Microwave- and ultrasound-assisted extraction of vanillin and its quantification by high-performance...
7
J. Sep. Sci. 2006, 29, 613 – 619 A. Sharma et al. 613 Anuj Sharma Subash Chandra Verma Nisha Saxena Neetu Chadda Narendra Pratap Singh Arun Kumar Sinha Natural Plant Products Division, Institute of Himalayan Bioresource Technology, Palampur, Himachal Pradesh, India Original Paper Microwave- and ultrasound-assisted extraction of vanillin and its quantification by high-performance liquid chromatography in Vanilla planifolia Microwave-assisted extraction (MAE), ultrasound-assisted extraction (UAE) and con- ventional extraction of vanillin and its quantification by HPLC in pods of Vanilla pla- nifolia is described. A range of nonpolar to polar solvents were used for the extrac- tion of vanillin employing MAE, UAE and conventional methods. Various extraction parameters such as nature of the solvent, solvent volume, time of irradiation, micro- wave and ultrasound energy inputs were optimized. HPLC was performed on RP ODS column (4.6 mm ID6250 mm, 5 lm, Waters), a photodiode array detector (Waters 2996) using gradient solvent system of ACN and ortho-phosphoric acid in water (0.001: 99.999 v/v) at 258C. Regression equation revealed a linear relationship (r 2 A0.9998) between the mass of vanillin injected and the peak areas. The detection limit (S/N = 3) and limit of quantification (S/N = 10) were 0.65 and 1.2 lg/g, respec- tively. Recovery was achieved in the range 98.5 – 99.6% for vanillin. Maximum yield of vanilla extract (29.81, 29.068 and 14.31% by conventional extraction, MAE and UAE, respectively) was found in a mixture of ethanol/water (40 : 60 v/v). Dehydrated ethanolic extract showed the highest amount of vanillin (1.8, 1.25 and 0.99% by MAE, conventional extraction and UAE, respectively). Keywords: HPLC / Microwave / Ultrasound / Vanilla planifolia / Vanillin / FrankincenseMyrrh / Lab- danum / Galbanum / Pine resin / Pine pitch / Archaeological samples / SPME, GC/MS / Received: September 13, 2005; revised: December 6, 2005; accepted: December 13, 2005 DOI 10.1002/jssc.200500339 1 Introduction In recent years, there has been an increasing demand of natural molecules due to growing preference by consu- mers for high-quality flavouring agents [1, 2] that are deemed to be natural with minimal chemical exposure. Vanillin (4-hydroxy-3-methoxybenzaldehyde, Fig. 1), a major component of natural vanilla, is an important fla- vouring agent used worldwide in many food products, perfumes and in pharmaceutical preparations [3]. In addition, vanillin is also active against Gram-positive and Gram-negative food spoilage bacteria [4], yeasts and moulds in fruit purees and laboratory growth media [5] and has considerable potential for use as a food preserva- tive [6, 7]. Of late, antimutagenic effects of vanillin have also been reported [8]. The vanillin is obtained through either chemical synthesis [9] or biotransformation [10, 11] or extraction from natural vanilla pods which con- tain about 2 – 3% w/w vanillin [12]. Moreover, vanillin has also been reported in traces in many plants including tobacco [13] and fruits and fruit products such as orange, grapefruit and tangerine [14]. High consumption of nat- ural vanillin and the growing preference by consumers for using natural flavours due to food safety concerns have highlighted the need for developing environmen- tally benign extraction methods for obtaining such ingredients. Extraction of vanillin from vanilla pods is well explored using a variety of solvents ranging from hexane, ethanol and ethanol/water [15, 16] under conventional methods. Similarly, methods are available on extraction of vanillin Correspondence: Dr. Arun Kumar Sinha, Natural Plant Products Division, Institute of Himalayan Bioresource Technology, Post Box No. 6, Palampur-176061, Himachal Pradesh, India. E-mail: [email protected]. Fax: +91-1894-230433. Abbreviations: MAE, microwave-assisted extraction; UAE, ultra- sound-assisted extraction i 2006 WILEY-VCH Verlag GmbH & Co. KGaA, Weinheim www.jss-journal.com Figure 1. Structure of vanillin.
Transcript of Microwave- and ultrasound-assisted extraction of vanillin and its quantification by high-performance...
J. Sep. Sci. 2006, 29, 613 – 619 A. Sharma et al. 613
Anuj SharmaSubash Chandra VermaNisha SaxenaNeetu ChaddaNarendra Pratap SinghArun Kumar Sinha
Natural Plant Products Division,Institute of HimalayanBioresource Technology,Palampur, Himachal Pradesh,India
Original Paper
Microwave- and ultrasound-assisted extraction ofvanillin and its quantification by high-performanceliquid chromatography in Vanilla planifolia
Microwave-assisted extraction (MAE), ultrasound-assisted extraction (UAE) and con-ventional extraction of vanillin and its quantification by HPLC in pods of Vanilla pla-nifolia is described. A range of nonpolar to polar solvents were used for the extrac-tion of vanillin employing MAE, UAE and conventional methods. Various extractionparameters such as nature of the solvent, solvent volume, time of irradiation, micro-wave and ultrasound energy inputs were optimized. HPLC was performed on RPODS column (4.6 mm ID6250 mm, 5 lm, Waters), a photodiode array detector(Waters 2996) using gradient solvent system of ACN and ortho-phosphoric acid inwater (0.001:99.999 v/v) at 258C. Regression equation revealed a linear relationship(r 2 A0.9998) between the mass of vanillin injected and the peak areas. The detectionlimit (S/N = 3) and limit of quantification (S/N = 10) were 0.65 and 1.2 lg/g, respec-tively. Recovery was achieved in the range 98.5–99.6% for vanillin. Maximum yieldof vanilla extract (29.81, 29.068 and 14.31% by conventional extraction, MAE andUAE, respectively) was found in a mixture of ethanol/water (40 :60 v/v). Dehydratedethanolic extract showed the highest amount of vanillin (1.8, 1.25 and 0.99% byMAE, conventional extraction and UAE, respectively).
Keywords: HPLC / Microwave / Ultrasound / Vanilla planifolia / Vanillin / FrankincenseMyrrh / Lab-danum / Galbanum / Pine resin / Pine pitch / Archaeological samples / SPME, GC/MS /
Received: September 13, 2005; revised: December 6, 2005; accepted: December 13, 2005
DOI 10.1002/jssc.200500339
1 Introduction
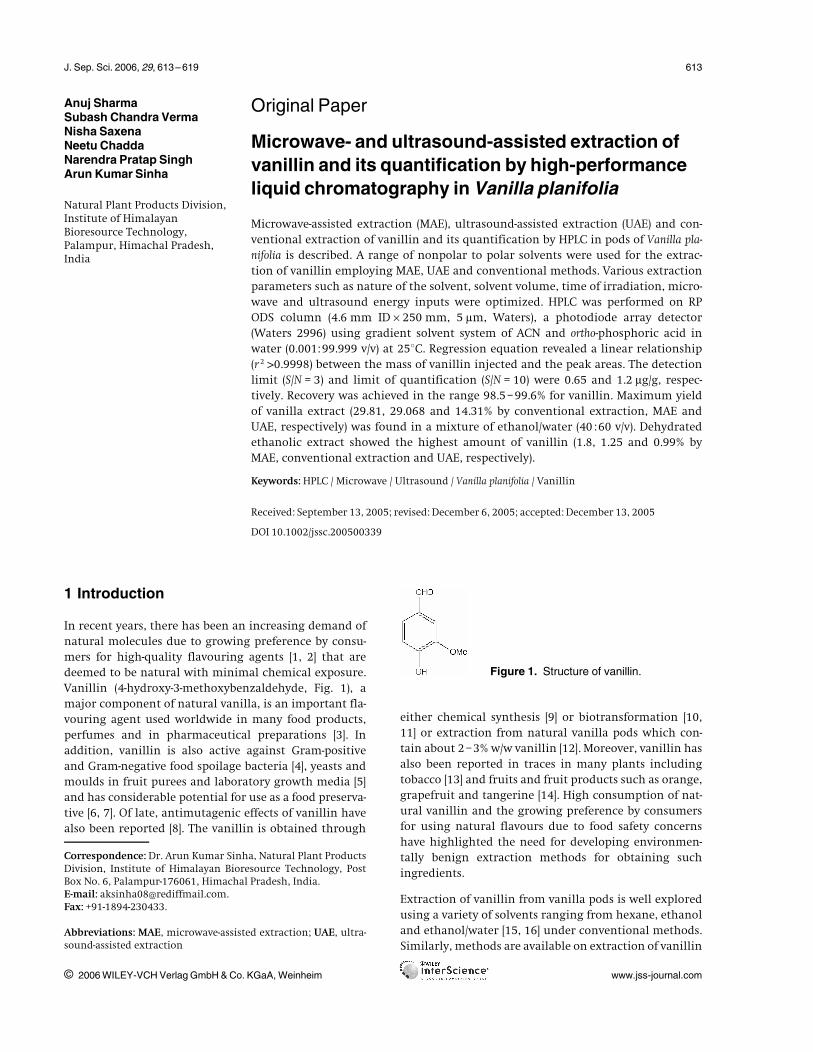
In recent years, there has been an increasing demand ofnatural molecules due to growing preference by consu-mers for high-quality flavouring agents [1, 2] that aredeemed to be natural with minimal chemical exposure.Vanillin (4-hydroxy-3-methoxybenzaldehyde, Fig. 1), amajor component of natural vanilla, is an important fla-vouring agent used worldwide in many food products,perfumes and in pharmaceutical preparations [3]. Inaddition, vanillin is also active against Gram-positiveand Gram-negative food spoilage bacteria [4], yeasts andmoulds in fruit purees and laboratory growth media [5]and has considerable potential for use as a food preserva-tive [6, 7]. Of late, antimutagenic effects of vanillin havealso been reported [8]. The vanillin is obtained through
either chemical synthesis [9] or biotransformation [10,11] or extraction from natural vanilla pods which con-tain about 2–3% w/w vanillin [12]. Moreover, vanillin hasalso been reported in traces in many plants includingtobacco [13] and fruits and fruit products such as orange,grapefruit and tangerine [14]. High consumption of nat-ural vanillin and the growing preference by consumersfor using natural flavours due to food safety concernshave highlighted the need for developing environmen-tally benign extraction methods for obtaining suchingredients.
Extraction of vanillin from vanilla pods is well exploredusing a variety of solvents ranging from hexane, ethanoland ethanol/water [15, 16] under conventional methods.Similarly, methods are available on extraction of vanillin
Correspondence: Dr. Arun Kumar Sinha, Natural Plant ProductsDivision, Institute of Himalayan Bioresource Technology, PostBox No. 6, Palampur-176061, Himachal Pradesh, India.E-mail: [email protected]: +91-1894-230433.
Abbreviations: MAE, microwave-assisted extraction; UAE, ultra-sound-assisted extraction
i 2006 WILEY-VCH Verlag GmbH & Co. KGaA, Weinheim www.jss-journal.com
Figure 1. Structure of vanillin.

614 A. Sharma et al. J. Sep. Sci. 2006, 29, 613 –619
[15] including supercritical fluid extraction [17], solid-phase micro-extraction (SPME) [18], biphasic sonoelectro-lysis [19], enzymatic extraction [20], liquid–liquid,liquid –solid extraction [21]. However, these techniquesare very often time-consuming, involve use of large quan-tity of solvents and high capital investment.
Recently, microwave-assisted extraction (MAE) and ultra-sound-assisted extraction (UAE) methods are beingwidely employed for extraction of various biologicallyactive compounds [22–25] from different plant matriceswith better yield, involving less amount of solvents com-pared to conventional methods. However, to the best ofour knowledge, MAE and UAE methods are not reportedfor the extraction of vanillin.
Therefore, in the present communication, we report acomparative study of MAE, UAE and conventional sol-vent extraction methods for the extraction of vanillinfrom the pods of Vanilla planifolia. Further, the percentageof vanillin in different extracts of pods of V. planifolia (byMAE, UAE and conventional methods) was quantitativelyand qualitatively analysed using HPLC.
2 Materials and methods
2.1 Plant material and chemicals
The cured vanilla pods were purchased from Spice BoardKerala, India. Vanilla pods were dried under a gentlestream of air in the laboratory for 4–5 days till no loss inweight (temperature 25 l 28C and relative humidity 65 l5%) and powdered in an electric grinder. Solvents andchemicals used were of analytical grade (E. Merck, Mum-bai, India). For sample and solvent filtration, 0.45 lmmembrane filters (Millipore, Germany) were used, andsolvents were degassed prior to use.
2.2 Extraction methods
2.2.1 Conventional extraction
Conventional extraction of cured vanilla pods was per-formed at room temperature (20–258C) with a variety ofsolvents ranging from nonpolar to polar ones, i. e. hex-ane, chloroform, ACN, ethanol and methanol/water(40 :60 v/v) and ethanol/water (40 :60 v/v). Dried and pow-dered vanilla pods (5 g each) were extracted three times(3615 mL) for 24 h of each extraction with each of theabove-mentioned solvents separately. These extractswere filtered and solvents were removed under vacuum.Concentrated extracts were re-dissolved in methanol(HPLC grade) to get a sample solution of 6 mg/mL andwere used for the HPLC analysis.
2.2.2 UAE
Sonics vibra cell using 500–750 W ultrasonic processorwith frequency 20 KHz was used for the extraction. The
conditions of extraction such as amount of vanilla pods,nature and volume of solvents were kept the same as inSection 2.2.1. Dried and powdered vanilla pods (5 g each)were kept in six different flasks and every flask wasextracted three times (3615 mL) with each of the above-mentioned solvents separately and irradiated with ultra-sonic waves for 120 s. Concentrated extracts, after filtra-tion of the solvents, were re-dissolved in methanol (HPLCgrade) to get a sample solution of 6 mg/mL and used forthe HPLC analysis.
2.2.3 MAE
Kenstar domestic microwave (900 W, frequency2450 MHz) was used for the extraction. All other condi-tions such as amount of vanilla pods, nature and volumeof solvents, time of irradiation of waves are the same asin Section 2.2.2. Extracts obtained by MAE were filteredand solvents were removed under vacuum. Concentratedextracts were redissolved in methanol (HPLC grade) toget a sample solution of 6 mg/mL and were used for HPLCanalysis.
2.3 HPLC conditions
The HPLC (Waters model 600E system, Waters, Milford,MA, USA) equipped with RP ODS column (4.6 mmID6250 mm, 5 lm, Waters), a photodiode array detector(Waters 2996), an inline-degasser AF (Waters), a 20 lLloop manual injector and Waters empower softwarewere used for analysis of vanillin. ACN (solvent A) andwater/ortho-phosphoric acid (99.999 :0.001 v/v, pH = 6.0)(solvent B) were used as mobile phase with a linear gradi-ent elution as follows: 0–10 min, 10–40% A; 10–20 min,40–80% A; 20 –25 min, 80–100% A; at a flow rate of1.4 mL/min. The detection wavelength was set at 254 nm.The column temperature was 258C, and the injectionvolume of each sample was 20 lL.
2.4 Method validation
In order to be a useful method in laboratories as a rou-tine analysis procedure, performance criteria were exam-ined for parameters including linearity [26], analyticallimits [27], repeatability [28], accuracy and recovery [29]using standard laid-down protocols.
2.4.1 Linearity
Standard stock solution of vanillin (1 mg/mL) was pre-pared by dissolving 10 mg in 10 mL of ACN. Workingstandard solutions were prepared in a range of concen-trations (62.5–1000 lg/mL) by serial dilution of the stan-dard stock solution. For preparing a calibration curve ofvanillin, each working standard solution was injectedinto the HPLC system. A five-point calibration curve was
i 2006 WILEY-VCH Verlag GmbH & Co. KGaA, Weinheim www.jss-journal.com

J. Sep. Sci. 2006, 29, 613 – 619 Microwave- and ultrasound-assisted extraction of vanillin 615
obtained by plotting the concentration of standard vanil-lin versus peak area.
2.4.2 LOD and LOQ
LOD (S/N = 3) and LOQ (S/N = 10) were estimated in accor-dance with the baseline noise, which was evaluated byrecording the detector response over a period of as muchas ten times the peak width. In order to estimate the LODand LOQ, blank (mobile phase) was injected six times fol-lowing the developed method (Section 2.3). Smallamount of vanillin was chromatographed under thedescribed HPLC conditions to determine LOD and LOQ.
2.4.3 Accuracy and recovery
The recovery of the method, including all experimentalprocedures, from the sample pretreatment to the chro-matographic analysis, was measured using the ethanolicextract of V. planifolia. Three different concentrations(62.5, 125 and 250 lg/mL) of working standard solutionswere added to the ethanolic extract (6 mg/mL) obtainedby MAE. These samples were then analysed using thedeveloped HPLC method. Each spiked sample wasinjected into the HPLC system in a triplicate manner(n = 3). The mean recovery was calculated.
2.4.4 Repeatability (intraday)
Six replicate injections of 20 lL of vanillin (500 lg/mL inACN) were analysed by the proposed method to deter-mine variation due to the chromatographic conditions(system precision). CVs for retention times and obtainedpeak areas were calculated.
2.5 Analysis of vanilla extracts
Ethanolic extracts of V. planifolia (6 mg/mL) were pre-pared for the quantification of vanillin by developedHPLC method. Prepared sample was injected into theHPLC system. Peak area calibration curves were used forthe quantitative analysis of the vanillin.
3 Results and discussion
3.1 HPLC method development
Several HPLC methods were reported for analysis of vanil-lin [30–38] in various formulations of vanilla products,including studies in a limited number of vanilla species.Quantification of vanillin in vanilla extract at low pH isdifficult, because the vanillin glycosides in vanillaextract may be hydrolysed to vanillin during HPLC anal-ysis [32] resulting in an apparently higher percentage ofvanillin in the overall analysis. In order to address thisproblem, we were interested in developing a new HPLCmethod for the analysis of vanillin in vanilla extract atnearer to neutral pH. RP-C18-bonded phase was chosen for
the analysis. Different mobile-phase compositions weretried for resolution of vanillin along with other compo-nents in extract and finally aqueous ortho-phosphoricacid (0.001%) and ACN in gradient elution was foundoptimum. ACN (solvent A) and water/ortho-phosphoricacid (99.999 :0.001 v/v) (solvent B) was used as mobilephase for the analysis of vanillin with a linear gradientelution as follows: 0–10 min, 10–40% A; 10–20 min,40–80% A; 20–25 min, 80 –100% A. It is worth mention-ing that use of minimal acid (0.001% ortho-phosphoricacid) in our method would not encourage hydrolysis ofglycosides thus giving rise to realistic analysis of vanillin.Vanillin was identified in ethanolic extracts of V. planifo-lia by comparison of its retention times (9.9 min), UV-visspectra and coinjections with standard vanillin (Fig. 2A–D).
3.2 Method validation
Linearity of the system was checked by plotting the cali-bration curve of five working standard solutions. Calibra-tion curve of vanillin was linear in the range of 62.5–1000 lg/mL. The UV detector response for vanillin waslinear over this range with a correlation coefficient of0.9998. Peak area (Y) and concentration (x) of each injec-tion was subjected to regression analysis to calculate thecalibration equation and correlation coefficients. Thecalibration curve could be represented by the followingregression equation:
Y = 13 045x–313059 (r2 = 0.9998, n = 5) (1)
where ,x’ is the concentration of the vanillin in lg/mLand ,Y’ is the peak area. The results showed that withinthe test concentration range, there was an excellent cor-relation between peak area and concentration of vanillin(Table 1). Under the present conditions, vanillin wasdetected with relatively high sensitivity. The LOD forvanillin was 0.65 lg/g, and the limit of quantificationwas 1.2 lg/g (Table 1).
The optimized HPLC conditions were applied for thedetermination of vanillin in fortified vanilla pod sam-ples. Samples spiked with 62.5, 125 and 250 lg/mL ofvanillin were used in triplicate to assess accuracy. Theamount of vanillin was calculated from related linearregression equation. The percentage recovery ranged
i 2006 WILEY-VCH Verlag GmbH & Co. KGaA, Weinheim www.jss-journal.com
Table 1. Calibration curve, LOD and LOQ of the examinedvanillin
Compound Linearequation
r 2 LOD,lg/mL
LOQ,lg/mL
Vanillin Y = 13 045 x6313 059 0.9998 0.65 1.2
r 2 = Correlation coefficient; x = amount of vanillin in lg;Y = peak area in a. u.

616 A. Sharma et al. J. Sep. Sci. 2006, 29, 613 –619
from 98.5 to 99.6% with RSD values in the range 1.07–1.45%, for vanillin (Table 2). Good recoveries from vanillaextract samples indicated that the method has sufficientaccuracy for the determination of the vanillin. The sys-tem precision CV for vanillin was less than 5% (Table 3) Itwas of the same order for the method intraday repeat-ability, showing that the extractability did not add a sig-nificant contribution to the total intraday repeatability(data not shown).
3.3 Quantification of vanillin
HPLC method was standardized for the qualitative andquantitative analysis of the vanillin in crude extracts ofV. planifolia, extracted by different solvents. Vanillaextracts in different solvents were analysed by the above-mentioned HPLC method. Although maximum yield ofvanilla extract was obtained by conventional method
i 2006 WILEY-VCH Verlag GmbH & Co. KGaA, Weinheim www.jss-journal.com
Table 2. Recovery study of vanillin in crude extract of V. pla-nifolia
Compound Added con-centration,lg/mL
Recoveredconcentra-tion, lg/mL
RSD, %n = 3
Averagerecovery,%
Vanillin 62.5 62.3 1.07 99.6125 123.2 1.43 98.5250 248.4 1.45 99.3
n = No. of assays.
Table 3. Results of system precision measurements
No. of assay Rt of Vanillin Area of Vanillin
1 9.92 7453 3042 9.91 7571 9823 9.90 7475 2824 9.89 7531 9835 9.89 7558 5566 9.89 7530 962Mean 9.90 7520 345%CV 0.058 0.278
Rt = Retention time.

J. Sep. Sci. 2006, 29, 613 – 619 Microwave- and ultrasound-assisted extraction of vanillin 617
(29.81%), MAE (29.06%) and UAE (14.31%) in ethanol/water (40 :60 v/v), maximum yield of pure vanillinthrough MAE (1.86%), conventional method (1.25%) andUAE (0.99%) was obtained in dehydrated ethanol, whichcould thus be safely assumed as optimum solvent forextraction of vanillin (Table 4).
From the above-mentioned results it is evident that MAEis more efficient than UAE and conventional extractionmethods for extraction of vanillin (Table 4). Further,
quantification and identification of remaining second-ary metabolites present in pods of V. planifolia by HPLC isunder progress.
4 Concluding remarksA simple, fast, environmentally benign and relativelycost-effective method employing MAE and UAE for theextraction of vanillin from pods of V. planifolia was devel-
i 2006 WILEY-VCH Verlag GmbH & Co. KGaA, Weinheim www.jss-journal.com
Figure 2. HPLC chromatogram of standard vanillin (A) and dehydrated ethanolic extract obtained by MAE (B), UAE (C) andconventional extraction (D). For experimental conditions see Section 2.3.

618 A. Sharma et al. J. Sep. Sci. 2006, 29, 613 –619
oped. We have identified, for the first time in vanillin theadvantage of performing extraction in microwave interms of time consumption as well as yield of vanillin, incomparison to ultrasound and conventional extraction.Moreover, the optimum solvent, i. e. dehydrated ethanol,is also proposed for maximum yield of vanillin from theextract. The studies have practical significance and ensueeconomical advantage per se. A simple and reliable HPLCmethod was also developed for the determination ofvanillin in pods of V. planifolia, which requires minimalacid (0.001%) ortho-phosphoric acid in a binary solventsystem of ACN and water, and a common stationaryphase (RP-18) which gives good separation and peakshapes. The method is suitable for the quantification ofvanillin in vanilla extracts and other food and perfumeryitems.
The authors are highly grateful to the Council of Scientific &Industrial Research, New Delhi, India (Mission mode project COR-0010) for its financial support. Authors are also thankful to theDirector (IHBT, Palampur) for providing necessary facilities dur-ing the course of the project.
5 References[1] Taylor, A. J., Mottram, M. S., Flavour Science: Recent Develop-
ments, The Royal Society of Chemistry, CB4 4WF, UK1996.
[2] Duke, J. A., Bogenschutz-Godwin, M. J., Cellier, J., Duke,P. A. K., CRC Handbook of Medicinal Spices, CRC Press, BocaRaton, Florida 2003.
[3] Walton, N. J., Mayer, M. J., Narbad, A., Phytochemistry2003, 63, 505 –515.
[4] Cerruti, P., Alzamora, S. M., Vidales, S. L., J. Food Sci.1997, 62, 608 –610.
[5] Fitzgerald, D. J., Startford, M., Narbad, A., Int. J. FoodMicrobiol. 2003, 86, 113 –122.
[6] Burri, J., Graf, M., Lambelet, P., Loliger, J., J. Sci. FoodAgric. 1989, 48, 49 –56.
[7] Moon, K. D., Delaquis, P., Toivonen, P., Stanich, K., FoodMicrobiol. 2006, 23, 169 –174.
[8] Keshava, C., Keshawa, N., Whong, W. Z., Nath, J., Ong, T.M., Teratogen. Carcin. Mut. 1998, 17, 313 –326.
[9] Bedoukian, P. Z., Perfumery and Flavorings Synthesis, 3rdEdn., Allured Publishing, Wheaton, IL 60187, USA 1986.
[10] Rao, S. R., Ravishankar, G. A., J. Sci. Food Agric. 2000, 80,289 –304.
[11] Priefert, H., Rabenhorst, J., Steinb�chel, A., Appl. Micro-biol. Biotechnol. 2001, 56, 296 –314.
[12] Westcott, R. J., Cheetham, P. S. J., Arraclough, A. J. B.,Phytochemistry 1994, 35, 135 –138.
[13] Makkar, H. P. S., Beeker, K., J. Agric. Food Chem. 1994, 42,731 –734.
[14] Goodner, K. L., Jella, P., Rouseff, R. L., J. Agric. Food Chem.2000, 48, 2882–2886.
[15] Voisine, R., Carmichael, L., Chalier, P., Cormier, F.,Morin, A., J. Agric. Food Chem. 1995, 43, 2658 –2661.
[16] Ruiz-Teran, F., Perez-Amador, I., Lopez-Munguia, A., J.Agric. Food Chem. 2001, 49, 5207 –5209.
[17] Nguyen, K., Barton, P., Spencer, J. S., J. Supercrit. Fluid1993, 4, 40–46.
[18] Sostaric, T., Boyce, M. C., Spickett, E. E., J. Agric. FoodChem. 2000, 48, 5802 –5807.
[19] Hardcastle, J. L., Paterson, C. J., Compton, R. G., Electro-analysis 2001, 13, 899 –905.
[20] Dignum, M. J. W., Kerler, J., Verpoorle, R., Food Chemistry2002, 79, 165 –171.
[21] Zhu, F. G., Zhou, S. H., Ind. Eng. Chem. Res. 2002, 41,2316–2319.
[22] Pan, X., Niu, G., Liu, H., Biochem. Eng. J. 2002, 12, 71 –77.
[23] Hrom�dkova, Z., Ebringerova, A., Valachovic, P., Ultra-son. Sonochem. 2002, 9, 37 –44.
[24] Pan, X., Niu, G., Liu, H., Chem. Eng. Process. 2003, 42, 129 –133.
[25] Yang, Y., Chen, L., Zhang, X. X., Guo, Z., J. Liq. Chromatogr.Rel. Tech. 2004, 27, 3203–3211.
i 2006 WILEY-VCH Verlag GmbH & Co. KGaA, Weinheim www.jss-journal.com
Table. 4. Quantitative analysis of extract of V. planifolia by HPLC
Solvent Conventional extraction, at roomtemperature
UAE extraction MAE extraction
Yield of crudeextract,%
% of vanillinin 100 g plantmaterial
Yield of crudeextract,%
% of vanillinin 100 g plantmaterial
Yield of crudeextract,%
% of vanillinin 100 g plantmaterial
Hexane 4.60 0.08 6.20 0.35 6.54 0.51Chloroform 7.41 0.27 4.88 0.43 8.56 1.08ACN 8.82 0.34 7.06 0.60 9.64 1.04Ethanol, dehy-drated
16.30 1.25 13.85 0.99 17.48 1.86
Methanol/water,40 :60
29.62 0.72 10.20 0.64 24.89 1.69
Ethanol/water,40 :60
29.81 0.68 14.31 0.67 29.06 1.58

J. Sep. Sci. 2006, 29, 613 – 619 Microwave- and ultrasound-assisted extraction of vanillin 619
[26] ISO 8466/1, International Organisation for Standardiza-tion, Geneve 1990.
[27] Carporal-Gautier, J., Nivet, J. M., Algranti, P., Guilloteau,M. et al., Pharma Pratiques 1992, 2, 205 –239.
[28] ISO 5725/2, International Organisation for Standardiza-tion, Geneve 1994.
[29] Monteiro, M. J. P., Bertrand, A., Feuillet Vert OIV 1990, 970,1–45.
[30] Lamphrecht, G., Pichlmayer, F., Schmid, E. R., J. Agric.Food Chem. 1994, 42, 1722 –1727.
[31] Ranadive, A. S., J. Agric. Food Chem. 1992, 40, 1922–1924.
[32] Negishi, O., Ozawa, T., J. Chromatogr. A 1996, 756, 129 –136.
[33] Rao, S. R., Ravishankar, G. A., Process Biochemistry 1999,35, 341 –348.
[34] Li, Y.-H., Sun, Z.-H., Zheng, P., Chromatographia 2004, 60,709 –713.
[35] Dignum, M. J. W., Kerler, J., Verpoorte, R., Food Chem.2002, 79, 165 –171.
[36] Herrmann, A., Stockli, M., J. Chromatogr. A 1982, 246,313 –316.
[37] Thompson, R. D., Hoffmann, T. J., J. Chromatogr. A 1988,438, 369 –382.
[38] Archer, A. W., J. Chromatogr. A 1989, 462, 461 –466.
i 2006 WILEY-VCH Verlag GmbH & Co. KGaA, Weinheim www.jss-journal.com