Comprehensive high performance thin layer chromatography ...
231
Comprehensive high performance thin layer chromatography (HPTLC) fingerprinting in quality control of herbal drugs, preparations and products Débora Arruda Frommenwiler Aquesta tesi doctoral està subjecta a la llicència Reconeixement- CompartIgual 4.0. Espanya de Creative Commons. Esta tesis doctoral está sujeta a la licencia Reconocimiento - CompartirIgual 4.0. España de Creative Commons. This doctoral thesis is licensed under the Creative Commons Attribution-ShareAlike 4.0. Spain License.
-
Upload
khangminh22 -
Category
Documents
-
view
3 -
download
0
Transcript of Comprehensive high performance thin layer chromatography ...

Comprehensive high performance thin layer
chromatography (HPTLC) fingerprinting in quality control of herbal drugs, preparations and products
Débora Arruda Frommenwiler
Aquesta tesi doctoral està subjecta a la llicència Reconeixement- CompartIgual 4.0. Espanya de Creative Commons. Esta tesis doctoral está sujeta a la licencia Reconocimiento - CompartirIgual 4.0. España de Creative Commons. This doctoral thesis is licensed under the Creative Commons Attribution-ShareAlike 4.0. Spain License.


© 2020 Débora A. Frommenwiler. All rights reserved. Cover illustration and interior design: Débora A. Frommenwiler Printed by:

Universitat de Barcelona
Facultat de Farmàcia i Ciències de l’Alimentació
Comprehensive high performance thin layer chromatography (HPTLC) fingerprinting in quality control of herbal drugs, preparations and products
Débora A. Frommenwiler 2020


Universitat de Barcelona
Facultat de Farmàcia i Ciències de l’Alimentació
Programa de Doctorat en Recerca, Desenvolupament i Control de Medicaments
Comprehensive high performance thin layer chromatography (HPTLC) fingerprinting in quality
control of herbal drugs, preparations and products
Anàlisi integral de l’empremta dactilar per cromatografia en capa fina d’alta resolució (HPTLC) en el control de qualitat de drogues i preparats vegetals i productes a base de plantes
Análisis integral de la huella dactilar por cromatografía en capa fina de alta resolución (HPTLC) en el control de calidad de drogas y preparados vegetales y productos a base de plantas
Memòria presentada per Débora Arruda Frommenwiler per optar al títol de doctor per la Universitat de Barcelona
Directors
Dr. Salvador Cañigueral Folcarà Dr. Eike Reich
Doctoranda Tutor
Débora Arruda Frommenwiler Dr. Salvador Cañigueral Folcarà
Débora Arruda Frommenwiler 2020


Acknowledgments
Firstly, I would like to thank my co-supervisor and boss, Eike (Mr. E.), who made this project become reality. When I was away from academic life and already working at CAMAG, he brought me back to the first goal I had when I moved to Switzerland: to do my PhD. His vast knowledge, patience and brilliant mind has made this project a life transforming experience. I believe that a good boss pushes his people out of their comfort zone and motivates them to improve and go beyond their best. That is what he did to me. Thank you, Mr. E., for being my mentor, for believing in me, encouraging me to pursue this project, and for always be there when I needed you.
Secondly, I would like to express my sincere gratitude to my supervisor Salvador, for always having a wise advice, for his kindness, patience, sharing his vast knowledge, and sometimes (as he uses to say) for playing devil's advocate, but also for showing me the positive side of things. The local distance became just a detail against the uncountable hours of conversation in skype. Salvador is for me the definition of a professor in his essence. With patience, kindness and excellence, his goal is to develop excellent professionals, no matter what and how long it takes. This is a gift that only few people possess. I have an enormous admiration, respect and gratitude for both supervisors.
A very special thanks to my husband, Lukas, who in my adult life was my number one encourager and life coach. With love, he taught me it is needed to focus, be resilient and work hard to achieve great goals. To him I dedicate my love, admiration, respect and gratitude.
Many thanks to my sisters Marina and Fernanda and to my brother, Rômulo, for all their love, motivation and patience. I would also like to thank my husband's family for their love and support. I would like to convey my appreciation to my friends Kathi, Sirin and Désirée for all their support, encouragement, patience, friendly shoulder, and for being a constant source of joy and relaxation.
Particular thanks to CAMAG, who generously supported this research, and to all my col-leagues who participated directly and indirectly in this project. Special thanks to the CEO, Markus, and all the members of the company's board of directors, who approved and encouraged this PhD project. Another special thanks to my laboratory colleagues Valeria, Eli, Tiên, Ilona, Meli and Marco, who helped in the projects, discussions, publications, presentations, and who made my PhD experience so memorable. Many thanks go to the Unit of Pharmacology, Pharmacognosy and Therapeutics, Faculty of Pharmacy and Food Sciences, University of Barcelona for supporting this research. As well as all the partners that have worked with us: British Herbal Medicine Association (BHMA), Forum for the Harmonization of Herbal Medicines (FHH), School of Pharmacy of the University College of London (UCL), Department of Life Sciences of the University of Westminster, the experts of the Traditional Chinese Medicine (TCM) group of the European Directorate for Quality of Medicines (EDQM) and the Institute for Pharmaceutical Sciences, Pharmaceutical Biology and Biotechnology of the Albert-Ludwigs-University.
Finally, my deepest gratitude to my parents, Mara and Alberto, who were the forerunners of my education, and who always showed me the path of science. I would not have gotten that far if it were not for their teachings, constructive criticism, encouragement and support. Thanks to them, I have been in contact with phytochemistry in my early years of life, by regularly visiting the organic chemistry laboratories at the Federal University of Pará - Brazil, where they used to teach. I remember getting fascinated by the fractionation col-umns, their many colors and smells, which unconsciously already sharpened the scientific spirit in me.


I
Table of Content
ABBREVIATIONS III
ABSTRACT V
RESUM VI
RESUMEN VIII
PART I: INTRODUCTION & OBJECTIVES 1
CHAPTER 1: INTRODUCTION 3
1.1 THE FITTING REGULATION 7 1.2 GENERAL CONSIDERATIONS REGARDING REGULATION OF HERBALS 13 1.3 WHICH ARE THE TESTS REQUIRED FOR QUALITY CONTROL OF HERBALS ACCORDING TO THE
PHARMACOPOEIAS? 14 1.4 WHAT ARE THE EXISTING ANALYTICAL TECHNIQUES FOR PERFORMING QUALITY CONTROL OF HERBALS? 16
CHAPTER 2: OBJECTIVES 27
PART II: RESULTS 31
CHAPTER 3: INVESTIGATION OF MARKET HERBAL PRODUCTS REGULATED UNDER DIFFERENT
CATEGORIES: HOW CAN HPTLC HELP TO DETECT QUALITY PROBLEMS? 33
3.1 ABSTRACT 37 3.2 INTRODUCTION 37 3.3 EXPERIMENTAL 39 3.4 RESULTS AND DISCUSSION 42 3.5 CONCLUSIONS 49 3.6 REFERENCES 50 3.7 SUPPLEMENTARY INFORMATION 52
CHAPTER 4: COMPREHENSIVE HPTLC FINGERPRINTING FOR QUALITY CONTROL OF AN HERBAL DRUG ‐ THE CASE OF ANGELICA GIGAS ROOT 59
4.1 ABSTRACT 63 4.2 INTRODUCTION 63 4.3 MATERIALS AND METHODS 65 4.4 RESULTS AND DISCUSSION 66 4.5 CONCLUSION 74 4.6 REFERENCES 74 4.7 SUPPLEMENTARY INFORMATION 76
CHAPTER 5: COMPREHENSIVE HPTLC FINGERPRINTING AS A TOOL FOR A SIMPLIFIED ANALYSIS OF
PURITY OF GINKGO PRODUCTS 85
5.1 ABSTRACT 89 5.2 INTRODUCTION 90 5.3 EXPERIMENTAL 91 5.4 RESULTS AND DISCUSSION 94 5.5 CONCLUSION 101 5.6 REFERENCES 102 5.7 SUPPLEMENTARY INFORMATION 104

II
CHAPTER 6: AN ALTERNATIVE AND SIMPLIFIED APPROACH TO IDENTIFICATION AND TEST FOR MINIMUM
CONTENT OF TCM HERBAL DRUGS 113
6.1 ABSTRACT 117 6.2 INTRODUCTION 117 6.3 MATERIALS AND METHODS 118 6.4 RESULTS AND DISCUSSION 120 6.5 DISCUSSION 129 6.6 CONCLUSION 129 6.7 REFERENCES 130 6.8 SUPPLEMENTARY INFORMATION 131
CHAPTER 7: COMPREHENSIVE HPTLC FINGERPRINTING: A NOVEL ECONOMIC APPROACH TO
EVALUATING THE QUALITY OF GANODERMA LUCIDUM FRUITING BODY 139
7.1 ABSTRACT 142 7.2 INTRODUCTION 142 7.3 MATERIALS AND METHODS 143 7.4 RESULTS AND DISCUSSION 145 7.5 CONCLUSION 154 7.6 REFERENCES 154 7.7 SUPPLEMENTARY INFORMATION 156
PART III: OVERVIEW, GENERAL DISCUSSION & CONCLUSIONS 165
CHAPTER 8: OVERVIEW AND GENERAL DISCUSSION 167
8.1 BACKGROUND 169 8.2 THE NEW FINDINGS 172 8.3 HOW TO DEVELOP A METHOD FOR COMPREHENSIVE HPTLC FINGERPRINTING 184
CHAPTER 9: CONCLUSIONS 197
PART IV: REFERENCES 201
REFERENCES 203

D. A. Frommenwiler Abbreviations
III
Abbreviations 5-HTTP: 5-hydroxytryptophan 92 a.u.: Arbitrary Units 131 ADC 2: Automatic Development Chamber 2 30 AHP: American Herbal Pharmacopoeia 53 ATR-IR: Attenuated Total Reflection Infrared 15 ATS 4: Automatic TLC Sampler 4 30 BC: Black cohosh 30 BHMA: British Herbal Medicine Association III bp: base pairs 14 BWH: Buckwheat herb 92 CAD: Charged Aerosol Detector 18 CDER: Center for Drug Evaluation and Research 7 CHF: Swiss Francs 158 CL: Chemiluminescence Detector 18 CMC: Chemistry, Manufacturing, and Controls 7 COI: Cythochrome Oxidase I 14 COSY: Correlation Spectroscopy 16 CPNP: Cosmetic Products Notification Portal 10 CRAFT: Complete Reduction to Amplitude Frequency Table 16 CV: Coefficient of Variation 78 CYR: Corydalis rhizome 99 DA: Decursinol Angelate 61 DAD: Diode Array Detector 18 DER: Drug/Extract Ratio 36 DS: Dietary Supplements 9 DSC: Dietary Supplements Compendium of the USP 31 DSHEA: The Dietary Supplement Health and Education Act of 1994 9 ECH: Coneflower 30 EDQM: European Directorate for Quality of Medicines III EFSA: The European Food Safety Authority 8 ELSD: Evaporative Light Scattering Detector 18 EMA: European Medicines Agency 6 EU: European Union 8 FDCA: Federal Food, Drug, and Cosmetic Act 9 FHH: Forum for the Harmonization of Herbal Medicines III FID: Flame Ionization Detector 17 FPLA: Fair Packaging and Labeling Act 10 FS: Food Supplement 34 FSMA: Food Safety Modernization Act 9 FTB: Fritillaria thunbergii bulbs 99 GACP: Good Agricultural and Collection Practice 7 GAP: Good Agricultural Practice 54 GB: Ginkgo biloba 86 GBE: Ginkgo Leaf Refined Dry Extract 74 GC: Gas chromatography 17 GE: Other types of ginkgo dry extract 89 GL: Samples of Ganoderma lucidum fruiting body 126 GLe: USP G. lucidum fruiting body extract 130 GLFB: Ganoderma lucidum fruiting body 122 GLm: G. lucidum fruiting body, pooled sample 130 GMP: Good Manufacturing Practice 7 GP: Ginkgo Products 75 GRAS: Generally Recognized as Safe 9

D. A. Frommenwiler Abbreviations
IV
GRASE: Generally Recognized as Safe and Effective 8 HDP: Herbal Drugs / Herbal Preparations 39 HDRI: High-Dynamic-Range Imaging 162 HKCMMS: Hong Kong Chinese Materia Medica Standards 123 HMBC: Heteronuclear Multiple Bond Correlatio 16 HMP: Herbal Medicinal Products 5 HMPC: The Committee on Herbal Medicinal Products 6 HPLC: High-Performance Liquid Chromatography 18 HPTLC: High-Performance Thin-Layer Chromatography 19 HRM: herbal Reference Material 52 HSQC: Heteronuclear Single Quantum Coherenc 16 Hue: Color Appearance Value 163 I: Isorhamnetin 80 IND: Investigational New Drug Application 7 IR: Infrared 15 K: Kaempferol 80 LC: Liquid Chromatography 17 MC: Minimum Content 60 MS: Mass spectrometry 17 MT: Milk thistle 30 NDA: New Drug Application 7 NDI: New Dietary Ingredient 9 NF: National Formulary 8 NGS: Next-Generation Sequencing 15 NIFDC: National Institute of Food and Drug Control 53 NIFDS: National Institute of Food and Drug Safety Evaluation 52 NIMM: National Institute of Medicinal Materials 53 NIR: Near Infrared 15 NLEA: Nutrition Labeling and Education Act 9 NLT: Not less than 80 NMR: Nuclear Magnetic Resonance 16 NP: Natural Products Reagent 31 OTC: Over-the-Counter 7 PCR: Polymerase Chain Reaction 14 PEG: Polyethylene Glycol Reagent 31 Ph. Eur.: European Pharmacopoeia 52 PMA: Premarket Approval 10 PPI: Peak Profiles from Images 54 PPSD: Peak Profiles from Scanning Densitometry 58 Q: Quercetin 80 qNMR: Quantitative Nuclear Magnetic Resonance 17 R: Correlation Coefficient 59 RMPM: Reference Material of Medicinal Plant Material 52 SJfl: Sophora flower bud 92 SJfr: Sophora fruit 92 SST: System Suitability Test 104 TCM: Traditional Chinese Medicine III THMP: Traditional Herbal Medicinal Products 6 THP: Tetrahydropalmatine 108 THR: Traditional Herbal Registration 29 TLC: Thin Layer Chromatography 19 UHPLC: Ultra-HPLC 18 USP: The United States Pharmacopeia 8 UV: Ultraviolet 16 WEU: Well-Established Medicinal Use 6

D. A. Frommenwiler Abstract
V
Abstract Quality control of herbals has its roots in the study of morphoanatomic and organoleptic characters. Nevertheless, in the last century, with the evolution of analytical chemistry, the quality control rapidly evolved from elementary tests to the use of sophisticated instruments combined with software for data management. In the current days, many authorities and organizations recommend a suite of tests, featuring many of these instruments, to evaluate quality of herbal products. HPTLC offers a comprehensive set of data that can be used not only for identification but also to evaluate the purity and content of herbal drugs, herbal preparations, and herbal products.
The objective of this doctoral thesis was to explore in-depth the capacities of HPTLC and develop applications for quality control of herbals, far beyond simple identification of the herbal drugs, preparations, and products. For that, five studies were developed.
In the first study, the quality of herbal drugs, preparations, and products from milk thistle fruit, coneflower root and aerial parts and black cohosh root, regulated under food supplements or medicines were evaluated with existing HPTLC methods. The suitability of these methods, using the entire fingerprint and several detection modes, as a tool for detecting quality problems, mainly adulterations, was confirmed.
In the second study, the comprehensive HPTLC fingerprinting concept was developed with the goal of simplifying the quality control process. This concept combines the qualitative and quantitative information of HPTLC images, obtained in a single analysis, to evaluate the identity, purity and content of herbals. The possibilities of applying it to identify an herbal drug, detect mixtures with related species (purity), and develop a minimum content test of an analytical marker were demonstrated in Angelica gigas root.
In the third study, the application of comprehensive HPTLC fingerprinting aimed to go one step beyond in the test for adulterants and to evaluate the use of the HPTLC for purity limit tests. This approach was evaluated with samples of ginkgo leaf and extracts, commercialized as food supplements in different countries. This study demonstrated that the information contained in the HPTLC fingerprints was suitable for verifying levels of rutin and quercetin, providing results similar to that of the HPLC limit test. It was also useful for detecting mixtures of ginkgo products not only with rutin and quercetin but also with buckwheat herb and sophora (flower bud or fruit).
In the fourth study, it was evaluated the use of comprehensive HPTLC fingerprinting as an alternative method to the current HPLC assay of markers of TCM drugs in the Ph. Eur. The goal of this project was to simplify the determination of content and thus reducing the number of tests to be performed during quality control. For this evaluation, two TCM herbal drugs were chosen by the experts of the TCM working party of the Ph. Eur.: Fritillaria thunbergii bulbs and corydalis rhizome. In both cases, comprehensive HPTLC fingerprinting was proven useful for identification and minimum content testing in one single analysis.
The fifth study goes one step beyond in the content determination. While the previous studies focused in the quantification of single markers, this study aimed to apply comprehensive HPTLC fingerprinting to quantify a group of constituents in an herbal drug, as an example of a more holistic assessment of quality. This determination was combined with the tests for purity and identity. To illustrate this concept, Ganoderma lucidum fruiting body was chosen.
In this work, HPTLC proved to be a useful technique for routine quality control of herbal drugs, preparations and products. As demonstrated, it can simplify this process by applying the concept of comprehensive HPTLC fingerprinting. A detailed guideline of how to develop, validate and apply comprehensive HPTLC fingerprinting methods for routine quality control of herbals has been elaborated and is also included in the thesis.

D. A. Frommenwiler Abstract
VI
Resum
Anàlisi integral de l'empremta dactilar per cromatografia en capa fina d'alta resolució (HPTLC) en el control de qualitat de drogues
i preparats vegetals i productes a base de plantes
El control de qualitat dels productes a base de plantes té les seves arrels en l'estudi dels caràcters morfoanatòmics i organolèptics. No obstant això, al segle passat, amb l'evolució de la química analítica, el control de qualitat va evolucionar ràpidament des de proves elementals a l'ús d'instruments sofisticats combinats amb programari per a la gestió de dades. Actualment, moltes autoritats i organitzacions recomanen un conjunt de proves, amb molts d'aquests instruments, per avaluar la qualitat dels productes a base de plantes. La HPTLC ofereix un conjunt complet de dades que poden usar-se no només per a la identificació, sinó també per avaluar la puresa i el contingut de drogues i preparats vegetals i productes a base de plantes.
L'objectiu d'aquesta tesi doctoral va ser explorar en profunditat les capacitats de la HPTLC i desenvolupar aplicacions per al control de qualitat dels productes de plantes medicinals, molt més enllà de la simple identificació de drogues vegetals, preparats vegetals i productes finals comercialitzats. Per això, es van desenvolupar cinc estudis.
En el primer estudi, es va avaluar la qualitat de les drogues vegetals, preparats vegetals i productes a base de plantes del fruit de card marià, l'arrel i la part aèria de equinàcia i l'arrel de cimicífuga, regulats com complements alimentosos o medicaments, amb els mètodes existents de HPTLC. Es va confirmar la idoneïtat d'aquests mètodes, utilitzant l'empremta dactilar completa i diversos formes de detecció, com una eina per a detectar problemes de qualitat, principalment adulteracions.
En el segon estudi, es va desenvolupar el concepte d'anàlisi integral de l'empremta dactilar per HPTLC (comprehensive HPTLC fingerprinting) amb l'objectiu de simplificar el procés de control de qualitat. Aquest concepte combina la informació qualitativa i quantitativa de les imatges d’HPTLC, obtingudes en una única anàlisi, per avaluar la identitat, la puresa i el contingut dels productes a base de plantes. La seva aplicabilitat per identificar una droga vegetal, detectar mescles amb espècies relacionades (puresa) i desenvolupar un assaig de contingut mínim d'un marcador analític es van demostrar en l'arrel d'Angelica gigas.
En el tercer estudi, l'aplicació de l'anàlisi integral de l'empremta dactilar per HPTLC va tenir com a objectiu anar un pas més enllà en l'assaig de adulterants i avaluar l'ús de l’HPTLC per a l'assaig límit de puresa. Aquest enfocament es va avaluar amb mostres de fulla i extracte de ginkgo, comercialitzats com a complements alimentosos en diferents països. Aquest estudi va demostrar que la informació continguda en les empremtes dactilars per HPTLC era adequada per verificar els nivells de rutina i quercetina, proporcionant resultats similars als de l'assaig límit per HPLC. També va ser útil per detectar mescles de productes de ginkgo no només amb rutina i quercetina, sinó també amb part aèria de blat sarraí i sòfora (botó floral i fruit).
En el quart estudi, es va avaluar l'ús de l'anàlisi integral de l'empremta dactilar per HPTLC com un mètode alternatiu a l'actual valoració de marcadors per HPLC en drogues vegetals de la medicina tradicional xinesa (MTC) a la Ph. Eur. L'objectiu d'aquest projecte era simplificar la determinació del contingut i, per tant, reduir el nombre de proves a realitzar durant el control de qualitat. Per a aquesta avaluació, dues drogues vegetals de la MTC van ser elegides pels experts del grup de treball TCM de la Ph. Eur.: bulb de Fritillaria thunbergii i rizoma de coridalis. En tots dos casos, es va demostrar que l'empremta dactilar completa per HPTLC era útil per a la identificació i l'assaig de contingut mínim en una sola

D. A. Frommenwiler Abstract
VII
anàlisi.
El cinquè estudi va un pas més enllà en la determinació del contingut. Si bé els estudis anteriors es van centrar en la quantificació de marcadors individuals, aquest estudi va tenir com a objectiu aplicar l'anàlisi integral de l'empremta dactilar per HPTLC a la quantificació d'un grup de components en una droga vegetal, com un exemple d'una avaluació més holística de la qualitat. Aquesta determinació es va combinar amb els assajos d'identitat i puresa. Per ilꞏlustrar aquest concepte, es va triar el carpòfor de Ganoderma lucidum.
En aquest treball, s'ha demostrat que la HPTLC és una tècnica útil per al control de qualitat rutinari de drogues i preparats vegetals i productes a base de plantes, i que es pot simplificar aquest procés aplicant el concepte d'anàlisi integral de l'empremta dactilar per HPTLC. S'ha elaborat una guia detallada sobre com desenvolupar, validar i aplicar mètodes d'anàlisi integral de l'empremta dactilar per HPTLC per al control de qualitat rutinari de productes a base de plantes, que també s'inclou en la tesi.

D. A. Frommenwiler Abstract
VIII
Resumen
Análisis integral de la huella dactilar por cromatografía en capa fina de alta resolución (HPTLC) en el control de calidad de drogas y preparados vegetales y productos a base de plantas
El control de calidad de los productos a base de plantas tiene sus raíces en el estudio de los caracteres morfoanatómicos y organolépticos. Sin embargo, en el siglo pasado, con la evolución de la química analítica, el control de calidad evolucionó rápidamente de las pruebas elementales al uso de instrumentos sofisticados combinados con software para la gestión de datos. Actualmente, muchas autoridades y organizaciones recomiendan un conjunto de pruebas, con muchos de estos instrumentos, para evaluar la calidad de los productos a base de plantas. La HPTLC ofrece un conjunto completo de datos que pueden usarse no sólo para la identificación, sino también para evaluar la pureza y el contenido de drogas y preparados vegetales y productos a base de plantas.
El objetivo de esta tesis doctoral fue explorar en profundidad las capacidades de HPTLC y desarrollar aplicaciones para el control de calidad de los productos de plantas medicinales, mucho más allá de la simple identificación de drogas vegetales, preparados vegetales y productos finales comercializados. Para eso, se desarrollaron cinco estudios.
En el primer estudio, se evaluó la calidad de las drogas vegetales, preparados vegetales y productos a base de plantas del fruto del cardo mariano, la raíz y la parte aérea de equinácea y la raíz de cimicífuga, regulados como complementos alimenticios o medicamentos, con los métodos existentes de HPTLC. Se confirmó la idoneidad de estos métodos, utilizando la huella digital completa y varios modos de detección, como una herramienta para detectar problemas de calidad, principalmente adulteraciones.
En el segundo estudio, se desarrolló el concepto de análisis integral de la huella dactilar por HPTLC (comprehensive HPTLC fingerprinting) con el objetivo de simplificar el proceso de control de calidad. Este concepto combina la información cualitativa y cuantitativa de las imágenes de HPTLC, obtenidas en un único análisis, para evaluar la identidad, la pureza y el contenido de los productos a base de plantas. Su aplicabilidad para identificar una droga vegetal, detectar mezclas con especies relacionadas (pureza) y desarrollar un ensayo de contenido mínimo de un marcador analítico se demostraron en la raíz de Angelica gigas.
En el tercer estudio, la aplicación del análisis integral de la huella dactilar por HPTLC tuvo como objetivo ir un paso más allá en el ensayo de adulterantes y evaluar el uso de la HPTLC para el ensayo límite de pureza. Este enfoque se evaluó con muestras de hoja y extracto de ginkgo, comercializados como complementos alimenticios en diferentes países. Este estudio demostró que la información contenida en las huellas dactilares por HPTLC era adecuada para verificar los niveles de rutina y quercetina, proporcionando resultados similares a los del ensayo límite por HPLC. También fue útil para detectar mezclas de productos de ginkgo no sólo con rutina y quercetina, sino también con parte aérea de trigo sarraceno y sófora (botón floral y fruto).
En el cuarto estudio, se evaluó el uso del análisis integral de la huella dactilar por HPTLC como un método alternativo a la actual valoración de marcadores por HPLC en drogas vegetales de la medicina tradicional china (MTC) en la Ph. Eur. El objetivo de este proyecto era simplificar la determinación del contenido y, por lo tanto, reducir el número de pruebas a realizar durante el control de calidad. Para esta evaluación, dos drogas vegetales de la MTC fueron elegidas por los expertos del grupo de trabajo TCM de la Ph. Eur.: bulbo de Fritillaria thunbergii y rizoma coridalis. En ambos casos, se demostró que la huella digital completa de HPTLC era útil para la identificación y el ensayo de contenido

D. A. Frommenwiler Abstract
IX
mínimo en un solo análisis.
El quinto estudio va un paso más allá en la determinación del contenido. Si bien los estudios anteriores se centraron en la cuantificación de marcadores individuales, este estudio tuvo como objetivo aplicar el análisis integral de la huella dactilar por HPTLC a la cuantificación de un grupo de componentes en una droga vegetal, como un ejemplo de una evaluación más holística de la calidad. Esta determinación se combinó con los ensayos de identidad y pureza. Para ilustrar este concepto, se eligió el carpóforo de Ganoderma lucidum.
En este trabajo, se ha demostrado que la HPTLC es una técnica útil para el control de calidad rutinario de drogas y preparados vegetales y productos a base de plantas, y que se puede simplificar este proceso aplicando el concepto de análisis integral de la huella dactilar por HPTLC. Se ha elaborado una guía detallada sobre cómo desarrollar, validar y aplicar métodos de análisis integral de la huella dactilar por HPTLC para el control de calidad rutinario de productos a base de plantas, que también se incluye en la tesis.


1
Part I: Introduction & Objectives


Chapter 1: Introduction


D. A. Frommenwiler Chapter 1
1
5
Herbal drugs are the oldest source of medicines known to mankind. For hundreds of centu-ries, the knowledge in the herbal medicines field was gained instinctively by trial and error through ingestion of herbal drugs and observations of their activity or toxicity [1] [2]. This process was the base for the traditional herbal medicinal practices, such as Traditional Chinese Medicine (TCM), Ayurveda, Kampo, amongst others [3], and later on, for the modern Western herbal medicines.
Because the chemistry of the herbal drugs was not known at that time, humans have iden-tified and selected medicinal plants and foods based on sensorial characteristics (ap-pearance, smell, taste, and texture) [4]. Therefore, botanical morphology and organoleptic testing was the root of quality control of herbal drugs.
The first scientific reference to quality of herbal drugs are the collections of books named “De Causis Plantarium” (Plant Etiology) and “De Historia Plantarium” (Plant History), written by Theophrastus. In these books, Theophrastus describes and classifies more than 500 medicinal plants [1]. Another important work in ancient history was “De Materia Medica”, written by Dioscorides (77 BC), the father of pharmacognosy. In his collection, the plant names, outward appearance, locality, mode of collection, preparation of medicines, and their therapeutic effect are described for about 600 medicinal plant species. No or short descriptions were included, but additional data were included in later editions, along centuries, especially in those of Mattioli and Laguna in the 16th century [1] [5].
From ancient times to early modern age, the morphological and organoleptic identity re-mained the principal way of assessing the quality of herbal drugs. Over time, descriptions and illustrations of morphological characters where gaining precision and became the basis for the identification of herbal drugs in the pharmacopoeias in the 19th century [6] [7].
One of the first chemical methods used in the quality control of herbal drugs were tests for the detection of functional groups by color reaction [4]. The Pharmacopoea Wirtenbergica (1741) was the first pharmacopoeia to introduce chemical testing of drugs, which later have been adopted in Western pharmacopoeias [6]. Nevertheless, it was only along the second half of the 19th century and the beginning of the 20th century, with the evolution of analytical chemistry, that the study of chemical compounds of the herbal drugs started [1] [4] [6]. This may be considered the birth of modern medicine and the beginning of scientific pharmacy.
During the 19th century, after successful isolation of morphine by Friedrich Sertürner [8], herbal drug research was concentrating on the extraction, isolation, and purification of substances (e.g., quinine, caffeine, nicotine, and so forth) [1] [4]. These studies also led to the first synthetic medicines derived from herbal drugs, such as acetylsalicylic acid [2].
With the emergence of the pharmaceutical science and industry in the mid-19th century, pure compounds isolated from plants and synthetic compounds started to be produced on a large scale. They became popular for treating diseases and took over the medicinal market. In the middle of the 20th century, companies started to invest more in the synthetic chemistry. Together with this shift, between 1930 and 1960, new analytical techniques, such as X-ray crystallography, ultraviolet and infrared spectroscopy, have emerged on the market for structural determination. Consequently, more knowledge was gained regarding the relation between the molecular structure and the biological activity [9].
Between 1937 and 1950s, the first regulations concerning drug safety started to appear in the US, Germany, and the UK. These were the base for the formal standards for testing and manufacture of medicines. Between 1960 and 1980, new analytical techniques, such as nuclear magnetic resonance and chromatography, and the beginnings of computers drove drug discovery and drug regulation. From this time, a more comprehensive and strict medicines law was implemented in many countries [9].
Because adverse effects and contraindications were increasingly detected in synthetic

D. A. Frommenwiler Chapter 1
1
6
drugs, the interest in natural remedies was slowly restored [1]. At the last third of the 20th century, the consumption of herbal medicines began to increase again. This change was driven by the belief that herbal medicines are "natural", and thus, are safer than drugs because of their long history of use [3]. However, one of the impediments to its widespread acceptance as medicines was the lack of standards for safety, efficacy and quality control, as these applied to medicines [10].
In 1992, the WHO Regional Office for the Western Pacific recognized the importance of herbal medicines, and the need for their scientific study. They were one of the first to create a guideline defining the basic criteria for assessing quality, safety and efficacy of herbal medicines [3]. This document became the base for herbal medicines assessment and regulation in different countries.
Molded by the conventional drugs path, quality control of herbal medicines has been adapted to meet the standards of the pharmaceutical industry. This means that the quality of an herbal is defined through several specifications, which are a set of morphological, chemical or biological tests that will confirm the identity, purity, and content of the material [11] [12] [13]. While quality control of synthetic drugs usually involves monitoring of one or few constituents, obtained under controlled conditions, herbal medicines have an extra challenge. They often present a complex chemical composition, containing numerous substances to be monitored, and to which the acceptance criteria need to be established [10] [12] [14]. Additionally, certain substances can be qualitatively and quantitatively influenced by environmental, genetic, and growth factors (e.g. UV radiation, different genetic material, different maturity/ripening stages, etc.) [12] [15], and post-harvesting processing. In order to simplify the quality control of herbal medicines, usually one or few markers of the herbal drug are chosen for monitoring during this process, rather than the entire range of constituents. However, based on this approach, a holistic understanding is set aside.
With the years and evolution of analytical techniques, the legal requirements for herbal medicines became stricter, more complex and expensive, which discouraged many companies to pursue this path. This caused the herbal products manufacturers to fit their products into other regulation categories, such as medical devices and dietary supplements, as a faster way to reach the market. Nevertheless, many of these regulatory categories do not have a specific guideline for the assessment of herbal drugs, preparation and products. They also have different requirements for testing quality, safety and efficacy. These differences are discussed in the following section.
Before discussing the regulation of herbals, definitions of the “herbal” terms commonly used in this work are provided. These are:
Herbal drugs: are mainly whole, fragmented or broken plants or parts of plants in an unprocessed state, usually in dried form but sometimes fresh. In this definition, the word ‘plant' is used in the broader sense to also include algae, fungi and lichens. [16].
Herbal preparations: are homogeneous products obtained by subjecting herbal drugs to treatments such as extraction, distillation, expression, fractionation, purification, concentration or fermentation. Herbal drug preparations include, for example, extracts, essential oils, expressed juices, processed exudates, and herbal drugs that have been subjected to size reduction for specific applications, for example herbal drugs cut for herbal teas or powdered for encapsulation [17].
Herbal products: any product, containing as active ingredients one or more herbal drugs and/or one or more herbal preparations. When registered as medicines, they are herbal medicinal products [18].
For matter of terminology, this work refers to “herbals” as those materials being herbal drug(s) or herbal preparation(s) or herbal product(s).

D. A. Frommenwiler Chapter 1
7
1
1.1 The fitting regulation Regulation of herbals is a complex topic because these products do not have a single regulatory category. Depending on their intended use, preparations, and dosages, herbals can fall under different definitions [19]. The main are medicinal products, food (dietary) supplements, medical devices, cosmetics and foodstuff. Each of them can have different levels of requirements for quality, safety, and efficacy.
The second factor that complicates regulation of herbals is that the legal situation of the same herbal drug, preparation and product can vary from country to country. For example, an herbal product can be regulated as dietary supplements in the USA and as medicine in the European Union [20] [21]. The sales of herbals through the internet further complicates this scenario. Consumers can easily purchase products from anywhere in the world. Con-sequently, products of different grades, or even unregulated items, have entered different markets endangering the user’s safety [21].
The diversity of specifications and lack of harmonization between the regulatory categories led to the reflection that different regulatory framework may be expected to result in products of different quality. To investigate this hypothesis, a literature review was conducted. It aimed at understanding the five main regulatory categories, for which herbals are eligible, and their requirements. In this review, the regulations of the EU and US were compared. These two regions were chosen due to their economic importance in the herbal market.
1.1.1 Which are the most common regulatory classifications for herbals?
Generally, medicinal products are any substance or combination of substances used for treating or preventing disease, diagnosing or restoring, correcting or modifying physiological functions in human beings [22].
Food is any substance under different degrees of process, intended to be ingested by humans [23]. Food includes drink, chewing gum and any substance, including water. Herbal ingredients and products are often included in this regulatory class. They can be either conventional food (e.g., vegetables, spices) or food supplements. Food (dietary) supplements is considered as a subcategory of food in different countries, and thus, follows the same rules as the food category [24]. Food supplements are intended to supplement a diet, maintain physiological functions or correct nutritional deficiencies with concentrated sources of nutrients or other substances with nutritional or physiological effect. They can be prepared from a single substance or a combination thereof, and are presented in a dosage form (e.g., liquid extract, capsule, etc.) [25].
Medical devices are any instrument, apparatus, software, implant, reagent, or other article (alone or in combination), intended to be used to diagnose, prevent, mitigate, and treat disease, injury, health condition, etc. In this case, the principal intended action is not achieved by any pharmacological, immunological or metabolic means, but rather by physical means, or the pharmacological activity is ancillary to the physical means [26] (e.g., propolis spray to remove mucus deposit from the nasal cavity).
Cosmetics are any substance or mixture intended to be applied on the external parts of the human body, teeth and the mucous membranes of the oral cavity, with the intent of cleaning, perfuming, changing their appearance, protecting, keeping in good condition or correcting body odors [27]. Other categories, such as biocidal, scents, color additives, etc., are not considered in this work.
Borderline products are those for which the boundary between the regulatory categories is not well-defined [28]. Usually, these types of products fall within the scope of at least two regulatory categories. For example, a shampoo is considered cosmetic if it is intended use is to clean the hair. However, if the shampoo is intended to treat dandruff, it is considered as medicine due to its health claims [29]. It is often the case with herbal

D. A. Frommenwiler Chapter 1
1
8
products, particularly among the medicines, medical devices, cosmetics, and food supplements categories. For determining the classification of a product, its primary mode of action, its intended use, and the claims made are considered.
1.1.2 Requirements of the five main herbals regulation categories in the EU and the US
Generally, the classification of herbals depends on (1) route of administration, (2) formulation, (3) safety and efficacy evidences, and (4) intended use and indication. In this section, the typical requirements of the main regulatory categories for herbals in the EU and US are discussed.
1.1.1.1 Medicinal products
Medicinal products in EU
In the EU, herbals can be market as medicines through a specific regulatory category named Herbal Medicinal Products (HMP). According to the Directive 2004/24/EC [18], herbal medicines can be marked as “new” herbal medicinal products, products with a well-established medicinal use, and traditional herbal medicinal products. A comparison of the requirements of the three categories is shown in Figure 1.1.
Figure 1.1 Overview of the requirements of the three categories of herbal medicinal products in the EU. New herbal medicinal products (HMP); well-established medicinal use products (WEU); Traditional Herbal Medicinal Products (THMP). Modified from [30]
New HMP
To obtain a license to market a new HMP, the manufacturer must submit to the authorities a dossier containing details about the quality, safety, and efficacy of its product through a process called marketing authorization [24]. The requirements and acceptance criteria for HMP are very similar to those of synthetic medicinal products. HMP are allowed to make major therapeutic claims, depending on the levels of clinical efficacy demonstrated [31] (Figure 1.1). The application for marketing authorization can be made through three different levels, from national to EU levels [30]. These procedures rely on the mutual

D. A. Frommenwiler Chapter 1
9
1
recognition of the scientific evaluations of the Member States [31].
The marketing authorization of medical products can be very lengthy and costly, which demotivates many manufactures to pursue registration of their products in this category. Nevertheless, over the past years, manufacturers of herbal products have become more eager to qualify their products as medicine, mainly because several countries implemented strict limitations on therapeutic claims for other regulation categories such as food supple-ments.
HMP with well-established medicinal use (WEU)
The WEU subcategory was created to facilitate the authorization procedure of medicinal products. It is applied to any type of medicine, including HMP. Products which fall in this category must show evidence of at least one decade of use, starting from its first systematic and well-documented use, recognized efficacy and acceptable levels of safety [32]. In this category, the applicant may not be required to perform efficacy and safety tests, if these can be demonstrated through a detailed scientific bibliography (Figure 1.1). However, quality still needs to be assessed, as for new HMP. Further aspects to be considered for the classification of an HMP as WEU are quantitative aspects of the use of the active substance, the degree of scientific interest in the use of the substance, and the coherence of scientific assessments and published scientific literature [24] [30]. As for new HMP, WEU can make major to minor therapeutic claims, depending on the levels of clinical efficacy.
The Committee on Herbal Medicinal Products (HMPC) of the European Medicines Agency (EMA) prepared a guideline (EMEA/HMPC/ 104613/05), providing detailed instructions regarding the documentation needed for marketing authorization/registration of all types of HMP. This committee is also responsible for the elaboration of Community Herbal Monographs that may be used to support the full marketing authorizations of WEU. Those monographs reflect the scientific opinion from the HMPC concerning the safety and efficacy of a determined preparation of an HMP. Bibliographic application is only possible if the scientific information contains at least one controlled clinical study (clinical trial, post marketing study, epidemiological study) of good quality to substantiate the efficacy of the HMP [24] [30] [33]. Additionally, if the scientific bibliography does not provide sufficient data, it is possible to obtain marketing authorization though a mixed application (hybrid form) [24].
Traditional Herbal Medicinal Products (THMP)
The Traditional Herbal Medicinal Products subcategory is applied exclusively for herbal drugs, preparation, and products for human use. This category was created to overcome the difficulties of manufactures to meet requirements to prove safety and principally efficacy of certain herbal products as medicine [18] [24]. It was first introduced in the EU and UK in 2004 by the Directive 2004/24/EC [18]. Some other countries, e.g., Saudi Arabia, Malaysia, Brazil and the Philippines, adopted a similar concept [34].
In the EU, this category offers a simplified mechanism in which the herbal product can be registered as medicine based on its traditional use for specific minor indications (e.g., relieve the symptoms of upper respiratory tract infections), appropriated to the traditional use (Figure 1.1) [30] [35]. In this case, they are exempt from proofing efficacy through clinical trials. Eligible products should have been in medicinal use for a sufficiently long time, its pharmacological effects or efficacy are plausible and proved based on long-standing use and experience (based on bibliographical or expert evidence), and are considered not to be harmful under normal conditions of use [18]. They are designated for use without supervision, have limited route of administration (oral, external, and or inhalation preparation), their strength and posology is specified and derived from the tradition, and have restrictive therapeutic claims [18] [24] [35]. Furthermore, a full expert report on safety and quality needs to be provided [35].

D. A. Frommenwiler Chapter 1
1
10
Instead of a marketing authorization procedure, a simplified registration can be used for THMP. The required documentation should provide sufficient evidence of the medicinal use of the product during at least 30 years, including at least 15 years within the European Community [19] [18] [24] [35]. Safety can be proven through scientific bibliography, but additional tests may be required. Nevertheless, there are no exemptions for the quality dossier and it has to fulfill the same requirements as any other medicinal product. To further facilitate and harmonize the registration authorization of THMP, the HMPC has created a list of herbal substances, which have been in medicinal use for a sufficiently long time, and are considered not to be harmful under normal conditions of use. Also, monographs on herbal drugs and the accepted indications for the traditional use of their preparations are elaborated by the HMPC. The applicants can refer to this list and the monographs to address the safety and efficacy of a THMP [19] [30].
Botanical drugs regulation in the US
Unlike various regulatory systems, the USA does not have a “traditional herbal medicinal product” or any particular category for herbal medicinal products. Herbal medicinal products are classified as “Botanical drugs”, and thus all requirements of the Federal Food, Drug and Cosmetic Act for drugs should apply [36] [37]. Botanical drugs may be classified as “new botanical drug” or “over-the-counter (OTC)”. Existing dietary supplements can also apply for botanical drugs.
New botanical drugs
According to Tamayo et al. [36], most of the botanical drugs entering in the US market will be considered as new, which is defined as any drug that has not been marketed before 1938 and therefore is not generally recognized as safe and effective under the conditions prescribed, recommended or suggested in the labeling [36] [38]. The first regulatory step to obtain marketing approval is the filing of an investigational new drug application (IND). This document is required when a botanical drug is studied in the US for drug use. The final step is the submission of a new drug application (NDA) for marketing approval, which includes the quality control tests, clinical and non-clinical trials, and safety studies [36] [39] [38].
To encourage botanical drug development, FDA’s Center for Drug Evaluation and Research (CDER) published a guideline for botanical drugs, considering their complexity and the practical difficulties in quality control. The initial document (chemistry, manufacturing, and controls (CMC)), include additional information about the Good Agricultural and Collection Practice (GACP) and Good Manufacturing Practice (GMP) of the herbal drug, proper identification of the raw material, as well as information on any human use that can support the safety of the botanical drug. These documents are significantly reduced compared to those of synthetic drugs. For example, manufacturers are not required to purify or identify the active ingredients [36]. Nevertheless, additional animal studies may be requested, and the evidence required for safety and efficacy are not less stringent than those for synthetic drugs [36] [37] [38]. In CMC, clinical and non-clinical data are the base documentation for the IND application [40].
There has been only a limited number of botanical drugs approved by the FDA due to stringent criteria for this regulation category. For example, between 2004 and 2016, the FDA received more than 600 INDs notifications for New Botanical Drugs. Only two NDA have been approved: Veregen® (an extract of Camellia sinensis Kuntze) and FulyzaqTM (an extract of dragon’s blood, the blood-red latex of Croton lechlerii Müll. Arg) [39] [41] [42].
Over-the-counter (OTC) drug
According to the FDA’s guideline, any drug that does not fall within the definition of a prescription drug is a nonprescription or OTC drug. This subcategory is further divided into OTC New Drug Application and OTC Drug Monograph. The first sub class follows the

D. A. Frommenwiler Chapter 1
11
1
same path as for new botanical drugs. For being eligible as OTC Drug Monograph, an herbal drug must generally be recognized as safe and effective (GRASE) and have been market for a long time for a specific indication. Furthermore, a botanical drug substance must be recognized in an official USP (USP) monograph and show compliance with the quality acceptance criteria of this monograph [38]. Any product that complies with an OTC monograph may be manufactured and sold without FDA’s approval [43]. If the botanical drug is not included in the USP or OTC monograph, the manufacturer should submit a proposal standard for inclusion in this pharmacopoeia, or a petition/Time and Extent Application (TEA) to amend a monograph in order to include a botanical drug substance [38]. Examples of herbal drugs present in OTC drugs review and OTC Drug Monograph in the USA are psyllium seed, senna, slippery elm bark, witch-hazel leaf/bark, etc. [38] [44].
1.1.1.2 Herbal food and food supplements
Herbal food and food supplements regulation in the EU
Food supplements are regulated as a specific category of food under Directive 2002/46/EC in the EU. This directive has a harmonized rule for vitamins and minerals supplements, but it does not include considerations for herbal food supplements. Therefore, the general requirements of food law under the regulation [EC] N° 178/2002, and for novel food under regulation [EC] N° 258/97 and [EU] 2015/2283 shall apply to herbal food supplements in the EU [19]. The European Food Safety Authority (EFSA) is the agency responsible for its regulation together with the national authorities.
The main focus of these laws is regarding the safety of the foodstuff. Besides that, they oblige food business operators to ensure compliance with the law and enforce the mutual recognition concept [19]. They also require that all kinds of food, that fall under the definition of novel foods (not used for human consumption within the EU before 15 May 1997), and their claims must be authorized by the EFSA before they reach the market. For that, manufacturers need to submit documentation to EFSA, proving their safety through centralized authorization procedure [19] [45].
Health claims can only be made if they are included in one of the EU health claims positive lists. The European Commission provides a list of examples of health claims for food and food supplements (other than herbals) that were granted in the EU [46]. Herbals have only “on hold” or rejected health claims.
Unlike novel foods, the EU has no centralized authorization procedure for food supplements. Instead, the member states enforce their own or European laws, which may have different criteria. Often, this results in a lack of specifications for herbal products and even in their regulation classification. For example, products can have different limits for toxic substances such as pyrrolizidine alkaloids. They can also be regulated as food supplements in one member state and as THMP in another.
Some of the member states have created their list of allowed plants (positive list) and/or a list of plants banned from foodstuffs (negative list), which are not consistent across the countries. Other information, such as the common name, plant part, restrictions, contraindications, interactions, etc. may be present or not [19]. Attempting to harmonize the safety and quality evaluation of herbal foodstuff, Belgian, French and Italian authorities have launched the “BELFRIT” project, which integrates the positive lists of each member state in a common positive list [19]. Even though the mutual recognition mechanism of non-harmonized EU legislation ensures free trade on the EU market, such inconsistency in the regulatory approaches still created barriers in the trade of those products at the European level.
Dietary supplements (DS) regulation in the US
Unlike food, dietary supplements (DS) are regulated in the US by the Dietary Supplement Health and Education Act of 1994 (DSHEA). The definition of DS is similar to that of EFSA

D. A. Frommenwiler Chapter 1
1
12
for food supplements. However, it excludes any “highly purified ingredients derived from plants, products of fermentation, or homeopathic drugs [36] [47].
According to DSHEA, only health claims (relation between an ingredient and reduced risk of a disease), structure/function claims (relation between an ingredient and the typical structure or function of the human body) or nutrient content claims (level of a nutrient in an ingredient) are allowed [48]. Those claims may be submitted to FDA for approval (the agency can be notified up to 30 days after marketing). In case the company has not notified the FDA, they should include a disclaimer that the FDA has not evaluated the claim. DS can only be marketed in limited administration forms such as tablets, capsules, liquids, and others, which is different from conventional food [36] [47], and are for self-prescription. Furthermore, they are required to be labeled as “dietary supplement” [49]. DSHEA states that DS products need to be manufactured under GMP to ensure that the product meets quality standards [50]. Currently, a list of pre-DSHEA ingredients (positive list for DS non-NDI) is being discussed in the US.
The manufactures of DS are prohibited from marketing products that are adulterated or misbranded, and the FDA can take legal actions against fraudulent companies [51]. Generally, DS products do not require pre-marketing approval from the FDA because they are generally recognized as safe (GRAS). It means that the manufacturer is responsible for the safety and quality of its product. However, if the product contains “new dietary ingredient” (NDI) (any ingredient that has not being marketed in the USA before 1994), a notification should be filed to the FDA. This notification should contain information regarding the manufacturing process, identity, and safety of the new ingredient [20] [52], and it should be received at least 75 days before the product is marketed.
Food regulation in the US
In the US, food products are controlled by the FDCA. Products of this regulatory category are also allowed to make health, structure/function, or nutrition claims if derivate from their nutritive value. Food claims are controlled by the Nutrition Labeling and Education Act (NLEA) of 1990. Unlike the dietary supplements, the FDA does not require notifications from food manufacturers about their structure/function and nutrition claims, and disclaimers are not required in their labels [44]. Health claims in food have to be authorized by the FDA [53].
FDCA requires that the substances used in foods are generally recognized as safe (or is authorized by a prior sanction), clean, and that the food product labeling should be truthful and not misleading [53]. Furthermore, food products should follow GMP. Any imported food should be adequate to the FDCA rules through the Food Safety Modernization Act (FSMA).
The FDA recognizes different categories of foods: conventional food (the most common foods in the general food supply, such as vegetables and fruits), medical foods (intended for the specific dietary management of a disease), and dietary supplements [53].
1.1.1.3 Medical devices
Medical devices regulation in the EU
In the EU, medical devices do not undergo an official authorization procedure like medicinal products. Instead, a simpler CE-marketing document, which indicates that a device conforms with the applicable requirements set out in the Regulation (EU) 2017/745, is required [26]. The competent national authorities, and in some specific cases the EMA, are responsible for the regulation of medical devices in each country. According to Fan et al. [54], registration of products in this category may be more desirable because it is generally quicker than the ‘traditional’ route, and some limited therapeutic claims are allowed. Nevertheless, the documentation should present comprehensive clinical data demonstrating the product’s action by physical means or that it is ancillary to the physical

D. A. Frommenwiler Chapter 1
13
1
action. Quality and safety should also be proven [26]. The quality guideline for medical devices provides no specific quality control information for herbal products. Not all European countries accept herbal products as medical devices. Italy is one exception, in which many herbal products were approved in this class.
Medical devices regulation in the US
Medical devices are classified as Class I, II, and III. Class I are considered low risk and subject only to general controls such as tests of sterility. Therefore, they do not require premarketing notification. Class II are considered moderate-risk and, thus, must file a pre-marketing notification to FDA. Class III (e.g., defibrillators) require clinical studies evaluating the safety and effectiveness of the device and must file a Premarket Approval (PMA) application to the FDA [55].
One of the very few examples of herbal used as a medical device is the gutta-percha. This product is a dental device, made from coagulated sap of some tropical trees and used to fill the tooth root canal. It is classified as class I and thus, exempt from premarketing notification [56]. FDA does not specify the test required for herbals classified as medical devices.
1.1.1.4 Cosmetics
Cosmetics regulation in the EU
Cosmetic (herbal) products are regulated by competent national authorities in the EU, based on the regulation (EC) N° 1223/2009. The EU regulation requires these products to undergo notification procedure before marketing, via EU Cosmetic Products Notification Portal (CPNP), in which the safety and quality are assessed [27] [57]. This process is less expensive and complicated when compared to the medicinal products category [58]. Furthermore, cosmetic products should be accompanied by information such as purpose, warnings, and instructions for use, etc. [57]. The regulation (EC) N° 1223/2009 also includes a list of substances prohibited in cosmetic products. Some of them are plant species such as Monk’s hood (Aconitum napellus) [27].
Cosmetics regulation in the US
In the US, cosmetic (herbal) products are regulated by the FDA under the FDCA and the Fair Packaging and Labeling Act (FPLA). Soaps are excluded from cosmetics definition and are controlled by another agency than FDA. Some products regulated as cosmetics in other countries, such as sunscreen, anti-aging, or products used for the treatment of acne, dandruff, etc., or any cosmetic product that claims therapeutic action are considered as drugs or as both, cosmetics and drugs in the US. In this case, the product should comply with both regulations. Cosmetics do not require pre-marketing approval from FDA (except color additives). Furthermore, the law does not require cosmetics to follow GMP, or specify the minimum GMP requirements [59] [60].
According to the FDA, the manufactures of cosmetics are prohibited from marketing prod-ucts that are adulterated or misbranded (e.g., therapeutic claims in cosmetic only products). The manufacturers have the legal responsibility to ensure the safety of their products. No specific test to demonstrate safety is described in the regulation. The cosmetic companies are neither obliged to share their safety information with FDA or required to register their establishments or file their product formulations with FDA [61]. FDA has a brief list of prohibited substances in cosmetics, but none of them are of plant origin [62].
1.2 General considerations regarding regulation of herbals Currently, the world seems to have a fragmented approach to the regulation of herbals. There is no agreement on a standard classification of this type of ingredient. Instead, herbal products may be fitted into either medicine, food, food supplements, medical

D. A. Frommenwiler Chapter 1
1
14
devices, cosmetics, or other categories. As shown in section 1.1.2, each category has different requirements regarding quality, safety, efficacy, where the medicine category has the most stringent criteria compared to unclear criteria in others.
In this review, it was observed that excluding medicines, which are generally not considered as safe and thus require exhaustive control, the herbal products of other regulatory categories may not be thoroughly controlled by the national authorities. In these cases, the manufacturers are still responsible for the quality, safety and efficacy of their products. However, in practice, they are not always performing the corresponding tests, particularly because the process can quickly become very expensive when several tests are involved.
In the quality control framework, the non-medicines regulations require herbal products manufacturers to be compliant with the laws. Nevertheless, many of them do not offer clear guidance on how to do that, which tests are to be performed, what to monitor and which acceptances criteria to select. Other regulations may define just minimum requirements, such as those for dietary supplements in the US, where the manufacturers should follow GMP and conduct at least one appropriate examination to verify the identity. However, concrete instructions are still lacking.
So, manufacturers have the freedom to develop their own methods and specifications or use those described in a pharmacopoeia. In the latter case, they are neither obliged to perform all prescribed tests nor to be in agreement with the pharmacopoeia’s specifications as long as they do not claim compliance. Therefore, it is often observed that manufacturers chose only 1-2 tests from a monograph to analyze their product’s quality, e.g., the assay of markers. When these tests are taken out of a monograph’s context, the entire “quality picture” cannot be seen, but only fragments of it. This fact frequently led to adulteration, safety, and quality issues.
Another problem frequently observed is the lack of information regarding the type of product used and how it was prepared. Led by the believe that more analytical markers yield more efficacious products, the manufacturers limit themselves to monitor and mainly report the content of a marker as the synonym of good quality products instead of monitoring the entire composition of the herbal drug/preparation or products.
In order to address quality and other problems, it is inevitable to increase regulatory oversight of herbals in different non-medicine categories and to improve their regulation. Nevertheless, as mentioned by Low et al. [20], the regulatory burden cannot be ignored.
1.3 Which are the tests required for quality control of herbals according to the pharmacopoeias?
Pharmacopoeias and non-official compendia are crucial instruments for quality assurance and quality control of herbals. Most of the time they are enforced for herbal medicines but can also be applied to other regulations. Their role is to provide quality specifications, establish the test methods and acceptance criteria (as part of quality assurance) that are likely to be used by independent analysts for quality control and regulation of herbals [13] [146]. According to WHO [13], pharmacopoeias are legally binding collections, prepared by an authority, of standards and quality specifications for medicines used within its territory.
The official compendia are particularly crucial for harmonizing and standardizing the quality of herbals within a country or region. Examples of the main pharmacopoeias and their number of herbal monographs are shown in Table 1.1. Currently, the European and the US Pharmacopoeias contain state-of-art monographs and are references for quality assurance and control of herbals. They are broadly accepted and also used outside of their region (e.g., Ph. Eur. is often used in countries that have no specific monograph available or no pharmacopoeia [13]).

D. A. Frommenwiler Chapter 1
15
1
Table 1.1. Examples of some (non)compendial collections of herbal monographs. The listed herbal monographs include single and multi- herbal formulations, herbal drugs, preparations, products, and tinctures, sometimes of the same species.
Region Official* compendia N° of herbal monographs
Year/Edition/vol
Brazil Brazilian Pharmacopoeiaa 58 2014/5th China The Pharmacopoeia of the People’s Republic of
Chinab 610 2015/10th
Europe European Pharmacopoeiaa,b 346 2017/9th France French Pharmacopoeiab 52d 2005/10th Germany German Pharmacopoeia (DAB)b 19d 2018 Germany German Homeopathic Pharmacopoeia (HAB)b 441 2012 India Indian Pharmacopoeia [63] 165 2018 India Ayurvedic Pharmacopoeia of Indiab 847 2017/ Parts I-II India Siddha Pharmacopoeia of Indiab 139 2011/ vol I and II India Unani Pharmacopoeia of India 448 2016/ Vol I-III Japan Japanese Pharmacopoeiab 122 2016/17th ROK Korean Herbal Pharmacopoeiaa 561 2019 ROK Korean Pharmacopoeiaa 200 2014/11th Russia The State Pharmacopoeia of the Russian
Federationb 107 2018/ 14th
CH Pharmacopoea Helveticab 24d 2012/11th Thailand Thai Material Medicaa ≥ 200 NI Thailand Thai Herbal Pharmacopoeiaa 80 2018 UK British Pharmacopoeia (BP) 265c 2009/vol III US United States Pharmacopoeia (USP)b 214 2017/USP41NF36 Vietnam Vietnamese Pharmacopoeiab 330 2017/5th Edition
Region Non-official compendia N° of herbal monographs
Year/Edition/vol
Africa African Herbal Pharmacopoeiab 52 2010 Brazil Brazilian Homeopathic Pharmacopoeiab 34 2011/3rd Germany German Pharmaceutical Codex (DAC)b 82 2012 India Indian Herbal Pharmacopoeia [64] 40 NI India Quality Standards of Indian Medicinal Plants
(QSIMP)b 519
15 volumes, 2003-2017
Indonesia Pharmakope Herbal Indonesiab 171 2008-2011/EDISI I
Inter. WHO monographsb 117 2007/Vol 1-4
Japan The Japanese standards for non-pharmacopoeial crude drugs
56 2012
Malaysia Malaysian Herbal Monograph 60 1990-2013/ Vol 1-3
Taiwan Taiwan Herbal Pharmacopoeiab 301 2015 USA Dietary Supplement Compendium (DSC-USP)b 69 2015 USA Herbal Medicinal Compendium (HMC-USP)b 106 2018 UK British Herbal Pharmacopoeia (BHP)b 169 1996/2nd Hong Kong
Hong Kong Chinese Materia Medica Standards (HKCMMS)b
293 2002-2018/Vol 1-9
NI: Not informed; CH: Switzerland; EU: European Union; Inter: International; UK: United Kingdom; ROK: Republic of Korea. aData obtained from Presentation in TradReg congress 2017, Bonn-Germany; bData obtained either from the pharmacopoeia’s website or in the pharmacopoeia’s index; ccorresponds to a combined number of monographs from the European Pharmacopoeia and National Pharmacopoeia. dNumber of monographs corresponding only to the national Pharmacopoeia (excluding those that are from Ph. Eur.).
The quality of an herbal is defined through specifications, which will confirm the identity, purity, and content of the material [11] [12] [13]. Identification is performed to ensure that

D. A. Frommenwiler Chapter 1
1
16
the article under examination agrees with the name on its label [65]. For that, the morphoanatomic and chemical characteristics of the herbal ingredient are evaluated.
Purity tests are performed to verify whether the examined material contains undesired components such as adulterants, microbiological contamination, foreign matter, heavy metals, mycotoxins, pesticide residue, or other contaminants, and to ensure that the material is safe for use [66].
Finally, the content of active principle(s) or markers is determined in order to ensure that the strength of the herbal drug, preparation, and product in a batch is within the defined specifications, and that the amount of herbal ingredient per dosage unit of a product is correct [12] [66] [67]. Because herbals are chemically complex, tests for content are commonly based on the quantification of one or a few constituents [12].
Analytical methods and criteria of acceptance, together with other information about the herbal drug/preparation and in some cases its dosage form, are described in the individual monographs, general monographs and general chapters of the pharmacopoeias.
Table 1.2 shows the typical content of individual pharmacopoeial herbal monographs of the European Pharmacopoeia. The presence of some tests will depend on the nature of the material (whether it is an herbal drug, herbal extract, essential oils, etc.).
Table 1.2 General descriptions of the content of herbal monographs, based on [63] [65] [68]
Definition Includes at least Latin binomial (genus, species, subspecies, variety, author), plant part, state of the drug, minimum content (or limits) of quantified constituent(s)*
Characters Few physical and organoleptic characteristics (color and, sometimes, odor). This section is not mandatory in the Ph. Eur.
Production** - Information on harvesting, drying, etc. - Accepted extraction solvent, in the case of extracts
Identification - Macroscopic and microscopic characters (may include images or illustrations)
- Chromatographic profile (TLC, HPTLC, HPLC, GC) - Chemical reactions for identification - Other tests
Purity (tests for impurities/contaminants)
- Adulterants - Foreign matter, loss on drying, water content - Total ash, ash insoluble in hydrochloric acid - Heavy metals, pesticides, aflatoxins - Pyrrolizidine alkaloids - Microbiological quality
Assay (tests for minimum content or strength)
- Quantification of active principles or markers
Other tests* - Extractable matter, swelling index, bitterness value - Matter insoluble in ethanol - Residual solvent in dry extract**
Storage* Storage conditions Labeling* The general monograph covers most labeling items
*Not applicable to all monographs or not required by all pharmacopoeias; **Mainly in case of herbal preparations
1.4 What are the existing analytical techniques for performing quality control of herbals?
In order to perform the tests required by Pharmacopoeias, a combination of different

D. A. Frommenwiler Chapter 1
17
1
morphoanatomic, genomic, spectroscopic, and chromatographic techniques is used to assess the chemical, biological or physical parameters of an herbal drug, preparation or product. In this scenario, all analytical techniques are important for the evaluation of quality of herbals and are usually used in combination. As stated by Upton et al. [7], “the scientific validity of a technique depends on the analytical goal and is reflected in the concept of “fitness-for-purpose”. This means that each technique should be used for its correct purpose or function. In this section, different analytical techniques used in routine tests for identity, purity, and content, are briefly presented and discussed.
1.4.1 Organoleptic analysis
According to Dentali [69], the gross organoleptic analysis uses the sensorial impressions to examine and characterize the quality of a material, such as aroma, flavor/taste, texture, and appearance. It is applicable to identify mainly unprocessed herbal drugs, and only in some cases for herbal preparations. It is a low-cost alternative for identification, does not depend on expensive instruments and is still present in many pharmacopoeias. However, due to ethical reasons, nowadays tests for odor and taste are increasingly excluded from mandatory sections.
1.4.2 Macroscopy and microscopy
Macroscopy and microscopy are the oldest methods of identification of herbal drugs of economic and medicinal importance. They are part of nearly all pharmacopoeias worldwide and are one of the first identification tests required for pharmacopoeial compliance. They are used for the evaluation of the anatomical features of the examined herbal drug and are less often used for the analysis of herbal preparation [70] [71].
Due to their long history of use, extensive literature is available as reference for comparison [70] [71]. Moreover, those techniques are relatively inexpensive and straightforward to use. Macroscopy and microscopy can also be useful in the purity test for detecting adulterants of plant origin, inert inorganic material (such as sand, salts) and other foreign matter, which may have been added to increase the weight of a material [7] [70].
1.4.3 DNA barcoding
DNA barcoding emerged less than half a century ago, and, in recent decades, has been widely in the scientific literature for the quality control of herbals. It has been progressively adopted by different pharmacopoeias as a routine method. The DNA barcode of plants consists of characteristic combinations of nucleotides, generally extracted from the nuclear DNA, which allows the identification of the herbal drug species. DNA barcoding refers to the technique where numerous copies of DNA base-pair sequences are made using a primer in a polymerase chain reaction (PCR). Those copies are then identified using a sequencing method [72].
This powerful and sensitive technique is also applied to distinguish animals, plant, fungal, and bacteria species [72] and thus, is useful for purity test of the biological source. Being a not quantitative technique, it is not applicable for tests of content.
DNA barcoding is mainly applicable to the evaluation of herbal drugs with preserved genetic material. There are some difficulties in evaluating herbal preparations by DNA barcoding due to the fragmentation of the genetic material through extraction, exposure to high temperatures and other processes. Unlike the genome sequencing of animals, that uses the cythochrome oxidase I (COI) region of the mitochondrial genome to distinguish species, the DNA sequencing of herbals involves a combination of two or three shorter chloroplast regions (with 200-300 bp), called mini-barcode, to distinguish plant species (e.g., ITS2 and psbA-trnH) [72] [73] [74]. Such length can be easily retrieved from processed material and sometimes extracts.

D. A. Frommenwiler Chapter 1
1
18
Due to its exceptional sensitivity, next-generation sequencing (NGS) or DNA metabarcoding allows parallel sequencing of multiple DNA fragments from different material in a single run and thus permitting the analysis of poly-herbal formulation, and detection of adulterants even in trace amounts [7] [72]. Besides that, the DNA content is independent of the physical and seasonal variation. Different plant parts cannot be distinguished.
A successful identification of the botanical material by DNA barcoding relies on a solid DNA library, containing a large population of the target herbal drug and closely related species and adulterants [7].
As mentioned by DeSalle [75], the chemical constituents of herbals are mainly responsible for their biological activity. Thus, relying only on the genome-based authentication will be insufficient for their quality control. Nevertheless, DNA barcoding can be a beneficial complementary method [73]. Some examples of successful identification and test for adulteration have been shown in [76] [77] [78] [79] and [80].
1.4.4 Spectroscopic techniques
Different forms of spectroscopy create signatures or fingerprints without separation of sub-stances. Those techniques are viewed as ‘holistic’ methods because they generate spectra that contain information of the entire sample. In the following sections, the use of infrared, UV/visible, and nuclear magnetic resonance spectroscopy for quality control of herbals are discussed.
1.4.4.1 Infrared (IR) spectroscopy
Infrared (IR) spectroscopy includes the wavelengths between the visible (700 nm) and the microwave (1 mm) range of the electromagnetic spectrum and is divided into three regions: near IR (750 - 2500 nm), mid IR (2.5 – 25 μm), and far IR (25 – 1000 μm). Spectroscopic techniques in the infrared (IR) wavelengths have been widely used in the fields of food, agriculture, and pharmaceuticals, and is also recommended by different pharmacopoeias in monographs. The NIR is the IR technique most frequently used for the quality control due to its higher energy, facilitating deeper penetration and thus easier analysis of the samples. However, absorption bands in the NIR are much broader than in the mid IR and therefore often overlap [81] [82].
NIR spectroscopy can be used for the identification and quantification of ingredients, all in a single analysis. One of its significant advantages is very little or no need for sample preparation. Measurements can be performed in various types of samples, from solid to liquid. The instrumentation is also very flexible, portable and provides a rapid analysis (about 30 s in the case of NIR) with a relatively low running cost. It is considered a holistic method, capable of detecting different classes of compounds such as carbohydrates, amino acids, lipids, fatty acids, proteins, polysaccharides, etc. [83].
In the herbals field, the most commonly applied techniques are the Attenuated Total Reflection (ATR-IR, the most sensitive) and near IR (NIR, the least sensitive). Generally, IR is mainly used as a qualitative method. Besides the chemical information, other anatomical characteristics of the herbal drug surface can be obtained (e.g., hairy epidermis) [7]. It has been also applied for the assay of either a group of substances or specific markers. Huck [82] listed some publications that use NIR for the assay of, for example, total polyphenols in grape seed, blueberries, primula, and total catechins in green tea, bamboo leaves. Huck [82] also reported the use of NIR for the assay of specific markers. Some examples are the quantification of hypericin plus hyperforin in St. John’s wort, verbenalin plus verbascoside in Verbena officinalis, kavalactones in kava, and ginsenosides in ginseng root [82]. The polyphenol quantification is particularly attractive because it does not require pre-treatment of the sample, as in the classic Folin Ciocalteau method. This can reduce errors during an assay. Several publications have shown the use of NIR for the identification of herbals and discrimination of related species and plant parts,

D. A. Frommenwiler Chapter 1
19
1
geographic origins, etc. as an alternative to the current pharmacopoeial identification methods [7]. However, reliability of the IR results depends on well-developed reference spectral library [7].
In summary, IR spectroscopy is suitable for the rapid evaluation of the chemical and physical properties of herbal samples. Nevertheless, the lack of well-established herbal drugs IR data bases and the need of chemometric methods to interpret the data limits its applicability as an identity method.
1.4.4.2 Ultraviolet (UV) spectroscopy
The use of UV spectroscopy has only a very limited number of publications in the field of identification, species discrimination, and test for purity of herbals. Some examples are shown in [84] [85] and [86]. Leung [87] presented an interesting application of UV spectroscopy for the identification of herbal drugs. In his approach, he combined the holistic information of the UV-Vis spectroscopy (UV spectra) with that of HPTLC fingerprints, obtained with different solvent systems, to develop as many identification features as possible. The set of data was compared to that of a characterized botanical reference material. This approach was successfully used to properly identify three Chinese herbal drugs.
In contrast, UV-visible spectrophotometry is a well-established methodology, which is often described and recommended by different pharmacopoeias as a quantitative method. It is regarded as moderately sensitive and robust. In the quantitative analysis of herbals, spectrophotometry typically groups similar compounds. For example, it is used to assay total flavonoids and phenolic compounds, hydroxyanthracene glycosides, anthocyanins, coumarins, lignans, sugars, etc. [88] [89]. In many cases, these assays require a colorimetric reaction (e.g., Folin-Ciocalteau) to either make saturated compounds absorb UV-vis light by adding a chromophore, or to change the absorbance wavelength of a molecule to make the assay more selective [90]. Due to its “grouping” characteristic, UV-visible spectrophotometry often gives a more comprehensive representation of the totality of the herbals’ composition. However, such a general approach has a disadvantage of being easily fooled by admixtures of adulterants [6]. In a review publication, Foster and Blumenthal [91] reported that the UV assay of total anthocyanins in bilberry extract could be misled by the addition of anthocyanins-reach material, yielding a false-positive result. Kupina and Gafner [92] mentioned that one of the main reasons for adulterating grape seed with peanut skin is due to manufactures relying on the lack of specificity of the UV spectrophotometric assay of proanthocyanidins.
1.4.4.3 Nuclear Magnetic Resonance (NMR) spectroscopy
NMR is widely used for the analysis of natural products and is the benchmark technique for structure elucidation of organic compounds [93]. NMR can detect a broad range of substances due to its universality (detects all compounds with NMR-active nuclei), is non-destructive, does not require elaborate sample preparation and can be used without separation techniques.
In the field of identification, NMR has been used for fingerprint analysis through two main approaches: targeted and non-targeted. The targeted approach involves the evaluation of specific analytes [93]. The non-targeted approach involves the analysis of the entire chemical profile (approximately 30–150 metabolites), generally of the 1H-NMR spectrum. Data interpretation with chemometric methods is often required for this case [93] [94]. This combination is widely applied for assessing adulteration in foodstuff [7]. Other types of NMR analysis, such as 2D NMR (e.g., COSY, HMBC, HSQC, 2D J-resolved, CRAFT) is less often applied for the quality control of herbals.
Because in NMR, the intensity and frequency of the signals are proportional to the number of atoms (molar concentration) and strength of the magnetic field, NMR provides absolute measurements for quantification. Quantitative analysis by NMR (qNMR), can be done with

D. A. Frommenwiler Chapter 1
1
20
an internal calibration (addition of a known amount of reference substance to the sample) or external calibration (reference standard with known concentration and samples are analyzed separately). [95] [96] [93] [97]. For complex herbal mixtures, quantification of multiple substances can be performed simultaneously [98]. Examples of its applicability for the quantitative assessment of herbals is extensively reviewed by Pauli et al. in [99] and [100].
The suitability of NMR for routine quality control of herbal drugs is limited by the high costs of non-portable instruments, when compared to other techniques [7]. Nevertheless, several publications show the usability of this technique for identification, determination of purity, and assay of herbals. Since 2018, the US Pharmacopoeia has been introducing qNMR for the evaluation of the composition and simultaneously quantification of multiple compounds of herbal medicines and dietary supplements [101].
1.4.5 Mass spectrometry (MS)
Mass spectrometry is extensively used in the fields of pharmaceutical, environmental, food analyses, clinical diagnostics, forensics, and protein research [102], and is mainly hyphenated with separation techniques (GC, LC, HPTLC and capillary electrophoresis (CE). The application in the quality control of herbals of the hyphenated techniques will be discussed in the following sections.
MS spectrometry is very sensitive, provides high resolution, has an extensive dynamic range (ratio of the largest to smallest detectable signal) [103], and it does not depend on chromophores or functional groups for the detection of compounds [104]. Even though it less universal than NMR, hyphenated MS is a very selective method capable of distinguishing compounds with highly similar structures. Additionally, it can perform structural confirmation by comparing the masses of the fragments with those from a spectral library or the literature [102].
MS instruments can be very costly, depending on the selected configuration, which may prevent them from being used in routine analysis [105]
1.4.6 Chromatographic techniques
Chromatography has been extensively used in the quality control of herbals and is the “golden standard” of most of the pharmacopoeias and non-official compendia [106]. It represents a significant advantage for the analysis of complex mixtures, because it increases the resolution of the data, and can detect different classes of compounds when hyphenated with different detectors or submitted to chemical reaction(s). In this work, the main chromatographic techniques (gas, liquid, and planar) used for the quality control of herbals will be discussed.
Beside identification and tests for content, chromatography techniques are used to detect and quantify over 250 different pesticides [12] [107], and detect (and in some cases, quantify) mycotoxins [108] and pyrrolizidine alkaloids as part of the purity test.
1.4.6.1 Gas chromatography (GC)
The use of gas chromatography (GC) is well established in different fields, such as phar-maceuticals, cosmetics, environmental, forensic, petrochemical, and others analyses [109]. GC is recommended by many pharmacopoeias and compendia for the analysis of essential oils and essential oil-containing herbal drugs. There exists a vast literature on this topic.
Gas chromatography can be hyphenated with different detectors. The most common is the flame ionization detector (FID), while the MS detector is less common in routine quality control analysis. Hyphenated GC analysis offers some advantages such as very low detection limits and high separation power [106] [110] [111]. GC is the technique of choice for the quality control of essential oils in the pharmacopoeias, giving information relative

D. A. Frommenwiler Chapter 1
21
1
to the identification, purity, and content of constituents. An example is the use of GC-FID for anise oil in the Ph. Eur. In this monograph, the identification of anise oil is made by comparing the retention times of the peaks of 7 specific constituents in the chromatograms of the sample and reference solutions. Relative content for these constituents is also obtained from the same chromatogram through normalization procedure. GC-FID is also used for a limit test for foeniculin and fenchone (two markers for dulterantion). Samples should not contain more than 0.01% of them [112].
GC-MS offers the advantage of reproducible spectra, particularly due to the standardized MS ionization energy. Due to its availability, reliability, effectiveness, and reproducibility, GC-MS has a long history of use in metabolomic studies. Thus numerous databases and libraries are available, also for secondary metabolites of herbals [106] [113] [110] [111].
Regarding quantitative analysis, the most common approaches in the pharmacopoeias and routine quality control are normalization and absolute quantification. The first approach quantifies the relative % abundances of the detected peaks, as in the example of anise oil. It is accepted as a semi-quantitative method and is prescribed in many monographs. The second approach quantifies some markers through calibrations with internal or external standards [114]. It is less observed in the monographs using GC.
Besides these applications, GC hyphenated with MS is often used for the analysis of non-polar and semi-polar pesticides [115] [116].
1.4.6.2 High-performance liquid chromatography (HPLC)
HPLC is one of the principal chromatographic methods and is the technique of choice for quality control in different fields such as environment, food, drugs, cosmetics, forensic, detection of mycotoxins, etc.. In the herbal field, pharmacopoeial monographs use HPLC mainly as a quantitative technique [117] for determination of active principles, markers, or contaminants and, to a lesser extent, for identification or detection of adulterants. Furthermore, there exist a vast literature using hyphenated HPLC for identification, determination of purity, and content of herbals, based on targeted analysis [118].
This technique has many advantages, such as easy and fully automated operation, suitablility to analyze almost all secondary metabolites from herbals, as well as high precision, resolution, selectivity, and sensitivity [119][118][117]. The most advanced form of HPLC is ultra-HPLC (UHPLC), featuring even smaller particles in shorter, narrow columns, and stronger pumps, which substantially increased the chromatographic resolution and peak capacity compared with HPLC, and may shorten the time of analysis. Nevertheless, such advance is associated with higher prices and less equipment available worldwide [111]. Therefore, it is not yet often applied to routine quality control of herbals.
To detect different classes of secondary metabolites, HPLC can be coupled with different detectors. The most frequently used is a UV detector (e.g., diode array detector (DAD)). Other detectors are evaporative light scattering detector (ELSD), charged aerosol detector (CAD), chemiluminescence detector (CL) for non-UV absorbing compounds, NMR, and mass spectrometry (MS) for universal detection and identification of substances [117] [119]. Coupling HPLC with NMR is not an economical alternative, and thus not feasible for routine analysis.
In the pharmacopoeias and compendial methods, quantitative analysis of non-volatile sub-stances in herbals is mainly performed by HPLC. Some approaches are: (1) direct quan-tification of one or fewer compounds, using reference substances at single concentration level; (2) quantification of the sum of peaks against a reference substance; and (3) group assays using hydrolysis reactions of the test solution for reducing the number of compounds to be separated (e.g., total flavonoids after hydrolysis, converting complex mixtures of glycosides into fewer aglycones) [6].
Besides that, HPLC-MS is often applied for the analysis of a wide range of pesticides and

D. A. Frommenwiler Chapter 1
1
22
mycotoxins in herbals [115] [116]. USP also recommends the use of a HPLC-fluorescence detector together with post-chromatographic column derivatization for the analysis of afla-toxins [120].
1.4.6.3 High-performance thin-layer chromatography (HPTLC)
Thin layer chromatography (TLC) was the first chromatographic method used for herbal screening and identification in pharmacopoeias, and is still recommended by most of these compendia [121]. However, because of its non-instrumental and non-standardized characteristics, this technique has low resolution and reproducibility, high detection limits, and is not suitable for quantitative analysis [119]. Nevertheless, TLC saw significant improvements after the introduction of high-performance thin-layer chromatography (HPTLC) [122].
TLC and HPTLC share the same basic principle. HPTLC is the High-Performance version of TLC, which focuses on better reproducibility, sensitivity, separation power, data tracea-bility, and GMP compliance. It relies on the use of a stationary phase with smaller particle size, automation of all steps through instruments controlled by software, optimized and standardized parameters, well-defined, and validated methods. Such advance leads to reliable analytical results with good intra- and inter-laboratory reproducibility [123] [122] [119]. The HPTLC concept and its specific parameters for the analysis of herbals are described in the main pharmacopoeias, such as Ph. Eur. and USP, in general chapters:
2.8.25 (High-performance thin-layer chromatography of herbal drugs and herbal drug preparations) in the 9th edition of the European Pharmacopoeia [122].
Chapters <203> (High-Performance Thin-Layer Chromatography Procedure for Identification of Articles of Botanical Origin) and <1064> (Identification of Articles of botanical origin by High-Performance Thin-layer Chromatography procedure) in the USP 38 – NF 33 [122].
Some of the advantages of HPTLC for the analysis of herbals are simplicity, the possibility of combining a large number of stationary and mobile phases, and different choices of chamber configuration. It requires simpler sample preparation (no need to remove substances that bind irreversibly to the stationary phase, which is disposable), has low solvent consumption (no need for pre-equilibration of the system), and has the capacity of analyzing a large number of samples simultaneously (15 per plate) [121] [124]. The possibility of multiple detection and derivatizations gives flexibility to TLC/HPTLC and allows detecting compounds of different phytochemical groups in a single analysis [122]. The characteristic fingerprint of herbal drugs and preparations is one of the highlights of this technique, which relies not only on the RF values of the zones and their intensities but also on their specific colors prior to and after derivatization.
Due to its long history of use as a method for the identification of herbals, a vast number of TLC/HPTLC methods are available worldwide. According to Reich et al. [125], in 2015, there were at least 1666 methods only from compendial sources applying TLC/HPLTC for the identification of plant material. This number tends to grow towards HPTLC with the modernization of the monographs for herbals in the most important pharmacopoeias worldwide [122].
When HPTLC data is generated under standardized and reproducible conditions, it is pos-sible to compare images of tracks from different plates and laboratories side-by-side, with the support of software (e.g., Figure 1.2). For example, Booker et al. [126] compared 40 different samples of turmeric analyzed on 4 different plates. This feature is a good basis for data exchange. According to Cañigueral et al. [122], images can be stored in an electronic atlas or even in a cloud, which can be accessed by different labs, enabling global exchange and collaboration.

D. A. Frommenwiler Chapter 1
23
1
Figure 1.2 Images of the fingerprints of 40 turmeric samples, arranged according to their similarities, after derivatization under white light. Mobile phase toluene, acetic acid 4:1 (curcuminoids determination). Image adapted from [126].
HPTLC is a useful tool for determining the purity of herbals. Several pharmacopoeias in-cluded in their specific monographs the use of HPTLC and TLC for distinguishing close related species, confounding material, and adulterants [122].
Quantitative HPTLC is less often used by Pharmacopoeias. However, there exists a vast number of publications reporting absolute quantification of markers (with chemical standards and calibration curves) by HPTLC, using validated methods with good accuracy and precision. Examples are shown in [127] and [128].
In addition to these features, HPTLC is also applied to stability studies of herbal products. Cañigueral et al. [122] stated that stability studies are necessary for the market authorization of an herbal medicinal product, and HPTLC can be straightforwardly applied, particularly to analyze the variation of the entire fingerprint, rather than of a single marker. Stability studies usually combine analysis of fingerprints with quantification of markers. Besides these applications, HPTLC is also recommended for the analysis of aflatoxins by the USP [120].
1.4.7 General considerations regarding analytical techniques used for quality control of herbals
As observed in this review, some techniques such as spectroscopy can look into the chemical composition of herbals in a less specific but more holistic way, considering its entire composition. On the other hand, chromatographic techniques allow to zoom into specific classes or individual compounds, being more selective but less holistic. Biological identification have irreplaceable features, such as detection of material invisible to chemical techniques or morphologic and genomic characterization of herbal drugs. Therefore, there is no absolute method capable of evaluating all quality parameters for herbals. Instead, a combination of them is often applied.
Nevertheless, it is important to consider that the chemical composition of an herbal is responsible for its pharmacological activity and its safety. Thus, the focus of the quality control and assurance should be on the chemical characteristics of the herbal. In this context, chromatographic and spectroscopic techniques are irreplaceable. Chromatographic methods have the main advantage of separating complex mixtures and looking into the different potions of the chemical composition. They are particularly powerful when coupled with spectroscopic detectors. The main advantages and limitations of all discussed techniques are shown in Table 1.3.
However, if a large number of tests have to be performed for quality control, the associated costs increase dramatically. Instead, if some techniques could be better explored for their entire potential, the number of analyses and the costs could be reduced. In this context, HPTLC proved to be a simple, visual, and pragmatic technique, capable of delivering reliable and reproducible results based on standardized methodology [122]. The improvements introduced with the instrumentation and software open a whole new field in herbal analysis. The unique characteristics of HPTLC fingerprints (position of the zones, their intensities, and colors in multiple detections), allow visual or software-based comparison with other samples and simpler interpretation of the chromatogram.

D. A. Frommenwiler Chapter 1
1
24
Additionally, HPTLC results generated on different plates and laboratories can be directly compared. HPTLC also offers several advantages in comparison to other chromatographic and spectroscopic techniques, by combining features of both. For example, besides offering the separation of compounds, with HPTLC, the entire test solution is detected on the plate and is part of the fingerprint, including substances at the application position. With GC or HPLC, not everything that is injected in the instrument will be eluted or detected. With HPTLC, it is possible to detect several classes of substances in a single analysis, with the support of derivatization steps. For achieving this detection, different spectroscopic techniques may be used. The use of universal detectors (e.g., NMR) may offer a comprehensive detection. Nevertheless, most of the time, it is not coupled with a separation technique, and simpler instruments lack sensitivity.
Table 1.3 techniques used for quality control of herbals. Description of their advantages and limitations.
Morphoanatomic techniques
Advantages Limitations
Organoleptic Analysis
Does not require expensive instruments
Applicable to the identification of herbal drugs and detection of adulterations
Limited applicability for identification of herbal extracts and products
Requires well-trained personnel Sensorial description subjected to
personal interpretation Odor and taste are not considered
ethically suitable as mandatory tests
Macroscopy
Does not require expensive instruments
Applicable to the identifica-tion of intact herbal drugs and detection of adulterants
Can identify different parts of the plant
Low cost
Not suitable for powdered herbal drugs
Limited application for extracts and products
Criteria of acceptance as written des-criptions
Microscopy
Does not require expensive instruments
Applicable to the identifica-tion of intact and powdered herbal drugs
Can identify different parts of the plant
A large amount of referential information available
Digital images available Relatively low cost
Powdered material can lead to misidentification of herbal drugs from close species
Limited applicability for the identification of herbal extracts, tinctures, and products
Criteria of acceptance as written des-criptions
Genomic techniques
Advantages Limitations
DNA barcoding
Useful for species identifica-tion of herbal drugs
Independent from the sea-sonal variations and age of the plant
Analysis in products contai-ning multiple plant species is possible (Next Generation Sequencing and metabarco-ding)
Sensitive
Requires expensive instrumentation Presence of some plant constituents
and excipients may interfere with the analysis, leading to false results
Not suitable for identification in pro-cessed herbal preparations and pro-ducts
Universal DNA barcoding may be dif-ficult for accurate species identifica-tion
Identification based on a combination of two or more small regions (e.g., ITS2 and psbA-trnH) leads to higher costs

D. A. Frommenwiler Chapter 1
25
1
Problems to identify hybrids Cannot distinguish the different plant
parts of the same species Cannot detect adulteration with che-
micals and addition of exhaustively extracted material
Lack of reliable information from data bases and vouchered species
Spectroscopy techniques
Advantages Limitations
IR
Low to high-cost instrumenta-tion
Flexible and portable instru-mentation
Very simple or no sample preparation is required
Short analysis time Analyze full spectrum pattern Simultaneous quantification of
different constituents is possi-ble
A number of samples are required to calibrate the instrument and identification system.
Interpretation of data from complex samples requires chemometric methods.
Quantification methods are not very robust
Quantification methods have a low sensibility
Existing spectral libraries are not suitable for identification of species
UV-Visible
Low to high-cost instrumenta-tion
Simple and easy to use Analyze full spectrum pattern Allows quantification
Limited applicability as an identifica-tion method due to unspecific charac-teristics of the UV-Vis spectrum
Only substances with chromophores are detected
Substances without chromophores re-quire chemical derivatization
Low specificity (substances can have similar spectrum)
NMR
Is a non-destructive method Robust instrumentation Highly reproducible technique
if all the parameters are care-fully maintenance
Simple or no sample prepara-tion required
Does not require separation technique
Can analyze the total chemi-cal composition and detects a high number of metabolites
Suitable for ID and detection of adulterants
Can quantify without stan-dards (using pre-established calibration curve) or internal standard
Is a universal detector for or-ganic molecules
Very high-cost instrumentation Maintenance and consumable costs
are very high Low sensitivity compared to other
spectroscopy techniques Requires experienced personal 1H-NMR provides complex spectra
with overlaying peaks, hampering the use for identification and quantifica-tion
13C-NMR provides simpler spectra than 1H-NMR but requires a longer time for acquisition and is less sen-sitive than 1H-NMR.
Interpretation of data from complex samples may require chemometric methods.
Chromatographic techniques
Advantages Limitations
GC
Low to high-cost instrumenta-tion
High separation efficiency Sensitive detection
Not suitable for thermo-labile com-pounds
Non-volatile compounds require deri-vatization

D. A. Frommenwiler Chapter 1
1
26
Robust technique Well established MS libraries
for GC-MS analysis Suitable for quantification
It may be difficult to compare spectra of derivatized samples with an exis-ting data base
HPLC
Well-established technique Large literature available in
the herbal field Fully automated Suitable to analyze a wide
range of constituent classes Relatively robust methods Suitable for quantification UHPLC increases resolution
and reduces analysis time
Medium to very high-cost instrumen-tation.
Uses large volumes of solvents HPLC has lower resolution power
than GC Columns lack long term reproducibility Samples may require clean-up A most common detector, UV-vis, is
not universal
HPTLC
Low to medium cost instru-mentation.
Simple sample preparation Well-defined and validated
methods provide good intra- and inter-laboratory reprodu-cibility.
Suitable for identification, pu-rity test, and quantification
Lower solvent consumption than HPLC
Multiple detections possible in a single analysis
Instruments require very little maintenance
Data from different laborato-ries can be compared through image library
Limited resolution and separation ca-pability
Limited sensitivity Absence of fully automated systems. Detection may require chemical deri-
vatization Lower precision and linearity range
than HPLC and GC in quantitative analysis
Plates from a different manufacturer can lead to different selectivity

Chapter 2: Objectives


D. A. Frommenwiler Chapter 2
2
29
As reviewed in the introduction, quality control of herbals is a complex process that involves several steps, performed by a combination of methods. This assessment is often associated with high costs, which can discourage medium-small business to perform proper quality control of their material. Maybe, the number of analyses and cost could be reduced if the full potential of some techniques would be utilized.
Some analytical techniques, such as chromatography, offers a comprehensive set of data, which can be used for different assessments. Among chromatographic techniques, the thin-layer chromatography (TLC) has been used for years as initial screening and identification of herbals. High-performance thin-layer chromatography (HPTLC) is the modern version of TLC. When the full potential of HPTLC is unlocked, quality control could be performed in a straightforward, very cost-efficient way because qualitative and quantitative information about the sample can be obtained in a single HPTLC analysis.
Based on this hypothesis, the general objective of this work was to explore in-depth the capacities of HPTLC and develop pragmatic applications of HPTLC for quality control of herbals far beyond simple identification of the herbal drug, preparation, and product. Fitness for purpose and scalability to the different needs of different regulatory frameworks have been the key elements of the work.
The specific objectives, developed from the general objective, were the following:
1. Experimentally develop different case studies to investigate current quality problems of herbals regulated under different categories.
2. Show the usefulness of the HPTLC, as described in the pharmacopoeias and with enlarged interpretation, as a tool for detecting quality problems, such as adulteration.
3. Develop a new concept, named comprehensive HPTLC fingerprinting, taking advantage of the quantitative aspects of the HPTLC fingerprint, and its application to the quality control of herbal products, particularly to identity, purity and the content of markers.
4. Demonstrate the usefulness of comprehensive HPTLC fingerprinting in the test for adulterants and use the quantitative aspects of the electronic images to perform limit tests on purity.
5. Evaluate the use of comprehensive HPTLC fingerprinting as an alternative method to the current HPLC assay of markers, in order to simplify the quality control of TCM herbal drugs of the Ph. Eur.
6. Evaluate the applicability of comprehensive HPTLC fingerprinting to determine the content of a group of constituents in an herbal drug. In addition, evaluate the use of pattern recognition tools to automate the identification of the samples.
7. Develop a practical guideline on how to develop a comprehensive HPTLC fingerprinting method.
The specific objectives are addressed in the different chapters as follows. Current quality problems of marketed herbal products (objective A) is studied in the chapter 3 (milk thistle, coneflower and black cohosh products) and chapter 5 (ginkgo products). Chapter 3 also addresses objective B.
The concept of comprehensive HPTLC fingerprinting (objective C) is developed in chapter 4, using the case of the root of Angelica gigas as a proof of concept. The application of comprehensive HPTLC fingerprinting to a better assessment of adulterations, including to performing limit tests for adulterants (objective D) is investigated in chapter 5 using products of Ginkgo biloba leaf and extracts.
The objective E, this is the application of comprehensive HPTLC fingerprinting to perform a test for minimum content of markers as an alternative for the assay in TCM herbal drugs

D. A. Frommenwiler Chapter 2
2
30
of the Ph. Eur. has been developed for Fritillaria thunbergii bulbs and corydalis rhizome in the chapter 6. The applicability of comprehensive HPTLC fingerprinting to determine the content of a group of constituents in an herbal drug and the use of pattern recognition tools for identification (objective F) has been studied in the case Ganoderma lucidum fruiting body and the triterpenic acids group (ganoderic and ganoderenic acids) were the constituents analysed.
Finally, after the general discussion of results and taking advantage of the experience gained along the development of the different methods of the thesis, a guidance for future comprehensive HPTLC fingerprinting methods development has been elaborated (objective G) and is presented in the last section of chapter 8.

Part II: Results


Chapter 3: Investigation of market herbal products regulated under different categories: how can HPTLC
help to detect quality problems?

This manuscript has been submitted to Journal of AOAC International on 27.06.2020

D. A. Frommenwiler Chapter 3
35
3
Resum
Investigació de productes a base de plantes del mercat regulats en diferents
categories: com pot ajudar l’HPTLC a detectar problemes de qualitat?
Antecedents: S’ha trobat que els productes a base de plantes regulats en diferents categories són de diferent qualitat. Això ho demostra el nombre creixent de publicacions sobre la qualitat dels productes a base de plantes a la literatura científica. Una adequada identificació és una manera eficaç d’abordar aquesta qüestió de forma precoç en el procés de fabricació d’un producte.
Objectius: Avaluar la qualitat de drogues vegetals, preparacions i productes a base de card marià, equinàcia i cimicífuga comercialitzats en diferents categories regulatòries, i ilꞏlustrar la utilitat de l’HPTLC com a eina d’avaluació de la qualitat.
Mètodes: Els mètodes HPTLC es van adaptar a partir de les monografies de la Farmacopea Europea per al fruit de card marià, el rizoma de cimicífuga i l’equinàcia purpúria. Es van utilitzar modes de detecció addicionals més enllà dels descrits a les monografies i es van fer servir les empremtes dactilars completes de HPTLC per a l'examen de la identitat i la puresa de les mostres investigades.
Resultats: Tots els productes regulats com a medicaments tradicionals a base de plantes van mostrar una bona qualitat: les seves empremtes dactilars eren consistents i sense zones inesperades. Un nombre significatiu de complements alimentosos van mostrar problemes de qualitat (principalment adulteracions): el 52,4% per al card marià, el 33,3% per a les equinàcies i el 45,5% per als productes de cimicífuga. El mateix es va observar en el 66,6% de drogues i preparats vegetals de cimicífuga.
Punts destacats: s’ha demostrat que els mètodes per HPTLC optimitzats i normalitzats, juntament amb l'avaluació de l'empremta dactilar complerta mitjançant diversos modes de detecció, constitueixen una tècnica rendible per a la detecció ràpida de diversos problemes de qualitat en drogues, preparats i productes a base de plantes. Els nostres resultats suggereixen que regulacions menys estrictes poden afectar negativament la qualitat dels productes a base de plantes comercialitzats.

D. A. Frommenwiler Chapter 3
36
3
Resumen
Investigación de productos a base de plantas comercializados en diferentes
categorías regulatorias: ¿cómo puede ayudar la HPTLC a detectar problemas de calidad?
Antecedentes: Se ha encontrado que los productos a base de plantas regulados en diferentes categorías son de diferente calidad. Esto lo demuestra el número creciente de publicaciones sobre la calidad de los productos a base de plantas en la literatura científica. Una adecuada identificación es una manera eficaz de abordar esta cuestión de forma precoz en el proceso de fabricación de un producto.
Objetivos: Evaluar la calidad de drogas vegetales, preparados y productos a base de cardo mariano, equinácea y cimicífuga comercializados en diferentes categorías regulatorias, e ilustrar la utilidad de la HPTLC como herramienta de evaluación de la calidad.
Métodos: Los métodos por HPTLC se adaptaron a partir de las monografías de la Farmacopea Europea para el fruto de cardo mariano, el rizoma de cimicífuga y la equinácea purpúrea. Se utilizaron modos de detección adicionales más allá de los descritos en las monografías y se usaron las huellas dactilares completas de HPTLC para el examen de la identidad y la pureza de las muestras investigadas.
Resultados: Todos los productos regulados como medicamentos tradicionales a base de plantas mostraron una buena calidad: sus huellas dactilares eran consistentes y sin zonas inesperadas. Un número significativo de complementos alimenticios mostraron problemas de calidad (principalmente adulteraciones): el 52,4% para el cardo mariano, el 33,3% para las equináceas y el 45,5% para los productos de cimicífuga. Lo mismo se observó en el 66,6% de drogas y preparados vegetales de cimicífuga.
Puntos destacados: se ha demostrado que los métodos por HPTLC optimizados y normalizados, junto con la evaluación de la huella dactilar completa mediante diversos modos de detección, constituyen una técnica rentable para la detección rápida de varios problemas de calidad en drogas y preparados vegetales, así como productos a base de plantas. Nuestros resultados sugieren que regulaciones menos estrictas pueden afectar negativamente la calidad de los productos a base de plantas comercializados.

D. A. Frommenwiler Chapter 3
37
3
Investigation of market herbal products regulated under different categories: how can HPTLC help to detect
quality problems?
Débora A. Frommenwilera,b*, Eike Reicha, Maged Sharaf c, Salvador Cañigueralb and Christopher J. Etheridged
aCAMAG Laboratory, Sonnenmattstrasse 11, 4132 Muttenz, Switzerland; bUnit of Pharmacology, Pharmacognosy and Therapeutics, Faculty of Pharmacy and Food Sciences, University of Barcelona, Av. Joan XXIII, 27-31, ES-08028 Barcelona, Spain; c HPTLC Association, Dianastrasse 10, CH4310, Rheinfelden Switzerland; dBritish Herbal Medicine Association (BHMA), PO Box 583, Exeter EX1 9GX, UK
*Corresponding autor: Débora A. Frommenwiler, CAMAG Laboratory, Sonnenmattstrasse 11, CH-4132 Muttenz, Switzerland. E-mail: [email protected]; Phone: +41 61 4673431; Fax: +41 61 4610702
3.1 Abstract Background: Herbal products regulated under different categories were found to be of different qualities. This has been demonstrated by the increasing number of reports on the quality of herbal products in the scientific literature. Proper identification is an effective way to address this concerning issue early on in a products’ manufacturing process.
Objectives: To assess the quality of milk thistle, coneflower and black cohosh herbal drugs, preparations and products commercialized under different regulatory categories, and to illustrate the usefulness of HPTLC as a tool for evaluating quality.
Methods: HPTLC methods were adapted from the European Pharmacopeia’s monographs for milk thistle fruits, black cohosh and purple coneflower. Additional detection modes beyond those described in the monographs were employed, and the entire HPTLC fingerprints were used for the examination of identity and purity of the investigated samples.
Results: All products regulated as Traditional Herbal Medicinal Products showed good quality: their fingerprints were consistent and without unexpected zones. A significant number of food supplements showed quality issues (mainly adulterations): 52.4% for the milk thistle, 33.3% for the coneflowers, and 45.5% for the black cohosh products. The same was observed in 66.6% of black cohosh herbal drugs and preparations.
Highlights: Optimized and standardized HPTLC methods along with the evaluation of the entire fingerprint using several detection modes, proved to be a cost-efficient technique for quick detection of a range of quality issues in herbal drugs, preparations and products. Our findings suggest that less stringent regulations can negatively affect the quality of marketed herbal products.
3.2 Introduction Herbal products containing the same ingredient and regulated under different categories can be of different quality, because regulatory evaluations do not require the same scientific scrutiny. Although companies producing food supplements are obliged to comply with GMP, in many countries, those products do not undergo pre-evaluation/approval by a national authority. According to Low et al. (1), mandatory pre-marketing evaluation of products regulated under non-drug categories can increase the burden on both regulators

D. A. Frommenwiler Chapter 3
38
3
and business, and thus seem to be an unrealistic solution. A reason that could explain the variation in qualities of herbal products in different markets. Cost of analysis and use of expensive equipment can further exacerbate this burden.
Quality control of herbal products starts with the proper identification of their herbal ingredients. By using the right set of tools, additional quality parameters (beyond establishing the correct identity) can be assessed within the same analysis (e.g., purity of the material). Techniques such as HPTLC, recommended by pharmacopoeias to evaluate the identity of herbals, can deliver supplementary valuable data without the need for additional analyses. In addition, multiple samples can be tested at the same time and under the same exact conditions on one plate. With the proper resources, multiple samples can be compared across HPTLC plates that have been developed at different times and / or in different laboratories. In addition, the entire fingerprint of a sample, sometimes in multiple detection modes, can be utilized for assessment instead of looking at only a few zones as described in the acceptance criteria of typical monographs. Such extended evaluation of a single HPTLC analysis, in comparison to other tools, is useful for detecting zones that may indicate quality problems (2).
To illustrate this concept, three case studies have been conducted: milk thistle, coneflower, and black cohosh. The first two case studies were conducted in collaboration with the British Herbal Medicine Association (BHMA). The examples were chosen based on their market importance. According to Smith et al. (3), in 2016, these three herbal ingredients were listed among the top-20 selling products in the U.S. mainstream market. They are also well-known ingredients in the European market.
Milk thistle, the dried fruit of Silybum marianum (L.) Gaertn., is one of the most frequently sold herbal products for treatment and relief of dyspepsia and digestive complaints of hepatic origin. Its preparation is usually standardized to contain 70-80% of three flavonolignans (silybin, silychristin, and silydianin), collectively known as silymarin. A high concentration of flavonolignans in milk thistle extract is recommended because of their poor absorption in the gastrointestinal tract (4). Therefore, many products in the market declare to be standardized to contain high levels of silymarin. Another major constituent of milk thistle is the flavonoid taxifolin. Milk thistle is recognized as a Traditional Herbal Medicinal Product (THMP) and as a Traditional Herbal Registration (THR) medicinal product In the European Union (EU) and the United Kingdom (UK), respectively (5). However, it is also sold as a food supplement.
The term coneflower refers to several Echinacea species. In particular, the aerial parts and or roots of three species are used as medicinal: E. purpurea (L.) Moench (purple coneflower), E. angustifolia DC. (narrow-leaf coneflower) and E. pallida (Nutt.) Nutt (pale purple coneflower). The roots of the three species and aerial parts of E. purpurea are used mainly for preventing and treating the common cold. The roots of E. purpurea are also used for the relief of spots and pimples due to mild acne, and the aerial parts for the treatment of small superficial wounds. Proposed active constituent groups of these coneflowers include polysaccharides, glycoproteins, caffeic acid derivatives, and alkylamides (6). In the EU, the preparations of the roots of the three species are recognized as THMP and those from the fresh aerial parts of the purple coneflower are accepted, both as THMP and for Well Established Use (WEU) medicinal products (4)(7)(8)(9)(10). In the UK, medicinal products containing coneflower preparations are sold as THMP/THR. Both, in the EU and the UK, coneflower products are also sold as food supplements. They often contain one or more Echinacea sp. or different parts of the same or different species.
Preparations of black cohosh, the dried root and rhizome of Actaea racemosa L., are widely used in the United States, Canada, Europe, Australia, and elsewhere, principally for the treatment of menopausal symptoms. The two main compound classes of this herbal drug are triterpene glycosides and polyphenolic derivatives (11).
For economic reasons, black cohosh, growing in North America, is known to be adulterated

D. A. Frommenwiler Chapter 3
39
3
with related species from China. The most common of those are Actaea cimicifuga L. and Actaea dahurica (Turcz. ex Fisch. & C.A.Mey.) Franch. Intentional adulteration happens mainly because of the price of Chinese powdered material and extract, which may be as low as one-quarter of that of the authentic black cohosh. Accidental adulteration with Chinese material happens because of the confusion in the nomenclature. For example, Chinese species of Actaea and Serratula chinensis S.Moore are sold under the name, black cohosh, through internet shops. Admixture with American species (e.g., A. podocarpa DC., A. pachypoda Elliott, A. rubra (Aiton) Willd., and A. cordifolia DC.) occurs because they share the same habitat and resemble black cohosh (12) when the underground parts are harvested in the fall. In the EU, black cohosh products are sold as WEU medicinal products (13) and as THR products in the UK, or as food supplements, while in the US, they are considered dietary supplements.
The objective of these three case studies was to evaluate the quality of the different herbals as a function of their regulation category and to show the usefulness of the HPTLC fingerprint as a tool for detecting quality issues, particularly adulteration. Samples were evaluated following the HPTLC methods in the Ph. Eur. monographs with modifications. The interpretation was based on the entire fingerprint (beyond the table description of the Ph. Eur.) and we used additional detection modes.
3.3 Experimental
3.3.1 Chemical reference standards, reagents, and apparatus
The chemical reference standards silybin (98% pure) and caffeic acid (98% pure) were purchased from Sigma Aldrich (St. Louis, United States). Taxifolin (85% pure) was purchased from Extrasynthese (Genay, France). Silydianin, chlorogenic acid (97% pure), caftaric acid (90% pure), and chicoric acid (97% pure) were purchased from USP (Rockville, United States). Silychristin (97.9% pure), dodec-2-ene-8,10-diynoic acid isobutylamide, and isoferulic acid (97% pure) were purchased from Chromadex (Los Angeles, United States). β-sitosterol (95% pure), ursolic acid (97% pure), echinacoside (95% pure), dodeca-2E,4E,8Z,10E/Z-tetraenoic acid isobutylamide (93% pure), cynarin (96% pure), actein (95% pure), and cimifugin (97% pure) were purchased from Phytolab (Vestenbergsgreuth, Germany).
Solvents (≥95% pure) and reagents were purchased from Roth (Karlsruhe, Germany), Acros (Gent, Belgium), Fisher Scientific (Hampton, United States), and Merck (Darmstadt, Germany). Silica gel 60 F254 HPTLC glass plates (20 x 10 cm) were obtained from Merck (Darmstadt, Germany).
HPTLC instruments from CAMAG (Muttenz, Switzerland) were used, including Automatic TLC Sampler (ATS 4), Automatic Development Chamber (ADC 2) with humidity control, Plate Heater 3, TLC Visualizer 2, and Immersion Device 3.
3.3.2 Samples
Thirty-one products of milk thistle (MT) and twenty-three products of coneflower (ECH) were acquired from the internet, local shops, and pharmacies in the UK. They included tablets, chewable tablets, capsules, tinctures, and liquid extracts, sold as food supplements or traditional herbal medicinal products. Their labels claimed contents of either standardized extract, extract, a mixture of extracts and herbal drug, or dried herbal drug.
Sixty samples of products, herbal drugs and herbal preparations (e.g., extracts) labeled as black cohosh (BC), including tea bags, capsules, tablets of plant material and/or extracts, and herbal ingredients (powdered herbal drug and extracts) were acquired from the internet, and the market in the U.S.
A list of samples and their specifications is presented in the supplementary information

D. A. Frommenwiler Chapter 3
40
3
(Tables 3S1 – 3S3).
3.3.3 Preparation of test solutions
3.3.3.1 Milk thistle and coneflower products
Products were extracted with methanol to contain the equivalent of 100 mg of dried herbal drug, dried or liquid extract per mL of solution. If the drug extract ratio (DER) of extracts was declared, it was used to calculate the equivalent amount of herbal drug used in the preparation. The mixtures were sonicated for 10 minutes, centrifuged, and the supernatants used as the test solutions. For analysis of alkylamides in coneflower products, the test solutions were prepared in dichloromethane following the same procedure.
Milk thistle tinctures (MT20 and MT14), which did not declare the DER were directly applied onto the plate. Samples MT12, 13 and 30 were prepared at 5 mg/mL, MT8 at 25 mg/mL and ECH16 at 20 mg/mL. These concentrations were adopted due to the overloaded fingerprints or matrix disturbance, observed in these samples during initial experiments.
3.3.3.2 Black cohosh products, herbal drugs and preparations
Products were extracted with ethanol and water (50:50 v/v) to contain the equivalent of 50 mg of herbal drug, extract, or combined herbal drug and extract per mL of solution. The mixtures were sonicated for 10 minutes, centrifuged, and the supernatants were used as the test solutions.
3.3.4 HPTLC parameters
HPTLC was performed with general parameters specified in Ph. Eur. 2.8.25
3.3.4.1 Milk thistle products
The HPTLC method was adapted from the Ph. Eur. monograph for milk thistle fruits (14). It was published by the HPTLC Association (15) and adopted in the United States Pharmacopeia (USP) Dietary Supplements Compendium (DSC) 2019 (16). Specific parameters are described in
Table 3.1 HPTLC parameters for identification of milk thistle
Parameters Description Stationary phase 20x10 cm glass plates Si 60 F254 (Merck) SST 0.5 mg/mL of taxifolin, 0.2 mg/mL of silybin, 0.1 mg/mL of silychristin and
silydianin, individually prepared in methanol Application volume 2 μL of test and reference solutions Developing solvent Toluene, ethyl formate, formic acid 40:50:5 (v/v/v) Development 20 min saturation (with filter paper), 10 min conditioning at 33% relative
humidity (with MgCl2), 70 mm distance from lower edge, room temperature = 23-27 ⁰C
Derivatization reagent 1 Natural Product (NP) reagent: 1 g of diphenylboric acid 2-aminoethyl ester was dissolved in 200 mL of ethyl acetate
Derivatization reagent 2 Polyethylene glycol (PEG) reagent: 10 g of polyethylene glycol (Macrogol) 400 were dissolved in 200 mL of dichloromethane.
Derivatization procedure
Plates were heated at 100 ⁰C for 5 min and then derivatized by dipping (speed: 3, time: 0) in NP reagent and subsequently in PEG reagent. Plates were heated again for 5 minutes at 100°C. Images were taken one hour after derivatization
Documentation White light, UV 254 nm, and UV 366 nm prior to derivatization; UV 366 nm and white light after derivatization
3.3.4.2 Echinacea products
Two HPTLC methods for the identification of coneflowers roots and aerial parts were used

D. A. Frommenwiler Chapter 3
41
3
to evaluate the coneflower products. These methods were adapted from the Ph. Eur. monograph for purple coneflower root (17) and published by the HPTLC Association, with modifications of the sample preparation, application volume, developing distance and derivatization (18), were used to evaluate the coneflower products. The parameters are described in Table 3.2 and Table 3.3. For the alkylamides fingerprints, the image after the second heating step was used because it yields stronger zones.
Table 3.2 HPTLC parameters for identification of coneflowers roots and aerial parts, phenolic compounds fingerprint.
Parameters Description Stationary phase 20x10 cm glass plates Si 60 F254 (Merck) SST 0.5 mg/mL of cynarin and echinacoside, 0.1 mg/mL of chlorogenic acid and
caffeic acid, individually prepared in methanol Application volume 2 μL of reference solutions and 4 µL of the test solution Developing solvent Ethyl acetate, ethyl methyl ketone, water, formic acid 5:3:1:1 (v/v/v/v) Development 20 min saturation (with filter paper), 10 min conditioning at 33% relative
humidity (with MgCl2), 70 mm distance from lower edge, room temperature = 23-27 ⁰C
Derivatization reagent 1 NP reagent: 1 g of diphenylboric acid 2-aminoethyl ester was dissolved in 200 mL of ethyl acetate
Derivatization reagent 2 PEG reagent: 10 g of polyethylene glycol (Macrogol) 400 were dissolved in 200 mL of dichloromethane.
Derivatization procedure
Plates were heated at 100 ⁰C for 3 min and derivatized by dipping (speed: 3, time: 0) into NP reagent and then into PEG reagent.
Documentation White light, UV 254 nm, and UV 366 nm prior to derivatization; UV 366 nm and white light after derivatization
Table 3.3 HPTLC parameters for identification of coneflowers roots and aerial parts, alkylamides.
Parameters Description Stationary phase 20x10cm plates Si 60 F254 (Merck) SST
0.2 mg/mL ursolic acid, β-sitosterol and dodec-2-ene-8,10-diynoicacid isobutylamide and 0.4 mg/mL of dodeca-2E,4E,8Z,10E/Z-tetraenoic acidisobutylamide, individually prepared in methanol
Application volume 2 μL of reference solutions and 10 µL of the test solution Developing solvent Toluene, ethyl acetate, cyclohexane, formic acid 80:20:10:3 (v/v/v/v) Development 20 min saturation, 10 min conditioning at 33% relative humidity (with MgCl2),
70 mm distance from lower edge, room temperature = 23-27 ⁰C Derivatization reagent Anisaldehyde reagent: 20 mL of acetic acid and 10 mL of sulfuric acid was
slowly added to 170 mL of ice-cooled methanol and mixed well. The mixture was allowed to cool to room temperature, and then 1 mL of anisaldehyde was added.
Derivatization procedure The plates were dipped (speed: 3, time: 0) into anisaldehyde reagent and then heated 3 minutes at 100°C. After documentation, the plates were heated for another 15 min and then documented again
Documentation White light, UV 254 nm, and UV 366 nm prior to derivatization; UV 366 nm and white light after derivatization and after second heating
3.3.4.3 Black cohosh products
The HPTLC method for identification of Cimicifuga racemosa (syn. of A. racemosa) from Ph. Eur. (19) was used to evaluate the black cohosh products, herbal drugs and preparations. The monograph includes three HPTLC methods, which share the same parameters except for the application volume and derivatization reagent. These parameters are summarized in Table 3.4.
Table 3.4 HPTLC parameters for identification of black cohosh.
Parameters Description Stationary phase 20x10 cm glass plates Si 60 F254 (Merck)

D. A. Frommenwiler Chapter 3
42
3
SST 0.1 mg/mL of actein, isoferulic acid and cimifugin are individually prepared in methanol
Application volume 2 μL of reference and test solution for identification and 20 µL of test solution for test for the presence of A. podocarpa, A. dahurica, and A. cimicifuga
Developing solvent Toluene, ethyl formate, formic acid 50:30:20 (v/v/v) Development 20 min saturation (with filter paper), 10 min conditioning at 0% relative
humidity (with molecular sieve), 70 mm distance from lower edge, room temperature = 23-27 ⁰C
Derivatization reagent 1 (identification)
Sulfuric acid reagent: 20 mL of sulfuric acid was mixed with 180 mL of methanol. The plate is dipped (time: 0, spped:3) and then heated at 100°C for 5 minutes
Derivatization reagent 2 (test for adulteration with A. dahurica)
Antimony trichloride reagent: 8 g of Antimony trichloride were mixed with 200 mL of chloroform and shaken until completely dissolved. The plates were immersed (time: 1s, speed: 3) into the solution and then heated at 120°C for 10 minutes.
Derivatization reagent 3 (test for adulteration with A. cimicifuga)
Boric acid, oxalic acid reagent: 4 g of boric acid and 5 g of oxalic acid were individually dissolved in 150 mL and 50 mL of ethanol absolute, respectively, and then shaken until completely clear. The solutions were combined before derivatization. The plates were dipped (time: 1s, speed: 3) into the solution and heated at 120°C for 5 minutes.
Documentation White light, UV 254 nm and UV 366 nm prior to derivatization, UV 366 nm and white light after derivatization
3.4 Results and discussion
3.4.1 Milk thistle case study
Silybum marianum fruits have unique macroscopic and chemical characteristics. Therefore, quality problems of milk thistle products (MT) are rarely related to substitution or mixing with other species. There is a limited number of publications referring to poor quality and adulteration of MT products. Fenclova et al. (20) analyzed twenty-six MT food supplements purchased in the U.S. and the Czech market. Mycotoxins, pesticides, and microbiological contamination were detected in all tested preparations. Furthermore, the authors identified significant differences in the silymarin content between the products, often contradicting the information provided on the labels.
The products analyzed in the present study claimed to contain different plant parts of S. marianum, the herbal drug and/ or its extracts. The present HPTLC method, based on the analysis of flavonolignans and flavonoids, can differentiate between these ingredient types. As shown in Figure 3.1, fingerprints of MT fruit and fruit extract show a sequence of four green zones after derivatization, three of which are due to silybin, silydianin, and silychristin. Additionally, an orange zone due to taxifolin is observed just below silybin. Fingerprints of fruit show a blue zone at RF 0.13 (yellow arrows) before and after derivatization, which is absent in the extract. Milk thistle herb show two very faint green zones, one of them at the position of silybin, and prior to derivatization, it shows an intense red zone due to chlorophylls (green arrow), absent in the fruit and fruit extract.
MT products were evaluated with the same HPTLC method. In Figure 3.2, the products are grouped by their regulatory category and their tracks were then re-arranged based on similarity upon visual inspection. The evaluation of quality is summarized in Figure 3.3. All THMP products (tracks 1-10) show homogeneous and consistent fingerprints in regard to the number of zones and their intensities, including those due to flavonolignans and taxifolin. Only one sample declared to contain milk thistle fruit, and as expected, it showed a blue zone at RF 0.13. These ten products were concluded to be of good quality. Of the twenty-one food supplement (FS) products, two were declaring to contain MT fruit (tracks 11-12) and eight declaring to contain MT extracts (tracks 13-18, 28-29). Fingerprints for these ten FS products conform with the labeled information and were deemed of good quality. Two of them (tracks 28-29) show an additional zone at RF 0.55, which is suspected to be curcuminoids from turmeric extract, declared on the product label.

D. A. Frommenwiler Chapter 3
43
3
Figure 3.1 HPTLC Fingerprints of milk thistle fruit, fruit extract, and herb prior to (right image) and after derivatization (left image). Yellow arrows: blue zone characteristic of MT fruit, absent in MT fruit extract; Green arrow: chlorophyll zone characteristic of MT herb.
Figure 3.2 Fingerprints of the 31 milk thistle products in different detection modes, grouped by regulatory categories. Track A: silydianin, silychristin, taxifolin, and silybin in increasing RF values. Blue arrows: red zone due to chlorophyll detected in some products; red arrow: an unidentified yellow-white zone detected in some products.
The rest of the MT FS (11) had questionable quality. Nine of them (tracks 19-27) showed the four green zones due to flavonolignans but lacked taxifolin (orange zone). Additionally, some of them have a faint fingerprint under UV 254 nm, in which the zones due to silybin and silychristin are not detected due to their low concentration. These findings are in agreement with the statement of Fenclova et al. (20). Finally, two samples (tracks 30 and 31) lack zones characteristic of MT fruit or its extracts, which suggest the absence of MT in these products.
The fingerprints of some samples of both the good or questionable quality feature additional zones that are not characteristic of MT, but related to other declared ingredients in the product. In particular, eight samples presented red zone(s) due to chlorophyll (Figure 3.2, blue arrows), which could be caused by the declared MT herb, spirulina (biomass of Arthrospira platensis and A. maxima), alfalfa (Medicago sativa L.), artichoke (Cynara cardunculus L.), dandelion (Taraxacum officinale F.H.Wigg.), boldo (Peumus boldus Molina) and peppermint leaf (Mentha × piperita L.). Five samples show an unidentified yellow-white zone just above the application position under UV 366 nm prior

D. A. Frommenwiler Chapter 3
44
3
to derivatization (Figure 3.2, red arrows), which could indicate a quality issue. Common excipients were ruled out as source of this zone by additional experiments. The origin of this zone continues to be unclear.
Figure 3.3 Summary of the quality of milk thistle products MT. THMP: Traditional Herbal Medicinal Product; FS: Food supplement. The number after the back slash represents the total number of products analyzed per category.
3.4.2 Coneflower case study
Poor quality of coneflowers (ECH) products has been reported for a long time. At the end of the last century, ECH products in the U.S. market often contained Parthenium integrifolium L. as a substitute, which is no longer happening for most cases (21). Species mix up can also happen between members of the Echinacea genus. According to Ardjomand-Woelkart and Bauer (22), the roots of E. angustifolia and E. pallida are often confused due to their physical similarities. The first species is endangered in the wild. Nowadays, the most found ingredient in ECH products is E. purpurea root. Spelman stated that confusion of species is almost certainly still occurring for researchers and companies that do not have proper identification procedures in place (23).
The current HTPLC methods for identification of coneflowers, published by the HPTLC Association (18), include HPTLC fingerprints for phenolic compounds and alkylamides. While the phenolic fingerprint is used to distinguish the plant parts and species, the alkylamides fingerprint is used to indicate the quality of the herbal ingredients. According to Wills and Stuart (24), alkylamides can suffer degradation if the herbal drug when stored in the milled form at room temperature.
Figure 3.4 shows the characteristic fingerprints of the three coneflowers roots and the purple coneflower herb obtained with the two HPTLC methods. Some HPTLC characteristics allows to clearly distinguish the four herbal drugs. The most prominent are: (1) echinacoside is present in the roots of E. angustifolia and E. pallida as a very intense zone, but absent in the roots and the aerial parts of E. purpurea; (2) cynarin is present in the roots of E. angustifolia, but not in the other 3 herbal drugs; (3) the zone due to chicoric acid is very intense in the root and aerial parts of E. purpurea, but far less intense in the root of E. pallida and absent in the root of E. angustifolia (although there is a faint zone below that position), and (4) E. purpurea aerial parts show red zones due to chlorophylls and some yellow zones due to flavonoids, which are not present in the three roots. Chlorogenic acid appears mainly in the root of E. angustifolia, and caftaric acid mainly in the root and aerial parts of E. purpurea, but these two compounds are less helpful for

D. A. Frommenwiler Chapter 3
45
3
discrimination.
Figure 3.4 HPLTC fingerprints of standards and coneflowers herbal drugs: phenolic compounds (left image); alkylamides (after second heating step, right image). Yellow arrows: zones characteristic of E. purpurea herb; black arrows: zones due to alkylamides of E. angustifolia root; purple arrow: zones characteristic of E. pallida root; blue arrow: zone due to alkylamides in E. purpurea root.
The alkylamide fingerprint (Figure 3.4, image to the right) of E. angustifolia root shows one pink and one brown zone at the positions of the alkylamides dodec-2-ene-8,10-diynoic acid isobutylamide and dodeca-2E,4E,8Z,10E/Z-tetraenoic acid isobutylamide, respectively (black arrows). E. purpurea root shows the upper alkylamide co-eluting with another pink zone due to another unidentified alkylamide (blue arrow), and these zones are absent in the other species and E. purpurea aerial parts. E. pallida root shows a brown zone absent in all other fingerprints (purple arrow).
In Figure 3.5, the products are separated by the regulatory category and their tracks were then re-arranged based on similarity upon visual inspection of the fingerprint due to phenolic compounds. A summary of the quality of ECH products is presented in Figure 3.6.
In Figure 3.5, all THMP (tracks 1-11) and nine of the twelve FS products (tracks 12-18, 20 and 23) show fingerprints compliant with their labels. Regarding their phenolic fingerprint, nine THMP present a composition similar to E. purpurea root (tracks 1-9), one THMP shows zones characteristic of E. angustifolia root (track 10), one THMP (track 11) and seven FS (tracks 12-18) show zones similar to E. purpurea aerial parts. These herbal drugs were declared on the labels. Two FS products (tracks 20 and 23) declared to contain E. purpurea aerial parts plus E. angustifolia root show no zones characteristic of chlorophyll. These samples were prepared in glycerin and water, which could have affected the extraction of chlorophyll. Therefore, they were also considered compliant with their labels. Regarding the alkylamides profile, two THMP products (tracks 1 and 11) and four FS products (tracks 12, 13, 20 and 23) showed very faint zones under UV 254 nm prior to derivatization and under white light after derivatization. The possible reasons may be that: (1) the extract used in samples at tracks 1, 20 and 23 were prepared using low percentages of ethanol (e.g., 30%) or in water/glycerin, leading to lesser amounts of the lower-polarity constituents, such as alkylamides; and (2) due to lack of information regarding the drug/extract ratio (DER) for samples on tracks 11-13, the selected sample preparation may not be optimal thus yielding overall faint fingerprints.

D. A. Frommenwiler Chapter 3
46
3
Figure 3.5 Alkylamide fingerprints of standards and Echinacea spp., in different detection modes. Tracks A: echinacoside and cynarin, B: chlorogenic and caffeic acids, C: Ursolic acid and β-sitosterol and D: dodeca-2E,4E,8Z,10E/Z-tetraenoic acid isobutylamide and dodec-2-ene-8,10-diynoic acid isobutylamide (with increasing RF); 1-23: ECH products 1-23.
The remaining three of the twelve FS samples are of questionable quality. Two products (tracks 21-22) show no zones due to coneflower in either fingerprint. Sample on track 19 declared to contain E. purpurea aerial parts but showed no zones due to chlorophyll in the phenolic compounds fingerprint. This zone is expected to be seen in tinctures. Furthermore, its alkylamide fingerprint was very faint.
Figure 3.6 Summary of the quality of coneflower products ECH. THMP: Traditional Herbal Medicinal Product; FS: Food supplement. The number after the back slash represents the total number of products analyzed per category.

D. A. Frommenwiler Chapter 3
47
3
3.4.3 Black cohosh case study
The HPTLC method for black cohosh of the Ph. Eur. (19) is capable of discriminating the four main adulterants: A. cimicifuga, A. dahurica, A. podocarpa, and Serratula chinensis root. The typical fingerprints of these species and black cohosh are shown in Figure 3.7. Under UV 254 nm, A. podocarpa (tracks 9 -10) shows quenching zones absent in black cohosh and other Actaea species (blue arrows). Under white light after derivatization, A. dahurica (tracks7-8) fingerprint lacks zones due to actein (black arrow) and 26-deoxyactein (purple arrow), while A. cimicifuga (tracks 5-6) lacks only 26-deoxyactein. Under UV 366 nm after derivatization, all four Actaea species show distinctive fingerprints, and S. chinensis (track 11) shows mainly an intense blue zone above the application position, absent in the other fingerprints. Even though, these four Actaea species can be distinguished with the identification method, the presence of the adulterants in a mixture cannot be detected in this test.
Therefore, Ankli et al. (25) proposed an additional HPTLC test for the detection of adultera-tion, which was adopted in the Ph. Eur. monograph for black cohosh. In this test, 20 µL of the samples are applied twice onto the plate (once in each half. After development, the plate is cut in the middle. One half is derivatized with antimony trichloride reagent (reagent 2), and the other half with boric acid and oxalic acid reagent (reagent 3). As shown in Figure 3.8, adulteration of A. racemosa with ≥ 10% of A. podocarpa shows a quenching zone (black arrow, track 2) under UV 254 nm prior to derivatization, absent in pure A. racemosa (track 1). Under UV 366 nm after derivatization with antimony trichloride reagent, A. racemosa adulterated with ≥ 5% of A. dahurica shows two green zones, one above and one below actein (orange arrows, track 4), absent in pure A. racemosa (track 3). Under UV 366 nm after derivatization with boric acid and oxalic acid reagent, A. racemosa adulterated with ≥ 5% of A. cimicifuga shows one blue zone due to cimifugin (green arrow, track 6), and another blue zone above the application position. These zones are absent in A. racemosa (track 5).
The black cohosh food supplements and herbal drugs / herbal preparations (HDP) were analyzed with the two described methods above. The HPTLC fingerprints are presented in supplementary information, Figures 3S1-7. Typical fingerprints are shown in Figure 3.9.
Figure 3.7 Fingerprints of Actaea racemosa and common adulterants prior to (top) and after deriva-tization (bottom). Blue arrows: zones characteristic of A. podocarpa root; black arrow: zone due to actein in A. racemosa; purple arrow: zone due to 26-deoxyactein in A. racemosa.

D. A. Frommenwiler Chapter 3
48
3
.
Figure 3.8 Test for adulteration of A. racemosa with A. podocarpa, A. dahurica, and A. cimicifuga. Tracks 1, 3 and 5: A. racemosa; tracks 2, 4 and 6: A. racemosa mixed with 10% of A. podocarpa, 5% of A. dahurica and 5% of A. cimicifuga, respectively. Black arrow: zones characteristic of A. podocarpa root; orange arrows: zones characteristic of A. dahurica root; green arrow: zone due to cimifugin characteristic of A. cimicifuga root.
Of the sixty food supplement and HDP, eighteen FS (BC2-5, 7-9, 11, 13-15, 18, 22-24, 26, 30, and 32) and nine HDP (BC34-40, and 49-50) showed fingerprints characteristic of A. racemosa (e.g., BC37, Figure 3.9 A and B). Of these samples, the fingerprints of eight are fainter than those of reference herbal drug (BCRHD) and reference extract (BCRE) (e.g., BC24, Figure 3.9 A, and B). Nevertheless, these samples were considered compliant with their labels concerning identity, but were likely of low potency.
The remaining thirty-three samples are of questionable quality. None of them were con-cluded to be adulterated with A. podocarpa or S. chinensis. Fifteen products contained A. racemosa adulterated with other Actaea species. Of these, six FS (BC1, 16, 19, 20, 21, 27 and 28) and seven HDP (BC 45, 48, 51-53, 56-57) showed zones due to A. cimicifuga and A. dahurica in addition to those of A. racemosa (e.g., BC16, 19 and 20, Figure 3.9). Ten of the fifteen samples (BC1, 12, 17, 45, 48, 51-53, 56-57) have the green zones characteristic for adulteration with A. dahurica fainter than the 5% accepted by the Ph. Eur. (e.g., BC19 and 16, Figure 3.9 C). Samples BC16 and 41 are adulterated with A. cimicifuga only.
The other eighteen samples show no traces of black cohosh. Of these, two FS (BC12 and 17) have zones due to A. dahurica and A. cimicifuga (e.g., similar to BC1, Figure 3.9 C-D). Four FS (BC10, 25, 29, 31) and two HDP (BC44, 47) presented faint fingerprints, in composition similar to that of A. cimicifuga (e.g., BC44, Figure 3.9 A, B and D), indicating the presence of this species alone. Seven HDP (BC42, 43, 46, 55, 58-60) contained only A. dahurica (e.g., BC58, Figure 3.9 A-C). The three remaining samples (BC6, 33, and 54) show fingerprints different from all Actaea species (e.g., BC6, Figure 3.9 A-B) or only barely detectable zones.
In this case study, more than half of the analyzed black cohosh samples were found to be adulterated. A summary of the quality of all black cohosh samples is presented in Figure 3.10.

D. A. Frommenwiler Chapter 3
49
3
Figure 3.9 HPTLC fingerprint of 11 black cohosh products (BCP) and ingredients (BCI). STD1: actein and isoferulic acid (increasing RF); STD2: cimifugin; RBCR: reference black cohosh root; RBCE: reference black cohosh root extract; 5% AD: A. racemosa mixed with 5% of A. dahurica; 5% AC: A. racemosa mixed with 5% of A. cimicifuga. Fingerprints A and B are used for identification of black cohosh root, while fingerprints C and D are used for detecting adulteration with A. dahurica and A. cimicifuga, respectively.
Figure 3.10 Summary of the quality of black cohosh FS and (HPD) analyzed in this case study. AC: A. cimicifuga; AD: A. dahurica; AR: A. racemosa; HDP: black cohosh herbal drugs and preparations; FS: black cohosh food supplement products.
3.5 Conclusions These three case studies showed that evaluating the entire HPTLC fingerprints in several detection modes is very helpful for uncovering adulterations and other quality issues in

D. A. Frommenwiler Chapter 3
50
3
herbal drugs, preparations and products.
Significant quality differences were observed between the tested products commercialised under different regulatory frameworks. All products marketed as medicinal products were compliant with label statements. Their fingerprints were consistent, without unexpected zones observed. This may not be the case with food/dietary supplements products. Quality issues were found in 52% of the milk thistle products, 25% of the coneflowers products, and 46% of the black cohosh food supplement products. Also, 67% of herbal drugs and preparations labelled as black cohosh presented quality issues. Several quality issues were found, including absence of the herbal ingredient declared on the label of the product, lower concentration of the herbal ingredient per unit pharmaceutical form, and presence of undeclared herbal drugs and adulterants, especially related species. These case studies support the theory that less stringent regulations can negatively affect the quality of herbal products.
The cost for the HPTLC analysis per sample, if only one sample were to be analyzed on one plate and in one run, is approximately $46 for coneflower (because two methods were used), and $21 for black cohosh and milk thistle. A detailed calculation of the cost is shown in the supplementary information. It is important to highlight that the analysis cost per sample is reduced drastically when more than one sample is analyzed on the same plate.
HPTLC using optimized and standardized methods and evaluating the entire fingerprint under several detections, proves to be a cost-efficient technique for proper identification and quick detection of a range of quality issues in herbal drugs, preparations and products.
3.6 References 1. Low, T.Y., Wong, K.O., Yap, A.L.L., De Haan, L.H.J., & Rietjens, I.M.C.M. (2017)
Compr. Rev. Food Sci. Food Saf. 16, 821–834. doi:10.1111/1541-4337.12289
2. Cañigueral, S., Frommenwiler, D.A., Reich, E., & Vila, R. (2018) in Recent advances in pharmaceutical sciences, Muñoz-Torrero, D., Cajal, Y., & Llobet, J. M. (Eds), Research Signpost, Kerala, pp 119–136
3. Tyler Smith, Kimberly Kawa, Veronica Eckl, Claire Morton, & Ryan Stredney (2017) HerbalGram 56–65
4. Blumenthal, M., Goldberg, A., & Brinckmann, J. (2000) Herb. Med. Expand. Comm. E Monogr. Available at: http://cms.herbalgram.org/expandedE/MilkThistlefruit.html?ts= 1570889458&signature=7dfccfa2df3ead26eaafb3145167386b&ts=1570962542&signature=41b402c151d2bf671ac6413630078b77. Accessed on 13 October 2019
5. Committee on Herbal Medicinal Products (HMPC) European Medicines Agency (EMA) (2018) EMA/HMPC/294187/2013 1–7. Available at: https://www.ema.europa.eu/en/ documents/herbal-monograph/final-european-union-herbal-monograph-silybum-marianum-l-gaertn-fructus_en.pdf. Accessed on 12 October 2019
6. Ardjomand-Woelkart, K. & Bauer, R. (2015) Planta Med. 82, 17–31. doi:10.1055/s-0035-1558096
7. Committee on Herbal Medicinal Products (HMPC) European Medicines Agency (EMA) (2015) EMA/HMPC/48704/2014 Corr 1 1–7. Available at: https://www.ema.europa.eu/ en/documents/herbal-monograph/final-european-union-herbal-monograph-echinacea-purpurea-l-moench-herba-recens_en.pdf. Accessed on 13 October 2019
8. Committee on Herbal Medicinal Products (HMPC) European Medicines Agency (EMA) (2017) EMA/HMPC/424583/2016 1–7. Available at: https://www.ema.europa.eu/en/ documents/herbal-monograph/final-european-union-herbal-monograph-onechinacea-purpurea-l-moench-radix-revision-1_en.pdf. Accessed on 13 October 2019

D. A. Frommenwiler Chapter 3
51
3
9. Committee on Herbal Medicinal Products (HMPC) European Medicines Agency (EMA) (2018) EMA/HMPC/737380/2018 1–7. Available at: https://www.ema.europa.eu/en/ documents/herbal-monograph/final-european-union-herbal-monograph-echinacea-pallida-nutt-nutt-radix-revision-1_en.pdf. Accessed on 13 October 2019
10. Committee on Herbal Medicinal Products (HMPC) European Medicines Agency (EMA) (2012) EMA/HMPC/688216/2008 1–6. Available at: https://www.ema.europa.eu/en/ documents/herbal-monograph/final-community-herbal-monograph-echinacea-angustifolia-dc-radix_en.pdf. Accessed on 13 October 2019
11. European Scientific Cooperative on Phytotherapy E/S/C/O/P (2011) Cimicifugae rhizoma (black cohosh), ESCOP monograph, European Scientific Cooperative on Phytotherapy, Exeter, U.K
12. Foster, S. (2013) HerbalGram 32–51
13. Committee on Herbal Medicinal Products (HMPC) European Medicines Agency (EMA) (2017) EMA/HMPC/48745/2017 1–8. Available at: https://www.ema.europa.eu/en/ documents/herbal-monograph/draft-european-union-herbal-monograph-cimicifuga-racemosa-l-nutt-rhizome-revision-1_en.pdf. Accessed on 13 October 2019
14. European Directorate for the Quality of Medicines and Healthcare (EDQM) (2020) in European Pharmacopoeia 10.0, Strasbourg, pp 1539–1540
15. HPTLC Association - Silybum marianum fruit (2019) 3. Available at: https://www.hptlc-association.org/methods/methods.cfm
16. United States Pharmacopeial Convention (2020) in Dietary Supplements Compedium, Rockville, US
17. European Directorate for the Quality of Medicines and Healthcare (EDQM) (2020) in European Pharmacopoeia 10.0, Strasbourg, pp 1548–1549, 1568–1569, 1589–1592
18. HPTLC Association - Narrow-leaf coneflower root (Echinacea angustifolia); Pale coneflower root (Echinacea pallida); Purple coneflower root and herb (Echinacea purpurea) (2014). Available at: https://www.hptlc-association.org/methods/methods. cfm
19. European Directorate for the Quality of Medicines and Healthcare (EDQM) (2017) in European Pharmacopoeia 10.0, Strasbourg, pp 1355–1358
20. Fenclova, M., Novakova, A., Viktorova, J., Jonatova, P., Dzuman, Z., Ruml, T., Kren, V., Hajslova, J., Vitek, L., & Stranska-Zachariasova, M. (2019) Sci. Rep. 9, 11118. doi:10.1038/s41598-019-47250-0
21. Hobbs, C. (1994) HerbalGram 30, 33–48
22. Ardjomand-Woelkart, K. & Bauer, R. (2015) Planta Med. 82, 17–31. doi:10.1055/s-0035-1558096
23. Spelman, K. (2013). Available at: https://pdfs.semanticscholar.org/ddf8/b26142a97 cd4c5ee14394cda7cc10bca2fe8.pdf. Accessed on 17 October 2019
24. Wills, R.B.H. & Stuart, D.L. (2000) J. Sci. Food Agric. 80, 1402–1406. doi:10.1002/1097-0010(200007)80:9<1402::AID-JSFA663>3.0.CO;2-4
25. Ankli, A., Reich, E., & Steiner, M. (2008) J. AOAC Int. 91, 1257–1264. doi:10.1093/jaoac/ 91.6.1257

D. A. Frommenwiler Chapter 3, Supplementary information
52
3
3.7 Supplementary information Table 3S1 Description of the milk thistle products analyzed in this work, their pharmaceutical dosage form and regulatory status. MTE: Milk thistle extract; MTS: Milk thistle fruit; MTHP: Milk thistle herb powder; MTT: Milk thistle tincture; THMP: traditional herbal medicinal product.
Sample N°
Description of products per pharmaceutical unit Pharmaceutical
dosage form Regulatory
status
MT1 MTE 300 mg equivalent to 7.2-8.1 g of fruit (DER: 24-27:1). Standardized to contain 174 mg of silymarin. Extraction solvent: Acetone 95%
Tablet THMP
MT2 MTE 137.5-165 mg equivalent to 2.75-6.60 g of fruit (DER: 20-40:1). Standardized to contain 82.5 mg of silymarin. Extraction solvent: Ethyl acetate
Tablet THMP
MT3 MTE 100 mg equivalent to 3 g of fruit (DER: 30:1). Standardized to contain 80 mg of silymarin.
Tablets Food
supplement MT4 MTS 450 mg Capsules THMP
MT5 MTE 83.3 mg equivalent to 3 g of herbal drug (DER: 36:1). Standardized to contain 66.67 mg of silymarin.
Tablets Food
supplement
MT6 MTE 100 mg equivalent to 4 g of herbal drug (DER: 40:1), MTHP 325 mg and MTS 25 mg. Each dosage form is standardized to contain 80 mg of silymarin
Tablets Food
supplement
MT7 MTE 83.3 mg equivalent to 3 g of herbal drug (DER: 36:1). Standardized to contain 66.67 mg of silymarin.
Tablets Food
supplement
MT8 MTE 100 mg standardized to contain 80 mg of silymarin, and MT aerial parts and seeds powder 350 mg
Capsule Food
supplement
MT9 MTE 300 mg equivalent to 7.2-8.1 g of fruit (DER: 24-27:1). Standardized to contain 174 mg of silymarin. Extraction solvent: Acetone 95%
Tablets THMP
MT10 MTE equivalent to 485 mg of milk thistle complex tincture. Other ingredients: artichoke leaves 46%, dandelion herb 12%, boldo leaf 7% and peppermint leaf 3%.
Tablets Food
supplement
MT11 MTE 86 mg equivalent to 3 g of seeds (DER: 35:1). Standardized to contain 68 mg of silymarin.
Tablets Food
supplement
MT12 MTE 40 mg standardized to 32 mg of silymarin. Other ingredients: dandelion root 100 mg, curcumin extract 25 mg, artichoke leaf powder 50 mg
Tablets Food
supplement
MT13 MTE 40 mg standardized to 32 mg of silymarin. Other ingredients: dandelion root 100 mg, curcumin extract 25 mg, artichoke leaf powder 50 mg
Tablets Food
supplement
MT14 MT dried fruit complex tincture 32%, artichoke leaves 46%, dandelion herb 12%, boldo leaf 7% and peppermint leaf 3%. Extraction solvent: alcohol 62%
Tincture Food
supplement
MT15 MTE 125 mg equivalent to 2.5-5 g of fruit (DER: 20-40:1). Standardized to contain 62.5-75 mg of silymarin.
Tablets THMP
MT16 MT seeds 500 mg. Standardized to contain 15-25 mg of silymarin
Capsules Food
supplement
MT17 MT seeds 400 mg Capsules Food
supplement
MT18 MTT 97.5 mg of tincture per mL, equivalent to 1 g of MT seed
Tincture Food
supplement
MT19 MTT 1 mL of tincture is equivalent to 856 mg of MT fresh
seed Tincture
Food supplement
MT20 MT dried fruit complex tincture 32%, artichoke leaves 46%, dandelion herb 12%, boldo leaf 7% and peppermint leaf 3%. Extraction solvent: alcohol 62%
Tincture Food
supplement
MT21 MTE 100 mg equivalent to 3 g of fruit (DER: 30:1) Tablets Food
supplement
MT22 MTE 175 mg, MTHP 172 mg. Other ingredients: spirulina and alfalfa
Capsules Food
supplement
MT23 1.5 g of a blend of herbal ingredients and MT Tincture Food
supplement
MT24 MTE of seeds 100 mg standardized to contain 80 mg of silymarin and 350 mg of powdered MT seeds and aerial parts
Capsules Food
supplement

D. A. Frommenwiler Chapter 3, Supplementary information
53
3
Sample N°
Description of products per pharmaceutical unit Pharmaceutical
dosage form Regulatory
status
MT25 MTE 193-261 mg equivalent to 3.725-10.818 g of fruit (DER: 19.3-41.4:1). Standardized to contain 108 mg of silymarin. Extraction solvent: Acetone 95%
Capsules THMP
MT26 MTE 89-121 mg equivalent to 1.721-5.0 g of fruit (DER: 19.3-41.3:1). Standardized to contain 50 mg of silymarin. Extraction solvent: Acetone 95%
Capsules THMP
MT27 MTE 193-261 mg equivalent to 3.725-10.818 g of fruit (DER: 19.3-41.4:1). Standardized to contain 108 mg of silymarin. Extraction solvent: Acetone 95%
Capsules THMP
MT28 MTE 89-121 mg equivalent to 1.721-5.0 g of fruit (DER: 19.3-41.3:1). Standardized to contain 50 mg of silymarin. Extraction solvent: Acetone 95%
Capsules THMP
MT 29 MTE 100 mg equivalent to 4 g of fruit (DER: 40:1). Standardized to contain 80 mg of silymarin. MT seeds and aerial parts 350 mg
Capsule Food
supplement
MT 30 MTE seed 175 mg standardized to contain 140 mg of silymarin. Blessed thistle stem, leaf and flower, 120 mg
Capsule Food
supplement
MT 31 MTE 133-324 mg equivalent to 3.325-9.720 g of fruit (DER: 25-30:1). Standardized to contain 108 mg of silymarin. Extraction solvent: Acetone 99%
Capsule THMP
Table 3S2 Description of the coneflower products analyzed in this work, their pharmaceutical dosage form and regulatory status. ECHE: coneflower dried extract; ECHT: coneflower tincture; ECHHD: coneflower herbal drug; THMP: traditional herbal medicinal product.
Sample N°
Description of products per pharmaceutical unit Pharmaceutical
dosage form Regulatory
status
ECH1 ECHE 380 mg from fresh E. purpurea herb (DER: 7.5-14.6:1), ECHE 20 mg from fresh E. purpurea root (DER: 7.1-12.5:1) Extraction solvent: ethanol 65%
Tablets Food supplement
ECH2 ECHE 70 mg from fresh E. purpurea root equivalent to 460-530 mg of root (DER: 6.6-7.6:1) Extraction solvent: ethanol 30%
Tablets THMP
ECH3
ECHE 128 mg of E. angustifolia (part of the herbal drug not declared) per mL of extract (DER: 1:1). Extraction solvent: ethanol 45%. Other ingredients: wild indigo (35 mg of extract DER 1:1, per mL) and fulmitory (32 mg of extract DER 1:1, per mL)
Oral Liquid THMP
ECH4 ECHE 380 mg from fresh E. purpurea herb (DER: 12:1), ECHE 20 mg from fresh E. purpurea root (DER: 11:1). Extraction solvent: ethanol 65%
Chewable Tablets THMP
ECH5 ECHE 65 mg from E. purpurea root (DER: 4:1) and ECHHB 265 mg of E. purpurea aerial parts
Capsules Food supplement
ECH6
ECHT 860 mg of E. purpurea herb per mL of tincture (DER: 7.5-14.6:1). ECHT 45 mg of E. purpurea root per mL of tincture (DER: 7.1-12.5:1) Extraction solvent: ethanol 65%
Oral Liquid Food supplement
ECH7 ECHE 70 mg from fresh E. purpurea root equivalent to 420-560 mg of root (DER: 6-8:1) Extraction solvent: ethanol 75%
Tablets THMP
ECH8 ECHE 140 mg from fresh E. purpurea root equivalent to 838-1177 mg of root (DER: 6-8.4:1) Extraction solvent: ethanol 75%
Capsules THMP
ECH9 ECHE 71.5 mg from fresh E. purpurea root equivalent to 429-500 mg of root (DER: 6-7:1)
Tablets THMP
ECH10 ECHT 250 mg of E. purpurea herb per mL of tincture (DER: 5:1). Extraction solvent: ethanol 66%
Oral Liquid Food supplement
ECH11
ECH standardized extract 160 mg equivalent to 3200 mg of herb (DER: 45:1). Note: 160 mg of extract is equivalent to 7200 mg of fresh herb and not 3200 mg, as declared in the label.
Tablets Food supplement
ECH12 ECHE 56 mg from fresh E. purpurea root equivalent to Tablets THMP

D. A. Frommenwiler Chapter 3, Supplementary information
54
3
Sample N°
Description of products per pharmaceutical unit Pharmaceutical
dosage form Regulatory
status
338-450 mg of root (DER: 6-7:1) Extraction solvent: ethanol 75%
ECH13 ECHT 480 mg of E. purpurea herb per mL of tincture Oral Liquid Food supplement
ECH14 ECHE 71.5 mg from fresh E. purpurea root equivalent to 429-500 mg of root (DER: 6-7:1)
Tablets THMP
ECH15 ECHE 71.5 mg from fresh E. purpurea root equivalent to 429-500 mg of root (DER: 6-7:1)
Tablets THMP
ECH16
ECHT 1 mL contains 1 g of E. purpurea aerial parts and root extract (standardized to 10 mg of phenolic compounds), E. angustifolia root extract and Goldenseal root extract. Prepared in Glycerin and water
Tincture Food supplement
ECH17
ECHT 2 mL contain 325 mg of E. purpurea flowers and herbs extract and E. angustifolia roots extract equivalent to 1470 mg of herbal drug. Prepared in Glycerin and water
Tincture Food supplement
ECH18 ECHE 140 mg from fresh E. purpurea root equivalent to 838-1177 mg of root (DER: 6-8.4:1) Extraction solvent: ethanol 75%
Capsules THMP
ECH19 ECHE 105 mg from fresh E. purpurea root equivalent to 630-840 mg of root (DER: 6-8:1) Extraction solvent: ethanol 75%
Tablets THMP
ECH20 ECHHD 400 mg of E. purpurea aerial parts Capsules Food supplement ECH21 ECHE equivalent to 1000 mg of E. purpurea herb Tablets Food supplement
ECH22 ECHE 65 mg from E. purpurea root (DER: 4:1) and ECHHB 265 mg of E. purpurea aerial parts
Capsules Food supplement
ECH23 ECHE 65 mg from E. purpurea root (DER: 4:1) and ECHHB 265 mg of E. purpurea aerial parts
Capsules Food supplement
Table 3S3 Description of the Black cohosh products analyzed in this work, their pharmaceutical dosage form and products type BC: Black cohosh (A. racemosa); BCE: Black cohosh root extract; DS: dietary (food) supplement; HDP: herbal drug or herbal preparation; DER: Drug extract ratio.
Sample N°
Description of products per pharmaceutical unit Pharmaceutical
dosage form Regulatory
status
BC1 BC 1.25 g of root cut / dosage form Tea bag Finished product, DS BC2 BC 540 mg of root powder / dosage form Capsules Finished product, DS BC3 BC 540 mg of root powder / dosage form Capsules Finished product, DS BC4 BC 540 mg of root powder / dosage form Capsules Finished product, DS BC5 BC 540 mg of root powder / dosage form Capsules Finished product, DS BC6 BC 410 mg of root powder / dosage form Capsules Finished product, DS
BC7 BC 300 mg of root powder / dosage form. Another ingredient: brown rice powder
Capsules Finished product, DS
BC8 BC 540 mg of root powder / dosage form Capsules Finished product, DS BC9 BC 540 mg of root powder / dosage form Capsules Finished product, DS
BC10 BC 540 mg of root powder / dosage form Capsules Finished product, DS BC11 BC 100 mg of root powder / dosage form Capsules Finished product, DS BC12 BC 540 mg of root powder / dosage form Capsules Finished product, DS BC13 BC 370 mg of root powder / dosage form Capsules Finished product, DS BC14 BC 540 mg of root powder / dosage form Capsules Finished product, DS BC15 BC 200 mg of root powder / dosage form Capsules Finished product, DS BC16 BC 540 mg of root powder / dosage form Capsules Finished product, DS
BC17 BC 530 mg of root powder and BCE 20 mg. Extract standardized to 2.5% of triterpene glycosides. Another ingredient: rice flour
Capsules Finished product, DS
BC18 BC root powder and BCE (545 mg) Capsules Finished product, DS
BC19 BC 185 mg of root powder and BCE 40 mg. Extract standardized to 2.5% of triterpene glycosides
Capsules Finished product, DS
BC20 BC 380 mg of root powder and BCE 80 mg. Extract standardized to 2.5% of triterpene glycosides. Other ingredients: triglycerides, vitamin E and rosemary oil
Capsules Finished product, DS

D. A. Frommenwiler Chapter 3, Supplementary information
55
3
Sample N°
Description of products per pharmaceutical unit Pharmaceutical
dosage form Regulatory
status
BC21 BC 380 mg of root powder and BCE 80 mg. Extract standardized to 2.5% of triterpene glycosides. Other ingredients: triglycerides, vitamin E and rosemary oil
Capsules Finished product, DS
BC22 BC root powder and BCE (545 mg) Capsules Finished product, DS
BC23 BCE 100 mg, standardized to 2.5% of triterpene glycosides. Other ingredients: rice flour
Capsules Finished product, DS
BC24 BCE 20 mg, standardized to 2.5% of triterpene glycosides, calculated as 26-deoxyactein
Tablet Finished product, DS
BC25 BCE 40 mg, standardized to 2.5% of triterpene glycosides. Other ingredients: rice flour
Capsules Finished product, DS
BC26 BCE 40 mg, standardized to 2.5% of triterpene glycosides, calculated as 26-deoxyactein
Capsules Finished product, DS
BC27 BCE 40 mg, standardized to 8% of triterpene glycosides, calculated as 26-deoxyactein
Capsules Finished product, DS
BC28 BCE 135 mg (DER: 4:1) and BCE 40 mg, standardized to 2.5% of triterpene glycosides
Capsules Finished product, DS
BC29 BCE 80 mg, standardized to 2.5% of triterpene glycosides. Other ingredients: rice flour
Capsules Finished product, DS
BC30 BCE 80 mg, standardized to 2.5% of triterpene glycosides, calculated as 26-deoxyactein
Tablet Finished product, DS
BC31 BCE 40 mg, standardized to 2.5% of triterpene glycosides, calculated as 26-deoxyactein
Capsules Finished product, DS
BC32 BCE 250 mg, standardized to 2.5% of triterpene glycosides
Capsules Finished product, DS
BC33 BCE 80 mg, standardized to 2.5% of triterpene glycosides, calculated as 26-deoxyactein. Other ingredients: natural color
Fluid extract Finished product, DS
BC34 BC root cut (plant material) ---- HDP BC35 BC root cut (plant material) ---- HDP BC36 BC root cut (plant material) ---- HDP BC37 BC root cut (plant material) ---- HDP BC38 BC root cut (plant material) ---- HDP BC39 BC root cut (plant material) ---- HDP BC40 BC root powder (plant material) ---- HDP BC41 BC root whole (plant material) ---- HDP BC42 BC root whole (plant material) ---- HDP BC43 BC root whole (plant material) ---- HDP BC44 BC root whole (plant material) ---- HDP
BC45 BCE powder extract, standardized to 2.5% of triterpene glycosides
---- HDP
BC46 BCE powder (not labeled but macroscopically similar to extract)
---- HDP
BC47 BCE powder (DER 4:1) ---- HDP BC48 BC root powder (plant material) ---- HDP BC49 BC root powder (plant material) ---- HDP BC50 BC root powder (plant material) ---- HDP BC51 BCE, standardized to 2.5% of triterpene glycosides ---- HDP BC52 BCE, standardized to 2.5% of triterpene glycosides ---- HDP BC53 BC root powder (plant material) ---- HDP BC54 BC root powder (plant material) ---- HDP BC55 BC root whole (plant material) ---- HDP BC56 BCE powder (DER 10:1) ---- HDP BC57 BCE powder (5%) ---- HDP BC58 BC root whole (plant material) ---- HDP BC59 BC root whole (plant material) ---- HDP BC60 BC root whole (plant material) ---- HDP

D. A. Frommenwiler Chapter 3, Supplementary information
56
3
Figure 3S1 HPTLC fingerprint of all black cohosh products (BC1 to BC33) and herbal drugs/preparations (BC34 to BC60) under UV 254 nm prior to derivatization. Identification method. STD: isoferulic acid; RBCR: reference black cohosh root; RBCE: reference black cohosh root extract.
Figure 3S2 HPTLC fingerprint of all black cohosh products (BC1 to BC33) and herbal drugs/preparations (BC34 to BC60) under UV 366 nm prior to derivatization. Identification method. STD: isoferulic acid; RBCR: reference black cohosh root; RBCE: reference black cohosh root extract.
Figure 3S3 HPTLC fingerprint of all black cohosh products (BC1 to BC33) and herbal drugs/preparations (BC34 to BC60) under white light after derivatization. Identification method. STD: actein and isoferulic acid (increasing RF); RBCR: reference black cohosh root; RBCE: reference black cohosh root extract.

D. A. Frommenwiler Chapter 3, Supplementary information
57
3
Figure 3S4 HPTLC fingerprint of all black cohosh products (BC1 to BC33) and herbal drugs/preparations (BC34 to BC60) under UV 366 nm after derivatization with sulfuric acid. Identification method. STD: actein and isoferulic acid (increasing RF); RBCR: reference black cohosh root; RBCE: reference black cohosh root extract.
Figure 3S5 HPTLC fingerprint of all black cohosh products (BC1 to BC33) and herbal drugs/preparations (BC34 to BC60) under UV 254 nm prior to derivatization. Test for A. podocarpa; RBCR: reference black cohosh root; 10% AP: A. racemosa mixed with 10% of A. podocarpa.
Figure 3S6 HPTLC fingerprint of all black cohosh products (BC1 to BC33) and herbal drugs/preparations (BC34 to BC60) under UV 366 nm after derivatization with Antimony trichloride reagent. Test for A. dahurica. STD: cimifugin; RBCR: reference black cohosh root; 5% AD: A. racemosa mixed with 5% of A. dahurica.

D. A. Frommenwiler Chapter 3, Supplementary information
58
3
Figure 3S7 HPTLC fingerprint of all black cohosh products (BC1 to BC33) and herbal drugs/preparations (BC34 to BC60) under UV 366 nm after derivatization boric acid/oxalic acid reagent. Test for A. cimicifuga. STD: cimifugin; RBCR: reference black cohosh root; 5% AD: A. racemosa mixed with 5% of A. cimicifuga.
Calculation of the costs for preparation and analysing the samples
The prices per mL of high-purity solvents (used to prepare the mobile phase and extract the samples), of the stationary phases and single use disposable material were obtained from Sigma Aldrich and Merck websites: https://www.sigmaaldrich.com/switzerland-suisse.html; http://www.merckmillipore.com/CH/de; (accessed on 20.12.2019 and 24.01.2020).
Calculation excludes standards, instruments, glass apparatus, and personal.
The costs for HPTLC analyses per sample were calculated based on:
a. The price of the volume of solvent used per plate. b. The cost for disposable material such as centrifuge tubes, plastic
pipettes, and syringe filter. c. The price of a single plate. d. The cost per derivatization, taking into account the price of solvents and
reagents needed to prepare 200 mL. The obtained value is divided by 50 (approximated dipping incidents to consume the 200 mL of reagent).
Note: This calculation excluded the price per filter paper, which is reusable and it cannot be estimated how many times a single sheet will be reused.

Chapter 4: Comprehensive HPTLC fingerprinting for quality control of an herbal drug - the case of Angelica gigas root

Article published in Planta Medica 84 (6-7): 465-474. 2018; DOI: 10.1055/a-0575-4425. For reasons of copyright, a copy of the published article was not included in this thesis. Instead, the manuscript accepted by this journal was adapted to the format of this thesis and included here.

D. A. Frommenwiler Chapter 4
61
4
Resum
Anàlisi integral de l’empremta dactilar per HPTLC per al control de qualitat de
drogues vegetals: el cas de l'arrel de Angelica gigas
La qualitat de les drogues vegetals se sol controlar amb diverses proves recomanades en una monografia. La cromatografia en capa fina d’alta resolució (HPTLC) és el mètode escollit per a la identificació en moltes farmacopees. Si es combina amb un material de referència adequat per a la seva comparació, l’HPTLC pot proporcionar informació més enllà de la identificació i, per tant, pot simplificar el control de qualitat.
Aquest article descriu, com a prova de concepte, com es pot aplicar l’HPTLC per a definir les especificacions d'un material vegetal de referència i per controlar la qualitat d'una droga vegetal segons aquestes especificacions. A partir de múltiples lots d’arrel cultivada d’Angelica gigas, es va optimitzar un mètode específic d’HPTLC per a la seva identificació. Aquest mètode pot distingir 27 espècies relacionades. També detecta la presència de barreges de A. gigas amb dues altres espècies d’Angelica comercialitzades com a "Dang gui" i és adequat per a la valoració quantitativa de les mostres mitjançant un test de contingut mínim de la suma de decursina i angelat de decursinol. Es proposa el nou concepte “anàlisi integral de l’empremta dactilar per HPTLC” (Comprehensive HPTLC fingerprinting): les empremtes dactilars (imatges) per HPTLC, que s’utilitzen per a la identificació, es converteixen en perfils de pics i les intensitats de zones seleccionades es comparen quantitativament amb les zones corresponents del material de referència. Després d’un estudi interlaboratori realitzat en tres laboratoris de tres països, el mètode es va utilitzar per a avaluar la qualitat d’altres candidats a establir un material de referència adequat. En conclusió, aquest cas demostra que una única anàlisi per HPTLC pot proporcionar informació sobre la identitat, la puresa i el contingut mínim dels marcadors d’una droga vegetal.

D. A. Frommenwiler Chapter 4
62
4
Resumen
Análisis integral de la huella dactilar por HPTLC para el control de calidad de
drogas vegetales: el caso de la raíz de Angelica gigas
La calidad de las drogas vegetales se suele controlar con varias pruebas recomendadas en una monografía. La cromatografía en capa fina de alta resolución (HPTLC) es el método elegido para la identificación en muchas farmacopeas. Si se combina con un material de referencia adecuado para su comparación, la HPTLC puede proporcionar información más allá de la identificación y, por tanto, puede simplificar el control de calidad.
Este artículo describe, como prueba de concepto, como se puede aplicar la HPTLC para definir las especificaciones de un material vegetal de referencia y para controlar la calidad de una droga vegetal según estas especificaciones. A partir de múltiples lotes de raíz cultivada de Angelica gigas, se optimizó un método específico de HPTLC para su identificación. Este método puede distinguir 27 especies relacionadas. También detecta la presencia de mezclas de A. gigas con dos otras especies de Angelica comercializadas como "Dang gui" y es adecuado para la valoración cuantitativa de las muestras mediante un test de contenido mínimo de la suma de decursina y angelato de decursinol . Se propone el nuevo concepto "análisis integral de la huella dactilar por HPTLC" (Comprehensive HPTLC fingerprinting): las huellas dactilares (imágenes) por HPTLC, que se utilizan para la identificación, se convierten en perfiles de picos y las intensidades de zonas seleccionadas se comparan cuantitativamente con las zonas correspondientes del material de referencia. Después de un estudio interlaboratorio realizado en tres laboratorios de tres países, el método se utilizó para evaluar la calidad de otros candidatos para establecer un material de referencia adecuado. En conclusión, este caso demuestra que un único análisis por HPTLC puede proporcionar información sobre la identidad, la pureza y el contenido mínimo de los marcadores de una droga vegetal. Después de un estudio interlaboratorio realizado en tres laboratorios de tres países, el método se utilizó para evaluar la calidad de otros candidatos a establecer un material de referencia adecuado. En conclusión, este caso demuestra que un único análisis por HPTLC puede proporcionar información sobre la identidad, la pureza y el contenido mínimo de los marcadores de una droga vegetal.

D. A. Frommenwiler Chapter 4
63
4
Comprehensive HPTLC fingerprinting for quality control of an herbal drug - the case of Angelica gigas root
4.1 Abstract Quality of herbal drugs is usually controlled with several tests recommended in a monograph. High-performance thin-layer chromatography (HPTLC) is the method of choice for identification in many pharmacopoeias. If combined with a suitable reference material for comparison, HPTLC can provide information beyond identification and thus may simplify quality control. This paper describes, as a proof of concept, how HPTLC can be applied to define specifications for an herbal reference material and to control the quality of an herbal drug according to these specifications. Based on multiple batches of cultivated Angelica gigas root, a specific HPTLC method for identification was optimized. This method can distinguish 27 related species. It also detects the presence of mixtures of A. gigas with two other Angelica species traded as “Dang gui” and is suitable for quantitative assessment of samples in a test for minimum content of the sum of decursin and decursinol angelate. The new concept of “comprehensive HPTLC fingerprinting” is proposed: HPTLC fingerprints (images), which are used for identification, are converted into peak profiles and the intensities of selected zones are quantitatively compared to the corresponding zones of the reference material. Following a collaborative trial involving three laboratories in three countries, the method was applied to check the quality of further candidates for establishing an appropriate reference material. In conclusion, this case demonstrates that a single HPTLC analysis can provide information about identity, purity and minimum content of markers of an herbal drug.
4.2 Introduction To describe and assure the quality of herbal drugs, a suite of appropriate tests is recom-mended by regulatory agencies [1] [2] and organizations [3]. Such tests, as well as specifi-cations for compliance, are described in pharmacopoeial or other quality monographs. They include verification of identity and purity as well as determination of the amount of

D. A. Frommenwiler Chapter 4
64
4
the active substance(s) or marker(s) [4] [5]. To perform all tests, different analytical techniques and expertise are needed and together with additional experiments (e.g. test for pesticides, mycotoxins, etc.) the overall costs of quality testing can dramatically be increased.
For herbal drugs, identity is still one of the central elements of quality [6]. Identity is evaluated primarily based on the morphological characteristics in comparison to a descriptive key and/or to an herbal reference material (HRM), representative for the species and the corresponding plant part. Identity is also evaluated based on the chemical composition, the pattern of which may be compared to that of the HRM [2]. However, herbal reference materials could also be used to qualify an herbal drug in a much wider sense, since the target material is of “good quality” when, additionally, it meets the purity and quantitative specifications of a quality monograph. Such HRM could be the “reference material of medicinal plant material (RMPM)” as envisioned and defined by the Forum for the Harmonization of Herbal Medicines (FHH) [7].
The FHH was created with a focus on the harmonization of the approaches to regulation and quality of herbal drugs used in and traded among the member countries Australia, China, Hong Kong, Japan, Singapore, Republic of Korea, and Vietnam. Other targets in-clude the establishment of a scientific basis for improvement or development of standards in quality, safety, and efficacy of herbal material as well as the establishment of regionally applicable RMPM [7]. For establishing their first RMPM, the FHH has selected the root of Angelica gigas Nakai. The roots of many Angelica species have a long use as traditional medicine [8] [9] [10]. Some are traded in East Asian herbal markets under the same common name “Dang gui”: Angelica sinensis (Oliv.) Diels, A. acutiloba (Siebold & Zucc.) Kitag., and A. gigas Nakai are most commonly used in China, Japan, the Republic of Korea and Vietnam, respectively [11] [12] [13]. They show similar phenotype and organoleptic properties, but different chemical composition. Other species from related genera within the Apiaceae are also traditionally prescribed for similar purpose.
In the past years, HPTLC/TLC have been widely adopted by pharmacopoeias around the world for the chemical identification of herbal drugs. Acceptance criteria for HRM are either given by a results table (European Pharmacopoeia (Ph. Eur.) [14]) or by a paragraph describing color and position of zones of the chromatogram [15][16]. More recently images of HPTLC/TLC chromatograms have also been published [17] [18] [19] [20] [21] [22] [23]. However, HPTLC chromatograms and HPTLC fingerprints carry information beyond simple chemical identification.
The HPTLC fingerprint is the electronic image of the chromatogram. When generated by a standardized methodology under use of suitable instruments and software, and qualified by a System Suitability Test [14] [15] [16] [24], HPTLC fingerprints can also provide quantitative information based on the intensity of zones [25]. Based on the entire information from a single HPTLC analysis, the process of quality control could be simplified. “Comprehensive HPTLC fingerprinting” might also become a tool for purity checks and determination of the minimum content of an herbal drug. Comprehensive HPTLC fingerprints derived from an herbal reference material can transfer all relevant quality elements of the reference material to the image, which thus could be used independently as reference for quality control.
The goal of this work was to prove this concept for which the terminus “Comprehensive HPTLC fingerprinting” is proposed. At the same time, an herbal reference material for the root of Angelica gigas Nakai was established by defining the specifications for quality with respect to identity, purity, and minimum content. First, a suitable HPTLC method for this task was optimized, and an SOP was drafted. The SOP was used as basis for a collaborative trial involving three laboratories in three countries to prove the concept. Finally, the comprehensive HPTLC fingerprinting, generated in our laboratory, was applied for assessment of quality of twenty-four RMPM candidates.

D. A. Frommenwiler Chapter 4
65
4
4.3 Materials and methods
4.3.1 Plant material and standards
Powdered root samples of A. gigas, A. sinensis, A. acutiloba and other 27 related species were obtained from the National Institute of Food and Drug Safety Evaluation (NIFDS) – Republic of Korea, National Institute of Food and Drug Control (NIFDC) – Peoples Republic of China, National Institute of Medicinal Materials (NIMM) - Vietnam, the American Herbal Pharmacopoeia (AHP), Freie Universität Berlin (collected and authenticated by Prof. Melzig), the European Directorate for the Quality of Medicines (EDQM) and from local markets. Additional information about the samples is presented in the supplementary information, Tables 3S1 – 3.
The standards Z-ligustilide (purity ≥ 99%) and nodakenin (purity ≥ 98%) were purchased from CromaDex. Ferulic acid (purity ≥ 99%) was purchased from Sigma. Decursinol (purity ≥ 98%) and 7-demethylsuberosine (purity ≥ 98%) were purchased from ChemFaces. Other standards (decursin, purity ≥ 95%, and decursinol angelate, purity ≥ 95%) were isolated and supplied by the NIFDS. Imperatorin, isoimperatorin and osthole (purity ≥ 99%) were purchased from PhytoLab.
4.3.2 Reagents
Toluene (99%), ethyl acetate (99.5%), acetic acid (99.5%) and sulfuric acid (95%) were purchased from Acros. Methanol (HPTLC grade) was obtained from Carl Roth GmbH.
4.3.3 Plant material processing
Bulk material of A. gigas, A. sinensis, and A. acutiloba was collected by authorities of Republic of Korea, Japan and Vietnam, and then processed by washing, drying at 60°C for 20-30 min, and further drying in the oven for 7-10 days at 35°C. The roots of each sample/batch were milled for 20 seconds to minimize the loss of volatile compounds. These materials were provided to the different institutions.
4.3.4 Preparation of samples and standards solutions
Test solutions: 1.0 g of the powdered material was suspended in 5 mL of methanol and shaken at 3000 rpm for 10 minutes. The suspension was centrifuged at 5000 rpm for 5 min and the supernatants used. For quantitative evaluation, the A. gigas test solutions were diluted 500-fold.
Standard solutions for system suitability test: 1 mg of imperatorin, osthole, and isoimpera-torin were dissolved in 1 mL of methanol.
Decursin standard solutions for the quantitative assessment: five working solutions were prepared at concentrations between 8.0 – 40.0 µL/mL.
4.3.5 High-Performance Thin-Layer Chromatography (HPTLC)
A CAMAG HPTLC system consisting of Visualizer, Automatic TLC Sampler 4 (ATS4), Au-tomatic Developing Chamber 2 (ADC2), Scanner 4, Chromatogram Immersion Device III and TLC Plate Heater III, and controlled by visionCATS software, was used for the analysis. The parameters were chosen based on the USP general chapter <203> [15]: Merck HPTLC silica gel F254 plates 20x10 cm (article N° 105642) were utilized as stationary phase. Prior to development the plates were conditioned to 33% relative humidity and the chamber was saturated for 20 minutes with filter paper and developing solvent. The plates were developed up to 70 mm (from the lower edge) and dried for 5 minutes after development.
The developing solvent consisted of toluene, ethyl acetate, and acetic acid (90:10:1 v/v/v). The volume applied for identity and purity check was 4.0 µL. For the minimum content tests (diluted test solutions and standards) the application volume was 2.0 µL.

D. A. Frommenwiler Chapter 4
66
4
4.3.6 Visualization of fingerprints
Multiple detection modes were employed: UV 254 nm, UV 366 nm, and white light (transmission/ reflection) prior to derivatization; UV 366 nm and white light (transmission/reflection) after derivatization. For derivatization, plates were dipped (speed: 3, time: 0) into 10% sulfuric acid in methanol, and then heated at 100°C for 3 min.
4.3.7 Scanning Densitometry
Chromatograms were scanned in fluorescence mode at 20 mm/s, with data resolution of 100 μm/step and slit size of 5 × 0.2 mm at UV 313 nm using a mercury lamp and a 400 nm cut-off filter K400.
4.3.8 Converting fingerprints into peak profiles (PPI) and evaluation of data
The visionCATS software was used to generate peak profiles (PPI) from fingerprints (images) by calculating the luminance as L = ( R) + ( G) + ( B) from the average of Red, Green, and Blue pixels of each line of the track and then plotting it against the RF values. visionCATS was used for all quantitative evaluation.
4.3.9 Supplementary information
In the supplementary information the following data are available: 1) Different sources of HPTLC/TLC methods for identification of Angelica and related species (Table 4S1); 2) Details of samples shown in Figure 4.2 (Table 4S2); 3) Details of samples of A. gigas, A. sinensis, and A. acutiloba used in the study (Table 4S3); 4) Content of D+DA of herbal reference materials of A. gigas (Table 4S4); and 5) SOP for the collaborative trial.
4.4 Results and Discussion To establish specifications for an herbal drug, the selected sample population has to be sufficiently large, properly authenticated, and representative for the desired quality. Thirty-four samples of A. gigas roots (RMPM 1-10 and AG 1-24) were collected during the traditional collection season (October to November). They had been cultivated in compliance with Good Agricultural Practices (GAP) in fields in the Gangwon province (Republic of Korea). Samples were subjected to botanical and organoleptic identification. Those which met the macroscopic and microscopic specification of the Korean Pharmacopoeia monograph for Angelica gigas root [26] were further evaluated by DNA barcoding and assay in the Herbal Medicine Research Division, National Institute of Food and Drug Safety Evaluation, Republic of Korea [11].
4.4.1 HPTLC fingerprints for identification and evaluation of natural variability
Over the last decades, approximately thirty HPTLC/TLC methods have been published that target eight species of Angelica and related genera [12] [26] [27] [28] [29] [30] [31] [32] (see Table 4S1, supplementary information). Except for those included in the Ph. Eur., the methods are not harmonized and do not provide sufficient information about specific chromatographic parameters. Therefore, it was decided to start with “Identification C” of the Ph. Eur. monograph on Angelica sinensis root [27], already harmonized with monographs for four other related species. Identification C uses standard HPTLC methodology as defined in the general chapters of the Ph. Eur. (2.8.25) [14] and the United States Pharmacopoeia (USP) (<203>) [15]. The System Suitability Test of the Ph. Eur. monographs was modified to the required appearance of the zones corresponding to imperatorin, osthole, and isoimperatorin at RF 0.33, 0.38, and 0.44, respectively. Furthermore, the exposure time for capturing the image under UV 366 nm was adjusted on the track that contains the System Suitability Test [14].
The method was applied to investigate the natural variability of A. gigas root and to establish a “representative” fingerprint comprising most of the chemical characteristics of

D. A. Frommenwiler Chapter 4
67
4
the species. Nineteen samples were analyzed individually and then pooled by mixing 1g of each. The pooled sample was homogenized, extracted, and analyzed. Its fingerprint (track A) is compared in Figure 4.1 with those of all thirty-four individual samples (tracks 1-34). While there are slight variations in the individual fingerprints, the pooled sample represents an average revealing the typical features of the species.
Figure 4.1 HPTLC fingerprints of 34 samples of A. gigas; UV 254 nm (top) and UV 366 nm prior derivatization (bottom); track A: pooled sample of 19 samples on tracks 11-29; tracks 1-10: RMPM 1-10; tracks 11 – 34: AG 1-24.
4.4.2 Specificity of the optimized HPTLC method
Specificity of the Ph. Eur. method was investigated. A series of experiments with a modified sample preparation (using methanol instead of heptane) and an additional derivatization step with 10% sulfuric acid in methanol, demonstrated that the final method is able to generate significantly different fingerprints for the roots of twenty-seven related species (Figure 4.2). Several zones between the application position and the zone of isoimperatorin (RF 0.44, track 1) can be used to distinguish the species on tracks 2 to 8 applying different detection modes. The samples on tracks 9 - 13 include Angelica and Peucedanum species and show different composition under different detection modes. A. gigas (track 12) features a very characteristic and distinctive fingerprint. The samples on tracks 14 - 15 (P. alsaticum and A. palustris) show an overall weak fingerprint, both species can be distinguished from others under UV 254 nm prior to derivatization and UV 366 nm after derivatization. The species on tracks 16 – 29, which contain Z-ligustilide (a blue zone at RF 0.58 under UV 366 nm prior to derivatization), can be discriminated by the zones between RF 0.2 and 0.55 applying different detection modes. The modified method for chemical identification is specific and can detect substitution with other species (adulterants).

D. A. Frommenwiler Chapter 4
68
4
Figure 4.2 HPTLC fingerprints of the roots of different species of Apiaceae Family, top to bottom: UV 254 nm and UV 366 nm prior derivatization, white light and UV 366 nm after derivatization. Track 1: imperatorin, osthole, isoimperatorin and Z-ligustilide (increasing RF); track 2: Peucedanum officinale; track 3: Notopterygium franchetii; track 4: Notopterygium incisum; track 5: Angelica dahurica var. formosana; track 6: Angelica dahurica; track 7: Peucedanum ostruthium; track 8: Angelica grosseserrata; track 9: Angelica decursiva; track 10: Angelica pubescens; track 11: Angelica archangelica; track 12: Angelica gigas; track 13: Peucedanum praeruptorum; track 14: Peucedanum alsaticum; track 15: Angelica palustris; track 16: Ligusticum mutellina; track 17: Ligusticum grayi; track 18: Angelica acutiloba; track 19: Angelica acutiloba var. sugiyamae; track 20: Ligusticum officinale; track 21: Angelica sinensis; track 22: Ligusticum canbyi; track 23: Ligusticum tenuissimum; track 24: Ligusticum jeholense; track 25: Ligusticum sinense; track 26: Ligusticum chuanxiong; track 27: Ligusticum porteri; track 28: Levisticum officinale.
4.4.3 HPTLC fingerprints for determination of purity
In the next step, a test for purity, this method should be shown to be suitable to detect adulterants added to a certain percentage. This involved the assessment of: (1) whether the HPTLC fingerprints of the adulterant materials contain zones that can be regarded as markers absent in the fingerprint of target material and (2) the detection limit of such markers in the fingerprint.
The two other very common species of Dang gui (A. sinensis and A. acutiloba) were chosen as adulterants. Individual pooled samples were created for A. acutiloba from twelve samples, for A. sinensis from six samples, and for A. gigas from 10 samples (RMPM 1-10). The powdered pooled samples of A. gigas were systematically mixed in different proportions with either A. sinensis, or A. acutiloba, extracted and analyzed (Figure 4.3). Z-ligustilide at RF 0.58 turned out as highly suitable to detect the two adulterants. It represents a marker for both A. acutiloba (track 6) and A. sinensis (track 12), but lacks in the fingerprint of pure Angelica gigas (tracks 1 and 7). This faint zone was observed when only 1% of either A. acutiloba or A. sinensis is mixed with 99% of A. gigas (tracks 2 and 8, respectively).

D. A. Frommenwiler Chapter 4
69
4
Figure 4.3 Fingerprints of mixtures: UV 366 nm prior derivatization (enhanced: contrast 1.0; normalized over the zone of Z-ligustilide on tracks 5 and 11). Tracks 1 and 7: 100% Angelica gigas (AG), track 2: 1% A. acutiloba (AA) and 99% AG, track 3: 5% AA and 95% AG), track 4: 10% AA and 90% AG, track 5: 50% AA and 50% AG, track 5: 100% AA, track 8: 1% A. sinensis (AS) and 99% AG, track 9: 5% AS and 95% AG, track 10: 10% AS and 90% AG, track 11: 50% AS and 50% AG, track 12: 100% AS.
4.4.4 Conversion of electronic images into “peak profile from images” (PPI)
For a more objective evaluation and comparison of zone intensities for quantitative analysis, the HPTLC fingerprints (electronic images, Figure 4.4 A) were converted into “peak profiles from images” (PPI). In this process the luminance is calculated from the average RGB signals of pixels per line of the track and then plotted as function of the RF (Figure 4.4 B). In the peak profile integration ranges were then adjusted to frame the target zone Z-ligustilide (Figure 4.4 C). The resulting single peak was rotated 90° so that it is seen as a band from its rear end and its height becomes a “bar graph” (Figure 4.4 E).
Figure 4.4 Conversion of electronic images into “peak profiles from images” (PPI); A: Fingerprint (image) under UV 366 nm prior to derivatization; B: Fingerprint converted into PPI; C: peak due to Z-ligustilide after adjusting the integration range to exclude other peaks; D: isometric view of the PPI; E: bar graph representing the peak height due to Z-ligustilide.

D. A. Frommenwiler Chapter 4
70
4
In Figure 4.5, the intensities of the Z-ligustilide zones are compared. Admixtures of 5% of either species into A. gigas (tracks 3 and 9) are clearly visible in the fingerprint (Figure 4.3). Thus, this level is proposed as an upper limit for the presence of these two species.
Figure 4.5 Evaluation of PPI derived from Fingerprints in Figure 4.3: detection of mixtures of A. gigas with A. acutiloba (red bars) or A. sinensis (blue bars) based on the presence of Z-ligustilide.
4.4.5 HPTLC fingerprint for minimum content test
The third part of the study targeted the possibility of determining “minimum content” of active or analytical markers as a criterion of quality from the HPTLC fingerprint obtained during identification. It was evaluated whether an HPTLC fingerprint of an herbal reference material with a known content of markers and a defined minimum content as acceptance criterion can be used as a quantitative reference. This could be a simpler and more general approach to the assessment of minimum content. Such quantitative evaluation could be accomplished during the HPTLC analysis for identification without need for additional work or instrumentation.
For that purpose, several known constituents of A. gigas roots were evaluated with respect to their chromatographic behavior, spectral properties, and suitability as positive markers. Five of those substances are clearly detectable in the HPTLC fingerprint of the drug (Figure 4.6, tracks 1-5) under the conditions of the method for identification. Decursin (track 4) and decursinol angelate (DA; track 5) are co-eluting and give the most prominent zone of the fingerprint (track 6) with sufficient separation from other zones. The sum of decursin plus DA (D+DA) expressed as decursin was selected for assessment of minimum content.
The amount of this sum was determined from peak profiles from scanning densitometry (PPSD) in ten herbal reference samples of A. gigas (RMPM 1-10; see Table 4S4). After dilution of the test solution for identification at a ratio 1:500, samples fit into a linear calibra-tion range of 16-80 ng per zone established with a decursin standard. Measurements in fluorescent mode at UV 313/>400nm were performed in independent triplicates on three HPTLC plates. Results are presented in Table 4.1. The average of D+DA of samples was 5.55% by PPSD. This value is comparable to 5.9% obtained by HPLC assays of the indivi-dual compounds [11]. The table compares values from PPSD and PPI. Both measurements evaluated peaks areas and heights. For PPI the data was best fitted by a polynomial function (Figure 4.7). Good correlation was observed with the results obtained by PPSD which were 1.14-fold higher.

D. A. Frommenwiler Chapter 4
71
4
Based on the lowest value for D+DA in the RMPMs, the minimum content expressed as decursin was proposed at 3.0% (average between area and height data from PPI). This corresponds to 0.012 mg/mL of D+DA equivalent to 0.4 mg/mL of powdered drug extracted in methanol.
Figure 4.6 Identification of zones in the fingerprint of Angelica gigas (UV 366 nm prior derivatization); track 1: nodakenin; track 2: decursinol; track 3: 7-demethylsuberosine (RF 0.15); track 4: decursin; track 5: decursinol angelate; track 6: A. gigas; concentration of reference substances: 1 mg/mL in methanol.
Table 4.1 Average content of D+DA expressed as decursin in ten samples of herbal reference material (RMPM 1-10)
PPSD (area)
PPSD (height)
PPI (area)
PPI (height)
Average content of decursin plus DA expressed as decursin 5.55% 5.12% 4.74% 4.30%
Average CV% of the triplicates 4.22% 4.31% 4.87% 4.70% Correlation coefficient (R) for plate 1 (samples n1) 0.999223a 0.998699a 0.999004a 0.999183b
Coefficient of variation of the calibration curve for plate 1 2.0232% 2.5136% 2.3615 % 2.0483%
Correlation coefficient (R) for plate 2 (samples n2) 0.993888a 0.993097 0.998409b 0.998398b
Coefficient of variation of the calibration curve for plate 2 5.7059% 5.9035% 3.0235% 2.9313%
Correlation coefficient (R) for plate 3 (samples n3) 0.998833a 0.997809a 0.999409b 0.999556b
Coefficient of variation of the calibration curve for plate 3 2.4634% 3.2975% 1.8251% 1.5318%
a Calculation based on a linear function; b Calculation based on a polynomial function
Figure 4.7 Calibration curves for decursin based on PPI and PPD; Blue dots: sample solutions; Green dots: reference solutions.

D. A. Frommenwiler Chapter 4
72
4
4.4.6 The use of RMPM as reference for minimum content test
To replace the chemical standard, RMPM 4 of A. gigas was prepared to contain 0.012 mg of these substances per mL (reference solution used as minimum content (MC)). RMPM 1-10 were prepared at concentrations of 0.2 g/mL (as for identification test) and diluted 500-fold (test solutions). Figure 8 compares the test solutions (green bars) with the reference solution (red bar). Visually it is difficult to accurately assess from the fingerprint if a sample passes or fails the test for minimum content (Figure 4.8 A), but after conversion to PPI such determination is quite simple: the content (intensity) of all samples is above the limit (Figure 4.8 B). For results with higher accuracy, a single point calibration based on peak area or height of D+DA in the reference solution can be used to calculate values for the test solutions (Figure 4.8 C and D). Similar results are obtained by PPSD.
Figure 4.8 Test for minimum content of D+DA in A. gigas samples for herbal reference material; A: visual comparison of the fingerprints; B: visual evaluation based on PPI; Content (%) of D+DA calculated on PPI via height (C) and area (D). MC: minimum content/RMPM 4; tracks 1 - 10: A. gigas root RMPM 1-10.
4.4.7 The collaborative trial
The above described process of producing an HPTLC fingerprint and rendering it into peak profiles which may be integrated for obtaining additional, quantitative information is suggested to denominate “Comprehensive HPTLC fingerprinting”. The corresponding SOP for Angelica gigas root was drafted. It defines acceptance criteria regarding identity, purity, and minimum content with reference to the herbal reference material (see supplementary information). This SOP was evaluated in a collaborative trial involving three laboratories in three countries, Switzerland, Republic of Korea, and Vietnam. The collaborators used identical sets of standards (imperatorin, osthole, isoimperatorin, and decursin) and samples (three of A. gigas, RMPM 1, 5 and 10; one sample each of A. sinensis and A. acutiloba). Results are presented in Table 4.1.
The trial evaluated repeatability of the RF of seven zones of the fingerprint. All values were within 0.01 RF units, except for Z-ligustilide. According to Reich et al. [6], variability of RF in inter-laboratory trials should not exceed 0.07 RF units. All test samples produced fingerprints identical to that of A. gigas herbal reference material presented in the SOP. In the purity test no lab detected a zone due to Z-ligustilide in the herbal reference samples but the zone representing 5% adulteration in the corresponding reference solution made

D. A. Frommenwiler Chapter 4
73
4
from A. acutiloba and A. sinensis. In the test for minimum content, the intensity (peak height) of the zone of D+DA in the fingerprint of A. gigas was compared to that of a decursin standard solution prepared at a concentration of 0.012 mg/mL. In all laboratories all samples passed the limit test for D+DA.
Table 4.2 Results of the collaborative study performed in three laboratories with three samples of herbal reference material of A. gigas roots.
Qualification of the chromatography/ identity Compounds CHb KRc Vietnam ΔRF Z-ligustilide 0.58 0.58 0.52 0.06 Isoimperatorin 0.44 0.44 0.44 0.00 Osthole 0.38 0.38 0.37 0.01 Imperatorin 0.33 0.34 0.33 0.01 Decursin plus DAa 0.27 0.27 0.28 0.01 7-Demethylsuberosine 0.15 0.16 0.16 0.01 Decursinol 0.04 0.04 0.04 0.00 Purity of A. gigas samples
Presence of Z-ligustilide in 3 A. gigas samples
negative negative negative Samples not
adulterated with ASd and/or AAe
Z-ligustilide equivalent to 5% adulteration in reference solution
positive positive positive Representation of
adulteration with 5% ASd and AAe is seen
Strength of A. gigas samples Content of Decursin plus DAa in three A. gigas samples
≥ 0.012 mg/mL
≥ 0.012 mg/mL
≥ 0.012 mg/mL
Sample of compliant strength
a Decursinol angelate (DA); b Switzerland (CH); c Republic of Korea (KR); d Angelica sinensis (AS); e Angelica acutiloba (AA)
The new method was applied to twenty-four additional samples of herbal reference material of A. gigas (samples AG 1-24). The identification part is included in Figure 4.2 (tracks 11- 34). All fingerprints are in full agreement with those of RMPM 1-10 (tracks 1-10). No zone due to Z-ligustilide is seen, indicating the absence of A. acutiloba and/or A. sinensis. For visual assessment of minimum content, the PPI of the test solutions were compared to that of the reference solution prepared from RMPM 4 containing 3.0% of D+DA (Figure 4.9). Nineteen samples (tracks 1-6, 8-10, 12-14, 17-20, 22-24, green bars) pass the limit test, one sample (track 15) is in the uncertainty level of ± 5%, and four samples (tracks 7, 11, 16 and 21, gray bars) fail the minimum content, and were therefore rejected as candidate for herbal reference material.
Figure 4.9 Visual test for minimum content based on PPI; MC: minimum content/RMPM 4; tracks 1 - 24: A. gigas root herbal reference material (samples AG 1-24).

D. A. Frommenwiler Chapter 4
74
4
4.5 Conclusion In this work the specifications for chemical identity of A. gigas, as well as purity (test for adulteration with A. sinensis and A. acutiloba) and minimum amount of D+DA in the roots of A. gigas were established based on the data available in the image. The method has been successfully evaluated in a collaborative trial involving three laboratories and was applied in the analysis of twenty-four commercial samples (samples for herbal reference material: AG 1-24).
To the best of our knowledge, this case study presents a novel, pragmatic, and cost-efficient approach for establishing and controlling quality of an herbal drug, based on “comprehensive HPTLC fingerprinting”. While the fingerprint usually is the electronic ima-ge of the visual HPTLC chromatogram, the comprehensive fingerprint includes a peak profile based on luminance, which can be evaluated quantitatively. A comprehensive fingerprint thus contains information about the identity, purity, and minimum content of the herbal drug. It represents the quality of an herbal reference material of A. gigas root and can be included in an SOP or quality monograph as principal reference for those three elements of quality. In the process of establishing further RMPM for herbal drugs, the concept of comprehensive HPTLC fingerprinting could be used for creating an HPTLC atlas of herbal drug quality for FHH members.
4.6 References [1] United Stated Food & Drug Administration (FDA), “CFR - Code of Federal Regulations Title 21
Sec. 111.75 What must you do to determine whether specifications are met?” [Online]. Available: https://www.accessdata.fda.gov/scripts/cdrh/cfdocs/cfcfr/CFRSearch.cfm?fr=111.75.
[2] European Agency for the Evaluation of Medicinal Products (EMEA), “Guidelines on quality of herbal medicinal products/traditional medicinal products,” EMA/HMPC/201116 /2005 Rev. 2. London, 2011.
[3] World Health Organizaton, “Quality control methods for Herbal Materials (Updated edition of Quality control methods for medicinal plant materials, 1998),” 2011. [Online]. Available: https://apps.who.int/medicinedocs/en/m/abstract/Jh1791e/. [Accessed: 27-Sep-2019].
[4] World Health Organization (WHO), “Review of world Pharmacopoeia, Working document QAS/12.512/Rev.1.,” in International Meeting of World Pharmacopoeias, 2012.
[5] R. R.H. Upton, “Traditional herbal medicine, pharmacognosy, and pharmacopoeial standards: A discussion at the crossroads,” in Evidence-based validation of herbal medicine, P. K. Mukherjee, Ed. Waltham: Elsevier, 2015, p. 537.
[6] E. Reich and Anne Schibli, “Validation of High-Performance Thin-Layer Chromatographic Methods for the Identification of Botanicals in a cGMP Environment,” J. AOAC Int., vol. 91, no. 1, pp. 13–20, 2008.
[7] “Forum for the Harmonization of Herbal Medicines.” [Online]. Available: http://www.fhhm.net/. [Accessed: 22-Sep-2016].
[8] W. Peng-cheng, M. Crosby, and S. He, Eds., Moss flora of China. Sematophyllaceae - Polytrichaceae, Vol. 8. St. Louis: Missouri Botanical Garden Press, 2005.
[9] R.H. Shan, “Umbelliferae,” in Flora reipublicae popularis sinicae, M. L. Sheh and R.H. Shan, Eds. Beijing: Academia Sinica, 1992, pp. 13–62.
[10] S. C. Lao et al., “Identification and quantification of 13 components in Angelica sinensis (Danggui) by gas chromatography-mass spectrometry coupled with pressurized liquid extraction,” Anal. Chim. Acta, vol. 526, no. 2, pp. 131–137, 2004.
[11] S. Y. Jeong et al., “Quantitative analysis of marker compounds in Angelica gigas, Angelica sinensis and Angelica acutiloba by HPLC/DAD,” Chem. Pharm. Bull. (Tokyo)., vol. 63, no. 7, pp. 504–11, 2015.
[12] R. R.H. Upton, A. Graff, and D. Swisher, “Dang gui root,” in American Herbal Pharmacopoeia and Therapeurical Compendium, R. R.H. Upton, Ed. Scotts Valley: AHP, 2003, pp. 1–41.
[13] Ingrid L.I. Hook, “Danggui to Angelica sinensis root: Lost in translation? Are potential benefits of a TCM lost to European women? A review,” J. Ethnopharmacol., vol. 152, no. 1, pp. 1–13, 2013.

D. A. Frommenwiler Chapter 4
75
4
[14] European Directorate for the Quality of Medicines and Healthcare (EDQM), “Chapter 2.8.25: High-performance thin-layer Chromatography of herbal drugs and herbal preparations,” in European Pharmacopoeia, 9.0., 2017, pp. 295–296.
[15] United States Pharmacopeial Convention, “Chapter 203: High-Performance Thin-Layer Chromatography procedure for identification of articles of botanical origin,” in The United States Pharmacopoeia 40–NF 35, Rockville, 2017, pp. 258–260.
[16] United States Pharmacopoeial Convention, “Chapter 1064: Identification of articles of botanical origin by high-performance thin-layer Chromatography procedure,” in The United States Pharmacopeia 40–NF 35, Rockville, 2017, pp. 1187–1197.
[17] Chinese Pharmacopoeia Commission, TLC atlas of Chinese crude drugs in pharmacopoeia of the People’s Republic of China, 1st ed. Beijing: People’s Medical Publishing House, 2008.
[18] Indian Council of Medical Research, Quality standards of Indian medicinal plants, 14th ed. New Delh: Aravali Printers & Publishers, 2016.
[19] United States Pharmacopeial Convention, United States Pharmacopoeia dietary supplement compendium. Rockville, 2015.
[20] U. S. P. Convention, “Herbal medicines compendium.” [Online]. Available: https://hmc.usp.org/. [Accessed: 01-Nov-2017].
[21] American Herbal Pharmacopoeia, American Herbal Pharmacopoeia and Therapeurical Compendium, 35 volumes. Scotts Valley.
[22] “Hong Kong Chinese Materia Medica Standards, 8 volumes.” [Online]. Available: http://www.cmd.gov.hk/html/eng/hkcmms/cmmlist.html. [Accessed: 10-Aug-2016].
[23] R. Bauer, D. Melchart, P. G. Xiao, A. Staudinger, and H. Wagner, Chromatographic Fingerprint Analysis of Herbal Medicines. Vien: Kötzting: Springer, 2011.
[24] E. Reich, D. A. Frommenwiler, and V. Maire-Widmer, “High-performance thin-layer chromatography for the identification of botanical materials and the detection of adulteration,” in Botanicals: methods and techniques for quality & authenticity, 1st ed., K. Allerslev and M. Khalid, Eds. Boca Raton: CRC Press, 2015, pp. 241–259.
[25] B. Spangenberg, P. C.F., and W. C.H., Qualtitative thin-layer chromatography: a practical survey. Heidelberg: Springer Science & Business Media, 2011.
[26] Ministry of Food and Drug Safety, “Monographs for Angelica dahurica root, Angelica gigas root and Cnidium officinale rhizome,” in The Korean Pharmacopoeia, 10th ed., Osong, 2012, pp. 1258–1261 and 1279–1280.
[27] European Directorate for the Quality of Medicines and Healthcare (EDQM), “Monographs for Angelica archangelica root (1857), Angelica dahurica root (2556), Angelica pubescens root (2557), Angelica sinensis root (2558) and Levisticum officinale root (1233),” in European Pharmacopoeia, 9.0., Strasbourg, 2017, pp. 1242–1248 and 1420–1421.
[28] Chinese Pharmacopoeia Commission, “TLC identification of radix Angelicae dahuricae, radix Angelicae pubescentis, radix Angelicae sinensis, rhizoma Chuanxiong and rhizoma et radix Ligustici,” in TLC Atlas of Chinese crude drug in pharmacopoeia of the People’s Republic of China, Beijing: People’s Medical Publishing House, 2008, pp. 172–175, 244, 259.
[29] Chinese Pharmacopoeia Commission, “Monographs for Angelicae dahuricae radix, Angelicae pubescentis radix, Angelicae sinensis radix, Chuangxiong rhizoma and Ligustici rhizoma et radix,” in Pharmacopoeia of the People’s Republic of China, Beijing, 2010, pp. 35–38, 105–106, 249–250.
[30] Chinese Medicine Division; Department of Health; The Government of the Hing Kong Special Admnistrative Region, “Monographs for radix Angelicae pubescentis, radix Angelicae sinesis, Ligustici rhizoma et radix,” Hong Kong Chinese Materia Medica Standards.
[31] M. and H. products R. Agency, “Monographs for Angelica root (Angelica archangelica) and Angelica sinensis root for use in THM,” in British Pharmacopoeia, London, 2009, pp. 3331–3334.
[32] R. Bauer, D. Melchart, P. G. Xiao, A. Staudinger, and H. Wagner, “Monographs for radix Angelicae pubescentis (Duhuo), radix Angelicae sinensis (Danggui), radix Angelicae dahuricae (Baizhi) and rhadix Ligustici chuanxiong (Chuanxiong),” in Chromatographic Fingerprint Analysis of Herbal Medicines, Vien: Kötzting: Springer, 2011, pp. 99–111, 161–190.

D. A. Frommenwiler Chapter 4, Supplementary information
4
76
4.7 Supplementary information Table 4S1 Sources of TLC/HPTLC methods for identification of Angelica and related species
Species Source TLC / HPTLC identification method and mobile phase Angelica sinensis Ph. Eur. [27]
TLC Atlas [28]
TLC Atlas [28] PPRC [29] HKCMMS [30] HKCMMS [30]
AHP [12]
BP [31]
CFAHM [32]
HPTLC; acetic acid, ethyl acetate, toluene (1:10:90 v/v/v) (ID 1), HPTLC; hexane, ethyl acetate (4:1 v/v) (ID 2), HPTLC; toluene, ethyl acetate, formic acid (4:1:0.1 v/v/v) TLC; hexane, ethyl acetate (4:1 v/v) (ID 1), HPTLC; hexane, ethyl acetate (5:1 v/v) (ID 2), HPTLC; chloroform, ethyl acetate, formic acid (10:5:0.5 v/v/v) HPTLC; acetic acid, ethyl acetate, toluene (1:10:90 v/v/v) TLC; formic acid, ethyl acetate, toluene (1:10:90 v/v/v) TLC; formic acid, ethyl acetate, toluene (1:10:90 v/v/v)
Angelica dahurica Ph. Eur. [27] TLC Atlas [28]
PPRC [29] CFAHM [32]
KP [26]
HPTLC; acetic acid, ethyl acetate, toluene (1:10:90 v/v/v) HPTLC; petroleum ether, ether (3:2 v/v) TLC; petroleum ether, ether (3:2 v/v) TLC; formic acid, ethyl acetate, toluene (1:10:90 v/v/v) TLC; hexane, ethyl acetate (2:1 v/v)
Angelica pubescens
Ph. Eur. [27] TLC Atlas [28]
HKCMMS [30]
PPRC [29] CFAHM [32]
HPTLC; acetic acid, ethyl acetate, toluene (1:10:90 v/v/v) HPTLC; hexane, toluene, ethyl acetate (2:1:1 v/v/v) HPTLC; hexane, toluene, ethyl acetate (2:1:1 v/v/v) TLC; petroleum ether, ethyl acetate (7:3 v/v)) TLC; hexane, ethyl acetate (4:1 v/v)
Angelica archangelica
Ph. Eur. [27] BP [31]
HPTLC; acetic acid, ethyl acetate, toluene (1:10:90 v/v/v) TLC; dichloromethane, toluene (1:1 v/v)
Angelica gigas KP [26] TLC; hexane, ethyl acetate (2:1 v/v) Ligusticum
sinensis PPRC [29] TLC Atlas [28] HKCMMS [30]
TLC; petroleum ether, acetone (95:5) TLC; toluene, ethyl acetate, formic acid (7:2:0.1 v/v/v) TLC; cyclohexane, ethyl acetate, acetic acid (6:3:0.4 v/v/v)
Ligusticum chuanxiong
PPRC [29] TLC Atlas [28] CFAHM [32]
KP [26]
TLC; hexane, ethyl acetate (9:1 v/v) TLC; hexane, ethyl acetate (9:1 v/v) TLC; acetic acid, ethyl acetate, toluene (1:10:90 v/v/v) TLC; hexane, ethyl acetate, methanol (10:2:1 v/v/v)
Levisticum officinale
Ph. Eur. [27] HPTLC; acetic acid, ethyl acetate, toluene (1:10:90 v/v/v)
Table 4S2 Details of samples shown in Figure 4.2
Track N° Sample 1 Imperatorin, osthole, isoimperatorin and Z-ligustilide (increasing RF) 2 Peucedanum officinale L. c 3 Notopterygium franchetii H.Boissieua 4 Notopterygium incisum K.C.Ting ex H.T.Chang a 5 Angelica dahurica var. formosana (Boissieu) Yen a 6 Angelica dahurica (Hoffm.) Benth. & Hook.f. ex Franch. & Sav. a 7 Peucedanum ostruthium (L.) W.D.J.Koch c 8 Angelica grosseserrata Maxim. a

D. A. Frommenwiler Chapter 4, Supplementary information
77
4
Track N° Sample 9 Angelica decursiva (Miq.) Franch. & Sav. a
10 Angelica pubescens Maxim. a 11 Angelica archangelica L. b 12 Angelica gigas Nakai a 13 Peucedanum praeruptorum Dunn a
14 Peucedanum alsaticum L. c
15 Angelica palustris (Besser) Hoffm.c
16 Ligusticum mutellina (L.) Crantz c
17 Ligusticum grayi J.M.Coult. & Rose b
18 Angelica acutiloba (Siebold & Zucc.) Kitag. a
19 Angelica acutiloba var sugiyamae Hikino a
20 Ligusticum officinale (Makino) Kitag. a
21 Angelica sinensis (Oliv.) Diels a
22 Ligusticum canbyi J.M. Coult. & Rose b
23 Ligusticum tenuissimum (Nakai) Kitag. a
24 Ligusticum jeholense (Nakai & Kitag.) Nakai & Kitag. a
25 Ligusticum sinense Oliv. a
26 Ligusticum chuanxiong S.H.Qiu, Y.Q.Zeng, K.Y.Pan, Y.C.Tang & J.M.Xu d
27 Ligusticum porteri J.M.Coult. & Rose b
28 Levisticum officinale W.D.J.Koc b
a) botanical reference material (BRM) provided by the Ministry of Food and Drug Safety (MFDS) – South Korea or by the National institute of food and Drug Control (NIFDC) – China; b) BRM provided by the American Herbal Pharmacopoeia (AHP) – USA; c) BRM collected and authenticated by Prof. Melzig, Freie Universität Berlin; d) provided through the European Directorate for the Quality of Medicines (EDQM)
Table 4S3 Details of Angelica gigas, Angelica acutiloba and Angelica sinensis samples used in the study, their origin (Institutions, market samples) and their voucher number (when applicable)
Description of samples
Sample species Institution/ Herbarium
Voucher n°
RMPM1 Angelica gigas NIFDS Not available* RMPM2 Angelica gigas NIFDS Not available* RMPM3 Angelica gigas NIFDS Not available* RMPM4 Angelica gigas NIFDS Not available* RMPM5 Angelica gigas NIFDS Not available* RMPM6 Angelica gigas NIFDS Not available* RMPM7 Angelica gigas NIFDS Not available* RMPM8 Angelica gigas NIFDS Not available* RMPM9 Angelica gigas NIFDS Not available* RMPM10 Angelica gigas NIFDS Not available*
AG1 Angelica gigas NIFDSa KDNR1404102001 AG2 Angelica gigas NIFDSa KDNR1404102002 AG3 Angelica gigas NIFDSa KDNR1404102003 AG4 Angelica gigas NIFDSa KDNR1404102004 AG5 Angelica gigas NIFDSa KDNR1404102005 AG6 Angelica gigas NIFDSa KDNR1404102006 AG7 Angelica gigas NIFDSa KDNR1404102007 AG8 Angelica gigas NIFDSa KDNR1404102008 AG9 Angelica gigas NIFDSa KDNR1404102009
AG10 Angelica gigas NIFDSa KDNR1404102010 AG11 Angelica gigas NIFDSa KDNR1404102011 AG12 Angelica gigas NIFDSa KDNR1404102012 AG13 Angelica gigas NIFDSa KDNR1404102013 AG14 Angelica gigas NIFDSa KDNR1404102014 AG15 Angelica gigas NIFDSa KDNR1404102015

D. A. Frommenwiler Chapter 4, Supplementary information
78
4
Description of samples
Sample species Institution/ Herbarium
Voucher n°
AG16 Angelica gigas NIFDSa KDNR1404102016 AG17 Angelica gigas NIFDSa KDNR1404102017 AG18 Angelica gigas NIFDSa KDNR1404102018 AG19 Angelica gigas NIFDSa KDNR1404102019 AG20 Angelica gigas NIFDSa KDNR1404102020 AG21 Angelica gigas NIFDSa KDNR1404102021 AG22 Angelica gigas NIFDSa KDNR1404102022 AG23 Angelica gigas NIFDSa KDNR1404102023 AG24 Angelica gigas NIFDSa KDNR1404102024 AA1 Angelica acutiloba NIMMb Ref. H2014V0002 AA2 Angelica acutiloba Market sample Not available* AA3 Angelica acutiloba Market sample Not available* AA4 Angelica acutiloba Market sample Not available* AA5 Angelica acutiloba NIFDS Not available* AA6 Angelica acutiloba NIFDS Not available* AA7 Angelica acutiloba NIFDS Not available* AA8 Angelica acutiloba NIFDS Not available* AA9 Angelica acutiloba NIFDS Not available*
AA10 Angelica acutiloba NIFDS Not available* AA11 Angelica acutiloba NIFDSa KDSR1404212095 AA12 Angelica acutiloba NIFDS Not available* AS1 Angelica sinensis Market sample Not available* AS2 Angelica sinensis Market sample Not available* AS3 Angelica sinensis Market sample Not available* AS4 Angelica sinensis Market sample Not available* AS5 Angelica sinensis Market sample Not available* AS6 Angelica sinensis Market sample Not available* AS1 Angelica sinensis Market sample Not available*
a) indicates samples deposited at the Herbarium from National Center for Herbal Resources – National Institute of Food and Drug Safety Evaluation (NIFDS; Republic of Korea); b) indicates samples provided by National Institute of Medicinal Materials (NIMM; Vietnam) * samples were provided with internal reference number (column 1) only
Table 4S4 Content of D+DA of herbal reference materials of Angelica gigas RMPMs
Average content (n=3) in % based on PPSD
Average content (n=3) in % based on PPI
Samples area height area height A. gigas RMPM 1 5.91 ± (0.20%) 5.48 ± (0.20%) 5.37 ± (0.30%) 4.93 ± (0.28%) A. gigas RMPM 2 5.41 ± (0.32%) 4.96 ± (0.38%) 4.85 ± (0.43%) 4.42 ± (0.41%) A. gigas RMPM 3 7.23 ± (0.35 %) 6.58 ± (0.33%) 6.35 ± (0.41%) 5.61 ± (0.37%) A. gigas RMPM 4 3.60 ± (0.14%) 3.24 ± (0.13%) 3.15 ± (0.12%) 2.88± (0.10%) A. gigas RMPM 5 4.50 ± (0.14%) 3.87 ± (0.10%) 3.84 ± (0.13%) 3.46 ± (0.10%) A. gigas RMPM 6 6.99 ± (0.22%) 5.63 ± (0.14%) 5.85 ± (0.12%) 5.31 ± (0.10%) A. gigas RMPM 7 6.49 ± (0.52%) 5.92 ± (0.54%) 5.38 ± (0.52%) 4.87 ± (0.47%) A. gigas RMPM 8 4.21 ± (0.06%) 3.76 ± (0.04%) 3.50 ± (0.03%) 3.15 ± (0.02%) A. gigas RMPM 9 4.32 ± (0.22%) 3.90 ± (0.15%) 3.57 ± (0.15%) 3.23 ± (0.09%) A. gigas RMPM 10 6.81 ± (0.16%) 6.13 ± (0.21%) 5.58 ± (0.20%) 5.03 ± (0.20%)
Method for the identification and assessment of purity and strength of Angelica gigas root (SOP) 1. Preparation of test solutions

D. A. Frommenwiler Chapter 4, Supplementary information
79
4
Test solution A: 1.0 g of milled plant material is transferred to a 5 mL volumetric flask. The volume is made up to 5 mL with methanol. The mixture is shaken for 10 min and then centrifuged. The supernatant is used as Test solution.
Test solution A1: 1 mL of Test solution A is transferred to a 20 mL volumetric flask and the volume is made up to 20 mL with methanol. 1 ml of the diluted solution (1:20) is transferred to a 25 mL volumetric flask and the volume is made up to 25 mL with methanol.
2. Preparation of reference solutions
Solution for system suitability test (SST): 1 mg each of imperatorin, osthole and isoimperatorin are individually dissolved in 1 mL of methanol.
Reference solution R (identification): a solution of A. gigas roots RMPM is prepared to contain 3.0% of decursin plus decursinol angelate as follows (calculate the amount of starting material according to this formula):
Z0.03
0.01 𝑌
Z = amount of starting material in grams
𝑌 = percentage of decursin plus decursinol angelate declared in the CoA
The amount of starting material, calculated in grams (formula above), is transferred to a 5 mL volumetric flask and volume is made up to 5 mL with methanol. The mixture is shaken for 10 min and then centrifuged. The supernatant is used as reference solution.
Reference solution R1 (limit test): 1 mL of Reference solution R is transferred to a 20 mL volumetric flask and the volume is made up to 20 mL with methanol. 1 mL of the diluted solution (1:20) is transferred to a volumetric flask and the volume is made up to 25 mL with methanol.
Reference solution R2 (A. sinensis root 100%): 1.0 g of A. sinensis milled plant material is transferred to a 5 mL volumetric flask and volume is made up to 5 mL with methanol. The mixture is shaken for 10 min and then centrifuged. The supernatant is used as Test solution.
Reference solution R3 (A. sinensis root 5%): 1 mL of reference solution R2 is added to a 20 mL volumetric flask and the volume is made up to 20 mL with methanol.
Reference solution R4 (A. acutiloba root 100%): 1.0 g of A. acutiloba milled plant material is transferred to a 5 mL volumetric flask and volume is made up to 5 mL with methanol. The mixture is shaken for 10 min and then centrifuged. The supernatant is used as Test solution.
Reference solution R5 (A. acutiloba root 5%): 1 mL of reference solution R4 is added to a 20 mL volumetric flask and the volume is made up to 20 mL with methanol.
3. Stationary phase
20x10 cm glass plates HPTLC silica gel 60 F254 (Merck).
4. Sample application
4 L of Test solution A, SST and Reference solutions R2-5; and 2 L of Test solution A1 and Reference solution R1 are applied as 8 mm bands, at least 2 mm apart, 8 mm from the lower edge and at least 15 mm from left and right edges of the plate.
5. Temperature and humidity
Record temperature and humidity in the laboratory.
6. Chromatography

D. A. Frommenwiler Chapter 4, Supplementary information
80
4
Chamber type: 20x10 cm Twin Trough Chamber Configuration: Place the filter paper into the rear trough of the chamber and
wet it with 25 mL of developing solvent. Place 10 mL of developing solvent in the front trough and close the lid. Saturate the chamber for 20 min
Humidity control: Condition the plate to 33% rH (saturated MgCl2 solution) Developing solvent: Toluene, ethyl acetate, acetic acid (90:10:1 v/v/v), Developing distance: 70 mm from lower edge of plate Drying: 5 min with cold air 7. Derivatization Derivatization reagent: 10% sulfuric acid in methanol Preparation: Mix 20 mL of sulfuric acid with 180 mL of cold methanol Reagent use: Dip (time: 0; speed: 3) the plate into 10% sulfuric acid
reagent and heat at 100°C for 3 minutes. 8. Documentation 1) Clean plate at UV 254 nm and at white light RT 2) Developed plate at UV 254 nm 3) Developed plate at UV 366 nm 4) Derivatized plate at white light RT 5) Derivatized plate at UV 366 nm Evaluation 1 (Identity) Detection A: capture images under UV 254 nm and UV 366 nm (normalized on SST) Compare results with the images below:
UV 254 nm UV 366 nm
1 2 1 2
System suitability test SST (compare with Track 1):
Under UV 254 nm quenching zones due to the standards isoimperatorin and imperatorin are seen at RF ~ 0.44 and 0.33, respectively. A quenching zone with blue fluorescence due to the standard osthole is seen at RF ~ 0.38.
Under UV 366 nm two greenish blue fluorescent zones due to the standards isoimperatorin and imperatorin are seen at RF ~ 0.44 and 0.33, respectively. A blue fluorescent zone due to the standard osthole is seen at RF ~ 0.38.
Acceptance criteria
Under UV 254 nm the Reference solution R shows one intense quenching/blue fluorescence zone at RF ~ 0.27 (decursin plus decursinol angelate) and another quenching zone with blue fluorescence at RF ~ 0.15 (7-demethylsuberosine). Other faint quenching zones are seen below the position of 7-demethylsuberosine.
Under UV 366 nm the Reference solution R shows a faint blue fluorescent zone at the position of osthole (compare with Track 1). The most prominent zone of the chromatogram is due to decursin plus decursinol angelate (a blue fluorescent zone). A blue fluorescent
Track Sample 1 SST: isoimperatorin, osthole, imperatorin* 2 Angelica gigas (Reference solution R)
* decreasing RF values

D. A. Frommenwiler Chapter 4, Supplementary information
81
4
zone due to 7-demethylsuberosine is seen at RF ~ 0.15. Below this position and above the application position, several faint, blue fluorescent zones are seen (including the one at RF ~ 0.03 due to decursinol).
Additional evaluation
Compare to the provided images:
After derivatization, WRT After derivatization, UV 366 nm
1 2 1 2
Evaluation 2 (Purity)
Detection B1: capture images under UV 366 nm and normalize on the SST
Compare results with the images below:
1 2 3 4 5
SST Reference solution R2 and R4 (compare with Tracks 1 and 2, respectively):
Under UV 366 nm a light blue fluorescent zone is seen at RF ~ 0.58 due to Z-ligustilide in R2 and R4 (tracks 1 and 2). In the lower half of the chromatogram, a blue fluorescent zone at the same RF of decursin plus decursinol angelate and several bluish zones above the application position are seen in the Reference solution R4 (A. acutiloba).
Detection B2: normalize on reference solution R3 or R5
Compare results with the images below:
1 2 3 4 5
Track Sample 1 SST: isoimperatorin, osthole, imperatorin* 2 Angelica gigas (Reference solution R)
* decreasing RF values
Track Sample 1 R2 A. sinensis 100% 2 R4 A. acutiloba 100% 3 R3 A. sinensis 5% 4 R5 A. acutiloba 5% 5 Angelica gigas (Reference solution R)
Track Sample 1 R2 A. sinensis 100% 2 R4 A. acutiloba 100% 3 R3 A. sinensis 5% 4 R5 A. acutiloba 5% 5 Angelica gigas (Reference solution R)

D. A. Frommenwiler Chapter 4, Supplementary information
82
4
SST Reference solution R3 and R5 (compare with Tracks 3 and 4, respectively):
Under UV 366 nm a very faint blue fluorescent zone is seen at RF ~ 0.58 due to Z-ligustilide.
Acceptance criteria
No blue fluorescent zone due to Z-ligustilide is seen on Reference solution R (compare with track 5).
Evaluation 3 (Strength/minimum content)
Detection C1: capture images under UV 366 nm and normalize over Reference solution R1
Compare results with the images below:
1 2
SST Reference solution R1 (compare with Track 1):
Under UV 366 nm a faint blue fluorescent zone is seen in R1 at RF ~ 0.27 in the Reference solution R due to decursin plus decursinol angelate.
Acceptance criteria
Under UV 366 nm the Test solution A1 (compare with Track 2) shows a faint a blue fluorescent zone at RF ~ 0.27 due to decursin plus decursinol angelate. The intensity of this zone is not less than that obtained with Reference solution R1 (compare with Track 1).
Detection C2: images under UV 366 nm converted into profiles
Convert electronic images of the fingerprints under UV 366 nm (prior to derivatization) into profiles by calculating the luminance as function of RF. Adjust the integration ranges to fit the zone due to decursin plus decursinol. Rotate profile 90° so that the peak is seen from its front. Compare the height of the peak in the Test solution A1 (track 2, Detection C1) to that of the reference solution R1 (track 1, Detection C).
1 2
Track Sample 1 Reference solution R1 A. gigas RMPM prepared to
contain 3.0% of decursin plus decursinol angelate 2 Test solution A1 A. gigas diluted 1:500
Track Sample 1 Reference solution R1 A. gigas RMPM prepared to
contain 3.0% of decursin plus decursinol angelate 2 Test solution A1 A. gigas diluted 1:500

D. A. Frommenwiler Chapter 4, Supplementary information
83
4
Acceptance criteria
The peak height of decursin plus decursinol angelate recorded for Test solution A1 (green bar) is equal to or greater than that recorded for Reference solution R1 (red bar).
Evaluation 4 (Strength/minimum content, Optional)
Detection D: Densitometry at 330 nm/K > 400
Scan the tracks corresponding to Test solution A1 (track 2, Detection C1) and Reference solution R1 (track 1, Detection C1) from 5.0 mm to 40.0 mm, and record the peak area.
1 2
Acceptance criteria
The peak area of decursin plus decursinol angelate recorded for Test solution A1 is equal to or greater than that recorded for Reference solution R1.
Track Sample 1 Reference solution R1 A. gigas RMPM prepared
to contain 3.0% of decursin plus decursinol angelate
2 Test solution A1 A. gigas diluted 1:500


Chapter 5: Comprehensive HPTLC fingerprinting as a tool for a simplified analysis of purity of ginkgo products

Article published in Journal of Ethnopharmacology 243 (2019) 112084; DOI: 10.1016/j.jep.2019.112084. For reasons of copyright, a copy of the published article was not included. Instead, the manuscript accepted by this journal was adapted to the format of this thesis and included here.

D. A. Frommenwiler Chapter 5
87
5
Resum
Anàlisi integral de l’empremta dactilar per HPTLC com a eina per a una anàlisi
simplificada de la puresa dels productes de ginkgo
Rellevància etnofarmacològica: Els medicaments a base de plantes amb extracte sec refinat de fulla de ginkgo (GBE) són un desenvolupament europeu a partir de Ginkgo biloba L., espècie utilitzada tradicionalment a l’Àsia Oriental. Avui en dia, els productes de ginkgo han augmentat la presència al mercat, principalment com a complements alimentosos. La seva adulteració amb rutina i quercetina o extractes vegetals rics en aquests compostos és una pràctica habitual. Cal fer assajos que inclouen valoracions i detecció d'adulterants, a més d'altres mètodes (per exemple, proves d'identificació). Això pot augmentar els costos de l’avaluació de la qualitat dels productes de ginkgo.
Objectiu de l'estudi: Demostrar que l’anàlisi integral de l’empremta dactilar per HPTLC (Comprehensive HPTLC fingerprinting) pot proporcionar informació més enllà de la identificació de productes ginkgo, evitant anàlisis cromatogràfiques addicionals per a la detecció d'adulteracions.
Materials i mètodes: La informació continguda en l’empremta dactilar obtinguda per l’anàlisi de flavonoides per HPTLC es va utilitzar per a la identificació i per a la detecció d’adulterants, així com per verificar els límits de rutina i quercetina, que normalment es determinen per HPLC i s’utilitzen per a la detecció d’adulterants. Per a aquest propòsit, es van generar perfils de pics a partir d’imatges de cromatograma obtinguts per HPTLC. Els mètodes HPLC de la United States Pharmacopea (USP) es van utilitzar per quantificar el total de flavonoides i assajar els límits de rutina i quercetina. Les dades HPLC es van utilitzar per donar suport a la validesa del mètode HPTLC. Es va desenvolupar un mètode HPTLC en fase inversa addicional com a possible mètode de confirmació per a la prova de límit de quercetina.
Resultats: El mètode HPTLC proposat utilitza una seqüència particular de deteccions, donant lloc a un nombre d'imatges, que s'interpretaran posteriorment en un determinat ordre. És capaç d’identificar productes de ginkgo, de detectar adulterants (rutina, quercetina, fruits i botons florals de sòfora, i blat sarraí) i, mitjançant perfils de pics generats a partir d’imatges del cromatograma abans i després de la derivatització, d’avaluar els límits de la rutina i la quercetina. Quaranta vuit de cinquanta-nou suplements dietètics de ginkgo analitzats contenien un o més adulterants. A més, els resultats de les assajos límit de rutina i quercetina realitzats per HPTLC i HPLC van coincidir en el 98% dels casos. Finalment, per ajudar l’analista a avaluar si les mostres tenen la identitat correcta i si contenen o no adulterants, s’inclou un arbre de decisions que mostra la seqüència d’interpretació de les empremtes dactilars obtingudes amb les diferents deteccions després d’una sola anàlisi per HPTLC.
Conclusió: Una única anàlisi per HPTLC és capaç de proporcionar informació sobre la identitat i la puresa dels productes. Això simplifica el flux de treball analític i redueix el nombre d’anàlisis prescrites a la monografia d’extracte sec de ginkgo de la USP.

D. A. Frommenwiler Chapter 5
88
5
Resumen
Análisis integral de la huella dactilar por HPTLC como herramienta para un análisis simplificado de la pureza de los productos de ginkgo
Relevancia etnofarmacológica: Los medicamentos a base de plantas con extracto seco refinado de hoja de ginkgo (GBE) son un desarrollo europeo a partir de Ginkgo biloba L., especie utilizada tradicionalmente en Asia Oriental. Hoy en día, los productos de ginkgo han aumentado la presencia en el mercado, principalmente como complementos alimenticios. Su adulteración con rutina y quercetina o extractos vegetales ricos en estos compuestos es una práctica habitual. Es necesario hacer ensayos que incluyen valoraciones y detección de adulterantes, además de otros métodos (por ejemplo, pruebas de identificación). Esto puede aumentar los costes de la evaluación de la calidad de los productos de ginkgo.
Objetivo del estudio: Demostrar que el análisis integral de la huella dactilar por HPTLC (Comprehensive HPTLC fingerprinting) puede proporcionar información más allá de la identificación de productos ginkgo, evitando pruebas cromatográficas adicionales para la detección de adulteraciones.
Materiales y métodos: La información contenida en la huella dactilar obtenida por el análisis de flavonoides por HPTLC se utilizó para la identificación y para la detección de adulterantes, así como para verificar los límites de rutina y quercetina, que normalmente se determinan por HPLC y se utilizan para la detección de adulterantes. Para este propósito, se generaron perfiles de picos a partir de imágenes de cromatogramas obtenidos por HPTLC. Los métodos HPLC de la United States Pharmacopea (USP) se utilizaron para cuantificar el total de flavonoides y ensayar los límites de rutina y quercetina. Los datos HPLC se utilizaron para apoyar la validez del método HPTLC. Se desarrolló un método HPTLC en fase inversa adicional como posible método de confirmación para la prueba de límite de quercetina.
Resultados: El método HPTLC propuesto utiliza una secuencia particular de detecciones, dando lugar a un número de imágenes, que se interpretarán posteriormente en un determinado orden. Es capaz de identificar productos de ginkgo, de detectar adulterantes (rutina, quercetina, frutos y botones florales de sófora, y trigo sarraceno) y, mediante perfiles de picos generados a partir de imágenes del cromatograma antes y después de la derivatización, de evaluar los límites de la rutina y la quercetina. Cuarenta y ocho de cincuenta y nueve suplementos dietéticos de ginkgo analizados contenían uno o más adulterantes. Además, los resultados de los ensayos límite de rutina y quercetina realizados por HPTLC y HPLC coincidieron en el 98% de los casos. Finalmente, para ayudar al analista evaluar si las muestras tienen la identidad correcta y si contienen o no adulterantes, se incluye un árbol de decisiones que muestra la secuencia de interpretación de las huellas dactilares obtenidas con las diferentes detecciones después de un solo análisis por HPTLC.
Conclusión: Un único análisis por HPTLC es capaz de proporcionar información sobre la identidad y la pureza de los productos. Esto simplifica el flujo de trabajo analítico y reduce el número de análisis prescritos en la monografía de extracto seco de ginkgo de la USP.

D. A. Frommenwiler Chapter 5
89
5
Comprehensive HPTLC fingerprinting as a tool for a simplified analysis of purity of ginkgo products
5.1 Abstract Ethnopharmacological relevance: Herbal medicinal products based on ginkgo leaf refined dry extract (GBE) are European development from the Eastern Asia traditionally used species Ginkgo biloba L. Nowadays, ginkgo products have increased the presence in the market, mainly as dietary supplements. Its adulteration with rutin and quercetin or herbal extracts rich in these compounds is a common practice. Tests featuring assays and detection of adulterants need to be performed on top of other existent methods (e.g. identification test). This may increase the costs of evaluating the quality of ginkgo products.
Aim of the study: To prove that comprehensive HPTLC fingerprinting can provide information beyond identification of ginkgo products, avoiding additional chromatographic tests for detection of adulterations.
Materials and methods: The information contained in the fingerprint obtained by HPTLC analysis of flavonoids was used for identification and for detection of adulterants, as well as to verify the limits of rutin and quercetin, which are normally determined by HPLC and used for detection of adulterants. For this purpose, peak profiles were generated from HPTLC chromatogram images. USP-HPLC methods were used for quantification of total flavonoids and testing the limits of rutin and quercetin. HPLC data were used to support the validity of the HPTLC method. An additional reversed phase HPTLC method was developed as a possible confirmatory method for the quercetin limit test.
Results: The proposed HPTLC method uses a particular sequence of detections, resulting in a number of images, which are later interpreted in a certain order. It is able to identify ginkgo products, to detect adulterants (rutin, quercetin, sophora fruit and flower bud, and buckwheat), and, using peak profiles generated from the chromatogram images prior to and after derivatisation, to evaluate the limits of rutin and quercetin. Forty-eight out of fifty-nine ginkgo dietary supplements analysed contained one or more adulterants. Furthermore, results of the HPTLC and HPLC limit tests for rutin and quercetin were in

D. A. Frommenwiler Chapter 5
90
5
agreement in 98% of the cases. Finally, a decision tree showing the sequence of interpretation of the fingerprints obtained with the different detections after a single HPTLC analysis is included to help the analyst to evaluate whether samples have the correct identity and whether they contain or not adulterants.
Conclusion: A single HPTLC analysis is able to provide information on identity and purity of the products. This simplifies the analytical workflow and reduces the number of analyses prescribed in the USP powdered ginkgo extract monograph.
5.2 Introduction Ginkgo (Ginkgo biloba L.), considered a sacred tree in the Eastern Asia, is traditionally associated with longevity. The earliest known medicinal use of ginkgo dates back to 2800 BC and it is described for the pseudofruits, which are more frequently used than leaves in Eastern Asia. However, based on some not very well documented uses in traditional Chinese medicine (TCM), a German company developed a medicinal product from leaves for cognitive impairment in dementia. The active ingredient is a ‘special’ extract – extract G. biloba (EGb) 761 obtained by a water-acetone extraction and subsequent purification (Heinrich, 2010, Drieu and Jaggy, 2000). This ginkgo leaf refined dry extract (GBE), which uses 50 kg of leaf to yield 1 kg of extract, is standardized to contain 22-27% of flavonol glycosides and 5.4-6.6% of terpene lactones (EDQM, 2018), and it is accepted for the improvement of age-associated cognitive impairment and of quality of life in mild dementia (European Medicines Agency, 2015). EGB products (with EGb 761 and other similar refined extracts), that nowadays are in the market either as medicinal products or as dietary supplements, are in high demand. The global trade of gingko leaf extracts has registered a consistent growth in the last years. However, to produce such extract, about 19 steps are involved with costs estimated at $200-250/Kg (Gafner, 2018, Czigle et al., 2018).
Because of the complexity and high cost of the manufacturing process, adulteration of ginkgo products (GP) has become an important problem in poorly regulated markets. Booker et al (2016) evaluated the quality of GP sold as food supplements in the UK, revealing that the majority of the samples (32 out of 35) showed a HPTLC fingerprint different from that described in the European Pharmacopoeia and US Pharmacopoeia. It was hypothesized they were adulterated with rutin, quercetin, and other botanical materials. One sample was found to contain only 5-hydroxytryptophan.
According to Gafner (2018), industry experts agree that adulteration of GP often stems from economic considerations. Several publications report the addition of flavonol aglycones quercetin and/or kaempferol and/or the flavonol glycoside rutin to ginkgo products. Such practice is performed to ensure that those products, containing less extract, will have higher levels of total flavonoids after hydrolysis (22-27%) and thus comply with the HPLC assay specifications of the Pharmacopoeias (The United States Pharmacopoeia (USP), 2016b). The assay is based on the hydrolysis of the glycosides and the quantification of the resulting aglycones. Consequently, other botanical material, rich in glycosides of the same flavonol aglycones have also been reported as adulterants. They are sophora fruit and flower bud (Styphnolobium japonicum (L.) Schott, syn: Sophora japonicum L.) and buckwheat herb (Fagopyrum sp Moench) (Avula et al., 2015; Chandra et al., 2011; Franz et al., 2011; He and Roller, 2011; Lopez-Gutierrez et al., 2016; Ma et al., 2016; Tawab et al., 2010; Wohlmuth et al., 2014; Yang et al., 2016, Gafner, 2018).
Due to the lack of specificity to detect adulterants of the flavonoid-based assays, several publications propose additional methods, using different chromatographic techniques and detections (López-Guitiérrez et al., 2016, van Beek and Montoro, 2009). Since 2015, the United States Pharmacopoeia (USP) introduced an additional HPLC limit test for rutin and quercetin to the ginkgo extract monograph (The United States Pharmacopoeia (USP), 2016b). As acceptance criteria, the test solution (prior to hydrolysis) should not contain more than 4% of rutin and 0.5% of quercetin. As both substances have very different

D. A. Frommenwiler Chapter 5
91
5
polarities, a gradient elution system over 1 hour is needed. To perform all tests for identity, purity, and strength according to USP, five different analyses (including HPTLC and HPLC) featuring five different sample preparations, to analyse three classes of compounds are required. However, if identification is performed by HPTLC based on the “comprehensive HPTLC fingerprinting” concept (Frommenwiler et al., 2018), more information can be obtained in a single analysis, and so avoid one HPLC test for purity.
In this paper we aim at further developing and illustrating how HPTLC fingerprints generated primarily for identification, can deliver additional information regarding the presence of adulterants and specifically on the content of rutin and quercetin in ginkgo products. For detection of adulterants, different derivatisation steps and detection modes are considered. Additionally, quantitative information of the profiles generated from the images are used to verify compliance with the limit test for rutin and quercetin. The generated data are compared to those obtained by HPLC. A decision-tree detailing how best to perform comprehensive HPTLC fingerprinting for identification and detection of adulterations in gingko products is proposed.
5.3 Experimental
5.3.1 Samples and reference substances
Fifty-nine products of Ginkgo, including tablets, capsules, and soft gel capsules (GP1-PG59), sold as food supplements or medicines were used in the present work. They declared to contain either refined extracts (22-27% of flavonol glycosides), extracts with either DER 50:1 or no additional information, powdered leaf, extract and leaf, extract and rutin, or extract and green buckwheat. A detailed description of the samples is presented in the supplementary information, Table 5S1.
Ginkgo leaf reference extracts (GBE) were obtained from Sigma/HWI (Darmstadt, Germany) and Dr. Willmar Schwabe (Karlsruhe, Germany). A sample of ginkgo leaf (GBL) was provided by the American Herbal Products Association (AHPA, Silver Spring, MD, USA). Botanical reference material of sophora fruit and flower bud were obtained from American Herbal Pharmacopoeia (AHP, Scotts Valley, USA). Buckwheat herb (batch 155239) was obtained from Chrüterhüsli (Basel, Switzerland). The standards genistein (99%), quercetin (99.5%) and rutin (91.3%) were obtained from USP (Rockville, USA). Kaempferol (97%) was obtained from Sigma (Darmstadt, Germany) and USP. Isorhamnetin (99%) from Extrasynthese (Genay, France) and USP.
5.3.2 Reagents and solvents
Polyethylene glycol 400 (99.5%), 2-aminoethyldiphenylborinate (96.5%), acetic acid (99.5%), toluene (≥99%), acetone (pure), dichloromethane (HPLC grade), sodium acetate anhydrous (99.5%) and acetic anhydride (98.5%) were purchased from Merck (Darmstadt, Germany). Methanol (HPLC grade) and ortho-phosphoric acid (85%) were purchased from Carl Roth GmbH (Karlsruhe, Germany). Acetonitrile (HPLC grade), ethyl acetate (99.5%), formic acid (≥98%), tetrahydrofuran (extra pure) and p-anisaldehyde (≥99%) were purchased from Acros (New Jersey, USA). Ethanol (99.9%) was purchased from Alcosuisse (Bern, Switzerland). Deionized water was generated in-house. For the HPLC analysis, methanol, acetonitrile (both HPLC gradient grade) and hydrochloric acid (37%) were purchased from Fisher Scientific (Hamptom, USA). Phosphoric acid (≥85%) was obtained from Honeywell (New Jersey, USA), and formic acid (98-100%) from Scharlau (Barcelona, Spain).
5.3.3 Instruments
A CAMAG HPTLC system controlled by visionCATS software and including Visualizer, Automatic TLC Sampler 4, Automatic Developing Chamber 2, TLC Plate Heater III and Chromatogram Immersion device was used.

D. A. Frommenwiler Chapter 5
92
5
For the HPLC analysis, a Shimadzu instrument of the UFLC series including auto sampler SIL-20AC HT, pumps LC-20AD, degasser DGU-20As, column oven CTO-20A, diode array detector SPD-M20A, and communication bus module CBM-20A was used. The software was LC Solutions (Shimadzu Corporation) version 1.23 SP1. The column used was a Phenomenex Gemini® NX C18 (100 Å, 5 μm, 4.6 mm × 250 mm).
5.3.4 High performance thin layer chromatography (HPTLC)
HPTLC parameters for plate layout, sample application, conditioning of the plate, plate development and visualization were in agreement with the USP general Chapter <203> (The United States Pharmacopoeia (USP), 2017). The quality of the chromatography was verified based on the position of two or three standards, used as system suitability test (SST). The image’s background normalization was adjusted over the SST.
5.3.4.1 Standard solutions
Solutions of rutin, chlorogenic acid, and quercetin were prepared at concentration of 0.2 mg/mL in methanol for the SST. For the limit test of rutin, the standard solution was prepared at 0.4 mg/mL of rutin in methanol. For the quercetin limit test based on a reference extract (Sigma/HWI GBE was used in this case), the weight of extract was adjusted to yield a solution (in methanol) representing 0.5% of quercetin in the extract. For the limit test of quercetin on reversed phase, the standard solution was prepared at 0.05 mg/mL of quercetin in methanol.
5.3.4.2 Test solutions
Sample of gingko leaf and products containing leaf were prepared according to the USP Ginkgo monograph (The United States Pharmacopoeia (USP), 2016a). Products containing ginkgo extract (capsules, soft gel capsules and tablets) were prepared to contain 10 mg of extract per mL of methanol, sonicated for 10 minutes at room temperature and centrifuged for 5 minutes at 5000 rpm. Products containing leaf plus extract were processed as leaf, taking in account the labelled content of extract and the drug-extract ratio, which were used to calculate its equivalence as leaf.
5.3.4.3 Chromatography
The HPTLC method used for evaluating the samples was based on the USP ginkgo and powdered ginkgo extract monographs (The United States Pharmacopoeia (USP), 2016a and 2016b). The parameters for application volume, detection and derivatisation methods were optimized (see parameters described under HPTLC ID method in Table 5.1). A confirmatory additional method for the limit of quercetin was developed using a reversed phase plate (parameters are also described in Table 5.1).
Table 5.1 Parameters for the two HPTLC methods used in the present work.
Parameters ID method Limit of quercetin (reversed
phase)
Stationary phase 20x10cm plates Si 60 F254 (Merck)
20x10cm plates Si 60 RP-18 W (Merck)
SST 0.2 mg/mL of rutin, quercetin and chlorogenic acid
0.2 mg/mL of rutin and quercetin
Preparation of standards for limit test
0.4 mg/mL (rutin, limit test) 0.05 mg/mL (quercetin, limit test)
Application volume 3 μL of test and standards solutions 3 μL of test and standards solutions
Developing solvent Ethyl acetate, acetic acid, formic acid, water (100:11:11:26 V/V/V/V)
ACNa, THFb and 0.5%H3PO4 aqueous solution (10:40:50 V/V/V)
Development 20 min saturation, 10 min conditioning at 33% relative
20 min saturation, 10 min conditioning at 33% relative humidity

D. A. Frommenwiler Chapter 5
93
5
humidity (with MgCl2), 70 mm distance from lower edge, room
temperature = 23-27 ⁰C
(with MgCl2), 70 mm distance from lower edge, room temperature = 23-
27 ⁰C
Documentation prior to derivatization
UV 254 nm, UV 366 nm Not applicable
Derivatization 1 Plates were heated at 100 ⁰C for 3 min and derivatised by dipping
(speed: 3, time: 0) in NP reagent and then in PEG reagent
Plates were heated at 100 ⁰C for 3 min and derivatised by dipping
(speed: 3, time: 0) in NP reagent and then in PEG reagent
Derivatization 2 Plates were heated at 100 ⁰C for 3 min and derivatised by dipping
(speed: 3, time: 0) in NP reagent Not applicable
Documentation after derivatization 1 or 2
UV 366 nm UV 366 nm
Derivatization 3 Plates were dipped (speed: 3, time: 0) in p-anisaldehyde reagent and
heated at 100 ⁰C for 3 min Not applicable
Documentation after derivatization 3
White light Not applicable
aACN: acetonitrile; bTHF: tetrahydrofuran;
5.3.4.4 Derivatisation reagents
Natural products reagent (NP) was prepared dissolving 1 g of 2-aminoethyl diphenylborinate in 200 mL of ethyl acetate. As a polyethylene glycol reagent (PEG) a dissolution of 10 g of polyethylene glycol 400 in 200 mL of dichloromethane was used. Finally, the anisaldehyde reagent was obtained dissolving 1 mL of p-anisaldehyde in 200 mL of a mixture of methanol, acetic acid and sulphuric acid (170:20:10 V/V/V).
5.3.4.5 Generation of peak profiles from chromatogram images
Where necessary, the visionCATS software was used to generate peak profiles from fingerprints by calculating the luminance as L = (1/3 R)+(1/3 G)+(1/3 B) from the average of red (R), green (G), and blue (B) pixels of each line of the track and then plotting it against the RF values (Frommenwiler et al., 20118).
5.3.4.6 Limit tests of rutin and quercetin
Peak profiles were used for performing the limit tests of rutin and quercetin. Detections under UV 254 nm prior to derivatisation (rutin) and under UV 366 nm after derivatisation with NP or NP plus PEG (quercetin) were used. Calculations were based on the peak heights at the position of rutin or quercetin in the samples and the standard solutions. Standard solutions at concentrations corresponding to the maximum limit accepted for rutin and quercetin according to USP powdered ginkgo extract monograph were used.
5.3.4.7 Validation of the limit test of rutin and quercetin using the HPTLC ID method
The analytical procedure presented in this research has been validated in order to confirm its reliability. Linearity was established for rutin, based on the peak area of the peak profile under UV 254 nm prior to derivatisation. Six data points in the range of 0.75–1.8 μg/application with 0.15 and 0.3 μg intervals were used. The correlation coefficient (R2) was 0.999050 and the coefficient of variation (CV) was 0.88%. For quercetin, an extract was used to build the calibration curve. The peak heights of the peak profile under UV 366 nm after derivatisation were used. Linearity of the zone at the position of quercetin was established using six data points in the range of 0.06– 0.21 μg/application of quercetin with 0.03 μg intervals, using GB reference extract with known content of quercetin (0.297%). The correlation coefficient (R2) was 0.999223 and the coefficient of variation (CV) was

D. A. Frommenwiler Chapter 5
94
5
1.51%. For intraday and interday precision, one GB reference extract was prepared 4 times (each day), and solutions were analysed twice (2 plates per day). The absolute area of the peak at the position of rutin (under UV 254 nm prior after derivatization) and absolute height of the peak at the position of quercetin (under UV 366 nm prior to derivatization) in GB extract was used for the precision test. The intraday CV% was 2.08 for rutin and 0.89 for quercetin. The interday CV% was 3.48 for rutin and 2.65 for quercetin.
5.3.5 High performance liquid chromatography (HPLC)
The HPLC assay of total flavonoids was performed according to the USP powdered ginkgo extract monograph (The United States Pharmacopoeia (USP), 2016b) with all samples that declare to contain GBE. Samples that contain leaf were analysed according to its specific monograph. For tablets and capsules, an initial weight equivalent to 300 mg of extract was used. Additionally, the specific tests (limit of rutin and quercetin) according to USP powdered ginkgo extract monograph were applied for products containing refined extracts or other extracts. For products containing ginkgo leaf or mixtures of extracts with ginkgo leaf, rutin or buckwheat, this limit test was not performed. For tablets and capsules, an initial weight equivalent to 100 mg of extract was used. For both, assay and limit tests, each sample was prepared and analysed in duplicate.
5.4 Results and discussion In the current study, thirty-five ginkgo products obtained in the UK and twenty-four other products from other countries were analysed particularly for their purity. In addition to the detection prescribed in the identification section of the monographs, other detections were used (UV 254 nm and 366 nm prior to derivatisation). Those multiple images, generated during the identification test, are available for each analysis. HPTLC fingerprints and results for identity and adulteration of all samples are presented in the supplementary information (Figure 5S1-4, Table 5S2). In a first set of experiments, fifty-nine samples of ginkgo products were evaluated with the HPTLC ID method. Their fingerprints were compared to the description of the monograph and to reference materials of ginkgo leaf and extract. Typical fingerprints are shown in Figure 5.1. It was observed that only eleven samples were compliant with the monograph description.
Under UV 254 nm prior to derivatisation (Figure 5.1), several products show intense quenching zones at the position of rutin (e.g. GP17), or at RFs 0.12 and/or 0.6 (e.g. GP4). The two latter zones are absent in ginkgo. Under UV 366 nm prior to derivatisation (Figure 5.1), red zones due to chlorophylls are seen in GBL. Additionally, GBL and GBE show a blue fluorescent zone at the position of chlorogenic acid, characteristic of ginkgo. Four products lacked this zone (e.g. GP4 and GP7) and other four products showed it, but fainter than GBL and GBE. Under UV 366 nm after derivatisation 1 (Figure 5.1), twenty products showed an intense yellow zone at the position of quercetin (e.g. GP4 and GP5) and sometimes faint zones in the rest of the fingerprint (e.g. GP17).
Eight products lacked zones characteristic of ginkgo and showed mainly a zone due to rutin (e.g. GP14). One sample contained only 5-hydroxy tryptophan (GP7) as shown previously. One sample (GP3) showed an additional blue zone between RFs 0.6 and 0.7. Sixteen samples showed additional green zones between RFs 0.2 and 0.3 (e.g. GP17, GP4 and GP3) most of the time combined with high levels of quercetin. Of the five samples labelled as containing ginkgo leaf, two yielded fingerprints similar to that of GBE, while three corresponded to GBL, but the zones were less pronounced.
Based on the identification results, it was concluded that many of the analysed products seemed to have quality problems, including adulteration. In addition, the intensity of some fingerprints was lower than expected. To confirm the hypothesis that some of the products had less extract than declared, their total flavonoids content was evaluated.

D. A. Frommenwiler Chapter 5
95
5
Figure 5.1 HPTLC fingerprints of reference standards, ginkgo leaf and extract, sophora fruit, sophora flower buds, buckwheat herb and different cases of adulterations of ginkgo products under different detection modes. Track 1: genistein; SST: system suitability test (rutin, chlorogenic acid, and quercetin with increasing RF values); GBE: ginkgo leaf refined dry extract; GBL: ginkgo leaf; SJfr: Sophora fruit; SJfl: Sophora flower bud; BWH: Buckwheat herb; GP: ginkgo product.
5.4.1 HPLC analysis of flavonoids in ginkgo products according to the USP
The content of flavonol glycosides was determined in fifty-three ginkgo products (GP). Five products were not analysed by HPLC due to limited amount of sample available. The per-centage of flavonoids was calculated from the content of the corresponding aglycones obtained after hydrolysis, which are quercetin (Q), kaempferol (K), and isorhamnetin (I). Acceptable contents of flavonoids, expressed as flavonol glycosides, were 22.0%-27.0% for the extract, and not less than 0.5% for the leaves. Furthermore, the peak area ratios of K/Q (required ≥ 0.7) and I/Q (required ≥ 0.1) were calculated for the products containing extract, as described in the USP powdered ginkgo extract monograph. Forty-four samples that declared to contain extract were also analysed for their content of rutin and quercetin, based on the method specified in the USP. Acceptable contents prior to hydrolysis were ≤ 4% for rutin and ≤ 0.5% for quercetin (see Table 5S3; supplementary information).
The investigated products fall into five categories according to their claims: refined extracts with declaration of total flavonoid content, refined extracts without declaration, mixture of extract and additional ingredient, other extracts, and products based on dried leaves.

D. A. Frommenwiler Chapter 5
96
5
Of the thirty-eight products containing refined extract with a declaration of flavonoid content, thirty-four were analysed for their flavonol glycosides content. Of those, twenty-seven contained the amount of flavonol glycosides declared on their labels and twenty-one complied with the K/Q and I/Q peak ratios. Six products had less than 22% of total flavonoids and one had more than 27%. Regarding the rutin and quercetin contents of those thirty-four products, four had more than 4% of rutin and twenty-two had more than 0.5% of quercetin. Thus, GP20, 36-43 and 59 were the only products of this group compliant with the USP specifications concerning HPTLC fingerprint, flavonol glycosides content by HPLC, K/Q and I/Q ratios and HPLC limit test of rutin and quercetin.
Eight of the nine products containing refined extract without declaring the flavonoid content were analysed. All of them had less than 22.0% of flavonol glycosides by HPLC. Of those, two had more than 4% of rutin and five had more than 0.5% of quercetin.
Of the five products that declared to contain extract mixed with other ingredients, four were analysed. They declared to contain either rutin, buckwheat, or ginkgo leaf. The products that contained additional rutin or buckwheat had more than 27.0% of flavonol glycosides, yet are compliant with their label claims.
Of the two products containing other type of extracts, both had less than 22.0% of flavonol glycosides as determined by HPLC. Finally, all five products declaring to contain ginkgo leaf complied with the total flavonoid content for the leaf (NLT than 0.5%).
In general, most of the products that were compliant with the total flavonoids assay had weak fingerprints by HPTLC and/or intense zones at the positions of quercetin or rutin and/or additional zones. To properly detect addition of rutin and/or quercetin, a supplementary HPLC test is required. Nevertheless, results of the HPTLC ID method pointed to quality issues in the same samples as the combined HPLC tests.
In this context, our goal was to evaluate, whether the HPTLC fingerprint, obtained with the ID method, can also be used as tool to determine the purity of ginkgo products by detecting the presence of adulterants.
5.4.2 HPTLC analysis of ginkgo products
In the next steps of the investigation, first a literature review was performed to identify possible adulterants. Then, their HPTLC fingerprints were compared with those of GBL and GBE. Thereafter, physical mixtures of GBL and adulterants were analysed. It was evaluated whether the HPTLC ID method is capable of distinguishing the adulterants from ginkgo and what their respective detection limits were in mixtures. Finally, the HPTLC ID method was evaluated for suitability to verify compliance with the USP HPLC limit tests for rutin and quercetin. In that step, different detection modes and derivatisation reagents were investigated.
Samples of sophora fruit and flower bud, and buckwheat were individually analysed using the HPTLC ID method and their fingerprints were compared to those of GBE extract and GBL (Figure 5.1).
Under UV 366 nm after derivatisation, sophora fruit featured several unique greenish zones in the lower half of the chromatogram, a yellow zone at the position of rutin and a faint greenish zone at the position of quercetin, kaempferol, and isorhamnetin. The fingerprint of sophora flower bud was comparatively rich in rutin and quercetin, and contained other flavonoids and phenolic compounds (faint zones). Its fingerprint pattern was somewhat similar to that of the GBE. Buckwheat also showed an intense zone at the position of rutin and another blue fluorescent zone between RFs 0.4 and 0.5. Other reddish and yellowish zones were observed in the upper half of the chromatogram. Other individual characteristics were observed under UV 254 nm for each sample.
For the investigation of admixtures, physical mixtures of 1, 3, 5, 10, 15, and 20% each of sophora fruit, sophora flower bud, and buckwheat powdered drugs with 99, 97, 95, 90, 85,

D. A. Frommenwiler Chapter 5
97
5
and 80% of ginkgo leaf were prepared.
5.4.3 Admixture of buckwheat herb (Fagopyrum sp.)
To visualise admixtures with buckwheat, different detection modes were evaluated. Under UV 366 nm prior to derivatisation (Figure 5S5), a faint reddish zone was seen in the middle of the chromatogram in the ginkgo leaf spiked with 15% buckwheat. This zone was absent in ginkgo leaf. One sample (GP9), which listed buckwheat as an ingredient, showed similar reddish zones. In this respect, the product cannot be considered as adulterated. Nevertheless, the same sample was found to contain sophora flower bud.
5.4.4 Admixture of sophora flower bud
When sophora flower bud was mixed with ginkgo leaf (Figure 5.2), the amounts of rutin and quercetin increased. However, with this method it was not possible to link these higher levels of rutin and quercetin to bulk chemicals or an herbal drug. In the absence of specific markers to detect the presence of sophora flower bud, alternative derivatisation 3 was introduced: following derivatisation with NP reagent and visualising the image under UV 366 nm, the plate was derivatised with anisaldehyde reagent and documented under white light. Because anisaldehyde reagent cannot be used subsequently to PEG reagent (used in derivatisation 1 of the ID method), that derivatisation reagent had to be eliminated (derivatization 2) (Table 5.1).
Figure 5.2 HPTLC fingerprints of physical mixtures of ginkgo leaf and sophora flower bud, and examples of adulterated products. GBL: ginkgo leaf, SJfl: sophora flower bud. Track 1: 100% SJfl, track 8: 100% GBL, tracks 2-8: mixtures of SJfl and GBL, tracks 9-10: products adulterated with SJfl.
Detection of flavonoids is not significantly altered by PEG (Figure 5S6). However, subsequent use of anisaldehyde instead provided an extra set of data without the need to repeat the chromatography.
The chromatogram of ginkgo leaf spiked with 5% of sophora flower bud showed two purple zones above and below the zone due to rutin, combined with an elevated amount of rutin. When the ginkgo products were tested with this detection, two samples (GP29 and 17) presented a pattern similar to that described above, indicating adulteration with sophora flower bud.

D. A. Frommenwiler Chapter 5
98
5
5.4.5 Admixture of sophora fruit
Avula et al. (2015) and Wohlmuth et al. (2014) stated that genistein is a chara-cteristic constituent of sophora fruit and can be used as a marker to detect adulteration with this drug. However, in the HPTLC ID method genistein migrated close to the solvent front and was barely detected after derivatisation under UV 366 nm (Figure 5.1). Under UV 254 nm prior to derivatisation, genistein was detectable (Figure 5.1) but co-eluted with quercetin.
In Figure 5.3, the fingerprint of ginkgo leaf containing 1% of sophora fruit after derivatisation, showed a green zone between RFs 0.1 and 0.2, which was absent in 100% ginkgo leaf. Under UV 254 nm prior to derivatisation one quenching zone between RFs 0.5 and 0.6 was seen in the sample spiked at 1%. A second zone between RFs 0.1 and 0.2 was observed in the sample spiked at 3%. The described zones are detected in 17 of the 59 products. Therefore, these three zones can be used to identify the presence of 1% or more of sophora fruit in mixtures with ginkgo leaf.
Figure 5.3 HPTLC fingerprints of the physical mixtures of ginkgo leaf and sophora fruit, and examples of adulterated products. Track 1: 100% SJfr, track 8: 100% GBL, tracks 2-8: mixtures of SJfr and GBL, tracks 9-25: products adulterated with SJfr.
5.4.6 Limit test for rutin
Forty-six products declaring to contain ginkgo extract, were investigated for compliance with the USP limit for rutin by the HPTLC ID method using a reference solution containing rutin standard at 0.4 mg/mL, equivalent to 4% of the extract weight. Percentage values of rutin were calculated. Results are shown in Figure 5.4 and Table 5S2. Eight samples (GP14, 17, 23, 26, 32, 45, 49 and 54) exceeded the 4% limit. Of those, samples GP14, 23, 32, 45 49 and 54 seemed to contain mainly rutin, because they showed only a yellow zone at the position of rutin and lacked other zones characteristic of ginkgo. Samples GP17 and 26 were found to be adulterated with sophora flower bud and fruit, and consequently showed an amount of rutin above the accepted level. One sample that contained mainly rutin (GP 30) complied with the limit test and had a low content of flavonol glycosides.
The HPTLC data were compared to those of HPLC. Results were in agreement regarding samples passing or failing the limit test. In six samples, the values from HPLC were considerably higher than those obtained by HPTLC. This was due to the limited dynamic range of the HPTLC detection resulting in saturation. Values below 4% were very similar

D. A. Frommenwiler Chapter 5
99
5
with both methods. Thus, the HPTLC ID method can substitute the HPLC method in the limit test for rutin prescribed in the USP powdered ginkgo extract monograph.
Figure 5.4 Comparison of the results of the limit test for rutin in relation to the refined extracts contained in the products, obtained by the HPTLC ID method and by HPLC. Dashed line: maximum content of rutin (4%) according to the USP powdered ginkgo extract monograph. * Not analysed by HPLC due to the limited amount of sample.
5.4.7 Limit test for quercetin
The compliance to the limit test for quercetin was also investigated in the forty-six products using the HPTLC ID method. A ginkgo extract from HWI with known quercetin content was prepared to contain 0.5% of quercetin in the solution. This solution representing the samples in which quercetin is co-eluting with other zones (Figure 5.1) was used instead of a standard solution of quercetin. After conversion of the image under UV 366 nm after derivatisation with NP into peak profiles, the height of the yellow/greenish peak at RF 0.9 (corresponding to Q/K/I and other zones) in the products was compared against that of the standard. Results are shown in Figure 5.5.
Of the investigated products, only eighteen complied with the limit test for quercetin. Of those, seven contained mainly rutin (GP 14, 23, 30, 32, 45, 49 and 54) and one was adulterated with sophora fruit (GP26). Only ten had a fingerprint similar to GBE (GP 20, 36-43 and 59) (Figures 5S1 and 5S2). This result was in agreement with the HPLC limit test for quercetin (Figure 5.5). One product (GP54), which was found to be compliant after HPTLC analysis, was, however, found to contain more than 0.5% of quercetin when analysed by HPLC. Nevertheless, this sample was not compliant with the rutin limit test, and would thus fail in quality control.
An additional reversed phase HPTLC method (Table 5.1), which improves the separation of quercetin from the other two aglycones, was used for confirmation of results of the limit test for quercetin in all samples (Figure 5S7). Peak profiles were generated from images under UV 366 nm obtained after derivatisation with NP and PEG reagents. The quercetin percentages were determined against a quercetin standard solution equivalent to 0.5% of the extract weight (Figure 5.6 and Table 5S2). Results were in accordance to those obtained by HPLC.
The data using HPLC and HPTLC ID methods for the quercetin limit were comparable in 98% of the cases, and when combined with the other data, the HPTLC results lead to the same conclusion as those obtained by HPLC. Thus, the HPTLC ID method can be used instead of the USP HPLC method for determining the limit of quercetin. Samples with borderline results by HPTLC may be evaluated with other methodologies (HPLC or reversed phase HPTLC) for confirmation.

D. A. Frommenwiler Chapter 5
100
5
Figure 5.5 Comparison of the quercetin zone intensity, expressed in AU, of forty-six ginkgo products containing refined extract with GBE representing 0.5% of quercetin.
Figure 5.6 Comparison of the results of the limit test for quercetin in relation to the refined extracts contained in the products, obtained by HPTLC reversed phase method and by HPLC. Dashed line: maximum content of quercetin (0.5%) according to the USP powdered ginkgo extract monograph. *Not analysed by HPLC due to the limited amount of sample.
5.4.8 HPTLC decision tree
For better understanding of the significance of the proposed HPTLC method for the routine quality control of ginkgo products a decision tree has been designed (Figure 5.7). It shows the sequence of interpretation of the fingerprints obtained with the different detections after a single HPTLC analysis. Thus, this decision tree can help the analyst to evaluate whether samples have the correct identity and whether they contain or not adulterants.

D. A. Frommenwiler Chapter 5
101
5
Figure 5.7 Decision-tree about how to best perform comprehensive HPTLC fingerprinting for identification and detection of adulterations in ginkgo products.
5.5 Conclusion This work provides a new pragmatic and cost-efficient approach to the quality control of ginkgo products, based on the “comprehensive HPTLC fingerprinting” concept. A single HPTLC analysis, carried out during identification, can also be used to detect adulteration with sophora fruit, sophora flower bud, buckwheat herb, quercetin, or rutin. Peak profiles generated from the images can be used to perform a limit test for quercetin and rutin without the need of an additional analysis if reference standards are applied at suitable levels. In this case HPTLC and HPLC data lead to the same conclusion. However, the HPTLC method cannot be considered valid for rutin or quercetin quantification purposes out of the limit test, which is only aimed to give a pass/fail decision.
Only eleven of the investigated fifty-nine GB products comply with specifications of the USP for identity, limits on rutin and quercetin, and content of total flavonoids. To the best of our knowledge, this is the largest study performed on commercial ginkgo products. Such a large percentage of poor quality and clearly adulterated products calls for quality control measures at earlier stages and throughout the value chains from the raw material to

D. A. Frommenwiler Chapter 5
102
5
finished products (Booker and Heinrich 2016). For legitimate companies wanting to produce good quality products, HPTLC is able to provide important information concerning raw material acquisition, product development, the control of intermediate processing steps and final product compliance. However, much of the poor quality appears to be either deliberate (such as in the case of adulteration) or arising through an insufficient understanding of the manufacturing processes. In this context HPTLC can be a valuable tool used to highlight poor practice within the industry, provide evidence to regulatory bodies and ultimately to disseminate a greater awareness of product differences to the general public.
Acknowledgments
The authors wish to thank Mr. Enric Gibert for the technical support with the HPLC analyses, Mr. Christian Goy for providing part of the samples, Mr. Sidney Sudberg (Alkemist Lab) for providing references samples, Dr. Maged Sharaf for proof reading the article. Some of the initial samples were purchased with funds provided by the BBC, UK as a part of their programme ‘Trust Me – I am a Doctor’. The authors are also grateful to the help of Fundación Maria Francisca de Roviralta and Generalitat de Catalunya for the acquisition of laboratory equipment for the University of Barcelona.
Author contributions
DAF did most of the experimental work with the collaboration of ER, SC and RV. MH and AB provided a big part of the samples. ER and SC supervised the work. DAF, ER and SC were responsible for writing the manuscript. All authors proof read manuscript and made contributions to the final version.
Conflict of interest
The authors declare no competing financial interests.
Supporting information
Figures 5S1 to 5S7 and Tables 5S1 to 5S3 are provided as supplementary information.
5.6 References Avula, B., Sagi, S., Gafner, S., Upton, R., Wang, Y.H., Wang, M., Khan, I.A., 2015. Identification of
Ginkgo biloba supplements adulteration using high performance thin layer chromatography and ultra high performance liquid chromatography-diode array detector-quadrupole time of flight-mass spectrometry. Anal. Bioanal. Chem., 407(25), 7733–7746. https://doi.org/10.1007/s00216-015-8938-1
Booker, A., Frommenwiler, D., Reich, E., Horsfield, S., Heinrich, M., 2016. Adulteration and poor quality of Ginkgo biloba supplements. J. Herbal Med., 6(2). https://doi.org/10.1016/j.hermed .2016.04.003
Booker, A., Heinrich, M., 2016. Value chains of botanicals and herbal medicinal products: a European perspective. HerbalGram, 112, 40–45.
Chandra, A., Li, Y., Rana, J., Persons, K., Hyun, C., Shen, S., Mulder, T., 2011. Qualitative categorization of supplement grade Ginkgo biloba leaf extracts for authenticity. J. Funct. Foods, 3(2), 107–114. https://doi.org/10.1016/j.jff.2011.03.004
Czigle, S., Tóth, J., Jedlinszki, N., Háznagy-Radnai, E., Csupor, D., Tekeľová, D., 2018. Ginkgo biloba Food Supplements on the European Market – Adulteration Patterns Revealed by Quality Control of Selected Samples. Planta Med., 84(6-07), 475–482. https://doi.org/10.1055/a-0581-5203
Drieu, K, Jaggy, H., 2000. History, development and constituents of EGb 761, in van Beek, T.A. (Ed.), Ginkgo biloba, Chapter 15. Harwood Academic Publishers, Amsterdam, pp. 267–277.
EDQM (European Directorate for the Quality of Medicines and Health Care), 2018. Monograph on Ginkgo dry extract, refined and quantified. European Pharmacopoeia. 9th Ed. Council of Europe, Strasbourg.
European Medicines Agency, 2015. European Union herbal monograph on Ginkgo biloba L., folium.

D. A. Frommenwiler Chapter 5
103
5
Document EMA/HMPC/321097/2012. European Medicines Agency, London. https://www.ema.europa.eu/documents/herbal-monograph/final-european-union-herbal-monograph-ginkgo-biloba-l-folium_en.pdf
Franz, C., Chizzola, R., Novak, J., Sponza, S. (2011). Botanical species being used for manufacturing plant food supplements (PFS) and related products in the EU member states and selected third countries. Food Funct., 2(12), 720–730. https://doi.org/10.1039/c1fo10130g
Frommenwiler, D. A., Kim, J., Yook, C.-S., Tran, T. T. T., Cañigueral, S., Reich, E., 2018. Comprehensive HPTLC Fingerprinting for Quality Control of an Herbal Drug – The Case of Angelica gigas Root. Planta Med., 84(6-07), 465–474. https://doi.org/10.1055/a-0575-4425
Gafner, S., 2018. Adulteration of Ginkgo biloba Leaf Extract. Botanical Adulterants Bulletin, January, 1–8.
He, K., Roller, M., 2011. The Use of Nuclear Magnetic Resonance Spectroscopy for the Identification of Biomarkers for Quality Control of Plant Extracts, in Dayan, N., Kromidas, L. (Eds.), Formulating, Packaging, and Marketing of Natural Cosmetic Products. Wiley, Hoboken, NJ, pp. 361–385.
Heinrich, M., 2010. Ethnopharmacology and Drug Discovery, in: Mander, L., Lui, H.-W., (Eds.), Comprehensive Natural Products II Chemistry and Biology, Chapter 3.12. Elsevier, Oxford, pp. 351-381.
López-Gutiérrez, N., Romero-González, R., Vidal, J.L. M., Frenich, A.G., 2016. Quality control evaluation of nutraceutical products from Ginkgo biloba using liquid chromatography coupled to high resolution mass spectrometry. J. Pharm. Biomed. Anal., 121, 151–160. https://doi.org/10.1016/j.jpba.2016.01.021
Ma, Y. C., Mani, A., Cai, Y., Thomson, J., Ma, J., Peudru, F., Chen, S., Luo, M., Zhang, J., Chapman, R.G., Shi, Z.T., 2016. An effective identification and quantification method for Ginkgo biloba flavonol glycosides with targeted evaluation of adulterated products. Phytomedicine, 23(4), 377–387. https://doi.org/10.1016/j.phymed.2016.02.003
Tawab, M., Krzywon, M., Schubert-Zsilavecz, M., 2010. Nahrungsergänzungsmittel mit Ginkgo unter der Lupe. Pharm. Ztg. 155(20),1994–1999
The United States Pharmacopoeia (USP), 2016a. Monograph for ginkgo, in United States Pharmacopoeia and National Formulary USP38–NF33. United States Pharmacopoeial Convention, Rockville, MD, USA, pp. 6668-6671.
The United States Pharmacopoeia (USP), 2016b. Monograph for powdered ginkgo extract, in United States Pharmacopoeia and National Formulary USP39–NF34. United States Pharmacopoeial Convention, Rockville, MD, USA, pp.6671-6674.
The United States Pharmacopoeia (USP), 2017. Chapter 203: High-Performance Thin-Layer Chromatography procedure for identification of articles of botanical origin, in United States Pharmacopoeia and National Formulary USP40–NF35. United States Pharmacopoeial Convention, Rockville, MD, USA, pp. 258–260.
van Beek, T.A., Montoro, P., 2009. Chemical analysis and quality control of Ginkgo biloba leaves, extracts, and phytopharmaceuticals. J. Chromatogr. A, 1216(11), 2002–2032. https://doi.org/10.1016/j.chroma.2009.01.013
Wohlmuth, H., Savage, K., Dowell, A., Mouatt, P., 2014. Adulteration of Ginkgo biloba products and a simple method to improve its detection. Phytomedicine, 21(6), 912–918. https://doi.org/10.1016/j.phymed.2014.01.010
Yang, J., Wang, A. Q., Li, X.J., Fan, X., Yin, S.S., Lan, K., 2016. A chemical profiling strategy for semi-quantitative analysis of flavonoids in Ginkgo extracts. J. Pharm. Biomed. Anal., 123, 147–154. https://doi.org/10.1016/j.jpba.2016.02.017.

D. A. Frommenwiler Chapter 5, Supplementary information
104
5
5.7 Supplementary Information Table 5S1 Description of the products analysed in this work, their dosage form and country of origin. GP: ginkgo product; GBE: refined ginkgo dry extract; GE: other types of ginkgo dry extract. DER: drug-extract ratio.
Sample N°
Description of products per dosage unit Dosageform
Country of origin
GP1 GBE 120 mg equivalent to 6000 mg of leaf. Standardised to contain 24% of flavone glycosides (28.8 mg) and 6% of terpene lactones (7.2 mg)
Tablet UK
GP2 GBE 120 mg equivalent to 6000 mg of leaf, 24% of flavone glycosides and 6% of terpene lactones
Tablet UK
GP3 GBE 5 mg (DER 50:1) and 250 mg of Ginkgo biloba leaf Tablet UK
GP4 GBE 120 mg. Standardised to contain 24% of flavone glycosides (28.8 mg) and 6% of ginkgolides plus bilobalide (7.2 mg)
Tablet UK
GP5 GBE, equivalent to 6000 mg of dried leaf. Contain 24% of flavone glycosides Tablet UK
GP6 GBE 100 mg. Contain 24 mg of flavone glycosides and 6 mg of terpene lactones
Tablet Denmark
GP7 GBE 600 mg, equivalent to 30.000 mg of leaf. Contain 24% of flavone glycosides (114 mg) and 6% of terpene lactones (36 mg).
Capsule UK
GP8 GBE 60 mg from leaf. Standardised to contain 24% of flavone glycosides (14.4 mg)
Tablet USA
GP9 GBE 100 mg. Contain 23 mg of flavone glycosides, 6 mg of terpene lactones, 300 mg of green buckwheat and 10 mg of Vitamin E
Tablet UK
GP10 GBE 120 mg (DER 50:1), providing 6000 mg Tablet UK
GP11 GBE 120 mg (DER 50:1) equivalent to 6000 mg of herb powder, providing 28.8 mg of flavone glycosides and 7.2 mg of terpene lactones
Tablet UK
GP12 GBE 60 mg. Standardized to contain 14.3 mg of flavone glycosides and 3.6 mg of terpene lactones
Capsule UK
GP13 GBE 120 mg (DER 50:1), providing 6000 mg Tablet UK
GP14 GBE 60 mg (DER 50:1), equivalent to 3000 mg of leaf. Contain 24% of flavone glycosides and 6% of terpene lactones
Tablet UK
GP15 GBE 120 mg (DER 50:1), providing 6000 mg Tablet UK
GP16 GBE 120 mg (DER 50:1), providing 6000 mg Tablet UK
GP17 GBE 100 mg, equivalent to 5000 mg Gingko biloba. Containing 24 mg of flavone glycosides and 6 mg of terpene lactones
Tablet UK
GP18 GBE 120 mg (DER 50:1), equivalent to 6000 mg Tablet UK
GP19 GBE 120 mg (DER 50:1) equivalent to 6000 mg of whole dried leaf Tablet UK
GP20 GBE 120 mg (LI 1370) from cultivated leaf. Contain 25% of flavone glycosides
Tablet Germany
GP21 GBE 120 mg (DER 50:1), equivalent to 6000 mg of leaf. Contain 28.8 mg of flavone glycosides and 7.2 mg of terpene lactones
Tablet UK
GP22 GBE 120 mg (DER 50:1), equivalent to 6000 mg of leaf. Contain 28.8 mg of flavone glycosides and 7.2 mg of ginkgolides A B & C and bilobalide
Tablet UK
GP23 GBE 120 mg from leaf. Standardized to contain 24% of flavone glycosides (28.8 mg) and 6% of terpene lactones (7.2 mg)
Capsule UK
GP24 GBE 60 mg from leaf. Standardized to contain 24% of flavone glycosides and 6% of terpene lactones and NMT 5% of ginkgolic acids
CapsuleUSA
GP25 GBE 8 mg, equivalent to 400 mg of herb powder. Contain 24% of flavone glycosides and 6% of terpene lactones
Capsule New Zealand
GP26 GBE 120 mg (DER 50:1) equivalent to 6000 mg of whole herb Capsule UK
GP27 GBE 60 mg from leaf. Contain 24% of flavone glycosides (14.4 mg) and 30 mg of Ginkgo biloba leaf powder
CapsuleUSA
GP28 Ginkgo biloba leaf powder 130 mg Capsule UK
GP29 GBE 120 mg, equivalent to 6000 mg of herb powder. Contain 24% of flavone glycosides and 6-7% of ginkgolides A B & C and bilobalide and 50 mg of rutin
Capsule UK

D. A. Frommenwiler Chapter 5, Supplementary information
105
5
Sample N°
Description of products per dosage unit Dosageform
Country of origin
GP30 GBE 200 mg (DER 50:1), equivalent to 10.000 mg of herb powder. Capsule UK
GP31 GBE 100 mg (DER 50:1), equivalent to 5000 mg of Ginkgo biloba powder. Contain 24% of flavone glycosides and 6% of terpene lactones
Soft gel capsule
UK
GP32 GBE 120 mg, equivalent to 6000 mg of whole Ginkgo biloba. Tablet Netherlands
GP33 GE 90 mg (DER 3-5:1) prepared from fresh leaf Tablet Switzerland
GP34 Ginkgo biloba leaf powder 180 mg Capsule UK
GP35 GBE 120 mg. Contain 24% of flavone glycosides (28.8 mg) and 6% of terpene lactones (7.2 mg)
Capsule USA
GP36 GBE 80 mg. Contain 17.6-21.6 mg of flavone glycosides and 4.0- 5.6 mg of terpene lactones.
Tablet Switzerland
GP37 Quantified and refined GBE 120 mg from leaf (DER 35-67:1). Contain 26.4-32.4 mg of flavonoid glycosides, 3.12-3.84 mg of bilobalide, 3.36-4.08 mg of ginkgolides A, B & C
Tablet Switzerland
GP38 Quantified and refined GBE 120 mg (DER 35-67:1). Contain 26.4-32.4 mg of flavonoid glycosides, 3.12-3.84 mg of bilobalide, 3.36-4.08 mg of ginkgolides A, B, C and NMT 5 ppm of ginkgolic acid
Tablet Switzerland
GP39 Quantified and refined GBE 120 mg (DER 35-67:1). Contain 26.4-32.4 mg of flavonoid glycosides and 6.48-7.92 mg terpene lactones
Tablet Switzerland
GP40 GBE 120 mg from leaf (DER 35-67:1). Contain 26.4-32.4 mg of flavonoid glycosides, 6.0-8.4 mg of terpene lactones, of which 3.12-3.84 mg of bilobalide, 3.36-4.08 mg of ginkgolides A, B & C
Tablet Germany
GP41 GBE 120 mg from leaf (DER 35-67:1). Contain 26.4-32.4 mg of flavonoid glycosides, 6.0-8.4 mg of terpene lactones, of which 3.12-3.84 mg of bilobalide, 3.36-4.08 mg of ginkgolides A, B & C
Tablet Germany
GP42 GBE 120 mg from leaf (DER 35-67:1; EGb 761). Contain 26.4-32.4 mg of flavonoid glycosides, 6.0-8.4 mg of terpene lactones, of which 3.12-3.84 mg of bilobalide, 3.36-4.08 mg of ginkgolides A, B and C
Tablet Germany
GP43 GBE 120 mg from leaf (DER 35-67:1). Contain 22-27% of flavonoid glycosides, 2.8-3.4% of ginkgolides A, B & C, 2.6-3.2% of bilobalide and NMT 5ppm of ginkgolic acids
Capsule Germany
GP44 GBE 100 mg (50:1). Contain 24.5 mg flavone glycosides, 6.5 mg ginkgolide terpene lactones
Capsule Germany
GP45 Standardized GBE (120 mg). Contain NLT 24% of flavonol glycosides and 6% of terpene lactones.
Capsule Serbian
GP46 Ginkgo biloba leaf 330 mg Tablet Spain
GP47 Ginkgo biloba leaf 180 mg Tablet Spain
GP48 GBE 40 mg (40-50:1). Contain 8.8-10.8 mg of flavone glycosides, 1.12-1.36 mg of Ginkgolide A, B & C, and 1.04-1.28 mg of bilobalide
Tablet Croatia
GP49 GBE 120 mg. Contain 24% of flavone glycosides (28.8 mg) and 6% terpene lactone (7.2 mg).
Capsule Netherlands
GP50 GBE 410 mg and leaf (amount not informed). Contain 24% of flavone glycosides.
Capsule Italy
GP51 GBE 60 mg. Contain 24% of flavone glycosides Soft gel capsule
Colombia
GP52 GBE 80 mg. Contain 24% of flavone glycosides and 6% of terpene lactones Soft gel capsule
Colombia
GP53 GBE 40 mg. Contain 24% of flavone glycosides (9.6 mg) Soft gel capsule
Colombia
GP54 GBE 80 mg. Contain 19.2 mg of flavone glycosides Capsule Colombia
GP55 GE 50 mg, equivalent to 500 mg of GBL Tablet Spain
GP56 Ginkgo biloba leaf, equivalent to 500 mg (200 mg of leaf and 40 mg of extract 7.5:1)
Tablet Spain
GP57 GBE 120 mg. Contain 24% of flavone glycosides (28 mg) Capsule USA
GP58 GBE 60 mg. Contain 24% of flavone glycosides (14.4 mg) Tablet USA
GP59 GBE 120 mg from leaf. Contain 24% of flavone glycosides (28.8 mg) Capsule USA

D. A. Frommenwiler Chapter 5, Supplementary information
106
5
Figure 5S1 HPTLC fingerprints of all ginkgo products under UV 254 nm prior to derivatization. SST: system suitability test (rutin, chlorogenic acid, and quercetin, increasing RF values).
Figure 5S2 HPTLC fingerprints of all ginkgo products under UV 366 nm prior to derivatization. SST: system suitability test (rutin, chlorogenic acid, and quercetin, increasing RF values).
Figure 5S3 HPTLC fingerprints of all ginkgo products under UV 366 nm after derivatisation 2 (NP reagent). SST: system suitability test (rutin, chlorogenic acid, and quercetin, increasing RF values).

D. A. Frommenwiler Chapter 5, Supplementary information
107
5
Figure 5S4 HPTLC fingerprints of all ginkgo products under UV 366 nm after derivatisation 1. SST: system suitability test (rutin, chlorogenic acid, and quercetin, increasing RF values).
Table 5S2 Table of results obtained by HPTLC regarding identity, purity, and percentages of rutin and quercetin, for all products. Products similar to that of reference ginkgo leaf or extract are indicated with green squares, and not similar with red circles. GBE: Refined ginkgo extract; GL: Ginkgo leaf (GBL); SJfr: Sophora fruit; SJfl: Sophora flower bud; BWH: Buckwheat herb; 5-HTTP: 5-hydroxytryptophan; n.a.: not applicable.
Sample N°
Similar to GBE or GBL
Contain SJfr
Contain SJfl
Contain BWH
5-HTP only
Intense zone at the
position of rutin or only
rutin
Rutin (%), by HPTLC ID method
Intense zone at the
position of quercetin
Quercetin (%), by HPTLC
reversed phase
method
GP1 ● x 0.69 x 3.74
GP2 ● x 1.92 x 3.11
GP3a ● x n.a. n.a.
GP4 ● x 1.95 x 3.80
GP5 ● 1.35 x 3.16
GP6 ● 1.72 x 2.24
GP7 ● x n.a. n.a.
GP8 ● 0.94 x 2.88
GP9b ● x x n.a. x n.a.
GP10 ● x 0.42 x 2.50
GP11 ● 1.49 x 1.99
GP12 ● 1.46 x 3.52
GP13 ● x 1.31 x 2.53
GP14 ● x 6.61 0.24
GP15 ● x 1.10 x 2.89
GP16 ● 0.45 x 2.55
GP17 ● x x 6.62 x 1.07
GP18 ● x 2.54 x 1.68
GP19 ● 0.43 x 2.89
GP20 ■ 2.20 0.16
GP21 ● 1.18 x 2.85
GP22 ● x 1.73 x 2.93
GP23 ● x 6.45 0.29
GP24 ● x 1.22 x 2.14
GP25 ● 2.86 x 1.80

D. A. Frommenwiler Chapter 5, Supplementary information
108
5
Sample N°
Similar to GBE or GBL
Contain SJfr
Contain SJfl
Contain BWH
5-HTP only
Intense zone at the
position of rutin or only
rutin
Rutin (%), by HPTLC ID method
Intense zone at the
position of quercetin
Quercetin (%), by HPTLC
reversed phase
method
GP26 ● x 5.47 0.35
GP27a ● n.a. x n.a.
GP28c ● n.a. x n.a.
GP29d ● x x n.a. x n.a.
GP30 ● Only rutin 1.75 0.00
GP31 ● 1.74 x 2.79
GP32 ● x 6.51 0.27
GP33e ■ 1.71 0.20
GP34c ● n.a. x n.a.
GP35 ● 1.41 x 2.79
GP36 ■ 2.84 0.09
GP37 ■ 1.96 0.05
GP38 ■ 2.11 0.04
GP39 ■ 2.63 0.12
GP40 ■ 2.79 0.31
GP41 ■ 2.73 0.16
GP42 ■ 2.89 0.29
GP43 ■ 1.93 0.09
GP44 ● x 1.37 x 2.60
GP45 ● x 6.91 0.01
GP46c ● n.a. n.a.
GP47c ● n.a. n.a.
GP48 ● 1.85 x 2.04
GP49 ● x 6.95 0.50
GP50a ● n.a. x n.a.
GP51 ● x 1.78 x 2.10
GP52 ● 0.49 x 2.32
GP53 ● x 2.73 x 2.05
GP54 ● x 6.23 0.66
GP55e ● x 1.66 x 4.44
GP56c ● n.a. n.a.
GP57 ● 2.82 x 2.15
GP58 ● 2.47 x 2.35
GP59 ■ 2.38 0.39
Total 11 16 2 1 1 9 --- 35 --- a Products that declare to contain mixture of refined ginkgo extract and ginkgo leaf; b Products that declare to contain mixture of refined ginkgo extract and green buckwheat; c Products that declare to contain ginkgo leaf; d Products that declare to contain mixture of refined ginkgo extract and rutin; e Products that declare to contain ginkgo extract other than GBE.
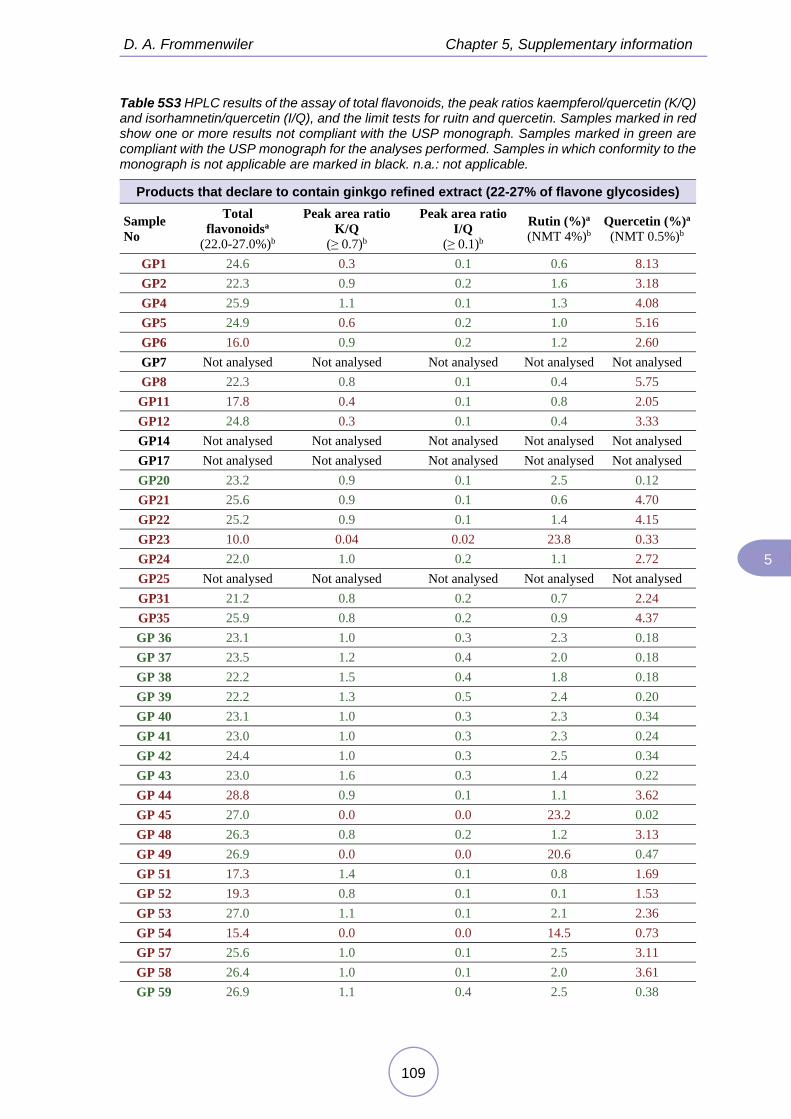
D. A. Frommenwiler Chapter 5, Supplementary information
109
5
Table 5S3 HPLC results of the assay of total flavonoids, the peak ratios kaempferol/quercetin (K/Q) and isorhamnetin/quercetin (I/Q), and the limit tests for ruitn and quercetin. Samples marked in red show one or more results not compliant with the USP monograph. Samples marked in green are compliant with the USP monograph for the analyses performed. Samples in which conformity to the monograph is not applicable are marked in black. n.a.: not applicable.
Products that declare to contain ginkgo refined extract (22-27% of flavone glycosides)
Sample No
Total flavonoidsa
(22.0-27.0%)b
Peak area ratio K/Q
(≥ 0.7)b
Peak area ratio I/Q
(≥ 0.1)b
Rutin (%)a (NMT 4%)b
Quercetin (%)a (NMT 0.5%)b
GP1 24.6 0.3 0.1 0.6 8.13
GP2 22.3 0.9 0.2 1.6 3.18
GP4 25.9 1.1 0.1 1.3 4.08
GP5 24.9 0.6 0.2 1.0 5.16
GP6 16.0 0.9 0.2 1.2 2.60
GP7 Not analysed Not analysed Not analysed Not analysed Not analysed
GP8 22.3 0.8 0.1 0.4 5.75
GP11 17.8 0.4 0.1 0.8 2.05
GP12 24.8 0.3 0.1 0.4 3.33
GP14 Not analysed Not analysed Not analysed Not analysed Not analysed
GP17 Not analysed Not analysed Not analysed Not analysed Not analysed
GP20 23.2 0.9 0.1 2.5 0.12
GP21 25.6 0.9 0.1 0.6 4.70
GP22 25.2 0.9 0.1 1.4 4.15
GP23 10.0 0.04 0.02 23.8 0.33
GP24 22.0 1.0 0.2 1.1 2.72
GP25 Not analysed Not analysed Not analysed Not analysed Not analysed
GP31 21.2 0.8 0.2 0.7 2.24
GP35 25.9 0.8 0.2 0.9 4.37
GP 36 23.1 1.0 0.3 2.3 0.18
GP 37 23.5 1.2 0.4 2.0 0.18
GP 38 22.2 1.5 0.4 1.8 0.18
GP 39 22.2 1.3 0.5 2.4 0.20
GP 40 23.1 1.0 0.3 2.3 0.34
GP 41 23.0 1.0 0.3 2.3 0.24
GP 42 24.4 1.0 0.3 2.5 0.34
GP 43 23.0 1.6 0.3 1.4 0.22
GP 44 28.8 0.9 0.1 1.1 3.62
GP 45 27.0 0.0 0.0 23.2 0.02
GP 48 26.3 0.8 0.2 1.2 3.13
GP 49 26.9 0.0 0.0 20.6 0.47
GP 51 17.3 1.4 0.1 0.8 1.69
GP 52 19.3 0.8 0.1 0.1 1.53
GP 53 27.0 1.1 0.1 2.1 2.36
GP 54 15.4 0.0 0.0 14.5 0.73
GP 57 25.6 1.0 0.1 2.5 3.11
GP 58 26.4 1.0 0.1 2.0 3.61
GP 59 26.9 1.1 0.4 2.5 0.38

D. A. Frommenwiler Chapter 5, Supplementary information
110
5
Products that declare to contain ginkgo dry extract with a DER of 50:1c
Sample No
Total flavonoidsa
(22.0-27.0%)b
Peak area ratio K/Q (≥ 0.7)b
Peak area ratio I/Q (≥ 0.1)b
Rutin (%)a (NMT 4%)b
Quercetin (%)a (NMT 0.5%)b
GP10 12.4 0.3 0.1 0.2 3.01
GP13 13.3 0.3 0.1 0.8 3.05
GP15 11.4 0.8 0.1 0.5 1.93
GP16 10.0 0.3 0.1 0.2 3.24
GP18 Not analysed Not analysed Not analysed Not analysed Not analysed
GP19 14.1 0.3 0.1 0.2 3.92
GP26 16.3 0.5 0.1 13.0 0.39
GP30 0.1 0.8 0.1 0.7 0.01
GP32 19.3 0.02 0.01 21.0 0.39
Products that declare to contain other types of ginkgo dry extract
Sample No
Total flavonoidsa (requirement
n.a.)
Peak area ratio K/Q
(requirement n.a.)
Peak area ratio I/Q
(requirement n.a.)
Rutin (%)a (requirement
n.a.)
Quercetin (%)a (requirement
n.a.)
GP33 2.9 1.4 0.4 0.2 0.00
GP55 16.3 0.4 0.1 0.5 3.44
Products that declare to contain ginkgo refined extract and additional rutin
Sample No
Total flavonoidsd (requirement
n.a.)
Peak area ratio K/Q
(requirement n.a.)
Peak area ratio I/Q
(requirement n.a.)
Rutin (%) (requirement
n.a.)
Quercetin (%) (requirement
n.a.)
GP29 37.3 0.2 0.1 n.a. n.a.
Products that declare to contain ginkgo refined extract and additional green buckwheat
Sample No
Total flavonoidse (requirement
n.a.)
Peak area ratio K/Q
(requirement n.a.)
Peak area ratio I/Q
(requirement n.a.)
Rutin (%) (requirement
n.a.)
Quercetin (%) (requirement
n.a.)
GP9 8.2 0.2 0.04 n.a. n.a.
Products that declare to contain mixture of ginkgo refined extract (declaring 22-27% of flavone glycosides or DER 50:1) and ginkgo leaf
Sample No
Total flavonoidsf
(requirement n.a.)
Peak area ratio K/Q
(requirement n.a.)
Peak area ratio I/Q
(requirement n.a.)
Rutin (%) (requirement
n.a.)
Quercetin (%) (requirement
n.a.)
GP3 15.1 0.8 0.1 n.a. n.a.
GP27 22.3 1.0 0.1 n.a. n.a.
GP50 Not analysed Not analysed Not analysed Not analysed Not analysed
Products that declare to contain ginkgo leaf
Sample No
Total flavonoidsg
(NLT 0.5%)h
Peak area ratio K/Q
(requirement n.a.)
Peak area ratio I/Q
(requirement n.a.)
Rutin (%) (requirement
n.a.)
Quercetin (%) (requirement
n.a.)
GP28 0.8 n.a. n.a. n.a. n.a.
GP34 0.6 n.a. n.a. n.a. n.a.
GP46 0.5 n.a. n.a. n.a. n.a.

D. A. Frommenwiler Chapter 5, Supplementary information
111
5
GP47 0.9 n.a. n.a. n.a. n.a.
GP56 0.5 n.a. n.a. n.a. n.a. a Results expressed in relation to the extract contained in the product. b Requirements of the USP monograph on Powdered Ginkgo Extract. c These extracts did not declare any content of flavonoids but a DER of 50:1, typical of the GBE. For this reason, were considered as GBE and thus, compliance to the requirements described in the USP monograph on Powdered Ginkgo Extract was assessed. d Results expressed in relation to the sum of the declared amounts of GBE and rutin. e Results expressed in relation to the sum of the declared amounts of GBE and green buckwheat. f Results expressed in relation to GBE equivalent, sum of the amounts of GBE and GBE equivalent to ginkgo leaf (calculated from a DER 50:1). g Results expressed in relation to the ginkgo leaf contained in the product. h Requirements of the USP monograph on Ginkgo (ginkgo leaf).
Figure 5S5 HPTLC fingerprints of the physical mixtures of ginkgo leaf and buckwheat herb, and examples of adulterated product (GP9). BWH: buckwheat herb, GBL: ginkgo leaf. Track 1: 100% BWH, track 8: 100% GBL, tracks 2-8: mixtures of BWH and GBL, track 9: product containing BWH.
Figure 5S6 Fingerprints of GBL (track 1) and GBE (track 2) under UV 366 nm after derivatization with NP (left) and NP + PEG (right).

D. A. Frommenwiler Chapter 5, Supplementary information
112
5
Figure 5S7 HPTLC fingerprints of forty-eight ginkgo products analysed with the reverse-phase HPTLC method under UV 366 nm after derivatisation 1. SST: system suitability test (quercetin and rutin, increasing RF values).

Chapter 6: An alternative and simplified approach to identification and test for minimum content of TCM
herbal drugs

This manuscript has been submitted to Pharmeuropa Bio & Scientific Notes on 30.06.2020

D. A. Frommenwiler Chapter 6
115
6
Resum
Un enfocament alternatiu i simplificat per a la identificació i la assaig de contingut
mínim en drogues vegetals emprades en medicina tradicional xinesa (TCM)
Seguint una decisió de la Comissió de la Farmacopea Europea (Ph. Eur.), el grup de treball sobre drogues vegetals emprades en TCM va iniciar una fase pilot per examinar la idoneïtat de l’assaig de contingut mínim per HPTLC per reemplaçar la valoració clàssica en monografies TCM. Aquest plantejament es va avaluar amb dos drogues vegetals de la TCM: els bulbs Fritillaria thunbergii (FTB) i el rizoma de coridalis (CYR).
En primer lloc, es van optimitzar els mètodes HPTLC existents per a les dues drogues vegetals. Els nous mètodes es van aplicar a l'avaluació de múltiples mostres i a l’establiment de criteris d'acceptació per a la identificació, seguint el capítol general 2.8.25 de la Ph. Eur.. A continuació, es van desenvolupar i validar els assajos de contingut mínim de marcadors. per HPTLC. En aquest assaig, es compara la intensitat de la zona del marcador a l’empremta dactilar de la mostra amb la zona corresponent de la solució de referència, que té una concentració que dóna una intensitat equivalent al criteri d’acceptació. Aquesta prova dóna un resultat de passa o falla per a cada mostra, en lloc d’un contingut, i es pot realitzar visualment (amb les imatges) o mitjançant programari (utilitzant perfils de pics generats a partir d’imatges, PPI).
Es va avaluar la reproductibilitat dels mètodes HPTLC en estudis interlaboratori en els que participaren sis laboratoris. En resum, els resultats de FTB de cinc laboratoris estaven d'acord. El laboratori restant no va passar la identificació de les mostres. Per a CYR, tots els laboratoris van presentar els mateixos resultats per a la seva identificació. A la prova de contingut mínim, una mostra que es trobava a la zona límit va passar a 4 laboratoris i va fallar en dos. Tots els laboratoris van arribar a conclusions similars per a les altres set mostres.
Els mètodes HPTLC proposats ofereixen un enfocament simplificat per avaluar la identitat i el contingut mínim de drogues vegetals de la TCM en una única anàlisi.

D. A. Frommenwiler Chapter 6
116
6
Resumen
Un enfoque alternativo y simplificado para la identificación y el ensayo de
contenido mínimo en drogas vegetales utilizadas en medicina tradicional china (TCM)
Siguiendo una decisión de la Comisión de la Farmacopea Europea (Ph. Eur.), El grupo de trabajo sobre drogas vegetales empleadas en TCM inició una fase piloto para examinar la idoneidad del ensayo de contenido mínimo por HPTLC para reemplazar la valoración clásica en monografías TCM. Este planteamiento se evaluó con dos drogas vegetales de la TCM: los bulbos Fritillaria thunbergii (FTB) y el rizoma de coridalis (CYR).
En primer lugar, se optimizaron los métodos HPTLC existentes para ambas drogas vegetales. Los nuevos métodos se aplicaron a la evaluación de múltiples muestras y al establecimiento de criterios de aceptación para la identificación, siguiendo el capítulo general 2.8.25 de la Ph. Eur. A continuación, se desarrollaron y validaron los ensayos de contenido mínimo de marcadores por HPTLC. En este ensayo, se compara la intensidad de la zona del marcador a la huella dactilar de la muestra con la zona correspondiente de la solución de referencia, que tiene una concentración que da una intensidad equivalente al criterio de aceptación. Esta prueba da un resultado de pasa o falla para cada muestra, en lugar de un contenido, y se puede realizar visualmente (con las imágenes) o mediante software (utilizando perfiles de picos generados a partir de imágenes, PPI).
Se evaluó la reproducibilidad de los métodos HPTLC en estudios interlaboratorio en los que participaron seis laboratorios. En resumen, los resultados de FTB de cinco laboratorios estaban de acuerdo. El laboratorio restante no pasó la identificación de las muestras. Para CYR, todos los laboratorios presentaron los mismos resultados para su identificación. En la prueba de contenido mínimo, una muestra que se encontraba en la zona límite pasó a 4 laboratorios y falló en dos. Todos los laboratorios llegaron a conclusiones similares para las otras siete muestras.
Los métodos HPTLC propuestos ofrecen un enfoque simplificado para evaluar la identidad y el contenido mínimo de drogas vegetales de la TCM en un único análisis.

D. A. Frommenwiler Chapter 6
117 117
6
An alternative and simplified approach to identification and test for minimum content of TCM herbal drugs
Débora Arruda Frommenwilera,b, Cristiana Sabatini-Samoric, Rosmarie Scherübld, Volker Wolkingere, Amandine Nachtergaelf, Eike Reichb, Salvador Cañiguerala and Ulrich Rosec
Affiliation: aUnit of Pharmacology, Pharmacognosy and Therapeutics, Faculty of Phar-macy and Food Sciences, University of Barcelona, Barcelona, Spain; bCAMAG Laboratory, Muttenz, Switzerland; cEuropean Directorate for the Quality of medicines and Health Care (EDQM), Council of Europe, Strasbourg, France; dBionorica SE, Neumarkt, Deutschland; eInstitute of Pharmaceutical Science, Karl-Franzens-Universität Graz – Austria; fUnit of Therapeutic Chemistry and Pharmacognosy, University of Mons (UMONS), Belgium.
6.1 Abstract Following a decision of the European Pharmacopoeia Commission, the TCM working party started a pilot phase to examine the suitability of HPTLC minimum content test for replacing the classical assay in TCM monographs. This approach was evaluated with two TCM herbal drugs: Fritillaria thunbergii bulbs (FTB) and Corydalis rhizome (CYR).
Firstly, the existing HPTLC methods were optimized for both drugs. The new methods were applied to the evaluation of multiple samples, and acceptance criteria for the identification, following Ph. Eur. chapter 2.8.25, were set. Then, the HPTLC tests for minimum content of markers were developed and validated. In this test, the intensity of the zone of the marker in the fingerprint of the sample is compared to the corresponding in the reference solution, which has a concentration giving an intensity equivalent to the acceptance criterion. This test gives a pass or fail result rather than a content and can be performed visually (on the images) or by software (using peak profiles from images, PPI).
Reproducibility of the HPTLC methods was evaluated in a collaborative trial including six laboratories. In summary, results for FTB from five laboratories were in agreement. The remaining laboratory did not pass the identification of the samples. For CYR, all laboratories presented the same results for identification. In the test for minimum content, one borderline sample passed in 4 laboratories and failed in two. All laboratories reached similar conclusions for the other seven samples.
The HPTLC methods proposed offer a simplified approach to evaluating identity and mini-mum content of TCM drugs in a single analysis.
6.2 Introduction The European Pharmacopoeia plays an important role in the global quality control of herbal drugs. The 10th Edition (including supplement 10.2) contains 346 monographs of herbal drugs and herbal drug preparations [1]. Of these, 73 are devoted to the quality of TCMs (Traditional Chinese Medicines) drugs. In order to evaluate the quality of herbal drugs and preparations, monographs contain a suite of tests, used for the identification of the herbal drug or preparation, detection of impurities, and content of a constituent or a group of constituents.
The constituents used for quality control of herbal drugs are classified in three categories: compounds with known therapeutic activity, active markers and analytical markers. The

D. A. Frommenwiler Chapter 6
118
6
two first groups have an accepted responsibility or contribution to the clinical efficacy of the herbal drug. Quantification of these constituents is considered relevant in the assessment of the quality of the herbal drugs. Nevertheless, in most herbal drugs, due to the limited knowledge on the responsibility of their constituents on its clinical efficacy, a constituent or a group of constituents are used as analytical marker(s). The quantification of an analytical marker can help in the control of the manufacturing process of an herbal drug and the resulting medicinal product. Nevertheless, in many cases, the determined content of analytical marker(s) is not indicative of the suitability of the herbal drug for the intended use and does neither guarantee the quality nor the stability of the drug. Still, the usual practice is, that wherever possible, an assay shall be described in monographs on herbal drugs and preparations and this assay is very often based on chromatographic methods, like LC or GC using reference standards with assigned content. Usually, one analytical marker is determined quantitatively in these assays and the Definition section of the monograph describes a minimum content. However, as an analytical marker is not responsible of the therapeutic activity, there is an ongoing discussion amongst experts whether less sophisticated methods could not fulfil the same requirements concerning quality control and simultaneously enable the control of several markers and therefore provide a more holistic approach. This concept has already described in the literature as “comprehensive HPTLC fingerprinting” [2][3] and has the advantage that identification test and determination of analytical marker(s) can be performed within one test. Furthermore, with the modernization of the monographs in the Ph. Eur., the new HPTLC 2.8.25 acknowledges the quantitative aspects of the HPTLC image with the inclusion of intensity markers.
Following a decision of the European Pharmacopoeia Commission at its 157th session in November 2016, the TCM working party started a pilot phase to examine the suitability of a semi-quantitative HPTLC approach to replace the classical assay in those monographs on TCMs (Traditional Chinese Medicines) which are not covered by a marketing authorisation in Europe. The idea was to offer a simpler test for minimum content that can be performed in parallel with identification. This approach was tested in two case studies, chosen by the experts of the TCM working party: Fritillaria thunbergii bulbs (FTB) and Corydalis rhizome (CYR). The results of the pilot phase are described in this paper.
6.3 Materials and Methods
6.3.1 Samples, reagents and instruments
Papaverine hydrochloride (95% pure), yohimbine hydrochloride (95% pure), peimine (95% pure), peiminine (95% pure), isofraxidin (95% pure), scopoletin (95% pure), corydaline (95% pure), tetrahydropalmatine (95% pure), and all samples of Fritillaria thunbergii bulbs and Corydalis rhizome were provided by the European Directorate for the Quality of Medicines (EDQM) (Strasbourg, France). Other standards listed in the supplementary information were obtained from Sigma Aldrich.
HPTLC instruments from CAMAG (Muttenz, Switzerland) were used, including: Automatic TLC Sampler (ATS 4), Automatic Development Chamber (ADC 2) with humidity control, Plate Heater 3, TLC Visualizer 2, and Immersion Device 3. These instruments were also used by the laboratories participating in the collaborative trial, whenever available. Solvents (≥95% pure) and reagents were purchased from Roth (Karlsruhe, Germany), Acros (Gent, Belgium), Fisher Scientific (Hampton, United States), and Merck (Darmstadt, Germany). Silica gel 60 F254 HPTLC glass plates (20 x 10 cm) were manufactured by Merck (Darmstadt, Germany).

D. A. Frommenwiler Chapter 6
119 119
6
6.3.2 Sample preparation
6.3.2.1 Fritillaria thunbergii bulb
In a closed centrifuge tube, 0.5 g of the powdered herbal drug were macerated for 30 minutes with 2.5 mL of concentrated ammonia (min 30%). Then 12.5 mL of methanol were added, the tube was closed again, and the mixture was shaken for 20 minutes at 300 rpm. Then, following centrifugation for 5 minutes, the supernatant was used as test solution.
6.3.2.2 Corydalis rhizome
In a closed centrifuge tube, 0.5 g of the powdered herbal drug were sonicated for 15 minutes with 10 mL of 50% aqueous ethanol. Then, following centrifugation for 5 minutes, 1.0 mL of the clear supernatant was transferred into a 10 mL volumetric flask and diluted to 10 mL with 50% aqueous ethanol.
6.3.3 High-Performance Thin-Layer Chromatography (HPTLC)
General HPTLC parameters for plate layout, sample application, conditioning of the plate, plate development, and visualization were in agreement with the Ph. Eur. general chapter 2.8.25 [4]. The specific parameters are described in Table 6.1 and Table 6.2.
Table 6.1 Parameters for HPTLC analysis of Fritillaria thunbergii bulb.
Stationary phase 20x10 cm glass plates silica gel 60 F254 (2-10 µm) (Merck)
Ref. solution a Papaverine at 0.5 mg/mL in methanol
Ref. solution b Yohimbine at 0.1 mg/mL in methanol
Ref. solution c Peimine at 40 µg/mL in methanol
Ref. solution d Peiminine at 40 µg/mL in methanol
Ref. solution e Peimine at 10 µg/mL in methanol
Ref. solution f Peiminine at 10 µg/mL in methanol
Ref. solution g Peimine at 20 µg/mL in methanol
Ref. solution h Peiminine at 6.7 µg/mL in methanol
Application 5 μL of test and reference solutions, quantitative mode
Developing solvent Toluene, acetone, diethylamine (9:9:1.2, v/v/v)
Development Unsaturated chamber (deviating from HPTLC standard conditions), 10 min conditioning at 33% relative humidity (with MgCl2), to 70 mm from the lower edge of plate, room temperature (22 ± 5⁰C)
Documentation prior to derivatization
UV 254 nm, UV 366 nm, and white light
Derivatization reagent 10% sulfuric acid in methanol: to 180 mL of cold methanol, 20 mL of sulfuric acid were added. The mixture was allowed to cool to room temperature before use.
Derivatization Plates were dipped (speed: 1, dwell time: 0) into the derivatization reagent, dried for 1 min in a stream of cold air and then heated at 120 ⁰C for 5 min
Documentation Images were recorded immediately after derivatization, under UV 366 nm and white light
Table 6.2 Parameters for HPTLC analysis of Corydalis rhizome.
Stationary phase 20x10 cm glass plates silica gel 60 F254 (2-10 µm) (Merck)
Ref. solution a Isofraxidin at 0.5 mg/mL in methanol
Ref. solution b Scopoletin at 0.5 mg/mL in methanol
Ref. solution c Corydaline at 12.5 µg/mL in methanol

D. A. Frommenwiler Chapter 6
120
6
Ref. solution d Tetrahydropalmatine at 12.5 µg/mL in methanol
Ref. solution e Corydaline at 3.125 µg/mL in methanol
Ref. solution f Tetrahydropalmatine at 3.125 µg/mL in methanol
Ref. solution g Corydaline at 2 µg/mL in methanol
Ref. solution h Tetrahydropalmatine at 3 µg/mL in methanol
Application 2 μL of test and reference solutions, quantitative mode
Developing solvent Toluene, anhydrous ter-butyl methyl ether, isopropanol (8:2:0.2, v/v/v)
Development Unsaturated chamber (deviating from HPTLC standard conditions), 10 min conditioning at 33% relative humidity (with MgCl2), to 70 mm from the lower edge of plate, room temperature (22 ± 5⁰C)
Documentation prior to derivatization
UV 254 nm, UV 366 nm, and white light
Derivatization reagent Iodine vapor: a glass chamber was saturated for 30 minutes with 1 g of iodine, spread evenly.
Derivatization The plate was exposed to iodine vapor for 3 minutes. The excess of iodine absorbed on the plate is removed in a stream of cold air for 10 minutes.
Documentation Images were taken immediately after derivatization, under UV 366 nm and white light
6.3.4 Generation of peak profiles from images (PPI)
The visionCATS software (CAMAG, Switzerland) was used to generate peak profiles from images (fingerprints) by calculating the luminance L = (1/3 R)+(1/3 G)+(1/3 B) from the averaged signals of the red (R), green (G) and blue (B) channels of each pixel line of the track. L in fluorescence mode, respectively L-1 in absorption mode, is plotted as a function of the RF value [5].
6.4 Results and discussion This work presents two case studies of an alternative method combining identification and test for minimum content, that were proposed for pilot studies of the Ph. Eur.:
Fritillaria thunbergii bulb (FTB) Corydalis rhizome (CYR)
6.4.1 Fritillaria thunbergii bulb (FTB)
The dried bulb of Fritillaria thunbergii Miq. (FTB) is used in traditional Chinese medicine (TCM) for treating cough and airway inflammatory diseases [6]. According to Li et al. [7], the alkaloids peimine (verticine) and peiminine (verticinone) are the major constituents of fritillaria and primarily responsible for the activity of the drug. Therefore, identification C of the first draft monograph elaborated by the TCM WP of the European Pharmacopoeia (confidential document) is using alkaloids as markers, and in the monograph for Fritillariae Thunbergii Bulbus of the Chinese Pharmacopoeia [8] an assay for peimine and peiminine is prescribed. Before starting the work presented here, sample preparation and HPTLC method of the first draft for Ph. Eur. were optimized to improve repeatability (data not shown).
6.4.1.1 Identification, intensity marker, system suitability test (SST) and specificity of the method
The optimized method, as described in the experimental section, was used to evaluate twenty-four samples of FTB. Fingerprints are shown in Figure 6S1 of the supplementary information. Figure 6.1 shows the chromatograms of the reference solutions (tracks A to D) and, as test solution, an average fingerprint generated through electronic merging of

D. A. Frommenwiler Chapter 6
121 121
6
the individual fingerprints of all FTB samples (track 1). The eight main zones of the test solution are labeled alphabetically on the chromatogram and described in a table as acceptance criteria for identification. Under UV 366 nm after derivatization a sample should contain a blue fluorescent zone at the position of peiminine [e], a blue fluorescent zone [f], a blue fluorescent zone [g], barely separated from a faint green fluorescent zone [h], a greenish fluorescent zone at the position of peimine [j], one blue zone [k] and a faint blue zone [l].
6.4.1.2 Intensity marker
In order to improve the description of the intensity of the zones in the chromatogram, the concept of intensity markers adopted in the HPTLC general chapter 2.8.25 [4] was followed. According to this chapter, solutions of one or two substances are prepared in two concentrations. One that resembles the intensity of the main zone(s) in the fingerprint of the test solution (R) and another solution with the same standards diluted 4-fold (R/4). To describe the intensity of the zones in the fingerprints, their intensities are visually compared with the intensity of the zones in solutions (R) and (R/4). Zones that are more intense than the solution (R) are described as intense zone, while those of similar intensity are described as (equivalent) zones. Zones that show intensity between solutions (R) and (R/4) are referred to as faint, and those less intense than solution (R/4) are very faint.
Figure 6.1 HPTLC chromatograms and table description for visual identification and test for the minimum content of peimine and peiminine in Fritillaria thunbergii bulb (FTB). Track A: SST; Tracks B to D: reference solutions. Track 1: FTB test solution (average fingerprint). Tracks B to D and 1 normalized over peiminine in track B. Intensity markers: peimine for zones [i] and [h], peiminine for all the other zones.

D. A. Frommenwiler Chapter 6
122
6
In the case of FTB, the reference solutions of peimine and peiminine were used as intensity markers. First, they were prepared at ten different concentrations, between 500 µg/mL and 10 µg/mL (Figure 6S2). The solutions at a concentration of 40 µg/mL were suitable as first intensity markers (reference solutions c and d) and their 4-fold dilutions (10 µg/mL) as diluted intensity markers (reference solutions e and f) (Figure 6.1). Peimine is used as intensity marker for the corresponding zone [j] and zone [h], and peiminine for all the other zones.
A more objective description of the intensity is possible using the peak profiles from images (PPI). In this approach, the height of the peaks can be directly compared using suitable software. An example is shown in Figure 6.2 for the fingerprint of one FTB sample. Peaks [j] and [h] are compared to peimine as intensity marker [d] and would be described as faint. The other peaks are compared to peiminine as intensity marker [c], and, consequently, peaks corresponding to the zones [f], [g] and [k] would be described as intense zones, whereas peaks [e] and [l] as faint zones.
Figure 6.2 Chromatograms and PPI of reference and test solutions. Peimine (zone [d]) and peiminine (zone [c]) are used as intensity markers for zones [i] and [h] and all the other zones, respectively.
6.4.1.3 System Suitability Test (SST)
Besides intensity markers, the HPTLC general chapter 2.8.25 [4] also requires the use of a system suitability test (SST) to evaluate the quality of the chromatography. According to this chapter, the SST consists of two substances on the same track, which, after chroma-tography, are barely separable. Different separation pattern can indicate problems in the chromatography. For FTB, twenty-eight standards were tested (Figure 6S3). Only twelve alkaloids migrated between RF 0.2 and 0.8. Those that showed similar RF were then com-bined. While no suitable combination was obtained after derivatization, three of them were proposed for evaluation prior to derivatization under UV 254 and 366 nm (Figure 6.3). Quinine and boldine showed good separation, but after derivatization, the intensity of the zone due to quinine interferes with the detection of other zones on the plate. The combination of brucine and theobromine was tested in a collaborative trial, including six laboratories, and some participants had difficulties with completely dissolving theobromine, which affected the detectability of this standard. Therefore, papaverine and yohimbine were finally selected as SST. Detection at UV 366 nm was chosen for its higher sensitivity, particularly for yohimbine. The concentration of the standards was adjusted to 0.5 mg/mL for papaverine and 0.1 mg/mL for yohimbine as shown in Figure 6.1.

D. A. Frommenwiler Chapter 6
123 123
6
Figure 6.3 Images of the possible SST, under UV 254 and 366 nm prior to derivatization
6.4.1.4 Development of the test for minimum content based on PPI
For FTB, the HPTLC test for minimum content was developed on the basis of the HPLC assay of the Chinese pharmacopoeia [8]. In the first part of the HPTLC investigation, peimine and peiminine were quantified in 9 authenticated samples (FTB1-9). The minimum content of both markers was established. Then, the optimized HPTLC method was validated with a new set of samples (FTB 10-24), and results were compared to data obtained by HPLC.
Establishing minimum content of peimine and peiminine
The contents of peimine and peiminine were established prior to method optimization, using the HPTLC method of the draft monograph (confidential document) and diluted test solutions, prepared according to method 2 described in Table 6S1. A calibration curve using peak areas from PPI for peimine was used to calculate both peimine and peiminine in samples FTB1-9. First, the linear working range was evaluated. Linearity was achieved with five concentration levels ranging from 2 to 8 µg/mL (4-16 ng/application). To fit the test solutions into the linear working range, they were further diluted 4-fold
The content of peimine in samples FTB1-9 varied between 0.01% and 0.11% (0.06% on average), with 77% of the samples having a content ≥0.06%. The content of peiminine in these samples varied between 0.01% and 0.05% (0.02% on average), 89% of the samples showing a percentage ≥0.02%. Result are shown in Table 6S2. Based on these results it was agreed to propose 0.06% and 0.02% as minimum contents for peimine and peiminine, respectively. These limits include 56% of the samples analyzed.
Validation of the HPTLC method in comparison to HPLC assay
For validating the new HPTLC method against the existing HPLC assay method elaborated and validated by the experts of the TCM WP of the European Pharmacopoeia (confidential document), the content of peimine and peiminine was assessed in fifteen new samples (FTB10-24). To improve accuracy of the HPTLC determination, a separate calibration curve for peiminine, ranging from 2-10 µg/mL (4-20 ng/application), was prepared (Figure 6S4), whereas for peimine, the calibration curve described in previous section was used. The sample preparation for HPLC is described in Table 6S1 (method 1). For HPTLC, the same sample preparation was used, but with an additional 25-fold dilution in order to fit in the linear range. Quantifications were performed in the PPI by peak area for peimine and peak height for peiminine, due to a lack of baseline separation from the neighboring peak. HPTLC results were compared to HPLC data provided by an expert

D. A. Frommenwiler Chapter 6
124
6
of the TCM WP (confidential document).
In Figure 6.4, HPTLC results are, on average, 1.1 and 1.5-fold greater than those of HPLC for peimine and peiminine, respectively. Nevertheless, both techniques lead to same con-clusion of the test for minimum content for peimine (thirteen samples passed) and peiminine (all samples passed).
Figure 6.4 Comparison of the contents of peimine and peiminine by HPTLC and HPLC. Black lines: minimum content of peimine (0.06%) and peiminine (0.02%).
6.4.1.5 Collaborative trial: organization
The reproducibility of the new HPTLC method was evaluated in a collaborative trial involving six laboratories using a common set of six samples (FTB 25-30) and reference solutions. Reference (a) to (f) and test solutions for identification were prepared according to the experimental section. Brucine and theobromine were used as SST.
The test for minimum content was performed visually and by PPI using single levels of peimine and peiminine equivalent to 0.06% respectively 0.02% in the herbal drug (reference solutions (g) and (h).
The test performed by PPI (software) involved an additional set of test and reference solu-tions at a 4-fold dilution ensuring determination within the linear range. Due to the low intensity of its zones this set is not suitable for visual evaluation.
The participating laboratories evaluated whether the SST, intensity markers and samples met the acceptance criteria below:
Evaluation 1, SST: The quenching zones due to theobromine [a] and brucine [b] are barely separable and are seen at RF ~ 0.36 and 0.32, respectively.
0
0.02
0.04
0.06
0.08
0.1
0.12
0.14
0.16
0.18
0.2
0.22
0.24
0.26
FTB10 FTB11 FTB12 FTB13 FTB14 FTB15 FTB16 FTB17 FTB18 FTB19 FTB20 FTB21 FTB22 FTB23 FTB24
Mea
n v
alu
e (%
)
Samples
PeimineHPTLC HPLC
0
0.02
0.04
0.06
0.08
0.1
0.12
0.14
0.16
0.18
0.2
0.22
FTB10 FTB11 FTB12 FTB13 FTB14 FTB15 FTB16 FTB17 FTB18 FTB19 FTB20 FTB21 FTB22 FTB23 FTB24
Mea
n v
alu
e (%
)
Samples
PeiminineHPTLC HPLC

D. A. Frommenwiler Chapter 6
125 125
6
Evaluation 1, intensity markers: A blue zone due to peiminine [c] and a greenish zone due to peimine [d] are seen at RF ~ 0.59 and 0.34, respectively. The ∆RF between experimental and theoretical RF should not be greater than 0.05.
Evaluation 2, identification: Fingerprints of test solution should contain zones [e] to [k], with colors and intensities similar to those described in the table of Figure 6.2. Refe-rence solutions (c) to (f) are used.
Evaluation 3, minimum content (visual evaluation): under UV 366 nm after derivatiza-tion, the intensity of the zones due to peimine and peiminine in the fingerprint of test solution is not less than that obtained with reference solutions g and h, respectively.
Evaluation 4, minimum content (PPI): In the PPI of the image under UV 366 nm after derivatization (non-diluted and diluted), peak heights of peimine and peiminine recorded for the test solutions are equal to or greater than those recorded for reference solutions.
6.4.1.6 Collaborative trial: results
Results of the collaborative trial are presented in Table 6S3 and Figure 6.5. The first SST (brucine and theobromine) passed in four laboratories but problems with solubility and detection of theobromine were observed. This could be the reason for observing only one zone in two laboratories, causing the SST to fail. Therefore, the new SST-2 (yohimbine and papaverine) was proposed, positively tested in several laboratories, and implemented in the method proposed for the monograph. Results of all laboratories were compliant regarding the position of the intensity markers, except for one that showed ΔRF greater than 0.05 for peimine.
Figure 6.5 Results of the collaborative trial for FTB with 6 participant laboratories.
For the identification (evaluation 2), all laboratories reported the seven zones with colors matching those of the description table. One Laboratory (4) obtained overall faint finger-prints. The reason for that is not clear. Because all samples failed the ID test, the results of the test for minimum content from Laboratory 4 were not considered.
In the visual test for minimum content (evaluation 3), five laboratories passed samples FTB 25 and 27-29. Samples FTB 26 and 30 showed lower content of peimine. The same result was observed in the test for minimum content based on evaluation of the PPI performed by three participants. Because results were similar, the experts of the TCM

D. A. Frommenwiler Chapter 6
126
6
Working Party adopted the non-diluted set for this test.
In summary, five laboratories came to uniform pass/fail decisions, which were in line with those based on the HPLC assay. Based on this study, the draft monograph under elabora-tion was updated and the final version published in Pharmeuropa.
6.4.2 Corydalis rhizome (CYR)
The dried rhizome of Corydalis yanhusuo (Y.H.Chou & Chun C.Hsu) W.T.Wang ex Z.Y.Su & C.Y.Wu (CYR) has been used traditionally to promote blood circulation and as analgesic. CYR contains isoquinoline alkaloids, such as tetrahydropalmatine (THP), corydaline, isocorypalmine, stylopine, columbamine, coptsin, and others. Some studies demonstrated a relation between I-THP and the analgesic effect [9]. Due to its importance for the biological effect of the herbal drug, chemical identification and assay of analytical markers in the current Ph. Eur. monograph 2976 [10] focus on the isoquinoline alkaloids profile. Before starting the work described here, the sample preparation and HPTLC method were optimized to improve repeatability (data not shown).
6.4.2.1 Identification of multiple samples, SST and intensity marker
The optimized method was used to evaluate thirty-five samples of corydalis (CYR1-35, Figure 6S5). Figure 6.6 shows the chromatograms of the reference solutions (tracks A to D) and an average fingerprint generated through electronic merging of the individual fingerprints of all CYR samples (track 1). The four main zones observed in the test solutions are labeled alphabetically and described in a table as acceptance criteria for identification. Under UV 366 nm after derivatization, the test solution shows a faint to equivalent green fluorescent zone [e], a faint to equivalent blue fluorescent zone [f], a very faint green fluorescent zone [g], a faint to equivalent green fluorescent zone [h], and an intense fluorescent green zone at the application position [j].
Figure 6.6 HPTLC chromatogram and acceptance criteria for visual identification and test for mini-mum content of corydaline and tetrahydropalmatine (THP) in corydalis rhizome (CYR). Track A:

D. A. Frommenwiler Chapter 6
127 127
6
SST; Tracks B to D: reference solutions. Track 1: CYR test solution (average fingerprint). Tracks B-D and 1 are normalized over track B. Intensity markers: corydaline for zone [f], THP for all the other zones.
6.4.2.2 SST and Intensity markers
For selecting a SST for CYR, twenty one substances were tested with the mobile phase described in the experimental section (Figure 6S6). Mainly the coumarins and few alkaloids migrated between RF 0.1 and 0.3. The most suitable combination was isofraxidin and scopoletin detected under UV 366 nm after derivatization. Concentrations were adjusted to 0.5 mg/mL (Reference solutions (a) and (b), track A, Figure 6.6).
For setting intensity markers, the same process as for FTB was followed. Reference solu-tions of tetrahydropalmatine and corydaline at 12.5 µg/mL were used as reference solutions (c) and (d). Those solutions were diluted 4-fold to yield a concentration of 3.125 µg/mL for reference solutions (e) and (f).
6.4.2.3 Development of the test for minimum content based on PPI
The HPTLC test for the minimum content of CYR was developed based on the existing method from the Ph. Eur. [10], in which the contents of corydaline and THP are quantified by HPLC and combined. With HPTLC, minimum contents for each marker were individually established. As in the case of FTB, first, the contents were assessed in 2 authenticated samples (CYR1 and 2), and a minimum content was agreed upon. In the second part, the linear working ranges for both substances were investigated. The concentration of test solutions was adjusted to the linear range of both standards.
Establishing minimum content of corydaline and THP
The minimum content of corydaline and THP were established prior to method optimization, using the HPTLC method of the current monograph on Corydalis rhizome [10]. The concentration of all solutions was 10-fold higher. This part of the work was performed by the EDQM laboratory. First, the contents of both markers were quantified in samples CYR1 and 2, prepared in triplicate, and using calibration curves with five levels of concentration. The calibration data were obtained from PPI under UV 366 nm after derivatization. The amounts of corydaline were 0.04% and 0.09%, and THP were 0.06% and 0.08% in samples CYR 1 and 2, respectively. For the minimum content, it was agreed to use the lowest content of corydaline and THP of these two samples: 0.04% and 0.06%, respectively.
Establishing a linear working range for test solutions
In order to achieve a more accurate quantification by single level calibration, used in the test for minimum content, the linear working range for corydaline and THP in the test solutions was evaluated. For that, the optimized HPTLC method was used. Calculations were based on peaks areas from PPI under UV 366 nm after derivatization. Linearity was achieved for five concentration levels ranging from 1 to 10 µg/mL (2-20 ng/application), for both markers. Fitting the test solutions in the linear working range required a 10-fold dilution of the test solution described current monograph (to a concentration equivalent to 5 mg/mL of the herbal drug). Calibration curves are shown in Figure 6S7.
6.4.2.4 Collaborative trial: organization and results
As in the case of FTB, a collaborative trial was performed by six laboratories. For that, eight samples of corydalis (CYR36-43), chemical compounds for reference solutions and a SOP were distributed to the participants.
The following acceptance criteria were used to pass/fail samples and reference solutions:

D. A. Frommenwiler Chapter 6
128
6
Evaluation 1, SST: Two blue fluorescent zones due to the standards scopoletin [a] and isofraxidin [b] are barely separable and are seen at RF ~ 0.16 and 0.14, respectively.
Evaluation 1, intensity markers: A blue zone due to corydaline [c] and a green zone due to THP [d] are seen at RF ~ 0.40 and 0.16, respectively in the tracks corresponding to the reference solutions (c)+(d) and (e)+(f). The ∆RF between experimental and theoretical RF should not be greater than 0.05.
Evaluation 2, identification: The fingerprint of the test solution should contain zones [e] to [j], with color and intensities similar to these described in the table of Figure 6.6. Reference solutions c-f are used.
Evaluation 3, minimum content (visual evaluation): The intensity of the zones due to corydaline and THP in the fingerprint of the test solution is not less than that obtained with reference solutions (g) and (h), respectively.
Evaluation 4, minimum content (PPI evaluation): The PPI of the image under UV 366 nm after derivatization was used. The peak heights of corydaline and THP, recorded for the test solution, are equal to or greater than those recorded for reference solutions (g) and (h).
The results of the collaborative trial are presented in Table 6S4 and Figure 6.7. The RF values for the SST and intensity markers were compliant with the acceptance criteria in all laboratories (evaluation 1). All eight samples were compliant with the table description, regarding the number of zones, their colors, and intensities (evaluation 2).
For the test of minimum content based on the visual evaluation (evaluation 3), all six labo-ratories passed samples CYR38-43 and failed sample CYR 36. Two laboratories failed sample CYR37 due to the low intensity of THP (laboratory 2) or both markers (laboratory 1). All other participants considered this sample passing. The same pattern was observed for the test for minimum content based on PPI (evaluation 4): laboratories 1 and 2 found sample CYR37 having a lower content of THP. All other samples had similar results as evaluation 3.
Figure 6.7 Results of the collaborative trial for CYR with 6 participant laboratories.
In general, all laboratories participating in the trial came to uniform pass/fail decision for seven out of the eight samples in all evaluations. Discrepancies were observed only for

D. A. Frommenwiler Chapter 6
129 129
6
CYR37 showing a borderline situation, particularly for THP. In this case, it is recommended to repeat the test two times to confirm the results.
These samples were also assayed by HPLC. The results of the collaborative trial showed that there was good agreement between results obtained by HPTLC and HPLC with the exception of one sample (CYR37) whose THP content failed by HPTLC in two labs and passed by LC. This might be explained by the fact that the content of the marker in the sample was borderline.
6.5 Discussion During the initial evaluations, several reproducibility problems were encountered for the existing (HP)TLC methods from pharmacopoeias. This is because most of the (HP)TLC methods have never been optimized and validated for achieving reproducible quantitative results in different laboratories. Therefore, new HPTLC methods were established based on the investigation and optimization of different parameters, standardization and validation of the methodologies. After this step, multiple samples were evaluated with the optimized methods and acceptance criteria for the identification were set. Reference solutions, used as SST and intensity markers, were established following chapter 2.8.25.
This work shows how to use PPI for the analysis and description of the intensities of the zones in the identification of herbal drugs. For that, the intensity (height) of the peaks in the reference solutions (undiluted and 4-fold diluted) and the test solutions are compared, providing a more objective way of evaluation than visual observation.
The innovative part of this work demonstrated how the HPTLC method for identification can be used for the test for minimum content of markers in the herbal drugs. First, the actual contents of the markers were quantitatively determined in samples against a five-level calibration curve. Then the minimum content for each substance was established based on the outcome of this test. For simplicity of routine use, the HPTLC test for minimum content features only one reference solution, prepared at a concentration within the linear range and equivalent to the minimum content in the sample. This approach is suitable for software evaluation through PPI, as well as for visual evaluation.
The reproducibility of the HPTLC methods for the test for minimum content were evaluated and found to be suitable in collaborative trials.
An interim report was presented to the Commission on its 159th session and the Commission encouraged the TCM WP to continue the work. Finally, the Commission accepted the results of the pilot phase unanimously at the 163th session in March 2019.
6.6 Conclusion The presented HPTLC methods offer a simplified and alternative approach to verifying the quality of two TCM drugs, by eliminating the need for an HPLC based assay. The new HPTLC methods combine identification and test for minimum content in a single analysis. The methods proposed to the European Pharmacopoeia are suitable for any type of labo-ratory: those that perform manual HPTLC and laboratories equipped with HPTLC instru-ments and software. This gives laboratories with low budget a better chance to be compliant with the pharmacopoeia. After the introduction of the intensity marker to describe the intensity of fingerprints, the (visual) assessment of the minimum content of a single marker against a chemical reference represents an essential step towards a comprehensive use of the HPTLC fingerprints. Further studies will show if this concept can be extended to a multi-marker analysis that enables a more holistic approach for the quality control of herbal drugs.
Acknowledgments
The authors wish to thank the following experts and their teams, who participated in both HPTLC collaborative trials: Prof. Dr. Rudolf Bauer and Ms. Saskia Hofer, Institute of

D. A. Frommenwiler Chapter 6
130
6
Pharmaceutical Sciences, Karl-Franzens-Universität Graz; Prof. Dr. Pierre Duez and Mr. Claudio Palmieri, Université de Mons - Belgium; Dr. Matthias Weber, EDQM laboratory; Dr. Catherine Lenihan, British Pharmacopoeia Commission MHRA; Prof. Dr. De-An Guo, Shanghai Institute of Materia Medica, Chinese Academy of Science.
6.7 References
[1] Eur. Ph. 10th Edition. 2020. 4728 p. Strasbourg, France: Council of Europe; 2020.
[2] Frommenwiler DA, Kim J, Yook C-S, Tran TTT et al. Comprehensive HPTLC Fingerprinting for Quality Control of an Herbal Drug – The Case of Angelica gigas Root. Planta Med. 2018;84(6–07):465–74. DOI: 10.1055/a-0575-4425.
[3] Frommenwiler DA, Booker A, Vila R, et al. Comprehensive HPTLC fingerprinting as a tool for a simplified analysis of purity of ginkgo products. J Ethnopharmacol. 2019;243. DOI: 10.1016/j.jep. 2019.112084.
[4] High-performance thin-layer Chromatography of herbal drugs and herbal preparations, general chapter 2.8.25. Ph. Eur. 10th Edition. Strasbourg, France: Council of Europe; 2020.
[5] Frommenwiler DA, Trefzer D, Schmid M, et al. Comprehensive HPTLC fingerprinting: A novel economic approach to evaluating the quality of Ganoderma lucidum fruiting body. J Liq Chromatogr Relat Technol. 2020; DOI: 10.1080/10826076.2020.1725560.
[6] Ruan X, Cui WX, Yang L, et al. Extraction of total alkaloids, peimine and peiminine from the flower of Fritillaria thunbergii Miq using supercritical carbon dioxide. J CO2 Util. 2017;18:283–93. DOI: 10.1016/j.jcou.2017.01.024.
[7] Li HJ, Jiang Y, Li P. Chemistry, bioactivity and geographical diversity of steroidal alkaloids from the Liliaceae family. Nat Prod Rep. 2006; 23:735–52. DOI: 10.1039/b609306j.
[8] Fritillariae Thunbergii Bulbus, monograph. Pharmacopoeia of the People’s Republic of China. Beijing, China: Chinese Pharmacopoeia Commission; 2015.
[9] Ma Z-Z, Xu W, Jensen N, et al. Isoquinoline Alkaloids Isolated from Corydalis yanhusuo and Their Binding Affinities at the Dopamine D1 Receptor. Molecules. 2008 13(9):2303–12. DOI: 10.3390/molecules13092303.
[10] Corydalis rhizome, monograph 2976. Ph. Eur. 10th Edition. Strasbourg, France: Council of Europe; 2020.

D. A. Frommenwiler Chapter 6, Supplementary information
6
131
6.8 Supplementary information
6.8.1 Fritillaria thunbergii bulb
Figure 6S1 Fingerprints of all Fritillaria thunbergii bulb (FTB) evaluated samples (FTB1-24) under UV 366 nm after derivatization. Track 1- Electronically merged image of all fingerprints.
Figure 6S2 Fingerprints of peimine (green zone at RF 0.34) and peiminine (blue zone at RF 0.60), prepared at 10 different concentrations (tracks 1-10) and an electronically merged image of all FTB fingerprints, under UV 366 nm after derivatization.

D. A. Frommenwiler Chapter 6, Supplementary information
132
6
Figure 6S3 Fingerprints of the reference solutions at 1 mg/mL from secondary metabolites of different classes (e.g. flavonoids, saponins, sugars and alkaloids), analyzed for the selection of a system suitability test (SST) for Fritillaria thunbergii bulb HPTLC method.
Table 6S1 Description of the sample preparation methods tested with pooled sample of Fritillaria thunbergii bulb.
Method Name Description
1 HPLC
method
In a 250 mL round bottom flask, 1.0 g of the powdered herbal drug were macerated for 30 minutes with 2 mL of concentrated ammonia (25-35%). Then, 20 mL of a mixture of dichloromethane and methanol (4:1) were accurately added, and the mixture was heated under reflux on a water bath at 60°C for 45 minutes. After cooling, the mixture was filtered over sodium sulfate into a 20 ml volumetric flask. The round bottom flask was rinsed twice, transferred to the volumetric flask and the volume was filled up with solvent mixture to the mark. Ten mL of the filtrate was evaporated to dryness and the residue was dissolved into with 2 ml methanol.
2 Sonication
10’
In a stopped centrifuge tube, 0.5 g of the powdered herbal drug were macerated for 30 minutes with 2.5 mL of concentrated ammonia (25-35%). Then, 12.5 mL of a mixture of dichloromethane and methanol (1:1) were added, the tube was again stopped, and the mixture was sonicated for 10 minutes. The test solution was centrifuged, and supernatant was used. For quantification, 1 mL of the supernatant was diluted with 3 mL of methanol.
3 Shaking
20’ MeOH
In a stopped centrifuge tube, 0.5 g of the powdered herbal drug were macerated for 30 minutes with 2.5 mL of concentrated ammonia (25-35%). Then, 12.5 mL of methanol were added the tube was again stopped, and the mixture was shaking for 20 minutes. The test solution was centrifuged, and supernatant was used. For quantification, 1 mL of the supernatant was diluted with 3 mL of

D. A. Frommenwiler Chapter 6, Supplementary information
133 133
6
Method Name Description methanol.
4 Original HPTLC
In a stopped centrifuge tube, 0.5 g of the powdered herbal drug were macerated for 30 minutes with 0.5 mL of concentrated ammonia (25-35%). Then, 2.5 mL of a mixture of dichloromethane and methanol (1:1) were added, the tube was again stopped, and the mixture was sonicated for 10 minutes. The test solution was centrifuged, and supernatant was used.
Figure 6S4 Calibration curves of peimine and peiminine. Detection mode: UV 366 nm after derivatization.
Table 6S2 Contents of peimine and peimine in Fritillaria thunbergii bulb samples (FTB1-9), calculated with the original HPTLC method. Detection mode: UV 366 nm after derivatization.
Sample Peimine UV 366 nm (PPI) % Peimine UV 366 nm (PPI)
% FBT1 0.08 0.02 FBT2 0.10 0.03 FBT3 0.07 0.02 FBT4 0.08 0.02 FBT5 0.07 0.01 FBT6 0.01 0.05 FBT7 0.08 0.02 FBT8 0.01 0.02 FBT9 0.03 0.04
Agreed minimum content 0.06 0.02

D. A. Frommenwiler Chapter 6, Supplementary information
134
6
Table 6S3 Summary of the results of the collaborative trial for Fritillaria thunbergii bulb HPTLC method, among six laboratories.
Laboratories 1 2 3 4 5 6 Evaluation 1: SST and intensity markers
SST
Ref. solution a (theobromine)
Pass Pass Pass
Fail (no separation)
Pass Fail (no
separation) Ref. solution b
(brucine) Pass Pass Pass
Fail (no separation)
Pass Fail (no
separation)
SST2
Ref. solution a (papaverine)
Pass n.a. n.a. n.a. Pass n.a.
Ref. solution b (yohimbine)
Pass n.a. n.a. n.a. Pass n.a.
IMa
Ref. solution c and e (peimine)
Fail (deviant RF values) Pass Pass Pass Pass Pass
Ref. solution d and f (peiminine)
Fail (deviant RF values) Pass Pass Pass Pass Pass
Evaluation 2: Identity
FTB 25 Pass Pass Pass Fail (faint
fingerprint) Pass Pass
FTB 26 Pass Pass Pass Fail (faint
fingerprint) Pass Pass
FTB 27 Pass Pass Pass Fail (faint
fingerprint) Pass Pass
FTB 28 Pass Pass Pass Fail (faint
fingerprint) Pass Pass
FTB 29 Pass Pass Pass Fail (faint
fingerprint) Pass Pass
FTB 30 Pass Pass Pass Fail (faint
fingerprint) Pass Pass
Evaluation 3: Minimum content, visual evaluation
FTB 25 Pass Pass Pass n.a. Pass Pass
FTB 26 Fail
(peimine) Fail
(peimine) Fail
(peimine) n.a.
Fail (peimine)
Fail (peimine)
FTB 27 Pass Pass Pass n.a. Pass Pass FTB 28 Pass Pass Pass n.a. Pass Pass FTB 29 Pass Pass Pass n.a. Pass Pass
FTB 30 Fail
(peimine) Fail
(peimine) Fail
(peimine) n.a.
Fail (peimine)
Fail (peimine)
Evaluation 4: Minimum content, PPI (non-diluted test and reference solutions)
FTB 25 n.a. Pass Pass n.a. Pass n.a.
FTB 26 n.a. Fail
(peimine) Fail
(peimine) n.a.
Fail (peimine)
n.a.
FTB 27 n.a. Pass Pass n.a. Pass n.a. FTB 28 n.a. Pass Pass n.a. Pass n.a. FTB 29 n.a. Pass Pass n.a. Pass n.a.
FTB 30 n.a. Fail
(peimine) Fail
(peimine) n.a.
Fail (peimine)
n.a.
Evaluation 4: Minimum content, PPI (diluted test and reference solutions)
FTB 25 n.a. Pass Pass n.a. Pass n.a.
FTB 26 n.a. Fail
(peimine) Fail
(peimine) n.a.
Fail (peimine)
n.a.
FTB 27 n.a. Pass Pass n.a. Pass n.a. FTB 28 n.a. Pass Pass n.a. Pass n.a. FTB 29 n.a. Pass Pass n.a. Pass n.a.
FTB 30 n.a. Fail
(peimine) Fail
(peimine) n.a.
Fail (peimine)
n.a.
a Intensity marker;

D. A. Frommenwiler Chapter 6, Supplementary information
135 135
6
6.8.2 Corydalis rhizome
Figure 6S5 Fingerprints of all Corydalis rhizome (CYR) evaluated samples (CYR1-35) under UV 366 nm after derivatization. Track 1: Electronically merged image of all fingerprints.
Figure 6S6 Fingerprints of the reference solutions at 1 mg/mL from secondary metabolites of different classes (e.g. coumarins, alkaloids, hydroxycinnamic acids and flavonoids), analyzed for the selection of the system suitability test (SST) for the Corydalis rhizome HPTLC method.

D. A. Frommenwiler Chapter 6, Supplementary information
136
6
Figure 6S7 Calibration curves of tetrahydropalmatine and corydaline. Detection mode: UV 366 nm after derivatization.
Table 6S4 Summary of the results of the collaborative trial for Corydalis rhizome (CYR) HPTLC method, among six laboratories
Laboratories 1 2 3 4 5 6 Evaluation 1: SST and intensity markers
SST
Ref. solution a
(scopoletin) Pass Pass Pass Pass Pass Pass
Ref. solution b
(isofraxidin) Pass Pass Pass Pass Pass Pass
IMa
Ref. solution c and e
(corydaline) Pass Pass Pass Pass Pass Pass
Ref. solution d and f (THP)
Pass Pass Pass Pass Pass Pass
Evaluation 2: Identity
CYR36 Pass Pass Pass Pass Pass Pass CYR37 Pass Pass Pass Pass Pass Pass CYR38 Pass Pass Pass Pass Pass Pass CYR39 Pass Pass Pass Pass Pass Pass CYR40 Pass Pass Pass Pass Pass Pass CYR41 Pass Pass Pass Pass Pass Pass CYR42 Pass Pass Pass Pass Pass Pass CYR43 Pass Pass Pass Pass Pass Pass

D. A. Frommenwiler Chapter 6, Supplementary information
137 137
6
Evaluation 3: Minimum content, visual evaluation
CYR36 Fail
(corydaline and THP)
Fail (corydaline and THP)
Fail (corydaline and THP)
Fail (corydaline and THP)
Fail (corydaline and THP)
Fail (corydaline and THP)
CYR37 Fail
(corydaline and THP)
Fail (THP) Pass Pass Pass Pass
CYR38 Pass Pass Pass Pass Pass Pass CYR39 Pass Pass Pass Pass Pass Pass CYR40 Pass Pass Pass Pass Pass Pass CYR41 Pass Pass Pass Pass Pass Pass CYR42 Pass Pass Pass Pass Pass Pass CYR43 Pass Pass Pass Pass Pass Pass
Evaluation 4: Minimum content, PPI
CYR36 Fail
(corydaline and THP)
Fail (corydaline and THP)
Fail (corydaline and THP)
Fail (corydaline and THP)
Fail (corydaline and THP)
Fail (corydaline and THP)
CYR37 Fail (THP) Fail (THP) Pass Pass Pass Pass CYR38 Pass Pass Pass Pass Pass Pass CYR39 Pass Pass Pass Pass Pass Pass CYR40 Pass Pass Pass Pass Pass Pass CYR41 Pass Pass Pass Pass Pass Pass CYR42 Pass Pass Pass Pass Pass Pass CYR43 Pass Pass Pass Pass Pass Pass


Chapter 7: Comprehensive HPTLC fingerprinting: a novel economic approach to evaluating the quality of
Ganoderma lucidum fruiting body

Article published in Journal of Liquid Chromatography & Related Technologies, 43 (11-12): 414-423. 2020; DOI: 10.1080/10826076.2020.1725560. For reasons of copyright, a copy of the published article was not included. Instead, the manuscript accepted by this journal was adapted to the format of this thesis and included here.

D. A. Frommenwiler Chapter 7
141
7
Resum Anàlisi integral de l’empremta dactilar per HPTLC: un nou enfocament econòmic
per avaluar la qualitat del carpòfor de Ganoderma lucidum
L’avaluació de qualitat dels medicaments a base de plantes requereix l’avaluació de la identitat i les possibles adulteracions, així com la determinació del contingut de principis actius o marcadors. Per això, normalment, a les monografies de Farmacopea, es prescriuen diferents mètodes que utilitzen diferents tècniques cromatogràfiques. L’objectiu d’aquest treball és proposar un nou mètode d’avaluació, basat en l’anàlisi integral de l’empremta dactilar per HPTLC (Comprehensive HPTLC fingerprinting): una única anàlisi per HPTLC, que combina la identificació del carpòfor de Ganoderma lucidum amb un assaig d’adulteració i la determinació quantitativa del contingut d’àcids triterpènics totals.
Els paràmetres del mètode per HPTLC es van optimitzar per a obtenir senzillesa i robustesa. A continuació, es van avaluar una cinquantena de mostres de carpòfor de G. lucidum, així com mostres de possibles espècies adulterants, que demostren l’especificitat del mètode per a l’espècie objectiu. Els àcids triterpènics es van analitzar integrant els pics d’àcids ganodèrics a l’empremta dactilar, sumant les seves àrees i quantificant-los enfront d’un punt de calibració d’un sol nivell d’àcid ganodèric A.
El mètode HPTLC presentat ofereix una alternativa econòmica però poderosa a l’actual monografia USP sobre el carpòfor de G. lucidum. Combina la identificació i la valoració quantitativa en un assaig de baix cost, eliminant la valoració d’àcids triterpènics totals per UHPLC. D’aquesta manera es pot descriure de forma exhaustiva la qualitat de les mostres.
Resumen Análisis integral de la huella dactilar por HPTLC: un nuevo enfoque económico
para evaluar la calidad del carpóforo de Ganoderma lucidum
La evaluación de calidad de los medicamentos a base de plantas requiere la evaluación de la identidad y las posibles adulteraciones, así como la determinación del contenido de principios activos o marcadores. Por eso, normalmente, en las monografías de Farmacopea, se prescriben diferentes métodos que utilizan diferentes técnicas cromatográficas.El objetivo de este trabajo es proponer un nuevo método de evaluación, basado en elanálisis integral de la huella dactilar por HPTLC (Comprehensive HPTLC fingerprinting): un único análisis por HPTLC, que combina la identificación del carpóforo de Ganoderma lucidum con un ensayo de adulteración y la determinación cuantitativa del contenido de ácidos triterpénicos totales.
Los parámetros del método por HPTLC se optimizaron para obtener sencillez y robustez. A continuación, se evaluaron una cincuentena de muestras de carpóforo de G. lucidum, así como muestras de posibles especies adulterantes, que demuestran la especificidad del método para la especie objetivo. Los ácidos triterpénicos se analizaron integrando los picos de ácidos ganodéricos en la huella dactilar, sumando sus áreas y cuantificándolos frente a un punto de calibración de un solo nivel de ácido ganodérico A.
El método HPTLC presentado ofrece una alternativa económica pero poderosa a la actual monografía USP sobre el carpóforo de G. lucidum. Combina la identificación y la valoración cuantitativa en un ensayo de bajo coste, eliminando la valoración de ácidos triterpénicos totales por UHPLC. De esta manera se puede describir de forma exhaustiva la calidad de las muestras.

D. A. Frommenwiler Chapter 7
142
7
Comprehensive HPTLC fingerprinting: a novel economic approach to evaluating the quality of Ganoderma lucidum fruiting body
7.1 Abstract Quality evaluation of herbal drugs requires the assessment of identity and possible adulterations, as well as the determination of the content of active principles or markers. For that, normally, different methods, using different chromatographic techniques are prescribed in the Pharmacopoeia monographs. The goal of this work is to propose a new method for evaluation, based on “comprehensive HPTLC fingerprinting”. A single HPTLC analysis, which combines identification of Ganoderma lucidum fruiting body with a test for adulteration and quantitative determination of the content of total triterpene acids.
Parameters of the HPTLC method were optimized for simplicity, and robustness. Then, fifty samples of G. lucidum fruiting body, plus samples of possible adulterating species were evaluated, proving specificity of the method for the targeted species. Triterpene acids were assayed by integrating the peaks of ganoderic acids in the fingerprint, summing their areas, and quantifying them against a single level calibration point of ganoderic acid A.
The presented HPTLC method offers an economic yet powerful alternative to the current USP monograph on G. lucidum fruiting body. It combines identification and quantitative assessment in a single, low-cost test, eliminating the UHPLC assay of total triterpene acids. This way the samples’ quality can be comprehensively described.
7.2 Introduction approach The quality of herbal supplements is evaluated based on Current Good Manufacturing Practice (cGMP). As for herbal medicines, manufacturers are required to assess the identity, purity, and content of their ingredients and products, among other parameters. Scientifically valid methods and acceptance criteria are required [1][2][3]. Pharmacopoeias and other compendia offer ready-to-use specifications (methods and acceptance criteria) for quality control of herbal drugs, preparations and products [4][5], which may fulfil the requirements of cGMP even if the monograph describes materials regulated in different categories.
While the quality control for synthetic drug substances is simple and straightforward, this process can be more complex for herbal drugs and preparations. For the first ones, the active molecule and the impurities are monitored to establish identity, purity, and content, normally based on a single analysis (e.g. HPLC). Herbal drugs and preparations often contain a complex mixture of dozens of substances and there is a limited knowledge of their active constituents [6]. Therefore, testing and assuring the quality of herbals becomes a much more complex and difficult task, which may require a larger number of substances

D. A. Frommenwiler Chapter 7
143
7
to be monitored and tests to be included.
In monographs, pharmacopoeias prescribe a suite of tests for identity, purity, and content of one or more constituents. In most of the cases, TLC or HPTLC is used for the chemical identification and detection of adulterants while the assay of constituents with known thera-peutic activity, active markers or analytical markers is mainly performed by HPLC or GC [6]. The marker concept is suitable only for herbals of which the therapeutically active constituents are not known. In this case the entire herbal ingredient is considered to provide the health benefit. Markers can be a single constituent or a group of them.
Aiming at describing the quality of herbal supplements, USP developed a monograph for Reishi mushroom, Ganoderma lucidum (Curtis) P. Karst fruiting body GLFB [7]. This herbal drug is used in the Traditional Medicine of China and other Asian countries. It contains polysaccharides, triterpenoids, sterols, and fatty acids. The pharmacological properties of GLFB have been associated with the triterpenoids [8]. Therefore, USP monograph includes assays of a number of triterpene acids (ganoderic and ganoderenic acids) by UHPLC in addition to other quality tests. The assay method offers a more holistic approach than the single analytical marker quantification, but is challenging due to the required unusually long UHPLC column and the resulting need for a strong pump and a gradient run of 1 hour per sample.
Since the introduction of standardized HPTLC into the pharmacopoeias (e.g. general HPTLC chapters USP <203> in 2015 [9] and Ph. Eur. 2.8.25 in 2017 [10]), it is possible to reproducibly generate HPTLC fingerprints for identification of herbals. Those fingerprints are static two-dimensional arrays of separated compounds on HPTLC plates. The concept of “comprehensive HPTLC fingerprinting” [11] combines visual image data and quantitative information from peak profiles generated from images (PPI). “Comprehensive HPTLC fin-gerprinting” can be seen as a multidimensional evaluation of quality of an ingredient based on qualitative and quantitative data obtained during identification, thus by eliminating a separate experiment for the assay reducing the overall cost of analysis.
The goal of this work was to elaborate an example of how HPTLC can be used as a rapid and cost-efficient tool for comprehensive description of quality. A single HPTLC analysis, which combines identification of GLFB with a test for adulteration and determination of the content of total triterpene acids expressed as ganoderic acid A is proposed.
7.3 Materials and methods
7.3.1 Samples, standards, instruments, solvents and reagents
Fifty samples of GLFB (whole, powdered, chopped) where acquired from or provided by different companies and institutions from USA, France, Switzerland and Canada. For addi-tional information, see Table 7S1 in the supplementary information. Standards of ganoderic acid A, B, C2, D, and G were purchased from ChemFaces (Hubei – People’s Republic of China). Ganoderma lucidum fruiting body reference extract (lot: #F012B0) and ergosterol were provided by USP (Rockville, MD, USA).
HPTLC equipment from CAMAG (Muttenz, Switzerland) was used, including: Automatic TLC Sampler (ATS 4), Automatic Development Chamber (ADC 2) with humidity control, Scanner 4, Plate Heater 3, TLC Visualizer 2, and Immersion Device 3. The solvents and reagents were purchased from Sigma-Aldrich (Buchs, Switzerland), Roth (Karlsruhe, Germany), Acros (Gent, Belgium) and Merck (Darmstadt, Germany). Silica gel 60 F254
HPTLC glass plates (20 x 10 cm) were manufactured by Merck (Darmstadt, Germany).
7.3.2 Sample preparation for identification and quantitative tests
Samples of GLFB were milled for one minute at 1900 rpm in a grind system (Tube Mill control, IKA, Switzerland). Then, 400 mg of the powder were accurately weighed into cen-trifuge tubes and 5.0 mL of absolute ethanol were added. The mixture was shaken for 15

D. A. Frommenwiler Chapter 7
144
7
minutes at 3000 rpm on an Orbital Shaking Platform POS-300 (Grant-Bio, UK). After cen-trifugation for five minutes, the supernatant was used as test solution.
7.3.3 Standards preparation
3 mg of ganoderic acid A were accurately weighed and dissolved in 3.0 mL of methanol. The resulting stock solution was diluted with methanol to different concentrations in a range from 0.04 to 0.60 mg/mL. Other standards were prepared at 1 mg/mL in methanol. For single level calibration 5 µL of standard solution at 0.1 mg/mL were used.
7.3.4 High performance thin layer chromatography (HPTLC)
General HPTLC parameters for plate layout, sample application, conditioning of the plate, plate development and visualization were in agreement with the USP general Chapter <203> [9]. The background of the images obtained in fluorescence mode was normalized on the ganoderic acid A standard track. The optimized parameters are described in Table 7.1.
Table 7.1 Parameters for the HPTLC methods used in the present work.
Stationary phase 20x10 cm plates Si 60 F254 (Merck)
Concentration of stan-dard
0.1 mg/mL (ganoderic acid A, content test)
Application 5 μL of test and standards solutions, quantitative mode
Developing solvent Toluene, tetrahydrofuran, acetic acid (70:30:1 v/v/v)
Development Unsaturated chamber, 10 min conditioning at 33% relative humidity (with MgCl2), 70 mm distance from lower edge, room temperature = 22 ± 5⁰C
Documentation prior to derivatization
UV 254 nm, UV 366 nm and white light
Peak Profiles from Sca-nning densitometry (PPSD)
Densitometric analysis for quantification is performed before derivatization in absorbance mode at 260 nm, using deuterium lamp, slit dimension 5.0 x 0.2 mm, scanning speed 20 mm/s.
UV spectra
UV spectra of samples and standards were recorded before derivatization in absorbance, between the wavelengths 200 and 400 nm, using a deuterium lamp, slit dimension 8.0 x 0.4 mm, scanning speed 10 mm/s
Derivatization reagent 10% sulfuric acid in methanol. To 180 mL of cold methanol, 20 mL of sulfuric acid are added. The mixture is allowed to cool to room temperature before use.
Derivatization Plates were dipped (speed: 1, time: 0) into the derivatization reagent, dried for 1 min in a stream of cold air and then heated at 100 ⁰C for 3 min
Documentation Images are taken 12 minutes after derivatization, under UV 366 nm and white light
7.3.5 Generation of peak profiles from images (PPI)
The visionCATS software (CAMAG, Switzerland) was used to generate peak profiles from images (fingerprints) by calculating the luminance L = (1/3 R)+(1/3 G)+(1/3 B) from the red (R), green (G) and blue (B) channel for each pixel line of the track. L in fluorescence mode, respectively 1-L in absorption mode, is plotted as a function of the RF value [11].
7.3.6 Repeatability of quantitation
Six individual solutions of sample GL20 were prepared according to the method described above. The areas of PPI and PPSD between RF 0.1 and 0.5 were added and the coefficient of variation (CV) of the total content of triterpene acids was calculated against a single

D. A. Frommenwiler Chapter 7
145
7
level of ganoderic acid A.
7.4 Results and discussion Starting point of the work was an evaluation of monographs for GLFB from the Hong Kong Chinese Materia Medica Standards (HKCMMS) [12], the United States Pharmacopoeia (USP) [7], and the Pharmacopoeia of the People’s Republic of China (PPRC) [13].
Beside other tests, these monographs include mainly identification by macroscopy, microscopy, TLC or HPTLC, and HPLC, focusing on the detection of the triterpene acids. For the quantitative analysis, the PPRC prescribes an unspecific assay of polysaccharides, triterpenes and sterols by spectrophotometry. Only the USP monographs include a minimum content test by UHPLC, which sums up peaks of 10 different triterpene acids and expresses them as ganoderic acid A.
The HPTLC method from USP (which is also included in the American Herbal Pharmacopoeia [14] and the method collection of the HPTLC Association [15]) is suitable for identification of Ganoderma lucidum fruiting body. However, with respect to separation of ganoderic acids the method published by Xie and Yun [14] gives superior results.
The selectivity of these two methods as well as the results of the USP UHPLC assay were included as benchmarks for the development of a new approach combining identification of the herbal drug with quantification of its minimum content on triterpene acids, based on the concept of “HPTLC comprehensive fingerprinting” [11].
7.4.1 Optimization of the HPTLC parameters
Changing the mobile phase of the USP HPTLC method (toluene, ethyl formate, formic acid 25:25:1 v/v/v) [7] (Figure 7.1 A) to toluene, tetrahydrofuran, acetic acid (70:30:1 v/v/v) afforded superior separation of triterpene acids and thus improved the quantification of these compounds (Figure 7.1 C). In comparison to the gradient elution method of Xie and Yun [16] (Figure 7.1 B), the achieved resolution is comparable, but due to the use of standard HPTLC equipment the method is technically much simpler and thus easier to reproduce.
Figure 7.1 Fingerprints of USP G. lucidum reference extract, developed with USP [7] (A) and Xie and Yun [129] (B) methods, and the new mobile phase (C). Images under UV 254 nm prior to derivatization (Track 1) and UV 366 nm after derivatization (track 2). Zones within the orange bounds are due to triterpene acids.

D. A. Frommenwiler Chapter 7
146
7
7.4.2 Extraction method
With the goal of selecting a simple, rapid, and robust quantitative extraction method that can be compared to the 45 min extraction under reflux used in the USP assay of triterpene acids in GLFB [7], 5 procedures were evaluated. Aliquotes of the same samples were extracted by shaking or sonication for different times in duplicate keeping the extraction ratio at 80 mg of powdered drug per 1 mL of ethanol (see supplementary information, Table 7S2, for description of the sample preparation methods). After chromatography the efficiency of extraction was evaluated based on the comparison of the intensity of the peaks between RF 0.1 and 0.5 of the PPI under UV 254 nm prior to derivatization. Results were similar for all methods (see supplementary information, Figure 7S1). Fifteen minutes shaking at room temperature (22±5°C) was chosen as final extraction for its simplicity and low susceptibility to temperature change (e.g., increase of temperature in the ultrasonic bath during sonication).
7.4.3 Derivatization procedure
Derivatization with sulfuric acid reagent is an important step for proper identification of GLFB. As shown in Figure 7.2, some nonpolar substances in the upper RF range can only be seen after derivatization. Most of the triterpene acids (between RF 0.1 and 0.5) develop colored zones that are more intense than prior to derivatization. This facilitates visual evaluation of the samples. It was observed during evaluation of extraction, that the color of the zone due to the ganoderic acid A standard after derivatization varied between the analyses, indicating instability during and after this step. Therefore, the influence of the following parameters on the color of the zones were investigated: 1) preparation of sulfuric acid reagent in methanol versus ethanol; 2) stability of the color and intensity of the zones after derivatization with time.
Figure 7.2 HPTLC of ergosterol, ganoderic acids D, B, A. G and C2 (prepared at 1 mg/mL) and 2 samples of G. lucidum fruiting body (GL13 and GL12, respectively) under UV 254 nm prior to deriva-tization (left) and UV 366 nm after derivatization (right). Standards on tracks 1, 3 and 6 show more than one zone due to impurities.
In the first experiment post-derivatization stability of the fingerprint was evaluated on plates derivatized with 10% sulfuric acid in methanol and ethanol, respectively. The developed plates were dipped into freshly prepared reagent, dried for 1 minute at room temperature and then heated at 100°C for 3 minutes. After derivatization, images were recorded at 3, 6, 9, 12, 15, 18, 21 and 60 minutes. It was found that with time methanolic sulfuric acid yields less change in color than ethanolic sulfuric acid. Stability was reached nine minutes after derivatization. At this point in time the intensity of the zones changed only marginally (supplementary information, Figures 7S2, 7S3, 7S4).
7.4.4 Choice of the detection modes for quantitative assessments
As observed in Figure 7.2, ganoderic acids D, B, A, G and C2 are detected as standards

D. A. Frommenwiler Chapter 7
147
7
and in the samples prior to and after derivatization. Other zones between 0.1 and 0.5 were not identified due to the lack of standards. Nevertheless, their UV spectra in a pooled sample were recorded and compared with those of ganoderic acids. The similarity of the UV spectra and RF values suggests that these zones are due to ganoderic acids, and thus will be used for quantification of total triterpene acids (see supplementary information, Figures 7S5 and 7S6)
Selection of the most suitable PPI for quantification was based on the response of ganoderic acid A at 0.25 mg/mL, applied at four different positions on the plate. After chromatography, the (CV) for the corresponding peak areas was calculated. CV was low prior to derivatization (1.2%), while after derivatization it reached 12.3%. Therefore, the PPI prior to derivatization are used for quantitation, while the images after derivatization (under UV 366 nm) are used for identification.
Quantitation based on PPI was compared to peak profiles from scanning densitometry (PPDS) at 260 nm, selected for detection based on the absorption maximum of the ganoderic acids (Figure 7S5, supplementary information).
7.4.5 Evaluation of samples with optimized HPTLC method
Fifty samples of GLFB were analyzed with the optimized HPTLC method. Their fingerprints were compared to that of a USP reference extract prepared at 10 mg/mL. Results are presented in Figure 7.3.
Figure 7.3 Fingerprints of fifty samples of Ganoderma lucidum fruiting body (GL) and the USP extract (GLe) under UV 366 nm after derivatization.
Half of the samples (GL2-27) show fingerprints similar to that of the USP reference extract (GLe). Four of them show very faint or no zones in the upper third of the chromatogram, such as ergosterol (GL9, 25-27). Two samples (GL1-2) present additional yellow zones in the lower third of the chromatogram. Sample GL1 presents different proportions of the triterpene acids, compared to the reference extract. Samples GL28-50 lack either one or more yellow zone(s) due to triterpene acids, a zone at the position of ganoderic acid A or all of them (only triterpenes in the upper part of the chromatogram and some other faint zones are present). Therefore, samples GL2-8, 10-24 were considered compliant with the USP specifications (fingerprint similar to that of the reference extract). Samples GL1, 9, 25-27 were considered of questionable quality and GL 28-50 were considered not compliant with USP specifications because they lack zones of triterpene acids.

D. A. Frommenwiler Chapter 7
148
7
7.4.6 Specificity of the optimized HPTLC method
The specificity of the proposed method was evaluated based on its capacity to distinguish fruiting bodies of Ganoderma lucidum from fruiting bodies of other mushrooms. None of the 13 species shown in Figure 7.4 show quenching zones or yellow and green zones due to triterpene acids prior to (A) and after derivatization (D), respectively. Instead, they feature zones in the upper third of the chromatogram or at the application position, which might be used to detect their presence in mixtures with G. lucidum. The optimized method proved to be specific for GLBF.
Figure 7.4 Fingerprints of fruiting bodies of Ganoderma lucidum and other mushroom species under UV 254 nm (A; enhanced, contrast 4.0) and 366 nm (B) prior to derivatization, and white light (C) and UV 366 nm (D) after derivatization. Tracks 1: fruiting body samples of G. lucidum (GL), 2: G. applanatum (GA), 3: G. sinensis (GS), 4: Inonotus obliquus (IO), 5: Hericium erinaceus (HE), 6: Grifola frondosa (GF), 7: Fomes fomentarius (FF), 8: Coprinus comatus (CC), 9: Cordyceps sinensis (CS), 10: Agaricus blazei (AB) 11: Lentinus edodes (LE), 12: Phellinus linteus (PL), 13: Pleurotus spp. (PS), 14: Tremella fuciformis (TF).
7.4.7 Quantitative assessment
Like the UHPLC assay of ganoderic acids of the USP monograph, HPTLC can determine a sum of peaks (total triterpene acids) in the chromatogram (PPI), calculated as ganoderic acid A. In the proposed method, triterpene acids migrate to positions between RF 0.1 and 0.5 (Figure 7.2).
7.4.7.1 Linear range of ganoderic acid A
The linear range of ganoderic acid A was determined from PPI under UV 254 nm and PPSD at UV 260 nm based on a dilution series prepared at concentrations between 0.02 and 0.15 mg/mL (100-750 ng/zone), with increments of 0.01 mg/mL per level. The linear range of ganoderic acid A under both detections was between 0.04 - 0.10 mg/mL (200-500 ng/zone). The calibration curves are shown in the supplementary information, Figure 7S7.
7.4.7.2 Determination of ganoderic acid A in the USP reference extract by multilevel calibration
To prove that the HPTLC method yields results comparable to that of the UHPLC method, the content of ganoderic acid A was quantified in the USP reference extract and compared to the value specified in the certificate of analysis. For that, a five level calibration curve of ganoderic acid A, ranging from 200 to 500 ng/application was used. Results obtained with HPTLC method were 1.0% (PPI) and 1.0% (PPSD), were close to the declared content of 0.9%.

D. A. Frommenwiler Chapter 7
149
7
7.4.7.3 Linear range of triterpene acids in G. lucidum fruiting body
The linear range for each of the main peaks between RF 0.1 and 0.5 in GLFB was deter-mined, in order to find a suitable concentration of the test solution for quantification. The goal was to obtain a fingerprint in which all the main peaks are within linear range, and their sum can be calculated against a single level calibration. First, samples available in large quantities with fingerprints similar to that of the USP reference extract (GL9, 13, 14, 16, 19, 20, and 23) were pooled to create an average sample. The pooled sample was prepared at 80 mg/mL with the optimized extraction method. Fifteen dilutions were prepared from this stock solution, at concentrations between 6 and 80 mg/mL. Each of the seven peaks within the selected RF range (Figure 7.5) was integrated manually using the perpendicular drop method. The baseline correction was done automatically by the software between RF 0.1 and 0.5 (Figure 7.5). Calibration curves were built for each zone by plotting the area of the corresponding peak against the concentration of the test solution. Linearity was calculated for each peak and is shown in Table 7S3 (supplementary information). The test solution at concentration of 80 mg/mL used for identification is within the linear range. Therefore, the same test solution can be used for identification and quantification.
Figure 7.5 Illustration of the peaks evaluated for linearity and quantification of G. lucidum samples. Profile under UV 254 nm (enhanced image, contrast 2.1), PPI and PPSD of the pooled sample.
7.4.7.4 Quantification of triterpene acids
According to the USP monograph, GLFB should contain not less than 0.3% (weight percent) of total triterpenoic acids, calculated as a sum of ganoderic acids A, B, D2, D, F, G and H and ganoderenic acids B, C and D [7]. The same acceptance criterion was implemented for quantitative HPTLC.

D. A. Frommenwiler Chapter 7
150
7
Good correlation is observed between PPI and PPSD at 260 nm, which was recorded for comparison (Table 7.2).
Of the fifty samples, twenty-eight (GL1-7, 9-25, 28-30 and 44) show a content of triterpene acids equal to or higher than 0.3%. Of these, twenty-one (GL2-7, 10-24) show a fingerprint similar to that of USP reference extract (Figure 7.2). Samples GL1, 9 and 25 show ques-tionable fingerprints during identification. Even though samples GL 28-30 and 40 pass the assay, they lack yellow zones due to triterpene acids in the identity test. Three samples (GL 32, 38-39) have borderline content (between 0.27% - 0.29%) in one or both detections, but their identity is not matching the USP reference extract. Of the nineteen samples that have less than 0.27% of triterpene acids in one or both detections, one (GL8) shows a fingerprint similar to that of the USP reference extract, two are questionable samples (GL26 and 27), and sixteen (GL31, 33-37, 40-43, 45-50) lack one or more triterpene acids zones.
Based on the USP acceptances criteria for the assay and identity test, twenty-one samples (02-07, 10-24) are considered compliant. All other samples fail one or both tests.
Table 7.2 Results of quantification of 50 samples of GLFB
Sample Total amount of triterpene
acids (%)
Sample Total amount of triterpene
acids (%)
254 nm (PPI) 260 nm (PPSD) 254 nm (PPI) 260 nm (PPSD)
GL1 0.40 0.39 GL26 0.24 0.23
GL2 0.48 0.51 GL27 0.23 0.24
GL3 0.64 0.63 GL28 0.45 0.51
GL4 0.38 0.36 GL29 0.47 0.48
GL5 0.30 0.32 GL30 0.39 0.37
GL6 0.42 0.41 GL31 0.22 0.20
GL7 0.48 0.53 GL32 0.27 0.31
GL8 0.25 0.23 GL33 0.18 0.20
GL9 0.36 0.39 GL34 0.09 0.12
GL10 0.61 0.59 GL35 0.08 0.08
GL11 0.46 0.43 GL36 0.11 0.10
GL12 0.40 0.38 GL37 0.09 0.08
GL13 0.51 0.54 GL38 0.28 0.29
GL14 0.38 0.44 GL39 0.25 0.27
GL15 0.35 0.32 GL40 0.23 0.19
GL16 0.52 0.56 GL41 0.21 0.19
GL17 0.35 0.34 GL42 0.22 0.22
GL18 0.32 0.32 GL43 0.15 0.15
GL19 0.35 0.39 GL44 0.58 0.62
GL20 0.43 0.50 GL45 0.20 0.23
GL21 0.30 0.32 GL46 0.25 0.24
GL22 0.50 0.48 GL47 0.12 0.09
GL23 0.31 0.33 GL48 0.10 0.06
GL24 0.58 0.62 GL49 0.14 0.15
GL25 0.59 0.62 GL50 0.05 0.07
7.4.7.5 Repeatability of the quantification method
The repeatability of the chromatographic quantification of triterpene acids was evaluated in a single sample (n=6). It shows a CV of 1.2% for PPI and 3.1% from PPSD.

D. A. Frommenwiler Chapter 7
151
7
7.4.8 Setting new acceptances criteria for identity and minimum content
The development of a new method requires the establishment of new acceptance criteria. This is because the sequence of zones evaluated for identification has changed (Figure 7.1). A new description of the HPTLC fingerprint is proposed in Figure 7.6, based on an image (GLm) that was generated by electronically merging all passing samples (GL2-8, GL10-24). Other faint zones not described may be present. Passing samples should contain at least the zones (c) to (h).
For the assay, the quantification data of samples that pass the identification test (GL2-8 and 10-24) were considered. Based on the lowest value for total triterpene acids in the PPI of these samples, the minimum content expressed as ganoderic acid A is proposed at 0.25%.
Figure 7.6 Fingerprints of G. lucidum pooled sample (GLm) and USP G. lucidum extract (GLe) under UV 366 nm after derivatization, and their description in the format of a table.
7.4.9 Economic aspects of the proposed method
The proposed HPTLC method is an economic alternative for evaluation of the quality of GLFB. It allows identification, purity testing and quantification of triterpene acids, all in one analysis, and thus reduces the number of tests to be performed (e.g. UHPLC assay). The economic aspects of the new method in comparison to the approach of the USP monograph (HPTLC for identification and UHPLC for the assay of total triterpene acids) are presented in
Table 7.3. Costs of the analysis, volume of solvent and time were calculated for 1-13 samples (the capacity of each HPTLC plate plus one standard and one track for the refe-rence extract). The total analysis cost and time per sample for the new HPTLC method were calculated based on the added costs/time of preparation and analysis of one sample. For the USP methods (HPTLC and UHPLC), the costs/time for sample preparation and analysis of one sample were combined. For the UHPLC method, cost/time of an additional run for one standard solution was added to the calculation. Details of all calculation are described in supplementary information.
Also, the proposed sample preparation method is faster, less expensive and uses less solvent than those of USP HPTLC and UHPLC. Furthermore, the new HPTLC method is more than 1.5 times shorter, uses 8 times less solvent, and costs about 75% of the UHPLC analysis of 1 sample. For the same kind of information to be obtained, the costs of the USP HPTLC and UHPLC methods need to be combined. While for the HPTLC methods,

D. A. Frommenwiler Chapter 7
152
7
the fixed cost of the analysis remains the same for one to thirteen samples, for the UHPLC method the costs per sample are additive.
Table 7.3 Comparison of different economic aspects and time consumption of the new HPTLC method with the methods of USP (HPTLC and UHPLC)
New HPTLC method
USP – HPTLC ID method
USP – UHPLC method
Sample preparation time (approxi-mately) per sample
23 minutesa 35 minutesa > 60 minutesb (ex-
cluding SPE) Volume of solvent (sample prepa-
ration) per sample 5 mL 52 mL
120 mL (excluding SPE)
Approximate cost for preparation of one sample
1.0 CHF 4.70 CHF 11.90 CHF (ex-cluding SPE)
Number of samples and reference solutions analyzed per run
13 samples + 2 references
13 samples + 2 reference
1 sample or refe-rence
Analysis time for 1-13 runs (equi-valent to one plate)
90 min 82 min (58 to 754) + 58
min Approximate cost for the analysis
of 1-13 samples (equivalent to one plate)
26.10 CHF 33.60 CHF (12.00 to 156.00)
+ 12.00 CHF
Volume of solvent used for the analysis of 1-13 samples, plus re-
ference extract and substance 20 mL 50 mL
(23.2 to 301.6) + 23.2 mL
Total analysis costs of one sample
27.10 CHF 74.20 CHF
Total analysis costs per 13 samples 39.10 CHFa 417.40 CHFa,b Total analysis time per sample 113 minc 293 mind
Total analysis time per 13 samples 113 minc 1349 mind
a Samples prepared in parallel; b 2 samples prepared in parallel; cost and analysis time for the new HPTLC methodc, and for the USP HPTLC and UHPLC methods combinedd. Swiss Francs (CHF).
7.4.10 The future
The use of pattern recognition tools can facilitate the routine quality control analysis of herbals and transfer the knowledge of experts into machines. By using existing descriptions of the HPTLC fingerprints, e.g. those in the style of the European Pharmacopoeia, which are similar to that in Figure 7.6, it is possible to automate the identification of samples. For example: a prototype functionality of the visionCATS software, used for identification of GLFB, allows entering peak information such as RF, acceptable ∆RF, color appearance value (Hue), variation in color appearance (∆Hue) and intensity. In this experiment, the USP reference extract was used as reference for the pattern. The peaks (c) to (h) were included in the acceptance criteria. The parameters for each peak are described in Table 7.4. Based on the information given to the software, all samples that passed or failed the visual evaluation also passed or failed the software evaluation. One exception is sample GL20, in which the zone (c) presents different color than ergosterol and was rejected by the software. Visual and software interpretations were very similar for zones present or absent (see Table 7S4 in supplementary information).
Table 7.4 Values of RF, colors and intensity used for pattern recognition for each peak. Peaks from Figure 7.6
RF ∆RF Hue ∆Hue Minimum Intensity
Detection
(c) 0.59 0.03 0.585 0.05 0.05
UV 366 nm after
derivatization
(d) 0.35 0.02 0.560 0.12 0.05 (e) 0.30 0.02 0.400 0.20 0.05 (f) 0.25 0.02 0.400 0.20 0.05 (g) 0.19 0.02 0.576 0.20 0.05 (h) 0.15 0.02 0.400 0.20 0.05

D. A. Frommenwiler Chapter 7
153
7
In addition, it is possible to describe the quality of an herbal more holistically, taking into account its entire fingerprint. In this type of assessment, the presence or absence of peaks in the chromatogram and their intensities are compared to the specifications, which are displayed in the shape of a “window” (e.g. Figure 7.7, dotted grey lines).
Figure 7.7 Acceptance window model to evaluate quality of Ganoderma lucidum fruiting body. A: Example of GIe – passes test. B: two examples that fail tests (GL1 and 39). Arrows indicate zones of profiles that are out of the acceptance criteria. PPI from image after derivatization under UV 366 nm.
Such evaluation can be done using a suitable software (e.g. Microsoft Excel) and the RF and intensity in arbitrary units (a.u.) values from the PPI. To set the acceptance criteria, the passing samples (GL2-8, 10-24) are used as references. The lowest and the highest intensity values for each RF among these samples are used to create the lower and upper limits of the “acceptance window”. The acceptance criteria were defined so that 95% of

D. A. Frommenwiler Chapter 7
154
7
the whole profile is within that “window” to be immune to slight RF shifts and very intense signals at the application position. In order to define the acceptance range every profile has to be normalized to its surface to emphasize the shape of the profile. Additionally, this normalization avoids that the range between lower and upper limit depends on concentrated or faint signals, which limits the specificity of the “acceptance window”. A profile of an unknown sample has to be normalized prior to evaluation. An average PPI was created based on these twenty-two samples (black line, Figure 7.7).
The new model was tested with the 50 samples and USP reference extract. The passing samples and the USP reference extract were within the acceptance window (e.g. GLe, green profile Figure 7.7 A). All the samples that have failed the visual and peak evaluation in the previous section (GL1, 8, 25-50) showed zone(s) above and/or below the acceptance range, as observed in the examples of Figure 7.7 B (orange and blue profiles). Sample GL1 (orange profile) shows additional zones (orange arrows), absent in the reference fingerprints of GLFB. Sample GL39 (blue profile) shows no zone at the position of ganoderic acid A (RF 0.19) and at RF 0.30, and a zone at RF 0.80 more intense than this of the acceptance range. A good correlation between the visual evaluation and the window model was observed.
7.5 Conclusion The presented HPTLC method offers a simplified yet comprehensive assessment of quality of Ganoderma lucidum fruiting body. On the same plate and in one analysis, using the same reference substances as the USP monograph (USP ganoderic acid A and Ganoderma lucidum powdered dry extract RS), a sample can be identified, the presence of confounding species can be excluded and the minimum content of triterpene acids expressed as ganoderic acid A can be established. Applying standard HPTLC conditions and analyzing 13 samples per plate, analysis time is 113 min (for 1-13 samples, including sample preparation) and cost for chromatography per sample is 27.10 CHF. Further validation of the quantitative method under routine conditions is pending.
Disclosure statement
The authors declare that they have no competing interests
7.6 References [1] He, T.-T.; Ung, C. O. L.; Hu, H.; Wang, Y.-T. Good manufacturing practice (GMP) regulation of
herbal medicine in comparative research: China GMP, cGMP, WHO-GMP, PIC/S and EU-GMP. Eur. J. Integr. Med. 2015, 1, 55–66.
[2] Cavaliere, M. and Blumenthal, M. Review of FDA’s Final GMPs for Dietary Supplements. HerbalGram. 2007, 76, 58–61.
[3] World Health Organization (WHO). WHO guidelines on good manufacturing practices (GMP) for herbal medicines; WHO Library Cataloguing in Publication Data: Geneva, 2007.
[4] Keitel, S. Inside EDQM: The Role of the Pharmacopeia in a Globalized World. Pharmtech. 2010, 34, 4.
[5] World Health Organization (WHO). Review of world Pharmacopoeias. In International Meeting of World Pharmacopoeias, Geneva, March 01-03.2012.
[6] Folcarà, S. C. Medicamentod a Base de Plantas: el Reto de la Calidad y la Framacopea como Hierramenta para Alcanzarla. Revista de Fitoterapia. 2013, 13, 2, 101–122.
[7] Monographs for Ganoderma lucidum Fruiting Body and Ganoderma lucidum Fruiting Body Powder. In The United States Pharmacopoeia (USP) 41–NF36. United States Pharmacopeial: Rockville, USA, 2018, pp. 4629–4635.
[8] Ahmad, M. F. Ganoderma lucidum: Persuasive biologically active constituents and their health endorsement. Biomedicine and Pharmacotherapy. 2018, 107, 507–519.
[9] Chapter 203: High-Performance Thin-Layer Chromatography procedure for identification of

D. A. Frommenwiler Chapter 7
155
7
articles of botanical origin. In United States Pharmacopoeial Convention 40–NF35. United States Pharmacopeial: Rockville, USA, 2017, pp. 258–260.
[10] European Directorate for the Quality of Medicines and Healthcare (EDQM). Chapter 2.8.25: High-performance thin-layer Chromatography of herbal drugs and herbal preparations. In European Pharmacopoeia, 9.0. European Pharmacopoeia: Strassbourg, France, 2017, pp. 295–296.
[11] Frommenwiler, D. A.; Kim, J.; Yook, C.-S.; Tran, T. T. T.; Cañigueral, S.; Reich, E. Comprehensive HPTLC Fingerprinting for Quality Control of an Herbal Drug – The Case of Angelica gigas Root. Planta Medica, 2018, 84, 6-07, 465-474. doi: 10.1055/a-0575-4425.
[12] Chinese Medicine Regulatory Office. Ganoderma. In Hong Kong Chinese Materia Medica Standards, Vol. 9; Chinese Medicine Division, Department of Health Government of the Hong Kong Special Administrative Region: Wanchai, Hong Kong, 2005, pp. 99–123.
[13] Chinese Pharmacopoeia Commission. Monograph for Ganoderma (Lingzhi). In Pharmacopoeia of the people’s Republic of China. The Stationery Office: Beijing, China, 2015, pp. 205–206.
[14] Upton, R.; Graff, A.; Länger, R.; Sudberg, S.; Sudberg, E.; Williamson, E.; Reich, E.; Bieber, A.; Mattioda, J.; Mutch, J.; Chen, J. Reishi Mushroom (Ganoderma lucidum),” in American Herbal Pharmacopoeia (AH) and Therapeurical Compendium, R. Upton and C. Petrone, Eds. Scotts Valley: The American Herbal Pharmacopoeia, 2000, pp. 1–24.
[15] The International Association for the Advancement of High Performance Thin Layer Chromatography (HPTLC Association). Ganoderma lucidum - fruiting body. https://www.hptlc-association.org/methods/methods.cfm (accessed Nov 15, 2019).
[16] Xie P.; Yun, Y. Chromatographic fingerprints for the detailed illustration of the quality of herbal medicines; Fujian Science and Technology Press: Beijing/China, 2010

D. A. Frommenwiler Chapter 7, Supplementary information
156
7
7.7 Supplementary information Table 7S1 Description of investigated samples. Sample CAMAG Batch Description County
GL1 S16791 Ganoderma lucidum fruiting body US GL2 S13014 Ganoderma spp. Unknown GL3 S16790 Ganoderma lucidum fruiting body US GL4 S17874 Reishi mushroom - Stem, pores pileal layer Canada GL5 S16484 Ganoderma lucidum fruiting body Unknown GL6 S18406 Ganoderma lucidum fruiting body US GL7 S18405 Ganoderma lucidum fruiting body Unknown GL8 S18403 Ganoderma lucidum fruiting body US GL9 S12211 Ganoderma lucidum fruiting body US
GL10 S16726 Ganoderma lucidum fruiting body powder Germany GL11 S12215 Ganoderma spp. US GL12 S12018 Ganoderma lucidum fruiting body powder China GL13 S12016 Ganoderma lucidum fruiting body powder China GL14 S2351 G. lucidum fruiting body cultivated on Duan wood Unknown GL15 S16485 Ganoderma lucidum fruiting body Unknown GL16 S12014 Ganoderma lucidum fruiting body powder China GL17 S12214 Ganoderma spp. US GL18 S12015 Ganoderma lucidum fruiting body powder China GL19 S16725 Ganoderma lucidum fruiting body powder Germany GL20 S12020 Ganoderma lucidum fruiting body powder US GL21 S16663 Ganoderma lucidum fruiting body Canada GL22 S15945 Ganoderma lucidum fruiting body France GL23 S17873 Reishi mushroom - Stem, pores pileal layer Canada GL24 S16594 Ganoderma lucidum fruiting body China GL25 S16592 Ganoderma lucidum fruiting body China GL26 S16589 Ganoderma lucidum fruiting body China GL27 S16595 Ganoderma lucidum fruiting body China GL28 S12024 Ganoderma lucidum fruiting body powder US GL29 S2353 Ganoderma lucidum fruiting body Unknown GL30 S12017 Ganoderma lucidum fruiting body powder China GL31 S2347 Ganoderma lucidum fruiting body Unknown GL32 S17872 Reishi mushroom - Stem, pores pileal layer Canada GL33 S16662 Ganoderma lucidum fruiting body Canada GL34 S16680 Ganoderma lucidum fruiting body Germany GL35 S16817 Ganoderma spp. fruiting body ROK GL36 S16795 Ganoderma lucidum fruiting body US GL37 S16799 Ganoderma lucidum fruiting body US GL38 S12026 Ganoderma lucidum fruiting body powder US GL39 S16794 Ganoderma lucidum fruiting body powder US GL40 S16793 Ganoderma lucidum fruiting body powder US GL41 S16798 Ganoderma lucidum fruiting body powder US GL42 S16792 Ganoderma lucidum fruiting body, whole US GL43 S16797 Ganoderma lucidum fruiting body US GL44 S16789 Ganoderma lucidum fruiting body (antler form) US GL45 S2357 G. lucidum fruiting body cultivated on Duan wood Unknown GL46 S12027 Ganoderma lucidum fruiting body powder US GL47 S18404 Ganoderma lucidum fruiting body powder Unknown GL48 S2355 Ganoderma lucidum fruiting body powder Unknown GL49 S1202S2 Ganoderma lucidum fruiting body powder US GL 50 S12025 Ganoderma lucidum fruiting body powder US
GLe S18403 G. lucidum fruiting body reference extract (USP) Lot
#F012B0 US
Gle1 R11732 G. lucidum fruiting body extract (USP), Lot #B120665 US Gle2 S17878 G. lucidum mushroom extract Canada

D. A. Frommenwiler Chapter 7, Supplementary information
157
7
Sample CAMAG Batch Description County Gle3 S18014 G. spp entire mushroom extract Canada Gle4 S17879 G. lucidum mushroom extract Canada GLe5 S17877 G. lucidum mushroom extract Canada GLe6 S17876 G. lucidum mushroom extract Canada GLe7 S16756 G. lucidum mushroom extract US GLe8 S16737 G. lucidum mushroom extract Germany GLe9 S17881 G. lucidum mushroom extract Canada GA S12028 Ganoderma applanatum fruiting Body wildcrafted US GS S16815 Ganoderma sinensis reference extract US IO S16828 Inonotus obliquus fruiting body US HE S16685 Hericium erinceus fruiting body Germany GF S16643 Grifola frondosa fruitning body US FF S16687 Fomes fomentarius fruiting body powder Germany CC S16675 Coprinus comatus fruiting body Germany CS S16681 Cordyceps sinensis fruiting body Germany AB S16674 Agaricus balzei fruiting body Germany LE S16676 Lentinus edodes fruiting body Germany
PL S16678 Phellinus linteus (maybe F. fomentarius) fruiting
body Germany
PS S16686 Pleurotus spp. fruiting body powder Germany TF S16683 Tremella fuciformis fruiting body Germany
Table 7S2 Description of the six tested extraction methods.
Method description
400.0 mg of powdered G. lucidum fruiting body were mixed with 5.0 mL of solvent and then prepared according to the method. After centrifugation, the supernatant was used as test solution.
Method Track in
Figure 7S1 Preparation
USP reflux 3 and 4 Solvent: ethanol; method: sonicated for 30 minutes at 60°C
Sonication 15 minutes
5 and 6 Solvent: ethanol; method: sonicated for 15 minutes
Sonication 30 minutes
7 and 8 Solvent: ethanol; method: sonicated for 30 minutes
Shaking 15 minutes
9 and 10 Solvent: ethanol; method: shaken for 15 minutes
Shaking 30 minutes
11 and 12 Solvent: ethanol; method: shaken for 30 minutes
Sonication 30 min, 60°C
13 and 14 Solvent: ethanol; method: sonicated for 30 minutes at 60°C
Table 7S3 Concentration ranges of GLFB pooled test solution in which the relevant peaks are within linear range prior to derivatization.
Peak on Figure
7.5
UV 254 nm (PPI) UV 260 nm (PPSD)
Concentration of test solution
in mg/mL
Amount of sample on the plate in µg
(absolute)
Concentration of test solution
in mg/mL
Amount of sample on the plate in µg
(absolute)
1 25-80 125-400 15-80 75-400
2 25-80 125-400 20-80 100-400
3 15-80 75-400 20-80 100-400
4 15-80 75-400 15-80 75-400

D. A. Frommenwiler Chapter 7, Supplementary information
158
7
5 15-80 75-400 20-80 100-400
6 15-80 75-400 20-80 100-400
7 25-80 125-400 20-80 100-400
Table 7S4 Assessment of the identity of G. lucidum by a pattern recognition software, based on the presence of six zones in the fingerprint after derivatization under UV 366 nm.
Sample CAMAG Batch Pass/fail (c) (d) (e) (f) (g) (h) GL1 S16791 GL2 S13014 GL3 S16790 GL4 S17874 GL5 S16484 GL6 S18406 GL7 S18405 GL8 S18403 GL9 S12211 GL10 S16726 GL11 S12215 GL12 S12018 GL13 S12016 GL14 S2351 GL15 S16485 GL 16 S12014 GL 17 S12214 GL 18 S12015 GL 19 S16725 GL 20 S12020 GL 21 S16663 GL 22 S15945 GL 23 S17873 GL 24 S16594 GL 25 S16592 GL 26 S16589 GL 27 S16595 GL 28 S12024 GL 29 S2353 GL 30 S12017 GL 31 S2347 GL 32 S17872 GL 33 S16662 GL 34 S16680 GL 35 S16817 GL 36 S16795 GL 37 S16799 GL 38 S12026 GL 39 S16794 GL 40 S16793 GL 41 S16798 GL 42 S16792 GL 43 S16797 GL 44 S16789 GL 45 S2357 GL 46 S12027 GL 47 S18404 GL 48 S2355 GL 49 S1202S2

D. A. Frommenwiler Chapter 7, Supplementary information
159
7
Sample CAMAG Batch Pass/fail (c) (d) (e) (f) (g) (h) GL 50 S12025
: passing samples or zones; : failing samples or zones
Figure 7S1 Comparison of the intensity of the main peaks between RF 0.1 and 0.5 of sample GL33, extracted with 6 different methods in duplicate. Detection: PPI under UV 254 nm prior to derivatization.

D. A. Frommenwiler Chapter 7, Supplementary information
160
7
Figure 7S2 Image of the plate derivatized with 10% sulfuric acid in ethanol, taken at different times. Track 1: ganoderic acid A 0.5 mg/mL; track 2: GL7; track 3: USP G. lucidum extract (GLe1); track 4: G. lucidum USP reference extract (GLe); track 5: G. lucidum USP reference extract (1 µL application volume); tracks 6-13: G. lucidum extract samples GLe2-9, respectively.

D. A. Frommenwiler Chapter 7, Supplementary information
161
7
Figure 7S3 Images of the plate derivatized with 10% sulfuric acid in methanol, taken at different times. Track 1: ganoderic acid A 0.5 mg/mL; track 2: GL7; track 3: USP G. lucidum extract (GLe1); track 4: G. lucidum USP reference extract (GLe); track 5: G. lucidum USP reference extract (1 µL application volume); tracks 6-13: G. lucidum extract samples GLe2-9, respectively.

D. A. Frommenwiler Chapter 7, Supplementary information
162
7
Figure 7S4 Profiles of G. lucidum fruiting body USP reference extract (R11732), recorded between 3 and 18 minutes after derivatization.
Figure 7S5 UV spectra (overlaid) of ganoderic acids A, B, D, G, C2 prior to derivatization (absorption mode).
Figure 7S6 UV spectra (overlaid) of eight peaks between RF 0.1 and 0.5 and ergosterol, prior to derivatization (absorption mode) in the pooled sample.

D. A. Frommenwiler Chapter 7, Supplementary information
163
7
Figure 7S7 Calibration curve for Ganoderic acid A in the range 0.04 to 0.1 mg/mL. Left image: PPI at UV 254 nm prior to derivatization; right image: PPSD at UV 260 nm prior to derivatization.
Calculation of the costs and time for preparation and analysing the samples
The prices per mL of high-purity solvent (used to prepare the mobile phase and samples), of the stationary phases and single use disposable material were obtained from Sigma Aldrich, Merck and Alcosuisse websites: https://www.sigmaaldrich.com /switzerland-suisse.html; http://www. merckmillipore.com/CH/de; and https://www.alcosuisse.ch/ (accessed on 20.12.2019).
Calculation excludes instruments, glass apparatus, personal and solid phase extraction SPE (in the case of UHPLC analysis).
a. Preparation cost per sample: the prices per mL of solvent used in each method and single use disposable material such as centrifuge tubes, plastic pipettes, and syringe filter, were used for calculation. b. Preparation time per sample: This calculation was done mainly based on the
extraction time and other steps (such as centrifugation or filtration and precise weighing). Milling time was excluded from calculation.
c. Analysis cost for 1-13 samples: The costs for HPTLC analyses were calculated based on the volume of solvent used per plate and the price of a single plate. This calculation excluded the price per filter paper because it is not predictable how many times a single sheet can be used for the USP HPTLC method. The costs for UHPLC analyses were calculated for 1-13 samples, based on the volume of solvent used per run (including equilibration and cleaning steps) plus one run for the standard solution and the cost of a UHPLC column shared by 1000 runs.
d. Analysis time per sample: For the HPTLC methods, the time spent in each step was used for the calculation (e.g. application, development, documentations, derivatization). For the UHPLC analysis, this calculation was done based on the gradient time plus 10 minutes for equilibration before the first run.

D. A. Frommenwiler Chapter 7, Supplementary information
164
7
e. Total analysis cost/time per sample: The total cost/time for the new HPTLC analyses was calculated based on the cost/time for preparation of one sample, plus the analysis cost/time one plate (with capacity for 1-13 samples). The cost/time for the USP analysis (combined HPTLC plus UHPLC) was calculated based on the added cost/time for preparation of one sample with both methods, plus the added cost/time for the HPTLC analysis of 13 samples and UHPLC analysis of 1 sample plus 1 standard solution.
f. Total analysis cost/time per 13 samples: The cost/time for the new HPTLC analyses was calculated based on the cost/time for preparation of one sample multiplied by 13, plus the analysis cost/time for one plate. The cost for the USP analysis (combined HPTLC plus UHPLC) was calculated based on the added cost for preparation of one sample with both methods multiplied by 13, plus the added cost for the analysis of 13 samples with both methods. For the UHPLC method the cost of one run (for the standard solution) was added. The total analysis time for the USP method was calculated based on the sample preparation time of one sample (13 samples were prepared in parallel) for the HPTLC method, plus the preparation time of 7 samples (2 samples were prepared in parallel) for the UHPLC method, plus the analysis time for the 13 samples with each method, and plus the analysis time of one run (for the standard solution).

Part III: Overview, general discussion & conclusions


Chapter 8: Overview and general discussion


D. A. Frommenwiler Chapter 8
169
8
8.1 Background
8.1.1 The evolution of HPTLC in the context of the Pharmacopoeias
Quality control of herbal drugs has its roots in botanical morphology and organoleptic testing. One of the first chemical methods used in the quality control of herbal drugs were tests for the detection of functional groups by color reaction [4]. Around the year 1950, thin-layer chromatography (TLC) has started to become a popular technique [130]. Therefore, in subsequent years, TLC was the first chromatographic method adopted by most pharmacopoeias as an identification method of herbal drugs, in combination with morphological analysis [6]. Over many years, the identification by TLC in the phar-macopoeias was mainly focused on the evaluation of few (1-3) specific markers (e.g., echinacoside in Echinacea sp.) rather than the evaluation of the entire fingerprint.
The first edition of the European Pharmacopoeia (Ph. Eur.), published in 1969, includes a general chapter for TLC, in which few parameters are described (e.g., manual preparation of plates, application of the samples and the type of chamber used) [131]. The lack of description, validation, and standardization of the parameters led to a lack of reproducibility of the TLC methods.
In 1989, a new TLC chapter (V.6.20.2) was published in the 13th fascicle of the 2nd edition of the Ph.Eur. [132], that in the Ph. Eur. 3.0 became the chapter (2.2.27), with no modification [133]. It comprised a more detailed description of the chromatographic (TLC) process and the type of instrumentation used. This chapter introduced many options to the analyst: use of prefabricated plates, spot or band application with different sizes, regular, two-dimensional or horizontal development, use of flat bottom or twin-through chambers, and so forth. However, there was still no consensus on a standard methodology to be applied. Furthermore, the identification was still performed by comparing the spots obtained in the chromatogram of the test solution with those of the chemical reference substances.
In 1994, with the approval of the Dietary Supplement Health and Education Act (DSHEA) in the US legislation, some awareness regarding the need for a more comprehensive identification of herbal dietary supplements had been raised in the herbal industry. According to this legislation, manufactures should produce dietary supplements under good manufacturing practice and should perform proper identification of their material [134]. Following this policy, the way that TLC was performed for the quality control of herbals underwent a modernization. The American Herbal Pharmacopoeia (AHP) was the first compendium to modernize TLC methods for identification. Starting with the monograph on hawthorn leaf with flower, published in 1999, it included images of the HPLTC chromatograms under multiple detections and described more precisely the HPTLC parameters [135]. It was also the first to mention the term “HPTLC fingerprint” reference.
Given the need for standardization and modernization of the TLC methodology in the ana-lysis of herbal drugs, two important papers were published in the year 2003. First, in their article published in Pharmeuropa [136], Reich et al. pointed out the need for some improvements in the general TLC method description of the Ph. Eur., focusing on the standardization of the experimental details. The authors view High-Performance TLC (HPTLC) as the miniaturization of TLC, with a special stationary phase consisting of fine particles and customized parameters. Second, Koll et al. [137] published in the Journal of AOAC the outcome of her thesis: a pioneer work about the validation of HPTLC methods for identification of herbal drugs, using standardized HPTLC methodology. These papers became the basis for the modernization of chapter 2.2.27 in the 5th edition of the Ph. Eur. (2005) [138], in which HPTLC was mentioned for the first time in this pharmacopoeia and for the upcoming new HPTLC concept. In this chapter, some parameters, such as pre-treatment of the plate and sample application, were amended. Other parameters, such as

D. A. Frommenwiler Chapter 8
170
8
documentation and quantitative TLC, were introduced. The 5th edition also included the first monographs using TLC and HPTLC, with differential parameters of the latter written in brackets.
In parallel, the United States Pharmacopoeia (USP) general chapter <621> Chromato-graphy [139] was revised and harmonized with Ph. Eur. 2.2.27.
In the following years, other publications dealt with the topic of standardization and validation of HPTLC methods (e.g., [123] and [140]). During that time, the term High-performance TLC (HPTLC) was widely used in the scientific community and literature. However, there was still no official definition of or agreement on the HPTLC concept.
In 2009, for the first time, an official yet non-binding compendium (Dietary Supplement Compendium of the USP [141]) published color images of HPTLC and TLC fingerprints of herbal dietary supplements. That marked a new possibility: evaluating the identity of herbs by comparing the fingerprints of the tested samples with reference images. Meanwhile, the parameters for the description of the TLC and HPTLC chromatograms in the leading pharmacopoeias have changed to be more comprehensive.
HPTLC and TLC co-exist in some monographs of the Ph. Eur. until today, yet the official transition from TLC to HPTLC began in December of 2015 with the United State Pharmacopoeia chapter <203> [142] coming into effect followed by the Ph. Eur. chapter 2.8.25 [143] in January of 2017. Both chapters are based on the standard operating procedure for HPTLC published in 2012 by the International Association for the Advancement of HPTLC [144]. In these chapters, the concept of HPTLC is made official, representing a milestone in the field of quality control of herbals as all the HPTLC parameters are well defined and optimized for practicality.
On this basis, this thesis aims to explore the capabilities of standardized HPTLC in the quality control of herbal drugs, preparations, and products. The hypothesis was that if HPTLC is used to its full potential during identification of herbals, additional information about the purity and content of the analyzed sample can be obtained in a single analysis. Certain tests could be eliminated and, consequently, the quality control could be performed in a simpler and more cost-efficient way.
Because quality control is related to regulation, capabilities of analytical techniques, and their routine feasibility, these topics were reviewed before presenting the new findings. The goal of this literature review was to understand how different regulations tackle these quality requirements in two different regions of the world. Secondly, it was aimed to understand the concepts and requirements of the quality of herbals and to compare different techniques used for its quality control.
8.1.2 The regulatory environment concerning the quality of herbals
Besides natural and processing factors that can directly affect the quality of herbal drugs, preparations, and products, several authors (e.g., [20] and [19]) have stated that different regulatory frameworks can also impact the quality of herbals. The regulation of herbals exists to protect the consumer and to ensure good quality, safe, and efficacious material. It could mean that a less stringent regulatory framework may be expected to result in products of lower quality.
Herbal products do not fit a single specific regulatory category in any country/region. De-pending on their intended use, preparations, dosages and dosage forms, herbal products can fall into five main groups: medicinal products, medical devices, cosmetics, food supplements, and food. In this discussion, the emphasis is given to “medicines” and “food supplements”.
In the regulatory category “medicinal product”, the herbals need to undergo a strict assess-ment of quality, safety, and efficacy before their marketing. Herbal medicinal products are allowed to make therapeutic claims. Depending on the substance, indication, and intended

D. A. Frommenwiler Chapter 8
171
8
claim, different levels of evidence are required for efficacy. In some regulation subclasses (e.g., well-established medicinal use medicines –WEU– in EU), the therapeutic effects can be supported with scientific literature. A combination system (new trials plus scientific publications) can also be used. In the Traditional Herbal Medicinal Products (THMP) subclass, the therapeutic effects are proven based on long-standing traditional use (described in bibliographical or expert evidence) for minor indications. Regarding quality, requirements are the same for all types of medicines. The monographs from official pharmacopoeias are mandatory for testing the quality of herbal medicinal products. If no monograph is available, manufacturers need to develop their own methods, set specifications, and prove the quality, including the production under GACP, GSP, and GMP of their product [31] [30].
In many countries, food and food supplements are regulated under the same law, as in the case of the EU. The food supplement category generally does not allow claims concerning treatment or cure of diseases, but only nutrition (e.g., “low fat”, “low sugar”, etc.) or limited health claims (e.g., reduction of gastrointestinal discomfort, designated to healthy consumers to maintain their health). Food supplement regulation is less stringent than that of the medicinal products category. Quality (and in some cases, the safety) of the product may be tested, depending on the jurisdiction. Efficacy assessment is generally not required. Usually, products are exempted from marketing approval, if they have been already commercialized before a specific period. This is because they are generally considered as safe based on a history of use. On the other hand, novel food (products marketed after this specific date) should undergo an assessment to prove safety and quality. Unlike for medicinal products, there exist no compulsory guidelines for quality control of food supplements in many countries/regions [20] [24].
By comparing the requirements of these two categories, it was observed that the medicinal products have the most stringent criteria concerning quality, safety, efficacy over the milder criteria for food supplements, resulting in the production of higher quality herbal products. This situation often leads to very relevant differences in the quality of the marketed products of the two categories, in particular with respect to adulteration frequently being detected in food supplements.
8.1.3 The quality control of herbals and the state of the art of analytical tech-nology
Quality control is the process designated to demonstrate compliance with the specifications and to detect quality problems in a product [145]. Performing quality control of herbals is particularly challenging. Several aspects, such as environment and genetic factors, natural variation, presence of contaminants, adulterants, misidentification, and others, can compromise the quality of the herbal drug, leading to low-quality preparations and products. For ensuring good quality herbals, it is necessary to enforce the adoption of GACP, GMP, GSP, the standardization and validation of processes, and the establishment of quality specifications [12].
Pharmacopoeias and non-official compendia are crucial instruments for the quality control of herbals. They provide the specifications that include the test methods and criteria of acceptance for individual herbal drugs and preparations, in the form of monographs [13] [146]. During these evaluations, different techniques are recommended, targeting aspects of identity, purity, and content. Among them are the morphoanatomical, genomic, spectroscopic, and chromatographic techniques.
Morphoanatomical identification of herbal products through macroscopical, microscopical, and organoleptic analysis are low-cost methods, that, in some cases, are also suitable for purity testing. Its applicability has some limitations in the case of powdered herbal drugs and is not suitable for extracts and other herbal preparations [69] [71].
Genomic techniques, such as DNA barcoding, represent a powerful and sensitive method
D. A. Frommenwiler Chapter 8
172
8
for identification and test for contaminants with multiple other species, which is independent of seasonal variation and age of the plant. However, it is an expensive method, requires solid knowledge of the DNA barcode of the species. It is not recommended for the identification of highly processed material (e.g., extracts), and can neither distinguish between different plant parts of the same species, nor detect adulteration with chemicals [72].
Spectroscopic techniques, such as NIR and UV/VIS spectroscopy, represent low to medium cost methods that are simple, rapid, flexible, easy to use, and require little to no sample preparation. They produce qualitative and quantitative results and have applications for identification, tests for purity, and assays. Shortcomings are: low sensitivity and the need for a large number of samples to calibrate the instrument for automatic identification routines (NIR) [81]; the detection of substances is limited to the presence of chromophoric groups, and the applicability for identification is limited (UV) [6]. NMR is a non-destructive, reproducible, and robust technique that does not require complicated sample preparation, that can be used without separation techniques, and can perform quantification. It is the most universal detection. Limitations are the cost for instruments, consumables, and maintenance, as well as low sensitivity. Interpretation of data from complex samples (e.g., herbals) may require chemometric methods [7] [93].
Chromatographic techniques, such as GC, HPLC (coupled with different detectors), and (HP)TLC, are widely used in the monographs for identification, tests for purity, and assay. Their greatest advantage is the possibility of separating complex mixtures [106]. While GC is a robust technique, has high separation efficiency, and can provide sensitive detection of compounds, its applicability is limited to the detection of volatile substances (e.g., analysis of essential oils) [112]. HPLC is a well-established, fully automated technique with vast literature available in the field of herbals, and it is suitable for analyzing a wide range of constituent classes [118]. Nevertheless, it has medium to high instrumentation costs, uses large volumes of solvent, samples may require additional clean-up steps, and the most common detectors are not universal [119] [147]. In monographs, HPTLC is used mainly for identification and purity testing, and in some rare cases, for quantification. It usually does not require cumbersome sample preparation, consumes little solvents, and allows multiple detections in a single analysis through chemical derivatization [122]. Limitations are lower resolution and separation capability, sensitivity, precision and linearity range, and variations in the selectivity between the plates from different manufacturers [148].
In conclusion, there exists no absolute method capable of evaluating all quality parameters for herbals. Instead, a combination of methods is often applied. It is also important to con-sider that: (1) the chemical composition of an herbal is responsible for its pharmacological activity and its safety, and thus the focus of the quality control and assurance should rely primarily on chemical characteristics of the herbal; (2) a large number of tests are prescribed to describe the quality of the material, increasing the associated cost. Instead, the exploitation of one technique for its entire potential could help to reduce the number of analyses and cost. In this context, HPTLC is a simple, visual, and pragmatic technique capable of delivering reliable and reproducible results based on standardized methodology, improved software, and instrumentation.
8.2 The new findings As shown in section 8.1.1, TLC has officially been part of the quality control of herbals for at least 70 years. Advances and standardization of the technique and new regulation of herbals have improved the way herbals are identified and controlled. Methods described in the pharmacopoeia are now reproducible and allow the use of HPTLC for more than just identification. The next subsections will discuss the contribution of this work to the advances in the field of quality control of herbals, after the publication of chapters USP <203> and Ph. Eur. 2.8.25. For that, five studies were performed. They are discussed in

D. A. Frommenwiler Chapter 8
173
8
sections 8.2.1 to 8.2.5.
8.2.1 HPTLC as a tool for assessing the market situation concerning the quality of herbals
As mentioned in section 8.1.2, herbal products regulated in different categories could be of different quality. This fact has been demonstrated by the increasing number of reports on low quality herbal products. These reports are related mainly to accidental and intentional adulterations with chemical substances, plant parts, or extracts, for example (as discussed in [72], [149], and many other publications).
Because quality assessment starts with suitable identification of the herbal ingredient, se-veral problems can already be detected during this step. HPTLC, as recommended for assessing the identity of herbals can also deliver valuable data describing their quality. When applying the new chapter Ph. Eur. 8.2.25., the entire fingerprint can be used for the evaluation rather than only a few zones, and detecting the presence or absence of certain zones may indicate quality problems [122].
This approach is the first step towards better exploiting HPTLC data. It was used in the three case studies described in chapter 3. Their objectives were: (1) to assess the quality of different herbal drugs, preparations, and products, as a function of their regulation category; and (2) to show the usefulness of HPTLC, as described in chapters USP <203> and Ph. Eur. 2.8.25, as a tool for detecting quality problems, mainly adulterations (other plants, extracts, synthetic drugs, or other molecules).
For that, the following herbals were chosen according to their market importance and the availability of HPTLC methods for identification ([150] [151] [152]): milk thistle fruits (Silybum marianum (L.) Gaertn.), coneflower (root and herb of Echinacea purpurea (L.) Moench and roots of E. angustifolia DC. and E. pallida Nutt.) and black cohosh root (Actaea racemosa L.). For the two first cases, products regulated as traditional herbal medicinal products (THMP) and food supplements (FS) were purchased in the UK market. For black cohosh, products regulated as dietary (food) supplement (FS) and black cohosh preparations (used as ingredients of the finished products) were purchased in the US market. The HPTLC methods used in this work were adapted from the Ph. Eur.
The most significant deviation from the original methods was the inclusion of the evaluation and interpretation of the entire fingerprint (beyond what is prescribed in the Ph. Eur. mono-graphs). Additional detection modes on the same plate, give access to confirming and complementary information without additional analytical efforts. Examples are shown in.
In the case of purple coneflower herb, the phenolic fingerprint contained a red zone due to chlorophylls. The absence of this zone in the profile of one product, labeled as tincture of E. purpurea herb, led to the conclusion that the declared aerial parts were absent (e.g., Figure 8.1, red arrow, tracks 3). For milk thistle, five samples showed a yellow zone under UV 366 nm before derivatization, not observed in the characteristic fingerprint of the herbal drug (e.g., Figure 8.1, yellow arrows, tracks 6-7). The origin of this zone is not clear, and it could indicate a quality issue of the products, unrelated to excipients. As in the case of coneflower, the detection of a red zone due to chlorophyll (e.g., tracks 6-7, orange arrow, Figure 8.1) helped to confirm the presence of aerial parts, from both milk thistle and other herbal products, in eight MT products. The distinction between the fingerprints of fruit and fruit extract of milk thistle was made possible by the detection of a blue zone at RF 0.13 before and after derivatization, that was present in the fruit and absent in the extract (e.g., Figure 8.1, blue arrows, tracks 4-5). In the case of black cohosh, the goal was to assess the market situation concerning possible adulterations with Chinese Actaea species and deviations from the fingerprint described in the Ph. Eur. monographs.
A general conclusion regarding the quality of the samples and their regulatory classification is shown in Table 8.1. The three case studies showed that (1) the products regulated as THMP had a consistent and homogenous fingerprint, in accordance to

D. A. Frommenwiler Chapter 8
174
8
botanical reference material and authentic samples; (2) Only products classified as food supplements or herbal preparations (powdered herbal drug, extracts) showed quality problems. Those were: lack of characteristic zone(s), overall faint fingerprint, no zone characteristic of the declared herbal drug, or the presence of zones characteristic of adulterants. They accounted for 52.4% of the milk thistle FS, 33.3% of the coneflower FS, 45.5% of the black cohosh FS and 66.6% of black cohosh preparations.
Figure 8.1 How additional detection modes and evaluation of the entire fingerprint can help detecting quality problems: Fingerprints of coneflower and milk thistle under UV 366 nm prior to (left) and after derivatization (right). Blue arrows indicate the presence of a zone characteristic of milk thistle fruit, absent in the extract. Yellow arrows indicate the presence of an additional zone, not characteristic of Milk thistle fruit and present in the products. Red and orange arrows indicate the red zone due to chlorophylls, characteristic of purple coneflower aerial parts and milk thistle aerial parts, respectively.
Table 8.1 Classification of the samples as having good or questionable quality, grouped according to their regulatory status. Percentages are given in relation to the total number of samples of each category and the absolute number of samples in parenthesis.
Milk thistle fruit
Coneflower Black cohosh
Traditional Herbal Medicinal Products (THMP) Good quality samples 100% (10) 100% (11) ─ Questionable quality 0% (0) 0% (0) ─
Food supplements (FS) Good quality samples 47.6% (10) 75% (9) 54.5% (18) Questionable quality 52.4% (11) 25% (3) 45.5% (15)
Herbal drugs / herbal preparations Good quality samples ─ ─ 33.3% (9) Questionable quality ─ ─ 66.6% (18)
If herbal medicines do not meet the acceptance criteria of the pharmacopoeial monograph, these are considered to be adulterated. On the other hand, food supplements that show fingerprint deviating from that of the monograph, but do not claim compliance with it, may not be considered adulterated, unless other undeclared constituents are detected.
In this study it was observed a significant number of food supplements did not comply with their labels claim. These findings confirm that less stringent regulation can negatively affect the quality of herbal products, compromising their safety and efficacy, and misleading the consumers. The great advantage of HPTLC in this context is that using

D. A. Frommenwiler Chapter 8
175
8
existing optimized and standardized HPTLC methods, and evaluating the entire fingerprint under several detections, a range of quality problems was quickly detected.
A manuscript was submitted to Journal of AOAC international: D. A. Frommenwiler, E. Reich, M. H. M. Sharaf, S. Cañigueral and C. J. Etheridge. Investigation of market herbal products regulated under different categories: how can HPTLC help to detect quality problems? The manuscript is shown in chapter 3.
8.2.2 The development of the comprehensive HPTLC fingerprinting concept and its application to Angelica gigas Nakai root
Section 8.2.1 have shown the advantages of exploiting all qualitative information given in an HPTLC analysis using the entire fingerprint and several modes of detection. In the following sections, the quantitative features carried by the HPTLC chromatogram will be explored.
Quantitative TLC analysis started to become popular in the mid-1960s when the first instru-ments for scanning densitometry were commercialized. Since that time, it is still predomi-nantly performed using slit-scanning densitometers [153]. In 1989, quantitative TLC was acknowledged for the first time in the Ph. Eur., when a section “quantitative measurements” was added to the new thin-layer chromatography chapter V.6.20.2 [132] (that later became 2.2.27). Nevertheless, no monograph includes quantification by HPTLC or TLC. One of the possible reasons is that scanning densitometers are expensive and not considered to be standard laboratory equipment. However, this instrument is still essential for development and validation of quantitative HPTLC methods.
At the end of the 20th century, with the onset of the digital age and the introduction of digital cameras, it became possible to carry out a quantitative evaluation based on electronic images. This had been initially applied to electrophoresis and then to TLC analysis [154]. The new quantitative approach was attractive due to its low cost and convenience. With the evolution of software for image analysis, quantitative aspects of the HPTLC fingerprint became objectively accessible. According to Sherma and Rabel [153], a range of software is available for such analysis, for example, Microsoft Paint, Sorbfil TLC Videodensitometer, UN-SCAN-IT, JustTLC, ImageJ, TLSee, The Gimp, VideoScan, and visionCATS.
Unlike in scanning densitometry, that measures the absorbance or fluorescence of a zone, using a single wavelength per scan, in image analysis, the pixels of three channels (red (R), green (G), and blue (B)) are assessed. To create the core data for HPTLC image analysis, the average luminance may be calculated as L = (1/3 R) + (1/3 G) + (1/3 B) from the RGB channels for each pixel line of a track. Then, L is plotted as a function of the RF
value. The resulting profile of a fingerprint is called “peak profile from image” (PPI). L, as described, is used for images taken at UV 366 nm, and for images taken at daylight or UV 254 nm, 1-L is used.
Because the luminance formula weighs the RGB channels equally, the relative intensities of zones seen in the image of the fingerprint may not be equivalent to the peak heights observed in the PPI. Furthermore, the color impression is lost during this conversion. Con-sequently, for a comprehensive evaluation of the fingerprint, the PPI needs to be analyzed together with the corresponding image. This led to the development of the “comprehensive HPTLC fingerprinting”: tests for identity, purity, and content can be performed in a single analysis, including different detection modes, by combining qualitative and quantitative information from the HPTLC fingerprints and PPI (Figure 8.2). Peak profiles from scanner densitometry (PPSD) can offer complementary, spectrally selective information but are beyond the scope to this work.
The possibilities of applying the concept to identify an herbal drug, detect mixtures with related species (purity), and develop a minimum content test of an analytical marker, using a single analysis, were explored for Angelica gigas root in a case study described in

D. A. Frommenwiler Chapter 8
176
8
chapter 4.
First, the criteria for identification of roots of A. gigas by HPTLC fingerprints were established based on the evaluation of multiple batches of cultivated plant material that met the current quality specifications of the Korean Pharmacopoeia. Five detection modes were included. An average fingerprint representing the typical characteristics of the drug was generated by pooling multiple batches of plant material to yield a single sample. The specificity of the HPTLC method was tested with an analysis of twenty-eight related species, side-by-side. All species were distinguishable.
Figure 8.2. Representation of the concept “comprehensive HPTLC fingerprinting”, using a sample of Angelica gigas root in different detection modes.
For the purity test, two potential confounding species, Chinese angelica (A. sinensis) and Japanese angelica (A. acutiloba), which have the same common name (Danggui) as A. gigas (Koran angelica), were chosen. Their powdered roots were physically mixed with powdered root of A. gigas in different proportions. Mixtures of Angelica gigas with adulterants could be detected at levels as low as 1% based on the presence of the zone of Z-ligustilide. This is a blue zone under UV 366 nm prior to derivatization (at RF 0.58), which is characteristic for the investigated and nine other related species, but is absent in A. gigas. The determination of purity was performed visually, based on the electronic image, and using the PPI.
The third part of the study demonstrated the use of PPI for determining the “minimum content” of the analytical markers decursin plus decursinol angelate in A. gigas root. These substances co-migrate as the most prominent blue zone (RF 0.27) of the fingerprint. For this determination, a quantified reference material of plant material (RMPM) for A. gigas root, distributed by the Forum for the Harmonization of Herbal Medicines (FHH), was used in a single-level calibration. The intent behind that was to avoid the use of expensive and commercially unavailable chemical standards for quantification and to provide a single reference material for identity and purity at the same time.
For the test for minimum content test, the RMPM solution was prepared at a concentration of decursin plus decursinol angelate equivalent to the minimum content previously esta-blished as the acceptance criterion (3.0%). After converting HPTLC fingerprints (images)

D. A. Frommenwiler Chapter 8
177
8
into peak profiles (PPI), the height (intensity) of the zone at RF 0.27 in the samples was compared to the corresponding zone in the RMPM. Interpretation of the results (Figure 8.3) was performed visually as a pass or fail test, where passing samples showed a higher peak than the RMPM. Failing samples showed a lower peak than the RMPM. The same data were also used for quantification of decursin plus decursinol angelate (absolute content) in the samples. Both evaluations are possible because the underlying quantitative method was validated using multilevel calibration and establishing a linear working range.
The method was successfully tested in a collaborative trial involving three laboratories (Switzerland, South Korea, and Vietnam).
This work is the proof of concept for the comprehensive HPTLC fingerprinting, demonstra-ting that identity, presence of adulterants, and minimum content (either as pass/fail output or determining the percentage) for an herbal drug can be obtained from a single HPTLC analysis.
An article was published in a special issue of Planta Medica dedicated to “Quality Control of Herbal Drugs and Preparations”: D. A. Frommenwiler, J. Kim, C.-S. Yook, T. T. T. Tran, S. Cañigueral, E. Reich. Comprehensive HPTLC fingerprinting for quality control of an herbal drug - the case of Angelica gigas root. Planta Medica 2018, 84, 06/07, p 465-474. The manuscript is shown in chapter 4.
Figure 8.3. The test for minimum content of decursin plus decursinol angelate (DA) in 24 samples of A. gigas. Red bar: RMPM, equivalent to accepted minimum content. Green bars: passing samples (intensity decursin + DA peak ≥ RMPM); Grey bars: failing samples (intensity of decursin + DA peak < RMPM. Values in the lower row of the table are the concentrations (%) of decursin + DA in the samples.
8.2.3 Application of comprehensive HPTLC fingerprinting to the testing of purity of ginkgo products
It has been shown that HPTLC fingerprints generated for identification can also be used to detect adulteration and for assaying markers. Within the concept “comprehensive HPTLC fingerprinting”, this section aims to go one step beyond in the test for adulterants and to evaluate the use of the HPTLC for purity limit tests. This approach was evaluated with samples of ginkgo leaf and extracts, as described in chapter 5.
The USP monograph for ginkgo leaf extract [155] prescribes two HPTLC identifications (flavonoids and terpene lactones) two HPLC assays (flavonol glycosides and terpene lactones) and an HPLC limit test for rutin and quercetin in order to detect adulterations. The HPLC assay for total flavonol glycosides is somehow unspecific and can be easily fooled since a hydrolysis step is used to simplify the quantification. In this process, flavonol

D. A. Frommenwiler Chapter 8
178
8
glycosides present in Gingko biloba L. leaf extract are converted into quercetin, kaempferol, and isorhamnetin. The quantification is done based on the sum of the peaks of these three substances. According to the monograph, the test solution should contain between 22 and 27% of flavonoids expressed as flavonol glycosides. Low levels of flavonol glycosides can be easily compensated by the addition of inexpensive rutin and quercetin bulk chemicals, or other inexpensive natural sources of these substances. Instead of looking for alternatives in the methods already existing in the monograph, USP included an additional one-hour HPLC limit test for rutin and quercetin to detect adulterations.
The present study demonstrated that, with additional detection modes, the HPTLC finger-prints produced during identification with an optimized USP method could detect mixtures of ginkgo products not only with rutin and quercetin but also with buckwheat herb and sophora (flower bud or fruit), as it is shown in Figure 8.4.
Figure 8.4. Fingerprints of ginkgo leaf extract, buckwheat herb, sophora fruit, and flower with different detection modes. Arrows point to zones that are positive markers for adulterants in ginkgo samples. Buckwheat herb: red zones (green arrow); Sophora fruit: quenching zones (orange arrow and bracket) and a green zone (white arrow); Sophora flower: two purple zones above and below rutin (black arrows).
Additionally, the same HPTLC method proved suitable for verifying levels of rutin and quer-cetin, providing information similar to that of the HPLC limit test. Instead of assigning values for these substances in the samples, the HPTLC limit test evaluates whether their levels are below the limits of the USP monograph. The test is performed on the PPI from images before and after derivatization. The peak heights of the test solutions were compared to those of the reference solutions prepared at concentrations equivalent to the acceptance criteria in the monograph. For adulterated samples, peaks due to rutin and/or quercetin are greater than those of the reference solutions (Figure 8.5). HPLC data was used to support the validity of the HPTLC limit test. A good correlation was obtained in 98% of the cases for quercetin and 100% of the cases for rutin.
Only eleven of fifty-nine analyzed products gave HPTLC fingerprints similar to that of ginkgo refined extract or ginkgo leaf, compliant with pharmacopoeial standards. The other forty-eight products showed at least one of the adulterants. Eight samples had more than 4% of rutin, and thirty had more than 0.5% of quercetin. One contained no ginkgo at all.
To the best of our knowledge, this is the first time that a single HPTLC was used for suc-cessfully determining identity, purity, and limits of rutin and quercetin in ginkgo products. Thus, if a sample fails the tests for identity and purity test based on high levels of rutin and/or quercetin during comprehensive HPTLC fingerprinting (as proposed in this section),

D. A. Frommenwiler Chapter 8
179
8
it will consequently fail the HPLC limit test for these adulterants. Conversely, a sample that passes comprehensive HPTLC fingerprinting will likely pass the HPLC assay and limit tests. Because problems with content can be detected during identification with the HPTLC method, the additional HPLC tests become redundant. Consequently, the HPTLC method may save costs and time by reducing the number of experiments. To assist the analyst during HPTLC experiments, a decision tree was proposed (Figure 5.7 in chapter 5).
This work was published in the following paper: D. A. Frommenwiler, A. Booker, R. Vila, M. Heinrich, E. Reich, and S. Cañigueral. Comprehensive HPTLC fingerprinting as a tool for a simplified analysis of the purity of ginkgo products. Journal of Ethnopharmacology 2019, 243, 112084. The manuscript is shown in Chapter 5.
Figure 8.5. HPTLC limit tests for rutin and quercetin in 7 GB samples (GB20, 23, 32, 26, 1, 2, and 4). Images with the bars represent intensities of rutin and quercetin in the reference and test solutions after integration of the peaks of the PPI. Red bar: peak of rutin in the reference solution; orange bar: peak of quercetin in the reference extract solution; green bars: passing samples; gray bars: failing samples. The concentration of reference solutions is equivalent to the acceptance criteria of the limit test.
8.2.4 Comprehensive HPTLC fingerprinting in the Ph. Eur. monographs for Traditional Chinese Medicine (TCM) drugs
The European Pharmacopoeia is an important instrument for quality control of Traditional Chinese Medicine (TCM) herbal drugs in the western world. The 10th edition includes 73 monographs on TCM herbal drugs.
The development of monographs for the quality control of these herbal drugs is particularly challenging due to the limited availability of commercial and reference samples of herbal drugs and adulterants in Europe. Additionally, the constituents responsible for the efficacy of the TCM herbal drugs are often only partially known or not at all. Consequently, most

D. A. Frommenwiler Chapter 8
180
8
TCM monographs use the analytical marker approach to evaluate the content of the herbal drug. This type of assay is usually performed by HPLC, in addition to other tests (e.g., identity test by HPTLC). However, there have been some critical remarks from the TCM wholesalers regarding the costs associated with testing herbal drugs according to the Ph. Eur., particularly for TCM drugs with limited trade volume in Europe. Because of this problem, the TCM working party of the EDQM launched the project “alternatives to assays”. This project aimed at simplifying the determination of content and reducing the number of tests to be performed during quality control of TCM herbal drugs.
Due to the quantitative features of HPTLC images, this technique was considered as a candidate for the pilot study, based on the comparison of peak heights (intensities) from the PPI. The suitability of HPTLC as an alternative to assays was evaluated in two case studies, chosen by the experts of the TCM working party: Fritillaria thunbergii bulbs (FTB) and Corydalis rhizome (CYR). In both cases, the concept “comprehensive HPTLC fingerprinting” was applied for identification and minimum content.
In the first step, it was necessary to optimize the existing pharmacopoeial (HP)TLC methods for both TCM drugs, in order to improve their reproducibility and quantitative outcomes. The new methods were then applied to multiple samples. During this step, the acceptance criteria for the identification were set. Reference solutions, used as SST and intensity markers, were established following chapter 2.8.25.
In the second part of the work, the test for minimum content by HPTLC was developed. The content of the markers was assessed in representative samples of FTB and CYR against a five-level calibration curve of standards. Based on the outcome of these assays, a minimum content was established for each marker. For simplicity in the routine application, reference solutions were prepared at a single concentration, within the linear range and equivalent to the minimum content in the sample. The intensity of the zone in the fingerprints of samples and reference are then compared. The test gives a pass or fail result rather than a content, and can be performed visually (on the images) or by software (using PPI). Outcomes of the two interpretations are in agreement, as shown in Figure 8.6 for FTB.
Figure 8.6. Visual and software interpretations of the test for minimum content of peimine and peiminine in FTB samples. Visual interpretation: passing samples are marked with a green check, while the failing sample is marked with an x. Software interpretation: orange and red bars: peiminine in the reference solution h and peimine in the reference solution g, respectively; green bars: passing samples; gray bar: failing sample.
Finally, the reproducibility of the HPTLC methods was evaluated in a collaborative trial including six laboratories. The outcomes are presented in chapter 6. In summary, results

D. A. Frommenwiler Chapter 8
181
8
for FTB from five laboratories were in agreement. The remaining laboratory did not pass the identification of the samples. For CYR, all laboratories presented the same results for SST, intensity markers, and identification. In the test for minimum content, one borderline sample passed in 4 laboratories and failed in two. All laboratories reached similar conclusions for the other seven samples.
The HPTLC methods proposed to the Ph. Eur. offer a simplified approach to evaluating identity and minimum content of TCM drugs in a single analysis. They are suitable for any type of laboratory: from those performing HPTLC manually to laboratories equipped with HPTLC instruments and software. Thus, laboratories on a low budget have a better chance to comply with the pharmacopoeia.
The manuscript presented in chapter 6 was submitted to Pharmeuropa Bio & Scientific Notes: D. A. Frommenwiler, C. Sabatini-Samori, E. Reich, S. Cañigueral and U. Rose. An alternative and simplified approach to identification and test for minimum content of TCM herbal drugs.
8.2.5 The quantification of a group of constituents with comprehensive HPTLC fingerprinting
Since the introduction of “comprehensive HPTLC fingerprinting”, the quantitative aspect of this concept has been focused on the assessment of individual markers against a reference solution (either from a chemical reference substance or an herbal reference material). However, herbal drugs and preparations often contain a complex mixture of substances, and thus, monitoring a group of constituents may be preferable for assuring their quality.
For example, the USP recently adopted a monograph for Ganoderma lucidum fruiting body (GLFB) [156], which includes an assay of triterpenoic acids (ten peaks of ganoderic and ganoderenic acids). This analysis presents an extra challenge because it requires an unu-sual long UHPLC column, and consequently, a stronger pump and a gradient run of 1 hour per sample.
In this work, the applicability of the comprehensive HPTLC fingerprinting concept to deter-mine the content of a group of constituents in an herbal drug was investigated using the example of GLFB. The goal was to propose a single HPTLC analysis, which combines the identification of GLFB with a test for adulteration and determination of the content of total triterpenoic acids expressed as ganoderic acid A.
First, the mobile phase, the sample preparation method, and derivatization procedure of the existing USP HPTLC method for identification were optimized for simplicity and robustness. The specificity of the method was evaluated by comparing the fingerprints of GLFB with those of nine related mushroom species in different detection modes. Triterpenoic acids (yellow and green zones between RF 0.1 and 0.5, Figure 8.7) were specific for GLFB and absent in the fingerprints of all other species.
The quantitative part of this work aimed at using a single reference solution for the quantifi-cation of a group of substances. During method development, the zones due to triterpenoic acids (between RF 0.1 and 0.5, Figure 8.7) were identified in the fingerprint of the sample. That was accomplished by comparing their RF position, color before and after derivatization, and UV spectra before derivatization with those of reference substances. Some zones were also classified as triterpenoic acids based on their similarities in color and UV spectra with those of ganoderic acids A and D. The choice of a suitable detection mode was made based on the signal response of the peaks from PPI in different detection modes. UV 254 nm was chosen because the peaks were best detected and had a low coefficient of variation during quantification.

D. A. Frommenwiler Chapter 8
182
8
Figure 8.7. HPTLC fingerprints of ergosterol, ganoderic acids D, B, A. G and C2 (prepared at 1 mg/mL) and two samples of G. lucidum fruiting body (GL13 and GL12, respectively) under UV 254 nm prior to derivatization (left) and UV 366 nm after derivatization (right). Standards on tracks 1, 3, and 6 show more than one zone due to impurities.
The other important step for the quantification was to ensure that all PPI peaks to be quan-tified were within the linear range allowing calculation with a single level calibration. For that, different dilutions of a pooled sample were analyzed, calibration curves for each of the selected peaks were established, and a suitable concentration of the test solution was chosen. A representation of this process is shown in section 8.3.8.3.
The new quantitative method was then applied to the determination of triterpenoic acids in fifty samples. This was done by integrating all peaks between RF 0.1 and 0.5 as one peak, and calculating the total area against a single level calibration point of ganoderic acid A (as shown in Figure 8.8). Based on the lowest value for total triterpenoic acids in samples considered of acceptable quality, the minimum content expressed as ganoderic acid A was proposed at 0.25%.
Figure 8.8 Representation of quantification of total triterpenoic acids by integrating all peaks between RF 0.1 and 0.5 in the test solution, using a single level calibration of ganoderic acid A at 0.1 mg/mL, and expressing results as ganoderic acid A.
The new method is a simpler yet efficient way to perform quality control of GLFB. In com-parison to the method proposed by USP, the new HPTLC method is also an economic alternative. The analysis of one sample with the new method costs approximately 27.00 Swiss Francs (CHF) in comparison to approximately 74.00 CHF for the USP method (combined HPTLC plus UHPLC).
Furthermore, this work shows the application of two pattern recognition tools that could be

D. A. Frommenwiler Chapter 8
183
8
used in routine quality control: peak recognition and acceptance range. With peak recogni-tion, the existing descriptions of the zones in the HPTLC fingerprints, e.g., those in the style of the European Pharmacopoeia, can be imported into suitable software (e.g., a prototype functionality of the visionCATS software). The software checks the presence or absence of required peaks and automatically passes or fails samples. The other tool (acceptance range) describes the quality of an herbal more comprehensively, taking into account its entire fingerprint. In this assessment, the presence or absence of peaks and their intensities are compared with specifications, which were displayed in the shape of a “window” (Figure 8.9).
Figure 8.9. Acceptance window model for evaluation of quality of Ganoderma lucidum fruiting body. A: Example of GIe – passes the test. B: two examples that fail tests (GL1 and 39). Arrows indicate zones of profiles that are outside of the acceptance criteria. PPI from the image after derivatization under UV 366 nm.
This window contains for each RF line a maximum and minimum allowed intensity (or values of arbitrary units (a.u.)), which were set based on the evaluation of good GLFB samples. Samples compliant with the model show a fingerprint within the window. Non-compliant samples present > 5% of their chromatogram outside of the window (above or below the acceptable ranges). Samples evaluated with both methods show the same

D. A. Frommenwiler Chapter 8
184
8
passing/failing results as the visual evaluation.
This case study offers an example of an economic yet powerful HPTLC method for comprehensively describing the quality of an herbal drug, combining identification and quantitative assessment of a group of zones in a single analysis.
This work has been published in the following paper: D. A. Frommenwiler, D. Trefzer, M. Schmid, S. Cañigueral, and E. Reich. Comprehensive HPTLC fingerprinting: A novel eco-nomic approach to evaluating the quality of Ganoderma lucidum fruiting body. Journal of Liquid Chromatography & Related Technologies, 2020. Published online, DOI: 10.1080/1 0826076.2020.172 5560. The manuscript is shown in Chapter 7.
8.3 How to develop a method for comprehensive HPTLC finger-printing
With the experience gained from different applications of comprehensive HPTLC finger-printing, this section provides general guidance for the development of comprehensive HPTLC methods suitable for the analysis of herbal drugs, preparations, and products.
8.3.1 Procurement of samples
Comprehensive HPTLC methods must take the natural variability of herbals into account. For that, it is crucial to work with at least 5-10 samples of representative quality. If possible, at least 10 g of each sample, including botanical reference material (BRM), should be obtained.
In addition, a minimum of 2-10 g of each known adulterants or related species should be included. Additional information can be obtained from SOP 013 of the HPTLC Association [157].
8.3.2 Sample preparation
Sample preparation should be kept as short and straightforward as possible. If available, sample preparation methods from the literature for the target herbal drug can be evaluated. A general method is sonication or shaking of the powdered sample with a suitable solvent (e.g. methanol) for 10 min at room temperature or 60°C.
The efficiency of the sample preparation can be evaluated semi-quantitatively by comparing the intensity of the zones of the fingerprints, based on their PPI in different detection modes.
Once the sample preparation method is established, precise weighing and exact volumes of solvents are required for quantitative analysis. Additional information can be found in SOP 005 [158].
8.3.3 Chromatographic setup
For general guidance on the HPTLC procedure, the following SOP and chapters are recommended: USP 203 [142] Ph. Eur. 2.8.25 [143] SOP 001 General Methodology for HPTLC, from the HPTLC Association [159]. Additional important parameters are emphasized below.
8.3.3.1 Stationary phase
For most analyses, 20x10 cm HPTLC glass plates Si 60 F254 (e.g., Merck) are used. It is crucial to notice that plates from different manufacturers may have different selectivity, which can affect the reproducibility of the method.
8.3.3.2 Reagents and solvents
If possible, reagents and solvents of a high grade or purity should be used to ensure the reproducibility of the method.

D. A. Frommenwiler Chapter 8
185
8
8.3.3.3 Sample application
For ensuring quantitative results, the syringe should be rinsed twice with the rinsing solvent (e.g., methanol) and filled twice with the test/reference solution. This step should be re-peated for each solution to be analyzed. Application volumes lower than 2 µL (reproduci-bility) and greater than 10 µL (time, band broadening) should be avoided.
8.3.3.4 Selection of the developing solvent
Before developing a method from scratch, the existing literature should be considered. Good sources of methods are Ph. Eur., USP, and other pharmacopoeias, the USP Dietary Supplement Compendium (DSC), USP Herbal Medicines Compendium [160], Hong Kong Chinese Materia Medica Standards [161], Plant Drug Analysis [162], the HPTLC Association [163]. Additionally, the HPTLC Association offers a guideline on the selection and optimization of developing solvents [157].
The selection of an optimal developing solvent is the core step of a comprehensive HPTLC method. During this evaluation, the analyst should take into account:
The class(es) of compound(s) targeted for analysis and the selection of a compatible chromatographic system.
That even if multiple classes of compounds are targeted, a single development, possibly combined with multiple detections, should be employed (e.g., evaluation of proanthocyanidins and flavonoids in cranberry can be performed with a single developing solvent [164]).
The capability of the method to detect adulterants (see section 8.3.7). For harmonization purposes, a method applicable to the related and target herbal
drug is preferred. That the developing solvent can separate with baseline resolution the analytical
marker(s) if they are separately quantified. That the method fulfills the validation requirements (see section 8.3.5).
8.3.3.5 Preparation of developing solvent and development
For this step, it is crucial to ensure that:
In order to minimize volume error, a quantity of developing solvent sufficient for a working day should be prepared.
The twin through chamber contains no residual solvent. If applicable, the development instrument should be rinsed appropriately with
developing solvent prior to the development. For development in a saturated chamber, the filter paper used is of the correct
weight and free of residual solvents.
Development in a saturated chamber: 10 mL of developing solvent are used in the front through affording a level of 5 mm depth for development, and 25 mL of developing solvent are used in the rear through for the saturation, together with filter paper. The chamber should be saturated for 20 minutes. Prior to development, plates are conditioned with a saturated salt solution (e.g., MgCl2) for 10 minutes. Developing distance is 70 mm from the lower edge of the plate. After development, the plate is dried for 5 minutes with air at room temperature.
Development in an unsaturated chamber: Prior to development, plates are conditioned with a salt solution for 10 minutes. Then 10 mL of developing solvent are poured in the front through affording a level of 5 mm depth for development, just before introducing the plate into the chromatographic chamber. The rear through is left empty. Plates are developed to 70 mm from the lower edge. After development, they are dried for 5 minutes with air at room temperature.

D. A. Frommenwiler Chapter 8
186
8
8.3.3.6 Detection and documentation
Detection can be performed prior to and/or after derivatization. Derivatization is an important step in HPTLC analysis and part of the majority of the HPTLC methods. If not executed in an automated manner, derivatization can lead to reproducibility problems. It is important to highlight that subsequent derivatization steps can be performed on the same plate, offering additional information (e.g., detection of sophora flower in ginkgo leaf products). A documentation step is added after each derivatization. Examples of compatible reagents are natural products and anisaldehyde reagents, or natural products and fast blue salt B reagents. Additional details on the execution of the derivatization step are found in SOP 001 of the HPTLC association [159]. The preparation of the derivatization reagents is shown in SOP 006 [165]. If applicable, the post-derivatization reaction time and temperature should be investigated, using the PPI. The best combination of parameters will afford a higher response (e.g., more intense peaks).
Plates should be documented with a digital documentation system under UV 254 nm and white light prior to application (for correction of the plate background); under UV 254 nm, UV 366 nm and white light after development; and under UV 366 nm and white light after derivatization. White light is used in combined absorption (from top) and transmission (from below) mode. Additionally, the post-chromatographic stability of the color and intensity of the zones with time can be evaluated. For that, after derivatization, images of the plate are recorded at different intervals of time (e.g., at 3, 6, 9, and 12 minutes). Evaluation is done with images plus PPI. A stable fingerprint is reached when the color and intensity of the peaks/zones changed only marginally or not at all. The time for reaching stability should be considered in the description of the documentation (e.g., as shown in chapter 7).
8.3.3.7 Converting images into peak profiles (PPI)
For generating PPI, the luminance is calculated as L = (1/3 R) + (1/3 G) + (1/3 B) from the red (R), green (G), and blue (B) channel for each pixel line of the track. L in fluorescence mode, respectively 1-L in absorption mode, is then plotted as a function of the RF value.
8.3.4 Defining a system suitability test SST
In HPTLC analysis, the SST has two functions: (1) to verify and qualify the chromatography, and (2) to normalize the intensity of the images under UV 366 nm.
The quality of the chromatography is evaluated with the SST reference solution either by judging the separation of two very close zones or comparing the RF of the zones with the acceptance criteria. The ∆RF should not be greater than 0.02 for analyses performed on the same day, and 0.05 for analyses performed on different days and in different laboratories.
The SST is also useful for the normalizing of the image background. An example is shown in Figure 8.10, the plate background of the raw data can be different from plate to plate (upper images of the plates). These differences are caused by different exposure times during image capturing in high-dynamic-range imaging (HDRI) mode. An HDRI contains multiple ranges of luminance levels at different exposures to capture details in shadows or highlights. When normalized over a common intensity (e.g., SST), the backgrounds of dif-ferent plates look similar, as in the three plates at the bottom of the image. Therefore, with software correction, it is possible to compare images captured with different exposures.
SST can be: (a) chemical reference substances, or (b) reference extracts. Chemical refe-rence substances as SST are used by most pharmacopoeias and the HPTLC Association, while reference extracts as SST are more common in the USP.

D. A. Frommenwiler Chapter 8
187
8
Figure 8.10 Normalization of background based on SST in HPTLC analysis. Images of three plates (1-3) before and after plate background normalization over the SST (actein and isoferulic acid).
The choice of chemical markers for SST is related to the targeted class of compound, and their distribution in the chromatogram (ideally between RF 0.2 and 0.8) [157]. Ideally, 5-10 compounds of the targeted class should be prepared at 1 mg/mL and analyzed in individual tracks, including one test solution for comparison. From this experiment, 2-4 markers are chosen. In a second experiment, their concentration is optimized. The intensity should resemble those of the corresponding or similar zones in the test solutions to avoid underex-posure or overexposure of an image. Reference extracts used as SST should be prepared in a concentration resembling that of the samples.
8.3.5 Validation of comprehensive HPTLC methods
General guidance on validation of qualitative HPTLC methods is presented by Koll et al. in [137]. For the quantitative assessment, it is recommended to take into account the ICH guideline [166]. The minimum validation requirements for the quantitative assessment are emphasized below.
The specificity of the method: to ensure the identity of the analyte, it is recommended to record UV spectra of the zones used in the quantification and compare them to the UV spectra of the reference standards.
Linearity: needs to be established before the precision. It is discussed in section III.
The precision of the method: can be evaluated through repeatability (evaluation in a short interval of time in the same laboratory) with six replicates, intermediate precision (evaluation within days and in the same laboratory), and if possible, reproducibility (evaluation in different laboratories).
Accuracy of the method: can be assessed through the recovery tests. For that, it is recommended to perform nine determinations using a sample spiked with three concentration levels of the marker, and each level prepared in triplicate. The analyst should ensure that the added amount of marker will not be outside of the linear range.
8.3.6 Identity
The HPTLC method for identification should deliver a binary outcome: YES, the tested sample corresponds to the target herbal drug, or NO, it is not the targeted herbal drug. The decision is based on acceptance criteria.
8.3.6.1 Guidance for the establishment of acceptance criteria
In order to set acceptance criteria for the identification of an herbal drug, the description of the HPTLC fingerprint should consider the following aspects:
The color of the zones and their RF, in different detection modes.

D. A. Frommenwiler Chapter 8
188
8
The natural variability should be considered in the description of the intensity of the zones. For that, a representative number of samples should be evaluated. The resulting description can include a range of intensity (e.g., faint to equivalent zone).
Description of intensity can be done more objectively with PPI, and minimum or maximum peak height/areas could be defined.
The entire fingerprint should be considered, including zones that are often ignored (e.g., fatty acids or chlorophylls). Zones that are barely detectable may be excluded.
It is recommended to include the evaluation of identity in different detection modes. If the analysis is based on an existing standardized HPTLC method, the fingerprint
images from a databank can be used for comparison (e.g., methods from HPTLC atlas of the HPTLC association, https://www.hptlc-association.org/atlas/hptlc-atlas.cfm, or the CAMAG HPTLC method library, https://www.camag.com/products/ software).
Identification can be automated by using suitable software and pattern recognition tools. However, specific acceptance criteria need to be set. These include the RF position of characteristic zones, acceptable ∆RF, color appearance value (Hue), variation in color appearance (∆Hue), and intensity. An example of its application is shown in chapter 7, section 7.3.13.
8.3.7 Purity
A purity test is performed to check the presence of non-target material (adulterants) in the herbal drug, preparation, or product. The method chosen for identification should also be suitable for checking purity.
First, literature research should be performed to identify possible adulterants. After the procurement of representative samples, these should be analyzed side by side with the target herbal drug. A suitable method shows clear differences between the fingerprints of the different herbal drugs, as illustrated in Figure 8.11. In situation A, target and confounding herbal drugs show very similar fingerprints and cannot be distinguished with method 1, while in situation B, the use of method 2 allows discrimination of the herbal drugs.
Figure 8.11 Schematic example for choosing a suitable HPTLC method for the identification and detection of adulteration. A: unsuitable method for distinguishing target herbal drug and the adulte-rant; B: suitable method; C: illustration of a zone used to detect the adulterant; D: systematic mixtures of target herbal drug and adulterant.
If the sample contains an admixture of an adulterant, a suitable method should be capable of detecting their presence based on the detection of at least one positive marker (zone). Positive zones are characteristic of the adulterant and absent or much fainter in the target herbal drug. For example, in Figure 8.11 C, the positive zone for detecting a mixture with

D. A. Frommenwiler Chapter 8
189
8
an adulterant is the yellow zone just above the application position (blue arrow). This kind of evaluation is also applicable to detecting the addition of chemical substances (e.g., dyes in saffron stigma).
8.3.7.1 The detection limit of the admixtures
The detection limit of the admixtures should be investigated as well. For that, it is recom-mended to prepare individual physical mixtures of 1, 5, 10, 25, 40 and 50% of the adulterant with 99, 95, 90, 75, 60 and 50% of the target herbal drug, as shown in Figure 8.11 D. Different detection modes should be evaluated, as shown in chapter 5. The evaluation of Figure 8.11 D can also be performed in a more objective way using the PPI (not shown in this figure). It helps to better visualize zones that are very faint in the image (e.g., yellow zone, 1% of the adulterant in the target herbal drug).
8.3.7.2 Limit test
The limit test assesses whether the level of an impurity in the sample meets the acceptance criterion. The method must give a pass/fail result based on the quantification of the present impurity. It can be performed using the PPI. After localizing a positive marker in the chromatogram, its identity can be confirmed against a chemical reference standard. The scenarios illustrated in Figure 8.12 apply:
If the identity of the zone is known and the corresponding chemical reference stan-dard is available, a standard solution is used with a concentration equivalent to the maximum acceptable amount of the impurity in the mixture. For example, in Figure 8.12 A, the reference solution of substance x is prepared at a concentration corre-sponding to the intensity of the yellow zone when 5% of the adulterant is in the herbal drug (when 5% is the maximum accepted). If the chemical reference standard is not available, approaches 2 and 3 can be followed.
If the identity of the zone is not known, a surrogate standard with a similar response can be used (see example in Figure 8.12 B). The same procedure should be fol-lowed as in scenario A.
If a reference herbal drug/extract of the adulterant is available, this can be used for preparing a reference solution for the limit test (see example in Figure 8.12 C). In this case, the solution should be prepared at a concentration giving an intensity of substance x equivalent to the maximum accepted.
If a test for purity already exists, its specifications can be applied (e.g., the limit test of rutin and quercetin in ginkgo products in the USP monograph, chapter 5).
Figure 8.12 Schematic example of a limit test using an identified reference solution (A), a surrogate standard (B), and a reference herbal drug (C).

D. A. Frommenwiler Chapter 8
190
8
I. How to perform the limit test using PPI
First, the images are converted into peak profiles. Then, the heights of the target peaks of the reference and test solutions are compared. Passing samples are less intense than the reference while failing samples are more intense than the reference. A representation of this process is shown in Figure 8.13. Such evaluation is semi quantitative because these are plots of the peak heights (non-calibrated data).
Figure 8.13. Use of peak profiles from images (PPI) in the limit test for rutin in ginkgo extract. A: Fingerprint of ginkgo extract under UV 254 nm prior to derivatization; B: Fingerprint converted into PPI; C: peak due to rutin in the sample, after the integration range was adjusted to exclude other peaks; D: bar graph showing the peak heights for rutin (red bar), and passing (green and blue bars) or failing (gray bar) samples. The intensity of rutin is equivalent to the maximum accepted in the extract.
Same result can also be based on peak data (height and/or area) calculated by single level calibration. Nevertheless, it requires development of a quantitative method as will be shown in the next section.
8.3.8 Content
When coming to determination of content, it is important to ensure that the integrated and calibrated data is used. Therefore, in this section, the bar graph images are expressing the content of marker(s) after quantification rather than relative peak heights as shown in purity test.
The content of an herbal drug / herbal drug preparation can be assessed based on individual markers or a group determination against a chemical substance or quantified herbal drug or extract. In the individual marker approach, individual peaks of the fingerprint are assayed against a corresponding reference peak. For group determination, in which a range of peaks due to the same class of compounds in the sample is used, the total area of the range is evaluated against a single chemical refence or a single peak in the reference extract. The results of the test for content of both approaches can be expressed in two manners: as a pass/fail (minimum content test) or the content in % of markers (assay). A third possibility is the group determination quantification with the corresponding range of a reference extract. This alternative was not pursued because a fully characterized reference extract is needed, which was not available. Applying the comprehensive HPTLC fingerprinting concept means that the method used for identification and test for purity is also used for testing the content. If necessary, the con-centration of the test solution is adjusted to fit the linear working range for quantification.

D. A. Frommenwiler Chapter 8
191
8
Certain cases may require two concentrations of the test solution, e.g. if the concentration needed for quantification produces fingerprints that are too faint for use in identification. These can still be evaluated in a single analysis. To save time, the test solution prepared for the identification and test for purity can be suitably diluted for quantification.
The steps for assessment of content by HPTLC are discussed in the next sections. The common steps for the two approaches (individual marker and group determination) are explained in section 8.3.8.1, and their individual cases are shown in sections 8.3.8.2 and 8.3.8.3.
8.3.8.1 Common steps
II. Choice of the detection mode for quantitative assessment
The selection of the most suitable detection for quantification should be based on the re-sponse (shown in the PPI) of the target substance in different detection modes, prior to and after derivatization. Optionally, the PPSD at multiple wavelengths can be considered. Two elements are verified: the intensity of the signal, and the coefficient of variance (CV) for the same test solution, applied at several positions on the plate. For this test, a reference solution should be prepared in a single concentration (for example, one that contains the target compound(s) at 20 µg/mL) and applied at 4-8 different positions on the plate.
The detection mode giving the highest response, either as peak area or as peak height, should be chosen, but the lowest CV of the 4-8 zones should also be considered. If possible, detection modes before derivatization should be preferred for quantification, in order to minimize possible errors introduced by additional steps of the method.
III. Linear working range of the method
In order to produce quantitative results, the linear working range of the method has to be investigated. First, the linearity of the calibration curve should be examined. As a rule of thumb, most of the chemical substances are within the linear working range when prepared at concentrations between 50 µg/mL and 1 µg/mL, with an application volume of 2 µL (for absorption and fluorescence modes). In order to save time, it is recommended to prepare 10-15 concentrations within this range and analyze them on one plate (as shown in the example of Figure 8.14 A).
The linearity study also applies if a quantified reference herbal drug/extract is used instead of a chemical reference substance. The concentrations of the solutions used for the calibration curve should be calculated based on the content of the target compound in the reference herbal drug/extract. For example, if 10 mg of an extract contains 40 µg of a substance x, then reference solutions of this extract can be prepared at concentrations of 1.25, 2.5, 3.75, 5.0 mg/mL, to contain 5, 10, 15, 20 µg/mL of substance x, and so on (Figure 8.14 B).
The test for linearity in the PPI can be performed based on the area (if baseline separation of the substance is achieved in the sample) or height of the target peak(s). A suitable linear working rage needs to be selected, as shown in Figure 8.14 C. Acceptable regression modes are linear and linear forced through zero.
Once linearity is established, the quantitative method can be further validated (see recom-mendations in section 8.3.5).

D. A. Frommenwiler Chapter 8
192
8
Figure 8.14 Schematic example for determination of the linear working range of a reference solution or a given zone in a reference herbal drug or extract.
8.3.8.2 Individual marker approach
IV. Adjustment of the test solution to the linear working range
After establishing the linear working range, the concentration of the test solution needs to be adjusted to fit this model. Usually, herbal drugs, at concentrations between 100 mg/mL and 10 mg/mL, and extracts between 50 mg/mL and 1 mg/mL, present zones in the linear range, using application volumes of 2 µL. In order to save time, it is recommended to prepare ten concentrations of a sample within these ranges and analyze them against a five-level calibration curve established in the previous step. A suitable concentration of the test solution would have the targeted marker(s) in the middle of the linear working range.
V. Selection of concentration of the reference solution for routine assay
For simplification of the assay, quantification with single level calibration is desirable. In this case, a reference solution should be prepared at the highest level of the linear range established in section III. The use of this calibration level also allows the quantification of samples that exceed the upper limit of the linear working range.
For methods that use linear calibration functions not forced through zero, at least two reference points should be used for quantification. These are the lowest and highest levels of the linear range established in section III.
VI. Setting acceptance criteria for minimum content
In this step, the acceptance criteria for minimum content is established based on the lowest amount of the marker(s) considered appropriate for “good” samples of the herbal drug,

D. A. Frommenwiler Chapter 8
193
8
preparation, or product, ± the error of the method, determined during validation. For this experiment, it is recommended to have at least ten samples of the herbal drug, which comply with the specifications for identity and purity. The samples are prepared at the concentration established during the linearity study (section IV), and the content of maker(s) is determined against the reference solution established in section V.
VII. Selection of concentration of the reference solution for the test of minimum content
The test for minimum content can be performed visually or with PPI. For this, a chemical reference substance or a quantified herbal drug/extract can be used at a concentration matching the intensity of a test solution with minimum content.
VIII. Content: assay versus minimum content test
Interpretation of the data can be performed in two ways:
Test for minimum content: the intensity of the target zones (Figure 8.15 A and B) or their content in % (Figure 8.15 C) in the reference and test solutions are compared. Passing samples have zones equally or more intense (or have equal or higher concentration) than the reference while failing samples have zones less intense (or have a lower concentration) than the reference.
Assay: the contents of the markers in the samples are calculated in % of the dried weight of the dried herbal drug, preparation, or product (Figure 8.15 C).
Figure 8.15 Expression of the content. A: fingerprints of the chemical reference and samples solu-tions under white light after derivatization; B: a pass/fail test comparing the intensity of the respective zones in reference solution and test solution; C: expression of the content of substance z in samples 1-3 in %.
8.3.8.3 Group determination approach
This approach uses a chemical reference substance or a quantified marker in a refence herbal drug or extract (e.g., Figure 8.14 B) to quantify a range of peaks in the samples. In this specific case, only peak area is used.
IX. Identification of the zones in the fingerprint
Although this step belongs to the investigation of specificity, this evaluation is different in the case of multiple markers and thus is highlighted here. To perform a quantitative assessment of a group of substances, first, it is recommended to identify the zones in the chromatogram by comparing their RF position, color, and UV spectra to those of reference substances.

D. A. Frommenwiler Chapter 8
194
8
However, in most cases, not all reference standards are available, and thus the identity of the zones is difficult to verify. Nevertheless, it is possible to characterize zones against a reference substance as part of a class of compounds based on their similarities in RF posi-tion, color, UV spectra, and, if necessary, MS analysis. In the example of Figure 8.16 B, the UV spectra of the zones due to flavonoids of St. John’s wort (quercetin, quercitrin, isoquercetin, hyperoside, and rutin) show shapes similar to a rutin standard solution. Conversely, in Figure 8.16 C, the spectrum of hypericin shows a shape different from the rutin standard.
Figure 8.16 Comparison of UV spectra of different flavonoids of St. John’s wort (quercetin, quercitrin, isoquercetin, hyperoside, and rutin). Data recorded prior to derivatization. A: rutin reference solution and St. John’s wort sample under UV 366 nm after derivatization with NP reagent; B: spectra overlapping of zones due to flavonoids in the sample and rutin standard; C: spectra overlapping of zones due to hypericin in the sample and rutin standard.
X. Adjustment of the test solution to the linear working range
In this case, the linear working range for each of the main peaks within the selected range of the fingerprint should be determined to find a common suitable concentration of the test solution for quantification. The goal is to obtain a fingerprint in which all main peaks are within the linear range, and their sum can be calculated based on the same single level calibration.
First, aliquots of samples available in large quantities, and compliant with the specification set during tests for identity and purity are pooled to create an average sample. The pooled sample is prepared according to the method for identification, and then fifteen dilutions are prepared from this stock solution. Recommended concentrations are shown in section IV. After the analysis of the test solutions, evaluations are performed on PPI (Figure 8.17) in the detection mode chosen in section 8.3.8.1.
In the PPI, each peak within the selected range should be manually integrated using the perpendicular drop method, and the baseline should be corrected for all the peaks within the range. Both examples are shown in Figure 8.17 C and D).
Because the concentrations of the target zones in the samples might not be known, the concentration of the test solutions can be assigned to the peaks when building the calibration curve. For example, in Figure 8.18, peaks 1-7 are labeled with the concentrations between 6-80 mg/mL according to the corresponding concentration of the test solution and plotted against the peak area. In Figure 8.18, the sample prepared at 80 mg/mL has all the seven peaks within the linear range, and thus this concentration was selected for the assessment of content.
It is also important to ensure that all selected peaks are within the linear working range of the chemical marker. For that, each peak of the sample is evaluated against the calibration curve set in section III.

D. A. Frommenwiler Chapter 8
195
8
Figure 8.17 Determination of the linear working range for several peaks in a test solution of Ganoderma lucidum fruiting body, prepared in different concentrations. A: image of the plate under UV 254 nm prior to derivatization; B: PPI of image A, without baseline correction; C: image B with baseline correction between RF 0.1 and 0.5; D: manual integration of each peak (peaks 1-7) in the PPI of the sample prepared at 80 mg/mL.
Figure 8.18 Linear calibration for each of the seven peaks of Figure 8.17.

D. A. Frommenwiler Chapter 8
196
8
XI. Selection of concentration of the reference solution for routine assay
For simplification of the assay, a single level calibration of reference solution is used, equi-valent to the middle concentration of the linear range, established in section III. This ap-proach applies to linear function forced through zero.
For methods that use linear functions not forced through zero, at least two reference points should be used for direct quantification. These are the lowest and highest levels of the linear range established in section III.
XII. Setting acceptance criteria for minimum content
In this step, the acceptance criterion for minimum content is established based on the lowest amount of the combined content of markers within a range, obtained in representative samples. For this experiment, it is recommended to have at least ten samples of the herbal drug, which comply with the specifications set during tests for identity and purity. They are prepared at concentration established during the linearity study (section X), and the maker(s) content is determined against the reference solution established in section XI.
For calculation of the content, the range of zones in the PPI is integrated as one peak (Figure 8.19 A), and the total area is used in the linear equation. Most likely, the concentra-tion of the test solutions will be displayed out of the linear range, because its signal is due to all added peaks. Therefore, it is important to extrapolate the calibration curve (Figure 8.19 B).
The content of the combined peaks in the samples is given in % of the dried weight of the herbal drug, preparation, or product.
Figure 8.19 Integration of peaks as a total area of the peaks within the RF range (left image), and the calculation of its concentration against an extrapolated two-level calibration curve, which is not forced through zero (right image).

Chapter 9: Conclusions


D. A. Frommenwiler Chapter 9
9
199
In this work, HPTLC proved to be a useful technique for routine quality control of herbal drugs, preparations and products. As demonstrated, it can simplify this process by per-forming identity, purity and content testing in a single analysis, applying the concept of comprehensive HPTLC fingerprinting. This is afforded by rigorous standardization and qualification of the HPTLC data.
Comprehensive HPTLC fingerprinting is a concept developed in the present thesis, which allies the qualitative and quantitative information of HPTLC images and can be performed with the standard instrument set up paired with suitable software. This gives opportunities to laboratories with different budgets to evaluate the quality of herbals in a less-costly way.
This concept also proved to be suitable for the quality control of herbals, regardless of their regulatory category. In fact, if comprehensive HPTLC fingerprinting is adopted for this purpose, quality problems, such as adulteration and lower potency, can be detected already at early stages of the quality control process. It can also help other non-medicine industries to deliver higher quality herbals products.
The specific conclusions of this work are the following:
1. In all market studies presented in this work, herbal products regulated under different categories had different qualities, where those regulated as non-medicines often showed one or more quality issues. Of the products evaluated in chapter 3, 52.4% of the milk thistle food supplements (FS), 33.3% of the coneflower FS, 45.5% of the black cohosh FS and 66.6% of black cohosh preparations showed quality problems. All THMP products were compliant with their label claim. Of the ginkgo products evaluated in chapter 5, approximately 81% presented at least one type of adulteration. These products were all commercialized as FS.
2. The application of existing HPTLC methods, but including visual evaluation of the entire fingerprint and several detection modes, allows rapid identification of quality issues, especially adulterations.
3. The new concept comprehensive HPTLC fingerprinting allies for the first time the qualitative and quantitative aspects of HPTLC fingerprints in a single analysis, which permits performing tests for identity, purity, and content of markers in a straight forward and cost-efficient way. The concept was demonstrated using the example of Angelica gigas root. Based on the analysis of multiple batches of cultivated A. gigas root, the acceptance criteria for identification were established. The HPTLC method was capable of distinguishing 27 related species, detect the presence of mixtures of A. gigas with two other Angelica species traded as “Dang gui”. The method was also shown to be suitable for quantitative assessment of the sum of decursin and decursinol angelate as a pass/fail test (by visual evaluation or using PPI) and for content determination (using PPI or PPSD).
4. The comprehensive HPTLC fingerprinting concept demonstrated to be useful for detecting adulteration with herbal drugs and/or chemical substances, and for quantitatively performing limit tests, using the images generated during identification. This was demonstrated in the case of ginkgo products. The most common adulterations found were the presence of undeclared sophora fruit and/or high levels of rutin and/or quercetin. HPTLC and HPLC limit tests for rutin and quercetin were in agreement 100% or 98% of the cases, respectively. It, therefore, helped to reduce the number of analyses prescribed in the USP monograph for ginkgo dry extract. A decision tree showing the sequence of interpretation of the fingerprints obtained with different detections is included. It is a practical tool for helping the analyst in the routinary application of the HPTLC method.
5. Comprehensive HPTLC fingerprinting methods, including a test for minimum content, proved to be a suitable and simpler alternative to the assay of markers. After proper validation, the simplification of the qualitative/quantitative HPTLC method enables

D. A. Frommenwiler Chapter 9
9
200
laboratories to perform the analysis manually or with instruments and to interpret the results visually or using a software. Based on this approach, low-budget laboratories have a better chance of complying with the pharmacopoeia. With this approach, methods for Fritillaria thunbergii bulbs and corydalis rhizome were developed and validated, also showing good performance in interlaboratory trials.
6. The application of the new concept for the quantification of a group of markers and the use of pattern recognition tools for the identity represents a step toward a more holistic and automated approach to quality for herbals. This was clearly shown for Ganoderma lucidum fruiting body. The new HPTLC method, which combined the tests for identification and the content determination of triterpenoic acids (ganoderic and ganoderenic acids), is an economic alternative to the USP method (27.00 CHF of a single HPTLC method versus approximately 74.00 CHF for the combined HPTLC plus UHPLC USP methods). Additionally, the use of pattern recognition tools allows simplification and automatization of the identification of this herbal drug.
7. The development of a detailed guideline is an important outcome of this work because it enables laboratories to develop, validate, and apply comprehensive HPTLC fingerprinting methods for routine quality control of herbals.

201
Part IV: References


D. A. Frommenwiler References
203
R
References [1] B. B. Petrovska, “Historical review of medicinal plants’ usage,” Pharmacogn. Rev., vol. 6, no.
11, pp. 1–5, 2012.
[2] D. A. Dias, S. Urban, and U. Roessner, “A historical overview of natural products in drug discovery,” Metabolites, vol. 2, no. 2. MDPI AG, pp. 303–336, 16-Apr-2012.
[3] World Health Organization (WHO), “Some traditional herbal medicines,” in IARC monographs on the evaluation of carcinogenic risks to humans, vol. 82, Lyon, France: IARC Press, 2002, pp. 41–68.
[4] M. Fitzgerald, M. Heinrich, and A. Booker, “Medicinal plant analysis: A historical and regional discussion of emergent complex techniques,” Front. Pharmacol., vol. 10, p. 1480, Jan. 2019.
[5] P. Font Quer, Plantas medicinales. El Dioscórides renovado., 4th ed. Labor (Barcelona), 1974.
[6] R. R. H. Upton, “Traditional herbal medicine, pharmacognosy, and pharmacopoeial standards: a discussion at the crossroads,” in Evidence-based validation of herbal medicine, P. K. Mukherjee, Ed. Waltham: Elsevier, 2015, p. 537.
[7] R. Upton, B. David, S. Gafner, and S. Glasl, “Botanical ingredient identification and quality assessment: strengths and limitations of analytical techniques,” Phytochem. Rev., pp. 1–21, 2019.
[8] A. G. Atanasov, A. G. Atanasov, B. Waltenberger, E. M. Pferschy-Wenzig, T. Linder, C. Wawrosch, P. Uhrin, V. Temml, L. Wang, S. Schwaiger, E. H. Heiss, J. M. Rollinger, D. Schuster, J. M. Breuss, V. Bochkov, M. D. Mihovilovic, B. Kopp, R. Bauer, V. M. Dirsch, H. Stuppner, “Discovery and resupply of pharmacologically active plant-derived natural products: a review,” Biotechnology Advances, vol. 33, no. 8. Elsevier Inc., pp. 1582–1614, 2015.
[9] A. Daemmrich and M. E. Bowden, “A rising drug industry,” Chem. Eng. News, vol. 83, no. 25, pp. 28–42, 2005.
[10] O. Folashade, H. Omoregie, and P. Ochogu, “Standardization of herbal medicines - a review,” Int. J. Biodivers. Conserv., vol. 4, no. 3, pp. 101–112, 2012.
[11] R. Bauer, “Quality criteria and standardization of phytopharmaceuticals: can acceptable drug standards be achieved?,” Drug Inf. J., vol. 23, pp. 101–110, 1998.
[12] S. C. Folcarà, “Medicamentos a base de plantas: el reto de la calidad y la farmacopea como hierramenta para alcanzarla,” Rev. Fitoter., vol. 13, no. 2, pp. 101–122, 2013.
[13] World Health Organization (WHO), “Review of world Pharmacopoeias,” in International Meeting of World Pharmacopoeias, 2013, p. 20.
[14] J. Zhang, B. Wider, H. Shang, X. Li, and E. Ernst, “Quality of herbal medicines: challenges and solutions,” Complement. Ther. Med., vol. 20, no. 1–2, pp. 100–106, 2012.
[15] L. Gobbo-Neto and N. P. Lopes, “Plantas medicinais: fatores de influência no conteúdo de metabólitos secundários,” Quim. Nova, vol. 30, no. 2, pp. 374–381, 2007.
[16] European Directorate for the Quality of Medicines (EDQM), “Herbal drug, monograph N° 1433,” in European Pharmacopoeia 9.2, 8.0., Strasburg, 2017, p. 4419.
[17] European Directorate for the Quality of Medicines (EDQM), “Herbal drug preparations, monograph N° 1434,” in European Pharmacopoeia, 9.2., Strasburg, 2017, p. 819.
[18] “Directive 2004/24/EC.” [Online]. Available: https://eur-lex.europa.eu/LexUriServ/LexUri Serv.do?uri=OJ:L:2004:136:0085:0090:en:PDF. [Accessed: 10-Jul-2019].
[19] A. R. Bilia, “Herbal medicinal products versus botanical-food supplements in the European market: state of art and perspectives,” Nat. Prod. Commun., vol. 10, no. 1, pp. 125–131, 2015.
[20] T. Y. Low, K. O. Wong, A. L. L. Yap, L. H. J. De Haan, and I. M. C. M. Rietjens, “The regulatory framework across international jurisdictions for risks associated with consumption of botanical food supplements,” Compr. Rev. Food Sci. Food Saf., vol. 16, no. 5, pp. 821–834, Sep. 2017.

D. A. Frommenwiler References
204
R
[21] World Health Organization (WHO), “Regulatory situation of herbal medicine, worldwide review,” 1998. [Online]. Available: https://apps.who.int/iris/handle/10665/63801. [Accessed: 07-Jul-2019].
[22] “Directive 2001/83/EC.” [Online]. Available: https://eur-lex.europa.eu/LexUriServ/LexUri Serv.do?uri=OJ:L:2001:311:0067:0128:en:PDF. [Accessed: 10-Jul-2019].
[23] “Regulation (EC) N° 178/2002 of the European Parliament and of the Council of 28 January 2002.” [Online]. Available: https://eur-lex.europa.eu/legal-content/EN/TXT/PDF/?uri=CEL EX:32002R0178&from=EN. [Accessed: 14-Jul-2019].
[24] T. Brendler, L. D. Phillips, and S. Speiss, “Classification of herbal (medicinal) products,” in A practical guide to licensing herbal medicinal products, 1st ed., Thomas Brendler, L Denzil Phillips, and Stefan Speiss, Eds. London: Pharmaceutical Press, 2009, pp. 3–20.
[25] “Directive 2002/46/EC of the European Parliament and of the Council of 10 June 2002.” [Online]. Available: https://eur-lex.europa.eu/legal-content/EN/TXT/PDF/?uri=CELEX:32002 L0046&from=EN. [Accessed: 14-Jul-2019].
[26] “Regulation (EU) 2017/ 745 of the European Parliament on medical devices,” 2017. [Online]. Available: https://eur-lex.europa.eu/legal-content/EN/TXT/PDF/?uri=CELEX:32017R0745 &from=EN. [Accessed: 13-Jul-2019].
[27] The European Parliament and the Council of European Union, “Regulation (EC) N° 1223/2009 of The European Parliament and the Council of 30 November 2009 on cosmentic products,” Off. J. Eur. Union, vol. 52, pp. 59–209, 2009.
[28] Medicines & Healthcare Products Regulatory Agency (MHRA), “A guide to what is a medicinal product,” London, 2016.
[29] L. S. Joshi and H. A. Pawar, “Herbal cosmetics and cosmeceuticals: an overview,” Nat. Prod. Chem. Res., vol. 3, no. 2, p. 170, 2015.
[30] W. Knoess, “Harmonization of regulatory requirements in Europe to ensure quality, safety and efficacy of herbal medicinal products,” in Evidence-based validation of herbal medicine, Pulok K. Mukherjee, Ed. Elsevier, 2015, pp. 201–216.
[31] N. Scholz, “Medicinal products in the European Union. The legal framework for medicines for human use,” Eur. Parliam. Res. Serv., no. April 2015, pp. 1–25, 2015.
[32] A. Vlietinck, L. Pieters, and S. Apers, “Legal requirements for the quality of herbal substances and herbal preparations for the manufacturing of herbal medicinal products in the European Union,” Planta Med., vol. 75, no. 07, pp. 683–688, 2009.
[33] R. Poveda OMP, “Regulation of herbal (traditional) medicinal products in the European Union,” Pharm. Regul. Aff. Open Access, vol. 04, no. 02, pp. 1–5, 2015.
[34] S. Sharma, “Current status of herbal product: regulatory overview,” J. Pharm. Bioallied Sci., vol. 7, no. 4, pp. 293–6, 2015.
[35] M. Heinrich, “Quality and safety of herbal medical products: regulation and the need for quality assurance along the value chains,” Br. J. Clin. Pharmacol., vol. 80, no. 1, pp. 62–66, 2015.
[36] C. Tamayo and F. A. Hoffman, “Botanical regulation: comparison of the United States and Canada,” Pharm. Regul. Aff. Open Access, vol. 06, no. 01, pp. 1–5, 2017.
[37] S. T. Chen, J. Dou, R. Temple, R. Agarwal, K.-M. Wu, and S. Walker, “New therapies from old medicines,” Nat. Biotechnol., vol. 26, no. 10, pp. 1077–1083, Oct. 2008.
[38] U.S. Department of Health and Human Services - Food and Drug Administration (FDA), “Botanical drug development guidance for industry,” 2016. [Online]. Available: https://www.fda.gov/files/drugs/published/Botanical-Drug-Development--Guidance-for-Industry.pdf. [Accessed: 03-Feb-2019].
[39] Freddie Ann Hoffman and Steven R. Kishter, “Botanical new drug applications - the final frontier,” HerbalEGram, vol. 10, no. 6, 2013.
[40] F. A. Hoffman, “Botanicals as ‘new’ drugs: US development,” Epilepsy Behav., vol. 52, pp. 338–343, 2015.
[41] American Botanical Council, “FDA approves special green tea extract as a new topical drug

D. A. Frommenwiler References
205
R
for genital warts,” Herbalgram, vol. 74, pp. 62–65, 2007.
[42] S. Cañigueral and J. Sanz-Biset, “Ethnopharmacology in Central and South America,” in Ethnopharmacology, First Edit., M. Heinrich and A. K. Jäger, Eds. John Wiley & Sons, Ltd, 2015, pp. 379–391.
[43] U.S. Food & Drug Admnistration, “OTC (nonprescription) drugs,” 2016. [Online]. Available: https://www.fda.gov/drugs/how-drugs-are-developed-and-approved/otc-nonprescription-drugs. [Accessed: 14-Sep-2019].
[44] U.S. Food & Drug Administration (FDA), “Structure/Function claims,” 2017. [Online]. Available: https://www.fda.gov/food/food-labeling-nutrition/structurefunction-claims. [Accessed: 09-Aug-2019].
[45] Tarja Laaninen, “Updating rules on novel foods to keep up with scientific advances,” Eur. Parliam. Res. Serv., pp. 1–8, 2015.
[46] European Commission, “EU register of nutrition and health claims made on foods.” [Online]. Available: https://ec.europa.eu/food/safety/labelling_nutrition/claims/register/public/?event =register.home&CFID=7583568&CFTOKEN=ae7b3eb3a958797-964E7164-BD06-F24B-3093E0F862357988. [Accessed: 10-Aug-2019].
[47] U. S. Food and Drug Administration, “Dietary supplement products & ingredients,” 2017. [Online]. Available: https://www.fda.gov/food/dietary-supplements/dietary-supplement-products-ingredients. [Accessed: 26-Jul-2019].
[48] U.S. Food & Drug Administration (FDA), “Label claims for conventional foods and dietary supplements,” 2018. [Online]. Available: https://www.fda.gov/food/food-labeling-nutrition/ label-claims-conventional-foods-and-dietary-supplements. [Accessed: 10-Aug-2019].
[49] U.S. Food & Drug Administration (FDA), “What is a botanical drug?” [Online]. Available: https://www.fda.gov/about-fda/center-drug-evaluation-and-research/what-botanical-drug. [Accessed: 29-Jul-2019].
[50] Public Law 103-417, “Dietary Supplement Health and Education Act of 1994,” 1994. [Online]. Available: https://ods.od.nih.gov/About/DSHEA_Wording.aspx. [Accessed: 10-Aug-2019].
[51] U.S. Food & Drug Administration (FDA), “Dietary supplements,” 2019. [Online]. Available: https://www.fda.gov/food/dietary-supplements. [Accessed: 09-Aug-2019].
[52] M. I. Avigan, R. P. Mozersky, and L. B. Seeff, “Scientific and regulatory perspectives in herbal and Dietary supplement associated hepatotoxicity in the United States,” Int. J. Mol. Sci., vol. 17, no. 3, p. 331, Mar. 2016.
[53] S. Ross, “Functional foods: the Food and Drug Administration perspective,” Am. J. Clin. Nutr., vol. 71, no. 6, pp. 1735S-1738S, 2000.
[54] T.-P. Fan G. Deal, H.-L. Koo, D. Rees, H. Sun, S. Chen, J.-H Dou, V. G. Makarov, O. N. Pozharitskaya, A. N. Shikov, Y. S. Kim, Y.-T. Huang, Y. S. Chang, W. Jia, A. Dias, V. C.-w. Wong, K. Chan, “Future development of global regulations of Chinese herbal products,” J. Ethnopharmacol., vol. 140, no. 3, pp. 568–586, Apr. 2012.
[55] D. B. Kramer, S. Xu, and A. S. Kesselheim, “Regulation of medical devices in the United States and European Union,” N. Engl. J. Med., vol. 366, no. 9, pp. 848–855, 2012.
[56] U.S. Food & Drug Administration, “Code of Federal Regulations Title 21, part 872 Detal devices,” 2018. [Online]. Available: https://www.accessdata.fda.gov/scripts/cdrh/cfdocs /cfcfr/CFR Search.cfm?fr=872.3850. [Accessed: 10-Aug-2019].
[57] European Comission, “Cosmetic Legislation.” [Online]. Available: https://ec.europa.eu/ growth/sectors/cosmetics/legislation_en. [Accessed: 14-Sep-2019].
[58] M. Biagi, R. Pecorari, G. Appendino, E. Miraldi, A. R. Magnano, P. Governa, G. Cettolin, D. Giachetti , “Herbal products in Italy: the thin line between phytotherapy, nutrition and parapharmaceuticals; a normative overview of the fastest growing market in Europe,” Pharmaceuticals, vol. 9, no. 4, Oct. 2016.
[59] U.S. Food and Drug Administration (FDA), “Federal Food, Drug and Cosmetic Act of 1938, as amended through P.L. 116-22, Enacted June 24, 2019,” 1938. [Online]. Available: https://legcounsel.house.gov/Comps/Federal Food, Drug, And Cosmetic Act.pdf. [Accessed: 09-Aug-2019].

D. A. Frommenwiler References
206
R
[60] U.S. Food & Drug Administration (FDA), “Is it a cosmetic, a drug, or both? (or is it soap?),” 2018. [Online]. Available: https://www.fda.gov/cosmetics/cosmetics-laws-regulations/it-cosmetic-drug-or-both-or-it-soap. [Accessed: 09-Aug-2019].
[61] U.S. Food & Drug Administration (FDA), “FDA authority over cosmetics: how cosmetics are not FDA-approved, but are FDA-regulated,” 2018. [Online]. Available: https://www.fda.gov/ cosmetics/cosmetics-laws-regulations/fda-authority-over-cosmetics-how-cosmetics-are-not-fda-approved-are-fda-regulated#What_kinds. [Accessed: 09-Aug-2019].
[62] U.S. Food & Drug Administration, “Prohibited & restricted ingredients in cosmetics,” 2017. [Online]. Available: https://www.fda.gov/cosmetics/cosmetics-laws-regulations/prohibited-restricted-ingredients-cosmetics. [Accessed: 14-Sep-2019].
[63] J. Prakash, S. Srivastava, R. S. Ray, N. Singh, R. Rajpali, and G. N. Singh, “Current status of herbal drug standards in the Indian Pharmacopoeia,” Phytoterapy Res., vol. 31, pp. 1817–1823, 2017.
[64] K. S. Kumar, “Herbal Pharmacopoeias - an overview of international and Indian representation,” J. Ayurvedic Herb. Med., vol. 1, no. 3, pp. 59–60, 2015.
[65] The United States Pharmacopoeia Convention (USP), “Monographs in the Herbal Medicines Compendium guidelines document,” 2013. [Online]. Available: https://hmc.usp.org /sites/default /files/documents/Guidelines/HMC Monograph Guidelines v 1 1_EC comment.p df. [Accessed: 03-Feb-2019].
[66] R. Kumari and M. Kotecha, “A review on the standardization of herbal medicines,” Int. J. Pharma Sci. Res., vol. 7, no. 2, pp. 97–106, 2016.
[67] S.-J. Yoo and G. Giancaspro, “Establishing specifications as required by dietary supplement CGMPs,” Nutraceuticals World, 2017. [Online]. Available: https://www.nutraceuticalsworld .com/contents/view_features/2017-03-01/establishing-specifications-as-required-by-dietary-supplement-cgmps. [Accessed: 17-Mar-2019].
[68] European Directorate for the Quality of Medicines (EDQM), “Guide for the elaboration of monographs on herbal drugs and herbal drug preparations.” Strasbourg, p. 22, 2007.
[69] S. Dentali, “Organoleptic analysis of herbal ingredients.” American Herbal Products Association, Silver Spring, p. 43, 2013.
[70] R. Upton, A. Graff, G. Jolliffe, R. Länger, and E. Williamson, American Herbal Pharmacopoeia: botanical pharmacognosy - microscopic characterization of botanical medicines, 1st ed. Boca Raton: CRC Press, 2016.
[71] S. J. Lachumy and S. Sasidharan, “The usage of microscopy method for herbal standardizations,” in Current microscopy contributions to advances in science and technology, A. Méndez-Vilas, Ed. Formatex Research Center, 2012, pp. 704–710.
[72] I. Parveen, S. Gafner, N. Techen, S. Murch, and I. Khan, “DNA barcoding for the identification of botanicals in herbal medicine and dietary supplements: strengths and limitations,” Planta Med., vol. 82, no. 14, pp. 1225–1235, 2016.
[73] H. J. de Boer, M. C. Ichim, and S. G. Newmaster, “DNA barcoding and pharmacovigilance of herbal medicines,” Drug Saf., vol. 38, no. 7, pp. 611–620, 2015.
[74] J. Costa, J. S. Amaral, T. J. R. Fernandes, A. Batista, M. B. P. P. Oliveira, and I. Mafra, “DNA extraction from plant food supplements: influence of different pharmaceutical excipients,” Mol. Cell. Probes, vol. 29, no. 6, pp. 473–478, 2015.
[75] R. DeSalle, “Species discovery versus species identification in DNA barcoding efforts: response to rubinoff,” Conserv. Biol., no. 5, pp. 1545–1547, 2006.
[76] R. Srirama, U. Senthilkumar, N. Sreejayan, G. Ravikanth, B. R. Gurumurthy, M. B. Shivanna, M. Sanjappa, K. N. Ganeshaiah, R. Uma Shaanker, “Assessing species admixtures in raw drug trade of Phyllanthus, a hepato-protective plant using molecular tools,” J. Ethnopharmacol., vol. 130, no. 2, pp. 208–215, 2010.
[77] Y. Zuo, Z. Chen, K. Kondo, T. Funamoto, J. Wen, and S. Zhou, “DNA Barcoding of Panax Species,” Planta Med., vol. 77, no. 02, pp. 182–187, 2011.
[78] D. A. Baker, D. W. Stevenson, and D. P. Little, “DNA barcode identification of black cohosh herbal dietary supplements.,” J. AOAC Int., vol. 95, no. 4, pp. 1023–34, 2012.

D. A. Frommenwiler References
207
R
[79] D. P. Little and M. L. Jeanson, “DNA barcode authentication of saw palmetto herbal dietary supplements,” Sci. Rep., vol. 3, no. 1, p. 3518, 2013.
[80] D. P. Little, “Authentication of Ginkgo biloba herbal dietary supplements using DNA barcoding,” Genome, vol. 57, no. 9, pp. 513–516, 2014.
[81] C. Kradjel, “Practical use of FT-NIR for identification and qualification of botanicals a fit-for-purpose approach,” in Botanicals: methods and techniques for quality & authenticity, Kurt A. Reynertson and Khalid Mahmood, Eds. Boca Raton: CRC Press, 2015, pp. 215–239.
[82] C. Huck, “Near-infrared (NIR) spectroscopy in natural product research,” in Handbook of chemical and biological pant analytical methods, Vol. 1, Pa., K. Hostettman, S. Chen, A. Marston, and H. Stuppner, Eds. John Wiley & Sons, Ltd, 2014, pp. 1–19.
[83] D. Cozzolino, “Applications of molecular spectroscopy in environmental and agricultural omics,” in OMICS: applications in biomedical, agricultural, and environmental sciences, Debmalya Barh, Vasudeo Zambare, and Vasco Azevedo, Eds. Boca Raton: CRC Press, 2013, pp. 551–564.
[84] S. S. Shukla, S. Saraf, and S. Saraf, “Development of spectrophotometric fingerprinting method for Talisadi Churna,” East Cent. African J. Pharm. Sci., vol. 12, pp. 52–54, 2009.
[85] D. L. Luthria, S. Mukhopadhyay, R. J. Robbins, J. W. Finley, G. S. Banuelos, and J. M. Harnly, “UV spectral fingerprinting and analysis of variance-principal component analysis: a useful tool for characterizing sources of variance in plant materials,” J. Agric. Food Chem., vol. 56, pp. 5457–5462, 2008.
[86] R. Boggia, F. Turrini, M. Anselmo, P. Zunin, D. Donno, and G. L. Beccaro, “Feasibility of UV-VIS-fluorescence spectroscopy combined with pattern recognition techniques to authenticate a new category of plant food supplements.,” J. Food Sci. Technol., vol. 54, no. 8, pp. 2422–2432, Jul. 2017.
[87] A. Y. Leung, “Tradition-and science-based quality control of Chinese medicines-introducing the Phyto-True TM System,” Oxford Academic, Sep. 2010.
[88] Committee for medicinal products for human use (CHMP) committee for medicinal products for veterinary use (CVMP), “Guideline on specifications: test procedures and acceptance criteria for herbal substances, herbal preparations and herbal medicinal products/traditional herbal medicinal products,” London, 2006.
[89] C.-Z. Wang and Y. Shoyama, “Herbal medicine: identification, analysis, and evaluation strategies,” in Traditional Chinese Medicine, Chun-Su Yuan, Erick J. Bieber, and Brent A. Bauer, Eds. Boca Raton: CRC Press, 2011, p. 318.
[90] D. Moiseev, “Determination of hypericin in St. John’s wort by derivative spectrophotometry,” J. Pharmacogn. Phytochem., vol. 5, no. 6, pp. 249–253, 2016.
[91] S. Foster and M. Blumenthal, “The adulteration of commercial bilberry extracts,” Herbalgram, no. 96, pp. 64–73, 2012.
[92] S. Kupina and S. Gafner, “Adulteration of grape seed extract,” Bot. Adulterants Bull., p. 5, 2016.
[93] K. L. Colson, J. Yuk, and C. Fische, “Nuclear magnetic resonance a revolutionary tool for nutraceutical analysis,” in Botanicals: methods and techniques for quality & authenticity, 1st ed., Kurt Reynertson and Khalid Mahmood, Eds. Boca Raton: CRC Press, 2015, pp. 157–181.
[94] E. A. Mahrous and M. A. Farag, “Two dimensional NMR spectroscopic approaches for exploring plant metabolome: a review,” J. Adv. Res., vol. 6, pp. 3–15, 2015.
[95] A. Booker, D. Johnston, and M. Heinrich, “Value chains of herbal medicines - ethnopharmacological and analytical challenges in a globalizing world,” in Evidence-based validation of herbal medicine, 1st ed., P. K. Mukherjee, Ed. Boca Raton: Elsevier, 2015, pp. 29–44.
[96] M. Balci, Basic 1H- and 13C-NMR Spectroscopy, 1st ed. Boca Raton: Elsevier Science, 2005.
[97] A.-H. M. Emwas, “The strengths and weaknesses of NMR spectroscopy and mass spectrometry with particular focus on metabolomics research,” in Metabonomics methods

D. A. Frommenwiler References
208
R
and protocols, 1st ed., J. Bjerrum, Ed. Clifton: Springer, 2015, pp. 161–193.
[98] C. Simmler, J. G. Napolitano, J. B. McAlpine, S. N. Chen, and G. F. Pauli, “Universal quantitative NMR analysis of complex natural samples,” Current Opinion in Biotechnology, vol. 25. NIH Public Access, pp. 51–59, Feb-2014.
[99] G. F. Pauli, B. U. Jaki, and D. C. Lankin, “Reviews quantitative 1 H NMR: development and potential of a method for natural products analysis §,” J. Nat. Prod., vol. 68, no. 1, pp. 133–149, 2005.
[100] G. F. Pauli, “qNMR — a versatile concept for the validation of natural product reference compounds,” Phytochem. Anal., vol. 12, no. 1, pp. 28–42, Jan. 2001.
[101] M. Ambrose, “Quantitative NMR use for botanical RS characterization. Current developments and path forward,” in USP Dietary Supplements Stakeholder Forum, 2018.
[102] N. Bjarnholt, B. Li, J. D’Alvise, and C. Janfelt, “Mass spectrometry imaging of plant metabolites – principles and possibilities,” Nat. Prod. Rep., vol. 31, no. 6, pp. 818–837, 2014.
[103] D. D. Marshall and R. Powers, “Beyond the paradigm: combining mass spectrometry and nuclear magnetic resonance for metabolomics,” Prog Nucl Magn Reson Spectrosc, vol. 100, pp. 1–16, 2017.
[104] Y. Shen, W.-Y. Wu, and D.-A. Guo, “DART-MS: A new research tool for herbal medicine analysis,” World J. Tradit. Chinese Med., pp. 2–9, 2016.
[105] “High resolution mass spectrometry,” Biocompare Editorial Article, 2007. [Online]. Available: https://www.biocompare.com/Editorial-Articles/41598-High-Resolution-Mass-Spectrometry/. [Accessed: 07-Apr-2019].
[106] R. Patel and K. Patel, “Significance of various chromatographic techniques in herbal drug analysis,” Available online www.jocpr.com J. Chem. Pharm. Res., vol. 8, no. 7, pp. 877–882, 2016.
[107] Official Journal of the European Union, “Commission implementing regulation (EU) No 788/2012 concerning a coordinated multiannual control programme of the Union for 2013, 2014 and 2015 to ensure compliance with maximum residue levels of pesticides and to assess the consumer exposure to pesticide residues in and on food of plant and animal origin.” Strassburg, pp. L235–L238, 2012.
[108] Y. Man, G. Liang, A. Li, and L. Pan, “Analytical methods for the determination of alternaria mycotoxins,” Chromatographia, vol. 80, no. 1, pp. 9–22, 2017.
[109] Z. Yongyu, S. Shujun, D. Jianye, W. Wenyu, C. Huijuan, W. Jianbing, G. Xiaojun, “Quality control method for herbal medicine - chemical fingerprint analysis,” in Quality control of herbal medicines and related areas, Y. Shoyama, Ed. InTech, 2011, pp. 173–194.
[110] D. Balmer, V. Flors, G. Glauser, and B. Mauch-Mani, “Metabolomics of cereals under biotic stress: current knowledge and techniques,” Front. Plant Sci., vol. 4, p. 82, Apr. 2013.
[111] Z. Lei, D. V. Huhman, and L. W. Sumner, “Mass spectrometry strategies in metabolomics,” J. Biol. Chem., vol. 286, no. 29, pp. 25435–25442, 2011.
[112] European Directorate for the Quality of Medicines (EDQM), “Monograph for anise oil (N° 0804),” in European Pharmacopoeia 9.0, Strasbourg, 2017, p. 1530.
[113] K.-M. Lee, J.-Y. Jeon, B.-J. Lee, H. Lee, and H.-K. Choi, “Application of metabolomics to quality control of natural product derived medicines,” Biomol. Ther. (Seoul)., vol. 25, no. 6, pp. 559–568, 2017.
[114] C. Bicchi, E. Liberto, M. Matteodo, B. Sgorbini, L. Mondello, B. d’A. Zellner, R. Costa, P. Rubiolo, “Quantitative analysis of essential oils: a complex task,” Flavour Fragr. J., vol. 23, no. 6, pp. 382–391, 2008.
[115] A. Pérez-Parada, M. Colazzo, N. Besil, E. Dellacassa, V. Cesio, H. Heinzen, A. R. Fernández-Alba, “Pesticide residues in natural products with pharmaceutical use: occurrence, analytical advances and perspectives,” in Pesticides in the modern world - trends in pesticides analysis, Margarita Stoytcheva, Ed. IntechOpen, 2011, pp. 357–390.
[116] European Commission Directorate General for Health and Food Safety, “Guidance document on analytical quality control and method validation procedures for pesticide residues and

D. A. Frommenwiler References
209
R
analysis in food and feed. SANTE/11813/2017.” p. 46, 2017.
[117] M. R. Siddiqui, Z. A. Alothman, and N. Rahman, “Analytical techniques in pharmaceutical analysis: a review,” Arab. J. Chem., vol. 10, pp. S1409–S1421, 2017.
[118] N. A. Farooqui, A. Dey, G. N. Singh, T. S. Easwari, and M. K. Pandey, “Analytical techniques in quality evaluation of herbal drugs,” Asian J. Pharm. Res., vol. 4, no. 3, pp. 112--117, 2014.
[119] A. Bansal, V. Chhabra, R. K. Rawal, and S. Sharma, “Chemometrics: a new scenario in herbal drug standardization,” J. Pharm. Anal., vol. 4, pp. 223–233, 2014.
[120] United States Pharmacopeial Convention, “General chapter <561>: Articles of botanical origin,” in United States Pharmacopeia, 41st-NF 36th ed., Rockville, MD, USA: United States Pharmacopeial, 2018, p. 6293.
[121] Y.-Z. Liang, P. Xie, and K. Chan, “Quality control of herbal medicines,” J. Chromatogr. B, vol. 812, pp. 53–70, 2004.
[122] S. Cañigueral, D. A. Frommenwiler, E. Reich, and R. Vila, “High performance thin-layer chromatography (HPTLC) in the quality control of herbal products,” in Recent advances in pharmaceutical sciences, VIII., D. Muñoz-Torrero, Y. Cajal, and J. M. Llobet, Eds. Kerala: Research Signpost, 2018, pp. 119–136.
[123] E. Reich and A. Schibli, High-performance thin-layer chromatography for the analysis of medicinal plants. Thieme, 2007.
[124] D. Kumar and U. Sharma, “High-performance thin-layer chromatography: an economical alternative for the quality control of medicinal plants and derived products,” Sep. Sci. Plus, vol. 1, no. 2, pp. 100–134, 2018.
[125] E. Reich, D. A. Frommenwiler, and V. Maire-Widmer, “High-performance thin-layer chromatography for the identification of botanical materials and the detection of adulteration,” in Botanicals: methods and techniques for quality & authenticity, 1st ed., K. Reynardson and M. Khalid, Eds. Boca Raton: CRC Press, 2015, pp. 241–259.
[126] A. Booker, D. Frommenwiler, D. Johnston, C. Umealajekwu, E. Reich, and M. Heinrich, “Chemical variability along the value chains of turmeric (Curcuma longa): a comparison of nuclear magnetic resonance spectroscopy and high performance thin layer chromatography,” J. Ethnopharmacol., vol. 152, no. 2, pp. 292–301, 2014.
[127] D. Rathee, S. Rathee, P. Rathee, A. Deep, S. Anandjiwala, and D. Rathee, “HPTLC densitometric quantification of stigmasterol and lupeol from Ficus religiosa,” Arab. J. Chem., vol. 8, no. 3, pp. 366–371, 2015.
[128] A. Shuayprom, D. Sanguansermsri, P. Sanguansermsri, I. H. Fraser, and N. Wongkattiya, “Quantitative determination of vitexin in Passiflora foetida Linn. leaves using HPTLC,” Asian Pac. J. Trop. Biomed., vol. 6, no. 3, pp. 216–220, 2016.
[129] P. Xie and Y. Yun, “Ling-Zhi,” in Chromatographic fingerprints for the detailed illustration, X. Peishan and Y. Yuzhen, Eds. Beijing: The Straits Publishing & Distributing Group, 2010, pp. 163–173.
[130] Merck, “History of thin-layer chromatography.” [Online]. Available: https://www.merck millipore.com/CH/de/analytics-sample-preparation/learning-center-thin-layer-chromatograp hy/tlc-history/bSGb.qB.xO4AAAFVQRxDx07D,nav?ReferrerURL=https %3A%2F%2Fwww. google.com%2F. [Accessed: 07-Mar-2020].
[131] Council of Europe, “Thin-layer chromatography,” in European Pharmacopoeia, 1.0, Vol 1., Sainte Ruffine, France: Maisonneuve, S.A, 1969, pp. 88–89.
[132] Council of Europe, “Thin-layer chromatography,” in European Pharmacopoeia, 2.0 Fascicle 13th, Ed. Strasbourg, 1989, p. 2 pages.
[133] European Directorade for the Quality of Medicines, “Chapter 2.2.27 thin-layer chromatography,” in European Pharmacopoeia, 3.0., Strasbourg, 2001, pp. 38–39.
[134] M. Blumenthal, “Congress passes dietary supplement health and education act of 1994: herbs to be protected as supplements,” HerbalGram, no. 32, p. 18, 1994.
[135] D. Swisher, D. Garcia, and A. Goldberg, “Hawthorn leaf with flower,” in American Herbal Pharmacopoeia (AHP) and Therapeurical Compendium, R. Upton and C. Petrone, Eds.

D. A. Frommenwiler References
210
R
Santa Cruz, US: American Herbal Pharmacopoeia, 1999, pp. 1–28.
[136] E. Reich, A. Blatter, and B. Meier, “TLC for the analysis of herbal drugs. A critical review of the status and proposal for improvement of monographs,” Pharmeuropa Sci. note, no. 15.3, pp. 424–430, 2003.
[137] K. Koll, E. Reich, A. Blatter, and M. Veit, “Validation of standardized high-performance thin-layer chromatographic methods for quality control and stability testing of herbals,” J. AOAC Int., vol. 86, no. 5, pp. 909–915, Sep. 2003.
[138] European Directorate for the Quality of Medicines (EDQM), “Chapter 2.2.27 thin-layer chromatography,” in European Pharmacopoeia, 5.0., 2005, pp. 3090–3091.
[139] United States Pharmacopoeial Convention, “General chapter <621>: Chromatography,” in United States Pharmacopeia, 29th-NF 24th ed., Rockville, US: United States Pharmacopeial, 2005, p. 2639.
[140] E. Reich and Anne Schibli, “Validation of high-performance thin-layer chromatographic methods for the identification of botanicals in a cGMP environment,” J. AOAC Int., vol. 91, no. 1, pp. 13–20, 2008.
[141] United States Pharmacopeial Convention, Dietary Supplement Compendium, First. Rockville, MD, USA, 2009.
[142] United States Pharmacopeial Convention, “Chapter 203: High-performance thin-layer chromatography procedure for identification of articles of botanical origin,” in The United States Pharmacopoeia, 40th–NF 35 ed., Rockville, 2017, pp. 258–260.
[143] European Directorate for the Quality of Medicines and Healthcare (EDQM), “Chapter 2.8.25: High-performance thin-layer chromatography of herbal drugs and herbal preparations,” in European Pharmacopoeia, 9.0., 2017, pp. 295–296.
[144] The International Association for the Advancement of High Performance Thin Layer Chromatography, “Standard operating procedure for HPTLC,” 2012. [Online]. Available: https://www.hptlc-association.org/. [Accessed: 08-Mar-2020].
[145] L. Chandler, “Sources of errors in molecular testing,” in Accurate results in the clinical laboratory, 1st ed., Amitava Dasgupta and Jorge L. Sepulveda, Eds. Elsevier, 2013, pp. 327–341.
[146] S. Keitel, “Inside EDQM: the role of the pharmacopeia in a globalized world,” Pharmtech, vol. 34, no. 4, 2010.
[147] R. D. da C. C. Bandeira, T. M. Uekane, C. P da Cunha, J. M. Rodrigues, M. H. C. de la Cruz, R. L. de O. Godoy, A. de L. Fioravante, “Comparison of high performance liquid chromatography with fluorescence detector and with tandem mass spectrometry methods for detection and quantification of ochratoxin a in green and roasted coffee beans,” Brazilian Arch. Biol. Technol., vol. 56, no. 6, pp. 911–920, 2013.
[148] G. Biringanine, M. T. Chiarelli, M. Faes, and P. Duez, “A validation protocol for the HPTLC standardization of herbal products: application to the determination of acteoside in leaves of Plantago palmata Hook. f.s.,” Talanta, vol. 69, no. 2, pp. 418–424, 2006.
[149] K. A. Reynertson and K. Mahmood, “The importance of quality and authenticity for botanical R&D,” in Botanicals. Method and techniques for quality & authenticity, K. A. Reynertson and K. Mahmood, Eds. Boca Raton: CRC Press, 2015, pp. 1–3.
[150] HPTLC Association, “HPTLC method for Silybum marianum - fruit,” 2019. [Online]. Available: https://www.hptlc-association.org/methods/methods.cfm.
[151] HPTLC Association, “HPTLC method for narrowleaf coneflower root (Echinacea angustifolia) - Alkylamides,” 2014. [Online]. Available: https://www.hptlc-association.org/methods/ methods.cfm
[152] European Directorate for the Quality of Medicines and Healthcare (EDQM), “Monographs for black cohosh root (2069),” in European Pharmacopoeia, 10.0., Strasbourg, 2017, pp. 1355–1358.
[153] J. Sherma and F. Rabel, “Review of thin layer chromatography in pesticide analysis: 2016-2018,” J. Liq. Chromatogr. Relat. Technol., pp. 1–14, 2019.

D. A. Frommenwiler References
211
R
[154] T. Tang and W. Hong, “An image analysis system for thin-layer chromatography quantification and its validation,” J. Chromatogr. Sci., vol. 46, no. 6, pp. 560–564, 2008.
[155] The United States Pharmacopoeia (USP), “Monograph for powdered ginkgo extract,” in Pharmacopoeial Convention 38–NF33, Rockville, MD, USA, 2015, pp. 6064–6067.
[156] United States Pharmacopeial Convention, “Monographs for Ganoderma lucidum fruiting body and Ganoderma lucidum fruiting body powder,” in United States Pharmacopoeia, Rockville, MD, USA, 2018, pp. 4629–4635.
[157] HPTLC Association, “SOP 013 Evaluation, optimization, development, and validation of methods for identification of medicinal plants and products thereof, Version 05,” 2018. [Online]. Available: https://www.hptlc-association.org/member_area/tools.cfm. [Accessed: 15-Mar-2020].
[158] HPTLC Association, “SOP 005 Sample preparation for HPTLC,” 2018. [Online]. Available: https://www.hptlc-association.org/member_area/tools.cfm. [Accessed: 15-Mar-2020].
[159] HPTLC Association, “SOP 001 General methodology for HPTLC,” 2018. [Online]. Available: https://www.hptlc-association.org/member_area/tools.cfm. [Accessed: 15-Mar-2020].
[160] U. S. P. Convention, “Herbal Medicines Compendium.” [Online]. Available: https://hmc.usp. org/monographs/all. [Accessed: 02-Jun-2020].
[161] “Hong Kong Chinese Materia Medica Standards, 9 volumes.” [Online]. Available: https://www.cmro.gov.hk/html/eng/GCMTI/hkcmms/volumes.html. [Accessed: 02-Jun-2020].
[162] H. Wagner and S. Bladt, Plant drug analysis. Springer Berlin Heidelberg, 1996.
[163] “The International Association for the Advancement of High Performance Thin Layer Chromatography (HPTLC Association).” [Online]. Available: https://www.hptlc-association. org/ home.cfm. [Accessed: 02-Jun-2020].
[164] D. Frommenwiler, M. Monagas, and E. Reich, “Quality of cranberry-derived products: one HPTLC method for identification and detection of adulterants,” in 67th International Congress and Annual Meeting of the Society for Medicinal Plant and Natural Product Research (GA) in cooperation with the French Society of Pharmacognosy AFERP, 2019, vol. 85, no. 18, p. P-024.
[165] HPTLC Association, “SOP 006 Derivatization reagents,” 2018. [Online]. Available: https://www. hptlc-association.org/member_area/tools.cfm. [Accessed: 15-Mar-2020].
[166] The International Council for Harmonisation of Technical Requirements for Pharmaceuticals for Human Use (ICH), “Validation of analytical procedures: text and methodology Q2(R1),” 2005.

D. A. Frommenwiler References
212
R