Quantitative determination of compounds in tobacco essential oils by comprehensive two-dimensional...
8
Journal of Chromatography A, 1086 (2005) 107–114 Quantitative determination of compounds in tobacco essential oils by comprehensive two-dimensional gas chromatography coupled to time-of-flight mass spectrometry Shukui Zhu a , Xin Lu b , Li Dong a , Jun Xing a , Xueli Su a , Hongwei Kong b , Guowang Xu b , Caiying Wu a,∗ a College of Chemistry and Molecular Science, Wuhan University, Wuhan 430072, China b National Chromatographic R&A Center, Dalian Institute of Chemical Physics, Chinese Academy of Sciences, Dalian 116011, China Available online 29 April 2005 Abstract A quantitative analysis of the individual compounds in tobacco essential oils is performed by comprehensive two-dimensional gas chro- matography (GC × GC) combined with flame ionization detector (FID). A time-of-flight mass spectrometer (TOF/MS) was coupled to GC × GC for the identification of the resolved peaks. The response of a flame ionization detector to different compound classes was calibrated using multiple internal standards. In total, 172 compounds were identified with good match and 61 compounds with high probability value were reliably quantified. For comparative purposes, the essential oil sample was also quantified by one-dimensional gas chromatography–mass spectrometry (GC/MS) with multiple internal standards method. The results showed that there was close agreement between the two analysis methods when the peak purity and match quality in one-dimensional GC/MS are high enough. © 2005 Elsevier B.V. All rights reserved. Keywords: Comprehensive two-dimensional gas chromatography; Time-of-flight mass spectrometry; Gas chromatography–mass spectrometry; Multiple internal standards calibration; Essential oils; Tobacco 1. Introduction Many tobacco essential oils have a popular and easily rec- ognizable fragrance, which has been attributed to the volatile and semi-volatile components. In order to understand the re- lationship between constituents and the aroma of essential oils, analysis of these constituents is necessary. The result obtained from this may be used to answer the research or industrial analysis questions, such as for comparative pur- poses, where one essential oil is contrasted with others for quality control or investigation of adulteration, to discover new components, or to characterize the chemical classes of compounds present. By their nature, essential oils almost ∗ Corresponding author. Tel.: +86 27 8768 4244; fax: +86 27 8764 7617. E-mail address: [email protected] (C. Wu). range from volatile through to semi-volatile compounds. This range is particularly suited to gas chromatographic analysis. However, Adams [1] reveals an enormous number of com- pounds that are present in essential oils and like materials. The similarity of retention indices of many related components will result in overlapping peaks. The presence of unsaturated bonds, various branched and cyclic compounds, and oxy- genated analogues (e.g., alcohols and ketones) will further complicate the issue. One-dimensional gas chromatography cannot provide sufficient separation for a complete qualita- tive, let alone, quantitative analysis, so it is desired to develop some new separation technologies to achieve improved anal- ysis. Comprehensive two-dimensional gas chromatography (GC × GC), which may be considered the most powerful separation tool in GC [2], is a technique highly suited for 0021-9673/$ – see front matter © 2005 Elsevier B.V. All rights reserved. doi:10.1016/j.chroma.2005.04.007
-
Upload
independent -
Category
Documents
-
view
3 -
download
0
Transcript of Quantitative determination of compounds in tobacco essential oils by comprehensive two-dimensional...
Journal of Chromatography A, 1086 (2005) 107–114
Quantitative determination of compounds in tobaccoessential oils by comprehensive two-dimensional gas
chromatography coupled to time-of-flightmass spectrometry
Shukui Zhua, Xin Lu b, Li Donga, Jun Xinga, Xueli Sua, Hongwei Kongb,Guowang Xub, Caiying Wua,∗
a College of Chemistry and Molecular Science, Wuhan University, Wuhan 430072, Chinab National Chromatographic R&A Center, Dalian Institute of Chemical Physics, Chinese Academy of Sciences,
Dalian 116011, China
Available online 29 April 2005
Abstract
gas chro-pled to
calibratedility valueraphy–masstwo analysis
tiple internal
hislysis.m-. Thentsatedoxy-rtheraphylita-elopanal-
phyrfulr
A quantitative analysis of the individual compounds in tobacco essential oils is performed by comprehensive two-dimensionalmatography (GC× GC) combined with flame ionization detector (FID). A time-of-flight mass spectrometer (TOF/MS) was couGC× GC for the identification of the resolved peaks. The response of a flame ionization detector to different compound classes wasusing multiple internal standards. In total, 172 compounds were identified with good match and 61 compounds with high probabwere reliably quantified. For comparative purposes, the essential oil sample was also quantified by one-dimensional gas chromatogspectrometry (GC/MS) with multiple internal standards method. The results showed that there was close agreement between themethods when the peak purity and match quality in one-dimensional GC/MS are high enough.© 2005 Elsevier B.V. All rights reserved.
Keywords:Comprehensive two-dimensional gas chromatography; Time-of-flight mass spectrometry; Gas chromatography–mass spectrometry; Mulstandards calibration; Essential oils; Tobacco
1. Introduction
Many tobacco essential oils have a popular and easily rec-ognizable fragrance, which has been attributed to the volatileand semi-volatile components. In order to understand the re-lationship between constituents and the aroma of essentialoils, analysis of these constituents is necessary. The resultobtained from this may be used to answer the research orindustrial analysis questions, such as for comparative pur-poses, where one essential oil is contrasted with others forquality control or investigation of adulteration, to discovernew components, or to characterize the chemical classes ofcompounds present. By their nature, essential oils almost
∗ Corresponding author. Tel.: +86 27 8768 4244; fax: +86 27 8764 7617.E-mail address:[email protected] (C. Wu).
range from volatile through to semi-volatile compounds. Trange is particularly suited to gas chromatographic anaHowever, Adams[1] reveals an enormous number of copounds that are present in essential oils and like materialssimilarity of retention indices of many related componewill result in overlapping peaks. The presence of unsaturbonds, various branched and cyclic compounds, andgenated analogues (e.g., alcohols and ketones) will fucomplicate the issue. One-dimensional gas chromatogrcannot provide sufficient separation for a complete quative, let alone, quantitative analysis, so it is desired to devsome new separation technologies to achieve improvedysis.
Comprehensive two-dimensional gas chromatogra(GC× GC), which may be considered the most poweseparation tool in GC[2], is a technique highly suited fo
0021-9673/$ – see front matter © 2005 Elsevier B.V. All rights reserved.doi:10.1016/j.chroma.2005.04.007
108 S. Zhu et al. / J. Chromatogr. A 1086 (2005) 107–114
the separation of complex mixture such as petroleum, envi-ronmental, tobacco smoke and essential oil samples. Withthis new technique, the peaks eluting from the first GC col-umn enter a cold-jet modulator, which traps each subsequentsmall portions of eluate, focuses these portions and intro-duces them into a second column for further separation.GC× GC differs from conventional multidimensional sep-arations in that the whole sample is subjected to both di-mensions of the separation processes in a single run. Thetheoretical peak capacity that can be achieved is the productof the peak capacities of the two individual GC separations[3].
For an essential oil, different content ratio among the com-ponents will strongly influence the quality of flavor; mean-while, even some minor components should not be over-looked as they also contribute to the overall qualities of anessential oil. Therefore, the analysis of essential oil shouldnot only provide sufficient separation, but also accurate quan-titation of all individual components. With respect to thequantitative determination of all individual components incomplex mixture, the traditional method is normalization ofpeak area[4–6] and single internal standard calibration with-out considering calibration factors (i.e. supposing the rela-tive response factors equate to one for all compounds)[7].Normalization of peak area requires that the whole compo-nents in the sample could elute from the capillary columna latilec ibra-t dardm ter-m tiond elyd emsu om-p entst ccoe vol-u ter-n owedt tionw at ist es-s beu
l oilw e-t ntialo -n deda lexma ) fort to-b ta anti-t
2. Experimental
2.1. Instrumentation
The Comprehensive two-dimensional gas chromatographsystem consisted of an HP6890GC equipped with a flameionization detector (Agilent Technologies, Wilmington, DE,USA) and a cold-jet modulator KT-2001 Retrofit prototype(Zoex Corp., Lincoln, NE, USA). The cold-jet modulatorconsisted of two cold- and two hot-jets, with the nozzlesproviding the cold-jets mounted orthogonally to the hot-jets.Nitrogen gas was cooled by a heat exchanger through coppertubing immersed in liquid nitrogen outside the GC system anddelivered through vacuum-insulated tubing to the cold-jets,which provided two continuous jets of cold nitrogen gas. TheGC oven contained two capillary columns connected seriallyvia the cold-jet modulator. The modulator focuses and re-injects the analyte as a sharp chemical pulse into the seconddimension GC column. A time-of-flight mass spectrometer(Pegasus, Leco Corporation, St. Joseph, MI, USA) was usedto acquire mass spectral data from the GC× GC using 70 eVelectron impact ionization, which has a maximum spectralacquisition rate of 500 spectra/s.
Either GC× GC-FID data (100 Hz) or GC× GC-TOF/MS data (50 Hz) may be exported in ASCII file for-mat (*.csv files). The *.csv files were converted into a two-d ramb . Them oft-w orne,U t canb orp.,L
istedo 73Nm DE,U
2
,t nnec-t . Thec
kPa.H ty of9 , ata tialo s.T t3 terw th ani -p asa 5 to5
nd be detected, but it was not true for some non-voompounds in the essential oil. Internal standard calion requires that the functional groups of internal stanolecular should be similar with those of compound deined, in addition, the response factor of flame ionizaetector (FID) to different component class is distinctivifferent, so the single internal standard calibration sensuitable for the quantitation of compounds in such a clex sample. For answering this question, the experim
o quantify 10 compounds with known content in tobassential oil were done using normalization of peakme, single internal standard calibration and multiple inal standards calibration, respectively. The results sh
hat the data from multiple internal standards calibraere closer to the true value than the other two. Th
o say, in order to reliably quantify the compounds inential oil, multiple internal standards calibration shouldsed.
In this paper, the components in tobacco essentiaere identified by GC× GC time-of-flight mass spectrom
er (TOF/MS), and all the individual components in esseil were quantified by GC× GC-FID using multiple interal standards calibration for the first time, which provimethod to quantify all individual components in compixtures. In addition, this paper also compared GC× GCnd gas chromatography–mass spectrometry (GC/MS
he identification and quantitation of the components inacco essential oil. The results showed GC× GC had greadvantage, especially in its reliable and reproducible qu
ative analysis.
imensional matrix by a homemade conversion progased on the modulation frequency and sampling rateatrix files were read into Transform (part of Noesys Sare Package, Research Systems International, CrowthK) to generate a contour plot. The peaks in contour ploe integrated and quantified by Zoex software (Zoex Cincoln, NE, USA).
The one-dimensional GC/MS system used consf an HP6890 gas chromatograph and an HP59ass spectrometer (Agilent Technologies, Wilmington,SA).
.2. Columns and conditions
In the analysis of GC× GC-FID and GC× GC-TOF/MShe columns were connected by means of a press-fit coor, and the two columns were installed in the same ovenolumn sets used are listed inTable 1.
The inlet pressure used in this experiment was 600elium was used as the carrier gas, which had a puri9.9995%. Injections were performed in the split modesplit ratio of 1:30. The injection volume of the essen
il sample was 0.5�l. The total modulation time was 5he oven temperature program was: 40◦C (1 min hold), a◦C/min to 220◦C (30 min hold). The mass spectromeas operated at an acquisition rate of 50 spectra/s, wi
on-source temperature of 220◦C and a transfer-line temerature of 250◦C. The pressure inside the flight tube wbout 10−7 Torr. The scanned mass range was from 300 u.
S. Zhu et al. / J. Chromatogr. A 1086 (2005) 107–114 109
Table 1GC× GC column sets
First column Second column
Set 1Length (m) 50 2.5Diameter (mm) 0.2 0.1Stationary phase DB-petro (100% dimethylpolysiloxane) DB-17ht (50% phenylmethylpolysiloxane)Film thickness (�m) 0.5 0.1Corporation J&W Scientific, Folsom, CA J&W Scientific, Folsom, CA
Set 2Length (m) 60 3.0Diameter (mm) 0.25 0.1Stationary phase DB-wax (polyethylene glycol) DB-1701 (14% cyanopropylphenylmethylpolysiloxane)Film thickness (�m) 0.25 0.4Corporation J&W Scientific, Folsom, CA J&W Scientific, Folsom, CA
In the analysis of GC/MS, a (50 m× 0.20 mm× 0.33�m)capillary column (HP-5MS, J&W Scientific, Folsom, CA,USA) was used. The column oven was programmed from40◦C (1 min hold) to 250◦C at 10◦C/min and the final tem-perature was held for 20 min. The carrier gas was helium witha flow rate of 0.8 ml/min. The split mode (1:30) was used.The injection volume of essential oil sample was 1.0�l. Themass spectrometer was operated in the electron impact mode(70 eV). The ion source temperature was held at 230◦C. Thetransfer-line was maintained at 280◦C. The scanned massrange was from 30 to 500 u.
2.3. Analytes and samples
Six calibration solutions containing ethyl acetate, 3-(1-methyl-2-pyrrolidinyl)-pyridine, 1-propanol and 2-ethyl-3-hydroxy-4H-pyran-4-one were prepared in ethanol at aconcentration (w/w%) of 0.0005, 0.001, 0.01, 0.1, 1.0and 2.0%. These calibration compounds were selected be-cause they were present in the essential oil sample andresolved from other components in the GC× GC two-dimensional retention time plane. Four internal standards,acetic acid pentyl ester, 5-ethyl-2-methyl-pyridine, 1-octanoland acetophenone were added in the calibration solutionsat a concentration of 0.05% each. These internal stan-dards were selected because they were not present in es-
nts.pre-%):noneanol,6-ate
wereundsidedby di-ns
3. Result and discussion
3.1. Selection of GC×GC-TOF/MS column system
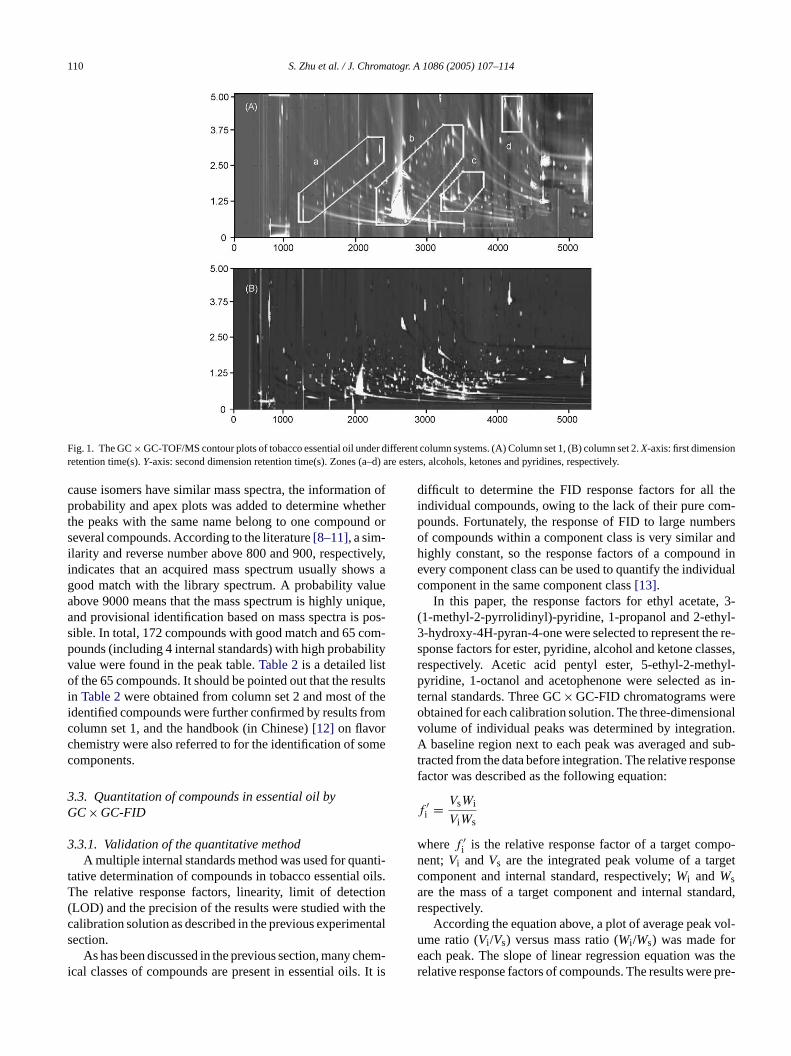
Usually, the first column is non-polar, and the second ismedium-polar (such as column set 1 inTable 1). Consideringthat the majority of components in essential oils are polarcompounds, we also used a polar column as the first columnand a different polar column as second column (column set 2in Table 1) to improve the separation and symmetry of peakson the first dimension. The GC× GC-TOF/MS contour plotsof essential oil under different column systems are depictedin Fig. 1.
It can be seen fromFig. 1A that an apparent group-typeseparation of some major components in the sample wasobtained when using column set 1. The components iden-tified as esters were found in the region marked (a). Like-wise, some components identified as alcohols, ketones andpyridines were located in the region marked (b), (c) and (d),respectively. The group-type separation facilitated the iden-tification of unknown components. When using column set2, the group-type separation was unapparent. However, themajor components were found to spread throughout a widerregion of the 2D plane, and the peak shape was better andmore individual components were resolved. In this study, theindividual components are more interesting to us, so columns al oil.C o wea set 2d
3
thep chw ver-s table.T erse,a ateh . Be-
sential oil and resolved from all essential oil componeA standard solution containing 10 compounds waspared in ethanol at the following concentration (w/wacetic acid (0.218%); ethyl acetate (0.193%); 2-penta(0.168%); pentanoic acid, ethyl ester (0.228%); 1-hept(0.224%); �-lonone (0.232%); 1-decanol (0.227%); 2dimethyl pyridine (0.186%); vanillin (0.205%); decano(0.159%).
The acetic acid, ethyl acetate, 1-propanol and ethanolof analytical grade quality. The other standard compowere all in GC purities. Essential oil samples were provby Wuhan Tobacco Company. Samples were preparedluting 0.2500 g of essential oil in 1ml of ethanol. All solutiowere refrigerated at 4◦C during storage.
et 2 was selected to quantify the components in essentiertainly, the group-type separation was also useful, slso used column set 1 to support the results of columnuring the characterization of the essential oil.
.2. Identification of peaks by GC×GC-TOF/MS
The GC× GC-TOF/MS software was used to find alleaks in the raw GC× GC chromatogram. A library searas carried out for all the peaks using the NIST/EPA/NIHion 2.0, and the results were combined in a single peakhe mass spectral match factors include similarity, revnd probability. The similarity and reverse factors indicow well a mass spectrum matches the library spectrum
110 S. Zhu et al. / J. Chromatogr. A 1086 (2005) 107–114
Fig. 1. The GC× GC-TOF/MS contour plots of tobacco essential oil under different column systems. (A) Column set 1, (B) column set 2.X-axis: first dimensionretention time(s).Y-axis: second dimension retention time(s). Zones (a–d) are esters, alcohols, ketones and pyridines, respectively.
cause isomers have similar mass spectra, the information ofprobability and apex plots was added to determine whetherthe peaks with the same name belong to one compound orseveral compounds. According to the literature[8–11], a sim-ilarity and reverse number above 800 and 900, respectively,indicates that an acquired mass spectrum usually shows agood match with the library spectrum. A probability valueabove 9000 means that the mass spectrum is highly unique,and provisional identification based on mass spectra is pos-sible. In total, 172 compounds with good match and 65 com-pounds (including 4 internal standards) with high probabilityvalue were found in the peak table.Table 2is a detailed listof the 65 compounds. It should be pointed out that the resultsin Table 2were obtained from column set 2 and most of theidentified compounds were further confirmed by results fromcolumn set 1, and the handbook (in Chinese)[12] on flavorchemistry were also referred to for the identification of somecomponents.
3.3. Quantitation of compounds in essential oil byGC×GC-FID
3.3.1. Validation of the quantitative methodA multiple internal standards method was used for quanti-
tative determination of compounds in tobacco essential oils.T tion( thec entals
hem-i . It is
difficult to determine the FID response factors for all theindividual compounds, owing to the lack of their pure com-pounds. Fortunately, the response of FID to large numbersof compounds within a component class is very similar andhighly constant, so the response factors of a compound inevery component class can be used to quantify the individualcomponent in the same component class[13].
In this paper, the response factors for ethyl acetate, 3-(1-methyl-2-pyrrolidinyl)-pyridine, 1-propanol and 2-ethyl-3-hydroxy-4H-pyran-4-one were selected to represent the re-sponse factors for ester, pyridine, alcohol and ketone classes,respectively. Acetic acid pentyl ester, 5-ethyl-2-methyl-pyridine, 1-octanol and acetophenone were selected as in-ternal standards. Three GC× GC-FID chromatograms wereobtained for each calibration solution. The three-dimensionalvolume of individual peaks was determined by integration.A baseline region next to each peak was averaged and sub-tracted from the data before integration. The relative responsefactor was described as the following equation:
f ′i = VsWi
ViWs
wheref ′i is the relative response factor of a target compo-
nent;Vi andVs are the integrated peak volume of a targetcomponent and internal standard, respectively;Wi andWsa dard,r
vol-u re s ther e pre-
he relative response factors, linearity, limit of detecLOD) and the precision of the results were studied withalibration solution as described in the previous experimection.
As has been discussed in the previous section, many ccal classes of compounds are present in essential oils
re the mass of a target component and internal stanespectively.
According the equation above, a plot of average peakme ratio (Vi /Vs) versus mass ratio (Wi /Ws) was made foach peak. The slope of linear regression equation waelative response factors of compounds. The results wer
S. Zhu et al. / J. Chromatogr. A 1086 (2005) 107–114 111
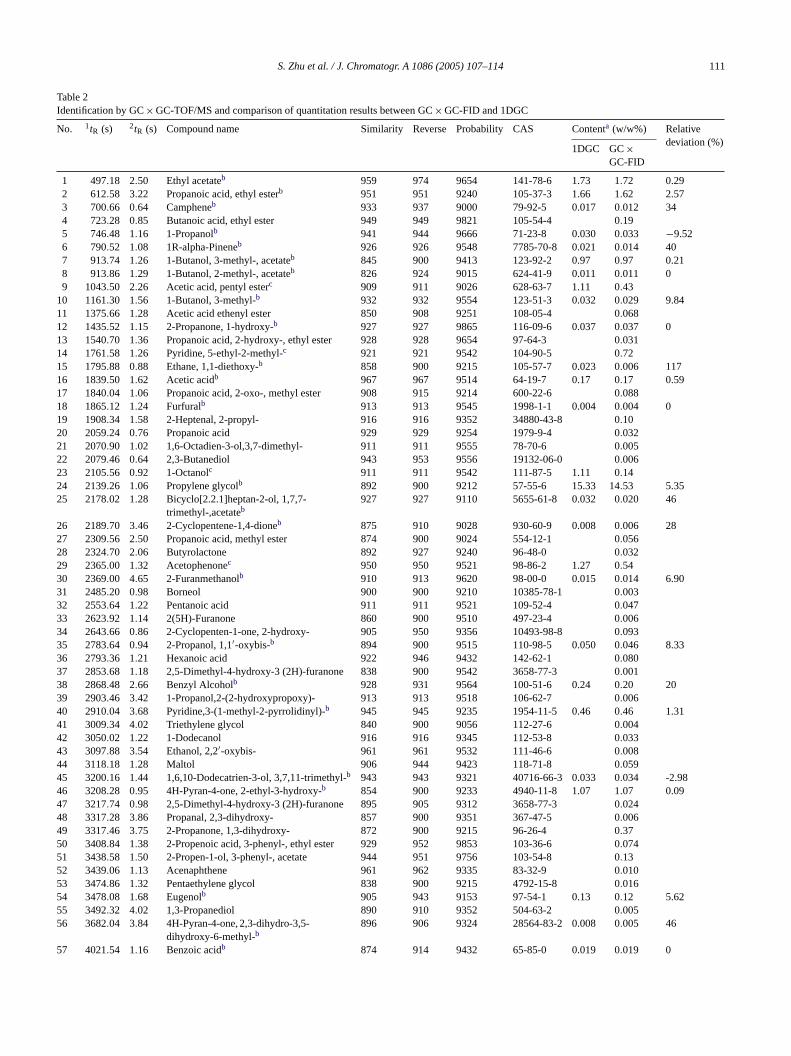
Table 2Identification by GC× GC-TOF/MS and comparison of quantitation results between GC× GC-FID and 1DGC
No. 1tR (s) 2tR (s) Compound name Similarity Reverse Probability CAS Contenta (w/w%) Relativedeviation (%)
1DGC GC×GC-FID
1 497.18 2.50 Ethyl acetateb 959 974 9654 141-78-6 1.73 1.72 0.292 612.58 3.22 Propanoic acid, ethyl esterb 951 951 9240 105-37-3 1.66 1.62 2.573 700.66 0.64 Campheneb 933 937 9000 79-92-5 0.017 0.012 344 723.28 0.85 Butanoic acid, ethyl ester 949 949 9821 105-54-4 0.195 746.48 1.16 1-Propanolb 941 944 9666 71-23-8 0.030 0.033 −9.526 790.52 1.08 1R-alpha-Pineneb 926 926 9548 7785-70-8 0.021 0.014 407 913.74 1.26 1-Butanol, 3-methyl-, acetateb 845 900 9413 123-92-2 0.97 0.97 0.218 913.86 1.29 1-Butanol, 2-methyl-, acetateb 826 924 9015 624-41-9 0.011 0.011 09 1043.50 2.26 Acetic acid, pentyl esterc 909 911 9026 628-63-7 1.11 0.43
10 1161.30 1.56 1-Butanol, 3-methyl-b 932 932 9554 123-51-3 0.032 0.029 9.8411 1375.66 1.28 Acetic acid ethenyl ester 850 908 9251 108-05-4 0.06812 1435.52 1.15 2-Propanone, 1-hydroxy-b 927 927 9865 116-09-6 0.037 0.037 013 1540.70 1.36 Propanoic acid, 2-hydroxy-, ethyl ester 928 928 9654 97-64-3 0.03114 1761.58 1.26 Pyridine, 5-ethyl-2-methyl-c 921 921 9542 104-90-5 0.7215 1795.88 0.88 Ethane, 1,1-diethoxy-b 858 900 9215 105-57-7 0.023 0.006 11716 1839.50 1.62 Acetic acidb 967 967 9514 64-19-7 0.17 0.17 0.5917 1840.04 1.06 Propanoic acid, 2-oxo-, methyl ester 908 915 9214 600-22-6 0.08818 1865.12 1.24 Furfuralb 913 913 9545 1998-1-1 0.004 0.004 019 1908.34 1.58 2-Heptenal, 2-propyl- 916 916 9352 34880-43-8 0.1020 2059.24 0.76 Propanoic acid 929 929 9254 1979-9-4 0.03221 2070.90 1.02 1,6-Octadien-3-ol,3,7-dimethyl- 911 911 9555 78-70-6 0.00522 2079.46 0.64 2,3-Butanediol 943 953 9556 19132-06-0 0.00623 2105.56 0.92 1-Octanolc 911 911 9542 111-87-5 1.11 0.1424 2139.26 1.06 Propylene glycolb 892 900 9212 57-55-6 15.33 14.53 5.3525 2178.02 1.28 Bicyclo[2.2.1]heptan-2-ol, 1,7,7-
trimethyl-,acetateb927 927 9110 5655-61-8 0.032 0.020 46
26 2189.70 3.46 2-Cyclopentene-1,4-dioneb 875 910 9028 930-60-9 0.008 0.006 2827 2309.56 2.50 Propanoic acid, methyl ester 874 900 9024 554-12-1 0.05628 2324.70 2.06 Butyrolactone 892 927 9240 96-48-0 0.03229 2365.00 1.32 Acetophenonec 950 950 9521 98-86-2 1.27 0.5430 2369.00 4.65 2-Furanmethanolb 910 913 9620 98-00-0 0.015 0.014 6.9031 2485.20 0.98 Borneol 900 900 9210 10385-78-1 0.00332 2553.64 1.22 Pentanoic acid 911 911 9521 109-52-4 0.04733 2623.92 1.14 2(5H)-Furanone 860 900 9510 497-23-4 0.00634 2643.66 0.86 2-Cyclopenten-1-one, 2-hydroxy- 905 950 9356 10493-98-8 0.09335 2783.64 0.94 2-Propanol, 1,1′-oxybis-b 894 900 9515 110-98-5 0.050 0.046 8.3336 2793.36 1.21 Hexanoic acid 922 946 9432 142-62-1 0.08037 2853.68 1.18 2,5-Dimethyl-4-hydroxy-3 (2H)-furanone 838 900 9542 3658-77-3 0.00138 2868.48 2.66 Benzyl Alcoholb 928 931 9564 100-51-6 0.24 0.20 2039 2903.46 3.42 1-Propanol,2-(2-hydroxypropoxy)- 913 913 9518 106-62-7 0.00640 2910.04 3.68 Pyridine,3-(1-methyl-2-pyrrolidinyl)-b 945 945 9235 1954-11-5 0.46 0.46 1.3141 3009.34 4.02 Triethylene glycol 840 900 9056 112-27-6 0.00442 3050.02 1.22 1-Dodecanol 916 916 9345 112-53-8 0.03343 3097.88 3.54 Ethanol, 2,2′-oxybis- 961 961 9532 111-46-6 0.00844 3118.18 1.28 Maltol 906 944 9423 118-71-8 0.05945 3200.16 1.44 1,6,10-Dodecatrien-3-ol, 3,7,11-trimethyl-b 943 943 9321 40716-66-3 0.033 0.034 -2.9846 3208.28 0.95 4H-Pyran-4-one, 2-ethyl-3-hydroxy-b 854 900 9233 4940-11-8 1.07 1.07 0.0947 3217.74 0.98 2,5-Dimethyl-4-hydroxy-3 (2H)-furanone 895 905 9312 3658-77-3 0.02448 3317.28 3.86 Propanal, 2,3-dihydroxy- 857 900 9351 367-47-5 0.00649 3317.46 3.75 2-Propanone, 1,3-dihydroxy- 872 900 9215 96-26-4 0.3750 3408.84 1.38 2-Propenoic acid, 3-phenyl-, ethyl ester 929 952 9853 103-36-6 0.07451 3438.58 1.50 2-Propen-1-ol, 3-phenyl-, acetate 944 951 9756 103-54-8 0.1352 3439.06 1.13 Acenaphthene 961 962 9335 83-32-9 0.01053 3474.86 1.32 Pentaethylene glycol 838 900 9215 4792-15-8 0.01654 3478.08 1.68 Eugenolb 905 943 9153 97-54-1 0.13 0.12 5.6255 3492.32 4.02 1,3-Propanediol 890 910 9352 504-63-2 0.00556 3682.04 3.84 4H-Pyran-4-one, 2,3-dihydro-3,5-
dihydroxy-6-methyl-b896 906 9324 28564-83-2 0.008 0.005 46
57 4021.54 1.16 Benzoic acidb 874 914 9432 65-85-0 0.019 0.019 0
112 S. Zhu et al. / J. Chromatogr. A 1086 (2005) 107–114
Table 2 (Continued)
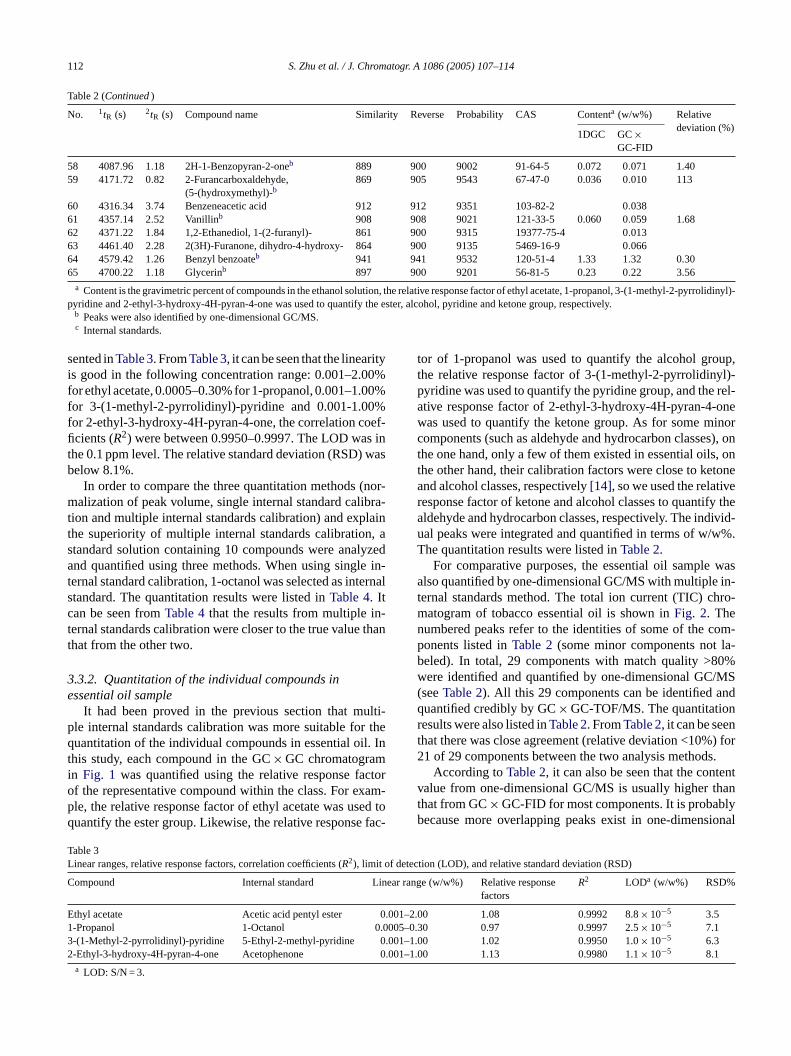
No. 1tR (s) 2tR (s) Compound name Similarity Reverse Probability CAS Contenta (w/w%) Relativedeviation (%)
1DGC GC×GC-FID
58 4087.96 1.18 2H-1-Benzopyran-2-oneb 889 900 9002 91-64-5 0.072 0.071 1.4059 4171.72 0.82 2-Furancarboxaldehyde,
(5-(hydroxymethyl)-b869 905 9543 67-47-0 0.036 0.010 113
60 4316.34 3.74 Benzeneacetic acid 912 912 9351 103-82-2 0.03861 4357.14 2.52 Vanillinb 908 908 9021 121-33-5 0.060 0.059 1.6862 4371.22 1.84 1,2-Ethanediol, 1-(2-furanyl)- 861 900 9315 19377-75-4 0.01363 4461.40 2.28 2(3H)-Furanone, dihydro-4-hydroxy- 864 900 9135 5469-16-9 0.06664 4579.42 1.26 Benzyl benzoateb 941 941 9532 120-51-4 1.33 1.32 0.3065 4700.22 1.18 Glycerinb 897 900 9201 56-81-5 0.23 0.22 3.56
a Content is the gravimetric percent of compounds in the ethanol solution, the relative response factor of ethyl acetate, 1-propanol, 3-(1-methyl-2-pyrrolidinyl)-pyridine and 2-ethyl-3-hydroxy-4H-pyran-4-one was used to quantify the ester, alcohol, pyridine and ketone group, respectively.
b Peaks were also identified by one-dimensional GC/MS.c Internal standards.
sented inTable 3. FromTable 3, it can be seen that the linearityis good in the following concentration range: 0.001–2.00%for ethyl acetate, 0.0005–0.30% for 1-propanol, 0.001–1.00%for 3-(1-methyl-2-pyrrolidinyl)-pyridine and 0.001-1.00%for 2-ethyl-3-hydroxy-4H-pyran-4-one, the correlation coef-ficients (R2) were between 0.9950–0.9997. The LOD was inthe 0.1 ppm level. The relative standard deviation (RSD) wasbelow 8.1%.
In order to compare the three quantitation methods (nor-malization of peak volume, single internal standard calibra-tion and multiple internal standards calibration) and explainthe superiority of multiple internal standards calibration, astandard solution containing 10 compounds were analyzedand quantified using three methods. When using single in-ternal standard calibration, 1-octanol was selected as internalstandard. The quantitation results were listed inTable 4. Itcan be seen fromTable 4that the results from multiple in-ternal standards calibration were closer to the true value thanthat from the other two.
3.3.2. Quantitation of the individual compounds inessential oil sample
It had been proved in the previous section that multi-ple internal standards calibration was more suitable for thequantitation of the individual compounds in essential oil. Inti ctoro xam-p ed toq fac-
tor of 1-propanol was used to quantify the alcohol group,the relative response factor of 3-(1-methyl-2-pyrrolidinyl)-pyridine was used to quantify the pyridine group, and the rel-ative response factor of 2-ethyl-3-hydroxy-4H-pyran-4-onewas used to quantify the ketone group. As for some minorcomponents (such as aldehyde and hydrocarbon classes), onthe one hand, only a few of them existed in essential oils, onthe other hand, their calibration factors were close to ketoneand alcohol classes, respectively[14], so we used the relativeresponse factor of ketone and alcohol classes to quantify thealdehyde and hydrocarbon classes, respectively. The individ-ual peaks were integrated and quantified in terms of w/w%.The quantitation results were listed inTable 2.
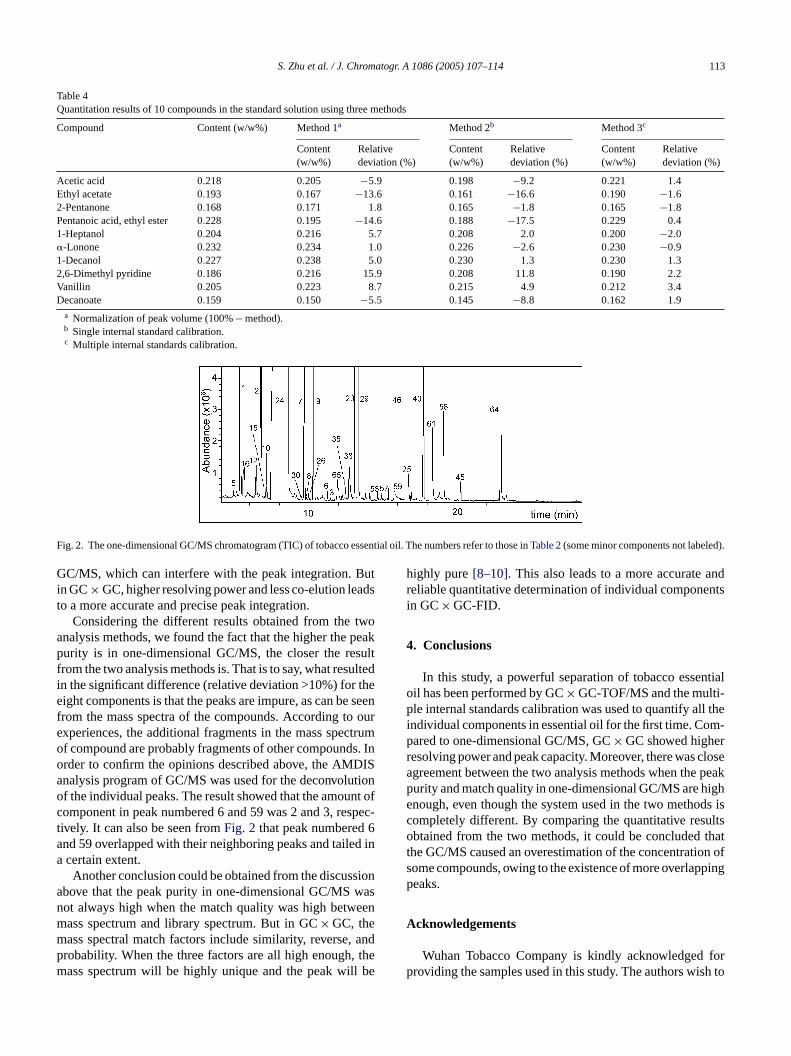
For comparative purposes, the essential oil sample wasalso quantified by one-dimensional GC/MS with multiple in-ternal standards method. The total ion current (TIC) chro-matogram of tobacco essential oil is shown inFig. 2. Thenumbered peaks refer to the identities of some of the com-ponents listed inTable 2(some minor components not la-beled). In total, 29 components with match quality >80%were identified and quantified by one-dimensional GC/MS(seeTable 2). All this 29 components can be identified andquantified credibly by GC× GC-TOF/MS. The quantitationresults were also listed inTable 2. FromTable 2, it can be seenthat there was close agreement (relative deviation <10%) for21 of 29 components between the two analysis methods.
entv hant lyb ional
TL f detec
C inear r
E 0.0011 .0005–3 0.001–2 0.001
his study, each compound in the GC× GC chromatogramn Fig. 1 was quantified using the relative response faf the representative compound within the class. For ele, the relative response factor of ethyl acetate was usuantify the ester group. Likewise, the relative response
able 3inear ranges, relative response factors, correlation coefficients (R2), limit o
ompound Internal standard L
thyl acetate Acetic acid pentyl ester-Propanol 1-Octanol 0-(1-Methyl-2-pyrrolidinyl)-pyridine 5-Ethyl-2-methyl-pyridine-Ethyl-3-hydroxy-4H-pyran-4-one Acetophenonea LOD: S/N = 3.
According toTable 2, it can also be seen that the contalue from one-dimensional GC/MS is usually higher that from GC× GC-FID for most components. It is probabecause more overlapping peaks exist in one-dimens
tion (LOD), and relative standard deviation (RSD)
ange (w/w%) Relative responsefactors
R2 LODa (w/w%) RSD%
–2.00 1.08 0.9992 8.8× 10⁻⁵ 3.50.30 0.97 0.9997 2.5× 10⁻⁵ 7.11.00 1.02 0.9950 1.0× 10⁻⁵ 6.3–1.00 1.13 0.9980 1.1× 10⁻⁵ 8.1
S. Zhu et al. / J. Chromatogr. A 1086 (2005) 107–114 113
Table 4Quantitation results of 10 compounds in the standard solution using three methods
Compound Content (w/w%) Method 1a Method 2b Method 3c
Content(w/w%)
Relativedeviation (%)
Content(w/w%)
Relativedeviation (%)
Content(w/w%)
Relativedeviation (%)
Acetic acid 0.218 0.205 −5.9 0.198 −9.2 0.221 1.4Ethyl acetate 0.193 0.167 −13.6 0.161 −16.6 0.190 −1.62-Pentanone 0.168 0.171 1.8 0.165 −1.8 0.165 −1.8Pentanoic acid, ethyl ester 0.228 0.195 −14.6 0.188 −17.5 0.229 0.41-Heptanol 0.204 0.216 5.7 0.208 2.0 0.200 −2.0�-Lonone 0.232 0.234 1.0 0.226 −2.6 0.230 −0.91-Decanol 0.227 0.238 5.0 0.230 1.3 0.230 1.32,6-Dimethyl pyridine 0.186 0.216 15.9 0.208 11.8 0.190 2.2Vanillin 0.205 0.223 8.7 0.215 4.9 0.212 3.4Decanoate 0.159 0.150 −5.5 0.145 −8.8 0.162 1.9
a Normalization of peak volume (100%− method).b Single internal standard calibration.c Multiple internal standards calibration.
Fig. 2. The one-dimensional GC/MS chromatogram (TIC) of tobacco essential oil. The numbers refer to those inTable 2(some minor components not labeled).
GC/MS, which can interfere with the peak integration. Butin GC× GC, higher resolving power and less co-elution leadsto a more accurate and precise peak integration.
Considering the different results obtained from the twoanalysis methods, we found the fact that the higher the peakpurity is in one-dimensional GC/MS, the closer the resultfrom the two analysis methods is. That is to say, what resultedin the significant difference (relative deviation >10%) for theeight components is that the peaks are impure, as can be seenfrom the mass spectra of the compounds. According to ourexperiences, the additional fragments in the mass spectrumof compound are probably fragments of other compounds. Inorder to confirm the opinions described above, the AMDISanalysis program of GC/MS was used for the deconvolutionof the individual peaks. The result showed that the amount ofcomponent in peak numbered 6 and 59 was 2 and 3, respec-tively. It can also be seen fromFig. 2 that peak numbered 6and 59 overlapped with their neighboring peaks and tailed ina certain extent.
Another conclusion could be obtained from the discussionabove that the peak purity in one-dimensional GC/MS wasnot always high when the match quality was high betweenmass spectrum and library spectrum. But in GC× GC, themass spectral match factors include similarity, reverse, andprobability. When the three factors are all high enough, themass spectrum will be highly unique and the peak will be
highly pure[8–10]. This also leads to a more accurate andreliable quantitative determination of individual componentsin GC× GC-FID.
4. Conclusions
In this study, a powerful separation of tobacco essentialoil has been performed by GC× GC-TOF/MS and the multi-ple internal standards calibration was used to quantify all theindividual components in essential oil for the first time. Com-pared to one-dimensional GC/MS, GC× GC showed higherresolving power and peak capacity. Moreover, there was closeagreement between the two analysis methods when the peakpurity and match quality in one-dimensional GC/MS are highenough, even though the system used in the two methods iscompletely different. By comparing the quantitative resultsobtained from the two methods, it could be concluded thatthe GC/MS caused an overestimation of the concentration ofsome compounds, owing to the existence of more overlappingpeaks.
Acknowledgements
Wuhan Tobacco Company is kindly acknowledged forproviding the samples used in this study. The authors wish to
114 S. Zhu et al. / J. Chromatogr. A 1086 (2005) 107–114
thank Dalian Institute of Chemical Physics for the technicalsupport and advice.
References
[1] R.P. Adams, Identification of Essential Oil Components by GasChromatography/Mass Spectroscopy, Allured Publ., Carol Stream,IL, 1995.
[2] P. Marriott, R. Shellie, Trend Anal. Chem. 21 (2002) 573.[3] J.B. Phillips, J. Beens, J. Chromatogr. A 856 (1999) 331.[4] R. Shellie, L. Mondello, P. Marriott, G. Dugo, J. Chromatogr. A 970
(2002) 225.[5] J. Rohloff, J. Agric. Food Chem. 50 (2002) 1543.[6] A.R. Bilia, G. Flamini, V. Taglioli, I. Morelli, F.F. Vincieri, Food
Chem. 76 (2002) 307.
[7] J. Cai, B. Liu, P. Ling, Q. Su, J. Chromatogr. A 947 (2002)267.
[8] X. Lu, J. Cai, H. Kong, M. Wu, R. Hua, M. Zhao, J. Liu, G. Xu,Anal. Chem. 75 (2003) 4441.
[9] M. van Deursen, J. Beens, J. Reijenga, P. Lipman, C. Cramers, J.High Resol. Chromatogr. 23 (2000) 253.
[10] J. Dalluge, L.L.P. van Stee, X. Xu, J. Williams, J. Beens,R.J.J. Vreuls, U.A.Th. Brinkman, J. Chromatogr. A 974 (2002)169.
[11] J. Wu, X. Lu, W. Tang, H. Kong, S. Zhou, G. Xu, J. Chromatogr.A 1034 (2004) 199.
[12] Handbook of Tobacco Industry, Chinese Light Industry Press, Bei-jing, 1999, p. 351.
[13] P.J. Schoenmakers, J.L.M.M. Oomen, J. Blomberg, W. Genuit, G.van Velzen, J. Chromatogr. A 892 (2000) 29.
[14] Handbook of Analytical Chemistry, vol. 5, Chemical Industry Press,Beijing, 1999, p. 698.