Microsatellite standardization and evaluation of genotyping error in a large multi-partner research...
15
Microsatellite standardization and evaluation of genotyping error in a large multi-partner research programme for conservation of Atlantic salmon (Salmo salar L.) J. S. Ellis • J. Gilbey • A. Armstrong • T. Balstad • E. Cauwelier • C. Cherbonnel • S. Consuegra • J. Coughlan • T. F. Cross • W. Crozier • E. Dillane • D. Ensing • C. Garcı ´a de Lea ´niz • E. Garcı ´a-Va ´zquez • A. M. Griffiths • K. Hindar • S. Hjorleifsdottir • D. Knox • G. Machado-Schiaffino • P. McGinnity • D. Meldrup • E. E. Nielsen • K. Olafsson • C. R. Primmer • P. Prodohl • L. Stradmeyer • J.-P. Va ¨ha ¨ • E. Verspoor • V. Wennevik • J. R. Stevens Received: 8 September 2010 / Accepted: 19 January 2011 / Published online: 1 February 2011 Ó The Author(s) 2011. This article is published with open access at Springerlink.com Abstract Microsatellite genotyping is a common DNA characterization technique in population, ecological and evolutionary genetics research. Since different alleles are sized relative to internal size-standards, different labora- tories must calibrate and standardize allelic designations when exchanging data. This interchange of microsatellite data can often prove problematic. Here, 16 microsatellite loci were calibrated and standardized for the Atlantic sal- mon, Salmo salar, across 12 laboratories. Although inconsistencies were observed, particularly due to differ- ences between migration of DNA fragments and actual allelic size (‘size shifts’), inter-laboratory calibration was successful. Standardization also allowed an assessment of the degree and partitioning of genotyping error. Notably, the global allelic error rate was reduced from 0.05 ± 0.01 prior to calibration to 0.01 ± 0.002 post-calibration. Most errors were found to occur during analysis (i.e. when size- calling alleles; the mean proportion of all errors that were analytical errors across loci was 0.58 after calibration). No evidence was found of an association between the degree of error and allelic size range of a locus, number of alleles, nor repeat type, nor was there evidence that genotyping errors were more prevalent when a laboratory analyzed samples outside of the usual geographic area they encounter. The microsatellite calibration between labora- tories presented here will be especially important for genetic assignment of marine-caught Atlantic salmon, Electronic supplementary material The online version of this article (doi:10.1007/s10709-011-9554-4) contains supplementary material, which is available to authorized users. J. S. Ellis A. M. Griffiths J. R. Stevens (&) School of Biosciences, Hatherly Laboratories, University of Exeter, Prince of Wales Rd, Exeter EX4 4PS, UK e-mail: [email protected] J. Gilbey A. Armstrong E. Cauwelier D. Knox L. Stradmeyer E. Verspoor Marine Scotland, Freshwater Laboratory, Faskally, Pitlochry PH16 4LB, UK C. Cherbonnel GENINDEXE, 6 rue des Sports, 17000 La Rochelle, France S. Consuegra Institute of Biological, Environmental & Rural Sciences, Aberystwyth University, Aberystwyth SY23 3DA, UK J. Coughlan T. F. Cross E. Dillane P. McGinnity Department of Zoology, Ecology & Plant Science/Aquaculture & Fisheries Development Centre, University College, Cork, Ireland W. Crozier D. Ensing Agri-Food and Biosciences Institute Northern Ireland, Fisheries and Aquatic Ecosystems Branch, Newforge Lane, Belfast BT9 5PX, UK C. Garcı ´a de Lea ´niz School of the Environment and Society, Swansea University, Swansea SA2 8PP, UK E. Garcı ´a-Va ´zquez G. Machado-Schiaffino Departament of Functional Biology, Genetics, Universidad de Oviedo, C/Julian Claveria s/n, 33006 Oviedo, Spain T. Balstad K. Hindar Norwegian Institute for Nature Research (NINA), 7485 Trondheim, Norway S. Hjorleifsdottir K. Olafsson Matis ohf., Vinlandsleid 12, 113 Reykjavik, Iceland 123 Genetica (2011) 139:353–367 DOI 10.1007/s10709-011-9554-4 Author's personal copy
-
Upload
independent -
Category
Documents
-
view
4 -
download
0
Transcript of Microsatellite standardization and evaluation of genotyping error in a large multi-partner research...

Microsatellite standardization and evaluation of genotyping errorin a large multi-partner research programme for conservationof Atlantic salmon (Salmo salar L.)
J. S. Ellis • J. Gilbey • A. Armstrong • T. Balstad • E. Cauwelier • C. Cherbonnel • S. Consuegra •
J. Coughlan • T. F. Cross • W. Crozier • E. Dillane • D. Ensing • C. Garcıa de Leaniz • E. Garcıa-Vazquez •
A. M. Griffiths • K. Hindar • S. Hjorleifsdottir • D. Knox • G. Machado-Schiaffino • P. McGinnity •
D. Meldrup • E. E. Nielsen • K. Olafsson • C. R. Primmer • P. Prodohl • L. Stradmeyer • J.-P. Vaha •
E. Verspoor • V. Wennevik • J. R. Stevens
Received: 8 September 2010 / Accepted: 19 January 2011 / Published online: 1 February 2011
� The Author(s) 2011. This article is published with open access at Springerlink.com
Abstract Microsatellite genotyping is a common DNA
characterization technique in population, ecological and
evolutionary genetics research. Since different alleles are
sized relative to internal size-standards, different labora-
tories must calibrate and standardize allelic designations
when exchanging data. This interchange of microsatellite
data can often prove problematic. Here, 16 microsatellite
loci were calibrated and standardized for the Atlantic sal-
mon, Salmo salar, across 12 laboratories. Although
inconsistencies were observed, particularly due to differ-
ences between migration of DNA fragments and actual
allelic size (‘size shifts’), inter-laboratory calibration was
successful. Standardization also allowed an assessment of
the degree and partitioning of genotyping error. Notably,
the global allelic error rate was reduced from 0.05 ± 0.01
prior to calibration to 0.01 ± 0.002 post-calibration. Most
errors were found to occur during analysis (i.e. when size-
calling alleles; the mean proportion of all errors that were
analytical errors across loci was 0.58 after calibration). No
evidence was found of an association between the degree
of error and allelic size range of a locus, number of alleles,
nor repeat type, nor was there evidence that genotyping
errors were more prevalent when a laboratory analyzed
samples outside of the usual geographic area they
encounter. The microsatellite calibration between labora-
tories presented here will be especially important for
genetic assignment of marine-caught Atlantic salmon,Electronic supplementary material The online version of thisarticle (doi:10.1007/s10709-011-9554-4) contains supplementarymaterial, which is available to authorized users.
J. S. Ellis � A. M. Griffiths � J. R. Stevens (&)
School of Biosciences, Hatherly Laboratories,
University of Exeter, Prince of Wales Rd,
Exeter EX4 4PS, UK
e-mail: [email protected]
J. Gilbey � A. Armstrong � E. Cauwelier � D. Knox �L. Stradmeyer � E. Verspoor
Marine Scotland, Freshwater Laboratory,
Faskally, Pitlochry PH16 4LB, UK
C. Cherbonnel
GENINDEXE, 6 rue des Sports, 17000 La Rochelle, France
S. Consuegra
Institute of Biological, Environmental & Rural Sciences,
Aberystwyth University, Aberystwyth SY23 3DA, UK
J. Coughlan � T. F. Cross � E. Dillane � P. McGinnity
Department of Zoology, Ecology & Plant Science/Aquaculture
& Fisheries Development Centre, University College,
Cork, Ireland
W. Crozier � D. Ensing
Agri-Food and Biosciences Institute Northern Ireland,
Fisheries and Aquatic Ecosystems Branch, Newforge Lane,
Belfast BT9 5PX, UK
C. Garcıa de Leaniz
School of the Environment and Society, Swansea University,
Swansea SA2 8PP, UK
E. Garcıa-Vazquez � G. Machado-Schiaffino
Departament of Functional Biology, Genetics, Universidad
de Oviedo, C/Julian Claveria s/n, 33006 Oviedo, Spain
T. Balstad � K. Hindar
Norwegian Institute for Nature Research (NINA),
7485 Trondheim, Norway
S. Hjorleifsdottir � K. Olafsson
Matis ohf., Vinlandsleid 12, 113 Reykjavik, Iceland
123
Genetica (2011) 139:353–367
DOI 10.1007/s10709-011-9554-4
Author's personal copy

enabling analysis of marine mortality, a major factor in the
observed declines of this highly valued species.
Keywords Atlantic salmon �Microsatellite � Calibration �Standardization � Genotyping error � Conservation
Introduction
Over the past three to four decades the application of
genetic techniques has revolutionized research in the fields
of ecology, evolution, conservation and wildlife manage-
ment, and the advent of ‘next-generation’ biotechnologies
continues to do so (Hudson 2008). Currently, microsatel-
lites are amongst the most popular markers in molecular
ecology and may remain so for the next 5–10 years (Moran
et al. 2006): they are easily amplified by PCR, highly
polymorphic, follow a simple mode of Mendelian inheri-
tance and many sophisticated computer programs exist,
allowing thorough analysis of large datasets (Excoffier and
Heckel 2006). Expertise in their use is widespread and they
are likely to find continued use in paternity analysis (e.g.
Glaubitz et al. 2003), genetic stock identification and
assignment testing (Narum et al. 2008), as well as in
conservation and population genetics, assessment of dis-
persal and invasive species biology.
One advantage of microsatellites for the present is the
existence of large historical datasets. This is especially
relevant for modern conservation applications which often
require a broad geographic scope varying from studies on a
local scale involving one or a few research groups, to
projects aimed at conserving a species across its entire
range, which are frequently collaborative in nature (e.g.
Moran et al. 2006). Such collaborative research pro-
grammes are likely to continue to make use of microsat-
ellite based approaches due to the possibility of combining
pre-existing datasets across different research groups, as
well as expanding them with the latest technological and
methodological advances (e.g. large-scale single nucleotide
polymorphism discovery and genotyping) to address sig-
nificant research challenges in a practical context.
A consequence of collaboration is the necessary inter-
change of genetic data between laboratories. However, the
exchange of microsatellite data is often regarded as prob-
lematic as it poses several challenges (reviewed in Moran
et al. 2006), including the fact that, due to historical
influences/factors, different laboratories frequently use
different sets of microsatellite markers and that allelic
designations are not consistent between laboratories.
Standardization of allelic designations can be particularly
problematic since the size of a fragment determined by
electrophoresis does not necessarily correspond to its
actual length determined by direct sequencing (Haberl and
Tautz 1999; Pasqualotto et al. 2007). The use of different
sequencing machines with associated differences in
chemistry can also result in differing allelic designations
for the same allele between laboratories (e.g. Delmotte
et al. 2001; Moran et al. 2006), as can differences in the
fluorophore used to label a particular primer, whether the
forward or reverse primer is labelled, etc.
Standardization and calibration are of much value,
however, and recent examples include projects to facilitate
exchange of genetic information in a horticultural context
(identification of grapevine cultivars (This et al. 2004),
olives (Doveri et al. 2008) and apple cultivars (Baric et al.
2008)) and validation of microsatellite scores between
laboratories working on the fungal pathogen Aspergillus
fumigatus (Pasqualotto et al. 2007). In a fisheries context,
projects include the coast-wide management of Pacific
salmon species such as Oncorhynchus mykiss (Stephenson
et al. 2009) and Oncorhynchus tshawytscha (Seeb et al.
2007).
One aspect of inter-laboratory comparisons sometimes
ignored is the possibility to assess the extent and parti-
tioning of genotyping error based on consensus genotypes
identified across laboratories. Assessment of genotyping
error is important in population genetics, but historically it
has been largely ignored outside of forensic studies (Bonin
et al. 2004; Pompanon et al. 2005). Errors can arise during
PCR and electrophoresis, or during analysis and data
handling. ‘Null alleles’ occur when a mutation arises in the
flanking sequence where design characteristics of PCR
primers can lead to amplification failure of a particular
allele (Callen et al. 1993), although their occurrence is not
necessarily a problem for inter-laboratory comparisons
unless primers are redesigned by different laboratories.
‘Allelic dropout’ occurs due to random preferential
amplification of one allele during PCR, leading to the
misidentification of heterozygotes as homozygotes due to
reduced peak/band intensity of the poorly amplified allele
(Gagneux et al. 1997a), or it may also be caused by vari-
ation in the flanking region used by a PCR primer so that
D. Meldrup � E. E. Nielsen
DTU Aqua, National Institute of Aquatic Resources,
Technical University of Denmark, Vejlsøve 39,
8600 Silkeborg, Denmark
C. R. Primmer � J.-P. Vaha
Department of Biology, University of Turku,
20014 Turku, Finland
V. Wennevik
Institute of Marine Research, Nordnesgaten 50,
5005 Bergen, Norway
P. Prodohl
School of Biological Sciences,
Queens University, Belfast BT9 7BL, UK
354 Genetica (2011) 139:353–367
123
Author's personal copy

the primer does not bind properly as in the case of null
alleles. ‘False alleles’ (extra peaks arising due to non-
specific binding or contamination) and electrophoresis
artefacts can also confuse microsatellite scoring (Fernando
et al. 2001). Genotyping errors can significantly affect the
conclusions drawn from a particular study. The genetic
inference of furtive mating by female chimpanzees outside
their social groups is a much-cited example (conclusions
later found to be false due to allelic dropout, Gagneux et al.
1997b, 2001). Over recent years, attention to genotyping
error has gained more prominence in molecular ecology,
especially in cases where template DNA may be low in
quantity or quality, such as when non-invasive genotyping
techniques or historical samples are used (e.g. museum
specimens or fish scale archives [which can make a large
source for genetic information (Nielsen et al. 1997; Knox
et al. 2002; Finnegan and Stevens 2008)]). The importance
and consequences of error, and how errors should be
measured and reported, have been discussed, as have pro-
tocols for designing microsatellite studies to limit error
(Taberlet et al. 1996; Bonin et al. 2004; Broquet and Petit
2004; Hoffman and Amos 2005; Pompanon et al. 2005;
Johnson and Haydon 2007; Taubert and Bradley 2008;
Morin et al. 2009).
In recent decades the Atlantic salmon (Salmo salar L.)
has suffered declines in abundance across its entire range
due to a number of factors (see Canadian Journal of
Fisheries and Aquatic Sciences, supplement 1, 1998; WWF
2001). Increased marine mortality is considered an
important aspect of the observed decline (Jonsson and
Jonsson 2004; Potter et al. 2004; Friedland et al. 2009), yet
the ecology of anadromous S. salar during marine migra-
tion is poorly understood and remains a major challenge in
managing declines of this economically and culturally
important species. This and similar issues have recently led
to several projects using or aiming to use genetic stock
identification to assign marine caught fish to their rivers/
regions of origin (e.g. Gauthier-Ouellet et al. 2009;
Griffiths et al. 2010; also the ‘SALSEA-Merge’ project, of
which the present study is part (www.nasco.int/sas/
salseamerge.htm)). Key goals of such studies are to eluci-
date stock composition of intermingled stocks on common
migration routes or feeding grounds, and/or to reveal stock-
specific patterns of migration. In light of the species’
ability to migrate over distances of up to several thousand
kilometres, the need to generate genetic data for baseline
populations across the entire range, or as much of it as
possible, is crucial to ensure studies are as informative as
possible. Necessarily, multiple laboratories must collabo-
rate and calibrate genetic data so that a standardized
microsatellite database can be created. Despite the com-
mercial and cultural importance of Atlantic salmon, as well
as the existence of numerous studies and research groups
using microsatellite data, a large-scale multi-laboratory
microsatellite validation exercise has not previously been
undertaken for this species. Validation has also not been
previously undertaken for earlier datasets such as those for
allozymes, significantly limiting the synthesis value of
allozyme data from across the species’ range (Verspoor
et al. 2005).
Here we detail microsatellite standardization across 12
laboratories. This included a detailed analysis of the degree
of genotyping error, the partitioning of the causes of this
error and the distribution of this error across laboratories
using differing genotyping platforms and methods, and
across loci of different size ranges and repeat motifs. We
provide a retrospective discussion of the challenges faced
while integrating databases in this context, and provide
advice and recommendations for future collaborative
research projects.
Materials and methods
Standardization and validation of microsatellite data
Consortium members and selection of loci
Twelve institutions comprise the genetic consortium of the
SALSEA-Merge project. The consortium agreed the use
of a microsatellite panel of fifteen loci (Verspoor and
Hutchinson 2008; Olafsson et al. 2010) consisting of:
SsaF43 (Sanchez et al. 1996), Ssa14, Ssa289 (McConnell
et al. 1995), Ssa171, Ssa197, Ssa202 (O’Reilly et al. 1996)
SSsp1605, SSsp2201, SSsp2210, SSsp2216, SsspG7
(Paterson et al. 2004), SsaD144, SsaD486, SsaD157 (King
et al. 2005) and SSsp3016 (unpublished, GenBank number
AY37820). Additionally, a number of laboratories also
routinely genotype SsOSL85 (Slettan et al. 1995) and this
has also been included in the present study. Five of the
chosen loci possess dinucleotide repeat motifs, and 11
tetranucleotide repeats.
Genotyping of standard sample set
In order to standardize microsatellite scores between lab-
oratories, two 96-well plates were prepared containing
template DNA from samples representing the widest
coverage of the range of S. salar as was practicable (Matis-
Prokaria, Iceland, hereafter referred to as the ‘control
plates’; Table 1). PCR cycle conditions, thermocyclers
used and multiplexes varied across laboratories, as did
genotyping platform, size standard, etc., for capillary or
slab-gel electrophoresis. Similarly, different fragment
analysis software packages were used for sizing microsat-
ellite alleles, each associated with the particular genetic
Genetica (2011) 139:353–367 355
123
Author's personal copy

analyzer used for electrophoresis (Table 2). One laboratory
(Laboratory D) used different PCR primers to the other
laboratories for loci SSsp1605 and SSsp2216 (primers
were redesigned to prevent allele overlap in multiplex
reactions).
Some institutions did not genotype all 16 loci, notably
Laboratories E and F had collaborated on a previous pro-
ject in which they utilised 11 of the 16 loci. Other labo-
ratories genotyped only those loci that they routinely
worked with (Table 3), with eight genotyping 15 of the 16
loci, one 12 loci and one all 16 loci; a number of labora-
tories did not genotype SsaD486 due to the marked lack of
genetic variation at this locus in Europe.
Generation of standard allele sizes
After genotyping control plate samples, genotypes were
submitted to Exeter University for generation of stan-
dardization rules. Standardization involved several steps.
First, spreadsheets for each locus were created containing
the control plate sample genotypes for all laboratories. A
list of all the alleles scored by each laboratory at each locus
was then generated using the allele count function in
Microsatellite Analyzer (MSA, Dieringer and Schlotterer
2002). For each locus, lists of allele counts for each labo-
ratory were aligned by cross-referencing with the sample
genotypes in the control plate genotype spreadsheets. Once
allele lists were aligned, standard allele scores were des-
ignated for each locus: if two or more labs scored the data
identically at a particular locus their alleles were desig-
nated as the ‘baseline alleles’ for standardization; if no two
laboratories scored the data in the same way, one labora-
tory was nominated as the baseline; if there were multiple
groups of laboratories that shared allelic scoring patterns
the one with the most members was designated as the
baseline. The size difference between the allele lists from
each laboratory and the baseline allele list were then cal-
culated. It was then possible to generate a database of
standard allele scores by adding to or subtracting from the
observed data the size difference between a laboratory’s
allele sizes and the nominated baseline size, as appropriate
for each locus in question (hereafter referred to as ‘stan-
dardization rules’).
Dealing with scoring inconsistencies
In some laboratories various scoring inconsistencies were
observed (alleles of unusual size or incorrect repeat type,
detailed in the ‘‘Results’’ section). Where these were par-
ticularly problematic, further correspondence, analyses of
microsatellite data and/or re-genotyping were necessary to
generate a consistent allele list. Standardization processes
were then repeated to generate new factors for standardi-
zation to the baseline allele sizes as necessary.
Some inconsistencies (unusual alleles appearing in the
data from some laboratories, but not others) were associ-
ated with particular individual samples in the control
plates. These were investigated as potential Atlantic sal-
mon/brown trout (Salmo trutta L.) hybrids (S. salar 9
S. trutta) by amplification of 5S rDNA and subsequent
agarose gel electrophoresis (Pendas et al. 1995).
Re-screening of samples
After the standardization rules had been generated (as
described above), the results were checked by re-screening
a selection of samples (120–216 samples, depending on the
locus) at a single laboratory. Each laboratory donated
samples that had been genotyped at all relevant loci (i.e.
loci they routinely genotype) and for which their genotypes
had already been converted to the standard allele sizes.
Genotypes for these samples were then generated in the
re-screening laboratory and scored double-blind. The
standardization rules pertaining to the re-screening labo-
ratory were then used to generate standard allele sizes. The
two sets of data (standardized allele sizes from the donating
laboratory and the re-screening laboratory) were examined
for any inconsistencies with the original standardization
rules generated above.
Table 1 River of origin of the samples used in the calibration
control plates, presented by country (numbers in parenthesis indicate
the number of samples per river)
Country River(s)
Canada Malbaie (5), Ste-Anne (5), Stewiacke (2),
St-Jean (5), Ste-Marguerite (5),
Tobique (2), Trinite (5)
USA Narraguagus (5), Penobscot (5)
Denmark Skjern (1)
England Dart (4)
Finland Simojoki (5), Tornionjoki (5)
France Allier (5), See (5)
Iceland Langa (5), Laxa I Adaldal (5), Nupsa (5)
Ireland Blackwater (5), Boyne (5), Drowes (5)
Norway Komagelva (4), Repparfjordelva (4),
Figgjo (4), Saltdalselva (5),
Vigda (5), Stordalselva (5)
Russia (Baltic Sea) Neva (5)
Russia (NW: Barents
and White Sea)
Ponoi (4), Pulonga (4), Varzuga (3),
Pechora (5)
Scotland Coulin (5), Don (5)
Spain Narcea (5), Sella (4)
Sweden Atran (5)
Wales Dee (5)
356 Genetica (2011) 139:353–367
123
Author's personal copy

Error estimation
Identifying consensus genotypes
After standardization rules had been established, all sample
genotypes for each laboratory were converted to the stan-
dard allele sizes. By examining the standardized genotypes
for each individual at a given locus across laboratories,
consensus genotypes were identified for each individual in
the control plates. Comparison of laboratory genotypes
with the consensus genotype allowed the identification of
genotyping errors. Errors were identified in the original
datasets that were submitted, and in datasets after the
standardization process was complete and correspondence
regarding sizing inconsistencies had taken place (Fig. 1).
Post-standardization datasets included corrected data from
Table 2 Methods used by each laboratory in the study
Lab Polymerase Thermocycler Platform Fragment labelling Size standard Fragment analysis
Lab A Promega Go-Taq Hybaid Licor 4300 IRD700/IRD800 Made in house By eye
Lab B Bioline Biotaq ThermoHybaid
MBS system
MegaBACE500 FAM, HEX NED GE Healthcare-
Et-ROX400 &
Et-ROX550
Fragment Profiler
Lab C Qiagen hotstart;
Thermostart
ABI9700, VWR
Quattro, MJ Research
ABI3130 FAM, HEX, NED,
VIC, TET
GS LIZ 500 Genemapper 3.7
Lab D QIAGEN multiplex
PCR kit
ABI 2730, Eppendorf,
PTC-100
ABI 3130xl FAM, PET, VIC, NED GS LIZ 600 Genemapper 3.7
Lab E GoTaq Promega; Flexi
DNA polymerase
ABI 2720 ABI 3130 FAM, PET, VIC, NED GS LIZ 500 Genemapper
Lab F Bioline BioTaq RED;
Sigma REDTaq
ThermoHybaid Beckman-
Coulter
CEQ8000
Sigma-Genosys WellRED GenomeLab
size-standard 400
CEQ 8000 Genetic
analysis system
Lab G TEG polymerase
(Prokaria manufactured)
MJ-research PTC-225 ABI-3730 FAM, PET, VIC, NED GS LIZ 500 Genemapper 4.0
Lab H Promega Go-Taq ABI9700 ABI-3730 FAM, PET, VIC, NED GS LIZ 500 Genemapper 4.0
Lab I Invitrogen Taq Hybaid PCR Express ABI 3130 FAM, PET, VIC, NED GS LIZ 500 Genescan 4.0
Lab J QIAGEN multiplex PCR kit AB 2720 ABI3130xl FAM, PET, VIC, NED GS LIZ 500 Genemaker
Lab K QIAGEN multiplex PCR kit ABI 2720 ABI 3130XL FAM, HEX, NED ROX 500 Genotyper 3.5
Lab L Qiagen hotstart mastermix kit MBS ThermoHybaid ABI 3130 FAM, PET, VIC, NED GS LIZ 500 Genescan 4.0
Table 3 Summary information
from the calibration exercise:
number of laboratories
genotyping each locus; the
number of laboratories sharing
identical bin sets (numbers
separated by commas indicate
different bin sets shared, e.g.
2,2 = bin set 1 shared by two
laboratories; bin set 2 shared by
two other laboratories);
maximum allelic size difference
between different bin sets;
presence/absence of a size-shift
a Alternative primer designs by
one laboratory, thus these values
do not represent ‘true’ allelic
size differences observed
between laboratories
Locus Number of
laboratories
Number with
identical
bin sets
Maximum allelic
size difference (bp)
Size-shift
Ssa14 9 4,3 9 No
Ssa171 11 3,2,2 7 Yes
Ssa197 11 4,4,2 11 No
Ssa202 11 3,3 9 No
Ssa289 10 3,2 11 No
SsaD144 10 3,2,2 10 Yes
SsaD157 11 2,2 12 No
SsaD486 7 4,2 7 No
SsaF43 9 3,3 8 Yes
SSsp1605 11 5,2 48a No
SSsp2201 11 4,4 8 No
SSsp2210 11 7,2 17 Yes
SSsp2216 10 5,2 72a Yes
SSsp3016 9 5,2 8 No
SSspG7 10 3,2 13 Yes
SsOSL85 8 4 5 Yes
Genetica (2011) 139:353–367 357
123
Author's personal copy

laboratories that had re-genotyped and re-analyzed data to
eliminate scoring inconsistencies, as well as corrected data
from the automatic removal of size-shift errors by the
standardization process (see below).
Estimation of error rates
Allelic error rates were calculated for each laboratory at
each locus following Pompanon et al. (2005). Using this
approach allelic error (ea) is defined as:
ea ¼ma
2nt
where ma is the number of allelic mismatches, and 2nt is
the number of replicated alleles. Here, as an individual
laboratory’s genotypes can be determined as correct or
incorrect by reference to the consensus genotype, for each
locus it is also possible to determine individual laboratory
error rates using the same formula, with 2nt as the total
number of alleles genotyped at a particular locus for that
laboratory.
Donation of samples
Matis-Prokaria create ‘control plates’
Multi-platfrommultilocusgenotyping across labs
Correspondence with labs. Inconsistent genotypes reviewed as appropriate
Standardization rules for each locus and lab generated.
Second error estimation
Multilocus genotypes sent to Exeter University; first calibration undertaken.
First error estimation.
Calibration
Standardization rules defined
Double-blind re-screening in single laboratory to confirm standardization rules
Fig. 1 Summary of work-flow
to generate standardization rules
for the final pan-European
database. Points when error
estimations were made are also
indicated
358 Genetica (2011) 139:353–367
123
Author's personal copy
Sources of error
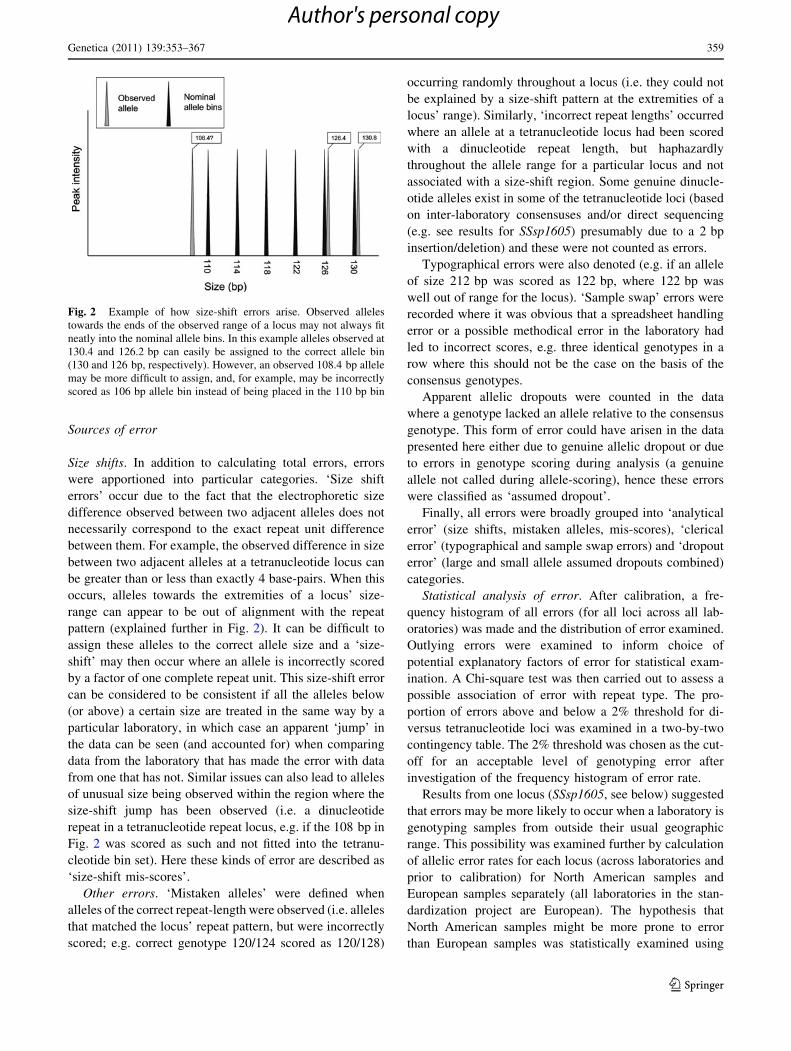
Size shifts. In addition to calculating total errors, errors
were apportioned into particular categories. ‘Size shift
errors’ occur due to the fact that the electrophoretic size
difference observed between two adjacent alleles does not
necessarily correspond to the exact repeat unit difference
between them. For example, the observed difference in size
between two adjacent alleles at a tetranucleotide locus can
be greater than or less than exactly 4 base-pairs. When this
occurs, alleles towards the extremities of a locus’ size-
range can appear to be out of alignment with the repeat
pattern (explained further in Fig. 2). It can be difficult to
assign these alleles to the correct allele size and a ‘size-
shift’ may then occur where an allele is incorrectly scored
by a factor of one complete repeat unit. This size-shift error
can be considered to be consistent if all the alleles below
(or above) a certain size are treated in the same way by a
particular laboratory, in which case an apparent ‘jump’ in
the data can be seen (and accounted for) when comparing
data from the laboratory that has made the error with data
from one that has not. Similar issues can also lead to alleles
of unusual size being observed within the region where the
size-shift jump has been observed (i.e. a dinucleotide
repeat in a tetranucleotide repeat locus, e.g. if the 108 bp in
Fig. 2 was scored as such and not fitted into the tetranu-
cleotide bin set). Here these kinds of error are described as
‘size-shift mis-scores’.
Other errors. ‘Mistaken alleles’ were defined when
alleles of the correct repeat-length were observed (i.e. alleles
that matched the locus’ repeat pattern, but were incorrectly
scored; e.g. correct genotype 120/124 scored as 120/128)
occurring randomly throughout a locus (i.e. they could not
be explained by a size-shift pattern at the extremities of a
locus’ range). Similarly, ‘incorrect repeat lengths’ occurred
where an allele at a tetranucleotide locus had been scored
with a dinucleotide repeat length, but haphazardly
throughout the allele range for a particular locus and not
associated with a size-shift region. Some genuine dinucle-
otide alleles exist in some of the tetranucleotide loci (based
on inter-laboratory consensuses and/or direct sequencing
(e.g. see results for SSsp1605) presumably due to a 2 bp
insertion/deletion) and these were not counted as errors.
Typographical errors were also denoted (e.g. if an allele
of size 212 bp was scored as 122 bp, where 122 bp was
well out of range for the locus). ‘Sample swap’ errors were
recorded where it was obvious that a spreadsheet handling
error or a possible methodical error in the laboratory had
led to incorrect scores, e.g. three identical genotypes in a
row where this should not be the case on the basis of the
consensus genotypes.
Apparent allelic dropouts were counted in the data
where a genotype lacked an allele relative to the consensus
genotype. This form of error could have arisen in the data
presented here either due to genuine allelic dropout or due
to errors in genotype scoring during analysis (a genuine
allele not called during allele-scoring), hence these errors
were classified as ‘assumed dropout’.
Finally, all errors were broadly grouped into ‘analytical
error’ (size shifts, mistaken alleles, mis-scores), ‘clerical
error’ (typographical and sample swap errors) and ‘dropout
error’ (large and small allele assumed dropouts combined)
categories.
Statistical analysis of error. After calibration, a fre-
quency histogram of all errors (for all loci across all lab-
oratories) was made and the distribution of error examined.
Outlying errors were examined to inform choice of
potential explanatory factors of error for statistical exam-
ination. A Chi-square test was then carried out to assess a
possible association of error with repeat type. The pro-
portion of errors above and below a 2% threshold for di-
versus tetranucleotide loci was examined in a two-by-two
contingency table. The 2% threshold was chosen as the cut-
off for an acceptable level of genotyping error after
investigation of the frequency histogram of error rate.
Results from one locus (SSsp1605, see below) suggested
that errors may be more likely to occur when a laboratory is
genotyping samples from outside their usual geographic
range. This possibility was examined further by calculation
of allelic error rates for each locus (across laboratories and
prior to calibration) for North American samples and
European samples separately (all laboratories in the stan-
dardization project are European). The hypothesis that
North American samples might be more prone to error
than European samples was statistically examined using
Fig. 2 Example of how size-shift errors arise. Observed alleles
towards the ends of the observed range of a locus may not always fit
neatly into the nominal allele bins. In this example alleles observed at
130.4 and 126.2 bp can easily be assigned to the correct allele bin
(130 and 126 bp, respectively). However, an observed 108.4 bp allele
may be more difficult to assign, and, for example, may be incorrectly
scored as 106 bp allele bin instead of being placed in the 110 bp bin
Genetica (2011) 139:353–367 359
123
Author's personal copy

Wilcoxon’s signed rank test. The sum of signed ranks
(W±) was used as the critical value as recommended for
small sample sizes (Zar 1999). Tests were made twice,
once for all loci (minus SSsp1605, which was not calibrated
for North American samples, thus error rates could not be
estimated) and, secondly, with loci that were subject to
size-shift errors removed from the analysis. This was done
in order to assess potential bias due to some loci with size
shifts being subject to very large outlying error rates when
a large number of individuals were present with alleles in
the affected size-range. If the range of a locus subject to a
size-shift occurred within a particular region (North
America or Europe) then a significant result may or may
not be obtained simply due to a single major cause of error
affecting a large number of individuals.
Another consideration was whether the effort that dif-
ferent laboratories made in genotyping had any outcome on
the amount of allelic error rate observed. That is, some
laboratories may have been more cautious than others in
assigning genotypes and thus may have withheld more
questionable genotypes. In this case a positive linear rela-
tionship may be expected between the proportion of sam-
ples genotyped and the degree of allelic error rate, since
more cautious laboratories which genotyped fewer samples
may have made fewer genotyping errors. Conversely, more
errors might be expected to occur when fewer samples
were genotyped if a relatively small proportion of samples
genotyped indicated a poor PCR amplification and an
associated ‘bad’ genotyping run. In this case a negative
linear relationship might be expected between proportion
of samples genotyped and error rate. To examine this, plots
were made of allelic error rate against proportion of sam-
ples genotyped for each locus in each laboratory (after
calibration).
Anonymity of laboratories is maintained throughout the
paper. For clarity, a summary of the work-flow is provided
(Fig. 1).
Results
Scoring inconsistencies and standardization
In general, scoring patterns between laboratories were
consistent at most loci (i.e. allele size differences between
laboratories followed a systematic pattern and loci were
thus easy to calibrate), although some loci proved partic-
ularly problematic for a number of research groups
(inconsistent scoring included the occurrence of alleles of
unusual size or incorrect repeat type and are detailed
below).
SSsp1605 showed a distinct geographic split in the allele
patterns and sizes between North American and European
populations. North American populations showed a 2 bp
size-shift relative to European populations (SSsp1605 is
tetranucleotide, this indel having been confirmed by direct
sequencing [D. Knox and E. Verspoor, Marine Scotland,
Freshwater Laboratory, unpublished data]). Additionally,
dinucleotide repeat alleles were numerous in the North
American samples genotyped in the control plates, but
were not scored consistently between laboratories (i.e.
laboratories differed in the number of dinucleotide repeat
alleles they scored, or they scored the locus to a tetranu-
cleotide repeat system only). These observations suggest a
dinucleotide-tetranucleotide compound repeat may actually
be more realistic at this locus. Conversely, only a single
dinucleotide allele was observed in the European samples
and was scored consistently by seven of the 11 labs
genotyping this locus. Due to the inconsistencies between
North American and European source populations at this
locus, calibration was carried out only for the European
populations. Interestingly, one laboratory (H) also reported
single base-pair alleles at this locus in some populations
(particularly prevalent in Russian samples, but otherwise
no clear geographic pattern in frequency). Genotyping of
another standard set of individuals including more North
American alleles and individuals containing single base-
pair alleles would be useful for the future, but was not
possible with available resources during the course of this
study.
Some inconsistencies (alleles of unusual size or incor-
rect repeat type) that initially confused the generation of
standardization rules were found to be consistent with two
individuals in the control plate. These individuals were
discovered to be salmon 9 trout (S. salar and S. trutta)
hybrids (one individual originating from the River Neva,
Russia, the other from the River Figgjo, Norway).
Where laboratories had large numbers of genotyping
errors at a particular locus relative to the consensus or
allelic patterns, these were resolved through correspon-
dence and/or additional genotyping and analysis (4 of 12
laboratories were affected).
Size shifts
Six loci were affected by ‘size-shift’ problems in at least
one laboratory due to the allelic drift described above
(Table 3; Fig. 2). For a single locus the greatest number of
laboratories showing a size-shift was four (SSspG7 prior to
calibration). SsaD144 also showed a characteristic double
peak on some genotyping platforms compounding the
problem of a drifting size pattern. Alternatively, where
size-shift patterns occurred consistently at a particular
locus for a particular laboratory (i.e. all alleles above or
below a certain allele length fell out of pattern by a factor
of a single repeat length) two standardization rules were
360 Genetica (2011) 139:353–367
123
Author's personal copy

applied to the locus in question, thus automatically cor-
recting this error. Standardization rules were successfully
generated for all laboratories.
Re-screening
Re-screening revealed that at one laboratory the original
?4 standardization rule for one locus (Ssa197) determined
from the calibration plate was no longer necessary. Upon
investigation, this proved to be because that laboratory had
changed their PCR protocol (a change in Taq polymerase
used) after the calibration plate had been scored and that
this resulted in a 4 bp shift in their Ssa197 allele scores. It
was also seen that at a single laboratory there was a non-
standard calibration needed at SsaF43 with the smallest
alleles. This was noticed in the original calibration exer-
cise, but after discussion with the laboratory was not
included, with hindsight a wrong decision (at the time it
was assumed to be an inconsistent error that would not be
repeated, but in fact re-screening highlighted a consistent
size-shift for the laboratory in question at this locus).
Of all re-screened samples further inconsistencies (dif-
ferences between the original genotyping and rescreening)
occurred where two samples had been mixed up. For other
loci apart from Ssa197 and SsaF43, the proportion of
genotypes with an inconsistency between the re-screen and
original data varied from 0 (SSsp3016, SsaD486, Ssosl85)
to 0.058 (SSsp2201); mean 0.020 ± 0.005. SSspG7 had the
second highest inconsistency rate of 0.042.
Error estimation
Mean errors for each locus across laboratories ranged from
0.003 ± 0.001 (SsaD486) to 0.286 ± 0.112 (SSspG7) prior
to standardization and from 0.002 ± 0.001 (SsaD486) to
0.039 ± 0.018 (SsOSL85) after standardization (Table 4; for
all errors by locus and laboratory before and after cali-
bration, see Supplementary Data). Mean errors for each
laboratory across loci varied from 0.002 ± 0.001 (Lab A)
to 0.175 ± 0.060 (Lab K) prior to standardization and from
0.002 ± 0.001 (Lab A) to 0.027 ± 0.009 (Lab K) after
calibration (Table 5; Supplementary Data). Global allelic
error rates (allelic error rates across all laboratories) were
reduced from 0.05 ± 0.01 initially to 0.01 ± 0.002 after
calibration. It should be noted that calibration only
improved error rates where laboratories previously had a
size-shift error that could automatically be corrected during
generation of standard allele sizes (as described) or where a
laboratory revised their allelic scoring for a particular locus
after correspondence and exchange of data during cali-
bration to correct some of the inconsistencies described in
the methods. Elsewhere, allelic error rates remained the
same before and after calibration.
Sources of error
Most errors prior to standardization were analytical, i.e.
errors that occurred during the scoring of allele sizes either
by eye (alone) or in genotyping software (note that all
software genotypes were also confirmed by eye). After
standardization, which automatically removes all size-shift
errors, most errors remained analytical or clerical, with the
exception of SsaF43 where allelic dropout caused most
errors (Table 6).
Statistical analysis of error
Frequency distributions of all error rates after calibration
are shown in Fig. 3. Examination of large, outlying error
Table 4 Total error for each laboratory summed across all loci (all
errors observed divided by total number of alleles genotyped; number
of loci genotyped by each laboratory is shown in parenthesis)
Laboratory Total error (summed for all loci) Mean across
loci (±SE)
Allelic
mismatches
Number
of alleles
ea ea
(A)
Lab A (12) 5 3,244 0.002 0.002 ± 0.001
Lab B (15) 98 5,120 0.019 0.019 ± 0.010
Lab C (15) 55 4,938 0.011 0.011 ± 0.003
Lab D (15) 35 5,146 0.007 0.007 ± 0.002
Lab E (5) 271 1,662 0.163 0.157 ± 0.140
Lab F (6) 12 2,256 0.005 0.006 ± 0.002
Lab G (15) 20 5,184 0.004 0.004 ± 0.002
Lab H (16) 38 5,506 0.007 0.008 ± 0.002
Lab I (15) 431 4,190 0.103 0.090 ± 0.050
Lab J (15) 378 5,198 0.073 0.072 ± 0.026
Lab K (15) 880 4,958 0.177 0.175 ± 0.060
Lab L (15) 467 5,100 0.092 0.090 ± 0.050
(B)
Lab A (12) 5 3,244 0.002 0.002 ± 0.001
Lab B (15) 55 5,120 0.011 0.011 ± 0.003
Lab C (15) 55 4,938 0.011 0.011 ± 0.003
Lab D (15) 29 5,146 0.006 0.006 ± 0.002
Lab E (5) 24 1,662 0.014 0.015 ± 0.006
Lab F (6) 11 1,904 0.006 0.006 ± 0.002
Lab G (15) 20 5,184 0.004 0.004 ± 0.002
Lab H (16) 35 5,510 0.006 0.008 ± 0.002
Lab I (15) 78 4,264 0.018 0.022 ± 0.007
Lab J (15) 221 5,202 0.042 0.042 ± 0.009
Lab K (15) 139 5,136 0.027 0.027 ± 0.009
Lab L (15) 47 5,112 0.009 0.009 ± 0.002
See text for calculation of ea. Mean allelic error rates are also given,
calculated across individual loci for each laboratory. A, Before cali-
bration; B, after calibration
Genetica (2011) 139:353–367 361
123
Author's personal copy

Ta
ble
5T
ota
ler
rors
for
each
locu
ssu
mm
edac
ross
lab
ora
tori
es,
bef
ore
cali
bra
tio
n(A
)an
daf
ter
(B)
Ssa
14
Ssa
17
1S
sa1
97
Ssa
20
2S
sa2
89
Ssa
D1
44
Ssa
D1
57
Ssa
D4
86
Ssa
F4
3S
Ssp
16
05
SS
sp2
20
1S
Ssp
22
10
SS
sp2
21
6S
Ssp
30
16
SS
spG
7S
sOS
L8
5
Rep
eat
typ
ed
id
ite
tra
tetr
ad
ite
tra
tetr
ate
tra
di
tetr
ate
tra
tetr
ate
tra
tetr
ate
tra
di
Siz
era
ng
e(b
p)
24
84
16
01
84
42
18
82
04
64
54
10
21
80
84
12
49
61
32
64
No
.o
fal
lele
s5
30
28
23
63
63
21
21
01
03
51
42
11
82
82
0
n9
11
11
11
10
10
11
10
91
11
11
11
01
01
08
(A)
All
elic
mis
mat
ches
33
55
89
17
48
31
62
11
51
43
45
76
30
48
44
99
94
81
Rep
lica
ted
alle
les
3,1
40
3,7
14
3,7
18
3,5
60
3,4
10
3,2
40
3,5
00
2,2
56
3,0
72
2,8
86
3,5
10
3,7
88
3,4
26
2,8
98
3,4
78
2,5
66
e a0
.01
10
.01
50
.02
40
.00
50
.01
40
.09
80
.06
00
.00
20
.04
70
.01
60
.02
20
.08
00
.02
50
.01
70
.28
60
.03
2
Mea
ne a
±S
E0
.01
0±
0.0
06
0.0
14
±
0.0
07
0.0
23
±
0.0
10
0.0
05
±
0.0
02
0.0
14
±
0.0
10
0.0
92
±
0.0
49
0.0
57
±
0.0
45
0.0
03
±
0.0
01
0.0
47
±
0.0
16
0.0
16
±
0.0
05
0.0
27
±
0.0
13
0.0
80
±
0.0
49
0.0
24
±
0.0
14
0.0
16
±
0.0
08
0.2
86
±
0.1
12
0.0
37
±
0.0
15
(B)
All
elic
mis
mat
ches
28
45
61
21
45
44
39
41
00
39
62
20
36
42
44
90
Rep
lica
ted
alle
les
3,1
40
3,7
18
3,7
18
3,5
86
3,4
32
3,2
38
3,5
02
2,2
56
3,0
80
2,8
78
3,7
00
3,8
06
3,4
24
2,9
10
3,4
74
2,5
62
e a0
.00
90
.01
20
.01
60
.00
60
.01
30
.01
40
.01
10
.00
20
.03
20
.01
40
.01
70
.00
50
.01
10
.01
40
.01
30
.03
5
Mea
ne a
±
SE
0.0
09
±
0.0
06
0.0
12
±
0.0
05
0.0
16
±
0.0
07
0.0
07
±
0.0
03
0.0
13
±
0.0
10
0.0
13
±
0.0
05
0.0
12
±
0.0
03
0.0
02
±
0.0
01
0.0
33
±
0.0
08
0.0
14
±
0.0
05
0.0
16
±
0.0
06
0.0
05
±
0.0
02
0.0
10
±
0.0
06
0.0
13
±
0.0
08
0.0
13
±
0.0
02
0.0
39
±
0.0
18
(C)
e aN
.A
mer
ica
0.0
08
0.0
28
0.0
18
0.0
09
0.0
10
.05
0.0
70
.00
40
.08
6n
/a0
.04
80
.05
0.0
63
0.0
15
0.0
51
0.0
13
e aE
uro
pe
0.0
08
0.0
07
0.0
19
0.0
02
0.0
14
0.1
05
0.0
53
0.0
05
0.0
28
n/a
0.0
13
0.0
90
.01
0.0
10
.33
60
.02
3
Mea
nal
leli
cer
ror
rate
sar
eal
sog
iven
,ca
lcu
late
dac
ross
ind
ivid
ual
lab
ora
tory
erro
rsfo
rea
chlo
cus;
nn
um
ber
of
lab
ora
tori
esg
eno
typ
ing
each
locu
s,lo
cus
rep
eat
typ
e(d
id
inu
cleo
tid
e,te
tra
tetr
anu
cleo
tid
e),
No
.o
fal
lele
s:n
um
ber
of
alle
les
ob
serv
edin
bas
elin
ela
bo
rato
ries
for
each
locu
sin
the
con
tro
lp
late
s.(C
)A
llel
icer
ror
rate
ssp
lit
by
geo
gra
ph
icre
gio
n,
erro
rra
tes
inb
old
ind
icat
elo
cin
ot
sub
ject
tosi
ze-s
hif
ter
rors
362 Genetica (2011) 139:353–367
123
Author's personal copy

rates in the dataset after calibration showed no apparent
trends with respect to size range or polymorphism. Several
dinucleotide loci appeared to be implicated in outlying
large error rates, however, no statistical association
between repeat type and proportion of error above and
below the 2% threshold was evident (v2 = 0.93, 1 df,
P [ 0.05).
No statistically significant pattern of allelic error rate
with geographic region (North America and Europe,
Table 5) was observed, either including all loci (sum of
signed ranks W-, 48, n = 15, P [ 0.05) or including only
loci not subject to size shifts (sum of signed ranks W-, 6,
n = 8, P [ 0.05).
There was much variation and no obvious trend with
regard to genotyping effort (proportion of loci genotyped)
and allelic error rate (data not shown).
Discussion
Calibration and standardization
In this study we illustrate the relative ease with which
microsatellite data can be calibrated and standardized
across multiple laboratories for use in conservation and
management, providing an important and valuable resource
for population genetic research through the generation of a
standardized database for Atlantic salmon across its entire
range.
Calibration was possible across 12 laboratories geno-
typing up to 16 loci using seven different genotyping
platforms, multiple models of thermocycler, different
fragment labelling systems, size-standards, Taq polymer-
ase, multiplexes, labelling different primers (forward or
reverse), using different fluorophores and in two cases (in
one laboratory) even different primers. Although the use of
different primers could present problems in later analysis,
through the potential for differing rates of null alleles, their
use did not present a problem during the current calibration
process. Although similar exercises have been previously
undertaken in a range of species on varying scales (This
et al. 2004; Pasqualotto et al. 2007; Seeb et al. 2007;
Doveri et al. 2008; Baric et al. 2008; Stephenson et al.
2009), calibration is often considered or found to be
problematic (Weeks et al. 2002; Moran et al. 2006) and in
some cases has not been possible (Hoffman et al. 2006).
Previous studies have recommended the use of allele
ladders for calibration (LaHood et al. 2002; Moran et al.
2006): single tubes are made containing a range (ideally
all) of the alleles present for a particular locus for the study
species in question and genotyped as a control by multiple
laboratories. Comparison of observed allele ladder geno-
types and the nominated sizes for those alleles allowsTa
ble
6B
reak
do
wn
of
erro
rp
erlo
cus
into
the
cate
go
ries
des
crib
edin
the
tex
t(a
fter
cali
bra
tio
n,
no
teth
atd
rop
-ou
tis
‘ass
um
ed’,
see
tex
t)
Ssa
14
Ssa
17
1S
sa1
97
Ssa
20
2S
sa2
89
Ssa
D1
44
Ssa
D1
57
Ssa
D4
86
Ssa
F4
3S
Ssp
16
05
SS
sp2
20
1S
Ssp
22
10
SS
sp2
21
6S
Ssp
30
16
SS
spG
7S
sOS
L8
5T
ota
l
Err
or
typ
e
Siz
e-sh
ift
00
00
00
00
00
00
00
00
0
Siz
e-sh
ift
plu
sm
is-
sco
re
00
00
00
00
00
00
00
00
0
Mis
tak
enal
lele
13
24
35
14
30
23
16
22
93
01
81
21
31
41
21
42
99
Inco
rrec
tre
pea
t
len
gth
00
36
01
45
08
62
31
12
12
08
1
Ty
po
.1
01
00
01
00
10
01
01
06
Sam
ple
swap
12
12
12
01
24
00
12
03
41
71
22
72
17
4
Sm
all
alle
led
rop
-ou
t1
62
11
01
01
51
13
13
46
25
7
Lar
ge
alle
led
rop
-ou
t1
23
02
37
14
61
52
11
01
02
96
Pro
po
rtio
n
An
aly
tica
l0
.46
0.5
50
.68
0.9
50
.67
0.8
40
.54
0.5
00
.37
0.9
20
.66
0.6
50
.39
0.3
80
.56
0.1
60
.53
Cle
rica
l0
.46
0.2
70
.23
0.0
00
.27
0.0
90
.03
0.0
00
.12
0.0
30
.05
0.2
00
.50
0.2
90
.07
0.8
00
.25
Dro
p-o
ut
0.0
70
.18
0.0
90
.05
0.0
70
.07
0.4
40
.50
0.5
10
.05
0.2
90
.15
0.1
10
.33
0.3
70
.04
0.2
1
Th
ep
rop
ort
ion
of
erro
rsin
toth
eb
road
clas
ses
des
crib
edin
the
tex
tis
also
pro
vid
ed
Genetica (2011) 139:353–367 363
123
Author's personal copy

correction of population genotypes to the standard sizes
and, if the ladder is run as a control during screening, future
consistency is maintained. In this study although a specific
allele ladder was not used, samples within the two control
plates had been selected to include fish from across the full
range of the species (Table 1). Subsequently, calibration
was achieved through comparison of allele sizes at each
locus across laboratories based on the control plates con-
taining this standard set of samples from across the species’
range, thus presumably reflecting a wide representation of
existing genetic variation. In the future, as the geographic
sample baseline is made more comprehensive and addi-
tional populations are characterised, we anticipate that
some new alleles outside the current range may be
encountered. Thus, it is intended that aliquots of samples
with new alleles will be made available to consortium
members and other interested parties for additional cali-
bration as required.
Nonetheless, some anomalies remained. For example,
one laboratory reported unusual 1 bp alleles at one locus
for several populations from Norway and Russia, which
were not detected in other baseline populations. It is not
easy to include such data in the standardized database and
the alleles, although real (as confirmed by direct sequenc-
ing), were reported by only a single laboratory. Conse-
quently, to maintain consistency across laboratories, these
alleles were binned with the adjacent tetranucleotide
alleles, although this obviously creates a loss of resolution
at a single locus for some populations.
The presence of two hybrids between S. salar and
S. trutta in the control plate caused some initial confusion
in the process of standardization, as different laboratories
treated the presence of anomalous allele sizes differently in
their data. Hybridization has similarly caused difficulties in
microsatellite standardization in the past (e.g. between
O. mykiss and O. clarki, Stephenson et al. 2009). For future
standardization efforts, it is sensible to recommend
screening of samples to be used for data exchange between
laboratories to identify hybrids, especially when hybrid-
ization between the study organism and related species is
known to occur, as is the case in salmonids.
The identification of the Ssa197-shift during the final re-
screening illustrates the need for this stage. It also illus-
trates the need for controls to be run when changing any of
the protocols within a laboratory and further highlights an
advantage of using an allele ladder method. The identifi-
cation of the non-standard conversion factor at SsaF43
illustrates the need to have the full range of alleles included
on a calibration plate.
Of necessity, projects must to some extent balance their
choice of approach against available finances, current
resources and existing data. In the future, the construction
of allele ladders containing the full range of alleles
observed thus far for each locus used would be advanta-
geous (and experience in Pacific salmonids shows that the
use of allele ladders allows new laboratories to become
instantly standardized and to produce high quality data
[P. Moran, pers. comm.]). Although there is no guarantee
that allele ladders will include all alleles that will ulti-
mately be encountered (as is also true of the control-plate
approach used here), in practice missing alleles in the
ladder do not necessarily compromise utility (Lahood et al.
Fig. 3 Frequencies of allelic
error rates (Ea = ea) after
calibration
364 Genetica (2011) 139:353–367
123
Author's personal copy

2002) and new alleles can easily be added to the pool used
to construct the ladder, prior to redistribution. Sustained
funding is valuable for the continuing success of exchange,
compilation and distribution of data, and an important
point is that researchers should at least plan/budget for
some on-going/additional calibration.
Estimation of genotyping error
Calibration and standardization enabled an assessment of
genotyping error. Similarly to other studies (e.g. with slab-
gel sequencers, Ewen et al. 2000), most errors observed
occurred at the analytical stages, i.e. errors associated with
the binning of alleles or data-handling. Allelic dropout was
the major cause of error at only one of the 16 loci (SsaF43,
after calibration). A large number of errors occurred due to
size shifts, this cause of error giving rise to very large
outlying error rates at some loci (prior to calibration).
Interest in standardization is evident in the literature and
programmes have been developed to allow the combination
of data (Taubert and Bradley 2008), to examine issues of
inconsistency such as size shifts (Morin et al. 2009 [these
programmes did not exist when this project began]), as well
as to examine the extent of ‘false alleles’ and allelic
dropout even where reference data are not available
(Johnson and Haydon 2007).
Previous studies have suggested that errors may be
associated with modal allele size at a locus and locus
polymorphism (Hoffman and Amos 2005). There is also a
perceived wisdom that dinucleotides can be particularly
problematic to score: often dinucleotides possess peaks
with a so-called ‘hedgehog’ topography (i.e. lots of stutter)
and it can be difficult to determine whether a peak is homo-
or heterozygous and which peaks represent the actual
allele(s). Conversely, Moran et al. (2006) have recom-
mended the use of polymorphic dinucleotide loci with an
intermediate degree of polymorphism since they occupy
little of the available size range on an electrophoretic
instrument, thus allowing more opportunity for ‘size-
plexing’ microsatellites with the same fluorophore in a
single PCR reaction; additionally, many dinucleotides may
be available that do not show stutter (true in many sal-
monids), and tetranucleotides may be more prone to
inconsistencies in mobility, thus making standardization
between labs more difficult (Moran et al. 2006). Here, no
clear associations were found between degree of error and
locus size range, number of alleles or repeat type. How-
ever, the early agreement by many laboratories to a stan-
dard panel of loci, known to be generally free of scoring
errors, may explain why no clear associations were
observed. The chosen panel of loci resulted from an
informal meeting held in West Virginia in 2004 in which
the choices were made by a number of laboratories inter-
ested in studying the genetics of Atlantic salmon (see
Verspoor and Hutchinson 2008). Although not in use by all
laboratories, the fact that many had been using the panel, or
a sub-set of loci from the panel, greatly aided the inte-
gration of historical data. Without such an agreement it
would not have been possible to combine genetic data, as
the potential for each laboratory to choose different loci
would have been high considering there were many hun-
dreds of microsatellites to choose from. Such a consider-
ation is perhaps even more important for the future with the
development of SNP technologies, for which there are
potentially many hundreds of thousands of polymorphisms.
Allelic error rates showed no clear pattern associated
with geographic region (North America vs. Europe), nor
was a consistent relation between percentage of the control
plates genotyped and allelic error rate found (data not
shown). An additional aspect that would also be interesting
to examine is how genotyping error affects the estimation
of common population genetic statistics. With a number of
laboratories showing differing degrees of genotyping error
and genotyping the same set of samples, this would have
been interesting to examine here. However, the set-up of
the control plates was not undertaken with such a goal in
mind and the small number of individuals per river (as few
as two individuals in some cases) precluded a useful
analysis.
Overall, it was found that some laboratories were less
prone to making genotyping errors than others and some
loci were less prone to errors than others, although as
described this is not necessarily predictable on the basis of
repeat type, size range or allele number. One important
recommendation is to make locus choices on the basis of
prior genotyping experience and, with regard to collabo-
ration and interchange of data, perform an initial small-
scale calibration using a wider range of loci than intended
for final use. In this way any locus that was considered
to be reliable by a single laboratory, but for which inter-
laboratory calibration reveals errors or difficulties, can be
eliminated from the study and the most reliable set can be
calibrated at a larger scale and used for the future (similar
parallels regarding this point have been observed in the
calibration of genetic data for Pacific salmonids [P. Moran,
pers. comm.]).
In this study, calibration reduced errors significantly.
Pompanon et al. (2005) address solutions to genotyping
error and provide a work-flow to minimize error. Assessing
consistency of microsatellite genotypes with independent
data is recommended as a final step, prior to the determi-
nation of the reliability of the data. Some of these errors,
such as size shifts, or consistently mis-calling a particular
Genetica (2011) 139:353–367 365
123
Author's personal copy

allele, would not be readily rectified through ‘standard’
intra-laboratory replicate genotyping as is routine and
recommended (Bonin et al. 2004; Hoffman and Amos
2005). Thus, calibration is to be advised even where future
collaboration is not the final goal as a means to improve the
quality of microsatellite datasets. In the past, other authors
have called for the presentation of an estimate of error
alongside genetic studies as the equivalent of presenting
P-values in traditional statistics (Bonin et al. 2004; Broquet
and Petit 2004) and this is a call that can be reiterated here.
Concluding remarks
The standardization described here will allow the gener-
ation of a pan-European microsatellite genetic database for
Atlantic salmon, Salmo salar. Thus, genetic assignment of
marine caught fish to rivers or regions of origin across
most of the European range of Atlantic salmon will be
possible and the freshwater origins of migrating and/or
feeding Atlantic salmon caught in intermixed stocks may
be elucidated. As the marine survival of Atlantic salmon
has declined dramatically over recent decades (Jonsson
and Jonsson 2004; Potter et al. 2004; Friedland et al.
2009), this will represent a much-needed and significant
contribution to the underlying knowledge necessary to
mitigate declines of this culturally and economically
important fish.
Although single nucleotide polymorphisms (SNPs)
overcome some of the problems associated with micro-
satellites (homoplasy, null alleles, variable mutation mod-
els and sparsely distributed loci, Morin et al. 2004; Seddon
et al. 2005; Kohn et al. 2006), and are likely to find rapidly
increasing use in the future, recent studies suggest that, for
the time being, a combination of microsatellites and SNPs
can provide more robust information for population genetic
analyses (Narum et al. 2008).
Acknowledgments This work forms part of the SALSEA-Merge
research project (Project No. 212529) and was funded by the Euro-
pean Union under theme six of the 7th Framework programme. In
addition to samples contributed by the authors, thanks go to T. King,
P. O’Reilly, L. Bernatchez, M.-L. Koljonen, A. Veselov, A. J. Jensen,
J. Lumme and S. Kaliuzhin for additional samples used in the cali-
bration exercise. PMcG, TC & JC were funded by the Beaufort
Marine Research Award with the support of the Marine Institute
under the Marine Research Sub-Programme of the National Devel-
opment Plan (Ireland) 2007–2013. Thanks to James Cresswell (Uni-
versity of Exeter) for statistical advice and useful discussions. We
would also like to thank Paul Moran (NW Fisheries Science Center,
Seattle, USA) and one anonymous reviewer for their detailed and
constructive comments on the original manuscript.
Open Access This article is distributed under the terms of the
Creative Commons Attribution Noncommercial License which per-
mits any noncommercial use, distribution, and reproduction in any
medium, provided the original author(s) and source are credited.
References
Baric S, Monschein S, Hofer M, Grill D, Via Dalla J (2008)
Comparability of genotyping data obtained by different proce-
dures an inter-laboratory survey. J Hortic Sci Biotechnol
83:183–190
Bonin A, Bellemain E, Eidesen Bronken P, Pompanon F, Brochmann
C, Taberlet P (2004) How to track and assess genotyping errors
in population genetic studies. Mol Ecol 13:3261–3273
Broquet T, Petit E (2004) Quantifying genotyping errors in nonin-
vasive population genetics. Mol Ecol 13:3601–3608
Callen DF, Thompson AD, Shen Y, Phillips HA, Richards RI, Mulley
JC, Sutherland GR (1993) Incidence and origin of null alleles in
the (AC)n microsatellite markers. Am J Hum Genet 52:922–927
Delmotte F, Leterme N, Simon C-J (2001) Microsatellite allele sizing:
difference between automated capillary electrophoresis and
manual technique. BioTechniques 31:810–818
Dieringer D, Schlotterer C (2002) Microsatellite analyser (MSA): a
platform independent analysis tool for large microsatellite data
sets. Mol Ecol Notes 3:167–169
Doveri S, Gil FS, Dıaz A, Reale S, Busconi M, Camara Machado DA,
Martın A, Fogher C, Donini P, Lee D (2008) Standardization of a
set of microsatellite markers for use in cultivar identification
studies in olive (Olea europaea L.). Sci Hortic 116:367–373
Ewen KR, Bahlo M, Treloar SA, Levinson DF, Mowry B, Barlow
JW, Foote SJ (2000) Identification and analysis of error types in
high-throughput genotyping. Am J Hum Genet 67:727–736
Excoffier L, Heckel G (2006) Computer programs for population
genetics analysis: a survival guide. Nat Rev Genet 7:745–758
Fernando P, Evans BJ, Morales JC, Melnick DJ (2001) Electrophor-
esis artefacts – a previously unrecognized cause of error in
microsatellite analysis. Mol Ecol Notes 1:325–328
Finnegan AK, Stevens JR (2008) Assessing the long-term genetic
impact of historical stocking events on contemporary popula-
tions of Atlantic salmon, Salmo salar. Fish Manage Ecol 15:
315–326
Friedland KD, Maclean JC, Hansen LP, Peyronnet AJ, Karlsson L,
Reddin DG, Maoileidigh NO, McCarthy JL (2009) The recruit-
ment of Atlantic salmon in Europe. ICES J Mar Sci 66:289–304
Gagneux P, Boesch C, Woodruff DS (1997a) Microsatellite scoring
errors associated with non-invasive genotyping based on nuclear
DNA amplified from shed hair. Mol Ecol 6:861–868
Gagneux P, Woodruff DS, Boesch C (1997b) Furtive mating in
female chimpanzees. Nature 387:358–359
Gagneux P, Woodruff DS, Boesch C (2001) Furtive mating in female
chimpanzees (vol 387, pp 358, 1997) Nature 414:508
Gauthier-Ouellet M, Dionne M, Caron F, Kind TL, Bernatchez L
(2009) Spatiotemporal dynamics of the Atlantic salmon (Salmosalar) Greenland fishery inferred from mixed-stock analysis. Can
J Fish Aquat Sci 66:2040–2051
Glaubitz JC, Rhodes OE, Dewoody JA (2003) Prospects for inferring
pairwise relationships with single nucleotide polymorphisms.
Mol Ecol 12:1039–1047
Griffiths AM, Machado-Schiaffino G, Dillane E, Coughlan J, Horreo
JL, Bowkett AE, Minting P, Toms S, Roche W, Gargan P,
McGinnity P, Cross T, Bright D, Garcia-Vazquez E, Stevens JR
(2010) Genetic stock identification of Atlantic salmon (Salmosalar) populations in the southern part of the European range.
BMC Genet 11:31
Haberl M, Tautz D (1999) Comparative allele sizing can produce
inaccurate allele size differences for microsatellites. Mol Ecol
8:1347–1349
Hoffman JI, Amos W (2005) Microsatellite genotyping errors:
detection approaches, common sources and consequences for
paternal exclusion. Mol Ecol 14:599–612
366 Genetica (2011) 139:353–367
123
Author's personal copy

Hoffman JI, Matson CW, Amos W, Loughlin TR, Bickham JW
(2006) Deep genetic subdivision within a continuously distrib-
uted and highly vagile marine mammal, the Steller’s sea lion
(Eumetopias jubatus). Mol Ecol 15:2821–2832
Hudson ME (2008) Sequencing breakthroughs for genomic ecology
and evolutionary biology. Mol Ecol Resour 8:3–17
Johnson PCD, Haydon DT (2007) Maximum-likelihood estimation of
allelic dropout and false allele error rates from microsatellite
genotypes in the absence of reference data. Genetics 175:827–842
Jonsson B, Jonsson N (2004) Factors affecting the marine production
of Atlantic salmon (Salmo salar). Can J Fish Aquat Sci
61:2369–2383
King TL, Eackles MS, Letcher BH (2005) Microsatellite DNA
markers for the study of Atlantic salmon (Salmo salar) kinship,
population structure, and mixed-fishery analyses. Mol Ecol
Notes 5:130–132
Knox D, Lehmann K, Reddin DG, Verspoor E (2002) Genotyping of
archival Atlantic salmon scales from northern Quebec and West
Greenland using novel PCR primers for degraded mtDNA. J Fish
Biol 60:266–270
Kohn MH, Murphy WJ, Ostrander EA, Wayne RK (2006) Genomics
and conservation genetics. Trends Ecol Evol 21:629–636
LaHood ES, Moran P, Olsen J, Stewart Grant W, Park LK (2002)
Microsatellite allele ladders in two species of Pacific salmon:
preparation and field-test results. Mol Ecol Notes 2:187–190
McConnell S, Hamilton L, Morris D, Cook D, Paquet D, Bentzen P,
Wright J (1995) Isolation of salmonid microsatellite loci and
their application to the population genetics of Canadian east
coast stocks of Atlantic salmon. Aquaculture 137:19–30
Moran P, Teel DJ, LaHood ES, Drake J, Kalinowski S (2006)
Standardising multi-laboratory microsatellite data in Pacific
salmon: an historical view of the future. Ecol Freshw Fish
15:597–605
Morin PA, Luikart G, Wayne RK, The SNP Workshop Group (2004)
SNPS in ecology, evolution and conservation. Trends Ecol Evol
19:208–216
Morin PA, Manaster C, Mesnick SL, Holland R (2009) Normalization
and binning of historical and multi-source microsatellite data:
overcoming the problems of allele size-shift with ALLELO-
GRAM. Mol Ecol Resour 9:1451–1455
Narum SR, Banks M, Beacham TD, Bellinger MR, Campbell MR,
Dekoning J, Elz A, Guthrie CM III, Kozfkay C, Miller KM,
Moran P, Phillips R (2008) Differentiating salmon populations
at broad and fine geographical scales with microsatellites
and single nucleotide polymorphisms. Mol Ecol 17:3464–
3477
Nielsen EE, Hansen MM, Loeschcke V (1997) Analysis of micro-
satellite DNA from old scale samples of Atlantic salmon Salmosalar: a comparison of genetic composition over 60 years. Mol
Ecol 6:487–492
O’Reilly PT, Hamilton LC, McConnell SK, Wright JM (1996) Rapid
analysis of genetic variation in Atlantic salmon (Salmo salar) by
PCR multiplexing of dinucleotide and tetranucleotide microsat-
ellites. Can J Fish Aquat Sci 53:2292–2298
Olafsson K, Hjorleifsdottir S, Pampoulie C, Hreggvidsson GO,
Gudjonsson S (2010) Novel set of multiplex assays (SalPrint15)
for efficient analysis of 15 microsatellite loci of contemporary
samples of the Atlantic salmon (Salmo salar). Mol Ecol Resour
10:533–537
Pasqualotto AC, Denning DW, Andersen MJ (2007) A cautionary
tale: lack of consistency in allele sizes between two laboratories
for a published multilocus microsatellite typing system. J Clin
Microbiol 45:522–528
Paterson S, Piertney SB, Knox D, Gilbey J, Verspoor E (2004)
Characterization and PCR multiplexing of novel highly variable
tetranucleotide Atlantic salmon (Salmo salar L.) microsatellites.
Mol Ecol Notes 4:160–162
Pendas AM, Moran P, Martinez JL, Garcia-Vazquez E (1995)
Applications of 5S rDNA in Atlantic salmon, brown trout, and in
Atlantic salmon 9 brown trout hybrid identification. Mol Ecol
4:275–276
Pompanon F, Bonin A, Bellemain E, Taberlet P (2005) Genotyping
errors: causes, consequences and solutions. Nat Rev Genet
6:847–859
Potter ECE, Crozier WW, Schon P-J, Nicholson MD, Maxwell DL,
Prevost E, Erkinaro J, Gudbergsson G, Karlsen L, Hansen LP,
Maclean JC, Maoileidigh NO, Prusov S (2004) Estimating and
forecasting pre-fishery abundance of Atlantic salmons (Salmosalar L.) in the Northeast Atlantic for the management of mixed-
stock fisheries. ICES J Mar Sci 61:1359–1369
Sanchez JA, Clabby C, Ramos G, Blanco D, Flavin F, Vazquez E,
Powell R (1996) Protein and microsatellite single-locus vari-
ability in Salmo salar L. (Atlantic salmon). Heredity 77:423–432
Seddon JM, Parker HG, Ostrander EA, Ellegren H (2005) SNPs in
ecological and conservation studies: a test in the Scandinavian
wolf population. Mol Ecol 14:503–511
Seeb LW, Antonovich A, Banks MA, Beacham TD, Bellinger MR,
Blankenship SM, Campbell MR, Decovich NA, Garza JC,
Guthrie CM III, Lundrigan TA, Moran P, Narum SR, Stephenson
JJ, Supernault KJ, Teel DJ, Templin WD, Wenburg JK, Young
SF, Smith CT (2007) Development of a standardized DNA
database for Chinook salmon. Fisheries 11:540–549
Slettan A, Olsaker I, Lie Ø (1995) Atlantic salmon, Salmo salar,
microsatellites at the SsOSL25, SsOSL85, SsOSL311 and SsOSL417
loci. Anim Genet 26:281–282
Stephenson JJ, Campbell MR, Hess JE, Kozfkay C, Matala AP,
McPhee MV, Moran P, Narum SR, Paquin MM, Maureen OS,
Small P, Van Doornik DM, Wenburg JK (2009) A centralized
model for creating shared, standardized, microsatellite data that
simplifies inter-laboratory calibration. Conserv Genet 10:1145–
1149
Taberlet P, Griffin S, Goosens B, Questiau S, Manceau V, Escaravage
N, Waits LP, Bouvet J (1996) Reliable genotyping of samples
with very low DNA quantities using PCR. Nucleic Acids Res
24:3189–3194
Taubert H, Bradley DG (2008) COMBI.PL: a computer program to
combine data sets with inconsistent microsatellite marker size
information. Mol Ecol Resour 8:572–574
This P, Jung A, Boccacci P, Borrego J, Botta R, Costantini L, Crespan
M, Dangl GS, Eisenheld C, Ferreira-Monteiro F, Grando S, Ibanez
J, Lacombe T, Laucou V, Magalhaes R, Meredith CP, Milani N,
Peterlunger E, Regner F, Zulini L, Maul E (2004) Development of
a standard set of microsatellite reference alleles for identification
of grape cultivars. Theor Appl Genet 109:1448–1458
Verspoor E, Hutchinson P (2008) Report of the symposium on
population structuring of Atlantic salmon: from within rivers
to between continents. NASCO report ICR(08)8, 23 pp. http://
www.nasco.int/sas/pdf/reports/misc/
Verspoor E, Beardmore JA, Consuegra S, Garcia de Leaniz C, Hindar
K, Jordan WC, Koljonen M-L, Makhrov AA, Paaver T, Sanchez
JA, Skaala Ø, Titov S, Cross TF (2005) Population structure in
the Atlantic salmon: insights from 40 years of research into
genetic protein variation. J Fish Biol 67(suppl A):3–54
Weeks DE, Conley YP, Ferrell RE, Mah TS, Gorin MB (2002) A tale
of two genotypes: consistency between two high-throughput
genotyping centres. Genome Res 12:430–435
WWF (2001) The status of wild atlantic salmon: a river by river
assessment. WWF http://assets.panda.org/downloads/salmon2.
pdf. Accessed March 2010
Zar JH (1999) Biostatistical analysis, 4th edn. Prentice-Hall, London
Genetica (2011) 139:353–367 367
123
Author's personal copy