Fatty acid metabolism in Atlantic salmon (Salmo salar L.) hepatocytes and influence of dietary...
35
1 Fatty acid metabolism in Atlantic salmon (Salmo salar L.) hepatocytes, and influence of dietary vegetable oil Ingunn Stubhuag a1 , Douglas R. Tocher b , J. Gordon Bell b , James R. Dick b , Bente E. Torstensen a a National institute of Nutrition and Seafood Research, PO Box 2029, Nordnes, 5817 Bergen, Norway b Institute of Aquaculture, University of Stirling, Stirling FK9 4LA, Scotland Running title: Fatty acid metabolism in Atlantic salmon hepatocytes Keywords: uptake, phospholipids, TAG, β-oxidation, secretion, salmon 1 Correspondence to Ingunn Stubhaug, National Institute of Nutrition and Seafood Research (NIFES), P.O. Box 2029, Nordnes, 5817 Bergen, Norway Phone: +47 55 90 51 49, Fax: +47 55 90 52 99 E-mail: [email protected]
-
Upload
independent -
Category
Documents
-
view
4 -
download
0
Transcript of Fatty acid metabolism in Atlantic salmon (Salmo salar L.) hepatocytes and influence of dietary...
1
Fatty acid metabolism in Atlantic salmon (Salmo salar L.)
hepatocytes, and influence of dietary vegetable oil
Ingunn Stubhuaga1, Douglas R. Tocherb, J. Gordon Bellb, James R. Dickb, Bente
E. Torstensena
aNational institute of Nutrition and Seafood Research, PO Box 2029, Nordnes, 5817 Bergen,
Norway bInstitute of Aquaculture, University of Stirling, Stirling FK9 4LA, Scotland
Running title: Fatty acid metabolism in Atlantic salmon hepatocytes
Keywords: uptake, phospholipids, TAG, β-oxidation, secretion, salmon
1 Correspondence to Ingunn Stubhaug, National Institute of Nutrition and Seafood Research
(NIFES), P.O. Box 2029, Nordnes, 5817 Bergen, Norway
Phone: +47 55 90 51 49, Fax: +47 55 90 52 99
E-mail: [email protected]

2
Abstract
Isolated hepatocytes from Atlantic salmon (Salmo salar), fed diets containing either
100% fish oil or a vegetable oil blend replacing 75% of the fish oil, were incubated with a
range of seven 14C-labelled fatty acids. The fatty acids were; [1-14C]16:0, [1-14C]18:1n-9, [1-
14C]18:2n-6, [1-14C]18:3n-3, [1-14C]20:4n-6, [1-14C]20:5n-3, and [1-14C]22:6n-3. After 2
hours of incubation the hepatocytes and medium were analyzed for acid soluble products,
incorporation into lipid classes, and hepatocytes for desaturation and elongation. Uptake into
hepatocytes was highest with [1-14C]18:2n-6 and [1-14C]20:5n-3 and lowest with [1-14C]16:0.
The highest recovery of radioactivity in the cells was found in triacylglycerols. Of the
phospholipids the highest recovery was found in phosphatidylcholine, with [1-14C]16:0 and
[1-14C]22:6n-3 being the most prominent fatty acids. The rates of β-oxidation were as follows:
20:4n-6 > 18:2n-6 = 16:0 > 18:1n-9 > 22:6n-3 = 18:3n-3 = 20:5n-3. Of the fatty acids taken
up by the hepatocytes, [1-14C]16:0 and [1-14C]18:1n-9 were subsequently exported the most,
with the majority of radioactivity recovered in phospholipids and triacylglycerols,
respectively. The major products from desaturation and elongation were generally one cycle
of elongation of the fatty acids. Diet had a clear effect on the overall lipid metabolism, with
replacing 75% of the fish oil with vegetable oil resulting in decreased uptake of all fatty acids
and reduced incorporation of fatty acids into cellular lipids, but increased β-oxidation activity,
and higher recovery in products of desaturation and elongation of [1-14C]18:2n-6 and [1-
14C]18:3n-3.
Abbreviations: CL, cardiolipin, FO, fish oil; PA, phosphatidic acid; PC,
phosphatidylcholine; PE, phosphatidylethanolamine; PI, phosphatidylinositol; PL,
phospholipids; PS, phosphatidylserine; PUFA, polyunsaturated fatty acids; TAG,
triacylglycerol; VO, vegetable oil,
3
1. Introduction
Both in vitro studies and more traditional feeding trials on salmonids have shown that fatty
acids have distinct fates inside a cell and that there is competition between the pathways of
fatty acid metabolism [1]. In Atlantic salmon (Salmo salar), essential fatty acids such as
22:6n-3 in all tissues, and 20:5n-3 specifically in liver, are relatively spared from β-oxidation
[2]. In fish, monounsaturated fatty acids (MUFA) and polyunsaturated fatty acids (PUFA) are
proposed to be good candidates for hepatic β-oxidation with MUFA reported as the primary
substrates in several studies [3-5].
Another metabolic fate, at least in liver, is desaturation and elongation of fatty acids. The
affinity of the desaturation and elongation enzymes for fatty acids is higher for the n-3 series
than for the n-6 and n-9 series [6, 7]. Only a few studies have simultaneously investigated
both the pathways of β-oxidation and desaturation/elongation of fatty acids [8-10], and very
little has been done regarding the overall metabolic fate of fatty acids in cells. Previous
studies on lipid metabolism in salmonids have mainly concentrated on the metabolism of
18:3n-3 [11], and effects of dietary treatment. Desaturation and elongation of 18:3n-3 are
increased when Atlantic salmon are fed a diet containing vegetable oil (VO) in comparison
with fish fed fish oil (FO) [12, 13], and there is increased expression of fatty acid desaturase
and elongase genes [14]. Given the increased demand for FO and the limited availability [15],
there has been an intensive search for suitable, sustainable alternatives to FO for salmon diets.
However, VO does not contain fatty acids with carbon chain length greater than C18 compared
to FO, which contains predominantly C20 and C22 PUFA. Knowledge of the effects of VO on
lipid metabolism in fish is therefore important in order to maintain fish health and benefits of
farmed fish for human consumers [16].
Other possible fates for fatty acids in liver are incorporation into cellular lipids and
secretion of lipids through lipoprotein production. Triacylglycerols (TAG) and phospholipids

4
(PL) are the major fatty acid-containing lipid components in cells. PLs are produced in the
endoplasmic reticulum and are major structural components of membranes. TAG are stored in
lipid droplets in the cytoplasm until required and mobilised for transport of lipids to other
tissues, or for β-oxidation [17, 18]. Thus the liver is an important regulator of plasma levels of
free fatty acids that are low in the post prandial state [17]. The extent to which endogenous
and/or exogenous fatty acids are mobilised for β-oxidation is not fully known. Studies have
shown that in mammalian liver the majority of fatty acids that are β-oxidised originate from
exogenous sources rather than mobilising endogenous TAG [19]. Lipids are secreted by the
liver mainly as TAG in very-low-density lipoprotein (VLDL) [20]. In rat hepatocytes, 18:1n-9
is known to be readily incorporated into VLDL particles, primarily as TAG, whereas 20:5n-3
inhibited VLDL production [21, 22].
The present study had two primary objectives. Firstly, to determine an overall budget for
the metabolism of different fatty acids in Atlantic salmon hepatocytes. Secondly, to
investigate dietary effects on hepatic lipid metabolism. Atlantic salmon were fed for two years
from first feeding on diets containing either FO or a VO blend replacing 75% of FO. Isolated
hepatocytes were incubated with seven radiolabelled fatty acids including saturated,
monounsaturated, and n-3 and n-6 polyunsaturated fatty acids. Metabolic fates of the different
fatty acids, and the effects of diet, were assessed by measuring recovery of radioactivity in
cellular lipids, exported lipids, acid soluble products and in desaturated/elongated products.
2. Materials and Methods
2.1 Fish, diets and sampling
Atlantic salmon were fed two fish meal-based diets containing 75% VO or 100% FO
from first feeding. The VO was a blend of low erucic acid rapeseed, palm and linseed oils in
the ratio 3.7 : 2 : 1 with the remaining 25% being FO (capelin). The diets were formulated to
5
satisfy the nutritional requirements of salmonid fish and were manufactured by Nutreco ARC,
Stavanger, Norway. The analysed proximate compositions and fatty acid compositions of the
diets are given in Table 1. The trial was carried out at Marine Harvest Ltd. facilities at
Invergarry (freshwater) and Loch Duich, Lochalsh (seawater). In March 2002, salmon fry
were distributed into replicate tanks (3m x 3m, depth 0.5m) at a stocking level of 3000/tank,
and fed extruded diets containing 20% added oil until seawater transfer in April 2003. Fish
were then transferred into 5m x 5m net pens at 700 fish/pen. The fish were fed the same diet
in seawater as in freshwater except oil levels were increased up to 32% by the time of
sampling in March 2004. There was no significant difference in growth of the fish between
the two dietary groups with fish fed FO weighing 2.54±0.14 kg and fish fed VO weighing
2.37±0.13 (n = 2 for FO and n = 3 for VO), at the time of sampling. Further details of the
experimental design, growth performance, tissue fatty acid compositions are given elsewhere
[23]. Three and six fish from FO and VO dietary groups were sampled in March 2004 after
one year in seawater, respectively. Fish were killed with a blow to the head after being
anesthetized with MS222 (Sigma-Aldrich, Poole, England), and livers removed immediately
for preparation of hepatocytes.
2.2 Preparation of isolated hepatocytes
Hepatocytes were isolated following Tocher et al. [24]. Briefly, the liver was cleared of
blood by perfusion via the hepatic vein with calcium and magnesium-free Hank’s balanced
salt solution (HBSS), containing 10 mM HEPES and 1 mM EDTA (Solution A). A portion of
liver (approximately 1 g) was finely chopped and incubated with solution A containing 0.1
mg/ml collagenase in an Erlenmeyer flask for 45 min at 20°C in a shaking water bath. The
digested liver was filtered through 100 µm nylon gauze by flushing the cells with 25 ml
solution A containing 1 mg/ml fatty acid free serum albumin (FAF-BSA). The cells were
collected by centrifugation at 400 x g for 2 min. The supernatant was removed and the cell

6
pellet washed with 20 ml solution A (without FAF-BSA) followed by centrifugation at 400 x
g for 2 min. The supernatant was removed and the cells resuspended in 10 ml of Medium 119
containing 10 mM HEPES and 200 mM glutamine. The hepatocytes from all livers per dietary
treatment were pooled to produce a common pool of cells so that comparison between each
fatty acid could be made. This resulted in two large and homogeneous cell suspensions, one
per dietary treatment. Five 100 µl aliquots of the cell suspensions were taken for protein
determination using the method of Lowry et al. [25] after incubation with 0.4 ml of 0.25%
(w/v) SDS/1 M NaOH for 45 min at 60ºC.
2.3 Incubation of hepatocytes with [1-14C]-labelled fatty acids
Each pooled hepatocyte suspension was distributed in 3 ml portions (5.5 and 5.1mg
protein/flask for FO and VO, respectively) between twenty-one (FO) and 42 (VO) 25 cm2
tissue culture flasks (Nunclon, Nunc A/S, Denmark), and 0.3 µCi (final fatty acid
concentration, 2 µM) of one radiolabelled fatty acid was added to three (FO) or six (VO)
flasks per suspension/dietary treatment. The fatty acids used were: [1-14C]16:0, [1-14C]18:1n-
9, [1-14C]18:2n-6, [1-14C]18:3n-3, [1-14C]20:4n-6, [1-14C]20:5n-3, and [1-14C]22:6n-3. The
fatty acids were added as a complex with FAF-BSA prepared as described previously [26].
After addition of the fatty acids the flasks were incubated for 2 hours at 20 ºC in a water bath.
After incubation, the cell layer was dislodged by gentle rocking and resuspended with a
plastic pipette. The suspension was transferred to a glass conical test tube, mixed and one ml
immediately transferred into a 2 ml microcentrifuge tube for β-oxidation assay. The
remaining suspension was further processed as described below.
2.4 Assay of hepatocyte β-oxidation activity
Radioactive acid-soluble fatty acid oxidation products and bicarbonate in the isolated
hepatocyte suspensions incubated with the different radiolabelled fatty acids were determined

7
essentially as described previously [10]. The one ml of hepatocyte suspension was
homogenised using a hand held tissue disrupter (Ultra Turrax and T8/S8N-5G probe, IKA-
Werke GmbH & Co, Staufen, Germany) and 500 µl of the homogenate transferred into a
clean 2 ml microcentrifuge tube. One hundred µl of a 6 g/ml FAF-BSA solution in water was
added and mixed well to bind non-metabolised fatty acid, before 1 ml of ice-cold 4 M
perchloric acid was added and mixed to precipitate the protein-bound non-oxidised fatty
acids. The solution was centrifuged at 3500 x g for 10 min in a microcentrifuge and 500 µl of
the supernatant was taken, mixed with 4 ml scintillation fluid (Ecoscint A, National
Diagnostics, Atlanta GA) and radioactivity determined in a TRI-CARB 2000CA scintillation
counter (United Technologies Packard, U.K.). Results were corrected for counting efficiency
and quenching of 14C.
2.5 Assay of hepatocyte fatty acyl desaturation/elongation activities
The remaining 2 ml of the hepatocyte suspension was centrifuged at 500 x g for 2 min.
The supernatant was removed into a 15 ml glass test tube and 10 ml of ice-cold
chloroform/methanol (2:1, by vol.) containing 0.01% (w/v) butylated hydroxytoluene (BHT)
was added and total lipid extracted as described by Folch et al. [27]. The analysis of
distribution of radioactivity in lipids recovered from the medium is described below. To the
cell pellet, 5 ml of ice-cold chloroform/methanol (2:1, by vol.) containing 0.01% (w/v) BHT
was added for total lipid extraction as described in detail previously [28]. Fatty acid methyl
esters were prepared from half of the extracted total lipid by acid-catalyzed transesterification
as described by Christie [29] and methyl esters extracted and purified as described previously
[30]. The methyl esters were redissolved in 100 µl hexane containing 0.01% BHT and applied
to 2 cm streaks to thin-layer chromatography plates impregnated with silver nitrate as
described previously [31]. The plates were developed in toluene/acetonitrile (95:5, v/v) to 1
cm from the top. The radioactive bands were located by autoradiography with Kodak MR2 X-
8
ray film for 7 days at room temperature. Areas of silica corresponding to individual fatty acids
or fatty acid groups were scraped from the plate into mini vials containing 2.5 ml of
scintillation fluid and radioactivity determined as described above. The remaining total lipid
extracted from the cells was analysed as described below.
2.6 Assay of incorporation of radiolabelled fatty acids into lipid classes
The total lipids extracted both from the medium and from the remaining portion of the
cell pellets were analysed to determine the distribution of radioactivity from the different
radiolabelled fatty acids in lipid classes. The total lipid extracts were resuspended in
chloroform/methanol (2:1, v/v) and 10 µl portions used for separation of lipid classes by
single dimension double development high performance thin-layer chromatography (HPTLC).
The lipid extracts were applied as 1 cm streaks onto HPTLC plates, and the plates developed
for the first 5.5 cm in methyl acetate/isopropanol/chloroform/methanol/0.25% aqueous KCl
(25/25/25/10/9, by vol.). The plate was then vacuum desiccated briefly in order to remove
solvent before being developed in isohexane/diethyl ether/acetic acid (85/15/1, by vol.) to
within 0.5 cm of the top. After air drying for 15 min, the separated lipid classes were
visualised by placing the plate in a tank saturated with iodine vapour. The areas corresponding
to the individual lipid classes were marked and scraped individually into mini-vials, 2.5 ml
scintillation fluid added and radioactivity determined as described above.
2.7 Materials
All radiolabelled fatty acids (50-55 mCi mmol-1) were purchased from NEN (NEN Life
Science Products UK Ltd, Stevenage, UK) except for [1-14C]22:6n-3 which was obtained
from American Radiolabeled Chemicals Inc. (Laborel, Oslo, Norway). BHT, collagenase
(Type IV), FAF-BSA, glutamine, HBSS, HEPES buffer, Medium-199, silver nitrate and
perchloric acid were obtained from Sigma Chemical Co. (Poole, UK). TLC (20 x 20 cm x
9
0.25 mm) and HPTLC (10 x 10 cm x 0.15 mm) plates, precoated with silica gel 60 (without
fluorescent indicator) were obtained from Merck (Darmstadt, Germany). All solvents were of
HPLC grade and were obtained from Fisher Scientific UK, Loughborough, England.
2.8 Statistical analysis
All data are presented as means ± SEM (n = 3, 6 or as otherwise stated). Differences
between fatty acids were analysed by one-way ANOVA followed by Tukey post hoc test. To
determine differences between the diets the t-test was used. All statistical analyses were
performed using STATISTICA 6.1 software. Differences were regarded as significant when
P<0.05 [32].
3. Results
3.1 Diets
The VO blend was formulated in order to duplicate the total amount of saturated,
monounsaturated and PUFA in the FO diet. This was accomplished, however, the individual
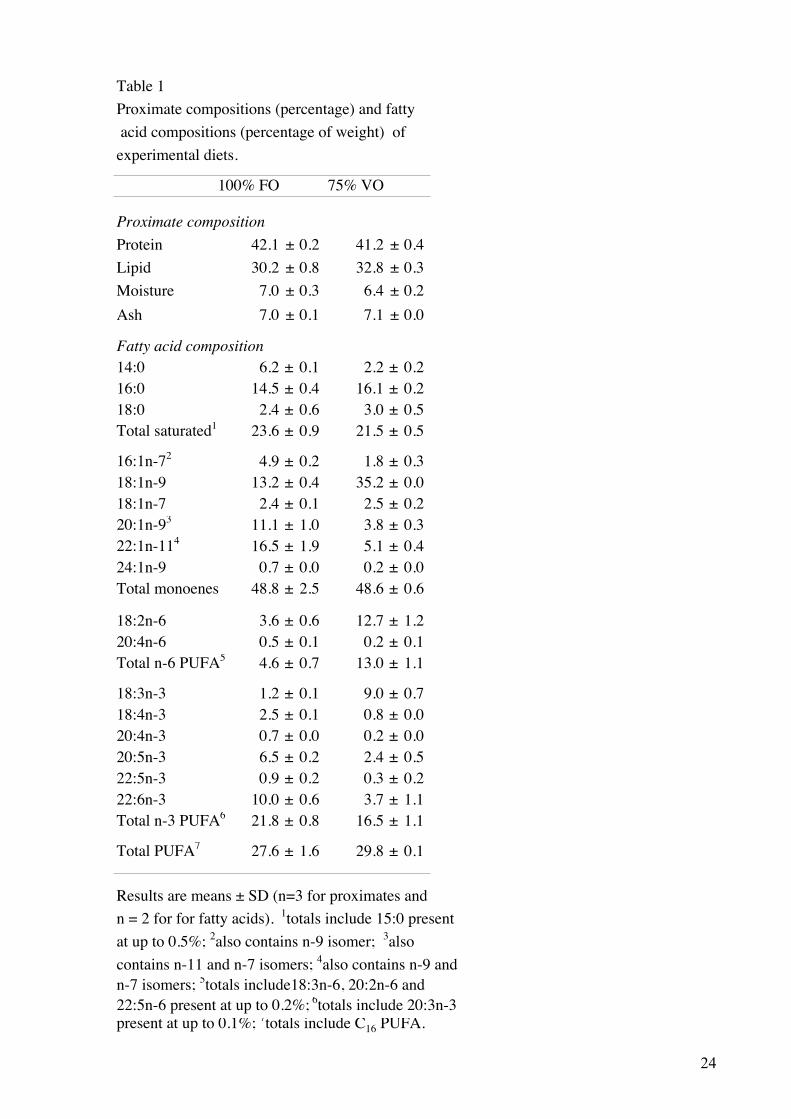
fatty acids differed between the diets (Table 1). Replacing the FO with VO, increased the
percentage of 18:1n-9 2.7-fold, whereas the amounts of 20:1n-9 and 22:1n-11 were decreased.
In addition, the proportions of 18:2n-6 and 18:3n-3 increased 3.5- and 7.5-fold, respectively,
whereas the amount of 20:5n-3 and 22:6n-3 decreased by 63%.
3.2 Uptake of fatty acids into hepatocytes
Uptake was measured as the sum of all radioactivity recovered in cellular lipids,
esterified lipids in the medium (i.e. not including free fatty acids) and acid soluble products.
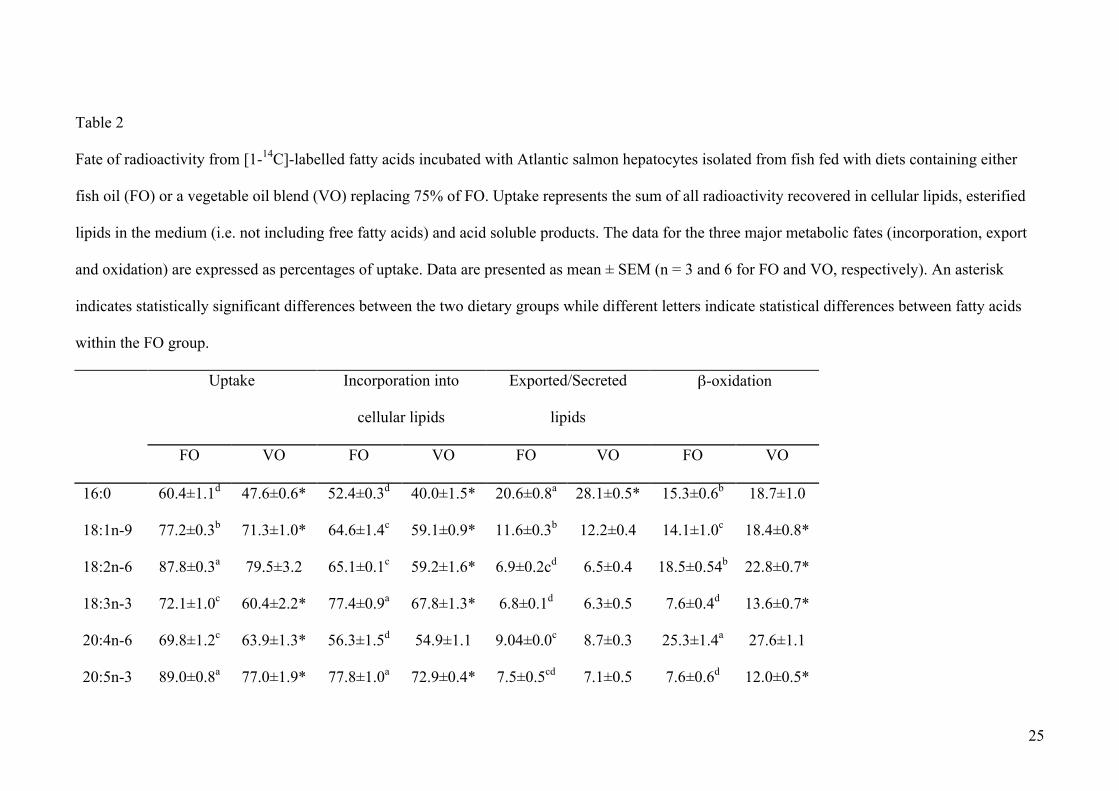
Uptake into the hepatocytes ranged between 60 and 89% for the different fatty acids (Table
2). Uptake was greatest with [1-14C]20:5n-3 and [1-14C]18:2n-6 and lowest with [1-14C]16:0.

10
In hepatocytes from fish fed VO, the uptake of almost all the fatty acids was significantly
lower than in hepatocytes from fish fed FO (Table 2). The breakdown of the fate of fatty acids
taken up by the hepatocytes (incorporation into cellular lipids, export or oxidation) are
presented relative to uptake in order to eliminate influence of differences in uptake. These
data were based on absolute recoveries (dpm) in the different fractions and show 90-95%
recovery of total radioactivity.
3.3 Incorporation into hepatocyte cell lipids
The greatest portion of fatty acid taken up by the hepatocytes was incorporated into
cellular lipids (Table 2). The level of incorporation was highest with [1-14C]20:5n-3 and [1-
14C]18:3n-3 with the lowest incorporation observed with [1-14C]16:0. Again, the
incorporation of fatty acids into cell lipids was significantly lower in fish fed VO compared to
the fish fed FO (Table 2).
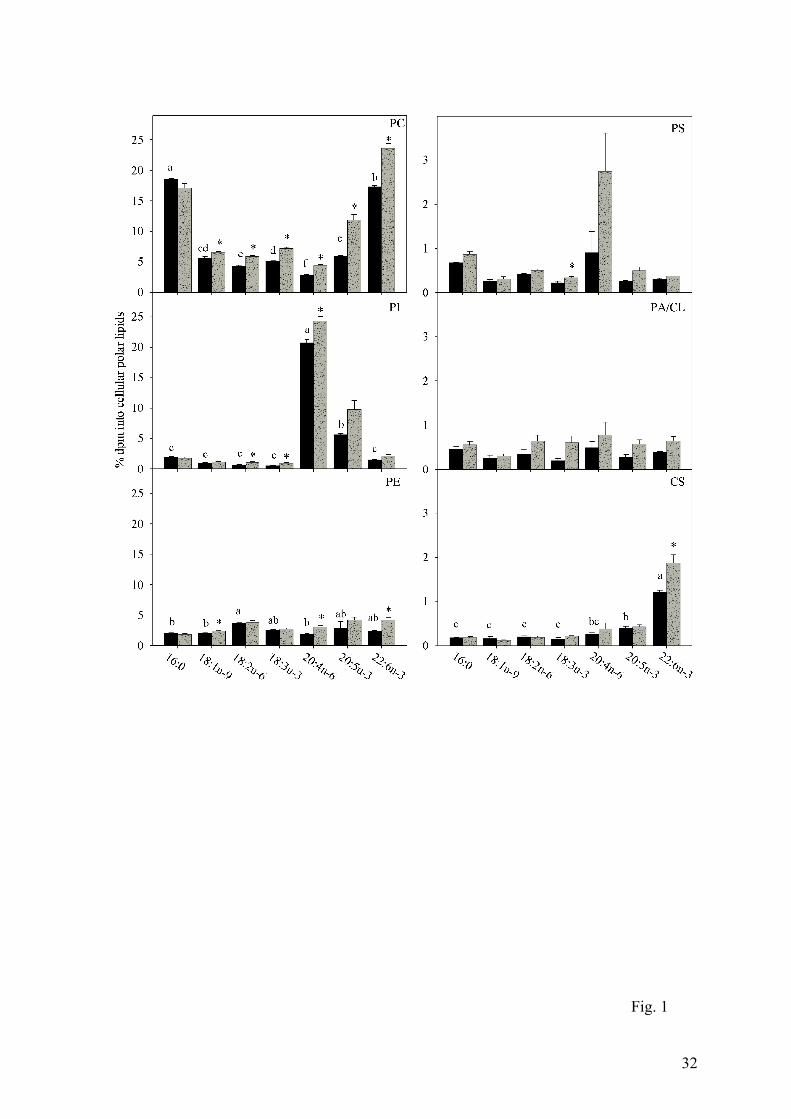
Within the PLs, fatty acids in general were incorporated predominantly into
phosphatidylcholine (PC), ranging from 2.8% to 16.6% of the total taken up by hepatocytes
from fish fed FO, followed by phosphatidylethanolamine (PE), phosphatidylinositol (PI), and
phosphatidylserine (PS) (Fig.1). The highest incorporations into PC were observed with [1-
14C]16:0 and [1-14C]22:6n-3, with [1-14C]20:4n-6 showing the significantly lowest
incorporation. In contrast, [1-14C]20:4n-6 showed highly specific incorporation into PI as did
[1-14C]20:5n-3 to a lesser extent. Within PE, the highest amount of radioactivity incorporated
was with [1-14C]18:2n-6, whereas in cerebrosides highest recovery was found with [1-
14C]22:6n-3. Incorporation into PS and phosphatidic acid/cardiolipin (PA/CL) was low and
there were no significant differences between the incorporation of different fatty acids.
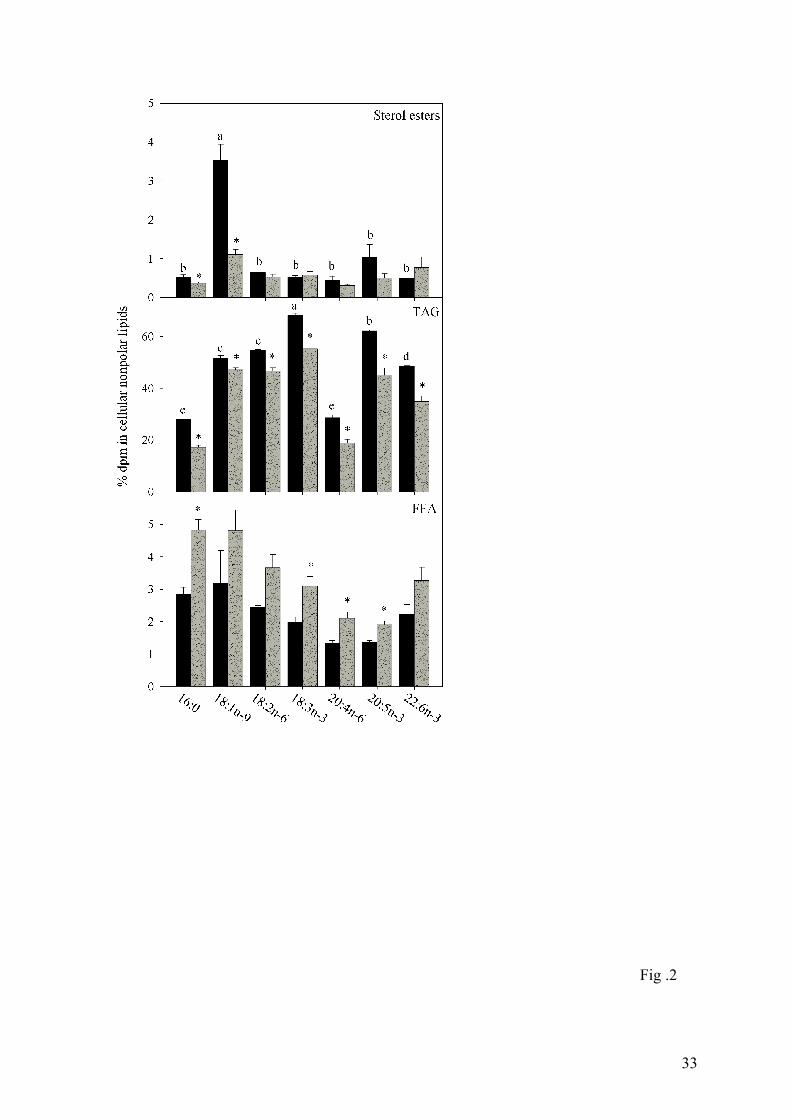
Irrespective of fatty acid, the greatest portion was always incorporated into TAG, varying
from 68% of radioactivity from [1-14C]18:3n-3 to around 28-29 % with [1-14C]16:0 and [1-
14C]20:4n-6 (Fig.2). From 1.3 to 3.1% of fatty acid taken up by hepatocytes from fish fed FO,
11
remained within the free fatty acid fraction (Fig. 2). Only [1-14C]18:1n-9 was incorporated
into steryl esters to any extent (Fig. 2).
Diet had a clear effect on the distribution of fatty acids in cellular lipids. Feeding salmon
75% VO led to generally increased incorporation of fatty acids, other than [1-14C]16:0, into
PC, PE and PI (Fig. 1), and significant lower incorporation into TAG (Fig.2). There were few
significant effects of diets on incorporation of fatty acids into PS, PA/CL, cerebrosides, steryl
esters and free fatty acids (Figs.1 and 2).
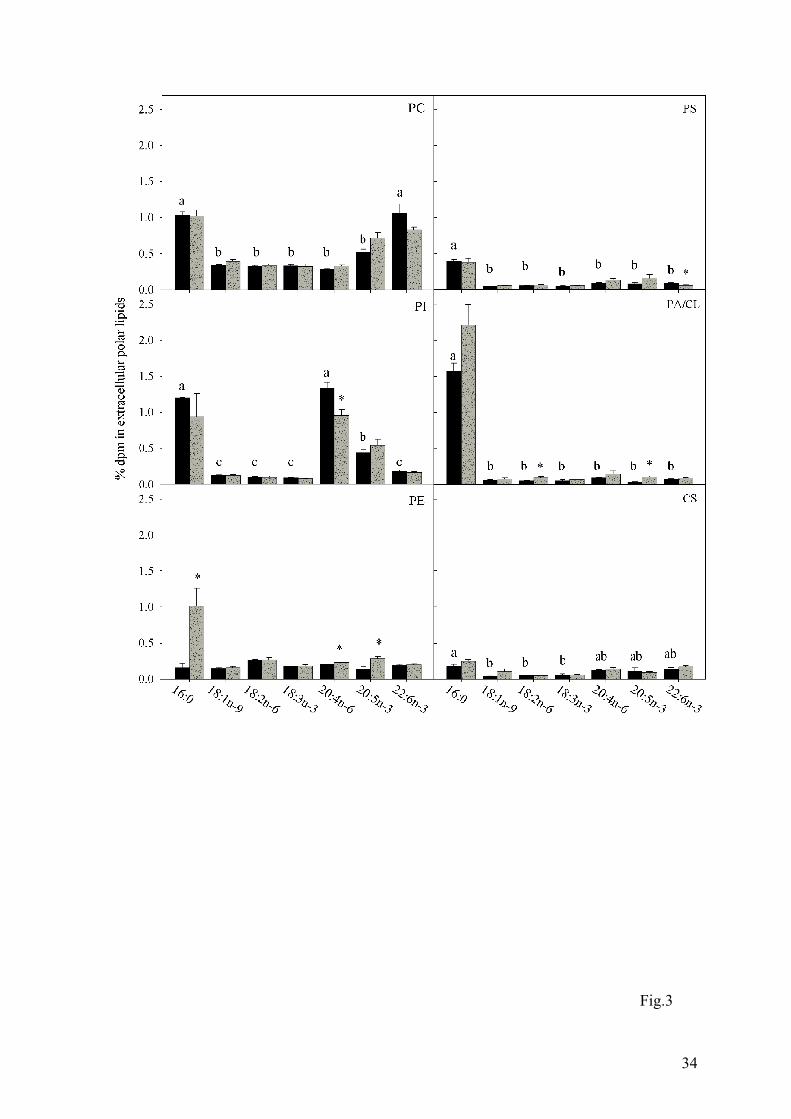
3.4 Recovery of radioactivity in extracellular (exported) lipids
Radioactivity in the medium was predominantly recovered as free fatty acid, largely
representing exogenously added fatty acid that was not taken up by the cells, and is
represented in Table 2 as the difference between the figure for uptake and 100% (Table 2).
However, a significant amount of radioactivity in the medium was recovered in other lipid
classes, shown in Table 2 as “exported/secreted”, indicating that it represents fatty acids that
have been taken up by the cell and secreted back into the medium as PLs or neutral lipids.
Significantly more [1-14C]16:0 and [1-14C]18:1n-9 were exported from the cells than any of
the PUFA (Table 2). Specifically, [1-14C]16:0 was distributed predominantly in the PLs and
thus was the major labelled fatty acid found in PC, PE, PS, PA/CL, and cerebrosides. (Fig.3).
Other than [1-14C]16:0, there was virtually no significant difference between any of the fatty
acids in terms of recovery in PE, PS, PA/CL and cerebrosides, but PC was characterised by
having the higher levels of recovery of radioactivity from [1-14C]22:6n-3, and PI was rich in
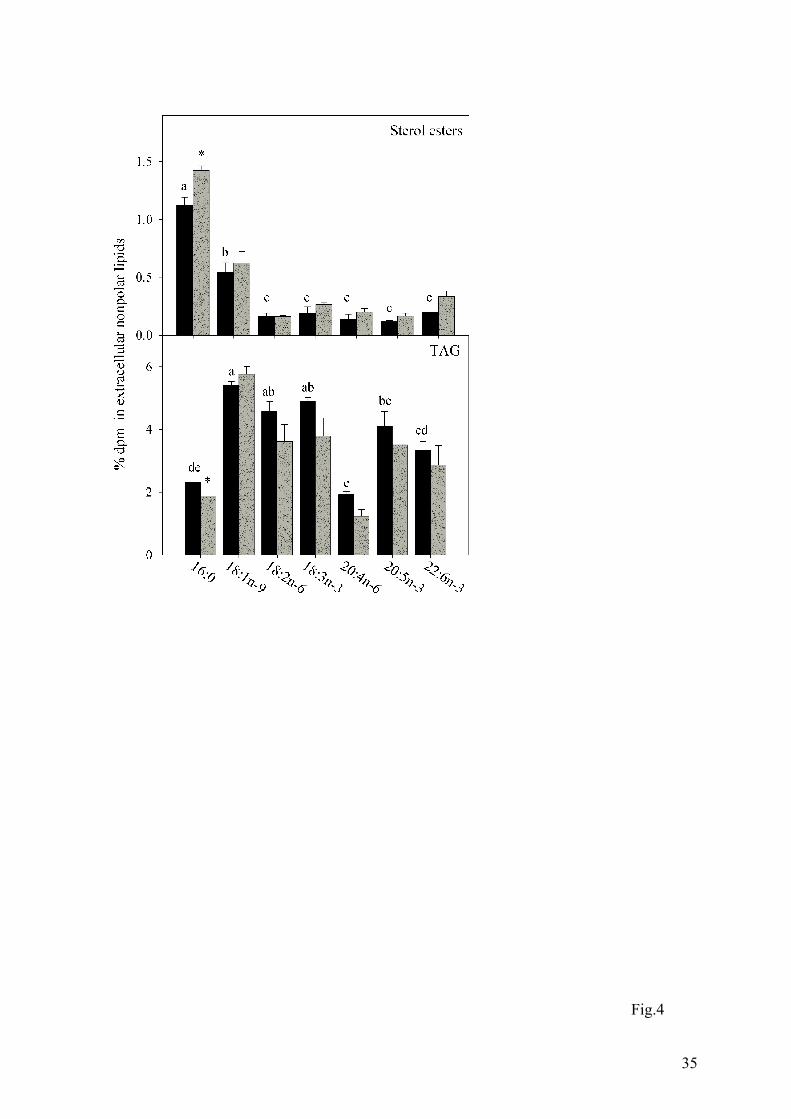
radioactivity from [1-14C]20:4n-6 and [1-14C]20:5n-3 (Fig.3). In contrast, [1-14C]18:1n-9 was
recovered mainly in TAG which was the lipid class in which most radioactivity was recovered
for all fatty acids other than [1-14C]16:0 and [1-14C]20:4n-6 (Fig.4). Steryl esters were
characterised by relatively high levels of radioactivity recovered from both [1-14C]16:0 and
[1-14C]18:1n-9 (Fig.4).
12
Diet had relatively few effects on the recovery of radioactivity in exported lipid classes.
There was significantly more [1-14C]16:0 exported from hepatocytes from salmon fed the VO
diet, which could be seen by an increased recovery in most of the lipids classes (Table 2, Figs.
3 and 4).
3.5 Fatty acid oxidation
Approximately 8 to 25% of the radioactivity taken up by hepatocytes from fish fed FO
was recovered in acid soluble (oxidation) products (Table 2). The rank order for recovery of
radioactivity in acid soluble products was [1-14C]20:4n-6 > [1-14C]18:2n-6 = [1-14C]16:0 > [1-
14C]18:1n-9 > [1-14C]22:6n-3 = [1-14C]18:3n-3 = [1-14C]20:5n-3. Feeding dietary VO
increased the recovery of radioactivity as acid soluble products from [1-14C]18:1n-9, [1-
14C]18:2n-6, [1-14C]18:3n-3 and [1-14C]20:5n-3 (Table 2).
3.6 Fatty acid conversions
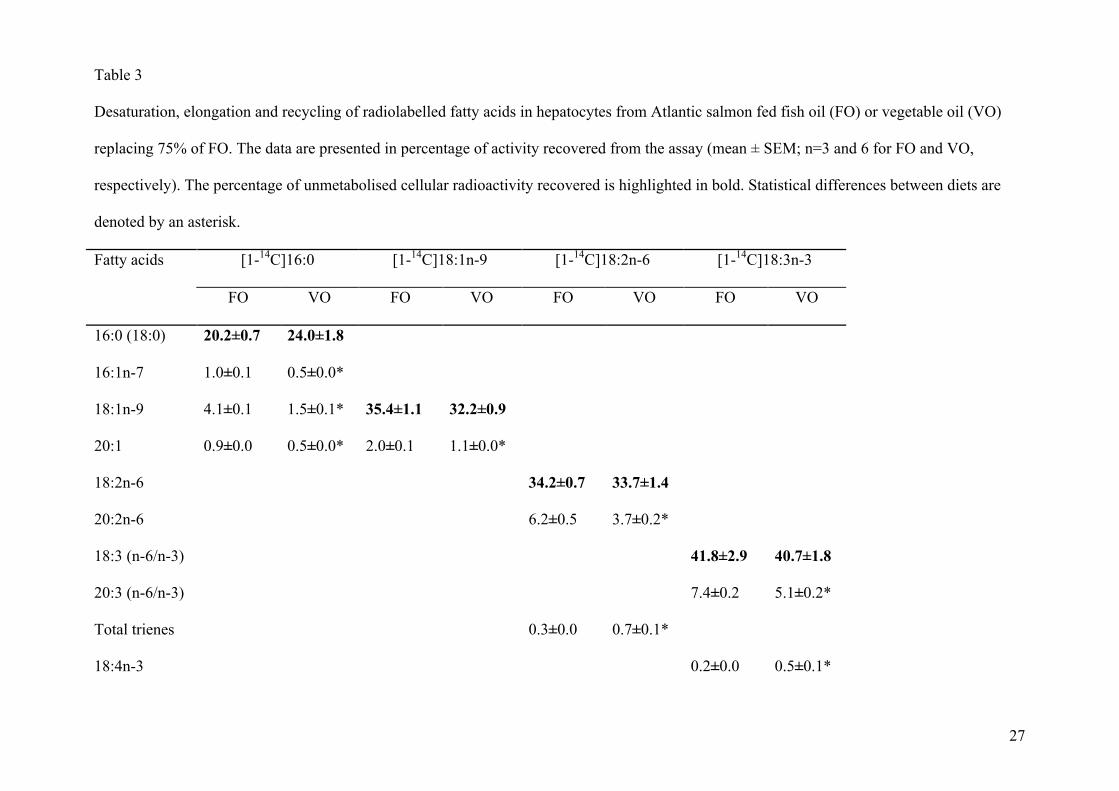
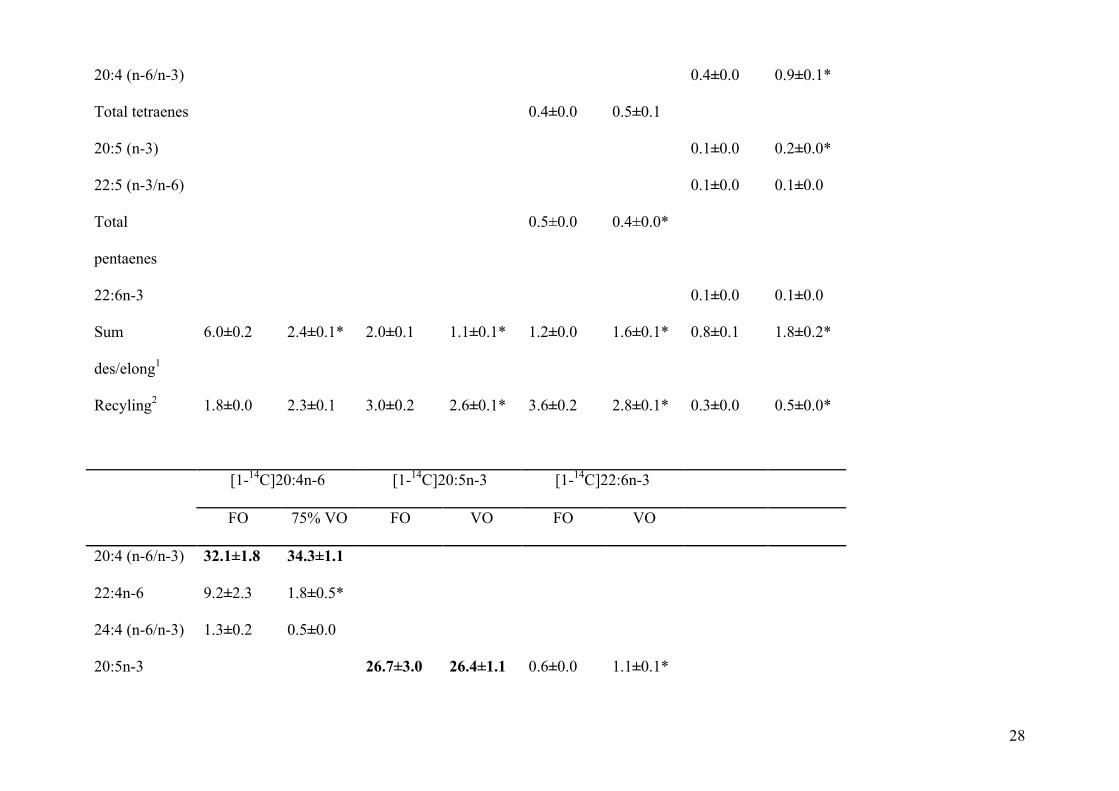
About 16% of cellular [1-14C]20:5n-3 was elongated to 22:5n-3 with a small amount
further metabolised to 22:6n-3, and 9.2% of [1-14C]20:4n-6 was elongated to 22:4n-6 (Table
3), Approximately 2% of [1-14C]22:6n-3 was recovered as 24:6n-3, most likely the result of
direct elongation of 22:6n-3, and about 1-1.5% was retroconverted to 20:5n-3 with some
recovery also in 22:5n-3 (Table 3). Conversion of [1-14C]16:0 and [1-14C]18:1n-9 was
primarily by elongation and desaturation to 18:1n-9 and 20:1n-9, respectively. Only small
percentages of [1-14C]18:2n-6 and [1-14C]18:3n-3 were desaturated in hepatocytes from fish
fed FO, with the majority of their metabolism being by elongation to the “dead-end” products
20:2n-6 and 20:3n-3. However, desaturation of [1-14C]18:2n-6 and [1-14C]18:3n-3 was
increased in hepatocytes from fish fed VO and conversion to dead end products reduced
(Table 3). In contrast, metabolic conversions of the other fatty acids by the
desaturation/elongation pathways were generally significantly reduced in fish fed VO. For all
13
the fatty acids, a small amount of radioactivity was recovered in fatty acid products that could
only have arisen through recycling with the highest recovery of recycling from [1-14C]18:2n-
6. That is, upon one round of oxidation of [1-14C]-labelled fatty acids, radioactivity can enter
the acetyl-CoA pool, and through conversion to labelled malonyl CoA, be used in fatty acid
synthesis or elongation (Table 3).
4. Discussion
There were two major aims in this study; firstly to determine the principal metabolic
fates of different fatty acids in Atlantic salmon hepatocytes; secondly, to investigate
nutritional effects on the metabolism of the fatty acids. Results showed that each fatty acid
had their own fate inside the cell, related to the fatty acid family and series (n-3 or n-6), and
that diet had effects on lipid metabolism. The uptake of the fatty acids differed, being greatest
with [1-14C]20:5n-3 and [1-14C]18:2n-6, and lowest with [1-14C]16:0. This corresponded well
with another study on Atlantic salmon skeletal muscle cells, where more 20:5n-3 was taken
up than 18:1n-9 [33]. In contrast, the uptake of 18:2n-6 and 18:3n-3 in salmon hepatocytes
were similar [34]. However, the present study is the first report comparing overall lipid and
fatty acid metabolism in hepatocytes in such a way, and few studies have reported fatty acid
uptake of such a range of fatty acids. Whether unesterified fatty acids are taken up by the cells
through a passive uptake mechanism and thereby unregulated, or if they are transported into
the cytoplasm by plasma membrane proteins, remains to be fully elucidated. Several plasma
membrane proteins have been characterised and proposed as candidates for uptake and
transport of fatty acids including fatty acid binding protein, fatty acid translocase, caveolin,
renal fatty acid binding protein and fatty acid transport protein [35, 36]. The results of the
present study suggest that fatty acid transport is regulated and that the transporters have a
distinct selectivity for fatty acids. However, since the fatty acids used in the present study
14
ranged from saturated fatty acids to long-chain PUFA, both passive and active transport could
be involved.
Fatty acid entering a cell can either be esterified into cellular lipids or β-oxidised.
Cellular TAG is the most important storage form of fatty acids because it is the most energy
rich molecule per gram, and in the present study, fatty acids were incorporated into TAG to
the highest degree. Previously, it was shown that isolated salmon hepatocytes incorporated
85% and 80% of 18:2n-6 and 18:3n-3 into TAG, respectively, with the remainder being
incorporated into PL [9]. This is consistent with results found in the present study, where 84%
and 87% of incorporated [1-14C]18:2n-6 and [1-14C]18:3n-3 were recovered in TAG in fish
fed FO. This trend was similar for the other fatty acids, but for [1-14C]16:0 and [1-14C]22:6n-3
a more even distribution between TAG and PL was observed. Also, comparable with the
present study, Ruyter et al. [34] found a higher degree of esterification of [1-14C]18:3n-3 and
[1-14C]20:5n-3 than [1-14C]18:2n-6. There was a clear distribution of radioactivity between
the individual cellular PLs depending upon fatty acid, but generally the majority of the
radioactivity in PLs was recovered in PC, which accounts for about 50% of the PL in the cell
membranes. Molecular species composition studies have shown that 16:0/20:5 and 16:0/22:6
were the most abundant species in muscle and liver PC in fish [37]. Within the PL, recoveries
of [1-14C]16:0 and [1-14C]22:6n-3 were highest in PC, consistent with the earlier molecular
species studies. Recovery of radioactivity in PI was highest when [1-14C]20:4n-6 was
provided, followed by [1-14C]20:5n-3. This is consistent with the fatty acid composition of PI
in mammals, and fish. being rich in 20:4n-6 and 20:5n-3 [38, 39], giving rise to the suggestion
that this PL maybe involved in eicosanoid metabolism in fish [40-42].
The β-oxidation reaction is located in mitochondria and peroxisomes of the cell [43-45]
and was estimated here by the recovery of products in the acid soluble fraction, representing
breakdown of fatty acids to acetyl-CoA and other small organic molecules. From around 8%
to 25% of the fatty acids taken up by the hepatocytes were oxidised in salmon fed FO,
15
consistent with previous results [46]. However, Ruyter and Thomassen [9] found that only 2-
5% of supplemented 18:2n-6 and 18:3n-3 were oxidised by salmon hepatocytes, and there
were no major differences between the fatty acids. In the present study, n-6 fatty acids gave
the highest recovery of radioactivity in the acid soluble fraction, with β-oxidation of [1-
14C]18:1n-9 showing an intermediate rate, and n-3 fatty acids being the least oxidised. Several
previous studies have shown that MUFA are generally good substrates for β-oxidation in fish
[4, 5, 47]. Furthermore, in a previous study in which salmon were fed increasing levels of
rapeseed oil, low retention of MUFA, 18:2n-6 and 18:3n-3 were observed in the fillet,
suggesting that all of these fatty acids were readily available for oxidation [2]. Although few
studies have compared the relative rates of β-oxidation of such a range of fatty acids in one
study, where published studies have used similar fatty acids, the results are comparable with
those in the present study [4, 5, 47]. Generally speaking though, little attention has been given
to n-6 fatty acids when dealing with energy production in hepatocytes as, normally, fish diets
based on FO do not contain large amounts of n-6 fatty acids. But, with increasing levels of
VO being used in fish diets, the amount of total n-6 fatty acids increases substantially, largely
due to 18:2n-6, a predominant fatty acid of many VOs. Therefore, there is increasing interest
in the metabolism of n-6 fatty acids in fish, not only in terms of essential fatty acids, but also
in terms of energy provision.
Feeding salmon VO had a clear effect on uptake of the fatty acids, resulting in more
radioactivity recovered as free fatty acids in the medium i.e. lower uptake. Obviously, feeding
VO changes the fatty acid composition of the tissue cell membranes and this could affect
uptake processes, but the precise mechanism for this effect requires further study [2, 13, 48].
As well as reducing uptake, a lower proportion of the fatty acids taken up were esterified into
cellular lipids when salmon were fed VO. In addition there was relatively lower incorporation
into TAG and relatively more incorporation into PL. This result of feeding VO may be
determined by the effects on β-oxidation. By replacing 75% of the dietary FO with VO,

16
hepatic β-oxidation for all fatty acids was increased, particularly so for [1-14C]18:1n-9, [1-
14C]18:2n-6, [1-14C]18:3n-3 and [1-14C]20:5n-3. As discussed above, the incorporation of
fatty acids into TAG in hepatocytes was reduced by feeding VO, thus it appears that by
feeding salmon VO, more of the fatty acids taken up by the hepatocytes are directed towards
β-oxidation rather being incorporated into TAG. Previous studies in mammals have shown
that little of the stored TAG in the cell is mobilised for oxidation, suggesting that the major
source of fatty acids for oxidation is extra cellular fatty acids [17]. In the present salmon
study, less n-6 fatty acids were esterified and more oxidised, whereas n-3 fatty acids were
generally more esterified.
In a recent study measuring the β-oxidation capacity in muscle and liver homogenates
and the effects of rapeseed and olive oils, no major differences in β-oxidation capacity were
found in liver [49]. The results from the present study appear to show contrary results.
However, two very different things are being measured in the two studies. In the present study
with intact cells, free fatty acids are supplied to cells which retain their full architecture with
all associated different metabolic pools that the fatty acid may enter, directing it towards
different specific metabolic pathways or fates as determined by the physiology of the cell.
When measuring the β-oxidation capacity in tissue homogenates, the cell architecture is
destroyed along with many of the normal metabolic pools leaving an organelle fraction. The
fatty acid substrate is also provided as a CoA-derivative, and thus any specificity of the
activation step is removed. In addition, the conditions for measuring β-oxidation in
homogenates are optimised so total capacity of the system can be determined, meaning excess
co-factors and substrate are also supplemented and only the enzymes are the limiting factor
[49]. When measuring metabolic pathways in cell studies one must consider that the
regulation might be constituted at several levels and/or the conditions are not optimised for
any specific pathway. Given these differences in measuring β-oxidation in cells and
homogenates, one might speculate that the differences in results regarding the present cell

17
study and the earlier homogenate study by Stubhaug et al. [49] may be at the level of fatty
acid uptake and/or intracellular transport rather than directly at the level of the β-oxidation
enzymes [46].
Liver is the interface between exogenous and endogenous transport of lipids. Exogenous
transport involves transport of chylomicrons from the intestine to liver, and VLDL from liver
to peripheral tissues, whereas endogenous transport is that of mobilised fatty acids and high
density lipoproteins from peripheral tissues to the liver [20, 50]. Several studies have reported
decreased VLDL-production and serum TAG concentrations after feeding FO. [51, 52]. It has
been shown that 20:5n-3 inhibits hepatic synthesis of TAG, thereby lowering the secretion of
TAG, whereas 18:1n-9 stimulated the synthesis and secretion of TAG [21, 22]. Perhaps
consistent with this, the highest recovery of radioactivity in exported lipids in the present
study was observed when salmon hepatocytes were incubated with [1-14C]16:0 and [1-
14C]18:1n-9. Expressed relative to uptake, the recovery of radioactivity in exported lipids was
only higher in salmon fed VO when incubated with [1-14C]16:0, but the absolute data, upon
which the data in Table 2 are based, showed that VO feeding decreased the export of fatty
acids from the hepatocytes but, other than with 16:0, this was entirely due to decreased uptake
rather than a specific effect on export.
Enzymatic activity of desaturation and elongation of fatty acids has been studied
extensively in fish [8, 10, 13, 34, 48, 53]. It has been shown in a number of studies that
desaturation and elongation of 18:3n-3 is increased in both hepatocytes and enterocytes from
fish fed VO compared to FO [8, 10, 13, 48]. Comparable with this, desaturation and
elongation of both [1-14C]18:2n-6 and [1-14C]18:3n-3 were increased in the present study in
hepatocytes from fish fed VO compared to FO. Expression of desaturase and elongase genes
has recently been shown to be under nutritional regulation in salmon and both appear
upregulated when the fish were fed VO [14, 54]. Whether this increased expression and
thereby increased activity of long-chain PUFA synthesis is due to increased 18:3n-3 and
18
18:2n-6 substrate availability or a decrease in long-chain n-3 PUFA concentration in lipids is
still under debate [8, 14]. For most of the fatty acids used in the present trial, the major
product in fish fed FO was one elongation step. In contrast, when salmon were fed VO, the
amounts of elongation products from [1-14C]16:0, [1-14C]18:1n-9, [1-14C]20:4n-6 and [1-
14C]20:5n-3 decreased, as did the production of “dead-end” products from [1-14C]18:2n-6 and
[1-14C]18:3n-3. The precise mechanisms for these changes are not clear and may not be
effects on elongases per se, but the result of competitive effects with desaturases. For
instance, with 18:2n-6 and 18:3n-3, it appears that the upregulation of desaturase activity in
fish fed VO results in more of the fatty acid being desaturated rather than being elongated to
dead-end products. Decreased expression of ∆9 desaturase (responsible for the desaturation of
16:0 and 18:0) has been found in salmon fed rapeseed oil (A.E.O. Jordal, personal
communication), and this could partly explain lower amounts of desaturation and elongation
products of 16:0 in fish fed VO in the present trial. However, it could be speculated that the
affinity of elongase and/or desaturase enzymes toward fatty acids is affected by dietary VO,
perhaps due to changes in membrane fatty acid composition. There appeared to be little
difference in desaturation/elongation of [1-14C]18:2n-6 and [1-14C]18:3n-3 in the present
study. Previous studies measuring the desaturation and elongation activity of these two fatty
acids have found that elongases and desaturases have a higher affinity towards n-3 fatty acids
than n-6 fatty acids [6, 7]. It was noteworthy that when the hepatocytes were incubated with
[1-14C]18:2n-6, a relative large amount of radioactivity was recovered in products that could
only originate from recycling of acetyl-CoA (derived from one β-oxidation cycle of 18:2n-6)
into biosynthesis of fatty acids. This further supports the higher level of β-oxidation observed
with [1-14C]18:2n-6 as noted above.
In summary, pathways of lipid metabolism in salmon hepatocytes showed specificity
towards fatty acids at almost every level. Selectivity was apparent at the level of uptake of the
fatty acids across the cell membrane, incorporation into the different PL and β-oxidation of
19
fatty acids. The secondary aim, to investigate nutritional effects on lipid metabolism, was also
achieved. Feeding Atlantic salmon VO as a replacement for dietary FO, affected various
aspects of lipid metabolism, with reduced uptake of fatty acids and increased proportions of
the fatty acids being β-oxidised rather than incorporated into cellular lipids.
Acknowledgements
The present study has been funded by the European Union (Researching alternatives to fish
oil in aquaculture, RAFOA, QLRT-2000-30058) as part of the Fifth Framework Programme.
This work was also supported in part through an award to IS from the European Union Access
to Research Infrastructures (ARI) Action of the Improving Human Potential (IHP)
Programme (contract HPRI-CT-2001-00180). Also, thanks to Anthony Oxley for assistance in
the laboratory.
20
References
[1] R.J. Henderson, Fatty acid metabolism in freshwater fish with particular reference to polyunsaturated fatty acids, Arch. Anim. Nutr. 49 (1996) 5-22.
[2] B.E. Torstensen, L. Froyland, O. Lie, Replacing dietary fish oil with increasing levels of rapeseed oil and olive oil - effects on Atlantic salmon (Salmo salar L.) tissue and lipoprotein lipid composition and lipogenic enzyme activities, Aquacult. Nutr. 10 (2004) 175-192.
[3] E.L. Crockett, B.D. Sidell, Substrate selectivities differ for hepatic mitochondrial and peroxisomal b-oxidation in an Antarctic fish, Notothenia gibberifrons, Biochem. J. 289 (1993) 427-433.
[4] R.J. Henderson, J.R. Sargent, Chain-length specificities of mitochondrial and peroxisomal β-oxidation of fatty acids in livers of rainbow trout (Salmo gairdneri), Comp. Biochem. Physiol. 82B (1985) 79-85.
[5] B.D. Sidell, E.L. Crockett, W.R. Driedzic, Antarctic fish tissues preferentially catabolize monoenoic fatty acids, J. Exp. Zool. 271 (1995) 73-81.
[6] D.R. Tocher, J.R. Dick, Polyunsaturated fatty acid metabolism in cultured fish cells: Incorporation and metabolism of (n-3) and (n-6) series acids by Atlantic salmon (Salmo salar) cells, Fish. Physiol. Biochem. 8 (1990) 311-319.
[7] J.R. Sargent, D.R. Tocher, G.J. Bell. The lipids, in Halver, J.E., Hardy, R.W., (eds.) Fish Nutrition, Academic Press, San Diego 2002, pp. 181-257.
[8] D.R. Tocher, J. Fonseca-Madrigal, J.R. Dick, W.K. Ng, J.G. Bell, P.J. Campbell, Effects of water temperature and diets containing palm oil on fatty acid desaturation and oxidation in hepatocytes and intestinal enterocytes of rainbow trout (Oncorhynchus mykiss), Comp. Biochem. Physiol. 137B (2004) 49-63.
[9] B. Ruyter, M.S. Thomassen, Metabolism of n-3 and n-6 fatty acids in Atlantic salmon liver: Stimulation by essential fatty acid deficiency, Lipids 34 (1999) 1167-1176.
[10] D.R. Tocher, J. Fonseca-Madrigal, J.G. Bell, J.R. Dick, R.J. Henderson, J.R. Sargent, Effects of diets containing linseed oil on fatty acid desaturation and oxidation in hepatocytes and intestinal enterocytes in Atlantic salmon (Salmo salar), Fish. Physiol. Biochem. 26 (2002) 157-170.
[11] D.R. Tocher, Metabolism and functions of lipids and fatty acids in teleost fish, Rev. Fish. Sci. 11 (2003) 107-184.
[12] J.G. Bell, J. McEvoy, D.R. Tocher, F. McGhee, P.J. Campbell, J.R. Sargent, Replacement of fish oil with rapeseed oil in diets of Atlantic salmon (Salmo salar) affects tissue lipid compositions and hepatocyte fatty acid metabolism, J. Nutr. 131 (2001) 1535-1543.
[13] D.R. Tocher, J.G. Bell, P. MacGlaughlin, F. McGhee, J.R. Dick, Hepatocyte fatty acid desaturation and polyunsaturated fatty acid composition of liver in salmonids: Effects of dietary vegetable oil, Comp. Biochem. Physiol. 130B (2001) 257-270.
21
[14] X.Z. Zheng, D.R. Tocher, C.A. Dickson, J.G. Bell, A.J. Teale, Effects of diets containing vegetable oil on expression of genes involved in highly unsaturated fatty acid biosynthesis in liver of Atlantic salmon (Salmo salar), Aquaculture 236 (2004) 467-483.
[15] R.W. Hardy, Alternatives to fish oil, Aquacult. Mag. 27 (2001) 49-54.
[16] P.M. Kris-Etherton, W.S. Harris, L.J. Appel, Fish consumption, fish oil, omega-3 fatty acids, and cardiovascular disease, Arterioscler. Thromb. Vasc. Biol. 23 (2003) E20-E31.
[17] G.F. Gibbons, K. Islam, R.J. Pease, Mobilisation of triacylglycerol stores, Biochim. Biophys. Acta.1483 (2000) 37-57.
[18] G.F. Gibbons, D. Wiggins, A.M. Brown, A.M. Hebbachi, Synthesis and function of hepatic very-low-density lipoprotein, Biochem. Soc. T. 32 (2004) 59-64.
[19] H.A. Krebs, R. Hems, Fatty acid metabolism in perfused rat liver, Biochem. J. 119 (1970) 525-533.
[20] P.J. Babin, J.M. Vernier, Plasma lipoprotein in fish, J. Lipid Res. 30 (1989) 467-488.
[21] J.O. Nossen, A.C. Rustan, S.H. Gloppestad, S. Malbakken, C.A. Drevon, Eicosapentaenoic acid inhibits synthesis and secretion of triacylglycerols by cultured rat hepatocytes, Biochim. Biophys. Acta. 879 (1986) 56-65.
[22] A.C. Rustan, C.A. Drevon, Eicosapentaenoic acid inhibits hepatic production of very low-density lipoprotein, J. Intern. Med. 225 (1989) 31-38.
[23] B.E. Torstensen, G.J. Bell, D.R. Tocher, G. Rosenlund, J.R. Henderson, E.I. Graff, O. Lie, J.R. Sargent, Tailoring of Atlantic salmon (Salmo salar L.) flesh; lipid level, composition and sensory analysis. A life cycle feeding trial with marine oil and vegetable oil blends including a finishing diet period, J. Agr. Food Chem. Submitted (2005).
[24] D.R. Tocher, J.G. Bell, J.R. Dick, V.O. Crampton, Effects of dietary vegetable oil on Atlantic salmon hepatocyte fatty acid desaturation and liver fatty acid compositions, Lipids 38 (2003) 723-732.
[25] O.H. Lowry, N.J. Rosenbourg, A.L. Farr, R.J. Randall, Protein measurement with folin phenol reagent, J. Biol. Chem. 193 (1951) 265-275.
[26] C. Ghioni, D.R. Tocher, J.R. Sargent, The effect of culture on morphology, lipid and fatty acid composition, and polyunsaturated fatty acid metabolism of rainbow trout (Oncorhynchus mykiss) skin cells, Fish. Physiol. Biochem. 16 (1997) 499-513.
[27] J. Folch, M. Lees, G.H. Sloane-Stanley, A simple method for the isolation and purification of total lipids from animal tissues, J. Biol. Chem. 226 (1957) 497-509.
[28] D.R. Tocher, J.R. Sargent, G.N. Frerichs, The fatty acid compositions of established fish cell lines after long-term culture in mammalian sera, Fish. Physiol. Biochem. 5 (1988) 219-227.
[29] W.W. Christie, Lipid analysis, 2nd Edition., Pergamon press, Oxford, 1982.
22
[30] D.R. Tocher, D.G. Harvie, Fatty acid compositions of the major phosphoglycerides from fish neural tissues (n-3) and (n-6) polyunsaturated fatty acids in rainbow trout (Salmo gairdneri) and cod (Gadus morhua) brains and retinas, Fish. Physiol. Biochem. 5 (1988) 229-239.
[31] D.R. Tocher, J.R. Sargent, Effect of temperature on the incorporation into phospholipid classes and metabolism via desaturation and elongation of n-3 and n-6 polyunsaturated fatty acids in fish cells in culture, Lipids 25 (1990) 435-442.
[32] J.H. Zar, Biostatistical analysis, 4th Edition., Prentice Hall, New Jersey, 1998.
[33] A. Vegusdal, T.K. Østbye, T.N. Tran, T. Gjøen, B. Ruyter, b-oxidation, esterification, and secretion of radiolabeled fatty acids in cultivated Atlantic salmon skeletal muscle cells, Lipids 39 (2004) 649-658.
[34] B. Ruyter, C. Rosjo, B. Grisdale-Helland, G. Rosenlund, A. Obach, M.S. Thomassen, Influence of temperature and high dietary linoleic acid content on esterification, elongation, and desaturation of PUFA in Atlantic salmon hepatocytes, Lipids 38 (2003) 833-840.
[35] P.D. Berk, D.D. Stump, Mechanisms of cellular uptake of long chain free fatty acids, Mol. Cell. Biochem. 192 (1999) 17-31.
[36] T. Hajri, N.A. Abumrad, Fatty acid transport across membranes: Relevance to nutrition and metabolic pathology, Annu. Rev. nutr. 22 (2002) 383-415.
[37] M.V. Bell, J.R. Dick, Molecular species composition of the major diacyl glycerophopholipids from muscle, liver, retina and brain of cod (Gadus morhua), Lipids 26 (1991) 565-573.
[38] M.V. Bell, J.R. Dick, Molecular species composition of phosphatidylinositol from the brain, retina, liver and muscle for cod (Gadus morhua), Lipids 25 (1990) 691-694.
[39] R.F. Irvine, How is the level of free arachidonic-acid controlled in mammalian-cells, Biochem. J. 204 (1982) 3-16.
[40] J.G. Bell, D.R. Tocher, J.R. Sargent, Effect of supplementation with 20/3(n-6), 20/4(n-6) and 20/5(n-3) on the production of prostaglandin-E and prostaglandin-F of the 1-series, 2-series and 3-series in turbot (Scophthalmus maximus) brain astroglial cells in primary culture, Biochim. Biophys. Acta. 1211 (1994) 335-342.
[41] M.V. Bell, J.R. Henderson, J.R. Sargent, The role of polyunsaturated fatty acids in fish, Comp. Biochem. Physiol. 83B (1986) 711-719.
[42] P.J. Marshall, D.E. Boatman, L.E. Hokin, Direct demonstration of the formation of prostaglandin-E2 due to phosphatidylinositol breakdown associated with stimulation of enzyme secretion in the pancreas, J. Biol. Chem. 256 (1981) 844-847.
[43] G. Small, M. Connock, Palmitoyl-CoA oxidase in goldfish (Carassius auratus): detection in several tissues and subcellular location in intestinal peroxisomes, Comp. Biochem. Physiol. 68B (1981) 151-153.
23
[44] G.P. Mannaerts, L.J. Debeer, J. Thomas, P.J. De Schepper, Mitochondrial and peroxisomal fatty acid oxidation in liver homogenates and isolated hepatocytes from control and clofibrate-treated rats, J. Biol. Chem. 11 (1979) 4585-4595.
[45] E.C. Foerster, F. Fährenkemper, U. Rabe, P. Graf, H. Sies, Peroxisomal fatty acid oxidation as detected by H2O2 production in intact perfused rat liver., Biochem. J. 196 (1981) 705-712.
[46] B.E. Torstensen, I. Stubhaug, β-oxidation of 18: 3n-3 in Atlantic salmon (Salmo salar L.) hepatocytes treated with different fatty acids, Lipids 39 (2004) 153-160.
[47] K.H. Kiessling, A. Kiessling, Selective utilization of fatty acids in rainbow trout (Oncorhynchus mykiss Walbaum) red muscle mitochondria, Can. J. Zool. 71 (1993) 248-251.
[48] D.R. Tocher, J.G. Bell, J.R. Dick, J.R. Sargent, Fatty acyl desaturation in isolated hepatocytes from Atlantic salmon (Salmo salar): Stimulation by dietary borage oil containing g-linolenic acid, Lipids 32 (1997) 1237-1247.
[49] I. Stubhaug, L. Frøyland, B.E. Torstensen, β-oxidation capacity of red and white muscle and liver in Atlantic salmon (Salmo salar L.) - Effects of increasing dietary levels of rapeseed oil (0-100 %) and olive oil (50 %) in replace to capelin oil, Lipids 40 (2005) 39-47.
[50] M.A. Sheridan, Lipid dynamics in fish: Aspects of absorption, transportation, deposition and mobilization, Comp. Biochem. Physiol. 90B (1988) 679-690.
[51] W.S. Harris, W.E. Connor, M.P. McMurray, The comparative reductions of the plasma lipids and lipoproteins by dietary polyunsaturated fats: salmon oil versus vegetable oils, Metabolism 32 (1883) 179-184.
[52] D.R. Illingworth, W.S. Harris, W.E. Connor, Inhibition of low density lipoprotein synthesis by dietary omega-3 fatty acids in humans, Arteriosclerosis 4 (1984) 270-275.
[53] B. Ruyter, C. Røsjø, K. Måsøval, O. Einen, M.S. Thomassen, Influence of dietary n-3 fatty acids on the desaturation and elongation of [1-14C]18:2n-6 and [1-14C]18:3n-3 in Atlantic salmon hepatocytes, Fish. Physiol. Biochem. 23 (2000) 151-158.
[54] X. Zheng, B.E. Torstensen, D.R. Tocher, J.R. Dick, J.R. Henderson, G.J. Bell, Environmental and dietary influences on highly unsaturated fatty acid biosynthesis and expression of fatty acyl desaturase and elongase genes in liver of Atlantic salmon (Salmo salar), Biochim. Biophys. Acta. In press (2005).
24
Table 1Proximate compositions (percentage) and fatty acid compositions (percentage of weight) of experimental diets.
100% FO 75% VO
Proximate compositionProtein 42.1 ± 0.2 41.2 ± 0.4Lipid 30.2 ± 0.8 32.8 ± 0.3Moisture 7.0 ± 0.3 6.4 ± 0.2Ash 7.0 ± 0.1 7.1 ± 0.0
Fatty acid composition14:0 6.2 ± 0.1 2.2 ± 0.216:0 14.5 ± 0.4 16.1 ± 0.218:0 2.4 ± 0.6 3.0 ± 0.5Total saturated1 23.6 ± 0.9 21.5 ± 0.5
16:1n-72 4.9 ± 0.2 1.8 ± 0.318:1n-9 13.2 ± 0.4 35.2 ± 0.018:1n-7 2.4 ± 0.1 2.5 ± 0.220:1n-93 11.1 ± 1.0 3.8 ± 0.322:1n-114 16.5 ± 1.9 5.1 ± 0.424:1n-9 0.7 ± 0.0 0.2 ± 0.0Total monoenes 48.8 ± 2.5 48.6 ± 0.6
18:2n-6 3.6 ± 0.6 12.7 ± 1.220:4n-6 0.5 ± 0.1 0.2 ± 0.1Total n-6 PUFA5 4.6 ± 0.7 13.0 ± 1.1
18:3n-3 1.2 ± 0.1 9.0 ± 0.718:4n-3 2.5 ± 0.1 0.8 ± 0.020:4n-3 0.7 ± 0.0 0.2 ± 0.020:5n-3 6.5 ± 0.2 2.4 ± 0.522:5n-3 0.9 ± 0.2 0.3 ± 0.222:6n-3 10.0 ± 0.6 3.7 ± 1.1Total n-3 PUFA6 21.8 ± 0.8 16.5 ± 1.1
Total PUFA7 27.6 ± 1.6 29.8 ± 0.1
Results are means ± SD (n=3 for proximates and n = 2 for for fatty acids). 1totals include 15:0 present at up to 0.5%; 2also contains n-9 isomer; 3also contains n-11 and n-7 isomers; 4also contains n-9 andn-7 isomers; 5totals include18:3n-6, 20:2n-6 and 22:5n-6 present at up to 0.2%; 6totals include 20:3n-3 present at up to 0.1%; 7totals include C16 PUFA.
25
Table 2
Fate of radioactivity from [1-14C]-labelled fatty acids incubated with Atlantic salmon hepatocytes isolated from fish fed with diets containing either
fish oil (FO) or a vegetable oil blend (VO) replacing 75% of FO. Uptake represents the sum of all radioactivity recovered in cellular lipids, esterified
lipids in the medium (i.e. not including free fatty acids) and acid soluble products. The data for the three major metabolic fates (incorporation, export
and oxidation) are expressed as percentages of uptake. Data are presented as mean ± SEM (n = 3 and 6 for FO and VO, respectively). An asterisk
indicates statistically significant differences between the two dietary groups while different letters indicate statistical differences between fatty acids
within the FO group.
Uptake Incorporation into
cellular lipids
Exported/Secreted
lipids
β-oxidation
FO VO FO VO FO VO FO VO
16:0 60.4±1.1d 47.6±0.6* 52.4±0.3d 40.0±1.5* 20.6±0.8a 28.1±0.5* 15.3±0.6b 18.7±1.0
18:1n-9 77.2±0.3b 71.3±1.0* 64.6±1.4c 59.1±0.9* 11.6±0.3b 12.2±0.4 14.1±1.0c 18.4±0.8*
18:2n-6 87.8±0.3a 79.5±3.2 65.1±0.1c 59.2±1.6* 6.9±0.2cd 6.5±0.4 18.5±0.54b 22.8±0.7*
18:3n-3 72.1±1.0c 60.4±2.2* 77.4±0.9a 67.8±1.3* 6.8±0.1d 6.3±0.5 7.6±0.4d 13.6±0.7*
20:4n-6 69.8±1.2c 63.9±1.3* 56.3±1.5d 54.9±1.1 9.04±0.0c 8.7±0.3 25.3±1.4a 27.6±1.1
20:5n-3 89.0±0.8a 77.0±1.9* 77.8±1.0a 72.9±0.4* 7.5±0.5cd 7.1±0.5 7.6±0.6d 12.0±0.5*

26
22:6n-3 70.4±0.9c 57.2±5.6 72.2±0.2b 68.6±2.0 7.2±0.5cd 7.3±0.4 9.2±0.7d 13.0±1.0
27
Table 3
Desaturation, elongation and recycling of radiolabelled fatty acids in hepatocytes from Atlantic salmon fed fish oil (FO) or vegetable oil (VO)
replacing 75% of FO. The data are presented in percentage of activity recovered from the assay (mean ± SEM; n=3 and 6 for FO and VO,
respectively). The percentage of unmetabolised cellular radioactivity recovered is highlighted in bold. Statistical differences between diets are
denoted by an asterisk.
Fatty acids [1-14C]16:0 [1-14C]18:1n-9 [1-14C]18:2n-6 [1-14C]18:3n-3
FO VO FO VO FO VO FO VO
16:0 (18:0) 20.2±0.7 24.0±1.8
16:1n-7 1.0±0.1 0.5±0.0*
18:1n-9 4.1±0.1 1.5±0.1* 35.4±1.1 32.2±0.9
20:1 0.9±0.0 0.5±0.0* 2.0±0.1 1.1±0.0*
18:2n-6 34.2±0.7 33.7±1.4
20:2n-6 6.2±0.5 3.7±0.2*
18:3 (n-6/n-3) 41.8±2.9 40.7±1.8
20:3 (n-6/n-3) 7.4±0.2 5.1±0.2*
Total trienes 0.3±0.0 0.7±0.1*
18:4n-3 0.2±0.0 0.5±0.1*
28
20:4 (n-6/n-3) 0.4±0.0 0.9±0.1*
Total tetraenes 0.4±0.0 0.5±0.1
20:5 (n-3) 0.1±0.0 0.2±0.0*
22:5 (n-3/n-6) 0.1±0.0 0.1±0.0
Total
pentaenes
0.5±0.0 0.4±0.0*
22:6n-3 0.1±0.0 0.1±0.0
Sum
des/elong1
6.0±0.2 2.4±0.1* 2.0±0.1 1.1±0.1* 1.2±0.0 1.6±0.1* 0.8±0.1 1.8±0.2*
Recyling2 1.8±0.0 2.3±0.1 3.0±0.2 2.6±0.1* 3.6±0.2 2.8±0.1* 0.3±0.0 0.5±0.0*
[1-14C]20:4n-6 [1-14C]20:5n-3 [1-14C]22:6n-3
FO 75% VO FO VO FO VO
20:4 (n-6/n-3) 32.1±1.8 34.3±1.1
22:4n-6 9.2±2.3 1.8±0.5*
24:4 (n-6/n-3) 1.3±0.2 0.5±0.0
20:5n-3 26.7±3.0 26.4±1.1 0.6±0.0 1.1±0.1*

29
22:5 (n-6/n-3) 16.2±0.9 10.7±1.5* 0.5±0.0 0.5±0.0
24:5 n-3 4.1±0.1 3.3±0.3
Total
pentaenes
0.3±0.0 0.3±0.0
22:6n-3 0.5±0.0 1.1±0.1* 27.4±0.7 25.8±2.8
24:6n-3 2.0±0.4 2.9±0.3
Sum
des/elong1
10.6±2.3 2.4±0.5* 20.8±0.5 15.1±1.8 2.0±0.4 2.9±0.3
Recyling2 1.1±0.0 0.9±0.1 0.5±0.1 0.4±0.1 0.3±0.0 0.5±0.1
1Does not include so-called dead end products (20:2n-6 or 20:3n-3)
2 For [1-14C]16:0, this includes radioactivity in the penta- and hexaene areas; For [1-14C]18:1n-9, saturated fatty acids, penta- and hexaene areas;
For [1-14C]18:2n-6, saturated and monounsaturated fatty acids; For [1-14C]18:3n-3, saturated and monounsaturated fatty acids, and diene area;
For [1-14C]20:4n-6, [1-14C]20:5n-3 and [1-14C]22:6n-3, saturated and monounsaturated fatty acids, diene- and triene areas.
30
Legends to Figures
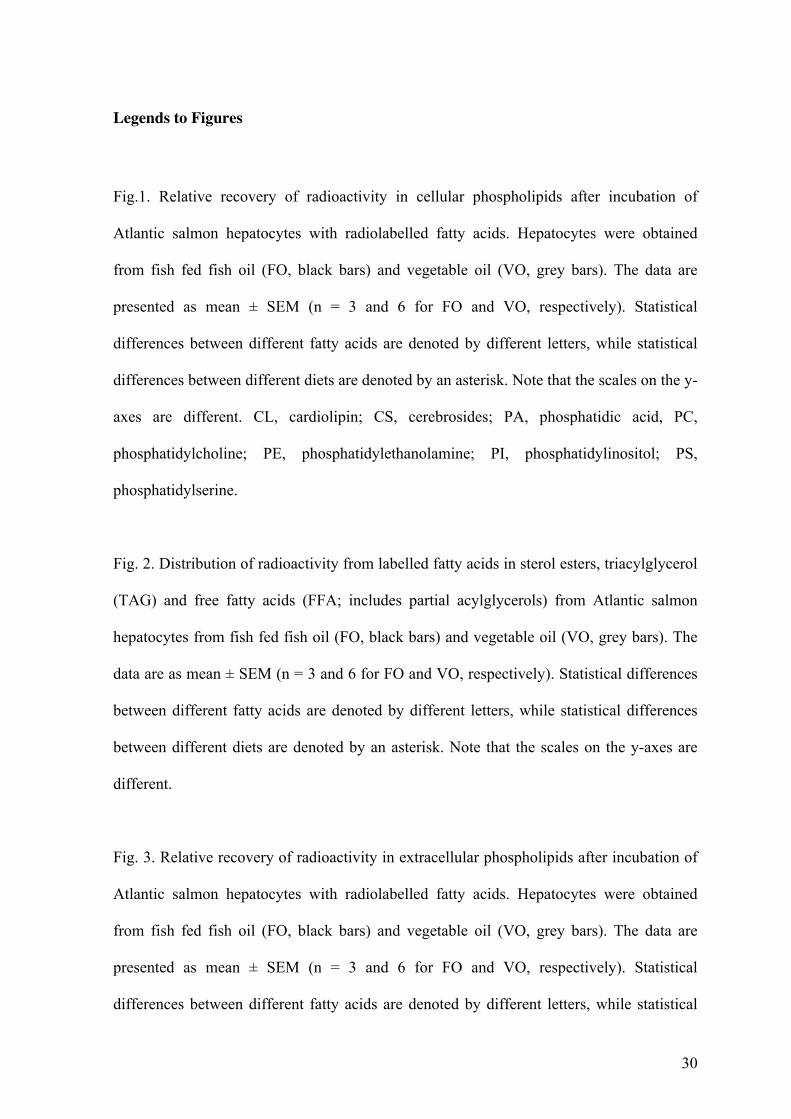
Fig.1. Relative recovery of radioactivity in cellular phospholipids after incubation of
Atlantic salmon hepatocytes with radiolabelled fatty acids. Hepatocytes were obtained
from fish fed fish oil (FO, black bars) and vegetable oil (VO, grey bars). The data are
presented as mean ± SEM (n = 3 and 6 for FO and VO, respectively). Statistical
differences between different fatty acids are denoted by different letters, while statistical
differences between different diets are denoted by an asterisk. Note that the scales on the y-
axes are different. CL, cardiolipin; CS, cerebrosides; PA, phosphatidic acid, PC,
phosphatidylcholine; PE, phosphatidylethanolamine; PI, phosphatidylinositol; PS,
phosphatidylserine.
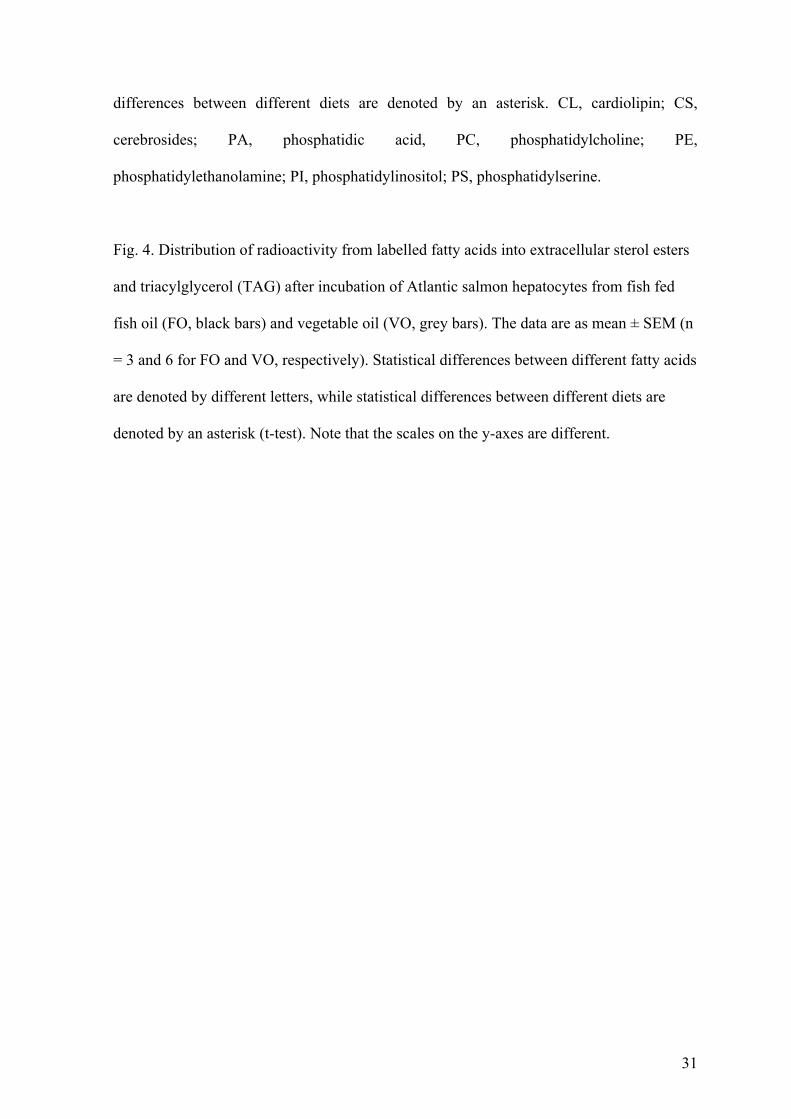
Fig. 2. Distribution of radioactivity from labelled fatty acids in sterol esters, triacylglycerol
(TAG) and free fatty acids (FFA; includes partial acylglycerols) from Atlantic salmon
hepatocytes from fish fed fish oil (FO, black bars) and vegetable oil (VO, grey bars). The
data are as mean ± SEM (n = 3 and 6 for FO and VO, respectively). Statistical differences
between different fatty acids are denoted by different letters, while statistical differences
between different diets are denoted by an asterisk. Note that the scales on the y-axes are
different.
Fig. 3. Relative recovery of radioactivity in extracellular phospholipids after incubation of
Atlantic salmon hepatocytes with radiolabelled fatty acids. Hepatocytes were obtained
from fish fed fish oil (FO, black bars) and vegetable oil (VO, grey bars). The data are
presented as mean ± SEM (n = 3 and 6 for FO and VO, respectively). Statistical
differences between different fatty acids are denoted by different letters, while statistical
31
differences between different diets are denoted by an asterisk. CL, cardiolipin; CS,
cerebrosides; PA, phosphatidic acid, PC, phosphatidylcholine; PE,
phosphatidylethanolamine; PI, phosphatidylinositol; PS, phosphatidylserine.
Fig. 4. Distribution of radioactivity from labelled fatty acids into extracellular sterol esters
and triacylglycerol (TAG) after incubation of Atlantic salmon hepatocytes from fish fed
fish oil (FO, black bars) and vegetable oil (VO, grey bars). The data are as mean ± SEM (n
= 3 and 6 for FO and VO, respectively). Statistical differences between different fatty acids
are denoted by different letters, while statistical differences between different diets are
denoted by an asterisk (t-test). Note that the scales on the y-axes are different.
32
Fig. 1
33
Fig .2
34
Fig.3
35
Fig.4