Are rhododendron hybrids distinguishable on the basis of morphology and microsatellite polymorphism?
Upload
independentCategory
view
1download
0
ORIGINAL ARTICLE
Microsatellite markers unravel the population genetic structureof the Azorean Leontodon: implications in conservation
Elisabete F. Dias • Julie Sardos • Luıs Silva •
Maria G. B. Maciel • Monica Moura
Received: 27 November 2012 / Accepted: 20 October 2013
� Springer-Verlag Wien 2013
Abstract The genus Leontodon L. (Asteraceae) com-
prises approximately 50 species with a natural distribution
area covering North America, Europe, northern Africa, and
western Asia. Two of these species are endemic to the
Azores Archipelago: Leontodon filii and Leontodon rigens.
Although both species were targeted with several taxo-
nomic revisions, so far no studies into their genetic
diversity have been carried out. In this research, the pop-
ulation genetic structure and diversity of both taxa were
assessed using five newly developed SSR markers. Four
hundred and thirty-seven individuals collected throughout
the archipelago were included in the study. A total of 98
alleles (25–12 per locus, average = 19.6) and an overall
excess of homozygotes (multilocus Fis = 0.37, range
0.16–0.53) were found for L. rigens populations. For L.
filii, 52 alleles in total (8–13 per locus, average = 10.4)
were found, overall near the HW equilibrium (multilocus
Fis = 0.07, range -0.25 to 0.57). The two species showed
an equivalent proportion of rare alleles (L. rigens 80.6 %;
L. filii 76.9 %). Both a Principal Coordinate Analysis and a
Bayesian analysis proposed the existence of two well-
defined groups, but pooled L. filii populations from Faial
Island with L. rigens populations. The largest proportion of
genetic variability was found within populations (L. rigens
72.6%; L. filii 78.9 %). The highest values of gene flow
were obtained for L. filii within the central group of islands.
Our results update the current distribution given for the
Azorean Leontodon taxa, clearly indicating that conserva-
tion measures should be applied to several populations. The
results also reveal that a revision of the Azorean Leontodon
should be carried out to clarify species delimitation.
Keywords Leontodon � Asteraceae � Conservation �Endemic � Microsatellites � Azores islands
Introduction
The genus Leontodon L. (Asteraceae) comprises about 50
species with a natural distribution area covering North
America, Europe, northern Africa, and western Asia (Bogler
2006). Two species are considered endemic to the Azores
archipelago: Leontodon filii (Hochst. ex Seub.) Paiva &
Ormonde and Leontodon rigens (Aiton) Paiva & Ormond
(Silva et al. 2010). It is thus one of the few genera showing
more than one endemic species in the archipelago. Originally
assigned to Microderis, the Azorean taxa was placed in
Leontodon by Paiva and Ormonde (1974), who considered
that the degree of inflorescence ramification and the number
of capitula were the main traits distinguishing the two spe-
cies. Thus, clear distinction between the species on mor-
phological grounds is problematic whenever the plants are
not flowering (Moura et al. 2010). Historical references
indicated a possible third species [Microderis umbellata
(Hochstetter ined.)] from Flores (Seubert 1844) suggesting
that species delimitation might require a revision.
Lack (1981), in a study of the Azorean Lactuceae
demonstrated that both L. filii and L. rigens have 14
chromosomes and are diploid. Both species are
E. F. Dias (&) � L. Silva � M. G. B. Maciel � M. Moura
CIBIO, Centro de Investigacao em Biodiversidade e Recursos
Geneticos, InBIO Laboratorio Associado, Polo dos Acores,
Departamento de Biologia, Universidade dos Acores, Rua da
Mae de Deus, Apartado 1422, Ponta Delgada 9501-801, Azores,
Portugal
e-mail: [email protected]
J. Sardos
Bioversity-France, Parc Scientifique Agropolis II,
34397 Montpellier Cedex 5, France
123
Plant Syst Evol
DOI 10.1007/s00606-013-0937-0

hemicryptophytes with anemochorous and hydrochorous
dispersal (Silva et al. 2009). Natural populations of L. ri-
gens are estimated to include more than 10,000 individuals.
Those of L. filii are estimated to contain 5,000 to 10,000
individuals, and this species is protected by Bern Con-
vention (Silva et al. 2009).
Leontodon filii has been found in steep slopes, ravines,
inland cliffs, wet places in crater margins near water-
courses, juniper woodland and extremely wet bogs, while
L. rigens occurs in wetlands, coastal cliffs, steep slopes,
craters, ravines, natural laurel forest and juniper woodland,
margins of permanent and semi-natural pastures, natural
meadows (Holcus and Festuca), wet meadows, young lava
flows with pioneer vegetation, waterfalls and roadside
slopes. Both species are threatened by habitat degradation
and reduction of available area, resulting from changes in
land use, including expansion of pastureland and plant
invasions. Additionally, some populations currently have a
low density of individuals and are geographically restricted
(Silva et al. 2009).
The distribution of the Azorean Leontodon species
remains unclear. The Azores Biodiversity Portal (2008) lists
as co-habiting the same locations in most of the Azorean
islands, with the exception of Corvo, where only L. rigens is
listed, and Graciosa and Santa Maria Islands where the
species do not occur. However, in the most recent checklist
of Azorean vascular flora (Silva et al. 2010), L. filii is
considered to occur in Pico, Sao Jorge, and Terceira, while
its presence was considered as doubtful in Faial and Sao
Miguel; L. rigens was considered to be geographically
confined to the island of Sao Miguel, as its presence is
doubtful in Pico and Terceira. Recent collections indicated
that the known distribution may contain errors.
To date, no extensive studies on the genetic variability
and population structure Azorean endemic Leontodon have
been made. These are necessary to define effective in situ
and ex situ conservation measures (for list of Azorean
priority species see Silva et al. 2009).
Francisco-Ortega et al. (2000) in a review of allozyme
variation in 69 mainly outcrossing endemic species of the
Canarian flora verified that these studies reported a high
total diversity within species and a relatively high differ-
entiation among populations (Perez de Paz and Caujape-
Castells 2013). The same study also indicated that the
average species-level genetic diversity at the allozyme loci
was unusually high. In a similar study devoted to the
Canarian Tolpis spp. (Crawford et al. 2006), allozymes
revealed low genetic diversity within species, a relatively
high proportion of the diversity among populations, and
low divergence among species. Caujape-Castells et al.
(2008) have hypothesized that the low values of genetic
variability obtained in Gran Canaria’s small subpopula-
tions of another endemic Asteraceae species, Atractylis
arbuscula, were connected to the common family charac-
teristic of possessing a sporophytic self-incompatibility
system.
In this context, this paper presents a comprehensive
population genetic study using newly developed micro-
satellite (SSR) markers.
Our objectives were (1) to determine the correspondence
between current chorological data of the Azorean Leonto-
don species and the major groups of genetic variability
obtained, (2) to estimate intra and inter-population genetic
variability patterns, (3) to identify populations with very
low genetic variability, and (4) to determine the existence
of population units requiring genetic and morphological
studies to confirm taxonomic recognition.
Materials and methods
Study site
The Azores Archipelago is located in the NE of the
Atlantic Ocean, between the 368 and 438 of North latitude
and the 258 and 318 of West longitude. The closest main-
land is the Iberian Peninsula, approximately 2,000 km
East; Nova Scotia is 2,300 km Northwest, Bermuda at
3,500 km southwest, and Madeira 1,200 km southeast. The
Azores are composed by nine islands distributed by three
main groups: western (Flores and Corvo), central (Faial,
Pico, Sao Jorge and Terceira), and eastern (Sao Miguel and
Santa Maria; Fig. 1). The vascular plant flora comprises
approximately 1,110 taxa including 73 endemic taxa (Silva
et al. 2010). Historically, research on Azorean flora was
limited by its remote geographic location and by the low
number of endemic plant taxa documented in early
checklists. This pattern led to the conclusion that the
archipelago’s endemic biodiversity was low, in comparison
with the Canary Islands and Madeira (Carine and Schaefer
2010). However, recent molecular studies have revealed
previously undetected patterns of diversity within the Az-
ores archipelago as well as new endemic taxa (Carine and
Schaefer 2010; Schaefer 2003; Schaefer and Schonfelder
2009; Schaefer et al. 2011; Silva et al. 2011; Martins et al.
2013; Moreira et al. 2013; Moura et al. 2013).
Plant material and sampling
During the summer and the early autumn of 2010, trips to
all the islands of the archipelago were carried out to
complement the samples of endemic Leontodon spp.
already available at the DNA bank collection of the AZB
herbarium (Biology Department, Azores University).
Depending on leaf size, one or two leaves per individual
were collected and immediately stored in a plastic bag with
E. F. Dias et al.
123

silica gel. After drying, the leaves were vacuum sealed in
plastic bags and stored in folders. The number of individ-
uals sampled per population varied: for small population
sizes (n \ 15) all individuals were sampled, and for larger
populations, between 10 and 30 individuals were sampled.
In total, and including already existing and new accessions,
51 different populations and 437 individuals were sampled
(Tables 1, 2). One to two representative voucher specimens
per population were also collected, pressed, mounted, and
stored at AZB. The locations of all populations were geo-
referenced and mapped using ArcView GIS 3.2.
General DNA extraction
DNA was extracted from dry leaves using a modified
Doyle and Dickson CTAB protocol (Doyle and Dickson
1987). Due to the difficulties encountered in obtaining
high-quality DNA, modifications proposed by Borges et al.
(2009) were used. Specifically, 700 ll of 39 CTAB, 50 ll
of Sarcosyl, and 10 ll of Proteinase K were used for the
initial lysis step, and the first washing step was performed
with 500 ll of chloroform–isoamylalcohol (24:1)
(SEVAG) with an additional wash using 500 ll of SEVAG
and 200 ll of 39 CTAB. DNA was then precipitated by
adding 450 ll of isopropanol and re-suspended in 50 ll of
pure water. DNA quality and quantity were measured using
a Nanodrop 2000 (Thermo Fisher Scientific) spectropho-
tometer. Samples were conserved at -20 �C until use.
Microsatellite development
Total DNA from fresh leaves of one individual of L. rigens
was sent to the Savannah River Ecology Laboratory
(University of Georgia), where the enrichment procedure
described in Glenn and Schable (2005), with the exceptions
described in Lance et al. (2010), was followed for micro-
satellite isolation. Sequences were subjected to a 30 quality
trim where only one base in the last 25 bases of the
sequence contains a quality score less than 20 or alterna-
tively contains one ambiguous base. CAP3 was then used
to assemble sequences at 98 % sequence identity using a
minimal overlap of 75 bp. Along with singlets, contigs of
two or three sequences were searched for the presence of
microsatellite DNA loci using the program
Fig. 1 Azores Archipelago and location of the Leontodon populations requiring conservation measures. Squares represent L. filii populations
and triangles, L. rigens. Estimated island ages (Myr) are also represented
Microsatellite markers unravel the population
123

MSATCOMMANDER version 0.8.1 (Faircloth 2008) and
primers designed with Primer3. One primer from each pair
was extended on the 50-end with an engineered sequence
(M13R tag 50-GGAAACAGCTATGACCAT-30) to enable
the use of a third primer identical to the M13R, which
allows for a inexpensive fluorescent labelling of the PCR
product obtained (Schuelke 2000), and a GTTT ‘‘pigtail’’
was added to the 50-end of the untagged primer to facilitate
accurate genotyping (Brownstein et al. 1996).
Out of the 183 sequences of primer pairs provided by the
Savannah River Ecology Lab we selected 24 primer pairs, 12
with expected PCR products ranging between 100–200 bp (A
series) and 12 exhibiting expected PCR products ranging
between 200 and 300 bp (B series) to allow later the multi-
loading of PCR products (Oetting et al. 1995). All the primer
pairs (with the tag sequence included) were selected on criteria
of non-complementarities within and between primers, low
secondary structures and 30-end instability (Rychlik 1995).
Table 1 Geographical distribution of the Leontodon rigens popula-
tions sampled in the Azores archipelago
Island
group
Island (N) Populations Codes n Total
Eastern Sao
Miguel
(118)
Sete Cidades (Caldeira
do Alferes)
SMAL 10 118
Road to Outeiro da
Lomba
SMOL 10
Lagoa do Canario
(road)
SMEC 5
Lagoa do Canario SMLC 10
Lagoas Empadadas SMEM 10
Lagoa do Fogo SMLF 17
Lagoa do Areeiro SMLA 6
Sete Cidades (Lomba
do Pico)
SMLP 12
Monte Escuro SMME 3
Planalto dos
Graminhais
SMPG 3
Pico Bartolomeu SMPB 6
Pico do Carvao SMPR 5
Nordeste (Tronqueira) SMTR 10
Sete Cidades (Vista do
Rei)
SMVR 11
Western Flores
(57)
Burreiro FLBU 10 68
Caldeira Seca FLLS 13
Caldeira Branca (road
to Morro Alto)
FLCB 9
Road to Ponta Delgada FLPD 6
Road to Morro Alto FLMA 10
Miradouro Craveiro
Lopes
FLCL 9
Corvo
(11)
Cumeeiras do
Caldeirao
COMC 11
A total of 186 individuals were collected
N number of individuals per island, n number of individuals per
population, Total number of individuals per island group (Eastern and
Western)
Table 2 Geographical distribution of the Leontodon filii populations
sampled in the Azores archipelago
Island
group
Island (N) Populations Codes n Total
Eastern Sao
Miguel
(3)
Lagoa do Canario SMLC 1 3
Pico da Vara SMPV 2
Central Pico (117) Cabeco do Coiro PICO 15 249
Cabeco dos Misterios PICM 7
Cabeco Redondo PIRE 2
Caldeirao da
Ribeirinha
PIRB 2
Chao Verde PICV 13
Lagoa do Peixinho PILP 16
Lomba do Capitao PILO 12
Miradouro (perto
Cabrais)
PIMI 14
Mountain (Baldio de
S. Mateus)
PIBM 15
Ribeira Funda PIRF 6
Transversal (near
Torrinhas)
PITT 15
Faial (24) Alto do Guarda-Sol FAGS 8
Cabeco do Trinta FATR 10
Caldeira rim FAEC 6
Terceira
(55)
Rocha do Chambre TERC 9
Algar do Carvao TEAC 9
Caldeira da Agualva TECA 1
Caldeira de Santa
Barbara
TESB 8
Serra do Labacal
(Moldes)
TESL 1
Pico da Bagacina TEPB 8
Pico do Gaspar TEPG 10
Cone near Pico do
Gaspar
TEGE 9
Sao Jorge
(53)
Faja do Santo Cristo SJFS 8
Morro Pelado SJMP 13
Pico da Esperanca SJPE 10
Pico do Areeiro SJPA 10
Road to Pico da
Esperanca
SJSE 12
Western Flores (2) Burreiro FLBU 2 2
A total of 254 individuals were collected
N number of individuals per island, n number of individuals per
population, Total number of individuals per island group (Eastern,
Central, and Western)
E. F. Dias et al.
123

Microsatellite selection
In the first phase of the test, all 24 primer pairs were tested
on four samples of L. rigens and four samples of L. filii
using a unlabelled tag primer in a final volume of 25 ll
consisting of 25 ng of DNA, 19 NH4 Buffer, 1.5 mM
MgCl2, 0.4 lM of untagged primer, 0.08 lM of tagged
primer, 0.36 lM of unlabelled tag primer, 200 lM of
dNTPs, 1U of Immolase (Bioline) and using a Biometra
TGradient thermocycler. Touchdown thermal cycling pro-
grammes (Don et al. 1991) encompassing a 10 �C span of
annealing temperatures ranging between 64 and 54 �C were
used for all loci. The PCR program consisted of the fol-
lowing steps: 95 �C for 7 min (hot start); 96 �C for 3 min;
20 cycles of 96 �C for 30 s, the highest annealing temper-
ature of 64 �C (decreased by 0.5 �C per cycle) for 30 s, and
72 �C for 30 s; 20 cycles of 96 �C for 30 s, 54 �C for 30 s,
and 72 �C for 30 s; and finally 72 �C for 10 min for the final
extension of the PCR products. Five ll of PCR products was
then run on a 3.5 % agarose gel, stained with SafeViewTM
Nucleic Acid Stain (abm) and visualized under UV to check
for amplification, polymorphism and scorability of the
bands. Eleven primer pairs exhibited scorable amplified
products of the expected length range and with at least two
alleles. In the second phase, the variability of the eleven
polymorphic loci was assessed in 24 samples: 16 L. rigens
and 8 L. filii, coming from a total of 13 populations.
After analysis of the quality of the PCR products
obtained with the universal primer M13R, five primers with
acceptable to high scorability were selected to run the
complete study (Table 3).
Full-scale genotyping
After optimization, the amplifications for the whole sample
were performed using the protocols presented in Table 4.
The M13R was labeled either with PET, FAM, NED or
VIC. The Taq polymerase used with all the markers was
Immolase (Bioline) with the exception of the primer pair
LR2A02 which used Biotaq (Bioline). Amplification pro-
ducts were diluted, multiloaded, run on an ABI-3130xl
Genetic Analyzer and sized with LIZ500 size standard. The
genotypes obtained were scored using the software Gene-
Marker V.1.97 Demo version (Softgenetics).
Table 3 Description of the five SSR polymorphic loci that exhibited acceptable to high scorability in the Azorean Leontodon
Name Primer Sequences Repeat motif Size range (bp) Dye
LR2A02 Forward aAAGCCGTATGTGAAGAAGAATTC (AC)8 200–250 VIC
Reverse bTGATGCAAACTCAGAACACTC
LR4B01 Forward aACGATATGCCGAATCTGTAC (ACAT)8 200–250 PET
Reverse bTGTTGTAGGAAAGGAAGAGG
LR2A03 Forward bCCATCAAATGTCTCAAATACC (AC)10 150–175 FAM
Reverse aTTAGCCCTCCTTGAAATG
LR4B08 Forward bTGTTGTAGGAAAGGAAGAGG (ACAT)9 240–260 NED
Reverse aACGATATGCCGAATCTGTAC
LR4B10 Forward aTTACGTCTTAACCACCATCTG (AAAC)9 250–300 FAM
Reverse bTTGGAGAAGGTTGAATAAGG
a Indicates ‘‘pigtail’’ tag (50-GTTT-30)b Indicates M13R tag (50-GGAAACAGCTATGACCA-30)
Table 4 PCR conditions for the set of microsatellites selected for the
wide-range genotyping of the Azorean Leontodon
Name PCR mix (Vf = 25
ll-100 ng of DNA)
Cycling program
LR2A02 100 lg/ml of BSA. 19 NH4
Buffer, 2.5 mM MgCl2,
0.4 lL untagged primer,
0.08 lM tagged primer,
0.36 lM Universal tag
M13R., 200 lM dNTP,
1.25 U of Biotaq
95 �C for 4 min; 22 cycles:
95 �C for 30 s, 64 �C
(Touchdown -0.5 �C
each cycle) for 45 s,
72 �C for 45 s; 16 cycles:
95 �C for 30 s. 53 �C for
45 s, 72 �C for 45 s;
72 �C for 10 min
LR2A03 100 lg/ml of BSA, 19
ImmoBuffer, 3 mM
MgCl2, 0.4 lL untagged
primer, 0.12 lM tagged
primer, 0.28 lM
Universal tag M13R,
200 lM dNTP, 1 U of
Immolase
95 �C for 7 min; 95 �C for
3 min; 20 cycles: 95 �C
for 30 s, 65 �C
(Touchdown -0.5 �C
each cycle) for 30 s,
72 �C for 45 s; 20 cycles:
95 �C for 30 s, 55 �C for
30 s, 72 �C for 30 s;
72 �C for 10 min
LR4B01
LR4B08
LR4B10
100 lg/ml of BSA, 19
ImmoBuffer, 3 mM
MgCl2, 0.4 lL untagged
primer, 0.2 lM tagged
primer, 0.2 lM Universal
tag M13R, 200 lM dNTP,
1 U of Immolase
95 �C for 7 min; 95 �C for
3 min; 20 cycles: 95 �C
for 30 s, 65 �C
(Touchdown -0.5 �C
each cycle) for 30 s,
72 �C for 45 s; 20 cycles:
95 �C for 30 s, 55 �C for
30 s, 72 �C for 30 s;
72 �C for 10 min
Microsatellite markers unravel the population
123
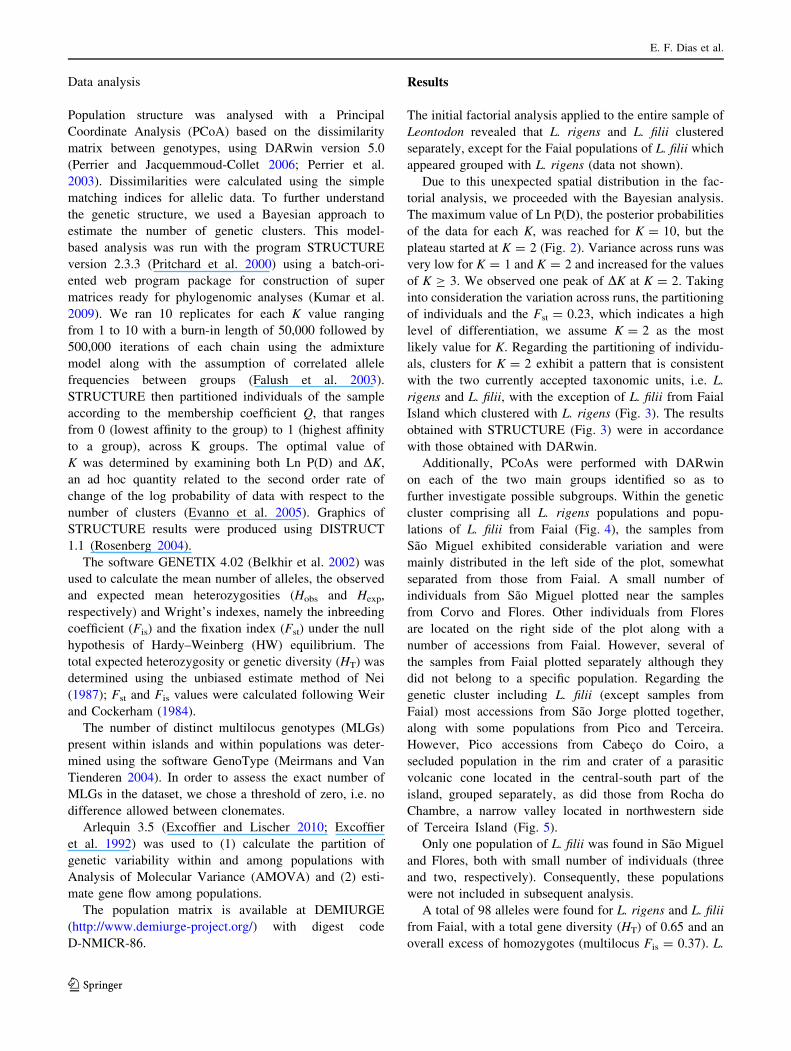
Data analysis
Population structure was analysed with a Principal
Coordinate Analysis (PCoA) based on the dissimilarity
matrix between genotypes, using DARwin version 5.0
(Perrier and Jacquemmoud-Collet 2006; Perrier et al.
2003). Dissimilarities were calculated using the simple
matching indices for allelic data. To further understand
the genetic structure, we used a Bayesian approach to
estimate the number of genetic clusters. This model-
based analysis was run with the program STRUCTURE
version 2.3.3 (Pritchard et al. 2000) using a batch-ori-
ented web program package for construction of super
matrices ready for phylogenomic analyses (Kumar et al.
2009). We ran 10 replicates for each K value ranging
from 1 to 10 with a burn-in length of 50,000 followed by
500,000 iterations of each chain using the admixture
model along with the assumption of correlated allele
frequencies between groups (Falush et al. 2003).
STRUCTURE then partitioned individuals of the sample
according to the membership coefficient Q, that ranges
from 0 (lowest affinity to the group) to 1 (highest affinity
to a group), across K groups. The optimal value of
K was determined by examining both Ln P(D) and DK,
an ad hoc quantity related to the second order rate of
change of the log probability of data with respect to the
number of clusters (Evanno et al. 2005). Graphics of
STRUCTURE results were produced using DISTRUCT
1.1 (Rosenberg 2004).
The software GENETIX 4.02 (Belkhir et al. 2002) was
used to calculate the mean number of alleles, the observed
and expected mean heterozygosities (Hobs and Hexp,
respectively) and Wright’s indexes, namely the inbreeding
coefficient (Fis) and the fixation index (Fst) under the null
hypothesis of Hardy–Weinberg (HW) equilibrium. The
total expected heterozygosity or genetic diversity (HT) was
determined using the unbiased estimate method of Nei
(1987); Fst and Fis values were calculated following Weir
and Cockerham (1984).
The number of distinct multilocus genotypes (MLGs)
present within islands and within populations was deter-
mined using the software GenoType (Meirmans and Van
Tienderen 2004). In order to assess the exact number of
MLGs in the dataset, we chose a threshold of zero, i.e. no
difference allowed between clonemates.
Arlequin 3.5 (Excoffier and Lischer 2010; Excoffier
et al. 1992) was used to (1) calculate the partition of
genetic variability within and among populations with
Analysis of Molecular Variance (AMOVA) and (2) esti-
mate gene flow among populations.
The population matrix is available at DEMIURGE
(http://www.demiurge-project.org/) with digest code
D-NMICR-86.
Results
The initial factorial analysis applied to the entire sample of
Leontodon revealed that L. rigens and L. filii clustered
separately, except for the Faial populations of L. filii which
appeared grouped with L. rigens (data not shown).
Due to this unexpected spatial distribution in the fac-
torial analysis, we proceeded with the Bayesian analysis.
The maximum value of Ln P(D), the posterior probabilities
of the data for each K, was reached for K = 10, but the
plateau started at K = 2 (Fig. 2). Variance across runs was
very low for K = 1 and K = 2 and increased for the values
of K C 3. We observed one peak of DK at K = 2. Taking
into consideration the variation across runs, the partitioning
of individuals and the Fst = 0.23, which indicates a high
level of differentiation, we assume K = 2 as the most
likely value for K. Regarding the partitioning of individu-
als, clusters for K = 2 exhibit a pattern that is consistent
with the two currently accepted taxonomic units, i.e. L.
rigens and L. filii, with the exception of L. filii from Faial
Island which clustered with L. rigens (Fig. 3). The results
obtained with STRUCTURE (Fig. 3) were in accordance
with those obtained with DARwin.
Additionally, PCoAs were performed with DARwin
on each of the two main groups identified so as to
further investigate possible subgroups. Within the genetic
cluster comprising all L. rigens populations and popu-
lations of L. filii from Faial (Fig. 4), the samples from
Sao Miguel exhibited considerable variation and were
mainly distributed in the left side of the plot, somewhat
separated from those from Faial. A small number of
individuals from Sao Miguel plotted near the samples
from Corvo and Flores. Other individuals from Flores
are located on the right side of the plot along with a
number of accessions from Faial. However, several of
the samples from Faial plotted separately although they
did not belong to a specific population. Regarding the
genetic cluster including L. filii (except samples from
Faial) most accessions from Sao Jorge plotted together,
along with some populations from Pico and Terceira.
However, Pico accessions from Cabeco do Coiro, a
secluded population in the rim and crater of a parasitic
volcanic cone located in the central-south part of the
island, grouped separately, as did those from Rocha do
Chambre, a narrow valley located in northwestern side
of Terceira Island (Fig. 5).
Only one population of L. filii was found in Sao Miguel
and Flores, both with small number of individuals (three
and two, respectively). Consequently, these populations
were not included in subsequent analysis.
A total of 98 alleles were found for L. rigens and L. filii
from Faial, with a total gene diversity (HT) of 0.65 and an
overall excess of homozygotes (multilocus Fis = 0.37). L.
E. F. Dias et al.
123
filii displayed a total of 52 alleles, HT = 0.53 and a mul-
tilocus Fis of 0.07. A similar proportion of rare alleles was
obtained for both groups (80.6 % for L. rigens and L. filii
from Faial and 76.9 % for L. filii), with the highest values
occurring in the islands of Sao Miguel and Flores for L.
rigens and of Pico for L. filii (Table 5). Populations of L.
rigens from Sao Miguel and those of L. filii from Terceira
displayed the highest numbers of multilocus alleles for each
group (57 and 36 alleles, respectively) with an excess of
homozygotes (Fis = 0.51 and Fis = 0.19, respectively;
Table 5). In Flores Island, the multilocus Fis value obtained
for L. rigens (0.02) also suggests that the populations follow
HW equilibrium, while for the populations from Corvo and
Faial, an excess of homozygotes was calculated (Table 5). In
contrast, values of multilocus Fis for L. filii in Sao Jorge and
Pico islands indicated an excess of heterozygotes (although
very close to equilibrium in Pico), although mixed locus-
specific Fis values were again obtained (Table 5).
The allelic richness varied from an average of 3 alleles
in Sao Jorge up to 10 alleles in Sao Miguel. The island with
the highest percentage of private alleles is Pico (45 %), and
the island with the lowest percentage is Sao Jorge with only
18.8 % (Table 6).
Particular allelic patterns appeared in Corvo in locus
LR4B08 and LR4B01 and in Faial a large range of alleles
is present at locus LR2A02. The dominant alleles were
similar in all the islands for the genetic cluster 2, while in
the genetic cluster 1 the diversity of dominant alleles was
higher (data not shown).
In order to further evaluate the genetic diversity within
populations and within islands, the number of distinct
multilocus genotypes (MLGs) was determined (Table 6).
With our set of markers, L. filii exhibited 168 MLGs out of
226 individuals sampled, while L. rigens exhibited 191 out
of 212 individuals sampled. Generally, for both L. rigens
and L. filii, the distinct MLGs index (MLGs/N) was either 1
or close to it.
AMOVA analyses applied to the groups defined above
showed that the largest proportion of genetic variation was
found within populations (73 and 79 %, for L. rigens with
L. filii from Faial and L. filii, respectively; Tables 7, 8).
Average Fst values calculated for both groups denoted a
considerable overall differentiation among populations
(0.27 and 0.21, respectively). Gene flow values calculated
between islands for L. filii indicate a high number of
migrants within the central group, with the highest value
obtained between Pico and S. Jorge (Table 9).
The values obtained for Fis, private alleles and the dis-
tinct MLGs index were compared to determine which
populations should have priority for conservation, namely
Fig. 2 Methodology from
Evanno et al. (2005) for the
interpretation of STRUCTURE
results. a Median Ln(K),
b Ln0(K), c Ln0 0(K) and
d Median Delta K are presented
for each value of K. The peak of
Median DK at K = 2 indicate
one putative right value for K
Fig. 3 Graphical display of the STRUCTURE output. Individuals are
represented as thin vertical lines partitioned into segments corre-
sponding to their membership in genetic clusters indicated by
different shades of grey, * marks the populations of L. filii that
cluster with L. rigens. All populations starting with LF belong to
Leontodon filii and LR to L. rigens
Microsatellite markers unravel the population
123

the populations that showed (1) low distinct MLGs index;
(2) strongly positive Fis values, resulting in a homozygotes
excess; and (3) a higher proportion of private alleles
reflecting unique genepools were considered to be in need
of restoration measures. The localizations of these popu-
lations were represented on a map of the archipelago
(Fig. 1).
Discussion
Genetic structure
Our study confirmed the existence of two main genetic
groups in the archipelago: one composed of L. rigens
individuals occurring in S. Miguel, Flores and Corvo, plus
all the L. filii from Faial; and the second was composed of
L. filii individuals occurring in S. Miguel, Terceira, Pico, S.
Jorge and Flores.
Please check and confirm the edit in the following:
Leontodon rigens from S. Miguel, possesses the highest
number of alleles; it is, therefore, possible that in the past,
the Azorean archipelago held a single ancestral endemic
species of Leontodon, which later evolved by allopatric
speciation. Sao Miguel is the second oldest island in the
archipelago (4.01 Myr; Franca et al. 2003), and in this
scenario dispersal and colonization are likely to have
occurred from east to west. The absence of L. rigens on
Terceira could be the result of never having dispersed
there, despite the geographic location and the age of the
island. Alternatively, it may reflect the destruction of pre-
vious populations by extensive volcanic activity without
subsequent reestablishment (Calvert et al. 2006). Such
events occurred throughout the archipelago. They
Fig. 4 PCoA performed on
simple matching dissimilarities
matrix obtained from the
molecular data matrix of L.
rigens s. l. Factors 1 and 2
represent 25.2 % of the total
variance observed. Legend: Sao
Miguel black squares, Corvo
white squares, Faial crosses,
and Flores triangles
E. F. Dias et al.
123

contributed to the destruction of large areas of vegetation
and have been hypothesized to explain the intra-archipel-
ago genetic characteristics of other Azorean taxa, namely
Juniperus brevifolia (Silva et al. 2011). Alternatively, both
species could have emerged from a common ancestor, now
extinct.
Human intervention in the native vegetation has also
been highly disruptive throughout time and is the most
probable explanation for the extinction of the endemic
Leontodon species on the islands of Santa Maria and
Graciosa. These islands have suffered an intense human
impact and the general low altitude topography led to a
deficiency of habitat refugia where the species could have
survived until the present days. According to our data, L.
rigens is also present in Flores and Corvo. Flores is the
oldest island of the Western group (2.16 Myr; Franca et al.
2003) and one of the oldest within the archipelago; thus an
early colonization of Flores by L. rigens was possible.
Flores accessions separated into two disjoint subgroups:
one composed mainly of individuals from of Lagoa Seca
caldera in Flores altogether with all accessions from Corvo,
and the second by a mix of Flores and some of Faial’s
accessions (Fig. 4). Accessions from Flores, Corvo toge-
ther with some accessions from Faial appear as showing
individuals that are somewhat intermediate, between
accessions from Sao Miguel at one extreme and other
accessions from Faial at the other. Faial is the westernmost
island of the central group. It is younger than Flores (0.73
Myr; Franca et al. 2003), and might have been colonized
Flores with later gene flow between populations on the two
islands (see Table 9). This could explain the similarities
found with several Flores accessions. The topography of
Faial’s Caldeira and the presence of Pico Mountain, as an
important geographical barrier (2,351 m asl), are some
factors that might explain the uniqueness of the Faial
Island’s populations in the central group. However,
according to our results, gene flow might also exist
between Faial and Terceira (Table 9). Both the population
Fig. 5 PCoA performed on
simple matching dissimilarities
matrix obtained from the
molecular data of L. filii cluster.
Factors 1 and 2 represented
30.41 % of the total variance
observed. Legend: Sao Jorge
dots, Pico squares, and Terceira
triangles
Microsatellite markers unravel the population
123

Ta
ble
5N
um
ber
of
gen
oty
ped
ind
ivid
ual
s(N
),n
um
ber
of
alle
les,
Hobs,
Hexp,
Fis
and
per
cen
tag
eo
fra
real
lele
s(f
req
uen
cyq\
0.0
5),
for
each
locu
so
fth
eL
.ri
gen
sp
lus
L.
fill
ifr
om
Fai
al
(Clu
ster
1)
and
L.
fili
i(C
lust
er2
)p
op
ula
tio
ns
dis
trib
ute
din
the
sev
enis
lan
ds
of
the
Azo
res
arch
ipel
ago
Clu
ster
sIs
lan
dN
LR
2A
02
LR
2A
03
LR
4B
01
All
eles
Hexp
Hobs
Fis
Rar
eal
lele
s(%
)A
llel
esH
exp
Hobs
Fis
Rar
eal
lele
s(%
)A
llel
esH
exp
Hobs
Fis
Rar
eal
lele
s(%
)
1S
.M
igu
el1
18
11
0.3
10
.13
0.5
88
1.8
70
.22
0.1
10
.50
71
.41
40
.83
0.4
70
.44
57
.1
Flo
res
54
40
.09
0.0
9-
0.0
26
6.7
90
.64
0.8
8-
0.3
77
7.8
11
0.6
90
.65
0.0
67
2.7
Co
rvo
11
20
.42
0.5
5-
0.3
30
.03
0.4
50
.55
-0
.21
0.0
90
.89
0.5
50
.40
0.0
Fai
al2
41
20
.80
0.8
8-
0.0
95
0.0
50
.61
0.7
5-
0.2
54
0.0
50
.61
0.4
60
.25
40
.0
Ov
eral
l2
07
18
0.3
40
.22
0.3
69
4.7
16
0.4
80
.41
0.1
68
7.5
24
0.8
40
.53
0.3
77
9.2
2T
erce
ira
55
60
.42
0.2
90
.31
50
.07
0.7
10
.64
0.1
15
7.1
70
.72
0.5
30
.27
28
.6
S.
Jorg
e5
33
0.0
90
.09
-0
.03
66
.76
0.5
90
.83
-0
.41
50
.04
0.5
70
.68
-0
.19
25
.0
Pic
o1
17
50
.29
0.0
50
.82
60
.07
0.5
90
.87
-0
.47
57
.13
0.4
80
.59
-0
.23
33
.3
Ov
eral
l2
25
80
.28
0.1
20
.57
75
.01
00
.64
0.8
0-
0.2
57
0.0
90
.58
0.6
0-
0.0
37
7.8
Clu
ster
sIs
lan
dN
LR
4B
08
LR
4B
10
Mu
ltil
ocu
s
All
eles
Hexp
Hobs
Fis
Rar
eal
lele
s(%
)A
llel
esH
exp
Hobs
Fis
Rar
eal
lele
s(%
)A
llel
esH
TH
obs
Fis
Rar
eal
lele
s(%
)
1S
.M
igu
el1
18
16
0.7
20
.26
0.6
46
2.5
90
.67
0.3
80
.44
55
.65
70
.55
0.2
70
.51
64
.9
Flo
res
54
14
0.7
20
.68
0.0
67
8.6
90
.72
0.5
00
.31
33
.34
70
.57
0.5
60
.02
67
.4
Co
rvo
11
70
.87
0.3
60
.59
0.0
20
.52
0.9
1-
0.8
20
.02
30
.63
0.5
80
.08
0.0
Fai
al2
46
0.7
20
.46
0.3
76
6.7
70
.83
0.7
10
.15
14
.33
50
.71
0.6
50
.09
42
.9
Ov
eral
l2
07
25
0.7
80
.41
0.4
88
4.0
12
0.8
10
.48
0.4
15
0.0
98
0.6
50
.41
0.3
78
0.6
2T
erce
ira
55
90
.75
0.6
00
.20
44
.47
0.7
40
.64
0.1
42
8.6
36
0.6
70
.54
0.1
94
1.7
S.
Jorg
e5
33
0.5
10
.57
-0
.11
33
.34
0.3
20
.13
0.5
90
.02
00
.42
0.4
6-
0.1
12
8.6
Pic
o1
17
50
.49
0.6
0-
0.2
24
0.0
11
0.4
60
.27
0.4
37
2.7
31
0.4
60
.48
-0
.03
58
.1
Ov
eral
l2
25
12
0.5
80
.59
-0
.01
83
.31
30
.54
0.3
20
.40
76
.95
20
.53
0.4
90
.07
76
.9
Clu
ster
sw
ere
defi
ned
reg
ard
less
of
tax
on
om
ictr
eatm
ent
E. F. Dias et al.
123

Table 6 Allelic richness (A) and percentage of private alleles (P) per island, number of individuals (N), number of distinct multilocus genotypes
(MLGs) and clonal richness (MLGs/N) per population, calculated for the two genetic clusters obtained
Clusters Island Taxon A P Populations N MLGs MLGs/N
1 S. Miguel L. rigens 11 38.6 SMLC 10 10 1.00
SMLA 6 5 0.83
SMOL 10 10 1.00
SMEC 5 5 1.00
SMPR 5 5 1.00
SMEM 10 9 0.90
SMLF 17 16 0.94
SMAL 10 10 1.00
SMLP 12 11 0.92
SMME 3 3 1.00
SMPG 3 3 1.00
SMTR 10 7 0.70
SMVR 11 10 0.91
SMPB 6 6 1.00
Flores L. rigens 9 23.9 FLBU 10 6 0.67
FLLS 11 10 0.91
FLCB 9 6 0.67
FLPD 5 4 0.80
FLMA 9 8 0.89
FLCL 10 9 0.90
Corvo L. rigens 4 42.8 COMC 11 10 0.91
Faial L. filii 6 21.4 FAGS 8 8 1.00
FATR 10 10 1.00
FAEC 6 6 1.00
2 Terceira L. filii 6 27.6 TERC 9 9 1.00
TEAC 9 9 1.00
TECA 1 1 1.00
TESB 8 8 1.00
TESL 1 1 1.00
TEPB 8 7 0.88
TEPG 10 10 1.00
TEGE 9 8 0.89
S. Jorge L. filii 3 18.8 SJFS 8 6 0.75
SJMP 13 10 0.77
SJPE 10 8 0.80
SJPA 10 10 1.00
SJSE 12 10 0.83
Pico L. filii 4 45 PICO 15 15 1.00
PICM 7 6 0.86
PIRE 2 2 1.00
PIRB 2 2 1.00
PICV 14 8 0.57
PILO 12 5 0.42
PILP 16 8 0.50
PIMI 14 4 0.29
PIBM 15 5 0.33
PIRF 6 4 0.67
PITT 15 12 0.80
Microsatellite markers unravel the population
123

of Rocha do Chambre in Terceira and all of the populations
sampled from Faial exhibit somewhat different genetic
characteristics. Furthermore, the characteristics of the later
lead to clustering with L. rigens accessions, while the
Terceira population slightly separated from the remaining
L. filii. The restricted locations of the population of Rocha
do Chambre in Terceira and Caldeira in Faial coupled with
a founder effect could have contributed to the convergence
of genetic characteristics, reflected in our results by the
estimation of possible gene flow. In fact, the difference
observed between the dominant alleles present in Cluster 2
(Table 5) could indicate the occurrence of founder effects.
It is thus possible that both locations were colonized by an
early L. filii form which later evolved in less circumscribed
areas but remained as a relict in the caldera of Faial and
Rocha do Chambre valley. Another possibility would be a
stochastic event of genetic convergence derived from
genetic drift.
Regarding L. filii, its origin in the archipelago likely
resulted from a recent speciation event, perhaps in the
oldest islands of the central group already colonized by L.
rigens and due to an easy interisland dispersal became the
dominant taxon in that group. The geographical location of
S. Jorge Island, between Terceira and Pico, is reflected in
our analysis by the high gene flow values and the proximity
in the multifactorial analysis between several accessions
ensuing from these islands, particularly with Pico. As with
Rocha do Chambre in Terceira and Faial’s Caldeira, the
slight differentiation revealed by the population of Cabeco
do Coiro in Pico might result from specific geographical
conditions, namely its location inside the narrow caldera of
a small volcanic cone.
Genetic diversity
The total genetic diversity obtained in our study for L.
rigens and L. filii is much higher than the allozyme
diversity values reviewed by Francisco-Ortega et al.
(2000), for the Canary Islands, and for most of the island
endemics reviewed by Franks (2010). Even if this is
expected since microsatellites are more variable markers
than allozymes (Hedrick 1999), the values obtained can
also be considered high by microsatellite marker standards
for silverswords in Hawaii (Friar and Ladoux 2000; Friar
et al. 2001, 2007).
Since the Azorean islands are much younger than sev-
eral islands of the Canarian archipelago (Schaefer 2003), it
is probable that Leontodon does not constitute an old
lineage that took refuge from Quaternary glaciations that
occurred in Europe, although studies with genus Pericallis
have indicated that the Azorean endemic species P. mal-
vifolia radiated on the Azores about 3 Myr ago, before
other genus radiations occurred in the Canary Islands
(Carine and Schaefer 2010). Another hypothesis put for-
ward by Francisco-Ortega et al. (2000) for the high genetic
diversity of the Canary Islands endemic flora relates to the
proximity of the archipelago to the African mainland which
probably facilitated multiple introductions of continental
taxa. However, the Azores are located in the mid Atlantic
Ocean and thus dispersal from continental land masses is
more difficult (Bellemain and Ricklefs 2008). Therefore, it
is more likely that, as with the Cyprus endemic Cedrus
brevifolia (Eliades et al. 2011), the high genetic diversity
obtained for the Azorean Leontodon indicates that it
Table 7 Analysis of molecular variance applied to 27 populations of
L. rigens from Sao Miguel, Flores, and Corvo and L. filii from Faial
Source of variation df Sum
squares
Variance of
component
Percentage of
variation
Among group 3 81,800 0.26687 Va 15.17
Among populations
within groups
21 100,021 0.2147 Vb 12.2
Within populations 393 502,312 127,815 Vc 72.63
Total 417 684,134 175.971
Groups corresponded to islands
Table 8 Analysis of Molecular Variance applied to 24 populations of
L. filii from Pico, Sao Jorge and Terceira. Groups corresponded to
islands
Source of variation df Sum
squares
Variance of
component
Percentage of
variation
Among group 2 29.545 0.06516 Va 4.78
Among populations
within groups
21 108.090 0.22212 Vb 16.28
Within populations 393 458.719 107.680 Vc 78.94
Total 449 596.353 136.408
Table 9 Gene flow values calculated between all islands of the
archipelago and for the two genetic clusters obtained
Cluster 1 Cluster 2
S. Miguel Flores Corvo Faial Terceira S. Jorge
Cluster 1
Flores 1.5
Corvo 1.0 0.9
Faial 0.9 1.4 0.9
Cluster 2
Terceira 0.8 0.9 0.9 1.0
S. Jorge 0.5 0.5 0.4 0.5 2.5
Pico 0.5 0.5 0.5 0.6 2.2 11.2
E. F. Dias et al.
123

originated from a widespread congener species, which is
supported by the close phylogenetic proximity of L. rigens
to the widely-distributed L. hispidus (Samuel et al. 2006).
On the other hand, we also observed that genetic vari-
ation was mainly found within populations, which is not in
accordance with the results obtained for several Canary
Islands endemic species, where most genetic variability
resided among populations (Francisco-Ortega et al. 2000).
Furthermore, restricted gene flow between islands, a
common pattern found in other population genetics studies
with island endemics (Franks 2010), was not observed,
particularly within the Azorean central sub-archipelago.
Unexpectedly, gene flow was also found between L. filii
from Faial and L. rigens from Flores. These results indicate
that some populations of both species might eventually
produce hybrids. The difficulty in determining the genetic
affinities of Leontodon populations using solely morpho-
logical traits, particularly in the case of non-flowering
individuals, makes it inadvisable to use any individual as a
diaspore source unless molecularly screened by the present
work.
Conservation genetics
Due to the large scale of our study, a wealth of information
on many of the existing Leontodon populations in the
archipelago is now available and it is unquestionable that
the genetic patterns documented should be taken into
consideration for the establishment of species recuperation
plans. The uniqueness of some of the studied populations
and the low heterozygosity values obtained for others
indicate that extreme care should be taken regarding (1) the
populations that should be selected for conservation and (2)
the implementation of augmentation conservation
strategies.
When dealing with genetic conservation, allelic richness
is one of the most relevant criteria for measuring diversity
(Bataillon et al. 1996; Kremer 1994; Petit et al. 1998).
According to our results, allelic richness is higher in the
islands of S. Miguel, Flores, Terceira?? and Faial
(Table 6). Additionally, our analysis established that the
islands with a higher percentage of private alleles are
Corvo, S. Miguel, Terceira and Pico. They should be
considered as a priority for the implementation of conser-
vation measures. We also took into consideration Fis values
which reveal excesses of homozygotes, i.e. the populations
with positive Fis values are subjected to inbreeding which
can increase the possibilities of the next generations being
affected by recessive or deleterious characters (Whitlock
2002). The number of individuals of Leontodon that, with
our set of markers, exhibit identical MLGs is high in some
populations. As sampling was designed to avoid the col-
lection of clones, and notwithstanding the possibility of
infrequent apomixis (Noyes 2007), we assume that the
identical MLGs ensue from different mating events and
that their strong occurrence highlights the small number of
alleles involved in mating in those specific populations.
The compilation of the percentage of private alleles per
population, the rate of MLGs repetition within populations
and of the Fis values, shows that the need to implement
protective conservation measures is crucial for the entire
islands of Corvo and Faial, for five populations in Pico, two
in Terceira, one in Sao Jorge and eight in Sao Miguel
(Fig. 1).
The comparably high genetic specificity of populations
in Corvo and Faial along with the populations of Rocha do
Chambre in Terceira and Cabeco do Coiro in Pico suggests
that seeds or individuals from these islands should not be
used in conservation programmes on other populations as
they correspond to different genetic entities. Seeds or
plantlets issuing from S. Miguel should not be introduced
in Flores or Corvo, as evolutionary mechanisms are likely
to be in action in the western group. Furthermore, diaspores
collected in the central group should not be introduced into
either the western or the eastern groups. The maintenance
of ex situ collections of seeds might also be an important
conservation measure to preserve the unique gene pools of
the most differentiated populations (Moreira et al. 2009;
Martins et al. 2011). However, sampling of seeds should be
conducted with extreme care in all the population area so
that all genotypes are equally represented in the collection.
Reintroduction of the endemic Leontodon spp. in Santa
Maria and Graciosa should not be attempted since using
diaspores from populations existing in other islands might
result in stepping-stone dispersal effects and contamination
of natural populations with different genetic entities.
Considering that Asteraceae are mainly outcrossing
(Caujape-Castells et al. 2008), the existence of restricted
Leontodon spp. populations with a reduced number of
individuals, as in Corvo and Faial islands, might result in a
decrease in compatible mating types and thus increase the
risk of biparental inbreeding and inbreeding depression
(Francisco-Ortega et al. 2000; Caujape-Castells et al. 2008;
Perez de Paz and Caujape-Castells 2013). In these specific
cases, a genetic rescue program might be implemented
through an ex situ seed propagation protocol using seeds
from each population and a later reintroduction of plantlets
in the same populations of origin. Ex situ propagation
should be conducted under laboratory conditions instead of
open air nurseries or gardens to avoid contamination with
local populations.
Besides government imposed restrictions to interpopu-
lation mixture, other management measures should also be
undertaken, similarly to what is presently implemented in
the Canary Islands for endangered species, namely infor-
mation campaigns and training of roadside workers acting
Microsatellite markers unravel the population
123

in natural areas (Martın 2005), and most importantly, the
definition of in situ protection measures through the pres-
ervation of the species natural habitats. Specifically, there
is the need for the urgent eradication of invasive alien
species, which are increasingly common in the Azorean
native vegetation areas, plant species, such as Hedychium
gardnerianum Sheppard ex Ker Gawl., Erigeron karviski-
anus D.C. and Leycesteria formosa Wall. and animal spe-
cies, such as Oryctolagus cuniculus (Linnaeus 1758), all
previously listed as top invasive species in the Azores
(Silva et al. 2008). Government restrictions should also be
implemented to the use of native vegetation areas as
grazing land for cattle and goats. Commercial exploitation
of Azorean Leontodon plants and their use in roadsides and
gardens should also be restricted as it increases the chances
of genetic contamination of nearby natural populations.
In conclusion, this study contributed to generate data
fundamental to implementing an appropriate conservation
plan for Azorean endemic Leontodon by documenting
variability patterns and detecting populations in critical
need of protection. In addition, the improved understanding
of the population genetic diversity and structure and the
recognition of complex sub-structures will help future
morphological, phylogenetic and geographical studies
focused on the taxon circumscription and the evolution of
Leontodon in the Azores.
Acknowledgments This study was funded by DRCTC (Direccao
Regional da Ciencia, Tecnologia e Comunicacoes) and by FEDER
and was part of projects VERONICA and DEMIURGO (MAC PCT).
The Authors would like to thank Dr. Mark Carine for revising the
English version of the manuscript, and the staff at Secretaria Regional
do Ambiente and Servicos Florestais who contributed during the
collection of some of the material used in the study.
References
Azores Biodiversity Portal 2008. http://www.azoresbioportal.angra.
uac.pt
Bataillon TM, David JL, Schoen DJ (1996) Neutral genetic markers
and conservation genetics: simulated germplasm collections.
Genetics 144:409–417
Belkhir K, Borsa P, Chikhi L, Raufasre N, BonHomme F (2002)
Genetix 4.04, Logiciel sous Windows TM pour la genetique des
populations. Laboratoire Genome, Populations, Interations.
CNRS UMR5000. Universite de Montpellier II, France
Bellemain E, Ricklefs RE (2008) Are islands the end of the
colonization road? Trends Ecol Evol 23(8):461–468
Bogler DJ (2006) Leontodon Linnaeus. In: Flora of North America
Editorial Committee (eds) Flora of North America. Magno-
liophyta: Asteridae, part 6: Asteraceae, part 1, vol 19. Oxford
University Press, New York, pp 294–296
Borges A, Rosa MS, Recchia GH, Queiroz-Silva JR, Bressan EA,
Veasey EA (2009) CTAB methods for DNA extraction of
sweetpotato for microsatellite analysis. Sci Agric 66(4):529–534
Brownstein MJ, Carpten JD, Smith JR (1996) Modulation of non-
templated nucleotide addition by Taq DNA polymerase: primer
modifications that facilitate genotyping. Biotechniques
20:1004–1010
Calvert AT, Moore RB, McGeehin JP, Silva AMR (2006) Volcanic
history and 40Ar/39Ar and 14C geochronology of Terceira Island,
Azores, Portugal. J Volcanol Geoth Res 156:103–115
Carine MA, Schaefer H (2010) The Azorean diversity enigma: why
are there so few Azorean endemic flowering plants and why are
they so widespread? J. Biogeogr 37:77–89
Caujape-Castells J, Marrero-Rodrııguez A, Baccarani-Rosas M,
Cabrera-Garcıa N, Vilches-Navarrete B (2008) Population
genetics of the endangered Canarian endemic Atractylis arbus-
cula (Asteraceae): implications for taxonomy and conservation.
Plant Syst Evol 274:99–109
Crawford DJ, Archibald JK, Santos-Guerra A, Mort ME (2006)
Allozyme diversity within and divergence among species of Tolpis
(Asteraceae-Lactuceae) in the Canary Islands: systematic, evolu-
tionary and biogeographical implications. Am J Bot 93(4):656–664
Don RH, Cox PT, Wainwright BJ, Baker K, Mattick JS (1991)
‘Touchdown’ PCR to circumvent spurious priming during gene
amplification. Nucleic Acids Res 19:4008
Doyle JJ, Dickson EE (1987) Preservation of plant samples for DNA
restriction endonuclease analysis. Taxon 36:715–722
Eliades N-GH, Gailing O, Leinemann L, Fady B, Finkeldy R (2011)
High genetic diversity and significant population structure in
Cedrus brevifolia Henry, a narrow endemic Mediterranean tree
from Cyprus. Plant Syst Evol 294:185–198
Evanno G, Regnault S, Goudet J (2005) Detecting the number of
clusters of individuals using the software structure: a simulation
study. Mol Ecol 14(8):2611–2620
Excoffier L, Lischer HEL (2010) Arlequin suite ver. 3.5: a new series
of programs to perform population genetics analyses under
Linux and Windows. Mol Ecol Resour 10:564–567
Excoffier L, Smouse PE, Quattro JM (1992) Analysis of molecular
variance inferred from metric distances among DNA haplotypes:
application to human mitochondrial DNA restriction data.
Genetics 131:479–491
Faircloth BC (2008) MSATCOMMANDER: detection of microsat-
ellite repeat arrays and automated, locus-specific primer design.
Mol Ecol Resour 8:92–94
Falush D, Stephens M, Pritchard JK (2003) Inference of population
structure using multilocus genotype data: linked loci and
correlated allele frequencies. Genetics 164(4):1567–1587
Franca Z, Cruz JV, Nunes JC, Forjaz VH (2003) Geologia dos
Acores: uma perspectiva actual. Acoreana 10(1):11–140
Francisco-Ortega J, Santos-Guerra A, Kim S-C, Crawford DJ (2000)
Plant genetic diversity in the Canary Islands: a conservation
perspective. Am J Bot 87(7):909–919
Franks SJ (2010) Genetics, evolution and conservation of islands
plants. J Plant Biol 53:1–9
Friar E, Ladoux T (2000) Microsatellite analysis of a population crash
and bottleneck in the Mauna Kea silversword, Argyroxiphium
sandwicense ssp. sandwicense (Asteraceae), and its implications
for reintroduction. Mol Ecol 9:2027–2034
Friar EA, Boose DL, LaDoux T, Roalson EH, Robichaux RH (2001)
Population structure in the endangered Mauna Loa silversword,
Argyroxiphium kauense (Asteraceae), and its bearing on rein-
troduction. Mol Ecol 10(7):1657–1663
Friar EA, Cruse-Sanders JM, McGlaughlin ME (2007) Gene flow in
Dubautia arborea and D. ciliolata: the roles of ecology and
isolation by distance in maintaining species boundaries despite
ongoing hybridization. Mol Ecol 16(19):4028–4038
Glenn TC, Schable NA (2005) Isolating microsatellite DNA loci.
Method Enzymol 395:202–222
Hedrick PW (1999) Perspective: highly variable loci and their
interpretation in evolution and conservation. Evolution
53(2):313–318
E. F. Dias et al.
123

Kremer A (1994) Diversite genetique et variabilite des caracteres
phenotypiques chez les arbres forestiers. Gen Sel Evol
26(1):105–123
Kumar S, Skjæveland A, Orr RJS, Enger P, Ruden T, Mevik B, Burki
F, Botnen A, Shalchian-Tabrizi K (2009) AIR: a batch-oriented
web program package for construction of supermatrices ready
for phylogenomic analyses. BMC Bioinformatics 10:357
Lack H (1981) Die Lactuceae (Asteraceae) der azorischen Inseln.
Willdenowia 11:211–247
Lance SL, Light JE, Jones KL, Hagen C, Hafner JC (2010) Isolation
and characterization of 17 polymorphic microsatellite loci in the
kangaroo mouse, genus Microdipodops (Rodentia: Heteromyi-
dae). Conserv Genet Resour 2:139–141
Martın JL (2005) Guıa metodologica para la elaboracion de planes de
especies amenazadas de Canarias. Direccion General del Medio
Natural, Gobierno de Canarias
Martins J, Moreira O, Silva L, Moura M (2011) Vegetative
propagation of the endangered Azorean tree, Picconia azorica.
Arquipelago. Life Mar Sci 28:39–46
Martins J, Moreira O, Sardos J, Maciel MGB, Silva L, Moura M
(2013) Population genetics and conservation of the Azorean tree
Picconia azorica. Biochem Syst Evol 49:135–143
Meirmans PG, Van Tienderen PH (2004) GENOTYPE and GENO-
DIVE: two programs for the analysis of genetic diversity of
asexual organisms. Mol Ecol Notes 4:792–794
Moreira O, Martins J, Silva L, Moura M (2009) Propagation of the
endangered Azorean cherry Prunus azorica using stem cuttings
and air layering.Arquipelago. Life Mar Sci 26:09–14
Moreira O, Martins J, Sardos J, Maciel MGB, Silva L, Moura M
(2013) Population genetic structure and conservation of the
Azorean tree Prunus azorica (Rosaceae). Plant Syst Evol.
doi:10.1007/s00606-013-0829-3
Moura M, Dias EF, Silva L, Schaefer H, Carine MA (2010) Molecular
systematics and morphology of the endemic Leontodon in the
Azores islands. Communication. International Symposium
FloraMAC 2010. September 23–25, Ponta Delgada, Acores
Moura M, Silva L, Caujape-Castells J (2013) Population genetics in
the conservation of the Azorean shrub Viburnum treleasei Gand.
Plant Syst Evol. doi:10.1007/s00606-013-0836-4
Nei M (1987) Molecular evolutionary genetics. Columbia University
Press, New York
Noyes RD (2007) Apomixis in the Asteraceae: diamonds in the rough.
Funct Plant Sci Biotech 1(2):207–222
Oetting WS, Lee HK, Flanders DJ, Wiesner GL, Sellers TA, King RA
(1995) Linkage analysis with multiplexed short tandem repeat
polymorphisms using infrared fluorescence and M13 tailed
primers. Genomics 30:450–458
Paiva JAR, Ormonde J (1974) Sobre Thrincia carreiroi Gandoger e
Thrincia subglabra Gandoger. Bol Soc Brot 2(47):271–291
Perez de Paz J, Caujape-Castells J (2013) A review of the allozyme
data set for the Canarian endemic flora: causes of the high
genetic diversity levels and implications for conservation. Ann
Bot. Oxford University Press
Perrier X, Jacquemmoud-Collet JP (2006) DARwin software. http://
www.darwin.cirad.fr/darwin
Perrier X, Flori A, Bonnot F (2003) Data analysis methods. In:
Hamon P, Seguin M, Perrier X, Glaszmann JC (eds) Genetic
diversity of cultivated tropical plants. Enfield Sciences Publisher,
Montpellier, pp 43–76
Petit RJ, El Mousadik A, Pons O (1998) Identifying populations for
conservation on the basis of genetic markers. Conserv Biol
12:844–855
Pritchard JK, Stephens M, Donnelly P (2000) Inference of population
structure using multilocus genotype data. Genetics 155:945–959
Rosenberg N (2004) Distruct: a program for the graphical display of
population structure. Mol Ecol Notes 4:137–138
Rychlik W (1995) Selection of primers for polymerase chain
reactions. Mol Biotechnol 3:129–134
Samuel R, Gutermann W, Stuessy TF, Ruas CF, Lack HW,
Tremetsberger K, Talavera S, Hermanowsky B, Ehrendorfer F
(2006) Molecular phylogenetics reveals Leontodon (Asteraceae,
Lactuceae) to be diphyletic. Am J Bot 93:1193–1205
Schaefer H (2003) Chorology and diversity of the Azorean flora.
Dissertationes Botanicae 374:1–130
Schaefer H, Schonfelder P (2009) Smilax azorica, S. canariensis
(Smilacaceae) and the genus Smilax in Europe. Monografıas del
Instituto de Estudios Canarios 78:297–307
Schaefer H, Moura M, Maciel MGB, Silva L, Rumsey F, Carine MA
(2011) The Linnean shortfall in oceanic island biogeography: a
case study in the Azores. J Biogeogr 38(7):1345–1355
Schuelke M (2000) An economic method for the fluorescent labeling of
PCR fragments: a poor man’s approach to genotyping for research
and high-throughput diagnostics. Nat Biotechnol 18:233–234
Seubert M (1844) Flora Azorica quam ex collectionibus schedisque
Hochstetteri patris et filii elaboravit et tabulis XV propria manu
aeri incisis illustravit Mauritius Seubert. Adolphum Marcum,
Bonnae
Silva L, Ojeda Land E, Rodrıguez Luengo JL (2008) Invasive
terrestrial flora and fauna of Macaronesia: Top 100 in Azores,
Madeira and Canaries. ARENA, Ponta Delgada
Silva L, Martins M, Maciel G, Moura M (2009) Flora Vascular dos
Acores. Prioridades em Conservacao. Azorean Vascular Flora.
Priorities in Conservation. Amigos dos Acores & CCPA, Ponta
delgada
Silva L, Moura M, Schaefer H, Rumsey F, Dias EF (2010) List of
vascular plants (Tracheobionta). In: Borges PAV, Costa A,
Cunha R, Gabriel R, Goncalves V, Martins AF, Melo I, Parente
M, Raposeiro P, Rodrigues P, Santos RS, Silva L, Vieira P,
Vieira V (eds) A list of the terrestrial and marine biota from the
Azores. Princıpia, Cascais, pp 9–33
Silva L, Elias RB, Moura M, Meimberg H, Dias E (2011) Genetic
Variability and differentiation among populations of the Azorean
endemic gymnosperm Juniperus brevifolia: baseline information
for a conservation and restoration perspective. Biochem Genet
49:715–734
Weir BS, Cockerham CC (1984) Estimating F-statistics for the
analysis of population structure. Evolution 38:1358–1370
Whitlock MC (2002) Selection, load and inbreeding depression in a
large metapopulation. Genetics 160:1191–1202
Microsatellite markers unravel the population
123
Copyright © 2022 FDOKUMEN