Intercalibration of age readings of deepwater black scabbardfish, Aphanopus carbo (Lowe, 1839

RAPID COMMUNICATIONS IN MASS SPECTROMETRY
Rapid Commun. Mass Spectrom. 2008; 22: 1235–1244
) DOI: 10.1002/rcm.3487
Published online in Wiley InterScience (www.interscience.wiley.comUsing stable isotopes to unravel and predict the origins
of great cormorants (Phalacrocorax carbo sinensis)overwintering at Kinmen
Yuan-Mou Chang1y, Kent A. Hatch1*,y, Tzung-Su Ding2**,y, Dennis L. Eggett3,
Hsiao-Wei Yuan2 and Beverly L. Roeder1
1Department of Biology, Brigham Young University, 401 WIDB, Provo, UT 84602-5181, USA2School of Forestry and Resource Conservation, National Taiwan University, No. 1, Sec. 4, Roosevelt Road, Taipei 106, Taiwan3Department of Statistics, Brigham Young University, 230 TMCB, Provo, UT 84602-5181, USA
Received 16 July 2007; Revised 1 February 2008; Accepted 4 February 2008
*CorrespoYoung UE-mail: k**CorrespoConservasevelt RoE-mail: dyThese auContract/
The Food and Agricultural Organization of the United Nations and the World Organization for
Animal Health have called for a better understanding of the role that migrating birds may play in
spreading H5N1 highly pathogenic avian influenza (HPAI). Bird banding, traditionally used in
studies ofmigration, is limited by low recapture rates. Telemetry can only be applied to larger species
and a limited number of birds.We show that analyses ofmultiple stable isotopes (d13C, d15N, d18O and
dD) can provide an understanding of the number of breeding populations represented at large
congregations of wintering birds, probable locations of these breeding populations, and which
breeding populations do not contribute migrants to a wintering site. As Asia is thought to be the
origin of many HPAI strains and the center of their evolution, and as bird migration is poorly
understood in this part of the world, we recommend that, in addition to banding, satellite, and VHF
telemetry, the stable isotope analysis of migration patterns should become a part of long-term
surveillance studies. Copyright # 2008 John Wiley & Sons, Ltd.
The risk to human health of the H5N1 highly pathogenic
avian influenza (HPAI) is widely acknowledged, and efforts
are underway to prepare for a possible pandemic.1
Discoveries of the survival of infected birds,2–5 as well as
outbreaks of HPAI among migratory wild birds in 2005 and
2006,6,7 have led the Food and Agricultural Organization of
the United Nations and the World Organization for Animal
Health to call for a better understanding of the role that
migrating birds may play in spreading HPAI.8 In particular,
they call for a more precise understanding of flyways and
congregation sites where large numbers of birds may mix
and spread HPAI.
Naturally occurring stable isotopes found in feathers can
be an important investigative tool to examine potential
links between the breeding and wintering grounds of
migratory birds.9 Proteins formed during the growth of
the feather become metabolically inert. They then form a
permanent record in which stable isotopes of hydrogen and
oxygen reflect the local environmental conditions in which
ndence to: K. A. Hatch, Department of Biology, Brighamniversity, 401 WIDB, Provo, UT 84602-5181, [email protected] to: T.-S. Ding, School of Forestry and Resourcetion, National Taiwan University, No. 1, Sec. 4, Roo-ad, Taipei 106, [email protected] contributed equally to this work.grant sponsor: Kinmen National Park of Taiwan.
the feather was grown, while stable isotopes of carbon and
nitrogen are influenced by the local diet. Therefore, the origin
of a bird can often be inferred from knowledge of the isotopic
values of feathers compared with the isotopic signatures of
the local environment and diet.9,10
We chose to study the migration of Phalacrocorax carbo
sinensis (the great cormorant) because of its potential to bring
HPAI to Taiwan. Although HPAI has not yet been detected
in Taiwan,11 individuals of P. c. sinensis infected with HPAI
have been found elsewhere.12,13 Kinmen Island, which lies
about 5 km off the coast of China (248440N, 1838330E, 150 km2,
Fig. 1) and is administered by Taiwan, is the location of one of
the two largest congregations of wintering P. c. sinensis in
East Asia. These wintering P. c. sinensis are also a focal
attraction for ecotourism to Kinmen. The large number of
cormorants wintering at Kinmen (greater than 10 000
individuals), and the likelihood that they come from many
different breeding populations, suggest the possibility that
they could be a vector for bringing HPAI to Kinmen.
Although dD values of feathers have typically been
compared with the dD of precipitation to infer migration,14,15
the distributions of dD and d18O in precipitation across Asia
are not as precisely known as in North America and Europe.
This is because there are fewer data collection sites and the
frequency of data collection is more sporadic in Asia.16 This
makes it more difficult to infer the origins of birds by
comparing the dD values of precipitation and of feathers in
Asia alone. Consequently, we sought to infer breeding
Copyright # 2008 John Wiley & Sons, Ltd.

Figure 1. East Asia breeding range and Kinmen wintering sites of Phalacrocorax
carbo sinensis. The locations marked by black circles indicate where cormorants
formerly bred but where none were found during our July 2005 visit. The site with
breeding cormorants that we did not visit is marked by a plus sign. The sites with
breeding individuals and where feathers were collected are marked with grey
triangles. These three sites are Qinghai Lake, Ussuri River and Chita Peninsula.
Ci Lake, Ti Lake and Ling Shui Lake are the roosting sites at Kinmen in winter and
are indicated by black squares.
1236 Y.-M. Chang et al.
locations of P. c. sinensis wintering at Kinmen based on the
direct comparison of d13C, d15N, d18O and dD values of
feathers collected at both wintering and breeding sites.
EXPERIMENTAL
Feather collectionAn extensive literature review revealed at least 19 sites where
P. c. sinensis have been known to breed in East Asia (Table 1,
Table 1. Possible breeding sites of great cormorants (Phalacroco
Place name Position
Tang Wang River Tang Yuan Co., Hei Long Jiang PrYalu River Fu Yuan Co., Hei Long Jiang ProvQin De Li Swamp Fu Yuan Co., Hei Long Jiang ProvSan Jiang Nature Reserve* Fu Yuan Co., Hei Long Jiang ProvHong He Nature Reserve* Fu Yuan Co., Hei Long Jiang ProvQi Hu Lin River and A BuXin River Swamp
Hu Lin Co. and Rao He Co.,Hei Long Jiang Province
Xing Kai Hu Nature Reserve* Mi Shan City, Hei Long Jiang ProvZha Long Nature Reserve* Qiqihar City, Hei Long Jiang ProvUssuri River*y The boundary river of Northeast C
and south of the Russian Far East,Hulun Lake* Hulun Buir Grassland, Inner MongWu Liang Su Hai Ba Yan Zhao Er City, Inner MongoHa Su Hai Hu He Hao Te City, Inner MongolHu Tu Bi Dzungaria, Xinjiang Uyghur AutonQinghai Lake*y Qinghai ProvinceZha Ling Lake*, E Ling Lake*y Ma Duo Co and Qu Ma Lai Co., QRi Tu, Ge Er South Part of Tibet Autonomous RChita Peninsula*y Japan
*Indicates breeding sites visited in July 2005.yIndicates breeding birds found.1: China Swamps/Wetlands Database.2: Liu JS, et al. Wild Animal 1994; 5: 19.3: Fan XS, University Bulletin of Shihezi University 1999; 3: 1.4: Johnsgard PA. Cormorants, Darters, and Pelicans of the World, Smithsonia
Copyright # 2008 John Wiley & Sons, Ltd.
Fig. 1). While P. c. sinensis breeding sites are also likely to occur
in Siberia (Dr Sergey Surmach, personal communication), we
did not visit these sites because little information has been
published on them and because of the difficulty of obtaining
visas to travel to these sites. However, we visited 10 of the 19
sites above (Fig. 1) in July 2006 and found breeding P. c. sinensis
at four sites only: Qinghai Lake (a saline lake), E Ling Lake,
Ussuri River in China, and Chita Peninsula in Japan.17 This
suggests a significant loss of P. c. sinensis breeding sites. We
rax carbo sinensis) in East Asia
Habitat type Sources
ovince Swamp 1ince Swamp 1ince Swamp 1ince Swamp 1ince Swamp 1
Swamp 1
ince Lake and swamp 1ince Swamp 1, 2hinaHei Long Jiang Province
River 1
olia Autonomous Region Swamp 1lia Autonomous Region Lake 1ia Autonomous Region Lake and swamp 1omous Region Reservoir 3
Lake 1, 2inghai Province Swamp 1egion — 1
Lake 4
n Institution Press: Washington and London, 1993.
Rapid Commun. Mass Spectrom. 2008; 22: 1235–1244
DOI: 10.1002/rcm

Origins of great cormorants overwintering at Kinmen 1237
were unable to collect feathers from E Ling Lake in China
because of the difficulty accessing the site. We also collected
feathers once a month from P. c. sinensis wintering at Kinmen
from December 2005 to February 2006.
Rather than capturing and removing feathers from live
adult birds, we chose to collect newly dropped feathers found
lying on the ground18 including primary, secondary and tail
feathers at breeding sites and at Kinmen.We are confident that
all the collected feathers were newly dropped because these
feathers were neither weathered, nor damaged, nor covered
by a layer of dirt or dust. We ensured that the collected
feathers were from different individuals by collecting them
under widely separated nests at breeding sites and under
separated roosting trees (Casuarina equisetifolia) at Kinmen.We
also collected body feathers or flight feathers from dead
nestlings which had fallen out of their nests at the breeding
sites. Since the nestlings had not yet migrated, the isotopic
signatures of their feathers must reflect that of the local
habitats.19,20 We collected feathers from a total of 19, 21 and 48
birds from breeding sites at Qinghai Lake, Ussuri River and
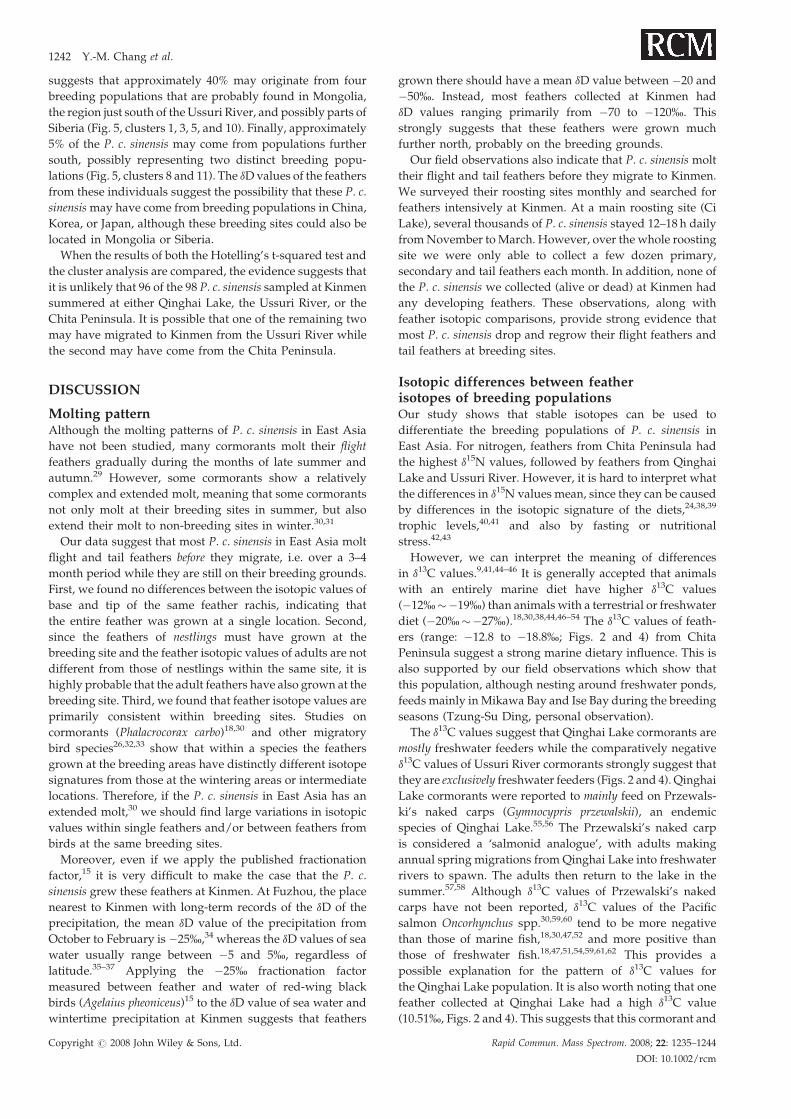
Figure 2. d13C, dD, d15N and d18O values of the tip and
from breeding sites.
Copyright # 2008 John Wiley & Sons, Ltd.
Chita Peninsula, respectively, for stable isotope analysis. At
Kinmenwe also collected a total of 39, 27 and 32 feathers from
Ci Lake, Tai Lake and Ling Shui Lake, respectively.
Feather cleaning and sample preparationBefore cleaning, we removed the vane of each feather and
excluded 2 cm of the base (proximal) portion of the rachis
including the calamus because this part is close to the
subdermal portion and has been shown to differ isotopically
from the rest of the feather.21 We then sonicated the feathers
in distilled water for 30min, followed by sonication in
petroleum ether for an additional 30min to remove
contaminants from the surface of the feathers. They were
then air-dried in a fume hood.
Once cleaned, we cut the samples from both the tip and the
base of each feather. Each sample was placed in a separate tin
capsule for d13C and d15N analysis and in a pre-combusted silver
capsule for d18O and dD analysis and thenweighed. The sample
weights ranged from0.7 to 0.8mg for d13C and d15Nanalysis and
from0.135 to 0.165mg for d18O and dDanalysis. All samples and
base of the Phalacrocorax carbo sinensis feathers
Rapid Commun. Mass Spectrom. 2008; 22: 1235–1244
DOI: 10.1002/rcm

1238 Y.-M. Chang et al.
the standards for d18O and dD analysis were stored in plastic
culture trays, loosely covered with the lid, and were allowed to
equilibrate at room temperature with ambient moisture in the
air for 5 days prior to analysis.
Isotopic analysisThe d13C and d15N of the feathers were analyzed using an
elemental analyzer (Costech ECS 4010, Valencia, CA, USA)
coupled to a Delta V isotope-ratio mass spectrometer
(Finnigan, Bremen, Germany). External standards used for
carbon were UCLA Carrera (a working standard from Ian
Kaplan’s laboratory, UCLA d13C¼ 2.52%) and LSVEC (NIST,
d13C¼�46.48%). For nitrogen, we used USGS 25 (NIST,
d15N¼�30.4%) and USGS 26 (NIST, d15N¼ 53.5%) as
external standards.
For d18O and dDanalysis, silver capsules containing feather
samples were analyzed using a high-temperature conversion
elemental analyzer (TC/EA, ThermoFinnigan, Bremen,
Germany) connected to a Finnigan Delta V isotope-ratio
mass spectrometer. We analyzed samples of the tips and
bases of feathers of 6–12 birds from each site at the Stable
Figure 3. d13C, dD, d15N and d18O values of the tip
feathers from Ci Lake, Ti Lake and Ling Shui Lake
Copyright # 2008 John Wiley & Sons, Ltd.
Isotope Research Facility (SIRFER) at the University of Utah
using their in-house standards. We then ran the remaining
feathers at Brigham Young University using the feathers that
we had run at SIRFER as in-house standards.
All stable isotope values of the samples are expressed in
‘delta’ (d) notation. Delta values for carbon and nitrogen are
expressed relative to Pee Dee Belemnite (PDB) and
atmospheric nitrogen, respectively.22,23 Delta values for
hydrogen and oxygen are expressed relative to V-SMOW
(Vienna Standard Mean Ocean Water).24 The overall
precision of the isotope measurements was �0.05% for
carbon and nitrogen, �0.1% for oxygen, and �1% for
hydrogen.
Data analysisWe designed our statistical analyses to answer the following
questions: (1) can we use stable isotopes to infer breeding
sites, (2) are there isotopic differences between feathers from
different breeding sites with regard to age and feather type,
(3) could P. c. sinensis wintering at Kinmen have come from
the breeding sites we sampled, and (4) if they did not migrate
and base of the Phalacrocorax carbo sinensis
roosting sites at Kinmen in winter.
Rapid Commun. Mass Spectrom. 2008; 22: 1235–1244
DOI: 10.1002/rcm

Table 3. Effects of sites (Qinghai Lake, Ussuri River and
Chita Peninsula), ages (adult and nestling) and feather types
(body feather, primary feather, secondary feather and tail
feather) on isotopic values of feathers (n¼ 88) collected at
breeding sites
EffectDf for
numeratorDf for
denominator F P
d13CPlace 2 85 485.79 <0.0001Age 1 76 0.61 0.44Feather type 3 76 1.02 0.39
dDPlace 2 85 102.43 <0.0001Age 1 76 0.47 0.49Feather type 3 76 0.33 0.81
d15NPlace 2 85 256.88 <0.0001Age 1 76 0.02 0.88Feather type 3 76 1.18 0.32
d18OPlace 2 77 115.93 <0.0001Age 1 76 0.88 0.35Feather type 3 77 2.02 0.66
Table 4. Tukey’s between site comparisons of the isotopic
values (%) of feathers from breeding sites. Least-square
means� 1 SE is shown
Origins of great cormorants overwintering at Kinmen 1239
from these breeding sites, from which locations could they
have possibly migrated? We first analyzed feathers that we
collected to establish that their stable isotopes could be used
to infer breeding sites. This was done by using a paired t-test
of the tips and bases of the rachis of all the feathers.We found
no significant difference in these two values of each feather
(see below) and we, therefore, averaged the isotope values of
tip and base of the rachis to represent the value of each
feather for further comparison. We then used site (Qinghai
Lake, Ussuri River and Chita Peninsula), age (adult and
nesting) and feather type (body feather, primary feather,
secondary feather and tail feather) as factors in a single full
model analysis of variance (ANOVA) to compare feather
delta values for each isotope from breeding sites and used a
Tukey’s post hoc test to determine differences within factors.
We used a post hoc t-test to test the difference of the isotopic
values between the feathers of the nestlings and adults
within a breeding site. To determine whether it is possible
that P. c. sinensis wintering at Kinmen could come from
breeding sites at Qinghai Lake, Ussuri River, or the Chita
Peninsula, we computed the multivariate normal distri-
bution for d13C, dD, d15N and d18O for each breeding site and
then computed a Hotelling’s t-squared test for each site and
observation. P. c. sinensis were assumed to come from the
specific breeding site if T2< 9.49, X20.95,4; otherwise theywere
assumed to come from sites other than the three from which
we collected feathers. Finally, to answer the question of
where these P. c. sinensis breed and roughly how many
breeding populations winter at Kinmen, we used cluster
analysis to objectively group wintering P. c. sinensis based on
the stable isotope values of their feathers. We used a
hierarchical approached based on the mean distance.25 We
tested this approach using the data we collected from birds at
our three breeding sites.
RESULTS
Isotopic signature of feathers from breedingsitesOur data indicate that the feathers we collected were grown
on the breeding grounds. First, we found no statistically
significant differences in the isotopic values of base and tip of
the rachis from the same feathers for d13C, dD, d15N or
d18O values (Table 2, Figs. 2 and 3). This indicates that the
entire feather was grown at a single location. Second,
d13C, dD, d15N and d18O values were significantly different
between breeding sites (Tables 3 and 4). Third, there were no
significant differences in d13C, dD, d15N and d18O between
different feather types (Table 3 and Fig. 4). Finally, the
feathers from nestlings were not significantly different from
Table 2. Paired t-tests of isotopic values of base and tip from
the same feathers (n¼ 186). Means� 1 SE is shown. The
significant level is P< 0.05
Isotope value (%) Tip Base t-value (Df) P
d13C �18.68� 0.38 �18.71� 0.39 0.42 (185) 0.67dD �86.68� 2.26 �87.11� 2.22 0.66 (185) 0.51d15N 11.50� 0.32 11.57� 0.33 �0.45 (185) 0.65d18O 15.46� 0.19 15.50� 0.18 �0.74 (185) 0.46
Copyright # 2008 John Wiley & Sons, Ltd.
the dropped feathers of adults in d13C, dD, d15N and
d18O values within a breeding site (Fig. 4, Table 5). Since
the feathers of nestlings must have grown at the breeding
site, this strongly indicates that the adult feathers did also.
Origin of P. c. sinensis wintering at KinmenOur results show that it is very unlikely that P. c. sinensis
wintering at Kinmen could come from breeding sites at
Qinghai Lake, Ussuri River, or the Chita Peninsula. There is a
possibility that three of the 98 P. c. sinensis sampled at
Kinmen may have spent the breeding season at Qinghai
Lake, two on theUssuri River and two at the Chita Peninsula.
However, it reasonably excludes the possibility that 91 of the
P. c. sinensis summered at the above locations (Table 6).
Having determined that most P. c. sinensis wintering at
Kinmen do not breed on either Qinghai Lake, the Chita
Peninsula, or at the Ussuri River, we next questioned where
these P. c. sinensis breed and roughly how many breeding
populations winter at Kinmen. When we tested cluster
analysis on our known data, it reproduced the breeding
populations quite closely (Table 7). When we applied this
analysis to the data collected from the P. c. sinensiswintering
Isotopevalue (%)
Breeding sites
QinghaiLake (n¼ 19)
UssuriRiver (n¼ 21)
Chita Peninsula(n¼ 48)
d13C �21.65� 0.37a �26.34� 0.35b �13.90� 0.23c
dD �33.20� 4.71a �124.96� 4.48b �70.66� 2.97c
d15N 14.90� 0.24a 11.57� 0.23b 17.71� 0.15c
d18O 16.34� 0.53a 6.96� 0.45b 13.51� 0.41c
Different letter superscripts within a row indicate significantlydifferent values (P< 0.05).
Rapid Commun. Mass Spectrom. 2008; 22: 1235–1244
DOI: 10.1002/rcm

Figure 4. d13C, dD, d15N and d18O values of Phalacrocorax carbo sinensis feathers from nestlings and adults of breeding sites.
The statistical results are shown in Tables 2,3,4 and 5.
Table 5. Post hoc t-test between the isotopic values (%)
between the feathers of the nestlings and adults within a
breeding site. The level of significance is P< 0.05
Isotopes
P values between nestlings and adults
Qinghai Lake Ussuri River Chita Peninsula
d13C 0.68 0.24 0.96dD 0.66 0.99 0.17d15N 0.81 0.54 0.26d18O 0.62 0.07 0.06
Table 6. Number of P. c. sinensis wintering at Kinmen (three
different locations) which might reasonably be inferred to have
spent the summer at either Qinghai Lake, the Ussuri River, or
Japan’s Chita Peninsula based on Hotelling’s t-squared test
Kinmen
Breeding sites
TotalQinghaiLake
UssuriRiver
ChitaPeninsula
Othersites
Ling Shui Lake 2 1 1 28 32Tai Lake 0 0 1 26 27Ci Lake 1 1 0 37 39Total 3 2 2 91 98
Copyright # 2008 John Wiley & Sons, Ltd.
1240 Y.-M. Chang et al.
at Kinmen, the analysis produced nine clusters plus two
outliers. Assuming these represent distinct breeding popu-
lations, we suggest that approximately 65% of the P. c.
sinensis wintering at Kinmen come from four of 9–11
breeding populations (Table 8, bold italics), while 25% come
from the remaining five breeding populations. The two
outliers may represent additional populations. Our data also
suggest that approximately 70% of the wintering P. c. sinensis
at Ling Shiu Lake were from breeding populations three and
four, and that approximately 60% of the P. c. sinensis at Tai
Lake were from breeding population three. Likewise, about
Table 7. Analysis of feathers collected at three breeding
sites. Cluster analysis correctly assigned 97% of breeding
cormorants to the correct breeding site based on stable
isotope analysis of feathers
Cluster name
Breeding sites
Qinghai Lake Ussuri River Chita Peninsula Total
1 0 0 48 482 16 0 0 163 0 21 0 214 2 0 0 25 1 0 0 1Total 19 21 48 88
Rapid Commun. Mass Spectrom. 2008; 22: 1235–1244
DOI: 10.1002/rcm

Table 8. Cluster analysis of feathers collected at three win-
tering sites in Kinmen. The clusters in the table represent
inferred breeding populations to which wintering P. c. sinensis
were assigned
Cluster name
Wintering sites
Ling Shui Lake Tai Lake Ci Lake Total
1 0 1 14 152 3 0 10 133 14 3 1 184 9 16 2 275 0 0 6 66 0 0 4 47 3 3 0 68 2 1 1 49 0 3 0 310 1 0 0 111 0 0 1 1Total 32 27 39 98
Note: Cluster analysis clearly separated cormorants into 11 possiblebreeding populations: four major populations (bold italics), fiveminor populations, and two questionable populations based onone bird each. The major breeding origins of cormorants of eachwintering site at Kinmen are indicated in bold. The numbers offeathers of each cluster do not imply the exact numbers of individ-uals coming from the breeding populations.
Figure 5. Inferred breeding region for each cluster of Phalacroc
cluster in (a) matches the color of the inferred breeding area in (b
for mean June precipitation (adapted from Ref. 71). We chose pre
due to the patterns of precipitation dD are similar among the mo
our inference (compare (b) with (c) and (d)). The percentage o
totals are given in Table 6. The percentages of feathers of eac
coming from the breeding populations.
Copyright # 2008 John Wiley & Sons, Ltd.
Origins of great cormorants overwintering at Kinmen 1241
60% of the P. c. sinensis at Ci Lake were from breeding
populations one and two (Table 8).
Using d13C, dD, d15N or d18O values, wewere able to largely
exclude the possibility that cormorants wintering at
Kinmen came from breeding populations at Qinghai Lake,
Ussuri River or the Chita Peninsula. Cluster analyses using
these isotopes also allowed us to infer the number of
probable breeding populations present at Kinmen. However,
because we did not collect feathers from breeding popu-
lations in Russia, we determined general locations of possible
breeding sites of our hypothesized populations based on the
comparisons of feather dD values with the mean dD of
precipitation during the breeding season according to the
best available dD isocline maps of Asia.16,26 The precipitation
collecting sites used to create these maps are not continu-
ously active, and the map is derived from spatially and
temporally discontinuous data. We assumed no diet-tissue
fractionation27,28 and that the dD values of the precipitation
are directly reflected in the feathers. This comparison
suggests that approximately 50% of the P. c. sinensis
wintering at Kinmen come from five breeding populations
that may be located in the region around Lake Baikal or an
area encompassing the Amur, Khabarovsk and Primorsky
regions of Russia (Fig. 5, clusters 2, 4, 6, 7, and 9). It also
orax carbo sinensis feathers at Kinmen. The color of each
). Areas of the same colors in (b) have the same dD values
cipitation dD map in June as the example of our inference;
nths of molting periods, and consequently does not affect
f feathers of each cluster is indicated in parentheses. The
h cluster do not imply the exact percentage of individuals
Rapid Commun. Mass Spectrom. 2008; 22: 1235–1244
DOI: 10.1002/rcm
1242 Y.-M. Chang et al.
suggests that approximately 40% may originate from four
breeding populations that are probably found in Mongolia,
the region just south of theUssuri River, and possibly parts of
Siberia (Fig. 5, clusters 1, 3, 5, and 10). Finally, approximately
5% of the P. c. sinensis may come from populations further
south, possibly representing two distinct breeding popu-
lations (Fig. 5, clusters 8 and 11). The dDvalues of the feathers
from these individuals suggest the possibility that these P. c.
sinensismay have come from breeding populations in China,
Korea, or Japan, although these breeding sites could also be
located in Mongolia or Siberia.
When the results of both the Hotelling’s t-squared test and
the cluster analysis are compared, the evidence suggests that
it is unlikely that 96 of the 98 P. c. sinensis sampled at Kinmen
summered at either Qinghai Lake, the Ussuri River, or the
Chita Peninsula. It is possible that one of the remaining two
may have migrated to Kinmen from the Ussuri River while
the second may have come from the Chita Peninsula.
DISCUSSION
Molting patternAlthough the molting patterns of P. c. sinensis in East Asia
have not been studied, many cormorants molt their flight
feathers gradually during the months of late summer and
autumn.29 However, some cormorants show a relatively
complex and extended molt, meaning that some cormorants
not only molt at their breeding sites in summer, but also
extend their molt to non-breeding sites in winter.30,31
Our data suggest that most P. c. sinensis in East Asia molt
flight and tail feathers before they migrate, i.e. over a 3–4
month period while they are still on their breeding grounds.
First, we found no differences between the isotopic values of
base and tip of the same feather rachis, indicating that
the entire feather was grown at a single location. Second,
since the feathers of nestlings must have grown at the
breeding site and the feather isotopic values of adults are not
different from those of nestlings within the same site, it is
highly probable that the adult feathers have also grown at the
breeding site. Third, we found that feather isotope values are
primarily consistent within breeding sites. Studies on
cormorants (Phalacrocorax carbo)18,30 and other migratory
bird species26,32,33 show that within a species the feathers
grown at the breeding areas have distinctly different isotope
signatures from those at the wintering areas or intermediate
locations. Therefore, if the P. c. sinensis in East Asia has an
extended molt,30 we should find large variations in isotopic
values within single feathers and/or between feathers from
birds at the same breeding sites.
Moreover, even if we apply the published fractionation
factor,15 it is very difficult to make the case that the P. c.
sinensis grew these feathers at Kinmen. At Fuzhou, the place
nearest to Kinmen with long-term records of the dD of the
precipitation, the mean dD value of the precipitation from
October to February is �25%,34 whereas the dD values of sea
water usually range between �5 and 5%, regardless of
latitude.35–37 Applying the �25% fractionation factor
measured between feather and water of red-wing black
birds (Agelaius pheoniceus)15 to the dD value of sea water and
wintertime precipitation at Kinmen suggests that feathers
Copyright # 2008 John Wiley & Sons, Ltd.
grown there should have a mean dD value between �20 and
�50%. Instead, most feathers collected at Kinmen had
dD values ranging primarily from �70 to �120%. This
strongly suggests that these feathers were grown much
further north, probably on the breeding grounds.
Our field observations also indicate that P. c. sinensis molt
their flight and tail feathers before they migrate to Kinmen.
We surveyed their roosting sites monthly and searched for
feathers intensively at Kinmen. At a main roosting site (Ci
Lake), several thousands of P. c. sinensis stayed 12–18h daily
fromNovember toMarch. However, over the whole roosting
site we were only able to collect a few dozen primary,
secondary and tail feathers each month. In addition, none of
the P. c. sinensis we collected (alive or dead) at Kinmen had
any developing feathers. These observations, along with
feather isotopic comparisons, provide strong evidence that
most P. c. sinensis drop and regrow their flight feathers and
tail feathers at breeding sites.
Isotopic differences between featherisotopes of breeding populationsOur study shows that stable isotopes can be used to
differentiate the breeding populations of P. c. sinensis in
East Asia. For nitrogen, feathers from Chita Peninsula had
the highest d15N values, followed by feathers from Qinghai
Lake and Ussuri River. However, it is hard to interpret what
the differences in d15N values mean, since they can be caused
by differences in the isotopic signature of the diets,24,38,39
trophic levels,40,41 and also by fasting or nutritional
stress.42,43
However, we can interpret the meaning of differences
in d13C values.9,41,44–46 It is generally accepted that animals
with an entirely marine diet have higher d13C values
(�12%��19%) than animals with a terrestrial or freshwater
diet (�20%��27%).18,30,38,44,46–54 The d13C values of feath-
ers (range: �12.8 to �18.8%; Figs. 2 and 4) from Chita
Peninsula suggest a strong marine dietary influence. This is
also supported by our field observations which show that
this population, although nesting around freshwater ponds,
feedsmainly inMikawa Bay and Ise Bay during the breeding
seasons (Tzung-Su Ding, personal observation).
The d13C values suggest that Qinghai Lake cormorants are
mostly freshwater feeders while the comparatively negative
d13C values of Ussuri River cormorants strongly suggest that
they are exclusively freshwater feeders (Figs. 2 and 4). Qinghai
Lake cormorants were reported to mainly feed on Przewals-
ki’s naked carps (Gymnocypris przewalskii), an endemic
species of Qinghai Lake.55,56 The Przewalski’s naked carp
is considered a ‘salmonid analogue’, with adults making
annual spring migrations from Qinghai Lake into freshwater
rivers to spawn. The adults then return to the lake in the
summer.57,58 Although d13C values of Przewalski’s naked
carps have not been reported, d13C values of the Pacific
salmon Oncorhynchus spp.30,59,60 tend to be more negative
than those of marine fish,18,30,47,52 and more positive than
those of freshwater fish.18,47,51,54,59,61,62 This provides a
possible explanation for the pattern of d13C values for
the Qinghai Lake population. It is also worth noting that one
feather collected at Qinghai Lake had a high d13C value
(10.51%, Figs. 2 and 4). This suggests that this cormorant and
Rapid Commun. Mass Spectrom. 2008; 22: 1235–1244
DOI: 10.1002/rcm

Origins of great cormorants overwintering at Kinmen 1243
possibly other individuals may prefer to feed on prey species
found in Qinghai Lake.
The dD and d18O values of feathers from Qinghai Lake
were the highest, followed by those from Chita Peninsula
and Ussuri River. It is reasonable that the feathers collected
from Ussuri River have lower dD and d18O values than those
from Chita Peninsula and Qinghai Lake since the spatial
distribution of dD and d18O in the precipitation generally
decreases with increasing latitude and increasing distances
from the ocean in Asia.34 An interesting isotopic pattern
occurs in Asia in which the dD values and d18O values in the
precipitation at Qinghai Lake and surrounding areas are
much higher than that of precipitation in the coastal regions
of China and Japan in summer.34 This may be due to the
contribution to precipitation of evaporated groundwater that
diffuses through the soil or is transpired by plants in this
semi-arid region.63 Therefore, a high dD and d18O in the
precipitation may cause the high feather dD values and
d18O values of Qinghai Lake cormorants.
Although the variance in individual foraging behavior
may cause differences in isotope patterns of individuals at
the same site,9 the small variances in feather d13C, d15N, and
d18O values within the same breeding population suggest
that cormorants of the same breeding population feed on
similar prey species. This corresponds with the observed
feeding practices of P. c. sinensis, which are colonial birds and
usually form a foraging flock with hundreds to thousands of
individuals taking schooling fish.64 Thus they are probably
feeding on similar prey.
Origin of P. c. sinensis wintering at KinmenOur analysis suggests that the P. c. sinensis gathered at
Kinmen come from 9–11 different breeding populations over
a large geographic range. However, the data suggest that
most of these cormorants do not breed at Qinghai Lake, the
Chita Peninsula, or Ussuri River. It also appears that
cormorants roosting at Kinmen segregate according to
breeding population.
Our inferences concur with observational data. P. c.
sinensis banded at Qinghai Lake were recovered near the Bay
of Bengal, India (Lai-Xing Lee, personal communication).
P. c. sinensis at Chita Peninsula have long been considered a
resident bird species, overwintering locally.17 Thus both our
isotopic data and previous observational studies suggest that
it is unlikely that Qinghai Lake and Chita Peninsula
populations overwinter at Kinmen.
It is possible that Kinmen P. c. sinensis could come from
North East China. Banded P. c. sinensis from Zha Long
Nature Reserve, Hei Long Jiang Province, were recovered at
Mingjiang Esturary, Fujian, in 1988,65 a place close to
Kinmen. However, our visits suggest that Ussuri River is the
only existing breeding site in North East China and few P. c.
sinensis could come from this region. Our inference of origins
based on dD alone suggests that P. c. sinensis wintering on
Kinmen primarily come from further north than the Ussuri
River. Dr Sergey Surmach’s (personal communications) field
observation shows that the breeding P. c. sinensis can
currently be found at Lake Baikal and in an area encom-
passing the Amur, Khabarovsk and Primorsky regions. Our
inferences of origins using dD alone seem not only to tally
Copyright # 2008 John Wiley & Sons, Ltd.
with Dr Surmach’s observation, but also suggest some other
potential breeding sites.
Although the utilization of dD in precipitation patterns to
study the movements of migratory birds has become
common,9,66 the degree of fractionation of dD between
precipitation and feathers is still controversial. Previous
studies have shown mixed results, with some showing
enrichment of feathers,67–69 while others suggesting
none.27,28 Since the diet of P. c. sinensis is aquatic, with very
little or no terrestrial input, we assumed that there is little or
no fractionation between the dDof precipitation and the dDof
the feathers.
In addition, the accuracy and precision of such studies
depend on the accuracy and precision of the dD values
in precipitation maps. Since the continental patterns of dD in
precipitation across Asia are not as precisely known as in
North America and Europe, and the influences of food and
drinking water on dD values of P. c. sinensis are not well
understood, caution should be used when inferring breeding
origins of P. c. sinensiswintering at Kinmen based on patterns
of dD in precipitation alone.
CONCLUSIONS
Our study shows that the stable isotope approach has the
potential to provide migratory information at the population
level, to uncover the possible existence of previously
unknown breeding populations, and to make coarse
inferences and predictions concerning bird migration and
possible future transmission of HPAI in East Asia. In
contrast, satellite telemetry and VHF telemetry can only be
applied to a limited number of individuals, but has a very
high spatial and temporal resolution, which allows the
precise assessment of bird movements. As Asia is thought to
be the origin of many HPAI strains and the center of their
evolution, and as migration is poorly understood in this part
of the world, we therefore recommend that, in addition to
banding, satellite and VHF telemetry,8 stable isotope analysis
ofmigration patterns become a part of long-term surveillance
studies. Moreover, combining multivariate analyses of stable
isotopes with analyses of the phylogenic trees of birds and
HPAI may provide an opportunity to better understanding
the interaction of bird migrations and the spread of
HPAI.10,70
AcknowledgementsWe greatly appreciate S.-W. Fu for help with the field work,
R. Bogardus and the students in K. A. Hatch’s lab for feather
cleaning and sample preparation, and S. Nelson and S.
Sinervo for their comments and insights. We thank two
anonymous reviewers for providing helpful comments on
the manuscript. We are grateful to Dr Sergey Surmach
(Institute of Biology and Soil Science, Russian Academy of
Science) for providing the valuable field observation data for
the breeding sites of Phalacrocorax carbo sinensis in Russia.
Finally, we acknowledge financial and logistic support from
Kinmen National Park of Taiwan.
Rapid Commun. Mass Spectrom. 2008; 22: 1235–1244
DOI: 10.1002/rcm

1244 Y.-M. Chang et al.
REFERENCES
1. Thomas JK, Noppenberger J. Am. J. Health-System Pharm.2007; 64: 149.
2. Chen H, Smith GJD, Li KS, Wang J, Fan XH, Rayner JM,Vijaykrishna D, Zhang JX, Zhang LJ, Guo CT, Cheung CL,Xu KM, Duan L, Huang K, Qin K, Leung YHC, Wu WL, LuHR, Chen Y, Xia NS, Naipospos TSP, Yuen KY, Hassan SS,Bahri S, Nguyen TD, Webster RG, Peiris JSM, Guan Y. Proc.Natl. Acad. Sci. USA 2006; 103: 2845.
3. Hulse-Post DJ, Sturm-Ramirez KM, Humberd J, Seiler P,Govorkova EA, Krauss S, Scholtissek C, Puthavathana P,Buranathai C, Nguyen TD, Long HT, Naipospos TSP, ChenH, Ellis TM, Guan Y, Peiris JSM, Webster RG. Proc. Natl.Acad. Sci. USA 2005; 102: 10682.
4. Liu J, Xiao H, Lei F, Zhu Q, Qin K, Zhang XW, Zhang XL,Zhao D, Wang G, Feng Y, Ma J, Liu W, Wang J, Gao GF.Science 2005; 309: 1206.
5. Sturm-Ramirez KM, Ellis T, Bousfield B, Bissett L, Dyrting K,Rehg JE, Poon L, Guan Y, PeirisM,Webster RG. J. Virol. 2004;78: 4892.
6. Gilbert M, Xiao XM, Domenech J, Lubroth J, Martin V,Slingenbergh J. Emerging Infectious Diseases 2006; 12: 1650.
7. Yasue M, Feare CJ, Bennun L, Fiedler W. Bioscience 2006; 56:923.
8. http://www.fao.org/docs/eims/upload//213826/AI_re-commandationswildbirds.pdf. Accessed 15 June 2007.
9. Hobson KA. Oecologia 1999; 120: 314.10. Webster MS, Marra PP, Haig SM, Bensch S, Holmes RT.
Trends Ecol. Evol. 2002; 17: 76.11. Sung WHT. Science 2005; 310: 235.12. http://www.fao.org/AG/againfo/subjects/documents/
ai/AVIbull032.pdf. Accessed 15 June 2007.13. http://www.fao.org/AG/againfo/subjects/documents/
ai/AVIbull035.pdf. Accessed 15 June 2007.14. Hobson KA, Bowen GJ, Wassenaar LI, Ferrand Y, Lormee H.
Oecologia 2004; 141: 477.15. Hobson KA, Wassenaar LI. Oecologia 1997; 109: 142.16. http://isohis.iaea.org/userupdate/Waterloo/index.html.
Accessed 15 June 2007.17. Johnsgard PA. Cormorants, Darters, and Pelicans of the World,
Smithsonian Institution Press: Washington and London,1993; 227.
18. Mizutani H, Fukuda M, Kabaya Y, Wada E. Auk 1990; 107:400.
19. Meehan TD, Rosenfield RN, Atudorei VN, Bielefeldt J,Rosenfield LJ, Stewart AC, Stout WE, Bozek MA. Condor2003; 105: 567.
20. Wunder MB, Kester CL, Knopf FL, Rye RO. Oecologia 2005;144: 607.
21. Knoff AJ, Macko SA, Erwin RM, Brown KM.Waterbirds 2002;25: 142.
22. Craig H. Geochim. Cosmochim. Acta 1957; 12: 133.23. Mariotti A. Nature 1983; 303: 685.24. Lajtha K, Michener RH. Stable Isotopes in Ecology and Environ-
mental Science. Blackwell Science: Oxford, 1994; xii.25. Manly BFJ. Multivariate Statistical Methods: A Primer. Chap-
man and Hall: New York, 1986; 101.26. Rocque DA, Ben-David M, Barry RP, Winker K. J. Ornithol.
2006; 147: 395.27. Hobson KA, Atwell L, Wassenaar LI. Proc. Natl. Acad. Sci.
USA 1999; 96: 8003.28. Smith BN, Ziegler H. Botanica Acta 1990; 103: 335.29. Johnsgard PA. Cormorants, Darters, and Pelicans of The World.
Smithsonian Institution Press: Washington and London,1993; 30.
30. Bearhop S, Thompson DR,Waldron S, Russell IC, AlexanderG, Furness RW. J. Appl. Ecol. 1999; 36: 75.
31. Winkler R. Der Ornithologische Beobachter 1987; 84: 317.
Copyright # 2008 John Wiley & Sons, Ltd.
32. Hobson KA, Brua RB, HohmanWL,Wassenaar LI.Auk 2000;117: 129.
33. Neto JM, Newton J, Gosler AG, Perrins CM. J. Avian Biol.2006; 37: 117.
34. Araguas-Araguas L, Froehlich K, Rozanski K. J. Geophys. Res. -Atmospheres 1998; 103: 28721.
35. Hebert CE, Hobson KA, Shutt JL. Environ. Sci. Technol. 2000;34: 1609.
36. Hoefs J. Stable Isotope Geochemistry (5th edn). Springer: Berlin,New York, 2004; 122.
37. Redfield AC, Friedman I. In Symposium on Marine Geochem-istry. Rhode Island University Narragansett Marine LaboratoryOccasional Publication, 1965; 149.
38. Owens NJP. Advances in Marine Biology 1987 24: 389.39. Schell DM, Barnett BA, Vinette KA. Marine Ecol. Prog. Ser.
1998; 162: 11.40. Fry B. Limnol. Oceanogr. 1988; 33: 1182.41. Hobson KA, Welch HE. Mar. Ecol. Prog. Ser. 1992; 84: 9.42. Hatch KA, Crawford MA, Kunz AW, Thomsen SR, Eggett
DL, Nelson ST, Roeder BL. Rapid Commun. Mass Spectrom.2006; 20: 3367.
43. Hobson KA, Alisauskas RT, Clark RG. Condor 1993; 95: 388.44. Fry B, Sherr EB. Contrib. Mar. Sci. 1984 27: 13.45. Rau GH, Mearns AJ, Young DR, Olsen RJ, Schafer HA,
Kaplan IR. Ecology 1983; 64: 1314.46. Peterson BJ, Fry B. Annu. Rev. Ecol. System. 1987; 18: 293.47. Chisholm BS, Nelson DE, Schwartz HP. Science 1982; 216:
1131.48. Craig H. Geochim. Cosmochim. Acta 1953; 3: 53.49. Estep MLF, Vigg S. Can. J. Fish. Aquat. Sci. 1985; 42: 1712.50. Fry B. Ecology 1991; 72: 2293.51. Hesslein RH, Capel MJ, Fox DE, Hallard KA. Can. J. Fish.
Aquat. Sci. 1991; 48: 2258.52. Thompson DR, Furness RW. Auk 1995; 112: 493.53. Hobson KA. Can. J. Zool. 1987; 65: 1210.54. Hobson KA. Condor 1990; 92: 897.55. Zhang TZ, Lian XM, Li LX, Cui QH, Li GY, Su JP. Zool. Res.
2003; 24: 235.56. ZhangTZ,LiLX,LianXM,CaiZY, Su JP.Waterbirds 2007; 30: 305.57. http://www.fao.org/docrep/field/003/U2896E/
U2896E00.htm#ch1. Accessed 15 January, 2008.58. Wood CM, Du JZ, Rogers J, Brauner CJ, Richards JG, Semple
JW, Murray BW, Chen XQ, Wang YX. Physiol. Biochem. Zool.2007; 80: 59.
59. Kline TC, Goering JJ, Mathisen OA, Poe PH, Parker PL. Can.J. Fish. Aquat. Sci. 1990; 47: 136.
60. Kline TC, Goering JJ, Mathisen OA, Poe PH, Parker PL,Scalan RS. Can. J. Fish. Aquat. Sci. 1993; 50: 2350.
61. Hobson KA, Welch HE. Can. J. Fish. Aquat. Sci. 1995; 52:1195.
62. Rosenfeld JS, Roff JC. J. N. Am. Benthological Soc. 1992; 11: 1.63. Aranyossy JF, Filly A, Tandia AA, Louvat D, Ousmane B,
Joseph A, Fontes J-C. In Isotope Techniques in Water ResourcesDevelopment. International Atomic Energy Agency: Vienna,1991; 309.
64. http://bna.birds.cornell.edu.erl.lib.byu.edu/bna/species/553/articles/introduction Accessed 15 January, 2008.
65. Zhang FY, Young RL. The Study of Migratory Birds of China.China Forestry Publishing House: Beijing, 1997; 119.
66. Meehan TD, Giermakowski JT, Cryan PM. Isot. Environ.Health Stud. 2004; 40: 291.
67. Birchall J, O’Connell TC, Heaton THE, Hedges REM. J. Anim.Ecol. 2005; 74: 877.
68. Doucett RR, Marks JC, Blinn DW, Caron M, Hungate BA.Ecology 2007; 88: 1587.
69. Malej A, Faganeli J, Pezdic J. Mar. Biol. 1993; 116: 565.70. Kelly JF, Ruegg KC, Smith TB. Ecological Applications 2005;
15: 1487.71. http://isohis.iaea.org/userupdate/Waterloo/index.html.
Rapid Commun. Mass Spectrom. 2008; 22: 1235–1244
DOI: 10.1002/rcm
Copyright © 2022 FDOKUMEN