
microRNA-214 contributes to melanoma tumour progression through suppression of TFAP2C
18
microRNA-214 contributes to melanoma tumour progression through suppression of TFAP2C Elisa Penna 1,2,10 , Francesca Orso 1,2,3,10 , Daniela Cimino 1,2,3 , Enrico Tenaglia 1,2 , Antonio Lembo 1,4 , Elena Quaglino 1,5 , Laura Poliseno 6 , Adele Haimovic 6 , Simona Osella-Abate 7 , Cristiano De Pitta ` 8 , Eva Pinatel 1,4 , Michael B Stadler 9 , Paolo Provero 1,4 , Maria Grazia Bernengo 7 , Iman Osman 6 and Daniela Taverna 1,2,3, * 1 Molecular Biotechnology Center (MBC), University of Torino, Torino, Italy, 2 Department of Oncological Sciences, University of Torino, Torino, Italy, 3 Center for Complex Systems in Molecular Biology and Medicine, University of Torino, Torino, Italy, 4 Department of Genetics, Biology and Biochemistry, University of Torino, Torino, Italy, 5 Department of Clinical and Biological Sciences, Universityof Torino, Torino, Italy, 6 Department of Dermatology, New York University Medical Center, New York, NY, USA, 7 Department of Biomedical Science and Human Oncology, Ist. Dermatologic Clinic, University of Torino, Torino, Italy, 8 Department of Biology and C.R.I.B.I.-Biotechnology Center, University of Padova, Padova, Italy and 9 Friederich Miescher Institute, Basel, Switzerland Malignant melanoma is fatal in its metastatic stage. It is therefore essential to unravel the molecular mechanisms that govern disease progression to metastasis. MicroRNAs (miRs) are endogenous non-coding RNAs involved in tumourigenesis. Using a melanoma progression model, we identified a novel pathway controlled by miR-214 that co- ordinates metastatic capability. Pathway components include TFAP2C, homologue of a well-established melanoma tumour suppressor, the adhesion receptor ITGA3 and multiple sur- face molecules. Modulation of miR-214 influences in vitro tumour cell movement and survival to anoikis as well as extravasation from blood vessels and lung metastasis forma- tion in vivo. Considering that miR-214 is known to be highly expressed in human melanomas, our data suggest a critical role for this miRNA in disease progression and the establish- ment of distant metastases. The EMBO Journal advance online publication, 5 April 2011; doi:10.1038/emboj.2011.102 Subject Categories: RNA; molecular biology of disease Keywords: extravasation; melanoma; miR-214; TFAP2C; tumour progression Introduction The ability of tumours to acquire malignancy and spread in their host organism is one of the main issues in cancer treatment, as metastasis formation accounts for 490% of human cancer deaths. Nevertheless, the understanding of the molecular mechanisms that regulate metastatic dissemina- tion remains fragmentary. The cascade of events that lead to metastasis is a complex multi-step process by which primary tumour cells acquire the ability to detach and invade adjacent tissues, intravasate, survive in the systemic circulation and translocate through the vasculature, adhere to the walls of capillaries of distant organs, extravasate in the parenchyma and finally proliferate in secondary tumours (Gupta and Massague, 2006). It is urgent to identify and characterize the genetic and epigenetic changes occurring during tumour progression. Several protein-coding genes involved in malignancy have been identified and characterized (Steeg, 2006; Nguyen et al, 2009). More recently, abnormalities in non-coding genes, such as microRNAs (miRs), have also been found to contribute to tumourigenesis (Croce, 2009; Valastyan and Weinberg, 2009). miRs are small endogenous non-coding RNAs able to post-transcriptionally downregulate expression of specific target genes by binding to the 3 0 UTRs of their mRNAs causing destabilization, degradation or transla- tion inhibition (Filipowicz et al, 2008; Bartel, 2009). The ability of miRs to achieve simultaneous fine tuning of numer- ous different target genes makes them fundamental regula- tors of cellular signalling and implicates them in tumour progression (Inui et al, 2010). Several miRs, such as miR-21, miR-10b, miR-373 and 520c, miR-126, miR-335, miR-31, miR- 200, miR-151 and miR-9, have already been reported to regulate tumour progression and metastasis (Valastyan and Weinberg, 2009; Ma et al, 2010). Malignant melanoma is one of the most aggressive human cancers (Parkin et al, 2005) which progresses very rapidly via specific steps characterized by defined molecular alterations. Melanomas arise when the melanocytes of the epidermis become transformed and start to proliferate abnormally, leading to radial and vertical growth phases and subsequent spreading all over the body (Melnikova and Bar-Eli, 2008). The transition from the non-invasive to the invasive and metastatic stage is accompanied by gain of function of a number of transcription factors such as CREB/ATF-1, ATF-2, NFkB, SNAIL and STATs, while the loss of the AP-2 transcription factors (TFAP2) positively correlates with malignancy. At the same time, alterations in the repertoire of adhesion molecules, including MCAM-MUC18, E-cadherin, N-cadherin and several integrins, as well as changes in genes involved in angiogenesis, invasion and survival, such as VEGF, bFGF, IL-8, c-KIT, EGFR, MMP2 and PAR-1, are linked to the acquirement of higher metastatic potential (Melnikova and Bar-Eli, 2008). Several miRs, including miR-137, miR-221/222, miR-182 and miR-34a, have already been found to be involved in melanoma progression by regulating key genes such as c-KIT, MITF, FOXO3, ITGB3, CCND1 and p27 Kip1 (Mueller and Bosserhoff, 2009). It now becomes fundamental to unravel how miRs control mela- noma aggressiveness. We identified a new pathway, coordinated by miR-214 and including TFAP2C, ITGA3 as well as multiple surface Received: 17 September 2010; accepted: 9 March 2011 *Corresponding author. Department of Oncological Sciences, Molecular Biotechnology Center (MBC), Universityof Torino, Via Nizza, 52, 10126 Torino, Italy. Tel.: þ 39 011 670 6497; Fax: þ 39 011 670 6432; E-mail: [email protected] 10 These authors contributed equally to this work The EMBO Journal (2011), 1–18 | & 2011 European Molecular Biology Organization | All Rights Reserved 0261-4189/11 www.embojournal.org & 2011 European Molecular Biology Organization The EMBO Journal EMBO THE EMBO JOURNAL THE EMBO JOURNAL 1
-
Upload
independent -
Category
Documents
-
view
0 -
download
0
Transcript of microRNA-214 contributes to melanoma tumour progression through suppression of TFAP2C
microRNA-214 contributes to melanoma tumourprogression through suppression of TFAP2C
Elisa Penna1,2,10, Francesca Orso1,2,3,10,Daniela Cimino1,2,3, Enrico Tenaglia1,2,Antonio Lembo1,4, Elena Quaglino1,5,Laura Poliseno6, Adele Haimovic6,Simona Osella-Abate7, Cristiano De Pitta8,Eva Pinatel1,4, Michael B Stadler9,Paolo Provero1,4, Maria Grazia Bernengo7,Iman Osman6 and Daniela Taverna1,2,3,*1Molecular Biotechnology Center (MBC), University of Torino, Torino,Italy, 2Department of Oncological Sciences, University of Torino, Torino,Italy, 3Center for Complex Systems in Molecular Biology and Medicine,University of Torino, Torino, Italy, 4Department of Genetics, Biology andBiochemistry, University of Torino, Torino, Italy, 5Department of Clinicaland Biological Sciences, University of Torino, Torino, Italy, 6Departmentof Dermatology, New York University Medical Center, New York, NY,USA, 7Department of Biomedical Science and Human Oncology, Ist.Dermatologic Clinic, University of Torino, Torino, Italy, 8Departmentof Biology and C.R.I.B.I.-Biotechnology Center, University of Padova,Padova, Italy and 9Friederich Miescher Institute, Basel, Switzerland
Malignant melanoma is fatal in its metastatic stage. It is
therefore essential to unravel the molecular mechanisms
that govern disease progression to metastasis. MicroRNAs
(miRs) are endogenous non-coding RNAs involved in
tumourigenesis. Using a melanoma progression model, we
identified a novel pathway controlled by miR-214 that co-
ordinates metastatic capability. Pathway components include
TFAP2C, homologue of a well-established melanoma tumour
suppressor, the adhesion receptor ITGA3 and multiple sur-
face molecules. Modulation of miR-214 influences in vitro
tumour cell movement and survival to anoikis as well as
extravasation from blood vessels and lung metastasis forma-
tion in vivo. Considering that miR-214 is known to be highly
expressed in human melanomas, our data suggest a critical
role for this miRNA in disease progression and the establish-
ment of distant metastases.
The EMBO Journal advance online publication, 5 April 2011;
doi:10.1038/emboj.2011.102
Subject Categories: RNA; molecular biology of disease
Keywords: extravasation; melanoma; miR-214; TFAP2C;
tumour progression
Introduction
The ability of tumours to acquire malignancy and spread in
their host organism is one of the main issues in cancer
treatment, as metastasis formation accounts for 490% of
human cancer deaths. Nevertheless, the understanding of the
molecular mechanisms that regulate metastatic dissemina-
tion remains fragmentary. The cascade of events that lead to
metastasis is a complex multi-step process by which primary
tumour cells acquire the ability to detach and invade adjacent
tissues, intravasate, survive in the systemic circulation and
translocate through the vasculature, adhere to the walls of
capillaries of distant organs, extravasate in the parenchyma
and finally proliferate in secondary tumours (Gupta and
Massague, 2006). It is urgent to identify and characterize
the genetic and epigenetic changes occurring during tumour
progression. Several protein-coding genes involved in
malignancy have been identified and characterized (Steeg,
2006; Nguyen et al, 2009). More recently, abnormalities in
non-coding genes, such as microRNAs (miRs), have also
been found to contribute to tumourigenesis (Croce, 2009;
Valastyan and Weinberg, 2009). miRs are small endogenous
non-coding RNAs able to post-transcriptionally downregulate
expression of specific target genes by binding to the 30UTRs of
their mRNAs causing destabilization, degradation or transla-
tion inhibition (Filipowicz et al, 2008; Bartel, 2009). The
ability of miRs to achieve simultaneous fine tuning of numer-
ous different target genes makes them fundamental regula-
tors of cellular signalling and implicates them in tumour
progression (Inui et al, 2010). Several miRs, such as miR-21,
miR-10b, miR-373 and 520c, miR-126, miR-335, miR-31, miR-
200, miR-151 and miR-9, have already been reported to
regulate tumour progression and metastasis (Valastyan and
Weinberg, 2009; Ma et al, 2010).
Malignant melanoma is one of the most aggressive human
cancers (Parkin et al, 2005) which progresses very rapidly via
specific steps characterized by defined molecular alterations.
Melanomas arise when the melanocytes of the epidermis
become transformed and start to proliferate abnormally,
leading to radial and vertical growth phases and subsequent
spreading all over the body (Melnikova and Bar-Eli, 2008).
The transition from the non-invasive to the invasive and
metastatic stage is accompanied by gain of function of
a number of transcription factors such as CREB/ATF-1,
ATF-2, NFkB, SNAIL and STATs, while the loss of the
AP-2 transcription factors (TFAP2) positively correlates with
malignancy. At the same time, alterations in the repertoire
of adhesion molecules, including MCAM-MUC18, E-cadherin,
N-cadherin and several integrins, as well as changes in
genes involved in angiogenesis, invasion and survival, such
as VEGF, bFGF, IL-8, c-KIT, EGFR, MMP2 and PAR-1, are
linked to the acquirement of higher metastatic potential
(Melnikova and Bar-Eli, 2008). Several miRs, including
miR-137, miR-221/222, miR-182 and miR-34a, have already
been found to be involved in melanoma progression by
regulating key genes such as c-KIT, MITF, FOXO3, ITGB3,
CCND1 and p27Kip1 (Mueller and Bosserhoff, 2009). It now
becomes fundamental to unravel how miRs control mela-
noma aggressiveness.
We identified a new pathway, coordinated by miR-214
and including TFAP2C, ITGA3 as well as multiple surfaceReceived: 17 September 2010; accepted: 9 March 2011
*Corresponding author. Department of Oncological Sciences, MolecularBiotechnology Center (MBC), University of Torino, Via Nizza, 52, 10126Torino, Italy. Tel.: þ 39 011 670 6497; Fax: þ 39 011 670 6432;E-mail: [email protected] authors contributed equally to this work
The EMBO Journal (2011), 1–18 | & 2011 European Molecular Biology Organization | All Rights Reserved 0261-4189/11
www.embojournal.org
&2011 European Molecular Biology Organization The EMBO Journal
EMBO
THE
EMBOJOURNAL
THE
EMBOJOURNAL
1
molecules, which controls melanoma metastasis dissemina-
tion by increasing migration, invasion, extravasation and
survival of melanoma cells.
Results
miR-214 is upregulated in a metastatic melanoma
model
To assess a potential correlation between deregulation of
miRs and melanoma malignancy, a miR profiling, which
will be presented elsewhere (Cimino et al, unpublished),
was performed in a melanoma progression model (Xu et al,
2008). The model consisted of a poorly metastatic A375
parental cell line (A375P) and its four highly metastatic
variants, MA-1, MA-2, MC-1 and MC-2 derived by repeated
passages in mice. Among the modulated miRs, miR-214 was
found to be differentially expressed comparing metastatic
(high) versus parental (low) cells in culture, as shown by
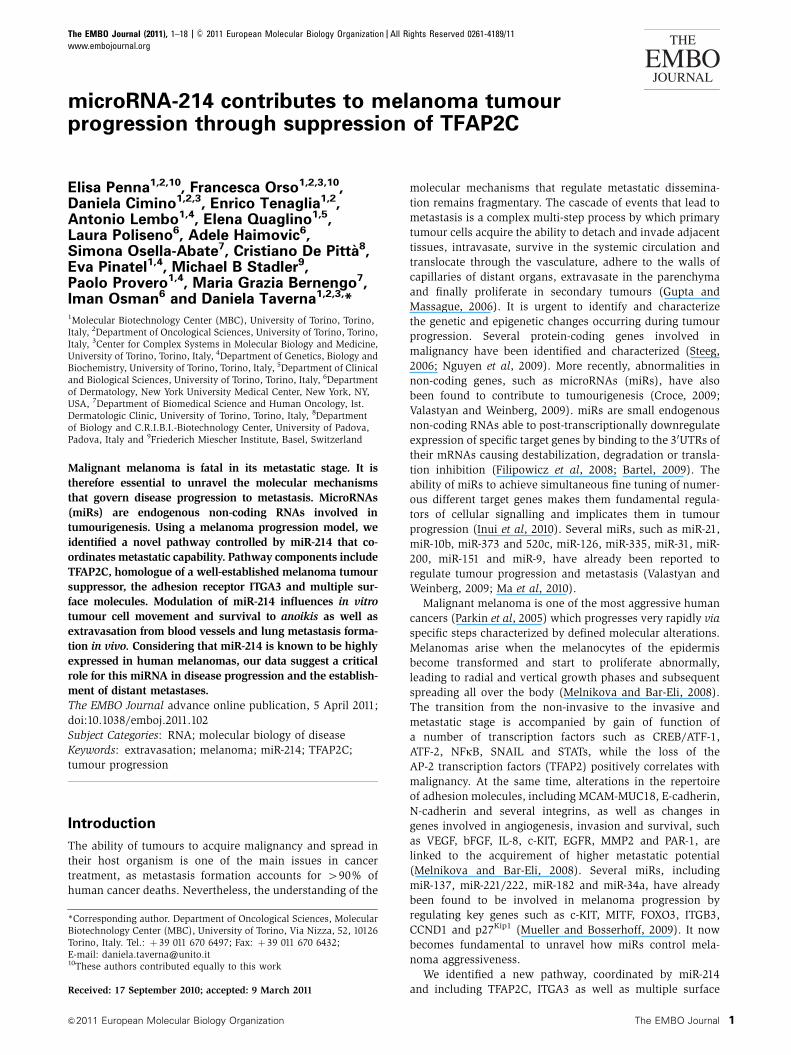
qRT–PCR (Figure 1A and B). miR-214 showed a very strong
enhancement of expression in samples derived from in vivo
lung metastases following tail vein injections of MA-2 cells in
immunodeficient mice (Figure 1B), suggesting an influence of
the microenvironment for high expression. Induction of miR-
214 expression in vivo was also observed in subcutaneous
tumours derived from different melanoma cell lines expres-
sing low miR-214 in culture (WK-Mel, GR4-Mel, 1300-Mel,
Dett-Mel, SK-Mel-173, SK-Mel-197) (Supplementary Figure S1A).
Other miRs, previously found to be involved in melanoma,
such as miR-34a, miR-221, miR-222 and miR-137, also
showed some differential expression in this system, however,
not as pronounced as miR-214 changes (Figure 1A). When we
extended expression analysis for miR-137 to other melanoma
malignant cell lines it resulted to be overexpressed in some of
them, such as WK-Mel, GR4-Mel, SK-Mel-173 and SK-Mel-197
compared with A375P. Instead no expression was detected in
1300-Mel, Dett-Mel and SK-Mel-187 cells (Supplementary
Figure S1B). Some miRs were poorly expressed or did not
show differential expression in our A375P isogenic model,
including miR-210, which we used as a control (Figure 1C).
miR-210 was expressed to some extent in most of the mela-
noma cells analysed although often at a low level (Supple-
mentary Figure S1C). Importantly, miR-214 copy number gain
was found in the genome of A375P, its MA-2 and MC-1
variants and in other melanoma cells, such as GR4-Mel,
2.55
7.510
0
2.55
7.510
0
pWPT-empty
pWPT-miR-214
Rel
ativ
e m
iR-2
14 le
vel
A375P
MA-2
MA-1
MC-2
MC-1
A B C
F G
MA-2
MC-1
******
**
*5
10
15
0
MC-1
2.55
7.510
0
2.55
7.510
0
***
Rel
ativ
e m
iR-2
10 le
vel
E
K
H
5
10
15
0
Mot
ility
(a.
u. ×
10–3
)M
igra
tion
(pix
els
× 10
5 )
Inva
sion
(pix
els
× 10
5 )
Adh
esio
n (p
ixel
s ×
105 )
Adh
esio
n (p
ixel
s ×
105 )
Mot
ility
(a.
u. ×
10–3
)
Mig
ratio
n (p
ixel
s ×
105 )
Mig
ratio
n (p
ixel
s ×
105 )
Inva
sion
(pi
xels
× 1
05 )
Inva
sion
(pi
xels
× 1
05 )
MA-2***
Rel
ativ
e m
iR le
vel
0
100
200
300
800
0
1
2
60
40
20
miR
-214
miR
-137
miR
-222
miR
-221
miR
-34a
A375PMA-2
1400
MA-2
met
s
Pre-control
Pre-miR-214
Pre-miR-210
**
Pre-control
Pre-miR-214
Pre-miR-210
Pre-control
Pre-miR-214
Anti-miR-214
Anti-miR-214
Anti-contro
l
Anti-miR-214
D
L
MA-2
2.55
7.510
0
12.5
17.515
20
2.55
7.510
0
12.5
17.515
20
MA-2
MA-2
MC-1
NS
NS
pWPT-miR-214
pWPT-empty
Anti-contro
l
Anti-contro
l
51015
*
***
***
NS NS
2
4
6
0Fibronectin Laminin Collagen IV
A375PPre-miR-214
2
4
6
0Fibronectin Laminin Collagen IV
MC-1 Anti-miR-214
**
*
***
** **
Pre-control Anti-control
I
J M
****
******
***
***
**NS NS
NS
510
50
400
A375P
MA-2
MA-1
MC-2
MC-1
MA-2
met
s
0
100
200
300
8001400
5101550
400
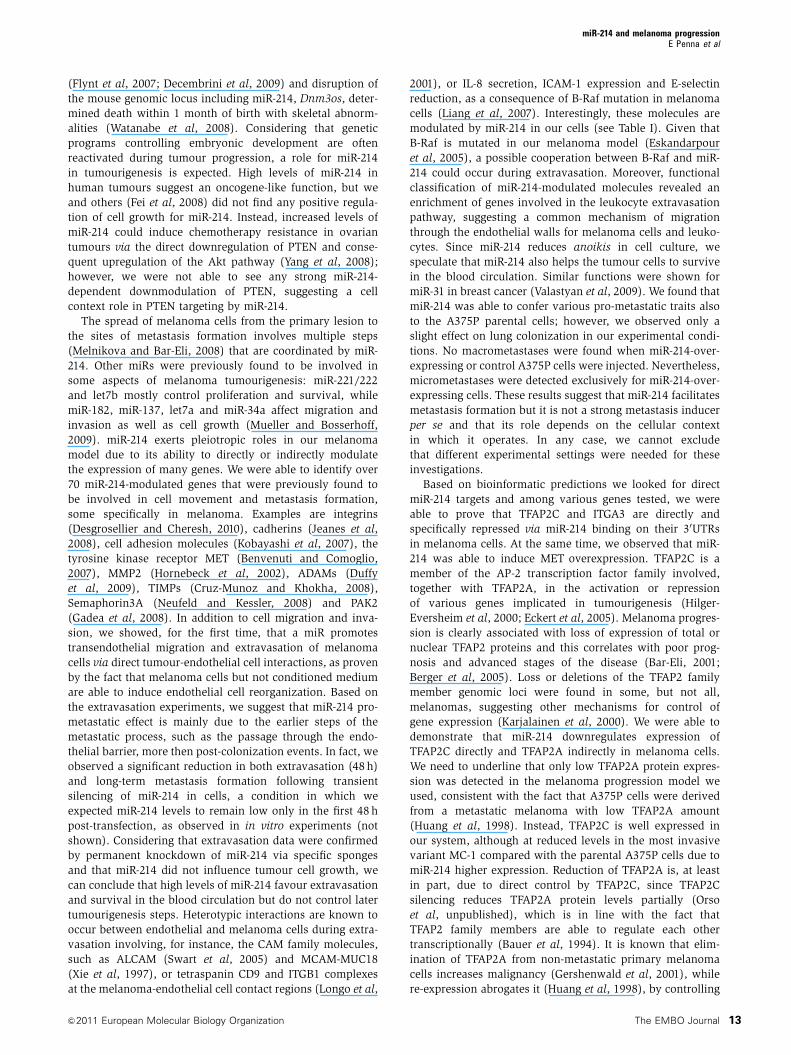
Figure 1 miR-214 modulates cell migration and invasion. (A–C) Expression levels of the indicated miRs were evaluated in A375P cells or in itsmetastatic variants MA-1, MA-2, MC-1, MC-2 or in a pool of MA-2-derived lung metastases (MA-2 mets) by qRT–PCR. Results are shown as foldchanges (mean±s.e.m.) relative to A375P cells, normalized on U44 RNA level. (D–M) Wound healing motility (D, E) or transwell migration ormatrigel invasion (F–K) or adhesion on fibronectin, laminin or collagen (L, M) assays for cells either transfected with the indicated miRprecursors or inhibitors or their negative controls (pre- and anti-miR or control) or stably transduced with pWPT-empty or miR-214overexpression vectors. Results are shown as mean±s.e.m. of the reciprocal of the wound size (motility assay) or of the area covered bymigrated or adherent cells (migration, invasion and adhesion assays). Two or three independent experiments were performed in triplicate andresults were either shown as representative ones (A–C) or pooled together (D–M). *Po0.05; **Po0.01; ***Po0.001.
miR-214 and melanoma progressionE Penna et al
The EMBO Journal &2011 European Molecular Biology Organization2
Dett-Mel, SK-Mel-103 and SK-Mel-187, as measured by geno-
mic qRT–PCR (Supplementary Figure S1D) and SNP (not
shown) analyses.
miR-214 expression enhances cell movement
The more pronounced expression of miR-214 in metastatic
cells prompted us to investigate the potential pro-metastatic
role of miR-214 by analysing cell movement following
miR-214 expression modulations.
We stably or transiently overexpressed miR-214 in the
miR-214-empty, poorly motile A375P cells and in the MA-2
metastatic variant, expressing an intermediate endogenous
level of miR-214 (see Figure 1B), as well as in other melano-
ma cells, such as 1300-Mel, SK-Mel-187, WK-Mel and GR4-
Mel, expressing low to undetectable miR-214 in culture
(see Supplementary Figure S1A), by lentiviral infections
with miR-214 expression or empty vectors (pWPT-miR-214
or pLemiR-214 or empty) or by transfections with miR-214
precursors or negative controls (pre-miR-214 or control).
Conversely, we silenced miR-214 in the highly motile and
invasive MC-1 and MC-2 variants following transfection with
specific miR-214 antisense inhibitors or negative controls
(anti-miR-214 or control). The efficacy of miR-214 modulations
was tested by qRT–PCRs; miR-214 expression was increased up
to 200 000- or 500-fold, respectively, in pre-miR-214 transiently
transfected cells and stable infected cells (Supplementary Figure
S2A–C) and almost completely silenced following miR-214
inhibition (Supplementary Figure S2D).
Significantly, miR-214 overexpression by pre-miR-214
transfection in MA-2 cells enhanced cell motility, migration
and invasion as evaluated by wound healing assays
(Figure 1D) or transwell assays in presence or absence of
matrigel (Figure 1F and G) compared with negative controls.
Migration and invasion were also increased 2–3-fold in stable
miR-214-overexpressing MA-2 cells compared with cells con-
taining the empty vector (Figure 1H and I). Moreover, miR-
214 overexpression was sufficient to promote a significant
increase in migration and/or invasion in poorly motile A375P
cells (pWPT-miR-214, Supplementary Figure S3A) and in
other unrelated melanoma cell lines, such as 1300-Mel,
SK-Mel-187, WK-Mel and GR4-Mel (pre-miR-214, Supplemen-
tary Figure S3E–J). The effects observed on cell movement in
the A375P isogenic model were specific for miR-214, since no
significant variation in migration or invasion was observed
following transient miR-210 overexpression (Figure 1F and
G). In line with these results, transient miR-214 downregula-
tion in MC-1 or MC-2 cells, following transfection with
anti-miR-214, led to a 50% reduction in motility in a wound
healing assay (Figure 1E, MC-1) and a 40–80% decrease
in migration and matrigel invasion in transwell assays
(Figures 1J and K, MC-1; Supplementary Figure S3B and C,
MC-2). miR-214 functions were also evaluated by stable
silencing in MC-1 cells using miR-214-specific sponges cloned
in the 30UTR of the green fluorescent protein (GFP) gene
(see Materials and methods). MC-1 cells were transduced
with pLenti-CMV-GFP-Puro-sponge1 (pLenti-sponge1) or
pLenti-CMV-GFP-Puro-sponge3 (pLenti-sponge3) or pLenti-
CMV-GFP-Puro (pLenti-empty) vectors and the efficacy of
each sponge was evaluated by measuring the expression of
the GFP in a western blot (WB) analysis (Supplementary
Figure S2E). In presence of pLenti-sponge1 or pLenti-sponge3
GFP expression was highly decreased, indicating the efficient
binding of miR-214 on the complementary sequences in the
30UTR of the GFP. As shown in Supplementary Figure S3D,
stable miR-214 silencing by sponge1 or sponge3 resulted in
impairment of MC-1 cell migration in vitro (transwell assays),
compared with control cells. Interestingly, miR-214 over-
expression (pre-miR-214) was also able to significantly in-
crease cell migration and matrigel invasion in other tumour
cells, including human MDA-MB-231 or murine 4T1 mam-
mary epithelial cancer cell lines (Supplementary Figures S2A
and S3K–N). When we looked for the involvement of
miR-214 in cell adhesion we observed significant adhesion
alterations on different extracellular matrices (ECMs). In
particular, transient miR-214 overexpression in A375P cells
improved adhesion on fibronectin, laminin and collagen
(1.5–3-fold increase), while miR-214 silencing in MC-1 cells
consistently resulted in comparable adhesion defects on these
matrices (Figure 1L and M).
Taken together, these results show that miR-214 signifi-
cantly enhances in vitro cell movement and modulates adhe-
sion, suggesting that it might facilitate metastasis formation
by favouring tumour cell invasion and adhesion to the
surrounding ECM.
miR-214 expression enhances metastasis formation
in vivo
Because of its ability to induce motility and invasion in vitro,
we asked whether miR-214 could influence cell movement
and metastasis formation in vivo. Thus, miR-214-overexpres-
sing MA-2 cells or miR-214-silenced MC-1 cells were injected
into the tail vein of immunodeficient SCID mice and the
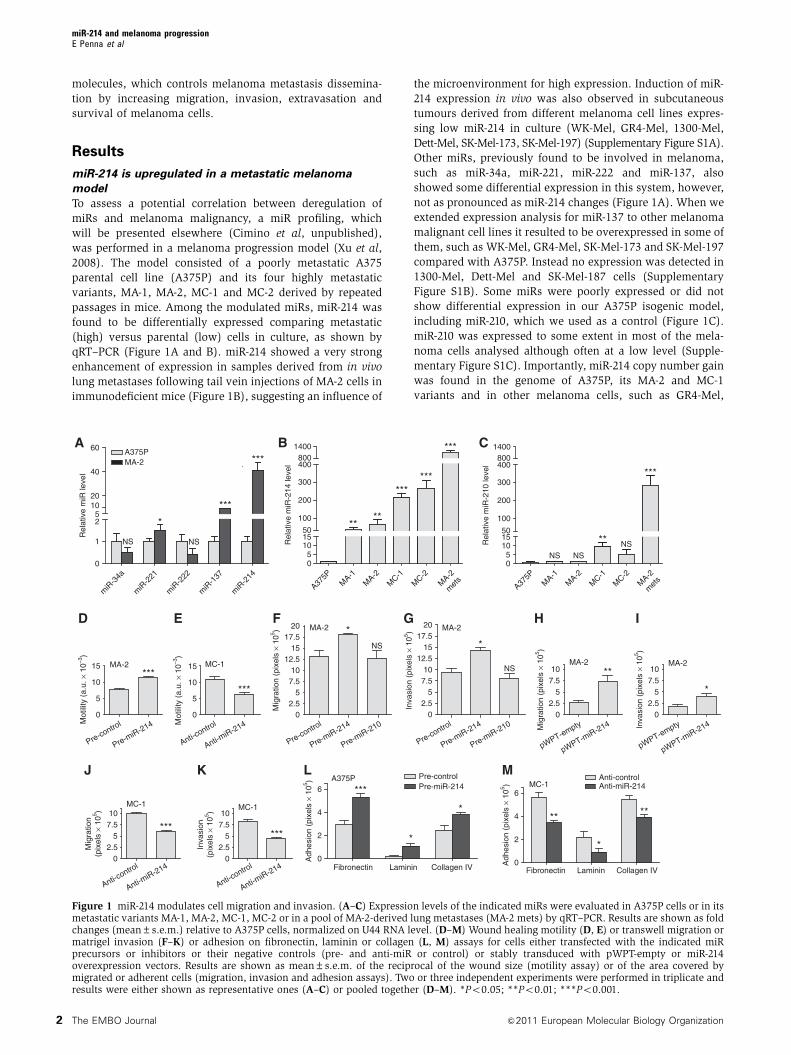
number of lung metastases was evaluated 7 weeks later. A
significantly higher number of macroscopic lung metastases
could be observed for miR-214-overexpressing (pWPT-miR-
214) MA-2 cells when compared with control (pWPT-empty)
cells (Figure 2A). To investigate whether miR-214 was able
to promote or regulate metastasis formation in the poorly
metastatic parental cells, miR-214-overexpressing (pWPT-
miR-214) or control (pWPT-empty) A375P cells were injected
into SCID mice. Metastasis formation was analysed 9 weeks
later and no macroscopic metastases were found on the lung
surface for the two groups of mice. However, histological
analyses revealed that 3 out of 10 mice injected with miR-214-
overexpressing cells contained small metastatic formations in
their lungs, while no micrometastases were found in control
mice (Supplementary Figure S4). In contrast, miR-214-
silenced MC-1 cells (by anti-miR-214 transfection) were signi-
ficantly impaired in their ability to seed lung metastases and
formed fewer lesions than the control (anti-control) cells
(Figure 2B). High miR-214 expression levels were also able
to enhance lung metastasis formation from a primary tumour.
In fact, when the 4T1 mammary epithelial cancer cells,
transduced with a lentiviral vector encoding for the turbo
red-fluorescent protein (tRFP) alone (pLemiR-empty) or for
miR-214 plus tRFP (pLemiR-214), were injected in mammary
fat pad of female BALB/c mice, a significantly higher dis-
tribution of red-fluorescent micrometastasis in the lungs was
observed for miR-214-overexpressing cells compared with
controls, 20 days after injection (Supplementary Figure S2C;
Figure 2C). However, miR-214-overexpressing cells gave rise
to similar sized primary tumours as control cells (not shown).
miR-214 enhancement effects on in vitro cell movement and
in vivo metastasis formation are directly ascribed to the
miR-214 and melanoma progressionE Penna et al
&2011 European Molecular Biology Organization The EMBO Journal 3
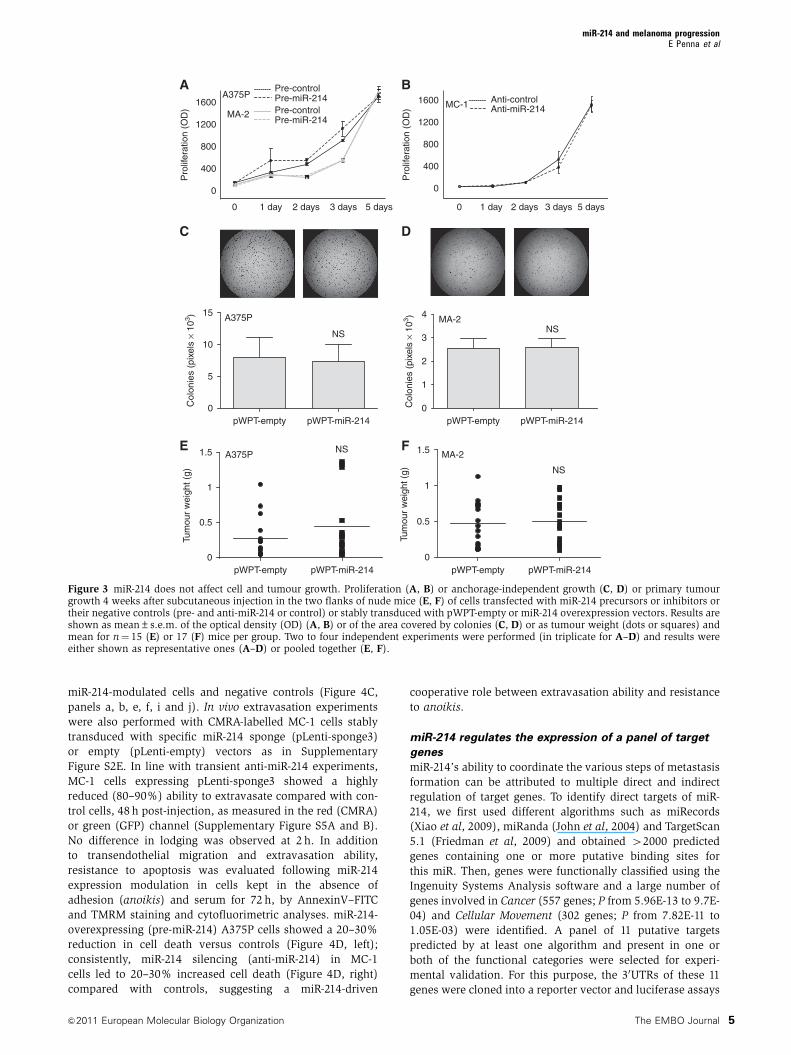
metastatic ability of the cells and not to proliferation effects.
In fact, miR-214 overexpression (pre-miR-214) in A375P and
MA-2 cells or miR-214 silencing (anti-miR-214) in MC-1 cells
did not influence in vitro proliferation compared with con-
trols (Figure 3A and B). Moreover, anchorage-independent
growth in soft agar was not affected, since the number and
the size of colonies for stable miR-214-overexpressing (pWPT-
miR-214) A375P and MA-2 cells were comparable with con-
trols (pWPT-empty) (Figure 3C and D). Furthermore, miR-214
did not influence primary tumour growth. In fact, when miR-
214-overexpressing (pWPT-miR-214) or control (pWPT-
empty) A375P or MA-2 cells were subcutaneously injected
in the flanks of nude mice, the final tumour weight was
similar for the different samples (Figure 3E and F).
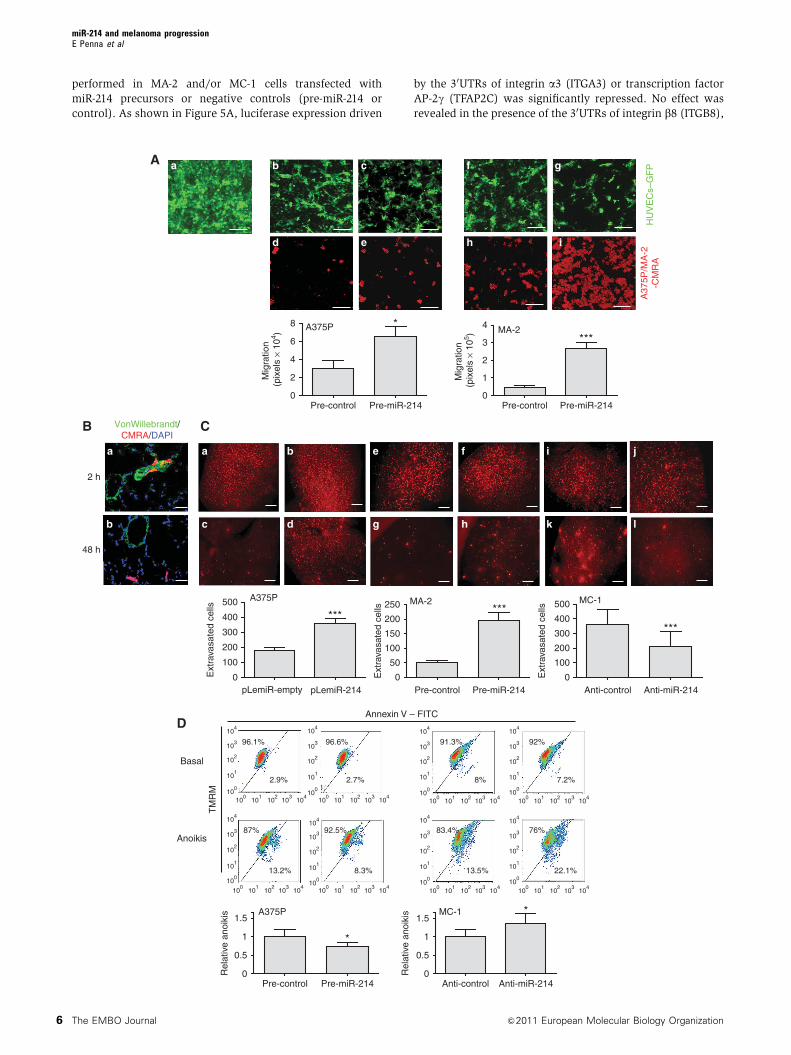
miR-214 modulates extravasation and survival
To assess the involvement of miR-214 in extravasation and
survival, we combined in vitro and in vivo experiments. We
first simulated transendothelial migration in vitro by seeding
CMRA-labelled (red) miR-214-overexpressing (pre-miR-214)
or control (pre-control) A375P or MA-2 cells in the upper
chambers of fibronectin-coated transwells, covered by a
confluent GFP-transduced human umbilical vein endothelial
cell (HUVEC) monolayer. The remodelling of the endothe-
lium and the consequent migration of melanoma cells in the
lower chamber of the transwell were then evaluated
(Figure 4A). The interaction of melanoma and endothelial
cells induced the formation of fenestrations in the HUVEC
monolayer. In the absence of melanoma cells (panel a) or
in the presence of melanoma cell-conditioned medium
(not shown), the HUVEC monolayer remains intact, suggest-
ing the requirement of a direct cell–cell contact. Interestingly,
the spaces formed in the endothelium were larger in the
presence of miR-214-overexpressing A375P or MA-2 cells,
compared with those formed with control cells (panels b, c,
f and g) and, consequently, an increased number of cells
migrated through the endothelial cells (panels d, e, h and i).
In conclusion, miR-214 overexpression in A375P and MA-2
cells resulted in a 2–3-fold more efficient transendothelial
migration. To evaluate the ability of miR-214 to influence
extravasation in vivo, we first demonstrated that cell extra-
vasation in the mouse lungs occurs within 48 h following
injection of any metastatic variant in the blood circulation.
For this, CMRA-labelled (red) negative control-transfected
MC-1 (Figure 4B) or MA-2 (not shown) cells were injected
in the tail vein of nude mice and their localization in the
lungs was evaluated at different times. Two hours after
injection, a high percentage of cells was located inside or
associated with the lung blood vessels (Figure 4B, panel a),
although some cells were already visible in the parenchyma
(not shown). Forty-eight hours after injection, most of the
cells present in the lungs appeared to be dispersed in the
parenchyma (Figure 4B, panel b). To evaluate the role of miR-
214 in the regulation of extravasation, CMRA-labelled miR-
214-overexpressing A375P or MA-2 cells (pLemiR-214 or pre-
miR-214, respectively) or silenced (anti-miR-214) MC-1 cells
were injected via tail vein in nude mice and their ability
to persist in the lungs was quantitated 48 h later. Two- or four-
fold increased extravasation was observed, respectively,
for miR-214-overexpressing A375P and MA-2 cells (Figure
4C, panels c, d, g and h), while about a 50% reduction in
extravasation ability was observed for miR-214-silenced
MC-1 cells (Figure 4C, panels k and l), compared with
controls. This was not the consequence of a different lod-
ging in the lung microvasculature, evaluated 2 h post-
injection, since no difference was observed between
A B Ce f
hg
a b
c d
Num
ber
of lu
ng m
etas
tase
s
pWPT-empty pWPT-miR-214
*MA-280
60
40
20
0
Anti-control Anti-miR-214
Num
ber
of lu
ng m
etas
tase
s
*
MC-1
0
150
100
50
i j
k l
pLemiR-214
0
**4T1
150
100
50
200
250
pLemiR-empty
Num
ber
of lu
ng m
etas
tase
s
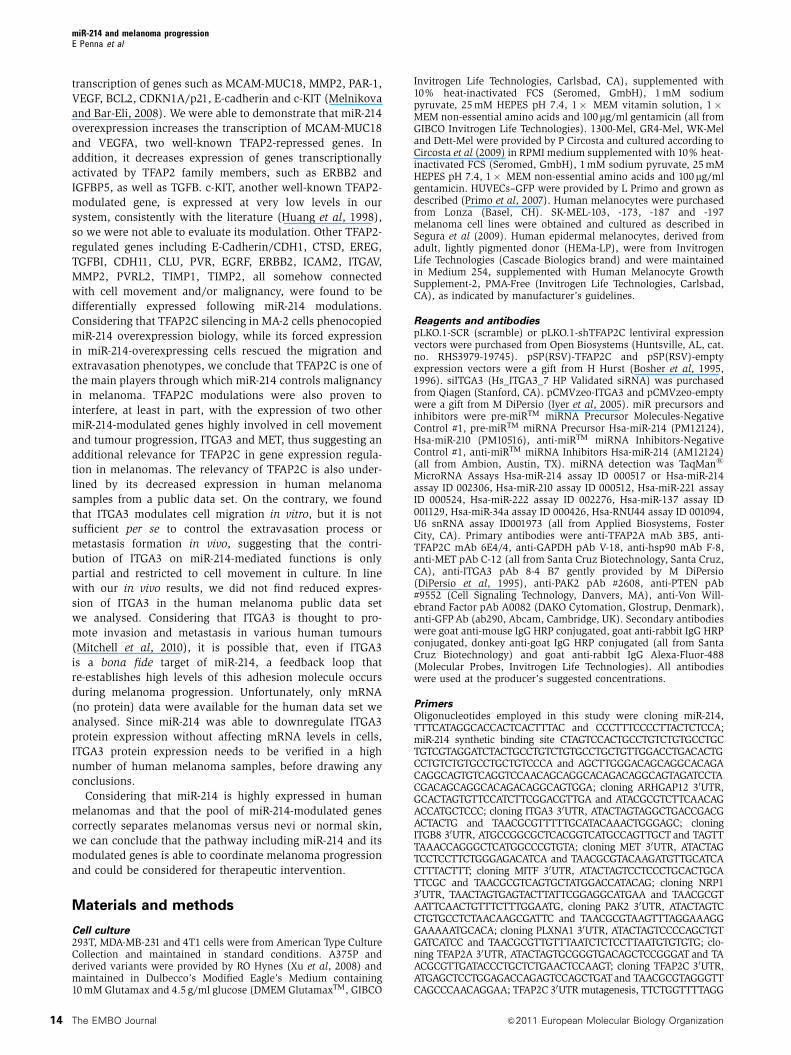
Figure 2 miR-214 enhances metastasis formation in vivo. (A, B) Metastasis formation in the lungs of SCID mice, 7 weeks after tail veininjection of MA-2 or MC-1 cells, stably transduced with pWPT-empty or miR-214 overexpression vectors (A) or transfected with miR-214inhibitors or negative controls (anti-miR-214 or control) (B). Total number of macroscopic metastases per lung is shown as box and whiskersplots with median and minimum/maximum (n¼ 5 mice per group). (C) Lung metastasis formation 3 weeks after injection of 4T1 cells stablytransduced with pLemiR-tRFP (pLemiR-empty) or pLemiR-miR-214 overexpression (pLemiR-214) vectors in the mammary fat pad of BALB/cmice. Number of red-fluorescent micrometastasis per lung is shown as mean±s.e.m. for n¼ 10 mice per group. Representative whole lung (a,b, e, f, i and j) and H&E staining (c, d, g, h, k and l) pictures are shown; bar¼ 1 mm and 100 mm, respectively. Two independent experimentswere performed and representative ones are shown (A, B) or results were pooled together (C). *Po0.05; **Po0.01.
miR-214 and melanoma progressionE Penna et al
The EMBO Journal &2011 European Molecular Biology Organization4
miR-214-modulated cells and negative controls (Figure 4C,
panels a, b, e, f, i and j). In vivo extravasation experiments
were also performed with CMRA-labelled MC-1 cells stably
transduced with specific miR-214 sponge (pLenti-sponge3)
or empty (pLenti-empty) vectors as in Supplementary
Figure S2E. In line with transient anti-miR-214 experiments,
MC-1 cells expressing pLenti-sponge3 showed a highly
reduced (80–90%) ability to extravasate compared with con-
trol cells, 48 h post-injection, as measured in the red (CMRA)
or green (GFP) channel (Supplementary Figure S5A and B).
No difference in lodging was observed at 2 h. In addition
to transendothelial migration and extravasation ability,
resistance to apoptosis was evaluated following miR-214
expression modulation in cells kept in the absence of
adhesion (anoikis) and serum for 72 h, by AnnexinV–FITC
and TMRM staining and cytofluorimetric analyses. miR-214-
overexpressing (pre-miR-214) A375P cells showed a 20–30%
reduction in cell death versus controls (Figure 4D, left);
consistently, miR-214 silencing (anti-miR-214) in MC-1
cells led to 20–30% increased cell death (Figure 4D, right)
compared with controls, suggesting a miR-214-driven
cooperative role between extravasation ability and resistance
to anoikis.
miR-214 regulates the expression of a panel of target
genes
miR-214’s ability to coordinate the various steps of metastasis
formation can be attributed to multiple direct and indirect
regulation of target genes. To identify direct targets of miR-
214, we first used different algorithms such as miRecords
(Xiao et al, 2009), miRanda (John et al, 2004) and TargetScan
5.1 (Friedman et al, 2009) and obtained 42000 predicted
genes containing one or more putative binding sites for
this miR. Then, genes were functionally classified using the
Ingenuity Systems Analysis software and a large number of
genes involved in Cancer (557 genes; P from 5.96E-13 to 9.7E-
04) and Cellular Movement (302 genes; P from 7.82E-11 to
1.05E-03) were identified. A panel of 11 putative targets
predicted by at least one algorithm and present in one or
both of the functional categories were selected for experi-
mental validation. For this purpose, the 30UTRs of these 11
genes were cloned into a reporter vector and luciferase assays
0
1.5
1
0.5
Tum
our
wei
ght (
g)
E FA375P MA-2NS
NS
0
1.5
1
0.5
Tum
our
wei
ght (
g)
pWPT-empty pWPT-miR-214 pWPT-empty pWPT-miR-214
Anti-controlAnti-miR-214
1600
1200
800
400
0 1 day 2 days 3 days 5 days
Pro
lifer
atio
n (O
D)
1600
1200
800
400
0
0 1 day 2 days 3 days 5 days
0
Pre-controlPre-miR-214A375P
MA-2 Pre-controlPre-miR-214
MC-1
A B
Pro
lifer
atio
n (O
D)
0
C D
1
2
3
4 MA-2NS
Col
onie
s (p
ixel
s ×
103 )
Col
onie
s (p
ixel
s ×
103 )15
10
5
0
A375P
NS
pWPT-empty pWPT-miR-214 pWPT-empty pWPT-miR-214
Figure 3 miR-214 does not affect cell and tumour growth. Proliferation (A, B) or anchorage-independent growth (C, D) or primary tumourgrowth 4 weeks after subcutaneous injection in the two flanks of nude mice (E, F) of cells transfected with miR-214 precursors or inhibitors ortheir negative controls (pre- and anti-miR-214 or control) or stably transduced with pWPT-empty or miR-214 overexpression vectors. Results areshown as mean±s.e.m. of the optical density (OD) (A, B) or of the area covered by colonies (C, D) or as tumour weight (dots or squares) andmean for n¼ 15 (E) or 17 (F) mice per group. Two to four independent experiments were performed (in triplicate for A–D) and results wereeither shown as representative ones (A–D) or pooled together (E, F).
miR-214 and melanoma progressionE Penna et al
&2011 European Molecular Biology Organization The EMBO Journal 5
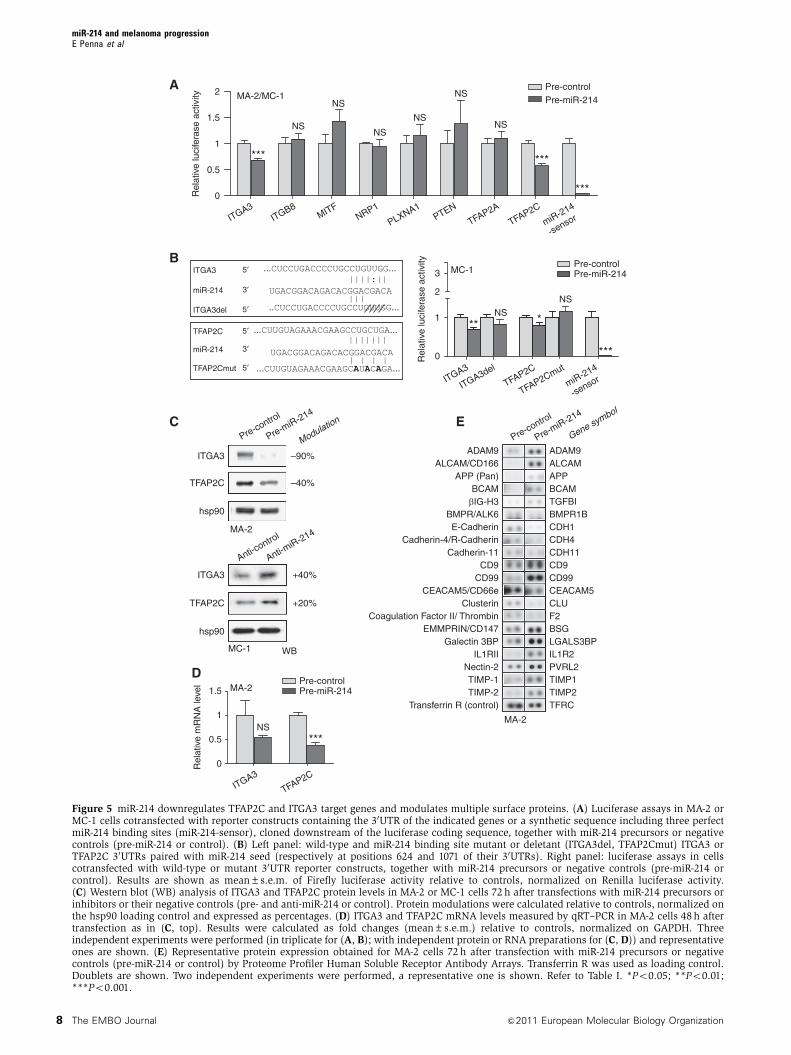
performed in MA-2 and/or MC-1 cells transfected with
miR-214 precursors or negative controls (pre-miR-214 or
control). As shown in Figure 5A, luciferase expression driven
by the 30UTRs of integrin a3 (ITGA3) or transcription factor
AP-2g (TFAP2C) was significantly repressed. No effect was
revealed in the presence of the 30UTRs of integrin b8 (ITGB8),
***
200
300
400
500
100
0
***
100
150
200
250
50
0Ext
rava
sate
d ce
lls
D
MA-2 MC-1
TM
RM
Annexin V – FITC
Basal
Anoikis
A375P MC-1
96.1%
2.9%
96.6%
2.7%
13.2% 8.3%
87% 92.5%
13.5%
83.4%
91.3%
8%
92%
7.2%
76%
22.1%
*
*
Pre-miR-214Pre-control
A
Pre-control Pre-miR-214
A375P MA-2
HU
VE
Cs–
GF
P
****
a b c f g
d e h i
8
0
4
2
6
4
3
1
2
0
Mig
ratio
n (p
ixel
s ×
104 )
Mig
ratio
n (p
ixel
s ×
105 )
A37
5P/M
A-2
-CM
RA
Pre-miR-214Pre-control
Anti-miR-214Anti-control
Pre-miR-214Pre-control Anti-miR-214Anti-control
Rel
ativ
e an
oiki
s
1
0
1.5
0.5
Rel
ativ
e an
oiki
s
1
0
1.5
0.5
Ext
rava
sate
d ce
lls
***
100
200
0
100
100
101
102
103
104
100
101
102
103
104
100
101
102
103
104
100
101
102
103
104
100
101
102
103
104
100
101
102
103
104
100
101
102
103
104
100
101
102
103
104
101
102
103
104
100
101
102
103
104
100
101
102
103
104
100
101
102
103
104
100
101
102
103
104
100
101
102
103
10410
010
110
210
310
410
010
110
210
310
4
Ext
rava
sate
d ce
lls
300
400
500
pLemiR-214pLemiR-empty
B
2 h
48 h
C
a
b
e f
g h
VonWillebrandt/CMRA/DAPI
A375P
a b
c d
i j
k l
miR-214 and melanoma progressionE Penna et al
The EMBO Journal &2011 European Molecular Biology Organization6
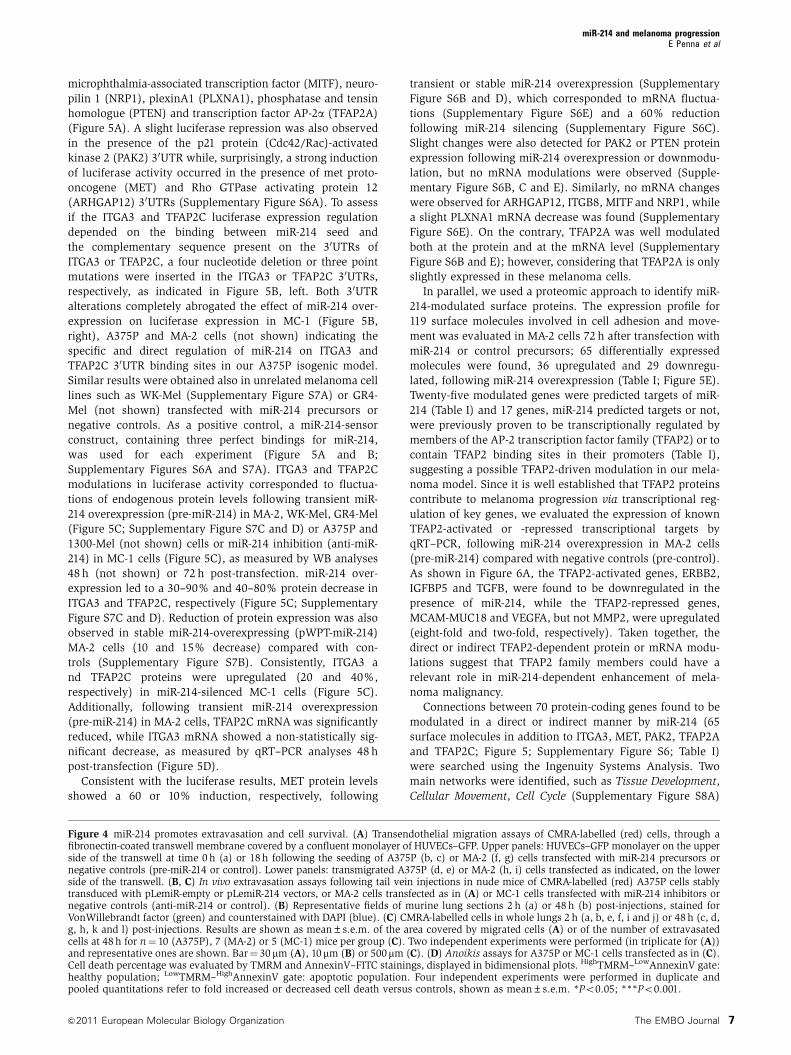
microphthalmia-associated transcription factor (MITF), neuro-
pilin 1 (NRP1), plexinA1 (PLXNA1), phosphatase and tensin
homologue (PTEN) and transcription factor AP-2a (TFAP2A)
(Figure 5A). A slight luciferase repression was also observed
in the presence of the p21 protein (Cdc42/Rac)-activated
kinase 2 (PAK2) 30UTR while, surprisingly, a strong induction
of luciferase activity occurred in the presence of met proto-
oncogene (MET) and Rho GTPase activating protein 12
(ARHGAP12) 30UTRs (Supplementary Figure S6A). To assess
if the ITGA3 and TFAP2C luciferase expression regulation
depended on the binding between miR-214 seed and
the complementary sequence present on the 30UTRs of
ITGA3 or TFAP2C, a four nucleotide deletion or three point
mutations were inserted in the ITGA3 or TFAP2C 30UTRs,
respectively, as indicated in Figure 5B, left. Both 30UTR
alterations completely abrogated the effect of miR-214 over-
expression on luciferase expression in MC-1 (Figure 5B,
right), A375P and MA-2 cells (not shown) indicating the
specific and direct regulation of miR-214 on ITGA3 and
TFAP2C 30UTR binding sites in our A375P isogenic model.
Similar results were obtained also in unrelated melanoma cell
lines such as WK-Mel (Supplementary Figure S7A) or GR4-
Mel (not shown) transfected with miR-214 precursors or
negative controls. As a positive control, a miR-214-sensor
construct, containing three perfect bindings for miR-214,
was used for each experiment (Figure 5A and B;
Supplementary Figures S6A and S7A). ITGA3 and TFAP2C
modulations in luciferase activity corresponded to fluctua-
tions of endogenous protein levels following transient miR-
214 overexpression (pre-miR-214) in MA-2, WK-Mel, GR4-Mel
(Figure 5C; Supplementary Figure S7C and D) or A375P and
1300-Mel (not shown) cells or miR-214 inhibition (anti-miR-
214) in MC-1 cells (Figure 5C), as measured by WB analyses
48 h (not shown) or 72 h post-transfection. miR-214 over-
expression led to a 30–90% and 40–80% protein decrease in
ITGA3 and TFAP2C, respectively (Figure 5C; Supplementary
Figure S7C and D). Reduction of protein expression was also
observed in stable miR-214-overexpressing (pWPT-miR-214)
MA-2 cells (10 and 15% decrease) compared with con-
trols (Supplementary Figure S7B). Consistently, ITGA3 a
nd TFAP2C proteins were upregulated (20 and 40%,
respectively) in miR-214-silenced MC-1 cells (Figure 5C).
Additionally, following transient miR-214 overexpression
(pre-miR-214) in MA-2 cells, TFAP2C mRNA was significantly
reduced, while ITGA3 mRNA showed a non-statistically sig-
nificant decrease, as measured by qRT–PCR analyses 48 h
post-transfection (Figure 5D).
Consistent with the luciferase results, MET protein levels
showed a 60 or 10% induction, respectively, following
transient or stable miR-214 overexpression (Supplementary
Figure S6B and D), which corresponded to mRNA fluctua-
tions (Supplementary Figure S6E) and a 60% reduction
following miR-214 silencing (Supplementary Figure S6C).
Slight changes were also detected for PAK2 or PTEN protein
expression following miR-214 overexpression or downmodu-
lation, but no mRNA modulations were observed (Supple-
mentary Figure S6B, C and E). Similarly, no mRNA changes
were observed for ARHGAP12, ITGB8, MITF and NRP1, while
a slight PLXNA1 mRNA decrease was found (Supplementary
Figure S6E). On the contrary, TFAP2A was well modulated
both at the protein and at the mRNA level (Supplementary
Figure S6B and E); however, considering that TFAP2A is only
slightly expressed in these melanoma cells.
In parallel, we used a proteomic approach to identify miR-
214-modulated surface proteins. The expression profile for
119 surface molecules involved in cell adhesion and move-
ment was evaluated in MA-2 cells 72 h after transfection with
miR-214 or control precursors; 65 differentially expressed
molecules were found, 36 upregulated and 29 downregu-
lated, following miR-214 overexpression (Table I; Figure 5E).
Twenty-five modulated genes were predicted targets of miR-
214 (Table I) and 17 genes, miR-214 predicted targets or not,
were previously proven to be transcriptionally regulated by
members of the AP-2 transcription factor family (TFAP2) or to
contain TFAP2 binding sites in their promoters (Table I),
suggesting a possible TFAP2-driven modulation in our mela-
noma model. Since it is well established that TFAP2 proteins
contribute to melanoma progression via transcriptional reg-
ulation of key genes, we evaluated the expression of known
TFAP2-activated or -repressed transcriptional targets by
qRT–PCR, following miR-214 overexpression in MA-2 cells
(pre-miR-214) compared with negative controls (pre-control).
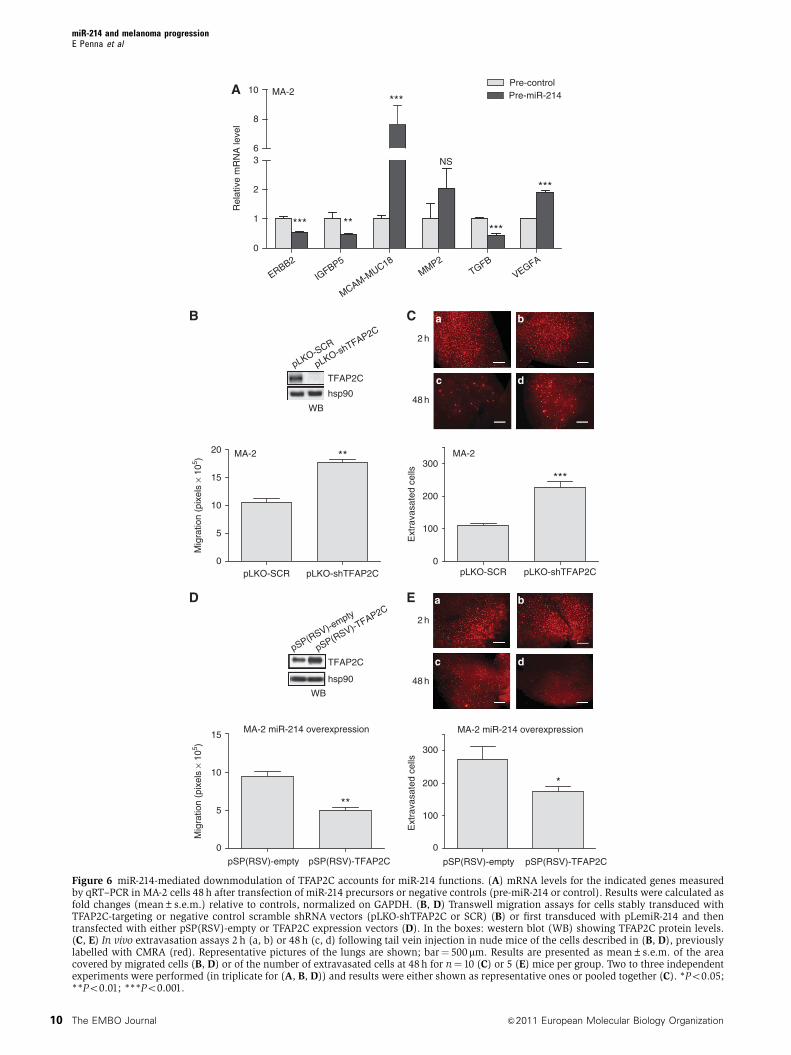
As shown in Figure 6A, the TFAP2-activated genes, ERBB2,
IGFBP5 and TGFB, were found to be downregulated in the
presence of miR-214, while the TFAP2-repressed genes,
MCAM-MUC18 and VEGFA, but not MMP2, were upregulated
(eight-fold and two-fold, respectively). Taken together, the
direct or indirect TFAP2-dependent protein or mRNA modu-
lations suggest that TFAP2 family members could have a
relevant role in miR-214-dependent enhancement of mela-
noma malignancy.
Connections between 70 protein-coding genes found to be
modulated in a direct or indirect manner by miR-214 (65
surface molecules in addition to ITGA3, MET, PAK2, TFAP2A
and TFAP2C; Figure 5; Supplementary Figure S6; Table I)
were searched using the Ingenuity Systems Analysis. Two
main networks were identified, such as Tissue Development,
Cellular Movement, Cell Cycle (Supplementary Figure S8A)
Figure 4 miR-214 promotes extravasation and cell survival. (A) Transendothelial migration assays of CMRA-labelled (red) cells, through afibronectin-coated transwell membrane covered by a confluent monolayer of HUVECs–GFP. Upper panels: HUVECs–GFP monolayer on the upperside of the transwell at time 0 h (a) or 18 h following the seeding of A375P (b, c) or MA-2 (f, g) cells transfected with miR-214 precursors ornegative controls (pre-miR-214 or control). Lower panels: transmigrated A375P (d, e) or MA-2 (h, i) cells transfected as indicated, on the lowerside of the transwell. (B, C) In vivo extravasation assays following tail vein injections in nude mice of CMRA-labelled (red) A375P cells stablytransduced with pLemiR-empty or pLemiR-214 vectors, or MA-2 cells transfected as in (A) or MC-1 cells transfected with miR-214 inhibitors ornegative controls (anti-miR-214 or control). (B) Representative fields of murine lung sections 2 h (a) or 48 h (b) post-injections, stained forVonWillebrandt factor (green) and counterstained with DAPI (blue). (C) CMRA-labelled cells in whole lungs 2 h (a, b, e, f, i and j) or 48 h (c, d,g, h, k and l) post-injections. Results are shown as mean±s.e.m. of the area covered by migrated cells (A) or of the number of extravasatedcells at 48 h for n¼ 10 (A375P), 7 (MA-2) or 5 (MC-1) mice per group (C). Two independent experiments were performed (in triplicate for (A))and representative ones are shown. Bar¼ 30 mm (A), 10mm (B) or 500mm (C). (D) Anoikis assays for A375P or MC-1 cells transfected as in (C).Cell death percentage was evaluated by TMRM and AnnexinV–FITC stainings, displayed in bidimensional plots. HighTMRM–LowAnnexinV gate:healthy population; LowTMRM–HighAnnexinV gate: apoptotic population. Four independent experiments were performed in duplicate andpooled quantitations refer to fold increased or decreased cell death versus controls, shown as mean±s.e.m. *Po0.05; ***Po0.001.
miR-214 and melanoma progressionE Penna et al
&2011 European Molecular Biology Organization The EMBO Journal 7
AMA-2/MC-1
Rel
ativ
e lu
cife
rase
act
ivity 2
1
0
B
TFAP2C
miR-214
...CUUGUAGAAACGAAGCCUGCUGA... UGACGGACAGACACGGACGACA...CUUGUAGAAACGAAGCAUACAGA...
...CUCCUGACCCCUGCCUGUUGG...
UGACGGACAGACACGGACGACAmiR-214
ITGA3 5′
3′
..CUCCUGACCCCUGCCUGUUGG...
ITGA3del
TFAP2Cmut
3
2
1
0Rel
ativ
e lu
cife
rase
act
ivity
MC-1
TFAP2Cmut
*
***|||||||
| | | |
NS
NS
ITGA3del
miR-214
-sensorTFAP2CITGA3
Pre-miR-214Pre-control
3′
5′
5′
**5′
||||:|||||
miR-214
-sensorITGA3ITGB8
MITFNRP1
PLXNA1
TFAP2A
TFAP2CPTEN
Pre-miR-214Pre-control
NS
*** ***
***
NS
NS
NS
NS
NS
0.5
1.5
Pre-control
MA-2
–40%
–90% ITGA3
TFAP2C
hsp90
C E
D
Anti-contro
l
Anti-miR-214
MC-1
+20%
+40%
Pre-miR-214
Modulation
WB
Transferrin R (control)
ADAM9ALCAM/CD166
APP (Pan)BCAM
CD99
IL1RII
TIMP-1TIMP-2
Clusterin
EMMPRIN/CD147
βIG-H3
Galectin 3BP
Nectin-2
BMPR/ALK6
CD9
CEACAM5/CD66e
Coagulation Factor II/ Thrombin
E-CadherinCadherin-4/R-Cadherin
Cadherin-11
MA-2
Pre-control
Pre-miR-214
Gene symbol
ADAM9ALCAMAPP
TGFBIBCAM
BMPR1BCDH1CDH4CDH11
CD99CD9
CEACAM5CLUF2BSGLGALS3BPIL1R2PVRL2TIMP1TIMP2TFRC
ITGA3
TFAP2C
hsp90
***NS
1
0
0.5
1.5
ITGA3
TFAP2C
Rel
ativ
e m
RN
A le
vel MA-2 Pre-miR-214
Pre-control
Figure 5 miR-214 downregulates TFAP2C and ITGA3 target genes and modulates multiple surface proteins. (A) Luciferase assays in MA-2 orMC-1 cells cotransfected with reporter constructs containing the 30UTR of the indicated genes or a synthetic sequence including three perfectmiR-214 binding sites (miR-214-sensor), cloned downstream of the luciferase coding sequence, together with miR-214 precursors or negativecontrols (pre-miR-214 or control). (B) Left panel: wild-type and miR-214 binding site mutant or deletant (ITGA3del, TFAP2Cmut) ITGA3 orTFAP2C 30UTRs paired with miR-214 seed (respectively at positions 624 and 1071 of their 30UTRs). Right panel: luciferase assays in cellscotransfected with wild-type or mutant 30UTR reporter constructs, together with miR-214 precursors or negative controls (pre-miR-214 orcontrol). Results are shown as mean±s.e.m. of Firefly luciferase activity relative to controls, normalized on Renilla luciferase activity.(C) Western blot (WB) analysis of ITGA3 and TFAP2C protein levels in MA-2 or MC-1 cells 72 h after transfections with miR-214 precursors orinhibitors or their negative controls (pre- and anti-miR-214 or control). Protein modulations were calculated relative to controls, normalized onthe hsp90 loading control and expressed as percentages. (D) ITGA3 and TFAP2C mRNA levels measured by qRT–PCR in MA-2 cells 48 h aftertransfection as in (C, top). Results were calculated as fold changes (mean±s.e.m.) relative to controls, normalized on GAPDH. Threeindependent experiments were performed (in triplicate for (A, B); with independent protein or RNA preparations for (C, D)) and representativeones are shown. (E) Representative protein expression obtained for MA-2 cells 72 h after transfection with miR-214 precursors or negativecontrols (pre-miR-214 or control) by Proteome Profiler Human Soluble Receptor Antibody Arrays. Transferrin R was used as loading control.Doublets are shown. Two independent experiments were performed, a representative one is shown. Refer to Table I. *Po0.05; **Po0.01;***Po0.001.
miR-214 and melanoma progressionE Penna et al
The EMBO Journal &2011 European Molecular Biology Organization8
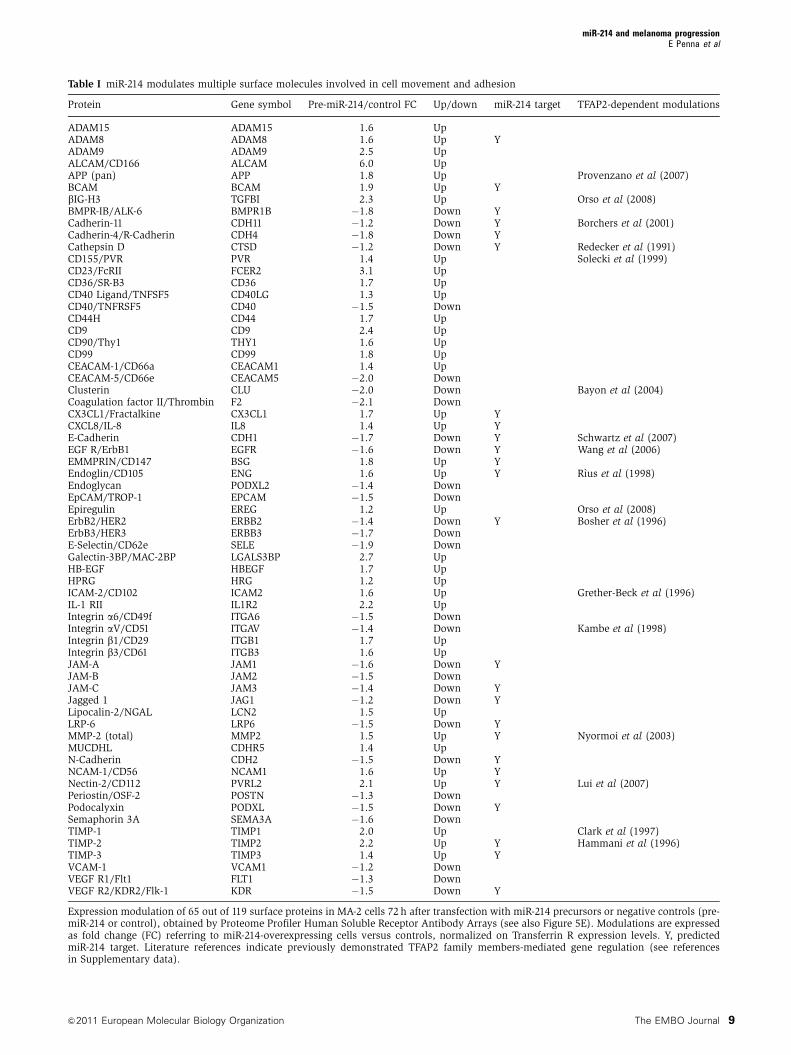
Table I miR-214 modulates multiple surface molecules involved in cell movement and adhesion
Protein Gene symbol Pre-miR-214/control FC Up/down miR-214 target TFAP2-dependent modulations
ADAM15 ADAM15 1.6 UpADAM8 ADAM8 1.6 Up YADAM9 ADAM9 2.5 UpALCAM/CD166 ALCAM 6.0 UpAPP (pan) APP 1.8 Up Provenzano et al (2007)BCAM BCAM 1.9 Up YbIG-H3 TGFBI 2.3 Up Orso et al (2008)BMPR-IB/ALK-6 BMPR1B �1.8 Down YCadherin-11 CDH11 �1.2 Down Y Borchers et al (2001)Cadherin-4/R-Cadherin CDH4 �1.8 Down YCathepsin D CTSD �1.2 Down Y Redecker et al (1991)CD155/PVR PVR 1.4 Up Solecki et al (1999)CD23/FcRII FCER2 3.1 UpCD36/SR-B3 CD36 1.7 UpCD40 Ligand/TNFSF5 CD40LG 1.3 UpCD40/TNFRSF5 CD40 �1.5 DownCD44H CD44 1.7 UpCD9 CD9 2.4 UpCD90/Thy1 THY1 1.6 UpCD99 CD99 1.8 UpCEACAM-1/CD66a CEACAM1 1.4 UpCEACAM-5/CD66e CEACAM5 �2.0 DownClusterin CLU �2.0 Down Bayon et al (2004)Coagulation factor II/Thrombin F2 �2.1 DownCX3CL1/Fractalkine CX3CL1 1.7 Up YCXCL8/IL-8 IL8 1.4 Up YE-Cadherin CDH1 �1.7 Down Y Schwartz et al (2007)EGF R/ErbB1 EGFR �1.6 Down Y Wang et al (2006)EMMPRIN/CD147 BSG 1.8 Up YEndoglin/CD105 ENG 1.6 Up Y Rıus et al (1998)Endoglycan PODXL2 �1.4 DownEpCAM/TROP-1 EPCAM �1.5 DownEpiregulin EREG 1.2 Up Orso et al (2008)ErbB2/HER2 ERBB2 �1.4 Down Y Bosher et al (1996)ErbB3/HER3 ERBB3 �1.7 DownE-Selectin/CD62e SELE �1.9 DownGalectin-3BP/MAC-2BP LGALS3BP 2.7 UpHB-EGF HBEGF 1.7 UpHPRG HRG 1.2 UpICAM-2/CD102 ICAM2 1.6 Up Grether-Beck et al (1996)IL-1 RII IL1R2 2.2 UpIntegrin a6/CD49f ITGA6 �1.5 DownIntegrin aV/CD51 ITGAV �1.4 Down Kambe et al (1998)Integrin b1/CD29 ITGB1 1.7 UpIntegrin b3/CD61 ITGB3 1.6 UpJAM-A JAM1 �1.6 Down YJAM-B JAM2 �1.5 DownJAM-C JAM3 �1.4 Down YJagged 1 JAG1 �1.2 Down YLipocalin-2/NGAL LCN2 1.5 UpLRP-6 LRP6 �1.5 Down YMMP-2 (total) MMP2 1.5 Up Y Nyormoi et al (2003)MUCDHL CDHR5 1.4 UpN-Cadherin CDH2 �1.5 Down YNCAM-1/CD56 NCAM1 1.6 Up YNectin-2/CD112 PVRL2 2.1 Up Y Lui et al (2007)Periostin/OSF-2 POSTN �1.3 DownPodocalyxin PODXL �1.5 Down YSemaphorin 3A SEMA3A �1.6 DownTIMP-1 TIMP1 2.0 Up Clark et al (1997)TIMP-2 TIMP2 2.2 Up Y Hammani et al (1996)TIMP-3 TIMP3 1.4 Up YVCAM-1 VCAM1 �1.2 DownVEGF R1/Flt1 FLT1 �1.3 DownVEGF R2/KDR2/Flk-1 KDR �1.5 Down Y
Expression modulation of 65 out of 119 surface proteins in MA-2 cells 72 h after transfection with miR-214 precursors or negative controls (pre-miR-214 or control), obtained by Proteome Profiler Human Soluble Receptor Antibody Arrays (see also Figure 5E). Modulations are expressedas fold change (FC) referring to miR-214-overexpressing cells versus controls, normalized on Transferrin R expression levels. Y, predictedmiR-214 target. Literature references indicate previously demonstrated TFAP2 family members-mediated gene regulation (see referencesin Supplementary data).
miR-214 and melanoma progressionE Penna et al
&2011 European Molecular Biology Organization The EMBO Journal 9
E
**
pSP(RSV)-empty pSP(RSV)-TFAP2C
pLKO-SCR pLKO-shTFAP2C
5
10
0
20
15
MA-2
Mig
ratio
n (p
ixel
s ×
105 ) **
Mig
ratio
n (p
ixel
s ×
105 )
5
10
0
15MA-2 miR-214 overexpression
B C
D
2 h
48 h
2 h
48 h
***
MA-2
Ext
rava
sate
d ce
lls
100
200
0
300
pLKO-SCR pLKO-shTFAP2C
100
200
0
MA-2 miR-214 overexpression
*
300
Ext
rava
sate
d ce
lls
pSP(RSV)-empty pSP(RSV)-TFAP2C
TFAP2C
hsp90
pLKO-SCR
pLKO-shTFAP2C
WB
TFAP2C
hsp90
pSP(RSV)-empty
pSP(RSV)-TFAP2C
WB
0
1
2
36
8
10
Rel
ativ
e m
RN
A le
vel
MA-2A
***
NS
***
***
***
**
Pre-miR-214Pre-control
ERBB2
IGFBP5
MCAM-MUC18
MMP2TGFB
VEGFA
a b
c d
a b
c d
Figure 6 miR-214-mediated downmodulation of TFAP2C accounts for miR-214 functions. (A) mRNA levels for the indicated genes measuredby qRT–PCR in MA-2 cells 48 h after transfection of miR-214 precursors or negative controls (pre-miR-214 or control). Results were calculated asfold changes (mean±s.e.m.) relative to controls, normalized on GAPDH. (B, D) Transwell migration assays for cells stably transduced withTFAP2C-targeting or negative control scramble shRNA vectors (pLKO-shTFAP2C or SCR) (B) or first transduced with pLemiR-214 and thentransfected with either pSP(RSV)-empty or TFAP2C expression vectors (D). In the boxes: western blot (WB) showing TFAP2C protein levels.(C, E) In vivo extravasation assays 2 h (a, b) or 48 h (c, d) following tail vein injection in nude mice of the cells described in (B, D), previouslylabelled with CMRA (red). Representative pictures of the lungs are shown; bar¼ 500 mm. Results are presented as mean±s.e.m. of the areacovered by migrated cells (B, D) or of the number of extravasated cells at 48 h for n¼ 10 (C) or 5 (E) mice per group. Two to three independentexperiments were performed (in triplicate for (A, B, D)) and results were either shown as representative ones or pooled together (C). *Po0.05;**Po0.01; ***Po0.001.
miR-214 and melanoma progressionE Penna et al
The EMBO Journal &2011 European Molecular Biology Organization10
and Cell-To-Cell Signalling and Interaction, Tissue Develop-
ment, Embryonic Development (Supplementary Figure S8B).
A top pathway was also identified, Leukocyte Extravasation
Signalling (not shown), including CD44, CD99, ITGB1, MMP2,
JAM2, JAM3, VCAM1 and TIMPs, genes potentially involved
in tumour cell movement and blood vessel extravasation.
miR-214-mediated downmodulation of TFAP2C and
ITGA3 controls miR-214 functions
As presented above, miR-214 is able to modulate TFAP2C and
genes known to be transcriptionally regulated by the TFAP2
family members. To investigate if the metastatic effects
of miR-214 in this melanoma model could be explained, in
part, via its TFAP2C target we first analysed how TFAP2C
silencing affected in vitro and in vivo cell movement. MA-2
cells were transduced with either specific TFAP2C or scram-
ble negative control (pLKO-shTFAP2C or SCR) shRNA lenti-
viral vectors, leading to almost complete silencing of TFAP2C
expression as measured by WB analysis (Figure 6B, top).
TFAP2C-silenced cells were used for in vitro cell migration
and in vivo extravasation experiments leading to results that
phenocopied miR-214 overexpression. Indeed, 41.5-fold in-
creased in vitro cell migration (Figure 6B) and extravasation
in the lungs 48 h following tail vein injections (Figure 6C,
panels c and d) were observed. No effect on the initial lodging
of silenced cells in the lung vasculature 2 h post-injection
was observed (Figure 6C, panels a and b). Hence, we
asked whether the pro-metastatic phenotype associated
with miR-214 overexpression could be rescued by TFAP2C
overexpression in miR-214-overexpressing cells. For this pur-
pose, a TFAP2C expression construct lacking its 30UTR
(pSP(RSV)-TFAP2C) was transiently transfected in stable
miR-214-overexpressing MA-2 cells (Supplementary Figure
S2C), as shown by WB in Figure 6D, top. Remarkably, a
40% decrease in in vitro cell migration (Figure 6D) and a
significant impairment of in vivo lung extravasation at 48 h
(Figure 6E) were observed compared with pSP(RSV)-empty
controls. In conclusion, these experiments proved that
TFAP2C is a major functional player downstream of miR-
214, in fact, its direct repression by miR-214 contributes to
increased melanoma pro-metastatic traits.
The functional impact of ITGA3 modulation via miR-214
was evaluated with similar approaches, by in vitro migration
and in vivo extravasation assays. For this purpose, ITGA3 was
silenced in MA-2 cells following transfections with specific
siRNAs (si-ITGA3), leading to strong protein downregulation
compared with negative control cells (si-control), as evalu-
ated by WB (Supplementary Figure S9A, top). In parallel,
ITGA3 overexpression was obtained in miR-214-overexpres-
sing MA-2 cells following transfection with a 30UTR-deprived
ITGA3 expression construct (pCMVzeo-ITGA3), compared
with control (pCMVzeo-empty) cells (Supplementary Figure
S9C, top). A significant increase in cell migration (Supple-
mentary Figure S9A) was found in ITGA3-silenced cells,
compared with controls, while decreased cell migration
(Supplementary Figure S9C) was found for miR-214/ITGA3-
overexpressing cells compared with controls. In contrast,
lung extravasation of CMRA-labelled cells, 48 h post-injection
as well as the lodging in the lung vasculature 2 h post-
injection were not affected by ITGA3 silencing or overexpres-
sion (Supplementary Figures S9B and D). This observation is
reinforced by the fact that long-term metastasis formation,
7 weeks following tail vein injection, was also not affected by
ITGA3 overexpression in miR-214-overexpressing MA-2 cells
(not shown).
Finally, the effect of TFAP2C on ITGA3 and MET protein
expression was evaluated in MA-2 cells following TFAP2C
silencing or overexpression. As shown in Supplementary
Figure S10, only a slight protein modulation was observed
for ITGA3 following TFAP2C silencing (10% reduction, left)
or overexpression (10% increase, right). In contrast, MET
protein expression strongly increased (over 100%) following
stable TFAP2C silencing and decreased (20% reduction)
when TFAP2C was transiently overexpressed (Supplemen-
tary Figure S10). These data suggest that the miR-214-depen-
dent regulation of MET and ITGA3 is at least in part mediated
by TFAP2C.
Expression of miR-214 and its modulated genes in
human melanoma tumours
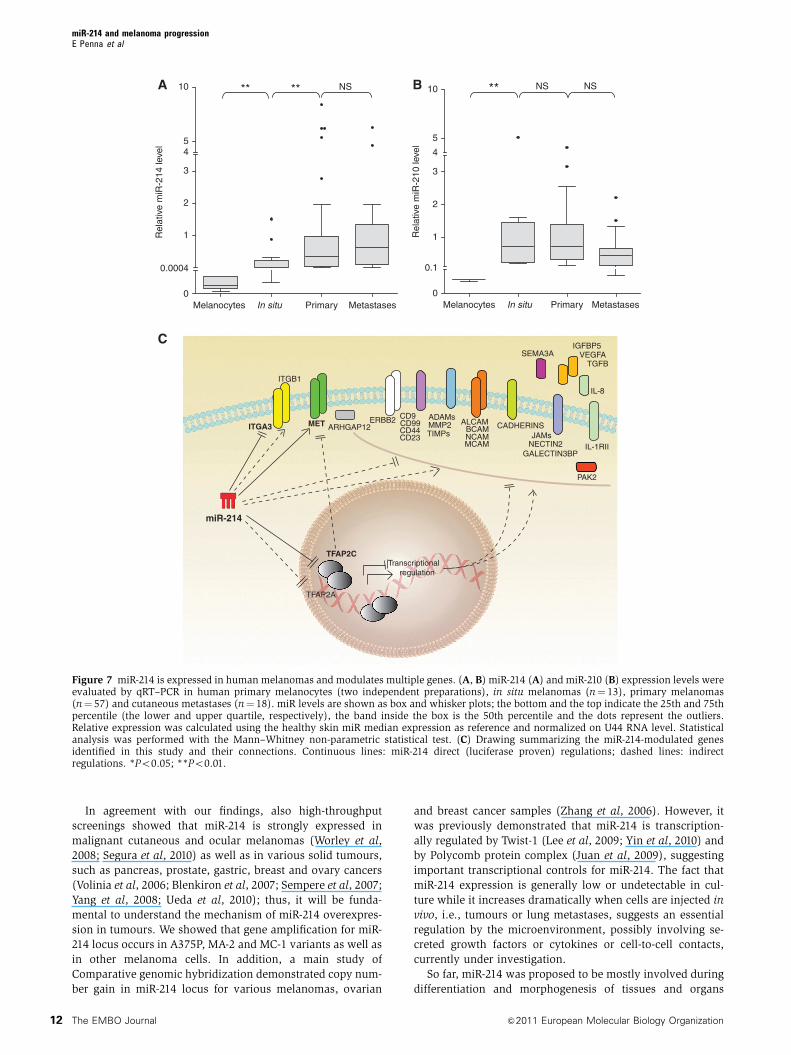
qRT–PCR analysis was used to assess miR-214 expression in
human primary melanocytes (two preparations), in situ
melanomas, confined into the basal membrane (n¼ 13),
primary invasive melanomas (n¼ 57) and cutaneous metas-
tases (n¼ 18). As shown in Figure 7A, miR-214 was highly
expressed in primary and metastatic melanomas, compared
with in situ tumours and normal melanocytes. Instead, miR-
210 expression, which we used as control, did not vary
significantly among tumour samples; however, low miR-210
levels were found in primary melanocytes (Figure 7B).
Considering the elevated levels of miR-214 in invasive mela-
nomas and in metastases, we investigated the expression of
over 70 miR-214-modulated genes (Figures 5 and 7C; Supple-
mentary Figure S6; Table I) in a human protein-coding gene
expression data set available in GEO, referring to mRNA
expression in normal skin, nevi and primary melanomas
(Talantov et al, 2005). Differential expression was observed
for several of these genes relative to the three groups of
samples analysed (Supplementary Figure S11), underlying
the relevance of this gene group for melanoma progression.
In agreement with our findings, TFAP2C mRNA was down-
regulated in melanoma but expressed in skin as well as nevus
samples; in contrast, ITGA3 mRNA was upregulated in
this cohort of melanomas, suggesting different or additional
regulations.
Discussion
Our work led to the identification of a novel functional
pathway (Figure 7C), controlled by miR-214 and including
its direct targets TFAP2C and ITGA3 as well as multiple
surface proteins, that coordinates metastasis formation in a
melanoma progression model, represented by the A375P
poorly metastatic parental cell line and its derived metastatic
variants. This pathway can be considered of general rele-
vance for melanoma progression since it was also studied
and validated in a panel of unrelated human melanoma cell
lines. Importantly, overexpression of miR-214 or silencing
of TFAP2C in melanoma cells enables them to acquire or
increase invasive and metastatic behaviour. On the other
hand, miR-214 silencing or concomitant miR-214 and TFAP2C
(lacking its 30UTR) overexpression impairs the establishment
of a metastatic phenotype, suggesting a major role for miR-214
and TFAP2C in controlling melanoma tumour progression.
miR-214 and melanoma progressionE Penna et al
&2011 European Molecular Biology Organization The EMBO Journal 11
In agreement with our findings, also high-throughput
screenings showed that miR-214 is strongly expressed in
malignant cutaneous and ocular melanomas (Worley et al,
2008; Segura et al, 2010) as well as in various solid tumours,
such as pancreas, prostate, gastric, breast and ovary cancers
(Volinia et al, 2006; Blenkiron et al, 2007; Sempere et al, 2007;
Yang et al, 2008; Ueda et al, 2010); thus, it will be funda-
mental to understand the mechanism of miR-214 overexpres-
sion in tumours. We showed that gene amplification for miR-
214 locus occurs in A375P, MA-2 and MC-1 variants as well as
in other melanoma cells. In addition, a main study of
Comparative genomic hybridization demonstrated copy num-
ber gain in miR-214 locus for various melanomas, ovarian
and breast cancer samples (Zhang et al, 2006). However, it
was previously demonstrated that miR-214 is transcription-
ally regulated by Twist-1 (Lee et al, 2009; Yin et al, 2010) and
by Polycomb protein complex (Juan et al, 2009), suggesting
important transcriptional controls for miR-214. The fact that
miR-214 expression is generally low or undetectable in cul-
ture while it increases dramatically when cells are injected in
vivo, i.e., tumours or lung metastases, suggests an essential
regulation by the microenvironment, possibly involving se-
creted growth factors or cytokines or cell-to-cell contacts,
currently under investigation.
So far, miR-214 was proposed to be mostly involved during
differentiation and morphogenesis of tissues and organs
METITGA3
ITGB1
ALCAMCD9CD99
TFAP2C
TFAP2A
miR-214
MCAM
MMP2
VEGFATGFB
Transcriptional regulation
IGFBP5
CD44
ADAMs
BCAMERBB2
PAK2
TIMPs NCAMCADHERINS
CD23 JAMs
SEMA3A
IL-8
IL-1RIINECTIN2GALECTIN3BP
ARHGAP12
C
Melanocytes In situ Primary Metastases
Rel
ativ
e m
iR-2
10 le
vel
B **** **A
Melanocytes In situ Primary Metastases0
1
2
3
5
10
Rel
ativ
e m
iR-2
14 le
vel
NS NS NS
0.0004
4
0
1
2
3
5
10
0.1
4
Figure 7 miR-214 is expressed in human melanomas and modulates multiple genes. (A, B) miR-214 (A) and miR-210 (B) expression levels wereevaluated by qRT–PCR in human primary melanocytes (two independent preparations), in situ melanomas (n¼ 13), primary melanomas(n¼ 57) and cutaneous metastases (n¼ 18). miR levels are shown as box and whisker plots; the bottom and the top indicate the 25th and 75thpercentile (the lower and upper quartile, respectively), the band inside the box is the 50th percentile and the dots represent the outliers.Relative expression was calculated using the healthy skin miR median expression as reference and normalized on U44 RNA level. Statisticalanalysis was performed with the Mann–Whitney non-parametric statistical test. (C) Drawing summarizing the miR-214-modulated genesidentified in this study and their connections. Continuous lines: miR-214 direct (luciferase proven) regulations; dashed lines: indirectregulations. *Po0.05; **Po0.01.
miR-214 and melanoma progressionE Penna et al
The EMBO Journal &2011 European Molecular Biology Organization12
(Flynt et al, 2007; Decembrini et al, 2009) and disruption of
the mouse genomic locus including miR-214, Dnm3os, deter-
mined death within 1 month of birth with skeletal abnorm-
alities (Watanabe et al, 2008). Considering that genetic
programs controlling embryonic development are often
reactivated during tumour progression, a role for miR-214
in tumourigenesis is expected. High levels of miR-214 in
human tumours suggest an oncogene-like function, but we
and others (Fei et al, 2008) did not find any positive regula-
tion of cell growth for miR-214. Instead, increased levels of
miR-214 could induce chemotherapy resistance in ovarian
tumours via the direct downregulation of PTEN and conse-
quent upregulation of the Akt pathway (Yang et al, 2008);
however, we were not able to see any strong miR-214-
dependent downmodulation of PTEN, suggesting a cell
context role in PTEN targeting by miR-214.
The spread of melanoma cells from the primary lesion to
the sites of metastasis formation involves multiple steps
(Melnikova and Bar-Eli, 2008) that are coordinated by miR-
214. Other miRs were previously found to be involved in
some aspects of melanoma tumourigenesis: miR-221/222
and let7b mostly control proliferation and survival, while
miR-182, miR-137, let7a and miR-34a affect migration and
invasion as well as cell growth (Mueller and Bosserhoff,
2009). miR-214 exerts pleiotropic roles in our melanoma
model due to its ability to directly or indirectly modulate
the expression of many genes. We were able to identify over
70 miR-214-modulated genes that were previously found to
be involved in cell movement and metastasis formation,
some specifically in melanoma. Examples are integrins
(Desgrosellier and Cheresh, 2010), cadherins (Jeanes et al,
2008), cell adhesion molecules (Kobayashi et al, 2007), the
tyrosine kinase receptor MET (Benvenuti and Comoglio,
2007), MMP2 (Hornebeck et al, 2002), ADAMs (Duffy
et al, 2009), TIMPs (Cruz-Munoz and Khokha, 2008),
Semaphorin3A (Neufeld and Kessler, 2008) and PAK2
(Gadea et al, 2008). In addition to cell migration and inva-
sion, we showed, for the first time, that a miR promotes
transendothelial migration and extravasation of melanoma
cells via direct tumour-endothelial cell interactions, as proven
by the fact that melanoma cells but not conditioned medium
are able to induce endothelial cell reorganization. Based on
the extravasation experiments, we suggest that miR-214 pro-
metastatic effect is mainly due to the earlier steps of the
metastatic process, such as the passage through the endo-
thelial barrier, more then post-colonization events. In fact, we
observed a significant reduction in both extravasation (48 h)
and long-term metastasis formation following transient
silencing of miR-214 in cells, a condition in which we
expected miR-214 levels to remain low only in the first 48 h
post-transfection, as observed in in vitro experiments (not
shown). Considering that extravasation data were confirmed
by permanent knockdown of miR-214 via specific sponges
and that miR-214 did not influence tumour cell growth, we
can conclude that high levels of miR-214 favour extravasation
and survival in the blood circulation but do not control later
tumourigenesis steps. Heterotypic interactions are known to
occur between endothelial and melanoma cells during extra-
vasation involving, for instance, the CAM family molecules,
such as ALCAM (Swart et al, 2005) and MCAM-MUC18
(Xie et al, 1997), or tetraspanin CD9 and ITGB1 complexes
at the melanoma-endothelial cell contact regions (Longo et al,
2001), or IL-8 secretion, ICAM-1 expression and E-selectin
reduction, as a consequence of B-Raf mutation in melanoma
cells (Liang et al, 2007). Interestingly, these molecules are
modulated by miR-214 in our cells (see Table I). Given that
B-Raf is mutated in our melanoma model (Eskandarpour
et al, 2005), a possible cooperation between B-Raf and miR-
214 could occur during extravasation. Moreover, functional
classification of miR-214-modulated molecules revealed an
enrichment of genes involved in the leukocyte extravasation
pathway, suggesting a common mechanism of migration
through the endothelial walls for melanoma cells and leuko-
cytes. Since miR-214 reduces anoikis in cell culture, we
speculate that miR-214 also helps the tumour cells to survive
in the blood circulation. Similar functions were shown for
miR-31 in breast cancer (Valastyan et al, 2009). We found that
miR-214 was able to confer various pro-metastatic traits also
to the A375P parental cells; however, we observed only a
slight effect on lung colonization in our experimental condi-
tions. No macrometastases were found when miR-214-over-
expressing or control A375P cells were injected. Nevertheless,
micrometastases were detected exclusively for miR-214-over-
expressing cells. These results suggest that miR-214 facilitates
metastasis formation but it is not a strong metastasis inducer
per se and that its role depends on the cellular context
in which it operates. In any case, we cannot exclude
that different experimental settings were needed for these
investigations.
Based on bioinformatic predictions we looked for direct
miR-214 targets and among various genes tested, we were
able to prove that TFAP2C and ITGA3 are directly and
specifically repressed via miR-214 binding on their 30UTRs
in melanoma cells. At the same time, we observed that miR-
214 was able to induce MET overexpression. TFAP2C is a
member of the AP-2 transcription factor family involved,
together with TFAP2A, in the activation or repression
of various genes implicated in tumourigenesis (Hilger-
Eversheim et al, 2000; Eckert et al, 2005). Melanoma progres-
sion is clearly associated with loss of expression of total or
nuclear TFAP2 proteins and this correlates with poor prog-
nosis and advanced stages of the disease (Bar-Eli, 2001;
Berger et al, 2005). Loss or deletions of the TFAP2 family
member genomic loci were found in some, but not all,
melanomas, suggesting other mechanisms for control of
gene expression (Karjalainen et al, 2000). We were able to
demonstrate that miR-214 downregulates expression of
TFAP2C directly and TFAP2A indirectly in melanoma cells.
We need to underline that only low TFAP2A protein expres-
sion was detected in the melanoma progression model we
used, consistent with the fact that A375P cells were derived
from a metastatic melanoma with low TFAP2A amount
(Huang et al, 1998). Instead, TFAP2C is well expressed in
our system, although at reduced levels in the most invasive
variant MC-1 compared with the parental A375P cells due to
miR-214 higher expression. Reduction of TFAP2A is, at least
in part, due to direct control by TFAP2C, since TFAP2C
silencing reduces TFAP2A protein levels partially (Orso
et al, unpublished), which is in line with the fact that
TFAP2 family members are able to regulate each other
transcriptionally (Bauer et al, 1994). It is known that elim-
ination of TFAP2A from non-metastatic primary melanoma
cells increases malignancy (Gershenwald et al, 2001), while
re-expression abrogates it (Huang et al, 1998), by controlling
miR-214 and melanoma progressionE Penna et al
&2011 European Molecular Biology Organization The EMBO Journal 13
transcription of genes such as MCAM-MUC18, MMP2, PAR-1,
VEGF, BCL2, CDKN1A/p21, E-cadherin and c-KIT (Melnikova
and Bar-Eli, 2008). We were able to demonstrate that miR-214
overexpression increases the transcription of MCAM-MUC18
and VEGFA, two well-known TFAP2-repressed genes. In
addition, it decreases expression of genes transcriptionally
activated by TFAP2 family members, such as ERBB2 and
IGFBP5, as well as TGFB. c-KIT, another well-known TFAP2-
modulated gene, is expressed at very low levels in our
system, consistently with the literature (Huang et al, 1998),
so we were not able to evaluate its modulation. Other TFAP2-
regulated genes including E-Cadherin/CDH1, CTSD, EREG,
TGFBI, CDH11, CLU, PVR, EGRF, ERBB2, ICAM2, ITGAV,
MMP2, PVRL2, TIMP1, TIMP2, all somehow connected
with cell movement and/or malignancy, were found to be
differentially expressed following miR-214 modulations.
Considering that TFAP2C silencing in MA-2 cells phenocopied
miR-214 overexpression biology, while its forced expression
in miR-214-overexpressing cells rescued the migration and
extravasation phenotypes, we conclude that TFAP2C is one of
the main players through which miR-214 controls malignancy
in melanoma. TFAP2C modulations were also proven to
interfere, at least in part, with the expression of two other
miR-214-modulated genes highly involved in cell movement
and tumour progression, ITGA3 and MET, thus suggesting an
additional relevance for TFAP2C in gene expression regula-
tion in melanomas. The relevancy of TFAP2C is also under-
lined by its decreased expression in human melanoma
samples from a public data set. On the contrary, we found
that ITGA3 modulates cell migration in vitro, but it is not
sufficient per se to control the extravasation process or
metastasis formation in vivo, suggesting that the contri-
bution of ITGA3 on miR-214-mediated functions is only
partial and restricted to cell movement in culture. In line
with our in vivo results, we did not find reduced expres-
sion of ITGA3 in the human melanoma public data set
we analysed. Considering that ITGA3 is thought to pro-
mote invasion and metastasis in various human tumours
(Mitchell et al, 2010), it is possible that, even if ITGA3
is a bona fide target of miR-214, a feedback loop that
re-establishes high levels of this adhesion molecule occurs
during melanoma progression. Unfortunately, only mRNA
(no protein) data were available for the human data set we
analysed. Since miR-214 was able to downregulate ITGA3
protein expression without affecting mRNA levels in cells,
ITGA3 protein expression needs to be verified in a high
number of human melanoma samples, before drawing any
conclusions.
Considering that miR-214 is highly expressed in human
melanomas and that the pool of miR-214-modulated genes
correctly separates melanomas versus nevi or normal skin,
we can conclude that the pathway including miR-214 and its
modulated genes is able to coordinate melanoma progression
and could be considered for therapeutic intervention.
Materials and methods
Cell culture293T, MDA-MB-231 and 4T1 cells were from American Type CultureCollection and maintained in standard conditions. A375P andderived variants were provided by RO Hynes (Xu et al, 2008) andmaintained in Dulbecco’s Modified Eagle’s Medium containing10 mM Glutamax and 4.5 g/ml glucose (DMEM GlutamaxTM, GIBCO
Invitrogen Life Technologies, Carlsbad, CA), supplemented with10% heat-inactivated FCS (Seromed, GmbH), 1 mM sodiumpyruvate, 25 mM HEPES pH 7.4, 1� MEM vitamin solution, 1�MEM non-essential amino acids and 100mg/ml gentamicin (all fromGIBCO Invitrogen Life Technologies). 1300-Mel, GR4-Mel, WK-Meland Dett-Mel were provided by P Circosta and cultured according toCircosta et al (2009) in RPMI medium supplemented with 10% heat-inactivated FCS (Seromed, GmbH), 1 mM sodium pyruvate, 25 mMHEPES pH 7.4, 1� MEM non-essential amino acids and 100 mg/mlgentamicin. HUVECs–GFP were provided by L Primo and grown asdescribed (Primo et al, 2007). Human melanocytes were purchasedfrom Lonza (Basel, CH). SK-MEL-103, -173, -187 and -197melanoma cell lines were obtained and cultured as described inSegura et al (2009). Human epidermal melanocytes, derived fromadult, lightly pigmented donor (HEMa-LP), were from InvitrogenLife Technologies (Cascade Biologics brand) and were maintainedin Medium 254, supplemented with Human Melanocyte GrowthSupplement-2, PMA-Free (Invitrogen Life Technologies, Carlsbad,CA), as indicated by manufacturer’s guidelines.
Reagents and antibodiespLKO.1-SCR (scramble) or pLKO.1-shTFAP2C lentiviral expressionvectors were purchased from Open Biosystems (Huntsville, AL, cat.no. RHS3979-19745). pSP(RSV)-TFAP2C and pSP(RSV)-emptyexpression vectors were a gift from H Hurst (Bosher et al, 1995,1996). siITGA3 (Hs_ITGA3_7 HP Validated siRNA) was purchasedfrom Qiagen (Stanford, CA). pCMVzeo-ITGA3 and pCMVzeo-emptywere a gift from M DiPersio (Iyer et al, 2005). miR precursors andinhibitors were pre-miRTM miRNA Precursor Molecules-NegativeControl #1, pre-miRTM miRNA Precursor Hsa-miR-214 (PM12124),Hsa-miR-210 (PM10516), anti-miRTM miRNA Inhibitors-NegativeControl #1, anti-miRTM miRNA Inhibitors Hsa-miR-214 (AM12124)(all from Ambion, Austin, TX). miRNA detection was TaqMans
MicroRNA Assays Hsa-miR-214 assay ID 000517 or Hsa-miR-214assay ID 002306, Hsa-miR-210 assay ID 000512, Hsa-miR-221 assayID 000524, Hsa-miR-222 assay ID 002276, Hsa-miR-137 assay ID001129, Hsa-miR-34a assay ID 000426, Hsa-RNU44 assay ID 001094,U6 snRNA assay ID001973 (all from Applied Biosystems, FosterCity, CA). Primary antibodies were anti-TFAP2A mAb 3B5, anti-TFAP2C mAb 6E4/4, anti-GAPDH pAb V-18, anti-hsp90 mAb F-8,anti-MET pAb C-12 (all from Santa Cruz Biotechnology, Santa Cruz,CA), anti-ITGA3 pAb 8-4 B7 gently provided by M DiPersio(DiPersio et al, 1995), anti-PAK2 pAb #2608, anti-PTEN pAb#9552 (Cell Signaling Technology, Danvers, MA), anti-Von Will-ebrand Factor pAb A0082 (DAKO Cytomation, Glostrup, Denmark),anti-GFP Ab (ab290, Abcam, Cambridge, UK). Secondary antibodieswere goat anti-mouse IgG HRP conjugated, goat anti-rabbit IgG HRPconjugated, donkey anti-goat IgG HRP conjugated (all from SantaCruz Biotechnology) and goat anti-rabbit IgG Alexa-Fluor-488(Molecular Probes, Invitrogen Life Technologies). All antibodieswere used at the producer’s suggested concentrations.
PrimersOligonucleotides employed in this study were cloning miR-214,TTTCATAGGCACCACTCACTTTAC and CCCTTTCCCCTTACTCTCCA;miR-214 synthetic binding site CTAGTCCACTGCCTGTCTGTGCCTGCTGTCGTAGGATCTACTGCCTGTCTGTGCCTGCTGTTGGACCTGACACTGCCTGTCTGTGCCTGCTGTCCCA and AGCTTGGGACAGCAGGCACAGACAGGCAGTGTCAGGTCCAACAGCAGGCACAGACAGGCAGTAGATCCTACGACAGCAGGCACAGACAGGCAGTGGA; cloning ARHGAP12 30UTR,GCACTAGTGTTCCATCTTCGGACGTTGA and ATACGCGTCTTCAACAGACCATGCTCCC; cloning ITGA3 30UTR, ATACTAGTAGGCTGACCGACGACTACTG and TAACGCGTTTTTGCATACAAACTGGGAGC; cloningITGB8 30UTR, ATGCCGGCGCTCACGGTCATGCCAGTTGCT and TAGTTTAAACCAGGGCTCATGGCCCGTGTA; cloning MET 30UTR, ATACTAGTCCTCCTTCTGGGAGACATCA and TAACGCGTACAAGATGTTGCATCACTTTACTTT; cloning MITF 30UTR, ATACTAGTCCTCCCTGCACTGCATTCGC and TAACGCGTCAGTGCTATGGACCATACAG; cloning NRP130UTR, TAACTAGTGAGTACTTATTCGGAGGCATGAA and TAACGCGTAATTCAACTGTTTCTTTGGAATG, cloning PAK2 30UTR, ATACTAGTCCTGTGCCTCTAACAAGCGATTC and TAACGCGTAAGTTTAGGAAAGGGAAAAATGCACA; cloning PLXNA1 30UTR, ATACTAGTCCCCAGCTGTGATCATCC and TAACGCGTTGTTTAATCTCTCCTTAATGTGTGTG; clo-ning TFAP2A 30UTR, ATACTAGTGCGGGTGACAGCTCCGGGAT and TAACGCGTTGATACCCTGCTCTGAACTCCAAGT; cloning TFAP2C 30UTR,ATGAGCTCCTGGAGACCAGAGTCCAGCTGATand TAACGCGTAGGGTTCAGCCCAACAGGAA; TFAP2C 30UTR mutagenesis, TTCTGGTTTTAGG
miR-214 and melanoma progressionE Penna et al
The EMBO Journal &2011 European Molecular Biology Organization14
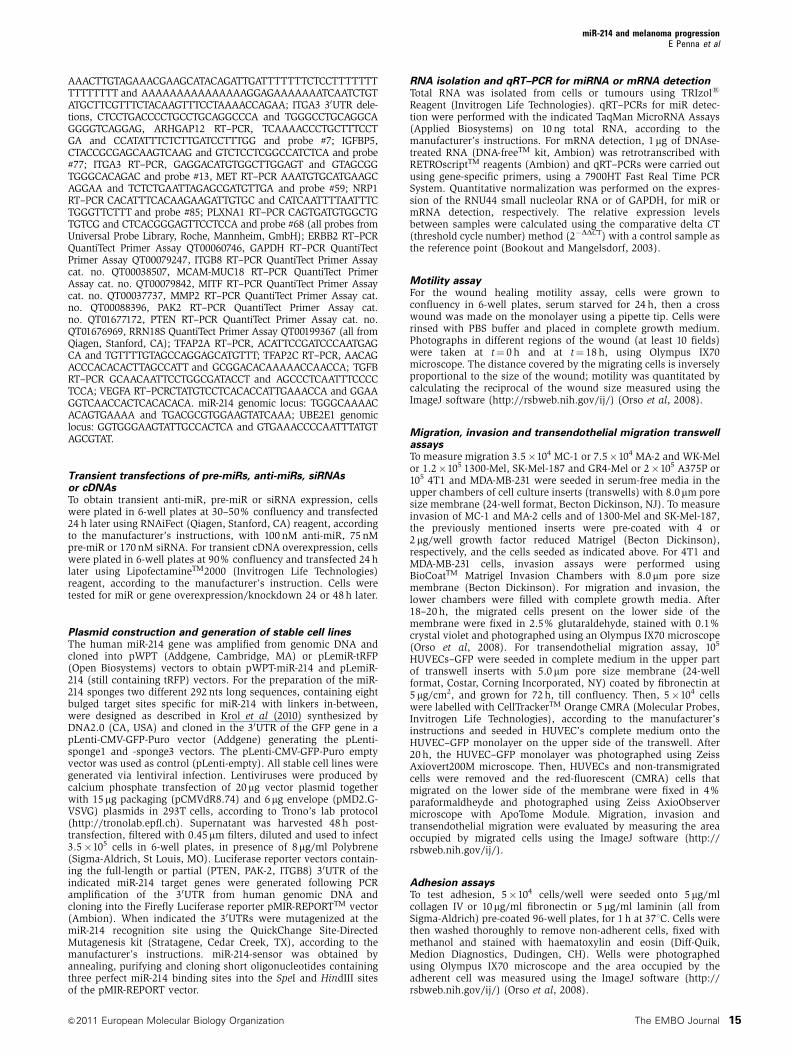
AAACTTGTAGAAACGAAGCATACAGATTGATTTTTTTCTCCTTTTTTTTTTTTTTT and AAAAAAAAAAAAAAAGGAGAAAAAAATCAATCTGTATGCTTCGTTTCTACAAGTTTCCTAAAACCAGAA; ITGA3 30UTR dele-tions, CTCCTGACCCCTGCCTGCAGGCCCA and TGGGCCTGCAGGCAGGGGTCAGGAG, ARHGAP12 RT–PCR, TCAAAACCCTGCTTTCCTGA and CCATATTTCTCTTGATCCTTTGG and probe #7; IGFBP5,CTACCGCGAGCAAGTCAAG and GTCTCCTCGGCCATCTCA and probe#77; ITGA3 RT–PCR, GAGGACATGTGGCTTGGAGT and GTAGCGGTGGGCACAGAC and probe #13, MET RT–PCR AAATGTGCATGAAGCAGGAA and TCTCTGAATTAGAGCGATGTTGA and probe #59; NRP1RT–PCR CACATTTCACAAGAAGATTGTGC and CATCAATTTTAATTTCTGGGTTCTTT and probe #85; PLXNA1 RT–PCR CAGTGATGTGGCTGTGTCG and CTCACGGGAGTTCCTCCA and probe #68 (all probes fromUniversal Probe Library, Roche, Mannheim, GmbH); ERBB2 RT–PCRQuantiTect Primer Assay QT00060746, GAPDH RT–PCR QuantiTectPrimer Assay QT00079247, ITGB8 RT–PCR QuantiTect Primer Assaycat. no. QT00038507, MCAM-MUC18 RT–PCR QuantiTect PrimerAssay cat. no. QT00079842, MITF RT–PCR QuantiTect Primer Assaycat. no. QT00037737, MMP2 RT–PCR QuantiTect Primer Assay cat.no. QT00088396, PAK2 RT–PCR QuantiTect Primer Assay cat.no. QT01677172, PTEN RT–PCR QuantiTect Primer Assay cat. no.QT01676969, RRN18S QuantiTect Primer Assay QT00199367 (all fromQiagen, Stanford, CA); TFAP2A RT–PCR, ACATTCCGATCCCAATGAGCA and TGTTTTGTAGCCAGGAGCATGTTT; TFAP2C RT–PCR, AACAGACCCACACACTTAGCCATT and GCGGACACAAAAACCAACCA; TGFBRT–PCR GCAACAATTCCTGGCGATACCT and AGCCCTCAATTTCCCCTCCA; VEGFA RT–PCRCTATGTCCTCACACCATTGAAACCA and GGAAGGTCAACCACTCACACACA. miR-214 genomic locus: TGGGCAAAACACAGTGAAAA and TGACGCGTGGAAGTATCAAA; UBE2E1 genomiclocus: GGTGGGAAGTATTGCCACTCA and GTGAAACCCCAATTTATGTAGCGTAT.
Transient transfections of pre-miRs, anti-miRs, siRNAsor cDNAsTo obtain transient anti-miR, pre-miR or siRNA expression, cellswere plated in 6-well plates at 30–50% confluency and transfected24 h later using RNAiFect (Qiagen, Stanford, CA) reagent, accordingto the manufacturer’s instructions, with 100 nM anti-miR, 75 nMpre-miR or 170 nM siRNA. For transient cDNA overexpression, cellswere plated in 6-well plates at 90% confluency and transfected 24 hlater using LipofectamineTM2000 (Invitrogen Life Technologies)reagent, according to the manufacturer’s instruction. Cells weretested for miR or gene overexpression/knockdown 24 or 48 h later.
Plasmid construction and generation of stable cell linesThe human miR-214 gene was amplified from genomic DNA andcloned into pWPT (Addgene, Cambridge, MA) or pLemiR-tRFP(Open Biosystems) vectors to obtain pWPT-miR-214 and pLemiR-214 (still containing tRFP) vectors. For the preparation of the miR-214 sponges two different 292 nts long sequences, containing eightbulged target sites specific for miR-214 with linkers in-between,were designed as described in Krol et al (2010) synthesized byDNA2.0 (CA, USA) and cloned in the 30UTR of the GFP gene in apLenti-CMV-GFP-Puro vector (Addgene) generating the pLenti-sponge1 and -sponge3 vectors. The pLenti-CMV-GFP-Puro emptyvector was used as control (pLenti-empty). All stable cell lines weregenerated via lentiviral infection. Lentiviruses were produced bycalcium phosphate transfection of 20 mg vector plasmid togetherwith 15mg packaging (pCMVdR8.74) and 6mg envelope (pMD2.G-VSVG) plasmids in 293T cells, according to Trono’s lab protocol(http://tronolab.epfl.ch). Supernatant was harvested 48 h post-transfection, filtered with 0.45mm filters, diluted and used to infect3.5�105 cells in 6-well plates, in presence of 8mg/ml Polybrene(Sigma-Aldrich, St Louis, MO). Luciferase reporter vectors contain-ing the full-length or partial (PTEN, PAK-2, ITGB8) 30UTR of theindicated miR-214 target genes were generated following PCRamplification of the 30UTR from human genomic DNA andcloning into the Firefly Luciferase reporter pMIR-REPORTTM vector(Ambion). When indicated the 30UTRs were mutagenized at themiR-214 recognition site using the QuickChange Site-DirectedMutagenesis kit (Stratagene, Cedar Creek, TX), according to themanufacturer’s instructions. miR-214-sensor was obtained byannealing, purifying and cloning short oligonucleotides containingthree perfect miR-214 binding sites into the SpeI and HindIII sitesof the pMIR-REPORT vector.
RNA isolation and qRT–PCR for miRNA or mRNA detectionTotal RNA was isolated from cells or tumours using TRIzols
Reagent (Invitrogen Life Technologies). qRT–PCRs for miR detec-tion were performed with the indicated TaqMan MicroRNA Assays(Applied Biosystems) on 10 ng total RNA, according to themanufacturer’s instructions. For mRNA detection, 1 mg of DNAse-treated RNA (DNA-freeTM kit, Ambion) was retrotranscribed withRETROscriptTM reagents (Ambion) and qRT–PCRs were carried outusing gene-specific primers, using a 7900HT Fast Real Time PCRSystem. Quantitative normalization was performed on the expres-sion of the RNU44 small nucleolar RNA or of GAPDH, for miR ormRNA detection, respectively. The relative expression levelsbetween samples were calculated using the comparative delta CT(threshold cycle number) method (2�DDCT) with a control sample asthe reference point (Bookout and Mangelsdorf, 2003).
Motility assayFor the wound healing motility assay, cells were grown toconfluency in 6-well plates, serum starved for 24 h, then a crosswound was made on the monolayer using a pipette tip. Cells wererinsed with PBS buffer and placed in complete growth medium.Photographs in different regions of the wound (at least 10 fields)were taken at t¼ 0 h and at t¼ 18 h, using Olympus IX70microscope. The distance covered by the migrating cells is inverselyproportional to the size of the wound; motility was quantitated bycalculating the reciprocal of the wound size measured using theImageJ software (http://rsbweb.nih.gov/ij/) (Orso et al, 2008).
Migration, invasion and transendothelial migration transwellassaysTo measure migration 3.5�104 MC-1 or 7.5�104 MA-2 and WK-Melor 1.2�105 1300-Mel, SK-Mel-187 and GR4-Mel or 2�105 A375P or105 4T1 and MDA-MB-231 were seeded in serum-free media in theupper chambers of cell culture inserts (transwells) with 8.0mm poresize membrane (24-well format, Becton Dickinson, NJ). To measureinvasion of MC-1 and MA-2 cells and of 1300-Mel and SK-Mel-187,the previously mentioned inserts were pre-coated with 4 or2 mg/well growth factor reduced Matrigel (Becton Dickinson),respectively, and the cells seeded as indicated above. For 4T1 andMDA-MB-231 cells, invasion assays were performed usingBioCoatTM Matrigel Invasion Chambers with 8.0 mm pore sizemembrane (Becton Dickinson). For migration and invasion, thelower chambers were filled with complete growth media. After18–20 h, the migrated cells present on the lower side of themembrane were fixed in 2.5% glutaraldehyde, stained with 0.1%crystal violet and photographed using an Olympus IX70 microscope(Orso et al, 2008). For transendothelial migration assay, 105
HUVECs–GFP were seeded in complete medium in the upper partof transwell inserts with 5.0 mm pore size membrane (24-wellformat, Costar, Corning Incorporated, NY) coated by fibronectin at5 mg/cm2, and grown for 72 h, till confluency. Then, 5�104 cellswere labelled with CellTrackerTM Orange CMRA (Molecular Probes,Invitrogen Life Technologies), according to the manufacturer’sinstructions and seeded in HUVEC’s complete medium onto theHUVEC–GFP monolayer on the upper side of the transwell. After20 h, the HUVEC–GFP monolayer was photographed using ZeissAxiovert200M microscope. Then, HUVECs and non-transmigratedcells were removed and the red-fluorescent (CMRA) cells thatmigrated on the lower side of the membrane were fixed in 4%paraformaldheyde and photographed using Zeiss AxioObservermicroscope with ApoTome Module. Migration, invasion andtransendothelial migration were evaluated by measuring the areaoccupied by migrated cells using the ImageJ software (http://rsbweb.nih.gov/ij/).
Adhesion assaysTo test adhesion, 5�104 cells/well were seeded onto 5mg/mlcollagen IV or 10mg/ml fibronectin or 5mg/ml laminin (all fromSigma-Aldrich) pre-coated 96-well plates, for 1 h at 371C. Cells werethen washed thoroughly to remove non-adherent cells, fixed withmethanol and stained with haematoxylin and eosin (Diff-Quik,Medion Diagnostics, Dudingen, CH). Wells were photographedusing Olympus IX70 microscope and the area occupied by theadherent cell was measured using the ImageJ software (http://rsbweb.nih.gov/ij/) (Orso et al, 2008).
miR-214 and melanoma progressionE Penna et al
&2011 European Molecular Biology Organization The EMBO Journal 15
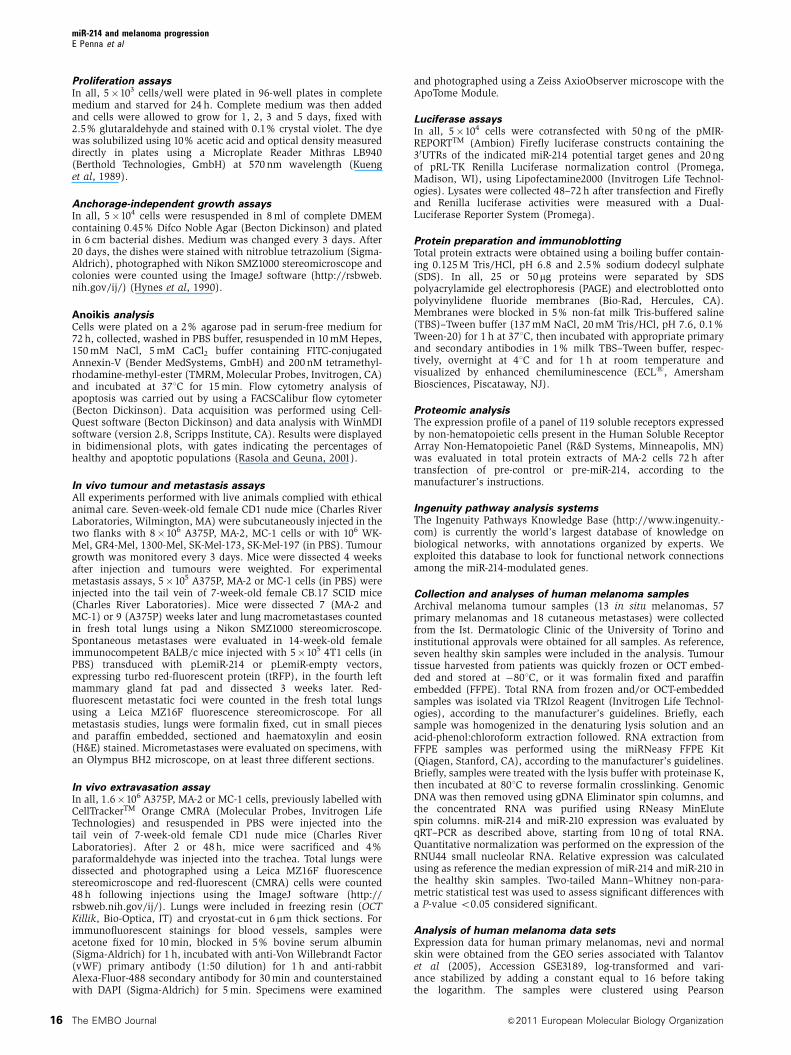
Proliferation assaysIn all, 5�103 cells/well were plated in 96-well plates in completemedium and starved for 24 h. Complete medium was then addedand cells were allowed to grow for 1, 2, 3 and 5 days, fixed with2.5% glutaraldehyde and stained with 0.1% crystal violet. The dyewas solubilized using 10% acetic acid and optical density measureddirectly in plates using a Microplate Reader Mithras LB940(Berthold Technologies, GmbH) at 570 nm wavelength (Kuenget al, 1989).
Anchorage-independent growth assaysIn all, 5�104 cells were resuspended in 8 ml of complete DMEMcontaining 0.45% Difco Noble Agar (Becton Dickinson) and platedin 6 cm bacterial dishes. Medium was changed every 3 days. After20 days, the dishes were stained with nitroblue tetrazolium (Sigma-Aldrich), photographed with Nikon SMZ1000 stereomicroscope andcolonies were counted using the ImageJ software (http://rsbweb.nih.gov/ij/) (Hynes et al, 1990).
Anoikis analysisCells were plated on a 2% agarose pad in serum-free medium for72 h, collected, washed in PBS buffer, resuspended in 10 mM Hepes,150 mM NaCl, 5 mM CaCl2 buffer containing FITC-conjugatedAnnexin-V (Bender MedSystems, GmbH) and 200 nM tetramethyl-rhodamine-methyl-ester (TMRM, Molecular Probes, Invitrogen, CA)and incubated at 371C for 15 min. Flow cytometry analysis ofapoptosis was carried out by using a FACSCalibur flow cytometer(Becton Dickinson). Data acquisition was performed using Cell-Quest software (Becton Dickinson) and data analysis with WinMDIsoftware (version 2.8, Scripps Institute, CA). Results were displayedin bidimensional plots, with gates indicating the percentages ofhealthy and apoptotic populations (Rasola and Geuna, 2001).
In vivo tumour and metastasis assaysAll experiments performed with live animals complied with ethicalanimal care. Seven-week-old female CD1 nude mice (Charles RiverLaboratories, Wilmington, MA) were subcutaneously injected in thetwo flanks with 8�106 A375P, MA-2, MC-1 cells or with 106 WK-Mel, GR4-Mel, 1300-Mel, SK-Mel-173, SK-Mel-197 (in PBS). Tumourgrowth was monitored every 3 days. Mice were dissected 4 weeksafter injection and tumours were weighted. For experimentalmetastasis assays, 5�105 A375P, MA-2 or MC-1 cells (in PBS) wereinjected into the tail vein of 7-week-old female CB.17 SCID mice(Charles River Laboratories). Mice were dissected 7 (MA-2 andMC-1) or 9 (A375P) weeks later and lung macrometastases countedin fresh total lungs using a Nikon SMZ1000 stereomicroscope.Spontaneous metastases were evaluated in 14-week-old femaleimmunocompetent BALB/c mice injected with 5�105 4T1 cells (inPBS) transduced with pLemiR-214 or pLemiR-empty vectors,expressing turbo red-fluorescent protein (tRFP), in the fourth leftmammary gland fat pad and dissected 3 weeks later. Red-fluorescent metastatic foci were counted in the fresh total lungsusing a Leica MZ16F fluorescence stereomicroscope. For allmetastasis studies, lungs were formalin fixed, cut in small piecesand paraffin embedded, sectioned and haematoxylin and eosin(H&E) stained. Micrometastases were evaluated on specimens, withan Olympus BH2 microscope, on at least three different sections.
In vivo extravasation assayIn all, 1.6�106 A375P, MA-2 or MC-1 cells, previously labelled withCellTrackerTM Orange CMRA (Molecular Probes, Invitrogen LifeTechnologies) and resuspended in PBS were injected into thetail vein of 7-week-old female CD1 nude mice (Charles RiverLaboratories). After 2 or 48 h, mice were sacrificed and 4%paraformaldehyde was injected into the trachea. Total lungs weredissected and photographed using a Leica MZ16F fluorescencestereomicroscope and red-fluorescent (CMRA) cells were counted48 h following injections using the ImageJ software (http://rsbweb.nih.gov/ij/). Lungs were included in freezing resin (OCTKillik, Bio-Optica, IT) and cryostat-cut in 6mm thick sections. Forimmunofluorescent stainings for blood vessels, samples wereacetone fixed for 10 min, blocked in 5% bovine serum albumin(Sigma-Aldrich) for 1 h, incubated with anti-Von Willebrandt Factor(vWF) primary antibody (1:50 dilution) for 1 h and anti-rabbitAlexa-Fluor-488 secondary antibody for 30 min and counterstainedwith DAPI (Sigma-Aldrich) for 5 min. Specimens were examined
and photographed using a Zeiss AxioObserver microscope with theApoTome Module.
Luciferase assaysIn all, 5�104 cells were cotransfected with 50 ng of the pMIR-REPORTTM (Ambion) Firefly luciferase constructs containing the30UTRs of the indicated miR-214 potential target genes and 20 ngof pRL-TK Renilla Luciferase normalization control (Promega,Madison, WI), using Lipofectamine2000 (Invitrogen Life Technol-ogies). Lysates were collected 48–72 h after transfection and Fireflyand Renilla luciferase activities were measured with a Dual-Luciferase Reporter System (Promega).
Protein preparation and immunoblottingTotal protein extracts were obtained using a boiling buffer contain-ing 0.125 M Tris/HCl, pH 6.8 and 2.5% sodium dodecyl sulphate(SDS). In all, 25 or 50mg proteins were separated by SDSpolyacrylamide gel electrophoresis (PAGE) and electroblotted ontopolyvinylidene fluoride membranes (Bio-Rad, Hercules, CA).Membranes were blocked in 5% non-fat milk Tris-buffered saline(TBS)–Tween buffer (137 mM NaCl, 20 mM Tris/HCl, pH 7.6, 0.1%Tween-20) for 1 h at 371C, then incubated with appropriate primaryand secondary antibodies in 1% milk TBS–Tween buffer, respec-tively, overnight at 41C and for 1 h at room temperature andvisualized by enhanced chemiluminescence (ECLs, AmershamBiosciences, Piscataway, NJ).
Proteomic analysisThe expression profile of a panel of 119 soluble receptors expressedby non-hematopoietic cells present in the Human Soluble ReceptorArray Non-Hematopoietic Panel (R&D Systems, Minneapolis, MN)was evaluated in total protein extracts of MA-2 cells 72 h aftertransfection of pre-control or pre-miR-214, according to themanufacturer’s instructions.
Ingenuity pathway analysis systemsThe Ingenuity Pathways Knowledge Base (http://www.ingenuity.-com) is currently the world’s largest database of knowledge onbiological networks, with annotations organized by experts. Weexploited this database to look for functional network connectionsamong the miR-214-modulated genes.
Collection and analyses of human melanoma samplesArchival melanoma tumour samples (13 in situ melanomas, 57primary melanomas and 18 cutaneous metastases) were collectedfrom the Ist. Dermatologic Clinic of the University of Torino andinstitutional approvals were obtained for all samples. As reference,seven healthy skin samples were included in the analysis. Tumourtissue harvested from patients was quickly frozen or OCT embed-ded and stored at �801C, or it was formalin fixed and paraffinembedded (FFPE). Total RNA from frozen and/or OCT-embeddedsamples was isolated via TRIzol Reagent (Invitrogen Life Technol-ogies), according to the manufacturer’s guidelines. Briefly, eachsample was homogenized in the denaturing lysis solution and anacid-phenol:chloroform extraction followed. RNA extraction fromFFPE samples was performed using the miRNeasy FFPE Kit(Qiagen, Stanford, CA), according to the manufacturer’s guidelines.Briefly, samples were treated with the lysis buffer with proteinase K,then incubated at 801C to reverse formalin crosslinking. GenomicDNA was then removed using gDNA Eliminator spin columns, andthe concentrated RNA was purified using RNeasy MinElutespin columns. miR-214 and miR-210 expression was evaluated byqRT–PCR as described above, starting from 10 ng of total RNA.Quantitative normalization was performed on the expression of theRNU44 small nucleolar RNA. Relative expression was calculatedusing as reference the median expression of miR-214 and miR-210 inthe healthy skin samples. Two-tailed Mann–Whitney non-para-metric statistical test was used to assess significant differences witha P-value o0.05 considered significant.
Analysis of human melanoma data setsExpression data for human primary melanomas, nevi and normalskin were obtained from the GEO series associated with Talantovet al (2005), Accession GSE3189, log-transformed and vari-ance stabilized by adding a constant equal to 16 before takingthe logarithm. The samples were clustered using Pearson
miR-214 and melanoma progressionE Penna et al
The EMBO Journal &2011 European Molecular Biology Organization16
correlation-based hierarchical clustering. Clustering and heatmapwere obtained using Bioconductor (Gentleman et al, 2004).
Analysis of miR-214 genomic locusGenomic DNA was isolated from melanoma cell lines using theQiagen QIAmp DNA Mini kit (Qiagen, Valencia, CA). PCRs wereperformed using MyiQ Single Color Real time PCR Detection System(Bio-Rad) in 96-well plates, with reaction mixture (25ml) containing20 ng of DNA and 12.5ml of ABsolute Blue QPCR SYBR Green Mix(Thermo Scientific, Waltham, MA). Triplicate reactions were runwith specific primers for all samples using the PCR protocol: 951Cfor 15 min, 40 cycles of 951C for 15 s, 551C 30 s and 721C for 30 s,followed by melting curve analysis to ensure amplificationspecificity. Under the selected conditions, only single peaks weredetected in the melting curve. The products of the PCRs were alsorun on a 2% agarose gel to confirm the correct size of the amplifiedproduct. To determine the genetic load, the DDCT method was usedaccording to Pfaffl (2001) and assuming 100% efficiency in theamplification from normal human genomic DNA (Promega).UBE2E1 housekeeping gene was used as reference. This gene hasnot been found genetically altered in melanomas (Lazar et al, 2009).
Statistical analysesUnless otherwise noted, data are presented as mean±s.e.m. andtwo-tailed Student’s t-test was used for comparison, with *Po0.05;**Po0.01; ***Po0.001 considered to be statistically significant.NS indicates a not statistically significant P-value.
Supplementary dataSupplementary data are available at The EMBO Journal Online(http://www.embojournal.org).
Acknowledgements
This work was supported by grants from the University of Torino(Local Research Funding 2007/DT, 2008/DT), Regione PiemonteRicerca Scientifica Applicata (CIPE2004/DT), Compagnia di SanPaolo (DT), Torino, PRIN 2008 (DT), AIRC 2010 (IG 10104 DT) andFIRB giovani 2008 (RBFR08F2FS-002 FO). FO and DC are fellows ofthe Regione Piemonte. We thank Lei Xu and Richard Hynes forgiving us the A375P cells and its metastatic variants; Paola Circostaand Alessandro Cignetti for providing several melanoma cell lines;Helen Hurst for the pSP(RSV)-NN and pSP(RSV)-TFAP2C vectors;Mike DiPersio for the anti-ITGA3 antibody and the pCMVzeo-ITGA3vector; Luca Primo for preparing HUVECs–GFP cells; Jacek Krol foradvices with sponges; Roberto Chiarle for help with the tumoursamples; Nancy Hynes, Pier Paolo Pandolfi and Richard Hynes forcritical reading of the manuscript.
Conflict of interest
The authors declare that they have no conflict of interest.
References
Bar-Eli M (2001) Gene regulation in melanoma progression by theAP-2 transcription factor. Pigment Cell Res 14: 78–85
Bartel DP (2009) MicroRNAs: target recognition and regulatoryfunctions. Cell 136: 215–233
Bauer R, Imhof A, Pscherer A, Kopp H, Moser M, Seegers S,Kerscher M, Tainsky MA, Hofstaedter F, Buettner R (1994) Thegenomic structure of the human AP-2 transcription factor. NucleicAcids Res 22: 1413–1420
Benvenuti S, Comoglio PM (2007) The METreceptor tyrosine kinasein invasion and metastasis. J Cell Physiol 213: 316–325
Berger AJ, Davis DW, Tellez C, Prieto VG, Gershenwald JE, JohnsonMM, Rimm DL, Bar-Eli M (2005) Automated quantitative analysisof activator protein-2alpha subcellular expression in melanomatissue microarrays correlates with survival prediction. Cancer Res65: 11185–11192
Blenkiron C, Goldstein LD, Thorne NP, Spiteri I, Chin SF, DunningMJ, Barbosa-Morais NL, Teschendorff AE, Green AR, Ellis IO,Tavare S, Caldas C, Miska EA (2007) MicroRNA expressionprofiling of human breast cancer identifies new markers oftumor subtype. Genome Biol 8: R214
Bookout AL, Mangelsdorf DJ (2003) Quantitative real-time PCRprotocol for analysis of nuclear receptor signaling pathways.Nucl Recept Signal 1: e012
Bosher JM, Totty NF, Hsuan JJ, Williams T, Hurst HC (1996)A family of AP-2 proteins regulates c-erbB-2 expression inmammary carcinoma. Oncogene 13: 1701–1707
Bosher JM, Williams T, Hurst HC (1995) The developmentallyregulated transcription factor AP-2 is involved in c-erbB-2 over-expression in human mammary carcinoma. Proc Natl Acad SciUSA 92: 744–747
Circosta P, Granziero L, Follenzi A, Vigna E, Stella S, Vallario A, EliaAR, Gammaitoni L, Vitaggio K, Orso F, Geuna M, Sangiolo D,Todorovic M, Giachino C, Cignetti A (2009) T cell receptor (TCR)gene transfer with lentiviral vectors allows efficient redirection oftumor specificity in naive and memory T cells without priorstimulation of endogenous TCR. Hum Gene Ther 20: 1576–1588
Croce CM (2009) Causes and consequences of microRNA dysregu-lation in cancer. Nat Rev Genet 10: 704–714
Cruz-Munoz W, Khokha R (2008) The role of tissue inhibitors ofmetalloproteinases in tumorigenesis and metastasis. Crit Rev ClinLab Sci 45: 291–338
Decembrini S, Bressan D, Vignali R, Pitto L, Mariotti S, Rainaldi G,Wang X, Evangelista M, Barsacchi G, Cremisi F (2009)MicroRNAs couple cell fate and developmental timing in retina.Proc Natl Acad Sci USA 106: 21179–21184
Desgrosellier JS, Cheresh DA (2010) Integrins in cancer: biologicalimplications and therapeutic opportunities. Nat Rev Cancer 10: 9–22
DiPersio CM, Shah S, Hynes RO (1995) alpha 3A beta 1 integrinlocalizes to focal contacts in response to diverse extracellularmatrix proteins. J Cell Sci 108(Pt 6): 2321–2336
Duffy MJ, McKiernan E, O’Donovan N, McGowan PM (2009) Roleof ADAMs in cancer formation and progression. Clin Cancer Res15: 1140–1144
Eckert D, Buhl S, Weber S, Jager R, Schorle H (2005) The AP-2family of transcription factors. Genome Biol 6: 246
Eskandarpour M, Kiaii S, Zhu C, Castro J, Sakko AJ, Hansson J (2005)Suppression of oncogenic NRAS by RNA interference inducesapoptosis of human melanoma cells. Int J Cancer 115: 65–73
Fei J, Lan F, Guo M, Li Y, Liu Y (2008) Inhibitory effects of anti-miRNA oligonucleotides (AMOs) on A549 cell growth. J DrugTarget 16: 688–693
Filipowicz W, Bhattacharyya SN, Sonenberg N (2008) Mechanismsof post-transcriptional regulation by microRNAs: are the answersin sight? Nat Rev Genet 9: 102–114
Flynt AS, Li N, Thatcher EJ, Solnica-Krezel L, Patton JG (2007)Zebrafish miR-214 modulates Hedgehog signaling to specifymuscle cell fate. Nat Genet 39: 259–263
Friedman RC, Farh KK, Burge CB, Bartel DP (2009) Most mammalianmRNAs are conserved targets of microRNAs. Genome Res 19: 92–105
Gadea G, Sanz-Moreno V, Self A, Godi A, Marshall CJ (2008)DOCK10-mediated Cdc42 activation is necessary for amoeboidinvasion of melanoma cells. Curr Biol 18: 1456–1465
Gentleman RC, Carey VJ, Bates DM, Bolstad B, Dettling M, Dudoit S,Ellis B, Gautier L, Ge Y, Gentry J, Hornik K, Hothorn T, Huber W,Iacus S, Irizarry R, Leisch F, Li C, Maechler M, Rossini AJ, SawitzkiG et al (2004) Bioconductor: open software development for com-putational biology and bioinformatics. Genome Biol 5: R80
Gershenwald JE, Sumner W, Calderone T, Wang Z, Huang S, Bar-EliM (2001) Dominant-negative transcription factor AP-2 augmentsSB-2 melanoma tumor growth in vivo. Oncogene 20: 3363–3375
Gupta GP, Massague J (2006) Cancer metastasis: building a frame-work. Cell 127: 679–695
Hilger-Eversheim K, Moser M, Schorle H, Buettner R (2000)Regulatory roles of AP-2 transcription factors in vertebrate devel-opment, apoptosis and cell-cycle control. Gene 260: 1–12
Hornebeck W, Emonard H, Monboisse JC, Bellon G (2002) Matrix-directed regulation of pericellular proteolysis and tumor progres-sion. Semin Cancer Biol 12: 231–241
Huang S, Jean D, Luca M, Tainsky MA, Bar-Eli M (1998) Loss ofAP-2 results in downregulation of c-KIT and enhancement
miR-214 and melanoma progressionE Penna et al
&2011 European Molecular Biology Organization The EMBO Journal 17
of melanoma tumorigenicity and metastasis. EMBO J 17:4358–4369
Hynes NE, Taverna D, Harwerth IM, Ciardiello F, Salomon DS,Yamamoto T, Groner B (1990) Epidermal growth factor receptor,but not c-erbB-2, activation prevents lactogenic hormone induc-tion of the beta-casein gene in mouse mammary epithelial cells.Mol Cell Biol 10: 4027–4034
Inui M, Martello G, Piccolo S (2010) MicroRNA control of signaltransduction. Nat Rev Mol Cell Biol 11: 252–263
Iyer V, Pumiglia K, DiPersio CM (2005) Alpha3beta1 integrinregulates MMP-9 mRNA stability in immortalized keratinocytes:a novel mechanism of integrin-mediated MMP gene expression.J Cell Sci 118(Pt 6): 1185–1195
Jeanes A, Gottardi CJ, Yap AS (2008) Cadherins and cancer: howdoes cadherin dysfunction promote tumor progression? Oncogene27: 6920–6929
John B, Enright AJ, Aravin A, Tuschl T, Sander C, Marks DS (2004)Human microRNA targets. PLoS Biol 2: e363
Juan AH, Kumar RM, Marx JG, Young RA, Sartorelli V (2009) Mir-214-dependent regulation of the polycomb protein Ezh2 in skele-tal muscle and embryonic stem cells. Mol Cell 36: 61–74
Karjalainen JM, Kellokoski JK, Mannermaa AJ, Kujala HE, Moisio KI,Mitchell PJ, Eskelinen MJ, Alhava EM, Kosma VM (2000) Failure inpost-transcriptional processing is a possible inactivation mechanismof AP-2alpha in cutaneous melanoma. Br J Cancer 82: 2015–2021
Kobayashi H, Boelte KC, Lin PC (2007) Endothelial cell adhesionmolecules and cancer progression. Curr Med Chem 14: 377–386
Krol J, Busskamp V, Markiewicz I, Stadler MB, Ribi S, Richter J,Duebel J, Bicker S, Fehling HJ, Schubeler D, Oertner TG, SchrattG, Bibel M, Roska B, Filipowicz W (2010) Characterizing light-regulated retinal microRNAs reveals rapid turnover as a commonproperty of neuronal microRNAs. Cell 141: 618–631
Kueng W, Silber E, Eppenberger U (1989) Quantification of cellscultured on 96-well plates. Anal Biochem 182: 16–19
Lazar V, Ecsedi S, Szollosi AG, Toth R, Vizkeleti L, Rakosy Z, BeganyA, Adany R, Balazs M (2009) Characterization of candidate genecopy number alterations in the 11q13 region along with BRAF andNRAS mutations in human melanoma. Mod Pathol 22: 1367–1378
Lee YB, Bantounas I, Lee DY, Phylactou L, Caldwell MA, Uney JB(2009) Twist-1 regulates the miR-199a/214 cluster during devel-opment. Nucleic Acids Res 37: 123–128
Liang S, Sharma A, Peng HH, Robertson G, Dong C (2007) Targetingmutant (V600E) B-Raf in melanoma interrupts immunoediting ofleukocyte functions and melanoma extravasation. Cancer Res 67:5814–5820
Longo N, Yanez-Mo M, Mittelbrunn M, de la Rosa G, Munoz ML,Sanchez-Madrid F, Sanchez-Mateos P (2001) Regulatory role oftetraspanin CD9 in tumor-endothelial cell interaction during trans-endothelial invasion of melanoma cells. Blood 98: 3717–3726
Ma L, Young J, Prabhala H, Pan E, Mestdagh P, Muth D, Teruya-Feldstein J, Reinhardt F, Onder TT, Valastyan S, Westermann F,Speleman F, Vandesompele J, Weinberg RA (2010) miR-9, a MYC/MYCN-activated microRNA, regulates E-cadherin and cancermetastasis. Nat Cell Biol 12: 247–256
Melnikova VO, Bar-Eli M (2008) Transcriptional control of themelanoma malignant phenotype. Cancer Biol Ther 7: 997–1003
Mitchell K, Svenson KB, Longmate WM, Gkirtzimanaki K, Sadej R,Wang X, Zhao J, Eliopoulos AG, Berditchevski F, Dipersio CM(2010) Suppression of integrin alpha3beta1 in breast cancer cellsreduces cyclooxygenase-2 gene expression and inhibits tumori-genesis, invasion, and cross-talk to endothelial cells. Cancer Res70: 6359–6367
Mueller DW, Bosserhoff AK (2009) Role of miRNAs in the progres-sion of malignant melanoma. Br J Cancer 101: 551–556
Neufeld G, Kessler O (2008) The semaphorins: versatile regulatorsof tumour progression and tumour angiogenesis. Nat Rev Cancer8: 632–645
Nguyen DX, Bos PD, Massague J (2009) Metastasis: from dissemi-nation to organ-specific colonization. Nat Rev Cancer 9: 274–284
Orso F, Penna E, Cimino D, Astanina E, Maione F, Valdembri D,Giraudo E, Serini G, Sismondi P, De Bortoli M, Taverna D(2008) AP-2alpha and AP-2gamma regulate tumor progressionvia specific genetic programs. FASEB J 22: 2702–2714
Parkin DM, Bray F, Ferlay J, Pisani P (2005) Global cancer statistics,2002. CA Cancer J Clin 55: 74–108
Pfaffl MW (2001) A new mathematical model for relative quantifi-cation in real-time RT-PCR. Nucleic Acids Res 29: e45
Primo L, di Blasio L, Roca C, Droetto S, Piva R, Schaffhausen B,Bussolino F (2007) Essential role of PDK1 in regulating endothe-lial cell migration. J Cell Biol 176: 1035–1047
Rasola A, Geuna M (2001) A flow cytometry assay simultaneouslydetects independent apoptotic parameters. Cytometry 45: 151–157
Segura MF, Belitskaya-Levy I, Rose AE, Zakrzewski J, Gaziel A,Hanniford D, Darvishian F, Berman RS, Shapiro RL, Pavlick AC,Osman I, Hernando E (2010) Melanoma MicroRNA signaturepredicts post-recurrence survival. Clin Cancer Res 16: 1577–1586
Segura MF, Hanniford D, Menendez S, Reavie L, Zou X, Alvarez-Diaz S, Zakrzewski J, Blochin E, Rose A, Bogunovic D, Polsky D,Wei J, Lee P, Belitskaya-Levy I, Bhardwaj N, Osman I, Hernando E(2009) Aberrant miR-182 expression promotes melanoma metas-tasis by repressing FOXO3 and microphthalmia-associated tran-scription factor. Proc Natl Acad Sci USA 106: 1814–1819
Sempere LF, Christensen M, Silahtaroglu A, Bak M, Heath CV,Schwartz G, Wells W, Kauppinen S, Cole CN (2007) AlteredmicroRNA expression confined to specific epithelial cell subpo-pulations in breast cancer. Cancer Res 67: 11612–11620
Steeg PS (2006) Tumor metastasis: mechanistic insights and clinicalchallenges. Nat Med 12: 895–904
Swart GW, Lunter PC, Kilsdonk JW, Kempen LC (2005) Activatedleukocyte cell adhesion molecule (ALCAM/CD166): signaling atthe divide of melanoma cell clustering and cell migration? CancerMetastasis Rev 24: 223–236
Talantov D, Mazumder A, Yu JX, Briggs T, Jiang Y, Backus J, Atkins D,Wang Y (2005) Novel genes associated with malignant melanomabut not benign melanocytic lesions. Clin Cancer Res 11: 7234–7242
Ueda T, Volinia S, Okumura H, Shimizu M, Taccioli C, Rossi S,Alder H, Liu CG, Oue N, Yasui W, Yoshida K, Sasaki H, Nomura S,Seto Y, Kaminishi M, Calin GA, Croce CM (2010) Relation betweenmicroRNA expression and progression and prognosis of gastriccancer: a microRNA expression analysis. Lancet Oncol 11: 136–146
Valastyan S, Reinhardt F, Benaich N, Calogrias D, Szasz AM,Wang ZC, Brock JE, Richardson AL, Weinberg RA (2009) Apleiotropically acting microRNA, miR-31, inhibits breast cancermetastasis. Cell 137: 1032–1046
Valastyan S, Weinberg RA (2009) MicroRNAs: crucial multi-taskingcomponents in the complex circuitry of tumor metastasis. CellCycle 8: 3506–3512
Volinia S, Calin GA, Liu CG, Ambs S, Cimmino A, Petrocca F, Visone R,Iorio M, Roldo C, Ferracin M, Prueitt RL, Yanaihara N, Lanza G,Scarpa A, Vecchione A, Negrini M, Harris CC, Croce CM (2006)A microRNA expression signature of human solid tumors definescancer gene targets. Proc Natl Acad Sci USA 103: 2257–2261
Watanabe T, Sato T, Amano T, Kawamura Y, Kawamura N,Kawaguchi H, Yamashita N, Kurihara H, Nakaoka T (2008)Dnm3os, a non-coding RNA, is required for normal growth andskeletal development in mice. Dev Dyn 237: 3738–3748
Worley LA, Long MD, Onken MD, Harbour JW (2008) Micro-RNAsassociated with metastasis in uveal melanoma identified bymultiplexed microarray profiling. Melanoma Res 18: 184–190
Xiao F, Zuo Z, Cai G, Kang S, Gao X, Li T (2009) miRecords: anintegrated resource for microRNA-target interactions. NucleicAcids Res 37 (Database Issue): D105–D110
Xie S, Luca M, Huang S, Gutman M, Reich R, Johnson JP, Bar-Eli M(1997) Expression of MCAM/MUC18 by human melanoma cellsleads to increased tumor growth and metastasis. Cancer Res 57:2295–2303
Xu L, Shen SS, Hoshida Y, Subramanian A, Ross K, Brunet JP, Wagner SN,Ramaswamy S, Mesirov JP, Hynes RO (2008) Gene expressionchanges in an animal melanoma model correlate with aggressive-ness of human melanoma metastases. Mol Cancer Res 6: 760–769
Yang H, Kong W, He L, Zhao JJ, O’Donnell JD, Wang J, Wenham RM,Coppola D, Kruk PA, Nicosia SV, Cheng JQ (2008) MicroRNA expres-sion profiling in human ovarian cancer: miR-214 induces cell survivaland cisplatin resistance by targeting PTEN. Cancer Res 68: 425–433
Yin G, Chen R, Alvero AB, Fu HH, Holmberg J, Glackin C,Rutherford T, Mor G (2010) TWISTing stemness, inflammationand proliferation of epithelial ovarian cancer cells throughMIR199A2/214. Oncogene 29: 3545–3553
Zhang L, Huang J, Yang N, Greshock J, Megraw MS, Giannakakis A,Liang S, Naylor TL, Barchetti A, Ward MR, Yao G, Medina A,O’Brien-Jenkins A, Katsaros D, Hatzigeorgiou A, Gimotty PA,Weber BL, Coukos G (2006) microRNAs exhibit high frequencygenomic alterations in human cancer. Proc Natl Acad Sci USA 103:9136–9141
miR-214 and melanoma progressionE Penna et al
The EMBO Journal &2011 European Molecular Biology Organization18