Methodology to a Watershed Based Approach to ... - Thurston County
71
Methodology to a Watershed Based Approach to Clean Water and Natural Resource Management Thurston County GeoData Center Department of Resource Stewardship May 24, 2012 This project has been funded wholly or in part by the United States Environmental Protection Agency under assistance agreement (Grant #WS-96073601) to Thurston County’s Water Resources Program. The contents of this document do not necessarily reflect the views and policies of the Environmental Protection Agency, nor does mention of trade names or commercial products constitute endorsement or recommendation for use.
-
Upload
khangminh22 -
Category
Documents
-
view
1 -
download
0
Transcript of Methodology to a Watershed Based Approach to ... - Thurston County

Methodology to a Watershed Based
Approach to Clean Water and Natural Resource Management
Thurston County GeoData Center
Department of Resource Stewardship
May 24, 2012
This project has been funded wholly or in part by the United States Environmental Protection Agency under assistance agreement (Grant #WS-96073601) to Thurston County’s Water Resources Program. The contents of this document do not necessarily reflect the views and policies of the Environmental Protection Agency, nor does mention of trade names or commercial products constitute endorsement or recommendation for use.
June, 2012 Watershed Characterization Methods
Acknowledgments We would like to acknowledge the Environmental Protection Agency (EPA) that provided grant funds under contract WS-96073601-0 to complete this important work for Thurston County and the South Puget Sound. With special mention of EPA staff Krista Mendelman, Melissa Whitaker, Evelyn Holtzendorf, and Tony Fournier, for their invaluable guidance and support to assure Thurston County’s success on this project. We also want to acknowledge Derek Booth, Ph.D, Rich Horner, Ph.D., and Dave Montgomery, Ph.D., for their thorough peer review and comments on the Methodology to assure a scientific rigorous document that meets the best available science standards. Additionally, we want to thank Stephen Stanley and Susan Grigsby, both with Ecology for their continued support of Thurston County’s work. And lastly, we want to acknowledge Dick Gersib, WSDOT (formally Ecology) for his continued persistence and vision of management of our natural resources at a watershed scale. Watershed Characterization Technical Team Owen Reynolds, GIS Analyst III, Thurston County GeoData Barb Wood, Utility Planner, Resource Stewardship Sue Stedman, Administrative Assistant, Resource Stewardship

Page i
Table of Contents
Introduction ............................................................................................................................................. 3
Box 1. Major Elements of a Watershed-Based Strategy.................................................................. 5
Importance of Comprehensive Watershed Analysis ....................................................................... 7 The Need for a Watershed Approach .............................................................................................. 7 Guiding Principles .......................................................................................................................... 8 Establishment of Technical Team ................................................................................................... 9 Local Watershed Coordination between Government Agencies .................................................... 9 The Framework for Watershed Characterization .......................................................................... 10
Part I. Landscape Characterization ............................................................................................... 11
The Approach................................................................................................................................ 11 Step 1. Establish Spatial Scales of Analysis .................................................................................... 11
Step 1A. Establish Drainage Analysis Units................................................................................ 11 Step 1B. Establish Study Area ..................................................................................................... 13
Step 2. Establish Temporal Scales of Analysis ................................................................................ 13 Step 2A. Create a Pre-Development Data Layer ......................................................................... 14 Step 2B. Select or Create a Current Landcover Data layer .......................................................... 14 Step 2C. Select or Create a Future Landcover Data layer ........................................................... 15
Part II. Characterize Condition of Ecological Processes in Study Area ........................................ 16
Step 1. Movement of Water ......................................................................................................... 17 Step 2. Movement of Wood ......................................................................................................... 18 Step 3. Movement of Sediment .................................................................................................... 19 Step 4. Movement of Pollutants ................................................................................................... 19 Step 5. Movement of Heat ........................................................................................................... 20 Step 6. Habitat Connectivity ........................................................................................................ 21
Part III. Characterize Natural Resources in Study Area .................................................................. 32
Step 1. Determine Location, Extent, and Condition of Wetland Resources. ................................... 34 Step 2. Determine Location, Extent, and Condition of Riparian Resources .................................... 41 Step 3. Determine Location, Extent, and Condition of Floodplain Resources. ............................... 43
Part IV. Assess Potential Sites within the Context of the Landscape .............................................. 45
Step 1. Determine the Ecological Conditions of the DAU .............................................................. 46 Step 2. Determine the Potential Environmental Benefit of Resource Sites ..................................... 47 Step 3. Assess Potential Sites within the DAU ................................................................................ 52
Part V. Potential Uses of Watershed Characterization Results ...................................................... 54
References 61

Page ii
List of Tables
Table 1: Description of typical terms and areas of Watershed Management Units used by Thurston County to establish consistent scale for assessment and planning needs. .......................... 12
Table 2. Matrix of Landscape-scale Pathways and Indicators (Stelle 1996) ................................... 22
Table 3. Rules and Assumptions Used to Establish the Overall Condition Rank for Movement of Water .................................................................................................................................. 25
Table 4. Rules and Assumptions Used to Establish the Overall Condition Rank for Movement of Wood .................................................................................................................................. 27
Table 5. Rules and Assumptions Used to Establish the Overall Condition Rank for Movement of Sediment ............................................................................................................................. 28
Table 6. Rules and Assumptions Used to Establish the Overall Condition Rank for Movement of Pollutants, Nutrients, and Bacteria ..................................................................................... 29
Table 7. Rules and Assumptions Used to Establish the Overall Condition Rank for Movement of Heat .................................................................................................................................... 30
Table 8. Rules and Assumptions Used to Establish the Overall Condition Rank for Habitat Connectivity ....................................................................................................................... 31
Table 9. Land use types recorded during wetland photo interpretation. .......................................... 33
Table 10. Hydrogeomorphic wetland types used to classify wetlands............................................... 36
Table 11. Weight criteria to rank DAUs ............................................................................................ 47
Table 12. Convert Ecological Process Score to Categories ............................................................... 47
Table 13. Potential Wetland Restoration Site Environmental Benefits Ranking Criteria.................. 48
Table 14. Potential Riparian Restoration Site Environmental Benefits Ranking Criteria ................. 50
Table 15. Potential Floodplain Restoration Site Environmental Benefits Ranking Criteria .............. 51
Table 16. Convert Wetland Environmental Process Score to Process Rank...................................... 52
Table 17. Convert Riparian Environmental Process Score to Process Rank ..................................... 52
Table 18. Convert Floodplain Environmental Process Score to Process Rank .................................. 52
Table 19. Combined DAU and Site Score Ranking ........................................................................... 53

June 2012 Watershed Characterization Methods
Methodology to a Watershed Based Approach to Page 1 Clean Water and Natural Resource Management
List of Acronyms and Abbreviations
303(d) List of impaired water bodies specified in the Clean Water Act, Section 303(d)
ADT Average daily traffic
Basin 1000 to 10000 acres
B-IBI Benthic – Index of Biological Integrity
Catchment 32 to 320 acres
DAU Drainage Analysis Unit (0.25 sq miles or 160 acres)
DBH Diameter breast height
DEM Digital Elevation Model
Ecological benefit The ability of a DAU to maintain ecological processes
Ecology Washington State Department of Ecology
EDT Ecosystem Diagnosis and Treatment
EIA Effective Impervious Area
EMC Event mean concentration
Environmental benefit
The ability of a natural resource site to maintain function within a DAU
EPA Environmental Protection Agency
ESA Endangered Species Act
ESB Engrossed Senate Bill
FEMA Federal Emergency Management Agency
FRAGSTATS FRAGSTATS is a computer software program designed to compute a wide variety of landscape metrics
GeoData Thurston County’s GeoData Center
GIS Geographical Information System
GLO General Land Office

June 2012 Watershed Characterization Methods
Methodology to a Watershed Based Approach to Page 2 Clean Water and Natural Resource Management
HSPF Hydrological Simulation Program—Fortran
LID Low Impact Development
LiDAR Light Detecting and Ranging
LWD Large Woody Debris
NEPA National Environmental Policy Act
PAH Polynuclear aromatic hydrocarbons
PHS Priority Habitats and Species
SEPA State Environmental Policy Act
SSHIAP Salmon and Steelhead Habitat Inventory and Assessment Program
Sub-basin 100 to 1,000 acres
Sub-watershed 320 to 19,200 acres
TIA Total Impervious Area
TMDL Total Maximum Daily Load
TSS Total Suspended Solids
TRPC Thurston Regional Planning Council
USDA US Department of Agriculture
USGS US Geological Survey
WAC Washington Administrative Code
WADNR Washington Department of Natural Resources
Watershed 19,200 to 320,000 acres
WDFW Washington State Department of Fish and Wildlife
WRIA Water Resource Inventory Area as defined in Chapter 173-500 WAC
WWHM Western Washington Hydrologic Model
WWSMM Western Washington Stormwater Management Manual

June 2012 Watershed Characterization Methods
Methodology to a Watershed Based Approach to Page 3 Clean Water and Natural Resource Management
INTRODUCTION Background The primary purpose of this document is to describe the approach, and the underlying scientific principles, used to develop the Totten and Eld Inlet and Deschutes River watershed characterizations (Thurston County, 2009, 2010). Its secondary purpose is to generalize this approach so that other jurisdictions can understand how this framework could be applied to other areas. Not every step, however, is described herein with enough detail to constitute a stand-alone “user’s guide.” Although that is a long-term goal of this effort, at present the applications are sufficiently rigorous and reviewed only to stand for the specific watersheds for which it has been developed and applied. The approach described in this document was originally developed by Gersib et al. (2004), currently with the Washington State Department of Transportation. Thurston County staff has updated the methods in 2006 (Reynolds and Wood, 2006), 2008 (Reynolds and Wood, 2008), and 2010 (Reynolds and Wood, 2010) as new information became available. In 2010, Thurston County requested a scientific peer review from Derek Booth, Ph.D., Richard Horner, Ph.D., and David Montgomery, Ph.D. Comments have been incorporated into the Methods where possible. Where comments could not be addressed, an explanation was provided. Following incorporation of the first peer review, a second peer review was completed by Derek Booth, Ph.D to assess the appropriateness of the revised Methods for the intended use to address taking a watershed approach to clean water and natural resource management. This document summarizes a scientific framework for watershed characterizations and describes a set of methods developed at the watershed scale that is being used in Thurston County to assist in providing information to make sound land-use decisions using best available science (BAS). Watershed-based methods will be most effective when the approach is driven by landscape needs and conditions rather than just an individual site needs. This is because the success of a restoration project will vary depending not only on the level of disturbance (anthropogenic or natural) of the site but also the landscape within which the site resides (NRC 1992). The methods discussed in this appendix will help to refine and provide new data to meet the needs of the Clean Water Act (CWA), Safe Drinking Water Act (SDWA), Endangered Species Act (ESA), Shoreline Management Act (SMA), and Critical Area Ordinance (CAO) updates. It represents a transition from a site-driven to landscape-driven approach to assessing current ecological processes of the watershed. Despite dramatic increases in effort, legal mandates, and expenditures for environmental protection and restoration over the past 20 years, the overall condition of natural ecosystems continues to decline (Karr 1995, Montgomery et al. 1995). A growing body of work indicates that declines in ecosystem integrity are perpetuated by existing policies and traditional techniques that tend to treat local symptoms of resource degradation and fail to

June 2012 Watershed Characterization Methods
Methodology to a Watershed Based Approach to Page 4 Clean Water and Natural Resource Management
address the root biological and physical causes of ecosystem degradation and population decline. These policy and traditional techniques perpetuate a narrow “site” review and analysis that often results in restoration that treat symptoms of localized habitat/resource degradation rather than addressing the systemic causes of ecosystem degradation (Frissell 1996, Angermeier and Schlosser 1995, Montgomery et al. 1995, Reeves et al. 1995, Ebersole et al. 1997, Beechie et al. 2010). Thurston County was designated a National Pollutant Discharge Elimination (NPDES) Phase II jurisdiction in the 2000 Census. Thurston County submitted a NPDES Phase II permit to Ecology in March 2003. With the issuance of the NPDES Permit for Phase II communities in February 2007, Thurston County determined that a more holistic approach was needed to incorporate all the required regulations at the watershed level to promote efficiency in monitoring, analyzing, and reporting on the health of our water bodies. Current government efforts are segmented and have not proven to provide protection to either Thurston County’s streams or to Puget Sound. There are multiple jurisdictions in Thurston County that have applied for their National Pollutant Discharge Elimination System (NPDES) Phase II and Phase I permits. Thurston County, in addition to the cities of Olympia, Lacey, and Tumwater, are designated Phase II permittees. The Washington State Department of Transportation (WSDOT) is a NPDES Phase I permittee in Thurston County. The current framework for state and federal permits is very fragmented. Each jurisdiction has applied for their respective permit separately, which could lead to duplicative efforts in planning, assessment, and monitoring as each jurisdiction addresses the six core Clean Water Act (CWA) programs and other requirements under the Safe Drinking Water Act (SDWA). These permits are managed by the Washington State Department of Ecology (WDOE) individually. In response to this interweave, Thurston County has endeavored to follow a six-step process detailed in EPA’s Watershed-Based NPDES Permitting Implementation Guidance drafted in 2003 (USEPA, 2003), and updated in 2007 (USEPA, 2007). This report presents the results of steps one, two and three of this process in the context of developing a watershed-based permit based on a watershed scale. These steps are as follows:
• Step One: Select a watershed and determine the boundaries. • Step Two: Identify and facilitate multiple jurisdictions to participate in a watershed-
based NPDES permit or permit compliance approach using the EPA’s guidance. • Step Three: Collect and analyze data through a watershed characterization for permit
development or permit compliance. • Step Four: Develop watershed-based permit or permit compliance conditions and
documentation. • Step Five: Issue watershed-based NPDES permit. • Step Six: Measure and report progress.

June 2012 Watershed Characterization Methods
Methodology to a Watershed Based Approach to Page 5 Clean Water and Natural Resource Management
Steps four, five and six have not been initiated as proposed. While the intent of the original watershed characterization work was to provide a framework for a future watershed based NPDES Permit; budget and staffing at the State level has disadvantaged that effort. However, the completion of watershed characterization plans does foster other uses of the data for many other efforts (see Part V of this document for potential uses of the data). The completion of watershed characterizations, or watershed plans, is not a requirement of the NPDES permit. However, the adoption of such plans allows alternative stormwater management options through Thurston County’s drainage manual, and the results of watershed characterizations also follows the guidance of USEPA (2007), utilizing the weight of scientific literature on watershed functions and processes. The EPA guidance does not specify how to implement a watershed-based permit; however, the Natural Resource Council has recently published Urban Stormwater Management in the United States (NRC, 2009). This document, and specifically chapter six, details how NPDES permit holders could implement EPA’s Watershed-Based NPDES Permitting. The report can be acquired at http://www.nap.edu/catalog.php?record_id=12465. Two of that report’s authors have been primary reviewers of the present document. Box 1 presents the major elements of effective watershed-based, water resources management and permitting in the committee’s view (NRC 2009). Each element is elaborated in substantial detail in the report. BOX 1. MAJOR ELEMENTS OF A WATERSHED-BASED STRATEGY1 A watershed instead of political-boundary basis Centralizing responsibility and authority for implementation with a municipal lead permittee working in partnership with other municipalities in the watershed as co-permittees Embracing the full range of sources of aquatic ecosystem problems now usually under uncoordinated management and permitting; integration of all local water permits under the co-permittee system organized by watersheds Extending full permit coverage, as appropriate, to any area in the watershed zoned or otherwise projected for development at an urban scale (e.g., more than one dwelling per acre)
1 The integration of all local water permits refers to permits for public streets and highways; municipal stormwater drainage systems; municipal separate and combined wastewater collection, conveyance, and treatment systems; industrial stormwater and process wastewater discharges; private residential and commercial property; and construction sites.
June 2012 Watershed Characterization Methods
Methodology to a Watershed Based Approach to Page 6 Clean Water and Natural Resource Management
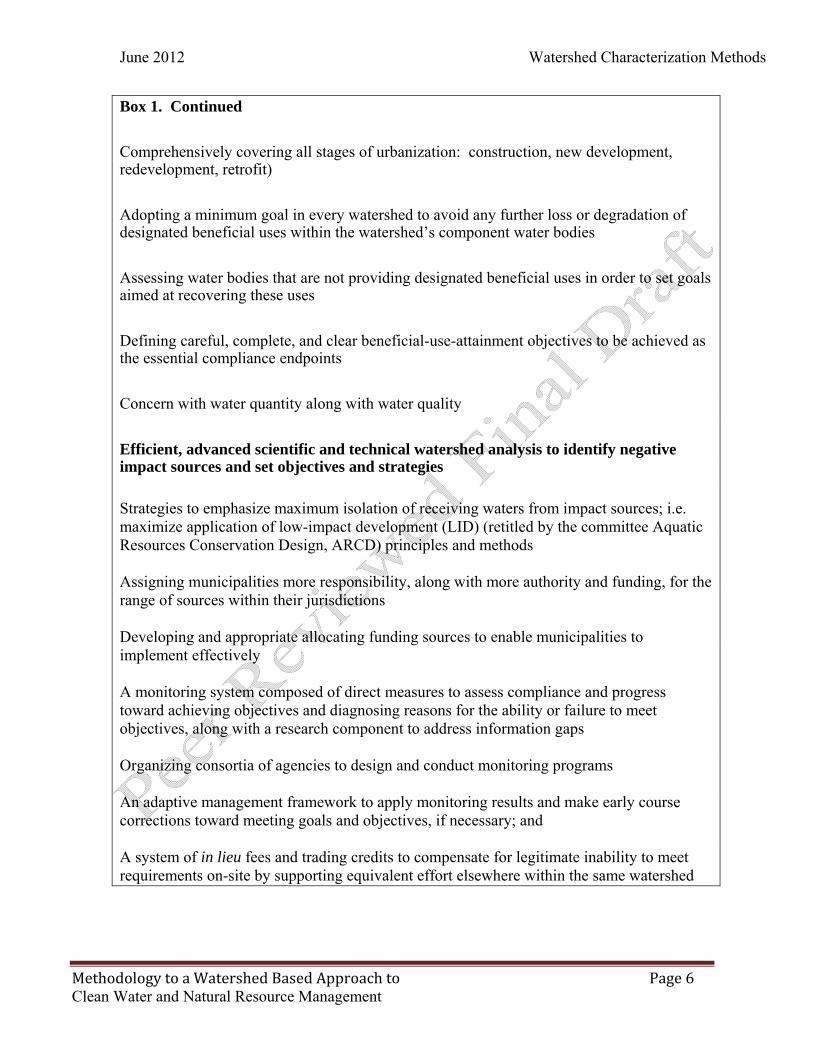
Box 1. Continued Comprehensively covering all stages of urbanization: construction, new development, redevelopment, retrofit) Adopting a minimum goal in every watershed to avoid any further loss or degradation of designated beneficial uses within the watershed’s component water bodies Assessing water bodies that are not providing designated beneficial uses in order to set goals aimed at recovering these uses Defining careful, complete, and clear beneficial-use-attainment objectives to be achieved as the essential compliance endpoints Concern with water quantity along with water quality Efficient, advanced scientific and technical watershed analysis to identify negative impact sources and set objectives and strategies Strategies to emphasize maximum isolation of receiving waters from impact sources; i.e. maximize application of low-impact development (LID) (retitled by the committee Aquatic Resources Conservation Design, ARCD) principles and methods Assigning municipalities more responsibility, along with more authority and funding, for the range of sources within their jurisdictions Developing and appropriate allocating funding sources to enable municipalities to implement effectively A monitoring system composed of direct measures to assess compliance and progress toward achieving objectives and diagnosing reasons for the ability or failure to meet objectives, along with a research component to address information gaps Organizing consortia of agencies to design and conduct monitoring programs An adaptive management framework to apply monitoring results and make early course corrections toward meeting goals and objectives, if necessary; and A system of in lieu fees and trading credits to compensate for legitimate inability to meet requirements on-site by supporting equivalent effort elsewhere within the same watershed

June 2012 Watershed Characterization Methods
Methodology to a Watershed Based Approach to Page 7 Clean Water and Natural Resource Management
Importance of Comprehensive Watershed Analysis An “efficient, advanced scientific and technical watershed analysis designed to identify negative impact sources and set objectives and strategies” (see bolded item in Box 1) represents Thurston County’s approach and shows where the watershed characterization results place in the overall watershed-based framework. It is essential to clarify that watershed-based strategy formulation in the NRC committee’s framework and the County’s methodology, differ sharply from traditional watershed (or basin) planning. In Thurston County traditional basin plans were the result of the built environment’s impacts on public infrastructure (flooding) and stream channel damage (scour because of high flows), and impaired water quality that results in the loss of shellfish harvest areas. Drawing up such a traditional basin plan can be time-consuming, and has often become an end in itself, instead of a means to an end. Many traditional basin plans completed over the last 40 years have not been fully implemented. Davenport (2003), drawing heavily on a survey of practitioners by the Center for Watershed Protection, presented and commented on 12 reasons for these failures (Horner, 2010). The NRC (2009) does not recommend completing a traditional “watershed plan,” as a prerequisite to watershed-based strategy development. Rather, the NRC process is based on a comprehensive scientific and technical analysis of the water resources to be managed and their contributing catchment areas. Thurston County’s approach is intended to comply with this principle, and its comprehensive scientific and technical analysis is reiterated here to add emphasis to its importance.
The Need for a Watershed Approach The conventional, site-specific, jurisdictional approach to environmental protection and recovery has failed to stem the decline in water quality, base flow, fish and wildlife habitat. Despite the expenditure of hundreds of millions of dollars on required mitigation and voluntary recovery efforts, Puget Sound continues to decline in health. There is a growing awareness that the scale of assessment needs to match the scale of the problem if we expect to reverse this trend (Naiman et al. 1992, Doppelt et al. 1993, Montgomery 1995, Frissell and Doppelt 1996). For example, if water-quality problems are associated with one identifiable point-source, then a site-specific scale of assessment is appropriate. However, if water quality problems are associated with many non-point sources of pollutants distributed throughout a watershed, then a watershed-scale response is needed to identify, understand, and prioritize management options. The nearly 50-year history of stormwater management in the United States has been organized, almost invariably, according to local jurisdictional (city, county) boundaries. This organizational principle extends, for the most part, to management of other pollutant-bearing discharges as well. In a 2003 policy statement, USEPA noted the disadvantages of this practice and the potential benefits (USEPA 2003a) of embracing, “... a detailed, integrated, and inclusive watershed planning process, based in “clear watershed goals.”

June 2012 Watershed Characterization Methods
Methodology to a Watershed Based Approach to Page 8 Clean Water and Natural Resource Management
Subsequent to the policy statement, USEPA published two guidance documents laying out a general process for setting up Clean Water Act permits on a watershed basis (USEPA 2003b, 2007). The NRC committee recognized the benefits and general principles of USEPA’s concept but concluded that its guidance did not go nearly far enough toward bringing it to fruition. The committee developed an approach consistent with the general framework outlined by USEPA but greatly expanding it in scope and detail. It is intended to replace the present structure, instead of being an adjunct to it, and to be uniformly applied nationwide (NRC, 2009).
Guiding Principles The following guiding principles have served as the fundamental building blocks on which landscape-scale assessment methods were developed for the Totten, Eld and Deschutes watershed characterizations. All of the guiding principles listed below have an established policy and/or technical rationale.
• Communities and landscapes form the ecological and evolutionary context for populations and species; preserving integrity at a landscape-scale is critical to species persistence (Angermeier and Schlosser 1995).
• Watershed characterization efforts seek to understand human effects on ecological processes that create and maintain the unique structure elements (habitat) that support all aquatic and terrestrial wildlife species. Any analyses of watershed conditions need to assess the variability of watershed functions and characteristics over time and space (Euphrat and Warkentin 1994).
• Watershed characterization efforts seek to use landscape-scale planning and analysis
to maximize environmental, social, and economic benefits of natural resource and environmentally sensitive area management plans.
• Indian Tribes of the State of Washington are guaranteed the right to protection of the
fish habitat within their Usual and Accustomed Areas (Orrick Decision). Development impacts to fish habitat and all associated management plans will result in consultation with the appropriate Tribe or Tribes to ensure no net loss of Tribal Usual and Accustomed Areas. Watershed characterization helps ensure that Tribal concerns regarding fish habitats are identified.
• Major initiatives intended to aid in the recovery of salmon stocks listed as
“threatened” or “endangered” under the ESA and to restore polluted water bodies in the Pacific Northwest have embraced watershed-scale planning and implementation. Further, stormwater management efforts are now beginning to explore the applicability of watershed assessment tools to address altered hydrology because of the built environment.

June 2012 Watershed Characterization Methods
Methodology to a Watershed Based Approach to Page 9 Clean Water and Natural Resource Management
Establishment of Technical Team Understanding the cumulative effects of land-use impacts on ecological processes at landscape scales requires expertise in hydrology, hydrogeology, ecology, biology, and many other scientific disciplines (Reid 1993). This suggests that an interdisciplinary technical team should work together to develop the interdisciplinary understanding of watershed processes. Thurston County staffs have extensive education and experience in hydrology, geomorphology, ecology, biology, and water quality. That education and experience, including technical support from a GIS analyst that is a certified American Institute of Certified (ACIP) planner, enabled Thurston County to complete the characterizations. The technical team was responsible for conducting the watershed characterization, with regular input from stakeholders with education and experience in various scientific disciplines. Thurston County also worked, and will continue to work with regulatory agencies to ensure a successful application of a watershed-based approach to clean water and natural resource management efforts.
Local Watershed Coordination between Government Agencies The cities of Olympia, Lacey, and Tumwater, as well as the Squaxin, Nisqually, and Chehalis tribes, share natural resource management responsibilities within Thurston County. Successful management at the landscape scale requires the coordination of responsible local and tribal governments. While the methods described in this document have been developed for Thurston County, the data is available to all stakeholders for consideration in their management decisions, wherever appropriate. Local watershed planning efforts are a fundamental mechanism for natural resource and environmentally sensitive area management. Watershed councils and planning groups bring stakeholders together to develop plans that consider all local interests and concerns. For this reason, local planning initiatives are assumed to be most effective at understanding and addressing the needs and priorities of local residents and the natural resources on which they depend. Local watershed planning groups often acquire and compile local or regional data sets that can be of substantial value to watershed characterization efforts. Thurston County was an active participant in Watershed Resource Inventory Areas (WRIA) planning efforts under Engrossed Substitute House Bill (ESHB) 2515, as well as ongoing Salmon Recovery Efforts under ESHB 2496. Thurston County incorporated the results of local watershed planning efforts at the earliest stages of watershed characterization which lead to additional opportunities for the collection of locally developed data needed for the watershed characterizations in Totten and Eld Inlets and the Deschutes watershed.
It should be acknowledged that GIS data varies in availability, quality, and scale. The processing of raw data to create new landscape data is an evolving discipline. As technology advances, so will the ability to create finer scale results using GIS as a tool. In addition, as data collection and storage evolves, there will be a collection of data that can be utilized during GIS evaluation of the landscape.

June 2012 Watershed Characterization Methods
Methodology to a Watershed Based Approach to Page 10 Clean Water and Natural Resource Management
The Framework for Watershed Characterization The rest of this document presents the process used by Thurston County to conduct the watershed characterization in the Totten, Eld, and Deschutes watersheds. Thurston County’s framework included the following steps:
1. Define the appropriate spatial scales to be used in watershed characterization; 2. Compile land use/landcover information for pre-development and current conditions
and estimate the type and extent of future growth/development; 3. Develop an understanding of the
ecological processes within drainages occurring in the area, identify key drivers for those processes, and begin to understand how past and present land use has altered processes and disturbance regimes;
4. Characterize the general condition of ecological processes within the largest acceptable landscape scale; and
5. Identify landscape areas having specific levels of degradation to targeted ecological processes under current conditions.
The focus of this work is to identify natural resource sites that can be restored with a high probability of success given their location in the landscape. The outputs of this work can be used as a first screening tool to evaluate restoration opportunities and to rank preservation sites for conservation futures purchases.
"Relative to preservation, it is the general consensus in the field that the first step in considering mitigation should be assessing if and how impact can be avoided entirely. Only with a convincing demonstration that avoidance is impossible should mitigation be considered. I recommend that these concepts be explicitly built into the steps in Thurston County’s procedure." (Horner 2010)

June 2012 Watershed Characterization Methods
Methodology to a Watershed Based Approach to Page 11 Clean Water and Natural Resource Management
PART I. LANDSCAPE CHARACTERIZATION
The Approach The goal of this methodology is to provide a scientific approach to analyzing the ecological processes and natural resources that maintain a functioning watershed, and to identify how anthropogenic activity has impacted those processes and responses. The first step characterized the effects of anthropogenic land use on physical processes and biological elements within the study area. The five physical processes and two biological elements focused on in this work are listed below.
Physical processes: • Delivery and routing of water
• Delivery and routing of large wood
• Delivery and routing of sediment
• Delivery and routing of nutrients/toxicants/bacteria
• Delivery and routing of heat
Biological elements: • Upland habitat connectivity
Step 1. Establish Spatial Scales of Analysis The alteration of these core processes and elements (or “pathways”) by human activities results in a change in how a site functions. These processes and elements operate over large spatial and temporal scales and have typically not been assessed when evaluating site specific natural resource restoration activities. Watershed characterizations evaluate the potential restoration success in the context of its location on the landscape.
Step 1A. Establish Drainage Analysis Units Drainage analysis units (DAU)s were developed based on the needs of the study. Table 1 provided guidance on the minimize size of the DAU. The particular unit selected was 0.25 square miles, as an average. This unit was based upon guidance published by the Center for Watershed Protection (See Table 1) in determining sizing for activities related to stormwater management. This scale was used because one of the main focuses of this study was to restore hydrologic function using natural resource sites (wetlands, riparian, and floodplains).
Thurston County staffs acknowledge that the Methods can be complex, and not very readable to the non-scientific audience. However, this Methods document is a documentation of how Thurston County staffs completed the watershed characterization work. If you have any questions or concerns regarding the watershed characterization process,, please contact us Our aspiration is to assist other jurisdictions in their endeavors to characterize their jurisdictions to provide scientific data to their decisions makers.
June 2012 Watershed Characterization Methods
Methodology to a Watershed Based Approach to Page 12 Clean Water and Natural Resource Management
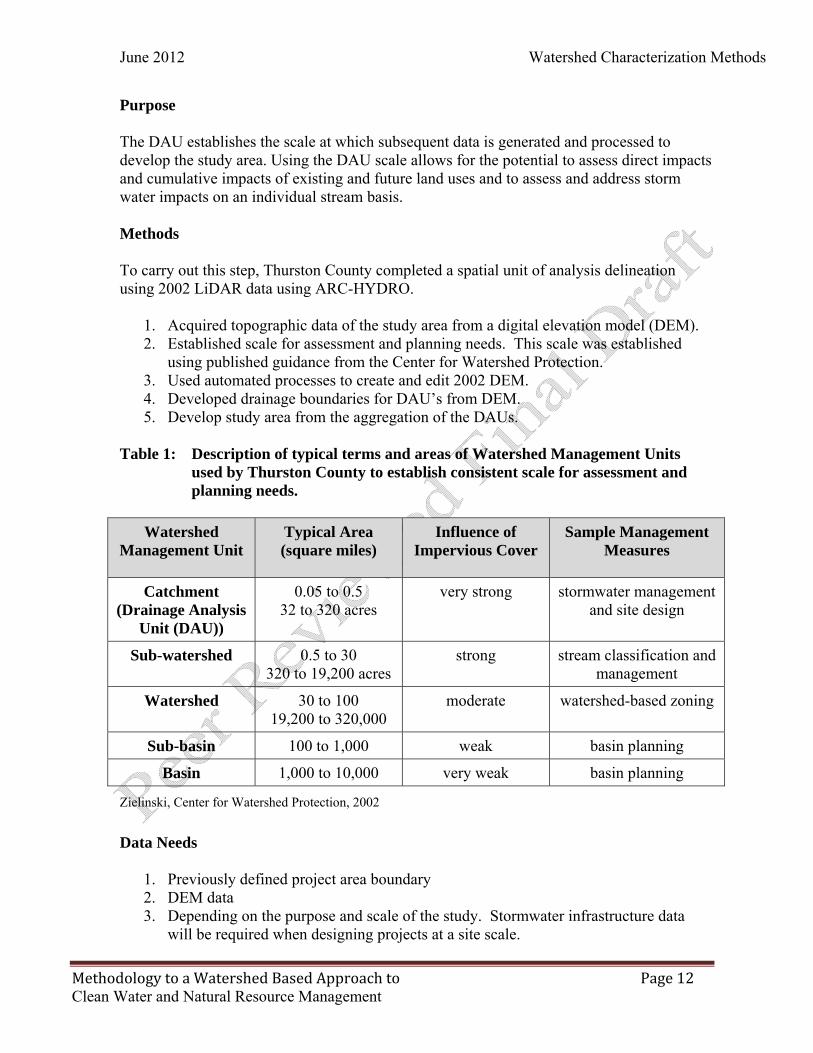
Purpose The DAU establishes the scale at which subsequent data is generated and processed to develop the study area. Using the DAU scale allows for the potential to assess direct impacts and cumulative impacts of existing and future land uses and to assess and address storm water impacts on an individual stream basis. Methods To carry out this step, Thurston County completed a spatial unit of analysis delineation using 2002 LiDAR data using ARC-HYDRO.
1. Acquired topographic data of the study area from a digital elevation model (DEM). 2. Established scale for assessment and planning needs. This scale was established
using published guidance from the Center for Watershed Protection. 3. Used automated processes to create and edit 2002 DEM. 4. Developed drainage boundaries for DAU’s from DEM. 5. Develop study area from the aggregation of the DAUs.
Table 1: Description of typical terms and areas of Watershed Management Units
used by Thurston County to establish consistent scale for assessment and planning needs.
Watershed
Management Unit
Typical Area (square miles)
Influence of Impervious Cover
Sample Management Measures
Catchment (Drainage Analysis
Unit (DAU))
0.05 to 0.5 32 to 320 acres
very strong stormwater management and site design
Sub-watershed 0.5 to 30 320 to 19,200 acres
strong stream classification and management
Watershed 30 to 100 19,200 to 320,000
moderate watershed-based zoning
Sub-basin 100 to 1,000 weak basin planning
Basin 1,000 to 10,000 very weak basin planning
Zielinski, Center for Watershed Protection, 2002
Data Needs
1. Previously defined project area boundary 2. DEM data 3. Depending on the purpose and scale of the study. Stormwater infrastructure data
will be required when designing projects at a site scale.

June 2012 Watershed Characterization Methods
Methodology to a Watershed Based Approach to Page 13 Clean Water and Natural Resource Management
Product Thurston County produced a GIS data layer of DAU, sub-watershed, and watershed boundaries that defined the study areas.
Step 1B. Establish Study Area Definition A study area is normally identified by a wide range of social, political, or regulatory factors. Once known, it needs to be expanded or clipped to align with watershed boundaries. The Totten, Eld, and Deschutes watersheds all drain to South Puget Sound. These watersheds were prioritized based on local, state, and federal protection efforts to reduce any further degradation to Puget Sound. Purpose To obtain or create a spatial layer that specifies the boundaries of the study area, such that the land area draining to any point or waterbody of interest is included within the study area. Methods The study areas for Totten and Eld Inlets and Deschutes were established through a GIS process of displaying the area of interest and refining the final boundary with updated topographic data. Data Needs An existing watershed or sub-watershed boundaries data layer, or a digital elevation model from which boundaries can be delineated. . Product A GIS data layer of the Totten, Eld, and the Deschutes study areas. Step 2. Establish Temporal Scales of Analysis Understanding present and potential future watershed conditions requires multiple periods of assessment. Pre-
Base data for determining DAU geography consisted of a LiDAR derived bare earth digital elevation model (DEM). The bare earth DEM was processed from point cloud data acquired from a leaf-off LiDAR mission in February 2002 under the management of the Puget Sound LiDAR Consortium (PSLC). PSLC has determined that this data is applicable for hydrologic modeling at the horizontal scale of 1:12,000 or smaller, with vertical accuracy on the order of a foot.1 The bare earth DEM product was further processed to remove imperfections by removing and filling sinks through an iterative process. This process utilized Arc Hydro Tools 9, an available extension for ArcGIS 9. The hydrologically corrected DEM yielded the DAU delineations for further automated and manual refinement. This refinement included clipping out DAU’s which were outside the specific project boundary, aggregating smaller units which were well below the 0.25 average sizing threshold, and manually editing anomalous drainage flows not removed from automated post processing procedures.

June 2012 Watershed Characterization Methods
Methodology to a Watershed Based Approach to Page 14 Clean Water and Natural Resource Management
development and current land use conditions are needed to infer past changes and cumulative impacts. Current and future build-out conditions are needed to understand potential future cumulative impacts in a build-out scenario and assess the potential for the watershed to maintain its essential ecosystem processes and functions over time. In the current watershed characterization work completed by Thurston County, future landcover conditions were not assessed because designated zoning and actual build out conditions are not equal.
Step 2A. Create a Pre-Development Data Layer Purpose A pre-development land use data layer is the reference point for assessing the current and future states of natural resources. In turn, an assessment of landscape condition requires an understanding of the extent of change in ecological processes from a pre-development to present and future land use conditions. Methods Thurston County used available General Lands Office GIS data to characterize the pre-development vegetation and natural resources of the study area.
Data Needs Pre-development vegetation and natural resource data for the study area. Product A GIS data layer of pre-development landcover.
Step 2B. Select or Create a Current Landcover Data layer Purpose This project’s landcover classification scheme was devised for the purpose of establishing an ecologically functioning relationship between the built and natural environments, specifically, through the development of indicators relevant in determining the impact to physical and biological indicators in the project area. Current landcover data are used in two ways. First, this data set is used with the pre-development data layer to characterize the extent of change in landcover. Second, this data layer is used to calculate quantitative values of landcover types for use in key landscape indicators, which are used to represent the extent of alteration in the five ecological processes.

June 2012 Watershed Characterization Methods
Methodology to a Watershed Based Approach to Page 15 Clean Water and Natural Resource Management
Total Impervious Area (TIA) and vegetation cover is used in watershed characterization to describe the degree of hydrologic alteration within drainage basins. TIA is defined as the percentage of land within an area that is impervious to water, and includes rooftops, paved surfaces, and compacted earth. TIA is derived from land use or landcover data, and is a key indicator of ecological condition. Methods Thurston County used the most current landcover data sets available from local, state, federal, and tribal sources. Thurston County acquired and processed 2005/2009/2010 SPOT 10 meter imagery for the current efforts. These data are high quality but not perfect; the overall accuracy for this project's area landcover classification is 84%. See also Hulse et al. 2002, A suggested further reference on mapping error and generalization, particularity in relation to land use policy and decision making. No field verification of landcover data was performed. Actual condition of the landscape would need to be evaluated when a specific land-use project is proposed. Data Needs Available satellite landcover classification data. Product Land cover classification yielded 15 classes for land cover analysis and indicator development purposes. The 15 classes were type verified by aerial photography, acquired in 2005, the same month as the satellite imagery and limited field visits. A classification accuracy assessment yielded combined class results as 84% accurate.
Step 2C. Select or Create a Future Landcover Data layer The reference to future land-use values has been discontinued in the methods. It is a goal to determine direct measurement of impervious values in Thurston County using the 2005, 2009, 2010, 10-m spot satellite data. This time frame includes rapid conversion of the vegetated landscape to the built-environment. It was determined during the Henderson work that any future land-use scenarios, based on current Thurston County zoning, would not provide any useful information. This is based on the fact that the majority of unincorporated Thurston County is zoned 1:5, and there are many non-conforming lots that were platted decades ago. However, Thurston Regional Planning Council has population forecast data that could be utilized to predict future build-out scenarios in the future.
NOTE: Effective impervious area (EIA) is a better indicator of hydrologic alteration, because it characterizes the impervious area directly connected to surface waters. However, either broad approximations or a very thorough stormwater infrastructure survey must be completed to determine EIA.
June 2012 Watershed Characterization Methods
Methodology to a Watershed Based Approach to Page 16 Clean Water and Natural Resource Management
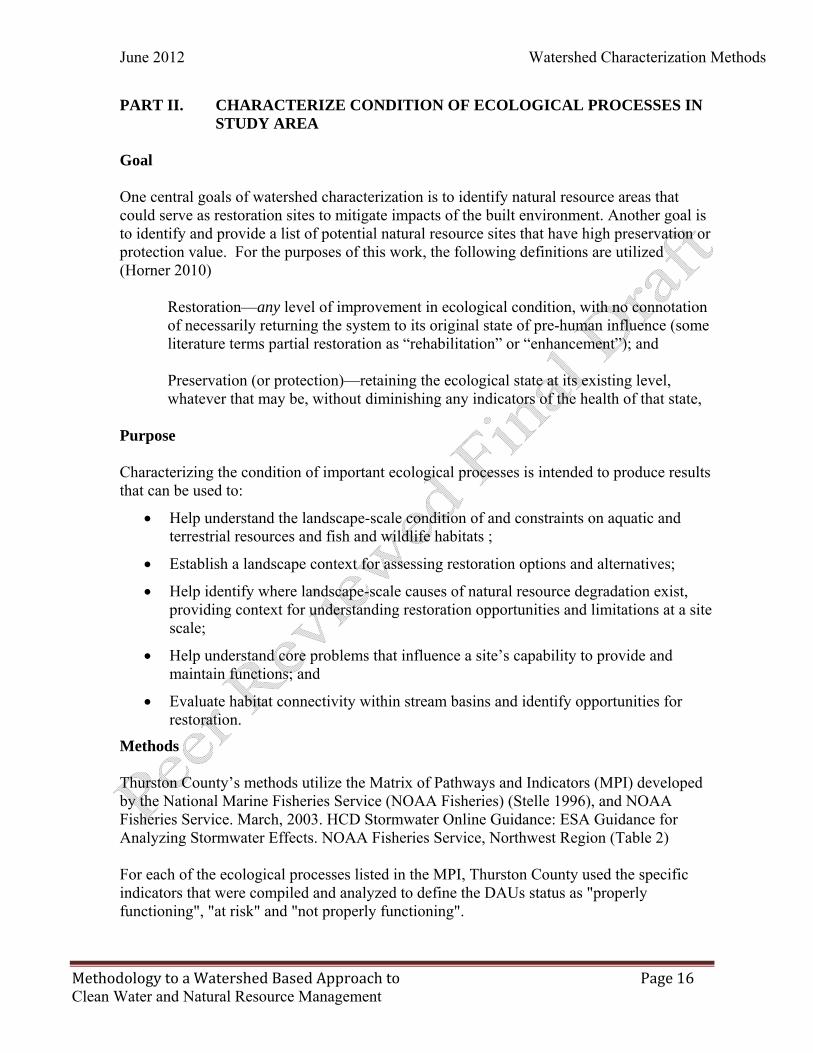
PART II. CHARACTERIZE CONDITION OF ECOLOGICAL PROCESSES IN STUDY AREA
Goal One central goals of watershed characterization is to identify natural resource areas that could serve as restoration sites to mitigate impacts of the built environment. Another goal is to identify and provide a list of potential natural resource sites that have high preservation or protection value. For the purposes of this work, the following definitions are utilized (Horner 2010)
Restoration—any level of improvement in ecological condition, with no connotation of necessarily returning the system to its original state of pre-human influence (some literature terms partial restoration as “rehabilitation” or “enhancement”); and Preservation (or protection)—retaining the ecological state at its existing level, whatever that may be, without diminishing any indicators of the health of that state,
Purpose Characterizing the condition of important ecological processes is intended to produce results that can be used to:
• Help understand the landscape-scale condition of and constraints on aquatic and terrestrial resources and fish and wildlife habitats ;
• Establish a landscape context for assessing restoration options and alternatives;
• Help identify where landscape-scale causes of natural resource degradation exist, providing context for understanding restoration opportunities and limitations at a site scale;
• Help understand core problems that influence a site’s capability to provide and maintain functions; and
• Evaluate habitat connectivity within stream basins and identify opportunities for restoration.
Methods Thurston County’s methods utilize the Matrix of Pathways and Indicators (MPI) developed by the National Marine Fisheries Service (NOAA Fisheries) (Stelle 1996), and NOAA Fisheries Service. March, 2003. HCD Stormwater Online Guidance: ESA Guidance for Analyzing Stormwater Effects. NOAA Fisheries Service, Northwest Region (Table 2) For each of the ecological processes listed in the MPI, Thurston County used the specific indicators that were compiled and analyzed to define the DAUs status as "properly functioning", "at risk" and "not properly functioning".
June 2012 Watershed Characterization Methods
Methodology to a Watershed Based Approach to Page 17 Clean Water and Natural Resource Management
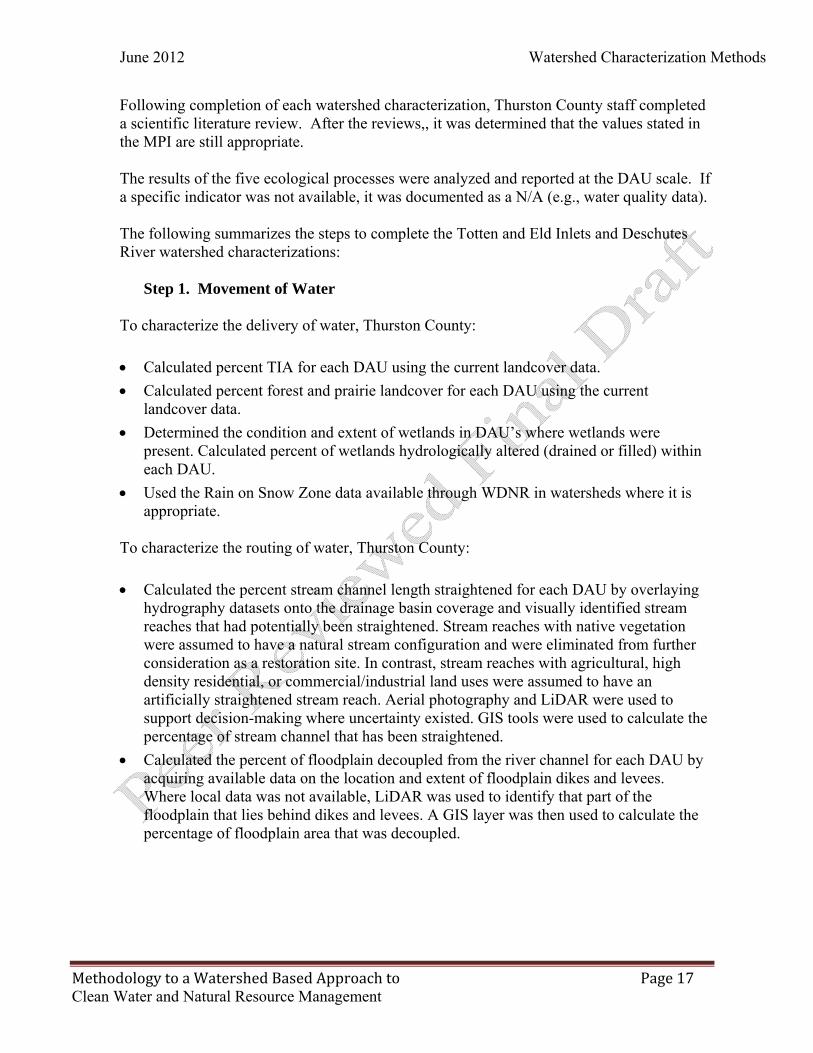
Following completion of each watershed characterization, Thurston County staff completed a scientific literature review. After the reviews,, it was determined that the values stated in the MPI are still appropriate. The results of the five ecological processes were analyzed and reported at the DAU scale. If a specific indicator was not available, it was documented as a N/A (e.g., water quality data). The following summarizes the steps to complete the Totten and Eld Inlets and Deschutes River watershed characterizations:
Step 1. Movement of Water To characterize the delivery of water, Thurston County: • Calculated percent TIA for each DAU using the current landcover data. • Calculated percent forest and prairie landcover for each DAU using the current
landcover data. • Determined the condition and extent of wetlands in DAU’s where wetlands were
present. Calculated percent of wetlands hydrologically altered (drained or filled) within each DAU.
• Used the Rain on Snow Zone data available through WDNR in watersheds where it is appropriate.
To characterize the routing of water, Thurston County: • Calculated the percent stream channel length straightened for each DAU by overlaying
hydrography datasets onto the drainage basin coverage and visually identified stream reaches that had potentially been straightened. Stream reaches with native vegetation were assumed to have a natural stream configuration and were eliminated from further consideration as a restoration site. In contrast, stream reaches with agricultural, high density residential, or commercial/industrial land uses were assumed to have an artificially straightened stream reach. Aerial photography and LiDAR were used to support decision-making where uncertainty existed. GIS tools were used to calculate the percentage of stream channel that has been straightened.
• Calculated the percent of floodplain decoupled from the river channel for each DAU by acquiring available data on the location and extent of floodplain dikes and levees. Where local data was not available, LiDAR was used to identify that part of the floodplain that lies behind dikes and levees. A GIS layer was then used to calculate the percentage of floodplain area that was decoupled.

June 2012 Watershed Characterization Methods
Methodology to a Watershed Based Approach to Page 18 Clean Water and Natural Resource Management
Step 2. Movement of Wood
Delivery of Large Wood To characterize the delivery of large wood, Thurston County: • Determined the percent of 67 meter riparian zone in mature forest for each drainage
basin, using a fixed-width buffer zone around each mapped stream intersected with the GIS landcover layer.
• Calculated the percent stream channel length straightened for each DAU by overlaying hydrography datasets onto the drainage basin coverage and visually identified stream reaches that had potentially been straightened. Stream reaches with native vegetation were assumed to have a natural stream configuration and were eliminated from further consideration as a restoration site. In contrast, stream reaches with agricultural, high density residential, or commercial/industrial land uses were assumed to have an artificially straightened stream reach. Aerial photography was used to support decision-making where uncertainty existed. GIS tools were used to calculate the percentage of stream channel that has been straightened.
• Calculated the percent of floodplain decoupled from the river channel for each DAU by acquiring available data on the location and extent of floodplain dikes and levees. Where local data was not available, LiDAR was used to identify that part of the floodplain that lies behind dikes and levees. A GIS layer was then used to calculate the percentage of floodplain area that was decoupled.
Routing of Large Wood To characterize the routing of large wood, Thurston County: • Determined the average number of stream crossings per kilometer of stream for each
DAU by intersecting the roads and stream layer. If field data or engineering designs were independently available, the average stream bed width and size of crossing, including the number of piers in the active channel, were determined by non-GIS means.
Thurston County currently maintains a bridge/culvert inventory with structure crossing width data; however, it does not contain stream width data to utilize this indicator. Thus, it will require field verification to determine the ordinary high water mark for each crossing, and thus was not completed as part of this work. However, for any future site specific natural resource restoration actions, that data should be collected and used in the analysis of potential restoration of resource sites.

June 2012 Watershed Characterization Methods
Methodology to a Watershed Based Approach to Page 19 Clean Water and Natural Resource Management
Step 3. Movement of Sediment NOTE: The delivery and routing of sediment analysis is only appropriate for long-term forestry areas, and is not appropriate to use in the urban areas. Delivery of Sediment NOTE: The delivery and routing of sediment analysis is only appropriate for long-term forestry areas. It is not appropriate to use in the urban areas. To characterize the delivery of sediment, Thurston County: • Using the most current land cover information, calculated the percentage of bare soil
areas within each DAU. • Calculated the percent of unstable slopes in each DAU, using the existing state DNR
data layers. Routing of Sediment To characterize the routing of sediment, Thurston County: • Used GIS tools to calculate road density (road miles per square mile) for each DAU. • Calculated the percent stream channel length straightened for each DAU by overlaying
hydrography datasets onto the drainage basin coverage and visually identified stream reaches that had potentially been straightened. Stream reaches with native vegetation were assumed to have a natural stream configuration and were eliminated from further consideration as a restoration site. In contrast, stream reaches with agricultural, high density residential, or commercial/industrial land uses were assumed to have an artificially straightened stream reach. Aerial photography was used to support decision-making where uncertainty existed. GIS tools were used to calculate the percentage of stream channel that has been straightened.
• Calculated the percent of floodplain decoupled from the river channel for each DAU by acquiring available data on the location and extent of floodplain dikes and levees. Where local data was not available, LiDAR was used to identify that part of the floodplain that lies behind dikes and levees. A GIS layer was then used to calculate the percentage of floodplain area that was decoupled.
• Movement of Nutrients and Toxicants
Step 4. Movement of Pollutants Delivery and Routing of Nutrients and Toxicants • Although in principle the number of Clean Water Act (CWA) 303(d) listed water bodies
for each drainage basin should be a useful indicator of the water quality, the limited number of ambient monitoring sites in Thurston County can only indicate what DAUs are “not properly functioning.” Many streams do not have ambient monitoring data and

June 2012 Watershed Characterization Methods
Methodology to a Watershed Based Approach to Page 20 Clean Water and Natural Resource Management
thus it can’t be assumed that streams without data are “properly functioning.” In the Totten and Eld Inlets and the Deschutes study areas, the utility of the CWA 303(d) list was greatly limited by data availability. The data was utilized when there was an ambient monitoring site in the DAU. If there was no data in a DAU, then the indicator was noted to be N/A.
• Determined the percent of 67 meter riparian zone in mature
forest for each drainage basin, using a fixed-width buffer zone around each mapped stream intersected with the GIS landcover layer.
Step 5. Movement of Heat
Delivery and Routing of Heat • To characterize the delivery and routing of heat, Thurston
County used the 303(d) listed water bodies and percent of 67 meter riparian zone in mature canopy, in addition to TIA and road crossings to indicate conditions relative to stream-water temperature. Percent TIA and road crossings inferences were presented in the Totten and Eld Inlets and Deschutes watershed results, but the relevance of all but the buffer-zone metric (and 303d listings, where available) is uncertain (Booth, 2010). Therefore, percent TIA and road crossings have been deleted from the MPI, and will not be used in future watershed characterizations because of the lack of data that supports their inclusion in the MPI.
• Determined the percent of 67 meter riparian zone in mature
forest for each drainage basin, using a fixed-width buffer zone around each mapped stream intersected with the GIS landcover layer.
Additional indicators include the following biological elements: Aquatic Integrity To characterize Aquatic Integrity, Thurston County plotted and classified all available Benthic- Index of Biological Integrity (B-IBI) scores, % riparian, and %TIA within the study area. The corresponding scores were applied to the downstream only in the corresponding DAU, and not for the entire stream. Where direct measurements of biological elements are unavailable, conditions can be inferred using other metrics. Criteria using the previously calculated condition results of
Aquatic Integrity: Snyder et al. (2003) synthesized results of existing studies relating to the influence of upland and riparian land use patterns on stream biotic integrity. This paper notes that in studies where scale influences were tested, whole catchment land use patterns were found to be better predictors of stream biological integrity in some studies, while others suggest riparian land use patterns were more influential. Morley and Karr (2002) presented similar results specifically for the Puget Lowland. This information supports the use of both percent riparian area in forest landcover and percent total impervious area as landscape indicators of aquatic integrity, where direct biological data are unavailable.

June 2012 Watershed Characterization Methods
Methodology to a Watershed Based Approach to Page 21 Clean Water and Natural Resource Management
percent riparian area in forest landcover and %TIA by DAU are shown in Table 2 as such example. Although percent riparian cover and percent total impervious area were not used as surrogates for this element in the prior studies, abundant research suggests it is likely very useful where no direct data are available and can be used in future watershed characterization work. However, future use of B-IBI data will include using the B-IBI scores to validate the condition of the DAU where there is data.
Step 6. Habitat Connectivity To characterize habitat connectivity, Thurston County: Used the software program FRAGSTATS; FRAGSTATS is a spatial pattern analysis program for quantifying landscape structure. The landscape subject to analysis is user defined and can represent any spatial phenomenon. FRAGSTATS quantifies the areal extent and spatial distribution of patches (that is, polygons on a map coverage) within a landscape; the user must establish a sound basis for defining and scaling the landscape (including the extent and grain of the landscape) and the scheme by which patches within the landscape are classified and delineated (we strongly recommend reading the preceding section, “Concepts and Definitions”). The output from FRAGSTATS is meaningful only if the landscape mosaic is meaningful for the phenomenon under consideration. Matrix of pathways and Indicators The Matrix of pathways and Indicators (MPI) was developed by NOAA Fisheries in 1996 (Stelle 1996) in response to the ESA listing of Chinook salmon. Initially, many of the indicators were qualitative only, and actual values were added as data and best professional judgment allowed. It should be noted that best available science supports many of the values, while other best available science does not. Because these values are used in a GIS analysis, and landcover classification accuracy is approximately 80%, the values used are appropriate for the scale of analysis. Indicators in bold were used for Totten, Eld, and Deschutes watershed characterizations.

June 2012 Watershed Characterization Methods
Methodology to a Watershed Based Approach to Page 22 Clean Water and Natural Resource Management
Table 2. Matrix of Landscape-scale Pathways and Indicators (Stelle 1996)
Ecological Process Landscape Indicator Effect Properly Functioning At Risk Not Properly Functioning
1) Percent change in Drainage Network i
Reduces Delivery Time; Habitat Degradation
Zero or minimal increases (<5%) in drainage network density due to development Moderate increases (5% to 20%) in drainage network density due to development Substantial increase (>20%) in drainage network density due to development
Delivery of Water Through a Stream System
2) Percent TIA ii Reduces Delivery Time; Increases Amount of Water Delivered; Habitat Degradation
10% or less TIA >10% and <25% total imperious area
≥25% TIA
3) Percent Forest Landcover and/or prairie coveriii
Reduces Delivery Time; Increases Amount of Water Delivered; Habitat Degradation
>65% of area in hydrologically mature forested landcover or native prairie
50% to 65% of area in hydrologically mature forested landcover or native prairie
<50% in hydrologically mature forested landcover or native prairie
4) Condition and Extent of Wetland Resources iv
Loss of assimilative capacity
>95% of all historic connecting wetland capacity present and unaltered
70-95% of historic connecting wetland capacity present and unaltered
<70% of historic connecting wetland capacity present and unaltered
5) Rain on Snow
Routing of Water Through a Stream System
6) Percent of Stream Channel Length Straightened
Reduced Routing Time; Habitat Degradation
Zero or minimal increases (<5%) of natural drainage network straightened
Moderate increases (5% to 20%) in natural drainage network straightening
Substantial increase (>20%) in drainage network straightening
7) Percent of Flood-plain Decoupled from Stream v
Reduced Routing Time; Habitat Degradation
Zero or minimal increases (<5%) in decoupled flood-plain
Moderate increases (5% to 40%) in decoupled flood-plain
Substantial increase (>40%) in decoupled flood-plain
Delivery of Large Wood to a Stream System
8) Percent of 67 meter Riparian Zone in Mature Condition vi
Source of Large Wood to the Stream System; Habitat Degradation
85% of overall riparian zone in forest or wetland cover
50-85% of overall riparian zone in forest or wetland cover
<50% of overall riparian zone in forest or wetland cover
9) Percent of Stream Channel Length Straightened
Reduced Routing Time; Habitat Degradation
Zero or minimal increases (<5%) of natural drainage network straightened
Moderate increases (5% to 20%) in natural drainage network straightening
Substantial increase (>20%) in drainage network straightening
10) Percent of Flood-plain Decoupled from Stream vii
Reduced Routing Time; Reduced Access to Habitat
Zero or minimal increases (<5%) in decoupled flood-plain
Moderate increases (5% to 40%) in decoupled flood-plain
Substantial increase (>40%) in decoupled flood-plain
Routing of Large Wood Through a Stream System
15) Stream Crossings/Kilometer viii
Blocks Routing of Large Wood and Facilitates Removal from System; Habitat Degradation
< 2 –stream crossings per kilometer of stream and ratio of culvert width to channel width is >1
2 to 4 stream crossings per kilometer of stream and ratio of culvert width to channel width is 0.5 to 1
> 4 stream crossings per kilometer of stream and ratio of culvert width to channel width is <0.5
Delivery of Sediment to a Stream System
11) Percent of Bare Soil Areas in agricultural and forest Areas
Increased Fine Sediment Inputs; Habitat Degradation
<5% of area in land uses having bare soils
5-15% of area in land uses having bare soils
>15% of area in land uses having bare soils
12) Road Density ix Increased Fine and Road densities < 1.0 Road densities of 1.0 to Road densities > 1.6

June 2012 Watershed Characterization Methods
Methodology to a Watershed Based Approach to Page 23 Clean Water and Natural Resource Management
Ecological Process Landscape Indicator Effect Properly Functioning At Risk Not Properly Functioning
Coarse Sediment Inputs; Habitat Degradation
miles/square mile 1.6- miles/square mile miles/square mile
13) Unstable Slopes
Increased Inputs of Fine and Course Sediment
≥5% of DAU in > 30 percent slope and <10 percent of high slope area in non-forest landcover
≥5% of DAU in > 30 percent slope and ≥10%< 25% of high slope area in non-forest landcover
≥5% of DAU in > 30 percent slope and ≥25% of high slope area in non-forest landcover
Routing of Sediment Through a Stream System
14) Percent of Stream Channel Length Straightened
Reduced Routing Time; Habitat Degradation
Zero or minimal increases (<5%) of natural drainage network straightened
Moderate increases (5% to 20%) in natural drainage network straightening
Substantial increase (>20%) in drainage network straightening
15) Percent of Flood-plain Decoupled from Stream x
Reduced Routing Time; Reduced Access to Habitat
Zero or minimal increases (<5%) in decoupled flood-plain
Moderate increases (5% to 40%) in decoupled flood-plain
Substantial increase (>40%) in decoupled flood-plain
Delivery and Routing of Nutrients, Toxicant, and Bacteria to a Stream System
16) Extent of 303(d) Listed Water Bodies for Nutrients, Toxicants, and Bacteria xi
Documented Water Quality Problem
Water quality in the stream meets water quality standards for all parameters. No excess nutrients or toxicity.
Water quality in the stream has one parameter that exceeds water quality criteria by 10 percent or greater
More than one parameter exceeds water quality criteria by 10 percent or greater.
17) Condition and Extent of Wetlands xii
Loss of assimilative capacity
Historic wetland area >5% and <25% of wetlands have been drained or hydrologically altered
Historic wetland area 25% to 40% of wetlands have been drained or hydrologically altered
Historic wetland area >40% of wetlands have been drained or hydrologically altered
18) Percent of 67 meter Riparian Zone with Mature Canopy xiii
Increase in Solar Energy to Stream; Habitat Degradation
85 percent or more of channel with riparian canopy intact and no large continuous stretches of open canopy
50 to 85 percent of riparian canopy intact but having some continuous stretches of open canopy
Riparian canopy fragmented, > 50 percent and contains large continuous stretches with no canopy
Delivery and Routing of Heat to a Stream System
19) Extent of 303(d) Listed Water Bodies for Temperature xiv
Identifies Problem Areas but Does Not Address Causes; Habitat Degradation
Area meets water quality standards for temperature
One parameter that exceeds temperature criteria 10 percent or more of the time
More than one parameter exceed temperature criteria 10 percent or more of the time
20) Percent of 67 meter Riparian Zone with Mature Canopy xv
Increase in Solar Energy to Stream; Habitat Degradation
85 percent or more of channel with riparian canopy intact and no large continuous stretches of open canopy
50 to 85 percent of riparian canopy intact but having some continuous stretches of open canopy
Riparian canopy fragmented, > 50 percent and contains large continuous stretches with no canopy
Biological Elements
Upland Habitat Connectivity
21) Level of Habitat Connectivity
Risk of Habitat Isolation
Use methods described elsewhere using Fragstats
Use methods described elsewhere using Fragstats
Use methods described elsewhere using Fragstats
Watershed Condition Index (See below)
22) Coho:Cutthroat Ratio

June 2012 Watershed Characterization Methods
Methodology to a Watershed Based Approach to Page 24 Clean Water and Natural Resource Management

June 2012 Watershed Characterization Methods
Methodology to a Watershed Based Approach to Page 25 Clean Water and Natural Resource Management
Staff met with Jamie Glasgow on the possibility of capturing coho:cutthroat data to begin to develop a simpler matrix; Jamie had the following comments;
Jamie Glasgow, Wild Fish Conservancy, states:
“My concerns with relying solely on the coho:cutthroat ratio as an indicator for WCI are outlined below. Considered with other metrics and a healthy dose of common sense, the ratio can be useful - but lacking those two things it can be misleading.
Due to the complex nature of their life cycle, coho abundance in watersheds is only partially controlled by the integrity of the watersheds they use. You can have a watershed that is pristine, but has only a fraction of the coho abundance it did historically due to harvest, hatchery interactions, ocean conditions, etc. This may be especially true in south Puget Sound, where stray hatchery coho make up a significant portion of the coho we see spawning in area streams.
Coho abundance is disproportionately affected by instream barriers. Again, you can have an intact watershed with one barrier to anadromy near its mouth that results in an extremely low coho:cutthroat ratio.
Coho abundance in watersheds can be artificially elevated by hatchery outplants and/or adult hatchery strays - their presence speaks little to the integrity of neither the watershed nor its ability to successfully incubate and rear coho."
Tables 3 through 8 contain the rules and assumptions developed to complete the ranking of the five ecological processes and habitat connectivity. These assumptions are based on the goal of identifying sites that have the potential mitigate past and future impacts from development. Table 3. Rules and Assumptions Used to Establish the Overall Condition Rank for
Movement of Water
Indicator Priority Landscape Indicator Condition Final
Rank
Primary %TIA
When % TIA is PF and % forest/prairie cover are PF, % stream channel length straightened is PF or AR, and wetlands or floodplains are not indicators, the final rank is PF PF
Secondary % Forest cover/Prairie cover
When % TIA is PF and % forest/prairie cover are AR or NPF, % stream channel length straightened is PF or AR, and wetlands or floodplains are not indicators, the final rank is AR AR
Secondary % Stream channel length straightened
When % TIA is AR and % forest/prairie cover is PF, % stream channel length straightened is AR or NPF, and wetlands and floodplains are not indicators, the final rank is AR AR

June 2012 Watershed Characterization Methods
Methodology to a Watershed Based Approach to Page 26 Clean Water and Natural Resource Management
Indicator Priority Landscape Indicator Condition Final
Rank
Tertiary
Condition/extent of wetlands. Assimilative capacity
When % TIA is NPF and % forest/prairie cover is AR or NPF, % stream channel length straightened is AR or NPF, and wetlands or floodplains are not indicators, the final rank is NPF NPF
Tertiary
% Floodplain decoupled from the channel
When % TIA is PF, % forest/prairie cover is PF, % stream channel length straightened is PF or AR, and wetlands and floodplains are PF, the final rank is PF PF
When % TIA is PF, % forest/prairie cover is PF, and wetlands or floodplains are AR or NPF, the final rank is AR AR When % TIA is AR, % forest/prairie cover is AR or NPF, wetlands and floodplains are AR or NPF, the final rank is AR AR When % TIA is NPF, % forest/prairie cover is AR or NPF, wetlands or floodplains are AR or NPF, the final rank is NPF NPF
When % TIA is PF, % forest/prairie cover is AR or NPF, and wetlands or floodplains are AR or NPF, the final rank is AR AR
When % TIA is AR, % forest/prairie cover is NPF, wetlands or floodplain are AR or NPF, the final rank is NPF NPF
When % TIA is AR, % forest/prairie cover is AR or NPF, wetlands or floodplains are PF, the final rank is AR AR When % TIA is AR and % forest/prairie cover is AR, and wetlands or floodplains are not indicators, the final rank is AR AR

June 2012 Watershed Characterization Methods
Methodology to a Watershed Based Approach to Page 27 Clean Water and Natural Resource Management
Table 4. Rules and Assumptions Used to Establish the Overall Condition Rank for
Movement of Wood
Indicator Priority Landscape Indicator Condition Final
Rank
Primary
% of 67 m riparian zone in mature condition
When % riparian is PF, % stream channel straightened and stream crossings are PF, the final rank is PF PF
Secondary Stream crossings/kilometer
When % riparian is PF, % stream channel straightened and stream crossings are AR, and % floodplain decoupled is AR or NPF, the final rank is AR AR
Secondary % stream channel straightened
When % riparian is AR, % stream channel straightened, stream crossings and % floodplain decoupled is PF or AR, the final rank is AR AR
Tertiary % floodplain decoupled
When % riparian is AR, % stream channel straightened, and stream crossings are AR or NPF and % floodplain decoupled is AR or NPF, the final rank is NPF NPF When % riparian is NPF, % stream channel straightened is AR, and stream crossings are AR or NPF, the final rank is NPF NPF When % riparian is PF, % stream channel straightened and stream crossings are PF or AR, and % floodplain decoupled is not an indicator, the final rank is PF PF When % riparian is AR, % stream channel straightened and stream crossings are PF or AR, and % floodplain decoupled is AR the final rank is AR AR No indicators in the DAU, the final rank is N/A N/A

June 2012 Watershed Characterization Methods
Methodology to a Watershed Based Approach to Page 28 Clean Water and Natural Resource Management
Table 5. Rules and Assumptions Used to Establish the Overall Condition Rank for
Movement of Sediment Indicator Priority
Landscape Indicator Condition Final
Rank
Primary % Bare soil
When bare soils and road density are PF and geologic hazard areas are either PF or not present, the final rank is PF PF
Secondary Road density
When bare soils and geologic hazard areas are NPF or AR and road density is AR the final rank is NPF NPF
Tertiary % stream channel straightened
Where there are no bare soils or geologic hazard areas in the DAU; Where % stream channel straightened and % decoupled floodplain are PF and road density is AR or PF, the final rank is PF PF
Tertiary % decoupled floodplain
Where there are no bare soils or geologic hazard areas in the DAU; Where % stream channel straightened and % decoupled floodplain are AR and road density is NPF or AR the final rank is AR AR
Where there are no bare soils or geologic hazard areas in the DAU; Where % stream channel straightened and % decoupled floodplain are NPF or AR and road density is NPF or AR the final rank is NPF NPF

June 2012 Watershed Characterization Methods
Methodology to a Watershed Based Approach to Page 29 Clean Water and Natural Resource Management
Table 6. Rules and Assumptions Used to Establish the Overall Condition Rank for
Movement of Pollutants, Nutrients, and Bacteria Indicator Priority
Landscape Indicator Condition Final
Rank
Primary
CWA 303(d) list for toxicants (sub-lethal and lethal to fish); for nutrients, and/or for bacteria
If the stream reach within a DAU has water quality data and is listed, then the final rank will be NPF because of the legal requirement to meet WQ standards. NPF
Secondary
Percent of 67 m riparian zone in mature condition
If the stream reach within a DAU has water quality data and is listed, and the % of 67 m riparian zone in mature condition is NPF or AR then the final rank is NPF NPF If the stream reach within a DAU has water quality data and is listed, and the % of 67 m riparian zone in mature condition is PF or AR then the final rank is AR AR If the stream reach within a DAU has no water quality data and is not listed, and the % of 67 m riparian zone in mature condition is PF then the final rank is PF. PF If the DAU does not include a surface water body, the rank is N/A N/A

June 2012 Watershed Characterization Methods
Methodology to a Watershed Based Approach to Page 30 Clean Water and Natural Resource Management
Table 7. Rules and Assumptions Used to Establish the Overall Condition Rank for
Movement of Heat Indicator Priority
Landscape Indicator Condition Final
Rank
Primary CWA 303(d) list for temperature
If the stream reach within a DAU has water quality data and is listed, then the final rank will be NPF because of the legal requirement to meet WQ standards. NPF
Primary % 67 meter riparian mature canopy
When there is no water quality data for the reach within a DAU data available and % riparian is PF, then the final rank is PF PF
Secondary
% Forest Landcover and/or Prairie cover
When % riparian is PF and % Forest landcover and/or Prairie cover is AR, the final rank is PF PF
When % riparian is AR, and % Forest landcover and/or Prairie cover is PF or AR, the final rank is AR AR
When % riparian is AR, and % Forest landcover and/or Prairie cover is AR or NPF the final rank is NPF NPF
When % riparian is NPF, and % Forest landcover and/or Prairie cover is PF or AR the final rank is AR AR
When % riparian is NPF, and % Forest landcover and/or Prairie cover is AR or NPF the final rank is NPF NPF
When % riparian is NPF, and % Forest landcover and/or Prairie cover is NPF, the final rank is NPF NPF
No Riparian Zone N/A

June 2012 Watershed Characterization Methods
Methodology to a Watershed Based Approach to Page 31 Clean Water and Natural Resource Management
Table 8. Rules and Assumptions Used to Establish the Overall Condition Rank for Habitat Connectivity
Indicator Priority
Landscape Indicator Condition Final
Rank
Primary FRAGSTATS Metrics
When metrics, % riparian and road crossings are PF, the final rank is PF PF
Secondary % 67 meter riparian forest cover
When metrics are PF, and % riparian is PF, and road crossings are AR, the final rank is PF PF
Tertiary Road crossings When metrics are PF, with no riparian zone, and road crossings are PF, the final rank is PF PF
When metrics are PF, and % riparian is AR, and road crossings are PF or AR, the final rank is AR AR
When metrics are PF, and % riparian is NPF, and road crossings are PF or AR, the final rank is AR AR
When metrics, % riparian and road crossings are AR, the final rank is AR AR
When metrics are AR, with no riparian zone, and road crossings are PF or AR, the final rank is AR AR
When metrics are AR, and both riparian zone and road crossings are PF, the final rank is AR AR
When metrics are AR, and riparian zone is AR, and road crossings are PF or AR, the final rank is AR AR
When metrics are AR, and % riparian is NPF, and road crossings are PF, the final rank is AR AR
When metrics are AR, and % riparian is NPF, and road crossings are AR or NPF, the final rank is NPF NPF
When metrics, % riparian and road crossings are NPF, the final rank is NPF NPF
When metrics are NPF, and riparian zone is AR or NPF, and road crossings are PF, AR or NPF, the final rank is NPF NPF
When metrics are NPF, with no riparian zone, and road crossings arePF, AR or NPF, the final rank is NPF NPF

June 2012 Watershed Characterization Methods
Methodology to a Watershed Based Approach to Page 32 Clean Water and Natural Resource Management
PART III. CHARACTERIZE NATURAL RESOURCES IN STUDY AREA Overall Purpose This section describes the evaluations of natural resource sites within the study area. The purpose is to determine natural resource sites that can be preserved or restored in the surrounding landscape to attain the greatest ecological benefit. This analysis is conducted concurrently with the analyses of the ecological processes. The sites identified are ranked in the context of the DAU and the study area landscape. Generalized Methods In evaluating the natural resources, Thurston County evaluated wetlands, riparian corridors, and floodplains. All sites must be field verified and undergo further analysis, depending on the intended purpose (e.g., restoration or preservation, etc). The following generalized attributes were used in the assessment of wetlands, riparian, and floodplain resource sites, using the most recent aerial photography at the time of the study and expert judgment: • Res_Pot – This attribute is the photo interpreter’s opinion of the natural resource site’s
restoration potential to provide an environmental lift in the DAU. This attribute was used to distinguish between sites that have potential to be used as a restoration site and those that have minimal restoration site potential.
0 – no/minimal potential for restoration; this can include both high quality site and degraded or destroyed sites with substantial development that precludes reasonable options to restore the wetland
1 – site has some level of restoration potential based on signatures from aerial photos indicating some level of hydrologic and/or vegetative alteration
2 – the site has sufficient restoration potential to serve as a viable restoration option
• Mit_Pot – This attribute is the photo interpreter’s opinion of a site’s potential to be used in a mitigation or restoration project. Considerations used to determine restoration potential included the size of the site, the extent of hydrologic and vegetative alteration, indications of many separate landowners, and major infrastructure development, such as high power transmission lines or major water conveyances.
0 – no/minimal potential for mitigation; this can include both high quality sites and degraded or destroyed sites with substantial development that precludes reasonable options to restore the resource.
1 – site may have limited potential as a mitigation or restoration site due to one or more site conditions observed during photo interpretation
2 – site has good potential for serving as a mitigation or restoration site

June 2012 Watershed Characterization Methods
Methodology to a Watershed Based Approach to Page 33 Clean Water and Natural Resource Management
• SLU - This attribute represents the photo interpreter’s evaluation of the general type of land use that surrounds the potential site. Land use codes that were useful at this stage in the analysis are presented in Table 9.
Table 9. Land use types recorded during wetland photo interpretation.
Land Use Code Land Use Type
RES Residential
OPEN Park/Open Space
FOR Forest
COM Commercial/Business
IND Industrial
AGR Agriculture
• Adjpublic – This attribute identifies sites located on or adjacent to public lands.
Publicly owned lands included all parcels that had permanent protections or easements. These included, but are not limited to: land trust properties, parks, reserves, schools, and green belts. Public properties were identified by a query of ownership parcels that pay no real estate tax.
0 – the potential site is not on or adjacent to publicly-owned land
1 – the potential site is on or adjacent to publicly-owned land
• LocalPrior – This attribute identifies potential restoration sites that are identified as local priority restoration projects by the Tribes, Salmon Recovery Lead Entities, Conservation Districts, and other non-profit organizations. Thurston County’s methods include the local priority when ranking restoration and preservation sites.
0 – the potential site is not included in a local watershed plan OR has not been prioritized in some manner for restoration 1 – the potential site is on a local watershed plan or a prioritized restoration list

June 2012 Watershed Characterization Methods
Methodology to a Watershed Based Approach to Page 34 Clean Water and Natural Resource Management
Step 1. Determine Location, Extent, and Condition of Wetland Resources. Purpose Identifying the location, extent, and condition of wetlands provides valuable insight into a landscape’s capacity to store surface water, sediment, nutrients, toxics, and bacteria. This information is used to help characterize the condition of ecological processes within drainage basins in the study area. The location and extent of existing, degraded, and destroyed wetlands serve as the pool of preservation sites and potential restoration or enhancement for past impacts to wetlands.
Methods In evaluating the wetlands, Thurston County:
1. Identified and compiled available wetland datasets showing the location, extent, and condition of historic and existing wetlands within the study area.
2. Obtained additional datasets that provide supporting natural resource information within the study area.
3. Created a single polygon layer named Existing Wetlands, using all available datasets. On Totten and Eld Inlets and Deschutes, we found Thurston County's data which includes updates with Thurston Regional Planning Council to be most useful. This updated Existing Wetlands layer was the starting point for a new wetlands restoration data set.
4. Created a Hydric Soils polygon layer from the National Resource and Conservation Service (NRCS) web-based data. Three types of soils polygons were included: hydric soils with no upland soil inclusions, hydric soils with upland soil inclusions, and non-hydric soils with hydric inclusions. The soil survey descriptions show which soil–slope combinations can be considered hydric.
5. Used Elevation, Slope, Low-Slope and Hillshade layers in determining the potential wetlands in Step 6. We have found that a hillshade layer with darker-to-lighter shading between 0 and 5% is particularly useful.
NOTE: A clear distinction must be made between a “wetland inventory” and an inventory of “potential wetland restoration sites.” Wetland inventories identify the location and extent of existing wetland resources, whether degraded or pristine. An inventory of potential wetland restoration sites identifies the location, extent and condition of existing and historical wetlands that have been altered by human activity but could be reestablished through restoration actions. For example, a wetland might have been converted to agricultural uses and dewatered (drained), and may no longer meet criteria for designation as a jurisdictional wetland, but it may provide an opportunity for restoring wetland functions within a watershed

June 2012 Watershed Characterization Methods
Methodology to a Watershed Based Approach to Page 35 Clean Water and Natural Resource Management
6. Used Photo Interpretation to conduct the detailed judgment-based interpretation of data layers developed in the previous steps to expand or reduce the Potential Wetland polygon.
After all wetland and hydric polygons within a section were evaluated and recorded in the data table, the remaining areas were evaluated to identify wetland signatures that didn’t coincide with a wetland or hydric soil polygon. These signatures included clusters or lines of deciduous trees within conifer forests, rough marsh vegetation, or sudden changes in vegetation type. When additional wetland signatures were identified, new polygons were added to the Potential Wetland data layer and their attributes recorded in the data table.
Written data associated with existing wetland inventories, local and regional planning reports were useful to support determinations made during photo interpretation.
Wetland Assessment. Using best professional judgment, a wetland scientist examined the Potential Wetland data and attribute table, then made a series of determinations for each site and entered the results into additional fields in the attribute table. The following fields were added to the Existing and Potential Wetland layers attribute table in the Totten and Eld Inlets and Deschutes studies, based on photo interpretation and from historical documents and reports:
• Pot_wet - This attribute represents the photo interpreter’s opinion of the site’s potential to be either an existing wetland OR a historical wetland area that has restoration potential. This attribute was used to distinguish between wetland and potential wetland areas and upland and historic wetland areas having no restoration potential.
Y - site is an existing wetland or has restoration potential
N - site is not an existing wetland and has no restoration potential due to site or surrounding human land use/alteration.
• HG_Class – This attribute is the site’s existing Hydrogeomorphic Code, as described in
Table 10. It represents the photo interpreter’s opinion of the hydrogeomorphic wetland classification under existing site conditions.

June 2012 Watershed Characterization Methods
Methodology to a Watershed Based Approach to Page 36 Clean Water and Natural Resource Management
Table 10. Hydrogeomorphic wetland types used to classify wetlands Hydrogeomorphic
Code Hydrogeomorphic
Type General Description
RI Riverine Impounding Topographic depressions on a valley bottom
RF Riverine Flow-through Wetland systems associated with rivers and streams where water tends to flow through rather than pond
DC Depressional Closed Topographic depressions outside of valley bottoms having no surface water connection to a stream
DF Depressional Flow-through
Topographic depressions outside of valley bottoms having a surface water connection to a stream
LF Lacustrine Fringe Wetlands occurring at the margins of deepwater lakes
LC Lacustrine Open Water Lake
A lake system >20 acres in area and >2 meters deep
SL Slope Wetland Wetlands occurring on a slope where water tends to sheet flow across
UN Unknown Unable to determine hydrogeomorphic type from photos
NW Non-wetland Site is upland area
MM Man made Stormwater ponds and other artificial impoundments
ES Estuary Direct connection to marine waters
• HG_Poten - This attribute is the site’s potential Hydrogeomorphic Code (Table 10)
following restoration. It represents the photo interpreter’s opinion of the wetland’s Hydrogeomorphic Classification after restoration activities.
• Hyd_Alter - This attribute represents the photo interpreter’s opinion of the extent of
human induced hydrologic alteration for the site based on photo interpretation and available locally developed information.
0 – no or minimal hydrologic alteration
1 – some hydrologic alteration evident, but portions of the site appear to be providing reasonable levels of wetland functions
2 – extensive hydrologic alteration is evident from surface drains and ditches, grading or filling, or is presumed to exist because of human land uses

June 2012 Watershed Characterization Methods
Methodology to a Watershed Based Approach to Page 37 Clean Water and Natural Resource Management
• Veg_Alt - This attribute represents the photo interpreter’s opinion of the extent of
human-induced vegetative alteration to the site based on photo interpretation and available local information.
0 – no or minimal vegetation alteration
1 – some vegetation alteration/clearing is evident from aerial photos and/or LiDAR datasets
2 – extensive vegetation alteration/clearing is evident from aerial photos and/or LiDAR datasets
If available data informed specific development actions, the following fields were also included:
• SiteAvoid – This attribute is the wetland scientist’s opinion of the site-scale resource
value of the wetland. It indicates the need to avoid and/or minimize impacts to the site. Thurston County used Ecology’s Wetland Rating System (2004) to assign a value of High, Medium or Low to each site.
H – High Avoidance: the wetland is an Ecology Category I or Category II (Ecology, 2004) and warrants the highest consideration for avoidance and minimization of impacts.
M – Medium Avoidance: the wetland is an Ecology Category III or IV (Ecology, 2004) and warrants moderate consideration for avoidance and minimization of impacts.
L – Low Avoidance: the wetland is an Ecology Category III or IV (Ecology, 2004) and warrants low consideration for avoidance and minimization of impacts.
• LandAvoid – This attribute is the wetland scientist’s opinion of the landscape-scale
resource value of the wetland in relation to the surrounding landscape and natural resources. Thurston County used Ecology’s Wetland Rating System (2004) to assign a value of High, Medium or Low to each site.
H – High Avoidance: the wetland warrants the highest consideration for avoidance and minimization of impacts based on its relationship to the landscape and natural resources around it.
M – Medium Avoidance: the wetland warrants moderate consideration for avoidance and minimization of impacts based on its relationship to the natural resources around it.
L – Low Avoidance: the wetland warrants low consideration for avoidance and minimization of impacts based on its relationship to the natural resources around it.

June 2012 Watershed Characterization Methods
Methodology to a Watershed Based Approach to Page 38 Clean Water and Natural Resource Management
• FinalAvoid – This attribute is the wetland scientist’s opinion of the overall resource value of the wetland based on averaging the site and landscape-scale rankings. Thurston County used Ecology’s Wetland Rating System (2004) to assign a value of High, Medium or Low to each site.
H – High Overall Avoidance: the wetland warrants the highest consideration for avoidance and minimization based on averaging its site-scale and landscape-scale ranks.
M – Medium Overall Avoidance: the wetland warrants moderate consideration for avoidance and minimization based on averaging its site-scale and landscape-scale ranks.
L – Low Overall Avoidance: the wetland warrants low consideration for avoidance and minimization based on averaging its site-scale and landscape-scale ranks.
• ECY_Categ – This attribute is Ecology’s Wetland Category for the site, according to
the wetland scientist’s opinion. Thurston County used the Washington State Wetlands Rating System (Ecology, 2004) to determine the proper Category, and then assign a value of High, Medium or Low accordingly.
H – High Value: the wetland is a Category I or Category II (Ecology, 2004). A high quality or rare wetland that warrants the highest consideration for avoidance and minimization of impacts.
M – Medium Value: the wetland is a Category III or IV (Ecology, 2004). These may provide ecosystem services not provided by Categories I or II wetlands, and warrant moderate consideration for avoidance and minimization of impacts.
L - Low Value: the wetland is a Category III or IV (Ecology, 2004), and may be small, isolated or degraded sites. These wetlands warrant low consideration for avoidance and minimization, but may provide restoration opportunities.
The following attributes were used prioritize potential wetland restoration sites, but only if additional information (typically non-GIS) was available: • Rare_Type – This attribute identifies wetland fens and bogs considered to be rare,
unique, and/or irreplaceable. Hydric soils with > 25 % organic matter have the greatest potential of supporting peat bogs or fens.
0 – potential wetland sites where ≤33% of the polygon area is a hydric soil series containing >25% organic matter
1 – potential wetland sites where > 33% of the polygon area is a hydric soil series containing > 25% organic matter
• RechrgPot – This attribute identifies wetland sites having the greatest potential to
recharge groundwater aquifers. Hydrologic code attributes within the soils data layer identify soil types having moderate to high percolation.

June 2012 Watershed Characterization Methods
Methodology to a Watershed Based Approach to Page 39 Clean Water and Natural Resource Management
0 – potential wetland sites with ≤50% or less of the polygon intersecting soil mapping units with a Hydrologic Code of A or B
1 – potential wetland sites with > 50% of the wetland polygon intersecting soil mapping units with a Hydrologic Code of A or B
• SWconnect – This attribute identifies potential wetland sites having a surface water
connection as defined by wetland hydrogeomorphic (HGM) classification. Surface water connection was defined as surface water movement from the wetland to a stream or lake for all or part of the year.
0 – potential wetland sites with a potential wetland classification (HG_Class) of Depressional Closed (DC)
1 – wetland sites with a potential wetland classification (HG_Class) of Depressional Flow-through (DF), Riverine Flow-through (RF), Riverine Impounded (RI), Lacustrine Fringe (LF), Lacustrine Open Water (LC), or Slope (SL).
• SWflood – This attribute identifies wetland sites having a direct surface water
connection to a perennial stream or lake. Thurston County inferred the connection by the intersection of a wetland site and a stream or lake on a 1:24,000 hydrography map or GIS layer.
0 – no direct intersection exists between the wetland site and a stream or lake
1 – a direct intersection exists between the wetland site and a stream or lake
• FishAccess – This attribute identifies wetland sites having a direct surface water connection to a perennial stream or lake, where one or more species of fish have potential to access the wetland.
0 – no direct intersection exists between the wetland site and a stream or lake, OR a direct intersection exists, but fish do not have access to that portion of the stream or lake
1 – a direct intersection exists between the wetland site and a fish bearing stream or lake
Data Needs
Thurston County used the following data to complete Step 1:
1. National Wetlands Inventory (NWI) digital data, available free of charge at http://wetlands.fws.gov/
2. Soil survey digital data by County and State: digital maps and descriptions. Free digital datasets of county-level soil maps can be downloaded from USDA (NRCS) websites, or through local County Agricultural Extension websites. http://soils.usda.gov/survey

June 2012 Watershed Characterization Methods
Methodology to a Watershed Based Approach to Page 40 Clean Water and Natural Resource Management
3. Hydric soils lists and descriptions by State: http://soils.usda.gov/use/hydric
4. Digital Elevation Models (DEM) developed from LiDAR or other sources. Government Land Office data from early land survey records
5. Hydrography dataavailable from WADNR
6. Fish access data
7. Public land ownership data
8. Local natural resource planning documents
Products GIS polygon layers of existing and potential wetland restoration sites within the study area. Attribute table populated with photo-interpreted data and natural resource information for each existing and potential wetland restoration site, and an assessment of the suitability of the site for preservation and restoration.

June 2012 Watershed Characterization Methods
Methodology to a Watershed Based Approach to Page 41 Clean Water and Natural Resource Management
Step 2. Determine Location, Extent, and Condition of Riparian Resources
Purpose The extent, location, and condition of riparian resources is used to help characterize the level of aquatic integrity within in the study area (Hyatt et al. 2004, Morley and Karr 2002, Sweeney et al. 2004). The location and extent of existing deforested riparian areas also serves as a pool of potential restoration sites for past impacts to riparian areas. Methods To determine the location, extent, and condition of riparian resources, Thurston County:
1. Applied a 67-meter buffer to a 1:24,000 scale hydrography layer within the study area, creating a riparian buffer layer around all rivers and streams (see previous section). The buffer was based on established minimum shade requirements and site potential tree height (SPTH) for large woody debris recruitment, respectively.
2. Used digital orthophotos, to draw polygons that included non-forested areas within the riparian buffer.
3. Used the following attributes based on best professional judgment.
• Mend_rip – This attribute is a measure of the created polygon to link two disjoined forest patches, if the site was chosen for riparian restoration.
Y – the site would link two forest patches
N – the site would not link two forest patches
• Add_rip – This attribute is a measure of the polygon’s proximity to forest patches, whether the polygon would add forest to the existing forest if it was chosen as a restoration site and restored.
Y – the site would add forest to the existing forest
N – the site would not add forest to the existing forest
• CTS – This attribute represents the range of forest cover within the polygon, how much of the area is cleared to stream (i.e., “CTS”) on a scale of 0 to 2, based on the 67-meter buffer distance from the stream.
0 - <25% cleared
1 – 25 to 50% cleared
2 - >50% cleared
• CDsoils – This attribute represents how much of each non-forest contains C or D soil types using the soils layer.
1 - > 50 percent C or D soils
0 - < 50 percent C or D soils

June 2012 Watershed Characterization Methods
Methodology to a Watershed Based Approach to Page 42 Clean Water and Natural Resource Management
4. Non-forested polygons were clipped to the border of the wetland or floodplain and their area and acreage reduced to avoid double-counting. For the Totten and Eld Inlets and Deschutes studies, non-forested areas less than three acres in size were removed from further consideration of potential riparian restoration sites.
Data Needs Thurston County used the following data to complete Step 2:
1. Hydrography layer.
2. Available riparian coverages, current landcover, digital orthophotos.
3. Study area, Stream Catchments, and drainage basin boundary layers.
4. Soil survey layer, C and D soils.
5. Land ownership layer or maps of publicly owned lands.
6. Local priority sites
7. Wetland and floodplain potential restoration sites Products
1. An approximation of riparian condition and forested riparian area within the study area andDAUs
2. A GIS data file of potential riparian restoration (i.e., non-forested) sites.
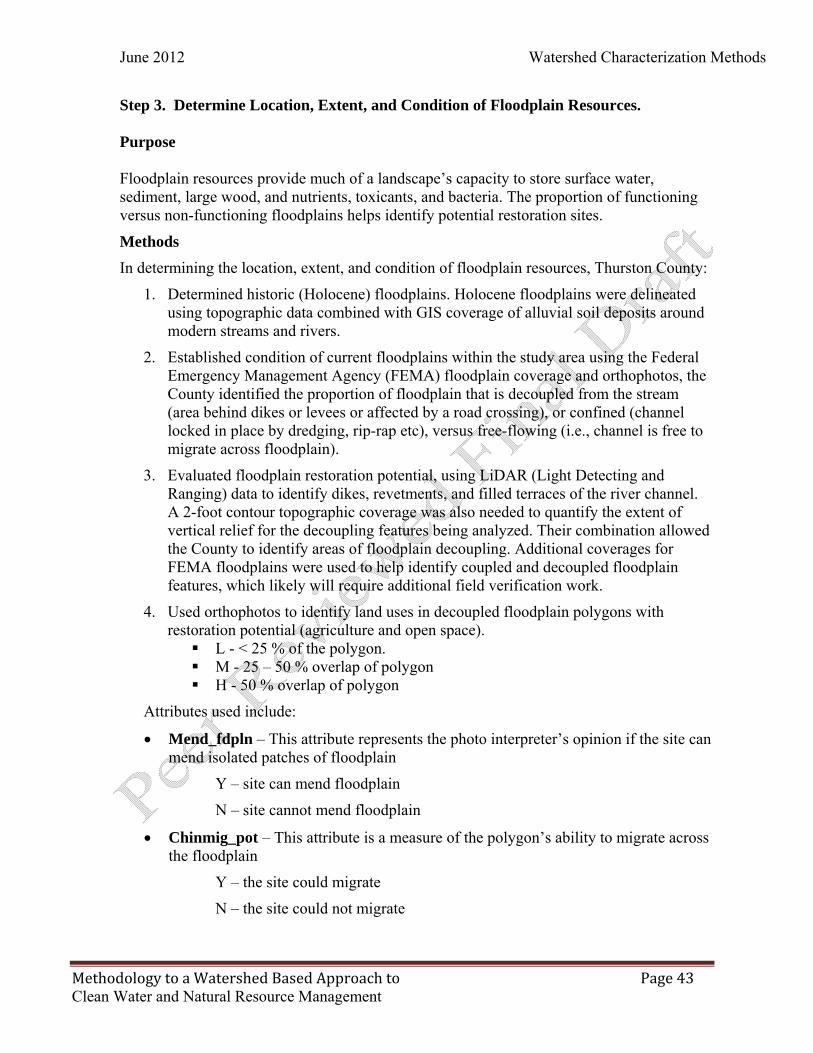
June 2012 Watershed Characterization Methods
Methodology to a Watershed Based Approach to Page 43 Clean Water and Natural Resource Management
Step 3. Determine Location, Extent, and Condition of Floodplain Resources. Purpose Floodplain resources provide much of a landscape’s capacity to store surface water, sediment, large wood, and nutrients, toxicants, and bacteria. The proportion of functioning versus non-functioning floodplains helps identify potential restoration sites.
Methods In determining the location, extent, and condition of floodplain resources, Thurston County:
1. Determined historic (Holocene) floodplains. Holocene floodplains were delineated using topographic data combined with GIS coverage of alluvial soil deposits around modern streams and rivers.
2. Established condition of current floodplains within the study area using the Federal Emergency Management Agency (FEMA) floodplain coverage and orthophotos, the County identified the proportion of floodplain that is decoupled from the stream (area behind dikes or levees or affected by a road crossing), or confined (channel locked in place by dredging, rip-rap etc), versus free-flowing (i.e., channel is free to migrate across floodplain).
3. Evaluated floodplain restoration potential, using LiDAR (Light Detecting and Ranging) data to identify dikes, revetments, and filled terraces of the river channel. A 2-foot contour topographic coverage was also needed to quantify the extent of vertical relief for the decoupling features being analyzed. Their combination allowed the County to identify areas of floodplain decoupling. Additional coverages for FEMA floodplains were used to help identify coupled and decoupled floodplain features, which likely will require additional field verification work.
4. Used orthophotos to identify land uses in decoupled floodplain polygons with restoration potential (agriculture and open space).
L - < 25 % of the polygon. M - 25 – 50 % overlap of polygon H - 50 % overlap of polygon
Attributes used include:
• Mend_fdpln – This attribute represents the photo interpreter’s opinion if the site can mend isolated patches of floodplain
Y – site can mend floodplain
N – site cannot mend floodplain
• Chinmig_pot – This attribute is a measure of the polygon’s ability to migrate across the floodplain
Y – the site could migrate
N – the site could not migrate

June 2012 Watershed Characterization Methods
Methodology to a Watershed Based Approach to Page 44 Clean Water and Natural Resource Management
• Confined – This attribute represents the photo interpreter’s opinion if the site has been confined from the active floodplain
Y – site has been confined
N – site is not confined
• Decoupled – This attribute represents the photo interpreter’s opinion if the site has been decoupled from the active floodplain
Y – site has been decoupled.
N – site has not been decoupled
• Rechrg_pot – This attribute identifies floodplain sites having the greatest potential to recharge groundwater aquifers. Hydrologic code attributes within the soils data layer were used to identify soil types having moderate to high percolation.
0 – potential floodplain sites with 50 percent or less of the polygon intersecting soil mapping units with a Hydrologic Code of A or B
1 – potential floodplain sites with > 50 % of the polygon intersecting soil mapping units with a Hydrologic Code of A or B
Data Needs Thurston County used the following data to complete Step 3:
1. GIS FEMA floodplain coverage
2. Current orthophoto GIS coverage
3. LiDAR topographic data
4. GIS type A and B soils coverage
5. GIS coverage of dikes, levees, and riprap
6. Hydrography Products
1. Information on the decoupling and alteration of floodplain areas

June 2012 Watershed Characterization Methods
Methodology to a Watershed Based Approach to Page 45 Clean Water and Natural Resource Management
PART IV. ASSESS POTENTIAL SITES WITHIN THE CONTEXT OF THE LANDSCAPE
The results of Part II and III are combined to assess the potential sites within the context of the landscape (Part IV). The resulting products comprise natural resource sites that were ranked for restoration opportunities and natural resource sites identified for preservation. To complete this assessment, Thurston County evaluated the DAUs in the study area were evaluated based on their potential to maintain natural processes, and thus to create habitat that can support aquatic species. Following a watershed characterization of the five ecological processes, DAUs were identified as “not properly functioning”, “at risk,” and “properly functioning” for each of the five ecological processes based on values in the MPI (Table 2), the rules and assumptions developed in Tables 3 to 8, and the natural resource rankings developed in (Tables 15 to 17). Results from the characterization of physical processes were used to define ecological process score and rank:
• Movement of Water • Movement of Wood • Movement of Sediments • Movement of Pollutants • Movement of Heat • Habitat Connectivity
The following summarizes the landscape indicators used for each process: Human alteration to the natural movement of water
• Percent TIA • Percent forest land • Percent wetlands cover • Percent floodplain decoupled • Percent stream channel straightened
Human alteration to the natural movement of large wood
• Percent forested riparian • Number of stream crossings per kilometer of stream • Percent floodplain decoupled • Percent stream channel straightened

June 2012 Watershed Characterization Methods
Methodology to a Watershed Based Approach to Page 46 Clean Water and Natural Resource Management
Human alteration to the natural movement of sediment
• Percent bare soils • Road density • Percent unstable slopes (as defined by Thurston County Critical Areas Ordinance) • Percent stream channel straightened • Percent floodplain decoupled
Human alteration to the natural movement of pollutants
• Extent of 303(d) listed water bodies for nutrients, toxicants, bacteria, and temperature
• Condition and extent of wetlands • Percent 67 meter riparian zone with mature canopy
Human alteration to the natural movement of heat
• Extent of 303(d) listed water bodies for nutrients, toxicants, bacteria, and temperature
• Percent 67 meter riparian zone with mature canopy
Habitat Connectivity
• Habitat connectivity for forest and prairie landscapes using FRAGSTATS Step 1. Determine the Ecological Conditions of the DAU This step identified DAUs within the study area having ecological processes that are considered “at risk” under current land use conditions. To maximize environmental benefit, there is growing evidence (Booth et al. 2004) that mitigation efforts should target areas where ecological processes have been altered at a low to moderate level, rather than targeting “the worst first” or a random selection of mitigation sites. Further, DAUs in the “at risk” category for multiple key ecological processes are assumed to provide the greatest potential to maximize environmental benefits when natural resource sites are restored. The final ranking of each DAU yielded an existing baseline condition of ecological health for each DAU, using the assessment of individual ecological process and biological element. All DAUs within the study area with ecological processes considered "At Risk” (AR) under current land use conditions were flagged for further consideration. DAUs in the AR category for multiple key ecological processes were assumed to provide the greatest potential to maximize environmental benefits when natural resource sites are restored. All DAUs were assigned an “ecological benefit score,” using the following weightings (Table 13). The movement of water was weighted highest, given the importance of that

June 2012 Watershed Characterization Methods
Methodology to a Watershed Based Approach to Page 47 Clean Water and Natural Resource Management
ecological process in a built landscape. Ecological processes and habitat connectivity that have been identified as "At Risk” were further considered based upon the potential for enhancement from restored/rehabilitated marginal function levels. These ecological process scores were then ranked with the values for each DAU assigned to one of these categories labeled High, Moderate, or Low (Table 14). Table 11. Weight criteria to rank DAUs
Ecological Process/ Habitat Connectivity in “At Risk” Condition
Score Weight
Total Score
Movement of Water 1 X 3 3
Local Theme – Movement of Large Wood 1 X 3 3
Movement of Sediment 1 X 1 1
Movement of Pollutants 1 X 1 1
Movement of Heat 1 X 1 1
Upland Habitat Connectivity 1 X 1 1
Maximum score for a DAU when all processes are “At Risk” 10 Table 12. Convert Ecological Process Score to Categories
Ecological Process Score Category
7, 8, 9, 10 points High
3, 4, 5, or 6 points Moderate
0, 1, or 2 points Low Step 2. Determine the Potential Environmental Benefit of Resource Sites To determine the potential environmental benefit of resource sites; wetlands, riparian, and floodplain with restoration potential were identified. These datasets differed significantly from existing natural resource data, such as local and state agencies provided, in that they were intended to identify potential restoration sites rather than inventorying existing wetlands, riparian areas, and present floodplain areas. These potential restoration sites included existing wetlands, degraded, or destroyed wetlands that have the highest potential, if restored, to maintain ecological function, while also meeting restoration and/or enhancement needs of local governments. The natural resource sites were evaluated based on the attributes assigned during site assessment. Some specific attributes included scores on vegetation alterations, hydrologic alterations, and adjacency to public lands. The specific details are in the following Tables 15 to 17. Once all the attributes were scored, the following ranking criteria were used to

June 2012 Watershed Characterization Methods
Methodology to a Watershed Based Approach to Page 48 Clean Water and Natural Resource Management
rank the sites High, Moderate, and Low, as detailed in Tables 18 to 20, using natural breaks in the data range. Table 13. Potential Wetland Restoration Site Environmental Benefits Ranking Criteria Scoring Criteria Points Rationale
1) Site has good level of restoration potential
(If criteria for #1 are met, skip #2)
2
2) Site has some restoration potential 1
3) Site has good mitigation potential (If criteria for #3 are met, skip #4)
2
4) Site has some mitigation potential 1
5) Site has extensive hydrologic alteration (Hydro_alt = 2) (If criteria for #5 are met, skip #6)
2 Loss of hydrology can mean the total conversion of the site from wetland to upland. Sites with extensive hydrologic alteration have the greatest potential to restore many of the recognized wetland functions. Restoring hydrologic alteration results in added flood storage desynchronization and flow control, as well as other functions specific to the site.
6) Site has some hydrologic alteration (Hydro_alt = 1)
1 Sites with some hydrologic alteration still function as a wetland, at some level. Mitigation credits are gained for only the functions restored, not maintained. Restoring natural hydrology results in an increase in flood storage /flow control function.
7) Site has extensive vegetation alteration (Veg_alt = 2) (If criteria for #7 are met, skip #8)
2 Sites with extensive forest clearing have potential to restore some flood storage/flow control, water quality, temperature maintenance, and organic export functions.
8) Site has experienced some vegetation alteration (Veg_alt = 1)
1 Sites with some forest clearing have potential to re-store that portion of the flood storage / flow control, water quality, temperature maintenance, and organic export functions affected by forest clearing.
9) More than 50 percent of site has Hydro Code A or B soils
1 Site has increased potential to provide groundwater recharge function.
10) Site has surface hydrology connection to river/stream
Sw_connect = 1
1 Improves site’s ability to provide impacted functions and priorities from Local Plans.

June 2012 Watershed Characterization Methods
Methodology to a Watershed Based Approach to Page 49 Clean Water and Natural Resource Management
Scoring Criteria Points Rationale
11) Stream reach access = 1
1 Identified in SSHIAP as current or historic presence and in WADNR stream typing data layer as modeled fish habitat defined in WAC 222-16-030.
12) Floodplain intersection = 1 1 Provides refuge from high flows
13) More than 33 percent of site on Orcas peat, Seattle muck, Shalcar muck, Mukilteo muck, Tukwila muck, etc
1 Site has bog or fen characteristics that make it a unique wetland type.
14) Site intersects publicly owned land 1 Additional social or educational benefits. Utilization of existing public property
15) Local Priority
local_priority = y
1 Site has been identified by other entities as priority site for restoration, mitigation and/or acquisition.
Ranking Criteria: Maximum Score
Environmental Benefit Criteria 15

June 2012 Watershed Characterization Methods
Methodology to a Watershed Based Approach to Page 50 Clean Water and Natural Resource Management
Table 14. Potential Riparian Restoration Site Environmental Benefits Ranking Criteria Scoring Criteria Points Rationale 1) Site has good level of restoration potential
(If criteria for #1 are met, skip #2)
2
2) Site has some restoration potential 1
3) Site has good mitigation potential (If criteria for #3 are met, skip #4)
2
4) Site has some mitigation potential 1
5) Site reconnects two large forest patches
Mend_rip = y
1 Maximizes potential to reduce habitat fragmentation/increase connectivity.
6) Site adds to an existing forest patch
Add_rip = y
1 Has potential to reduce habitat fragmentation/increase connectivity.
7) Site has 67 meter buffer CTS = 2
1 Reforestation of 67 meter buffer has potential to provide maximum temperature attenuation, water quality treatment, stream habitat value, and wood recruitment.
8) More than 50 percent of site has Hydro Code C or D soils
1 The recharge potential of outwash soils precludes substantial increase in flow control if the site is reforested. Riparian reforestation on till or bedrock areas are assumed to provide greater flow control potential.
9) Site intersects publicly owned land
Does not intersect = 0
Intersects = 1
1 Additional social or educational benefits. Utilization of existing public property.
10) Local Priority
local_priority = y
1 Site has been identified by other entities as priority site for restoration, mitigation and/or acquisition.
Ranking Criteria: Maximum Score
Environmental Benefit Criteria 10

June 2012 Watershed Characterization Methods
Methodology to a Watershed Based Approach to Page 51 Clean Water and Natural Resource Management
Table 15. Potential Floodplain Restoration Site Environmental Benefits Ranking Criteria Scoring Criteria Points Rationale 1) Site has good level of restoration potential
(If criteria for #1 are met, skip #2)
2
2) Site has some restoration potential 1
3) Site has good mitigation potential (If criteria for #3 are met, skip #4)
2
4) Site has some mitigation potential 1
5) Site is decoupled from floodplain
Decoupled = y
1 Sites having lost connectivity to the floodplain provide maximum potential for the recovery of floodplain functions.
7) Site hydrologically reconnects two large floodplain patches Mend_fdpln = y
1 Reestablishes floodplain hydrologic connectivity.
8) Site adds to an existing floodplain patch
Confined = n
1 Adds to floodplain hydrologic connectivity.
9) Site intersect with wetlands 1 Sites that can also restore wetland areas have potential to improve floodplain function.
10) Channel migration potential
Ch_mig_pot = y
1 Sites with channel migration potential have greater potential to restore and maintain diverse floodplain functions.
11) Site intersects publicly owned land
Intersects = 1
1 Additional social or educational benefits. Utilization of existing public property.
12) Local Priority
local_priority = y
1 Site has been identified by other entities as priority site for restoration, mitigation and/or acquisition.
Ranking Criteria: Maximum Score
Environmental Benefit Criteria 11

June 2012 Watershed Characterization Methods
Methodology to a Watershed Based Approach to Page 52 Clean Water and Natural Resource Management
Table 16. Convert Wetland Environmental Process Score to Process Rank
Environmental Process Score Environmental Process Rank
7 to 15 points High
4 to 6 points Moderate
0 to 3 points Low Table 17. Convert Riparian Environmental Process Score to Process Rank
Environmental Process Score Environmental Process Rank
6 to 10 points High
3 to 5 points Moderate
0 to 2 points Low Table 18. Convert Floodplain Environmental Process Score to Process Rank
Environmental Process Score Environmental Process Rank
9 to 11 points High
7 to 8 points Moderate
6 points Low Step 3. Assess Potential Sites within the DAU This section presents the results of a ranking process for all potential natural resource restoration sites within the DAU. This ranking of a natural resource restoration site was based on a combination of each individual site’s rank combined with the ranking of the DAU within which the restoration site was located. The result of this combination was a final score from 0 to 6, with a score of 6 representing those sites with the greatest potential for environmental benefit if restored. Table 21 shows the scores used to rank the natural resource sites in the context of the DAU. The Ecological Benefit (in each DAU) and the Environmental Benefit (Resource Sites) were ranked to provide a final score from 0 to 6. The results were displayed on maps and listed in tables in the resulting report for the study area.

June 2012 Watershed Characterization Methods
Methodology to a Watershed Based Approach to Page 53 Clean Water and Natural Resource Management
Table 19. Combined DAU and Site Score Ranking
Ecological Processes Resource Sites Total Score
High High 6
High Moderate 5
Moderate High 4
Moderate Moderate 3
Low High 2
Low Moderate 1
N/A Low 0

June 2012 Watershed Characterization Methods
Methodology to a Watershed Based Approach to Page 54 Clean Water and Natural Resource Management
PART V. POTENTIAL USES OF WATERSHED CHARACTERIZATION
RESULTS The knowledge of understanding the science of watershed processes is relatively new and it requires a new paradigm of thinking. Most decisions within Thurston County Resource Stewardship are site based and have limited information on what Thurston County now knows about how the Totten and Eld Inlets and the Deschutes River function as watersheds. To protect and restore water resources in these watersheds, the information from the characterization must be used through the county permitting and planning processes. Following are several county programs where the watershed characterization results can be utilized. Thurston County could use the results of this characterization (best available science) to ground site decisions in a watershed perspective. Policy and Programmatic Actions Thurston County Comprehensive Plan The Thurston County Comprehensive Plan contains an Important Greenspaces Map that identifies areas throughout the County for high priority open space. These areas are a combination of natural hazards (such as wetlands and floodplains), significant wildlife habitat areas, and existing parks and preserves (such as the Nisqually and Black River Wildlife Refuges). It includes both public lands and private properties where a land trust holds a conservation easement. The Comprehensive Plan provides the overarching guidance for other County programs described below. It also includes policies and definitions about what natural features and habitats warrant County regulations or implementation actions. At the present time, it lacks a definition of a watershed characterization restoration or preservation sites or any management policies. Comprehensive Plan updates relating to critical areas require substantive consideration of supporting science that meets the GMA’s Best Available Science criteria (WAC 365-195-900 through 365-195-925)
Potential Actions: 1) The Thurston County Comprehensive Plan, Natural Environment Chapter, should be amended to include a definition of watershed characterization restoration sites, an objective regarding the management approach appropriate for these areas, and specific policies for County implementation actions. 2) The Important Greenspaces Map in the Comprehensive Plan should be amended to include the watershed characterization restoration sites.
Conservation Futures Program The Thurston County Conservation Futures Program was established as a mechanism to protect open space, timber lands, wetlands, fish and wildlife habitat, and agricultural lands within the boundaries of Thurston County. Conservation Futures funds are used by Thurston County or a local land trust to acquire the land or the rights to future development of the

June 2012 Watershed Characterization Methods
Methodology to a Watershed Based Approach to Page 55 Clean Water and Natural Resource Management
land for permanent protection. Currently, applications are reviewed and ranked in terms of high to low priority based on a point system.
Potential Actions: 1) The Conservation Futures ranking process should be amended to recognize watershed characterization restoration sites as priority habitat areas, with an added point value.
Open Space Tax Program The Thurston County Current Use Assessment Program was established to provide deferral of property tax to properties maintained in agriculture, forestry or other open space uses. Properties are evaluated under a point system, called a Public Benefit Rating System, which is similar to the Conservation Futures Program. The existing Current Use Assessment Program does not specifically recognize the watershed characterization results but does give points for the presence of Significant Wildlife Habitat that includes wetlands, streams, floodplain, shoreline, and fish habitat.
Potential Actions: 1) The Current Use Assessment Program should be amended to recognize watershed characterization restoration sites as priority natural resource areas with an added point value.
Compensatory Mitigation Program Compensatory mitigation could address cumulative unavoidable development impacts through three distinct mechanisms. These include: 1) Permittee Responsible Mitigation (currently done in Thurston County Resource Stewardship through the Critical Areas Ordinance and through SEPA); 2) Mitigation Banking; and 3) In-Lieu Fee Mitigation. Permittee responsible mitigation maintains the liability for the construction and long-term success of the site. Whereas mitigation banking and in-lieu fee mitigation are forms of "third party" compensation, where the liability for project success is transferred to the mitigation bank or in-lieu fee sponsor. At the present, Thurston County does not have off-site compensatory mitigation programs such as wetland banking or fee-in-lieu, although a pilot in-lieu fee program is underway in the Deschutes watershed, funded by the Puget Sound Partnership. The Puget Sound Partnership provided the grant to undertake pre-capitalization activities that included: a feasibility study, preliminary design plans, and an appraisal. The potential sites are located within the Deschutes River floodplain. Watershed Characterization could inform future banking or fee-in-lieu programs regarding which sites provide restoration opportunities. Critical Area Ordinance updates require supporting science that meets the GMA’s Best Available Science criteria (WAC 365-195-900 through 365-195-925)
Potential Actions: 1) Thurston County should adopt a compensatory mitigation program that uses Watershed Characterization to identify restoration sites. This would need to identify the type of mechanism to be used (permittee responsible,

June 2012 Watershed Characterization Methods
Methodology to a Watershed Based Approach to Page 56 Clean Water and Natural Resource Management
mitigation banking, or fee in-lieu). It would need to identify the locations where the program is mandatory and any areas where it would be optional.
Purchase or Transfer of Development Rights Program In the mid-1990’s Thurston County adopted a Purchase of Development Rights (PDR) and a Transfer of Development Rights Program (TDR) for selected agricultural lands within the County. The PDR program purchased the development potential on 940 acres of farm land within the Nisqually Valley. The TDR program was applied to all other long-term agricultural areas. See website. We should provide examples on where we have applied the TDR program. The intent of the Transfer of Development Rights program is to provide an opportunity for working-land owners to sell their development rights without having to sell their entire property for development. Under this approach, the rural character and agricultural economy of Thurston County is preserved, and working-land owners have the opportunity to realize some of the true market value of their land without having to sell the land altogether for urban development. Under a TDR program watershed characterization preservation and restoration sites could be identified. Under such an approach, watershed characterization preservation or restoration sites may have the option to transfer the residential development rights to an appropriate receiving location.
Potential Actions: 1) Thurston County should adopt a Transfer of Development Rights Program which includes the identification of watershed characterization preservation and restoration sites, as priority features.
Watershed or Salmon Recovery Plans Thurston County has been involved in various types of watershed and salmon recovery planning since 1999. For non-point pollution efforts, water resource planning, or other localized needs. The Nisqually Indian Tribe is lead for water resource planning under ESHB 2514 (watershed planning) and ESHB 2496 (salmon recovery planning). Both of those efforts are active. The Thurston Conservation District serves as the lead entity for salmon recovery efforts in Water Resource Inventory Areas (WRIA) 13 and 14. Planning under ESHB 2514 for WRIA 13 and 14 has been discontinued because of lack of consensus among stakeholders. The current ESHB 2496 salmon recovery efforts in the three WRIAs do not recognize watershed characterization restoration sites as potential properties for restoration or long-term protection.
Potential Actions: 1) The salmon recovery plans for WRIAs 11, 13 and 14 could be updated to include watershed characterization restoration sites as potential properties for restoration or long-term protection.

June 2012 Watershed Characterization Methods
Methodology to a Watershed Based Approach to Page 57 Clean Water and Natural Resource Management
Thurston County Capital Facilities Plan Thurston County adopts a Capital Facilities Plan (CFP) identifying those facilities where the County will fund projects within the next six or twenty years. Transportation projects are a major portion of the CFP. While most new roadway systems throughout the County are proposed by private developments, expansions of existing facilities may be included within the County CFP. New or significantly widened roadways may increase habitat fragmentation and affect high quality habitat areas.
Potential Actions: 1) The Thurston County Comprehensive Plan should be amended to address watershed characterization restoration sites when considering capital improvement projects. 2) Policies could be added that projects within the Thurston County Capital Facilities Plan avoid restoration or preservation sites identified by the Watershed Characterization reports, and if mitigation is required, because an impact can not be avoided, then identified mitigation sites should be pursued whenever practicable..
Stormwater Basin Planning In the past, Thurston County undertook stormwater basin planning within the urban basins of the north Thurston County urban growth area. Over time the County and the adjacent Cities of Lacey, Olympia, and Tumwater prepared a number of basin plans. All the basin plans include lists of stormwater facilities to be retrofitted. All the basin plans are outdated and would not include any watershed characterization restoration sites.
Potential Actions: 1) The list of stormwater facilities to be retrofitted should be amended by basin to included watershed characterization restoration sites.
Urban Growth Area Boundary Revision The Thurston County Watershed Characterization results identify high quality natural resource sites that should be taken into consideration when changes to the Urban Growth Area (UGA) boundary are proposed and evaluated.
Potential Action: Utilize the list of high quality natural resource sites from the Watershed Characterization results, when making boundary revisions to UGA boundaries.

June 2012 Watershed Characterization Methods
Methodology to a Watershed Based Approach to Page 58 Clean Water and Natural Resource Management
Development Regulations Critical Areas Regulations Development regulations are means to implement the goals, objectives and policies of the Comprehensive Plan. All local jurisdictions in the state are required to have “Critical Areas” regulation under the State Growth Management Act (GMA). A Critical Areas Ordinance (CAO) covers a wide range of geographic conditions including floodplains, riparian areas, wetlands, and steep slopes. A CAO is a type of development regulation. Thurston County adopted its current CAO in 1994, with some fine-tuning in 1996. Thurston County is seeking to update its current CAO to address new state requirements. Critical Area Ordinance updates require substantive consideration of supporting science that meets the GMA’s Best Available Science criteria (WAC 365-195-900 through 365-195-925). While a Critical Area regulation can require protection of the current conditions, it lacks the ability to require substantial habitat restoration. For example, if a wetland has been ditched and now only supports monoculture of reed canary grass, (referred to by farmers as ‘wet pasture’) those ecological functions are what the CAO regulations would protect. This is why separate actions are needed by local governments for more ecological restoration and long-term habitat protection. CAO regulations could offer some innovative approaches for regulating critical areas; such as allowing mitigation banking, off-site mitigation, and alternative mitigation approaches. The management of watershed characterization restoration sites is more suitable for these alternative approaches than the traditional site-by-site review process. However, a large lot sub-division, or any proposed development that requires a SEPA review should be subject to restoration sites identified by the watershed characterization results. The CAO allows for the adoption of special management plans to be developed for specific situations relating to critical areas, such as sub-watersheds or basins. When detailed studies are completed, alternative standards and requirements can be adopted which provide specific development regulations, protection, and restoration potential. Such alternative approaches could include off-site mitigation when it can be shown to provide equal or greater benefits than on-site mitigation. While such an approach is most commonly associated with wetland mitigation, it might be equally suitable for streams, riparian, or prairie areas where off-site mitigation may provide greater watershed restoration benefits. Either could be linked to the compensatory mitigation program describe above.
Potential Actions: 1) The Thurston County Critical Area Ordinance (CAO) should be amended as watershed characterizations are completed. An alternative set of regulations should be adopted that provides equal or better watershed restoration benefits. 2) New regulations should be adopted regarding aquatic and terrestrial habitats and may include; a) minimum forest cover standards, b) minimum patch size for various habitats, c) a change of allowed uses to those which are defined as ‘low intensity’, and d) avoidance provision for the location of new upland roads similar to those currently in place for wetlands. 3) These special regulations could be linked to the adoption of a compensatory mitigation program.

June 2012 Watershed Characterization Methods
Methodology to a Watershed Based Approach to Page 59 Clean Water and Natural Resource Management
Stormwater Regulations - Low Impact Development Stormwater regulations are a type of development regulation described by the Thurston County Comprehensive Plan and the State Growth Management Act. Thurston County and the Cities of Lacey, Olympia, and Tumwater are regulated by the Washington State Department of Ecology (Ecology) through a National Pollution Discharge Elimination System (NPDES) phase II permit. Thurston County and the Cities of Lacey, Olympia, and Tumwater have all adopted an equivalent to Ecology’s manual. The proposed 2012 NPDES Phase II permit requires Low Impact Development (LID) as a set of techniques to minimize the development impacts of new development. LID covers a wide variety of practices intended to mimic natural hydrologic patterns and therefore reduce the negative impacts development has on hydrology and water quality. The application of LID techniques can offer a number of advantages over traditional, engineered stormwater drainage approaches, where feasible
Possible Actions: 1) The Thurston County Stormwater Drainage Manual should be amended to incorporate the watershed characterization restoration or preservation sites in lieu of LID practices.
Non-Regulatory Conservation Efforts Land Trusts There are many organizations and programs set-up to acquire properties for habitat conservation. Land trusts are one of these. They manage lands for a variety of open space and wildlife habitat purposes, and acquire properties through a fee simple purchase or a conservation easement which restricts the future use and development of the site. Within southern Puget Sound the Cascade Land Conservancy, Capital Land Trust, and Nisqually Land Trust are all active. The Nisqually Land Trust (WRIA 11) and the Capitol Land Trust (WRIA 13 and 14) have been active in acquiring parcels and conservation easements. This has been though a collaboration of funding sources including Conservation Futures, the Open Space Tax Program, and Salmon Recovery funding.
Possible Actions: 1) Thurston County should continue to support the actions of local land trusts to acquire parcels and conservation easements for the purpose of natural resource protection. 2) Encourage land trusts to participate in collaborative efforts which that would include watershed characterization restoration and preservation sites.

June 2012 Watershed Characterization Methods
Methodology to a Watershed Based Approach to Page 60 Clean Water and Natural Resource Management
South Puget Sound Salmon Enhancement Group The South Puget Sound Salmon Enhancement Group (SPSSEG) is one of fourteen Regional Enhancement Groups created by the State in 1990 to protect and restore salmon populations. By obtaining grants and donations it undertakes aquatic restoration projects. This is often done in cooperation with other conservation organizations.
Possible Actions: 1) Encourage SPSSEG to consider watershed characterization restoration sites as possible future projects. 2) List SPSSEG as a possible restoration partner in future updates of the Capitol Facilities Plan by the Thurston County Resource Stewardship Department – Water Resources Program.
Stream Team Thurston County and the Cities of Lacey, Olympia, and Tumwater have organized citizen based, volunteer stream teams to assist in various education and restoration efforts within the communities. This can often involve other environmental and civic groups (such as schools, scout troops, etc.). The volunteer approach offered by the Stream Team may have a higher success rate in interacting with these property owners than other governmental techniques. Possible Action: 1) Identify watershed characterization restoration sites that may assist in prioritizing Stream Team restoration efforts with a limited budget.

June 2012 Watershed Characterization Methods
Methodology to a Watershed Based Approach to Page 61 Clean Water and Natural Resource Management
REFERENCES Angermeier, P. L. and I. Schlosser. 1995. Conserving aquatic biodiversity: beyond species
and populations. In: Evolution and the Aquatic Ecosystem: Defining Unique Units in Population Conservation. Nielsen, J. L. (ed. ) American Fisheries Society Symposium 17:402-414.
Azous, A. L. and R.R. Horner. 1997. Wetlands and Urbanization; Implications for the Future. Washington Department of Ecology, King County Land and Water Resources Division, and the Univ. of Washington, Seattle.
Beechie, T. and S. Bolton. 1999. An approach to restoring salmonid habitat-forming processes in Pacific Northwest watersheds. Fisheries 24(4):6-24.
Beechie, T.J., E.A. Steel, P. Roni, and E. Quimby (editors). 2003. Ecosystem recovery planning for listed salmon: an integrated assessment approach for salmon habitat. U.S. Dept. Commer., NOAA Tech. Memo. NMFS-NWFSC-58, 183 p.
Beechie et al. 2010
Berman, C.H., and T.P. Quinn. 1991. Behavioral thermoregulation and homing by spring chinook salmon, Oncorhynchus tshawytscha (Walbaum), in the Yakima River. Journal of Fish Biology 39:301-312.
Booth, D. K. 2000. Forest cover, impervious-surface area, and the mitigation of urbanization impacts in King County, Washington. Unpublished paper. Center for Urban Water Resources, University of Washington, Seattle.
Booth, D.B. 1991. Urbanization and the Natural drainage system – Impacts, Solutions, and Prognoses. The Northwest Environmental Journal, 7:93-118.
Booth, D.B. 2010. Review of Thurston County’s “Methodology to a Watershed Based Approach to Federal and State Clean Water Act Regulations”. Submitted to Thurston County Department of Resource Stewardship.
Booth, D.B.and C.R. Jackson. 1997. “Urbanization of Aquatic Systems: Degradation Thresholds, Stormwater Detection, and Limits of Migration,” Journal of the American Water Resources Association, Vol. 33, No. 5, pp. 1077-1089.
Booth, D. B., J. R. Karr, S. Schauman, C. P. Konrad, S. A. Morley, M. G. Larson, P. C. Henshaw, E. J. Nelson, and S. J. Burges. 2001. Urban stream rehabilitation in the Pacific Northwest. Final Report of EPA Grant Number R82-5284-010. University of Washington.
Booth, D.B., J.R. Karr, S. Schauman, C.P. Konrad, S.A. Morley, M.G. Larson, and S.J. Burges. In Press. Reviving Urban Streams: Land Use, Hydrology, Biology, and Human Behavior. Journal of the American Water Resources Association.
Booth, D.B., R.A. Haugerud, and K.G. Troost, 2003. Geology, Watersheds, and Puget Lowland Rivers: chapter in D. Montgomery, S. Bolton, and D.B. Booth, eds., Restoration of Puget Sound Rivers: University of Washington Press. (pages 14 – 45).
June 2012 Watershed Characterization Methods
Methodology to a Watershed Based Approach to Page 62 Clean Water and Natural Resource Management
Brinson, M. M. 1993. A Hydrogeomorphic Classification for Wetlands. Wetlands Research Program Technical Report WRP-DE-4. U.S. Army Corps of Engineers, Springfield, VA.
Brooks, K., K.M. Dvornich, M. Tirhi, E. Neatherlin, M. McCalmon, and J. Jacobson. 2004. Pierce County Biodiversity Network Assessment: August, 2004. Report to Pierce County Council, Pierce County, 146 pp.
Center for Watershed Protection. 1997. National Pollutant Removal Performance Database for Stormwater Best Management Practices. For the Chesapeake Research Consortium.
Davenport, T.E. 2003. The Watershed Project Management Guide. Lewis Publishers, Boca Raton, FL.
Dinicola, R. S. 2001. Validation of a Numerical Modeling Method for Simulating Rainfall-Runoff Relations for Headwater Basins in Western King and Snohomish Counties, Washington. U.S. Geological Survey Water Supply Paper 2495.
Doppelt, B., M. Scurlock, C. Frissell, and J. Karr. 1993. Entering the watershed, a new approach to save America’s river ecosystems. The Pacific Rivers Council. Island Press. 462 pp.
Ebersole, J. L., W. Liss, and C. Frissell. 1997. Restoration of stream habitats in the Western United States: restoration as re-expression of habitat capacity. Environmental Management 21(1):1-14.
ESA Adolfson, in association with: Washington Department of Ecology, Department of Fish and Wildlife, Puget Sound Partnership, and EPA. 2007. Birch Bay Watershed Characterization: A Pilot Study Integrating Methods in Watershed Characterization and Land Use Planning. Prepared for: Whatcom County Planning and Development Services October 2007
Euphrat, F. D. and B. P. Warkentin. 1994. A watershed assessment primer. US Environmental Protection Agency 910/B-94/005. EPA Region X, Seattle, WA.
Feist, B.E., E.A. Steel, G.R. Pess, and R.E. Bilby. 2003. The influence of scale on salmon habitat restoration priorities. Animal Conservation. The Zoological Society of London, United Kingdom. 6:271-282.
Frissell, C. A. 1996. A new strategy for watershed restoration and recovery of Pacific salmon in the Pacific Northwest. In: Watershed and Salmon Habitat Restoration Projects: Guidelines for Managers of State Trust Lands. Dominguez, L. (ed.). Washington Department of Natural Resources. Olympia, WA 90 pp.
Frissell, C. and B. Doppelt. 1996. A new strategy for watershed protection, restoration and recovery of wild native fish in the Pacific Northwest. In: Healing the Watershed, a guide to the restoration of watersheds and native fish in the West. Pacific Rivers Council, Inc. 212 pp.
Geist, D.R., and D.D. Dauble. 1998. Redd site selection and spawning habitat use by fall chinook salmon: the importance of geomorphic features in large rivers. Environmental Management 22:655-669.

June 2012 Watershed Characterization Methods
Methodology to a Watershed Based Approach to Page 63 Clean Water and Natural Resource Management
Geist, D.R., 2000. Hyporheic discharge of river water into fall Chinook salmon (Oncorhynchus tshawytscha) spawning areas in the Hanford Reach, Columbia River. Can. J. Fish. Aquatic Sci. 57: 1647-1656 (2000).
Gersib, R. 2001. Characterizing wetland restoration potential at a river basin scale, Nooksack River Basin, Washington State. Draft Report. Washington State Department of Ecology.
Gersib, R., L. Wildrick, C. Freeland, S. Grigsby, K. Bauersfeld, S. Butkus, R. Coots, and J. Franklin. 1999. Process-based river basin characterization: a case study Snohomish Basin, Washington. Washington State Department of Ecology. Olympia, WA.
Gersib, R.. 1997. Restoring Wetlands at a River Basin Scale - A Guide for Washington’s Puget Sound. Operational Draft. Washington State Department of Ecology.
Gersib, R. A., B. Aberle, L. Driscoll, J. Franklin, B. Haddaway, T. Hilliard, J. Park, A. Perez, R. Schanz, A. Wald, and B. Wood. 2004. Enhancing Transportation Project Delivery Through Watershed Characterization: Methods Document. Washington State Department of Transportation. Available at the following web site: http://www.wsdot.wa.gov/environment/watershed/docs/methods.pdf
Hansen, A. J, and R. L Knight et al 2005. Effects of Exurban Development on Biodiversity Patterns, Ecological Applications, 15(6), pp. 1893–1905
Hill, K., E. Botsford, and D. B. Booth. 2003. A rapid landcover classification method for use in urban watershed analysis. University of Washington Department of Civil and Environ-mental Engineering, Water Resources Series Technical Report No. 173. http://depts.washington.edu/cwws/Research/Reports/landcover03.pdf
Horner, R. 2010. Review of Thurston County’s“Methodology to a Watershed Based Approach to Federal and State Clean Water Act Regulations”. Submitted to Thurston County Department of Resource Stewardship.
Hulse, D. et al., 2002. Willamette River Basin: trajectories of environmental and ecological change by The Pacific Northwest Ecosystem Research Consortium, Appendices -Uncertainty and Error, ed. David Hulse et al. Oregon State University Press, 2002.
Hyatt, T. L., T. Z. Waldo and T. J. Beechie. 2004. A watershed scale assessment of riparian forests, with implications for restoration. Restoration Ecology 12:175-183.
Karr, J. R. 1995. Clean water is not enough. Illahee 11(1-2):51-59.
Karr, J. R. and D. R. Dudley. 1981. Ecological perspectives on water quality goals. Environmental Management 5: 55-68.
Martin, D., L. Benda, and D. Shreffler. 2004. Core Areas: Habitats that Functionally Control the Spatial Structure of Salmon Populations. King County, Department of Natural Resources and Parks, Water and Land Resources Division, Science Section. Project No. T01426T.
Leman, V.N. 1993. Spawning sites of chum salmon, Oncorhynchus keta: Microhydrological regime and viability of progeny of redds (Kamchatka River Basin). Journal of Ichthyology 33:101-117.

June 2012 Watershed Characterization Methods
Methodology to a Watershed Based Approach to Page 64 Clean Water and Natural Resource Management
Maune, D.F. Editor. 2007. Digital Elevation Technologies & Applications, 2nd Ed., American Society for Photogrammetry and Remote Sensing Press.
May, C. and G. Peterson, 2003. East Jefferson County Salmonid Refugia Report
McGarigal, K., S. A. Cushman, M. C. Neel, and E. Ene. 2002. FRAGSTATS: Spatial Pattern Analysis Program for Categorical Maps. Computer software program produced by the authors at the University of Massachusetts, Amherst. Available at the following web site: http://www.umass.edu/landeco/research/fragstats/fragstats.html
Montgomery, D. R. 1995. Input- and out-oriented approaches to implementing ecosystem management. Environmental Management 19(2):183-188.
Montgomery, D. R., G. Grant, and K. Sullivan. 1995. Watershed analysis as a framework for implementing ecosystem management. Water Resources Bulletin 31(3):369-386.
Montgomery, D. R., Pess, G., Beamer, E. M., and Quinn, T. P., 1998. Channel type and salmonid spawning distributions and abundance, Canadian Journal of Fisheries and Aquatic Sciences, v. 56, p. 377-387, 1999.
Montgomery, D.R. 1999. Process domains and the river continuum. Journal of the American Water Resources Association. Vol. 35, No. 2, 397-410.
Musagrave Ruth S. Musgrave and Mary Anne Stein 1993 State Wildlife Laws Handbook: Chapter 2 Overview of Wildlife Law Government Institutes Inc., Rockville, Maryland ISBN #: 0-86587-357-7 http://www.animallaw.info/articles/arusHistoryStateWM.htm
Naiman, F. J., T. Beechie, L. Benda, D. Berg, P. Bisson, L. MacDonald, M. O’Connor, P. Olson, and E. Steel. 1992. Fundamental elements of ecological healthy watersheds in the Pacific Northwest coastal ecosystems. In: Naiman (ed.) Watershed Management, Springer-Verlag, p. 127-188.
National Marine Fisheries Service [NOAA-Fisheries]. 1996. Making Endangered Species Act determinations of effect for individual or grouped actions at the watershed scale. Environmental and Technical Services Division, Habitat Conservation Branch. 28 pp.
National Research Council. 1992. Restoration of aquatic ecosystems. National Academy Press, Washington, D. C.
National Research Council. 1999. New strategies for America’s watersheds. National Academy Press. Washington, D. C.
NOAA Fisheries Service. March, 2003. HCD Stormwater Online Guidance, ESA Guidance for Analyzing Stormwater Effects. NOAA Fisheries Service, Northwest Region.
Omernik, J. M. 1995. Ecoregions: a spatial framework for environmental management. In: W. S. Davis and T. P. Simon (eds.) Biological Assessment and Criteria, Tools for Water Re-source planning and Decision Making. Lewis Publishers.

June 2012 Watershed Characterization Methods
Methodology to a Watershed Based Approach to Page 65 Clean Water and Natural Resource Management
Pess, G.R., D.R. Montgomery, E.A. Steel, R.E. Bilby, B.E. Fiest, and H.M. Greenberg. 2002. Landscape Characteristics, land use, and coho salmon (Oncorhynchus kisutch) abundance, Snohomish River, Wash., U.S.A. Canadian Journal of Fisheries and Aquatic
Management 59:613-623
Reeves, G. H., L. Benda, K. Burnett, P. Bisson, and J. Sedell. 1995. A disturbance-based ecosystem approach to maintaining and restoring freshwater habitats of evolutionarily significant units of anadromous salmonids in the Pacific Northwest. In: Evolution and the Aquatic Ecosystem: Defining Unique Units in Population Conservation. Nielsen, J. L. (ed. ). American Fisheries Society Symposium 17:334-349.
Reid, L. M. 1993. Research and cumulative watershed effects. USDA Forest Service Pacific Southwest Research Station General Technical Report PSW-GTR-141. 118 pp.
Reynolds, O. and B. Wood. 2006. Henderson Inlet Watershed Characterization. Thurston County, WA. Methods document can be found at http://www.co.thurston.wa.us/stormwater/chara/chara-home.html
Reynolds, O. and B. Wood. 2009. Totten and Eld Watershed Characterization. Thurston County, WA. Methods document can be found at http://www.co.thurston.wa.us/stormwater/chara/chara-home.html
Reynolds, O. and B. Wood. 2010. Deschutes Watershed Characterization. Thurston County, WA. Methods document can be found at http://www.co.thurston.wa.us/stormwater/chara/chara-home.html
Roni, P., T. J. Beechie, R. E. Bilby, F. E. Leonetti, M. M. Pollock, and G. R. Pess. 2002. A review of stream restoration techniques and a hierarchical strategy for prioritizing restoration in Pacific Northwest watersheds. North American Journal of Fisheries Management 22:1-20.
Snyder, C.D., J.A. Young, R. Villella, and D.P. Lemarie. 2003. Influences of upland and riparian land use patterns on stream biotic integrity. Landscape Ecology 18:647-664.
Stelle, Jr., W. 1996. National Marine Fisheries Service letter dated September 4, 1996. Subject: Implementation of “Matrix of Pathways and Indicators” for evaluating the effects of human activities on anadromous salmonid habitat.
Strecker, E., B. Wu, and M. Iannelli. 1997. Analysis of Oregon Urban Runoff Water Quality Data Collected from 1990 to 1996. Prepared for The Oregon Association of Clean Water Agencies by Woodward-Clyde Consultants.
Sweeney, B. W., T. L. Bott, J. K. Jackson, L. A. Kaplan, J. D. Newbold, L. J. Standley, W. C. Hession, and R. J. Horwitz. 2004. Riparian deforestation, stream narrowing, and loss of stream ecosystem services. Proceedings of the national Academy of Sciences of the Unites States of America 101(39): 14132-14137.
U.S. Environmental Protection Agency (USEPA). 2003a. Watershed-Based NPDES Permitting Policy Statement. In Watershed-Based National Pollutant Discharge Elimination System (NPDES) Permitting Implementation Guidance. USEPA, Washington, DC.

June 2012 Watershed Characterization Methods
Methodology to a Watershed Based Approach to Page 66 Clean Water and Natural Resource Management
U.S. Environmental Protection Agency (USEPA). 2003b. Watershed-Based National Pollutant Discharge Elimination System (NPDES) Permitting Implementation Guidance. USEPA, Washington, DC.
U.S. Environmental Protection Agency (USEPA). 2007. Watershed-Based NPDES Permitting Technical Guidance (draft). USEPA, Washington, DC.
US Fish and Wildlife Service. 1998. A framework to assist in making endangered species act determinations of effects for individual or grouped actions at the bull trout subpopulation at a watershed scale.
Vaccaro, J.J., A.J. Hansen, Jr., and M.A. Jones, 1998. Hydrogeologic Framework of the Puget Sound Aquifer System, Washington and British Columbia. US Geological Survey Professional Paper 1424-D.
Washington State Department of Ecology. 1993. Washington State Wetlands Rating System, Western Washington (second edition). Washington State Department of Ecology. Publication #93-74.
Washington State Department of Ecology. 2003. Environmental Information Management System, On-line searchable database.
Washington Department of Fish & Wildlife (WDFW) 2005. Washington’s Comprehensive Wildlife Conservation Strategy (Olympia, Washington) Online at:
http://wdfw.wa.gov/wlm/cwcs/cwcs.htm
Washington State Department of Fish and Wildlife. 1991. Washington Department of Wildlife. Management Recommendations for Washington’s Priority Habitats and Species. Wildlife Management, Fish Management, and Habitat Management Divisions. Olympia, Washington.
Washington State Department of Fish and Wildlife. 2001. Priority Habitats and Species Database. July 18, 2001. 2 pg + maps.
Zielinski, J, 2002. Watershed Vulnerability Analysis. Center for Watershed Protection. Ellicott City, Maryland.
i Narrative criteria for indicator condition taken from US Fish and Wildlife Service (1998), numeric criteria added by authors ii Revised 4/09. Schueler, T.R., L.Fraley-McNeil, and K. Cappiella. Journal of Hydrologic Engineering,
April 2009. pg 309-314. Revised 8/04 based on Booth, D.B., J.R. Karr, S. Schauman, C.P. Konrad, S.A. Morley, M.G. Larson, and S.J. Burges. In Press. Reviving Urban Streams: Land Use, Hydrology, Biology, and Human Behavior. Journal of the American Water Resources Association.
iii NOAA Fisheries Service. March, 2003. HCD Stormwater Online Guidance, ESA Guidance for Analyzing
Stormwater Effects. NOAA Fisheries Service, Northwest Region iv NOAA Fisheries Service. March, 2003. HCD Stormwater Online Guidance, ESA Guidance for Analyzing
Stormwater Effects. NOAA Fisheries Service, Northwest Region

June 2012 Watershed Characterization Methods
Methodology to a Watershed Based Approach to Page 67 Clean Water and Natural Resource Management
v Narrative criteria for indicator condition taken from NOAA-Fisheries (1996) and US Fish and Wildlife
Service (1998), numeric criteria added by authors vi Adapted from NOAA-Fisheries Service. March, 2003. HCD Stormwater Online Guidance, ESA Guidance
for Analyzing Stormwater Effects. NOAA-Fisheries Service, Northwest Region vii Narrative criteria for indicator condition taken from NOAA-Fisheries (1996) and US Fish and Wildlife
Service (1998), numeric criteria added by authors viii NOAA-Fisheries Service. March, 2003. HCD Stormwater Online Guidance, ESA Guidance for Analyzing
Stormwater Effects. NOAA-Fisheries Service, Northwest Region ix Narrative and numeric criteria for indicator condition taken from NOAA-Fisheries (1996) x Narrative criteria for indicator condition taken from NOAA-Fisheries (1996) and US Fish and Wildlife
Service (1998), numeric criteria added by authors xi Narrative criteria for indicator condition taken from NOAA-Fisheries (1996) and US Fish and Wildlife
Service (1998) xii NOAA-Fisheries Service. March, 2003. HCD Stormwater Online Guidance, ESA Guidance for Analyzing
Stormwater Effects. NOAA-Fisheries Service, Northwest Region xiii Adapted from NOAA-Fisheries Service. March, 2003. HCD Stormwater Online Guidance, ESA Guidance
for Analyzing Stormwater Effects. NOAA-Fisheries Service, Northwest Region xiv Based on common criteria established by NOAA-Fisheries (1996) and the U.S. Fish and Wildlife Service
(1998) for chemical contamination/nutrients xv Adapted from NOAA-Fisheries Service. March, 2003. HCD Stormwater Online Guidance, ESA Guidance
for Analyzing Stormwater Effects. NOAA-Fisheries Service, Northwest Region