Cellular responses in the cyprinid Leuciscus cephalus from a contaminated freshwater ecosystem
ISSN 0378-4738 = Water SA Vol. 29 No. 1 January 2003 69Available on website http://www.wrc.org.za
Methodology for the assessment of human health risksassociated with the consumption of chemical contaminated
freshwater fish in South Africa
HH du Preez1,3*, RGM Heath2 LA Sandham3 and B Genthe4
1 Water Treatment Technology Division, Analytical Services, Hydrobiology Section, Rand Water, PO Box 3526,Vereeniging 1930, South Africa
2 Pulles Howard and De Lange, PO Box 861, Auckland Park 2006, South Africa3 School of Environmental Sciences and Development, Potchefstroom University for Christen Higher Education,
Private Bag X6001, Potchefstroom 2520, South Africa4 CSIR, PO Box 320, Stellenbosch 7599, South Africa
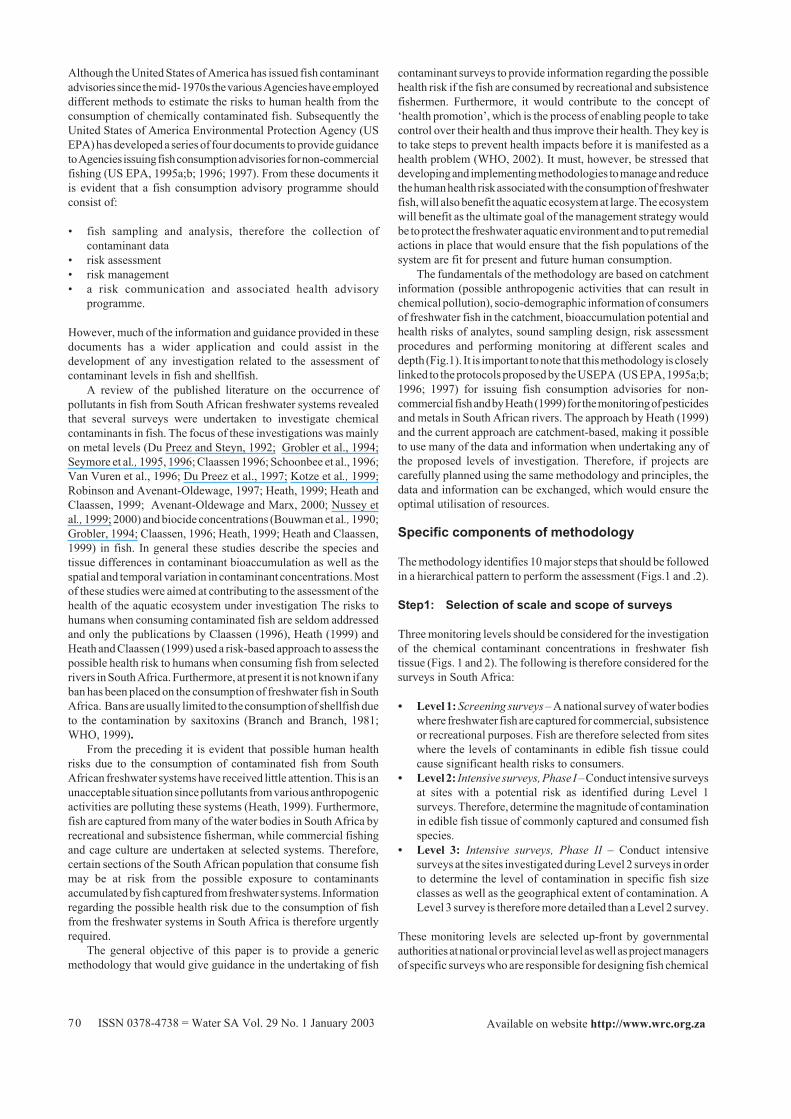
Abstract
Studies have shown that the aquatic environment can be polluted by contaminates that are accumulated by freshwater fish and thismay pose a health risk to the consumers of the contaminated fish. Developed counties like the United States of America havedeveloped strategies and associated guidance documentation to conduct chemical contaminant surveys using fish and to use thesedata to reduce the heath risk to the consumers of the fish. In this paper a generic methodology is presented that will give guidancein the undertaking of fish contaminant surveys to provide information regarding the possible health risk if the fish are consumedby recreational and subsistence fishermen in South Africa. The fundamentals of the methodology are based on catchmentinformation, socio-demographic information of consumers of fish in the catchment, bioaccumulation potential and health risks ofanalytes, sound sampling design, risk assessment procedures and performing monitoring at different scales and depths. Theseaspects are presented as 10 major steps in the methodology of which the basic requirements are discussed to focus the surveys andoptimise the application of resources. Although the methodology focuses on assessing the possible health risk to the consumers offish many of the aspects would apply to any investigation aimed at assessing the chemical contaminant levels in fish. Furthermoreas these surveys identify areas in the aquatic system where fish have unacceptably high chemical contaminant levels, thisinformation can be used in catchment management programmes to put remedial actions in place that would ensure that the fishpopulations of the system are fit for present and future human consumption.
Introduction
Pollution of the aquatic environment is one of the worst legacies ofdevelopment of the 20th century. It is well documented that modernagriculture, industrialisation and urbanisation have negativelyaffected environmental quality and specifically aquatic systems(Förstner and Wittmann, 1983; Hellawell, 1986; Ellis, 1989;Mason, 1991; Dallas and Day, 1993; Johnson, 1996). In SouthAfrica the pollution of freshwater aquatic systems can be linked topoint-source discharges (waste water treatment works and industrialeffluents) and diffuse surface runoff (agricultural, mining andurban). As a result of these anthropogenic activities, innocentpeople as well as other life forms may be exposed to harmfulcontaminants which may be released without adequate considerationof human health and the environmental effects (Tchounwou et al.,1996).
Effects on human health as a result of exposure to surface watercontaminants can occur through contact recreation, drinking waterand the consumption of contaminated food for example, fish andshellfish (US EPA, 1991). During contact recreation dermalabsorption and incidental ingestion may pose a potential healthrisk. Drinking water poses a very high health risk; however, the riskcan be reduced by effective treatment and by applying drinkingwater criteria. People consuming fish or shellfish are potentially atrisk as these organisms have the potential to bioaccumulate harmful
contaminants from the aquatic environment (US EPA, 1991;Bevelhimer, 1995). The contaminants that have been bio-accumulated by the fish or shellfish pose carcinogenic, genotoxicand non-carcinogenic health risks to consumers (Reinert et al.,1991; US EPA, 1991). However, it must be stressed that theconsumption of fish is generally beneficial as it provides a goodsource of protein, vitamins, omega fatty acids and basic minerals(Anderson et al., 1972; Zabik et al., 1995; US EPA, 1997).Additional benefits of consuming fish include a decrease incardiovascular disease, a reduction in blood pressure in individuals,reduced colon and breast cancer risks, a decrease in pain fromarthritis and a decrease in asthma attacks in asthmatics (US EPA,1997). From the preceding it is evident that the consumption of fishis beneficial to humans, but if these fish are contaminated they posea health risk to consumers.
As a result of the potential health risk associated with theconsumption of chemically contaminated non-commercially caughtfish, the United States of America has been issuing fish consumptionadvisories and bans (US EPA, 1995a;b; 1996; 1997; 1999). Fishconsumption advisories are designed to reduce the risk to fishconsumers by providing information that would lead to the voluntaryrestriction of fish consumption to levels that pose limited, if anyrisk. A fishing ban, on the other hand, involves the banning of theconsumption of fish by closing water bodies for fishing and/orbanning the possession of contaminated fish. Fish consumptionadvisories not only aim to minimise the health risk to the consumersof fish but also intend to minimise the negative effects of restrictingconsumption and fishing (US EPA, 1997).
* To whom all correspondence should be addressed.(016) 4215150; fax (016) 4552055; e-mail: [email protected]
Received 28 March 2002; accepted in revised form 15 October 2002.
ISSN 0378-4738 = Water SA Vol. 29 No. 1 January 200370 Available on website http://www.wrc.org.za
Although the United States of America has issued fish contaminantadvisories since the mid- 1970s the various Agencies have employeddifferent methods to estimate the risks to human health from theconsumption of chemically contaminated fish. Subsequently theUnited States of America Environmental Protection Agency (USEPA) has developed a series of four documents to provide guidanceto Agencies issuing fish consumption advisories for non-commercialfishing (US EPA, 1995a;b; 1996; 1997). From these documents itis evident that a fish consumption advisory programme shouldconsist of:
• fish sampling and analysis, therefore the collection ofcontaminant data
• risk assessment• risk management• a risk communication and associated health advisory
programme.
However, much of the information and guidance provided in thesedocuments has a wider application and could assist in thedevelopment of any investigation related to the assessment ofcontaminant levels in fish and shellfish.
A review of the published literature on the occurrence ofpollutants in fish from South African freshwater systems revealedthat several surveys were undertaken to investigate chemicalcontaminants in fish. The focus of these investigations was mainlyon metal levels (Du Preez and Steyn, 1992; Grobler et al., 1994;Seymore et al., 1995, 1996; Claassen 1996; Schoonbee et al., 1996;Van Vuren et al., 1996; Du Preez et al., 1997; Kotze et al., 1999;Robinson and Avenant-Oldewage, 1997; Heath, 1999; Heath andClaassen, 1999; Avenant-Oldewage and Marx, 2000; Nussey etal., 1999; 2000) and biocide concentrations (Bouwman et al., 1990;Grobler, 1994; Claassen, 1996; Heath, 1999; Heath and Claassen,1999) in fish. In general these studies describe the species andtissue differences in contaminant bioaccumulation as well as thespatial and temporal variation in contaminant concentrations. Mostof these studies were aimed at contributing to the assessment of thehealth of the aquatic ecosystem under investigation The risks tohumans when consuming contaminated fish are seldom addressedand only the publications by Claassen (1996), Heath (1999) andHeath and Claassen (1999) used a risk-based approach to assess thepossible health risk to humans when consuming fish from selectedrivers in South Africa. Furthermore, at present it is not known if anyban has been placed on the consumption of freshwater fish in SouthAfrica. Bans are usually limited to the consumption of shellfish dueto the contamination by saxitoxins (Branch and Branch, 1981;WHO, 1999).
From the preceding it is evident that possible human healthrisks due to the consumption of contaminated fish from SouthAfrican freshwater systems have received little attention. This is anunacceptable situation since pollutants from various anthropogenicactivities are polluting these systems (Heath, 1999). Furthermore,fish are captured from many of the water bodies in South Africa byrecreational and subsistence fisherman, while commercial fishingand cage culture are undertaken at selected systems. Therefore,certain sections of the South African population that consume fishmay be at risk from the possible exposure to contaminantsaccumulated by fish captured from freshwater systems. Informationregarding the possible health risk due to the consumption of fishfrom the freshwater systems in South Africa is therefore urgentlyrequired.
The general objective of this paper is to provide a genericmethodology that would give guidance in the undertaking of fish
contaminant surveys to provide information regarding the possiblehealth risk if the fish are consumed by recreational and subsistencefishermen. Furthermore, it would contribute to the concept of‘health promotion’, which is the process of enabling people to takecontrol over their health and thus improve their health. They key isto take steps to prevent health impacts before it is manifested as ahealth problem (WHO, 2002). It must, however, be stressed thatdeveloping and implementing methodologies to manage and reducethe human health risk associated with the consumption of freshwaterfish, will also benefit the aquatic ecosystem at large. The ecosystemwill benefit as the ultimate goal of the management strategy wouldbe to protect the freshwater aquatic environment and to put remedialactions in place that would ensure that the fish populations of thesystem are fit for present and future human consumption.
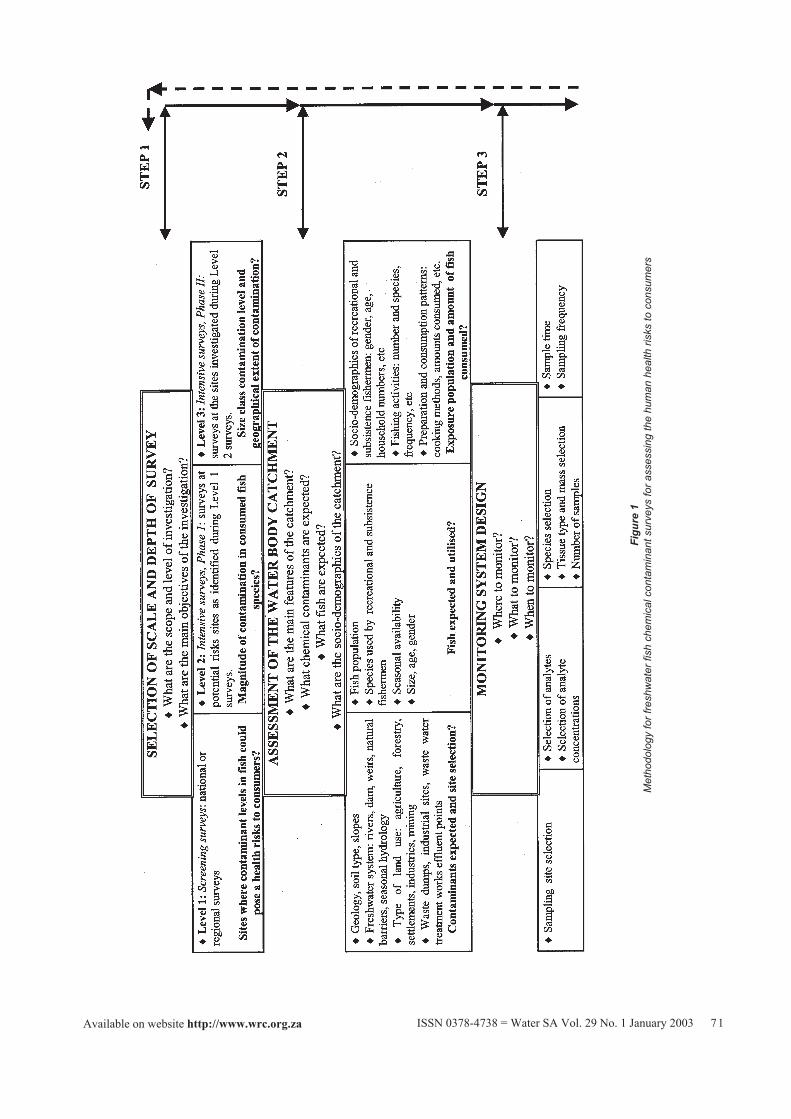
The fundamentals of the methodology are based on catchmentinformation (possible anthropogenic activities that can result inchemical pollution), socio-demographic information of consumersof freshwater fish in the catchment, bioaccumulation potential andhealth risks of analytes, sound sampling design, risk assessmentprocedures and performing monitoring at different scales anddepth (Fig.1). It is important to note that this methodology is closelylinked to the protocols proposed by the USEPA (US EPA, 1995a;b;1996; 1997) for issuing fish consumption advisories for non-commercial fish and by Heath (1999) for the monitoring of pesticidesand metals in South African rivers. The approach by Heath (1999)and the current approach are catchment-based, making it possibleto use many of the data and information when undertaking any ofthe proposed levels of investigation. Therefore, if projects arecarefully planned using the same methodology and principles, thedata and information can be exchanged, which would ensure theoptimal utilisation of resources.
Specific components of methodology
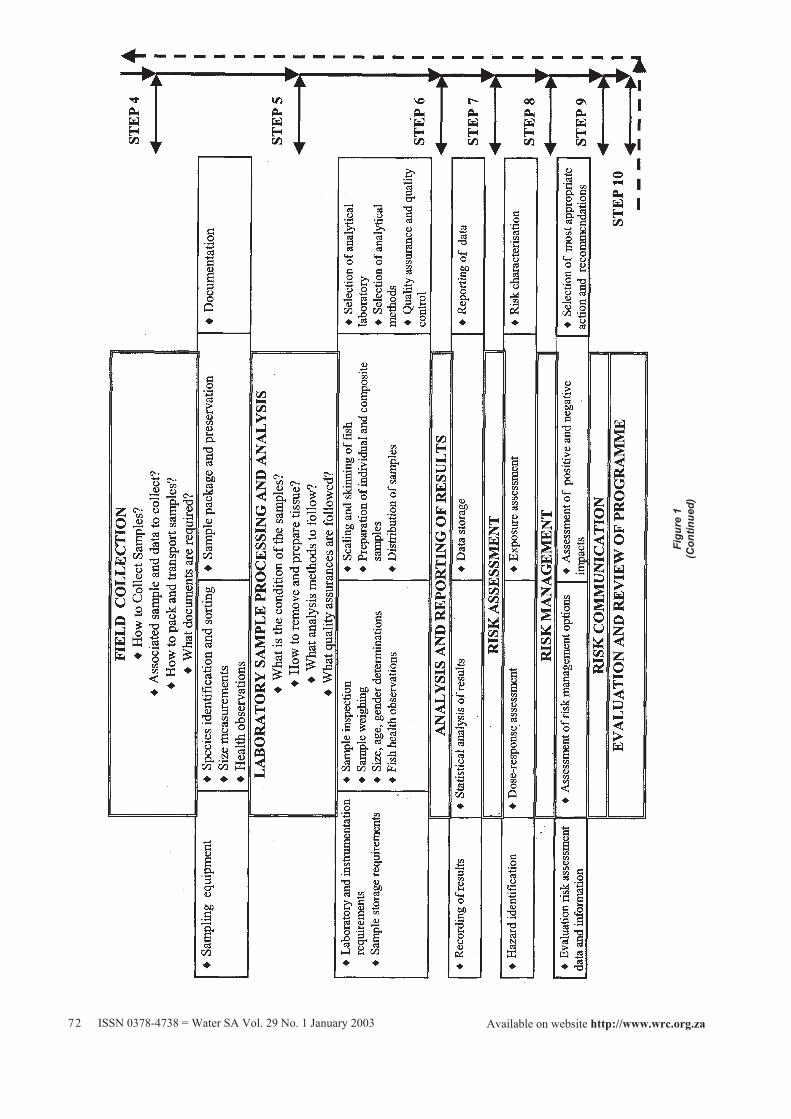
The methodology identifies 10 major steps that should be followedin a hierarchical pattern to perform the assessment (Figs.1 and .2).
Step1: Selection of scale and scope of surveys
Three monitoring levels should be considered for the investigationof the chemical contaminant concentrations in freshwater fishtissue (Figs. 1 and 2). The following is therefore considered for thesurveys in South Africa:
• Level 1: Screening surveys – A national survey of water bodieswhere freshwater fish are captured for commercial, subsistenceor recreational purposes. Fish are therefore selected from siteswhere the levels of contaminants in edible fish tissue couldcause significant health risks to consumers.
• Level 2: Intensive surveys, Phase I – Conduct intensive surveysat sites with a potential risk as identified during Level 1surveys. Therefore, determine the magnitude of contaminationin edible fish tissue of commonly captured and consumed fishspecies.
• Level 3: Intensive surveys, Phase II – Conduct intensivesurveys at the sites investigated during Level 2 surveys in orderto determine the level of contamination in specific fish sizeclasses as well as the geographical extent of contamination. ALevel 3 survey is therefore more detailed than a Level 2 survey.
These monitoring levels are selected up-front by governmentalauthorities at national or provincial level as well as project managersof specific surveys who are responsible for designing fish chemical
ISSN 0378-4738 = Water SA Vol. 29 No. 1 January 2003 71Available on website http://www.wrc.org.za
Figu
re 1
Met
hodo
logy
for f
resh
wat
er fi
sh c
hem
ical
con
tam
inan
t sur
veys
for a
sses
sing
the
hum
an h
ealth
risk
s to
con
sum
ers
ISSN 0378-4738 = Water SA Vol. 29 No. 1 January 200372 Available on website http://www.wrc.org.za
Figu
re 1
(Con
tinue
d)
ISSN 0378-4738 = Water SA Vol. 29 No. 1 January 2003 73Available on website http://www.wrc.org.za
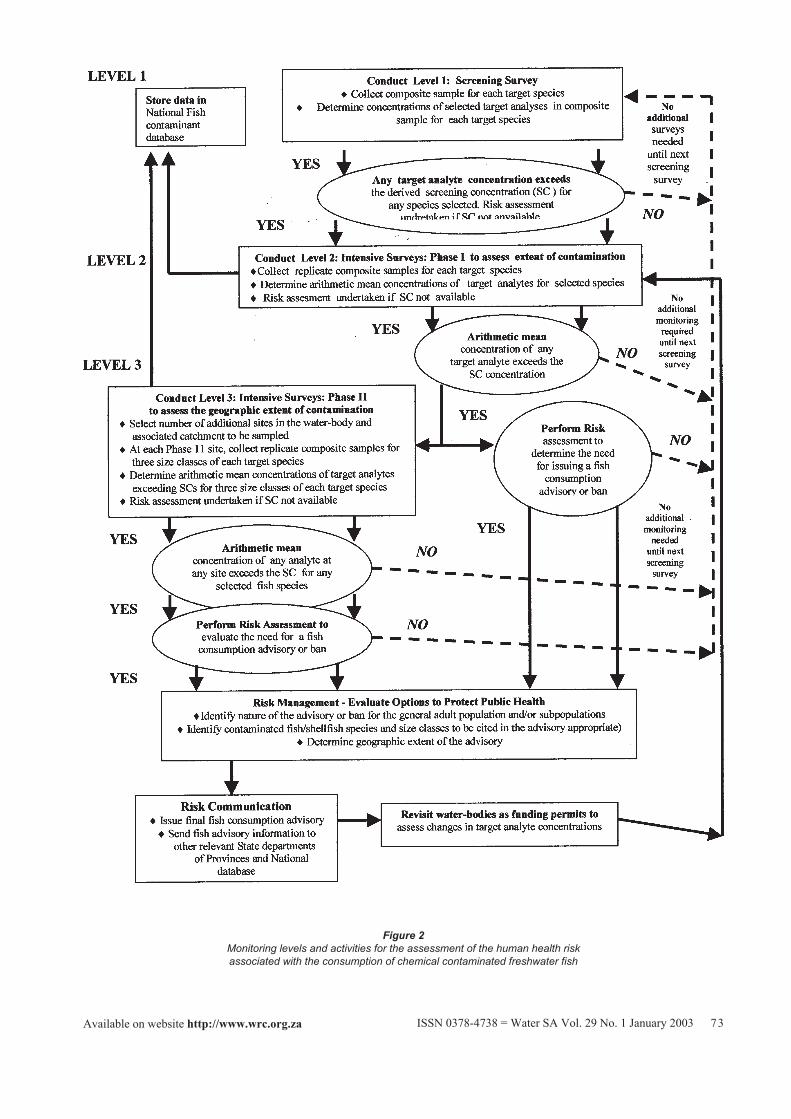
Figure 2Monitoring levels and activities for the assessment of the human health riskassociated with the consumption of chemical contaminated freshwater fish
ISSN 0378-4738 = Water SA Vol. 29 No. 1 January 200374 Available on website http://www.wrc.org.za
contaminant surveys (Fig. 1). It is also importantto note that these surveys are interlinked andnaturally flow from the one to the next (Fig. 2).To be cost- effective these levels should beapplied in a hierarchical manner as indicated inFig. 2.
Step 2: Assessment of water bodycatchment
The water body catchment should be assessed inorder to determine the processes that drive anddetermine the water quality in the catchment.The general catchment characteristics (soil typetopography, rainfall, hydrology, land-usepatterns, vegetation, etc.), anthropogenicactivities and potential pollution sources aredescribed and assessed (Fig. 1). Modellingtechniques (for example GIS models, pesticiderunoff models, effluent dispersal models, etc.)would also aid in identifying possible problemareas and possible pollution sources (Heath,1999).
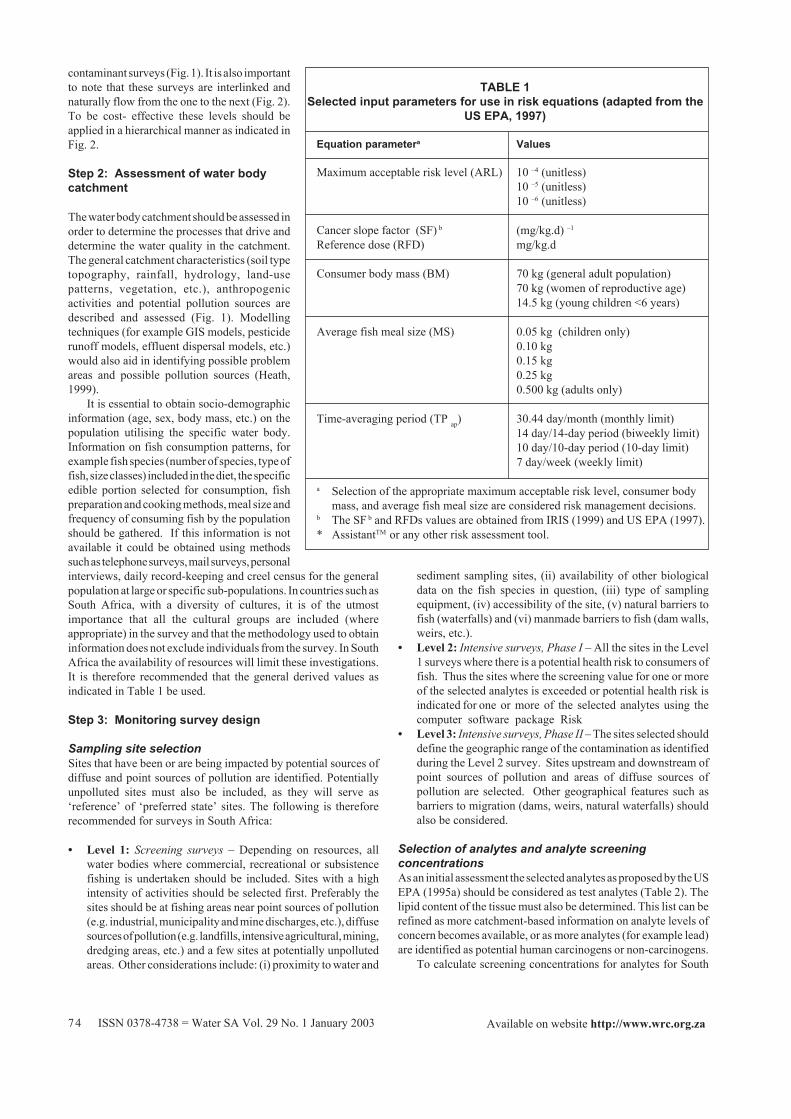
It is essential to obtain socio-demographicinformation (age, sex, body mass, etc.) on thepopulation utilising the specific water body.Information on fish consumption patterns, forexample fish species (number of species, type offish, size classes) included in the diet, the specificedible portion selected for consumption, fishpreparation and cooking methods, meal size andfrequency of consuming fish by the populationshould be gathered. If this information is notavailable it could be obtained using methodssuch as telephone surveys, mail surveys, personalinterviews, daily record-keeping and creel census for the generalpopulation at large or specific sub-populations. In countries such asSouth Africa, with a diversity of cultures, it is of the utmostimportance that all the cultural groups are included (whereappropriate) in the survey and that the methodology used to obtaininformation does not exclude individuals from the survey. In SouthAfrica the availability of resources will limit these investigations.It is therefore recommended that the general derived values asindicated in Table 1 be used.
Step 3: Monitoring survey design
Sampling site selectionSites that have been or are being impacted by potential sources ofdiffuse and point sources of pollution are identified. Potentiallyunpolluted sites must also be included, as they will serve as‘reference’ of ‘preferred state’ sites. The following is thereforerecommended for surveys in South Africa:
• Level 1: Screening surveys – Depending on resources, allwater bodies where commercial, recreational or subsistencefishing is undertaken should be included. Sites with a highintensity of activities should be selected first. Preferably thesites should be at fishing areas near point sources of pollution(e.g. industrial, municipality and mine discharges, etc.), diffusesources of pollution (e.g. landfills, intensive agricultural, mining,dredging areas, etc.) and a few sites at potentially unpollutedareas. Other considerations include: (i) proximity to water and
sediment sampling sites, (ii) availability of other biologicaldata on the fish species in question, (iii) type of samplingequipment, (iv) accessibility of the site, (v) natural barriers tofish (waterfalls) and (vi) manmade barriers to fish (dam walls,weirs, etc.).
• Level 2: Intensive surveys, Phase I – All the sites in the Level1 surveys where there is a potential health risk to consumers offish. Thus the sites where the screening value for one or moreof the selected analytes is exceeded or potential health risk isindicated for one or more of the selected analytes using thecomputer software package Risk
• Level 3: Intensive surveys, Phase II – The sites selected shoulddefine the geographic range of the contamination as identifiedduring the Level 2 survey. Sites upstream and downstream ofpoint sources of pollution and areas of diffuse sources ofpollution are selected. Other geographical features such asbarriers to migration (dams, weirs, natural waterfalls) shouldalso be considered.
Selection of analytes and analyte screeningconcentrationsAs an initial assessment the selected analytes as proposed by the USEPA (1995a) should be considered as test analytes (Table 2). Thelipid content of the tissue must also be determined. This list can berefined as more catchment-based information on analyte levels ofconcern becomes available, or as more analytes (for example lead)are identified as potential human carcinogens or non-carcinogens.
To calculate screening concentrations for analytes for South
TABLE 1Selected input parameters for use in risk equations (adapted from the
US EPA, 1997)
Equation parametera Values
Maximum acceptable risk level (ARL) 10 –4 (unitless)10 –5 (unitless)10 –6 (unitless)
Cancer slope factor (SF) b (mg/kg.d) –1
Reference dose (RFD) mg/kg.d
Consumer body mass (BM) 70 kg (general adult population)70 kg (women of reproductive age)14.5 kg (young children <6 years)
Average fish meal size (MS) 0.05 kg (children only)0.10 kg0.15 kg0.25 kg0.500 kg (adults only)
Time-averaging period (TP ap) 30.44 day/month (monthly limit)14 day/14-day period (biweekly limit)10 day/10-day period (10-day limit)7 day/week (weekly limit)
a Selection of the appropriate maximum acceptable risk level, consumer bodymass, and average fish meal size are considered risk management decisions.
b The SF b and RFDs values are obtained from IRIS (1999) and US EPA (1997).* AssistantTM or any other risk assessment tool.
ISSN 0378-4738 = Water SA Vol. 29 No. 1 January 2003 75Available on website http://www.wrc.org.za
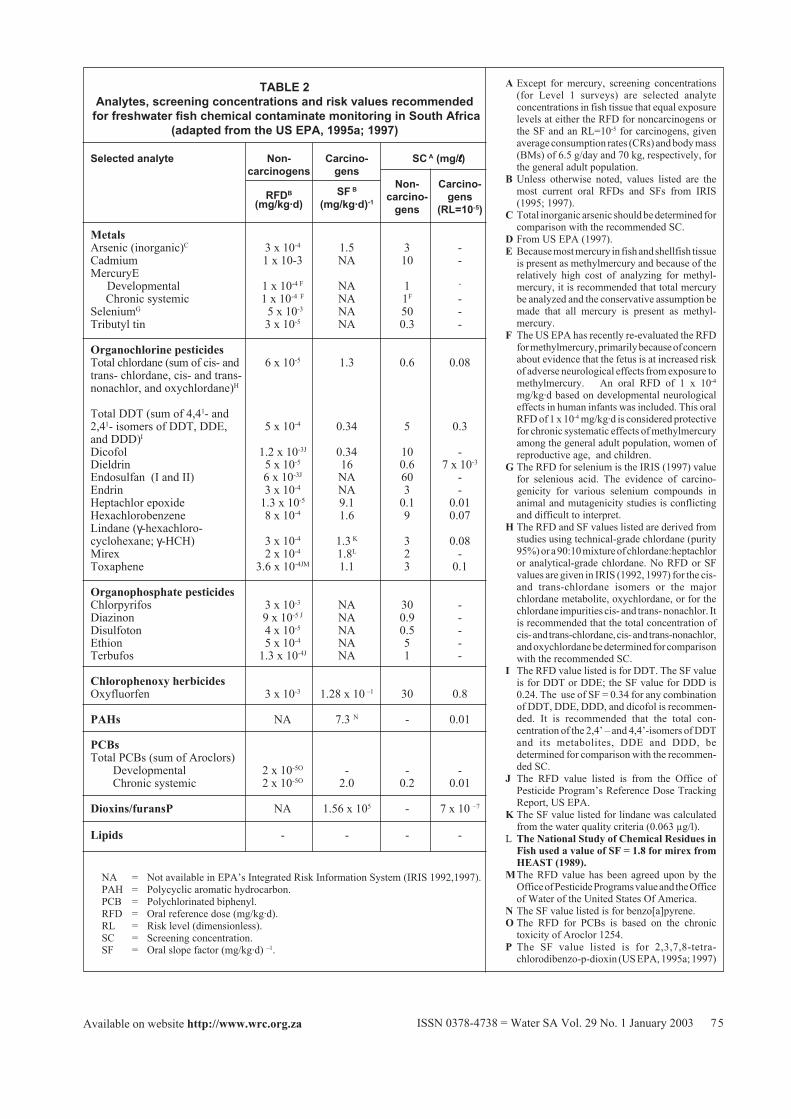
TABLE 2Analytes, screening concentrations and risk values recommended
for freshwater fish chemical contaminate monitoring in South Africa(adapted from the US EPA, 1995a; 1997)
Selected analyte Non- Carcino- SC A (mg/lllll)carcinogens gens
RFDB SF B Non- Carcino-
(mg/kg·d) (mg/kg·d)-1 carcino- gensgens (RL=10-5)
MetalsArsenic (inorganic)C 3 x 10⁻⁴ 1.5 3 -Cadmium 1 x 10⁻³ NA 10 -MercuryE
Developmental 1 x 10⁻⁴ F NA 1 -
Chronic systemic 1 x 10⁻⁴ F NA 1F -SeleniumG 5 x 10⁻³ NA 50 -Tributyl tin 3 x 10⁻⁵ NA 0.3 -
Organochlorine pesticidesTotal chlordane (sum of cis- and 6 x 10⁻⁵ 1.3 0.6 0.08trans- chlordane, cis- and trans-nonachlor, and oxychlordane)H
Total DDT (sum of 4,41- and2,41- isomers of DDT, DDE, 5 x 10⁻⁴ 0.34 5 0.3and DDD)I
Dicofol 1.2 x 10⁻³J 0.34 10 -Dieldrin 5 x 10⁻⁵ 16 0.6 7 x 10⁻³
Endosulfan (I and II) 6 x 10⁻³J NA 60 -Endrin 3 x 10⁻⁴ NA 3 -Heptachlor epoxide 1.3 x 10⁻⁵ 9.1 0.1 0.01Hexachlorobenzene 8 x 10⁻⁴ 1.6 9 0.07Lindane (γ-hexachloro-cyclohexane; γ-HCH) 3 x 10⁻⁴ 1.3 K 3 0.08Mirex 2 x 10⁻⁴ 1.8L 2 -Toxaphene 3.6 x 10⁻⁴JM 1.1 3 0.1
Organophosphate pesticidesChlorpyrifos 3 x 10⁻³ NA 30 -Diazinon 9 x 10⁻⁵ J NA 0.9 -Disulfoton 4 x 10⁻⁵ NA 0.5 -Ethion 5 x 10⁻⁴ NA 5 -Terbufos 1.3 x 10⁻⁴J NA 1 -
Chlorophenoxy herbicidesOxyfluorfen 3 x 10⁻³ 1.28 x 10 –1 30 0.8
PAHs NA 7.3 N - 0.01
PCBsTotal PCBs (sum of Aroclors)
Developmental 2 x 10⁻⁵O - - - Chronic systemic 2 x 10⁻⁵O 2.0 0.2 0.01
Dioxins/furansP NA 1.56 x 10⁵ - 7 x 10 –7
Lipids - - - -
NA = Not available in EPA’s Integrated Risk Information System (IRIS 1992,1997).PAH = Polycyclic aromatic hydrocarbon.PCB = Polychlorinated biphenyl.RFD = Oral reference dose (mg/kg·d).RL = Risk level (dimensionless).SC = Screening concentration.SF = Oral slope factor (mg/kg·d) –1.
A Except for mercury, screening concentrations(for Level 1 surveys) are selected analyteconcentrations in fish tissue that equal exposurelevels at either the RFD for noncarcinogens orthe SF and an RL=10-5 for carcinogens, givenaverage consumption rates (CRs) and body mass(BMs) of 6.5 g/day and 70 kg, respectively, forthe general adult population.
B Unless otherwise noted, values listed are themost current oral RFDs and SFs from IRIS(1995; 1997).
C Total inorganic arsenic should be determined forcomparison with the recommended SC.
D From US EPA (1997).E Because most mercury in fish and shellfish tissue
is present as methylmercury and because of therelatively high cost of analyzing for methyl-mercury, it is recommended that total mercurybe analyzed and the conservative assumption bemade that all mercury is present as methyl-mercury.
F The US EPA has recently re-evaluated the RFDfor methylmercury, primarily because of concernabout evidence that the fetus is at increased riskof adverse neurological effects from exposure tomethylmercury. An oral RFD of 1 x 10⁻⁴
mg/kg·d based on developmental neurologicaleffects in human infants was included. This oralRFD of 1 x 10⁻⁴ mg/kg·d is considered protectivefor chronic systematic effects of methylmercuryamong the general adult population, women ofreproductive age, and children.
G The RFD for selenium is the IRIS (1997) valuefor selenious acid. The evidence of carcino-genicity for various selenium compounds inanimal and mutagenicity studies is conflictingand difficult to interpret.
H The RFD and SF values listed are derived fromstudies using technical-grade chlordane (purity95%) or a 90:10 mixture of chlordane:heptachloror analytical-grade chlordane. No RFD or SFvalues are given in IRIS (1992, 1997) for the cis-and trans-chlordane isomers or the majorchlordane metabolite, oxychlordane, or for thechlordane impurities cis- and trans- nonachlor. Itis recommended that the total concentration ofcis- and trans-chlordane, cis- and trans-nonachlor,and oxychlordane be determined for comparisonwith the recommended SC.
I The RFD value listed is for DDT. The SF valueis for DDT or DDE; the SF value for DDD is0.24. The use of SF = 0.34 for any combinationof DDT, DDE, DDD, and dicofol is recommen-ded. It is recommended that the total con-centration of the 2,4’ – and 4,4’-isomers of DDTand its metabolites, DDE and DDD, bedetermined for comparison with the recommen-ded SC.
J The RFD value listed is from the Office ofPesticide Program’s Reference Dose TrackingReport, US EPA.
K The SF value listed for lindane was calculatedfrom the water quality criteria (0.063 µg/l).
L The National Study of Chemical Residues inFish used a value of SF = 1.8 for mirex fromHEAST (1989).
MThe RFD value has been agreed upon by theOffice of Pesticide Programs value and the Officeof Water of the United States Of America.
N The SF value listed is for benzo[a]pyrene.O The RFD for PCBs is based on the chronic
toxicity of Aroclor 1254.P The SF value listed is for 2,3,7,8-tetra-
chlorodibenzo-p-dioxin (US EPA, 1995a; 1997)
ISSN 0378-4738 = Water SA Vol. 29 No. 1 January 200376 Available on website http://www.wrc.org.za
Africa scenarios it is recommended that the procedure of the USEPA (1995a) be used. It is recommended that for South Africa thescreening concentrations for the selected analytes as listed in Table2 are used if data (for example on body mass and/or concentrationsrates etc) are not available to modify them or if resources are notavailable to derive local screening concentrations. Alternativelythe locally obtained chemical contaminant concentrations can beused in the Risk *AssistantTM software package (Risk *AssistantTM,1995) to calculate possible risks. However, this procedure can bemore costly. The following is therefore recommended for the SouthAfrican surveys:
• Level 1: Screening surveys – Monitor for the relevant selectedanalytes as listed in Table 2. Refine the list as more catchment-based analyte concentrations and/or information or additionaltoxicological data for other analytes become available. Use thescreening values as listed in Table 2 and adapt these values asmore information regarding the local population becomes
available. Alternatively, use the obtained chemical contaminantconcentrations directly in the Risk *AssistantTM softwarepackage.
• Level 2: Intensive surveys, Phase I – Monitor the selectedanalytes that exceed the screening concentration. Chemicalcontaminant concentrations just below or at the screeningconcentration should be re-assed to determine if they must befurther monitored. The same screening concentrations as inLevel 1 surveys are used and are only modified if more localpopulation information becomes available. Alternatively usethe obtained chemical contaminant concentrations directly inthe Risk *AssistantTM software package.
• Level 3: Intensive surveys, Phase II: – The samerecommendations as for Level 2 surveys, but a broadergeographical area must be surveyed and different size classesof a specific specie are selected for evaluation. The obtainedchemical contaminant concentrations are directly applied inthe Risk *AssistantTM software package.
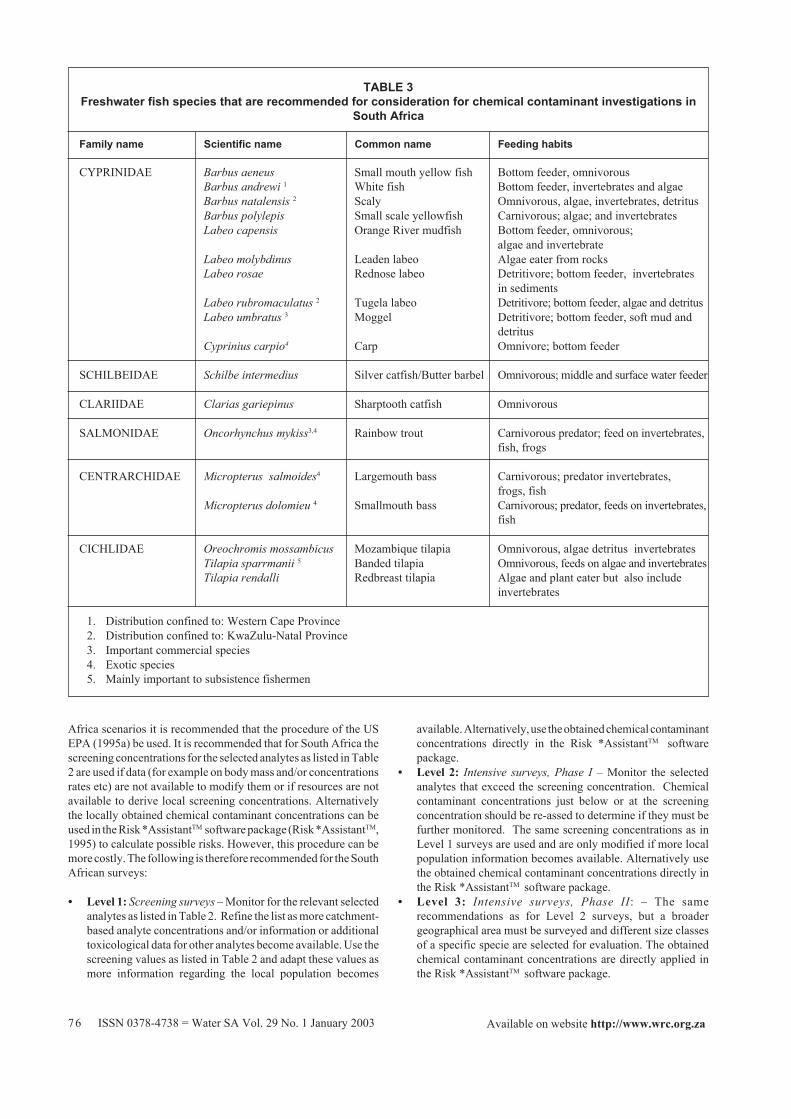
TABLE 3Freshwater fish species that are recommended for consideration for chemical contaminant investigations in
South Africa
Family name Scientific name Common name Feeding habits
CYPRINIDAE Barbus aeneus Small mouth yellow fish Bottom feeder, omnivorousBarbus andrewi 1 White fish Bottom feeder, invertebrates and algaeBarbus natalensis 2 Scaly Omnivorous, algae, invertebrates, detritusBarbus polylepis Small scale yellowfish Carnivorous; algae; and invertebratesLabeo capensis Orange River mudfish Bottom feeder, omnivorous;
algae and invertebrateLabeo molybdinus Leaden labeo Algae eater from rocksLabeo rosae Rednose labeo Detritivore; bottom feeder, invertebrates
in sedimentsLabeo rubromaculatus 2 Tugela labeo Detritivore; bottom feeder, algae and detritusLabeo umbratus 3 Moggel Detritivore; bottom feeder, soft mud and
detritusCyprinius carpio4 Carp Omnivore; bottom feeder
SCHILBEIDAE Schilbe intermedius Silver catfish/Butter barbel Omnivorous; middle and surface water feeder
CLARIIDAE Clarias gariepinus Sharptooth catfish Omnivorous
SALMONIDAE Oncorhynchus mykiss3,4 Rainbow trout Carnivorous predator; feed on invertebrates,fish, frogs
CENTRARCHIDAE Micropterus salmoides4 Largemouth bass Carnivorous; predator invertebrates,frogs, fish
Micropterus dolomieu 4 Smallmouth bass Carnivorous; predator, feeds on invertebrates,fish
CICHLIDAE Oreochromis mossambicus Mozambique tilapia Omnivorous, algae detritus invertebratesTilapia sparrmanii 5 Banded tilapia Omnivorous, feeds on algae and invertebratesTilapia rendalli Redbreast tilapia Algae and plant eater but also include
invertebrates
1. Distribution confined to: Western Cape Province2. Distribution confined to: KwaZulu-Natal Province3. Important commercial species4. Exotic species5. Mainly important to subsistence fishermen
ISSN 0378-4738 = Water SA Vol. 29 No. 1 January 2003 77Available on website http://www.wrc.org.za
Species selectionIdeally, species from two distinct ecological groups of fish (e.g.bottom feeders and predators) which occur over a wide geographicarea should be used. The fish species listed in Table 3 should givesome guidance for the selection of fish species for a specific region.The following is therefore recommended for surveys in SouthAfrica:
• Level 1: Screening surveys – At least one bottom feeder or onepredator species selected from the species in Table 3. Preferablyinclude one bottom feeder and one predator species. Focus onthe species that the people preferred eating
• Level 2: Intensive surveys, Phase I – Include the same speciesas for the Level 1 surveys but include more species if they arecaptured in sufficient numbers (see sections on size classselection and number of samples).
• Level 3: Intensive surveys, Phase II. – The same recommen-dation as for Level 2 surveys.
Size class selectionSome correlation between increasing size (age) of the fish andcontaminant concentration has been recorded. If the aim is to linka fish advisory to a specific fish size class while the other sizeclasses of the selected species remain open, then fish in specific sizeclasses must be analysed. The following is therefore recommended:
• Level 1: Screening surveys – If resources are limited, collectonly one size class for each of the selected species and focus onthe larger size class commonly consumed. Preferably collectindividuals from three size classes from the size rangescommonly consumed.
• Level 2: Intensive surveys, Phase I – Preferably collectindividuals from three size classes, but at least two (large andsmall) covering the exposure and consumption ranges. Selectmore size classes if more refinement in the relationship betweensize classes and advisories is required.
• Level 3: Intensive surveys, Phase II – The same as for Level 2:Phase I surveys.
Number of samplesIn South Africa factors such as the low abundance and availabilityof fish in some rivers and financial constraints may limit thenumber of samples collected. The following is thereforerecommended for surveys in South Africa:
• Level 1: Screening surveys – Collection of a composite sampleconsisting of eight individuals at each site. Preferably threereplicate composite samples, each consisting of eight individualat 10 % of the screening sites. The mean length (size) of theindividuals of the composite sample must not exceed 10%.Similarly the mean length of individuals in the compositesamples to be compared must not exceed 10%.
• Level 2: Intensive surveys, Phase I. – Collection of fivereplicate composite samples, each consisting of eightindividuals. As this would not be possible (due to small fishpopulations) for many of the rivers in South Africa, statisticalprocedures (as indicated) should be used to evaluate the statisticalsignificance of the decision.
• Level 3: Intensive surveys, Phase II. – The same recommen-dations as for Level 2 surveys.
Tissue type and mass selectionThe sample should consist of the portion of the fish that is
consumed by the population under investigation. For SouthAfrican conditions it is assumed that people usually gut the fish andthat fillets are consumed. The following is therefore recommended:
• Level 1: Screening surveys – A 200 g wet mass compositesample of edible-scaled skin-on or skinless (for fish withoutscales) fillets (including the belly flap) should be collected.Analyses of skinless fillets must be considered if the completehomogenisation of skin-on fillets is not achievable or if thelocal consumers only prepare skinless fillets. Each compositesample should consist of eight individual fish; therefore eachindividual should contribute 25 g wet mass to the composite. Alarger composite mass may be required if the number ofanalytes is increased or if the analytical procedures of thespecific laboratory require a larger tissue mass.
• Level 2: Intensive surveys, Phase 1 – The same as for Level 1surveys, but the mass can be reduced if the number of selectedanalytes of concern are reduced as a result of data obtainedduring Level 1 surveys.
• Level 3: Intensive surveys, Phase 11 – The samerecommendations as for Level 2 surveys.
Other tissues that may be considered include liver, body fat andgonads. However, muscle tissue should always be obtained foranalyses. In chemical contaminant surveys where the concentrationsof analytes in individual fish must be determined (not generallyrecommended) 25 individuals per size class must be selected.
Sampling time and sampling frequency
The sampling should not occur during the spawning season includingone month prior to and after spawning. The sampling frequencyshould be determined by the potential severity of the predictedhealth risk and the importance of the water body to recreational,subsistence and commercial fishing. The following sampling timeand frequency of sampling are therefore recommended for thesurveys in South Africa:
• Level 1: Screening surveys – Fish should preferably be collectedfrom March to May and from September to October. Note thatthe same species may spawn in September and October if rainsare early and the temperature is optimal. The frequency shouldbe three years but definitely every five years. However, ifpotentially high health risks are predicted and the fish populationis intensively fished, then annual screening of the specificwater body is advisable.
• Level 2: Intensive surveys, Phase I. – The period must be thesame as for the Level 1 surveys. The survey should beundertaken within one year of the Level 1 (screening survey)survey.
• Level 3: Intensive surveys, Phase II: – The general guidelinesfor a Level 2 survey should be followed. In many cases it wouldbe feasible and more cost-effective to combine Level 2 andLevel 3 surveys.
Step 4: Field collection
Sampling equipmentVarious fishing methods are available to collect freshwater fish.The methods employed will depend on the specific water body (forexample river or lake), the manpower and the equipment available.It is recommended that gill nets, seine nets and electro-fishing beused to obtain fish samples for South African water bodies.
ISSN 0378-4738 = Water SA Vol. 29 No. 1 January 200378 Available on website http://www.wrc.org.za
Species identification and sortingSpecies should be identified as soon as they are captured. Thepublications by Jubb (1967), Le Roux and Steyn (1968), Pienaar(1978) and Skelton (1993) should be used to identify South Africanfreshwater fish species.
After capture and depending on the circumstances the initiallyselected fish species can be transferred to a holding tank filledcontinuously with water from the site. Fish should, however, notbe kept in the holding tank for more than 3 h. Select only fish fromthe selected species of the required size which do not have damagedskin or fins.
Rinse selected fish in ambient water to remove any foreignmaterial from their body surface. A sharp blow on the skull withclean a wooden club or metal rod should stun large fish. Small fishmay be placed on ice to kill them humanely. Stunned fish are thengrouped and placed in clean holding trays to prevent contamination.Care should be taken not to stun too many fish at a time in the field,especially during summer, as rate of decay is rapid.
Size measurementsThe total body length (mm) of individual fish of the selected speciessample must be measured.
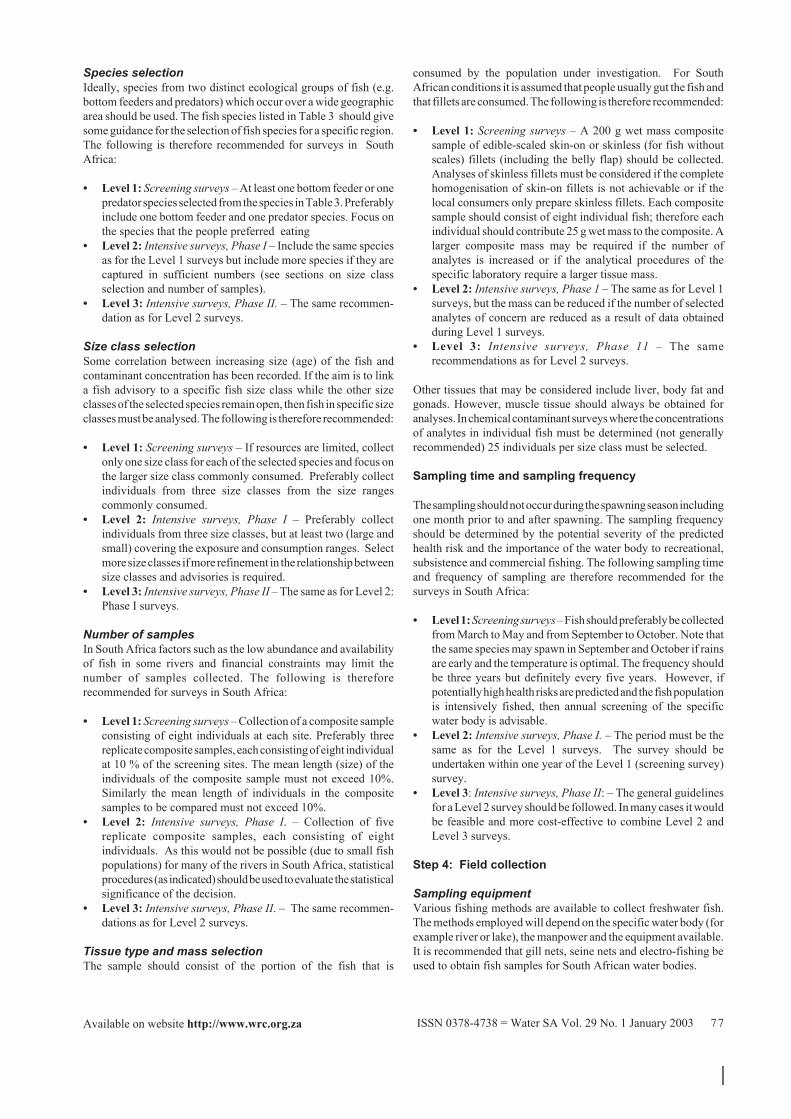
Fish health observationTo evaluate the health of the fish it may not be feasible to performa detailed health assessment as described by Adams et al., (1993),Avenant-Oldewage et al. (1995) and Avenant-Oldewage (2001).However, it is important to at least record gross morphologicalabnormalities and the body surface parasite load of the fish captured.Based on the Fish Health Assessment Index (FHAI) the followinghealth variables of the selected species should at least be evaluated:
• Condition of skin.• Condition of fins.• Condition of eyes.• Condition of opercula.• Condition of gills.• Number of ectoparasites.
TABLE 4Fish Health Assessment Index (FHAI) variables and assigned values[adapted from
Adams et al., (1993) and Robinson (1996)]
Variables Variable condition Scorevalue for
FHAI
Skin • Normal, no aberrations 0• Mild skin aberrations 10• Moderate skin aberrations 20• Severe skin aberrations 30
Fins • No active erosion or previous erosion healed over 0• Mild active erosion with no bleeding 10• Severe active erosion with haemorrhage/secondary infection 20
Eyes • Normal • No aberrations evident (good “clear” eyes) 0• Exopthalmia • Swollen, protruding eye 30• Hemorrhagic • Bleeding in the eye 30• Blind 30• Missing • Eye missing from the fish 30• Other • Any manifestations which do not “fit” the
above 30
Opercules • No shortening • Normal 0• Mild shortening 10• Severe shortening 20
Gills • Normal • No apparent aberration in gills 0• Frayed • Erosion of tips of gill lamellae: “ragged” look 30• Clubbed • Swelling of the tips of the gill lamellae 30• Marginate • Gill with a light discolored margin along the
distal end or tips of the lamellae of filament 30• Pale • Gills are definitely very light in color 30• Other • Any observation which does not fit above 30
Ectoparasites • No parasites observed 0• 1 – 10 parasites 10• 11 – 20 parasites 20• > 20 parasites 30
ISSN 0378-4738 = Water SA Vol. 29 No. 1 January 2003 79Available on website http://www.wrc.org.za
A description of these variables and the associated sources is givenin Table 4. The health of the fish can then be calculated as follows:
FHAI(fish)= S+F+E+O+G+P
where :S = skinF = finsE = eyesO = operculaG = gillsP = external parasites.
The FHAI for a specific species is calculated as follows:
FHAI(Species A) = median (FHAI(fish 1, species A), FHAI(fish 2, species A),……FHAI(fish n, species A))
where:n = the number of fish sampled of a specific species.
The FHAI for a site (FHAI(site)) is then calculated as the median ofall the individual species FHAI.
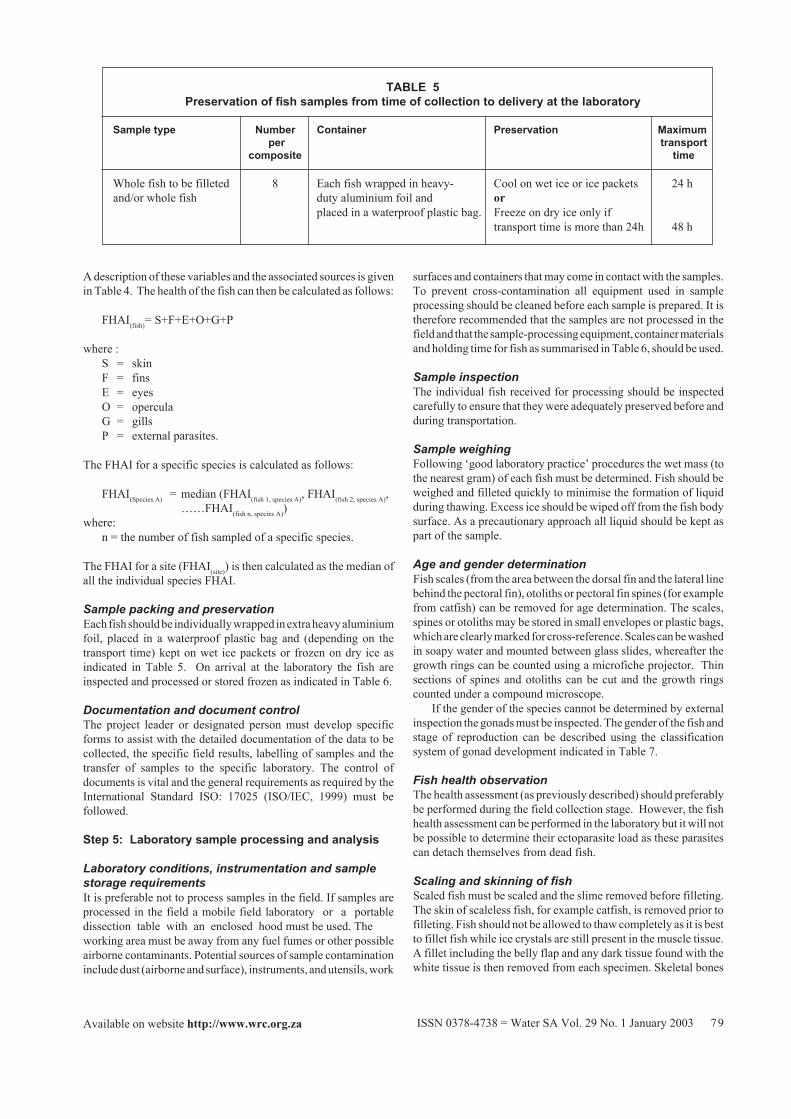
Sample packing and preservationEach fish should be individually wrapped in extra heavy aluminiumfoil, placed in a waterproof plastic bag and (depending on thetransport time) kept on wet ice packets or frozen on dry ice asindicated in Table 5. On arrival at the laboratory the fish areinspected and processed or stored frozen as indicated in Table 6.
Documentation and document controlThe project leader or designated person must develop specificforms to assist with the detailed documentation of the data to becollected, the specific field results, labelling of samples and thetransfer of samples to the specific laboratory. The control ofdocuments is vital and the general requirements as required by theInternational Standard ISO: 17025 (ISO/IEC, 1999) must befollowed.
Step 5: Laboratory sample processing and analysis
Laboratory conditions, instrumentation and samplestorage requirementsIt is preferable not to process samples in the field. If samples areprocessed in the field a mobile field laboratory or a portabledissection table with an enclosed hood must be used. Theworking area must be away from any fuel fumes or other possibleairborne contaminants. Potential sources of sample contaminationinclude dust (airborne and surface), instruments, and utensils, work
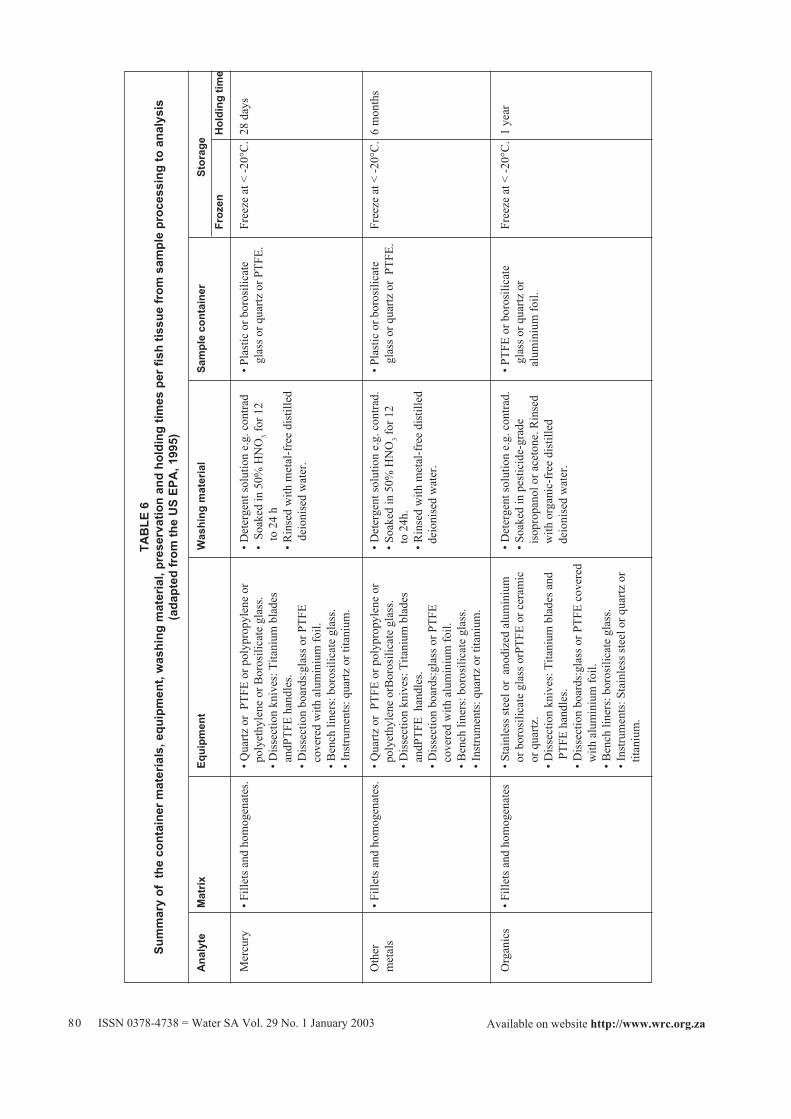
surfaces and containers that may come in contact with the samples.To prevent cross-contamination all equipment used in sampleprocessing should be cleaned before each sample is prepared. It istherefore recommended that the samples are not processed in thefield and that the sample-processing equipment, container materialsand holding time for fish as summarised in Table 6, should be used.
Sample inspectionThe individual fish received for processing should be inspectedcarefully to ensure that they were adequately preserved before andduring transportation.
Sample weighingFollowing ‘good laboratory practice’ procedures the wet mass (tothe nearest gram) of each fish must be determined. Fish should beweighed and filleted quickly to minimise the formation of liquidduring thawing. Excess ice should be wiped off from the fish bodysurface. As a precautionary approach all liquid should be kept aspart of the sample.
Age and gender determinationFish scales (from the area between the dorsal fin and the lateral linebehind the pectoral fin), otoliths or pectoral fin spines (for examplefrom catfish) can be removed for age determination. The scales,spines or otoliths may be stored in small envelopes or plastic bags,which are clearly marked for cross-reference. Scales can be washedin soapy water and mounted between glass slides, whereafter thegrowth rings can be counted using a microfiche projector. Thinsections of spines and otoliths can be cut and the growth ringscounted under a compound microscope.
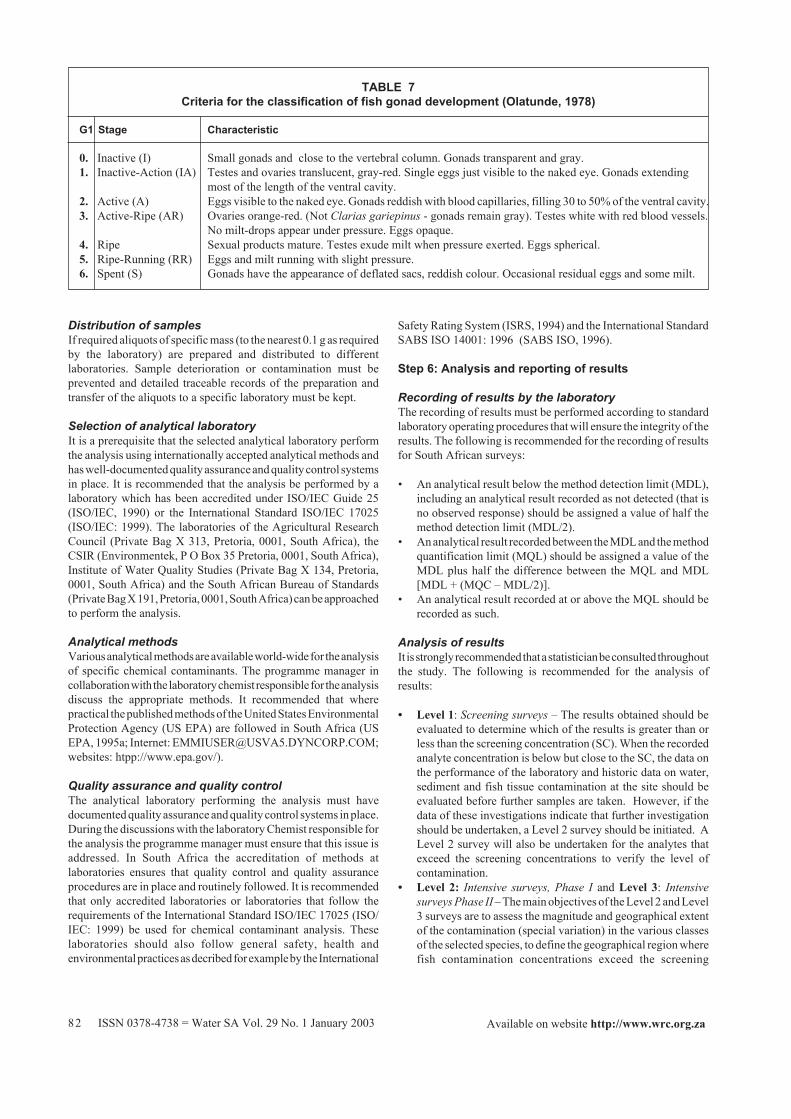
If the gender of the species cannot be determined by externalinspection the gonads must be inspected. The gender of the fish andstage of reproduction can be described using the classificationsystem of gonad development indicated in Table 7.
Fish health observationThe health assessment (as previously described) should preferablybe performed during the field collection stage. However, the fishhealth assessment can be performed in the laboratory but it will notbe possible to determine their ectoparasite load as these parasitescan detach themselves from dead fish.
Scaling and skinning of fishScaled fish must be scaled and the slime removed before filleting.The skin of scaleless fish, for example catfish, is removed prior tofilleting. Fish should not be allowed to thaw completely as it is bestto fillet fish while ice crystals are still present in the muscle tissue.A fillet including the belly flap and any dark tissue found with thewhite tissue is then removed from each specimen. Skeletal bones
TABLE 5Preservation of fish samples from time of collection to delivery at the laboratory
Sample type Number Container Preservation Maximum per transport
composite time
Whole fish to be filleted 8 Each fish wrapped in heavy- Cool on wet ice or ice packets 24 hand/or whole fish duty aluminium foil and or
placed in a waterproof plastic bag. Freeze on dry ice only iftransport time is more than 24h 48 h
ISSN 0378-4738 = Water SA Vol. 29 No. 1 January 200380 Available on website http://www.wrc.org.za
TAB
LE 6
Sum
mar
y of
the
con
tain
er m
ater
ials
, equ
ipm
ent,
was
hing
mat
eria
l, pr
eser
vatio
n an
d ho
ldin
g tim
es p
er fi
sh ti
ssue
from
sam
ple
proc
essi
ng to
ana
lysi
s(a
dapt
ed fr
om th
e U
S EP
A, 1
995)
Ana
lyte
Mat
rixEq
uipm
ent
Was
hing
mat
eria
lSa
mpl
e co
ntai
ner
Stor
age
Froz
enH
oldi
ng ti
me
Mer
cury
• Fill
ets a
nd h
omog
enat
es.
• Qua
rtz o
r PT
FE o
r pol
ypro
pyle
ne o
r• D
eter
gent
solu
tion
e.g.
con
trad
• Pla
stic
or b
oros
ilica
teFr
eeze
at <
-20°
C.
28 d
ays
pol
yeth
ylen
e or
Bor
osili
cate
gla
ss.
• So
aked
in 5
0% H
NO
3 for
12
gl
ass o
r qua
rtz o
r PTF
E.• D
isse
ctio
n kn
ives
: Tita
nium
bla
des
to
24
h a
ndPT
FE h
andl
es.
• Rin
sed
with
met
al-f
ree
dist
illed
• Dis
sect
ion
boar
ds:g
lass
or P
TFE
de
ioni
sed
wat
er.
cov
ered
with
alu
min
ium
foil.
• Ben
ch li
ners
: bor
osili
cate
gla
ss.
• Ins
trum
ents
: qua
rtz o
r tita
nium
.
Oth
er• F
illet
s and
hom
ogen
ates
.• Q
uartz
or
PTFE
or p
olyp
ropy
lene
or
• Det
erge
nt so
lutio
n e.
g. c
ontra
d.• P
last
ic o
r bor
osili
cate
Free
ze a
t < -2
0°C
.6
mon
ths
met
als
pol
yeth
ylen
e or
Bor
osili
cate
gla
ss.
• Soa
ked
in 5
0% H
NO
3 for
12
gl
ass o
r qua
rtz o
r PT
FE.
• Dis
sect
ion
kniv
es: T
itani
um b
lade
s t
o 24
h. a
ndPT
FE h
andl
es.
• Rin
sed
with
met
al-f
ree
dist
illed
• Dis
sect
ion
boar
ds:g
lass
or P
TFE
dei
onis
ed w
ater
. c
over
ed w
ith a
lum
iniu
m fo
il.• B
ench
line
rs: b
oros
ilica
te g
lass
.• I
nstru
men
ts: q
uartz
or t
itani
um.
Org
anic
s• F
illet
s and
hom
ogen
ates
• Sta
inle
ss st
eel o
r an
odiz
ed a
lum
iniu
m• D
eter
gent
solu
tion
e.g.
con
trad.
• PTF
E or
bor
osili
cate
Free
ze a
t < -2
0°C
.1
year
or b
oros
ilica
te g
lass
orP
TFE
or c
eram
ic• S
oake
d in
pes
ticid
e-gr
ade
gl
ass o
r qua
rtz o
r o
r qua
rtz.
iso
prop
anol
or a
ceto
ne. R
inse
d a
lum
iniu
m fo
il.• D
isse
ctio
n kn
ives
: Tita
nium
bla
des a
nd w
ith o
rgan
ic-f
ree
dist
illed
PT
FE h
andl
es.
dei
onis
ed w
ater
.• D
isse
ctio
n bo
ards
:gla
ss o
r PTF
E co
vere
d w
ith a
lum
iniu
m fo
il.• B
ench
line
rs: b
oros
ilica
te g
lass
.• I
nstru
men
ts: S
tain
less
stee
l or q
uartz
or
tita
nium
.
ISSN 0378-4738 = Water SA Vol. 29 No. 1 January 2003 81Available on website http://www.wrc.org.za
that may be present should, however, be removed. Puncturing ofinternal organs must be avoided, as the material released from theinternal organs will contaminate the fillets. After removing thefillets they are weighed whereafter they are processed further orstored (Table 6).
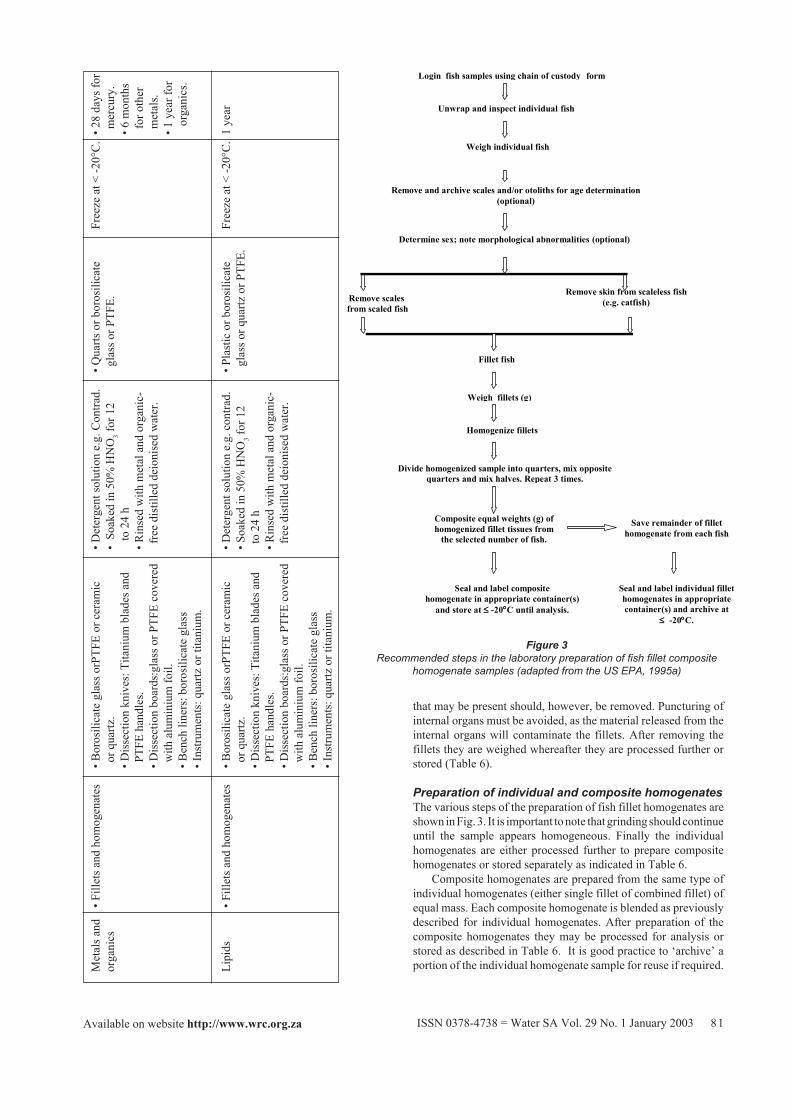
Preparation of individual and composite homogenatesThe various steps of the preparation of fish fillet homogenates areshown in Fig. 3. It is important to note that grinding should continueuntil the sample appears homogeneous. Finally the individualhomogenates are either processed further to prepare compositehomogenates or stored separately as indicated in Table 6.
Composite homogenates are prepared from the same type ofindividual homogenates (either single fillet of combined fillet) ofequal mass. Each composite homogenate is blended as previouslydescribed for individual homogenates. After preparation of thecomposite homogenates they may be processed for analysis orstored as described in Table 6. It is good practice to ‘archive’ aportion of the individual homogenate sample for reuse if required.M
etal
s and
• Fill
ets a
nd h
omog
enat
es• B
oros
ilica
te g
lass
orP
TFE
or c
eram
ic• D
eter
gent
solu
tion
e.g.
Con
trad.
• Qua
rts o
r bor
osili
cate
Free
ze a
t < -2
0°C
.• 2
8 da
ys fo
ror
gani
cs o
r qua
rtz.
• So
aked
in 5
0% H
NO
3 for
12
gla
ss o
r PTF
E. m
ercu
ry.
• Dis
sect
ion
kniv
es: T
itani
um b
lade
s and
to
24
h• 6
mon
ths
PTF
E ha
ndle
s.• R
inse
d w
ith m
etal
and
org
anic
- f
or o
ther
• Dis
sect
ion
boar
ds:g
lass
or P
TFE
cove
red
fre
e di
still
ed d
eion
ised
wat
er.
met
als.
with
alu
min
ium
foil.
• 1 y
ear f
or• B
ench
line
rs: b
oros
ilica
te g
lass
or
gani
cs.
• Ins
trum
ents
: qua
rtz o
r tita
nium
.
Lipi
ds• F
illet
s and
hom
ogen
ates
• Bor
osili
cate
gla
ss o
rPTF
E or
cer
amic
• Det
erge
nt so
lutio
n e.
g. c
ontra
d.• P
last
ic o
r bor
osili
cate
Free
ze a
t < -2
0°C
.1
year
or q
uartz
.• S
oake
d in
50%
HN
O3 f
or 1
2 g
lass
or q
uartz
or P
TFE.
• Dis
sect
ion
kniv
es: T
itani
um b
lade
s and
to
24 h
PTF
E ha
ndle
s.• R
inse
d w
ith m
etal
and
org
anic
-• D
isse
ctio
n bo
ards
:gla
ss o
r PTF
E co
vere
d f
ree
dist
illed
dei
onis
ed w
ater
. w
ith a
lum
iniu
m fo
il.• B
ench
line
rs: b
oros
ilica
te g
lass
• Ins
trum
ents
: qua
rtz o
r tita
nium
.
Figure 3Recommended steps in the laboratory preparation of fish fillet composite
homogenate samples (adapted from the US EPA, 1995a)
Login fish samples using chain of custody form
Unwrap and inspect individual fish
Weigh individual fish
Remove and archive scales and/or otoliths for age determination (optional)
Determine sex; note morphological abnormalities (optional)
Remove scales from scaled fish
Remove skin from scaleless fish (e.g. catfish)
Fillet fish
Weigh fillets (g)
Homogenize fillets
Divide homogenized sample into quarters, mix opposite quarters and mix halves. Repeat 3 times.
Composite equal weights (g) of homogenized fillet tissues from
the selected number of fish.
Save remainder of fillet homogenate from each fish
Seal and label composite homogenate in appropriate container(s)
and store at ≤ -20°C until analysis.
Seal and label individual fillet homogenates in appropriate container(s) and archive at
≤ -20°C.
ISSN 0378-4738 = Water SA Vol. 29 No. 1 January 200382 Available on website http://www.wrc.org.za
Distribution of samplesIf required aliquots of specific mass (to the nearest 0.1 g as requiredby the laboratory) are prepared and distributed to differentlaboratories. Sample deterioration or contamination must beprevented and detailed traceable records of the preparation andtransfer of the aliquots to a specific laboratory must be kept.
Selection of analytical laboratoryIt is a prerequisite that the selected analytical laboratory performthe analysis using internationally accepted analytical methods andhas well-documented quality assurance and quality control systemsin place. It is recommended that the analysis be performed by alaboratory which has been accredited under ISO/IEC Guide 25(ISO/IEC, 1990) or the International Standard ISO/IEC 17025(ISO/IEC: 1999). The laboratories of the Agricultural ResearchCouncil (Private Bag X 313, Pretoria, 0001, South Africa), theCSIR (Environmentek, P O Box 35 Pretoria, 0001, South Africa),Institute of Water Quality Studies (Private Bag X 134, Pretoria,0001, South Africa) and the South African Bureau of Standards(Private Bag X 191, Pretoria, 0001, South Africa) can be approachedto perform the analysis.
Analytical methodsVarious analytical methods are available world-wide for the analysisof specific chemical contaminants. The programme manager incollaboration with the laboratory chemist responsible for the analysisdiscuss the appropriate methods. It recommended that wherepractical the published methods of the United States EnvironmentalProtection Agency (US EPA) are followed in South Africa (USEPA, 1995a; Internet: [email protected];websites: htpp://www.epa.gov/).
Quality assurance and quality controlThe analytical laboratory performing the analysis must havedocumented quality assurance and quality control systems in place.During the discussions with the laboratory Chemist responsible forthe analysis the programme manager must ensure that this issue isaddressed. In South Africa the accreditation of methods atlaboratories ensures that quality control and quality assuranceprocedures are in place and routinely followed. It is recommendedthat only accredited laboratories or laboratories that follow therequirements of the International Standard ISO/IEC 17025 (ISO/IEC: 1999) be used for chemical contaminant analysis. Theselaboratories should also follow general safety, health andenvironmental practices as decribed for example by the International
Safety Rating System (ISRS, 1994) and the International StandardSABS ISO 14001: 1996 (SABS ISO, 1996).
Step 6: Analysis and reporting of results
Recording of results by the laboratoryThe recording of results must be performed according to standardlaboratory operating procedures that will ensure the integrity of theresults. The following is recommended for the recording of resultsfor South African surveys:
• An analytical result below the method detection limit (MDL),including an analytical result recorded as not detected (that isno observed response) should be assigned a value of half themethod detection limit (MDL/2).
• An analytical result recorded between the MDL and the methodquantification limit (MQL) should be assigned a value of theMDL plus half the difference between the MQL and MDL[MDL + (MQC – MDL/2)].
• An analytical result recorded at or above the MQL should berecorded as such.
Analysis of resultsIt is strongly recommended that a statistician be consulted throughoutthe study. The following is recommended for the analysis ofresults:
• Level 1: Screening surveys – The results obtained should beevaluated to determine which of the results is greater than orless than the screening concentration (SC). When the recordedanalyte concentration is below but close to the SC, the data onthe performance of the laboratory and historic data on water,sediment and fish tissue contamination at the site should beevaluated before further samples are taken. However, if thedata of these investigations indicate that further investigationshould be undertaken, a Level 2 survey should be initiated. ALevel 2 survey will also be undertaken for the analytes thatexceed the screening concentrations to verify the level ofcontamination.
• Level 2: Intensive surveys, Phase I and Level 3: Intensivesurveys Phase II – The main objectives of the Level 2 and Level3 surveys are to assess the magnitude and geographical extentof the contamination (special variation) in the various classesof the selected species, to define the geographical region wherefish contamination concentrations exceed the screening
TABLE 7Criteria for the classification of fish gonad development (Olatunde, 1978)
G1 Stage Characteristic
0. Inactive (I) Small gonads and close to the vertebral column. Gonads transparent and gray.1. Inactive-Action (IA) Testes and ovaries translucent, gray-red. Single eggs just visible to the naked eye. Gonads extending
most of the length of the ventral cavity.2. Active (A) Eggs visible to the naked eye. Gonads reddish with blood capillaries, filling 30 to 50% of the ventral cavity.3. Active-Ripe (AR) Ovaries orange-red. (Not Clarias gariepinus - gonads remain gray). Testes white with red blood vessels.
No milt-drops appear under pressure. Eggs opaque.4. Ripe Sexual products mature. Testes exude milt when pressure exerted. Eggs spherical.5. Ripe-Running (RR) Eggs and milt running with slight pressure.6. Spent (S) Gonads have the appearance of deflated sacs, reddish colour. Occasional residual eggs and some milt.
ISSN 0378-4738 = Water SA Vol. 29 No. 1 January 2003 83Available on website http://www.wrc.org.za
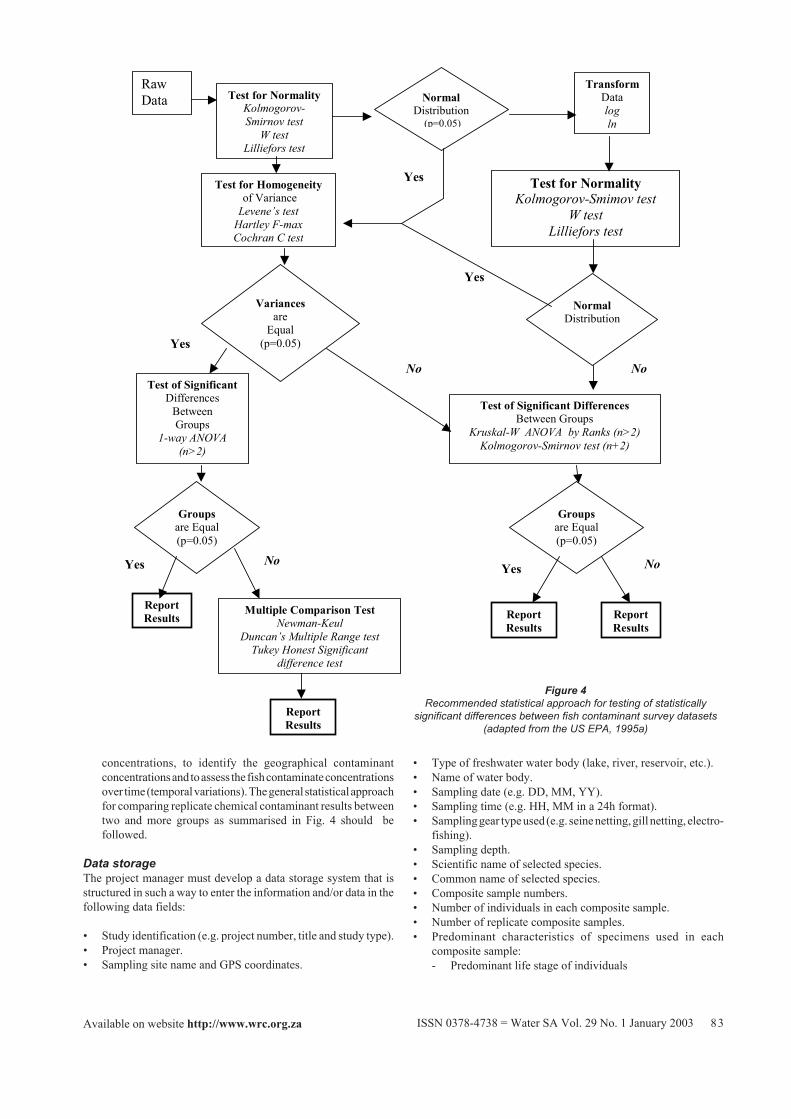
concentrations, to identify the geographical contaminantconcentrations and to assess the fish contaminate concentrationsover time (temporal variations). The general statistical approachfor comparing replicate chemical contaminant results betweentwo and more groups as summarised in Fig. 4 should befollowed.
Data storageThe project manager must develop a data storage system that isstructured in such a way to enter the information and/or data in thefollowing data fields:
• Study identification (e.g. project number, title and study type).• Project manager.• Sampling site name and GPS coordinates.
• Type of freshwater water body (lake, river, reservoir, etc.).• Name of water body.• Sampling date (e.g. DD, MM, YY).• Sampling time (e.g. HH, MM in a 24h format).• Sampling gear type used (e.g. seine netting, gill netting, electro-
fishing).• Sampling depth.• Scientific name of selected species.• Common name of selected species.• Composite sample numbers.• Number of individuals in each composite sample.• Number of replicate composite samples.• Predominant characteristics of specimens used in each
composite sample:- Predominant life stage of individuals
Figure 4Recommended statistical approach for testing of statistically
significant differences between fish contaminant survey datasets(adapted from the US EPA, 1995a)
Raw Data Test for Normality
Kolmogorov-Smirnov test
W test Lilliefors test
Normal Distribution
(p=0.05)
Transform Data log ln
Test for Homogeneity of Variance Levene’s test
Hartley F-max Cochran C test
Test for Normality Kolmogorov-Smimov test
W test Lilliefors test
Normal Distribution
Variances are
Equal (p=0.05)
Test of Significant Differences
Between Groups
1-way ANOVA (n>2)
Test of Significant Differences Between Groups
Kruskal-W ANOVA by Ranks (n>2) Kolmogorov-Smirnov test (n+2)
Groups are Equal (p=0.05)
Groups are Equal (p=0.05)
Report Results
No
Multiple Comparison Test Newman-Keul
Duncan’s Multiple Range test Tukey Honest Significant
difference test
Report Results
Report Results
Report Results
Yes
Yes
No
Yes
No
Yes No Yes
ISSN 0378-4738 = Water SA Vol. 29 No. 1 January 200384 Available on website http://www.wrc.org.za
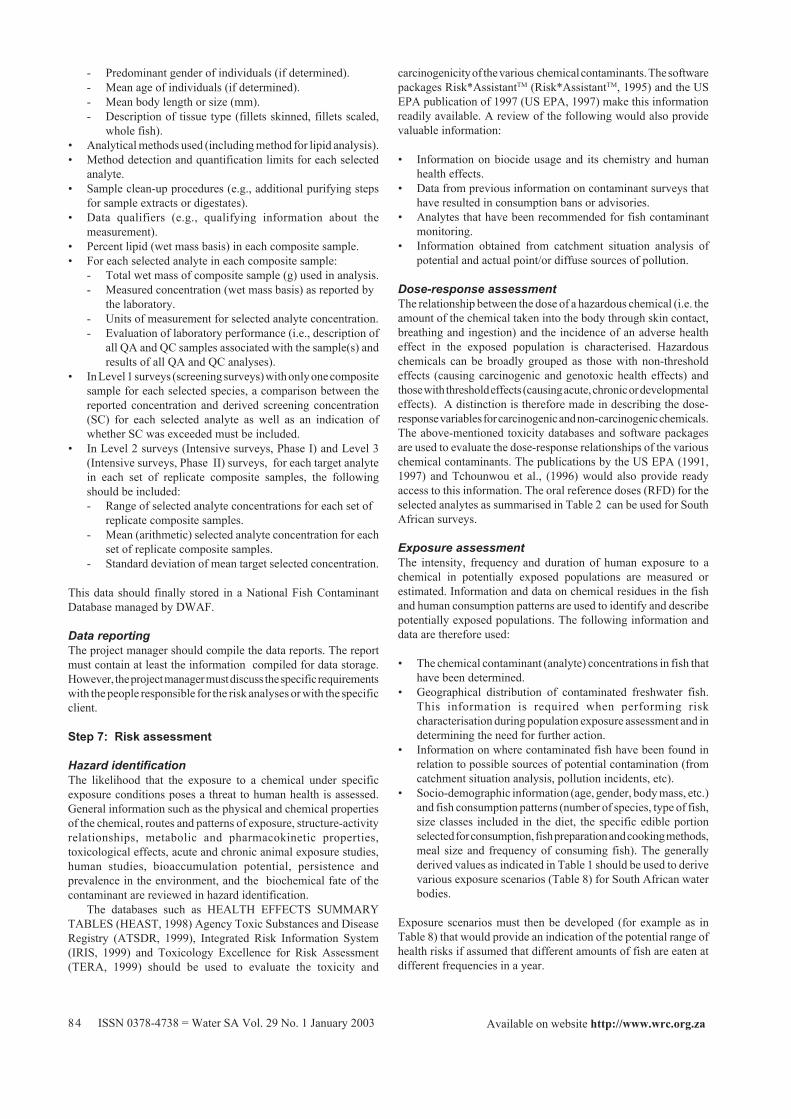
- Predominant gender of individuals (if determined).- Mean age of individuals (if determined).- Mean body length or size (mm).- Description of tissue type (fillets skinned, fillets scaled,
whole fish).• Analytical methods used (including method for lipid analysis).• Method detection and quantification limits for each selected
analyte.• Sample clean-up procedures (e.g., additional purifying steps
for sample extracts or digestates).• Data qualifiers (e.g., qualifying information about the
measurement).• Percent lipid (wet mass basis) in each composite sample.• For each selected analyte in each composite sample:
- Total wet mass of composite sample (g) used in analysis.- Measured concentration (wet mass basis) as reported by
the laboratory.- Units of measurement for selected analyte concentration.- Evaluation of laboratory performance (i.e., description of
all QA and QC samples associated with the sample(s) andresults of all QA and QC analyses).
• In Level 1 surveys (screening surveys) with only one compositesample for each selected species, a comparison between thereported concentration and derived screening concentration(SC) for each selected analyte as well as an indication ofwhether SC was exceeded must be included.
• In Level 2 surveys (Intensive surveys, Phase I) and Level 3(Intensive surveys, Phase II) surveys, for each target analytein each set of replicate composite samples, the followingshould be included:- Range of selected analyte concentrations for each set of
replicate composite samples.- Mean (arithmetic) selected analyte concentration for each
set of replicate composite samples.- Standard deviation of mean target selected concentration.
This data should finally stored in a National Fish ContaminantDatabase managed by DWAF.
Data reportingThe project manager should compile the data reports. The reportmust contain at least the information compiled for data storage.However, the project manager must discuss the specific requirementswith the people responsible for the risk analyses or with the specificclient.
Step 7: Risk assessment
Hazard identificationThe likelihood that the exposure to a chemical under specificexposure conditions poses a threat to human health is assessed.General information such as the physical and chemical propertiesof the chemical, routes and patterns of exposure, structure-activityrelationships, metabolic and pharmacokinetic properties,toxicological effects, acute and chronic animal exposure studies,human studies, bioaccumulation potential, persistence andprevalence in the environment, and the biochemical fate of thecontaminant are reviewed in hazard identification.
The databases such as HEALTH EFFECTS SUMMARYTABLES (HEAST, 1998) Agency Toxic Substances and DiseaseRegistry (ATSDR, 1999), Integrated Risk Information System(IRIS, 1999) and Toxicology Excellence for Risk Assessment(TERA, 1999) should be used to evaluate the toxicity and
carcinogenicity of the various chemical contaminants. The softwarepackages Risk*AssistantTM (Risk*AssistantTM, 1995) and the USEPA publication of 1997 (US EPA, 1997) make this informationreadily available. A review of the following would also providevaluable information:
• Information on biocide usage and its chemistry and humanhealth effects.
• Data from previous information on contaminant surveys thathave resulted in consumption bans or advisories.
• Analytes that have been recommended for fish contaminantmonitoring.
• Information obtained from catchment situation analysis ofpotential and actual point/or diffuse sources of pollution.
Dose-response assessmentThe relationship between the dose of a hazardous chemical (i.e. theamount of the chemical taken into the body through skin contact,breathing and ingestion) and the incidence of an adverse healtheffect in the exposed population is characterised. Hazardouschemicals can be broadly grouped as those with non-thresholdeffects (causing carcinogenic and genotoxic health effects) andthose with threshold effects (causing acute, chronic or developmentaleffects). A distinction is therefore made in describing the dose-response variables for carcinogenic and non-carcinogenic chemicals.The above-mentioned toxicity databases and software packagesare used to evaluate the dose-response relationships of the variouschemical contaminants. The publications by the US EPA (1991,1997) and Tchounwou et al., (1996) would also provide readyaccess to this information. The oral reference doses (RFD) for theselected analytes as summarised in Table 2 can be used for SouthAfrican surveys.
Exposure assessmentThe intensity, frequency and duration of human exposure to achemical in potentially exposed populations are measured orestimated. Information and data on chemical residues in the fishand human consumption patterns are used to identify and describepotentially exposed populations. The following information anddata are therefore used:
• The chemical contaminant (analyte) concentrations in fish thathave been determined.
• Geographical distribution of contaminated freshwater fish.This information is required when performing riskcharacterisation during population exposure assessment and indetermining the need for further action.
• Information on where contaminated fish have been found inrelation to possible sources of potential contamination (fromcatchment situation analysis, pollution incidents, etc).
• Socio-demographic information (age, gender, body mass, etc.)and fish consumption patterns (number of species, type of fish,size classes included in the diet, the specific edible portionselected for consumption, fish preparation and cooking methods,meal size and frequency of consuming fish). The generallyderived values as indicated in Table 1 should be used to derivevarious exposure scenarios (Table 8) for South African waterbodies.
Exposure scenarios must then be developed (for example as inTable 8) that would provide an indication of the potential range ofhealth risks if assumed that different amounts of fish are eaten atdifferent frequencies in a year.
ISSN 0378-4738 = Water SA Vol. 29 No. 1 January 2003 85Available on website http://www.wrc.org.za
Risk-based consumption limits can be derived for contaminantsusing specific risk equations (see Eqs. 1 and 2), risk values (Table2) and selected input values (Table 1). Based on a contaminant’scarcinogenicity, the allowable daily consumption rate (one fishspecies and one type of contaminant) of a contaminated fish sourceis calculated using the following equation:
CRlim = (ALR x BM)/ (SF x Cm) (1)
where:CRlim = maximum allowable fish consumption rate of the
species of interest (kg/day). The derived dailyconsumption limit (CR lim) represents the amountof freshwater fish expected to generate acarcinogenic health risk that is not greater than themaximum acceptable individual lifetime risk level(ALR), assuming that the consumer consumes fishdaily at the consumption limit over the person’slifetime.
ALR = maximum acceptable individual lifetime risk level(dimensionless).
BM = body mass of consumer (kg).SF = oral slope factor or carcinogenicity potency factor
(mg/kg/day) – 1 which is an upper bound risk value.Cm = measured concentration of chemical (analyte) m in
the edible portion of the species concerned (mg/kg).
Based on a contaminant’s non-carcinogenic health effect theallowable daily consumption rate of (one fish species and one typenon-carcinogenic contaminant) a contaminated fish source iscalculated using the following equation:
CRlim = (RFD x BM)/ Cm (2)
where:CRlim = maximum allowable fish consumption rate of the
species of interest (kg/d). The derived maximumdaily consumption rate (CRlim) represents theamount of freshwater fish which would probablynot generate a non-carcinogenic health risk to aconsumer over the person’s lifetime (US EPA,1997).
RFD = reference dose (mg/kg·d).
BM = body mass of consumer (kg).Cm = measured concentration of chemical (analyte) m in
the edible portion of the species concerned(mg/kg).
The above equations can be adapted to include more than one fishspecies or chemical contaminant. The risk-based consumptionlimits calculated for the proposed analytes in Table 2 can be usedfor the consumption of South African freshwater fish if informationon the input values and risk values is not available for South Africansituations.
Presently the total population exposure assessments cannotgenerally be performed for South African conditions as much of theinformation and data will not be available to perform the specificcalculations. Therefore for South African programmes the proposedinformation requirements are evaluated and obtained where feasible,considering the specific programme objectives and availability ofresources.
Risk characterisationAll the information concerning the hazard identification, dose-response assessment, and exposure assessment is used to characteriseand describe the extent of the overall individual or population risk.The most significant quantitative and qualitative aspects of theseassessments, the assumptions used and the identified uncertaintiesare assessed, summarised and discussed to provide an overallestimate of individual risk. If information and data are availablethis can also be expanded to estimate overall population risk.
The possible cancer risks are derived and described by usingthe following equation:
Individual lifetime cancer risk = Exposure x cancer slopefactor or cancer potency
where:Exposure = total exposure to a single chemical contaminant
from all sources (mg/kg·d).Cancer slope factor or cancer potency = upper bound of thelifetime cancer risk (mg/kg·d).
The population cancer risk can be calculated as:
Population cancer risk = individual lifetime cancer risk xsize of the exposed population
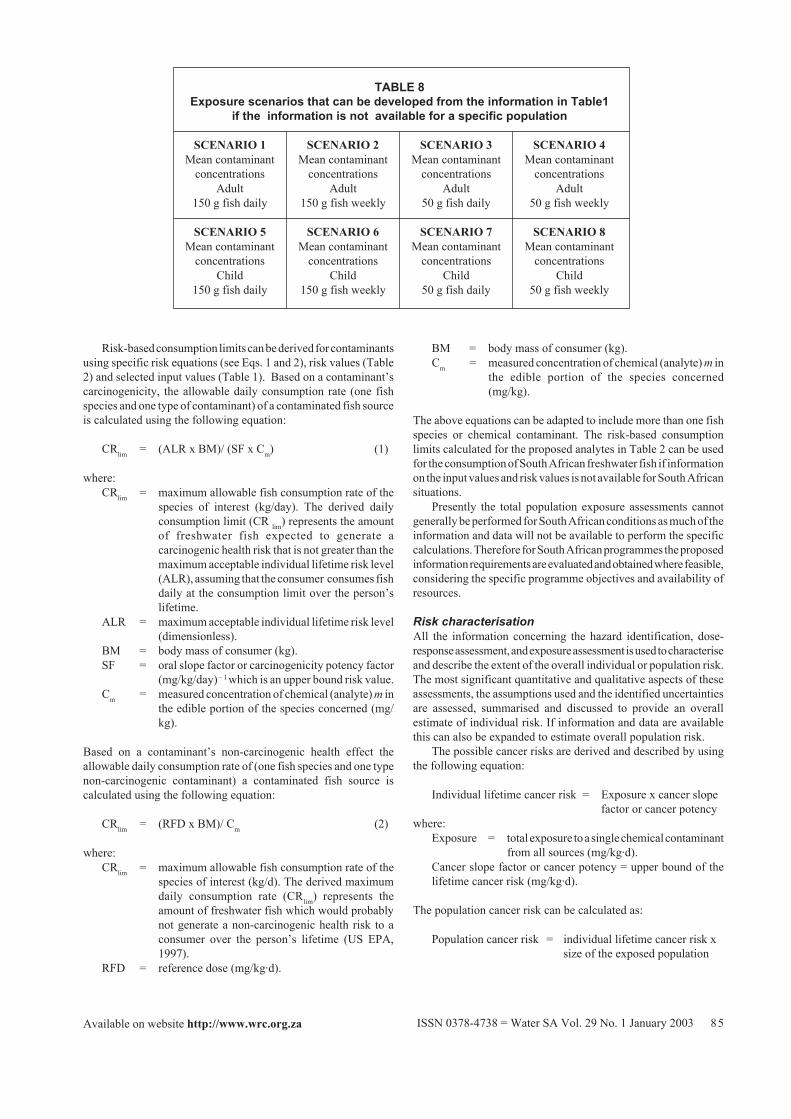
TABLE 8Exposure scenarios that can be developed from the information in Table1
if the information is not available for a specific population
SCENARIO 1 SCENARIO 2 SCENARIO 3 SCENARIO 4Mean contaminant Mean contaminant Mean contaminant Mean contaminant
concentrations concentrations concentrations concentrationsAdult Adult Adult Adult
150 g fish daily 150 g fish weekly 50 g fish daily 50 g fish weekly
SCENARIO 5 SCENARIO 6 SCENARIO 7 SCENARIO 8Mean contaminant Mean contaminant Mean contaminant Mean contaminant
concentrations concentrations concentrations concentrationsChild Child Child Child
150 g fish daily 150 g fish weekly 50 g fish daily 50 g fish weekly
ISSN 0378-4738 = Water SA Vol. 29 No. 1 January 200386 Available on website http://www.wrc.org.za
When different exposure levels occur the total risk is the sum of therisk at each level and when multiple contaminant exposures occur,the total risk is equal to the sum of the risks from individualcontaminants at each level. These cancer risks are then expressedas unit cancer risk (for individuals or populations), representing thelifetime risk due to constant lifetime exposure of one concentrationunit of the carcinogen. The unit cancer risk is calculated by thefollowing equation:
Lifetime cancer risk = 1 -e -(exposure x cancer slope factor or cancer potency)
The possible non-cancer risks are derived and described by usingthe following equation:
HQ = ADD/RFD
where:HQ = hazard quotient for individual lifetime cancer risk.
It compares the expected exposure of the chemicalcontaminant to an exposure that is assumed not tobe associated with a toxic effect.
ADD = average daily dose.RFD = reference dose.
or presented as:
HQ = Exposure/RFD
where:HQ = hazard quotient for individual lifetime cancer risk.
It compares the expected exposure of the chemicalcontaminant to an exposure that is assumed not tobe associated with a toxic effect.
Exposure = total exposure to a single chemical contaminantfrom all sources (mg/kg·d).
RFD = reference dose or any other non-carcinogenicexposure limit.
When exposure exceeds the RFD - that is, the HQ is equal to orgreater than 1.0 (for a single chemical contaminant or for acombination of chemical) - the possibility of non-cancer risks fromthe exposure is indicated. In most cases the less serious effects willresult in serious effects as exposure exceeds the RFD.
Population non-cancer risk can be defined by the followingequation:
Non-carcinogenic risk = population with exposure greaterthan the RFD
To perform these risk calculations for the chemical contaminantsfound in freshwater fish from South African systems and fordifferent scenarios the Risk*AssistantTM software package (withassistance from the competent personnel at the CSIR) can be used.
All the data and results that are generated are documented andorganised in a way that will facilitate their review and assessment.The risk assessment project leader or designated person shoulddesign specific forms to ensure proper documentation. Guidanceon the risk characterisation process and examples of how tocompile these documents can be found in the US EPA publications(US EPA 1997; Du Preez et al., 2000).
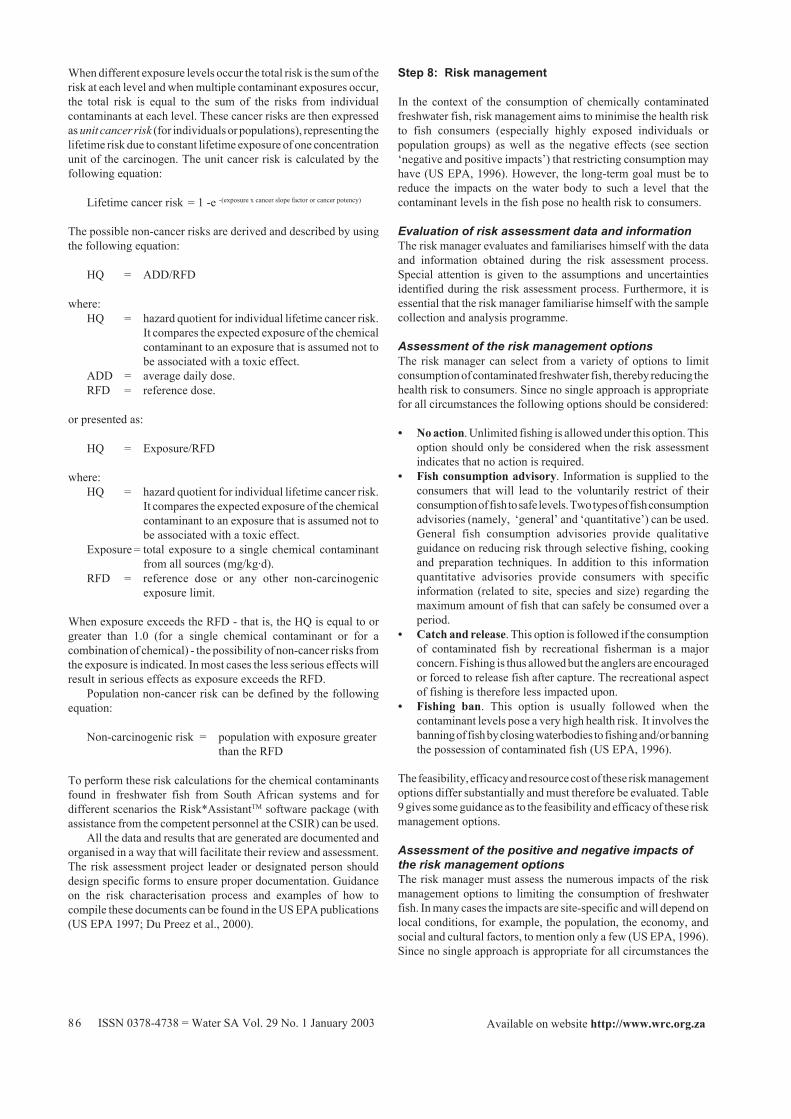
Step 8: Risk management
In the context of the consumption of chemically contaminatedfreshwater fish, risk management aims to minimise the health riskto fish consumers (especially highly exposed individuals orpopulation groups) as well as the negative effects (see section‘negative and positive impacts’) that restricting consumption mayhave (US EPA, 1996). However, the long-term goal must be toreduce the impacts on the water body to such a level that thecontaminant levels in the fish pose no health risk to consumers.
Evaluation of risk assessment data and informationThe risk manager evaluates and familiarises himself with the dataand information obtained during the risk assessment process.Special attention is given to the assumptions and uncertaintiesidentified during the risk assessment process. Furthermore, it isessential that the risk manager familiarise himself with the samplecollection and analysis programme.
Assessment of the risk management optionsThe risk manager can select from a variety of options to limitconsumption of contaminated freshwater fish, thereby reducing thehealth risk to consumers. Since no single approach is appropriatefor all circumstances the following options should be considered:
• No action. Unlimited fishing is allowed under this option. Thisoption should only be considered when the risk assessmentindicates that no action is required.
• Fish consumption advisory. Information is supplied to theconsumers that will lead to the voluntarily restrict of theirconsumption of fish to safe levels. Two types of fish consumptionadvisories (namely, ‘general’ and ‘quantitative’) can be used.General fish consumption advisories provide qualitativeguidance on reducing risk through selective fishing, cookingand preparation techniques. In addition to this informationquantitative advisories provide consumers with specificinformation (related to site, species and size) regarding themaximum amount of fish that can safely be consumed over aperiod.
• Catch and release. This option is followed if the consumptionof contaminated fish by recreational fisherman is a majorconcern. Fishing is thus allowed but the anglers are encouragedor forced to release fish after capture. The recreational aspectof fishing is therefore less impacted upon.
• Fishing ban. This option is usually followed when thecontaminant levels pose a very high health risk. It involves thebanning of fish by closing waterbodies to fishing and/or banningthe possession of contaminated fish (US EPA, 1996).
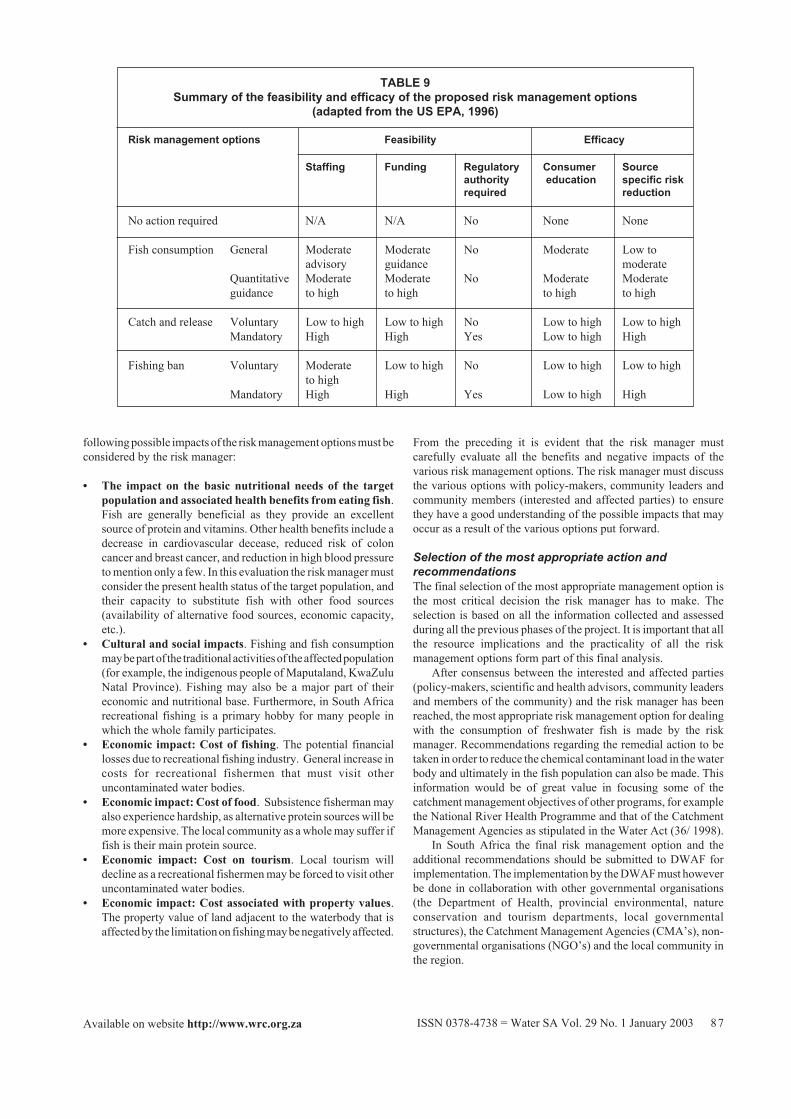
The feasibility, efficacy and resource cost of these risk managementoptions differ substantially and must therefore be evaluated. Table9 gives some guidance as to the feasibility and efficacy of these riskmanagement options.
Assessment of the positive and negative impacts ofthe risk management optionsThe risk manager must assess the numerous impacts of the riskmanagement options to limiting the consumption of freshwaterfish. In many cases the impacts are site-specific and will depend onlocal conditions, for example, the population, the economy, andsocial and cultural factors, to mention only a few (US EPA, 1996).Since no single approach is appropriate for all circumstances the
ISSN 0378-4738 = Water SA Vol. 29 No. 1 January 2003 87Available on website http://www.wrc.org.za
following possible impacts of the risk management options must beconsidered by the risk manager:
• The impact on the basic nutritional needs of the targetpopulation and associated health benefits from eating fish.Fish are generally beneficial as they provide an excellentsource of protein and vitamins. Other health benefits include adecrease in cardiovascular decease, reduced risk of coloncancer and breast cancer, and reduction in high blood pressureto mention only a few. In this evaluation the risk manager mustconsider the present health status of the target population, andtheir capacity to substitute fish with other food sources(availability of alternative food sources, economic capacity,etc.).
• Cultural and social impacts. Fishing and fish consumptionmay be part of the traditional activities of the affected population(for example, the indigenous people of Maputaland, KwaZuluNatal Province). Fishing may also be a major part of theireconomic and nutritional base. Furthermore, in South Africarecreational fishing is a primary hobby for many people inwhich the whole family participates.
• Economic impact: Cost of fishing. The potential financiallosses due to recreational fishing industry. General increase incosts for recreational fishermen that must visit otheruncontaminated water bodies.
• Economic impact: Cost of food. Subsistence fisherman mayalso experience hardship, as alternative protein sources will bemore expensive. The local community as a whole may suffer iffish is their main protein source.
• Economic impact: Cost on tourism. Local tourism willdecline as a recreational fishermen may be forced to visit otheruncontaminated water bodies.
• Economic impact: Cost associated with property values.The property value of land adjacent to the waterbody that isaffected by the limitation on fishing may be negatively affected.
From the preceding it is evident that the risk manager mustcarefully evaluate all the benefits and negative impacts of thevarious risk management options. The risk manager must discussthe various options with policy-makers, community leaders andcommunity members (interested and affected parties) to ensurethey have a good understanding of the possible impacts that mayoccur as a result of the various options put forward.
Selection of the most appropriate action andrecommendationsThe final selection of the most appropriate management option isthe most critical decision the risk manager has to make. Theselection is based on all the information collected and assessedduring all the previous phases of the project. It is important that allthe resource implications and the practicality of all the riskmanagement options form part of this final analysis.
After consensus between the interested and affected parties(policy-makers, scientific and health advisors, community leadersand members of the community) and the risk manager has beenreached, the most appropriate risk management option for dealingwith the consumption of freshwater fish is made by the riskmanager. Recommendations regarding the remedial action to betaken in order to reduce the chemical contaminant load in the waterbody and ultimately in the fish population can also be made. Thisinformation would be of great value in focusing some of thecatchment management objectives of other programs, for examplethe National River Health Programme and that of the CatchmentManagement Agencies as stipulated in the Water Act (36/ 1998).
In South Africa the final risk management option and theadditional recommendations should be submitted to DWAF forimplementation. The implementation by the DWAF must howeverbe done in collaboration with other governmental organisations(the Department of Health, provincial environmental, natureconservation and tourism departments, local governmentalstructures), the Catchment Management Agencies (CMA’s), non-governmental organisations (NGO’s) and the local community inthe region.
TABLE 9Summary of the feasibility and efficacy of the proposed risk management options
(adapted from the US EPA, 1996)
Risk management options Feasibility Efficacy
Staffing Funding Regulatory Consumer Sourceauthority education specific riskrequired reduction
No action required N/A N/A No None None
Fish consumption General Moderate Moderate No Moderate Low toadvisory guidance moderate
Quantitative Moderate Moderate No Moderate Moderateguidance to high to high to high to high
Catch and release Voluntary Low to high Low to high No Low to high Low to highMandatory High High Yes Low to high High
Fishing ban Voluntary Moderate Low to high No Low to high Low to highto high
Mandatory High High Yes Low to high High
ISSN 0378-4738 = Water SA Vol. 29 No. 1 January 200388 Available on website http://www.wrc.org.za
Step 9: Risk communication
In the context of the consumption of chemically contaminatedfreshwater fish risk communications aim to ‘share’ informationbetween all role-players to minimise the health risk to fish consumers(US EPA, 1995b). The risk communicator thus also focuses onhealth promotion. The development and implementation of a riskcommunication strategy usually involves:
• Problem analysis during which the risk communicatorfamiliarises himself/herself with the programme
• Audience needs assessment (identification of the targetpopulation, their specific information needs and the best wayto communicate with them)
• Communication strategy design and implementation (addressesthe what, how, when and the person responsible for thecommunication)
• Continuous evaluation of the programme (US EPA, 1995b).
Presently it would not be feasible to develop a complete riskcommunication strategy and implement this for South Africanwater bodies as it is time-consuming and resource-intensive. Thefollowing should be considered during risk communication relatedto freshwater fish for surveys in South African:
• The risk communicator uses the risk assessment and riskmanagement documents and personal judgement to familiarisehimself/herself with the programme and identify the targetpopulations needs.
• The risk communicator selects the main consumptioninformation by considering the following:- Frequency of consumption of fish from a specific water
body or water bodies.- The human health benefits from eating fish.- Chemicals of specific concern and their human health
effects.- The adverse health effects of eating contaminated freshwater
fish.- Reducing fish consumption risk by cleaning and cooking
methods.- Identification of the safer fish species or size of fish or the
water bodies that have the lowest contamination.• The risk communicator selects the style of presenting the
information by considering the following:- A combination of text tables and diagrams or graphics is
the most effective.- Using a cajoling tone and not a commanding tone.- Assessing whether qualitative or quantitative information
is the most suitable for the target group.- Determining what the education level of the target group is,
for example, will they be able to read the information.• The risk communicator selects the most appropriate
dissemination mechanism by considering the following:- Mass media types: for example, talks on the local radio
stations and on television (for example 50/50Pprogrammeon SABC).
- Specialised media types for example brochures, posters,fact sheets, newsletters, fishing regulation articles innewspapers and in fishing and outdoor magazines.
- Interpersonal contacts during meetings of non-govern-mental organisations, town councils, fishing clubs andcatchment forum meetings or during contacts with the staffof the DWAF and other governmental organisations (the
Department of Health, Provincial Environmental, NatureConservation and Tourism Departments) responsible forinformation transfer in the area of interest.
• The risk communicator selects the most appropriate time forinformation change by considering the following:- Information exchange should be done throughout the year
to stimulate public awareness and keep up compliance.- Target specific times of the year, for example the beginning
of spring when fishing generally starts and the summerperiod when fishing is most intensive.
- Holidays (especially during summer time) or days whenfishing competitions are held.
As resources become more available the risk communicator shouldexpand the specific programme, for example by obtaining detailedinformation needs from the target group or by producing additionaland more detailed information. In South Africa the riskcommunication related to the consumption of contaminatedfreshwater fish should be managed and implemented by DWAFincollaboration with other governmental organisations (theDepartment of Health, Provincial Environmental, Natureconservation and Tourism Departments, local governmentalstructures), CMA’s non-governmental organisations (NGO’s) andthe local community in the region.
Step 10: Evaluation and review of programme
It is vital to formally review all aspects of the programme. Specificattention must be given to the following:
• Re-assessment of the fish contaminant data obtained during thefollow-up surveys.
• Re-assessment of the risk assessment process as new informationmay be available and as new data is obtained.
• Re-assessment of the risk management programme to determinewhether the programme was and still is effective.
• Re-assessment of the risk communication initiatives todetermine whether the objectives of the communication strategywere reached.
The review must also consider the objectives, activities and remedialactions that have been taken by other programmes, especially thoserelated to catchment management and the river health programmesof DWAF. This review will enable the risk manager to adapt theprogramme as required, thereby achieving the goals of reducing thehealth risk to the consumers of freshwater fish and contributing tothe effective management of catchments.
Conclusions
If this methodology is accepted by the authorities it should provideguidance to governmental authorities at national or provincial leveland project managers for the collection of data and information aswell as for the assessment, management and communication of thehealth risks associated with the consumption of freshwater fish.The basic requirements are highlighted, as limited resources(financial, infrastructure and skilled personnel) in South Africawould curtail the possibility of undertaking detailed assessments asundertaken by the US EPA. Nevertheless, by applying the proposedmethodology, sound comparable assessments, based on riskassessment methodology, can be made regarding the human healthrisk associated with the consumption of freshwater fish in SouthAfrica. People responsible for these assessments would also be able
ISSN 0378-4738 = Water SA Vol. 29 No. 1 January 2003 89Available on website http://www.wrc.org.za
to compare their data and information with other studies in theworld, especially that of the United States of America.
These surveys will also identify areas in the aquatic systemwhere aquatic life and especially fish have unacceptably highchemical contaminant levels due to anthropogenic activities in thecatchment. This information can be used in catchment managementprogrammes and thereby contribute to the general management ofthe catchments. Thus, by following and implementing the proposedmethodology a major contribution would be made to the protectionof the consumers of freshwater fish as well as ensuring that the fishpopulations are fit for present and future human consumption. Thiswould in turn contribute to the ultimate goal of protection thefreshwater aquatic environment. As DWAFis the custodian offreshwater systems in South Africa, it is envisaged that themonitoring of chemical contaminant levels in fish according to theproposed methodology would be implemented and managed by theDepartment in collaboration with other governmental organisationsorganisations (the Department of Health, Provincial Environmental,Nature conservation and Tourism Departments, local governmentalstructures) and CMA’s. It must be stressed that for the methodologyto be effectively implement a multidisciplinary team approachmust be followed.
References
ADAMS SM, BROWN AM and GOEDE RW (1993) A quantitativehealth assessment index for rapid evaluation of fish condition in thefield. Trans. Am. Fish. Soc. 122 63-73.
AGENCY FOR TOXIC SUBSTANCES AND DISEASE REGISTRY(ATSDR) (1999) Agency for Toxic Substances and Disease RegistryDatabase. Atlanta. Georgia. United States of America: United States ofAmerica Department of Health and Human Services, Public HealthServices.
ANDERSON L, DIBBLE M, MITCHELL H and RYNBERGEN H (1972)Nutrition in Nursing. PA: Lippincott Co. Philadelphia.
AVENANT-OLDEWAGE A (2001) Protocol for the Assessment of FishHealth Based on the Health Index. Report and a manual for training offield workers to Rand Water, Vereeniging. Report No. 2001/03/31.BIOM.GEN. (H 1).
AVENANT-OLDEWAGE A and MARX HN (2000) Bioaccumulation ofchromium, copper and iron in organs and tissues of Clarias gariepinusin the Olifants River, Kruger National Park. Water SA 26 (4) 569-582.
AVENANT-OLDEWAGE A, OLDEWAGE WH and VAN VUREN JHJ(1995) Development of a Fish Health and Condition Procedure. Finalreport to the Institute for Water Quality Studies, Pretoria. 107 pp.
BRANCH M and BRANCH G (1981) The Living Shores of South Africa.C. Struik Publishers, Cape Town. 272pp.
BEVELHIMER MS (1995) Recent advances in contaminant assessmentoffer proactive alternatives for managing contaminated fisheries.Fisheries 20 (12) 6-10.
BOUWMAN H, COETZEE A and SCHUTTE GHJ (1990) Environmentaland health implications of DDT – contaminated fish from the PongolaFood Plain. J. Afr. Zool. 104 275-286.
CLAASSEN M (1996) Assessment of Selected Metal and BiocideBioaccumulation in Fish from the Berg, Luvuvhu, Olifants and SabieRivers, South Africa. Johannesburg. Unpublished M.Sc. Thesis, RandAfrikaans Univ.
DU PREEZ HH and STEYN GJ (1992) A preliminary investigation of theconcentration of selected metals in the tissues and organs of thetigerfish (Hydrocynus vittatus) from the Olifants River, Kruger NationalPark, South Africa. Water SA 18 (2) 131-136.
DU PREEZ HH, VAN DER MERWE M and VAN VUREN JHJ (1997)Bioaccumulation of selected metals in African catfish, Clariasgariepinus from the lower Olifants River, Mpumalanga, South Africa.Koedoe 40 77-90.
DU PREEZ HH, HEATH RGM and SANDHAM LA (2000) Strategies andElements of a Chemical Contaminant Monitoring Programme for theConsumption of Freshwater Fish Bioaccumulation. Rand Water.Vereeniging. South Africa.
ELLIS KV (1989) Surface Water Pollution and its Control. MacMillanPublishing Company, United Kingdom. 373 pp.
FÖRSTNER U and WITTMANN GTW (1983) Metal Pollution in theAquatic Environment (2nd edn.). Springer Verlsag, New York. 486 pp.
GROBLER DF (1994) A note on PCBs and chlorinated hydrocarbonpesticide levels in water, fish and sediment from the Olifants River,Eastern Transvaal, South Africa. Water SA 20 (3) 187-194.
GROBLER DF, KEMPSTER PL and VAN DER MERWE L (1994) A noteon the occurrence of metals in the Olifants River, Eastern Transvaal,South Africa. Water SA 20 (3) 195-204.
HEALTH EFFECTS SUMMARY TABLES (HEAST) (1989) HealthEffects Summary Tables. Washington DC: Office of Emergency andRemedial Response. United States of America Environmental ProtectionAgency.
HEATH RGM (1999) A Catchment-Based Assessment of the Metal andPesticide Levels of Fish from the Crocodile River, Mpumalanga.Unpublished Ph.D. Thesis, Rand Afrikaans Univ.
HEATH RGM and CLAASSEN MC (1999) An Overview of thePesticide and Metal Levels Present in Populations of the LargerIndigenous Fish Species of Selected South African Rivers. Reportto the Water Research Commission, Pretoria. WRC Report No.428/1/99. 318 pp.
HELLAWELL JM (1986) Biological Indicators of FreshwaterPollution and Environmental Management. Elsevier AppliedSciences Publishers Ltd. London. 546 pp.
INTEGRATED RISK INFORMATION SYSTEM (IRIS) (1992) TheUnited States of America Environmental Protection Agency IntegratedRisk Information System Database. US EPA, Duluth, Minnesota,United States of America.
INTEGRATED RISK INFORMATION SYSTEM (IRIS) (1995) TheUnited States of America Environmental Protection Agency IntegratedRisk Information System Database. US EPA, Duluth, Minnesota,United States of America.
INTEGRATED RISK INFORMATION SYSTEM (IRIS) (1997) TheUnited States of America Environmental Protection Agency IntegratedRisk Information System Database. US EPA, Duluth, Minnesota,United States of America.
INTEGRATED RISK INFORMATION SYSTEM (IRIS) (1999) TheUnited States of America Environmental Protection Agency IntegratedRisk Information System Database. US EPA, Duluth, Minnesota,United States of America.
INTERNATIONAL SAFETY RATING SYSTEM (ISRS) (1994)International Safety Rating (6th edn). International Loss Control Institute.Loganvillille, Georgia.
INTERNATIONAL STANDARDS ORGANISATION/IEC (1990)General Requirement for the Competence of Calibration and TestingLaboratories. ISO/IEC 025: 1990. South African Bureau of Standards.Pretoria. South Africa.
INTERNATIONAL STANDARDS ORGANISATION/IEC (1999)General Requirement for the Competence of Calibration and TestingLaboratories. ISO/IEC 17025: 1999. South African Bureau of Standards.Pretoria. South Africa.
JOHNSON BL (1996) Hazardous waste: Nature, extent, effects and socialresponses. In: De Serres FJ and Bloom AD ( eds.) Ecotoxicology andHuman Health. A Biological Approach to Environmental Remediation.Lewis Publishers, CRC Press, Inc. Boca Raton.
JUBB RA (1967) Freshwater Fishes of Southern Africa. Balkema. CapeTown. 248 pp.
KOTZE PJ, DU PREEZ HH and VAN VUREN JHJ (1999) Bio-accummulation of copper and zinc in Oreochromis Mossambicus andClarias gariepinus, from the Olifants River, Mpumalanga, SouthAfrica. Water SA 25 (1) 99-110.
LE ROUX P and STEYN L (1968) Fishes of the Transvaal. South AfricanInstitute. Johannesburg. 108 pp.
OLATUNDE AA (1978) Sex, reproductive cycle and variations in fecundityof the Family Schilbeidae (Osteichthyes: Siluriformes) in Lake Kainji,Nigeria. Hydrobiol. 57 (2) 125-142.
MASON CF (1991) Biology of Freshwater Pollution (2 nd edn). LongmanScientific and Technical Publication. New York. 351 pp.
NUSSEY G, VAN VUREN JHJ and DU PREEZ HH (1999) Bio-accumulation of aluminium, copper and zinc in the tissues of
ISSN 0378-4738 = Water SA Vol. 29 No. 1 January 200390 Available on website http://www.wrc.org.za
moggel from Witbank Dam, Upper Olifants River, Catchment(Mpumalanga). South Afr. J. Wildlife Res. 29 (4) 130-144.
NUSSEY G, VAN VUREN JHJ and DU PREEZ HH (2000) Bio-accumulation of chromium, manganese, nickel and lead in the tissuesof moggel (Cyprinidae) from Witbank Dam, Mpumalanga. Water SA26 (2) 269-284.
PIENAAR U DE V (1978) The Freshwater Fishes of the Kruger NationalPark. National Parks Board of Trustees. Pretoria. 91 pp.
REINERT RE, KNUTH BA, KAMRIN MA and SOBER QJ (1991) Riskassessment, risk management and fish consumption advisories in theUnited States. Fish. 16 (6) 3-12.
RISK * ASSISTANT TM (1995) Risk * Assistant TM. Hampshire ResearchInstitute, Inc. Alexandria. Virginia. United States of America.
ROBINSON J (1996) Evaluation of a Health Assessment Index withReference to Bioaccumulation of Metals in Oreochromis mossambicus.(Peters, 1852) and Aspects of the morphology of Lernaea cyprinicaea,Linnaeus, 1758. Johannesburg. Unpublished M.Sc. Thesis, RandAfrikaans Univ.
ROBINSON J and AVENANT-OLDEWAGE A (1997) Chromium, copper,iron and manganese bioaccumulation in some organs and tissues ofOreochromis mossambicus from the lower Olifants River, inside theKruger National Park. Water SA 23 (4) 387-404.
SCHOONBEE HJ, ADENDORFF A, DE WET LM, DE WET LPD,FLEISCHER CL, VAN DER MERWE CG, VAN EEDEN PH andVENTER AJA (1996) The Occurrence and Accumulation of SelectedHeavy Metals in Fish from Water Ecosystems Affected by Mine andIndustrial Polluted Effluent. Report to the Water Research Commission,Pretoria. WRC Report No. 313/1/96.
SEYMORE T, DU PREEZ HH and VAN VUREN JHJ (1995) Manganese,lead and strontium bioaccumulation in the tissues of the yellowfish,Barbus marequensis from the lower Olifants River, Eastern Transvaal.Water SA 21 (2) 159-172.
SEYMORE T, DU PREEZ HH and VAN VUREN JHJ (1996)Concentrations of zinc in Barbus marequensis from the lower OlifantsRiver, Mpumalanga, South Africa. Hydrobiol. 332 141-150.
SKELTON PH (1993) A Complete Guide to the Freshwater Fishes ofSouthern Africa. Southern Book Publishers, Midrand, South Africa.388 pp.
SOUTH AFRICAN BUREAU OF STANDARDS (1996) EnvironmentalManagement Systems- Specifications with Guidance for Use. SABSISO 14001:1996. South African Bureau of Standards. Pretoria.
TCHOUNWOU PB, ABDELGHANI AA, PRAMAR YV, HEYER LRand STEWARD CM (1996) Assessment of potential health risksassociated with ingesting heavy metals in fish collected from ahazardous-waste contaminated wetland in Louisiana, USA. Rev.Environ. Health 11 191-203.
TOXICOLOGY EXCELLENCE FOR RISK ANALYSIS (TERA) (1999)Toxicology Excellence for Risk Analysis Database. Available on theInternet: http://www.tera.org. [Date of use: May 1999].
UNITED STATES OF AMERICA ENVIRONMENTAL PROTECTIONAGENCY (US EPA) (1991) Guidelines for Developmental ToxicityRisk Assessment. Federal Register, 56: 63798-63826. US EPAWashington, D.C.
UNITED STATES OF AMERICA ENVIRONMENTAL PROTECTIONAGENCY Pretoria (1995a) Guidance for Assessing ChemicalContaminant Data for Use in Fish Advisories. Volume 1: Fish Samplingand Analysis (2nd edn.). EPA 823-R-95-007. US EPA. Washington,DC.
UNITED STATES OF AMERICA ENVIRONMENTAL PROTECTIONAGENCY Pretoria (1995b) Guidance for Assessing ChemicalContaminant Data for Use in Fish Advisories. Volume 4: RiskCommunication. EPA 823-R-95-001. US EPA. Washington, DC.
UNITED STATES OF AMERICA ENVIRONMENTAL PROTECTIONAGENCY Pretoria (1996) Guidance for Assessing ChemicalContaminant Data for Use in Fish Advisories. Volume 3: Overviewof Risk Management. EPA 823-B-96-006. US EPA. Washington, DC.
UNITED STATES OF AMERICA ENVIRONMENTAL PROTECTIONAGENCY Pretoria (1997) Guidance for assessing chemical contaminantdata for use in fish advisories. Volume 2: Risk Assessment and FishConsumption Limits (2nd edn.). EPA 823-B-97-009. US EPA.Washington, DC.
UNITED STATES OF AMERICA ENVIRONMENTAL PROTECTIONAGENCY Pretoria (1999) Update: National Listing of Fish and WildlifeAdvisories. EPA 823-F-99-005. US EPA. Washington, D.C.
VAN VUREN JHJ, DU PREEZ HH and DEACON AR (1996) Effect ofPollutants on the Physiology of Fish in the Olifants River (EasternTransvaal). Report to Water Research Commission, Pretoria . WRCProject No. K5/350. 214 pp.
WORLD HEALTH ORGANISATION (WHO) (1999) Toxic Cyanobacteriain Water. A Guide to Their Public Health Consequences, Management(Chorus I and Bartram J (eds.)) E and FN Span Publishers. London.416 pp.
WORLD HEALTH ORGANISATION (WHO ) (2002) Health Promotion:Milestones in the Road to a Global Alliance. Fact Sheets No 171. http://www.who.int/inf-fs/enfact171.html
ZABIK ME, ZABIK MJ, BOOREN AM, NETTLES M, SONG J, WELSHR and HUMPHREY H (1995) Pesticides and total polychlori-nated biphenyls in Chinook salmon and carp harvested from the GreatLakes: Effects of skin-on and skin-off processing and selected cookingmethods. J. Agric. Food Chem. 43 A993-1001.
Copyright © 2022 FDOKUMEN