METHODOLOGY FOR ASSESSING VULNERABILITY TO FLOODS IN ROMANIAN CITIES
17
Vol 20, No. 11;Nov 2013 274 [email protected] METHODOLOGY FOR ASSESSING VULNERABILITY TO FLOODS IN ROMANIAN CITIES Radu SĂGEATĂ, Teodor TODERAŞ, Alina NEGOESCU, Traian CRĂCEA Faculty of Geography of Tourism, 5-7, Simion Mehedinti Street “Dimitrie Cantemir” Chrisian University, Sibiu, Romania [email protected]; [email protected]; [email protected]; [email protected] Abstract: Starting from the consequences of global climatic changes upon the local ecosystems we have tried to create a coherent methodology for assessing flood vulnerability in the cities of Romania based on a typical sample of indicators grouped in three sub-modules whose intensity was evaluated by grades from 0.1 to 1. These led to the classification of Romanian cities in five classes of vulnerability to a certain genetic type of flood. On the basis of this classification, we have carried out one representative case study regarding the floods from Moldavia in July 2010, using GIS mapping techniques. We have considered three perimeters of analysis: Şerbeşti- Săuceşti and Fundeni-Nămoloasa on Siret River, respectively Sadoveni-Ripiceni on Prut River. Key words: vulnerability, risk, floods, methodology, urban network, Romania 1. ARGUMENT Over the recent years Romania has faced a series of extreme events, among which the most important were floods and flash floods, most of them being caused by torrential rains, snowmelt or the two phenomena combined, amplified in many cases by the breaking of natural or artificial dams, dykes, etc. Thus, the dykes and dams along the Danube and the main rivers have proven to be insufficient and in some cases inadequate in extreme situations; propagation of flood waves being strongly influenced by these environmental changes. The lack of a firm legislation at the beginning of the transition period determined a worsening of environmental conditions by uncontrolled deforestation, destructions of forest belts and irrigation systems and an accentuation of the impact of extreme hydrologic phenomena upon society. That is why it is necessary to develop an assessment model of flood risk in the human settlements of Romania as a key element for assessing potential damage costs caused by flooding. Through collaborative partnerships with local authorities, this demarche will be at the basis of improving general urban plans by means of a better administration of lands. This model will consider two basic elements:
Transcript of METHODOLOGY FOR ASSESSING VULNERABILITY TO FLOODS IN ROMANIAN CITIES

Vol 20, No. 11;Nov 2013
METHODOLOGY FOR ASSESSING VULNERABILITY TO
FLOODS IN ROMANIAN CITIES
Radu SĂGEATĂ, Teodor TODERAŞ, Alina NEGOESCU, Traian CRĂCEA
Faculty of Geography of Tourism, 5-7, Simion Mehedinti Street
“Dimitrie Cantemir” Chrisian University, Sibiu, Romania
[email protected]; [email protected]; [email protected];
Abstract: Starting from the consequences of global climatic changes upon the local
ecosystems we have tried to create a coherent methodology for assessing flood vulnerability in the cities of Romania based on a typical sample of indicators grouped
in three sub-modules whose intensity was evaluated by grades from 0.1 to 1. These led
to the classification of Romanian cities in five classes of vulnerability to a certain genetic type of flood. On the basis of this classification, we have carried out one
representative case study regarding the floods from Moldavia in July 2010, using GIS
mapping techniques. We have considered three perimeters of analysis: Şerbeşti-Săuceşti and Fundeni-Nămoloasa on Siret River, respectively Sadoveni-Ripiceni on
Prut River.
Key words: vulnerability, risk, floods, methodology, urban network, Romania
1. ARGUMENT
Over the recent years Romania has faced a series of extreme events, among
which the most important were floods and flash floods, most of them being caused by
torrential rains, snowmelt or the two phenomena combined, amplified in many cases
by the breaking of natural or artificial dams, dykes, etc. Thus, the dykes and dams
along the Danube and the main rivers have proven to be insufficient and in some
cases inadequate in extreme situations; propagation of flood waves being strongly
influenced by these environmental changes.
The lack of a firm legislation at the beginning of the transition period
determined a worsening of environmental conditions by uncontrolled deforestation,
destructions of forest belts and irrigation systems and an accentuation of the impact
of extreme hydrologic phenomena upon society. That is why it is necessary to
develop an assessment model of flood risk in the human settlements of Romania as a
key element for assessing potential damage costs caused by flooding. Through
collaborative partnerships with local authorities, this demarche will be at the basis of
improving general urban plans by means of a better administration of lands.
This model will consider two basic elements:

Vol 20, No. 11;Nov 2013
- probability of event occurrence (P), determined with the help of some
physical-geographical indicators (geographical position, land declivity, substratum
permeability, flow and section of adjacent hydrographic artery, etc.),
- vulnerability of the city (V), determined with the help of some socio-
economic indicators (demographic potential, infrastructure, value of buildings, etc.).
2. OPERATIONAL OBJECTIVES
In this context, the study aims to approach one of the most important and
dangerous problems that threatens the socio-economical activity and the environment
of inhabited areas namely the floods produced by the upstream watercourses, runoff
waters on the slopes of the inhabited areas, as well as the measures of mitigating the
effects of floods. We propose a Support System of Decision (SSD) composed of an
oriented database, a set of methods and models to determine the manner of formation
and propagation of flash foods in inhabited areas and the transport of pollutants that
lead to the identification of vulnerable human settlements.
To expand the current data base, proposals are made regarding its completion
and modernization for an integrated monitoring through a network of automatic
stations at the ground and satellite observation systems. GIS methodologies
developed for each of the problems announced must be adapted to different types of
physical-geographic and demographic conditions, the infrastructure features of
discharge systems of wastewater and urban rainwater, the types of land use and land
cover. In this regard, it has been developed an urban typology to which the sets of
methods and models will relate.
The implementation of these models has been made through case studies for the
inhabited areas that fall into different typologies. In the paper we have detailed and
mapped the floods in Moldavia, on Siret and Prut rivers, in July 2010. Consulting the
main factors involved in urban water problems as well as the local representatives,
including activities regarding dissemination of paper outcomes to beneficiaries will
be important objectives designed to substantiate the proposed solutions in terms of
public perception and provide capitalization of results achieved.
3. CONCEPTUAL FRAMEWORK
The development of the database structure, on which the analysis was based,
started from the quantification of the role and the importance of the cities as nodal
points in the geographical space organization. As a first step it has been developed an
analysis methodology of the types and areas of impact that human ecosystem has on
structuring the areas of influence in relation to different types of spatial organization
(macro territorial, meso territorial, micro territorial). Variability of these sizes is
determined by what is considered “whole” in all its complexity. On this basis we
passed to features identification of different types of biunivocal impact: human
settlement – area of influence, in relation to the relief potential, taking into
consideration the distribution of settlements on large relief units and hypsometric
Vol 20, No. 11;Nov 2013
steps, to which we added their positioning according to hydrographic arteries. The
purpose of this action is to indicate territorial extent and limits of human settlements
subsystems that will be taken into consideration in future research steps. If
physiognomic aspect is often obvious and does not involve only explanatory issues
related to succession of main sequences, of great importance is noting the character of
energy flows, of substance and information. According to the specifics of these flows,
by extension, there have been distinguished several obvious morphological types
(Ianoş, 1993):
a. Substance and energy flows with convergent character, specific
configuration of a system identified with a depression, with an area of influence of an
urban center or a functional area focused on urban systems. In the first case we
witness, on one hand, the trends of draining the water to a main collector and natural
transportation of material from the slopes to the center of the system, on the other
hand, the orientation of the main currents of raw materials and goods to settlements
usually located at the lowest altitude point. Gravity is fundamental in guiding these
flows;
b. Substance and energy flows with divergent character. This character is easily
noticed in the case of a territorial system that overlaps or belongs to a mountain or
deep rural areas. Orientation of flows is in both cases divergent and their structure
depends on the physical and economical-geographic parameters of that system.
Accessibility, altitude differentiation and geographical position are aspects that
influence more or less the divergent nature of these flows of substance and energy.
This type of flows orientation could also be seen in a plain unit, but it is characterized
by a lack of internal polarizing center, respectively an unpolarized territory (or
weakly polarized). In such a framework, movements of population, agricultural
products and other raw material resources are directed to adjacent areas;
c. Substance and energy flows with linear character, particular to transverse
valleys, where usually there is some dominance of matter and energy circulation, due
to their role in the restricted area or function that performs the connection between
the two adjacent regions. Within typical transverse valleys (valley corridors) there is
some equivalence between inflows and outflows, the former being slightly modified
quantitatively or qualitatively. Linearity of energetic and mass flows remains
dominant, even in the case of some internal changes caused by the existence of
certain economic and urban centers, medium or large, of receiving major tributaries
in that sector.
These configurations are easy to be shaped at macro and medium-scale, being
useful in setting the general framework to develop certain models of current
organization of territorial systems. The next step of the scientific approach was to
evaluate the potential of the environment as a premise of classification of human
settlements according to their vulnerability to different types of floods. Highly
complex operation, the assessment of the environment potential focuses mainly on
the knowledge of resources and their state. At micro territorial level, the assessment
of the environment potential is made through a detailed analysis of the main
Vol 20, No. 11;Nov 2013
components according to the analyzed geosystem. The assessment of the geological,
geomorphologic, topoclimatic, biogeographical, hydrological, etc. resources does not
constitute a methodological or technical difficulty. However the problem must be
correlated with the overall degree of vulnerability of the geosystem, with the
consumption thresholds from which its evolution may deviate from the normal
trajectory.
4. STRUCTURE OF DATABASE
The last purpose of the analysis was the assessment of the degree of geosystem
anthropization, essential condition to detect critical areas/ points, respectively those
thresholds of geosystems in which the imbalance between resource consumption and
available main resources is so high that it risks to degrade the whole territorial
system. Three categories of parameters have been analyzed:
- level of the human loads, measured by population density, given that a high
value indicates an increased pressure on space and environmental elements;
- spatial type of anthropization that refers to the configuration of the areas
affected by the increase in the degree of geosystem population. There are three
categories: punctual anthropization (in the situation of some isolated human centers),
linear anthropization (along a river, a means of communication or the sea coast) and
surface anthropization, in the field regions.
- temporal nature, according to which we distinguish a permanent, continuous
anthropization, whose intensity can be progressive quantified, a temporary one (given
by the exploitation of resources in compact natural areas) and a seasonal one, typical
of alpine areas (Drobot et al., 2008).
The degree of anthropization is responsible for the complexity accentuation of
the geosystems, and its assessment, even a global one, can become an important
element in sustainable development strategies.
On these considerations, we have developed the database structure on the basis
of three sub-modules:
4.1. Geological and geomorphologic indicators: geology, geomorphology,
lithology and soils, whose final quantification is the assessment of the permeability
degree of the substratum on which the human settlements have developed. Therefore,
we have named this category of indicators – indicators of substratum. To this we have
added its position in relation to the main valley which is a major source of
vulnerability to flooding: in flood plain, in valley corridors and depressions
(convergence areas of the water on the slopes), on flat interfluves (areas of stagnant
water from flood) or slopes (areas of divergence of water, protected from flooding);
4.2. Hydro-climatic indicators, represented by the amount of precipitations and
their regime, the hydrologic regime, flows, hydrological sections, etc.;
4.3. Socio-economic and demographic indicators, represented on one hand by
the demographic potential and on the other hand by the sanitary and the urban
technical infrastructure.

Vol 20, No. 11;Nov 2013
The importance of each of these indicators to establish flood risk was assessed
by assigning grades from 0.1 (for indicators that determine a minimum vulnerability
of the anthropic ecosystem) to 1 (for indicators that determine a maximum
vulnerability of the anthropic ecosystem).
4.1. Assessment of geological and geomorphologic indicators
In Romania, most human settlements are located in depressions, valley
corridors, and as micro relief units in meadows, terraces, slopes and interfluvial
fields. Thus, the micro relief units, more or less fragmented, provide conditions for
water stagnation and infiltration together with the characteristic petrography. In
meadows, where marsh phenomena are frequent, the meadow alluvial deposits, which
are mainly composed of friable impermeable sedimentary rocks (clays, marls) do not
allow water infiltration. From this point of view, their positioning in most part of the
meadow or meadow terrace (with meadow alluvial deposits represented by clays,
marls etc., impermeable rocks that do not allow water infiltration), expose the
settlements to flooding.
The settlements situated in low inclined terraces, slopes, interfluves with a
specific petrography (gravel, sand) that allow water infiltration, are less exposed to
these phenomena. Also, piedmont glaciers, piedmont schists and alluvial cones both
by slope inclination and characteristic petrography (gravels, conglomerates, sands)
that favor drainage and water infiltration, provide favorable conditions for the
development of human settlements.
In plain units, most settlements are located along the main hydrographic
arteries, in meadows, terraces and less on interfluvial fields. Those located in the
Danube Meadow or even in the meadow terrace present the highest vulnerability to
flooding, also those located in Argeş, Olt, Jiu, Buzău, Siret meadow, etc. The
meadow deposits (clays, marls) are impermeable favoring water stagnation. The same
situation occurs in the other relief units. In the Western Plain, most human
settlements are located both in the flood plains of the main hydrographic arteries
(Bârzava, Timiş, Crişuri, Someş etc.) and on the interfluvial fields that belong to the
plain of subsidence (digression) characterized by a continuous process of subsidence
and in which the ground-water layer is close to the surface, and the rivers have a
frequent tendency to break out.
In Moldavian Plateau, Getic Plateau, Mehedinţi Plateau and Western Hills,
human settlements are located mostly along the main hydrographic arteries and in
depressions, occupying river meadows and terraces but also the interfluves and the
slopes.
The Transylvanian Depression comprises over 40 cities located on the large
river terraces, in depressions and at the contact of the mountain with the hill.
Settlements in Carpathians are also located mostly in depressions and in valley
corridors and as relief micro-forms in meadows, terraces, connection slopes,
piedmont glaciers, etc.

Vol 20, No. 11;Nov 2013
Evaluation of settlements was achieved taking into account two criteria: that of
the location from the point of view of the micro relief (meadows, terraces, interfluvial
fields, piedmont accumulations, etc.) and that of the lithologic substratum, assigning
grades from 0 to 1 that indicates vulnerability to flood risk.
Regarding the location of human settlements in microforms of relief, the
terraces, slopes, piedmont glaciers, interfluvial fields, alluvial cones, which due to
sharp slopes or flat interfluves do not allow water stagnation, have received grades
from 0 to 0.5 indicating reduced exposure to flood risk. Settlements located in
meadows, meadow terraces or in interfluvial fields of digression, due to the position
towards the hydrographic network and the ground-water layer located close to the
surface, have received grades from 0.5 to 1 indicating a higher vulnerability to flood.
Settlements located according to the lithological substratum, the alluvial
deposits from the meadow or the interfluvial fields of digression (clay, marl, mud,
etc.) that due to impermeability favor water stagnation, have received grades from 0.5
to 1 indicating a high exposure to flood risk. Human settlements having as a
substratum terrace deposits (gravels, sands and conglomerates) that favor water
infiltration, have received grades between 0 and 0.5 showing a reduced vulnerability
to flood. The same qualifiers have been obtained by settlements situated on piedmont
glaciers, alluvial cones composed mainly by highly permeable rocks (conglomerates,
gravels), and also by those whose extension is on the slopes of hills or mountain
slopes where limestones, sandstones, crystalline schists or volcanic rocks are
predominant, but due to the incline they do not allow water accumulation.
From the common assessment of microrelief and petrography in urban areas,
we distinguished cities that are not vulnerable to flood: Amara, Anina, Babadag, Balş,
Baraolt, Băicoi, Băile Govora, Băile Olăneşti, Vaslui, Victoria, Zărneşti etc., but also
the cities that are vulnerable to flood: Moreni, Nucet, Satu Mare, Timişoara etc.
However, we noticed that most cities, regardless of the major unit of relief in which
they are framed, are located from the point of view of microforms in meadows and
terraces with particular lithological composition, followed by slopes, interfluvial
fields, piedmont glaciers, etc.
Changes in land cover together with natural hazards such as torrential rains and
floods can lead to soil degradation and river pollution, affecting thus the agricultural
and industrial activities as well as the quality of life in the region.
4.2. Assessment of hydro-climatic indicators
According to the data provided by the Intergovernmental Panel on Climate
Change (IPCC), the average global temperature increased by 0.6 degrees in the last
century and it continues to rise. Central and Eastern Europe underwent a period of
rapid changes both politically and economically, whose effects were also felt on the
quality of the environment. The main environmental issues specific to this region are
natural hazards (torrential rains, land slides, floods, droughts and forest fires) and
changes in precipitations regime.

Vol 20, No. 11;Nov 2013
These aspects are inter-conditioned and play an important role in the process of
regional economic and social development. In the last two decades, it has been
discovered that a local but important increase in precipitations has major implications
on social and economical system at regional and even global level. In this sense,
scenarios for the 21st century are some of the worst. Only in 2003, a heat wave caused
nearly 3,000 deaths in France; in 2005 in Romania 62 people died in areas affected by
floods and in the spring of 2006 the Danube reached historical levels and destroyed
entire villages, while the summer came with rains and floods in the illegal deforested
areas.
Atmospheric warming melts the polar ice cap, raises the level of the planetary
ocean and changes significantly the life of animals and plants. Temperatures above
20 ° C occur in the middle of winter, snowstorm over the blooming trees in March,
tornadoes and violent storms. It is clear that we need to prepare for a new world, a
world that people created by interfering in the natural course of nature through
industrialization and demographic development.
The Black Sea has already begun to flood the Romanian seaside. According to
a study (Sâmbotin, 2006), Mamaia resort loses 2 meters of beach each year and if
nothing will be done, in 2033 it will disappear entirely.
On the other hand, transition from one season to another will be suddenly,
which will enhance the perception of two seasons. However, there will still be spring,
summer, autumn and winter, only that they will look slightly different from what they
were a few decades ago. There won’t be snow during the whole period of the cold
season, and the famous frosts brought by the air masses from Siberia will soften,
because in the north of Asia it is expected a more accentuated warming than the
global average warming. Also, the summer won’t be as canicular the whole period.
There will be heat waves and cold waves with record temperatures that will overturn
the forecast statistics. In this context, the distribution of precipitations will record
anomalies increasingly larger. It will rain more and often in the north-west of the
country, while southern Romania will be marked by drought, and the destruction of
the irrigation systems will increase its effect. The most convincing example is given
by the recent flooding in Banat, Danube Valley and Moldavia, in parallel with strong
droughts that affected Bărăgan, Oltenia Plain, southern Moldavia and Dobrogea. The
period 2005-2010 highlighted in the years of meteorological observations after 1874
as an exceptional period regarding precipitation amount summed up month by month,
especially in the warm semester, only in 2005 it has been registered nationally 7
waves of floods with catastrophic effects, resulting in property damage of over 1
billion euros and the loss of 62 human lives.
Rainfalls recorded in Romania were in excess, on extensive areas, especially in
the south and the south-east of the country, having a torrential character in most
situations, causing significant exceeding (over 50%) of the average multiannual
quantities at 76 from the 160 meteorological stations in operation. Water amounts
were particularly high in Oltenia, Muntenia and Dobrogea. Among the highest
amounts registered in 24 hours we mention: 220 mm at Biruinţa and 154 mm at

Vol 20, No. 11;Nov 2013
Mangalia (in Constanţa County), 128 mm at Răchiţele and 127 mm at Mălureni (in
Argeş County), 124 mm at Moroieni and 123 mm at Malu cu Flori (in Dâmboviţa
County) etc.
On the strength of a synoptic situation favorable on extensive areas in Europe,
in Romania, especially in the year 2005 there were registered intervals with thermal
extremes, atmospheric instability and associated meteorological phenomena with
unusual intensity and historical precipitations amount. Under these circumstances,
besides the synoptic situation that provides the image of exposure to excess rainfall,
an important role is played by the geographical position of human settlements both in
the units and subunits of relief, their location at the level of micro units of relief, and
the demographic potential and the sanitary and urban technical infrastructure.
4.3. Assessment of demographic indicators and indicators of social &
urban infrastructure
In areas with different degrees of vulnerability there are elements of socio-
economical risk that include: population, buildings, civil engineering constructions,
economical activities, public services, utilities and infrastructures subject to risk in a
given area.
Of the many risk factors that can be considered, there were selected several
indicators: demographics (number of inhabitants), urban technical infrastructure
(number of dwellings, street length, the length of the water supply network, the length
of the sewerage network, the length of the natural gas distribution pipes) and social
infrastructure (number of hospitals, clinics, pharmacies, doctors and medium
qualified medical staff). These indicators were applied on the sample of urban
settlements, thought to be the most representative in terms of vulnerability to
flooding.
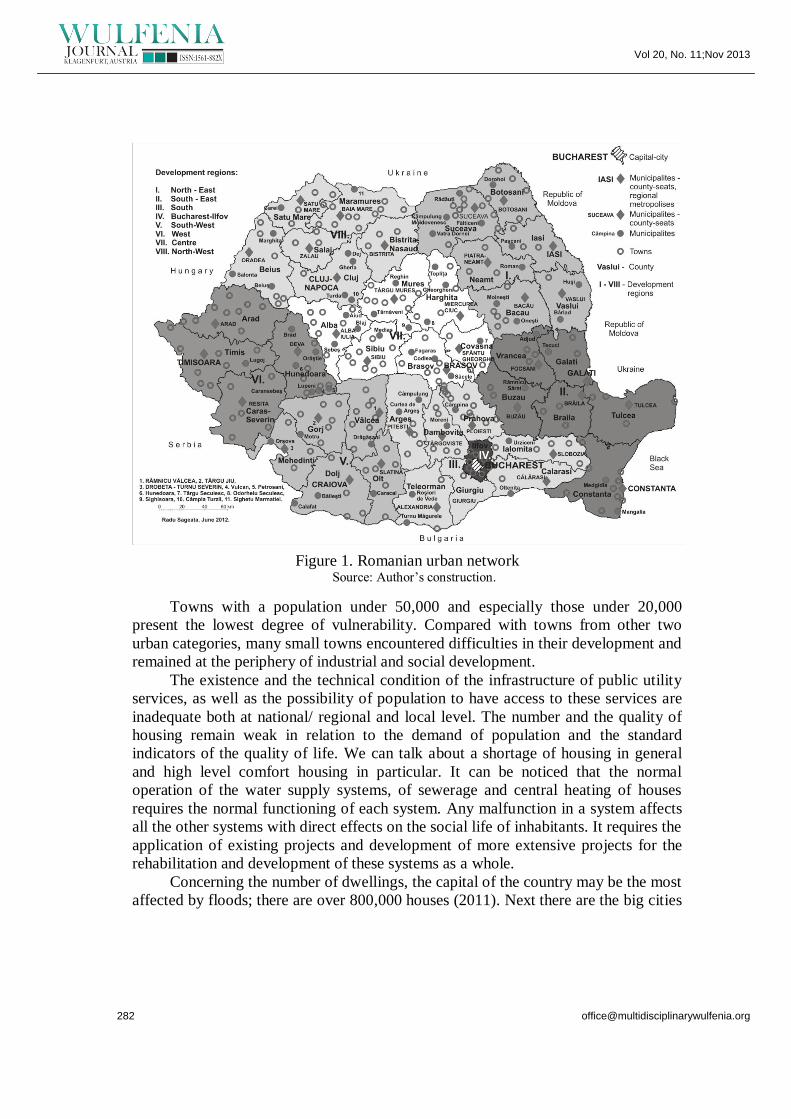
Romanian urban network (Figure 1) consists mainly of small and medium
cities, under 100,000 inhabitants, these representing 9/10 from their total number, and
within this category, towns under 20,000 inhabitants account for more than half.
Their demographic contribution to total urban population of the country is
significant, but as relative proportion, it has constantly decreased over the last quarter
century. Big cities with over 100,000 inhabitants, that are otherwise less numerous
(17 towns in 2011 census) present the highest degree of vulnerability (0.6 – 1). In the
postwar period, they were established as a separate size category within the urban
national system, their number decreasing compared to previous years (at the census
of 2002 there were 24). Currently these include a part of the county seats and
represent important industrial and service centers in Romania. They are major nodal
points in the national transport network or university and culture centers, etc.
The average degree of vulnerability (0.4) is specific to cities with a number of
people between 50,000 and 100,000. Thanks to the high degree of concentration of
giant units with industrial profile and the lack of functional flexibility, medium-sized
towns are currently a vulnerable category, their future evolution being conditioned by
the correlation between industrial restructuring and tertiary sector development.
Vol 20, No. 11;Nov 2013
Figure 1. Romanian urban network Source: Author’s construction.
Towns with a population under 50,000 and especially those under 20,000
present the lowest degree of vulnerability. Compared with towns from other two
urban categories, many small towns encountered difficulties in their development and
remained at the periphery of industrial and social development.
The existence and the technical condition of the infrastructure of public utility
services, as well as the possibility of population to have access to these services are
inadequate both at national/ regional and local level. The number and the quality of
housing remain weak in relation to the demand of population and the standard
indicators of the quality of life. We can talk about a shortage of housing in general
and high level comfort housing in particular. It can be noticed that the normal
operation of the water supply systems, of sewerage and central heating of houses
requires the normal functioning of each system. Any malfunction in a system affects
all the other systems with direct effects on the social life of inhabitants. It requires the
application of existing projects and development of more extensive projects for the
rehabilitation and development of these systems as a whole.
Concerning the number of dwellings, the capital of the country may be the most
affected by floods; there are over 800,000 houses (2011). Next there are the big cities

Vol 20, No. 11;Nov 2013
with a lower vulnerability to floods: Timişoara, Cluj-Napoca, Constanţa, Braşov, Iaşi,
Galaţi and Craiova with an index of 0.7. Other cities such as Ploieşti, Oradea, Brăila
also have a high vulnerability index. The lowest value is registered by small cities; a
special place being held by recently declared urban centers.
The lengths of urban streets potential floodable vary between 1,821 km in
Bucharest and 7 km in Scorniceşti. As in the previous cases, towns subject to higher
vulnerability are those with large population and over 3,000 km in length of street.
Water distribution system is the most developed in Bucharest; hence it presents
a higher vulnerability to floods. On the opposite side there are the new urban centers
that are deficient from the point of view of urban technical infrastructure (Cajvana,
Miercurea Nirajului, Copşa Mică, Fundulea, Bechet, Răcari, Nucet, Budeşti, Turceni,
Dragomireşti, Bragadiru, Bălceşti, Mihăileşti, Potcoava, Titu, Tălmaciu, etc). They
have less than 5 km length of network.
Sewerage systems vary between 1,811 km in Bucharest and 0.2 km in
Comarnic. Hence, theoretically, if they function properly, large towns and the capital
present the lowest vulnerability while small cities are subject to higher vulnerability.
Natural gas distribution network is of great importance in case of floods.
Damages will be raised in those cities where the length of the network is big, for
example Bucharest (2,446.6 km), Cluj-Napoca, Ploieşti, Braşov, Arad, Timişoara,
Iaşi (between 416.1 and 302.6 km). The least affected from this point of view will be
cities where natural gas distribution network is inexistent (over 100 urban centers).
The health system in Romania is still poor and heavily dependent on public
finances, as a management system, with growing inequities regarding the provision of
health services and lacked of the capacity to respond to local needs. An important
indicator of the assessment of health level in Romania is the average number of
employees in this field. After 1993 it has been registered a decrease in the number of
employees, due to the health care reform.
In terms of the number of hospitals, only 3 cities have over 10 hospitals:
Bucharest, Iaşi and Cluj-Napoca. Generally, most cities have only one hospital or
even none. The same as hospitals, clinics are reduced in number; most of them are in
Bucharest, Timişoara, Craiova, Târgu Mureş, Ploieşti (over 10 units); these cities
have a lower intensity of risk. Most cities are characterized by a reduced number of
clinics.
On the contrary, pharmacies have increased greatly during the transition period,
the capital having approximately 500 units, being followed by Iaşi, Constanţa and
Oradea (between 100 and 125). Even in small cities, there are 1 or 2 pharmacies or
even more. This positive dynamic has contributed to lower the risk in case of
flooding.
The number of doctors and the medium qualified medical staff can provide a
rapid intervention in case of disasters; the higher this number is, the size of the risk
will be lower. Thus, the number of doctors varies between about 8,000 people in
Bucharest and 1 person in small cities such as Bereşti or Băbeni. On the top of the
hierarchy, with over 1,000 doctors are cities such as Cluj-Napoca, Iaşi, Timişoara,

Vol 20, No. 11;Nov 2013
Craiova, Oradea, Târgu Mureş and Constanţa. Similarly, the medium qualified
medical staff range from approximately 19,000 people in capital and 2 people in
Băbeni or Piatra-Olt. More than 200 cities have fewer than 100 medium qualified
people, and of these more than 110 have fewer than 50 people. This can be important
for risk assessment.
5. CLASSIFICATION OF ROMANIAN CITIES IN TERMS OF
VULNERABILITY TO FLOODS
Practically, all physical-geographical units of Romania comprise urban systems
in a permanent process of development and diversification. There is an equilibrated
distribution according to the functionality of the geographical areas (mountain, hill
and plateau, field). We can certainly notice the influence of certain factors:
altitude: about 90% of current cities are situated between 0 and 400 m;
however, we have to indicate that some of these are cities from the mountain region
(situated in mountain or sub-mountain depressions or near the contact with the
adjacent regions);
river water: over 90% of cities are located on river waters recognized in the
hydrographic network of the country (18 on Danube, 12 on Mureş, 10 on Olt, 9 on
Crişuri and respectively on Jiu, 6 on Someşuri and respectively on Prahova etc). Any
of these cities present the same vulnerability of the flood;
presence of certain commercial roads (in the past) or major rail or road
ways of communication, in modern or contemporary period (only 34 of current cities
have an indirect location, respectively at 5-30 km, rarely more towards main lines and
highways).
The diverse geographical features of Romanian territory express different
vulnerabilities concerning floods. From the point of view of the causes that determine
vulnerability, cities of Romania can be grouped in the following categories (Figure
2):
A. Cities vulnerable to floods due to insufficient drainage. The situation is
characteristic to plain cities, especially those in Western Plain, where low altitudes,
flat relief and lithologic features do not lead to gravitational drainage of waters from
precipitations (for example Pecica, Nădlac, Săcueni, Carei, Tăşnad, Jimbolia,
Timişoara, Arad, Ineu, Lipova, Sânnicolau Mare etc.).
B. Cities vulnerable to floods due to overflowing of adjacent hydrographic
arteries at large flash floods (over 1/3 of Romanian cities). Vulnerability to floods of
these cities increases in spring because of the waters brought by snowmelt to which
heavy rainfalls are added, but also in autumn because of high amounts of
precipitations (for example Galaţi, Slobozia, Odorheiu Secuiesc, Săliştea de Sus,
Murgeni, Horezu, Novaci, Bumbeşti-Jiu, Avrig, Tălmaciu, Făgăraş etc.).

Vol 20, No. 11;Nov 2013
Figure 2. Flood vulnerability in Romanian cities
1. Cities vulnerable to floods due to insufficient drainage caused by local lithological and topographic features. 2. Cities vulnerable to floods due to overflowing of adjacent hydrographic arteries at large
flash floods. 3. Cities vulnerable to floods occurred because of accumulation of large amounts of water
that can not be taken by secondary hydrographic arteries or maladministration of flow control from
upstream hydro-technical constructions. 4. Cities vulnerable to floods due to sewerage systems
insufficiently dimensioned. 5. Cities vulnerable to floods due to water intake from the slopes.
Source: Author’s construction.
C. Cities vulnerable to floods occurred because of large amounts of water
accumulation that can not be taken by secondary hydrographic arteries or
maladministration of flow control from upstream hydro-technical constructions. This
category includes approximately 60 cities with a total population of about 4.5
millions inhabitants: Bucharest, Iaşi, Oradea, Bacău, Piteşti, Buzău, Botoşani,
Râmnicu Vâlcea, Suceava, Piatra Neamţ, Târgu Jiu, Slatina, Bârlad, Turda, Mediaş,
Oneşti, Paşcani, Caracal, Curtea de Argeş, etc., towns located in the flooded areas, or
just some parts. The common characteristic of all of them is insufficient drainage of
surface water.
D. Cities vulnerable to floods due to sewerage systems insufficiently
dimensioned. The rapid urbanization during the communist period led to the
declaration of some cities that have not been provided with all the elements of an
appropriate urban endowment. One of the compromises refers to sewerage systems.
Because of their under-sizing or later because of their poorly maintenance associated
with the expansion of built space, in case of heavy rainfall in a short period of time,

Vol 20, No. 11;Nov 2013
precipitation waters can not be taken by drains, and discharge affecting
communications and housing (Bucharest, Constanţa, Tulcea, Brăila, Vaslui, Iaşi,
Suceava, etc).
E. Cities vulnerable to floods due to water intake from the slopes. This
category includes most cities situated in sub-mountain and intra-mountain
depressions. Slopes deforestation during the recent years increased cities vulnerability
to floods (Baia de Arieş, Teiuş, Făget, Pucioasa, Câmpina, Abrud, Aiud, Câmpeni,
Cugir, Ocna Mureş, Sebeş, Zlatna, Câmpulung, Bacău, Oneşti, Buhuşi, Dărmăneşti,
Moineşti, Târgu-Ocna, Aleşd, Beiuş, Marghita, etc).
However, in most cases, the causes of flood vulnerability of Romanian urban
centers are associated: insufficient drainage due to lithological substratum can be
associated with water intake from the slopes or the inappropriate sewerage systems,
etc.
6. MAPPING OF FLOODED AREAS.
CASE STUDY: FLOODS IN MOLDAVIA ON SIRET AND PRUT RIVERS,
IN JULY 2010
Embankment systems performed in Moldavia, on Siret and Prut rivers, have
been dimensioned for flows that proved to be underappreciated as compared to real
flows produced in the last decades, thereby floods succeeded periodically. These
floods are generated by increases in flow and levels with exceeding of danger rates
associated with flash flood propagation previously formed, with possible major leak
on slopes, torrents and streams that produce local floods, leading to breaking of dams
and amplifying flooding effects.
In this context, in the summer of 2010 catastrophic floods occurred on Siret,
Olt, Someş-Tisa, Prut and Mureş rivers and affected a total of 161.36 km of dams and
160.39 km of bank protections (source: National Administration “Romanian
Waters”). From a total of 187 affected dams, 48 have been on Siret River and 27 on
Prut River.
Floods were due primarily to exceptional rainfall (160 l/m2 in Suceava County
and about 200 l/m2 in Botoşani County) that determined exceeding of flood quotas in
Suceava Basin and the superior basins of Siret, Prut and Jijia rivers. The flash flood
wave on Siret occurred in the morning of 30 June, downstream the Lespezi village
(Iaşi County) when it was registered a flow of about 2000 m3/s, comparable to that
registered at floods in July 2008. The combined effects of floods on Siret and Bistriţa,
associated with controlled discharges from upstream lakes generated significant water
accumulation northeast of Bacău (in Şerbeşti-Săuceşti perimeter) (Figure 3), and
those on Bârlad and Siret, downstream the hydrographic subsidence and convergence
aria of the two rivers, especially in Fundeni-Nămoloasa perimeter (Figure 4). On Prut
River, the most vulnerable area proved to be the perimeter of Stânca-Costeşti
reservoir, as a result of flooding caused by river (mostly from the Ukrainian sector)
associated with controlled discharges from the reservoir. In this area it was taken as a
case study Sadoveni-Ripiceni perimeter (Figure 5).

Vol 20, No. 11;Nov 2013
Figure 3. Floods on Siret in Şerbeşti – Săuceşti sector.
Situations on 1 July 2010 and 5 July 2010 1. Siret River, 2. The area flooded on 1 July 2010, 3. The area flooded on 5 July 2010, 4. Localities, 5.
Forests, 6. Road communication networks, 7. Railways. Source: Author’s construction.
For the identification and the mapping of flooded areas we have used
LANDSAT-7 ETM satellite images from July 2010, radiometric and geometric
corrected, topographic map, UTM projection, 35 North areas at 1:100,000 scale and
WGS 84 Datum. In order to accomplish the experimental geographic database and
the operations of processing satellite images we have used Quantum GIS software,
version 1.7.
The photogrammetric reference points used for geo-referencing satellite images
were determined in the field by GPS technology, being selected from the list of
support network for photogrametric locating, provided by specialized institutions
from the analyzed area. As a mathematic method of transformation it has been
selected the method of polynomial transformation that ensures a high precision in
transformation and for the resampling of the geo-referenced images it has been
selected the method of the nearest neighbor, ensuring high quality to resulting image.

Vol 20, No. 11;Nov 2013
Figure 4. Floods on Siret in Fundeni – Nămoloasa sector. Situation on 3 July 2010 1. Siret River, 2. Flooded area on 3 July 2010, 3. Localities, 4. Road communication networks, 5.
Irrigation channel, 6. Forests. Source: Author’s construction.
Figure 5. Floods on Prut in Sadoveni – Ripiceni sector. Situation on 4 iulie 2010. 1. Prut River and Stânca-Costeşti Reservoir, 2. Flooded area, 3. Localities, 4. Forests.
Source: Author’s construction.

Vol 20, No. 11;Nov 2013
The geo-referencing of the topographic map has been accomplished on the
basis of the points that define the corners of the trapezoid at 1:100,000 scale.
In developing the geographical database we have chosen a relational structure,
with stratified organization according to classes of processed information and distinct
layers for hydrologic information extracted from satellite images.
Hydrologic information regarding flooded areas, extracted from the geo-
referenced satellite images, has been analyzed and overlaid on geo-referenced
cartographic support, resulting maps with flash flood situation in the area of Serbesti-
Săuceşti; Fundeni-Nămoloasa and Sadoveni-Ripiceni localities, for the analyzed
moments.
REFERENCES
Bastié, J., Dézert, B., 1980. L’espace urbain, Masson, Paris, New York, Barcelona,
Milano.
Bălteanu, D., Cioacă, A., Dinu Mihaela, Sandu Maria, 1996. Some case of
geomorphological risk in the Curvature Carpathians and Subcarpahians,
RRGGG-Geogr., Edit. Academiei, Bucureşti.
Bălteanu D., 1992. Natural hazards in Romania, Revue Roumaine de Géografie,
Tome 36, Edit. Academiei Române, Bucureşti.
Bălteanu D., Cheval S., Şerban Mihaela, 2004. Evaluarea şi cartografierea
hazardelor naturale şi tehnologice la nivel local şi naţional. Studii de caz., vol.
“Fenomene şi procese cu risc major la scară naţională”, coord.: F. Filip, B.
Simionescu, Editura Academiei Române, Bucureşti.
Bălteanu D., Costache Andra, 2006. Conceptul de vulnerabilitate. Aplicaţii în
geografie, Revista Geografică, XII, Institutul de Geografie, Academia Română,
Bucureşti.
Bogdan, Octavia, Niculescu, Elena, 1999. Riscurile climatice din România, Academia
Română, Institutul de Geografie, Bucureşti.
Bogdan, Octavia, Marinică, I., 2007. Hazardele meteo-climatice din zona temperată.
Geneză şi vulnerabilitate cu aplicaţie la România, Edit. Univ. „Lucian Blaga”,
Sibiu.
Cova, T.J., Church, R.L., 1997. Modeling Community Evacuation Vulnerability
Using GIS, International Journal of Geographical Information Science, 11, pp.
763-784.
Cutter, L., Susan, 1996. Vulnerability to Environmental Hazards, Progress in Human
Geography 20, pp. 529-539.
Cutter, L., Susan, Mitchell, T., Jerry, Scott, S. Michael, 2000. Revealing the
Vulnerability of People and Places: A Case Study of Geogrgetown County,
South Carolina, Annals of Association of American Geographers, 90, 4, pp.
713-737.

Vol 20, No. 11;Nov 2013
Drobot Radu, Maria-Ilinca Alexandrescu, Săgeată Radu, Chendeş Viorel, 2008.
Water Related Crisis in Urban Areas, în vol. Conference Excellence Reseach –
a Way to Innovation, Section 2: Environement and Health, edt. Nicolae Vasiliu
& Szabolcs Lanyi., pp. 71.1-71.6.
Fothergill, A., 1996. Gender, Risk, and Disaster, International Journal of Mass
Emergencies and Disasters, 14 (1), pp. 33-56.
Guran-Nica, Liliana, Roznovieţchi, Irena, 2002. Rolul vulnerabilităţii sociale în
determinarea „vulnerabilităţii locului”. Studiu de caz: Carpaţii şi Subcarpaţii
din judeţul Buzău, Revista Geografică, VIII, 2001, pp. 144-152.
Hewitt, K., edt. 1997. Regions of Risk: A Geographical Introduction to Disasters,
Essex, Longman.
Ianoş, I., 1993. Riscul geoecologic urban, în Mediul Inconjurător, IV, 4, pp. 67-71.
Johnson, J., Zeigler, D., 1986. Evacuation Planning for Technological Hazard: An
Emerging Imperative, Cities, 3, pp. 148-156.
Liverman, D., 1990. Vulnerability to Global Environmental Change, în
Understanding Global Environmental Change, ed. R. Kasperson, et al.,
Worcester, MA: Clark University.
McMaster, R., 1988. Modeling Community Vulnerability to Hazardous Materials
Using Geographic Information Systems, Proceedings, 3rd
International
Symposium on Spatial Data Hndling, Columbus, Ohio State University, pp.
143-156.
Nae, M., 2006. Geografia calităţii vieţii urbane. Metode de analiză, Edit.
Universitară, Bucureşti.
Săgeată Radu, Persu Mihaela, Dumitrescu Bianca, 2007. Sistem suport de decizie în
gestiunea apelor urbane – URBWATER, în Analele Ştiinţifice ale Universităţii
„Al. I. Cuza”, Iaşi, t. LIII, s. II, Lucrările Simpozionului Sisteme Informaţionale
Geografice, 13, Edit. Universităţii „Al. I. Cuza”, Iaşi, pp. 73-90.
Săgeată Radu, Dumitrescu Bianca, Grigorescu Ines, Persu Mihaela, 2008. Typologies
of urban vulnerability to flooding in Romania, în Quality. Acces to Succes,
Year 9, no. 54, vol. I, International Conference „Ecological Performance in a
Competitive Economy”, Bucharest, 2008, pp. 60-68.
Sâmbotin, A., 2006. Metode numerice de prognoză a modificărilor morfologice
litorale ale plajelor produse de către lucrările costiere, Institutul Naţional de
Cercetare – Dezvoltare pentru Protecţia Mediului – ICIM, Bucureşti.
Surdeanu, V. edit. 2002-2007. Riscuri şi catastrofe, Casa cărţii de ştiinţă, Cluj-
Napoca.
***, 2005. România. Spaţiu, Societate, Mediu, Editura Academiei Române,
Bucureşti.
***, 2008. URBWATER – Manual de bune practici. Sistem suport de decizie în
gestiunea situaţiilor de criză generate de apă în zonele urbane. Proiect CEEX
nr. 71/2005, Edit. Conspress, Bucureşti.