Methodological proposal for implementing an intervention to prevent pedestrian injuries, a...
10
Methodological proposal for implementing an intervention to prevent pedestrian injuries, a multidisciplinary approach: the case of Cuernavaca, Morelos, Mexico Jorge M Rodríguez, 1,2 Martha Híjar Medina, 1 Julio César Campuzano, 1 Shrikant I Bangdiwala, 3,4 Andrés Villaveces 5 1 National Institute of Public Health of Mexico—Center for Health Systems Research, Cuernavaca, Morelos, México 2 Centro de Proyectos Para el Desarrollo (Cendex), Universidad Javeriana, Bogotá, Capital District, Colombia 3 UNC Injury Prevention Research Center, University of North Carolina at Chapel Hill, Chapel Hill, North Carolina, USA 4 Department of Biostatistics, Gillings School of Global Public Health, University of North Carolina at Chapel Hill, Chapel Hill, North Carolina, USA 5 Cisalva Institute, Universidad del Valle, Cali, Velle, Colombia Correspondence to Dr Andrés Villaveces, Cisalva Institute, Oficina 114, Universidad del Valle, San Fernando Calle 4B # 36-00 Cali, Valle 25360 Colombia; [email protected] Received 5 February 2013 Accepted 17 March 2013 To cite: Rodríguez JM, Híjar Medina M, Campuzano JC, et al. Inj Prev Published Online First: [ please include Day Month Year] doi:10.1136/injuryprev- 2013-040776 ABSTRACT Objective To describe the process for implementing an intervention to prevent pedestrian injuries in Cuernavaca, Mexico, using a multidisciplinary and evidence-based approach. Methodology This study included two phases with several stages. The first was an overall assessment of pedestrian mortality in Cuernavaca that included a comparison of pedestrian mortality between Cuernavaca and the rest of Morelos State (1998–2007), an analysis and geocoding of pedestrian injuries (2008–2009), and a description of techniques for selecting and analysing clustered events using road audits. The second phase focused on selecting an intervention through a review of the literature seeking the ‘best evidence’ adaptable to the local context and a methodological evaluation for implementation including techniques for cluster randomisation and for the evaluation of possible effects of the intervention. Results Between 2008 and 2009, in Cuernavaca there were 620 pedestrian injury events: 59.4% were men, the mean age was 36.3 years, 70% occurred during daylight hours, 55% had mild severity and there were no differences by sex (p>0.05). We generated evidence, that when combined with the results from a systematic search of the literature, provided sufficient information for the implementation of a pedestrian injury prevention intervention. Conclusions A combination of strategies and disciplines makes it possible to comprehensively address this public health problem, allowing interventions to strengthen aspects of pedestrian safety while accounting for characteristics of the local context; the promotion of local measures, of low cost and high impact, with modifications to the road infrastructure, are more effective in addressing pedestrian vulnerabilities. INTRODUCTION Pedestrian injuries represent as much as 80% of fatalities in some areas of the world. 12 Pedestrian fatalities occur more in low-income countries (35% to 80%) relative to high-income countries (10% to 15%). 2 Pedestrians involved in road traffic events are usually economically active men, heads of households, whose absence can significantly impact household income. 3 In low-income and middle-income countries, pedestrian injuries occur primarily on public roads, in urban zones and where there is a ‘mixture’ of users (that is, slow and vulnerable pedestrians, street vendors and cyclists sharing spaces with high-speed motor vehicles with a lack of separation space that increases injury risk). 4 Pedestrian survi- vors are more severely injured and require more care compared to other users, 5 and medical costs for prolonged care, the loss of heads of households, funeral costs and loss of income due to disability can plunge families into poverty. 6 In Mexico in 2007, there were 4972 fatal pedes- trian injuries corresponding to a mortality rate of 4.7/100 000 inhabitants. Cuernavaca, the capital of Morelos State, is located 90 km from Mexico City and is on a main tourism travel corridor. In 2006, the city reported a pedestrian mortality rate of 8.5/100 000 inhabitants, 7 higher than the national average for the same year. Given the high rates of pedestrian fatal injuries in Cuernavaca, our objective was to design an intervention aimed at reducing pedestrian injuries adapted to this locality, using an approach based on epidemiological, geographical and engineering criteria, and using a solid evidence base. MATERIALS AND METHODS To look at mortality rates, we used across-sectional design and divided our strategy into two phases. The first was a baseline description of pedestrian fatal injuries in Cuernavaca and the second was the development of a proposal for an evidence-based intervention and guidelines to implement it. Phase 1: baseline description of pedestrian injuries Characterisation of fatal injuries We first sought to establish the magnitude of pedes- trian fatalities in Cuernavaca by comparing fatal- ities there with other municipalities in the State of Morelos using official death certificates available from the National Geography and Statistics Institute (INEGI) for 1998–2007. 7 We classified outcomes using International Classification of Diseases, 10th edition (ICD-10) codes V03, V04 and V09, as primary cause of injury. 8 We collected information on victims’ age, sex, marital status, schooling, occupation, medical insur- ance, and place and hour of event occurrence. We calculated averages for continuous variables and percentages for categorical variables and used Student t tests and χ 2 tests where appropriate to establish the significance of differences. We calcu- lated standardised mortality rates (SMRs) per Rodríguez JM, et al. Inj Prev 2013;0:1–8. doi:10.1136/injuryprev-2013-040776 1 Study protocol IP Online First, published on April 19, 2013 as 10.1136/injuryprev-2013-040776 Copyright Article author (or their employer) 2013. Produced by BMJ Publishing Group Ltd under licence. group.bmj.com on April 30, 2013 - Published by injuryprevention.bmj.com Downloaded from
-
Upload
independent -
Category
Documents
-
view
1 -
download
0
Transcript of Methodological proposal for implementing an intervention to prevent pedestrian injuries, a...

Methodological proposal for implementingan intervention to prevent pedestrian injuries,a multidisciplinary approach: the case ofCuernavaca, Morelos, MexicoJorge M Rodríguez,1,2 Martha Híjar Medina,1 Julio César Campuzano,1
Shrikant I Bangdiwala,3,4 Andrés Villaveces5
1National Institute of PublicHealth of Mexico—Center forHealth Systems Research,Cuernavaca, Morelos, México2Centro de Proyectos Para elDesarrollo (Cendex),Universidad Javeriana, Bogotá,Capital District, Colombia3UNC Injury PreventionResearch Center, University ofNorth Carolina at Chapel Hill,Chapel Hill, North Carolina,USA4Department of Biostatistics,Gillings School of Global PublicHealth, University of NorthCarolina at Chapel Hill, ChapelHill, North Carolina, USA5Cisalva Institute, Universidaddel Valle, Cali, Velle, Colombia
Correspondence toDr Andrés Villaveces,Cisalva Institute, Oficina 114,Universidad del Valle, SanFernando Calle 4B # 36-00Cali, Valle 25360 Colombia;[email protected]
Received 5 February 2013Accepted 17 March 2013
To cite: Rodríguez JM, HíjarMedina M, Campuzano JC,et al. Inj Prev PublishedOnline First: [please includeDay Month Year]doi:10.1136/injuryprev-2013-040776
ABSTRACTObjective To describe the process for implementing anintervention to prevent pedestrian injuries in Cuernavaca,Mexico, using a multidisciplinary and evidence-basedapproach.Methodology This study included two phases withseveral stages. The first was an overall assessment ofpedestrian mortality in Cuernavaca that included acomparison of pedestrian mortality between Cuernavacaand the rest of Morelos State (1998–2007), an analysisand geocoding of pedestrian injuries (2008–2009), anda description of techniques for selecting and analysingclustered events using road audits. The second phasefocused on selecting an intervention through a review ofthe literature seeking the ‘best evidence’ adaptable tothe local context and a methodological evaluation forimplementation including techniques for clusterrandomisation and for the evaluation of possible effectsof the intervention.Results Between 2008 and 2009, in Cuernavaca therewere 620 pedestrian injury events: 59.4% were men,the mean age was 36.3 years, 70% occurred duringdaylight hours, 55% had mild severity and there were nodifferences by sex (p>0.05). We generated evidence,that when combined with the results from a systematicsearch of the literature, provided sufficient informationfor the implementation of a pedestrian injury preventionintervention.Conclusions A combination of strategies anddisciplines makes it possible to comprehensively addressthis public health problem, allowing interventions tostrengthen aspects of pedestrian safety while accountingfor characteristics of the local context; the promotion oflocal measures, of low cost and high impact, withmodifications to the road infrastructure, are moreeffective in addressing pedestrian vulnerabilities.
INTRODUCTIONPedestrian injuries represent as much as 80% offatalities in some areas of the world.1 2 Pedestrianfatalities occur more in low-income countries (35%to 80%) relative to high-income countries (10% to15%).2 Pedestrians involved in road traffic eventsare usually economically active men, heads ofhouseholds, whose absence can significantly impacthousehold income.3
In low-income and middle-income countries,pedestrian injuries occur primarily on public roads,in urban zones and where there is a ‘mixture’ ofusers (that is, slow and vulnerable pedestrians,
street vendors and cyclists sharing spaces withhigh-speed motor vehicles with a lack of separationspace that increases injury risk).4 Pedestrian survi-vors are more severely injured and require morecare compared to other users,5 and medical costsfor prolonged care, the loss of heads of households,funeral costs and loss of income due to disabilitycan plunge families into poverty.6
In Mexico in 2007, there were 4972 fatal pedes-trian injuries corresponding to a mortality rate of4.7/100 000 inhabitants. Cuernavaca, the capital ofMorelos State, is located 90 km from Mexico Cityand is on a main tourism travel corridor. In 2006,the city reported a pedestrian mortality rate of8.5/100 000 inhabitants,7 higher than the nationalaverage for the same year. Given the high rates ofpedestrian fatal injuries in Cuernavaca, our objectivewas to design an intervention aimed at reducingpedestrian injuries adapted to this locality, using anapproach based on epidemiological, geographicaland engineering criteria, and using a solid evidencebase.
MATERIALS AND METHODSTo look at mortality rates, we used a cross-sectionaldesign and divided our strategy into two phases.The first was a baseline description of pedestrianfatal injuries in Cuernavaca and the second was thedevelopment of a proposal for an evidence-basedintervention and guidelines to implement it.
Phase 1: baseline description of pedestrianinjuriesCharacterisation of fatal injuriesWe first sought to establish the magnitude of pedes-trian fatalities in Cuernavaca by comparing fatal-ities there with other municipalities in the State ofMorelos using official death certificates availablefrom the National Geography and StatisticsInstitute (INEGI) for 1998–2007.7 We classifiedoutcomes using International Classification ofDiseases, 10th edition (ICD-10) codes V03, V04and V09, as primary cause of injury.8
We collected information on victims’ age, sex,marital status, schooling, occupation, medical insur-ance, and place and hour of event occurrence. Wecalculated averages for continuous variables andpercentages for categorical variables and usedStudent t tests and χ2 tests where appropriate toestablish the significance of differences. We calcu-lated standardised mortality rates (SMRs) per
Rodríguez JM, et al. Inj Prev 2013;0:1–8. doi:10.1136/injuryprev-2013-040776 1
Study protocol IP Online First, published on April 19, 2013 as 10.1136/injuryprev-2013-040776
Copyright Article author (or their employer) 2013. Produced by BMJ Publishing Group Ltd under licence.
group.bmj.com on April 30, 2013 - Published by injuryprevention.bmj.comDownloaded from

100 000 and 95% CIs for municipalities, and classified them aslow (0–65.1), medium (>65.1–153.0) and high (>153.0). Wesubsequently mapped all events by municipality. The denomin-ator for rates calculation was obtained from the NationalPopulation Council.9
Statistical techniques for baseline registries of injured personsWe obtained pedestrian fatalities information in Cuernavaca for2008/2009. Individual level information was obtained at prehos-pitalisation services in Cuernavaca, including age, sex, and placeand time of occurrence of the event. We examined the statisticalsignificance of differences in mortality by sex. We also collectedinformation about the social context of the basic geostatisticalarea (BGSA), including presence/absence of schools, businesses/markets, medical units, sports/recreational areas and marginal-isation indices (a summary indicator of nine socioeconomiccharacteristics), used to assign pedestrian injuries according tothe zones where they occurred.10
We conducted multiple analyses by BGSAwith count data modelsincluding zero-inflated Poisson (ZIP), zero-truncated Poisson (ZTP)and negative binomial (NB) distributions (figure 1).11 The depend-ent variable was the number of pedestrian injuries by BGSA duringthe study period and the independent variables corresponded to thepopulation characteristics chosen for the BGSAs. The AkaikeInformation Criteria (AIC) was used to compare the modelsanalysed.12
Georeferencing of injured pedestrians in CuernavacaWith prehospitalisation registries, pedestrian injuries were manu-ally georeferenced, using ArcGIS software to identify the placewhere they occurred. We lacked enough information for propergeocoding, so to address this we (a) allocated cases in the neigh-bourhood centre when only the street name and neighbourhoodwas known; (b) when intersections did not coincide but a streetwas known, we located events in that street and correspondingneighbourhood; and (c) we eliminated five records for which nostreet or neighbourhood information was available (figure 2).13
Cluster selectionUsing maps, we detected the clusters where the greatestnumbers of pedestrian injuries were concentrated (figure 3). Wechose a convenience sample of 6 of 15 that met the followinginclusion criteria: ≥3 events per year, within urban perimeter,with similar land use (commercial, residential, mixed, and soon), on arterial roads, with similar pedestrian and vehicle flows,and for which we obtained permission from the transit author-ities. The clusters selected within the city were analysed usingroad audits. These were conducted by transportation engineer-ing professionals and included observation of the physical envir-onment (presence of pedestrian bridges, analysis of traffic lightcycles and traffic signs). The purpose was to consider pedestrianexposures and assign possible interventions that would best suiteach evaluated site.
Phase 2: intervention proposal for reducing pedestrianinjuries in CuernavacaSystematic literature searchA systematic literature search was conducted to determine ‘bestpractices’ for an intervention to reduce the risk of pedestrian injur-ies. The above procedure involved accessing various databases—Medline, Bireme, Lilacs and Scielo—using the keywords‘pedestrian-injuries/fatalities’, ‘pedestrian-vehicle-crashes’, ‘prevention-accidents-traffic’ and ‘road-safety’. In addition, information fromkey authors was obtained.14
Techniques for the random assignment of groupsWe will use a prospective design with a comparison site, similarto a community-based trial.15 The use of various strategies is sug-gested, including pairing and random selection, in an effort toguarantee the comparability between intervention andFigure 1 Decision algorithm for choosing the model with count data.
Figure 2 Analysis of individual and environmental factors forpedestrian injuries in Cuernavaca by, basic geostatistical area (BGSA).GIS, geographic information system.
2 Rodríguez JM, et al. Inj Prev 2013;0:1–8. doi:10.1136/injuryprev-2013-040776
Study protocol
group.bmj.com on April 30, 2013 - Published by injuryprevention.bmj.comDownloaded from

comparison sectors, according to the distribution of land use,number of road movements, pedestrian and vehicular flows; theassignment of the intervention would be on certaincombinations.16
The sample size will take into account the design effect(DEFF) and the correlation of the repeated measurements overtime. The intersections are considered conglomerates and therepeated measurements over time are considered units.Assuming a DEFF of 1.5, 16 annual pedestrian fatal injuries ateach sites, a reduction of 80% in the intervention sites (from 16to 3), 3 repeated measurements, about 3–4 intervention andcomparison sites will be required to achieve a power of 80%17
to evaluate the effectiveness of the intervention with 5% levelof significance.
Statistical techniques to evaluate the intervention resultsTo assess the intervention effect, the use of mixed effects (multi-level) models for count data is proposed. The measurementwould be quarterly (4 times in year); the dependent variable cor-responds to the number of events that occur quarterly at eachsites (intervention and comparison); fitting will be performedwith information collected at baseline level and during follow-upat the study zones, and will include possible confounders such astraffic and pedestrian flow counts, number of intersections, pres-ence or not of pedestrian bridges, traffic lights, pedestrian cross-walks, speed bumps, land use categorisation, street lights, trafficsignals and speeds limits, bus stops, tree canopies and visuallyobstructive structures.18 To control for seasonal trends in thebehaviour of pedestrian injuries during the study period, the vari-able time should be included using models that allow the man-agement of this characteristic.19 The Ethical and Research
Committees of the National Institute of Public Health of Mexicoapproved this study.
RESULTSPhase 1: diagnostics and baseline characterisationCharacterisation of mortality in Morelos and CuernavacaBetween 1998 and 2007, there were 701 pedestrian injurydeaths in Morelos State, giving an average rate of 4.1/100 000inhabitants, while in Cuernavaca the rate was 9.5/100 000; 3times higher for men than for women. The average age ofdeaths was 48.5 years old for those who died in Cuernavaca and42.6 years old for those who died in other parts of the state(table 1). The SMR in Cuernavaca was high at 215 (95% CI192 to 239).
Results from baseline data of injured personsDescriptive informationA total of 620 people were reported as cases of fatal pedestrianinjury by 4-wheel automobiles (table 2). It was possible to geor-eference 91.1% of those deaths. These were distributedthroughout 70% BGSAs in Cuernavaca (figure 4), and theywere concentrated in BGSAs with low and very low marginalisa-tion indexes (table 3).
Multiple analyses of baseline dataDifferent data count models were used to analyse the occur-rence of fatal pedestrian injuries. The Poisson distribution wasnot adequate for two reasons: first, for equal dispersion, themean and variance are very different (mean=4.7 and vari-ance=36); second, there are an excessive amount of zeros. Weconsidered the ZIP, ZTP and the NB distributions. Table 4
Figure 3 Standardised mortality ratios in all the municipalities of Morelos, Mexico, 1998–2007.
Rodríguez JM, et al. Inj Prev 2013;0:1–8. doi:10.1136/injuryprev-2013-040776 3
Study protocol
group.bmj.com on April 30, 2013 - Published by injuryprevention.bmj.comDownloaded from

shows the Relative Risk Index with the various models.Pedestrian injuries were located primarily in high-income andvery-high-income zones within Cuernavaca. There was an asso-ciation between schools presence and pedestrian fatal injuriesrisk by BGSA (p<0.05).
Georeferencing of injured persons in CuernavacaWe found that roughly 25% of pedestrian injuries occurredalong principal arterial avenues, 10% on secondary streets withintermediate–moderate flow and 20% in adjacent zones (eg,
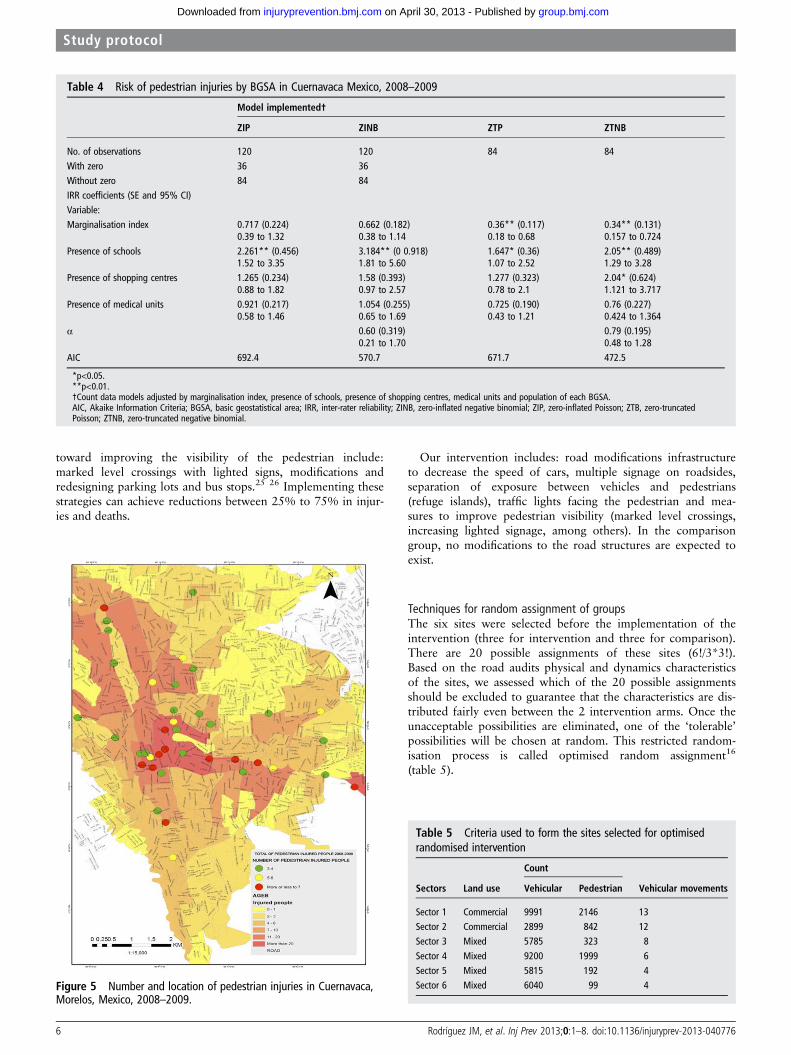
near to the downtown area) without special patterns accordingto road. The remaining group occurred sparsely throughout thecity. Cuernavaca city has 150/200 intersections with ≥1 pedes-trian injuries per year, and of these, at least 15 have ≥3 fatalpedestrian injuries (figures 4 and 5).
Selection and cluster analysesRoad audits were planned and implemented after selecting clus-ters and a transportation engineer supervised three groups oftechnicians with knowledge on how to conduct the audits. The
Table 1 Characteristics of fatal pedestrian fatalities in Cuernavaca and other municipalities in the State of Morelos, Mexico 1998–2007
CharacteristicsCuernavaca,n=327 (%) 95% CI
Other municipalitiesin Morelos, n=374 (%) 95% CI
SexMale 74.2 69.5 to 79.0 77.5 73.3 to 81.8Female 25.8 25.8 to 24.3 22.5 18.2 to 26.7
Marital statusSingle 27.8 22.9 to 32.7 30.5 25.8 to 35.2Widower 26.0 21.2 to 30.8 22.5 18.2 to 36.7Divorced 8.0 5.0 to 10.9 7.0 4.4 to 9.5Married/cohabitating 16.8 12.7 to 20.9 18.5 14.5 to 22.4Not specified 21.4 16.9 to 25.9 21.7 17.5 to 25.9
SchoolingNo schooling 18.3 14.1 to 22.6 17.7 13.8 to 21.5Primary 29.4 24.4 to 34.3 34.0 21.1 to 38.8Secondary/Baccalaureate 32.1 27.0 to 37.2 29.7 25.0 to 34.3Professional 5.8 3.2 to 8.4 4.3 22.2 to 6.3No information 14.4 10.6 to 18.2 14.5 10.9 to 18.0
OccupationUnemployed 27.2 22.4 to 32.1 20.9 16.7 to 24.9Technical-professional 5.8 3.3 to 8.4 5.1 2.8 to 7.3Farmer 9.2 6.0 to 12.3 20.0 16.0 to 24.1Operator 19.3 14.9 to 23.6 20.0 16.0 to 24.1Merchant/peddler 17.4 13.3 to 21.6 9.4 13.3 to 21.6Housework/guards 5.8 3.3 to 8.4 4.0 2.0 to 6.0Other 15.3 11.4 to 19.2 20.6 16.5 to 24.7
Social securityNone 62.4 57.1 to 67.7 73.3 68.8 to 77.8IMSS 29.7 24.7 to 34.6 20.1 16.0 to 24.1ISSSTE 5.2 2.8 to 7.6 4.0 2.0 to 4.0Other institutions 2.8 1.0 to 4.5 2.7 1.0 to 4.3
Medical assistanceYes 48.6 43.2 to 54.1 19.3 15.2 to 23.3No 29.7 24.7 to 34.6 54.0 48.9 to 59.1No information 21.7 17.2 to 27.2 26.7 22.2 to 31.2
Population centre size
Less than 20 000 19.5 15.2 to 23.9 54.0 48.9 to 51.220000 to 100 000 10.8 7.4 to 14.4 19.9 15.8 to 24.0More than 100 000 69.7 64.6 to 74.7 26.1 21.6 to 30.6
Injury event place of occurrenceRoad 77.1 72.5 to 81.6 79.4 75.3 to 83.5Residential area 11.9 8.4 to 15.5 10.2 7.1 to 13.2Commercial or industrial
area3.7 1.6 to 5.7 1.9 0.5 to 3.2
No information 7.3 4.5 to 10.2 8.6 5.7 to 11.4Time of death
Morning 45.2 39.7 to 50.6 46.7 41.5 to 51.8Afternoon 9.4 6.1 to 12.5 10.3 7.1 to 13.4Night 45.5 40.0 to 50.9 43.1 37.9 to 48.2
IMSS, Instituto Mexicano del Seguro Social (Mexican Institute of Social Security); ISSSTE, Instituto de Seguridad y Servicios Sociales de los Trabajadores del Estado (Institute of SocialSecurity and Services for Government Workers).
4 Rodríguez JM, et al. Inj Prev 2013;0:1–8. doi:10.1136/injuryprev-2013-040776
Study protocol
group.bmj.com on April 30, 2013 - Published by injuryprevention.bmj.comDownloaded from

selected sites were studied with satellite photos and were visitedbefore measurement; a description and diagram of the roadswas made, as well as their location within the municipality’sroad system. They analysed movement patterns, vehicular flow,as well as traffic light timing, pedestrian flows, with a descrip-tion of the different movements. Each zone was divided by side-walk location, and the spaces designed for pedestrians wereanalysed. Possible situations that reduce road safety in the sector(deteriorated horizontal and vertical signage, poor visibility dueto the presence of tree branches, vehicles parked in prohibited
places, among others) were identified. The complete results ofthe road audits are available in another report.20 21
Phase 2: proposal for an intervention to reduce pedestrianinjuries in CuernavacaSystematic literature searchPrimary prevention strategies were identified that improved roadsafety through actions aimed at decreasing the occurrence ofpedestrian injuries. Three levels of interventions are involved:(a) the human level, directed toward improving attitudes andbehaviour by pedestrians and drivers; (b) the vehicular levelaimed at improving mechanical conditions and safety such aslights, breaks, management of speed, among others; and (c) theenvironmental level, where actions have been designed andimplemented to modify road or highway structures to controlthe speed of cars, separate exposure between vehicles and pedes-trians and improve pedestrian visibility.2 22 23
Speed reduction strategies include: humps and similar struc-tures, road reflectors, narrowing of roads, rotaries, chicanes andmultiple signals over or on the side of roads.24 Measures to sep-arate exposure between vehicles and pedestrians, in terms ofspace and time include: pedestrian bridges, barriers, barricades,sidewalks, pedestrian refuge islands and installation of pedes-trian walk lights at high-risk intersections. Measures directed
Table 2 Characteristics of fatal and non-fatal pedestrian injuries caused by motor vehicles in Cuernavaca, Mexico, 2008–2009
Characteristics Men (%) 95% CI Women (%) 95% CI
Age 34.9 32.6 to 37.2 38.4 35.7 to 41.0Year of occurrence2008 49.5 44.3 to 54.6 51.7 45.2 to 58.12009 50.5 45.4 to 55.7 48.3 41.9 to 54.7
Trimester of occurrenceJanuary to March 23.9 19.5 to 28.3 25.6 20.0 to 31.2April to June 22.3 18.0 to 26.5 26.5 20.8 to 32.1July to September 27.2 22.6 to 31.7 24.0 18.5 to 29.4October to December 26.6 22.1 to 31.2 24.0 18.5 to 29.4
Time of injuryDay 67.9 63.2 to 72.7 74.7 69.1 to 80.3Night 32.1 27.3 to 37.8 25.3 19.7 to 30.9
SeverityMild 538 48.6 to 58.9 56.5 50.2 to 62.9Moderate 35.3 30.3 to 40.3 35.9 29.7 to 42.0Severe 7.0 4.3 to 9.6 5.5 2.6 to 8.4Fatal 3.9 1.9 to 5.9 2.1 0.3 to 3.9
Day: 7:00–19:00. Night: 19:00–7:00.
Figure 4 Pedestrian injuries in Cuernavaca, Morelos, Mexico, 2008.
Table 3 Occurrence of pedestrian injuries by socioeconomic levelin Cuernavaca, Mexico 2008 and 2009
Occurrence of injuries by BGSA
Socioeconomic level No. of injuries Yes % No % Total
Very low 59 11 13.1 11 30.5 22Low 408 51 60.7 7 19.4 58Middle 95 20 23.8 11 30.5 31High 7 2 2.4 6 16.7 8Very high 0 0 0 1 2.8 1Total 565 84 100 36 100 120
BGSA, basic geostatistical area.
Rodríguez JM, et al. Inj Prev 2013;0:1–8. doi:10.1136/injuryprev-2013-040776 5
Study protocol
group.bmj.com on April 30, 2013 - Published by injuryprevention.bmj.comDownloaded from
toward improving the visibility of the pedestrian include:marked level crossings with lighted signs, modifications andredesigning parking lots and bus stops.25 26 Implementing thesestrategies can achieve reductions between 25% to 75% in injur-ies and deaths.
Our intervention includes: road modifications infrastructureto decrease the speed of cars, multiple signage on roadsides,separation of exposure between vehicles and pedestrians(refuge islands), traffic lights facing the pedestrian and mea-sures to improve pedestrian visibility (marked level crossings,increasing lighted signage, among others). In the comparisongroup, no modifications to the road structures are expected toexist.
Techniques for random assignment of groupsThe six sites were selected before the implementation of theintervention (three for intervention and three for comparison).There are 20 possible assignments of these sites (6!/3*3!).Based on the road audits physical and dynamics characteristicsof the sites, we assessed which of the 20 possible assignmentsshould be excluded to guarantee that the characteristics are dis-tributed fairly even between the 2 intervention arms. Once theunacceptable possibilities are eliminated, one of the ‘tolerable’possibilities will be chosen at random. This restricted random-isation process is called optimised random assignment16
(table 5).
Table 5 Criteria used to form the sites selected for optimisedrandomised intervention
Count
Sectors Land use Vehicular Pedestrian Vehicular movements
Sector 1 Commercial 9991 2146 13Sector 2 Commercial 2899 842 12Sector 3 Mixed 5785 323 8
Sector 4 Mixed 9200 1999 6Sector 5 Mixed 5815 192 4Sector 6 Mixed 6040 99 4
Table 4 Risk of pedestrian injuries by BGSA in Cuernavaca Mexico, 2008–2009
Model implemented†
ZIP ZINB ZTP ZTNB
No. of observations 120 120 84 84With zero 36 36Without zero 84 84IRR coefficients (SE and 95% CI)Variable:Marginalisation index 0.717 (0.224) 0.662 (0.182) 0.36** (0.117) 0.34** (0.131)
0.39 to 1.32 0.38 to 1.14 0.18 to 0.68 0.157 to 0.724Presence of schools 2.261** (0.456) 3.184** (0 0.918) 1.647* (0.36) 2.05** (0.489)
1.52 to 3.35 1.81 to 5.60 1.07 to 2.52 1.29 to 3.28Presence of shopping centres 1.265 (0.234) 1.58 (0.393) 1.277 (0.323) 2.04* (0.624)
0.88 to 1.82 0.97 to 2.57 0.78 to 2.1 1.121 to 3.717Presence of medical units 0.921 (0.217) 1.054 (0.255) 0.725 (0.190) 0.76 (0.227)
0.58 to 1.46 0.65 to 1.69 0.43 to 1.21 0.424 to 1.364α 0.60 (0.319) 0.79 (0.195)
0.21 to 1.70 0.48 to 1.28AIC 692.4 570.7 671.7 472.5
*p<0.05.**p<0.01.†Count data models adjusted by marginalisation index, presence of schools, presence of shopping centres, medical units and population of each BGSA.AIC, Akaike Information Criteria; BGSA, basic geostatistical area; IRR, inter-rater reliability; ZINB, zero-inflated negative binomial; ZIP, zero-inflated Poisson; ZTB, zero-truncatedPoisson; ZTNB, zero-truncated negative binomial.
Figure 5 Number and location of pedestrian injuries in Cuernavaca,Morelos, Mexico, 2008–2009.
6 Rodríguez JM, et al. Inj Prev 2013;0:1–8. doi:10.1136/injuryprev-2013-040776
Study protocol
group.bmj.com on April 30, 2013 - Published by injuryprevention.bmj.comDownloaded from

DISCUSSIONCuernavaca had high SMRs between 1998 and 2007; the highdeath rates per 100 000 inhabitants were similar to those seenin Mexico City.27 These analyses were made with death certifi-cates; these have missing data, coding and registry errors (eg,treatment of injuries by paramedics was not identified in 25%of fatalities). Cuernavaca does not have epidemiological moni-toring systems to record, process, analyse and periodically dis-seminate road traffic incidents (RTIs).28 As a result of thisdeficiency, actions were planned and implemented to reconstructinformation on pedestrian injuries that occurred over 2 years;there were problems related to the quality of the records: forexample, 6% data was missing regarding the neighbourhoodwhere the injury occurred, primary and secondary roads werenot identified, there was lack of concordance between the roadand the neighbourhood, anecdotal sections were found, amongothers.29
The registries of prehospitalisation medical care for 2008–2009 were used to generate georeferencing processes, and withthe products—maps— clusters were detected within the city.These locations were analysed with road audits—tools little usedin public health. We must mention two limitations from this datasource. The first involves the use of centroid technique for geore-ferencing; in 2/6 clusters, 1/3 of its records were georeferencedby this technique, which may lead to differential measurementerrors with underestimates or overestimates of the occurrence ofthe event. Second, there was difficulty in measuring the severityvariable; although the prehospital care technicians used criteriasystematically, they did not have reliable measurements of theAbbreviated Injury Scale, Glasgow Coma Scale or traumaindices.30 Regarding the baseline data for this investigation, itwas found that most of the events occurred during daytimehours, which is contrary to reports by other researchers whohave shown that the majority occur during overnight hours.31
With respect to the information on pedestrian injuries byBGSA, several factors should be noted. First, the fact thatthe pedestrian injuries are occurring primarily in sectorswith low and very low marginalisation (high-income andvery-high-income zones) indicates that these locations have nodesign and infrastructure measures locally directed towards theprevention of these injuries and/or driver behaviour does nottake into account pedestrian vulnerability. Second, the informa-tion used by the registries of injuries was from 2008–2009,while the data from the BGSAs was from 2005. Between theseperiods, small changes may have occurred in the land patternsthat could cause a mistake in registering injuries in marginalisa-tion conditions. Third, the BGSAs where the most injuriesoccurred were those with more schools; nevertheless, this doesnot mean that school populations were those who were mostaffected—these results could induce an ecological fallacy inwhich the population results do not necessarily coincide withthe information at the individual level.32
With respect to modelling of the baseline data, the best distri-bution, with the lowest AIC, is the zero truncated NB; it esti-mated with greater precision the risk of fatal pedestrian injuriesand found a significant association between shopping centresand BGSAs not observed in other models. The results usedrobust measures to adjust for the heterogeneity that can exist inmodels.11 The selection method employed to choose clusters,although not random, used more inclusion criteria in an effortto guarantee the representativeness of locations with a higherrisk of pedestrian injuries in Cuernavaca33; the rigorous applica-tion of these criteria increases the validity of the study but candecrease generalisation of the results.
In the systematic review, we found that modifications andadjustments to the road environment decreased the risk of ped-estrian injuries. Architectonic changes over the medium andlong term improve the behaviour of pedestrians and drivers.Nevertheless, some researchers recognise that more rigorousinvestigations are needed, especially in low-income andmiddle-income countries.34 35 Even in high-income countries,few studies36 were categorised into high levels of evidence;also, the majority of investigations to reduce RTIs have focusedon drivers and vehicle occupants and little attention has beendirected toward the rest of the actors involved in RTIs. Withrespect to the intervention, it is expected to be of high impactand medium cost. As in the case of passive interventions, theyare intended to generate changes in the behaviour of drivers torecognise the vulnerability of pedestrians. Regarding the assign-ment suggested, optimised random assignment is employed sothat the covariables are distributed in a similar way among thepossible intervention and comparison arms. Thus, the possiblelimitation of ‘lack of comparability’ is minimised and the possi-bility of confounding and selection bias are decreased. Thefinal intervention will be the product of consensus amongresearchers, specialists in urban areas, transit authorities andurban engineers, supported by the findings, by the road audits,the systematic review of the literature and at the time it isagreed.
In a community-based type of trial, for each one of the sitesmonitored, it is important to take all precautions necessary toavoid contamination processes, which, when present, could biasthe estimator towards the null value, resulting in an increase intype II error (decrease in study power). With regards to the ana-lysis of the intervention results, another analytical strategy ismultilevel logistic regression, where the dependent variable cor-responds to the presence/absence of pedestrian injuries inintervention-comparison sites. If measures were repeated quar-terly, for 1 year before and after implementation of the trial,there would be 8 measurements in total at each site, resulting ina total of 48 measurements. This would increase the variabilityof the observations and increase the study power. Nevertheless,it is possible to increase the power in several ways: in thedesign, using more intersections or more repeated measure-ments over time, or increasing the intervention-comparison siteswith the same characteristics; and in the analysis, if the marginof error decreases after fitting the measured covariables37
(figure 1).In conclusion, this combination of strategies and approaches
makes it possible to comprehensively address traffic injuries inthis setting and allows interventions to strengthen aspects ofpedestrian safety while accounting for the characteristics of thelocal context; the promotion of such low-cost, high-impact localmeasures with modifications to the road infrastructure are thusmore effective in addressing pedestrian vulnerabilities especiallyin countries with more limited economic resources.
What is already known on this subject
▸ Pedestrians are at higher risk of injury and mortality thanindividuals using other modes of transportation.
▸ Most pedestrian injuries in Mexico occur to men ofeconomically active age.
▸ The city of Cuernavaca has higher rates of pedestrianinjuries than the national average of Mexico.
Rodríguez JM, et al. Inj Prev 2013;0:1–8. doi:10.1136/injuryprev-2013-040776 7
Study protocol
group.bmj.com on April 30, 2013 - Published by injuryprevention.bmj.comDownloaded from

Contributors JMR and MHM conceived the study, collected the data andcontributed to the analyses and writing of the manuscript. JCC contributed withdata collection processes, analyses of data and review of manuscript. SIB and AVcontributed to the analyses of the data, writing the manuscript and review ofdifferent versions of the manuscript.
Funding This work was funded by the National Council of Science and Technology(CONACYT) of México under project 114657 and also received partial support fromthe National Institute of Public Health of Mexico. Partial support for AV and SIBcame from a grant of the National Center for Injury Prevention and Control (NCIPC),to the UNC Injury Prevention Research Center under grant R149 CE000196.
Competing interests None.
Ethics approval The Mexican National Institute of Public Health approved thiswork.
Provenance and peer review Not commissioned; internally peer reviewed.
Data sharing statement Additional data are available for further analyses ofinterventions to the research group and technical personnel at the National Instituteof Public Health of Mexico.
REFERENCES1 Hijar M, Vazquez-Vela E, Arreola-Risa C. Pedestrian traffic injuries in Mexico: a
country update. Inj Contr Saf Promot 2003;10:37–43.2 Peden M, Scurfield R, Sleet D, et al., eds. World report on road traffic injury
prevention. Geneva: World Health Organization, 2004:41–4.3 Odero W, Garner P, Zwi A. Road traffic injuries in developing countries: a
comprehensive review of epidemiological studies. Trop Med Int Health1997;2:445–60.
4 Tiwari G, Mohan D, Fazio J. Conflict analysis for prediction of fatal crash locationsin mixed traffic streams. Accid Anal Prev 1998;30:207–15.
5 Hijar M, Arredondo A, Carrillo C, et al. Road traffic injuries in an urban area inMexico. An epidemiological and cost analysis. Accid Anal Prev 2004;36:37–42.
6 Hijar M, Trostle J, Bronfman M. Pedestrian injuries in Mexico: a multi-methodapproach. Soc Sci Med 2003;57:2149–59.
7 Instituto Nacional de Estadística y Geografía. Databases and records of mortalityfrom external causes and pedestrian injuries in Mexico 1998–2007. Cuernavaca:Instituto Nacional de Salud Pública Mexico, 2008.
8 World Health Organization. International statistical classification of diseases andrelated health problems. Geneva: World Health Organization, 2010.
9 National Population Council. Population projections for mexico 1995 to 2020.Mexico, DF: National Population Council, 2008.
10 Instituto Nacional de Estadística y Geografía. Urban marginalization in Mexico.Cuernavaca: Instituto Nacional de Salud Pública Mexico, 2007.
11 Salinas-Rodriguez A, Manrique-Espinoza B, Sosa-Rubi SG. Statistical analysisfor count data: use of healthcare services applications. Salud Pub Mex2009;51:397–406.
12 Cayuela L. Modelos lineales generalizados (GLM). Granada: Universidad deGranada, 2009.
13 Hijar-Medina MC. Usefulness of geographic analysis in the study of deaths causedby motor vehicle injuries. Salud Pub Mex 2000;42:188–93.
14 Rodríguez-Hernández JM, Campuzano-Rincón JC. Primary prevention measures forcontrolling pedestrian injuries and death and improving road safety. Rev SaludPublica (Bogota) 2010;12:497–509.
15 Murray DM, Varnell SP, Blitstein JL. Design and analysis of group-randomized trials:a review of recent methodological developments. Am J Public Health2004;94:423–32.
16 Kraschnewski JL, Keyserling TC, Bangdiwala SI, et al. Optimized probabilitysampling of study sites to improve generalizability in a multisite intervention trial.Prev Chronic Dis 2010;7:A10.
17 Lwanga SK, Lemeshow S. Sample size determination in health studies: a practicalmanual. Geneva: World Health Organization, 1991.
18 Kennedy JF. Estimating pedestrian volumes and crashes at urban signalized intersections.Falls Church, VA, USA: Virgina Polytechnic Institute and State University, 2008.
19 Villaveces A, Cummings P, Koepsell TD, et al. Association of alcohol-related lawswith deaths due to motor vehicle and motorcycle crashes in the United States,1980–1997. Am J Epidemiol 2003;157:131–40.
20 Arias C. Franco Auditoría en seguridad vial. Ambiente seguro: Intervenciones paraprevención de atropellamientos (ASIPA): Estudios viales. Cuernavaca: InstitutoNacional de Salud Publica, 2010:38.
21 Arias C Franco. Auditoría en seguridad vial. Ambiente seguro: Intervenciones paraprevención de atropellamientos (ASIPA): Problemática y propuestas. Cuernavaca:Instituto Nacional de Salud Publica, 2010:38.
22 Peek-Asa C, Zwerling C. Role of environmental interventions in injury control andprevention. Epidemiol Rev 2003;25:77–89.
23 Retting RA, Ferguson SA, McCartt AT. A review of evidence-based trafficengineering measures designed to reduce pedestrian-motor vehicle crashes. Am JPublic Health 2003;93:1456–63.
24 Bunn F, Collier T, Frost C, et al. Traffic calming for the prevention of road trafficinjuries: systematic review and meta-analysis. Inj Prev 2003;9:200–4.
25 Koepsell T, McCloskey L, Wolf M, et al. Crosswalk markings and the risk ofpedestrian-motor vehicle collisions in older pedestrians. JAMA 2002;288:2136–43.
26 Kwan I, Mapstone J. Interventions for increasing pedestrian and cyclist visibility forthe prevention of death and injuries. Cochrane Database Syst Rev 2006(4):CD003438.
27 Hidalgo-Solorzano E, Campuzano-Rincon J, Rodriguez-Hernandez JM, et al. Use andnon-use of pedestrian bridges in Mexico City. The pedestrian perspective. Salud PubMex 2010;52:502–10.
28 Celis A, Valdez LM, Armas J, et al. The injured pedestrian in motor vehicle trafficaccidents: mortality in Mexico, 1985–1996. Gaceta Med Mex 1999;135:353–8.
29 Hernández M, Garrido F, Salazar E. Sesgos. In: Hernández Avila M, ed.Epidemiología: diseño y análisis de estudios. Mexico, DF: Médica Panamericana,2007:253–68.
30 Stevenson M, Segui-Gomez M, Lescohier I, et al. An overview of the injury severityscore and the new injury severity score. Inj Prev 2001;7:10–13.
31 Campbell BJ, Zegeer CV, Huang HH, et al. A review of pedestrian safety research ofthe United States and abroad. McLean, VA: Federal Highway Administration,2004:150.
32 Morgenstern H. Ecologic studies in epidemiology: concepts, principles, andmethods. Ann Rev Pub Health 1995;16:61–81.
33 Morency P, Cloutier MS. From targeted “black spots” to area-wide pedestriansafety. Inj Prev 2006;12:360–4.
34 Ameratunga S, Hijar M, Norton R. Road-traffic injuries: confronting disparities toaddress a global-health problem. Lancet 2006;367:1533–40.
35 Mohan D. Road safety in less-motorized environments: future concerns. Int JEpidemiol 2002;31:527–32.
36 Schunemann HJ, Oxman AD, Brozek J, et al. Grading quality of evidence andstrength of recommendations for diagnostic tests and strategies. BMJ2008;336:1106–10.
37 Hayes RJ, Moulton LH. Cluster randomised trials. Boca Raton: CRC Press, 2009.
What this study adds
▸ Roughly one-quarter of pedestrian injuries occurred in mainarterial streets.
▸ In Cuernavaca, pedestrian injuries were concentrated in highand very high income areas.
▸ A strategy that accounts for pedestrian mortality incombination with a comprehensive assessment of physicalcharacteristics of the environment can be more effective ininforming prevention interventions for addressing pedestrianinjuries.
8 Rodríguez JM, et al. Inj Prev 2013;0:1–8. doi:10.1136/injuryprev-2013-040776
Study protocol
group.bmj.com on April 30, 2013 - Published by injuryprevention.bmj.comDownloaded from

doi: 10.1136/injuryprev-2013-040776 published online April 19, 2013Inj Prev
al.Jorge M Rodríguez, Martha Híjar Medina, Julio César Campuzano, et case of Cuernavaca, Morelos, Mexicoinjuries, a multidisciplinary approach: thean intervention to prevent pedestrian Methodological proposal for implementing
http://injuryprevention.bmj.com/content/early/2013/04/18/injuryprev-2013-040776.full.htmlUpdated information and services can be found at:
These include:
References t-1
http://injuryprevention.bmj.com/content/early/2013/04/18/injuryprev-2013-040776.full.html#ref-lisThis article cites 23 articles, 7 of which can be accessed free at:
P<P Published online April 19, 2013 in advance of the print journal.
serviceEmail alerting
the box at the top right corner of the online article.Receive free email alerts when new articles cite this article. Sign up in
CollectionsTopic
(766 articles)Epidemiologic studies � Articles on similar topics can be found in the following collections
(DOIs) and date of initial publication. publication. Citations to Advance online articles must include the digital object identifier citable and establish publication priority; they are indexed by PubMed from initialtypeset, but have not not yet appeared in the paper journal. Advance online articles are Advance online articles have been peer reviewed, accepted for publication, edited and
http://group.bmj.com/group/rights-licensing/permissionsTo request permissions go to:
http://journals.bmj.com/cgi/reprintformTo order reprints go to:
http://group.bmj.com/subscribe/To subscribe to BMJ go to:
group.bmj.com on April 30, 2013 - Published by injuryprevention.bmj.comDownloaded from

Notes
(DOIs) and date of initial publication. publication. Citations to Advance online articles must include the digital object identifier citable and establish publication priority; they are indexed by PubMed from initialtypeset, but have not not yet appeared in the paper journal. Advance online articles are Advance online articles have been peer reviewed, accepted for publication, edited and
http://group.bmj.com/group/rights-licensing/permissionsTo request permissions go to:
http://journals.bmj.com/cgi/reprintformTo order reprints go to:
http://group.bmj.com/subscribe/To subscribe to BMJ go to:
group.bmj.com on April 30, 2013 - Published by injuryprevention.bmj.comDownloaded from