Method for computing efficient electrical indicators for offshore wind turbine monitoring
6
Insight Vol 56 No 8 August 2014 443 WIND TURBINE CM The availability of offshore wind turbines is an important issue if such wind farms are to be considered a reliable source of renewable energy for the future. Environmental conditions and the low accessibility of such wind farms have contributed to a decrease in the availability of these wind turbines, compared to onshore ones. In order to improve reliability, condition monitoring systems and the implementation of scheduled maintenance strategies are a must for offshore power plants. This paper proposes a method for computing efficient electrical indicators using the available three-phase electrical quantities. These indicators are then to be used to obtain fault indicators for fault detection and diagnosis. The electrical indicators are obtained by using instantaneous symmetrical component decomposition, a well-proven method in the design and diagnosis of power networks. The new quantities are able to fully describe the whole electrical system and provide an effective means to quantify the balance and unbalance in the system. The method uses the electrical three-phase quantities measured at the output of the generator in a wind turbine to obtain the indicators. The performance of this method is illustrated using both synthetic and experimental data. 1. Introduction Wind power plants are a rather new and promising way of providing renewable energy. Moreover, as technology evolves, their reliability improves with time and modern wind turbines achieve quite a high availability [1] . However, unscheduled wind turbine failures most often result in high maintenance efforts, production losses and economical costs. To decrease losses and costs, efficient maintenance strategies have to be developed according to each wind farm’s specific needs. This need is further emphasised by the offshore deployment of wind farms. The offshore turbines have a much lower accessibility [1] , so maintenance work has to be planned well in advance. To correctly plan a maintenance strategy, condition monitoring of the systems and subsystems is needed. Several condition monitoring techniques have been developed and implemented in wind turbines [2] , such as vibrations, acoustic emissions or oil analysis. Most are intended to monitor the blades or mechanical parts (bearings, gears, shafts, etc), which are considered as critical wind turbine subassemblies. However, wind turbine electrical generators also have a high failure rate and generate a very high amount of downtime [1] . For such three-phase electrical systems, new approaches using electrical signals have to be developed. Raw three-phase electrical signals contain a great quantity of information about the system they are a part of, but are complex and difficult to interpret. In order to extract relevant features, the whole electrical information has to be split into different and specific indicators. One method used to separate such electrical information into meaningful quantities is symmetrical component decomposition [3] . This method was first developed by Fortescue in 1918 [4] and has since been widely used, for example in power network calculations [5] (network modelling and control, power quality monitoring, fault detection, etc). Symmetrical component decomposition approaches have also shown good results in monitoring three-phase electrical motors [6,7] . In this paper, this decomposition is used to analyse electric quantities measured at the output of a three-phase generator. The associated estimation algorithm provides several electrical features that can be further processed or directly used as fault indicators dedicated to the generator. The adopted sample-per-sample approach allows its online implementation and reaches good estimation and tracking performance in stationary and non-stationary cases. The theoretical considerations behind this method are presented in the next section, where the electrical features to be estimated are defined. Then, Section 3 gives an overview of the algorithm used to estimate these quantities. The proposed algorithm performance is studied in Section 4, with synthetic and experimental data measured on a small-scale wind turbine test-bench. Finally, the conclusions and future work are summarised in Section 5. 2. Method of electrical signature analysis for wind turbine monitoring Electrical subassemblies used in wind turbines, such as electrical generators, are three-phase systems. One efficient way to take into account the whole information contained in such systems is to use symmetrical component decomposition, as is customary for power networks [5] . From these symmetrical components, the design of fault indicators dedicated to the monitoring of such subassemblies can be expected. This idea is further developed in this second section, where the definition of symmetrical components is first given, followed by the proposition of some wind turbine electrical features that can be used to elaborate fault indicators. 2.1 Three-phase electrical system analysis 2.1.1 Balanced three-phase systems Most often, electrical signals and systems are analysed around their fundamental frequency f 0 . Indeed, the most relevant part of the whole electrical power is located around this particular frequency, where a lot of information is accessible. Following this consideration, electrical signals are often considered as pure sine waves of frequency f 0 with constant amplitude and original phase. A convenient notation for such a single-phase electrical signal x(t) Method for computing efficient electrical indicators for offshore wind turbine monitoring G Cablea, P Granjon and C Bérenguer Paper presented at CM 2014 / MFPT 2014, The Eleventh International Conference on Condition Monitoring and Machinery Failure Prevention Technologies, Manchester, UK, 10-12 June 2014 Georgia Cablea, Pierre Granjon and Christophe Bérenguer are with Gipsa- lab, Grenoble University, France. Email: georgia.cablea@gipsa-lab. grenoble-inp.fr / [email protected] / christophe. [email protected] DOI: 10.1784/insi.2014.56.8.443
-
Upload
grenoble-inp -
Category
Documents
-
view
1 -
download
0
Transcript of Method for computing efficient electrical indicators for offshore wind turbine monitoring

Insight Vol 56 No 8 August 2014 443
WIND TURBINE CM
The availability of offshore wind turbines is an important issue if such wind farms are to be considered a reliable source of renewable energy for the future Environmental conditions and the low accessibility of such wind farms have contributed to a decrease in the availability of these wind turbines compared to onshore ones In order to improve reliability condition monitoring systems and the implementation of scheduled maintenance strategies are a must for offshore power plantsThis paper proposes a method for computing efficient electrical indicators using the available three-phase electrical quantities These indicators are then to be used to obtain fault indicators for fault detection and diagnosis The electrical indicators are obtained by using instantaneous symmetrical component decomposition a well-proven method in the design and diagnosis of power networks The new quantities are able to fully describe the whole electrical system and provide an effective means to quantify the balance and unbalance in the system The method uses the electrical three-phase quantities measured at the output of the generator in a wind turbine to obtain the indicators The performance of this method is illustrated using both synthetic and experimental data
1 IntroductionWind power plants are a rather new and promising way of providing renewable energy Moreover as technology evolves their reliability improves with time and modern wind turbines achieve quite a high availability[1] However unscheduled wind turbine failures most often result in high maintenance efforts production losses and economical costs
To decrease losses and costs efficient maintenance strategies have to be developed according to each wind farmrsquos specific needs This need is further emphasised by the offshore deployment of wind farms The offshore turbines have a much lower accessibility[1] so maintenance work has to be planned well in advance To correctly plan a maintenance strategy condition monitoring of the systems and subsystems is needed
Several condition monitoring techniques have been developed and implemented in wind turbines[2] such as vibrations acoustic emissions or oil analysis Most are intended to monitor the blades or mechanical parts (bearings gears shafts etc) which are considered as critical wind turbine subassemblies However wind turbine electrical generators also have a high failure rate and
generate a very high amount of downtime[1] For such three-phase electrical systems new approaches using electrical signals have to be developed
Raw three-phase electrical signals contain a great quantity of information about the system they are a part of but are complex and difficult to interpret In order to extract relevant features the whole electrical information has to be split into different and specific indicators One method used to separate such electrical information into meaningful quantities is symmetrical component decomposition[3] This method was first developed by Fortescue in 1918[4] and has since been widely used for example in power network calculations[5] (network modelling and control power quality monitoring fault detection etc) Symmetrical component decomposition approaches have also shown good results in monitoring three-phase electrical motors[67] In this paper this decomposition is used to analyse electric quantities measured at the output of a three-phase generator The associated estimation algorithm provides several electrical features that can be further processed or directly used as fault indicators dedicated to the generator The adopted sample-per-sample approach allows its online implementation and reaches good estimation and tracking performance in stationary and non-stationary cases
The theoretical considerations behind this method are presented in the next section where the electrical features to be estimated are defined Then Section 3 gives an overview of the algorithm used to estimate these quantities The proposed algorithm performance is studied in Section 4 with synthetic and experimental data measured on a small-scale wind turbine test-bench Finally the conclusions and future work are summarised in Section 5
2 Method of electrical signature analysis for wind turbine monitoring
Electrical subassemblies used in wind turbines such as electrical generators are three-phase systems One efficient way to take into account the whole information contained in such systems is to use symmetrical component decomposition as is customary for power networks[5] From these symmetrical components the design of fault indicators dedicated to the monitoring of such subassemblies can be expected This idea is further developed in this second section where the definition of symmetrical components is first given followed by the proposition of some wind turbine electrical features that can be used to elaborate fault indicators
21 Three-phase electrical system analysis211 Balanced three-phase systemsMost often electrical signals and systems are analysed around their fundamental frequency f0 Indeed the most relevant part of the whole electrical power is located around this particular frequency where a lot of information is accessible Following this consideration electrical signals are often considered as pure sine waves of frequency f0 with constant amplitude and original phase A convenient notation for such a single-phase electrical signal x(t)
Method for computing efficient electrical indicators for offshore wind turbine monitoring
G Cablea P Granjon and C Beacuterenguer
Paper presented at CM 2014 MFPT 2014 The Eleventh International Conference on Condition Monitoring and Machinery Failure Prevention Technologies Manchester UK 10-12 June 2014
Georgia Cablea Pierre Granjon and Christophe Beacuterenguer are with Gipsa-lab Grenoble University France Email georgiacableagipsa-labgrenoble-inpfr pierregranjongipsa-labgrenoble-inpfr christopheberenguergipsa-labgrenoble-inpfr
DOI 101784insi2014568443
is its phasor notation x(t) defined in Equation (1) where x(t) stands for a generic electrical signal either a voltage or a current
x t( ) = Ae j 2π f0t+α( ) = Xe j2π f0t (1)
In that case and for a known frequency f0 the complex amplitude X = Aejα is then sufficient to completely characterise the original signal at f0 which is linked to its phasor through the simple relationship x(t) = Re[x(t)]
This approach can be easily extended to three-phase electrical signals x1(t) x2(t) x3(t) which can be represented at their fundamental frequency by three complex amplitudes X1 X2 X3 In the case of a balanced three-phase system the three electrical signals have the same amplitude and are shifted from each other by the same angle
of 2π3
radians This leads to the following phasor representation
x1 t( )x2 t( )x3 t( )
⎡
⎣
⎢⎢⎢⎢⎢
⎤
⎦
⎥⎥⎥⎥⎥
=
X1X2X3
⎡
⎣
⎢⎢⎢⎢
⎤
⎦
⎥⎥⎥⎥
e j2π f0t = X
1
eminus j2π
3
eminus j4π
3
⎡
⎣
⎢⎢⎢⎢
⎤
⎦
⎥⎥⎥⎥
e j2π f0t (2)
Equation (2) clearly shows that for a known fundamental frequency the balanced three-phase system is fully represented by the single complex amplitude X as in the single-phase case of Equation (1)
212 Unbalanced three-phase systems and symmetrical components
Real electrical three-phase systems are never perfectly balanced Consequently Fortescue[4] proposed in 1918 a method to decompose any n-phase unbalanced system in a set of n balanced systems called symmetrical components As described in the previous section the resulting set of balanced systems can be regarded as n single-phase systems completely characterised by a set of n complex amplitudes
Following this approach any unbalanced three-phase system can be resolved at its fundamental frequency into a sum of three balanced systemsq the positive-sequence component three phasors equal in
magnitude shifted by 2π3
radians and in the same phase
sequence as the original systemq the negative-sequence component three phasors equal in
magnitude shifted by 2π3
radians and in the reverse phase
sequence of the original systemq the zero-sequence component three phasors equal in magnitude
and with no phase shift between them
In matrix form the three complex amplitudes X1 X2 and X3 of the original system can be related to those of the corresponding symmetrical components with the simple linear relationship
X1X2X3
⎡
⎣
⎢⎢⎢⎢
⎤
⎦
⎥⎥⎥⎥
=1 1 1a2 a 1a a2 1
⎡
⎣
⎢⎢⎢
⎤
⎦
⎥⎥⎥
X+
Xminus
X0
⎡
⎣
⎢⎢⎢⎢
⎤
⎦
⎥⎥⎥⎥
X+
Xminus
X0
⎡
⎣
⎢⎢⎢⎢
⎤
⎦
⎥⎥⎥⎥
= 13
1 a a2
1 a2 a1 1 1
⎡
⎣
⎢⎢⎢
⎤
⎦
⎥⎥⎥
X1X2X3
⎡
⎣
⎢⎢⎢⎢
⎤
⎦
⎥⎥⎥⎥
(3)
where X+ Xndash and X0 are the complex amplitudes of the positive- negative- and zero-sequence components respectively and
a = ej2π3 is called the Fortescue operator modelling a phase shift
of + 2π3
radians It can be noticed that in the algorithm presented
in Figure 1 a factor of 2 has to be applied to the right-hand side of Equation (3) to obtain amplitude invariance between the original system and the symmetrical components
One major interest in using symmetrical components is that they provide the means to analyse general three-phase quantities at a given frequency by splitting them into balanced and unbalanced parts Indeed when the original system is balanced it only consists of a positive-sequence component while the negative- and zero-sequence components are zero On the contrary the existence of negative- andor zero-sequence components means that there is an unbalance in the three-phase system at the studied frequency Therefore the amplitude X+ of the positive-sequence component quantifies the amount of balanced signal whereas Xndash and X0 can be used to precisely quantify the unbalance in the original system
Several methods exist to estimate the symmetrical components of a three-phase system from the measured electrical signals among which the most popular is obviously the discrete Fourier transform[8] (DFT) However this approach is usually implemented on blocks of data and cannot easily compute instantaneous values of symmetrical components at each new measured sample One way to overcome this problem is to use the instantaneous symmetrical component transform first introduced by Lyon[9] This transform simply applies the same matrix appearing in the right-hand side of Equation (3) to the three-phase electrical signals x1(t) x2(t) x3(t) instead of the complex amplitudes of Equation (3) As a result we obtain three complex-valued signals x+(t) xndash(t) x0(t) named the instantaneous positive- negative- and zero-sequence components respectively By selecting the content of these signals around the fundamental frequency f0 it has been shown[6] that we obtain the classical symmetrical components of the original three-phase system at f0 This last method is used in the algorithm described in Section 3
22 Wind turbine electrical featuresElectrical quantities acquired on real electrical systems are usually voltages andor currents measured on a single phase or on all three phases Such signals are very rich in content and it is difficult to isolate meaningful and clear electrical information using raw data In this section the previous ideas and definitions are used to propose simple three-phase electrical features highlighting particular and precise electrical information such as electrical unbalance signal distortion or quality electrical powers etc Afterwards the proposed features can either be used directly or further processed to obtain efficient fault indicators
In order to propose well-defined features several preliminary assumptions must be made Firstly the monitored electrical system is supposed to be star-connected with a connected neutral wire and the measured electrical quantities are line-to-neutral voltages and line currents Nonetheless for the case of symmetrical component systems the quantities can be easily converted from line to phase quantities and vice versa[3] Moreover measured electrical signals are studied at their fundamental frequency f0 even if the same analysis could be made at any frequency This means that in the following all phasors and complex amplitudes are computed at f0 Finally due to wind speed and direction fluctuations wind turbines most often run under non-stationary conditions and generate non-stationary electrical quantities Therefore the electrical signals must be considered as non-stationary and the simple phasor model given in Equation (1) must be adapted to take into account amplitude and frequency variations of the fundamental component[10]
x t( ) = A t( )e jθ0 t( ) = X (t) e jθ0 t( ) (4)
where X(t) = A(t)ejα (time-varying positive magnitude multiplied by a complex number) and the instantaneous phase θ0(t) is related to the instantaneous fundamental frequency f0(t) by
θ0 t( ) = 2π f0 u( )du0
t
int (5)
It has also been shown[11] that in electromechanical systems most mechanical faults generate amplitude and frequency modulations in electrical quantities This also justifies the signal model adopted
444 Insight Vol 56 No 8 August 2014
Insight Vol 56 No 8 August 2014 445
in Equation (4) where x(t) stands for voltage or current signals either their measured values or their symmetrical components in the three-phase case
221 Narrowband electrical featuresThe previous model shows that at a given frequency electrical signals are fully described by their instantaneous amplitude and frequency Equations (4) and (5) show that the instantaneous amplitude can be easily obtained as the absolute value of the phasor and the instantaneous frequency can be extracted from the time derivative of its phase angle This is summarised by Equation (6)
A t( ) = x t( )
f0 t( ) = 12π
dθ0 t( )d t
where θ0 t( ) = angx t( )(6)
For the three-phase scenario the instantaneous frequency is computed as in Equation (6) using only the instantaneous positivesequence component phasor x+ t( ) The reasoning behind thisis that this component usually has the larger magnitude and that in the case of a perfectly-balanced symmetrical system only the positive sequence component would be non-null
The method of symmetrical components provides the means to easily describe electrical unbalance in a three-phase system Indeed an obvious unbalance indicator is the ratio between the unbalanced part and the whole part of a three-phase signal at a given frequency Using the instantaneous symmetrical component phasors this simply expresses as
ux t( ) =xminus t( )
2+ x0 t( )
2
x+ t( )2+ xminus t( )
2+ x0 t( )
2 =Xminus (t)
2+ X0(t)
2
X+ (t)2+ Xminus (t)
2+ X0(t)
2 (7)
This indicator belongs to the interval [01] where the ideal case of a perfectly balanced system would yield ux = 0 and the worst case would yield 1
222 Wideband electrical featuresAn electrical signal is not distorted or of lsquoperfect qualityrsquo if it is constituted by a pure sine wave of frequency f0 One way of quantifying this lsquoqualityrsquo is to compute the ratio between the amount of signal contained at the fundamental frequency over the total amount of signal A simple way to quantify the amountof a signal x(t) being its mean power Px = limTrarrinfin
1T x(t)
2dt
Tint
the following feature gives an instantaneous image of the signal quality
SQx t( ) =Px t( )Px t( )
(8)
where Px(t) and Px(t) are local estimates of the mean power at the fundamental frequency and for the whole signal
If this indicator equals 1 the signal can be considered a pure sine wave of frequency f0 On the contrary if this feature equals 0 no component is present at f0 Finally SQx(t) can be interpreted as the fraction of signal localised at the fundamental frequency
This feature can be easily extended to the three-phase case noting that the mean power of a three-phase signal is the sum of the signal powers on each phase Therefore in terms of symmetrical components the following relationship exists
Px1(t)+ Px2(t)+ Px3(t) =
12X1(t)
2+ X2(t)
2+ X3(t)
2( )= 34X+ (t)
2+ Xminus (t)
2+ X0(t)
2( )(9)
and such a relationship can be used in Equation (8) to measure the quality of three-phase signals
223 Electrical powers and phase shift If both voltages and currents are available (either on one phase or on all three phases) the electrical powers and the phase shift between voltages and currents are interesting features to characterise relationships between these two electrical quantities Once again the following features are defined only at the fundamental frequency f0
The single-phase instantaneous complex electrical power at frequency f0 is given by
p t( ) = v t( )i t( ) = 12V t( ) I t( )e jφ0 t( ) (10)
In terms of real and imaginary parts this complex power leads to active and reactive powers while in terms of magnitude and phase angle it leads to apparent power and phase shift between voltage and current
P t( ) = p t( ) = 12V t( ) I t( )cos 0 t( )( )Q t( ) = p t( ) = 12V t( ) I t( )sin 0 t( )( )S t( ) = p t( ) = 12V t( ) I t( )0 t( ) = p t( )
(11)
In practice and in the algorithm described in the next section the power factor cos(φ0(t)) is considered instead of the phase shift φ0(t)
The complex power defined in Equation (10) for single-phase signals can be easily extended to the three-phase case by using the instantaneous symmetrical components Indeed in that case this quantity is expressed as
p t( ) = 32 v+ t( )i+ t( )+ vminus t( )iminus t( )+ v0 t( )i0 t( )⎡
⎣⎤⎦ (12)
where phasors at f0 of the voltage and current instantaneous symmetrical components are used
Considering that healthy electrical systems should only develop positive sequence power the proposed feature for the complex three-phase power only considers the positive sequence components[6]
p+ t( ) = 32 v+ t( )i+ t( ) (13)
In healthy systems this would give an almost ideal approximation of the total three-phase power Once again real and imaginary parts or magnitude and phase angle can be used to obtain active reactive apparent powers and power factor in the three-phase case
Equations (6) (7) (8) (10) (11) and (13) form a set of electrical features that can be used to describe in detail the electrical content of one-phase or three-phase electrical signals measured for example on wind turbines
3 Estimation algorithmThe goal of this section is to briefly describe the general structure of the algorithm used to estimate the electrical features previously proposed
Figure 1 depicts the part of the algorithm dedicated to estimate features defined for one electrical quantity (voltage or current) The input is either a single- or a three-phase electrical quantity and the outputs consist of the different per-quantity features defined in the previous section Both single-phase and three-phase indicators are presented in this Figure in order to emphasise the similarities in
computing the indicators for the different scenarios Operations depicted in purple are specific to the three-phase scenario while blue parts are applicable in both cases
This structure has been chosen to obtain a sample-per-sample algorithm that is able to update the features at each new input sample It is organised around a complex bandpass filter[12] used to select the content of its input around the fundamental frequency Due to its complex-valued coefficients this filter avoids the symmetry around the zero frequency thus only selecting the content around + f0 and not that located at ndash f0 Therefore the output of such a filter consists in complex phasors such as the ones defined in Equations (1) and (4) As in[6] this filter is implemented in the time domain with a finite impulse response structure The down-sampling operation located in front of the complex filter is used to minimise the number of filter coefficients By using a time-invariant filter for selecting the frequency content computational time is kept low at the cost of limitation on the variations of the fundamental frequency This limitation is given by the bandwidth of the filter Simple and instantaneous operations are then applied to the obtained phasors in order to estimate the desired electrical features
Figure 2 depicts the part of the algorithm dedicated to the estimation of features defined when voltages and currents are available electrical powers and power factor Here these features can be computed for both single- and three-phase cases The inputs are phasors obtained from the complex bandpass filter on which simple and instantaneous operations are applied to obtain instantaneous values of active reactive apparent power and power factor at the fundamental frequency
It is worth noting that all the operations described in the two previous Figures (the filters and the different instantaneous operations) can be real-time implemented leading to a real-time sample-per-sample estimation algorithm
The performance of this algorithm is illustrated in the next section on synthetic and experimental electrical signals
4 ResultsIn this section two sets of results will be presented The first set is obtained using synthetic data in order to compare the estimated features with their theoretical values and measure the performance of the proposed estimation algorithm The second set is obtained using experimental data obtained from a test-bench running under non-stationary conditions highlighting the tracking capabilities of the algorithm
41 Synthetic resultsA set of synthetic signals is generated in order to illustrate the behaviour and performance of the proposed electrical features and estimation algorithm These three-phase electrical signals are considered to be line-to-line voltages (their zero-sequence component is then null) and line currents The three-phase currents are perfectly balanced with a positive sequence of 10 A The three-phase voltages are perfectly balanced with a positive sequence of 100 V except between 10 and 17 s where a 1 increase in magnitude has been generated on phase 1 only leading to a local voltage unbalance of 05 The voltages also contain non-stationary high-frequency components between 20 and 45 s to illustrate the signal quality feature At 20 s a high-frequency component was added to the voltages with the same magnitude as the fundamental component and was divided by two at 33 s and cancelled at 45 s For each quantity the same 2 random variations are introduced on the fundamental frequency of 50 Hz Finally the phase shift between the positive-sequence components of voltages and currents is kept constant throughout the simulation
The results obtained by the proposed method are presented in Figure 3 Theoretical values are in light blue while estimated ones are in dark blue and the delay of 038 s (775 samples) due to the bandpass filter used in the algorithm has been cancelled Features associated to the voltages are represented in Figures 3(a) to 3(e) (positive- and negative-sequence magnitudes unbalance instantaneous frequency and quality) The magnitude of the current positive sequence component is plotted in Figure 3(f) followed by active and reactive powers (Figures 3(g) and 3(h))
Figure 3 clearly shows that the proposed algorithm globally reaches very good performance Estimation errors are small for the stationary and non-stationary parts of each feature The influence of the increase of phase 1 voltage is perfectly highlighted and quantified either due to voltage features (see for example the voltage unbalance feature in Figure 3(c)) or due to powers (see active and reactive powers in Figures 3(g) and 3(h)) Even the random fluctuations of the fundamental frequency are correctly estimated and followed This means that whatever the feature this sample-per-sample algorithm presents at the same time both good estimation and tracking performance
42 Experimental resultsA test-bench located in the CETIM laboratory (Senlis France) has been used to generate a set of three-phase electrical signals under stationary and non-stationary operating conditions This test-bench depicted in Figure 4 has been elaborated in the context of the KAStrion European project in order to simulate the operation of a real wind turbine At the input of the structure a geared induction motor drives a low-speed shaft connected to a gearbox used as a multiplier The high-speed shaft at the output of the multiplier drives an induction three-phase generator connected to the power network through a PWM power converter The user can specify the desired speed profile thanks to an inverter supplying the input geared motor Electrical quantities are measured at the output of the generator using three current probes and three voltage probes Measured quantities are the three line currents and the three line-to-line voltages The sampling frequency is 40 kHz
The results presented in Figure 5 have been obtained by applying the proposed algorithm on the electrical quantities measured for two different operating states In each state the speed of the low-speed shaft (LSS) is considered as the input of the whole system State A represents steady-state operating conditions with a constant LSS speed of 20 rmin On the contrary State B represents non-stationary operating conditions with an LSS speed of 20 rmin and some small linear variations added This speed profile was used in order to simulate typical wind turbine behaviour
Figure 2 Estimation algorithm for instantaneous electrical features dedicated to two electrical quantities
Figure 1 Estimation algorithm for instantaneous electrical features dedicated to one electrical quantity (LPF stands for low-pass filter)
446 Insight Vol 56 No 8 August 2014
Insight Vol 56 No 8 August 2014 447
Figure 5(a) depicts the two speed profiles of the low-speed shaft (constant for state A and time-varying for state B) Figure 5(b) depicts the estimated instantaneous fundamental frequency of the electrical signals computed from the positive sequence component of the measured voltages The strong correlation between the speed profiles and the estimated frequency observed in these first two Figures highlights the good estimation and tracking performance
of this algorithm Figure 5(c) depicts the magnitudes of the positive sequence component for voltages while Figure 5(d) shows the magnitudes of the positive sequence component for currents These magnitudes are computed around the fundamental frequency of the signals and show as expected variations correlated with the speed profiles The estimated values of active and reactive powers are depicted in Figures 5(e) and 5(f) and are also closely linked to the speed variations The voltage unbalance indicator is represented in Figure 5(g) Considering that there was no electrical unbalance at the generator stator the value of this indicator is very close to zero whatever the state Nonetheless it is worth mentioning that this indicator is independent of the operating conditions of the system Indeed the speed variations of the shaft depicted in Figure 5(a) do not induce any correlated variations in the evolution of this particular indicator The voltage signal quality indicator is presented in Figure 5(h) The spectrum analysis of the measured signals has shown that the PWM converter connected at the output of the generator is responsible for high harmonic distortion thus confirming the poor signal quality obtained by the algorithm
From all these results it can be concluded that the proposed electrical features successfully describe the electrical quantities generated at the output of the test-bench and that the proposed algorithm successfully estimates their values and follows their variations
Figure 3 Results obtained on synthetic data (a) voltage positive sequence component magnitude (b) voltage negative sequence component magnitude (c) voltage unbalance indicator (d) voltage frequency indicator (e) voltage signal quality indicator (f) current positive sequence component magnitude (g) active power (h) reactive power
Figure 4 Experimental test-bench
Figure 5 Experimental results (a) speed profile of the low-speed shaft (b) voltage frequency indicator (c) voltage positive sequence component magnitude (d) current positive sequence component magnitude (e) active power (f) reactive power (g) voltage unbalance indicator (h) voltage signal quality indicator
5 ConclusionsIn this paper a method of generating meaningful electrical features from electrical measurements is presented At the beginning of this paper the definition of electrical features was given These features are able to describe the whole electrical information contained in both single- and three-phase electrical systems The second part of the paper proposed an algorithm to efficiently estimate such quantities The algorithm is able to process signals sample-per-sample and is suited for online implementation The results were validated using both synthetic and experimental signals This approach gives good results in terms of feature estimation and tracking
Future work will involve an evaluation of the proposed algorithm using real wind turbine data This will also enable the definition and validation of fault indicators specific to wind turbines Nonetheless the algorithm to obtain the fault indicators could be extended to other electrical systems Furthermore the algorithm can be improved by implementing adaptive filtering for the fundamental frequency selection step
AcknowledgementsThis research has been partly supported by KIC InnoEnergy a company supported by the European Institute of Innovation and Technology (EIT) through the KAStrion European project
The authors would like to thank CETIM (Centre Technique des Industries Meacutecaniques) for providing the test-bench and experimental data
References1 P J Tavner Offshore Wind Turbines ndash Reliability Availability
and Maintenance Institution of Engineering and Technology London UK 2012
2 F P Garciacutea Maacuterquez A M Tobias J M Pinar Peacuterez and M Papaelias lsquoCondition monitoring of wind turbines techniques and methodsrsquo Renewable Energy Vol 46 pp 169-178 October 2012
3 J E Hobson lsquoSymmetrical componentsrsquo in Electrical Transmission and Distribution Reference Book Westinghouse Electric Corp 1964
4 C L Fortescue lsquoMethod of symmetrical co-ordinates applied to the solution of polyphase networksrsquo Transactions of the American Institute of Electrical Engineers Vol XXXVII No 2 pp 1027-1140 July 1918
5 G C Paap lsquoSymmetrical components in the time domain and their application to power network calculationsrsquo IEEE Transactions on Power Systems Vol 15 No 2 pp 522-528 May 2000
6 P Granjon lsquoCondition monitoring of motor-operated valves in nuclear power plantsrsquo in 8th International Conference on Condition Monitoring and Machinery Failure Prevention Technologies Cardiff UK Vol 1 pp 109-119 2011
7 T Vaimann A Kallaste and A Kilk lsquoUsing Clarke vector approach for stator current and voltage analysis on induction motors with broken rotor barsrsquo Electronics and Electrical Engineering Vol 123 No 7 September 2012
8 T Tarasiuk lsquoComparative study of various methods of DFT calculation in the wake of IEC Standard 61000-4-7rsquo IEEE Transactions on Instrumentation and Measurement Vol 58 No 10 October 2009
9 W V Lyon Transient Analysis of Alternating-Current Machinery The Technology Press of MIT and John Wiley amp Sons New York 1954
10 B Boashash lsquoEstimating and interpreting the instantaneous frequency of a signalrsquo Proceedings of the IEEE Vol 80 No 4 April 1992
11 M Blodt P Granjon B Raison and J Reacutegnier lsquoMechanical fault detection in induction motor drives through stator current monitoring ndash theory and application examplesrsquo in Fault Detection Wei Zhang (Ed) 2010
12 A Reilly G Frazer and B Boashash lsquoAnalytic signal generation ndash tips and trapsrsquo IEEE Transactions on Signal Processing Vol 42 No 11 pp 3241-3245 November 1994
Vibration Monitoring amp Analysis HandbookThe British Institute of Non-Destructive Testing Condition Monitoring Series
Order online via the BINDT Bookstore at wwwbindtorgshopbindt
This new book is compiled by Simon Mills a chartered marine engineer with over 30
yearsrsquo experience in practical engineering and has been developed from his BINDT PCN
accredited series of training modules for Vibration Analyst Training and Qualification in
accordance with ISO 18436-2 It approaches the subject in an informal and informative manner
with a selection of clear diagrams pictures and tabulated methodologies It addresses all levels
of the syllabus given in ISO 8436-2 for Vibration Condition Monitoring and Diagnostics and
the BINDT specification ndash General requirements for qualification and assessment of condition
monitoring and diagnostic personnel (BINDT CM Gen Appendix D for Vibration Analysis) giving
practical advice examples and case histories BINDT has sponsored the publication of this
handbook as part of its portfolio of CM handbooks to fill in and reference required areas of
knowledge In conjunction with required ISO BS and other textbook references it provides a basis
for effective training and accountable qualification and certification as required by ISO 18436
Available from The British Institute of Non-Destructive Testing Newton Building St Georgersquos Avenue Northampton NN2 6JB UK Tel +44 (0)1604 89 3811 Fax +44 (0)1604 89 3861 Email infobindtorg
ISBN 978 0 903132 39 7Price BINDT Members pound8500 Non-Members pound9000
Produced and published by BINDT on behalf of its Condition Monitoring Group (COMADIT)
448 Insight Vol 56 No 8 August 2014
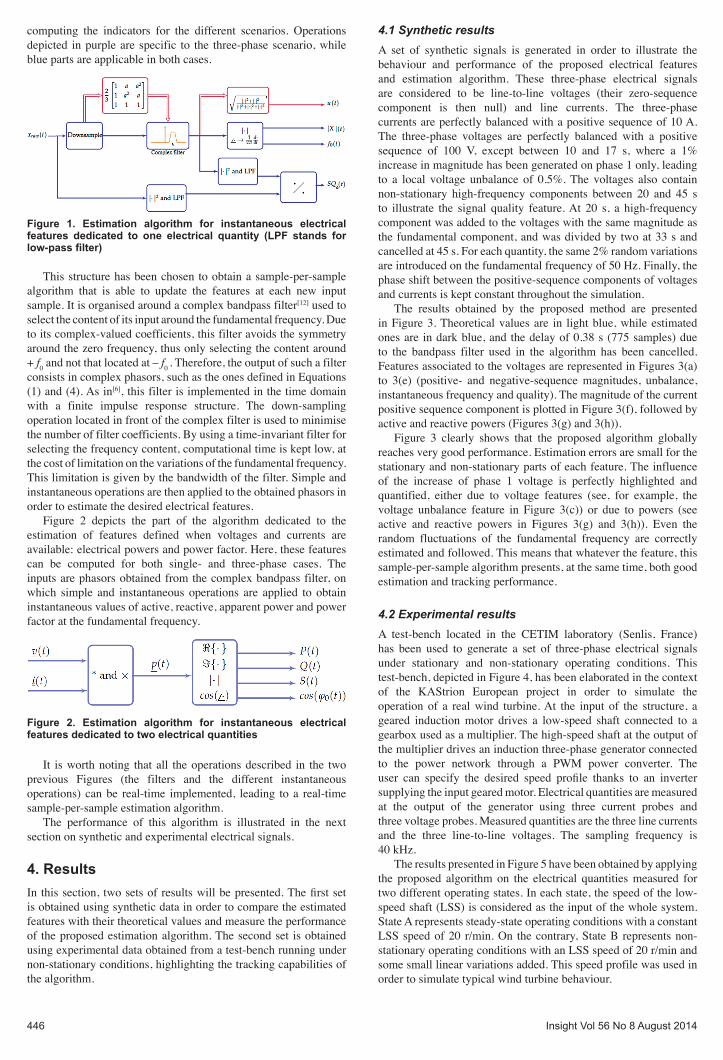
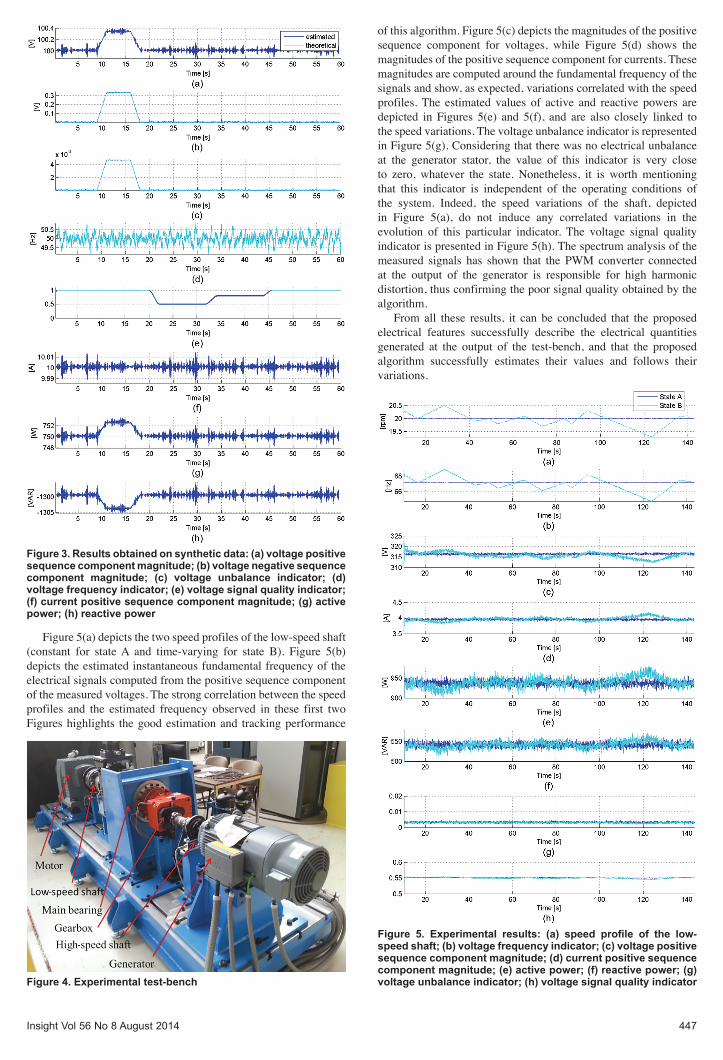