Method for assessing impacts on life support functions (LSF) related to the use of ‘fertile...
15
Method for assessing impacts on life support functions (LSF) related to the use of ‘fertile land’ in Life Cycle Assessment (LCA) Llorenc ¸ Mila ` i Canals a, * , Joan Romanya ` b , Sarah J. Cowell a a Centre for Environmental Strategy, University of Surrey, Guildford, Surrey GU2 7XH, UK b Department of Natural Products, Plant Biology and Soil Science, University of Barcelona, Barcelona, Spain Received 18 April 2005; accepted 9 May 2006 Available online 3 July 2006 Abstract Degradation of soil quality is a major concern due to the scarcity of fertile land, and needs to be properly addressed in the environmental assessment of agro-forestry systems. This paper addresses the main issues arising in assessing the impacts of fertile land use on ‘‘Life Support Functions’’ in Life Cycle Assessment (LCA). These issues include the assessment of occupation and transformation impacts, the references against which such impacts should be measured, and the concept of natural relaxation versus backup technology for recovery from the impacts. The alternative (or reference) situation is defined using the concept of consequential LCA, which facilitates clarification of the allocation issues arising due to successive land uses. This paper presents soil organic matter (SOM) as a robust indicator for soil quality; even though it does not fully consider all aspects of soil functioning, SOM has been often recognised as the best stand-alone indicator for soil quality. Impacts on bio- diversity are not included in this indicator and should be assessed in parallel. Alternative data sources for practical implementation of the method are suggested in a hierarchical way, including locally specific data sets describing changes in SOM; mechanistic models for the prediction of SOM evolution; and general data sources for simplified analyses. Thanks to its flexibility in data collection the method is applicable to any agricultural or forestry LCA to fill an important gap in Life Cycle Impact Assessment (LCIA) of land use. Ó 2006 Elsevier Ltd. All rights reserved. Keywords: Life support functions; Fertile land use; Agriculture; Life Cycle Impact Assessment; Soil organic matter 1. Introduction In Life Cycle Assessment (LCA) terminology, the use of land is a specific type of environmental intervention defined in the Life Cycle Inventory (LCI) results [1]. The first Life Cycle Impact Assessment (LCIA) methodologies assessed this use of land by recording the amount of land used (ha or ha year) as an indication of the impacts. However, today it is acknowledged that, apart from the amount of land being used, changes in the quality of the land should also be assessed in LCA. Additionally, a method is required that assesses main- tenance of different types of land use [2e4], which entail impacts in spite of not representing major changes in land use. 1 Land use impacts have been a focus of extensive research, including a special issue of this journal (issue 8, 2000 [5]), and one of SETAC’s working groups on LCIA [6]. The task force on resources and land use within the UNEPeSETAC Life Cycle Initiative LCIA programme is currently continuing this debate. * Corresponding author. Tel.: þ44 1483 686678; fax: þ44 1483 686671. E-mail address: [email protected] (L. Mila ` i Canals). 1 For example, in an agricultural field, one of the functions fulfilled by the soil is water filtration on an ongoing basis. This filtered water will be used at some point by organisms other than humans; therefore activities that affect the filtering and buffering capacity of soil are relevant for assessment even if this is not the primary function of the system under study from a human perspec- tive. In contrast, a resource such as copper has no function other than contrib- uting to the human activities under study (assuming its role as a trace element in the diet is not relevant in this context); therefore only the differences in the copper’s quality between the beginning and end of the system under analysis are of concern. 0959-6526/$ - see front matter Ó 2006 Elsevier Ltd. All rights reserved. doi:10.1016/j.jclepro.2006.05.005 Journal of Cleaner Production 15 (2007) 1426e1440 www.elsevier.com/locate/jclepro
Transcript of Method for assessing impacts on life support functions (LSF) related to the use of ‘fertile...

Journal of Cleaner Production 15 (2007) 1426e1440www.elsevier.com/locate/jclepro
Method for assessing impacts on life support functions (LSF) relatedto the use of ‘fertile land’ in Life Cycle Assessment (LCA)
Llorenc Mila i Canals a,*, Joan Romanya b, Sarah J. Cowell a
a Centre for Environmental Strategy, University of Surrey, Guildford, Surrey GU2 7XH, UKb Department of Natural Products, Plant Biology and Soil Science, University of Barcelona, Barcelona, Spain
Received 18 April 2005; accepted 9 May 2006
Available online 3 July 2006
Abstract
Degradation of soil quality is a major concern due to the scarcity of fertile land, and needs to be properly addressed in the environmentalassessment of agro-forestry systems. This paper addresses the main issues arising in assessing the impacts of fertile land use on ‘‘Life SupportFunctions’’ in Life Cycle Assessment (LCA). These issues include the assessment of occupation and transformation impacts, the referencesagainst which such impacts should be measured, and the concept of natural relaxation versus backup technology for recovery from the impacts.The alternative (or reference) situation is defined using the concept of consequential LCA, which facilitates clarification of the allocation issuesarising due to successive land uses. This paper presents soil organic matter (SOM) as a robust indicator for soil quality; even though it does notfully consider all aspects of soil functioning, SOM has been often recognised as the best stand-alone indicator for soil quality. Impacts on bio-diversity are not included in this indicator and should be assessed in parallel. Alternative data sources for practical implementation of the methodare suggested in a hierarchical way, including locally specific data sets describing changes in SOM; mechanistic models for the prediction ofSOM evolution; and general data sources for simplified analyses. Thanks to its flexibility in data collection the method is applicable to anyagricultural or forestry LCA to fill an important gap in Life Cycle Impact Assessment (LCIA) of land use.� 2006 Elsevier Ltd. All rights reserved.
Keywords: Life support functions; Fertile land use; Agriculture; Life Cycle Impact Assessment; Soil organic matter
1. Introduction
In Life Cycle Assessment (LCA) terminology, the use ofland is a specific type of environmental intervention definedin the Life Cycle Inventory (LCI) results [1]. The first LifeCycle Impact Assessment (LCIA) methodologies assessedthis use of land by recording the amount of land used (ha orha year) as an indication of the impacts. However, today it isacknowledged that, apart from the amount of land beingused, changes in the quality of the land should also be assessedin LCA. Additionally, a method is required that assesses main-tenance of different types of land use [2e4], which entail
* Corresponding author. Tel.: þ44 1483 686678; fax: þ44 1483 686671.
E-mail address: [email protected] (L. Mila i Canals).
0959-6526/$ - see front matter � 2006 Elsevier Ltd. All rights reserved.
doi:10.1016/j.jclepro.2006.05.005
impacts in spite of not representing major changes in landuse.1 Land use impacts have been a focus of extensive research,including a special issue of this journal (issue 8, 2000 [5]), andone of SETAC’s working groups on LCIA [6]. The task force onresources and land use within the UNEPeSETAC Life CycleInitiative LCIA programme is currently continuing this debate.
1 For example, in an agricultural field, one of the functions fulfilled by the
soil is water filtration on an ongoing basis. This filtered water will be used at
some point by organisms other than humans; therefore activities that affect the
filtering and buffering capacity of soil are relevant for assessment even if this
is not the primary function of the system under study from a human perspec-
tive. In contrast, a resource such as copper has no function other than contrib-
uting to the human activities under study (assuming its role as a trace element
in the diet is not relevant in this context); therefore only the differences in the
copper’s quality between the beginning and end of the system under analysis
are of concern.
1427L. Mila i Canals et al. / Journal of Cleaner Production 15 (2007) 1426e1440
However, it is still not common practice to include land use im-pacts in LCA studies, and an agreed method has yet to be definedfor both the LCI and LCIA phases.
In order to assess land use impacts, it is necessary to first con-sider the functions of land; many attempts have been made to listthese functions. The Dobris Assessment [7,8] divides them intoecological and socioeconomic functions. The listing by theSETAC LCIA WG ([6], p. 47) includes all the functions men-tioned in the Dobris Assessment, but also stresses others closelylinked to the role of soil in closing substance cycles (Table 1).
In LCA terminology, these functions of land are related tothe Areas of Protection (AoP) Natural Environment, includingNatural Resources, Biodiversity and Life Support Functions,or LFP ([9], pp. 219e221), and Human Health ([6], pp. 48e50) (e.g. through effects of land use on greenhouse gas emis-sions). Fertile land2 is possibly the most relevant type of landfrom a resource scarcity perspective, and has been defined asthe ‘‘ultimate’’ limiting resource in future before energy andany other mineral resources [10]. According to Pimentelet al. [11], 0.5 ha of arable land/capita is needed to adequatelyfeed people, while only 0.24 ha/capita of arable land is avail-able at present according to FAOSTAT [12]; this amount is de-creasing due to population growth [13] and (quantitative andqualitative) loss of agricultural soil. Life support functions(LSF) concern the major regulating functions of the naturalenvironment which enable life on earth (both human andnon-human), including biotic production, regulation of climateand maintenance of substance cycles (chiefly water, carbonand nutrients) ([9], pp. 220e221). The performance of LSFis closely related to soil quality [4].
The impacts from land use on the AoP Human Health, andon biodiversity within the AoP Natural Environment, are notconsidered further within this paper. Instead, it focuses onthe impacts from land use on life support functions (LSF)and natural resources within the AoP Natural Environment.Furthermore, this paper focuses on the use of fertile land be-cause this is the most relevant type of land from an LSF andresource perspective, as explained above. A method is intro-duced for assessing impacts on LSF arising from fertile landuse in LCA. It focuses on soil organic matter as an indicatorfor LSF in this context, due to its role in influencing soil qual-ity and biotic production more generally.
In this paper, the overarching conceptual approach used inLCIA for land use impacts is explained in Section 2. The sim-ilarities and differences between two alternative approachesfor the assessment of soil in LCIA (Lindeijer et al. [6]; Stewartand Weidema [14]) are discussed in Section 2.1., while Sec-tion 2.2 addresses some of the issues arising from this discus-sion and suggests the key elements to be considered inassessing fertile land use in LCA. Section 3 explores the use-fulness of soil organic matter (SOM) as an indicator for soilquality at LCIA and describes an operational method to assess
2 Fertile land is defined by its soil (chemical, physical and biological qual-
ities) and the properties of its geographical location (slope, availability of
water, radiation, temperature, etc.); it includes arable land, forests, grassland,
etc., and excludes sealed and built land.
the impacts on LSF using SOM. Section 4 illustrates the pro-posed approach with a case study.
2. Conceptual framework for considering impactson soil quality
The conceptual approach traditionally used in LCIA to ac-count for impacts on soil quality considers that soil enters thesystem at the start of the activity and leaves at the end [1,15].Changes in the soil’s quality between the initial and final statesare relevant from an impact assessment point of view, as forany other types of resource. Changes and/or maintenance inthe soil’s quality during the land use are also of concern;this is because soil has multiple functions and users as outlinedin Section 1. This is the main difference between the use ofsoil and other resources.
Two different frameworks have been developed that beginto address these issues: the land use framework developedby Lindeijer et al. [6] and a resource use framework byStewart and Weidema [14]. They are described and comparedin Section 2.1. Section 2.2 draws some practical implicationsfor a single conceptual framework to include impacts on soilquality within LCIA.
2.1. Soil as an aspect of land use and as a resource
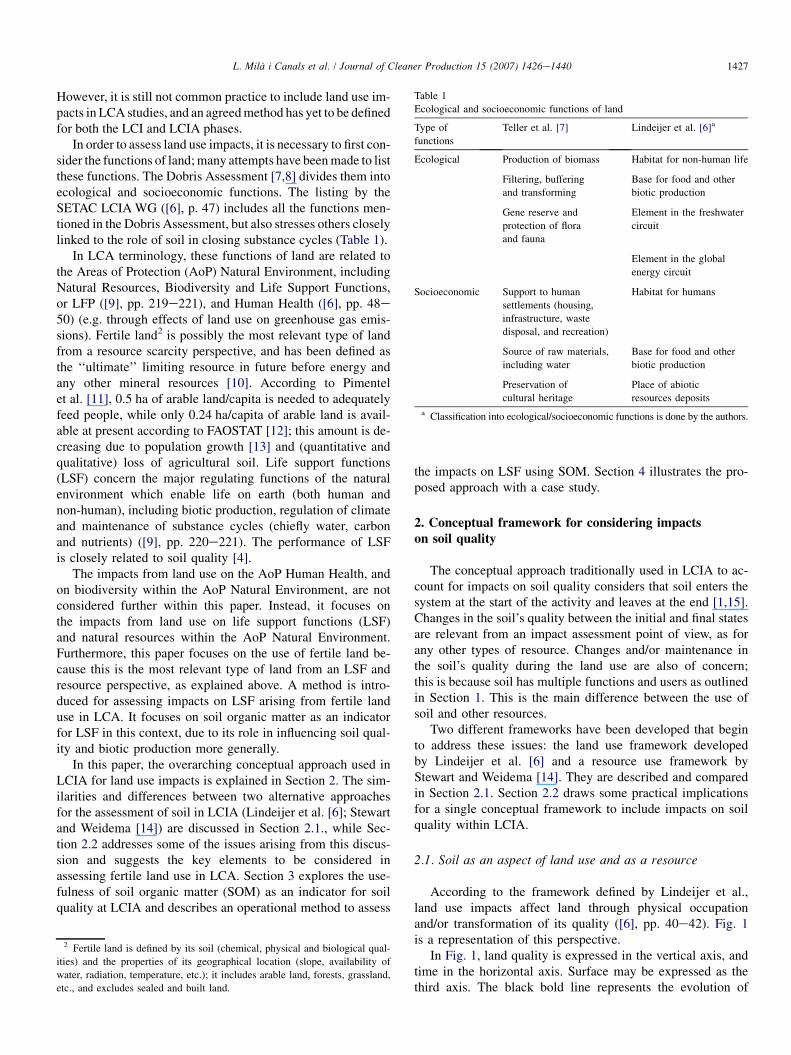
According to the framework defined by Lindeijer et al.,land use impacts affect land through physical occupationand/or transformation of its quality ([6], pp. 40e42). Fig. 1is a representation of this perspective.
In Fig. 1, land quality is expressed in the vertical axis, andtime in the horizontal axis. Surface may be expressed as thethird axis. The black bold line represents the evolution of
Table 1
Ecological and socioeconomic functions of land
Type of
functions
Teller et al. [7] Lindeijer et al. [6]a
Ecological Production of biomass Habitat for non-human life
Filtering, buffering
and transforming
Base for food and other
biotic production
Gene reserve and
protection of flora
and fauna
Element in the freshwater
circuit
Element in the global
energy circuit
Socioeconomic Support to human
settlements (housing,
infrastructure, waste
disposal, and recreation)
Habitat for humans
Source of raw materials,
including water
Base for food and other
biotic production
Preservation of
cultural heritage
Place of abiotic
resources deposits
a Classification into ecological/socioeconomic functions is done by the authors.
1428 L. Mila i Canals et al. / Journal of Cleaner Production 15 (2007) 1426e1440
land quality with time, and several moments are depicted inthis evolution: t1 is the beginning of a land use, when the ini-tial steady state (A) changes; t2 is the end of the same land use,and t3 is when a natural (or human-induced) recovery process(relaxation) reaches a new steady state.
The impacts occurring during the land use are called occupa-tion impacts, and can be measured by the amount of area af-fected, times the difference in quality between current qualityand the reference situation at each moment of the occupation pro-cess (DQ) times the duration of the occupation process (ha DQ -years). The relaxation potential (D, in Fig. 1) is used as thereference for estimating the occupation impacts, and the relaxa-tion time is included in this calculation. Transformation impactsare measured as the permanent change in land quality (A�D).
Stewart and Weidema [14] present a framework for assess-ing the resource use. They are concerned with the output qual-ity of the resource in relation to the input quality, and suggestthree typical situations for any resource (see Fig. 2). The twokey variables defined by these authors are the ultimate qualitylimit (point where a resource cannot be further used for its in-tended function without the application of major restorationactivities), and the backup technology (required to restore a re-source’s quality or to substitute the resource when this is def-initely rendered unavailable). No attention is given to impactsarising during the use of resource.
relaxation
time
Time
Occupation
process
S type of land
S · Qtemporal
· time
S · time
S · Qpermanent
A
BC
t1 t2 t3
Surface
Quality
Transformation
process
Transformation
impacts
Occupation
impacts
D
Legend
Q: change in (land) quality
S: Area
Fig. 1. The different aspects of land use impacts (adapted from Ref. [6]).
Resourceinput (a)
Product system
Output (b)
Resources renderedunavailable throughuse or disposal
Output (c)
Resources not directlyreusable, i.e. with a lowerfunctionality than (a)
Output (d)
Resources directly reusable,i.e. with the same or higherfunctionality than (a)
Fig. 2. Type of resource outputs from the product system to be considered for
functional resource use [14].
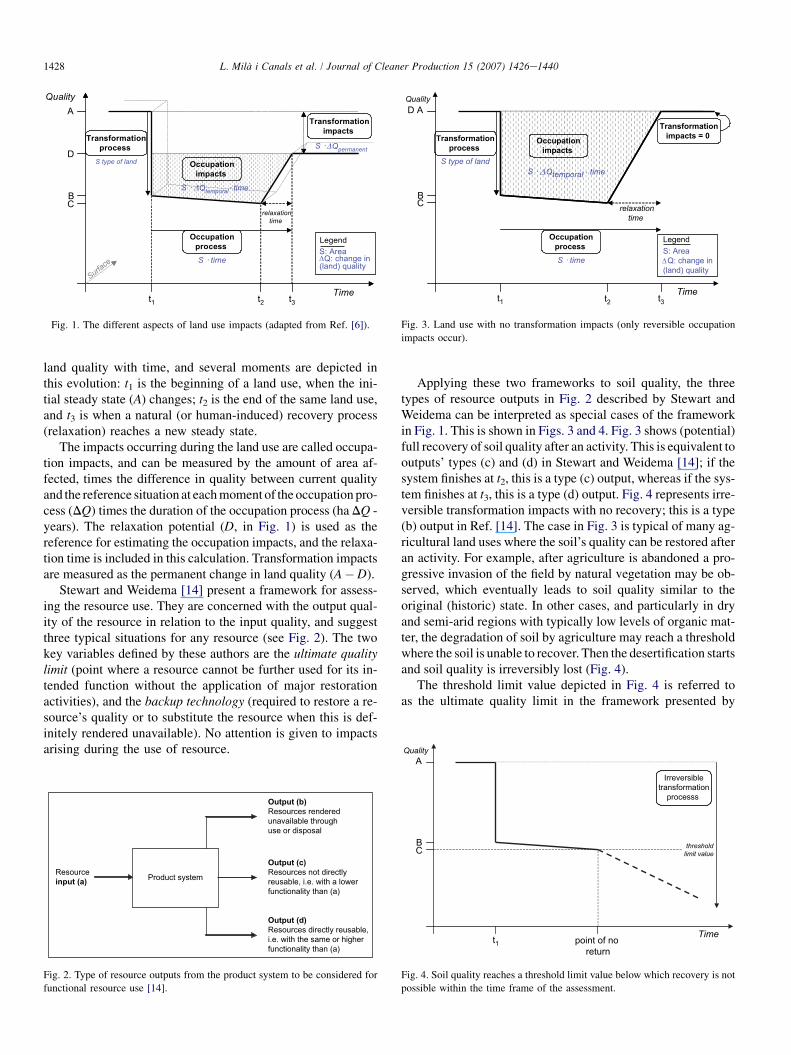
Applying these two frameworks to soil quality, the threetypes of resource outputs in Fig. 2 described by Stewart andWeidema can be interpreted as special cases of the frameworkin Fig. 1. This is shown in Figs. 3 and 4. Fig. 3 shows (potential)full recovery of soil quality after an activity. This is equivalent tooutputs’ types (c) and (d) in Stewart and Weidema [14]; if thesystem finishes at t2, this is a type (c) output, whereas if the sys-tem finishes at t3, this is a type (d) output. Fig. 4 represents irre-versible transformation impacts with no recovery; this is a type(b) output in Ref. [14]. The case in Fig. 3 is typical of many ag-ricultural land uses where the soil’s quality can be restored afteran activity. For example, after agriculture is abandoned a pro-gressive invasion of the field by natural vegetation may be ob-served, which eventually leads to soil quality similar to theoriginal (historic) state. In other cases, and particularly in dryand semi-arid regions with typically low levels of organic mat-ter, the degradation of soil by agriculture may reach a thresholdwhere the soil is unable to recover. Then the desertification startsand soil quality is irreversibly lost (Fig. 4).
The threshold limit value depicted in Fig. 4 is referred toas the ultimate quality limit in the framework presented by
Quality
D A
BC
relaxation
time
Occupation
process
S · time
Time
t1 t2 t3
S type of land
Transformation
process
Transformation
impacts = 0
S · Qtemporal
. time
Occupation
impacts
LegendS: Area Q: change in(land) quality
Fig. 3. Land use with no transformation impacts (only reversible occupation
impacts occur).
threshold
limit value
Quality
Time
A
BC
t1 point of no return
Irreversibletransformation
processs
Fig. 4. Soil quality reaches a threshold limit value below which recovery is not
possible within the time frame of the assessment.
1429L. Mila i Canals et al. / Journal of Cleaner Production 15 (2007) 1426e1440
Stewart and Weidema [14], and represents the point where thebackup technology starts because the resource has beenirreversibly lost. Stewart and Weidema suggest that backuptechnologies for fertile land may range from activities to re-store soil to its original quality (e.g. incorporation of organicmatter), to soil-less agriculture (e.g. hydroponics).
The two systems do not differ very much in their overallframeworks, and the main difference is the inclusion or exclusionof occupation impacts (due to different foci of the frameworks).For transformation impacts, the same quality difference needs tobe assessed in both cases; however, Lindeijer et al. express theseimpacts with a quality indicator whereas Stewart and Weidemaassess the impacts of applying the backup technology to restorethe initial quality. Another difference is the fact that part of thetransformation in quality (the part that can be recovered afterthe land use within a reasonable amount of time: from C to Din Fig. 1) is not considered as transformation impacts by Lindeijeret al., but is included as (extended) occupation impacts. Stewartand Weidema consider, on the other hand, that if the land usefinishes at t2 in Fig. 1, the full recovery from C to A is undertakenusing the backup technology (if feasible), and the impacts of thistechnology are the indicators of the transformation impacts.
2.2. Practical implications for assessing changesin soil quality
The following recommendations are made based on thediscussions above:
� Consideration of occupation impacts: As argued above, wesuggest that it is important to assess impacts during useof land (i.e. occupation impacts), in order to account forthe multiple functions fulfilled by land e and soil inparticular e at any point in time. Assessing occupationimpacts may be useful to predict likely future transforma-tion impacts based on locally defined thresholds, and thusapply correction measures during the land use whenrequired.� Measure of the changes in soil quality: Both (natural) relax-
ation and backup technology (which may include human-induced relaxation) are valid approaches to this issue. Thechange in soil quality should be measured between thebeginning and end of the system under study. Possiblemeasures of the impact of this change are as follows:
(a) the occupation impacts during (natural) relaxationuntil soil quality is restored to its state at the begin-ning of the system under study, or
(b) use of the backup technology to return the soil qual-ity to its state at the beginning of the system understudy.
We recommend assessing the situation that is most likely tooccur, be it natural relaxation (e.g. in regions where agricul-tural land is being abandoned and natural succession is be-ing established) or human restoration (e.g. seeding and/orploughing manure or sewage sludge into soil to prevent ero-sion after abandonment of intensive agriculture). In this pa-per we use the term backup technology to refer to both
human-induced and natural relaxations. Note that this obvi-ates the need for assessment of transformation impactsbecause such impacts would be assessed by use of an appro-priate backup technology. Note also that we assume mostagro-forestry systems studied with LCA will not be causingirreversible impacts, and so full soil quality recovery is anacceptable hypothesis. In cases when the resource qualityhas been irreversibly lost, application of the ultimate backuptechnology should be assessed to measure the land useimpacts. For example, if 1 ha of fertile land is lost, the im-pacts of constructing an equivalent amount of greenhouseswith hydroponics (in terms of yield potential for a similarcrop) could be calculated to account for the lost resourcefunctionality for humans (i.e. productivity). The loss ofother functions (water cycle, buffer capacity, etc.) shouldbe measured with other backup technologies.
� Reference to measure occupation impacts: Land quality isunlikely to remain constant unless a steady state has beenreached for the type of land use in place. Reaching a steadystate often takes from few decades to over a century andthus, in scenarios of intensive agricultural use, it wouldbe difficult to define a constant reference state. Here wepresent an alternative system that defines a reference forsoil quality applicable to non-equilibrium systems. The dis-tinction between attributional (retrospective) and conse-quential (prospective) LCA studies [16e18] is useful inthe definition of a reference within the LCI. ConsequentialLCA studies focus on the (consequential) effects of substi-tutions among alternative product systems [19], as opposedto attributional studies which focus on determining the im-pacts of the studied activity relative to a situation wherethis activity is not undertaken. Therefore, in consequentialLCA the reference should be defined as the evolution ofland quality under the most likely alternative situation ifthe system under study was not established there. Thisalternative (or reference) situation should be derivedfrom statistical time series [18] for land use. For example,in a region where agricultural land is being abandoned, ifthe system under study (such as an apple orchard or a wheatfield) was not established the most likely situation wouldbe abandonment of the land, and therefore the referencesituation is natural relaxation from tini (e.g. Fig. 5(a)).However, if incentives are being given to plant biofuelson set-aside land, then the reference situation is the evolu-tion of land quality under a biofuel crop. The method pre-sented in this paper is relevant for consequential LCA (i.e.the reference is defined by the most likely alternative situ-ation, which may or may not be natural relaxation). A sec-ond reference is additionally required to assess thesignificance of changes in soil quality: the climax quality.This measures the distance between the current qualityand the potential quality of the site (see Section 3.2.4).� Allocation of impacts between successive land uses: Figs.
1, 3 and 4 present cases of single systems using an areaof land. When successive systems are being establishedon the same area of land it is important to correctly
1430 L. Mila i Canals et al. / Journal of Cleaner Production 15 (2007) 1426e1440
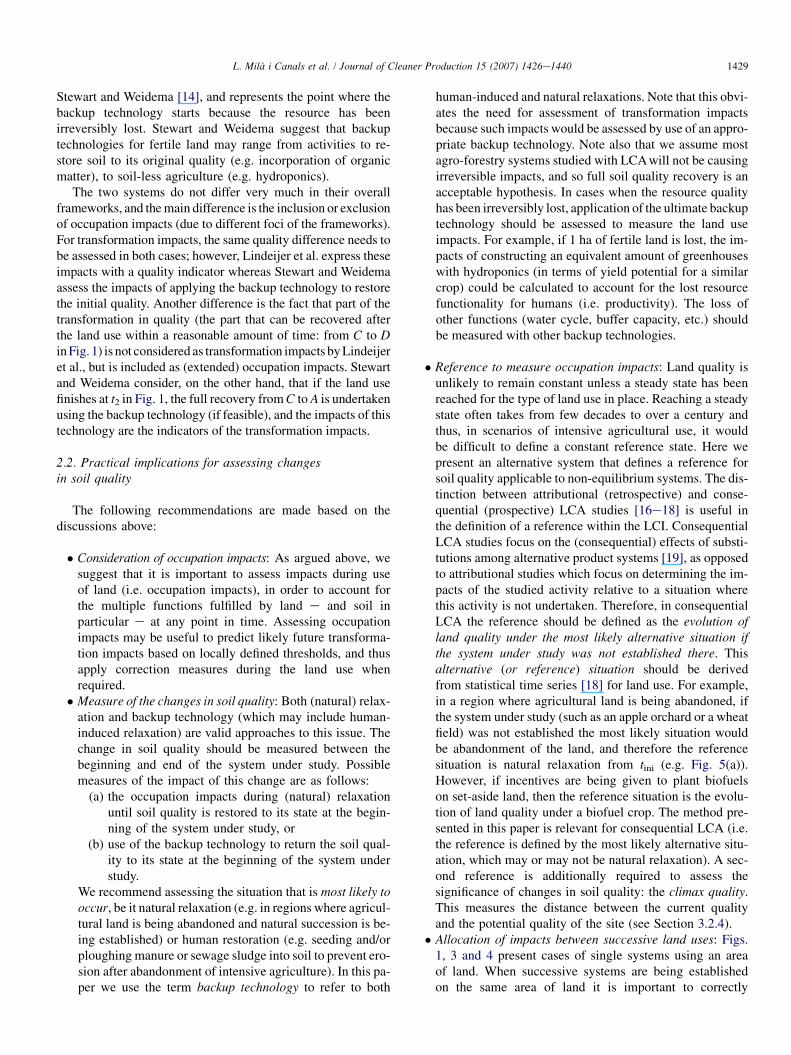
Fig. 5. Graphical representation of land use impact assessment. The horizontal hatching represents impacts due to the studied system, whereas the vertical hatching
represents avoided impacts credited to the studied system. In (a) and (c) the studied system has lower quality than the alternative situation (reference), and so
a damage accrues due to occupation. In (b) and (d) the reference is lower than the quality of the studied system, and so a benefit accrues due to occupation.
In (a) and (b) the studied system reduces soil quality during the land use, and so a damage is considered during its recovery, whereas (c) and (d) improve soil
quality and are credited for the avoided recovery.
allocate the impacts arising from each system. Using thealternative situation described above helps to clarify thisissue, which is not fully addressed by Lindeijer et al. [6]or Stewart and Weidema [14]. This is graphically ex-plained in Ref. [4] (pp. 220e225). Additionally, whenthe backup technology generates useful co-products (e.g.timber from afforestation), an additional allocation prob-lem arises, which can be avoided following the rules estab-lished by Weidema [19]. For example, when co-productsof the backup technology are utilised fully and displaceother production processes (e.g. timber harvested fromthe backup technology displaces forestry in another sys-tem), then the impacts of the backup technology are as-cribed to the system under study, which is also creditedfor the displaced process(es), while the impacts of manag-ing the co-product (e.g. sawing and processing timber) areascribed to the co-product (rules 1þ 2 [19]).
Fig. 5 shows four situations that may arise in assessingsoil quality. The impacts allocated to the system are theareas depicted by horizontal hatching, whereas the verticalhatching represents avoided impacts credited to the studiedsystem. The impacts from tini to tfin are calculated as the
difference between the current quality of the studied system(Qa) and the quality of the alternative (reference) situation(Qref). The change in the quality is considered as the differ-ence between Qini and Qfin, and the impacts of the backuptechnology for the restoration from tfin to tfin
0 are eitheradded to the occupation impacts (if Qfin<Qini, Fig. 5(a)and (b)), or subtracted from the occupation impacts (ifQfin>Qini, Fig. 5(c) and (d)). Note that in Fig. 5, onlythe occupation impacts on land quality due to the backuptechnology are represented; in addition, the impacts of ap-plying the technology (e.g. energy consumption, nitrogenemissions from manure, etc.) should be added to the respec-tive impact categories.
3. Method for the assessment of LSF using SOM
3.1. Soil organic matter (SOM) as an indicator forLSF in LCA
In the last few years, a number of indicators related to theLSF of land have been suggested for LCA [2,4,20e24]. Thesemethods suggest indicators for LSF based on net primary bio-mass production (NPP); free NPP (fNPP, the amount of

1431L. Mila i Canals et al. / Journal of Cleaner Production 15 (2007) 1426e1440
biomass left for nature development after subtracting humanconsumption from NPP); and a combination of indicators as-sessing soil quality including soil organic matter (SOM), de-gree of compaction, texture, structure, etc. Burger andKelting [25] suggest that the growth-based indicators (suchas NPP and thus fNPP) are not a good approach to assesssoil quality because they are affected by many other factors(weather, fertiliser use, land management, etc.). Bouma [26]also addresses this issue, and suggests that low-quality soilsmay have a high productivity due to skilled agricultural manage-ment and vice versa. Indeed, yield should be seen as an indicatorof the short-time effects of management practices, but is not aproper indicator of the system’s long-term sustainability. It istherefore appropriate to focus on soil quality, as opposed toprimary biomass production, as an indicator for LSF.
Extensive research and expert workshops have been devotedto the definition of soil quality and the establishment of indica-tors to measure it (see, for example, issue 88(2) of Agriculture,Ecosystems and Environment [27]). Within the field of soil sci-ences, SOM is probably the most cited indicator of soil quality[28e40]. In a thorough review of SOM as a soil quality indica-tor, Reeves [33] concludes ‘‘soil organic carbon (SOC) is the
Table 2
Role of soil organic matter in life support functions
Land function Role of SOM Selection of
references
Biotic production
(soil fertility)
Physical fertility: soil structure
(formation of aggregates) allowing
for root penetration; contribution to
erosion resistance and land stability;
reduction of susceptibility to
compaction; and soil aeration
[44e48]
Chemical fertility: nutrient pool;
nutrient protection (cation exchange
capacity (CEC) holds nutrients
avoiding their loss through
leaching); pH control
(buffer capacity); and
plant growth regulation
[49e51]
Biological fertility: enhancing
soil biota (food source); nutrient
cycling (degradation capacity
and nutrient availability);
and microbial activity
[52e54]
Climate regulation Global climate: carbon cycle [7,55e57]
Local climate: link to vegetation
cover; reduction of the albedo
of exposed soil
Maintenance of
substance cycles
Freshwater circuit:
water-holding capacity; CEC
for its filter function;
water conductivity; and
water infiltration
[53,55,58,59]
Carbon and nutrient cycling;
carbon pool
[7,55e57]
Immission protection: CEC
(filter and buffer capacity of soil)
and degradation capacity
(gene reservoir)
[7,60]
most consistently reported soil attribute from long-term studiesand is a keystone soil quality indicator’’. It is closely related tomany other soil quality indicators, such as cation exchange ca-pacity (CEC) or soil life activity. In addition, it is an indicator ofthe dynamic nature of soil, which differentiates soil from abi-otic resources, giving it the added value to support life [41].In contrast to inherent soil quality (determined by parent mate-rial, climate, time, etc.), dynamic soil quality (associated withSOM, structure, etc.) reflects the changes associated with cur-rent or past land use and anthropogenic management decisions.Lal [42] acknowledges that most agricultural soils now containa lower SOC pool than their potential as determined by climateand soil profile characteristics, mainly as a result of land usechanges due to human activities.
SOM has already been suggested as an indicator for soilquality in previous LCIA methodologies, generally as a measureof soil attributes to be combined with other parameters (such asstructure, pH, rainwater infiltration, etc.) [2,20,22,43]. Mila iCanals [4] provides a review of the role of SOM in LSF; thisis summarised in Table 2. Here, it is argued that SOM can beused as a single indicator for LSF in the framework of LCIAfor agricultural land uses (i.e. when used alongside other impactcategories such as toxicity, biodiversity and climate changewhich measure other aspects of soil quality).
It must be noted, though, that not all aspects of soil qualitywith impacts on LSF are represented by SOM. Erosion, com-paction, build-up of toxic substances, acidification and salini-sation are examples that are not directly assessed by usingSOM as an indicator3 However, in practical terms SOM isthe most relevant indicator for LSF in most agro-forestry sys-tems studied using LCA.
3.2. Calculation of changes in SOM and theirsignificance
The following values are needed for the assessment of landuse impacts according to the framework outlined in Section2.2, and using SOM as an indicator:
- the land occupation due to an activity (Aa) per functionalunit (e.g. ha year/f.u.);
- the SOM value at the start and end of land use (SOMini;SOMfin; Qini and Qfin in Fig. 5);
- the SOM value at each moment of the occupation process(SOMa; Qa in Fig. 5);
3 Erosion protection is partially represented because high SOM levels re-
duce soil vulnerability to erosion by increasing water infiltration and aggregate
stability. However, erosion depends on many other factors, particularly on veg-
etation cover. Compaction is partially represented because high SOM levels
increase the soil’s resistance to compaction; however, as for erosion, compac-
tion also depends upon other factors. Also the build-up of toxic substances in
soil has effects on soil quality that are not reflected by changes in SOM level.
In this case, though, it can be assumed that toxic effects are sufficiently rep-
resented by toxicity impact categories in the framework of LCA. Finally, sali-
nisation and acidification are specific problems not immediately linked to
SOM content that should be specifically addressed when relevant.

1432 L. Mila i Canals et al. / Journal of Cleaner Production 15 (2007) 1426e1440
- the SOM value at each moment of the reference situation(SOMref; Qref in Fig. 5);
- the SOM value at each moment of application of thebackup technology during the relaxation to SOMini (Qini
in Fig. 5); and- the potential SOM value of the site (SOMclimax).
The LSF indicator value is then calculated following thefour steps below.
3.2.1. Step 1: estimate the occupation impacts (LSFuse,a)The value of SOMa at each moment of the occupation
is subtracted from the value at each moment of the alter-native situation (SOMref). Multiplying each resulting value(SOMref� SOMa) by the calculation step (ti; usually oneyear) and the area of study, and adding the results, gives theLSF indicator value for the land use (Eq. (1)).
LSFuse;a ¼ Aa
Xtfin
i¼tini
�SOMref;i� SOMa;i
�ti ð1Þ
where Aa is the area occupied by the activity and i representsthe calculation step; the temporal limits of the calculation arethe beginning (tini) and end (tfin) of the occupation.
3.2.2. Step 2: estimate the impacts from changes inSOM content (LSFrelax,a)
At the end of the occupation (tfin) different things may hap-pen: if the SOM content has not changed during the occupa-tion (SOMini¼ SOMfin) then no further calculations areperformed. If the SOM content has decreased then the impactsfrom the most likely backup technology (as determined by theanalyst) occurring during the change back to Qini (LSFrelax,a)are assessed; these impacts may include extended occupationimpacts. If the SOM content has increased, then the impacts
from the most likely backup technology to raise the SOM con-tent by (SOMfin� SOMini) may be credited to the system toestimate the total (reduced) impacts. If natural relaxation isthe most likely backup technology, extended occupation im-pacts have to be calculated with SOMini (Eq. (2); Fig. 5(a)and (b)) or SOMfin (Eq. (3); Fig. 5(c) and (d)) as the referencefor systems decreasing and increasing SOM content,respectively.
LSFrelax;a ¼ Aa
Xtfin0
i¼tfin
ðSOMini� SOMrelax;iÞti ð2Þ
LSFrelax;a ¼�Aa
Xtfin0
i¼tfin
�SOMfin � SOMrelax;i
�ti ð3Þ
When natural relaxation occurs it is common to observe aninitial decline in SOM during the first years, due to the de-crease in organic matter additions in the early stages of succes-sion. When assessing short periods of time (such as a few croprotations or less), we suggest disregarding this initial period ofrelaxation showing a decrease in SOM, as this would be irrel-evant when allocated over all the years of agricultural activity.Fig. 6 shows the section of natural relaxation of SOM that maybe disregarded when SOM content has decreased during thestudied land use (Fig. 6(a)) and when SOM has increased(Fig. 6(b)).
3.2.3. Step 3: estimate the total impacts (LSFtotal,a)The LSF indicator is calculated as the sum of the occupa-
tion impacts (LSFuse,a) and the impacts due to the backup tech-nology (LSFrelax,a) (Eq. (4)).
LSFtotal;a ¼ LSFuse;a þLSFrelax;a ð4Þ
Fig. 6. Disregarding initial SOM decrease from natural relaxation when system has decreased (a) or increased (b) SOM level.
1433L. Mila i Canals et al. / Journal of Cleaner Production 15 (2007) 1426e1440
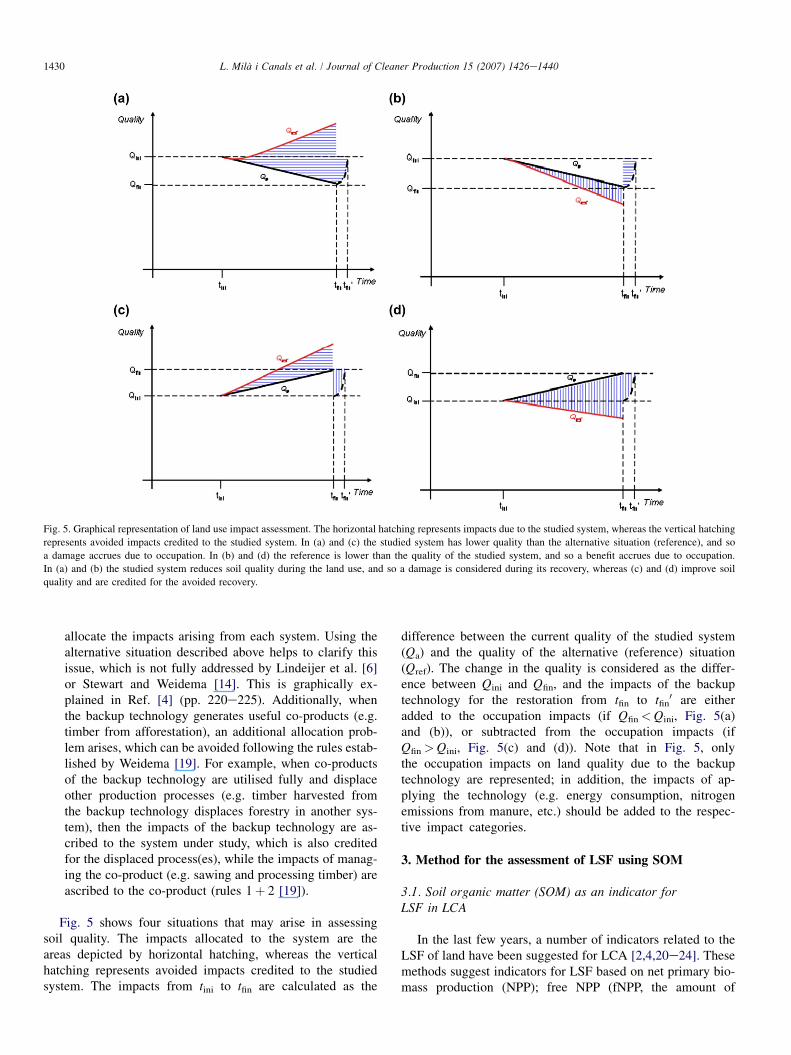
3.2.4. Step 4: estimate the significance of changes in SOMSoil with a low SOM content may show very small varia-
tions in SOM content during land management due to themore recalcitrant nature of this SOM compared to soils havinghigher initial SOM content. Also, their SOM will increasemore slowly than soils with a higher initial SOM content.This is illustrated in Fig. 7 where the same activity may occurin systems 1 and 2, and yet the change in SOM is much greaterin system 1 than in system 2. Following the three steps de-scribed above, system 1 has a higher LSF indicator valuethan system 2. However, in reality the changes occurring insystem 2 may be more significant because the lower SOMlevel indicates less resilience.
This site-dependent significance of changes in SOMcontent can be taken into account by dividing the LSF indica-tor value (LSFtotal,a) by the rate SOMini/SOMclimax, whereSOMclimax is an estimate of the potential SOM level for thesoil studied. For example, in Fig. 7 the higher LSF indicatorvalue calculated for system 1 would be divided by 0.8, andthe lower LSF indicator value for system 2 would be dividedby 0.3.
Fig. 7 shows two systems with the same climax potential(SOMclimax,1,2), but different climaxes may occur in differentsystems. This step in the method facilitates comparison be-tween systems in different regions or at different levels ofdegradation.
In dry and semi-arid regions, recovery after degradationmay be hindered by the naturally low SOM content and soilresilience in these regions. In these conditions a threshold limitvalue (ultimate quality limit, according to Stewart andWeidema [14]) may be reached below which natural relaxationdoes not take place (Fig. 4). Even though it is difficult to es-tablish this critical value, Persson and Kirchman [61] suggestthat when soil organic carbon (SOC) falls below 1%, soilstructure is too damaged to continue biotic production. TheEuropean Commission also suggests this critical threshold to
Fig. 7. Considering the significance of changes in SOM.
classify soils with less than 1.7% of SOM (approximatelyequivalent to 1% SOC) as in a ‘‘phase of pre-desertification’’[62]. It must be noted, though, that this threshold value of 1%SOC is not widely accepted, and is soil- and location-dependent; as an example, certain dry soils seem to be ableto sustain productive agricultural systems below this thresholdvalue (see example in Section 4).
3.3. Data sources for SOM
SOM content is usually estimated from the analysis of soilorganic carbon (SOC). Brady and Weil [41] suggest that SOMin mineral soils can be estimated as 1.724 times SOC (i.e. SOCrepresents ca. 58% of SOM). In general, the quantity of SOMin a system can be:
(a) measured directly from soil samples,(b) calculated using local datasets and locally adjusted
models, and(c) estimated from literature values for different areas and
crops.
Cowell [2] suggests that these three options are actually hi-erarchical, and thus site-specific measures should be usedwhenever possible. Indeed, the uncertainty related to thesesources of data will be much lower if site-specific measure-ments are available.
(a) Direct measurements: To use these data, field data of cur-rent SOM levels are required, as well as values for the evo-lution of SOM under the current land management.Obtaining all these data will probably be prohibitively ex-pensive [63], and is unlikely to be feasible from an LCAperspective in most cases. However, values for currentSOM levels will generally be available and can be com-bined with other data sources in LCA studies.
(b) Model calculations: In some cases, well-documented andwell-evaluated (within the study area) models may providean acceptable alternative to measured data [63]. Themodels may be used to estimate SOM evolution for thesystem under analysis, the alternative occupation, and evo-lution due to application of the backup technology (seee.g. [64,65] and the example in Section 4).
(c) Estimates from literature values: Extensive data sets maybe found in the literature on SOM levels in differentsoils of the world (e.g. [66]). These data sets may be usedto obtain default values for the initial SOM levels andSOMclimax. Besides, the growing interest in estimating thecarbon sequestration potential of forests and croplandshas generated increasing literature on SOC evolution underdifferent land management practices (see Appendix 1 and,for example, IPCC [67]; Arrouays et al. [68]; Freibaueret al. [69]). Additionally, national SOM inventories under-taken in many countries for the Kyoto Protocol carbonsinks instrument may provide a useful data source in this re-spect. However, default values should only be used as a last

1434 L. Mila i Canals et al. / Journal of Cleaner Production 15 (2007) 1426e1440
option and mainly for screening purposes because SOMvalues are always site-dependent.
3.4. Units of measure for SOM
Soil organic matter can be expressed as concentration (%)or as quantity per unit of land surface (Mg ha�1). To convertthe organic matter concentration to quantity we need toknow the soil bulk density (g of soil/cm3) and the thickness(cm) of the soil horizon. In many soil surveys agricultural soilsare sampled from 0 to 20 cm in one single soil horizon. In thiscase, calculation of the quantity of the organic carbon pool inthe first 20 cm would follow the equation:
SOC0e20 cmðMg ha�1Þ ¼ C ð%Þ �Bulk density ðg cm�3Þ� Soil depth ðcmÞ ð5Þ
If the soil has been sampled and analysed divided in i dif-ferent horizons this calculation step should be carried out foreach soil horizon as indicated in the following equation:
SOCtotal¼Xi
n¼1
ð%Ci�Bulk densityi�Horizon thicknessiÞ ð6Þ
3.5. Additional considerations
Apart from its beneficial effects, addition of organic matterto soil may have undesirable side-effects related to toxic sub-stances present in the some organic residues added to soil(e.g. in wastewater sludge or manures from intensive livestockproduction); excess of nutrients leading to nitrate leaching, etc.(as acknowledged in C sequestration literature [69]). Thereforeany additional impacts associated with adding SOM should bemodelled alongside changes in SOM within the LCA.
SOM is an appropriate LSF indicator for most agriculturalsoils because their SOM levels correlate with general soilquality and its related LSF. However, in highly acidified orin waterlogged soils the SOM levels may not correlate directlywith soil quality. Thus, in these situations SOM level may notbe a relevant indicator of soil quality.
4. Worked example
As an example of application of the approach presentedabove, we used hypothetical cereal fields established oncleared Holm oak (Quercus ilex L.) forests in Vallgorguina(Catalonia, North-east Spain) and then transformed to Pinusradiata fast growing plantations as described by Romanyaet al. [64]. In brief, the history of the area is as follows:
- in the past (ca. 250 years ago), the original forest (Holmoak, Q. ilex L.) was chopped down and cereal crop fieldswere established.
- Cereals were grown for ca. 200 years, with periodic addi-tion of manure and crop residues, as well as a fallow year(with bare soil) every 5 years.
- After agriculture was abandoned, a fast growing pine (P.radiata) plantation was established.
One hectare of agricultural field is assessed under differentmanagement practices, which are not considered to affectyields (2 Mg grain ha�1 year�1).
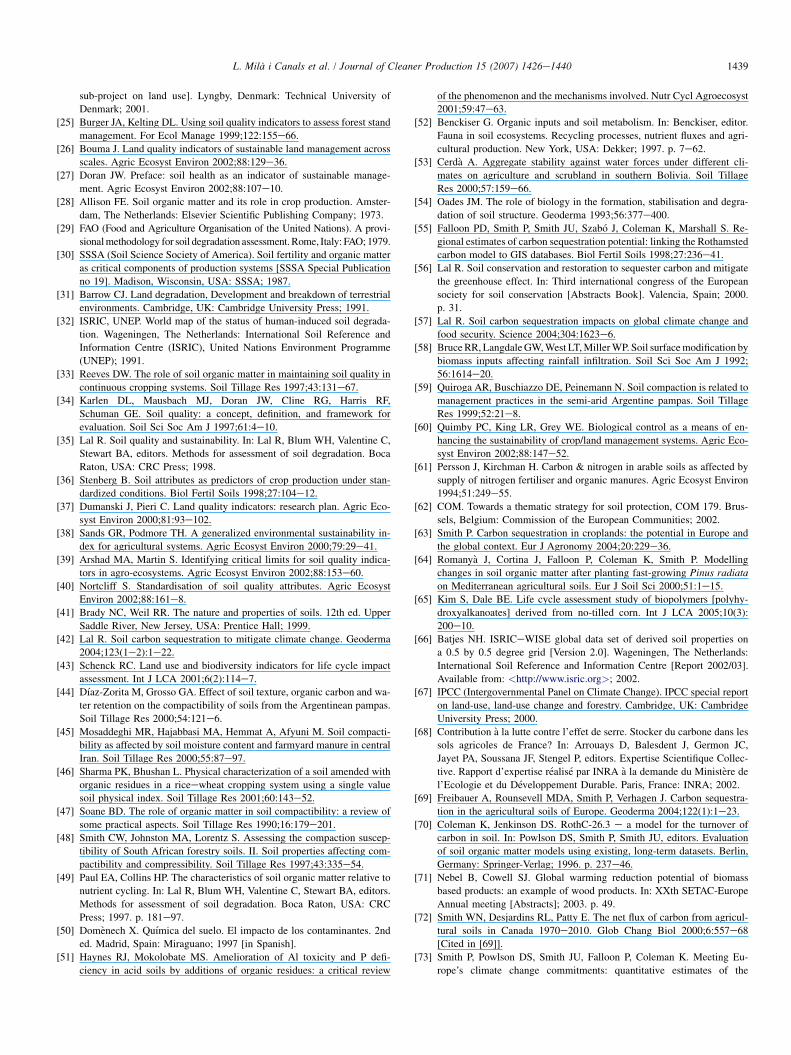
The RothC model [70] was used to simulate the impact ofdifferent management scenarios on the evolution of SOC inthis area. RothC is a multi-compartmental decompositionmodel, originally parameterized for temperate agriculturalsoils, which has been used worldwide in various ecosystemsand climates to describe the turnover rate of organic carbonin soil. The model describes the turnover of organic carbonin soil using monthly input data and is sensitive to soil type,temperature, moisture and plant cover. The model requiresthe inputs of organic carbon to the system; in cereal systemsthis can be divided into plant residues and the exogenous or-ganic matter (manure). In treatments with straw removal, theplant inputs were mainly root production of crops; in treat-ments with no straw removal, the straw was also consideredan input and was thus added to root production. The fallowyears were considered to be without plants so during theseyears organic matter inputs were kept at 0. For climaticdata, mean monthly temperature, rainfall and actual evapo-transpiration (AET) in the area of study were used. For this pa-per, RothC has been used to model the following different landmanagement possibilities:
- straw removal versus no straw removal- different amounts of manure added per year (0, 5, 10 and
20 Mg manure ha�1 year�1)
Fig. 8 gives the results of this simulation.
Time (years)0 5 10 15 20 25 30 35
Tota
l C (M
g ha
-1)
0
5
10
15
20
25
30
35
40
45
50
no straw removalwith straw removal
Cultivation of cereals Afforestation withPinus radiata
Recovery of system D
Marginal situation:afforestation with Pinus radiata
A
B
C
D
Fallowyear
Fallowyear
Fallowyear
Fig. 8. Modeling of SOC in the top 30 cm under different agricultural
management systems. Systems AeD receive 20, 10, 5 and 0 Mg manure ha�1
year�1, respectively.
1435L. Mila i Canals et al. / Journal of Cleaner Production 15 (2007) 1426e1440
4.1. Alternative situation and backup technology
Many agricultural fields in the area of study have beenabandoned in the last 50 years and afforested with pine plan-tations, and therefore this has been considered as the alterna-tive land use. Afforestation with P. radiata has also beenconsidered as the most likely backup technology at the endof the system to recover the initial soil quality.
To assess SOM evolution under the pine plantation, theRothC model was used and the results compared with measureddata from old cereal fields that had been abandoned duringthe second half of the 20th century [64]. Measured forestlitterfall and calculated root production were introduced tothe model as organic matter inputs [64]. As fields afforestedin different years were present in the area under study,SOM measures were available that could be used in order tovalidate the predictions of RothC for the relaxation period, afteragriculture was abandoned. The model also considers that theorganic matter from the forest decomposes more slowly thanthat of the cereal fields, and that there is no litterfall in the firstyears of the pine plantation (leading to an initial reduction inSOM).
4.2. Interpretation of the results according to theproposed framework
A typical LCA application might be the comparison of twosystems with different soil management regimes. As an exam-ple, comparison of the following two systems is undertakenhere:
- System B: straw removal; addition of 10 Mg manureha�1 year�1
- System D: no straw removal; no addition of manure
In both cases, four whole crop rotations are assessed, fromyear 0 to year 23 in Fig. 8.
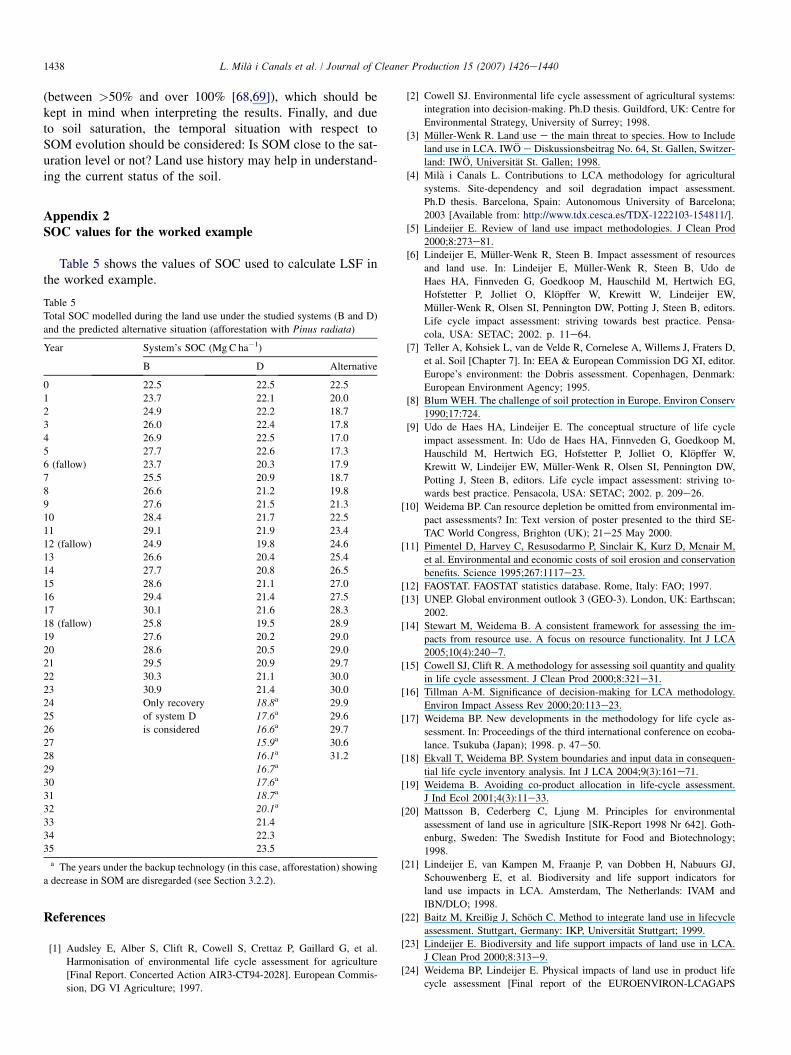
The outcome of the model consists of the organic carboncontent of the soil divided into different fractions (microbialbiomass, humus and inert organic matter) and the radiocarbonage of the soil organic matter. For this paper, only total organiccarbon in the top 30 cm of soil has been used as this is thedepth of soil principally affected by land management, andthe actual values at the end of each year modelled are givenin Appendix 2.
To calculate the LSF indicator values for each system, thefollowing procedure is followed:
- The current SOM level in systems B and D (Fig. 8 andAppendix 2) is subtracted from the SOM level in the alter-native situation (P. radiata plantation) for each time step(1 year): this is the yearly carbon deficit or surplus dueto the existence of the system under study.
- As the final SOM level in system D (SOMfin,D¼ 21.4Mg C ha�1) is lower than the initial state (SOMini,D¼
22.5 Mg C ha�1), and as afforestation similar to the alter-native situation is the most likely backup technology, theimpacts during recovery up to the initial SOM level(SOMini) with a pine plantation are added to system D.As the initial decline in SOM for the plantation is disre-garded (Fig. 6), only the carbon deficit of years 33 and34 (Appendix 2), when SOMini is reached again, are addedto system D’s carbon deficit.
- In the case of system B, the final SOM level (SOMfin,B¼30.9 Mg C ha�1) is higher than the initial state(SOMini,B¼ 22.5 Mg C ha�1). Therefore, the system iscredited with the (avoided) impacts that would occur ifthe backup technology was applied to raise the SOM levelfrom SOMini,B to SOMfin,B. Again, the initial SOM declineof afforestation is disregarded, and the Mg C year creditedto system B can be obtained from the years 10 to 27 of theafforestation process (Appendix 2).
- As both systems under study are alternatives withthe same SOMini no characterisation of the results isrequired, and so they can directly be compared (i.e. Sec-tion 3.2.4).
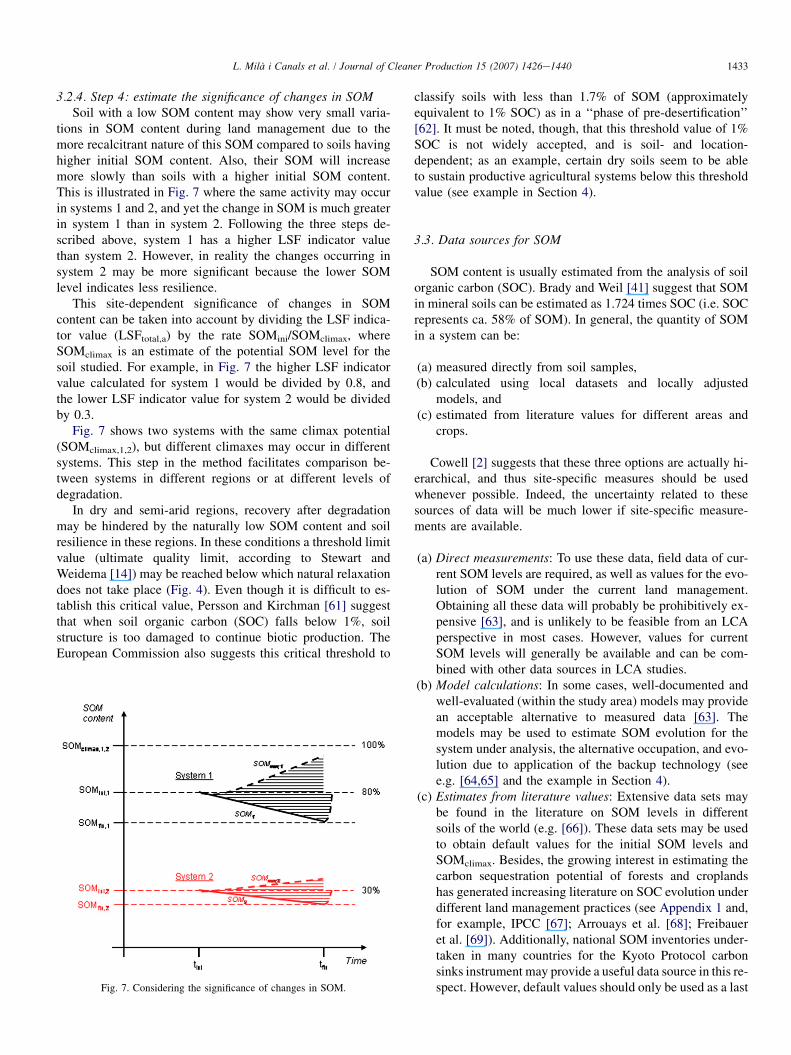
The final values are given in Table 3.According to the results in Table 3, system B is preferable
to system D in terms of LSF, with a net build-up of SOC andcredit for the improvement of soil quality (expressed bySOM). Of course, in the framework of LCA and as noted inSection 3.5, other impacts must be taken into account in theoverall analysis. For instance, system B may have increasedyield and energy consumption associated with the transporta-tion and spreading of manure, as well as increased nitrogenemissions from the field in the form of nitrates, ammoniaand nitrous oxide. The full LCA would show any trade-offs be-tween the LSF benefits and negative impacts arising from in-creased energy consumption.
The results shown in Table 3 refer to the impacts from ac-tivities on 1 ha during 23 years, which is unusual from an LCAperspective (where the functional unit usually refers to prod-ucts). Bearing in mind the yield described above (2 Mg grainha�1 year�1), these results may be related to a mass functionalunit such as 1 tonne grain. Considering that 3 of the 23 years arefallow, system B would then have an LSF of �2.6 Mg C yearper tonne grain (credit), and system D an LSF of 1.6 Mg Cyear per tonne grain.
Table 3
Calculation of LSF indicator for systems B and D
System Carbon deficit
during land use
(Mg C year)
Carbon deficit
during recovery to
the initial quality
(Mg C year)
Carbon deficit
attributed to
land use of the
studied system
(Mg C year)
LSFuse,a LSFrelax,a LSFtotal,a
x y xþ y
B �79.9 �24.5 �104.5
D 62.2 1.3 63.6
1436 L. Mila i Canals et al. / Journal of Cleaner Production 15 (2007) 1426e1440
It may be noted that applying Eq. (5) to the first 30 cm ofsoil, and using a soil bulk density of 1.51 g cm�3, 1% of or-ganic carbon represents a pool of 45.3 Mg C ha�1. Thereforethe soil in this case study is below 1% SOC threshold sug-gested as the lower limit for use of this approach. Actually,the SOC level in the natural forest (35 Mg C ha�1 accordingto Romanya et al. [64]) is also below this threshold, as is quiteoften the case in dry sandy soils. However, data from existingand functioning ecosystems show that this soil is indeed quitefertile and viable and so it is appropriate to use the approachfor this particular situation.
The results of the assessment are not additive, i.e. theresults for the 23-year period are not the same as the sumof the results for individual years calculated separatelyfollowing the same methodology. If the LCA practitioneris interested in the assessment being additive then she/heshould aim at assessing the longest possible period and al-locating the results amongst the overall yield of all theyears, as in the example above. This procedure increasesthe robustness of the analysis because it describes themedium- to longer-term effects of the studied agriculturalmanagement.
5. Discussion and conclusions
Agricultural management greatly affects soil quality andits effects can be quantified using suitable indicators suchas soil organic matter (SOM). A consistent framework forassessment has been presented in this paper based onprevious approaches for the treatment of land use interven-tions in LCA. SOM is suggested as a simple (but robust)approach for the LCIA of land use occupation and transfor-mation impacts affecting life support functions (LSF). Thisframework is useful for agro-forestry studies where soilquality is not compromised by factors such as water log-ging, acidification, salinisation, etc. In waterlogged or acidicsoils other indicators need to be used within the methodpresented here.
SOM does not cover certain aspects of soil quality, and thisshould be born in mind when interpreting the results. How-ever, as the current practice in LCIA is generally to omit theassessment of impacts on soil quality, a simple and applicableindicator such as SOM is regarded as a better option than noassessment of soil quality. A vector of indicators is neededto catch the multi-functional nature of soil; future researchon this subject may still use the general approach presentedin this paper as a consistent way of including all the relevantimpacts arising from use of land. Besides, impacts on biodi-versity from land use are also highly relevant, and are not in-dicated by SOM; therefore, this method should be used incombination with a proper assessment of the impacts onbiodiversity.
The results of applying the framework suggested in thispaper are highly site- and time-dependent, and particularlythe definition of an alternative situation in each region mayaffect the results to a large extent. This must be born in
mind when interpreting the results for land use impacts, par-ticularly when systems in different regions are being com-pared. This should not be regarded as a weakness of theframework: it is rather a consequence of the nature of landuse impacts.
Additionally, the outcome of the SOM modelling describedin this paper may be used to assess the contribution of thestudied system to climate change. In this case, the creditfrom sequestering and storing a certain amount of Mg Cyear may be shown as explained by Nebel and Cowell [71].Section 3.2.4 would not be relevant in this case, as the netgreenhouse gas emissions allocated to the system are requiredrather than their significance with respect to a potential SOMlevel. The use of this approach for assessing carbon storage insoil may help to avoid the underestimation of ‘‘hidden C emis-sions’’ when assessing C sequestration options, as suggested inliterature [42,69].
The next step for the testing of the method presented here isto undertake a comprehensive LCA case study and assess therelative importance of changes in SOM in relation to changesin other impact categories due to the use of backup technolo-gies, and choice of alternative situation.
Acknowledgements
Discussions within the Life Cycle initiative taskforce onresources and land use have provided useful input to thispaper. A research grant (AP96 37330593) from the SpanishMinistry of Education allowed the research for the previousversions of this method, presented in international forums in2000 and 2001. Three anonymous reviewers have commentedand helped to improve this paper.
Appendix 1Literature values for SOM evolution
Proper documentation of the management practice (e.g. pe-riod during which it has been applied, type of soil and climate,type of previous land use, etc.) is necessary before using datafrom Table 4. Particularly, it is important to work as much aspossible with data adapted to the conditions of the study, asnew findings and recommendations are continuously pro-duced. Besides, the C sequestration potential of agriculturalpractices changes over time due to soil saturation, witha new equilibrium being reached after 20e100 years in tem-perate regions [69]. Consequently, the length of time overwhich a management practice is applied should be docu-mented as well.
Data provided in Table 4 are only examples from more ex-tensive data reviews, which include more references on othertypes of conversion and practices in other land types (wood-land, grassland, etc.) [68,69]. The reader is encouraged totry and find more relevant data for the area of the study,with indications of previous soil use, climate, etc. Addition-ally, the values in Table 4 have a very high uncertainty
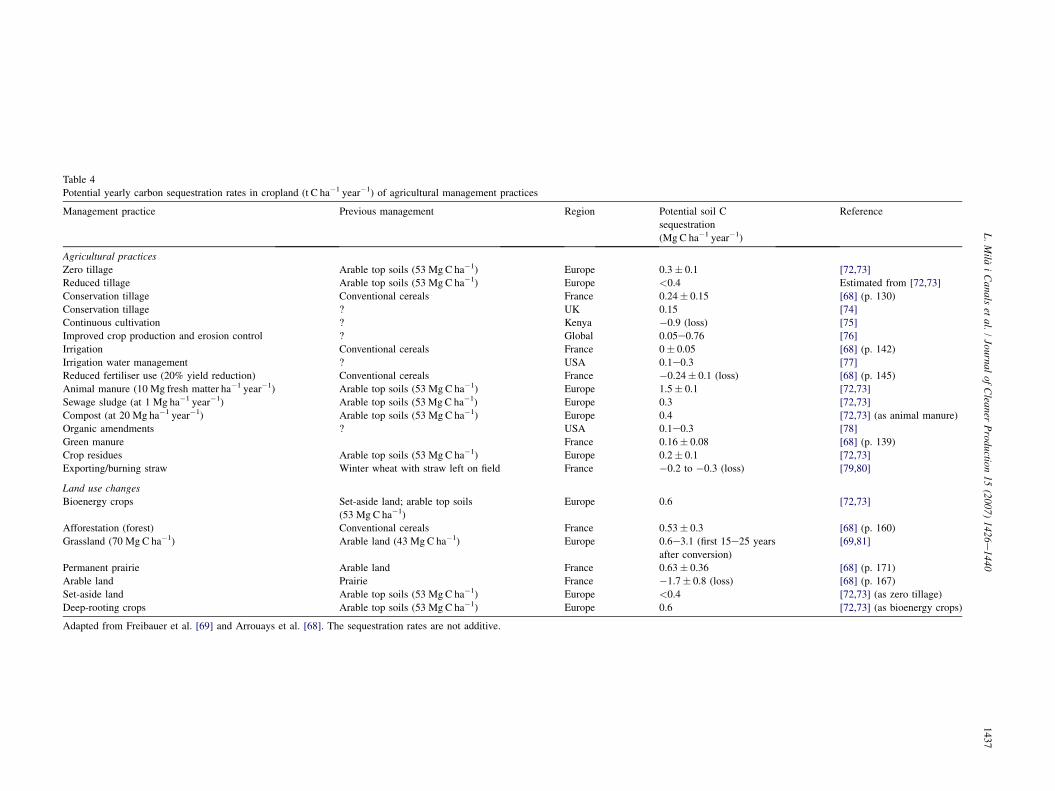
Table 4
Potential yearly carbon
Management practice Potential soil C
sequestration
(Mg C ha�1 year�1)
Reference
Agricultural practices
Zero tillage 0.3� 0.1 [72,73]
Reduced tillage <0.4 Estimated from [72,73]
Conservation tillage 0.24� 0.15 [68] (p. 130)
Conservation tillage 0.15 [74]
Continuous cultivation �0.9 (loss) [75]
Improved crop product 0.05e0.76 [76]
Irrigation 0� 0.05 [68] (p. 142)
Irrigation water manage 0.1e0.3 [77]
Reduced fertiliser use ( �0.24� 0.1 (loss) [68] (p. 145)
Animal manure (10 Mg 1.5� 0.1 [72,73]
Sewage sludge (at 1 M 0.3 [72,73]
Compost (at 20 Mg ha� 0.4 [72,73] (as animal manure)
Organic amendments 0.1e0.3 [78]
Green manure 0.16� 0.08 [68] (p. 139)
Crop residues 0.2� 0.1 [72,73]
Exporting/burning straw �0.2 to �0.3 (loss) [79,80]
Land use changes
Bioenergy crops 0.6 [72,73]
Afforestation (forest) 0.53� 0.3 [68] (p. 160)
Grassland (70 Mg C ha� 0.6e3.1 (first 15e25 years
after conversion)
[69,81]
Permanent prairie 0.63� 0.36 [68] (p. 171)
Arable land �1.7� 0.8 (loss) [68] (p. 167)
Set-aside land <0.4 [72,73] (as zero tillage)
Deep-rooting crops 0.6 [72,73] (as bioenergy crops)
Adapted from Freibaue
14
37
L.
Mila
iC
analset
al./
Journalof
Cleaner
Production
15(2007)
1426e1440
sequestration rates in cropland (t C ha�1 year�1) of agricultural management practices
Previous management Region
Arable top soils (53 Mg C ha�1) Europe
Arable top soils (53 Mg C ha�1) Europe
Conventional cereals France
? UK
? Kenya
ion and erosion control ? Global
Conventional cereals France
ment ? USA
20% yield reduction) Conventional cereals France
fresh matter ha�1 year�1) Arable top soils (53 Mg C ha�1) Europe
g ha�1 year�1) Arable top soils (53 Mg C ha�1) Europe1 year�1) Arable top soils (53 Mg C ha�1) Europe
? USA
France
Arable top soils (53 Mg C ha�1) Europe
Winter wheat with straw left on field France
Set-aside land; arable top soils
(53 Mg C ha�1)
Europe
Conventional cereals France1) Arable land (43 Mg C ha�1) Europe
Arable land France
Prairie France
Arable top soils (53 Mg C ha�1) Europe
Arable top soils (53 Mg C ha�1) Europe
r et al. [69] and Arrouays et al. [68]. The sequestration rates are not additive.
1438 L. Mila i Canals et al. / Journal of Cleaner Production 15 (2007) 1426e1440
(between >50% and over 100% [68,69]), which should bekept in mind when interpreting the results. Finally, and dueto soil saturation, the temporal situation with respect toSOM evolution should be considered: Is SOM close to the sat-uration level or not? Land use history may help in understand-ing the current status of the soil.
Appendix 2SOC values for the worked example
Table 5 shows the values of SOC used to calculate LSF inthe worked example.
References
[1] Audsley E, Alber S, Clift R, Cowell S, Crettaz P, Gaillard G, et al.
Harmonisation of environmental life cycle assessment for agriculture
[Final Report. Concerted Action AIR3-CT94-2028]. European Commis-
sion, DG VI Agriculture; 1997.
Table 5
Total SOC modelled during the land use under the studied systems (B and D)
and the predicted alternative situation (afforestation with Pinus radiata)
Year System’s SOC (Mg C ha�1)
B D Alternative
0 22.5 22.5 22.5
1 23.7 22.1 20.0
2 24.9 22.2 18.7
3 26.0 22.4 17.8
4 26.9 22.5 17.0
5 27.7 22.6 17.3
6 (fallow) 23.7 20.3 17.9
7 25.5 20.9 18.7
8 26.6 21.2 19.8
9 27.6 21.5 21.3
10 28.4 21.7 22.5
11 29.1 21.9 23.4
12 (fallow) 24.9 19.8 24.6
13 26.6 20.4 25.4
14 27.7 20.8 26.5
15 28.6 21.1 27.0
16 29.4 21.4 27.5
17 30.1 21.6 28.3
18 (fallow) 25.8 19.5 28.9
19 27.6 20.2 29.0
20 28.6 20.5 29.0
21 29.5 20.9 29.7
22 30.3 21.1 30.0
23 30.9 21.4 30.0
24 Only recovery
of system D
is considered
18.8a 29.9
25 17.6a 29.6
26 16.6a 29.7
27 15.9a 30.6
28 16.1a 31.2
29 16.7a
30 17.6a
31 18.7a
32 20.1a
33 21.4
34 22.3
35 23.5
a The years under the backup technology (in this case, afforestation) showing
a decrease in SOM are disregarded (see Section 3.2.2).
[2] Cowell SJ. Environmental life cycle assessment of agricultural systems:
integration into decision-making. Ph.D thesis. Guildford, UK: Centre for
Environmental Strategy, University of Surrey; 1998.
[3] Muller-Wenk R. Land use e the main threat to species. How to Include
land use in LCA. IWO e Diskussionsbeitrag No. 64, St. Gallen, Switzer-
land: IWO, Universitat St. Gallen; 1998.
[4] Mila i Canals L. Contributions to LCA methodology for agricultural
systems. Site-dependency and soil degradation impact assessment.
Ph.D thesis. Barcelona, Spain: Autonomous University of Barcelona;
2003 [Available from: http://www.tdx.cesca.es/TDX-1222103-154811/].
[5] Lindeijer E. Review of land use impact methodologies. J Clean Prod
2000;8:273e81.
[6] Lindeijer E, Muller-Wenk R, Steen B. Impact assessment of resources
and land use. In: Lindeijer E, Muller-Wenk R, Steen B, Udo de
Haes HA, Finnveden G, Goedkoop M, Hauschild M, Hertwich EG,
Hofstetter P, Jolliet O, Klopffer W, Krewitt W, Lindeijer EW,
Muller-Wenk R, Olsen SI, Pennington DW, Potting J, Steen B, editors.
Life cycle impact assessment: striving towards best practice. Pensa-
cola, USA: SETAC; 2002. p. 11e64.
[7] Teller A, Kohsiek L, van de Velde R, Cornelese A, Willems J, Fraters D,
et al. Soil [Chapter 7]. In: EEA & European Commission DG XI, editor.
Europe’s environment: the Dobris assessment. Copenhagen, Denmark:
European Environment Agency; 1995.
[8] Blum WEH. The challenge of soil protection in Europe. Environ Conserv
1990;17:724.
[9] Udo de Haes HA, Lindeijer E. The conceptual structure of life cycle
impact assessment. In: Udo de Haes HA, Finnveden G, Goedkoop M,
Hauschild M, Hertwich EG, Hofstetter P, Jolliet O, Klopffer W,
Krewitt W, Lindeijer EW, Muller-Wenk R, Olsen SI, Pennington DW,
Potting J, Steen B, editors. Life cycle impact assessment: striving to-
wards best practice. Pensacola, USA: SETAC; 2002. p. 209e26.
[10] Weidema BP. Can resource depletion be omitted from environmental im-
pact assessments? In: Text version of poster presented to the third SE-
TAC World Congress, Brighton (UK); 21e25 May 2000.
[11] Pimentel D, Harvey C, Resusodarmo P, Sinclair K, Kurz D, Mcnair M,
et al. Environmental and economic costs of soil erosion and conservation
benefits. Science 1995;267:1117e23.
[12] FAOSTAT. FAOSTAT statistics database. Rome, Italy: FAO; 1997.
[13] UNEP. Global environment outlook 3 (GEO-3). London, UK: Earthscan;
2002.
[14] Stewart M, Weidema B. A consistent framework for assessing the im-
pacts from resource use. A focus on resource functionality. Int J LCA
2005;10(4):240e7.
[15] Cowell SJ, Clift R. A methodology for assessing soil quantity and quality
in life cycle assessment. J Clean Prod 2000;8:321e31.
[16] Tillman A-M. Significance of decision-making for LCA methodology.
Environ Impact Assess Rev 2000;20:113e23.
[17] Weidema BP. New developments in the methodology for life cycle as-
sessment. In: Proceedings of the third international conference on ecoba-
lance. Tsukuba (Japan); 1998. p. 47e50.
[18] Ekvall T, Weidema BP. System boundaries and input data in consequen-
tial life cycle inventory analysis. Int J LCA 2004;9(3):161e71.
[19] Weidema B. Avoiding co-product allocation in life-cycle assessment.
J Ind Ecol 2001;4(3):11e33.
[20] Mattsson B, Cederberg C, Ljung M. Principles for environmental
assessment of land use in agriculture [SIK-Report 1998 Nr 642]. Goth-
enburg, Sweden: The Swedish Institute for Food and Biotechnology;
1998.
[21] Lindeijer E, van Kampen M, Fraanje P, van Dobben H, Nabuurs GJ,
Schouwenberg E, et al. Biodiversity and life support indicators for
land use impacts in LCA. Amsterdam, The Netherlands: IVAM and
IBN/DLO; 1998.
[22] Baitz M, Kreißig J, Schoch C. Method to integrate land use in lifecycle
assessment. Stuttgart, Germany: IKP, Universitat Stuttgart; 1999.
[23] Lindeijer E. Biodiversity and life support impacts of land use in LCA.
J Clean Prod 2000;8:313e9.
[24] Weidema BP, Lindeijer E. Physical impacts of land use in product life
cycle assessment [Final report of the EUROENVIRON-LCAGAPS
1439L. Mila i Canals et al. / Journal of Cleaner Production 15 (2007) 1426e1440
sub-project on land use]. Lyngby, Denmark: Technical University of
Denmark; 2001.
[25] Burger JA, Kelting DL. Using soil quality indicators to assess forest stand
management. For Ecol Manage 1999;122:155e66.
[26] Bouma J. Land quality indicators of sustainable land management across
scales. Agric Ecosyst Environ 2002;88:129e36.
[27] Doran JW. Preface: soil health as an indicator of sustainable manage-
ment. Agric Ecosyst Environ 2002;88:107e10.
[28] Allison FE. Soil organic matter and its role in crop production. Amster-
dam, The Netherlands: Elsevier Scientific Publishing Company; 1973.
[29] FAO (Food and Agriculture Organisation of the United Nations). A provi-
sional methodology for soil degradation assessment. Rome, Italy: FAO; 1979.
[30] SSSA (Soil Science Society of America). Soil fertility and organic matter
as critical components of production systems [SSSA Special Publication
no 19]. Madison, Wisconsin, USA: SSSA; 1987.
[31] Barrow CJ. Land degradation, Development and breakdown of terrestrial
environments. Cambridge, UK: Cambridge University Press; 1991.
[32] ISRIC, UNEP. World map of the status of human-induced soil degrada-
tion. Wageningen, The Netherlands: International Soil Reference and
Information Centre (ISRIC), United Nations Environment Programme
(UNEP); 1991.
[33] Reeves DW. The role of soil organic matter in maintaining soil quality in
continuous cropping systems. Soil Tillage Res 1997;43:131e67.
[34] Karlen DL, Mausbach MJ, Doran JW, Cline RG, Harris RF,
Schuman GE. Soil quality: a concept, definition, and framework for
evaluation. Soil Sci Soc Am J 1997;61:4e10.
[35] Lal R. Soil quality and sustainability. In: Lal R, Blum WH, Valentine C,
Stewart BA, editors. Methods for assessment of soil degradation. Boca
Raton, USA: CRC Press; 1998.
[36] Stenberg B. Soil attributes as predictors of crop production under stan-
dardized conditions. Biol Fertil Soils 1998;27:104e12.
[37] Dumanski J, Pieri C. Land quality indicators: research plan. Agric Eco-
syst Environ 2000;81:93e102.
[38] Sands GR, Podmore TH. A generalized environmental sustainability in-
dex for agricultural systems. Agric Ecosyst Environ 2000;79:29e41.
[39] Arshad MA, Martin S. Identifying critical limits for soil quality indica-
tors in agro-ecosystems. Agric Ecosyst Environ 2002;88:153e60.
[40] Nortcliff S. Standardisation of soil quality attributes. Agric Ecosyst
Environ 2002;88:161e8.
[41] Brady NC, Weil RR. The nature and properties of soils. 12th ed. Upper
Saddle River, New Jersey, USA: Prentice Hall; 1999.
[42] Lal R. Soil carbon sequestration to mitigate climate change. Geoderma
2004;123(1e2):1e22.
[43] Schenck RC. Land use and biodiversity indicators for life cycle impact
assessment. Int J LCA 2001;6(2):114e7.
[44] Dıaz-Zorita M, Grosso GA. Effect of soil texture, organic carbon and wa-
ter retention on the compactibility of soils from the Argentinean pampas.
Soil Tillage Res 2000;54:121e6.
[45] Mosaddeghi MR, Hajabbasi MA, Hemmat A, Afyuni M. Soil compacti-
bility as affected by soil moisture content and farmyard manure in central
Iran. Soil Tillage Res 2000;55:87e97.
[46] Sharma PK, Bhushan L. Physical characterization of a soil amended with
organic residues in a riceewheat cropping system using a single value
soil physical index. Soil Tillage Res 2001;60:143e52.
[47] Soane BD. The role of organic matter in soil compactibility: a review of
some practical aspects. Soil Tillage Res 1990;16:179e201.
[48] Smith CW, Johnston MA, Lorentz S. Assessing the compaction suscep-
tibility of South African forestry soils. II. Soil properties affecting com-
pactibility and compressibility. Soil Tillage Res 1997;43:335e54.
[49] Paul EA, Collins HP. The characteristics of soil organic matter relative to
nutrient cycling. In: Lal R, Blum WH, Valentine C, Stewart BA, editors.
Methods for assessment of soil degradation. Boca Raton, USA: CRC
Press; 1997. p. 181e97.
[50] Domenech X. Quımica del suelo. El impacto de los contaminantes. 2nd
ed. Madrid, Spain: Miraguano; 1997 [in Spanish].
[51] Haynes RJ, Mokolobate MS. Amelioration of Al toxicity and P defi-
ciency in acid soils by additions of organic residues: a critical review
of the phenomenon and the mechanisms involved. Nutr Cycl Agroecosyst
2001;59:47e63.
[52] Benckiser G. Organic inputs and soil metabolism. In: Benckiser, editor.
Fauna in soil ecosystems. Recycling processes, nutrient fluxes and agri-
cultural production. New York, USA: Dekker; 1997. p. 7e62.
[53] Cerda A. Aggregate stability against water forces under different cli-
mates on agriculture and scrubland in southern Bolivia. Soil Tillage
Res 2000;57:159e66.
[54] Oades JM. The role of biology in the formation, stabilisation and degra-
dation of soil structure. Geoderma 1993;56:377e400.
[55] Falloon PD, Smith P, Smith JU, Szabo J, Coleman K, Marshall S. Re-
gional estimates of carbon sequestration potential: linking the Rothamsted
carbon model to GIS databases. Biol Fertil Soils 1998;27:236e41.
[56] Lal R. Soil conservation and restoration to sequester carbon and mitigate
the greenhouse effect. In: Third international congress of the European
society for soil conservation [Abstracts Book]. Valencia, Spain; 2000.
p. 31.
[57] Lal R. Soil carbon sequestration impacts on global climate change and
food security. Science 2004;304:1623e6.
[58] Bruce RR, Langdale GW, West LT, Miller WP. Soil surface modification by
biomass inputs affecting rainfall infiltration. Soil Sci Soc Am J 1992;
56:1614e20.
[59] Quiroga AR, Buschiazzo DE, Peinemann N. Soil compaction is related to
management practices in the semi-arid Argentine pampas. Soil Tillage
Res 1999;52:21e8.
[60] Quimby PC, King LR, Grey WE. Biological control as a means of en-
hancing the sustainability of crop/land management systems. Agric Eco-
syst Environ 2002;88:147e52.
[61] Persson J, Kirchman H. Carbon & nitrogen in arable soils as affected by
supply of nitrogen fertiliser and organic manures. Agric Ecosyst Environ
1994;51:249e55.
[62] COM. Towards a thematic strategy for soil protection, COM 179. Brus-
sels, Belgium: Commission of the European Communities; 2002.
[63] Smith P. Carbon sequestration in croplands: the potential in Europe and
the global context. Eur J Agronomy 2004;20:229e36.
[64] Romanya J, Cortina J, Falloon P, Coleman K, Smith P. Modelling
changes in soil organic matter after planting fast-growing Pinus radiata
on Mediterranean agricultural soils. Eur J Soil Sci 2000;51:1e15.
[65] Kim S, Dale BE. Life cycle assessment study of biopolymers [polyhy-
droxyalkanoates] derived from no-tilled corn. Int J LCA 2005;10(3):
200e10.
[66] Batjes NH. ISRICeWISE global data set of derived soil properties on
a 0.5 by 0.5 degree grid [Version 2.0]. Wageningen, The Netherlands:
International Soil Reference and Information Centre [Report 2002/03].
Available from: <http://www.isric.org>; 2002.
[67] IPCC (Intergovernmental Panel on Climate Change). IPCC special report
on land-use, land-use change and forestry. Cambridge, UK: Cambridge
University Press; 2000.
[68] Contribution a la lutte contre l’effet de serre. Stocker du carbone dans les
sols agricoles de France? In: Arrouays D, Balesdent J, Germon JC,
Jayet PA, Soussana JF, Stengel P, editors. Expertise Scientifique Collec-
tive. Rapport d’expertise realise par INRA a la demande du Ministere de
l’Ecologie et du Developpement Durable. Paris, France: INRA; 2002.
[69] Freibauer A, Rounsevell MDA, Smith P, Verhagen J. Carbon sequestra-
tion in the agricultural soils of Europe. Geoderma 2004;122(1):1e23.
[70] Coleman K, Jenkinson DS. RothC-26.3 e a model for the turnover of
carbon in soil. In: Powlson DS, Smith P, Smith JU, editors. Evaluation
of soil organic matter models using existing, long-term datasets. Berlin,
Germany: Springer-Verlag; 1996. p. 237e46.
[71] Nebel B, Cowell SJ. Global warming reduction potential of biomass
based products: an example of wood products. In: XXth SETAC-Europe
Annual meeting [Abstracts]; 2003. p. 49.
[72] Smith WN, Desjardins RL, Patty E. The net flux of carbon from agricul-
tural soils in Canada 1970e2010. Glob Chang Biol 2000;6:557e68
[Cited in [69]].
[73] Smith P, Powlson DS, Smith JU, Falloon P, Coleman K. Meeting Eu-
rope’s climate change commitments: quantitative estimates of the
1440 L. Mila i Canals et al. / Journal of Cleaner Production 15 (2007) 1426e1440
potential for carbon mitigation by agriculture. Glob Chang Biol 2000;6:
525e39. Cited in [69].
[74] Paustian K, Andren O, Janzen HH, Lal R, Smith P, Tian G, et al. Agri-
cultural soils as a sink to mitigate carbon dioxide emissions. Soil Use
Manage 1997;13(4):230e44 [Cited in [67], Table 4e5].
[75] Woomer PL, Plalm CA, Qureshia JN, Kotto-Same J. Carbon sequestra-
tion and organic resources management in African smallholder agricul-
ture. In: Lal R, Kimble JM, Follett RF, Stewart BA, editors.
Management of carbon sequestration in soil. Boca Raton, USA: CRC
Press; 1997. p. 153e73 [Cited in [69]].
[76] Lal R, Bruce JP. The potential of world cropland soils to sequester C and
mitigate the greenhouse effect. Environ Sci Policy 1999;2:177e85 [Cited
in [67], Table 4e5].
[77] Lal R, Kimble JM, Follett RF. Agricultural practices and policies for car-
bon sequestration in soil. Recommendation and conclusions of the inter-
national symposium. Columbus, OH, USA; 19e23 July 1999 [Cited in
[67], Table 4e5].
[78] Watson RT, Noble IR, Bolin B, Ravindranath NH, Verardo DJ,
Dokken DJ, editors. Land use, land use change, and forestry. Cambridge,
UK: Cambridge Univ. Press; 2000 [Cited in [69]].
[79] Boiffin J, Keli-Zagbahi J, Sebillotte M. Systemes de culture et statut or-
ganique des sols dans le Noyonnais: application du modele de Henin-
Dupuis. Agronomie 1986;6:437e46 [Cited in [68], p. 131].
[80] Wylleman R. Caracterisation et modelisation de l’evolution des stocks de
matiere organique des sols de grande culture en Picardie. Laon, France:
INRA; 1999 [Cited in [68], p. 131].
[81] Vleeshouwers LM, Verhagen A. Carbon emission and sequestration by ag-
ricultural land use: a model study for Europe. Glob Chang Biol 2002;
8:519e30.
Llorenc Mila i Canals, BSc (Hons) (Env Sci), PhD, is a Research Fellow in
the Centre for Environmental Strategy (http://www.surrey.ac.uk/CES/), Uni-
versity of Surrey (UK). Previously he has been a Research Fellow and Lecturer
in three different university schools in Barcelona (Spain). His current research
interests focus on the sustainability of agro-food systems in general (gains and
losses associated with expanded domestic fruit and vegetables’ productions),
and more specifically on the methodological development of Life Cycle As-
sessment (LCA) for agriculture. He has been actively involved in SETAC
working groups on Life Cycle Impact Assessment (LCIA) since 1998, and
is currently a member of the UNEPeSETAC Life Cycle Initiative working
group on LCIA, within the Task Force of Resources and Land Use.
Joan Romanya, BSc (Hons) (Biology), University of Barcelona, 1987; PhD
(Plant Biology), University of Barcelona, 1993, is a Senior Lecturer on soil
science, environmental management and crop nutrition and organic matter
management in agro-ecological systems in the Natural Products, Plant Biol-
ogy and Soil Science Department of the University of Barcelona. He has
also participated in a Postgraduate course on Ecological Farming. His re-
search has focused on fertility of Mediterranean forest soils and on plant
and soil relationships, including soil nutrient cycling and organic matter
changes as affected by fire and by afforestation. He has also studied the or-
ganic matter sequestration in soils after changing land use by means of
chrono-sequences and by using soil organic matter models (Century and
Roth-C). Recently he has been working in the assessment of quarry restora-
tion interventions and has been involved in a national project on sewage
sludge application to Mediterranean forest soils. He has also been involved
in a national project to determine the amount of C stored in Spanish soils
and its rates of change.
Sarah J. Cowell, AIEMA FRSA, is a Senior Lecturer at the Centre for Envi-
ronmental Strategy, University of Surrey and Director of the Environmental
Life Cycle Management Programme. Her research interests concern develop-
ment and application of Environmental Life Cycle Assessment and related ap-
proaches, particularly with respect to food systems. She has been actively
involved with SETAC Europe LCA Steering Group and related working
groups for the last 10 years, and is on the Editorial Board of the InternationalJournal of LCA.