
Metallated Derivatives of Ammonia Borane with a view to their ...
349
Metallated Derivatives of Ammonia Borane with a view to their potential as Hydrogen Storage Materials by Ian C. Evans Supervisor: Dr Paul A. Anderson A thesis submitted to the University of Birmingham for the Degree of Doctor of Philosophy The School of Chemistry College of Engineering and Physical Sciences The University of Birmingham February 2011
-
Upload
khangminh22 -
Category
Documents
-
view
4 -
download
0
Transcript of Metallated Derivatives of Ammonia Borane with a view to their ...
Metallated Derivatives of Ammonia
Borane with a view to their potential as
Hydrogen Storage Materials
by
Ian C. Evans
Supervisor: Dr Paul A. Anderson
A thesis submitted to the University of Birmingham for the Degree of
Doctor of Philosophy
The School of Chemistry
College of Engineering and Physical Sciences
The University of Birmingham
February 2011
University of Birmingham Research Archive
e-theses repository This unpublished thesis/dissertation is copyright of the author and/or third parties. The intellectual property rights of the author or third parties in respect of this work are as defined by The Copyright Designs and Patents Act 1988 or as modified by any successor legislation. Any use made of information contained in this thesis/dissertation must be in accordance with that legislation and must be properly acknowledged. Further distribution or reproduction in any format is prohibited without the permission of the copyright holder.
Abstract
Ammonia borane, NH3BH3, has attracted growing interest in recent years in the field
of hydrogen storage due to its high gravimetric hydrogen content. In this study the
reaction of NH3BH3 with various metal hydrides was investigated. The reactions with
hydrides of lithium and sodium required a molar ratio of 1:2 in favour of NH3BH3 and
the reaction products were characterised as [Li(NH3)]+[BH3NH2BH3]
− and
[Na]+[BH3NH2BH3]−, respectively, through solid state 11B and 23Na MAS NMR and
Raman spectroscopy. The reaction of CaH2 with NH3BH3 required a reaction
stoichiometry of 1:4 and this reaction proceeded through a different reaction
mechanism, forming Ca(BH4)2·2NH3. The crystal structures of Ca(BH4)2·2NH3 and
Ca(BH4)2·NH3 were determined by powder diffraction methods and the reaction
pathway investigated through solid state 11B MAS NMR spectroscopy.
The thermal desorption properties of these hydrogen rich materials were investigated
and hydrogen was released from all the materials. However, under certain conditions
ammonia was the major gaseous desorption product from Ca(BH4)2·2NH3 and was
observed as a minor product from the decomposition of [Li(NH3)]+[BH3NH2BH3]
−.
Ammonia was also released during the synthesis of [Na]+[BH3NH2BH3]−, but the
decomposition of this material was free from ammonia release. Ramped thermal
desorption studies of [Na]+[BH3NH2BH3]− and [Li(NH3)]
+[BH3NH2BH3]− to 350°C
resulted in weight losses due to hydrogen desorption of 7.5 wt% and 12.5 wt%,
respectively. Heating Ca(BH4)2·2NH3 to 350°C resulted in a total weight loss of 27.5
wt%, which was predominantly due to NH3 desorption. Powder XRD and solid state
11B MAS NMR spectroscopy were employed to identify the solid decomposition
products and decomposition pathways were proposed. Metal borohydrides were
identified in all cases as well as polymeric products possessing B–N chains.

Acknowledgements
Well the nightmare of writing a thesis has finally come to an end and for that I am
exceptionally grateful. It has been a long and painful journey and I could not have got
to the end without the support of so many people. Firstly, I would like to thank my
supervisor, Paul, who has been eternally patient and helpful for the last few years as
well as for our many football chats when we probably should have been discussing
things a little more closely related to my PhD.
I‘d like to thank the members of the Anderson group, past and present, for the last
few years, with a special mention going to Dr Phil Chater for kindly synchronising his
departure from the group with my submission day, as well as for all his help over the
years with all things chemistry. Probably should mention the other group members to
avoid an earful, so Alvaro, Matt, Alex, Dave, Tom C and Ivan, you have all been in
the group. Thanks to the rest of Floor 5 for the fun and laughs while I‘ve been there.
In Mat & Met Dan, Allan and Big Dave have been nice enough to let me use their
equipment and help me out when things have not gone to plan. Tom Partridge at the
University of Warwick is due a mention for the countless hours he spent collecting
and interpreting NMR spectra, as well as John Hanna.
I am also thankful for having a fantastic set of mates, who I haven‘t really seen for the
last 12 months, but that‘s about to change with some big nights out planned, starting
today! So Bails, Evo, Jeff, Lairddog and Ugs, congratulations you have all made it in.
And I have to mention the mighty Bournville Village and Village C football clubs for
giving me a distraction from my thesis over the last year and keeping me sane. I‘m
sure some silverware is just around the corner!
Too many others to mention, but Nic, Ad and Deb are in for some brilliant times over
the years.
Finally, and most importantly, thanks to my parents and grandparents, without their
love and support I could never have achieved everything that I have in life.
i
Contents
1. Introduction 1
1.1. The Current World Energy System 1
1.2. Hydrogen 1
1.3. Hydrogen Production 2
1.3.1. From Fossil Fuels 3
1.3.2. Electrolysis 4
1.3.3. Thermal Production 5
1.3.4. Biomass 5
1.4. Hydrogen as a Fuel 6
1.4.1. Hydrogen Internal Combustion Engine 6
1.4.2. Fuel Cells 7
1.5. Batteries 9
1.6. Hydrogen Storage 10
1.6.1. Storing Hydrogen as a Gas 11
1.6.2. Liquid Hydrogen Storage 12
1.6.3. Solid State Hydrogen Storage 12
1.6.4. Physisorption 13
1.6.5. Metallic Hydrides 14
1.6.6. Complex Hydrides 16
1.6.6.1. Alanates 17
1.6.6.2. Borohydrides 17
1.6.6.3. Amides 19
1.6.6.4. Mixed Amide Borohydrides 22
1.6.7. Hydrogen Storage Targets 22
1.6.8. Thermodynamics of Hydrogen Storage 24
1.7. Ammonia Borane 26
1.7.1. Synthesis 26
1.7.2. Structure 28
CONTENTS ii
1.7.3. Decomposition 33
1.7.4. As a Hydrogen Storage Material 39
1.8. Aims 41
1.9. References 42
2. Experimental 51
2.1. Crystallography 51
2.1.1. Crystal Systems and Unit Cells 51
2.1.2. Lattices 52
2.1.3. Lattice Planes and Miller Indices 53
2.1.4. Crystal Structures 54
2.2. X-Ray Diffraction 54
2.2.1. Generation of X-Rays 54
2.2.2. Bragg‘s Law 55
2.2.3. Powder Diffraction 56
2.2.4. Laboratory X-Ray Diffraction 59
2.3. Rietveld Analysis 59
2.4. Mass Spectrometry 62
2.5. Temperature Programmed Desorption 63
2.6. Intelligent Gravimetric Analysis 67
2.7. Thermogravimetric Analysis 67
2.8. Solid State Nuclear Magnetic Resonance Spectrometry 68
2.9. Raman Spectroscopy 74
2.10. References 76
3. The Thermal Decomposition of Ammonia Borane 77
3.1. Introduction 77
3.2. Experimental 77
3.3. Powder X-Ray Diffraction 78
3.4. Thermal Desorption Studies 80
3.5. Raman Spectroscopy 84
3.6. Solid State 11B MAS NMR Spectroscopy 96
CONTENTS iii
3.7. Conclusion 103
3.8. References 104
4. The Reaction of Sodium Hydride with Ammonia Borane 107
4.1. Introduction 107
4.2. Experimental 107
4.3. Powder X-Ray Diffraction 108
4.3.1. Discussion 114
4.3.2. Indexing 118
4.3.2.1. Impurities 127
4.3.2.2. Refined Lattice Constants 129
4.4. Thermal Desorption Studies 132
4.4.1. NaNH2BH3 132
4.4.2. NaH + NH3BH3 135
4.4.3. NaH + 2NH3BH3 138
4.4.4. Alternative Thermal Desorption Studies 147
4.4.5. Na+[BH3(NH2)BH3]− Phase 151
4.4.5.1. TPD–MS 151
4.4.5.2. IGA–MS 152
4.4.5.3. Discussion 153
4.5. Solid State 11B MAS NMR Spectroscopy 155
4.5.1. NaH + NH3BH3 Reaction 156
4.5.2. NaH + 2NH3BH3 Reaction 161
4.6. Solid State 23Na MAS NMR Spectroscopy 172
4.7. Raman Spectroscopy 176
4.7.1. NaNH2BH3 176
4.7.2. Na+[BH3NH2BH3]− 185
4.8. Overall Discussion and Conclusion 189
4.8.1. The NaH + NH3BH3 Reaction Pathway 189
4.8.2. The NaH + 2NH3BH3 Reaction Pathway 192
4.8.3. Potential as Hydrogen Storage Materials 194
4.9. References 196
CONTENTS iv
5. The Reaction of Lithium Hydride with Ammonia Borane 200
5.1. Introduction 200
5.2. Experimental 200
5.3. Powder X-Ray Diffraction 201
5.3.1. Indexing 208
5.3.2. Discussion 212
5.4. Thermal Desorption Studies 219
5.4.1. TPD Study of LiNH2BH3 219
5.4.2. TPD Study of LiH + 2NH3BH3 Reaction Mixture, Heated to 350°C at a
rate of 2°C min−1 221
5.4.3. TPD Study of LiH + 2NH3BH3 Reaction Mixture, Heated to 60°C at a
rate of 0.1°C min−1 224
5.4.4. TPD–MS Study of the Tetragonal Phase 226
5.4.5. IGA–MS Study of the Tetragonal Phase 228
5.4.6. Comparison of H2 desorption from the LiH + 2NH3BH3 reaction mixture
and [Li(NH3)]+[BH3NH2BH3]
− to NH3BH3 233
5.5. Solid State 11B MAS NMR Spectroscopy 234
5.6. Raman Spectroscopy 242
5.7. Overall Discussion and Conclusion 246
5.7.1. The LiH + 2NH3BH3 Reaction Pathway 246
5.7.2. Potential as a Hydrogen Storage Material 248
5.8. References 249
6. The Reaction of Calcium Hydride with Ammonia Borane 252
6.1. Introduction 252
6.2. Experimental 252
6.3. Powder X-Ray Diffraction 253
6.4. Crystal Structure Determination of Ca(BH4)2·2NH3 (Phase A) 261
6.4.1. Indexing 261
6.4.2. Determining the Number of Formula Units in the Unit Cell and
Producing a Model 263
6.4.3. Full Rietveld Refinement 265
CONTENTS v
6.5. Crystal Structure Determination of Ca(BH4)2·NH3 (Phase B) 269
6.5.1. Indexing 269
6.5.2. Determining the Number of Formula Units in the Unit Cell and
Producing a Model 270
6.5.3. Full Rietveld Refinement 274
6.6. Thermal Desorption Studies 278
6.6.1. TPD Study of a CaH2 + 4NH3BH3 Reaction Mixture 278
6.6.2. IGA Study of a CaH2 + 4NH3BH3 Reaction Mixture 284
6.6.3. Thermal Desorption Studies of Product A 285
6.6.3.1. TPD Study of Product A 285
6.6.3.2. IGA Study of Product A 286
6.6.3.3. Discussion 288
6.6.4. Thermal Desorption Studies of Product B 290
6.6.4.1. TPD Study of Product B 290
6.6.4.2. TGA Study of Product B 291
6.6.4.3. Discussion 293
6.7. Solid State 11B MAS NMR Spectroscopy 294
6.8. Overall Discussion and Conclusion 313
6.8.1. The CaH2 + 4NH3BH3 Reaction Pathway 313
6.8.2. Potential as Hydrogen Storage Materials 316
6.9. References 317
7. Conclusions and Suggestions for Further Work 322
7.1. Conclusions 322
7.2. Suggestions for Further Work 327
Appendix 1 329
Appendix 2 331
Appendix 3 338
1
Chapter 1
Introduction
1.1 The Current World Energy Situation
The world is currently heavily reliant on fossil fuels, with almost all mobile energy
needs being met by petroleum, because they are a very convenient source of
energy. However, with this source of energy rapidly running out, the need to find a
replacement is becoming more critical. In pre-industrial times man used only biomass
as an energy source, which had no effect on the atmosphere because carbon dioxide
liberated from its combustion was offset by the absorption by plants during
photosynthesis, producing a carbon neutral cycle. Since the industrial revolution
world energy demand has drastically risen, with this increase mostly met by fossil
fuels. The introduction of the steam engine provided the foundation for an
industrialised society and a source of energy was needed in order to power it. This
demand was met by coal. The use of fossil fuels led to an increase of the
concentration of carbon dioxide in the atmosphere and because this is a greenhouse
gas the burning of fossil fuels has been linked to global climate change. Alternatives
to fossil fuels include biomass, nuclear, wind, solar, geothermal and hydrothermal
energies. These energy sources may be especially useful in the production of
electricity that is fed into the National Grid to be used in stationary applications. Their
use in mobile applications is more challenging, which is where hydrogen may play an
important role.
1.2 Hydrogen
Hydrogen offers potential to help provide a solution to the world‘s energy dilemma.
Like electricity it is an energy carrier; however, electricity is at a disadvantage when
CHAPTER 1. Introduction 2
storage of energy is required. Hydrogen on the other hand could be suited to
applications where storage of energy is required before use.
Figure 1.1 depicts how the nature of the world‘s main energy carrier has changed
through history.
Figure 1.1 – Historical development of energy carriers
There are two trends that are observed in this progression. The first trend involves
the physical state of the carrier, the transition from a solid to a liquid and then on to a
gas state energy carrier is observed. Secondly, there is a trend towards using more
hydrogen rich fuels. These two trends combined point in the direction of using pure
hydrogen as an energy carrier in the future.
1.3 Hydrogen Production
Hydrogen is the most abundant element in the universe: it is estimated that 90% of
all atoms are hydrogen which corresponds to 75% by mass of the universe. Further
to this, it is thought that the heavier elements were and still are being made from
hydrogen and helium. On Earth, hydrogen is also the most abundant element;
however, only a small fraction, approximately one percent, exists as molecular
hydrogen, the vast majority of it chemically bound in H2O, with a further substantial
amount bound in liquid or gaseous hydrocarbons. This means that the first step in
using hydrogen as a fuel involves its production. In order to completely replace fossil
fuels as the world‘s chief energy supplier, more than 3 × 10¹² kg of hydrogen would
need to be produced each year, which is approximately one hundred times greater
than today‘s annual production.1 The production of hydrogen adds extra cost to the
use of hydrogen, which has not been experienced with fossil fuels. The only cost
CHAPTER 1. Introduction 3
involved with fossil fuels is that of the mining, which makes the cost of hydrogen fuel
around three times greater than that of petroleum. This produces an economic
challenge: to minimise the cost of hydrogen production as well as having to convince
the world economy of the benefits of a synthetic fuel, as consumers must be willing to
pay for the energy content of the fuel. An investment over five years, to the value of
ten to one hundred trillion dollars, would be required to establish a new renewable
energy production infrastructure, which is the same amount spent worldwide on
energy over the same period.1
1.3.1 From Fossil Fuels
Currently hydrogen production in the world centres on fossil fuels and, specifically,
the process of steam reforming as shown in reaction 1.1. In 2008, 96% of the world‘s
hydrogen was produced using this process.2 The hydrocarbon most frequently used
for this reaction is methane. The process involves using high temperature steam, in
the range 700 to 1000°C, in combination with a hydrocarbon to yield hydrogen and
carbon monoxide. This is an endothermic reaction and hence consumes energy in
the process.
–(CH2)–n + H2O → (n + 1)H2 + CO Reaction 1.1
A second step, the water-gas shift reaction, reacts the synthesised carbon monoxide
with steam to produce more hydrogen and carbon dioxide as shown in reaction 1.2.
CO + H2O → CO2 + H2 Reaction 1.2
Unfortunately, this method of production produces a significant amount of carbon
dioxide emissions, in fact a similar amount to that of the direct combustion of fossil
fuels. In the transition to a hydrogen economy, steam reforming would likely be the
production method of choice during its infancy, with a predicted timescale of 20
years.3 There are methods to reduce carbon dioxide emissions from steam
reforming. The product gases are easily separated and carbon sequestration can be
used to prevent carbon dioxide emissions to the atmosphere.
There is a second method of producing hydrogen from hydrocarbons that is free from
carbon dioxide emissions. The thermal dissociation or cracking of hydrocarbons,
CHAPTER 1. Introduction 4
specifically methane, results in the production of hydrogen as well as carbon. The
decomposition of methane is less endothermic than steam methane reforming: the
energy required per mole of hydrogen produced is 37.8 kJ mol−1 H2 for cracking
compared with 63 kJ mol−1 H2 for steam reforming. Carbon dioxide emissions can
potentially be as low as 0.05 mol CO2 / mol H2 compared to 0.43 mol CO2 / mol H2 for
the steam reforming process.4 This process does, however, produce a vast amount
of carbon and leaves the problem of how to dispose of it. Beneficially the product is
solid, making it easily transported, handled and stored and one potential solution is to
use it as a construction material.5 The biggest drawback to this method though is it is
again not sustainable as the resource employed is non-renewable.
1.3.2 Electrolysis
In order for hydrogen to be classified as a clean, sustainable and renewable fuel, its
production must move away from fossil fuels, avoid the release of carbon dioxide into
the atmosphere and utilise a renewable source of energy. One such possibility is that
of water electrolysis. Electricity generated from renewable forms of energy including
solar, wind and hydro can be used in this process. Electrolysis is simply the
decomposition of water into oxygen and hydrogen, which makes it the cleanest way
to produce hydrogen. An electric circuit is connected to two electrodes, made from
inert metal, such as platinum, which are placed into the water. Two processes occur,
reduction at the negatively charged cathode and oxidation at the positively charged
anode, shown in reactions 1.3 and 1.4.
Cathode 2H+(aq) + 2e− → H2(g) Reaction 1.3
Anode 2H2O(l) → O2(g) + 4H+(aq) + 4e− Reaction 1.4
The process is thermodynamically unfavourable and so it is necessary to apply an
electric potential. It is possible to increase the rate of electrolysis by adding an
electrolyte to the water. The efficiency of electrolysis at ambient conditions is 65%,
although improvements to the process including the use of activated electrodes and
very thin membranes can help achieve increased efficiency to 85%.6 Hydrogen
produced in this way makes it sustainable in the long term as well as adding value to
the renewable resources employed in the process.
CHAPTER 1. Introduction 5
1.3.3 Thermal Production
Hydrogen can also be produced directly from the thermal decomposition of water.
This is, however, a very unfavourable process thermodynamically and requires
temperatures in excess of 2000°C. This temperature can be lowered substantially to
below 1000°C through the use of either a platinum or ruthenium catalyst. Following
the thermal decomposition, the product gases must be separated to avoid
recombination of the gases or the production of an explosive mixture. The advantage
of this process is that it again uses a renewable source of energy in the form of
sunlight. A solar furnace channels light energy from the sun onto a small area which
achieves the very high temperatures required for the decomposition to proceed.7
1.3.4 Biomass
Biomass can be used to produce hydrogen in two ways. Firstly, through gasification;
this is a process similar in nature to that of steam reforming. The biomass is thermally
treated to yield a mixture of gases including hydrogen, carbon monoxide and
methane. Further heat treatment through heated steam yields further hydrogen as
well as carbon dioxide. However, as the carbon dioxide that is released as a result of
this process was originally absorbed by the plant, this process can be regarded as
carbon dioxide neutral. The process of fermentation can also be used to produce
hydrogen through biomass. Hydrogen can be produced sustainably by anaerobic
bacterial growth on carbohydrate rich substrates in the absence of light, to give
organic fermentation end products, hydrogen and carbon dioxide. Sustainable
hydrogen production in this way requires principally carbohydrate based organics,
biomass produced from sustainable resources, biomass of sufficient concentration
that fermentative conversion and energy recovery are energetically favourable, and
biomass that requires minimal pre-treatment.8 A significant advantage to this process
is that biomass of low quality and low cost can be used. Again because the carbon
dioxide released in the process was originally absorbed by the biomass it can be
classed as a carbon dioxide neutral process.
CHAPTER 1. Introduction 6
1.4 Hydrogen as a Fuel
Chemical energy is related to valence electrons in atoms or molecules and their
potential to form stable arrangements through reaction. The hydrogen atom is made
up of only one proton and one electron making it an attractive chemical energy
source as it has the highest number of valence electrons available for reaction per
unit mass.
Following production, hydrogen is the cleanest burning fuel: the only exhaust gas
when it is burnt with oxygen is water. Furthermore, hydrogen is a very energy rich
fuel: its lower heating value, 120.1 MJ kg−1, is three times greater than that of
petroleum, 42.5 MJ kg−1.9 There are two methods of exploiting the chemical potential
of hydrogen. First, as with petroleum, it can be combusted in an internal combustion
engine producing mechanical power; or secondly, it can be used to produce electrical
power by electrochemical means using a fuel cell.
Using hydrogen as a fuel also has the added benefits of dramatically cutting
emissions of carbon dioxide, carbon monoxide and sulphur and nitrogen oxides. It
has the potential to become a secure and abundant domestic supply of fuel,
therefore significantly reducing the need to import other sources of energy such as oil
or natural gas, in turn providing nations with energy independence and security.
Finally, it would allow the transition from limited non-renewable supplies of fossil fuels
to an unlimited, renewable fuel source.
1.4.1 Hydrogen Internal Combustion Engine
Internal combustion engines are a well established technology and the idea of using
hydrogen as the fuel is not a modern one. The first internal combustion engine
designed and built to run on a mixture of hydrogen and oxygen was built by François
Isaac de Rivaz as early as 1807.10 Hydrogen gas can be used directly in a petroleum
internal combustion engine with only minor modifications required. The hydrogen is
burnt in the same way as gasoline, the only difference being that hydrogen burns
hotter than gasoline resulting in the need for minor modifications to the engine. The
modifications include using fuel injectors designed for gas instead of liquid, harder
valve and valve seats to compensate for the reduced lubricating properties of
CHAPTER 1. Introduction 7
hydrogen gas compared to liquid gasoline, and employing an exhaust system that is
capable of sustaining water vapour produced from the combustion process.
Internal combustion engines running on hydrogen could pave the way for a transition
to a Hydrogen Economy. The hydrogen internal combustion engine uses the current
manufacturing infrastructure as well as allowing the opportunity to develop hydrogen
infrastructure. A hydrogen internal combustion engine is currently much cheaper than
a fuel cell running on hydrogen and therefore offers a cheaper temporary solution to
using hydrogen as a fuel, until the cost of fuel cell technology starts to drop. A major
advantage of using hydrogen instead of gasoline in an internal combustion engine is
that the emissions of carbon dioxide are greatly reduced. A small amount of carbon
dioxide is released when using hydrogen as the fuel, but this comes from engine oil
in the cylinders of most engines and not from the fuel itself. It would require over 300
vehicles running on a hydrogen internal combustion engine to emit the same amount
of carbon dioxide as one vehicle running on gasoline. However, there are relatively
few car manufacturers that are actively researching a hydrogen internal combustion
engine and of the major automotive manufacturers it is only BMW and Mazda that
currently have an active research programme.
1.4.2 Fuel Cells
Fuel cells are emerging as a leading alternative technology to the more polluting
internal combustion engine in both mobile and stationary applications. They are
widely considered to be the green power source for the 21st century and could make
the prospect of a Hydrogen Economy a reality.11 However, they are not a recent
invention, they were invented in 1839 by William Grove.12 Fuel cells are
electrochemical energy conversion devices which convert the chemical energy of the
fuel, which is generally hydrogen, directly into electrical energy. There are numerous
types of fuel cell, that are characterised by the type of electrolyte that is employed,
the most common electrolytes being alkaline, solid oxide, molten carbonate,
phosphoric acid and polymer membrane. Provided there is a constant source of fuel,
fuel cells are capable of continuously producing energy.
CHAPTER 1. Introduction 8
Polymer electrolyte membrane fuel cells, PEMFC, also known as proton exchange
membrane fuel cells have a number of advantages associated with their use.
Primarily the only emission is water when using hydrogen as the fuel and oxygen as
the oxidant. They are able to operate at temperatures below 100°C with high
efficiency, which also results in them having rapid start-up times, making them
attractive for use in mobile applications. Compared to other fuel cells, PEMFCs are
capable of generating more power for a given weight or volume, making them
compact and lightweight. A fuel cell stack, where many fuel cells are used in
combination, is used in practice, allowing higher power densities to be achieved. The
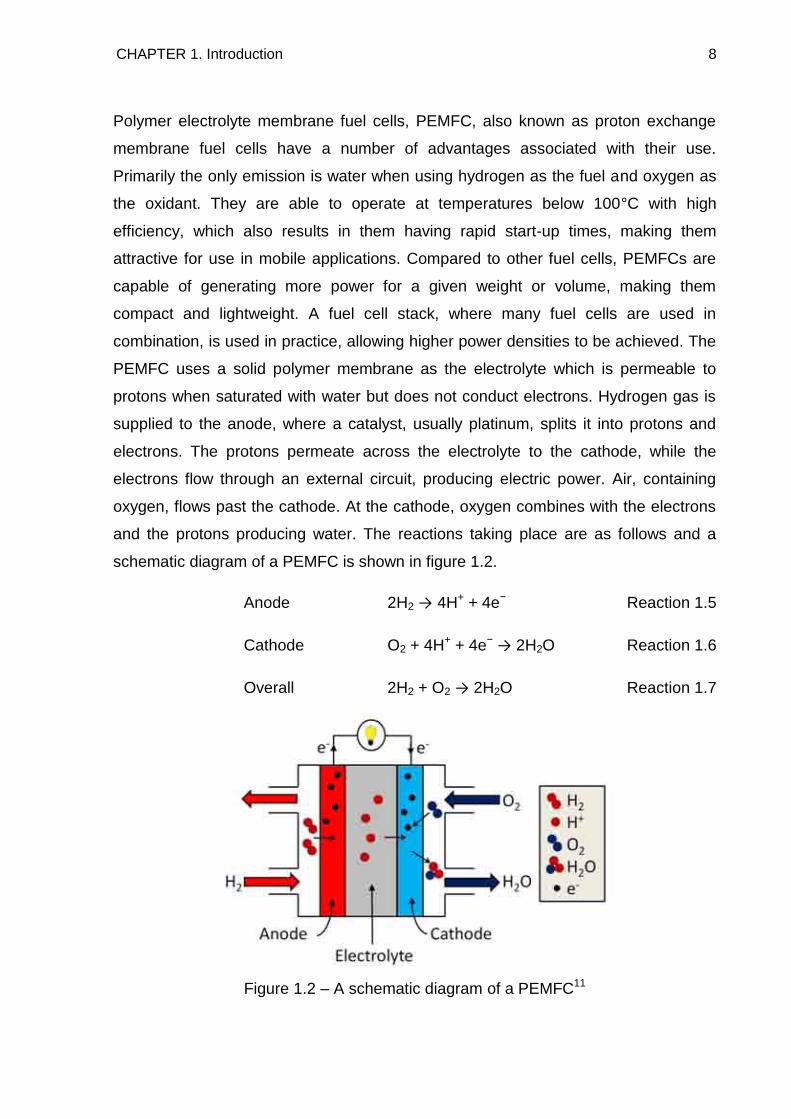
PEMFC uses a solid polymer membrane as the electrolyte which is permeable to
protons when saturated with water but does not conduct electrons. Hydrogen gas is
supplied to the anode, where a catalyst, usually platinum, splits it into protons and
electrons. The protons permeate across the electrolyte to the cathode, while the
electrons flow through an external circuit, producing electric power. Air, containing
oxygen, flows past the cathode. At the cathode, oxygen combines with the electrons
and the protons producing water. The reactions taking place are as follows and a
schematic diagram of a PEMFC is shown in figure 1.2.
Anode 2H2 → 4H+ + 4e− Reaction 1.5
Cathode O2 + 4H+ + 4e− → 2H2O Reaction 1.6
Overall 2H2 + O2 → 2H2O Reaction 1.7
Figure 1.2 – A schematic diagram of a PEMFC11
CHAPTER 1. Introduction 9
PEMFCs suffer performance degradation as a result of impurities in the hydrogen
supply such as carbon monoxide, hydrogen sulphide, ammonia and organic
compounds, and also from NOx and SOx in air.11 These contaminants can get into the
membrane of the fuel cell, thereby competing with the protons for the SO3− sites and
decreasing water content, resulting in a reduction in proton conductivity. Fuel cell
performance has been shown to drop rapidly when exposed to a hydrogen supply
containing 30 ppm ammonia, and could not be fully recovered after removal of the
ammonia.13
1.5 Batteries
A different type of technology that has been proposed as a replacement for fossil
fuels is that of batteries. Hydrogen has to be first produced, potentially through the
process of electrolysis, before it is converted back into electrical energy in a fuel cell.
As a result of these energy conversions, the efficiency of the fuel cell compared to
directly using the electricity in batteries is lowered. In stationary applications, when
using hydrogen and fuel cells, 51% of the electricity that could have been delivered
directly remains following the conversions, whereas batteries are able to store and
retrieve electricity with efficiencies greater than 75%.14 In mobile applications it is
estimated that by 2020 electric vehicles will have a range of 358 kilometres before a
recharge is required. However, these recharges can take around four hours for a full
recharge to be achieved. This is in contrast to fuel cells which are capable of running
continuously provided there is sufficient fuel provided. Further to this the cost of
lithium ion batteries is currently approximately three times too high for them to
become a commercially viable alternative to internal combustion engine based
vehicles. The development of alternative battery systems have shown particular
improvements in recent years with respect to energy density, efficiency and cycling
lifetimes, with an energy density of 125 W h / kg being achieved in lithium ion
batteries offering a driving range of 250 kilometres.15 A major advantage of using
batteries is that the infrastructure for this technology is already in place, whereas
there is the need for huge investment in order to use hydrogen as a fuel. In reality, it
seems likely that fuel cell vehicles will use a combination of batteries and a fuel cell in
order to meet the energy demands of automotive transport.16
CHAPTER 1. Introduction 10
1.6 Hydrogen Storage
At ambient temperature and pressure the hydrogen molecule exists as a gas, with a
density of 0.0899 kg m−3; below −262°C it exists as a solid with a much higher
density of 76.3 kg m−3 and there is a small zone where the molecule is found in the
liquid form with a density of 70.8 kg m−3 at −262°C.1 The very low volumetric density
of hydrogen gas shows the significant challenge of hydrogen storage. At ambient
temperature and pressure 1 kg of hydrogen gas occupies a huge 11 m3. On board
energy storage in vehicles is required to be light, safe and affordable. A modern,
commercially available car designed primarily for mobility has a range of 400
kilometres which burns 24 kilograms of petrol in a combustion engine.17 In order to
match this range, a combustion engine operating on hydrogen would require eight
kilograms of fuel or an electric car running on fuel cells would require four kilograms
of hydrogen. At room temperature and pressure, four kilograms of hydrogen occupies
a volume of 45 m3, which is not practical for a vehicle.
The term hydrogen storage essentially implies the reduction of this enormous volume
of hydrogen gas. The goal is to pack hydrogen as closely as possible in order to
achieve the highest possible volumetric density while minimising the amount of
additional material. In order to achieve higher hydrogen densities either work must be
applied to compress hydrogen or through liquefaction, both of which can be easily
performed. However, both methods cause a reduction in gravimetric density due to
the additional weight of the vessels required to maintain high pressures or low
temperatures. A compromise must be made between increasing the volumetric
capacity of the storage system while maintaining a usable gravimetric hydrogen
capacity. An alternative approach is to minimise the repulsion between hydrogen
molecules through the interaction with another material. Another important criterion
for a hydrogen storage system is that it requires a reversible hydrogen uptake and
release mechanism. This requirement means that all hydrocarbons are excluded as
potential storage methods as the hydrogen can only be irreversibly released at
temperatures above 800°C. There are a number of potential storage methods which
can broadly be divided into two categories: either the storage of molecular hydrogen,
which increases volumetric density through compression, liquefaction or adsorption
CHAPTER 1. Introduction 11
onto a surface, or the storage of atomic or ionic hydrogen through the reaction of
hydrogen gas to form metal hydrides or complex hydrides.
1.6.1 Storing hydrogen as a gas
Conventionally hydrogen is stored at high pressures. High pressure tanks are
traditionally made of relatively cheap steel and are routinely filled up to a pressure of
200 bar. However, this pressure would still require a total volume of 225 litres to store
the 4 kilograms of hydrogen.17 Furthermore, this equates to a gravimetric density of
only about 1%, which is very low. New lightweight composite cylinders have been
developed which are capable of withstanding pressures up to 800 bar, which results
in a volumetric density of 36 kg m−3.18 However, as the storage pressure increases,
the gravimetric hydrogen density decreases, because the walls of the pressure
cylinder must increase in thickness to be able to cope with the increased pressure.
The ideal material for a high pressure cylinder requires a high tensile strength, low
density and to be inert towards hydrogen, with the majority of cylinders being made
from stainless steel, copper or aluminium alloys. Recently light-weight high-density
carbon fibre gas cylinders have been developed, which are capable of storing
hydrogen up to pressures of 1000 bar, giving a gravimetric hydrogen density of 10
wt%.19 These high pressure gas cylinders come with significant disadvantages.
Additional pressure control would be required due to the large pressure drop when
the fuel is made available, there is a high safety risk associated with having high
pressure gas in automobiles and they are costly. A large amount of physical work is
also required to be done on the gas with respect to compression in order to achieve
the high pressures, which is energy that cannot be reclaimed when using the gas.20
Industry has set itself a target of developing cylinders capable of storing hydrogen at
a pressure of 700 bar, with a maximum weight of 110 kg, a gravimetric density of 6
wt% and a volumetric density of 30 kg m−3.21 However, this storage method looks
unlikely to be adopted due to the low hydrogen density, safety concerns and high
cost associated with it.
CHAPTER 1. Introduction 12
1.6.2 Liquid hydrogen storage
The storage of hydrogen as a cryogenic liquid has a high gravimetric density of 70.8
kg m−3 which is significantly higher than that of compressed gas.18 Liquid hydrogen is
stored in cryogenic tanks at temperatures below −252°C. These storage tanks have
to be open systems due to problems with boil off, because the pressure in a closed
system could rise to 104 bar. There are two main challenges associated with liquid
hydrogen storage. Firstly, the energy-intensive liquefaction process, which has a
significant energy penalty, because up to 30% of the energy content of hydrogen is
required to liquefy it.19 The second challenge is the thermal insulation of the
cryogenic storage vessel in order to minimise the boil off of hydrogen. Even with the
best available insulation vessels, boil off cannot be reduced below 1% per day for
small tanks suitable for transportation usage. Further costs are also incurred because
all of the components used for the delivery and storage of liquid hydrogen must be
cooled. Due to these drawbacks, liquefaction is not a particularly efficient method of
hydrogen storage. The high cost, large amount of energy required for liquefaction
and the continuous boil off of hydrogen mean that this storage method is limited to
applications where cost is not an important issue and the hydrogen is consumed in a
relatively short time such as with air and space applications.
1.6.3 Solid state hydrogen storage
As the two conventional methods of hydrogen storage, compression and liquefaction,
seem to be unlikely to be able to provide a solution to the problem, the most viable
alternative, solid state hydrogen storage, could provide the answer. A suitable solid
state hydrogen storage material should be able to store a high weight percent and
high volume density of hydrogen, while being able to absorb and desorb hydrogen
quickly close to room temperature and pressure. Furthermore, the material should be
cheap, safe and reusable, and possess the capacity to be regenerated and readily
recycled. Currently, there is no material that can meet all of these requirements.
Hydrogen can interact with the host material in a number of ways. Firstly, hydrogen
molecules can be physically adsorbed onto the surface of the host material. The
hydrogen can be chemically absorbed by the material through the formation of
CHAPTER 1. Introduction 13
chemical bonds. Finally, chemical hydrides can be formed which are characterised by
distinct chemical covalent bonding.
1.6.4 Physisorption
Hydrogen is capable of being adsorbed onto a solid surface through van der Waals
interactions. Physisorption is the weakest interaction between a solid and hydrogen,
the energy of the interactions is generally very low, in the range 2 to 20 kJ mol−1 H2.1
As a consequence of this the majority of hydrogen can be desorbed from the surface
by thermal energy at room temperature and as such significant physisorption is only
observed at temperatures below 273 K. Liquid nitrogen, with a boiling point of 77 K,
is often used as a coolant in order to maximise the physisorption interaction. The
strongest binding of hydrogen occurs when the hydrogen is bound directly to the
surface of the solid and although subsequent layers of hydrogen can be formed, the
weakness of these interactions means that hydrogen molecules usually form a
monolayer on the surface. Therefore, materials with very high surface areas are
required for this type of hydrogen storage system in order to reach a desirable
hydrogen storage capacity.
A number of types of high surface area solids have been studied including zeolites,22
high surface area carbon,23 metal organic frameworks (MOFs)24 and polymers of
intrinsic microporosity (PIMs).25 Single walled carbon nanotubes have been shown to
take up 2 wt% hydrogen at 77 K, with a high surface area of 1315 m2 g−1.23 A zeolite-
like carbon material was shown to exhibit improved and reversible hydrogen storage
capacity showing an uptake of 6.9 wt% at 77 K and 20 bar.26 At 1 bar the uptake was
reduced to 2.6 wt%. The strength of hydrogen binding in zeolites has the potential to
be improved by the inclusion of metal ions in the structure. Calcium exchanged
zeolite X has been shown to take up 2.19 wt% hydrogen at 77 K and 15 bar.22 This is
an improvement compared to zeolites that do not contain metal cations, where about
1.5 wt% hydrogen can be absorbed under the same conditions.27 Gravimetric
capacities of 6.7 wt% have also been reported for MOFs where the binding to metal
centres is suggested to improve the hydrogen storage capacity.24 PIMs are polymers
which behave like molecular sieves in the solid state, because they have rigid,
contorted molecular structures that are unable to pack efficiently, which gives them
CHAPTER 1. Introduction 14
potential as hydrogen storage materials.28 They have been shown to take up 2.7 wt%
at 77 K and 10 bar.25 Physisorption for hydrogen storage has the advantages of
having relatively cheap materials and the storage systems are of a simple design.
However, they suffer from relatively low gravimetric and volumetric densities and the
low temperatures (and/or high pressures) required are significant drawbacks to their
use.
1.6.5 Metallic Hydrides
A number of metals and alloys are capable of reversibly reacting with hydrogen to
produce metal hydrides. The transition back to the metal can be achieved through
either increasing the temperature or by reducing the pressure. Metals of group I and
group II of the periodic table usually form stoichiometric ionic hydrides, such as LiH,
whereas transition metals tend to form hydrides which have a variable non-
stoichiometric composition, as is the case with PdH0.6.29 These non-stoichiometric
hydrides form when hydrogen gas is dissociated at the metal surface and diffuses
into the metal. During the desorption process, two hydrogen atoms recombine to
form the hydrogen molecule. The lattice structure of non-stoichiometric hydrides is
that of a typical metal with hydrogen atoms on the interstitial sites and hence they are
also known as interstitial hydrides.
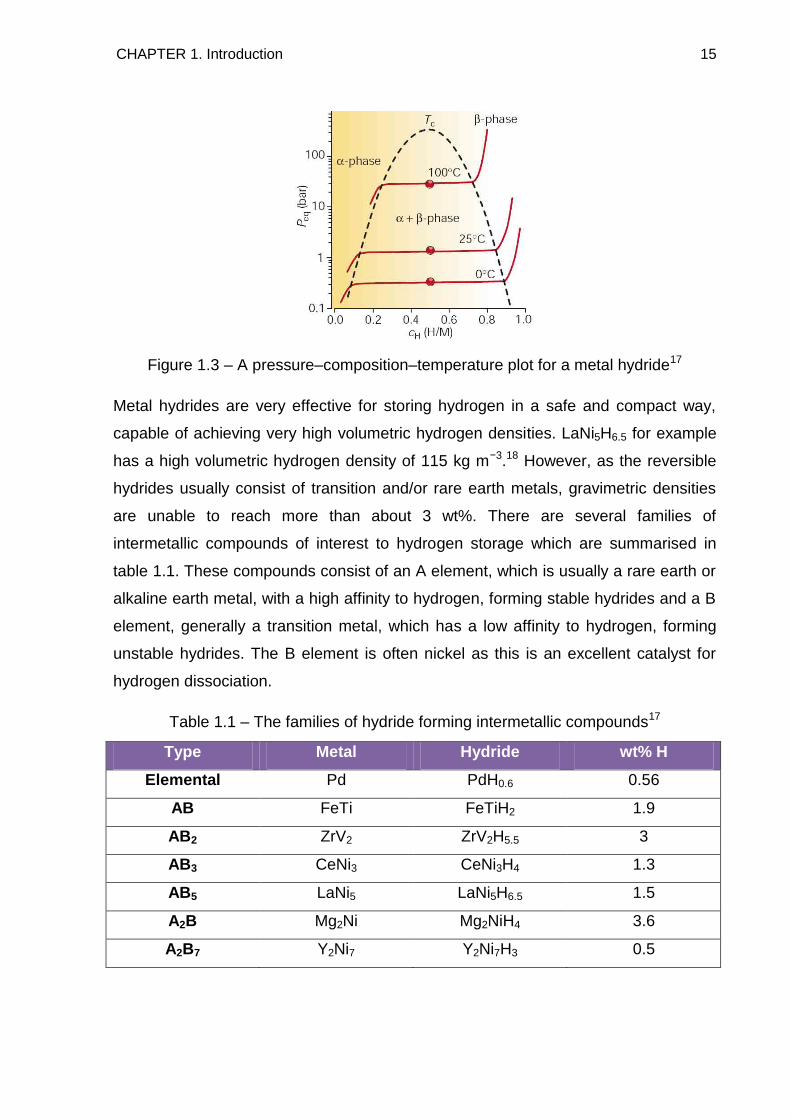
The formation of an interstitial hydride can be described in terms of a pressure-
composition isotherm, as shown in figure 1.3.1 Initially the host metal dissolves some
hydrogen in low concentrations forming a solid solution, shown as the α-phase in
figure 1.3. Increasing the pressure results in the concentration of hydrogen within the
metal increasing and nucleation and growth of the ordered hydride β-phase begins. A
plateau is observed where the two phases co-exist. During this plateau region, the
composition of the metal hydride can be changed significantly with only small
changes in temperature or pressure. This plateau region ends once a certain
temperature, denoted Tc in figure 1.3, is reached. Above this temperature the
transition from the α to the β phase is continuous.
CHAPTER 1. Introduction 15
Figure 1.3 – A pressure–composition–temperature plot for a metal hydride17
Metal hydrides are very effective for storing hydrogen in a safe and compact way,
capable of achieving very high volumetric hydrogen densities. LaNi5H6.5 for example
has a high volumetric hydrogen density of 115 kg m−3.18 However, as the reversible
hydrides usually consist of transition and/or rare earth metals, gravimetric densities
are unable to reach more than about 3 wt%. There are several families of
intermetallic compounds of interest to hydrogen storage which are summarised in
table 1.1. These compounds consist of an A element, which is usually a rare earth or
alkaline earth metal, with a high affinity to hydrogen, forming stable hydrides and a B
element, generally a transition metal, which has a low affinity to hydrogen, forming
unstable hydrides. The B element is often nickel as this is an excellent catalyst for
hydrogen dissociation.
Table 1.1 – The families of hydride forming intermetallic compounds17
Type Metal Hydride wt% H
Elemental Pd PdH0.6 0.56
AB FeTi FeTiH2 1.9
AB2 ZrV2 ZrV2H5.5 3
AB3 CeNi3 CeNi3H4 1.3
AB5 LaNi5 LaNi5H6.5 1.5
A2B Mg2Ni Mg2NiH4 3.6
A2B7 Y2Ni7 Y2Ni7H3 0.5
CHAPTER 1. Introduction 16
The hydride of LaNi5 shows some promising hydrogen storage properties, including
fast and reversible hydrogen uptake, as well as being able to release all of its
hydrogen at a pressure of less than 2 bar. However, lanthanum and nickel are both
heavy elements, which means that only 1.5 wt% can be stored in the alloy. Higher
hydrogen contents are obtainable through the use of light elements. Magnesium
forms a hydride containing 7.7 wt% hydrogen; however, it suffers from very slow
rates of de/rehydrogenation and releases hydrogen at temperatures in excess of
300°C.30 The characteristics of hydrogen absorption and desorption can be modified
by partial substitution of the constituent elements in the host lattice. For example,
attempts to improve the hydrogen storage properties of MgH2 have been made by
alloying magnesium with nickel before hydriding, resulting in a hydride of 3.6 wt%,
Mg2NiH4.31 The rate of hydriding is improved, potentially due to nickel acting as a
catalyst for the dissociation of hydrogen gas, but temperatures in excess of 280°C
are still required for hydrogen release.17 This temperature can be decreased further
through mechanical alloying with transition metals.32 Most metallic hydrides absorb
hydrogen up to a metal to hydrogen ratio of two. Greater ratios are possible, as is the
case with BaReH9, containing a ratio of 4.5.33
1.6.6 Complex Hydrides
Light metals such as lithium, sodium and aluminium give rise to a large variety of
metal-hydrogen complexes. They are amongst the most promising candidates for
hydrogen storage due to their lightweight and the number of hydrogen atoms per
metal atoms, which in many cases is two. The term complex hydride is generally
given to materials where hydrogen is covalently bonded to a central atom in a
complex anion.34 These ionic hydrides include borohydrides, BH4−, alanates, AlH4
−
and amides, NH2−, where the negative charge of the anion is compensated by a
cation of a light metal. They have some of the highest known gravimetric hydrogen
densities, with lithium borohydride, LiBH4, having a capacity of 18.5 wt%. However,
the stability of the compounds can be problematic, as they decompose at elevated
temperatures, often above the compound‘s melting point.
CHAPTER 1. Introduction 17
1.6.6.1 Alanates
The aluminium hydrides (alanates) of sodium and lithium can be synthesised either
directly from reaction of the constituent elements or through the reaction of the metal
hydride with aluminium halides in solution.35 Both of these alanates have high
gravimetric hydrogen contents, with lithium alanate containing 10.5 wt% and sodium
alanate possessing 7.4 wt%. The compounds decompose through the release of
hydrogen in a two step process, shown by reaction 1.8, lithium alanate decomposing
at a slightly lower temperature of 201°C compared to 265°C for sodium alanate. The
reverse reaction for the sodium system has been shown to proceed at 270°C under a
hydrogen pressure of 175 bar.34
3MAlH4 → M3AlH6 + 2Al + 3H2 → 3MH + 3Al + 9/2H2 Reaction 1.8
The practical use of alanates as materials for hydrogen storage was limited due to
high kinetic barriers both towards hydrogenation and the reverse reaction. The
kinetics of both uptake and release of hydrogen in sodium alanate have been shown
to be dramatically improved through doping with titanium.36 This allows hydrogen to
be released from the material at 150°C, while the reversible reaction could proceed
at a temperature as low as 170°C under 152 bar H2. However, this was achieved at a
cost of the hydrogen capacity of the material, this being reduced from an initial value
of 5.6 wt% down to 3.1 wt% after thirty one cycles.
1.6.6.2 Borohydrides
Borohydrides were first synthesised as early as 1940 through the reaction of
ethyllithium with diborane.37 An alternative synthesis involves the reaction of metal
hydride with diborane in ethereal solvents,38 and direct synthesis from the metal,
boron and hydrogen is also possible at elevated temperature and hydrogen pressure.
Borohydrides have been widely used in organic synthesis as reducing agents,
however, their potential as hydrogen storage materials has recently been
investigated.39, 40
Lithium borohydride has a very high gravimetric hydrogen density of 18.5 wt% and
therefore offers potential as a hydrogen storage material. The decomposition of
CHAPTER 1. Introduction 18
lithium borohydride begins at 280°C, which is accompanied by the melting of the
material. Only a small amount of hydrogen is released at this temperature, with the
main evolution of hydrogen occurring at a temperature in excess of 380°C.39 During
this process three of the four hydrogen atoms are released, leaving lithium hydride
and boron, giving a theoretical hydrogen capacity of 13.9 wt%. The decomposition of
lithium borohydride is shown in reaction 1.9.
2LiBH4 → 2LiH + 2B + 3H2 Reaction 1.9
This desorption process can be catalysed by adding SiO2, significantly lowering the
onset temperature of hydrogen release.39 The reverse rehydrogenation process has
been shown to proceed at 600°C under a hydrogen pressure of 350 bar.41 Following
rehydrogenation the amount of hydrogen that can then be reversibly released has
been shown to be 8.3 wt%.42
The decomposition of LiBH4 can be modified by reaction with MgH2, the alternative
decomposition pathway shown in reaction 1.10.43 The presence of MgH2 improves
the thermodynamics of both the hydrogenation and dehydrogenation pathways, while
still maintaining a high gravimetric hydrogen density of 11.4 wt%.
LiBH4 + ½MgH2 ↔ LiH + MgB2 + 2H2 Reaction 1.10
The formation of MgB2 stabilises the dehydrogenated state, consequently effectively
destabilising the LiBH4. Dehydrogenation begins from 270°C in a stepwise process,
with a total of 8 wt% released by 450°C. Hydrogenation can be achieved to a value of
10 wt% at 400°C under a pressure of 24 bar.
The desorption of NaBH4, which contains 10.7 wt% hydrogen, has also been
investigated.40 The compound undergoes dehydrogenation through a multi-step
process, beginning at a temperature as low as 150°C, although there is only a
relatively small release of hydrogen at this temperature, the main releases of
hydrogen occur above the melting point of the material, 505°C, giving a total
hydrogen release of 10.4 wt%, accounting for nearly all of the hydrogen in the initial
material. Therefore, the decomposition of NaBH4 differs slightly to that of LiBH4,
shown in reaction 1.11.
CHAPTER 1. Introduction 19
NaBH4 → Na + B + 2H2 Reaction 1.11
This difference is most likely due to the lower decomposition temperature of NaH
compared to LiH rather than any alternative decomposition pathway taking place.
The equivalent reverse reaction of reaction 1.9 has been demonstrated for sodium
hydride as well as calcium hydride.44
1.6.6.3 Amides
Alkali metal amides can be formed through the reaction of the molten metal with
ammonia, through catalysing a metal–ammonia solution with Fe2O3 or by reaction of
metal hydride with ammonia.45 The thermal decomposition of lithium amide proceeds
through the release of ammonia gas, forming lithium imide, shown in reaction 1.12,
and hence, from this point of view, the potential of lithium amide as a hydrogen
storage material is limited.46
2LiNH2 → Li2NH + NH3 Reaction 1.12
A breakthrough in amide hydrogen storage chemistry came in 2002, when Chen et
al.47 showed that lithium nitride, Li3N, is capable of absorbing 9.3 wt% hydrogen at
moderate temperature and pressure. This absorption was shown to be a two step
process represented by reaction 1.13.
Li3N + 2H2 ↔ Li2NH + LiH + H2 ↔ LiNH2 + 2LiH Reaction 1.13
Both steps of the reaction have been shown to be reversible, with a theoretical
hydrogen capacity of 10.4 wt%. Furthermore, the reactions of LiNH2 with LiH and
Li2NH with LiH were shown to release hydrogen, with only trace amounts of ammonia
detected. However, the kinetics of the first step have been shown to be poor, with a
very slow uptake of hydrogen and the Li2NH and LiH reaction was shown to only
release hydrogen above 320°C in a vacuum.47 It is the amide–imide step that offers
the most potential for hydrogen storage. This step has favourable thermodynamics
and a reversible hydrogen capacity of 6.5 wt%, and as a result has been the subject
of intensive research. The reaction mechanism has been investigated by isotopic
exchange which led to the conclusion that the hydrogen release mechanism involved
the combination of positively charged hydrogens present in LiNH2 combining with the
CHAPTER 1. Introduction 20
negatively charged ones in LiH.48 The effect of catalysis on the reaction has been
investigated, with TiCl3 shown to decrease the onset temperature of hydrogen
release.49 Ichikawa et al.50 investigated the mechanism of hydrogen release and
concluded that it occurs through two steps. Firstly, LiNH2 decomposes to release
ammonia, which in the second step rapidly reacts with the LiH present, producing
Li2NH and hydrogen. The lithium hydride acts as a ‗scavenger‘ for ammonia and the
reaction is so rapid that no ammonia release is detected. David et al.51 used
structural refinement of X-ray diffraction data to show that the mechanism of
transformation between LiNH2 and Li2NH during hydrogen cycling involves a bulk
reversible reaction that occurs in a non-stoichiometric manner within the cubic anti-
fluorite-like Li–N–H structure. Variable stoichiometry was observed in this cubic
structure, which suggested that the mechanism of absorption and desorption of
hydrogen involves mobility of Li+ and H+. NH3 in this mechanism is formed as a result
of Li+ migration to an adjacent, vacant, tetrahedral or octahedral site, resulting in
unstable, charged species. Charge balance can be restored by the expulsion of a
proton, leading to NH3 formation, which when released reacts with LiH, releasing H2.
The hydrogenation mechanism involves surface migratory Li+, which interacts with
H2, forming LiH and protonic hydrogen. The H+ subsequently bonds with NH2−,
forming NH2− and ultimately LiNH2.
The decomposition of Mg(NH2)2 has also been investigated and was shown to
proceed by the release of ammonia.52 Adding MgH2 failed to inhibit the release of
ammonia, whereas the presence of LiH resulted in only hydrogen being released.
This is due to the reaction of MgH2 with NH3 being a slow reaction in the order of one
day, whereas LiH and ammonia react in an ultrafast reaction in less than 25 ms.53
Mixed metal amide–hydride systems have been the subject of research, with Li–Ca,
and Li–Mg systems being proposed.54 On substituting MgH2 for LiH2 in reaction 1.13,
it was found that the onset temperature of hydrogen release was decreased and on
dehydrogenation a mixed Li–Mg imide formed. The reaction was demonstrated to be
reversible at 200°C and a hydrogen pressure of 32 bar. Further investigations
showed that the hydrogenation reaction produced lithium hydride and magnesium
amide in preference to the starting materials of lithium amide and magnesium
hydride, shown by reaction 1.14.54-56
CHAPTER 1. Introduction 21
2LiNH2 + MgH2 → Li2Mg(NH)2 + 2H2 ↔ Mg(NH2)2 + 2LiH Reaction 1.14
Studies that started by looking at the magnesium amide and lithium hydride system
settle on a 3:8 optimum molar ratio of the materials, with a reversible hydrogen
content of 7 wt%. The hydrogenation reaction proceeds at 200°C under a pressure of
30 bar, with dehydrogenation proceeding at 170°C. Interestingly both
dehydrogenation and hydrogenation mechanisms have been thought to rely on
ammonia, although no ammonia release is actually detected, while there is no
mention of a mixed Li–Mg imide due to the lower temperatures employed. The
dehydrogenation reactions are shown by reactions 1.14a–c, rehydrogenation by
reactions 1.15a–c, with the overall reaction shown in reaction 1.16.
3Mg(NH2)2 → 3MgNH + 3NH3 → Mg3N2 + NH3 Reaction 1.14a
4NH3 + 4LiH → 4LiNH2 + 4H2 Reaction 1.14b
4LiNH2 → 2Li2NH + 2NH3 Reaction 1.14c
4Li2NH + 4H2 → 4LiH + 4LiNH2 Reaction 1.15a
4LiNH2 → 2Li2NH + 2NH3 Reaction 1.15b
2NH3 + ½Mg3N2 → 2
3 Mg(NH2)2 Reaction 1.15c
3Mg(NH2)2 + 8LiH ↔ Mg3N2 + 4Li2NH + 8H2 Reaction 1.16
The equivalent Li–Ca system forms a mixed Li–Ca imide at 300°C starting with either
metal amide.57 However, on rehydriding the mixed imide always results in Ca(NH2)2
and LiH. There is a significant hydrogen release, approaching the theoretical
hydrogen capacity of 4.5 wt%, up to 200°C, although as with the Li–Mg example, this
does not result in the mixed imide forming, rather the individual calcium and lithium
imides.58 The system is partly reversible at 180°C and 30 bar hydrogen pressure,
shown in reaction 1.17.
2LiNH2 + CaH2 → Li2NH + CaNH + 2H2 → Li2Ca(NH)2 + 2H2 ↔ Ca(NH2)2 + 2LiH
Reaction 1.17
CHAPTER 1. Introduction 22
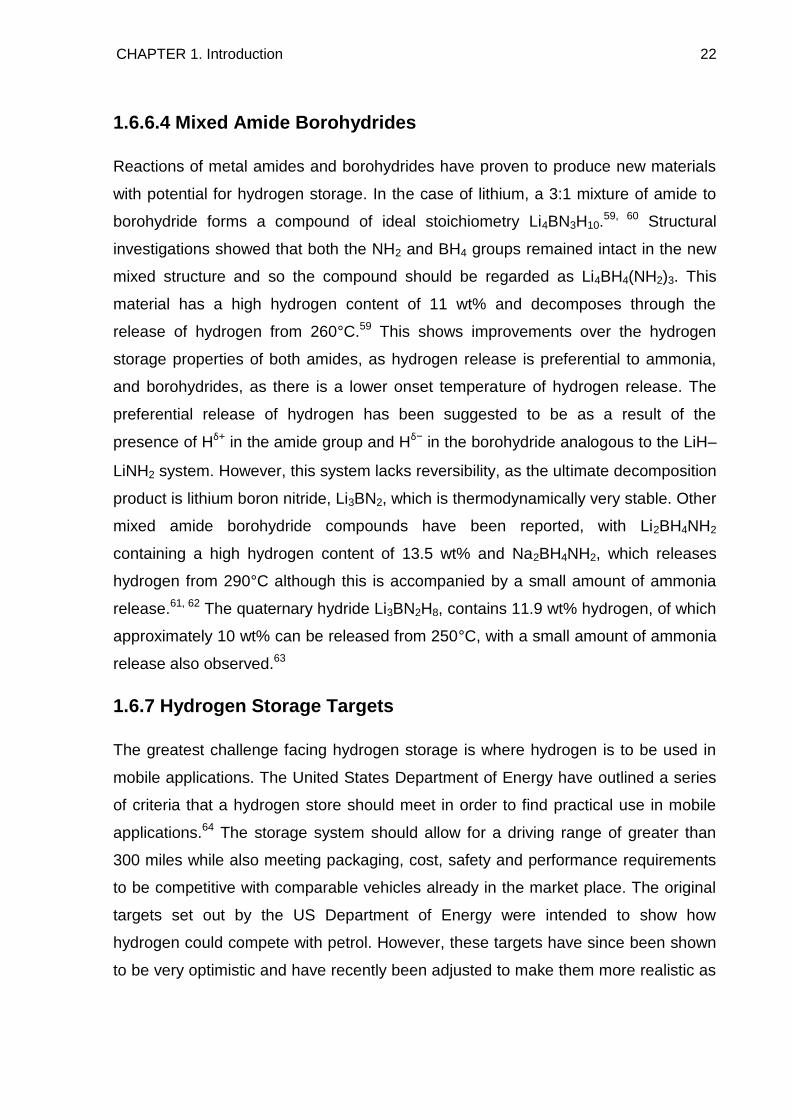
1.6.6.4 Mixed Amide Borohydrides
Reactions of metal amides and borohydrides have proven to produce new materials
with potential for hydrogen storage. In the case of lithium, a 3:1 mixture of amide to
borohydride forms a compound of ideal stoichiometry Li4BN3H10.59, 60 Structural
investigations showed that both the NH2 and BH4 groups remained intact in the new
mixed structure and so the compound should be regarded as Li4BH4(NH2)3. This
material has a high hydrogen content of 11 wt% and decomposes through the
release of hydrogen from 260°C.59 This shows improvements over the hydrogen
storage properties of both amides, as hydrogen release is preferential to ammonia,
and borohydrides, as there is a lower onset temperature of hydrogen release. The
preferential release of hydrogen has been suggested to be as a result of the
presence of Hδ+ in the amide group and Hδ− in the borohydride analogous to the LiH–
LiNH2 system. However, this system lacks reversibility, as the ultimate decomposition
product is lithium boron nitride, Li3BN2, which is thermodynamically very stable. Other
mixed amide borohydride compounds have been reported, with Li2BH4NH2
containing a high hydrogen content of 13.5 wt% and Na2BH4NH2, which releases
hydrogen from 290°C although this is accompanied by a small amount of ammonia
release.61, 62 The quaternary hydride Li3BN2H8, contains 11.9 wt% hydrogen, of which
approximately 10 wt% can be released from 250°C, with a small amount of ammonia
release also observed.63
1.6.7 Hydrogen Storage Targets
The greatest challenge facing hydrogen storage is where hydrogen is to be used in
mobile applications. The United States Department of Energy have outlined a series
of criteria that a hydrogen store should meet in order to find practical use in mobile
applications.64 The storage system should allow for a driving range of greater than
300 miles while also meeting packaging, cost, safety and performance requirements
to be competitive with comparable vehicles already in the market place. The original
targets set out by the US Department of Energy were intended to show how
hydrogen could compete with petrol. However, these targets have since been shown
to be very optimistic and have recently been adjusted to make them more realistic as
CHAPTER 1. Introduction 23
well as due to knowledge gained from hydrogen-fuelled vehicles produced since the
release of the original targets. The current target for the gravimetric capacity of a
hydrogen storage system is 5.5 wt%, to be achieved by the year 2015, with the
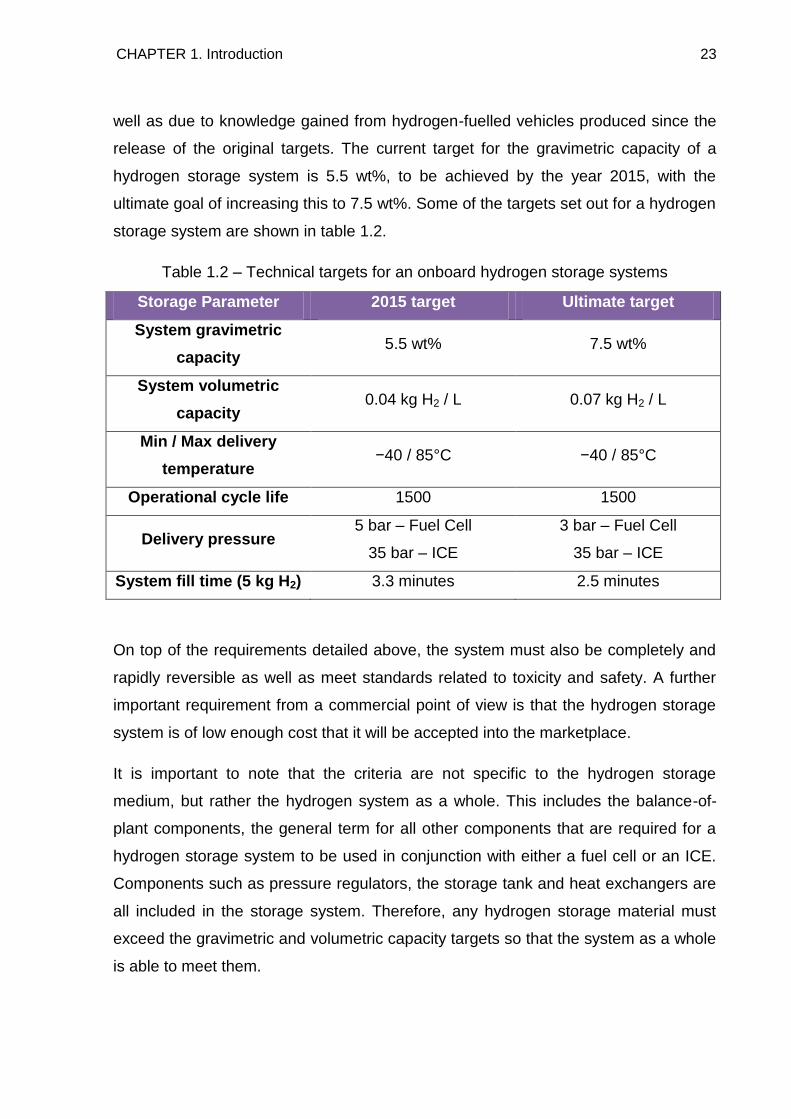
ultimate goal of increasing this to 7.5 wt%. Some of the targets set out for a hydrogen
storage system are shown in table 1.2.
Table 1.2 – Technical targets for an onboard hydrogen storage systems
Storage Parameter 2015 target Ultimate target
System gravimetric
capacity 5.5 wt% 7.5 wt%
System volumetric
capacity 0.04 kg H2 / L 0.07 kg H2 / L
Min / Max delivery
temperature −40 / 85°C −40 / 85°C
Operational cycle life 1500 1500
Delivery pressure 5 bar – Fuel Cell
35 bar – ICE
3 bar – Fuel Cell
35 bar – ICE
System fill time (5 kg H2) 3.3 minutes 2.5 minutes
On top of the requirements detailed above, the system must also be completely and
rapidly reversible as well as meet standards related to toxicity and safety. A further
important requirement from a commercial point of view is that the hydrogen storage
system is of low enough cost that it will be accepted into the marketplace.
It is important to note that the criteria are not specific to the hydrogen storage
medium, but rather the hydrogen system as a whole. This includes the balance-of-
plant components, the general term for all other components that are required for a
hydrogen storage system to be used in conjunction with either a fuel cell or an ICE.
Components such as pressure regulators, the storage tank and heat exchangers are
all included in the storage system. Therefore, any hydrogen storage material must
exceed the gravimetric and volumetric capacity targets so that the system as a whole
is able to meet them.
CHAPTER 1. Introduction 24
There is also an important point to note in the case of chemical hydrides as materials
for hydrogen storage. The gravimetric storage capacity of this system should be
quoted from the hydrogen releasing reaction and not from the total hydrogen content
of the material. It is often difficult to release the total hydrogen content of a material at
moderate temperatures. An example of this being lithium borohydride, a compound
that contains a total hydrogen content of 18.5 wt%. However, most of this hydrogen
is released at elevated temperatures and as lithium hydride is one of the
decomposition products, the amount of hydrogen actually released is reduced from
this value until even higher temperatures are reached.
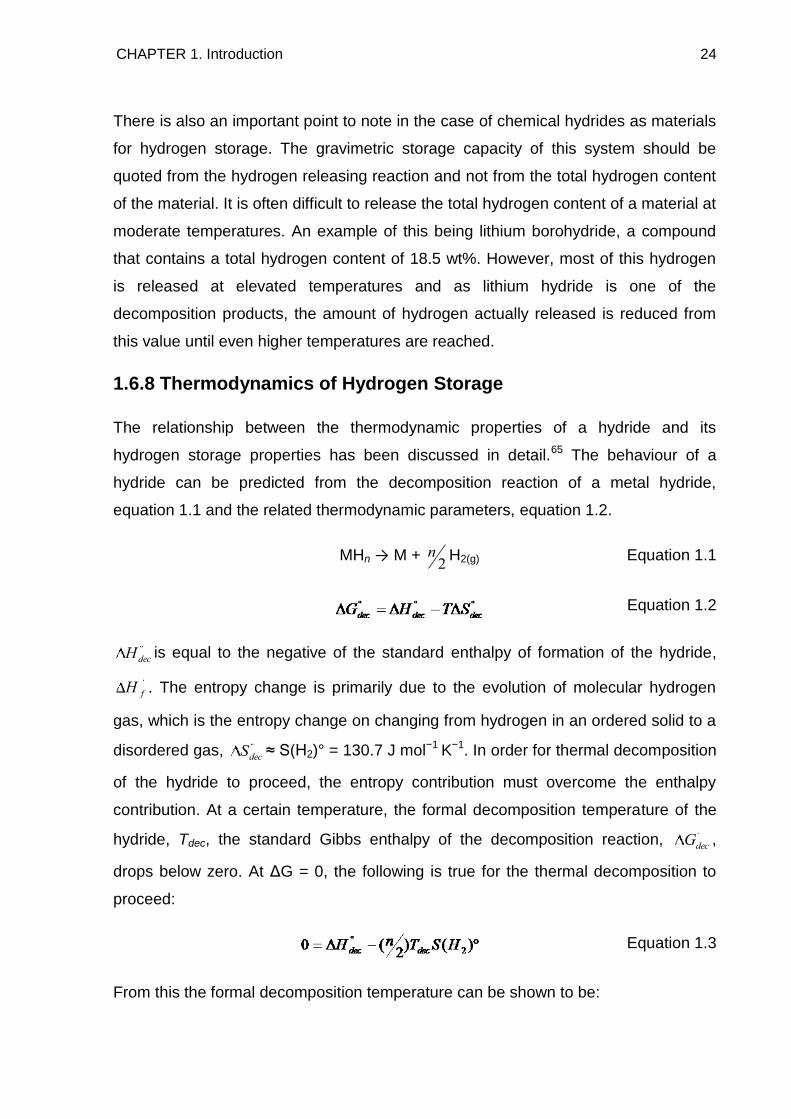
1.6.8 Thermodynamics of Hydrogen Storage
The relationship between the thermodynamic properties of a hydride and its
hydrogen storage properties has been discussed in detail.65 The behaviour of a
hydride can be predicted from the decomposition reaction of a metal hydride,
equation 1.1 and the related thermodynamic parameters, equation 1.2.
MHn → M + 2n H2(g) Equation 1.1
Equation 1.2
decH is equal to the negative of the standard enthalpy of formation of the hydride,
fH . The entropy change is primarily due to the evolution of molecular hydrogen
gas, which is the entropy change on changing from hydrogen in an ordered solid to a
disordered gas, decS ≈ S(H2)° = 130.7 J mol−1 K−1. In order for thermal decomposition
of the hydride to proceed, the entropy contribution must overcome the enthalpy
contribution. At a certain temperature, the formal decomposition temperature of the
hydride, Tdec, the standard Gibbs enthalpy of the decomposition reaction, decG ,
drops below zero. At ΔG = 0, the following is true for the thermal decomposition to
proceed:
Equation 1.3
From this the formal decomposition temperature can be shown to be:
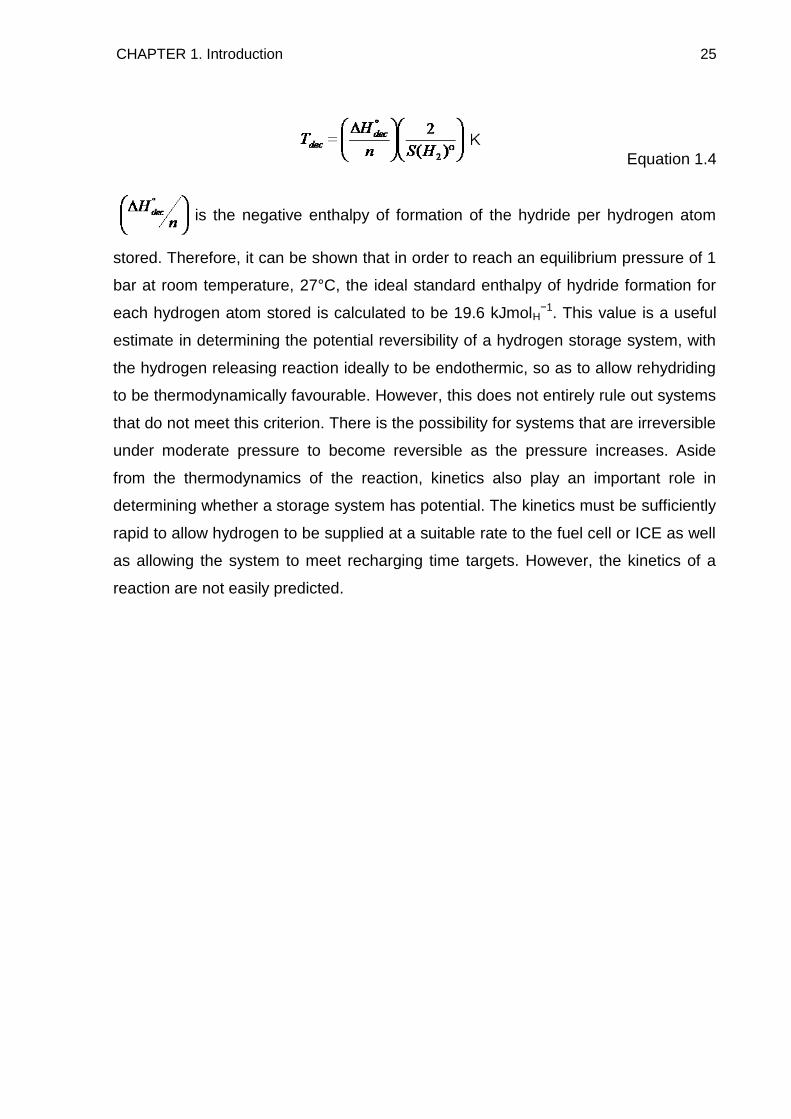
CHAPTER 1. Introduction 25
Equation 1.4
is the negative enthalpy of formation of the hydride per hydrogen atom
stored. Therefore, it can be shown that in order to reach an equilibrium pressure of 1
bar at room temperature, 27°C, the ideal standard enthalpy of hydride formation for
each hydrogen atom stored is calculated to be 19.6 kJmolH−1. This value is a useful
estimate in determining the potential reversibility of a hydrogen storage system, with
the hydrogen releasing reaction ideally to be endothermic, so as to allow rehydriding
to be thermodynamically favourable. However, this does not entirely rule out systems
that do not meet this criterion. There is the possibility for systems that are irreversible
under moderate pressure to become reversible as the pressure increases. Aside
from the thermodynamics of the reaction, kinetics also play an important role in
determining whether a storage system has potential. The kinetics must be sufficiently
rapid to allow hydrogen to be supplied at a suitable rate to the fuel cell or ICE as well
as allowing the system to meet recharging time targets. However, the kinetics of a
reaction are not easily predicted.
CHAPTER 1. Introduction 26
1.7 Ammonia borane
1.7.1 Synthesis
Ammonia borane has recently attracted a growing amount of interest in the field of
hydrogen storage.66, 67 This is largely due to its high gravimetric hydrogen content of
19.6 wt% and its high volumetric content of 0.145 kg L−1. Furthermore, it exists as a
stable white solid at room temperature and pressure and it is non-flammable, non-
toxic and non-explosive. The compound was first discovered in 1955 by Shore,68
albeit through a stroke of luck. Previous work attempting to synthesise ammonia
borane had proved unsuccessful. The reactions of Lewis acids with diborane had
been well investigated, the products being monomeric donor-acceptor adducts; some
examples are shown in reactions 1.18 and 1.19.69
B2H6 + 2CO → 2BH3CO Reaction 1.18
B2H6 + 2(CH3)3N → 2(CH3)3NBH3 Reaction 1.19
However, when the Lewis base was NH3, it was shown that NH3BH3 was not
synthesised and the reaction proceeded through a different reaction pathway,
synthesising a compound represented by the empirical formula B2H6.2NH3, which
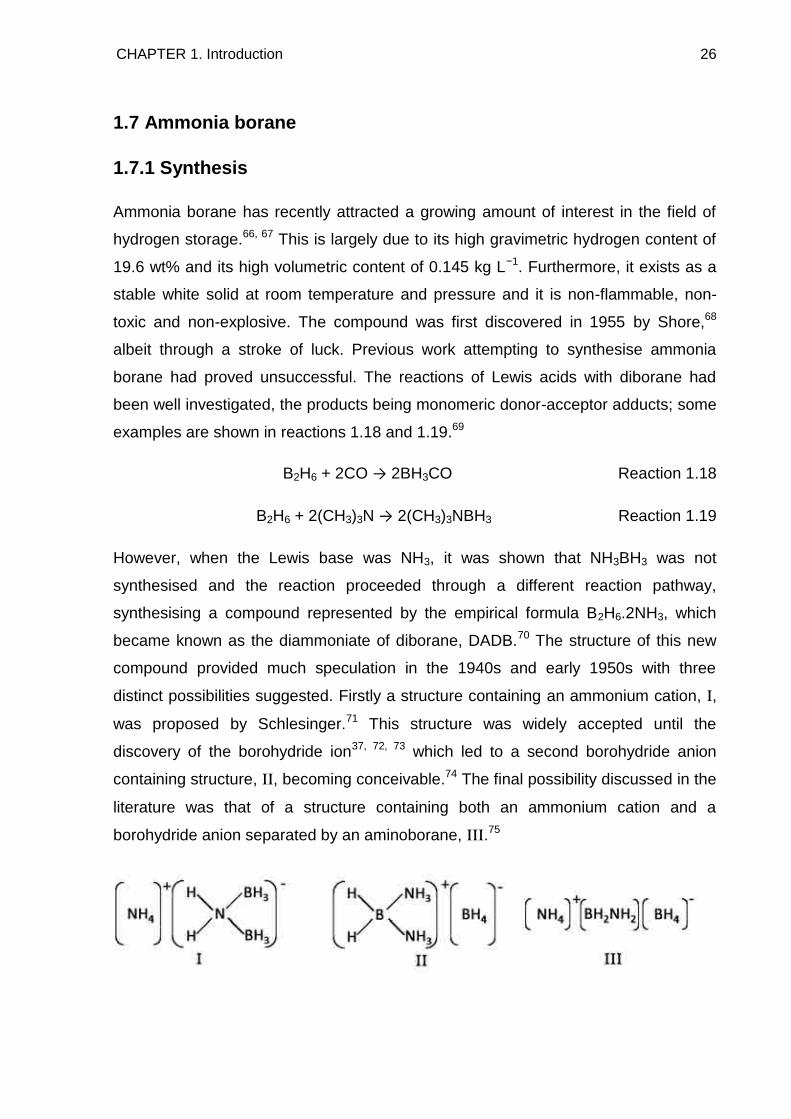
became known as the diammoniate of diborane, DADB.70 The structure of this new
compound provided much speculation in the 1940s and early 1950s with three
distinct possibilities suggested. Firstly a structure containing an ammonium cation, I,
was proposed by Schlesinger.71 This structure was widely accepted until the
discovery of the borohydride ion37, 72, 73 which led to a second borohydride anion
containing structure, II, becoming conceivable.74 The final possibility discussed in the
literature was that of a structure containing both an ammonium cation and a
borohydride anion separated by an aminoborane, III.75
CHAPTER 1. Introduction 27
Finally, in the 1950s a series of papers were published by Parry and Shore76-79 that
proved that the structure of DADB involved an N–B–N chain and a borohydride
anion, structure II shown above. One of the key steps in confirming this structure was
looking at how DADB reacted with ammonium and borohydride salts. DADB was
found to be unreactive towards borohydride salts, but did react with ammonium
salts.76 The steps in the reaction with ammonium bromide are shown in reaction 1.20
and the overall reaction in 1.21.
NH4Br + DADB → NH4BH4 + [NH3BH2NH3]+[Br]− Reaction 1.20a
2NH4BH4 → DADB + 2H2 Reaction 1.20b
DADB + 2NH4Br → 2[NH3BH2NH3]+[Br]− + 2H2 Reaction 1.21
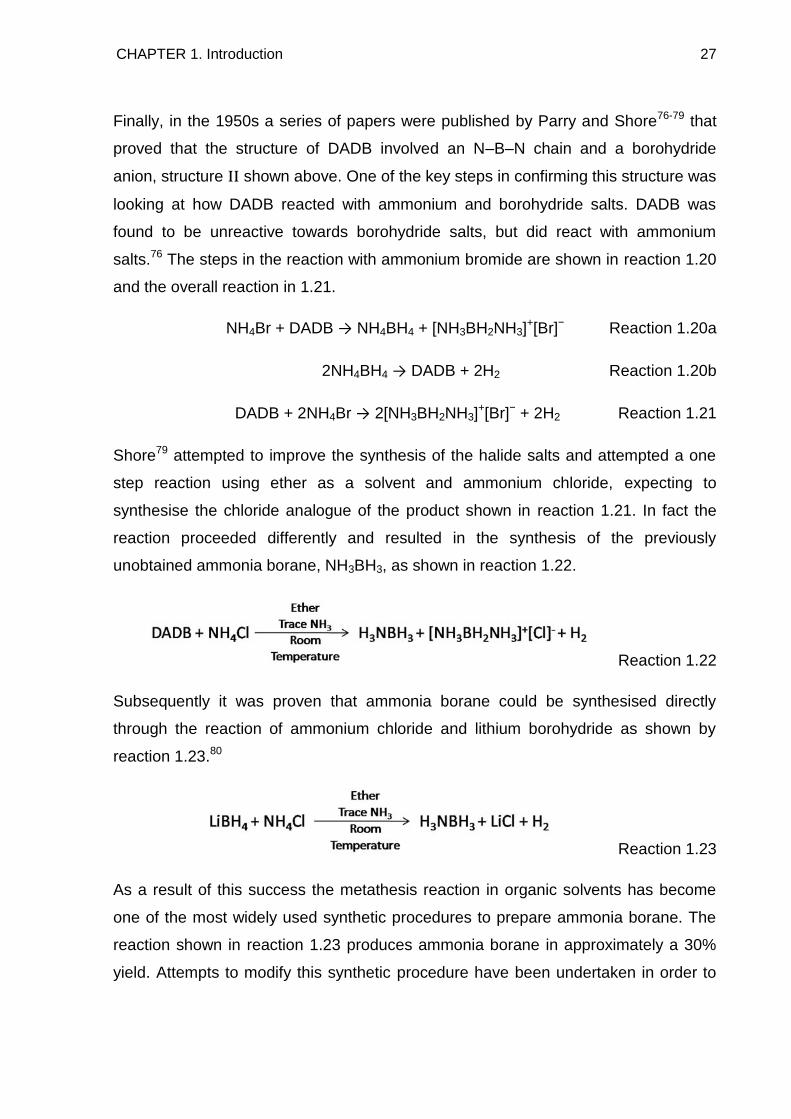
Shore79 attempted to improve the synthesis of the halide salts and attempted a one
step reaction using ether as a solvent and ammonium chloride, expecting to
synthesise the chloride analogue of the product shown in reaction 1.21. In fact the
reaction proceeded differently and resulted in the synthesis of the previously
unobtained ammonia borane, NH3BH3, as shown in reaction 1.22.
Reaction 1.22
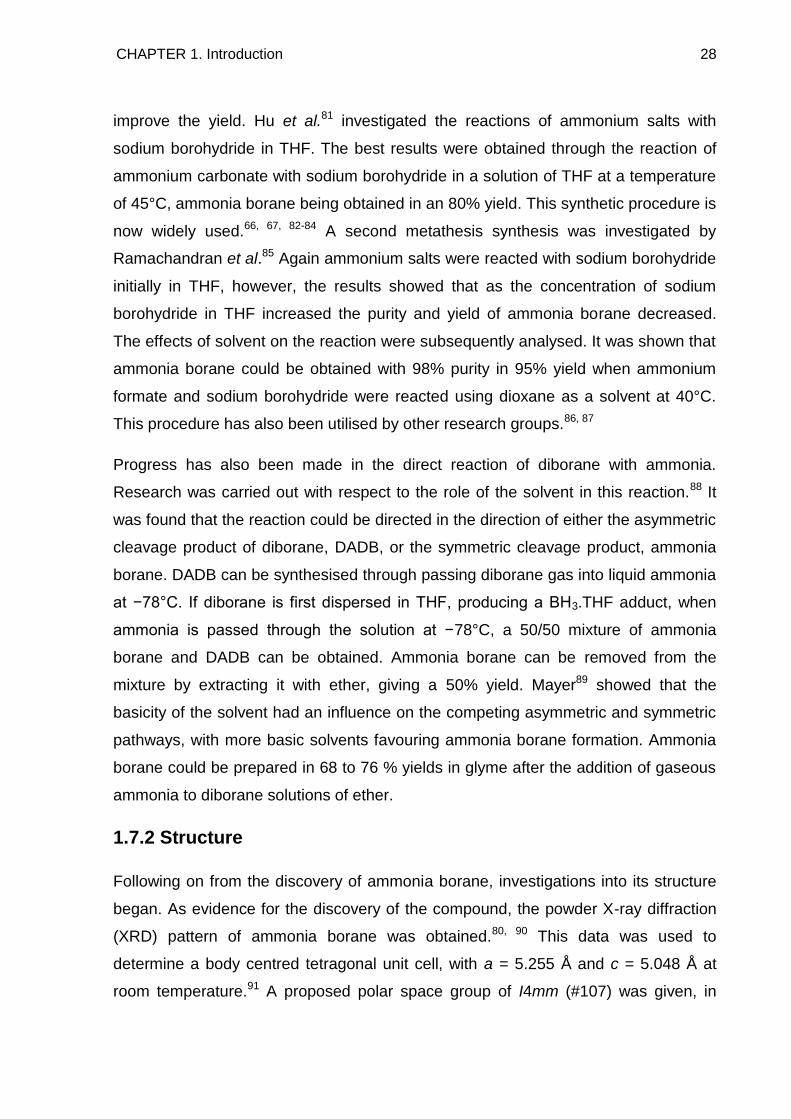
Subsequently it was proven that ammonia borane could be synthesised directly
through the reaction of ammonium chloride and lithium borohydride as shown by
reaction 1.23.80
Reaction 1.23
As a result of this success the metathesis reaction in organic solvents has become
one of the most widely used synthetic procedures to prepare ammonia borane. The
reaction shown in reaction 1.23 produces ammonia borane in approximately a 30%
yield. Attempts to modify this synthetic procedure have been undertaken in order to
CHAPTER 1. Introduction 28
improve the yield. Hu et al.81 investigated the reactions of ammonium salts with
sodium borohydride in THF. The best results were obtained through the reaction of
ammonium carbonate with sodium borohydride in a solution of THF at a temperature
of 45°C, ammonia borane being obtained in an 80% yield. This synthetic procedure is
now widely used.66, 67, 82-84 A second metathesis synthesis was investigated by
Ramachandran et al.85 Again ammonium salts were reacted with sodium borohydride
initially in THF, however, the results showed that as the concentration of sodium
borohydride in THF increased the purity and yield of ammonia borane decreased.
The effects of solvent on the reaction were subsequently analysed. It was shown that
ammonia borane could be obtained with 98% purity in 95% yield when ammonium
formate and sodium borohydride were reacted using dioxane as a solvent at 40°C.
This procedure has also been utilised by other research groups.86, 87
Progress has also been made in the direct reaction of diborane with ammonia.
Research was carried out with respect to the role of the solvent in this reaction.88 It
was found that the reaction could be directed in the direction of either the asymmetric
cleavage product of diborane, DADB, or the symmetric cleavage product, ammonia
borane. DADB can be synthesised through passing diborane gas into liquid ammonia
at −78°C. If diborane is first dispersed in THF, producing a BH3.THF adduct, when
ammonia is passed through the solution at −78°C, a 50/50 mixture of ammonia
borane and DADB can be obtained. Ammonia borane can be removed from the
mixture by extracting it with ether, giving a 50% yield. Mayer89 showed that the
basicity of the solvent had an influence on the competing asymmetric and symmetric
pathways, with more basic solvents favouring ammonia borane formation. Ammonia
borane could be prepared in 68 to 76 % yields in glyme after the addition of gaseous
ammonia to diborane solutions of ether.
1.7.2 Structure
Following on from the discovery of ammonia borane, investigations into its structure
began. As evidence for the discovery of the compound, the powder X-ray diffraction
(XRD) pattern of ammonia borane was obtained.80, 90 This data was used to
determine a body centred tetragonal unit cell, with a = 5.255 Å and c = 5.048 Å at
room temperature.91 A proposed polar space group of I4mm (#107) was given, in
CHAPTER 1. Introduction 29
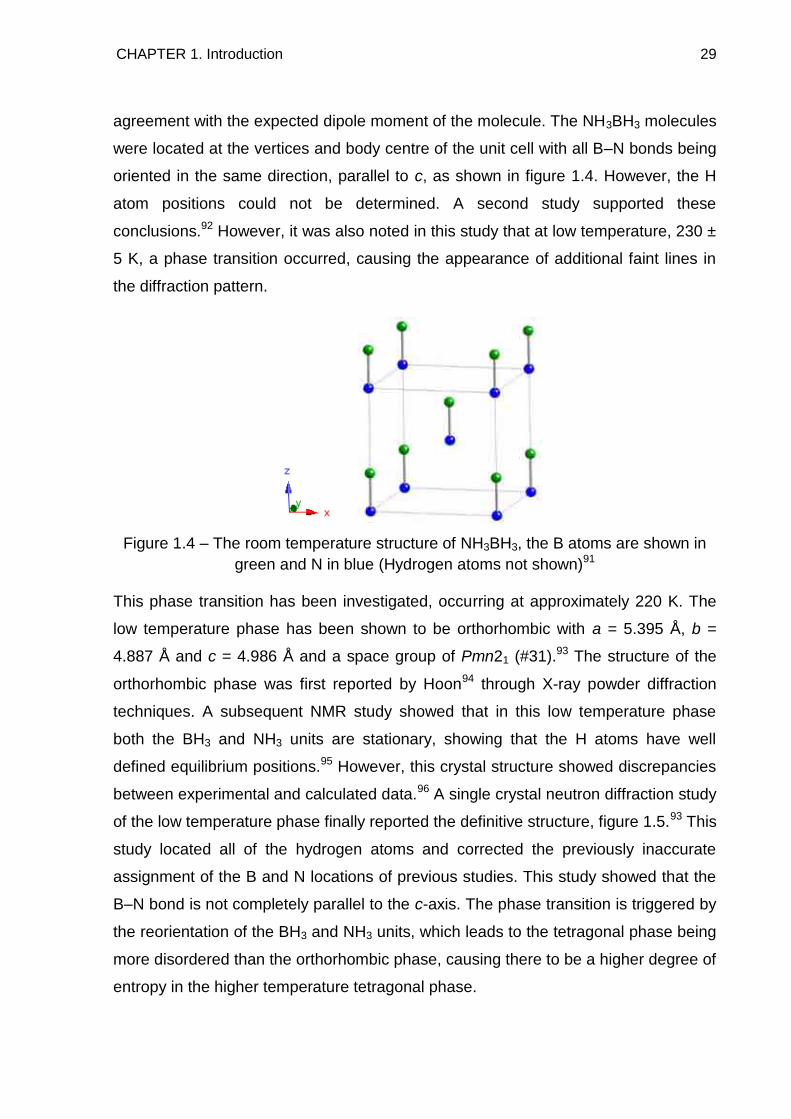
agreement with the expected dipole moment of the molecule. The NH3BH3 molecules
were located at the vertices and body centre of the unit cell with all B–N bonds being
oriented in the same direction, parallel to c, as shown in figure 1.4. However, the H
atom positions could not be determined. A second study supported these
conclusions.92 However, it was also noted in this study that at low temperature, 230 ±
5 K, a phase transition occurred, causing the appearance of additional faint lines in
the diffraction pattern.
Figure 1.4 – The room temperature structure of NH3BH3, the B atoms are shown in
green and N in blue (Hydrogen atoms not shown)91
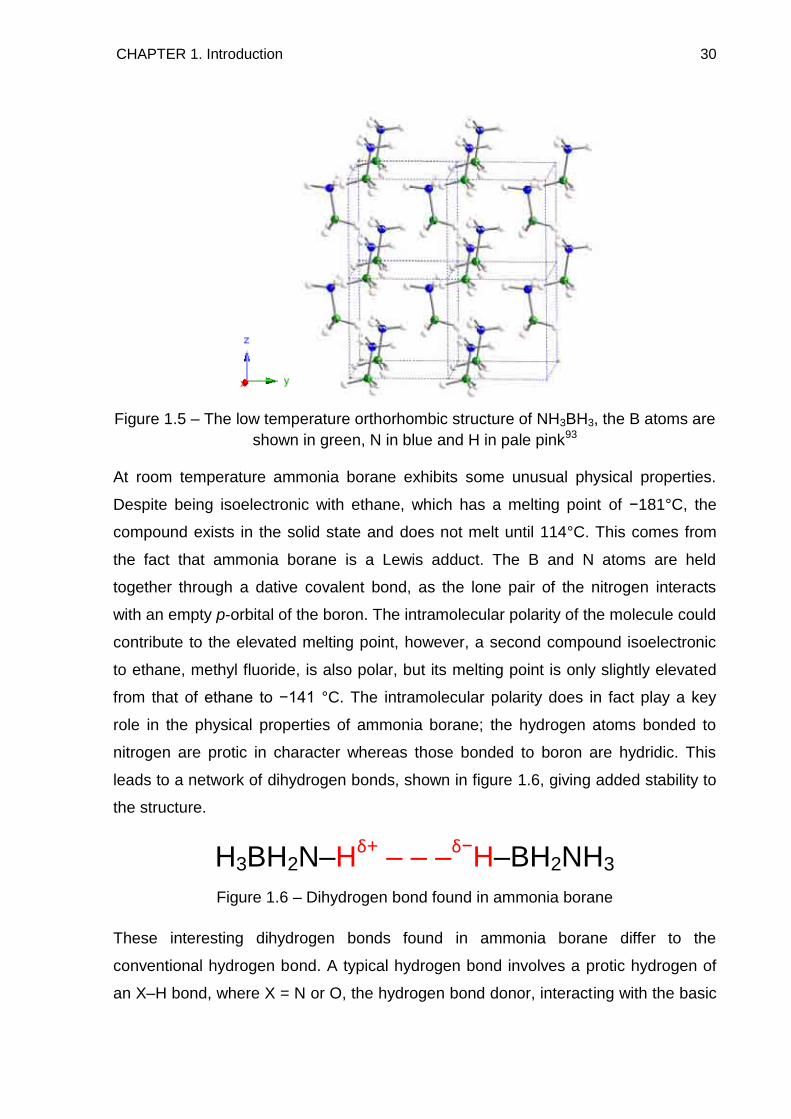
This phase transition has been investigated, occurring at approximately 220 K. The
low temperature phase has been shown to be orthorhombic with a = 5.395 Å, b =
4.887 Å and c = 4.986 Å and a space group of Pmn21 (#31).93 The structure of the
orthorhombic phase was first reported by Hoon94 through X-ray powder diffraction
techniques. A subsequent NMR study showed that in this low temperature phase
both the BH3 and NH3 units are stationary, showing that the H atoms have well
defined equilibrium positions.95 However, this crystal structure showed discrepancies
between experimental and calculated data.96 A single crystal neutron diffraction study
of the low temperature phase finally reported the definitive structure, figure 1.5.93 This
study located all of the hydrogen atoms and corrected the previously inaccurate
assignment of the B and N locations of previous studies. This study showed that the
B–N bond is not completely parallel to the c-axis. The phase transition is triggered by
the reorientation of the BH3 and NH3 units, which leads to the tetragonal phase being
more disordered than the orthorhombic phase, causing there to be a higher degree of
entropy in the higher temperature tetragonal phase.
CHAPTER 1. Introduction 30
Figure 1.5 – The low temperature orthorhombic structure of NH3BH3, the B atoms are
shown in green, N in blue and H in pale pink93
At room temperature ammonia borane exhibits some unusual physical properties.
Despite being isoelectronic with ethane, which has a melting point of −181°C, the
compound exists in the solid state and does not melt until 114°C. This comes from
the fact that ammonia borane is a Lewis adduct. The B and N atoms are held
together through a dative covalent bond, as the lone pair of the nitrogen interacts
with an empty p-orbital of the boron. The intramolecular polarity of the molecule could
contribute to the elevated melting point, however, a second compound isoelectronic
to ethane, methyl fluoride, is also polar, but its melting point is only slightly elevated
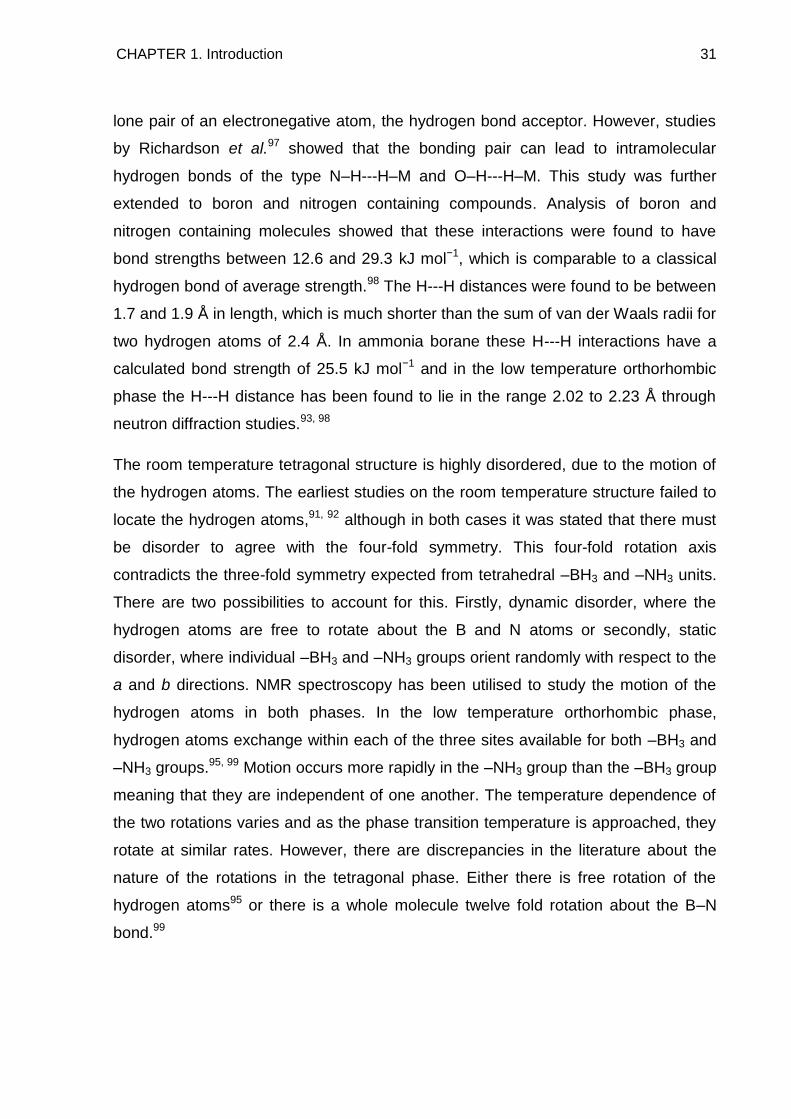
from that of ethane to −141 °C. The intramolecular polarity does in fact play a key
role in the physical properties of ammonia borane; the hydrogen atoms bonded to
nitrogen are protic in character whereas those bonded to boron are hydridic. This
leads to a network of dihydrogen bonds, shown in figure 1.6, giving added stability to
the structure.
H3BH2N–Hδ+
– – –δ−
H–BH2NH3
Figure 1.6 – Dihydrogen bond found in ammonia borane
These interesting dihydrogen bonds found in ammonia borane differ to the
conventional hydrogen bond. A typical hydrogen bond involves a protic hydrogen of
an X–H bond, where X = N or O, the hydrogen bond donor, interacting with the basic
CHAPTER 1. Introduction 31
lone pair of an electronegative atom, the hydrogen bond acceptor. However, studies
by Richardson et al.97 showed that the bonding pair can lead to intramolecular
hydrogen bonds of the type N–H---H–M and O–H---H–M. This study was further
extended to boron and nitrogen containing compounds. Analysis of boron and
nitrogen containing molecules showed that these interactions were found to have
bond strengths between 12.6 and 29.3 kJ mol−1, which is comparable to a classical
hydrogen bond of average strength.98 The H---H distances were found to be between
1.7 and 1.9 Å in length, which is much shorter than the sum of van der Waals radii for
two hydrogen atoms of 2.4 Å. In ammonia borane these H---H interactions have a
calculated bond strength of 25.5 kJ mol−1 and in the low temperature orthorhombic
phase the H---H distance has been found to lie in the range 2.02 to 2.23 Å through
neutron diffraction studies.93, 98
The room temperature tetragonal structure is highly disordered, due to the motion of
the hydrogen atoms. The earliest studies on the room temperature structure failed to
locate the hydrogen atoms,91, 92 although in both cases it was stated that there must
be disorder to agree with the four-fold symmetry. This four-fold rotation axis
contradicts the three-fold symmetry expected from tetrahedral –BH3 and –NH3 units.
There are two possibilities to account for this. Firstly, dynamic disorder, where the
hydrogen atoms are free to rotate about the B and N atoms or secondly, static
disorder, where individual –BH3 and –NH3 groups orient randomly with respect to the
a and b directions. NMR spectroscopy has been utilised to study the motion of the
hydrogen atoms in both phases. In the low temperature orthorhombic phase,
hydrogen atoms exchange within each of the three sites available for both –BH3 and
–NH3 groups.95, 99 Motion occurs more rapidly in the –NH3 group than the –BH3 group
meaning that they are independent of one another. The temperature dependence of
the two rotations varies and as the phase transition temperature is approached, they
rotate at similar rates. However, there are discrepancies in the literature about the
nature of the rotations in the tetragonal phase. Either there is free rotation of the
hydrogen atoms95 or there is a whole molecule twelve fold rotation about the B–N
bond.99
CHAPTER 1. Introduction 32
Studies have been undertaken into locating the hydrogen atoms in the room
temperature phase. A powder XRD study by Hoon and Reynhardt94 attempted to
solve the crystal structure, however, the study was unsuccessful due to the disorder
in the structure. It was proposed that due to the space group symmetry of the
structure, I4mm, the vertices of the BH3 and NH3 groups can point in four mutually
perpendicular directions, all perpendicular to the B–N axis, which means that each H
atom can occupy any of twelve positions. A second study involving single crystal
XRD was undertaken by Bowden et al.100 The positions for boron and nitrogen
refined simply to stable positions, but again the hydrogen positions proved
problematic. A 3D Fourier difference map was calculated, which showed hydrogen
atoms bonded to both boron and nitrogen are disordered in a halo-like arrangement
perpendicular to the B–N bond. The symmetry of the halo, was weakly four-fold, as a
consequence of the space group symmetry, meaning that the number of potential
hydrogen positions has to be a multiple of four. A model accounting for the disorder
was constructed, which proposed eight potential hydrogen positions around each
boron and nitrogen atom, with an occupancy of 3/8 in order to maintain the
stoichiometry. However, such a model was calculated to introduce new weak
diffraction peaks into the XRD pattern, which an exhaustive search of the data failed
to find. The results of the model therefore showed that hydrogen atoms do not
occupy fixed positions in an ordered arrangement. The average hydrogen positions
were therefore refined for the structure. A more recent powder neutron diffraction
study attempted to solve the structure by analysing a fully deuterated sample of
ammonia borane, ND3BD3.101 Both the proposed models of Hoon and Reynhardt,
twelve possible hydrogen positions, and Bowden et al., eight possible hydrogen
positions, were used to refine the structure. It was found that the best refinement was
obtained with the eight possible positions model. Refined deuterium positions are
published in this study. However, there are significant differences between this study
and the single crystal XRD study with respect to atomic coordinates. To date, it has
proved impossible to successfully refine the hydrogen positions in the room
temperature tetragonal structure of ammonia borane due to the disorder observed in
the structure.
CHAPTER 1. Introduction 33
1.7.3 Decomposition
The earliest studies of ammonia borane showed that it is subject to a slow loss of
hydrogen even at room temperature.90, 102 This loss of hydrogen was postulated to be
accompanied by the formation of DADB. Pure ammonia borane was shown to
dissolve completely in ethyl ether. However, a sample kept in a dry atmosphere for a
short period was shown not to redissolve fully, suggesting a partial conversion to
insoluble substances including DADB and polyaminoborane may have occurred.
Further to this, ammonia borane dissolved in ether was observed to precipitate slowly
an unidentified white solid. No observations about the behaviour of ammonia borane
under thermal treatment were made during these studies.
The first study of the thermal decomposition of ammonia borane was carried out by
Hu et al.103 Thermogravimetric analysis, TGA, results showed that a rapid decrease
in mass occurred between 120°C and 133°C, accompanied by a mass loss of 31.6%.
As ammonia borane has a total hydrogen content of less than 20 wt%, hydrogen
cannot be the sole decomposition product. A differential thermal analysis, DTA, study
exhibited a sharp endothermic peak at 112°C. This corresponded well to the
observed melting point of the compound, 112 – 114°C.89 At 117°C a sharp
exothermic peak is observed, reaching a maximum at 130°C. This peak was
accompanied by a rapid voluminous expansion and the release of a large amount of
gas. Finally a broad exothermic peak was observed from 150°C to 200°C. A
combined pressure and temperature measurement showed that a sharp pressure
increase was observed from 120°C, corresponding closely with the first exothermic
peak. On reaching 145°C, the rate of pressure increase decreased, suggesting a
second decomposition step. A final pyrolysis study involved heating ammonia borane
to 200°C. 2.33 mmol of hydrogen were calculated to be released per mmol of
ammonia borane and infra-red (IR) spectroscopy showed that both diborane and
borazine were released as a result of decomposition. This two step decomposition
mechanism was rationalised firstly by an exothermic release of hydrogen through
either reaction 1.24 or reaction 1.25.
NH3BH3 → (NH2BH2)n + H2 Reaction 1.24
CHAPTER 1. Introduction 34
2NH3BH3 → NH3BH2NH2BH3 + H2 Reaction 1.25
The exact nature of the step was not determined although both steps would lead to a
material of BNH4 composition. The exact composition of the product was not
determined but from previous work was suggested to be made up of
cyclodiborazane, (BNH4)2, cyclotriborazane, (BNH4)3, cyclopentaborazane, (BNH4)5,
and polyaminoborane, (BNH4)n.104 The vast number of potential products in this step
shows the complex nature of the thermal decomposition of ammonia borane. The
BNH4 materials further undergo an exothermic hydrogen release step, producing a
material of composition BNH2, reaction 1.26.
(NH2BH2)n → (NHBH)n + nH2 Reaction 1.26
An IR spectrum taken of a sample of ammonia borane pyrolysed at 600°C showed
features at 1390 and 810 cm−1, which are also observed in boron nitride, showing this
is the ultimate decomposition product.
Komm et al.105 undertook a study related to the synthesis of poly(aminoborane),
(NH2BH2)n. Ammonia borane heated to 140°C frothed and released gas, which was
presumed to be hydrogen. A white solid was collected after the experiment was
completed in a yield of 30%. Elemental analysis of the product showed that it was of
empirical formula BNH4, however, molecular mass measurements proved
unsuccessful due to the poor solubility of the material in solvents. This is consistent
with either a cyclic or linear polymer of relatively high molecular weight, again
showing the polymeric nature of the products from the thermal decomposition of
ammonia borane.
A DTA study by Sit et al.106 investigated how the heating rate affected the
decomposition pathway. For all heating rates a sharp endothermic peak was followed
by a sharp exothermic peak, however, the onset temperature of these processes was
shown to be reliant on the heating rate, while features of the DTA curve became
more distinct, with four separate processes being visible, with the lower heating
rates. It was also observed that a slow heating rate resulted in the solid beginning to
decompose at approximately 30°C below the melting point. The exothermic peaks
CHAPTER 1. Introduction 35
were again assigned to the formation of polyaminoboranes accompanied by
hydrogen release and their subsequent decomposition, further releasing hydrogen.
Wolf et al.66 further made progress in understanding the decomposition pathway
through a study involving TGA, DSC, volumetric measurements and IR spectroscopy.
DSC measurements showed that when a heating rate of 1°C min−1 was used, a
previously unreported exothermic event was observed at 95°C, closely followed by
an endothermic event and two further exothermic events at 113 and 125°C. There
was considerable overlap between all of these events, each starting before the
previous event had finished. A slower heating rate of 0.05°C min−1 significantly
decreased the onset temperature of the first exothermic event to 82°C. Furthermore
the endothermic event was no longer observed: the material completely decomposed
below the melting point. Isothermal DSC measurements between 70 and 90°C show
a single exothermic event, which was strongly dependent on temperature, occurring
after forty minutes at 90°C and twenty four hours at 70°C. The mean enthalpy of
reaction was calculated to be −21.7 kJ mol−1. The solid residue produced after
heating was determined to be mainly composed of polyaminoborane. Isothermal
volumetric measurements carried out at 90°C showed the first decomposition step to
be accompanied by the release of hydrogen, with one mole of hydrogen released per
mole of ammonia borane. Although the rate of release was strongly dependent on
temperature, the amount of hydrogen release was independent of temperature. TGA
measurements coupled with DSC and IR spectroscopy showed a mass loss of 10
wt% for the first decomposition step. A one mole loss of hydrogen would correspond
to a 6.5 wt% loss and hence volatile products such as borazine must account for the
additional weight loss. IR spectroscopy identified monomeric aminoborane and
borazine as products from this decomposition step. Monomeric aminoborane has
been shown to be unstable at room temperature and rapidly polymerises.107 These
measurements also showed that borazine was detected after the release of
monomeric aminoborane suggesting that borazine is released from decomposition
products, potentially through the polymerisation of monomeric aminoborane and not
directly from ammonia borane. This study showed that there are several reactions
taking place simultaneously during the thermal decomposition of ammonia borane,
the main decomposition product being polyaminoborane, along with other volatile
CHAPTER 1. Introduction 36
products including borazine. Furthermore, the decomposition process was shown to
be strongly dependent on temperature.
A related study by Baitalow et al.108 resulted in similar findings. A combined
volumetric–TGA study showed two weight loss steps, which could be separated with
a suitably slow ramp rate. 1.1 moles of hydrogen per mole of ammonia borane were
calculated to be released during the first decomposition step, agreeing well with the
formation of polyaminoborane. After heating to 200°C a total of 2.2 moles of
hydrogen per mole of ammonia borane were released, which would correspond to a
total mass loss of 14.3 wt%. However, the observed mass loss was in excess of this
value and so additional volatile products must account for this difference. At a
heating rate of 10°C min−1 the observed mass loss was as high as 33 wt%. Mass
spectrometry revealed that hydrogen, borazine and monomeric aminoborane were
released during the decomposition process. Hydrogen release was observed in both
decomposition steps, independent of the heating rate. However, the heating rate did
affect the release of volatiles. At a higher heating rate borazine and monomeric
aminoborane were released in both steps, but when the heating rate was reduced,
borazine release was suppressed in the first step. These two volatiles are released
simultaneously and it is therefore reasonable to conclude that borazine is formed
through the dehydrogenation of monomeric aminoborane, forming the highly reactive
monomeric iminoborane, which then trimerises producing borazine. The total
hydrogen release was again shown to be independent of both temperature and
heating rate, although its slow release rate in isothermal experiments at temperatures
below 90°C was discussed.
Up to this point only the thermodynamic properties of the thermal decomposition of
ammonia borane had been reported, the mechanism of the release of gases was not
fully understood. A study by Smith et al.109 suggested that the decomposition
pathway proceeded by a bimolecular mechanism. The gases released during
thermolysis from a mixture of NH3BH3 and ND3BD3 were analysed and all three
molecular species H2, HD and D2 were observed. This study also showed that
hydrogen could be released at a temperature as low as 70°C in isothermal
experiments, although there was a long delay before hydrogen release began. An in
CHAPTER 1. Introduction 37
situ solid state 11B NMR study was undertaken by Stowe et al.110 which analysed the
decomposition of ammonia borane and the evolution of boron containing non-volatile
intermediates and products at 88°C. The ammonia borane starting material was
shown to have two observable peaks, due to quadrupolar coupling, centred about a
chemical shift of −27.0 ppm. The first change in the spectrum saw the intensity of the
starting material decrease and a new resonance grow at −23.0 ppm. Two new
additional resonances then appeared corresponding to BH2 and BH4 at −13 and −38
ppm, the groups present in DADB. Pressure monitoring of ammonia borane
decomposition at 88°C showed that there was very little pressure change during this
time period, suggesting that little hydrogen is released at this time. The products
formed during this period are precursors to hydrogen loss. This induction period was
discussed as involving the disruption of the network of dihydrogen bonds, forming a
new more mobile phase of ammonia borane. After DADB formation, hydrogen
release began, evidenced by the broadening of the BH2 feature and the appearance
of a broad BH feature, consistent with polymerised species. The BH4 signal remained
constant after its appearance. DADB formation occurs during the nucleation step, this
was identified as being the critical nucleation event that allows hydrogen release to
commence. The final step in the decomposition was described as being a growth
step. This step was described as initially involving the bimolecular reaction of DADB
with unreacted ammonia borane resulting in the release of hydrogen and a DADB
like species. This DADB like species then further reacts with ammonia borane to
produce longer N–B chains, further releasing hydrogen and polyaminoborane
precursors. The proposed mechanism of hydrogen release is shown in figure 1.7.
Bowden et al.82 performed combined DSC–TG isothermal measurements. Two
exothermic events were observed, which could be separated at lower temperatures.
The first exotherm proceeded without any weight loss, whereas the second
proceeded with a weight loss greater than 6.5 wt%, a larger weight loss than for the
expected loss of one equivalent of hydrogen gas. This weight loss was larger at
higher temperatures, due to the increased release of volatile species such as
borazine. The first exothermic step was further analysed by optical microscopy and
XRD. Microscopy observations showed significant changes in the molecular nature of
ammonia borane without changes in the morphology of the crystals. It was concluded
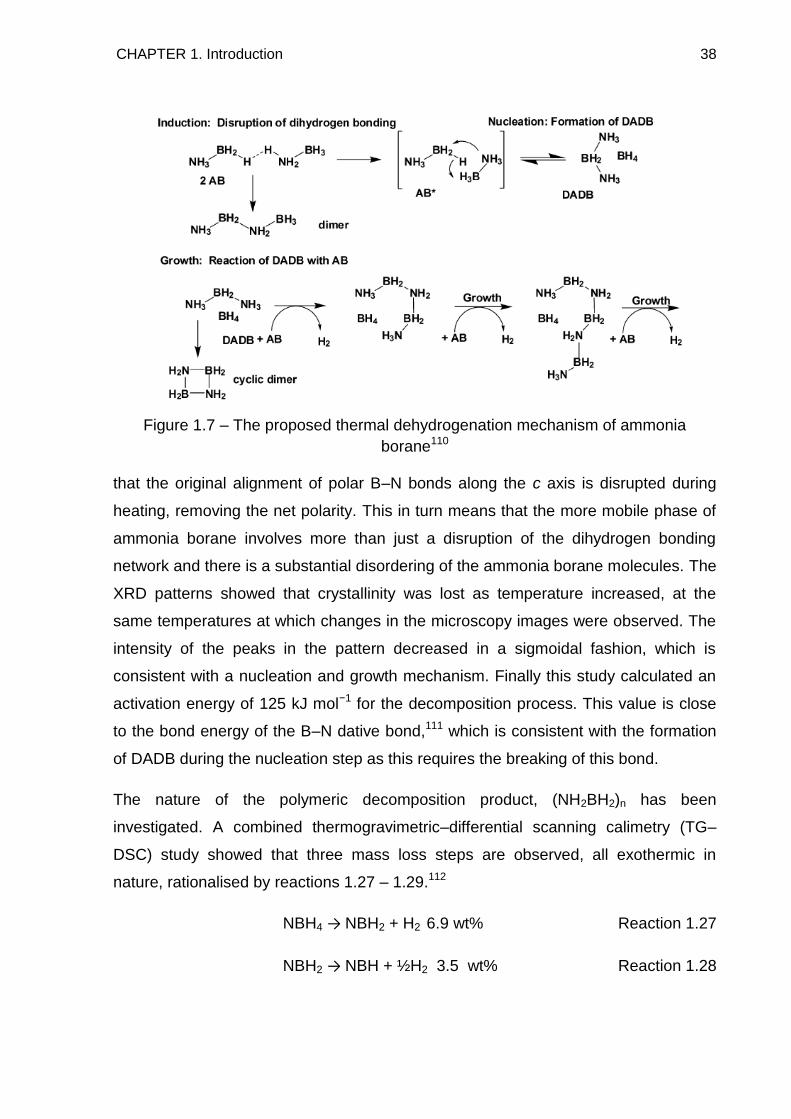
CHAPTER 1. Introduction 38
Figure 1.7 – The proposed thermal dehydrogenation mechanism of ammonia
borane110
that the original alignment of polar B–N bonds along the c axis is disrupted during
heating, removing the net polarity. This in turn means that the more mobile phase of
ammonia borane involves more than just a disruption of the dihydrogen bonding
network and there is a substantial disordering of the ammonia borane molecules. The
XRD patterns showed that crystallinity was lost as temperature increased, at the
same temperatures at which changes in the microscopy images were observed. The
intensity of the peaks in the pattern decreased in a sigmoidal fashion, which is
consistent with a nucleation and growth mechanism. Finally this study calculated an
activation energy of 125 kJ mol−1 for the decomposition process. This value is close
to the bond energy of the B–N dative bond,111 which is consistent with the formation
of DADB during the nucleation step as this requires the breaking of this bond.
The nature of the polymeric decomposition product, (NH2BH2)n has been
investigated. A combined thermogravimetric–differential scanning calimetry (TG–
DSC) study showed that three mass loss steps are observed, all exothermic in
nature, rationalised by reactions 1.27 – 1.29.112
NBH4 → NBH2 + H2 6.9 wt% Reaction 1.27
NBH2 → NBH + ½H2 3.5 wt% Reaction 1.28
CHAPTER 1. Introduction 39
NBH → NB + ½H2 3.5 wt% Reaction 1.29
However, observed total mass losses were greater than 14 wt% and so desorption of
volatile substances, such as borazine, could account for the enhanced mass losses.
Further to this it was noted that the sample history, with respect to its preparation had
an effect on results; weight losses in the range 13.5 wt% to 32.0 wt% were observed.
With such differences in results, it was suggested that there are competing
decomposition pathways in addition to a stepwise hydrogen desorption mechanism.
Baumann et al.113 further analysed the decomposition of polyaminoborane,
synthesising the material through controlled decomposition of ammonia borane at
90°C. A DSC study showed an exothermic event at 115°C, consistent with the
second exothermic event seen in the decomposition of ammonia borane.66, 103 It was
observed that, as with ammonia borane, increasing the heating rate caused an
increase in the temperature at which polyaminoborane decomposes. The enthalpy of
decomposition was shown to be dependent on heating rate; heating at 10 °C min−1
gave a value of −15.4 kJ mol−1, whereas at 0.1°C min−1 a value of −23.9 kJ mol−1
was calculated. The effect of heating rate shows that different reaction pathways are
possible, causing differences in decomposition products. Combined TG–FTIR and
TG–MS results showed that monomeric NH2BH2, borazine, diborane and hydrogen
were released. Although the amount of hydrogen released was independent of
heating rate with 1.1 moles of hydrogen released per mole of polyaminoborane, the
amount of monomeric NH2BH2 and borazine released increased with rising heating
rate. The release of 1.1 moles of hydrogen is consistent with the formation of a
second polymeric species, polyiminoborane, (NHBH)x.
1.7.4 As a hydrogen storage material
The potential of ammonia borane as a hydrogen storage material was first discussed
by Wolf et al.66 The high hydrogen content, 19.6 wt%, moderate temperatures of the
thermal decomposition process and the exothermic character of the decomposition
process were cited as the reasons for the compound‘s potential. However, ammonia
borane does not meet the previously discussed United States Department of Energy
targets for onboard hydrogen storage systems.67 Only 6.5 wt% of the compound‘s
CHAPTER 1. Introduction 40
hydrogen content can be released under isothermal conditions at temperatures
below 100°C and this release suffers from a long induction period. Furthermore, the
release of hydrogen occurs over a broad temperature range during temperature
ramping experiments and occurs over a long time period under isothermal conditions
below the operating system target temperature of 85°C. The two steps of hydrogen
release have also proved difficult to separate at faster ramp rates and higher
temperatures. The system also currently lacks reversibility, at least partly as a result
of the exothermic release: attempts to directly rehydrogenate the system have
proved unsuccessful.114 Finally, the hydrogen release is readily polluted with other
decomposition products, including monomeric ammonia borane, borazine and
diborane.67, 108 Borazine release during the decomposition of ammonia borane is so
prominent that it has been used as a method of producing borazine on a laboratory
preparation scale in high purity.115 The release of borazine and subsequent entry of
the gas into a fuel cell would poison the fuel cell and prevent it from working. For
these reasons, interest in the solid state storage of hydrogen in ammonia borane has
fallen off and interest has moved onto looking at how the system can be modified in
order to improve its hydrogen storage properties.
CHAPTER 1. Introduction 41
1.8 Aims
Ammonia borane has been identified as having a great deal of potential as a material
for hydrogen storage due to its high gravimetric hydrogen content. The interaction of
hydridic boron-bound and protic nitrogen-bound hydrogen favours hydrogen release
over other gases such as ammonia. The aim of the project was to investigate the
potential for improving the hydrogen storage properties of the ammonia borane
system through the introduction of metal cations. This was an area of hydrogen
storage that had not been investigated at the start of this project.
The reactions of ammonia borane with metal hydrides, namely lithium, sodium and
calcium hydrides were investigated. The interaction of lithium and sodium amides
with ammonia borane was also explored. The chief method employed to characterise
the reaction products was that of powder X-ray diffraction. In order to investigate the
hydrogen storage properties of the synthesised materials, thermal desorption
investigations were performed. Temperature programmed desorption experiments in
conjunction with mass spectrometry were carried out to obtain information about the
gases released during both synthesis and decomposition of the materials. Intelligent
gravimetric analysis and thermogravimetric analysis were employed to further
investigate the thermal decomposition properties of the synthesised materials by
monitoring the weight losses experienced during heating as well as recording the
gases released using a mass spectrometer. Reaction pathways were investigated
with respect to the changes in boron environments within the samples using solid
state 11B magic angle spinning nuclear magnetic resonance spectroscopy. This
method of analysis allowed information regarding amorphous reaction products to be
obtained. In the case of the sodium hydride and ammonia borane reaction, the
pathway was also investigated using solid state 23Na magic angle spinning nuclear
magnetic resonance spectroscopy. The final method of characterisation used to
investigate the products of the various reactions was that of Raman spectroscopy in
order to obtain information regarding the changes in bonds within the samples.
CHAPTER 1. Introduction 42
1.9 References
1. Züttel, A., Hydrogen storage methods. Naturwissenschaften 2004, 91, (4),
157–172.
2. Balat, M., Potential importance of hydrogen as a future solution to
environmental and transportation problems. International Journal of Hydrogen
Energy 2008, 33, 4013–4029.
3. Cherry, R. S., A hydrogen utopia? International Journal of Hydrogen Energy
2004, 29, 125–129.
4. Muradov, N. Z.; Veziroğlu, T. N., From hydrocarbon to hydrogen – carbon to
hydrogen economy. International Journal of Hydrogen Energy 2005, 30, 225–237.
5. Steinberg, M., Fossil fuel decarbonization technology for mitigating global
warming. International Journal of Hydrogen Energy 1999, 24, 771–777.
6. Kreuter, W.; Hofmann, H., Electrolysis: The important energy transformer in a
world of sustainable energy. International Journal of Hydrogen Energy 1998, 23, (8),
661–666.
7. Baykara, S. Z., Hydrogen production by direct solar thermal decomposition of
water, possibilities for improvement of process efficiency. International Journal of
Hydrogen Energy 2004, 29, 1451–1458.
8. Hawkes, F. R.; Dinsdale, R.; Hawkes, D. L.; Hussy, I., Sustainable
fermentative hydrogen production: challenges for process optimisation. International
Journal of Hydrogen Energy 2002, 27, 1339–1347.
9. Bossel, U., Well-to-wheel studies, heating values, and the energy
conservation principle. In European Fuel Cell Forum Technical Report E10, 2003.
10. Das, L. M., Hydrogen engines - A view of the past and a look into the future.
International Journal of Hydrogen Energy 1990, 15, 425–443.
11. Cheng, X.; Shi, Z.; Glass, N.; Zhang, L.; Zhang, J.; Song, D.; Liu, Z.-S.; Wang,
H.; Shen, J., A review of PEM hydrogen fuel cell contamination: Impacts,
mechanisms and mitigations. Journal of Power Sources 2007, 165, 739–756.
12. Grove, W. R., On voltaic series and the combination of gases by platinum.
Philosophical Magazine, Series 3 1839, 14, 127–130.
13. Halseid, R.; Vie, P. J. S.; R., T., Effect of ammonia on the performance of
polymer electrolyte membrane fuel cells. Journal of Power Sources 2006, 154, 343–
350.
14. Hammerschlag, R.; Mazza, P., Questioning hydrogen. Energy Policy 2005, 33,
2039–2043.
CHAPTER 1. Introduction 43
15. van Mierlo, J.; Maggetto, G.; Lataire, P., Which energy source for road
transport in the future? A comparison of battery, hybrid and fuel cell vehicles. Energy
Conversion and Management 2006, 47, 2748–2760.
16. Dunn, S., Hydrogen futures: Toward a sustainable energy system.
International Journal of Hydrogen Energy 2002, 27, 235–264.
17. Schlapbach, L.; Züttel, A., Hydrogen-storage materials for mobile applications.
Nature 2001, 414, 353–358.
18. Züttel, A., Materials for hydrogen storage. Materials Today 2003, 24–33.
19. Edwards, P. P.; Kuznetsov, V. L.; David, W. I. F., Hydrogen energy.
Philosophical Transactions of the Royal Society A 2007, 365, 1043–1056.
20. Aceves, S. M.; Berry, G. D.; Martinez-Frias, J.; Espinosa-Loza, F., Vehicular
storage of hydrogen in insulated pressure vessels. International Journal of Hydrogen
Energy 2006, 31, 2274–2283.
21. Zhou, L., Progress and problems in hydrogen storage methods. Renewable
and Sustainable Energy Reviews 2005, 9, 395–408.
22. Langmi, H. W.; Book, D.; Walton, A.; Johnson, S. R.; Al-Mamouria, M. M.;
Speight, J. D.; Edwards, P. P.; Harris, I. R.; Anderson, P. A., Hydrogen storage in
ion-exchanged zeolites. Journal of Alloys and Compounds 2005, 404, 637–642.
23. Züttel, A.; Sudan, P.; Mauron, P.; Kiyobayashi, T.; Emmenegger, C.;
Schlapbach, L., Hydrogen storage in carbon nanostructures. International Journal of
Hydrogen Energy 2002, 27, 203–212.
24. Lin, X.; Jia, J.; Zhao, X.; Thomas, K. M.; Blake, A. J.; Walker, G. S.;
Champness, N. R.; Hubberstey, P.; Schroder, M., High H2 adsorption by
coordination-framework materials. Angewandte Chemie International Edition 2006,
45, 7358–7364.
25. Budd, P. M.; Butler, A.; Selbie, J.; Mahmood, K.; McKeown, N. B.; Ghanem,
B.; Msayib, K.; Book, D.; Walton, A., The potential of organic polymer-based
hydrogen storage materials. Physical Chemistry Chemical Physics 2007, 9, 1802–
1808.
26. Yang, Z.; Xia, Y.; Mokaya, R., Enhanced hydrogen storage capacity of high
surface area zeolite-like carbon materials. Journal of the American Chemical Society
2007, 129, 1673–1679.
27. Langmi, H. W.; Walton, A.; Al-Mamouria, M. M.; Johnson, S. R.; Book, D.;
Speight, J. D.; Edwards, P. P.; Gameson, I.; Anderson, P. A.; Harris, I. R., Hydrogen
adsorption in zeolites A, X, Y and RHO. Journal of Alloys and Compounds 2003, 356,
710–715.
CHAPTER 1. Introduction 44
28. McKeown, N. B.; Budd, P. M., Polymers of intrinsic microporosity (PIMs):
Organic materials for membrane separations, heterogeneous catalysis and hydrogen
storage Chemical Society Reviews 2006, 35, 675–683.
29. van den Berg, A. W. C.; Arean, C. O., Materials for hydrogen storage: current
research trends and perspectives. Chemical Communications 2008, 6, 668–681.
30. Bogdanovic, B.; Bohmhammel, K.; Christ, B.; Reiser, A.; Schlichte, K.; Vehlen,
R.; Wolf, U., Thermodynamic investigation of the magnesium–hydrogen system.
Journal of Alloys and Compounds 1999, 282, 84–92.
31. Reilly, J. J.; Wiswall, R. H., Reaction of hydrogen with alloys magnesium and
nickel and formation of Mg2NiH4. Inorganic Chemistry 1968, 7, 2254–2256.
32. Spassov, T.; Solsona, P.; Bliznakov, S.; Surinac, S.; Baro, M. D., Synthesis
and hydrogen sorption properties of nanocrystalline Mg1.9M0.1Ni (M = Ti, Zr, V)
obtained by mechanical alloying. Journal of Alloys and Compounds 2003, 356, 639–
643.
33. Yvon, K., Complex transition metal hydrides. Chimia 1998, 52, 613–619.
34. Orimo, S.; Nakamori, Y.; Eliseo, J. R.; Züttel, A.; Jensen, C. M., Complex
hydrides for hydrogen storage. Chemical Reviews 2007, 107, 4111–4132.
35. Bogdanovic, B.; Brand, R. A.; Marjanovic, A.; Schwickardi, M., Metal-doped
sodium aluminium hydrides as potential new hydrogen storage materials. Journal of
Alloys and Compounds 2000, 302, 36–58.
36. Bogdanovic, B.; Schwickardi, M., Ti-doped alkali metal aluminium hydrides as
potential novel reversible hydrogen storage materials Journal of Alloys and
Compounds 1997, 253, 1–9.
37. Schlesinger, H. I.; Brown, H. C., Metal borohydrides III. Lithium borohydride.
Journal of the American Chemical Society 1940, 62, 3429–3435.
38. Schlesinger, H. I.; Brown, H. C.; Hoekstra, H. R.; Rapp, L. R., Reactions of
diborane with alkali metal hydrides and their addition compounds: New syntheses of
borohydrides: Sodium and potassium borohydrides. Journal of the American
Chemical Society 1953, 75, 199–204.
39. Züttel, A.; Wenger, P.; Rentsch, S.; Sudan, P.; Mauron, P.; Emmenegger, C.,
LiBH4 a new hydrogen storage material. Journal of Power Sources 2003, 118, 1–7.
40. Urgnani, J.; Torres, F. J.; Palumbo, M.; Baricco, M., Hydrogen release from
solid state NaBH4. International Journal of Hydrogen Energy 2008, 33, 3111–3115.
41. Orimo, S.; Nakamori, Y.; Kitahara, G.; Miwa, K.; Ohba, N.; Towata, S.; Züttel,
A., Dehydriding and rehydriding reactions of LiBH4. Journal of Alloys and Compounds
2005, 404–406, 427–430.
CHAPTER 1. Introduction 45
42. Mauron, P.; Buchter, F.; Friedrics, O.; Remhof, A.; Bielmann, M.; Zwicky, C.
N.; Züttel, A., Stability and reversibility of LiBH4. Journal of Physical Chemistry B
2008, 112, 906–910.
43. Vajo, J. J.; Skeith, S. L., Reversible storage of hydrogen in destabilized LiBH4.
Journal of Physical Chemistry B 2005, 109, 3719–3722.
44. Barkhordarian, G.; Klassen, T.; Dornheima, M.; Bormann, R., Unexpected
kinetic effect of MgB2 in reactive hydride composites containing complex
borohydrides Journal of Alloys and Compounds 2007, 440, L18–L21.
45. Bergstrom, F. W.; Fernelius, W. C., The chemistry of the alkali amides.
Chemical Reviews 1933, 12, 43–179.
46. Juza, R.; Opp, K., Metallamide und metallnitride, 24. Mitteilung. Die
kristallstruktur des lithiumamides. Zeitschrift fur anorganische und allgemeine chemie
1951, 266, 313–324.
47. Chen, P.; Xiong, Z.; Luo, J.; Lin, J.; Tan, K. L., Interaction of hydrogen with
metal nitrides and imides. Nature 2002, 420, 302–304.
48. Chen, P.; Xiong, Z.; Luo, J.; Lin, J.; Tan, K. L., Interaction between lithium
amide and lithium hydride. Journal of Physical Chemistry B 2003, 107, 10967–10970.
49. Ichikawa, T.; Isobe, S.; Hanada, N.; Fujii, H., Lithium nitride for reversible
hydrogen storage. Journal of Alloys and Compounds 2004, 365, 271–276.
50. Ichikawa, T.; Hanada, N.; Isobe, S.; Leng, H.; Fujii, H., Mechanism of novel
reaction from LiNH2 and LiH to Li2NH and H2 as a promising hydrogen storage
system. Journal of Physical Chemistry B 2004, 108, 7887–7892.
51. David, W. I. F.; Jones, M. O.; Gregory, D. H.; Jewell, C. M.; Johnson, S. R.;
Walton, A.; Edwards, P. P., A mechanism for non-stoichiometry in the lithium
amide/lithium imide hydrogen storage reaction. Journal of the American Chemical
Society 2007, 129, 1594–1601.
52. Nakamori, Y.; Kitahara, G.; Orimo, S., Synthesis and dehydriding studies of
Mg-N-H systems. Journal of Power Sources 2004, 138, 309–312.
53. Hu, Y. H.; Ruckenstein, E., Ultrafast reaction between LiH and NH3 during H2
storage in Li3N. Journal of Physical Chemistry A 2003, 107, 9737–9739.
54. Xiong, Z.; Wu, G.; Hu, J.; Chen, P., Ternary imides for hydrogen storage.
Advanced Materials 2004, 16, 1522–1525.
55. Chen, Y.; Cheng-Zhang, W.; Wang, P.; Cheng, H., Structure and hydrogen
storage property of ball milled LiNH2/MgH2 mixture. International Journal of Hydrogen
Energy 2006, 31, 1236–1240.

CHAPTER 1. Introduction 46
56. Rijssenbeek, J.; Gao, Y.; Hanson, J.; Huang, Q.; Jones, C.; Toby, B., Crystal
structure determination and reaction pathway of amide-hydride mixtures. Journal of
Alloys and Compounds 2008, 454, 233–244.
57. Wu, G.; Xiong, Z.; Liu, T.; Liu, Y.; Hu, J.; Chen, P.; Feng, Y.; Wee, A. T. S.,
Synthesis and characterization of a new ternary imide Li2Ca(NH)2. Inorganic
Chemistry 2007, 46, 517–521.
58. Tokoyoda, K.; Hino, S.; Ichikawa, T.; Okamotoa, K.; Fujii, H., Hydrogen
desorption/absorption properties of Li–Ca–N–H system. Journal of Alloys and
Compounds 2007, 439, 337–341.
59. Chater, P. A.; David, W. I. F.; Johnson, S. R.; Edwards, P. P.; Anderson, P. A.,
Synthesis and crystal structure of Li4BH4(NH2)3. Chemical Communications 2006,
2439–2441.
60. Meisner, G. P.; Scullin, M. L.; Balogh, M. P.; Pinkerton, F. E.; Meyer, M. S.,
Hydrogen release from mixtures of lithium borohydride and lithium amide: A phase
diagram study. Journal of Physical Chemistry B 2006, 110, 4186–4192.
61. Chater, P. A.; David, W. I. F.; Anderson, P. A., Synthesis and structure of the
new complex hydride Li2BH4NH2. Chemical Communications 2007, 45, 4770–4772.
62. Chater, P. A.; Anderson, P. A.; Prendergast, J. W.; Walton, A.; Mann, V. S. J.;
Book, D.; David, W. I. F.; Johnson, S. R.; Edwards, P. P., Synthesis and
characterisation of amide-borohydrides: New complex light hydrides for potential
hydrogen storage. Journal of Alloys and Compounds 2007, 446–447, 350–354.
63. Pinkerton, F. E.; Meisner, G. P.; Meyer, M. S.; Balogh, M. P.; Kundrat, M. D.,
Hydrogen desorption exceeding ten weight percent from the quaternary hydride
Li3BN2H8. Journal of Physical Chemistry B 2005, 109, 6–8.
64. United States Department of Energy; Targets for onboard hydrogen storage
systems for light-duty vehicles. Office of Energy Efficiency and Renewable Energy
and the FreedomCAR and Fuel Partnership technical report 2009.
65. Grochala, W.; Edwards, P. P., Thermal decomposition of the non-interstitial
hydrides for the storage and production of hydrogen. Chemical Reviews 2004, 104,
1283–1315.
66. Wolf, G.; Baumann, J.; Baitalow, F.; Hoffmann, F. P., Calorimetric process
monitoring of thermal decomposition of B–N–H compounds. Thermochimica Acta
2000, 343, 19–25.
67. Baumann, J.; Baitalow, F.; Wolf, G., Thermal decomposition of polymeric
aminoborane (H2BNH2)x under hydrogen release. Thermochimica Acta 2005, 430, 9–
14.
CHAPTER 1. Introduction 47
68. Shore, S. G.; Parry, R. W., The crystalline compound ammonia borane,
H3NBH3. Journal of the American Chemical Society 1955, 77, 6084-6085.
69. Burg, A. B.; Schlesinger, H. I., Hydrides of boron. VII. Evidence of the
transitory existence of borine (BH3): Borine carbonyl and borine trimethylammine.
Journal of the American Chemical Society 1937, 59, 780–787.
70. Stock, A.; Pohland, E., Ber. Dtsch. Chem. Ges. 1925, 58, 657.
71. Schlesinger, H. I.; Burg, A. B., Hydrides of boron. VIII. The structure of the
diammoniate of diborane and its relation to the structure of diborane. Journal of the
American Chemical Society 1938, 60, 290–299.
72. Schlesinger, H. I.; Sanderson, R. J.; Burg, A. B., Metal borohydrides I.
Aluminum borohydride. Journal of the American Chemical Society 1940, 62, 3421–
3425.
73. Burg, A. B.; Schlesinger, H. I., Metal borohydrides II. Beryllium borohydride.
Journal of the American Chemical Society 1940, 62, 3425–3429.
74. Burg, A. B., Proton-deuteron exchange between ammonia and ammoniated
diborane. Journal of the American Chemical Society 1947, 69, 747–750.
75. Schaeffer, G. W.; Adams, M. D.; Koenig, F. J., On the alkali metal salts
derived from the diammoniate of diborane. Journal of the American Chemical Society
1956, 78, 725–728.
76. Schultz, R. D.; Parry, R. W., Chemical evidence for the structure of the
"Diammoniate of Diborane." I. Evidence for the borohydride ion and for the dihydro-
diammine(III) cation. Journal of the American Chemical Society 1958, 80, 4–8.
77. Shore, S. G.; Girardot, P. R.; Parry, R. W., Chemical evidence for the structure
of the "Diammoniate of Diborane." V. A tracer study of the reaction between sodium
and the "Diammoniate of Diborane". Journal of the American Chemical Society 1958,
80, 20–24.
78. Parry, R. W.; Shore, S. G., Chemical evidence for the structure of the
"Diammoniate of Diborane." IV. The reaction of sodium with Lewis acids in liquid
ammonia. Journal of the American Chemical Society 1958, 80, 15–20.
79. Shore, S. G.; Parry, R. W., Chemical evidence for the structure of the
"Diammoniate of Diborane." III. The reactions of borohydride salts with lithium halides
and aluminum chloride. Journal of the American Chemical Society 1958, 80, 12–15.
80. Shore, S. G.; Parry, R. W., The crystalline compound ammonia-borane,
H3NBH3. Journal of the American Chemical Society 1955, 77, 6084–6085.
81. Hu, M. G.; van Paasschen, J. M.; Geanangel, R. A., New synthetic
approaches to ammonia-borane and its deuterated derivatives. Journal of Inorganic
and Nuclear Chemistry 1977, 39, 2147-2150.
CHAPTER 1. Introduction 48
82. Bowden, M. E.; Autrey, T.; Brown, I.; Ryan, M., The thermal decomposition of
ammonia borane: A potential hydrogen storage material. Current Applied Physics
2008, 8, 498–500.
83. Graham, K. R.; Kemmitt, T.; Bowden, M. E., High capacity hydrogen storage in
a hybrid ammonia borane-lithium amide material. Energy and Environmental Science
2009, 2, 706–710.
84. Kang, X.; Fang, Z.; Kong, L.; Cheng, H.; Yao, X.; Lu, G.; Wang, P., Ammonia
borane destabilized by lithium hydride: An advanced on-board hydrogen storage
material. Advanced Materials 2008, 20, 2756–2759.
85. Ramachandran, P.; Gagare, P. V., Preparation of ammonia borane in high
yield and purity, methanolysis and regeneration. Inorganic Chemistry 2007, 46,
7810–7817.
86. Xiong, Z.; Wu, G.; Chua, Y. S.; Hu, J.; He, T.; Xu, W.; Chen, P., Synthesis of
sodium amidoborane (NaNH2BH3) for hydrogen production. Energy and
Environmental Science 2008, 1, 360–363.
87. Spielmann, J.; Jansen, G.; Bandmann, H.; Harder, S., Calcium amidoborane
hydrogen storage materials: Crystal structures of decomposition products.
Angewandte Chemie-International Edition 2008, 47, 6290–6295.
88. Shore, S. G.; Boddeker, K. W., Large scale synthesis of H2B(NH3)2+BH4
− and
H3NBH3. Inorganic Chemistry 1964, 3, 914–915.
89. Mayer, E., Symmetrical cleavage of diborane by ammonia in solution.
Inorganic Chemistry 1972, 11, 866–869.
90. Shore, S. G.; Parry, R. W., The crystalline compound ammonia borane,
H3NBH3. Journal of the American Chemical Society 1955, 77, 6084–6085.
91. Hughes, E. W., The crystal structure of ammonia-borane, H3NBH3. Journal of
the American Chemical Society 1956, 76, 502–503.
92. Lippert, E. L.; Lipscomb, W. N., The structure of H3NBH3. Journal of the
American Chemical Society 1956, 78, 503–504.
93. Klooster, W. T.; Koetzle, T. F.; Siegbahn, P. E. M.; Richardson, T. B.;
Crabtree, R. H., Study of the N–H---H–B dihydrogen bond including the crystal
structure of BH3NH3 by neutron diffraction. Journal of the American Chemical Society
1999, 121, 6337–6343.
94. Hoon, C. F.; Reynhardt, E. C., Molecular dynamics and structures of amine
boranes of the type R3NBH3: I. X-ray investigation of H3NBH3 at 295 K and 110K.
Journal of Physics C: Solid State Physics 1983, 16, 6129–6136.
CHAPTER 1. Introduction 49
95. Reynhardt, E. C.; Hoon, C. F., Molecular dynamics and structures of amine
boranes of the type R3NBH3: II NMR investigation of H3NBH3. Journal of Physics C:
Solid State Physics 1983, 16, 6137–6152.
96. Bühl, M.; Steinke, T.; von Ragué Schleyer, P.; Boese, R., Solvation effects on
geometry and chemical shifts. An ab initio/IGLO reconciliation of apparent
experimental inconsistencies on H3BNH3. Angewandte Chemie-International Edition
1991, 30, 1160–1161.
97. Richardson, T. B.; de Gala, S.; Crabtree, R. H., Unconventional hydrogen
bonds: Intermolecular B-H---H-N interactions. Journal of the American Chemical
Society 1995, 117, 12875-12876.
98. Crabtree, R. H.; Siegbahn, P. E. M.; Eisenstein, O.; Rheingold, A. L.; Koetzle,
T. F., A new intermolecular interaction: Unconventional hydrogen bonds with
element-hydride bonds as proton acceptor. Accounts of Chemical Research 1996,
29, 348–354.
99. Penner, G. H.; Chang, Y. C. P.; Hutzal, J., A deuterium NMR spectroscopy
study of solid BH3NH3. Inorganic Chemistry 1999, 38, 2868–2873.
100. Bowden, M. E.; Gainsford, G. J.; Robinson, W. T., The room temperature
structure of ammonia borane. Australian Journal of Chemistry 2007, 60, 149–153.
101. Yang, J. B.; Lamsal, J.; Cai, Q.; James, W. J.; Yelon, W. B., Structural
evolution of ammonia borane for hydrogen storage. Applied Physics Letters 2008,
92, 091916–1–091916–3.
102. Shore, S. G.; Parry, R. W., Chemical evidence for the structure of the
"Diammoniate of Diborane." II. The preparation of ammonia borane. Journal of the
American Chemical Society 1958, 80, 8–12.
103. Hu, M. G.; Geanangel, R. A.; Wendlandt, W. W., The thermal decomposition
of ammonia borane. Thermochimica Acta 1978, 23, 249–255.
104. Böddeker, K. W.; Shore, S. G.; Bunting, R. K., Boron-nitrogen chemistry. I.
Synthesis and properties of new cycloborazanes, (BH2NH2)n. Journal of the American
Chemical Society 1966, 88, 4396–4401.
105. Komm, R.; Geanangel, R. A.; Liepins, R., Synthesis and studies of
poly(aminoborane), (H2NBH2)x. Inorganic Chemistry 1983, 22, 1684-1686.
106. Sit, V.; Geanangel, R. A.; Wendlandt, W. W., The thermal dissociation of
NH3BH3. Thermochimica Acta 1986, 113, 379-382.
107. Gerry, M. C. L.; Lewis-Bevan, W.; Merer, A. J.; Westwood, N. P. C., The
infrared spectrum of gaseous aminoborane, H2N=BH2: Location of the fundamentals
and rotational structure in the 410 Band (BN Stretching vibration at 1337 cm−1).
Journal of Molecular Spectroscopy 1985, 110, 153–163.
CHAPTER 1. Introduction 50
108. Baitalow, F.; Baumann, J.; Wolf, G.; Jaenicke-Rossler, K.; Leitner, G., Thermal
decomposition of B–N–H compounds investigated by using combined
thermoanalytical methods. Thermochimica Acta 2002, 391, 159-168.
109. Smith, R. S.; Kay, B. D.; Schmid, B.; Li, L.; Hess, N.; Gutowski, M.; Autrey, T.,
Mechanistic studies of hydrogen formation from amineborane complexes. Prep
Paper American Chemical Society Division of Fuel Chemistry 2005, 50, 112-113.
110. Stowe, A. C.; Shaw, W. J.; Linehan, J. C.; Schmid, B.; Autrey, T., In situ solid
state 11B MAS-NMR studies of the thermal decomposition of ammonia borane:
mechanistic studies of the hydrogen release pathways from a solid state hydrogen
storage material. Physical Chemistry Chemical Physics 2007, 9, 1831–1836.
111. Sana, M.; Leroy, G.; Wilante, C., Enthalpies of formation and bond energies in
lithium, beryllium and boron derivatives. 2. Dative, single and triple bonds.
Organometallics 1992, 11, 781–787.
112. Geanangel, R. A.; Wendlandt, W. W., A TG–DSC study of the thermal
dissociation of (NH2BH2)x. Thermochimica Acta 1985, 86, 375–378.
113. Baumann, J.; Baitalow, F.; Wolf, G., Thermal decomposition of polymeric
aminoborane (H2BNH2)x under hydrogen release. Thermochimica Acta 2005, 430, 9-
14.
114. Wang, S.; Mao, W. L.; Autrey, T., Bonding in boranes and their interaction with
molecular hydrogen at extreme conditions. Journal of Chemical Physics 2009, 131,
144508–1 – 144508–6.
115. Wideman, T.; Sneddon, L. G., Convenient procedures for the laboratory
preparation of borazine. Inorganic Chemistry 1995, 34, 1002–1003.
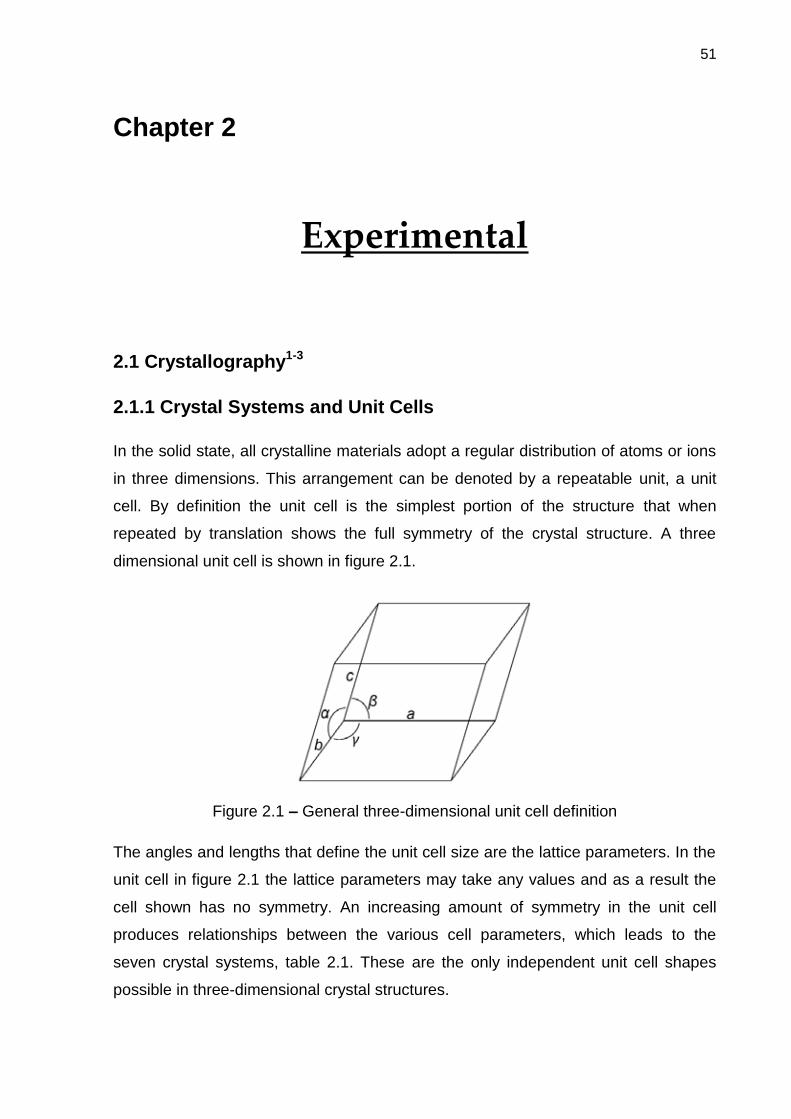
51
Chapter 2
Experimental
2.1 Crystallography1-3
2.1.1 Crystal Systems and Unit Cells
In the solid state, all crystalline materials adopt a regular distribution of atoms or ions
in three dimensions. This arrangement can be denoted by a repeatable unit, a unit
cell. By definition the unit cell is the simplest portion of the structure that when
repeated by translation shows the full symmetry of the crystal structure. A three
dimensional unit cell is shown in figure 2.1.
Figure 2.1 – General three-dimensional unit cell definition
The angles and lengths that define the unit cell size are the lattice parameters. In the
unit cell in figure 2.1 the lattice parameters may take any values and as a result the
cell shown has no symmetry. An increasing amount of symmetry in the unit cell
produces relationships between the various cell parameters, which leads to the
seven crystal systems, table 2.1. These are the only independent unit cell shapes
possible in three-dimensional crystal structures.
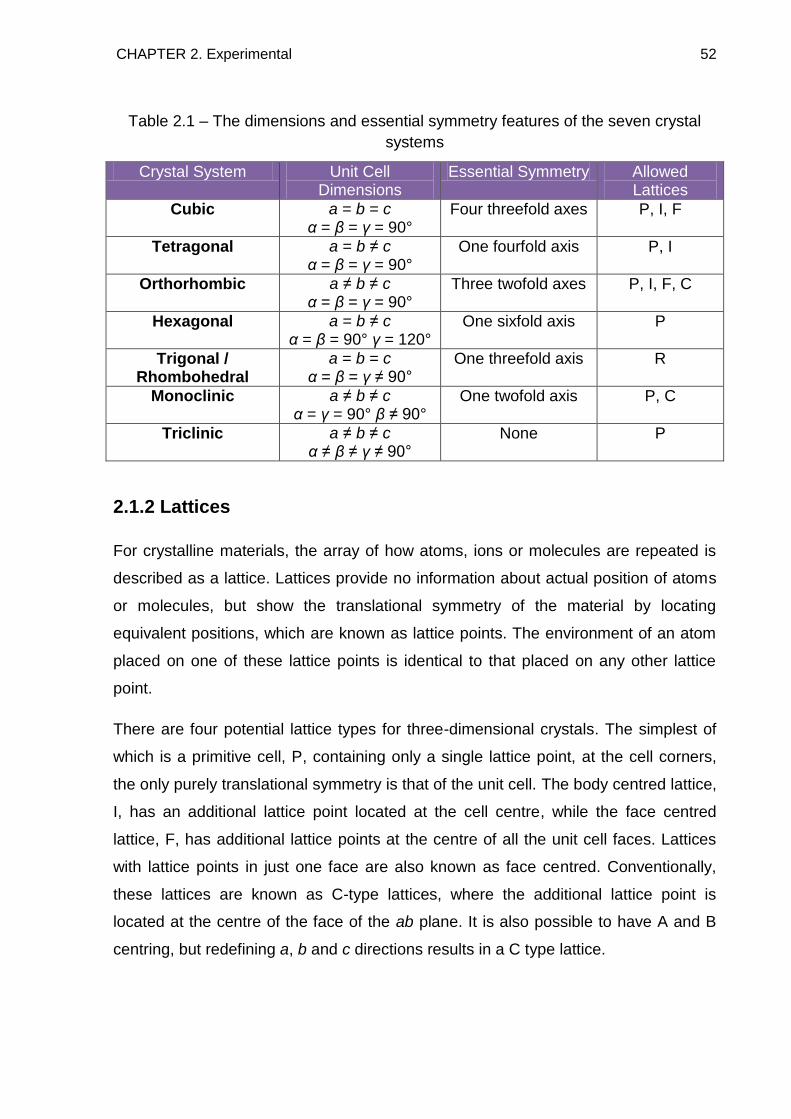
CHAPTER 2. Experimental 52
Table 2.1 – The dimensions and essential symmetry features of the seven crystal
systems
Crystal System Unit Cell Dimensions
Essential Symmetry Allowed Lattices
Cubic a = b = c α = β = γ = 90°
Four threefold axes P, I, F
Tetragonal a = b ≠ c α = β = γ = 90°
One fourfold axis P, I
Orthorhombic a ≠ b ≠ c α = β = γ = 90°
Three twofold axes P, I, F, C
Hexagonal a = b ≠ c α = β = 90° γ = 120°
One sixfold axis P
Trigonal / Rhombohedral
a = b = c α = β = γ ≠ 90°
One threefold axis R
Monoclinic a ≠ b ≠ c α = γ = 90° β ≠ 90°
One twofold axis P, C
Triclinic a ≠ b ≠ c α ≠ β ≠ γ ≠ 90°
None
P
2.1.2 Lattices
For crystalline materials, the array of how atoms, ions or molecules are repeated is
described as a lattice. Lattices provide no information about actual position of atoms
or molecules, but show the translational symmetry of the material by locating
equivalent positions, which are known as lattice points. The environment of an atom
placed on one of these lattice points is identical to that placed on any other lattice
point.
There are four potential lattice types for three-dimensional crystals. The simplest of
which is a primitive cell, P, containing only a single lattice point, at the cell corners,
the only purely translational symmetry is that of the unit cell. The body centred lattice,
I, has an additional lattice point located at the cell centre, while the face centred
lattice, F, has additional lattice points at the centre of all the unit cell faces. Lattices
with lattice points in just one face are also known as face centred. Conventionally,
these lattices are known as C-type lattices, where the additional lattice point is
located at the centre of the face of the ab plane. It is also possible to have A and B
centring, but redefining a, b and c directions results in a C type lattice.
CHAPTER 2. Experimental 53
The combination of the seven crystal classes with the four lattice types gives rise to
14 possible combinations, which are known as Bravais lattices, table 2.1.
2.1.3 Lattice Planes and Miller Indices
Lattice points which form a repeatable array in 3D can be connected by lattice
planes. Each plane is part of a parallel set of equally spaced planes and each lattice
point must lie on one of the lattice planes. These imaginary planes extend throughout
the complete crystal structure, intersecting the unit cell at specific points, which are
described by Miller indices. In a 3D structure three indices are required and are
labelled h, k and l, which take values that are either positive or negative integers or
zero. For a given set of planes the values of h, k and l are given by the reciprocal of
the fractional intercepts along each of the cell directions. Where planes are parallel to
one of the unit cell directions, the intercept is at infinity and therefore the Miller index
for the axis is 1/∞= 0. Some examples of lattice planes and their Miller indices are
shown in figure 2.2. The separation between equivalent planes is known as the d-
spacing, dhkl, which is also the perpendicular distance from the origin to the nearest
plane. The relationship between the d-spacing and the lattice parameters can be
determined geometrically, but is dependent on the crystal system. For a cubic system
it can be calculated using the following equation:
Equation 2.1
Figure 2.2 – Examples of lattice planes and their Miller indices
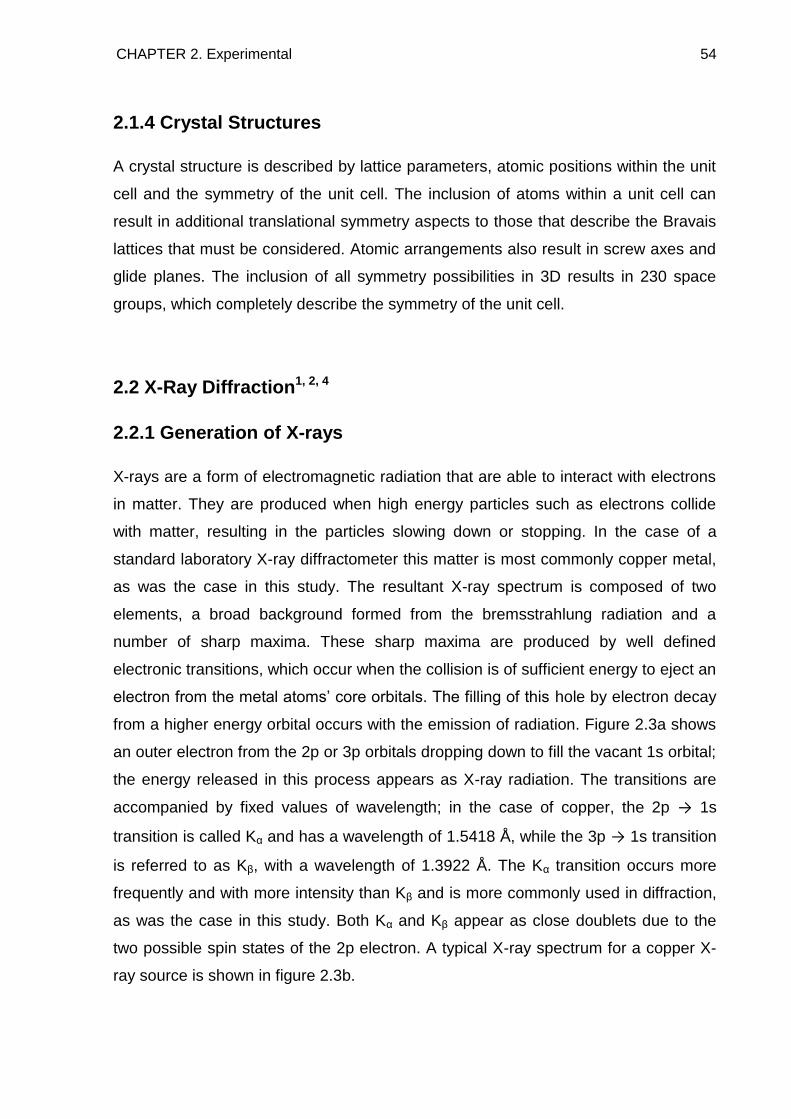
CHAPTER 2. Experimental 54
2.1.4 Crystal Structures
A crystal structure is described by lattice parameters, atomic positions within the unit
cell and the symmetry of the unit cell. The inclusion of atoms within a unit cell can
result in additional translational symmetry aspects to those that describe the Bravais
lattices that must be considered. Atomic arrangements also result in screw axes and
glide planes. The inclusion of all symmetry possibilities in 3D results in 230 space
groups, which completely describe the symmetry of the unit cell.
2.2 X-Ray Diffraction1, 2, 4
2.2.1 Generation of X-rays
X-rays are a form of electromagnetic radiation that are able to interact with electrons
in matter. They are produced when high energy particles such as electrons collide
with matter, resulting in the particles slowing down or stopping. In the case of a
standard laboratory X-ray diffractometer this matter is most commonly copper metal,
as was the case in this study. The resultant X-ray spectrum is composed of two
elements, a broad background formed from the bremsstrahlung radiation and a
number of sharp maxima. These sharp maxima are produced by well defined
electronic transitions, which occur when the collision is of sufficient energy to eject an
electron from the metal atoms‘ core orbitals. The filling of this hole by electron decay
from a higher energy orbital occurs with the emission of radiation. Figure 2.3a shows
an outer electron from the 2p or 3p orbitals dropping down to fill the vacant 1s orbital;
the energy released in this process appears as X-ray radiation. The transitions are
accompanied by fixed values of wavelength; in the case of copper, the 2p → 1s
transition is called Kα and has a wavelength of 1.5418 Å, while the 3p → 1s transition
is referred to as Kβ, with a wavelength of 1.3922 Å. The Kα transition occurs more
frequently and with more intensity than Kβ and is more commonly used in diffraction,
as was the case in this study. Both Kα and Kβ appear as close doublets due to the
two possible spin states of the 2p electron. A typical X-ray spectrum for a copper X-
ray source is shown in figure 2.3b.
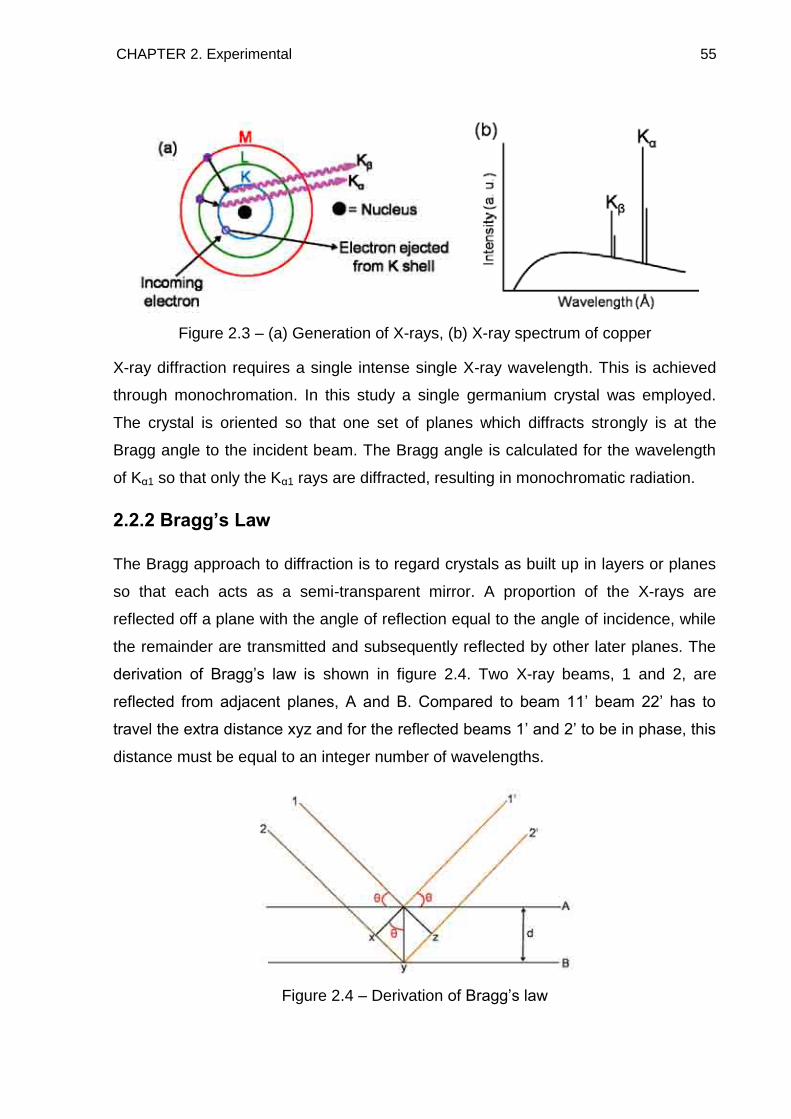
CHAPTER 2. Experimental 55
Figure 2.3 – (a) Generation of X-rays, (b) X-ray spectrum of copper
X-ray diffraction requires a single intense single X-ray wavelength. This is achieved
through monochromation. In this study a single germanium crystal was employed.
The crystal is oriented so that one set of planes which diffracts strongly is at the
Bragg angle to the incident beam. The Bragg angle is calculated for the wavelength
of Kα1 so that only the Kα1 rays are diffracted, resulting in monochromatic radiation.
2.2.2 Bragg’s Law
The Bragg approach to diffraction is to regard crystals as built up in layers or planes
so that each acts as a semi-transparent mirror. A proportion of the X-rays are
reflected off a plane with the angle of reflection equal to the angle of incidence, while
the remainder are transmitted and subsequently reflected by other later planes. The
derivation of Bragg‘s law is shown in figure 2.4. Two X-ray beams, 1 and 2, are
reflected from adjacent planes, A and B. Compared to beam 11‘ beam 22‘ has to
travel the extra distance xyz and for the reflected beams 1‘ and 2‘ to be in phase, this
distance must be equal to an integer number of wavelengths.
Figure 2.4 – Derivation of Bragg‘s law
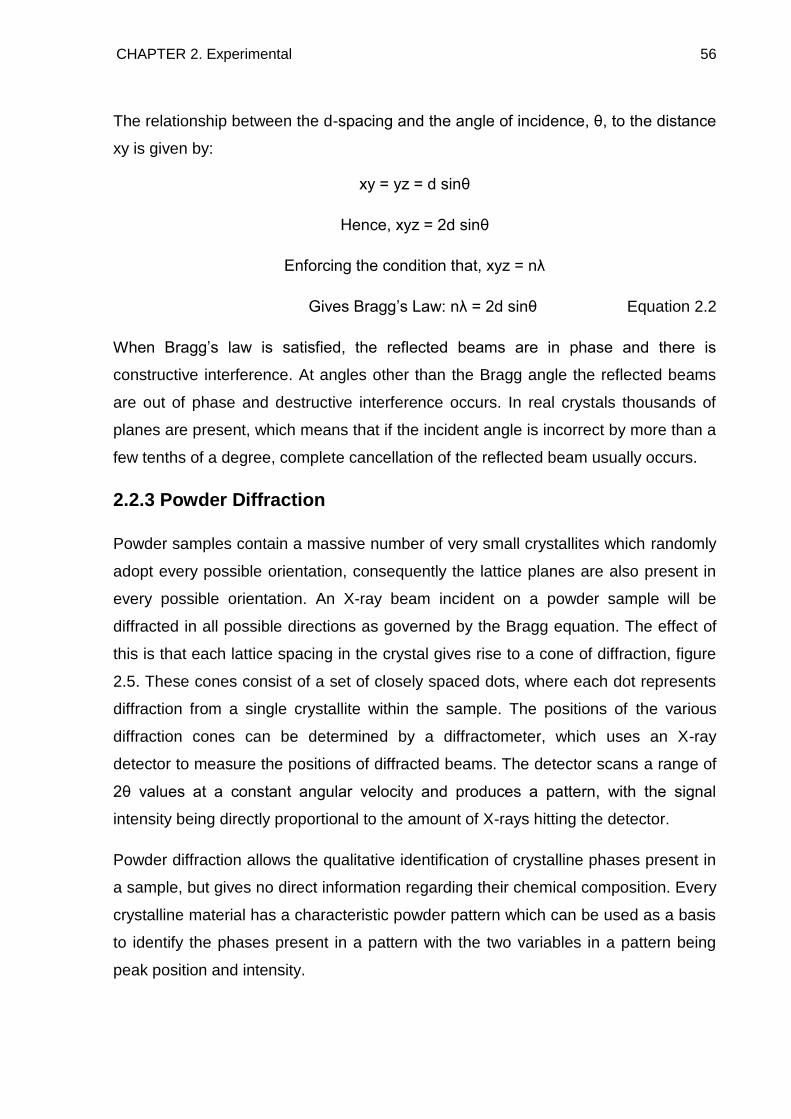
CHAPTER 2. Experimental 56
The relationship between the d-spacing and the angle of incidence, θ, to the distance
xy is given by:
xy = yz = d sinθ
Hence, xyz = 2d sinθ
Enforcing the condition that, xyz = nλ
Gives Bragg‘s Law: nλ = 2d sinθ Equation 2.2
When Bragg‘s law is satisfied, the reflected beams are in phase and there is
constructive interference. At angles other than the Bragg angle the reflected beams
are out of phase and destructive interference occurs. In real crystals thousands of
planes are present, which means that if the incident angle is incorrect by more than a
few tenths of a degree, complete cancellation of the reflected beam usually occurs.
2.2.3 Powder Diffraction
Powder samples contain a massive number of very small crystallites which randomly
adopt every possible orientation, consequently the lattice planes are also present in
every possible orientation. An X-ray beam incident on a powder sample will be
diffracted in all possible directions as governed by the Bragg equation. The effect of
this is that each lattice spacing in the crystal gives rise to a cone of diffraction, figure
2.5. These cones consist of a set of closely spaced dots, where each dot represents
diffraction from a single crystallite within the sample. The positions of the various
diffraction cones can be determined by a diffractometer, which uses an X-ray
detector to measure the positions of diffracted beams. The detector scans a range of
2θ values at a constant angular velocity and produces a pattern, with the signal
intensity being directly proportional to the amount of X-rays hitting the detector.
Powder diffraction allows the qualitative identification of crystalline phases present in
a sample, but gives no direct information regarding their chemical composition. Every
crystalline material has a characteristic powder pattern which can be used as a basis
to identify the phases present in a pattern with the two variables in a pattern being
peak position and intensity.
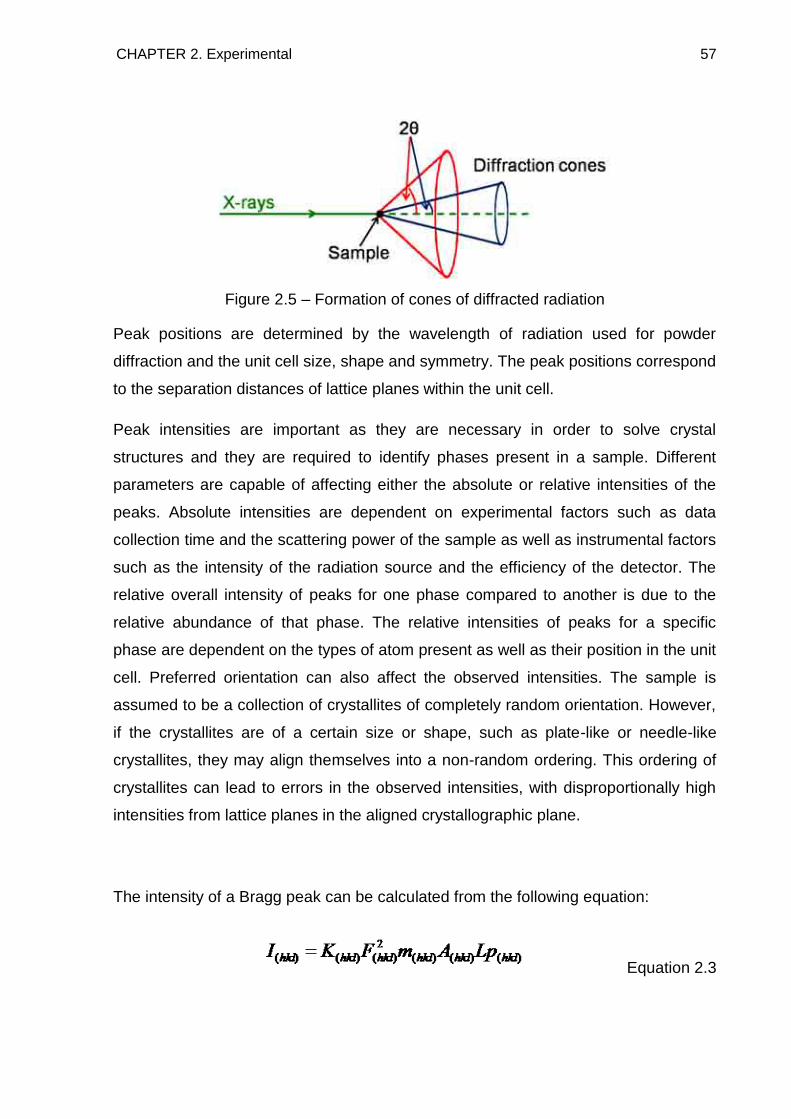
CHAPTER 2. Experimental 57
Figure 2.5 – Formation of cones of diffracted radiation
Peak positions are determined by the wavelength of radiation used for powder
diffraction and the unit cell size, shape and symmetry. The peak positions correspond
to the separation distances of lattice planes within the unit cell.
Peak intensities are important as they are necessary in order to solve crystal
structures and they are required to identify phases present in a sample. Different
parameters are capable of affecting either the absolute or relative intensities of the
peaks. Absolute intensities are dependent on experimental factors such as data
collection time and the scattering power of the sample as well as instrumental factors
such as the intensity of the radiation source and the efficiency of the detector. The
relative overall intensity of peaks for one phase compared to another is due to the
relative abundance of that phase. The relative intensities of peaks for a specific
phase are dependent on the types of atom present as well as their position in the unit
cell. Preferred orientation can also affect the observed intensities. The sample is
assumed to be a collection of crystallites of completely random orientation. However,
if the crystallites are of a certain size or shape, such as plate-like or needle-like
crystallites, they may align themselves into a non-random ordering. This ordering of
crystallites can lead to errors in the observed intensities, with disproportionally high
intensities from lattice planes in the aligned crystallographic plane.
The intensity of a Bragg peak can be calculated from the following equation:
Equation 2.3
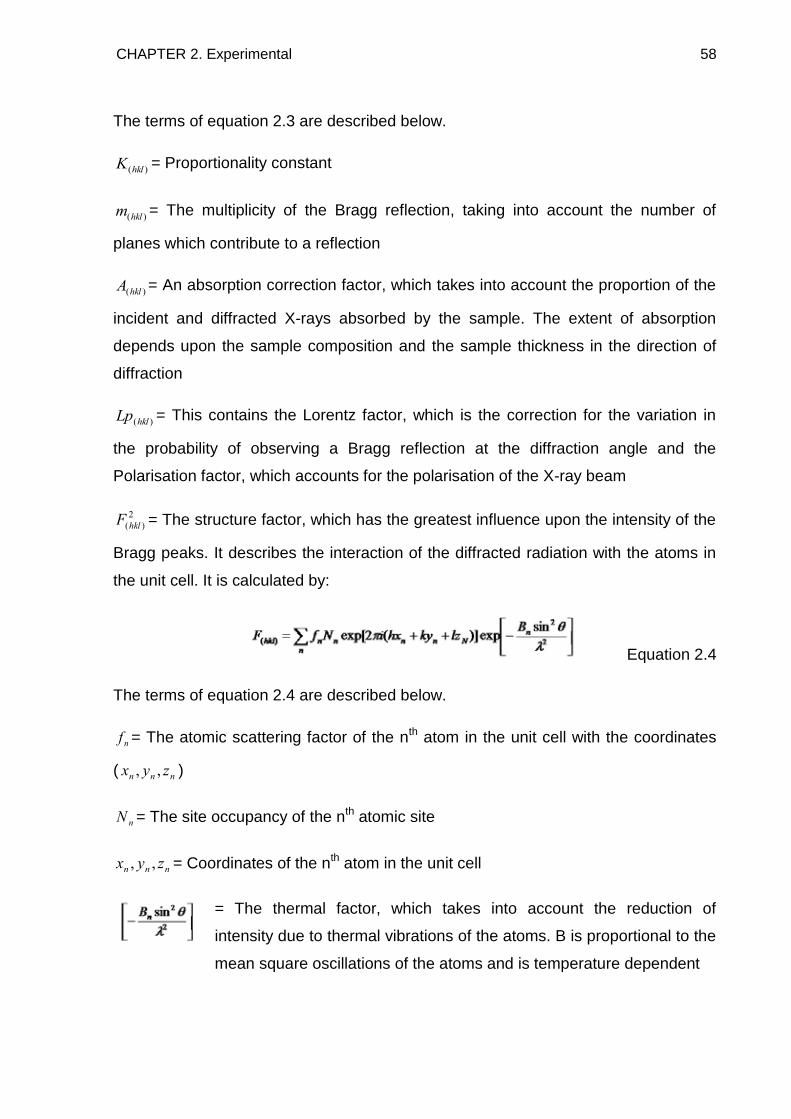
CHAPTER 2. Experimental 58
The terms of equation 2.3 are described below.
)(hklK = Proportionality constant
)(hklm = The multiplicity of the Bragg reflection, taking into account the number of
planes which contribute to a reflection
)(hklA = An absorption correction factor, which takes into account the proportion of the
incident and diffracted X-rays absorbed by the sample. The extent of absorption
depends upon the sample composition and the sample thickness in the direction of
diffraction
)(hklLp = This contains the Lorentz factor, which is the correction for the variation in
the probability of observing a Bragg reflection at the diffraction angle and the
Polarisation factor, which accounts for the polarisation of the X-ray beam
2
)(hklF = The structure factor, which has the greatest influence upon the intensity of the
Bragg peaks. It describes the interaction of the diffracted radiation with the atoms in
the unit cell. It is calculated by:
Equation 2.4
The terms of equation 2.4 are described below.
nf = The atomic scattering factor of the nth atom in the unit cell with the coordinates
( nnn zyx ,, )
nN = The site occupancy of the nth atomic site
nnn zyx ,, = Coordinates of the nth atom in the unit cell
= The thermal factor, which takes into account the reduction of
intensity due to thermal vibrations of the atoms. B is proportional to the
mean square oscillations of the atoms and is temperature dependent
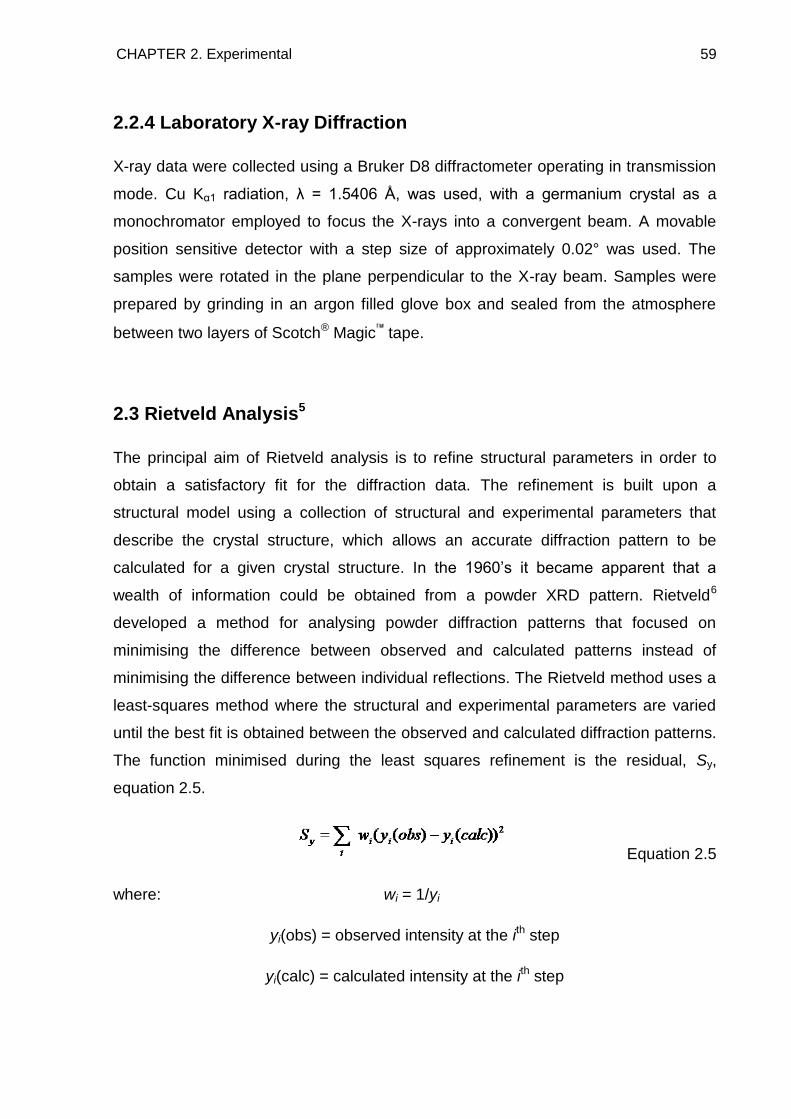
CHAPTER 2. Experimental 59
2.2.4 Laboratory X-ray Diffraction
X-ray data were collected using a Bruker D8 diffractometer operating in transmission
mode. Cu Kα1 radiation, λ = 1.5406 Å, was used, with a germanium crystal as a
monochromator employed to focus the X-rays into a convergent beam. A movable
position sensitive detector with a step size of approximately 0.02° was used. The
samples were rotated in the plane perpendicular to the X-ray beam. Samples were
prepared by grinding in an argon filled glove box and sealed from the atmosphere
between two layers of Scotch® Magic tape.
2.3 Rietveld Analysis5
The principal aim of Rietveld analysis is to refine structural parameters in order to
obtain a satisfactory fit for the diffraction data. The refinement is built upon a
structural model using a collection of structural and experimental parameters that
describe the crystal structure, which allows an accurate diffraction pattern to be
calculated for a given crystal structure. In the 1960‘s it became apparent that a
wealth of information could be obtained from a powder XRD pattern. Rietveld6
developed a method for analysing powder diffraction patterns that focused on
minimising the difference between observed and calculated patterns instead of
minimising the difference between individual reflections. The Rietveld method uses a
least-squares method where the structural and experimental parameters are varied
until the best fit is obtained between the observed and calculated diffraction patterns.
The function minimised during the least squares refinement is the residual, Sy,
equation 2.5.
Equation 2.5
where: wi = 1/yi
yi(obs) = observed intensity at the ith step
yi(calc) = calculated intensity at the ith step
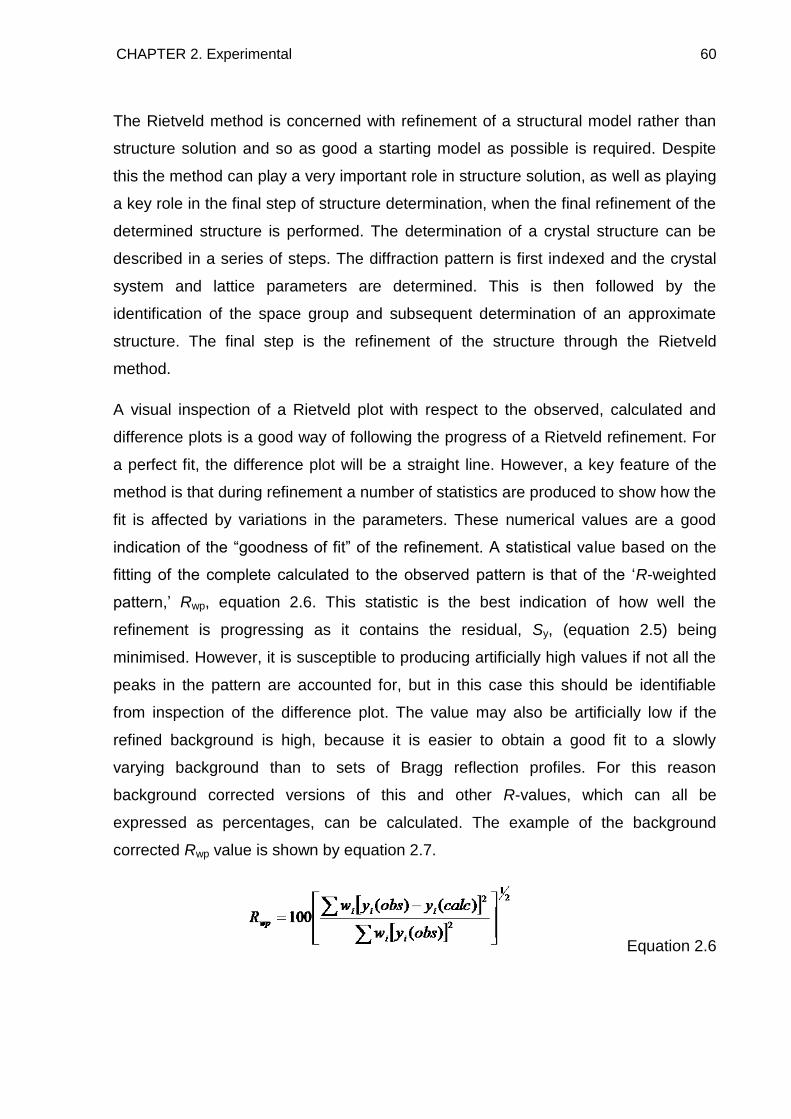
CHAPTER 2. Experimental 60
The Rietveld method is concerned with refinement of a structural model rather than
structure solution and so as good a starting model as possible is required. Despite
this the method can play a very important role in structure solution, as well as playing
a key role in the final step of structure determination, when the final refinement of the
determined structure is performed. The determination of a crystal structure can be
described in a series of steps. The diffraction pattern is first indexed and the crystal
system and lattice parameters are determined. This is then followed by the
identification of the space group and subsequent determination of an approximate
structure. The final step is the refinement of the structure through the Rietveld
method.
A visual inspection of a Rietveld plot with respect to the observed, calculated and
difference plots is a good way of following the progress of a Rietveld refinement. For
a perfect fit, the difference plot will be a straight line. However, a key feature of the
method is that during refinement a number of statistics are produced to show how the
fit is affected by variations in the parameters. These numerical values are a good
indication of the ―goodness of fit‖ of the refinement. A statistical value based on the
fitting of the complete calculated to the observed pattern is that of the ‗R-weighted
pattern,‘ Rwp, equation 2.6. This statistic is the best indication of how well the
refinement is progressing as it contains the residual, Sy, (equation 2.5) being
minimised. However, it is susceptible to producing artificially high values if not all the
peaks in the pattern are accounted for, but in this case this should be identifiable
from inspection of the difference plot. The value may also be artificially low if the
refined background is high, because it is easier to obtain a good fit to a slowly
varying background than to sets of Bragg reflection profiles. For this reason
background corrected versions of this and other R-values, which can all be
expressed as percentages, can be calculated. The example of the background
corrected Rwp value is shown by equation 2.7.
Equation 2.6
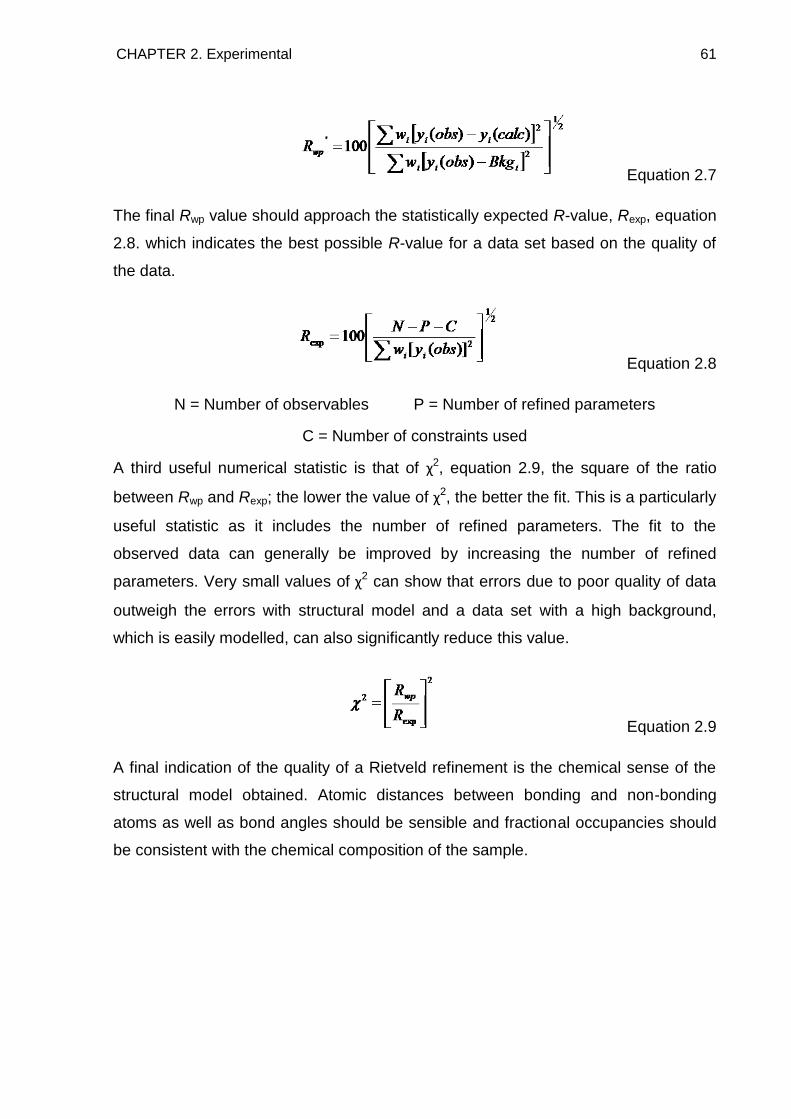
CHAPTER 2. Experimental 61
Equation 2.7
The final Rwp value should approach the statistically expected R-value, Rexp, equation
2.8. which indicates the best possible R-value for a data set based on the quality of
the data.
Equation 2.8
N = Number of observables P = Number of refined parameters
C = Number of constraints used
A third useful numerical statistic is that of χ2, equation 2.9, the square of the ratio
between Rwp and Rexp; the lower the value of χ2, the better the fit. This is a particularly
useful statistic as it includes the number of refined parameters. The fit to the
observed data can generally be improved by increasing the number of refined
parameters. Very small values of χ2 can show that errors due to poor quality of data
outweigh the errors with structural model and a data set with a high background,
which is easily modelled, can also significantly reduce this value.
Equation 2.9
A final indication of the quality of a Rietveld refinement is the chemical sense of the
structural model obtained. Atomic distances between bonding and non-bonding
atoms as well as bond angles should be sensible and fractional occupancies should
be consistent with the chemical composition of the sample.

CHAPTER 2. Experimental 62
2.4 Mass Spectrometry7, 8
Mass spectrometry is defined as the study of systems that causes the formation of
gaseous ions which are subsequently characterised by their mass to charge ratios
(m/z) and relative abundances. Selected m/z ratios can be analysed in order to
determine their amount in a given sample. Mass spectrometry involves three main
processes: ionisation, separation and detection.
Ionisation
Ionisation is the process that creates charged species by the removal or addition of
an electron or proton. There are a number of ionisation techniques that can be used
in mass spectrometry including chemical ionisation, electrospray ionisation and fast
atom bombardment. However, the most common form of ionisation for gaseous
analytes is that of electron impact. This was the only form of ionisation used in this
study.
Electron impact uses a tungsten filament to generate a beam of electrons which is
then accelerated in order to knock out an electron from neutral molecules to produce
singly charged cations. Single ionisation can be promoted and multiple ionisation
avoided by tuning the energy of the electron beam. This is favourable as multiple
ionisation will affect the m/z values of the ions under analysis.
Ionisation can also result in fragmentation of ionic species. Excess energy from the
ionisation process may be sufficient to result in the fragmentation of the ionic species
into smaller fragments. The charged fragment can also be detected with a lower m/z
ratio.
Ion Separation
Following ionisation a positively charged ion repeller forces the cations out of the
ionisation chamber and they are then accelerated through a voltage, giving them all
the same kinetic energy into a finely focused beam and into the analyser where
separation occurs. Ion separation is based on the fact that the charged species have
different m/z ratios. Quadrupole mass analysers are the most common method of ion
CHAPTER 2. Experimental 63
separation, and use an electric field provided by parallel electrodes to selectively
stabilise or destabilise the paths of ions passing through it. The frequency of the
electric field is varied to select which m/z value is stabilised and hence which ions are
able to reach the detector. All other ions with different m/z values become neutralised
through collisions and are therefore not detected. It is also important that the system
operates under a vacuum so that the ions of interest do not collide with other species
in the system during the ion separation process. Furthermore, the vacuum system is
heated to minimise the amount of water present in the system.
Detection
The ions that reach the detector produce an ion current on collision with it, which the
detector measures, outputting the data as a mass spectrum. For small samples,
where high sensitivity is required, a secondary electron multiplier detector is used.
Secondary electrons are produced by the initial collision of the ions with the detector,
which is then amplified by a series of electrodes, each one at an increased potential.
This results in increased sensitivity of the order of 106.
2.5 Temperature Programmed Desorption
Temperature programmed desorption (TPD) is a generic term for the controlled
heating of a sample while the desorption products are monitored. A sample is heated
under a flowing atmosphere at a controlled heating rate while the gaseous desorption
products are analysed by mass spectrometry. A home built TPD apparatus was used
in this study.
Temperature programmed desorption under a flowing argon atmosphere was
monitored using a mass spectrometer, TPD–MS. The flow of argon within the
apparatus was regulated using a mass flow controller (Hastings 200 Series,
Teledyne) at a constant rate of 100 ml min−1. The argon carrier gas flowed over the
top of the reaction chamber. The sample (~0.1 g) was weighed into a quartz reaction
tube (7 mm O/D, 4 mm I/D) inside an argon filled glove box and sealed vertically in
the reaction chamber. The sealed reaction chamber was transferred to the TPD
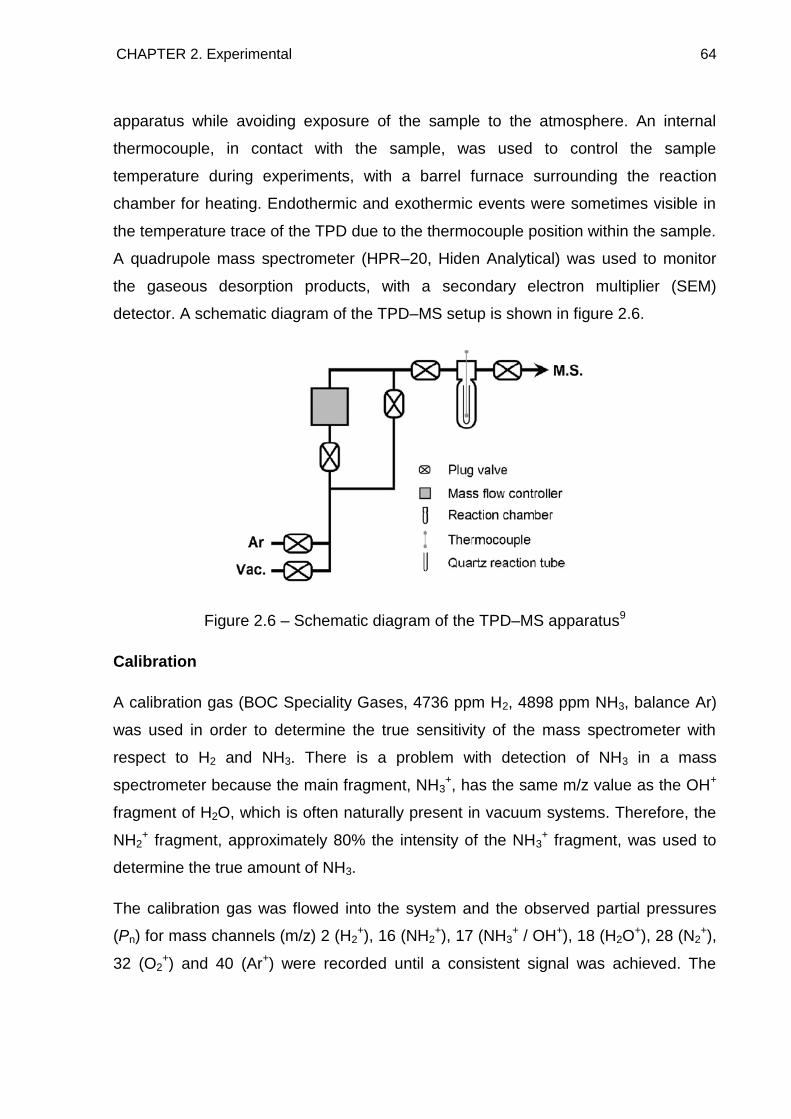
CHAPTER 2. Experimental 64
apparatus while avoiding exposure of the sample to the atmosphere. An internal
thermocouple, in contact with the sample, was used to control the sample
temperature during experiments, with a barrel furnace surrounding the reaction
chamber for heating. Endothermic and exothermic events were sometimes visible in
the temperature trace of the TPD due to the thermocouple position within the sample.
A quadrupole mass spectrometer (HPR–20, Hiden Analytical) was used to monitor
the gaseous desorption products, with a secondary electron multiplier (SEM)
detector. A schematic diagram of the TPD–MS setup is shown in figure 2.6.
Figure 2.6 – Schematic diagram of the TPD–MS apparatus9
Calibration
A calibration gas (BOC Speciality Gases, 4736 ppm H2, 4898 ppm NH3, balance Ar)
was used in order to determine the true sensitivity of the mass spectrometer with
respect to H2 and NH3. There is a problem with detection of NH3 in a mass
spectrometer because the main fragment, NH3+, has the same m/z value as the OH+
fragment of H2O, which is often naturally present in vacuum systems. Therefore, the
NH2+ fragment, approximately 80% the intensity of the NH3
+ fragment, was used to
determine the true amount of NH3.
The calibration gas was flowed into the system and the observed partial pressures
(Pn) for mass channels (m/z) 2 (H2+), 16 (NH2
+), 17 (NH3+ / OH+), 18 (H2O
+), 28 (N2+),
32 (O2+) and 40 (Ar+) were recorded until a consistent signal was achieved. The
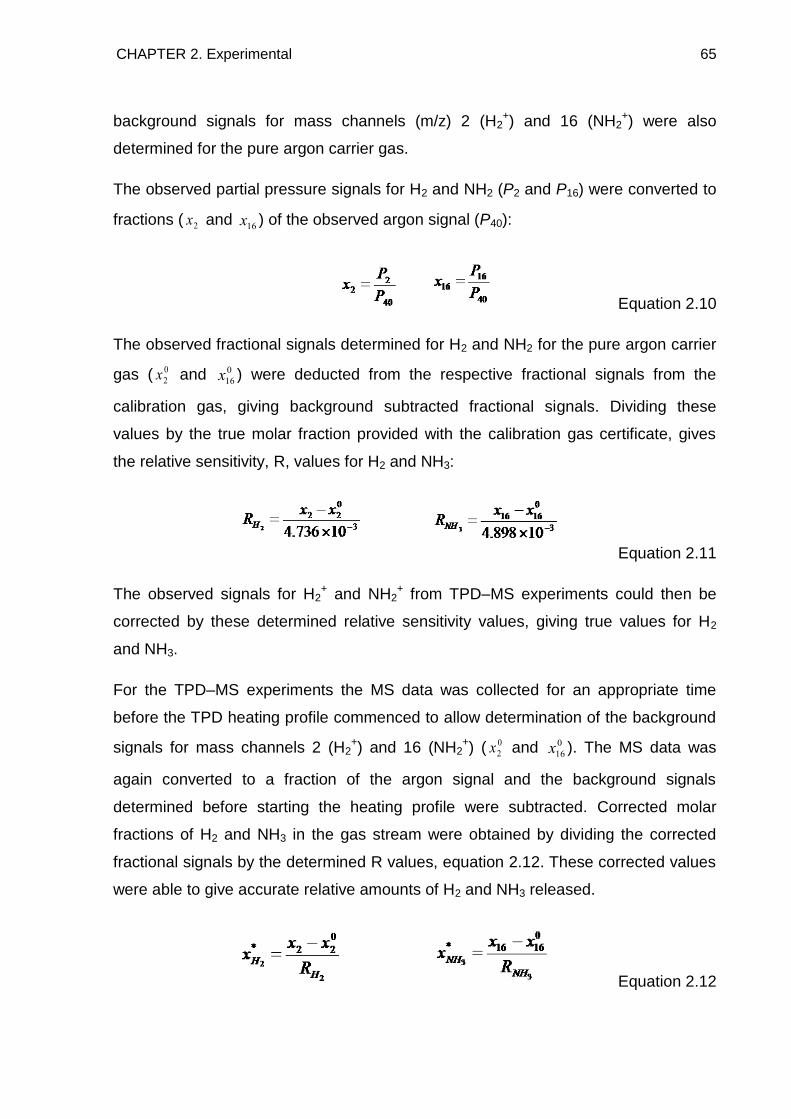
CHAPTER 2. Experimental 65
background signals for mass channels (m/z) 2 (H2+) and 16 (NH2
+) were also
determined for the pure argon carrier gas.
The observed partial pressure signals for H2 and NH2 (P2 and P16) were converted to
fractions ( 2x and 16x ) of the observed argon signal (P40):
Equation 2.10
The observed fractional signals determined for H2 and NH2 for the pure argon carrier
gas ( 0
2x and 0
16x ) were deducted from the respective fractional signals from the
calibration gas, giving background subtracted fractional signals. Dividing these
values by the true molar fraction provided with the calibration gas certificate, gives
the relative sensitivity, R, values for H2 and NH3:
Equation 2.11
The observed signals for H2+ and NH2
+ from TPD–MS experiments could then be
corrected by these determined relative sensitivity values, giving true values for H2
and NH3.
For the TPD–MS experiments the MS data was collected for an appropriate time
before the TPD heating profile commenced to allow determination of the background
signals for mass channels 2 (H2+) and 16 (NH2
+) ( 0
2x and 0
16x ). The MS data was
again converted to a fraction of the argon signal and the background signals
determined before starting the heating profile were subtracted. Corrected molar
fractions of H2 and NH3 in the gas stream were obtained by dividing the corrected
fractional signals by the determined R values, equation 2.12. These corrected values
were able to give accurate relative amounts of H2 and NH3 released.
Equation 2.12
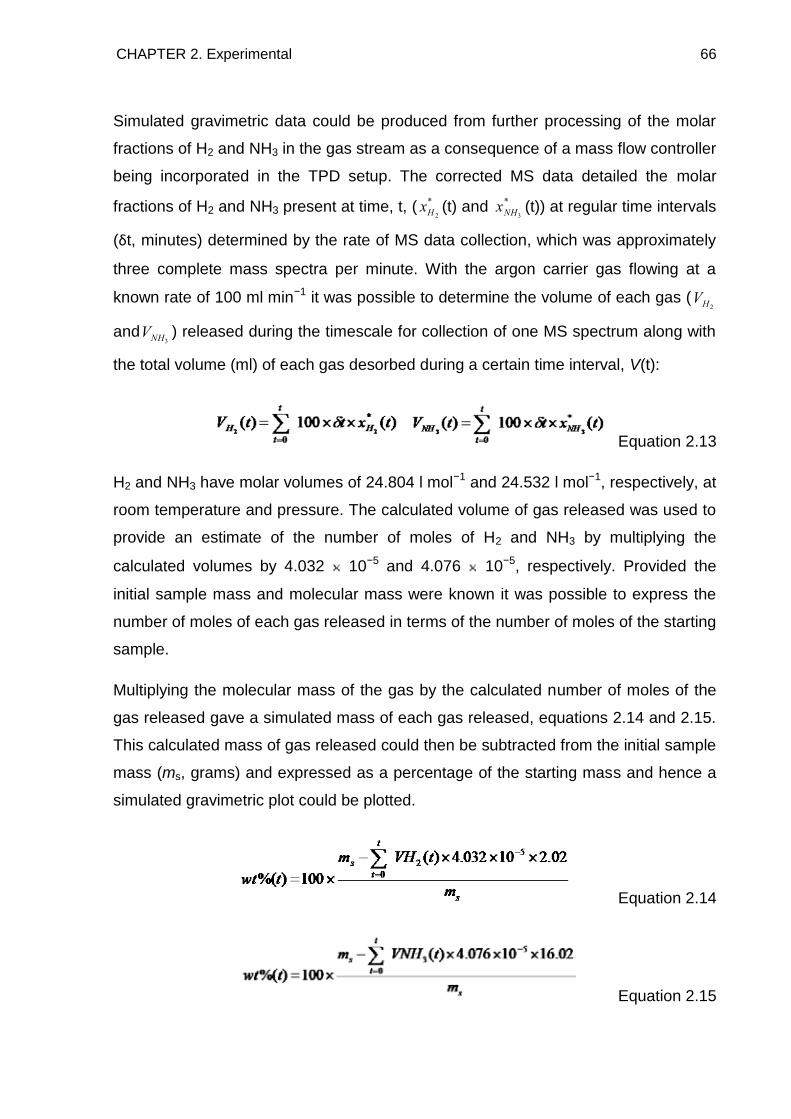
CHAPTER 2. Experimental 66
Simulated gravimetric data could be produced from further processing of the molar
fractions of H2 and NH3 in the gas stream as a consequence of a mass flow controller
being incorporated in the TPD setup. The corrected MS data detailed the molar
fractions of H2 and NH3 present at time, t, ( *
2Hx (t) and *
3NHx (t)) at regular time intervals
(δt, minutes) determined by the rate of MS data collection, which was approximately
three complete mass spectra per minute. With the argon carrier gas flowing at a
known rate of 100 ml min−1 it was possible to determine the volume of each gas (2H
V
and3NHV ) released during the timescale for collection of one MS spectrum along with
the total volume (ml) of each gas desorbed during a certain time interval, V(t):
Equation 2.13
H2 and NH3 have molar volumes of 24.804 l mol−1 and 24.532 l mol−1, respectively, at
room temperature and pressure. The calculated volume of gas released was used to
provide an estimate of the number of moles of H2 and NH3 by multiplying the
calculated volumes by 4.032 10−5 and 4.076 10−5, respectively. Provided the
initial sample mass and molecular mass were known it was possible to express the
number of moles of each gas released in terms of the number of moles of the starting
sample.
Multiplying the molecular mass of the gas by the calculated number of moles of the
gas released gave a simulated mass of each gas released, equations 2.14 and 2.15.
This calculated mass of gas released could then be subtracted from the initial sample
mass (ms, grams) and expressed as a percentage of the starting mass and hence a
simulated gravimetric plot could be plotted.
Equation 2.14
Equation 2.15
CHAPTER 2. Experimental 67
This form of data analysis is complicated, however, it does allow for a more complete
analysis of the desorbed gases from the starting sample. It was particularly beneficial
for analysis of samples of reaction mixtures where NH3BH3 was present. Upon
heating NH3BH3 undergoes a voluminous swelling, which means it is unsuitable for
analysis by more delicate methods of thermogravimetric analysis, whereas TPD–MS
is much more resistant to poorly behaved samples.
2.6 Intelligent Gravimetric Analysis
An Intelligent Gravimetric Analyser (IGA, Hiden Analytical) is a pressure controlled
thermo-gravimetric balance which allows complete control of the environment. The
sample is inertly loaded into a quartz sample holder and placed onto a hang-down
which is attached to a microbalance head. The sample mass is measured under
different conditions so that the changes in weight can be monitored under
temperature and pressure changes. The sample, microbalance head and
counterbalance are all subject to the same environment which helps reduce
buoyancy effects on the observed sample mass. An external furnace, surrounding
the reaction tube, is used to heat the sample, with the sample temperature monitored
by a positive temperature coefficient sensor located next to the sample.
In this study the IGA was used to obtain thermogravimetric data of the samples under
investigation. A constant flow rate and pressure of the argon carrier gas was
therefore established within the IGA reactor through external mass flow controllers.
The argon carrier gas flowed directly over the sample at a rate of 100 ml min−1 and a
pressure of 1 bar, which collected gaseous desorption products and transported
them to a mass spectrometer (HPR20-QIC, Hiden Analytical) for analysis.
2.7 Thermogravimetric Analysis
Thermogravimetric analysis (TGA) involves the measurement of the mass of a
sample with varying temperature. The sample is mounted onto a thermocouple within
the furnace. Argon carrier gas flows over the sample and collects desorbed gases
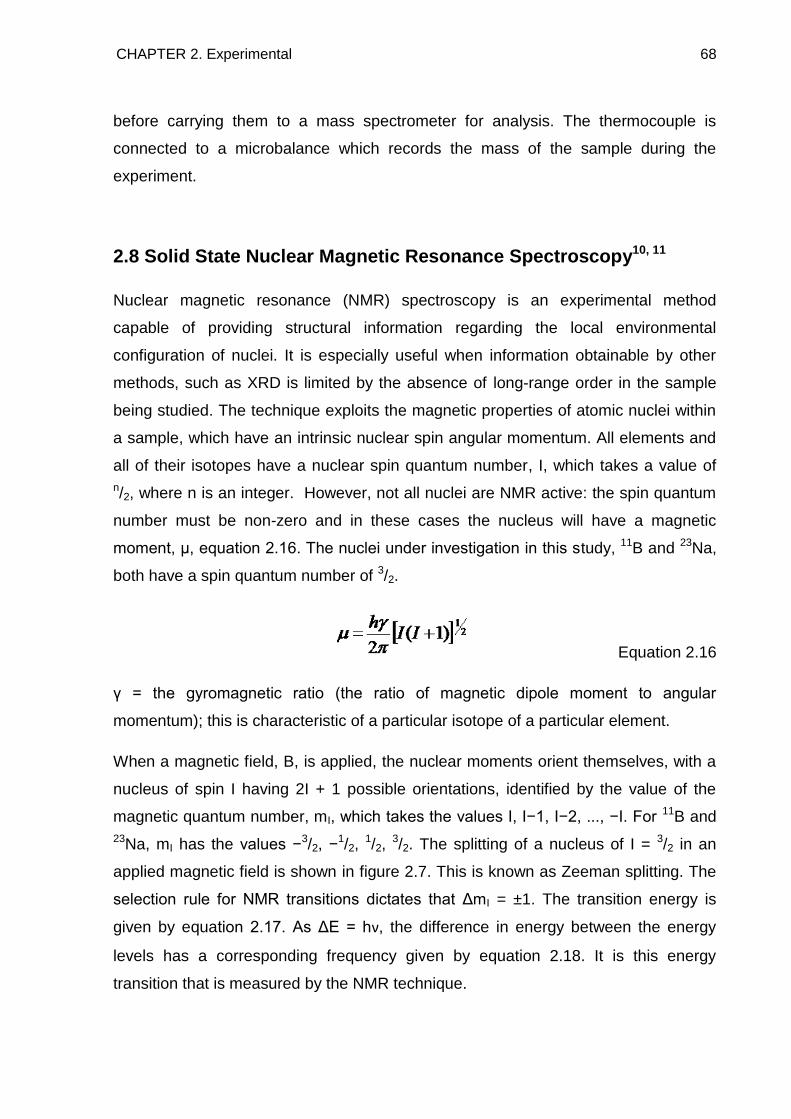
CHAPTER 2. Experimental 68
before carrying them to a mass spectrometer for analysis. The thermocouple is
connected to a microbalance which records the mass of the sample during the
experiment.
2.8 Solid State Nuclear Magnetic Resonance Spectroscopy10, 11
Nuclear magnetic resonance (NMR) spectroscopy is an experimental method
capable of providing structural information regarding the local environmental
configuration of nuclei. It is especially useful when information obtainable by other
methods, such as XRD is limited by the absence of long-range order in the sample
being studied. The technique exploits the magnetic properties of atomic nuclei within
a sample, which have an intrinsic nuclear spin angular momentum. All elements and
all of their isotopes have a nuclear spin quantum number, I, which takes a value of
n/2, where n is an integer. However, not all nuclei are NMR active: the spin quantum
number must be non-zero and in these cases the nucleus will have a magnetic
moment, μ, equation 2.16. The nuclei under investigation in this study, 11B and 23Na,
both have a spin quantum number of 3/2.
Equation 2.16
γ = the gyromagnetic ratio (the ratio of magnetic dipole moment to angular
momentum); this is characteristic of a particular isotope of a particular element.
When a magnetic field, B, is applied, the nuclear moments orient themselves, with a
nucleus of spin I having 2I + 1 possible orientations, identified by the value of the
magnetic quantum number, mI, which takes the values I, I−1, I−2, ..., −I. For 11B and
23Na, mI has the values −3/2, −1/2,
1/2, 3/2. The splitting of a nucleus of I = 3/2 in an
applied magnetic field is shown in figure 2.7. This is known as Zeeman splitting. The
selection rule for NMR transitions dictates that ΔmI = ±1. The transition energy is
given by equation 2.17. As ΔE = hν, the difference in energy between the energy
levels has a corresponding frequency given by equation 2.18. It is this energy
transition that is measured by the NMR technique.
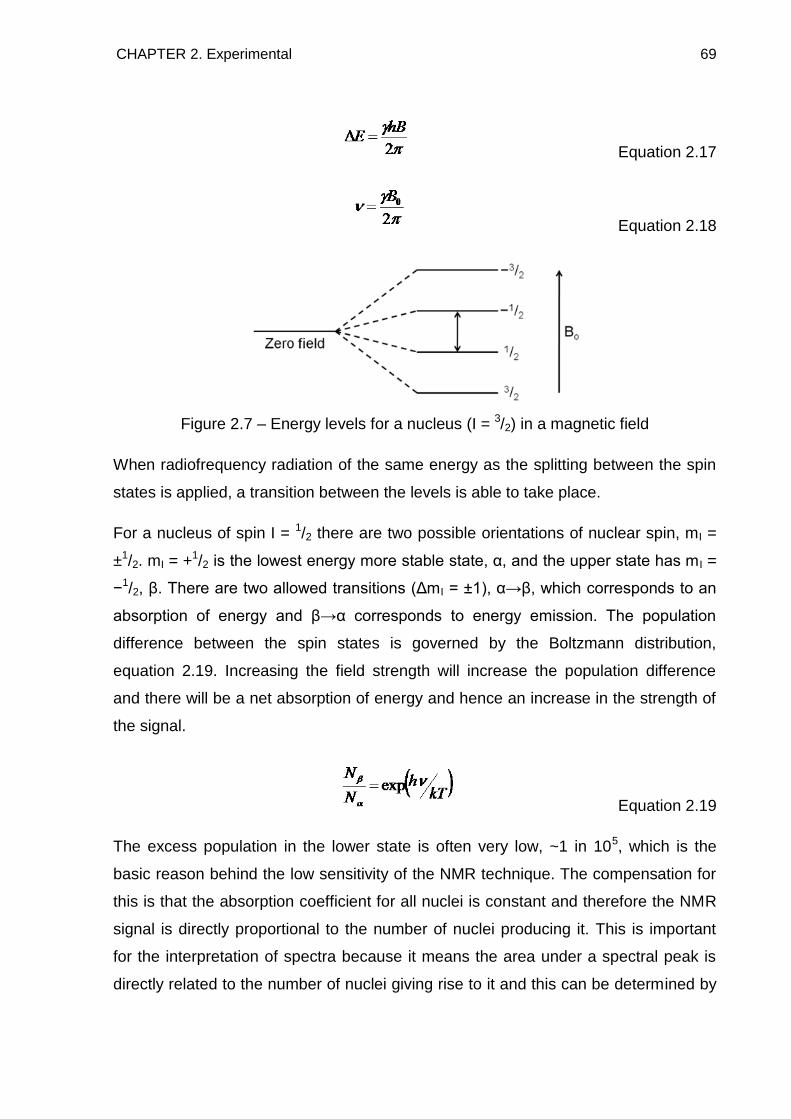
CHAPTER 2. Experimental 69
Equation 2.17
Equation 2.18
Figure 2.7 – Energy levels for a nucleus (I = 3/2) in a magnetic field
When radiofrequency radiation of the same energy as the splitting between the spin
states is applied, a transition between the levels is able to take place.
For a nucleus of spin I = 1/2 there are two possible orientations of nuclear spin, mI =
±1/2. mI = +1/2 is the lowest energy more stable state, α, and the upper state has mI =
−1/2, β. There are two allowed transitions (ΔmI = ±1), α→β, which corresponds to an
absorption of energy and β→α corresponds to energy emission. The population
difference between the spin states is governed by the Boltzmann distribution,
equation 2.19. Increasing the field strength will increase the population difference
and there will be a net absorption of energy and hence an increase in the strength of
the signal.
Equation 2.19
The excess population in the lower state is often very low, ~1 in 105, which is the
basic reason behind the low sensitivity of the NMR technique. The compensation for
this is that the absorption coefficient for all nuclei is constant and therefore the NMR
signal is directly proportional to the number of nuclei producing it. This is important
for the interpretation of spectra because it means the area under a spectral peak is
directly related to the number of nuclei giving rise to it and this can be determined by
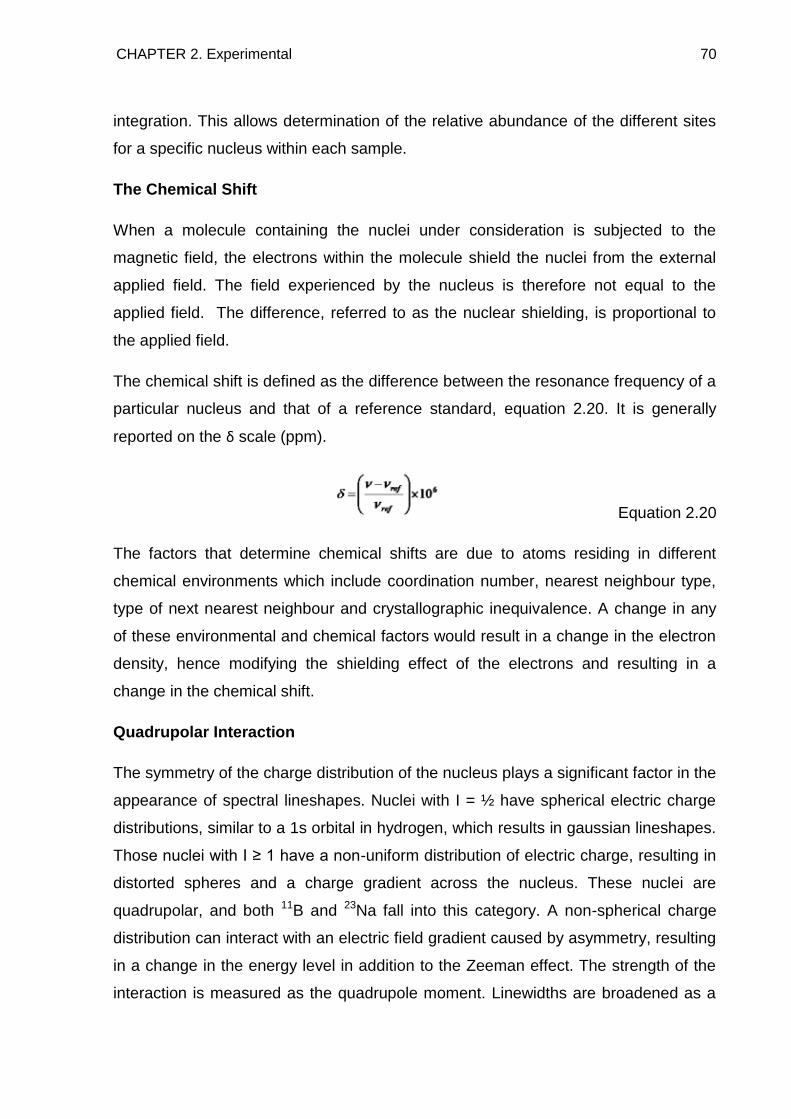
CHAPTER 2. Experimental 70
integration. This allows determination of the relative abundance of the different sites
for a specific nucleus within each sample.
The Chemical Shift
When a molecule containing the nuclei under consideration is subjected to the
magnetic field, the electrons within the molecule shield the nuclei from the external
applied field. The field experienced by the nucleus is therefore not equal to the
applied field. The difference, referred to as the nuclear shielding, is proportional to
the applied field.
The chemical shift is defined as the difference between the resonance frequency of a
particular nucleus and that of a reference standard, equation 2.20. It is generally
reported on the δ scale (ppm).
Equation 2.20
The factors that determine chemical shifts are due to atoms residing in different
chemical environments which include coordination number, nearest neighbour type,
type of next nearest neighbour and crystallographic inequivalence. A change in any
of these environmental and chemical factors would result in a change in the electron
density, hence modifying the shielding effect of the electrons and resulting in a
change in the chemical shift.
Quadrupolar Interaction
The symmetry of the charge distribution of the nucleus plays a significant factor in the
appearance of spectral lineshapes. Nuclei with I = ½ have spherical electric charge
distributions, similar to a 1s orbital in hydrogen, which results in gaussian lineshapes.
Those nuclei with I ≥ 1 have a non-uniform distribution of electric charge, resulting in
distorted spheres and a charge gradient across the nucleus. These nuclei are
quadrupolar, and both 11B and 23Na fall into this category. A non-spherical charge
distribution can interact with an electric field gradient caused by asymmetry, resulting
in a change in the energy level in addition to the Zeeman effect. The strength of the
interaction is measured as the quadrupole moment. Linewidths are broadened as a
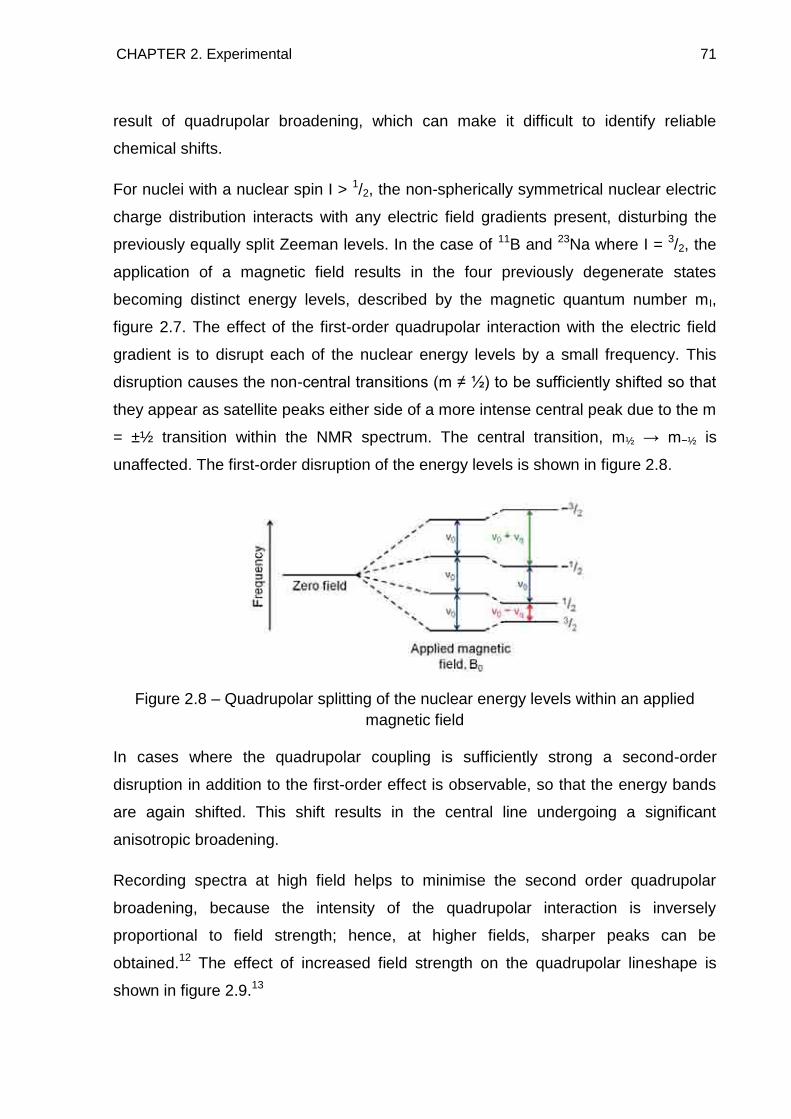
CHAPTER 2. Experimental 71
result of quadrupolar broadening, which can make it difficult to identify reliable
chemical shifts.
For nuclei with a nuclear spin I > 1/2, the non-spherically symmetrical nuclear electric
charge distribution interacts with any electric field gradients present, disturbing the
previously equally split Zeeman levels. In the case of 11B and 23Na where I = 3/2, the
application of a magnetic field results in the four previously degenerate states
becoming distinct energy levels, described by the magnetic quantum number mI,
figure 2.7. The effect of the first-order quadrupolar interaction with the electric field
gradient is to disrupt each of the nuclear energy levels by a small frequency. This
disruption causes the non-central transitions (m ≠ ½) to be sufficiently shifted so that
they appear as satellite peaks either side of a more intense central peak due to the m
= ±½ transition within the NMR spectrum. The central transition, m½ → m−½ is
unaffected. The first-order disruption of the energy levels is shown in figure 2.8.
Figure 2.8 – Quadrupolar splitting of the nuclear energy levels within an applied
magnetic field
In cases where the quadrupolar coupling is sufficiently strong a second-order
disruption in addition to the first-order effect is observable, so that the energy bands
are again shifted. This shift results in the central line undergoing a significant
anisotropic broadening.
Recording spectra at high field helps to minimise the second order quadrupolar
broadening, because the intensity of the quadrupolar interaction is inversely
proportional to field strength; hence, at higher fields, sharper peaks can be
obtained.12 The effect of increased field strength on the quadrupolar lineshape is
shown in figure 2.9.13
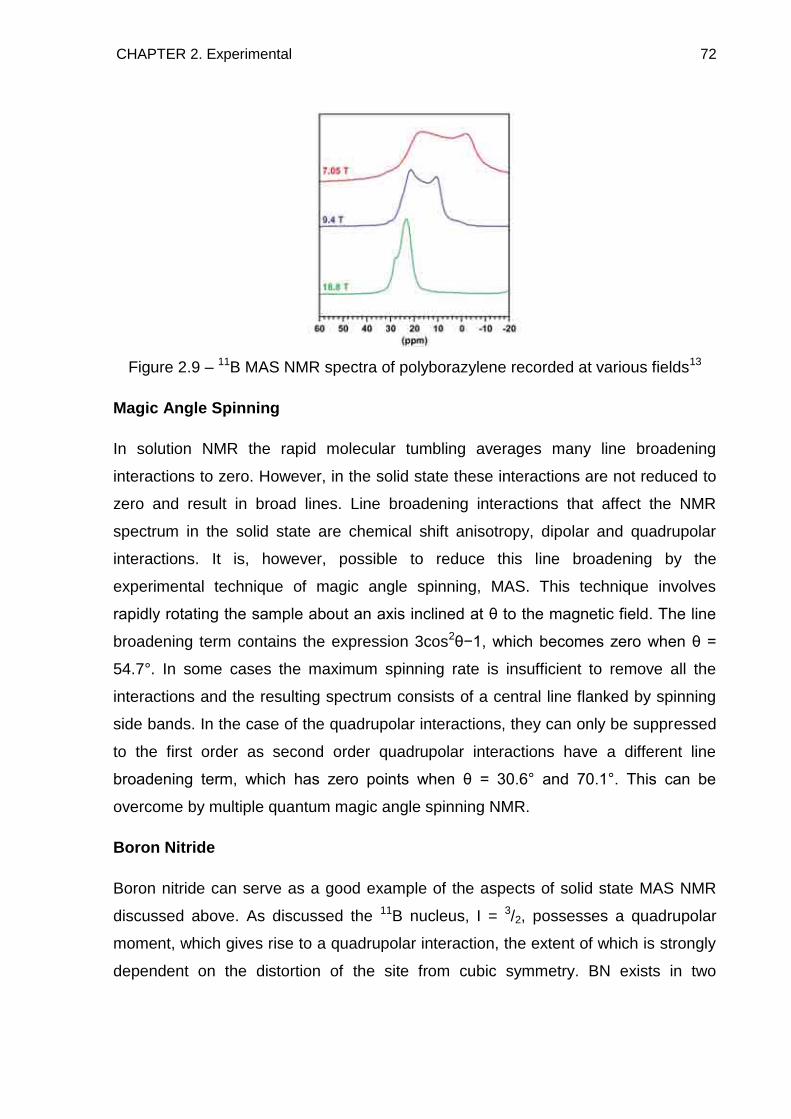
CHAPTER 2. Experimental 72
Figure 2.9 – 11B MAS NMR spectra of polyborazylene recorded at various fields13
Magic Angle Spinning
In solution NMR the rapid molecular tumbling averages many line broadening
interactions to zero. However, in the solid state these interactions are not reduced to
zero and result in broad lines. Line broadening interactions that affect the NMR
spectrum in the solid state are chemical shift anisotropy, dipolar and quadrupolar
interactions. It is, however, possible to reduce this line broadening by the
experimental technique of magic angle spinning, MAS. This technique involves
rapidly rotating the sample about an axis inclined at θ to the magnetic field. The line
broadening term contains the expression 3cos2θ−1, which becomes zero when θ =
54.7°. In some cases the maximum spinning rate is insufficient to remove all the
interactions and the resulting spectrum consists of a central line flanked by spinning
side bands. In the case of the quadrupolar interactions, they can only be suppressed
to the first order as second order quadrupolar interactions have a different line
broadening term, which has zero points when θ = 30.6° and 70.1°. This can be
overcome by multiple quantum magic angle spinning NMR.
Boron Nitride
Boron nitride can serve as a good example of the aspects of solid state MAS NMR
discussed above. As discussed the 11B nucleus, I = 3/2, possesses a quadrupolar
moment, which gives rise to a quadrupolar interaction, the extent of which is strongly
dependent on the distortion of the site from cubic symmetry. BN exists in two
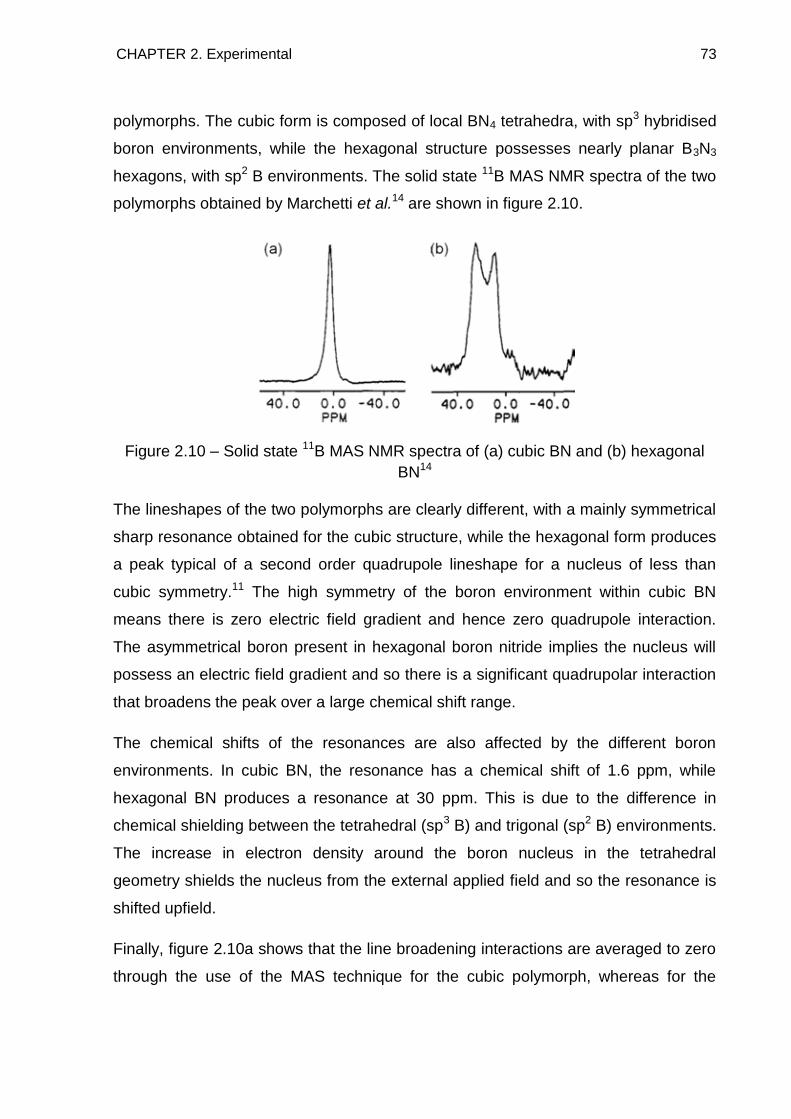
CHAPTER 2. Experimental 73
polymorphs. The cubic form is composed of local BN4 tetrahedra, with sp3 hybridised
boron environments, while the hexagonal structure possesses nearly planar B3N3
hexagons, with sp2 B environments. The solid state 11B MAS NMR spectra of the two
polymorphs obtained by Marchetti et al.14 are shown in figure 2.10.
Figure 2.10 – Solid state 11B MAS NMR spectra of (a) cubic BN and (b) hexagonal
BN14
The lineshapes of the two polymorphs are clearly different, with a mainly symmetrical
sharp resonance obtained for the cubic structure, while the hexagonal form produces
a peak typical of a second order quadrupole lineshape for a nucleus of less than
cubic symmetry.11 The high symmetry of the boron environment within cubic BN
means there is zero electric field gradient and hence zero quadrupole interaction.
The asymmetrical boron present in hexagonal boron nitride implies the nucleus will
possess an electric field gradient and so there is a significant quadrupolar interaction
that broadens the peak over a large chemical shift range.
The chemical shifts of the resonances are also affected by the different boron
environments. In cubic BN, the resonance has a chemical shift of 1.6 ppm, while
hexagonal BN produces a resonance at 30 ppm. This is due to the difference in
chemical shielding between the tetrahedral (sp3 B) and trigonal (sp2 B) environments.
The increase in electron density around the boron nucleus in the tetrahedral
geometry shields the nucleus from the external applied field and so the resonance is
shifted upfield.
Finally, figure 2.10a shows that the line broadening interactions are averaged to zero
through the use of the MAS technique for the cubic polymorph, whereas for the
CHAPTER 2. Experimental 74
hexagonal polymorph, figure 2.10b, the strong second-order quadrupolar interaction
is only partially averaged and the characteristic lineshape of sp2 boron environments
is observed.
Solid state 11B MAS NMR spectra in this study were collected using a 500 MHz
Bruker Avance III spectrometer equipped with an 11.74 T magnet. The solid state
23Na MAS NMR spectra were collected using a 400 MHz Bruker Avance
spectrometer equipped with a 9.4 T magnet. All samples were loaded in a glove box
under an argon atmosphere into a rotor. The rotor was sealed and then transferred
onto the spectrometer and data collected without sample exposure to the
atmosphere.
2.9 Raman Spectroscopy15
Raman spectroscopy is concerned with the study of molecular vibrations. Vibrational
modes can be excited to higher energy through the absorption of radiation of
appropriate frequency. A Raman spectrum is a plot of intensity of scattering as a
function of frequency or wavenumber. In Raman spectroscopy, the sample is
illuminated by monochromatic light, which is usually generated by a laser. A
vibrational mode is Raman active if the polarisability of the molecule changes during
the vibration. Changes in polarisability are not always easy to visualise and it is
usually necessary to employ group theory in order to determine whether or not a
mode will be Raman active.
During scattering, a short-lived excited state, known as a virtual state is created as a
result of the incident radiation polarising the electron cloud surrounding the nuclei of
the molecule under investigation. The excited state is unstable and rapidly relaxes
through the release of a photon. Two types of scattered radiation are possible.
Rayleigh scattering is essentially elastic, where only distortion of the electron cloud
occurs and the energy difference between the incident and the scattered photons is
minimal. Raman scattering events are inelastic, which occur when nuclear motions
are induced in the molecule. The photon excites the molecule from the ground state
to a virtual energy state and upon relaxation the molecule returns to a different
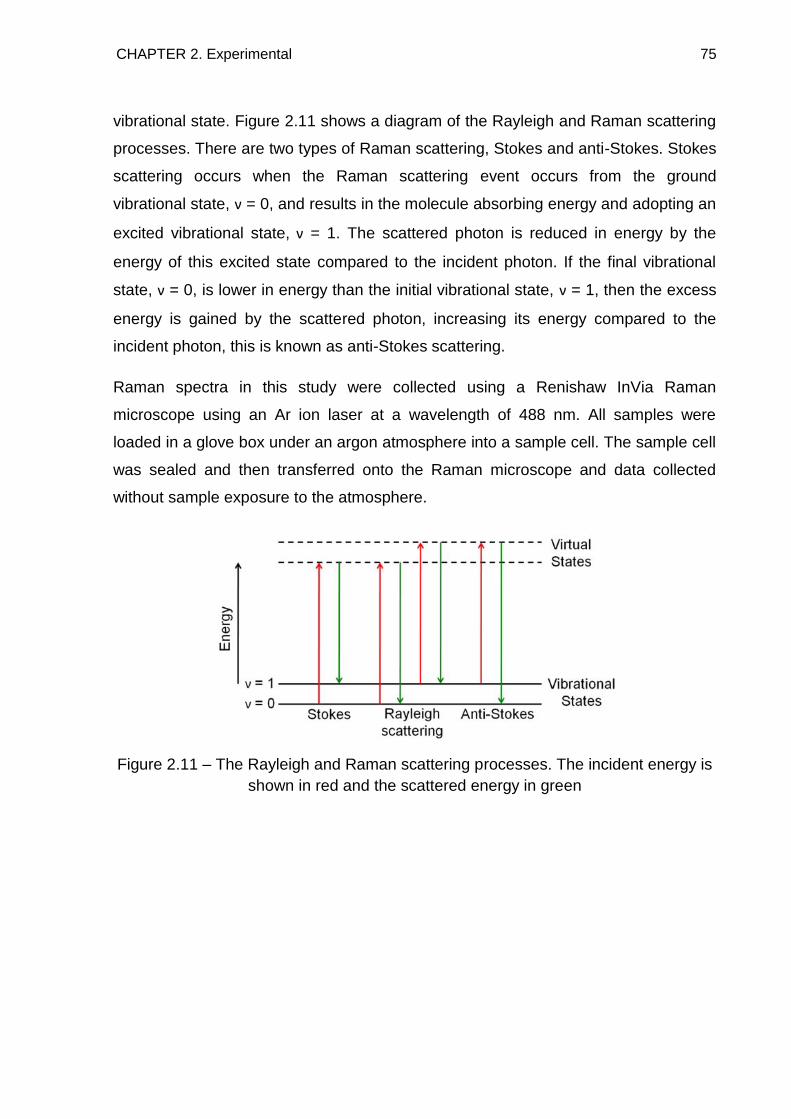
CHAPTER 2. Experimental 75
vibrational state. Figure 2.11 shows a diagram of the Rayleigh and Raman scattering
processes. There are two types of Raman scattering, Stokes and anti-Stokes. Stokes
scattering occurs when the Raman scattering event occurs from the ground
vibrational state, ν = 0, and results in the molecule absorbing energy and adopting an
excited vibrational state, ν = 1. The scattered photon is reduced in energy by the
energy of this excited state compared to the incident photon. If the final vibrational
state, ν = 0, is lower in energy than the initial vibrational state, ν = 1, then the excess
energy is gained by the scattered photon, increasing its energy compared to the
incident photon, this is known as anti-Stokes scattering.
Raman spectra in this study were collected using a Renishaw InVia Raman
microscope using an Ar ion laser at a wavelength of 488 nm. All samples were
loaded in a glove box under an argon atmosphere into a sample cell. The sample cell
was sealed and then transferred onto the Raman microscope and data collected
without sample exposure to the atmosphere.
Figure 2.11 – The Rayleigh and Raman scattering processes. The incident energy is
shown in red and the scattered energy in green
CHAPTER 2. Experimental 76
2.10 References
1. Giacovazzo, G.; Monaco, H. L.; Viterbo, D.; Scodary, F.; Gilli, G.; Zanotty, G.;
Catti, M., Fundamentals of Crystallography. Oxford Science Publications 1998.
2. West, A. R., Basic Solid State Chemistry. John Wiley & Sons, LTD 1999.
3. Burns, G.; Grazer, A. M., Space Groups for Solid State Scientists. Academic
Press, INC 1990.
4. Hammond, C., The Basics of Crystallography and Diffraction. Oxford
University Press 2001.
5. Young, R. A., The Rietveld Method. Oxford University Press 1993.
6. Rietveld, H. M., A profile refinement for nuclear and magnetic structures.
Journal of Applied Crystallography 1969, 2, 65–71.
7. Linscheid, M., Mass Spectrometry. Ullmann's Encyclopedia of Industrial
Chemistry 2001.
8. Mellon, F. A.; Self, R.; Startin, J. R.; Belton, P. S., Introduction to Principles
and Practice of Mass Spectrometry. RSC Publishing 2000.
9. Chater, P. A.; Anderson, P. A.; Prendergast, J. W.; Walton, A.; Mann, V. S. J.;
Book, D.; David, W. I. F.; Johnson, S. R.; Edwards, P. P., Synthesis and
characterisation of amide-borohydrides: New complex light hydrides for potential
hydrogen storage. Journal of Alloys and Compounds 2007, 446–447, 350–354.
10. Abraham, R. J.; Fisher, J.; Loftus, P., introduction to NMR Spectroscopy. John
Wiley & Sons, LTD 1991.
11. Smith, M. E.; van Eck, E. R. H., Recent advances in experimental solid state
NMR methodology for half-integer spin quadrupolar nuclei. Progress in Nuclear
Magnetic Resonance Spectroscopy 1999, 34, 159–201.
12. Massiot, D.; Montouillout, V.; Magnenet, C.; Bessada, C.; Coutures, J.;
Forster, H.; Steuernagel, S.; Mueller, D., Towards higher resolution for quadrupolar
nuclei in solid state NMR at very high field. Comptes Rendus de l'Academie des
Sciences Serie II 1998, 1, 157–162.
13. Gervais, C.; Babonneau, F., High resolution solid state NMR investigation of
various boron nitride preceramic polymers. Journal of Organometallic Chemistry
2002, 657, 75–82.
14. Marchetti, P. S.; Kwon, D.; Schmidt, W. R.; Interrante, L. V.; Maciel, G. E.,
High-field 11B Magic-Angle Spinning NMR characterization of boron nitrides.
Chemistry of Materials 1991, 3, 482–486.
15. Szymanski, H. A., Raman Spectroscopy : Theory and Practice. Plenum
Publishing Corporation 1970.
77
Chapter 3
The Thermal Decomposition of
Ammonia Borane
3.1 Introduction
Prior to the commencement of this research there had been few published studies
into the solid state thermal decomposition of ammonia borane. The majority of
research related to ammonia borane had focused on determinations of the structure
of the compound and any investigations into its decomposition generally involved
organic solvents or hydrolysis. This research investigated the hydrogen desorption
properties of the solid state material as well as spectroscopic investigations of the
decomposition properties.
3.2 Experimental
The NH3BH3 starting material was placed into a quartz tube within an argon filled
glove box (>10 ppm O2, >1 ppm H2O) and heated under a flowing argon atmosphere.
The samples were reground and annealed at the target temperatures to allow for the
samples to be collected as solids. Heating could not be carried out in-situ with
respect to powder X-ray diffraction and solid state NMR spectroscopy due to the
problem of ammonia borane undergoing a volume expansion while being heated.
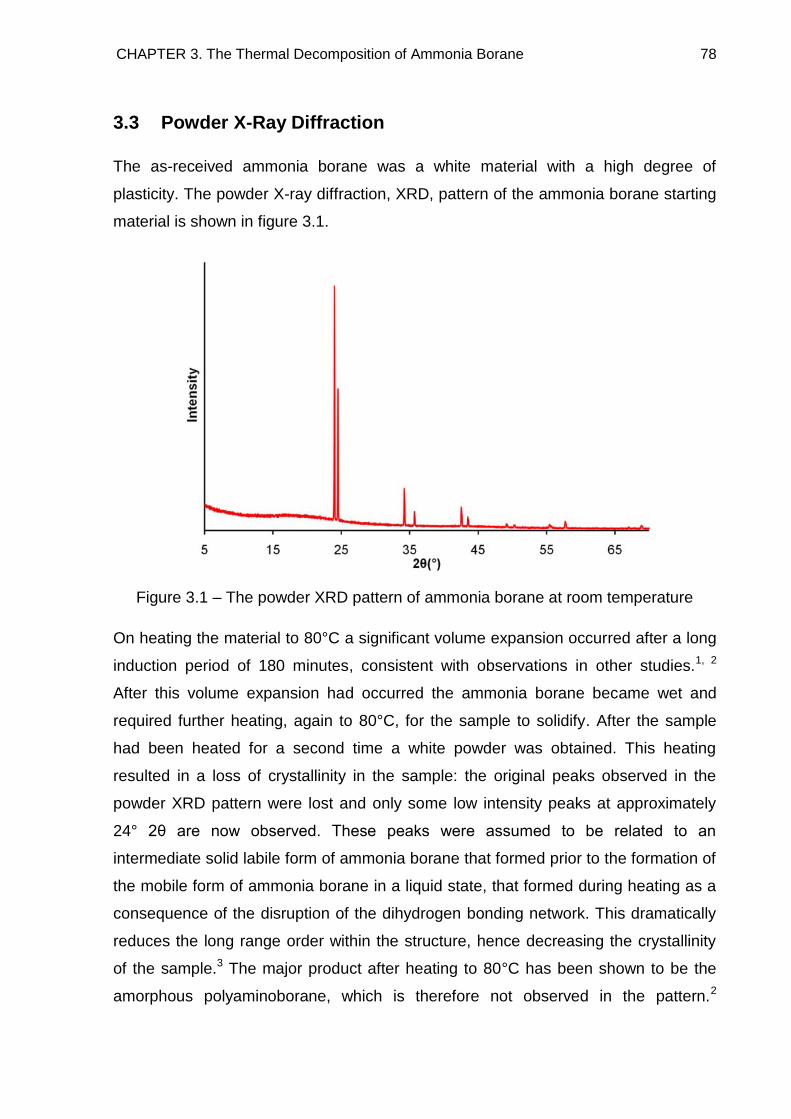
CHAPTER 3. The Thermal Decomposition of Ammonia Borane 78
3.3 Powder X-Ray Diffraction
The as-received ammonia borane was a white material with a high degree of
plasticity. The powder X-ray diffraction, XRD, pattern of the ammonia borane starting
material is shown in figure 3.1.
Figure 3.1 – The powder XRD pattern of ammonia borane at room temperature
On heating the material to 80°C a significant volume expansion occurred after a long
induction period of 180 minutes, consistent with observations in other studies.1, 2
After this volume expansion had occurred the ammonia borane became wet and
required further heating, again to 80°C, for the sample to solidify. After the sample
had been heated for a second time a white powder was obtained. This heating
resulted in a loss of crystallinity in the sample: the original peaks observed in the
powder XRD pattern were lost and only some low intensity peaks at approximately
24° 2θ are now observed. These peaks were assumed to be related to an
intermediate solid labile form of ammonia borane that formed prior to the formation of
the mobile form of ammonia borane in a liquid state, that formed during heating as a
consequence of the disruption of the dihydrogen bonding network. This dramatically
reduces the long range order within the structure, hence decreasing the crystallinity
of the sample.3 The major product after heating to 80°C has been shown to be the
amorphous polyaminoborane, which is therefore not observed in the pattern.2
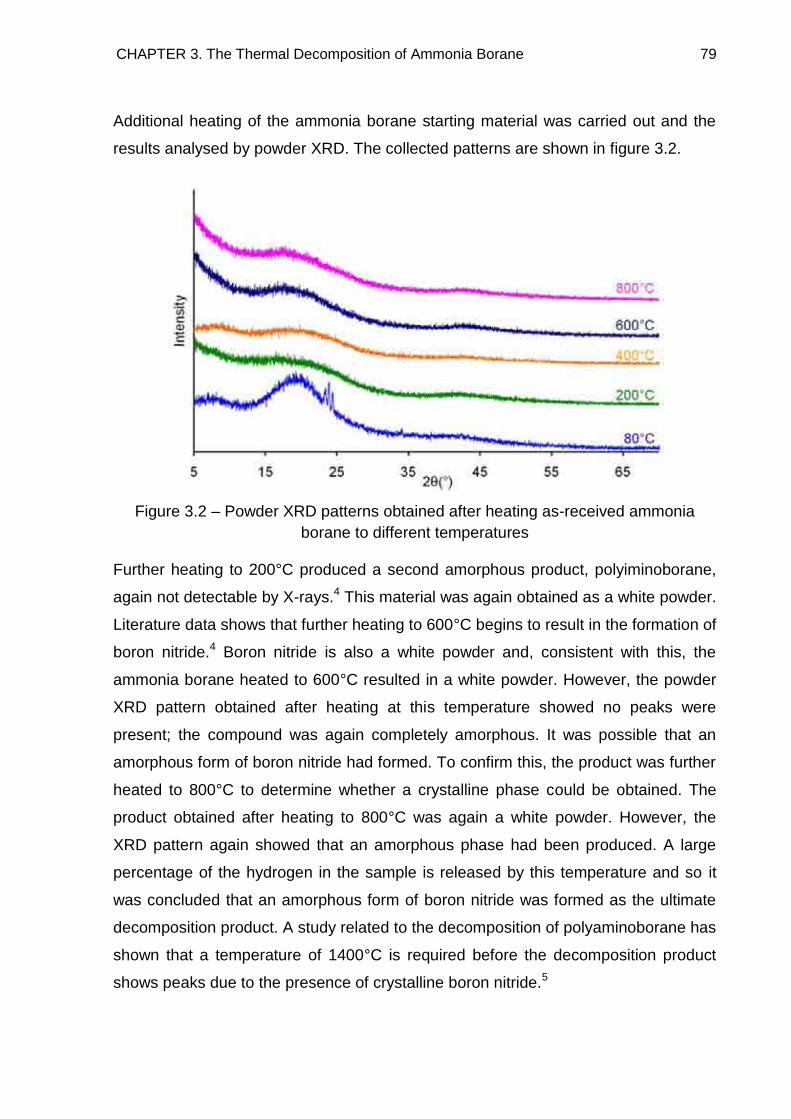
CHAPTER 3. The Thermal Decomposition of Ammonia Borane 79
Additional heating of the ammonia borane starting material was carried out and the
results analysed by powder XRD. The collected patterns are shown in figure 3.2.
Figure 3.2 – Powder XRD patterns obtained after heating as-received ammonia
borane to different temperatures
Further heating to 200°C produced a second amorphous product, polyiminoborane,
again not detectable by X-rays.4 This material was again obtained as a white powder.
Literature data shows that further heating to 600°C begins to result in the formation of
boron nitride.4 Boron nitride is also a white powder and, consistent with this, the
ammonia borane heated to 600°C resulted in a white powder. However, the powder
XRD pattern obtained after heating at this temperature showed no peaks were
present; the compound was again completely amorphous. It was possible that an
amorphous form of boron nitride had formed. To confirm this, the product was further
heated to 800°C to determine whether a crystalline phase could be obtained. The
product obtained after heating to 800°C was again a white powder. However, the
XRD pattern again showed that an amorphous phase had been produced. A large
percentage of the hydrogen in the sample is released by this temperature and so it
was concluded that an amorphous form of boron nitride was formed as the ultimate
decomposition product. A study related to the decomposition of polyaminoborane has
shown that a temperature of 1400°C is required before the decomposition product
shows peaks due to the presence of crystalline boron nitride.5
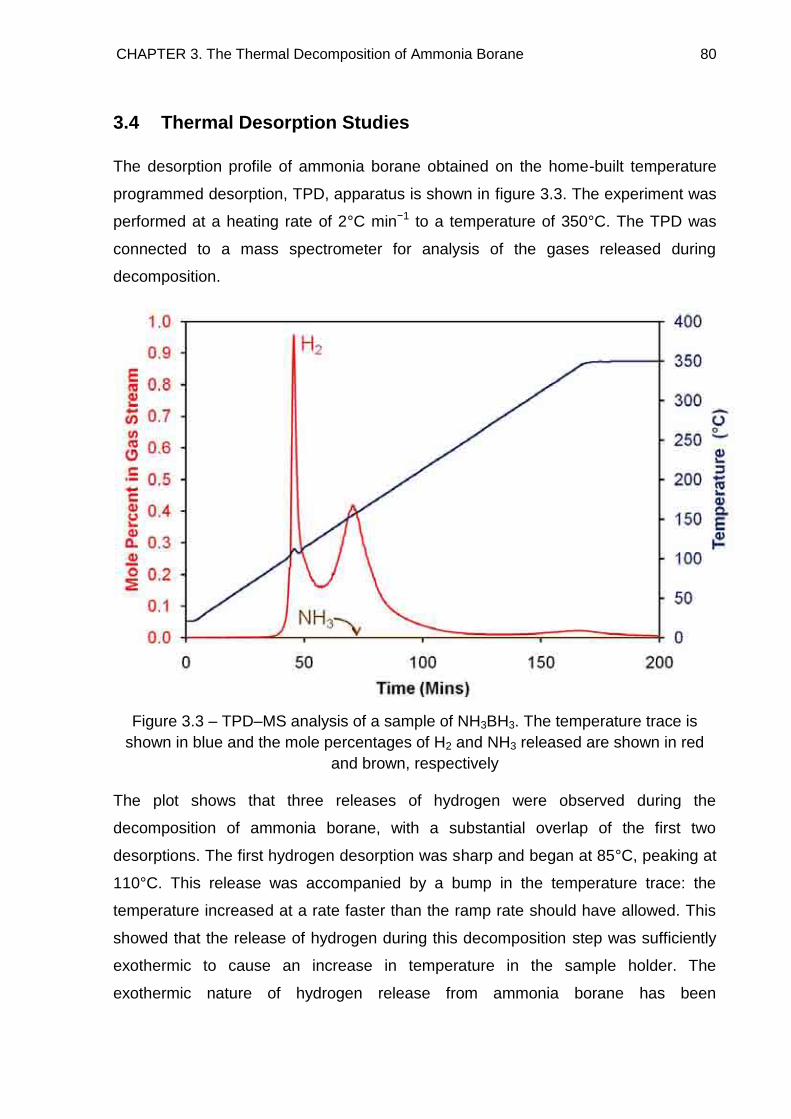
CHAPTER 3. The Thermal Decomposition of Ammonia Borane 80
3.4 Thermal Desorption Studies
The desorption profile of ammonia borane obtained on the home-built temperature
programmed desorption, TPD, apparatus is shown in figure 3.3. The experiment was
performed at a heating rate of 2°C min−1 to a temperature of 350°C. The TPD was
connected to a mass spectrometer for analysis of the gases released during
decomposition.
Figure 3.3 – TPD–MS analysis of a sample of NH3BH3. The temperature trace is
shown in blue and the mole percentages of H2 and NH3 released are shown in red
and brown, respectively
The plot shows that three releases of hydrogen were observed during the
decomposition of ammonia borane, with a substantial overlap of the first two
desorptions. The first hydrogen desorption was sharp and began at 85°C, peaking at
110°C. This release was accompanied by a bump in the temperature trace: the
temperature increased at a rate faster than the ramp rate should have allowed. This
showed that the release of hydrogen during this decomposition step was sufficiently
exothermic to cause an increase in temperature in the sample holder. The
exothermic nature of hydrogen release from ammonia borane has been
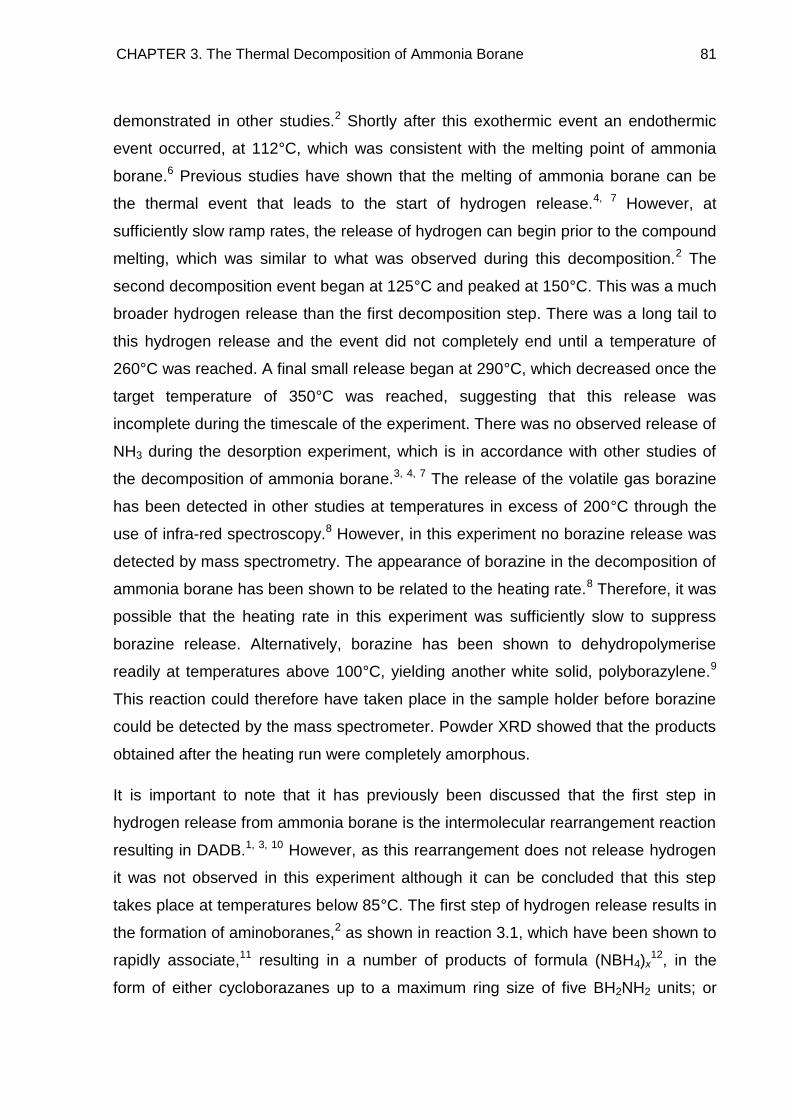
CHAPTER 3. The Thermal Decomposition of Ammonia Borane 81
demonstrated in other studies.2 Shortly after this exothermic event an endothermic
event occurred, at 112°C, which was consistent with the melting point of ammonia
borane.6 Previous studies have shown that the melting of ammonia borane can be
the thermal event that leads to the start of hydrogen release.4, 7 However, at
sufficiently slow ramp rates, the release of hydrogen can begin prior to the compound
melting, which was similar to what was observed during this decomposition.2 The
second decomposition event began at 125°C and peaked at 150°C. This was a much
broader hydrogen release than the first decomposition step. There was a long tail to
this hydrogen release and the event did not completely end until a temperature of
260°C was reached. A final small release began at 290°C, which decreased once the
target temperature of 350°C was reached, suggesting that this release was
incomplete during the timescale of the experiment. There was no observed release of
NH3 during the desorption experiment, which is in accordance with other studies of
the decomposition of ammonia borane.3, 4, 7 The release of the volatile gas borazine
has been detected in other studies at temperatures in excess of 200°C through the
use of infra-red spectroscopy.8 However, in this experiment no borazine release was
detected by mass spectrometry. The appearance of borazine in the decomposition of
ammonia borane has been shown to be related to the heating rate.8 Therefore, it was
possible that the heating rate in this experiment was sufficiently slow to suppress
borazine release. Alternatively, borazine has been shown to dehydropolymerise
readily at temperatures above 100°C, yielding another white solid, polyborazylene.9
This reaction could therefore have taken place in the sample holder before borazine
could be detected by the mass spectrometer. Powder XRD showed that the products
obtained after the heating run were completely amorphous.
It is important to note that it has previously been discussed that the first step in
hydrogen release from ammonia borane is the intermolecular rearrangement reaction
resulting in DADB.1, 3, 10 However, as this rearrangement does not release hydrogen
it was not observed in this experiment although it can be concluded that this step
takes place at temperatures below 85°C. The first step of hydrogen release results in
the formation of aminoboranes,2 as shown in reaction 3.1, which have been shown to
rapidly associate,11 resulting in a number of products of formula (NBH4)x12, in the
form of either cycloborazanes up to a maximum ring size of five BH2NH2 units; or
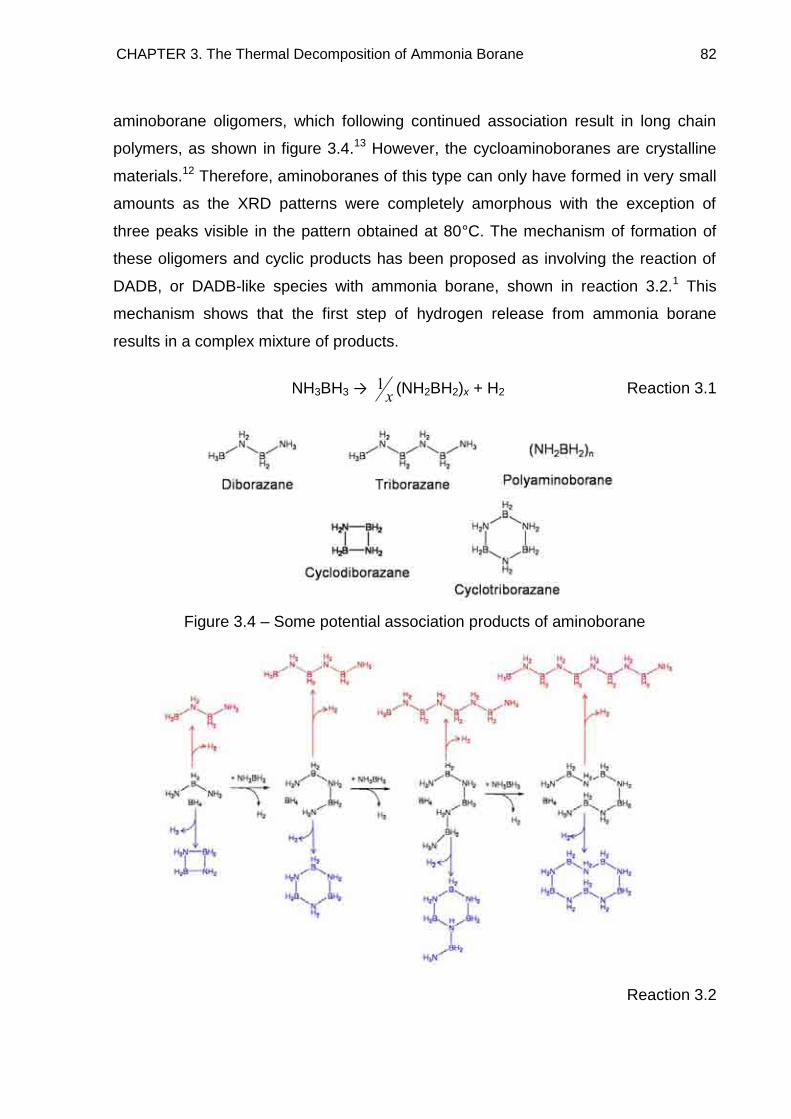
CHAPTER 3. The Thermal Decomposition of Ammonia Borane 82
aminoborane oligomers, which following continued association result in long chain
polymers, as shown in figure 3.4.13 However, the cycloaminoboranes are crystalline
materials.12 Therefore, aminoboranes of this type can only have formed in very small
amounts as the XRD patterns were completely amorphous with the exception of
three peaks visible in the pattern obtained at 80°C. The mechanism of formation of
these oligomers and cyclic products has been proposed as involving the reaction of
DADB, or DADB-like species with ammonia borane, shown in reaction 3.2.1 This
mechanism shows that the first step of hydrogen release from ammonia borane
results in a complex mixture of products.
NH3BH3 → x
1 (NH2BH2)x + H2 Reaction 3.1
Figure 3.4 – Some potential association products of aminoborane
Reaction 3.2
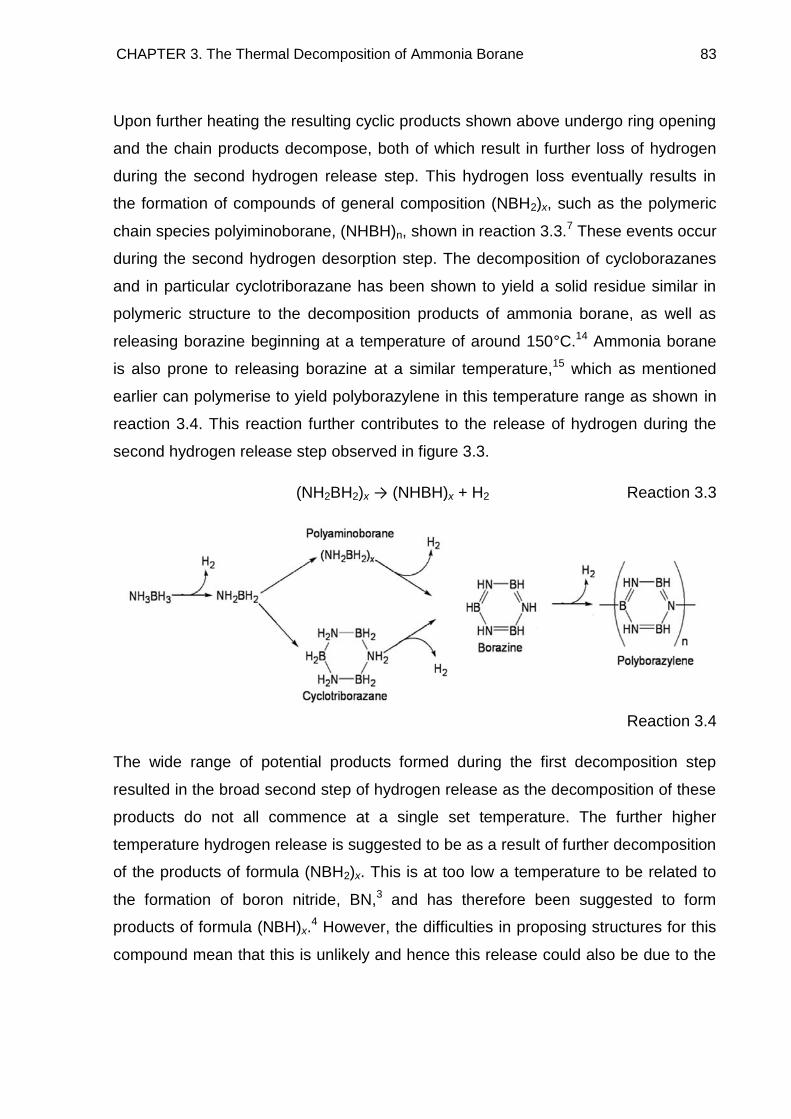
CHAPTER 3. The Thermal Decomposition of Ammonia Borane 83
Upon further heating the resulting cyclic products shown above undergo ring opening
and the chain products decompose, both of which result in further loss of hydrogen
during the second hydrogen release step. This hydrogen loss eventually results in
the formation of compounds of general composition (NBH2)x, such as the polymeric
chain species polyiminoborane, (NHBH)n, shown in reaction 3.3.7 These events occur
during the second hydrogen desorption step. The decomposition of cycloborazanes
and in particular cyclotriborazane has been shown to yield a solid residue similar in
polymeric structure to the decomposition products of ammonia borane, as well as
releasing borazine beginning at a temperature of around 150°C.14 Ammonia borane
is also prone to releasing borazine at a similar temperature,15 which as mentioned
earlier can polymerise to yield polyborazylene in this temperature range as shown in
reaction 3.4. This reaction further contributes to the release of hydrogen during the
second hydrogen release step observed in figure 3.3.
(NH2BH2)x → (NHBH)x + H2 Reaction 3.3
Reaction 3.4
The wide range of potential products formed during the first decomposition step
resulted in the broad second step of hydrogen release as the decomposition of these
products do not all commence at a single set temperature. The further higher
temperature hydrogen release is suggested to be as a result of further decomposition
of the products of formula (NBH2)x. This is at too low a temperature to be related to
the formation of boron nitride, BN,3 and has therefore been suggested to form
products of formula (NBH)x.4 However, the difficulties in proposing structures for this
compound mean that this is unlikely and hence this release could also be due to the
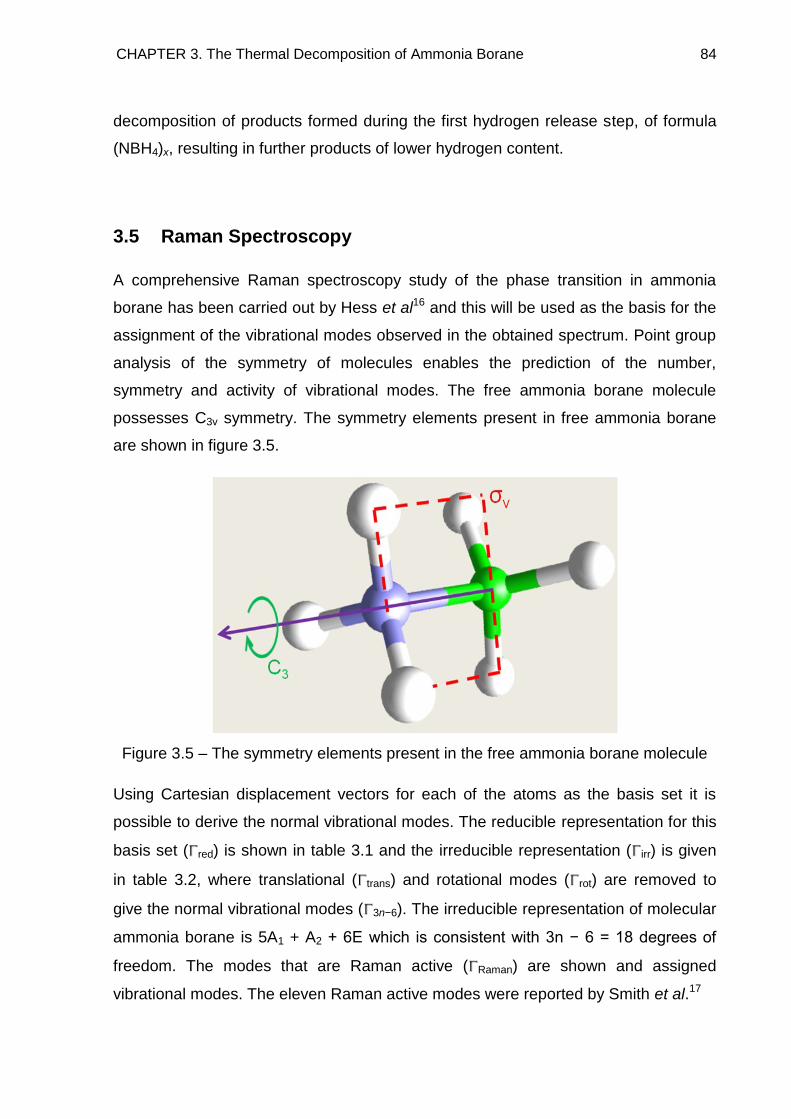
CHAPTER 3. The Thermal Decomposition of Ammonia Borane 84
decomposition of products formed during the first hydrogen release step, of formula
(NBH4)x, resulting in further products of lower hydrogen content.
3.5 Raman Spectroscopy
A comprehensive Raman spectroscopy study of the phase transition in ammonia
borane has been carried out by Hess et al16 and this will be used as the basis for the
assignment of the vibrational modes observed in the obtained spectrum. Point group
analysis of the symmetry of molecules enables the prediction of the number,
symmetry and activity of vibrational modes. The free ammonia borane molecule
possesses C3v symmetry. The symmetry elements present in free ammonia borane
are shown in figure 3.5.
Figure 3.5 – The symmetry elements present in the free ammonia borane molecule
Using Cartesian displacement vectors for each of the atoms as the basis set it is
possible to derive the normal vibrational modes. The reducible representation for this
basis set ( red) is shown in table 3.1 and the irreducible representation ( irr) is given
in table 3.2, where translational ( trans) and rotational modes ( rot) are removed to
give the normal vibrational modes ( 3n−6). The irreducible representation of molecular
ammonia borane is 5A1 + A2 + 6E which is consistent with 3n − 6 = 18 degrees of
freedom. The modes that are Raman active ( Raman) are shown and assigned
vibrational modes. The eleven Raman active modes were reported by Smith et al.17
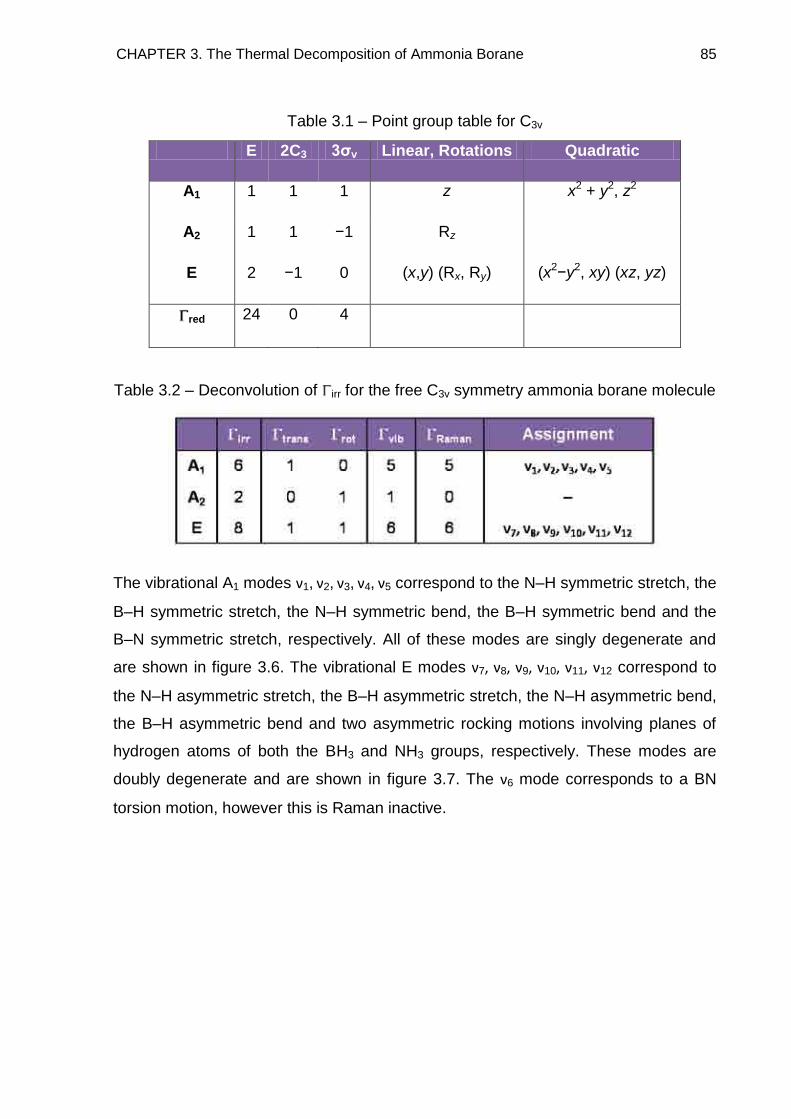
CHAPTER 3. The Thermal Decomposition of Ammonia Borane 85
Table 3.1 – Point group table for C3v
E 2C3 3σv Linear, Rotations Quadratic
A1 1 1 1 z x2 + y2, z2
A2 1 1 −1 Rz
E 2 −1 0 (x,y) (Rx, Ry) (x2−y2, xy) (xz, yz)
red 24 0 4
Table 3.2 – Deconvolution of irr for the free C3v symmetry ammonia borane molecule
The vibrational A1 modes ν1, ν2, ν3, ν4, ν5 correspond to the N–H symmetric stretch, the
B–H symmetric stretch, the N–H symmetric bend, the B–H symmetric bend and the
B–N symmetric stretch, respectively. All of these modes are singly degenerate and
are shown in figure 3.6. The vibrational E modes ν7, ν8, ν9, ν10, ν11, ν12 correspond to
the N–H asymmetric stretch, the B–H asymmetric stretch, the N–H asymmetric bend,
the B–H asymmetric bend and two asymmetric rocking motions involving planes of
hydrogen atoms of both the BH3 and NH3 groups, respectively. These modes are
doubly degenerate and are shown in figure 3.7. The ν6 mode corresponds to a BN
torsion motion, however this is Raman inactive.
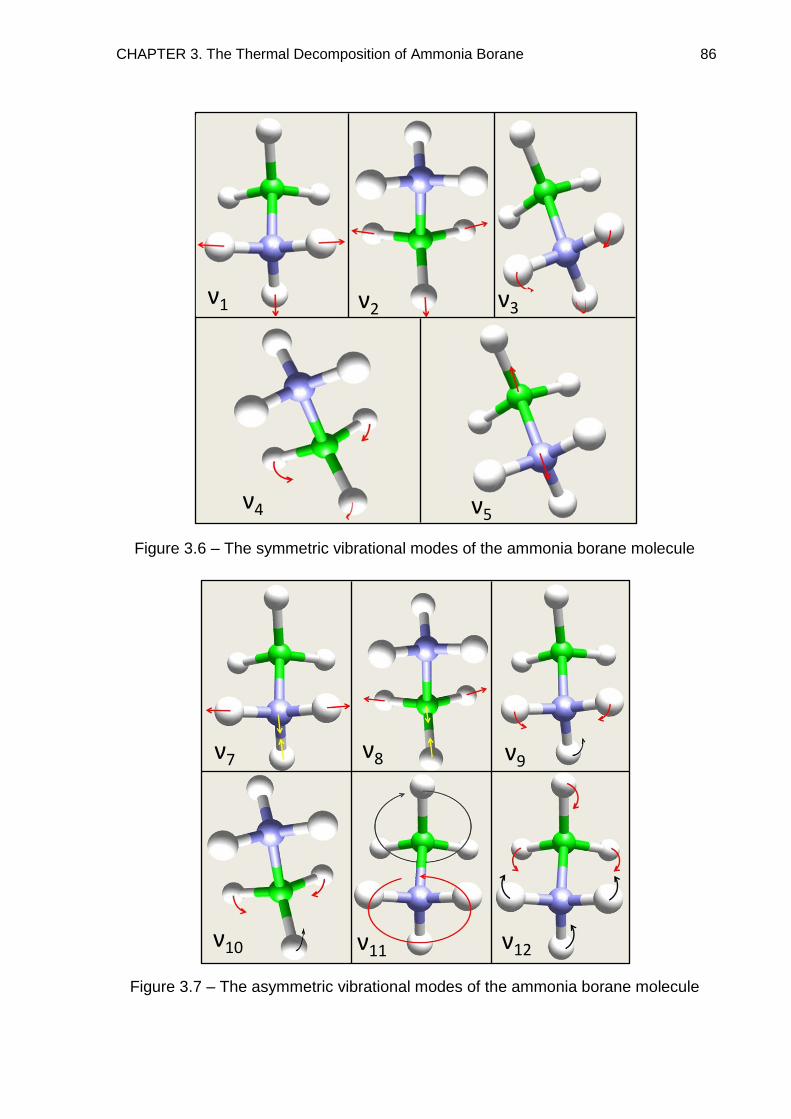
CHAPTER 3. The Thermal Decomposition of Ammonia Borane 86
Figure 3.6 – The symmetric vibrational modes of the ammonia borane molecule
Figure 3.7 – The asymmetric vibrational modes of the ammonia borane molecule
ν1 ν2
ν4 ν5
ν3
ν12ν10
ν9ν8ν7
ν11
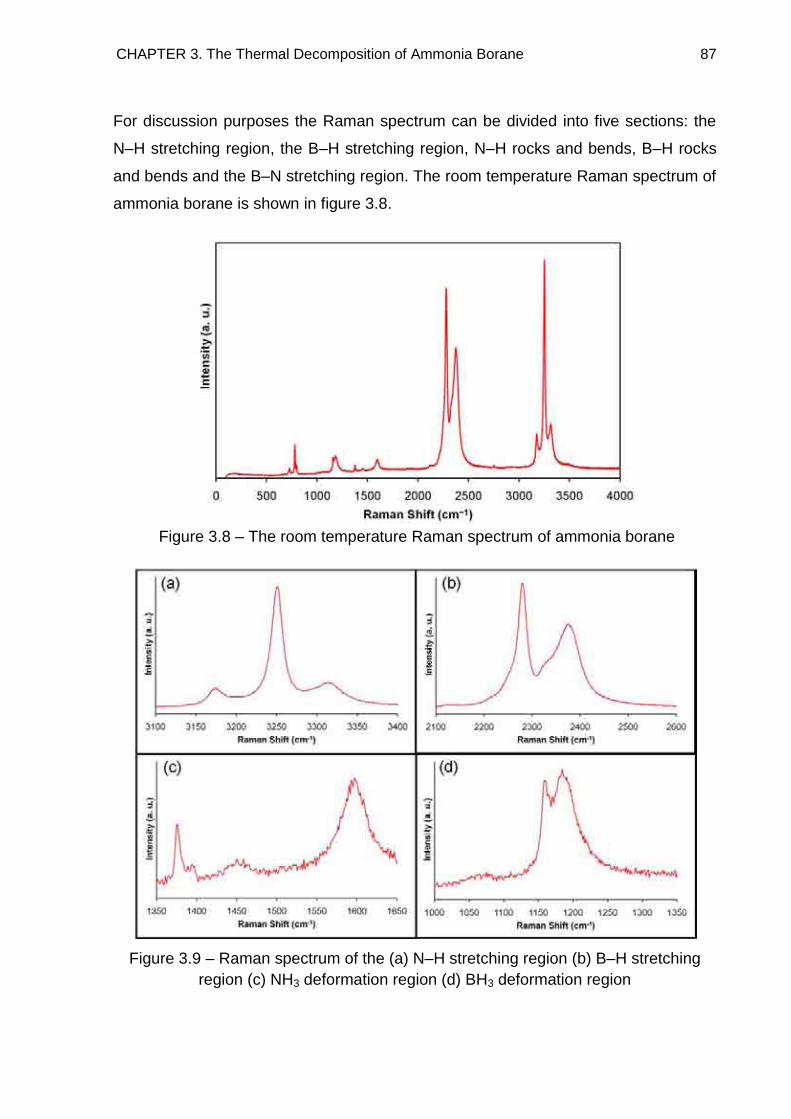
CHAPTER 3. The Thermal Decomposition of Ammonia Borane 87
For discussion purposes the Raman spectrum can be divided into five sections: the
N–H stretching region, the B–H stretching region, N–H rocks and bends, B–H rocks
and bends and the B–N stretching region. The room temperature Raman spectrum of
ammonia borane is shown in figure 3.8.
Figure 3.8 – The room temperature Raman spectrum of ammonia borane
Figure 3.9 – Raman spectrum of the (a) N–H stretching region (b) B–H stretching
region (c) NH3 deformation region (d) BH3 deformation region
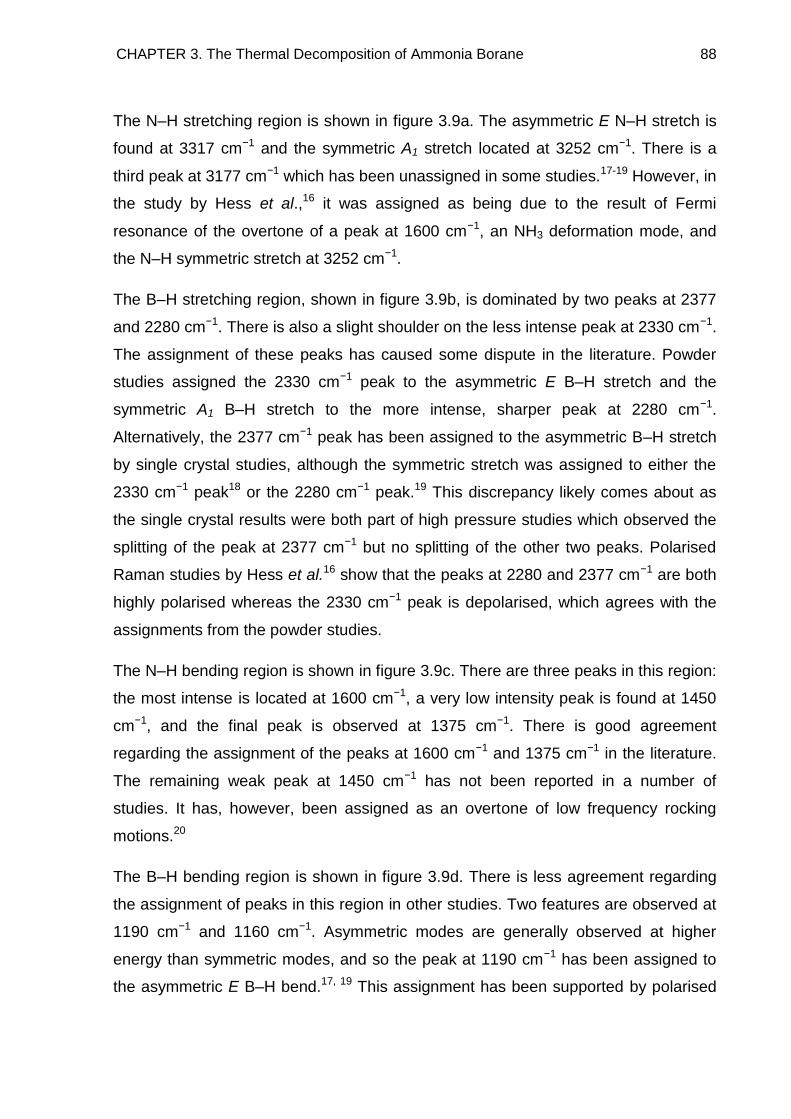
CHAPTER 3. The Thermal Decomposition of Ammonia Borane 88
The N–H stretching region is shown in figure 3.9a. The asymmetric E N–H stretch is
found at 3317 cm−1 and the symmetric A1 stretch located at 3252 cm−1. There is a
third peak at 3177 cm−1 which has been unassigned in some studies.17-19 However, in
the study by Hess et al.,16 it was assigned as being due to the result of Fermi
resonance of the overtone of a peak at 1600 cm−1, an NH3 deformation mode, and
the N–H symmetric stretch at 3252 cm−1.
The B–H stretching region, shown in figure 3.9b, is dominated by two peaks at 2377
and 2280 cm−1. There is also a slight shoulder on the less intense peak at 2330 cm−1.
The assignment of these peaks has caused some dispute in the literature. Powder
studies assigned the 2330 cm−1 peak to the asymmetric E B–H stretch and the
symmetric A1 B–H stretch to the more intense, sharper peak at 2280 cm−1.
Alternatively, the 2377 cm−1 peak has been assigned to the asymmetric B–H stretch
by single crystal studies, although the symmetric stretch was assigned to either the
2330 cm−1 peak18 or the 2280 cm−1 peak.19 This discrepancy likely comes about as
the single crystal results were both part of high pressure studies which observed the
splitting of the peak at 2377 cm−1 but no splitting of the other two peaks. Polarised
Raman studies by Hess et al.16 show that the peaks at 2280 and 2377 cm−1 are both
highly polarised whereas the 2330 cm−1 peak is depolarised, which agrees with the
assignments from the powder studies.
The N–H bending region is shown in figure 3.9c. There are three peaks in this region:
the most intense is located at 1600 cm−1, a very low intensity peak is found at 1450
cm−1, and the final peak is observed at 1375 cm−1. There is good agreement
regarding the assignment of the peaks at 1600 cm−1 and 1375 cm−1 in the literature.
The remaining weak peak at 1450 cm−1 has not been reported in a number of
studies. It has, however, been assigned as an overtone of low frequency rocking
motions.20
The B–H bending region is shown in figure 3.9d. There is less agreement regarding
the assignment of peaks in this region in other studies. Two features are observed at
1190 cm−1 and 1160 cm−1. Asymmetric modes are generally observed at higher
energy than symmetric modes, and so the peak at 1190 cm−1 has been assigned to
the asymmetric E B–H bend.17, 19 This assignment has been supported by polarised
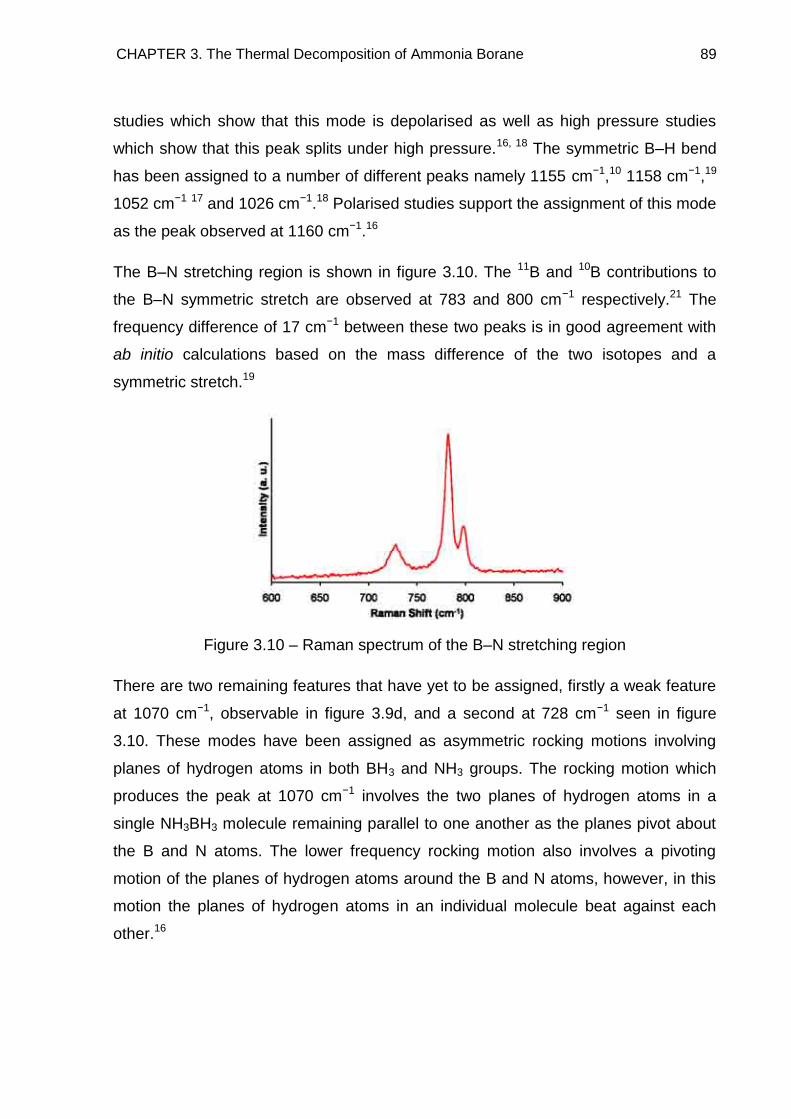
CHAPTER 3. The Thermal Decomposition of Ammonia Borane 89
studies which show that this mode is depolarised as well as high pressure studies
which show that this peak splits under high pressure.16, 18 The symmetric B–H bend
has been assigned to a number of different peaks namely 1155 cm−1,10 1158 cm−1,19
1052 cm−1 17 and 1026 cm−1.18 Polarised studies support the assignment of this mode
as the peak observed at 1160 cm−1.16
The B–N stretching region is shown in figure 3.10. The 11B and 10B contributions to
the B–N symmetric stretch are observed at 783 and 800 cm−1 respectively.21 The
frequency difference of 17 cm−1 between these two peaks is in good agreement with
ab initio calculations based on the mass difference of the two isotopes and a
symmetric stretch.19
Figure 3.10 – Raman spectrum of the B–N stretching region
There are two remaining features that have yet to be assigned, firstly a weak feature
at 1070 cm−1, observable in figure 3.9d, and a second at 728 cm−1 seen in figure
3.10. These modes have been assigned as asymmetric rocking motions involving
planes of hydrogen atoms in both BH3 and NH3 groups. The rocking motion which
produces the peak at 1070 cm−1 involves the two planes of hydrogen atoms in a
single NH3BH3 molecule remaining parallel to one another as the planes pivot about
the B and N atoms. The lower frequency rocking motion also involves a pivoting
motion of the planes of hydrogen atoms around the B and N atoms, however, in this
motion the planes of hydrogen atoms in an individual molecule beat against each
other.16
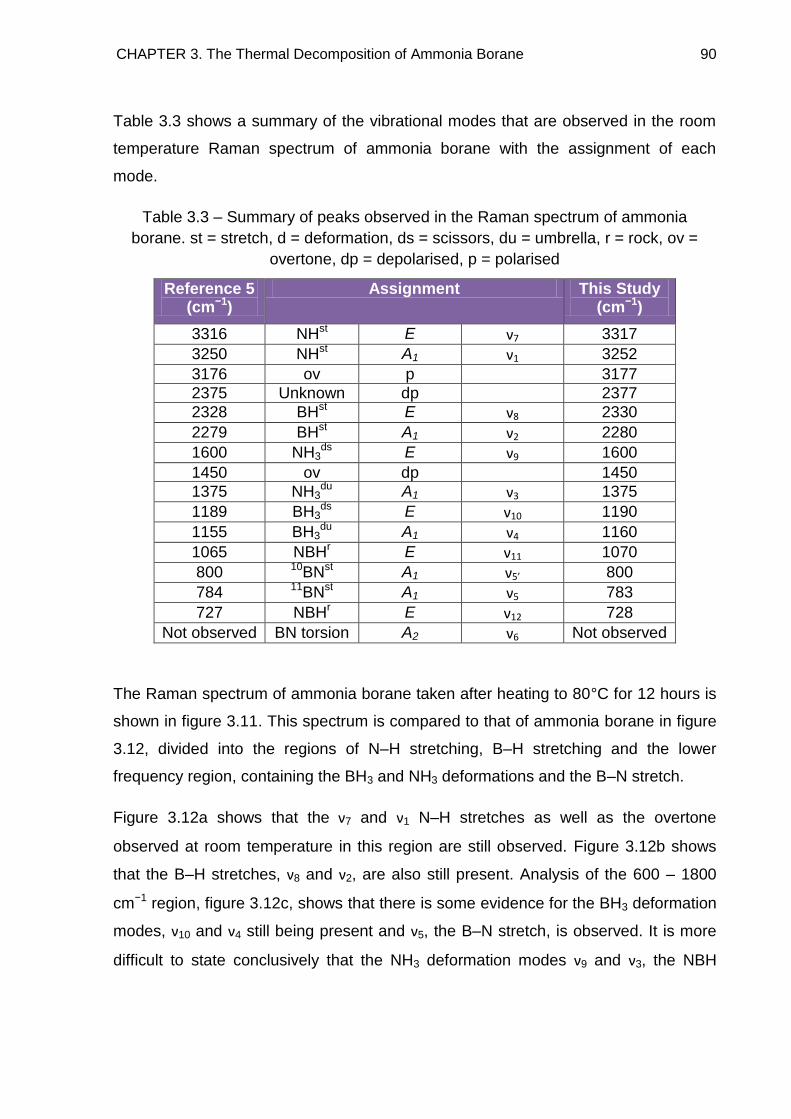
CHAPTER 3. The Thermal Decomposition of Ammonia Borane 90
Table 3.3 shows a summary of the vibrational modes that are observed in the room
temperature Raman spectrum of ammonia borane with the assignment of each
mode.
Table 3.3 – Summary of peaks observed in the Raman spectrum of ammonia
borane. st = stretch, d = deformation, ds = scissors, du = umbrella, r = rock, ov =
overtone, dp = depolarised, p = polarised
Reference 5 (cm−1)
Assignment This Study (cm−1)
3316 NHst E ν7 3317
3250 NHst A1 ν1 3252
3176 ov p 3177
2375 Unknown dp 2377
2328 BHst E ν8 2330
2279 BHst A1 ν2 2280
1600 NH3ds E ν9 1600
1450 ov dp 1450
1375 NH3du A1 ν3 1375
1189 BH3ds E ν10 1190
1155 BH3du A1 ν4 1160
1065 NBHr E ν11 1070
800 10BNst A1 ν5’ 800
784 11BNst A1 ν5 783
727 NBHr E ν12 728
Not observed BN torsion A2 ν6 Not observed
The Raman spectrum of ammonia borane taken after heating to 80°C for 12 hours is
shown in figure 3.11. This spectrum is compared to that of ammonia borane in figure
3.12, divided into the regions of N–H stretching, B–H stretching and the lower
frequency region, containing the BH3 and NH3 deformations and the B–N stretch.
Figure 3.12a shows that the ν7 and ν1 N–H stretches as well as the overtone
observed at room temperature in this region are still observed. Figure 3.12b shows
that the B–H stretches, ν8 and ν2, are also still present. Analysis of the 600 – 1800
cm−1 region, figure 3.12c, shows that there is some evidence for the BH3 deformation
modes, ν10 and ν4 still being present and ν5, the B–N stretch, is observed. It is more
difficult to state conclusively that the NH3 deformation modes ν9 and ν3, the NBH
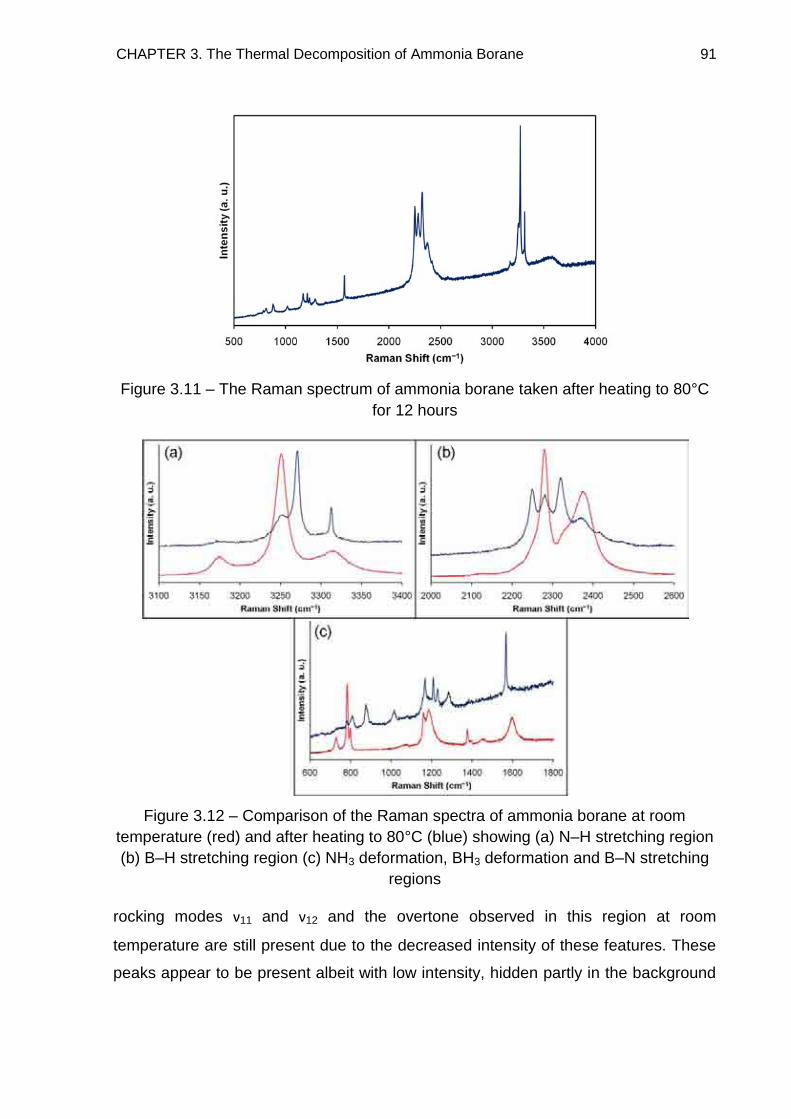
CHAPTER 3. The Thermal Decomposition of Ammonia Borane 91
Figure 3.11 – The Raman spectrum of ammonia borane taken after heating to 80°C
for 12 hours
Figure 3.12 – Comparison of the Raman spectra of ammonia borane at room
temperature (red) and after heating to 80°C (blue) showing (a) N–H stretching region
(b) B–H stretching region (c) NH3 deformation, BH3 deformation and B–N stretching
regions
rocking modes ν11 and ν12 and the overtone observed in this region at room
temperature are still present due to the decreased intensity of these features. These
peaks appear to be present albeit with low intensity, hidden partly in the background
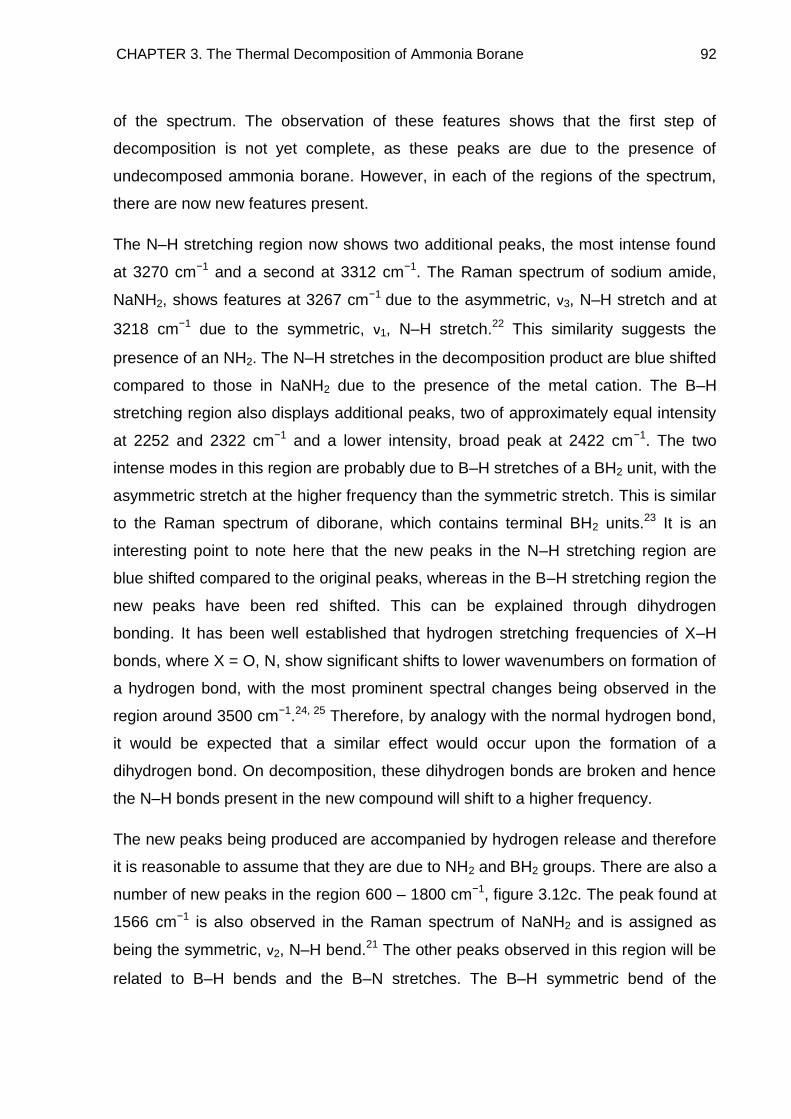
CHAPTER 3. The Thermal Decomposition of Ammonia Borane 92
of the spectrum. The observation of these features shows that the first step of
decomposition is not yet complete, as these peaks are due to the presence of
undecomposed ammonia borane. However, in each of the regions of the spectrum,
there are now new features present.
The N–H stretching region now shows two additional peaks, the most intense found
at 3270 cm−1 and a second at 3312 cm−1. The Raman spectrum of sodium amide,
NaNH2, shows features at 3267 cm−1 due to the asymmetric, ν3, N–H stretch and at
3218 cm−1 due to the symmetric, ν1, N–H stretch.22 This similarity suggests the
presence of an NH2. The N–H stretches in the decomposition product are blue shifted
compared to those in NaNH2 due to the presence of the metal cation. The B–H
stretching region also displays additional peaks, two of approximately equal intensity
at 2252 and 2322 cm−1 and a lower intensity, broad peak at 2422 cm−1. The two
intense modes in this region are probably due to B–H stretches of a BH2 unit, with the
asymmetric stretch at the higher frequency than the symmetric stretch. This is similar
to the Raman spectrum of diborane, which contains terminal BH2 units.23 It is an
interesting point to note here that the new peaks in the N–H stretching region are
blue shifted compared to the original peaks, whereas in the B–H stretching region the
new peaks have been red shifted. This can be explained through dihydrogen
bonding. It has been well established that hydrogen stretching frequencies of X–H
bonds, where X = O, N, show significant shifts to lower wavenumbers on formation of
a hydrogen bond, with the most prominent spectral changes being observed in the
region around 3500 cm−1.24, 25 Therefore, by analogy with the normal hydrogen bond,
it would be expected that a similar effect would occur upon the formation of a
dihydrogen bond. On decomposition, these dihydrogen bonds are broken and hence
the N–H bonds present in the new compound will shift to a higher frequency.
The new peaks being produced are accompanied by hydrogen release and therefore
it is reasonable to assume that they are due to NH2 and BH2 groups. There are also a
number of new peaks in the region 600 – 1800 cm−1, figure 3.12c. The peak found at
1566 cm−1 is also observed in the Raman spectrum of NaNH2 and is assigned as
being the symmetric, ν2, N–H bend.21 The other peaks observed in this region will be
related to B–H bends and the B–N stretches. The B–H symmetric bend of the
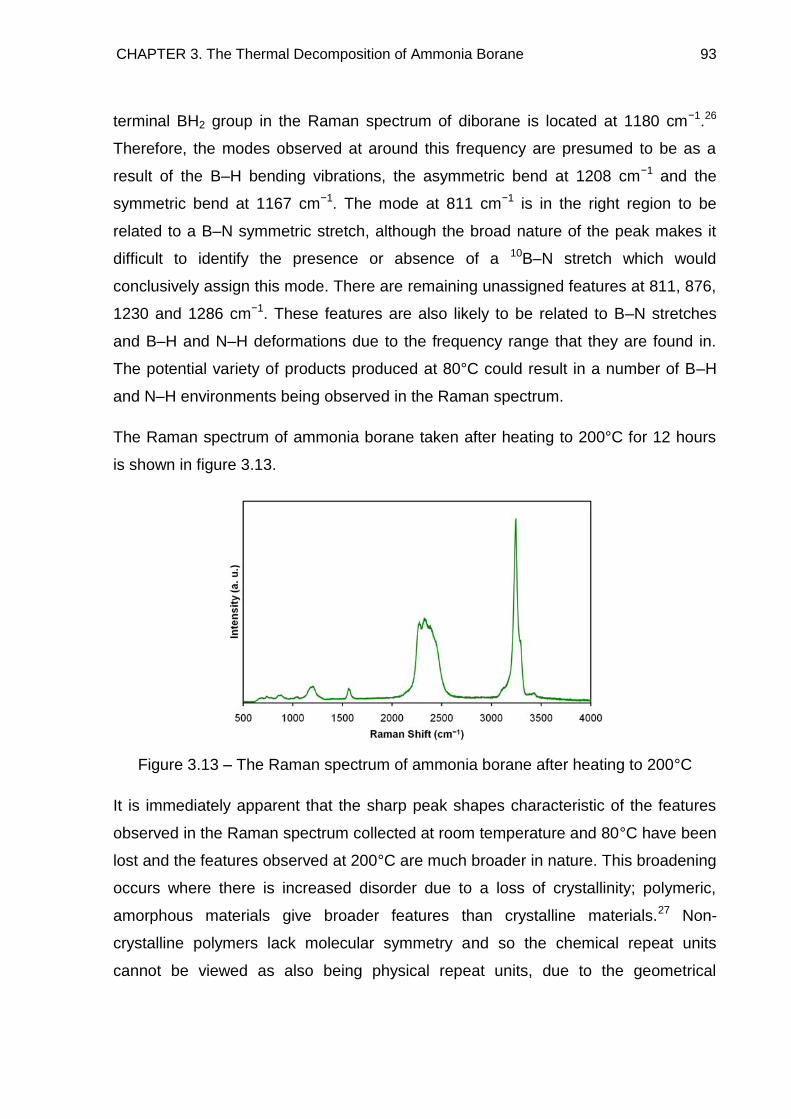
CHAPTER 3. The Thermal Decomposition of Ammonia Borane 93
terminal BH2 group in the Raman spectrum of diborane is located at 1180 cm−1.26
Therefore, the modes observed at around this frequency are presumed to be as a
result of the B–H bending vibrations, the asymmetric bend at 1208 cm−1 and the
symmetric bend at 1167 cm−1. The mode at 811 cm−1 is in the right region to be
related to a B–N symmetric stretch, although the broad nature of the peak makes it
difficult to identify the presence or absence of a 10B–N stretch which would
conclusively assign this mode. There are remaining unassigned features at 811, 876,
1230 and 1286 cm−1. These features are also likely to be related to B–N stretches
and B–H and N–H deformations due to the frequency range that they are found in.
The potential variety of products produced at 80°C could result in a number of B–H
and N–H environments being observed in the Raman spectrum.
The Raman spectrum of ammonia borane taken after heating to 200°C for 12 hours
is shown in figure 3.13.
Figure 3.13 – The Raman spectrum of ammonia borane after heating to 200°C
It is immediately apparent that the sharp peak shapes characteristic of the features
observed in the Raman spectrum collected at room temperature and 80°C have been
lost and the features observed at 200°C are much broader in nature. This broadening
occurs where there is increased disorder due to a loss of crystallinity; polymeric,
amorphous materials give broader features than crystalline materials.27 Non-
crystalline polymers lack molecular symmetry and so the chemical repeat units
cannot be viewed as also being physical repeat units, due to the geometrical
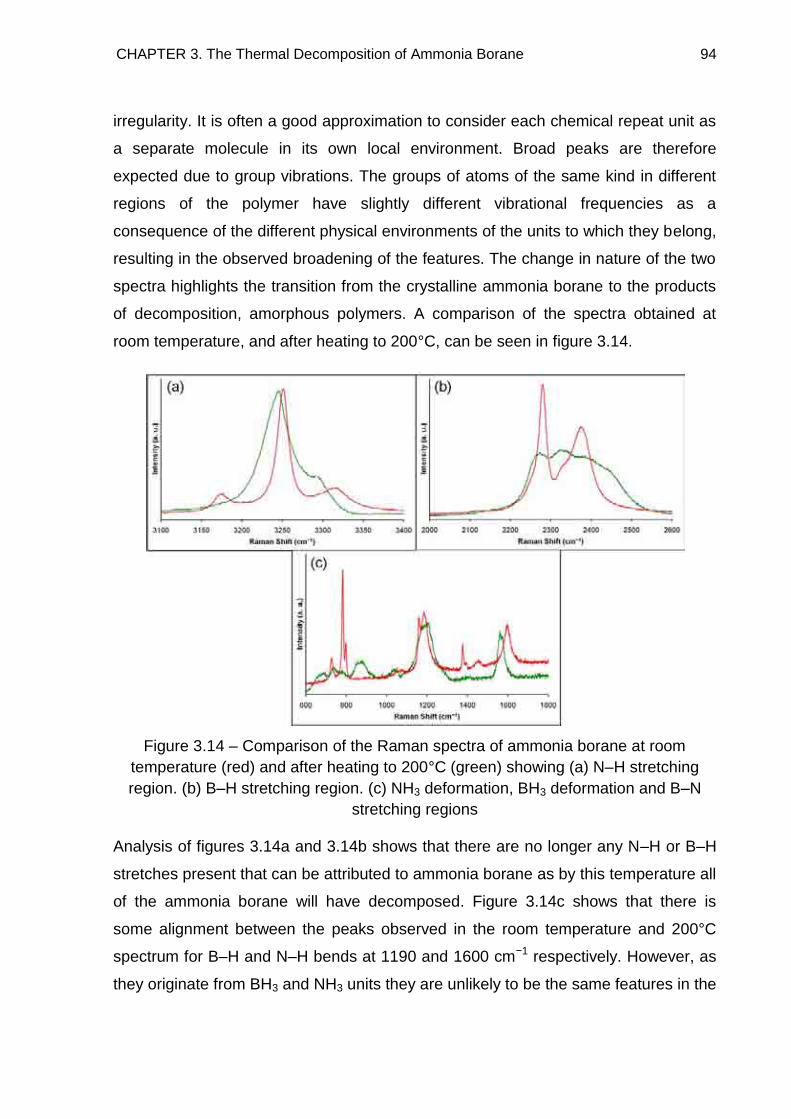
CHAPTER 3. The Thermal Decomposition of Ammonia Borane 94
irregularity. It is often a good approximation to consider each chemical repeat unit as
a separate molecule in its own local environment. Broad peaks are therefore
expected due to group vibrations. The groups of atoms of the same kind in different
regions of the polymer have slightly different vibrational frequencies as a
consequence of the different physical environments of the units to which they belong,
resulting in the observed broadening of the features. The change in nature of the two
spectra highlights the transition from the crystalline ammonia borane to the products
of decomposition, amorphous polymers. A comparison of the spectra obtained at
room temperature, and after heating to 200°C, can be seen in figure 3.14.
Figure 3.14 – Comparison of the Raman spectra of ammonia borane at room
temperature (red) and after heating to 200°C (green) showing (a) N–H stretching
region. (b) B–H stretching region. (c) NH3 deformation, BH3 deformation and B–N
stretching regions
Analysis of figures 3.14a and 3.14b shows that there are no longer any N–H or B–H
stretches present that can be attributed to ammonia borane as by this temperature all
of the ammonia borane will have decomposed. Figure 3.14c shows that there is
some alignment between the peaks observed in the room temperature and 200°C
spectrum for B–H and N–H bends at 1190 and 1600 cm−1 respectively. However, as
they originate from BH3 and NH3 units they are unlikely to be the same features in the
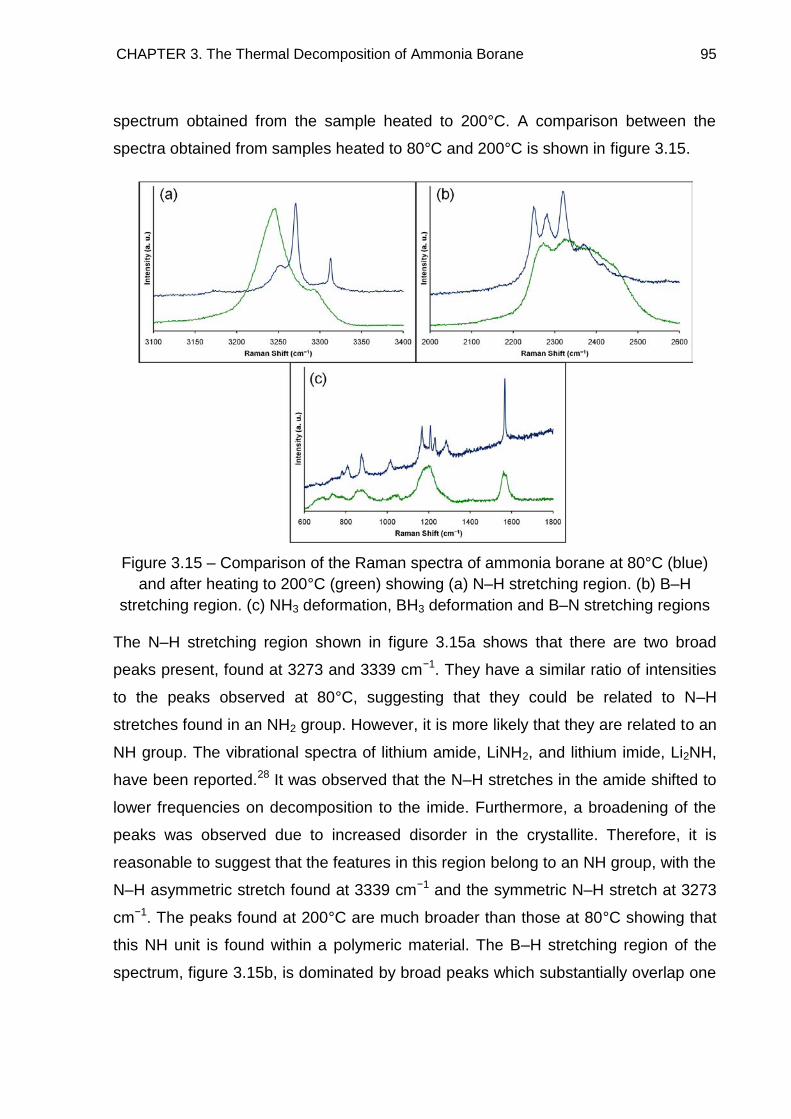
CHAPTER 3. The Thermal Decomposition of Ammonia Borane 95
spectrum obtained from the sample heated to 200°C. A comparison between the
spectra obtained from samples heated to 80°C and 200°C is shown in figure 3.15.
Figure 3.15 – Comparison of the Raman spectra of ammonia borane at 80°C (blue)
and after heating to 200°C (green) showing (a) N–H stretching region. (b) B–H
stretching region. (c) NH3 deformation, BH3 deformation and B–N stretching regions
The N–H stretching region shown in figure 3.15a shows that there are two broad
peaks present, found at 3273 and 3339 cm−1. They have a similar ratio of intensities
to the peaks observed at 80°C, suggesting that they could be related to N–H
stretches found in an NH2 group. However, it is more likely that they are related to an
NH group. The vibrational spectra of lithium amide, LiNH2, and lithium imide, Li2NH,
have been reported.28 It was observed that the N–H stretches in the amide shifted to
lower frequencies on decomposition to the imide. Furthermore, a broadening of the
peaks was observed due to increased disorder in the crystallite. Therefore, it is
reasonable to suggest that the features in this region belong to an NH group, with the
N–H asymmetric stretch found at 3339 cm−1 and the symmetric N–H stretch at 3273
cm−1. The peaks found at 200°C are much broader than those at 80°C showing that
this NH unit is found within a polymeric material. The B–H stretching region of the
spectrum, figure 3.15b, is dominated by broad peaks which substantially overlap one
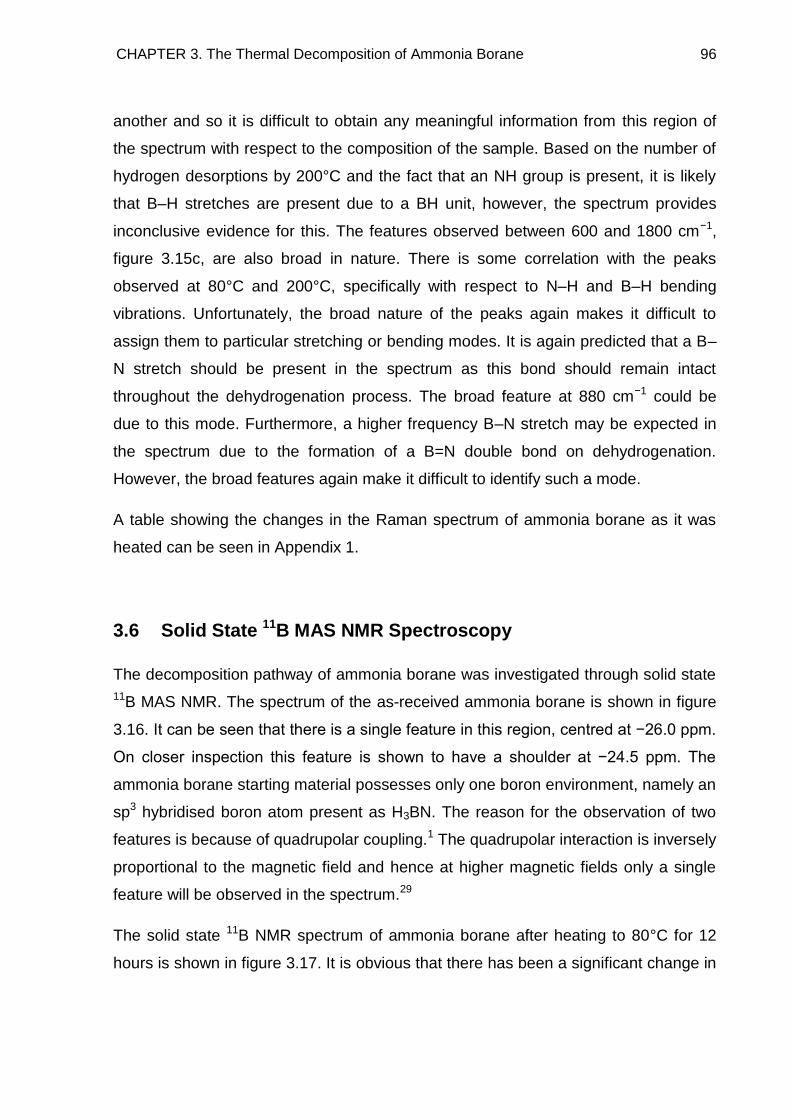
CHAPTER 3. The Thermal Decomposition of Ammonia Borane 96
another and so it is difficult to obtain any meaningful information from this region of
the spectrum with respect to the composition of the sample. Based on the number of
hydrogen desorptions by 200°C and the fact that an NH group is present, it is likely
that B–H stretches are present due to a BH unit, however, the spectrum provides
inconclusive evidence for this. The features observed between 600 and 1800 cm−1,
figure 3.15c, are also broad in nature. There is some correlation with the peaks
observed at 80°C and 200°C, specifically with respect to N–H and B–H bending
vibrations. Unfortunately, the broad nature of the peaks again makes it difficult to
assign them to particular stretching or bending modes. It is again predicted that a B–
N stretch should be present in the spectrum as this bond should remain intact
throughout the dehydrogenation process. The broad feature at 880 cm−1 could be
due to this mode. Furthermore, a higher frequency B–N stretch may be expected in
the spectrum due to the formation of a B=N double bond on dehydrogenation.
However, the broad features again make it difficult to identify such a mode.
A table showing the changes in the Raman spectrum of ammonia borane as it was
heated can be seen in Appendix 1.
3.6 Solid State 11B MAS NMR Spectroscopy
The decomposition pathway of ammonia borane was investigated through solid state
11B MAS NMR. The spectrum of the as-received ammonia borane is shown in figure
3.16. It can be seen that there is a single feature in this region, centred at −26.0 ppm.
On closer inspection this feature is shown to have a shoulder at −24.5 ppm. The
ammonia borane starting material possesses only one boron environment, namely an
sp3 hybridised boron atom present as H3BN. The reason for the observation of two
features is because of quadrupolar coupling.1 The quadrupolar interaction is inversely
proportional to the magnetic field and hence at higher magnetic fields only a single
feature will be observed in the spectrum.29
The solid state 11B NMR spectrum of ammonia borane after heating to 80°C for 12
hours is shown in figure 3.17. It is obvious that there has been a significant change in
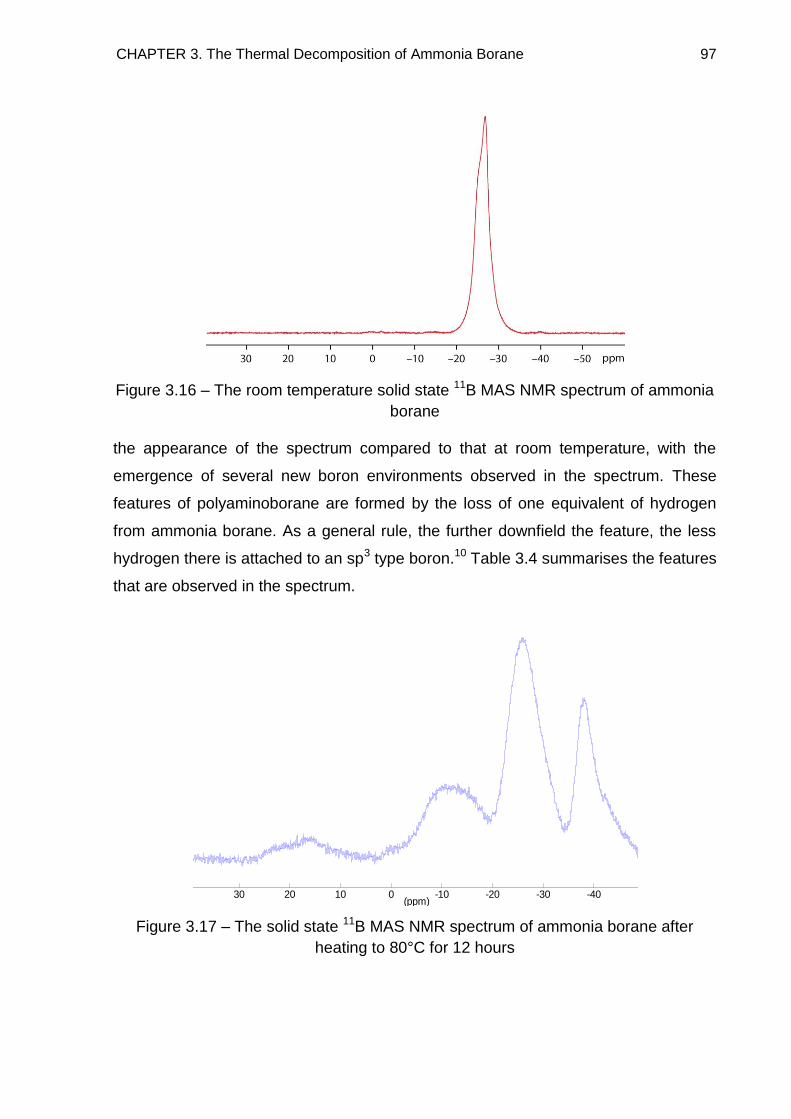
CHAPTER 3. The Thermal Decomposition of Ammonia Borane 97
Figure 3.16 – The room temperature solid state 11B MAS NMR spectrum of ammonia
borane
the appearance of the spectrum compared to that at room temperature, with the
emergence of several new boron environments observed in the spectrum. These
features of polyaminoborane are formed by the loss of one equivalent of hydrogen
from ammonia borane. As a general rule, the further downfield the feature, the less
hydrogen there is attached to an sp3 type boron.10 Table 3.4 summarises the features
that are observed in the spectrum.
Figure 3.17 – The solid state 11B MAS NMR spectrum of ammonia borane after
heating to 80°C for 12 hours
(ppm)-40-30-20-100102030
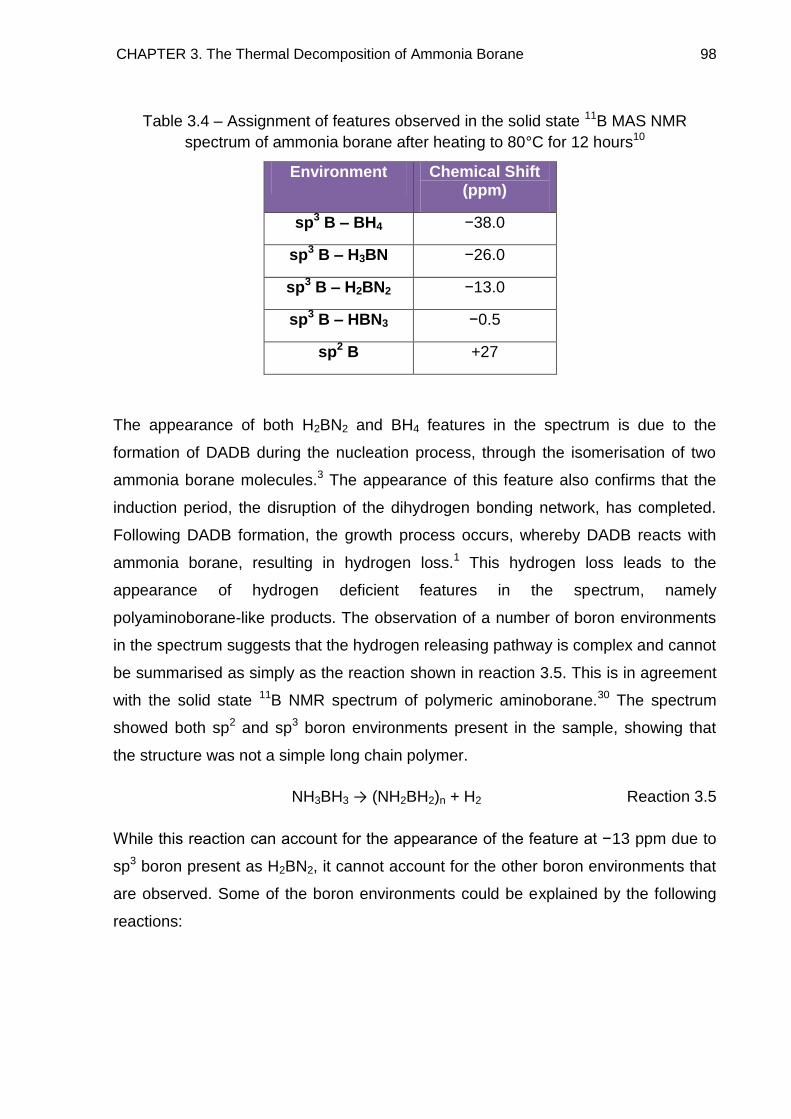
CHAPTER 3. The Thermal Decomposition of Ammonia Borane 98
Table 3.4 – Assignment of features observed in the solid state 11B MAS NMR
spectrum of ammonia borane after heating to 80°C for 12 hours10
Environment Chemical Shift (ppm)
sp3 B – BH4 −38.0
sp3 B – H3BN −26.0
sp3 B – H2BN2 −13.0
sp3 B – HBN3 −0.5
sp2 B +27
The appearance of both H2BN2 and BH4 features in the spectrum is due to the
formation of DADB during the nucleation process, through the isomerisation of two
ammonia borane molecules.3 The appearance of this feature also confirms that the
induction period, the disruption of the dihydrogen bonding network, has completed.
Following DADB formation, the growth process occurs, whereby DADB reacts with
ammonia borane, resulting in hydrogen loss.1 This hydrogen loss leads to the
appearance of hydrogen deficient features in the spectrum, namely
polyaminoborane-like products. The observation of a number of boron environments
in the spectrum suggests that the hydrogen releasing pathway is complex and cannot
be summarised as simply as the reaction shown in reaction 3.5. This is in agreement
with the solid state 11B NMR spectrum of polymeric aminoborane.30 The spectrum
showed both sp2 and sp3 boron environments present in the sample, showing that
the structure was not a simple long chain polymer.
NH3BH3 → (NH2BH2)n + H2 Reaction 3.5
While this reaction can account for the appearance of the feature at −13 ppm due to
sp3 boron present as H2BN2, it cannot account for the other boron environments that
are observed. Some of the boron environments could be explained by the following
reactions:
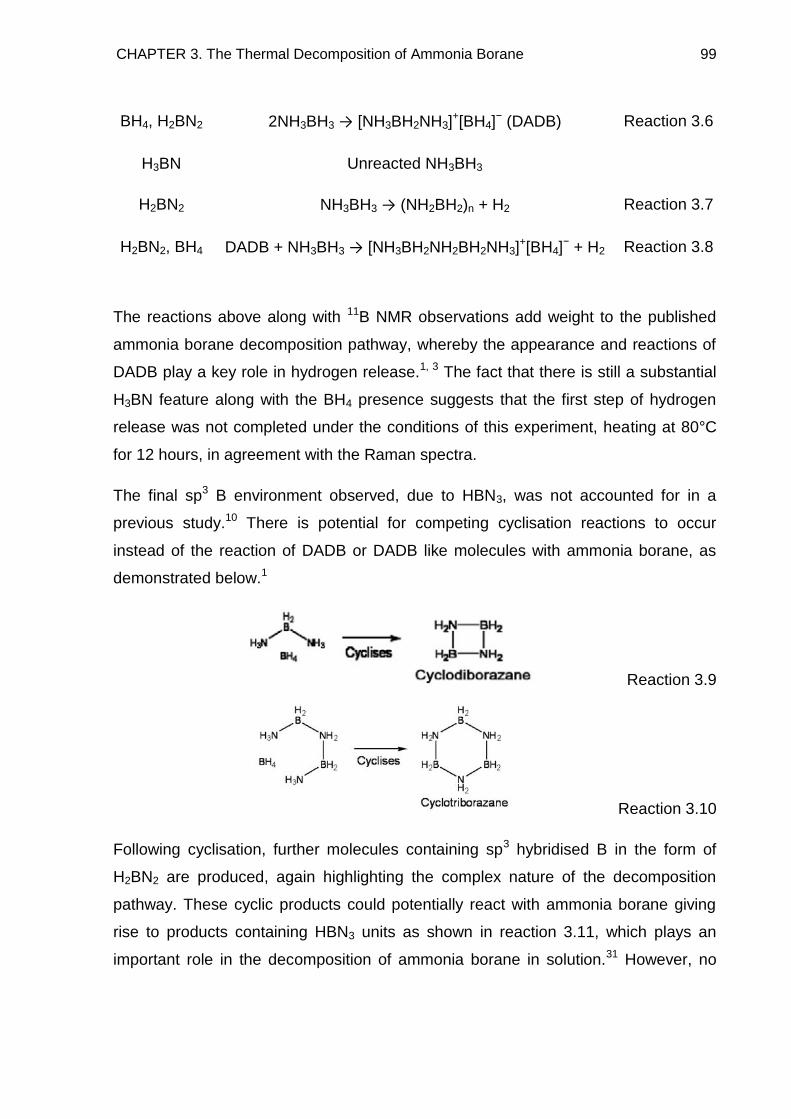
CHAPTER 3. The Thermal Decomposition of Ammonia Borane 99
BH4, H2BN2 2NH3BH3 → [NH3BH2NH3]+[BH4]
− (DADB) Reaction 3.6
H3BN Unreacted NH3BH3
H2BN2 NH3BH3 → (NH2BH2)n + H2 Reaction 3.7
H2BN2, BH4 DADB + NH3BH3 → [NH3BH2NH2BH2NH3]+[BH4]
− + H2 Reaction 3.8
The reactions above along with 11B NMR observations add weight to the published
ammonia borane decomposition pathway, whereby the appearance and reactions of
DADB play a key role in hydrogen release.1, 3 The fact that there is still a substantial
H3BN feature along with the BH4 presence suggests that the first step of hydrogen
release was not completed under the conditions of this experiment, heating at 80°C
for 12 hours, in agreement with the Raman spectra.
The final sp3 B environment observed, due to HBN3, was not accounted for in a
previous study.10 There is potential for competing cyclisation reactions to occur
instead of the reaction of DADB or DADB like molecules with ammonia borane, as
demonstrated below.1
Reaction 3.9
Reaction 3.10
Following cyclisation, further molecules containing sp3 hybridised B in the form of
H2BN2 are produced, again highlighting the complex nature of the decomposition
pathway. These cyclic products could potentially react with ammonia borane giving
rise to products containing HBN3 units as shown in reaction 3.11, which plays an
important role in the decomposition of ammonia borane in solution.31 However, no
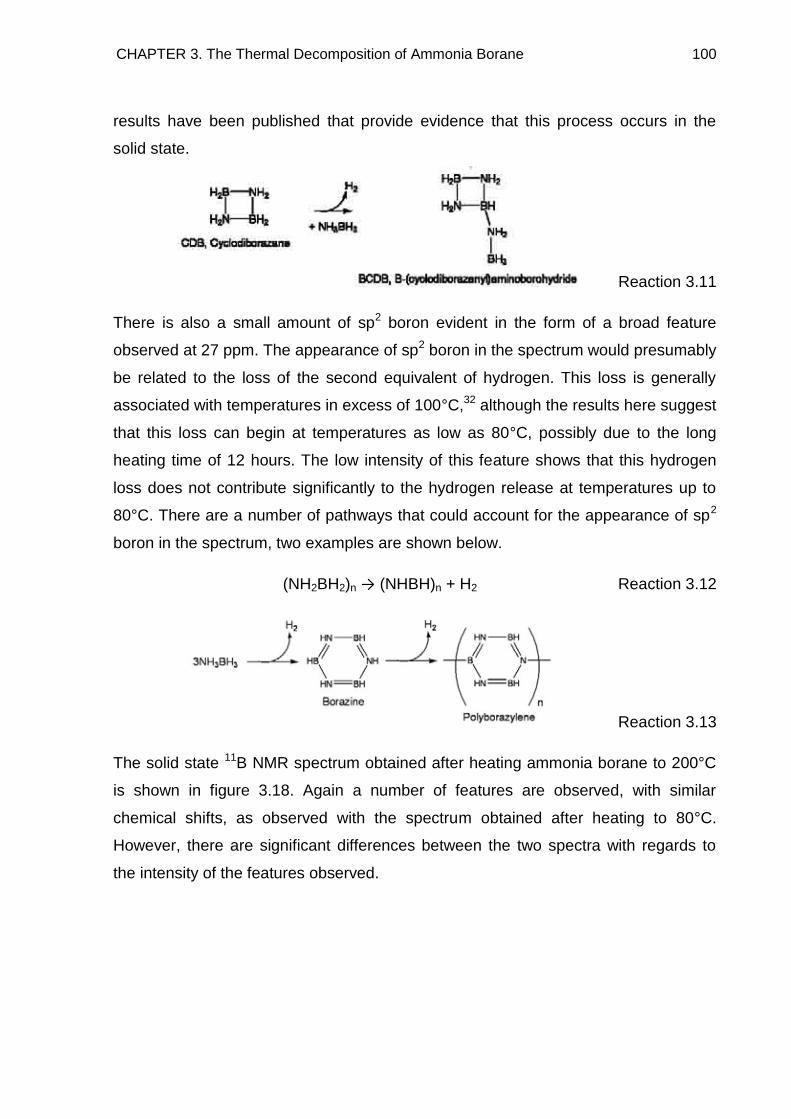
CHAPTER 3. The Thermal Decomposition of Ammonia Borane 100
results have been published that provide evidence that this process occurs in the
solid state.
Reaction 3.11
There is also a small amount of sp2 boron evident in the form of a broad feature
observed at 27 ppm. The appearance of sp2 boron in the spectrum would presumably
be related to the loss of the second equivalent of hydrogen. This loss is generally
associated with temperatures in excess of 100°C,32 although the results here suggest
that this loss can begin at temperatures as low as 80°C, possibly due to the long
heating time of 12 hours. The low intensity of this feature shows that this hydrogen
loss does not contribute significantly to the hydrogen release at temperatures up to
80°C. There are a number of pathways that could account for the appearance of sp2
boron in the spectrum, two examples are shown below.
(NH2BH2)n → (NHBH)n + H2 Reaction 3.12
Reaction 3.13
The solid state 11B NMR spectrum obtained after heating ammonia borane to 200°C
is shown in figure 3.18. Again a number of features are observed, with similar
chemical shifts, as observed with the spectrum obtained after heating to 80°C.
However, there are significant differences between the two spectra with regards to
the intensity of the features observed.
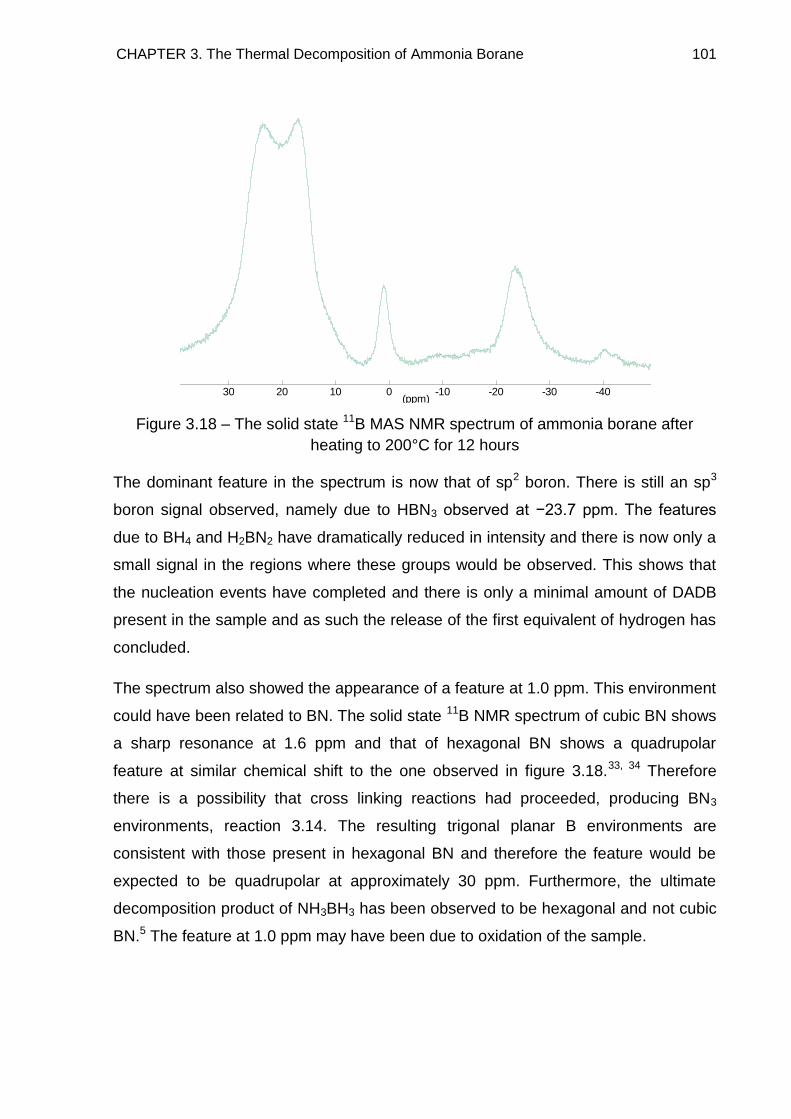
CHAPTER 3. The Thermal Decomposition of Ammonia Borane 101
Figure 3.18 – The solid state 11B MAS NMR spectrum of ammonia borane after
heating to 200°C for 12 hours
The dominant feature in the spectrum is now that of sp2 boron. There is still an sp3
boron signal observed, namely due to HBN3 observed at −23.7 ppm. The features
due to BH4 and H2BN2 have dramatically reduced in intensity and there is now only a
small signal in the regions where these groups would be observed. This shows that
the nucleation events have completed and there is only a minimal amount of DADB
present in the sample and as such the release of the first equivalent of hydrogen has
concluded.
The spectrum also showed the appearance of a feature at 1.0 ppm. This environment
could have been related to BN. The solid state 11B NMR spectrum of cubic BN shows
a sharp resonance at 1.6 ppm and that of hexagonal BN shows a quadrupolar
feature at similar chemical shift to the one observed in figure 3.18.33, 34 Therefore
there is a possibility that cross linking reactions had proceeded, producing BN3
environments, reaction 3.14. The resulting trigonal planar B environments are
consistent with those present in hexagonal BN and therefore the feature would be
expected to be quadrupolar at approximately 30 ppm. Furthermore, the ultimate
decomposition product of NH3BH3 has been observed to be hexagonal and not cubic
BN.5 The feature at 1.0 ppm may have been due to oxidation of the sample.
(ppm)-40-30-20-100102030
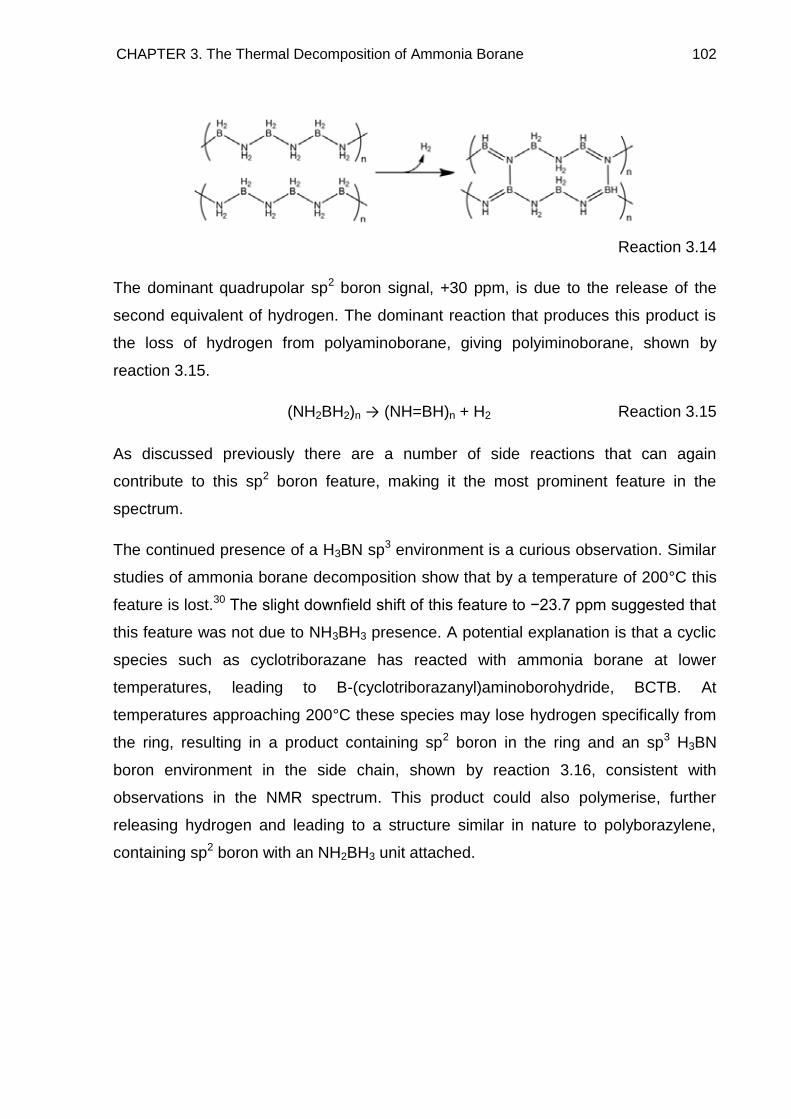
CHAPTER 3. The Thermal Decomposition of Ammonia Borane 102
Reaction 3.14
The dominant quadrupolar sp2 boron signal, +30 ppm, is due to the release of the
second equivalent of hydrogen. The dominant reaction that produces this product is
the loss of hydrogen from polyaminoborane, giving polyiminoborane, shown by
reaction 3.15.
(NH2BH2)n → (NH=BH)n + H2 Reaction 3.15
As discussed previously there are a number of side reactions that can again
contribute to this sp2 boron feature, making it the most prominent feature in the
spectrum.
The continued presence of a H3BN sp3 environment is a curious observation. Similar
studies of ammonia borane decomposition show that by a temperature of 200°C this
feature is lost.30 The slight downfield shift of this feature to −23.7 ppm suggested that
this feature was not due to NH3BH3 presence. A potential explanation is that a cyclic
species such as cyclotriborazane has reacted with ammonia borane at lower
temperatures, leading to B-(cyclotriborazanyl)aminoborohydride, BCTB. At
temperatures approaching 200°C these species may lose hydrogen specifically from
the ring, resulting in a product containing sp2 boron in the ring and an sp3 H3BN
boron environment in the side chain, shown by reaction 3.16, consistent with
observations in the NMR spectrum. This product could also polymerise, further
releasing hydrogen and leading to a structure similar in nature to polyborazylene,
containing sp2 boron with an NH2BH3 unit attached.
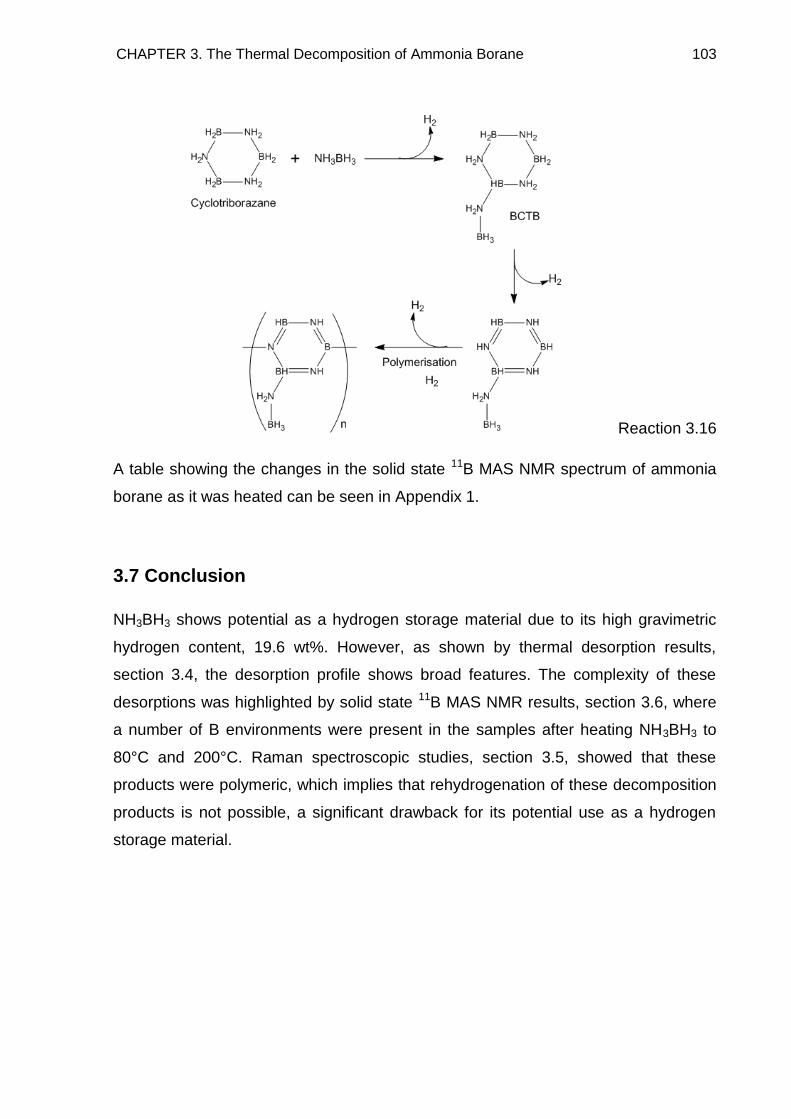
CHAPTER 3. The Thermal Decomposition of Ammonia Borane 103
Reaction 3.16
A table showing the changes in the solid state 11B MAS NMR spectrum of ammonia
borane as it was heated can be seen in Appendix 1.
3.7 Conclusion
NH3BH3 shows potential as a hydrogen storage material due to its high gravimetric
hydrogen content, 19.6 wt%. However, as shown by thermal desorption results,
section 3.4, the desorption profile shows broad features. The complexity of these
desorptions was highlighted by solid state 11B MAS NMR results, section 3.6, where
a number of B environments were present in the samples after heating NH3BH3 to
80°C and 200°C. Raman spectroscopic studies, section 3.5, showed that these
products were polymeric, which implies that rehydrogenation of these decomposition
products is not possible, a significant drawback for its potential use as a hydrogen
storage material.
CHAPTER 3. The Thermal Decomposition of Ammonia Borane 104
3.8 References
1. Stowe, A. C.; Shaw, W. J.; Linehan, J. C.; Schmid, B.; Autrey, T., In situ solid
state 11B MAS-NMR studies of the thermal decomposition of ammonia borane:
mechanistic studies of the hydrogen release pathways from a solid state hydrogen
storage material. Physical Chemistry Chemical Physics 2007, 9, 1831–1836.
2. Wolf, G.; Baumann, J.; Baitalow, F.; Hoffmann, F. P., Calorimetric process
monitoring of thermal decomposition of B–N–H compounds. Thermochimica Acta
2000, 343, 19–25.
3. Bowden, M. E.; Autrey, T.; Brown, I.; Ryan, M., The thermal decomposition of
ammonia borane: A potential hydrogen storage material. Current Applied Physics
2008, 8, 498–500.
4. Hu, M. G.; Geanangel, R. A.; Wendlandt, W. W., The thermal decomposition
of ammonia borane. Thermochimica Acta 1978, 23, 249–255.
5. Kim, D.; Moon, K.; Kho, J.; Economy, J.; Gervais, C.; Babonneau, F.,
Synthesis and characterization of poly(aminoborane) as a new boron nitride
precursor. Polymers for Advanced Technologies 1999, 10, 702–712.
6. Mayer, E., Symmetrical cleavage of diborane by ammonia in solution.
Inorganic Chemistry 1972, 11, 866–869.
7. Sit, V.; Geanangel, R. A.; Wendlandt, W. W., The thermal dissociation of
NH3BH3. Thermochimica Acta 1986, 113, 379–382.
8. Baitalow, F.; Baumann, J.; Wolf, G.; Jaenicke-Rössler, K.; Leitner, G., Thermal
decomposition of B–N–H compounds investigated by using combined
thermoanalytical methods. Thermochimica Acta 2002, 391, 159–168.
9. Fazen, P. J.; Remsen, E. E.; Beck, J. S.; Carrol, P. J.; McGhie, A. R.;
Sneddon, L. G., Synthesis, properties and ceramic conversion reactions of
polyborazylene. A high-yield polymeric precursor to boron nitride. Chemistry of
Materials 1995, 7, 1942–1956.
10. Heldebrant, D. J.; Karkamkar, A.; Hess, N.; Bowden, M. E.; Rassar, S.; Zheng,
F.; Rappe, K.; Autrey, T., The effects of chemical additives on the induction phase in
solid-state thermal decomposition of ammonia borane. Chemistry of Materials 2008,
20, 5332–5336.
11. Wiberg, E.; Bolz, A.; Buchheit, P., Zur Borin-Hupothese der Borwasserstoff-
Struktur. 1. Mitteilung uber Aminoderivate des Monoborlns BH3 I: Der Verbindungstyp
BH2(NR2). Zeitschrift für Anorganische Chemie 1948, 256, 285–306.
12. Böddeker, K. W.; Shore, S. G.; Bunting, R. K., Boron-nitrogen chemistry. I.
Synthesis and properties of new cycloborazanes, (BH2NH2)n. Journal of the American
Chemical Society 1966, 88, 4396–4401.
CHAPTER 3. The Thermal Decomposition of Ammonia Borane 105
13. Denton, D. L.; Johnson, A. D.; Hickam, C. W.; Bunting, R. K.; Shore, S. G.,
Boron-nitrogen chemistry. II. Poly(aminoborane). Journal of Inorganic and Nuclear
Chemistry 1975, 37, 1037–1038.
14. Schellenberg, R.; Kriehme, J.; Wolf, G., Thermal decomposition of
cyclotriborazane. Thermochimica Acta 2007, 457, 103–108.
15. Gutowska, A.; Li, L.; Shin, Y.; Wang, C. M.; Li, X. S.; Linehan, J. C.; Smith, R.
S.; Kay, B. D.; Schmid, B.; Shaw, W. J.; Gutowski, M.; Autrey, T., Nanoscaffold
mediates hydrogen release and the reactivity of ammonia borane. Angewandte
Chemie-International Edition 2005, 44, 3578–3582.
16. Hess, N. J.; Bowden, M. E.; Parvanov, V. M.; Mundy, C.; Kathmann, S. M.;
Schenter, G. K.; Autrey, T., Spectroscopic studies of the phase transition in ammonia
borane: Raman spectroscopy of single crystal NH3BH3 as a function of temperature
from 88 K to 330K. The Journal of Chemical Physics 2008, 128, 034508–1 –
034508–11.
17. Smith, J.; Seshadri, K. S.; White, D., Infrared spectra of matrix isolated BH3–
NH3, BD3–ND3 and BH3–ND3. Journal of Molecular Spectroscopy 1973, 45, 327–337.
18. Trudel, S.; Gilson, D. F. R., High-pressure Raman spectroscopic study of the
ammonia-borane complex. Evidence for the dihydrogen bond. Inorganic Chemistry
2003, 42, 2814–2816.
19. Custalcean, R.; Dreger, Z. A., Dihydrogen bonding under high pressure: A
Raman study of BH3NH3 molecular crystal. Journal Of Physical Chemistry B 2003,
107, 9231–9235.
20. Allis, D. G.; Kosmowski, M. E.; Hudson, B. S., The inelastic neutron scattering
spectrum of H3B:NH3 and the reproduction of its solid-state features by periodic DFT.
Journal of the American Chemical Society 2004, 126, 7756–7757.
21. Taylor, R. C.; Cluff, C. L., Vibrational frequency associated with the boron-
nitrogen dative bond in amine boranes. Nature 1958, 182, 390–391.
22. Cunningham, P. T.; Maroni, V. T., Laser Raman spectra of solid and molten
NaNH2: Evidence for hindered rotation of the NH2− ion. The Journal of Chemical
Physics 1972, 57, 1415–1418.
23. Anderson, T. F.; Burg, A. B., The Raman spectrum of liquid diborane. Journal
of Chemical Physics 1938, 6, 586–591.
24. Pimentel, G. C.; Sederholm, C. H., Correlation of Infrared stretching
frequencies and hydrogen bond distances in crystals. The Journal of Chemical
Physics 1956, 24, 639–641.
25. Pimentel, G. C.; McClellan, A. L., The Hydrogen Bond. W. H. Freeman And
Company 1960.
CHAPTER 3. The Thermal Decomposition of Ammonia Borane 106
26. Murli, C.; Song, Y., Pressure-induced transformations in diborane: A Raman
spectroscopic study. Journal Of Physical Chemistry B 2009, 113, 13509–13515.
27. Bower, D. I.; Maddams, W. F., The vibrational spectroscopy of polymers.
1989.
28. Kojima, Y.; Kawai, Y., IR characterizations of lithium imide and amide. Journal
of Alloys and Compounds 2005, 395, 236–239.
29. Gervais, C.; Framery, E.; Duriez, C.; Maquet, J.; Vaultier, M.; Babonneau, F., 11B and 15N solid state NMR investigation of a boron nitride preceramic polymer
prepared by ammonolysis of borazine. Journal of the European Ceramic Society
2005, 25, 129–135.
30. Gervais, C.; Babonneau, F., High resolution solid state NMR investigation of
various boron nitride preceramic polymers. Journal of Organometallic Chemistry
2002, 657, 75–82.
31. Shaw, W. J.; Linehan, J. C.; Szymczak, N. S.; Heldebrant, D. J.; Yonker, C.;
Camaioni, D. M.; Baker, R. T.; Autrey, T., In situ multinuclear NMR spectroscopic
studies of the thermal decomposition of ammonia borane in solution. Angewandte
Chemie-International Edition 2008, 47, 7493–7496.
32. Xiong, Z.; Yong, C. K.; Wu, G.; Chen, P.; Shaw, W. J.; Karkamkar, A.; Autrey,
T.; Jones, M. O.; Johnson, S. R.; Edwards, P. P.; David, W. I. F., High-capacity
hydrogen storage in lithium and sodium amidoboranes. Nature Materials 2008, 7,
138–141.
33. Jeschke, G.; Hoffbauer, W.; Jansen, M., A comprehensive NMR study of cubic
and hexagonal boron nitride. Solid State Nuclear Magnetic Resonance 1998, 12, 1–
7.
34. Marchetti, P. S.; Kwon, D.; Schmidt, W. R.; Interrante, L. V.; Maciel, G. E.,
High-field 11B Magic-Angle Spinning NMR characterization of boron nitrides.
Chemistry of Materials 1991, 3, 482–486.
107
Chapter 4
The Reaction of Sodium Hydride
with Ammonia Borane
4.1 Introduction
At the beginning of this research there had been no reported investigations into the
reactions of metal hydrides and ammonia borane. Initial investigations were targeted
at synthesising the mixed amide borohydride of sodium, Na2BH4NH2, which has been
previously reported.1 Initial investigations into the reaction of NaH and NH3BH3 in a
molar ratio of 2:1 resulted in excess NaH in the product mixture. The 1:1 reaction
mixture also resulted in excess NaH remaining at the end of the experiments. It was
found that a stoichiometry of 1:2 in favour of NH3BH3 was required to yield a product
free from starting materials. This new trigonal crystalline phase was found to be
different from Na2BH4NH2. The hydrogen desorption properties of this material were
investigated and spectroscopic characterisations carried out.
4.2 Experimental
Sodium hydride (Sigma-Aldrich, 95% purity) and ammonia borane (Sigma-Aldrich,
97% purity) were ground together in a 1:2 molar ratio in an argon filled glove box
(>10 ppm O2, >1 ppm H2O), and heated under a flowing argon atmosphere at 60°C.
The sample was reground and annealed at 60°C to improve the crystallinity of the
sample.
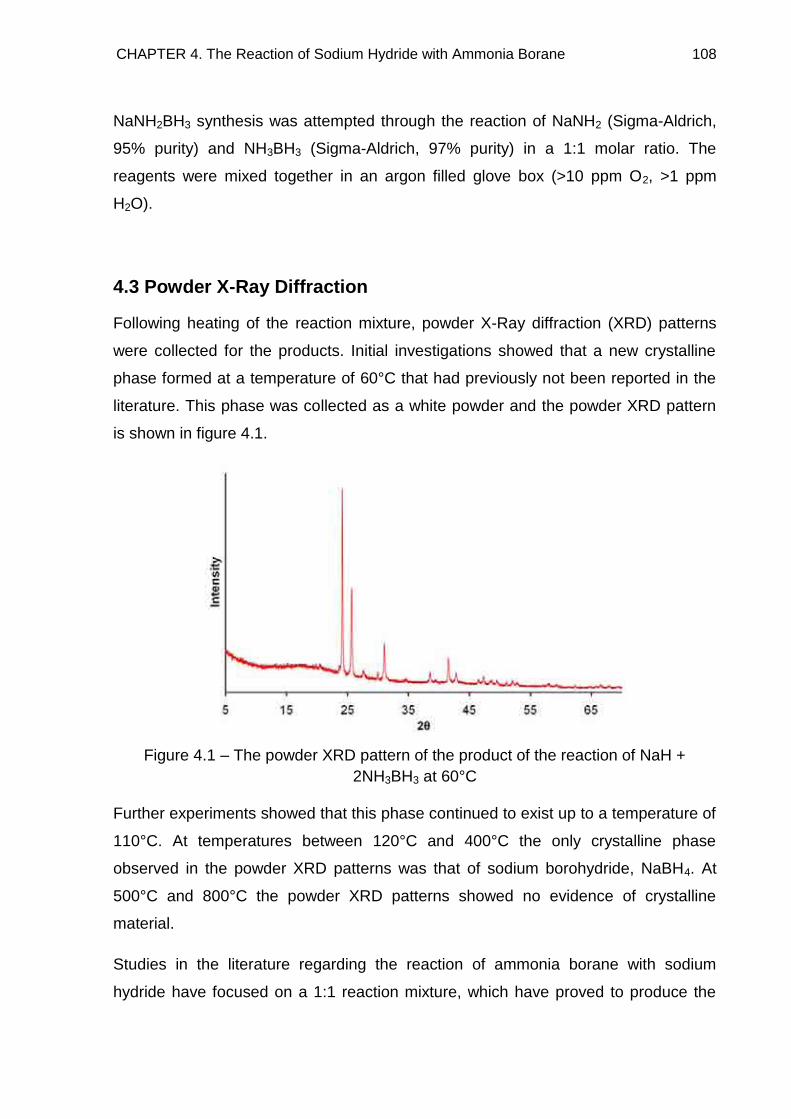
CHAPTER 4. The Reaction of Sodium Hydride with Ammonia Borane 108
NaNH2BH3 synthesis was attempted through the reaction of NaNH2 (Sigma-Aldrich,
95% purity) and NH3BH3 (Sigma-Aldrich, 97% purity) in a 1:1 molar ratio. The
reagents were mixed together in an argon filled glove box (>10 ppm O2, >1 ppm
H2O).
4.3 Powder X-Ray Diffraction
Following heating of the reaction mixture, powder X-Ray diffraction (XRD) patterns
were collected for the products. Initial investigations showed that a new crystalline
phase formed at a temperature of 60°C that had previously not been reported in the
literature. This phase was collected as a white powder and the powder XRD pattern
is shown in figure 4.1.
Figure 4.1 – The powder XRD pattern of the product of the reaction of NaH +
2NH3BH3 at 60°C
Further experiments showed that this phase continued to exist up to a temperature of
110°C. At temperatures between 120°C and 400°C the only crystalline phase
observed in the powder XRD patterns was that of sodium borohydride, NaBH4. At
500°C and 800°C the powder XRD patterns showed no evidence of crystalline
material.
Studies in the literature regarding the reaction of ammonia borane with sodium
hydride have focused on a 1:1 reaction mixture, which have proved to produce the
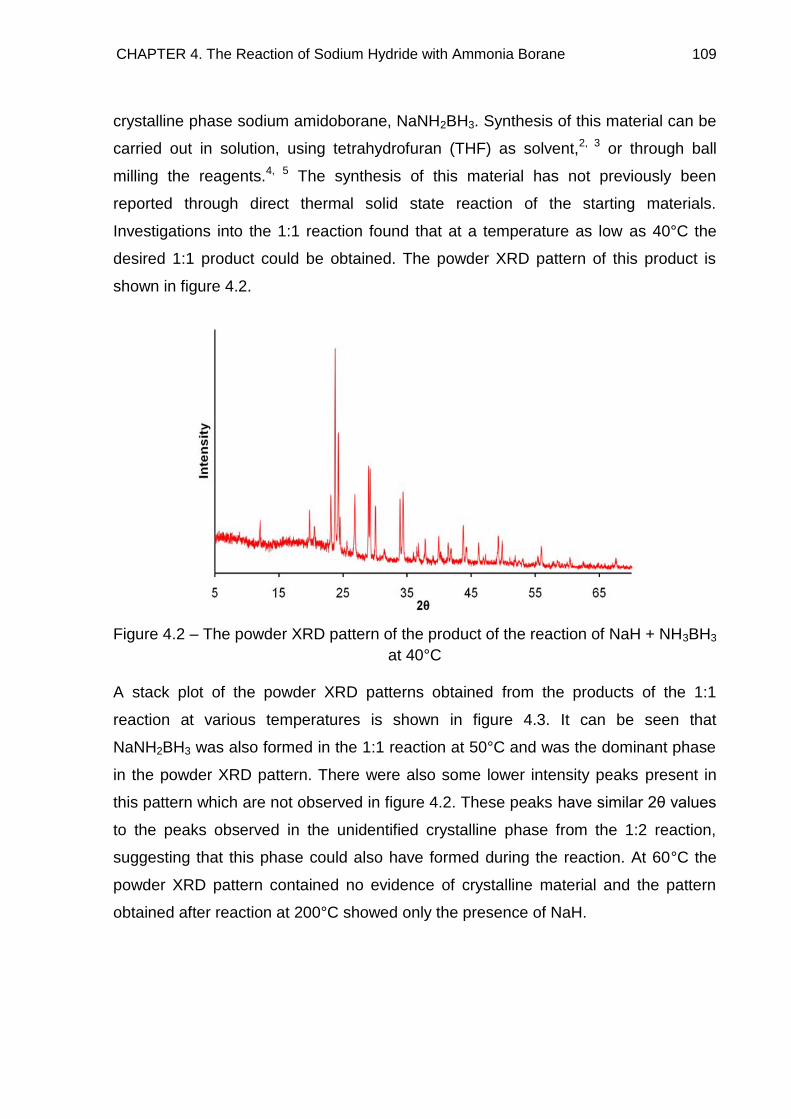
CHAPTER 4. The Reaction of Sodium Hydride with Ammonia Borane 109
crystalline phase sodium amidoborane, NaNH2BH3. Synthesis of this material can be
carried out in solution, using tetrahydrofuran (THF) as solvent,2, 3 or through ball
milling the reagents.4, 5 The synthesis of this material has not previously been
reported through direct thermal solid state reaction of the starting materials.
Investigations into the 1:1 reaction found that at a temperature as low as 40°C the
desired 1:1 product could be obtained. The powder XRD pattern of this product is
shown in figure 4.2.
Figure 4.2 – The powder XRD pattern of the product of the reaction of NaH + NH3BH3
at 40°C
A stack plot of the powder XRD patterns obtained from the products of the 1:1
reaction at various temperatures is shown in figure 4.3. It can be seen that
NaNH2BH3 was also formed in the 1:1 reaction at 50°C and was the dominant phase
in the powder XRD pattern. There were also some lower intensity peaks present in
this pattern which are not observed in figure 4.2. These peaks have similar 2θ values
to the peaks observed in the unidentified crystalline phase from the 1:2 reaction,
suggesting that this phase could also have formed during the reaction. At 60°C the
powder XRD pattern contained no evidence of crystalline material and the pattern
obtained after reaction at 200°C showed only the presence of NaH.
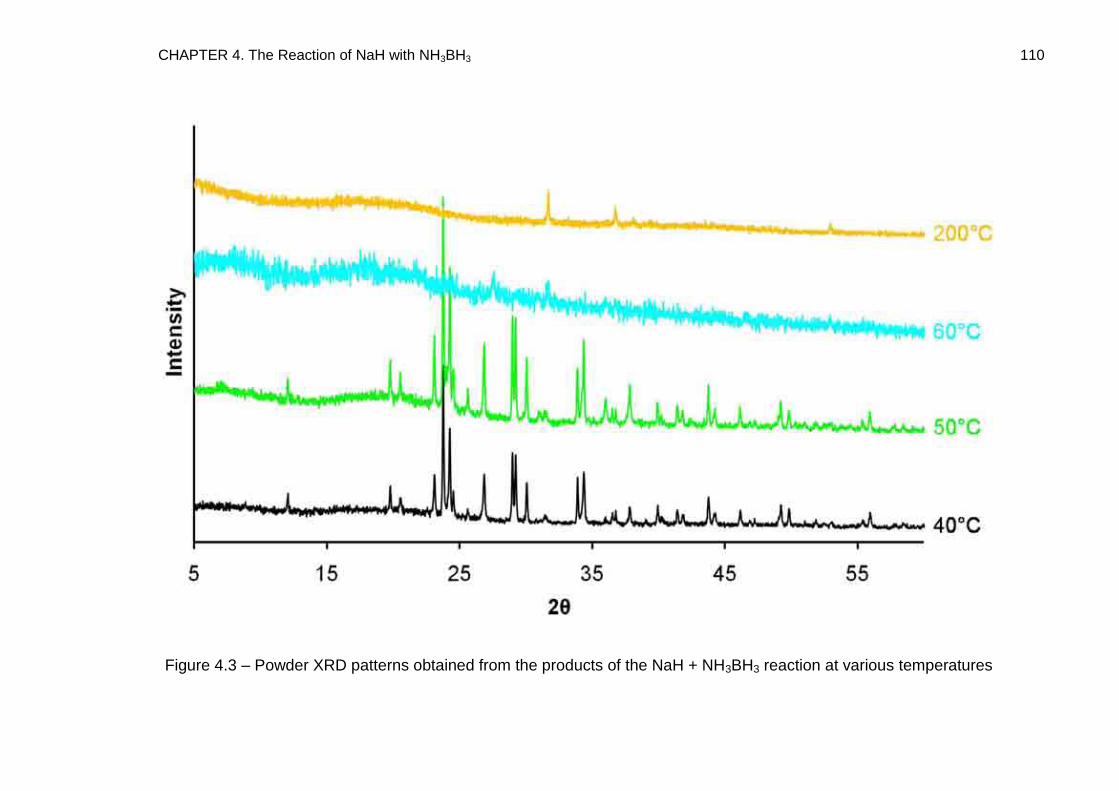
CHAPTER 4. The Reaction of NaH with NH3BH3 110
Figure 4.3 – Powder XRD patterns obtained from the products of the NaH + NH3BH3 reaction at various temperatures
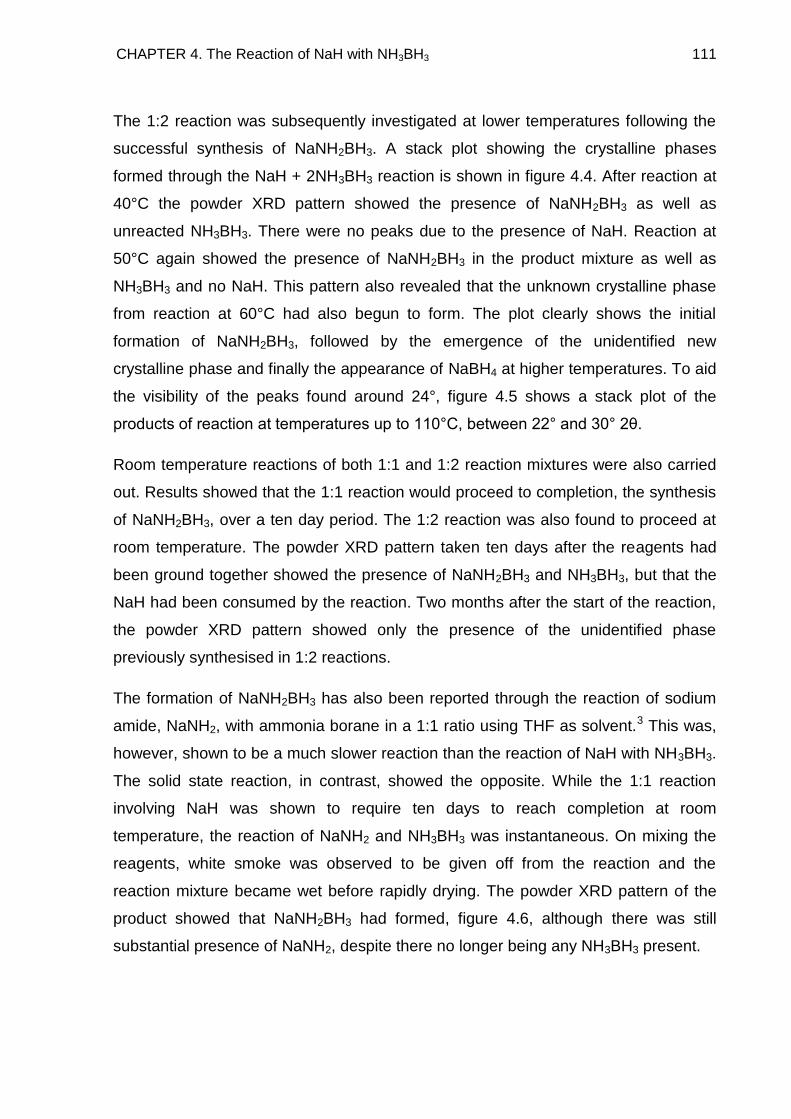
CHAPTER 4. The Reaction of NaH with NH3BH3 111
The 1:2 reaction was subsequently investigated at lower temperatures following the
successful synthesis of NaNH2BH3. A stack plot showing the crystalline phases
formed through the NaH + 2NH3BH3 reaction is shown in figure 4.4. After reaction at
40°C the powder XRD pattern showed the presence of NaNH2BH3 as well as
unreacted NH3BH3. There were no peaks due to the presence of NaH. Reaction at
50°C again showed the presence of NaNH2BH3 in the product mixture as well as
NH3BH3 and no NaH. This pattern also revealed that the unknown crystalline phase
from reaction at 60°C had also begun to form. The plot clearly shows the initial
formation of NaNH2BH3, followed by the emergence of the unidentified new
crystalline phase and finally the appearance of NaBH4 at higher temperatures. To aid
the visibility of the peaks found around 24°, figure 4.5 shows a stack plot of the
products of reaction at temperatures up to 110°C, between 22° and 30° 2θ.
Room temperature reactions of both 1:1 and 1:2 reaction mixtures were also carried
out. Results showed that the 1:1 reaction would proceed to completion, the synthesis
of NaNH2BH3, over a ten day period. The 1:2 reaction was also found to proceed at
room temperature. The powder XRD pattern taken ten days after the reagents had
been ground together showed the presence of NaNH2BH3 and NH3BH3, but that the
NaH had been consumed by the reaction. Two months after the start of the reaction,
the powder XRD pattern showed only the presence of the unidentified phase
previously synthesised in 1:2 reactions.
The formation of NaNH2BH3 has also been reported through the reaction of sodium
amide, NaNH2, with ammonia borane in a 1:1 ratio using THF as solvent.3 This was,
however, shown to be a much slower reaction than the reaction of NaH with NH3BH3.
The solid state reaction, in contrast, showed the opposite. While the 1:1 reaction
involving NaH was shown to require ten days to reach completion at room
temperature, the reaction of NaNH2 and NH3BH3 was instantaneous. On mixing the
reagents, white smoke was observed to be given off from the reaction and the
reaction mixture became wet before rapidly drying. The powder XRD pattern of the
product showed that NaNH2BH3 had formed, figure 4.6, although there was still
substantial presence of NaNH2, despite there no longer being any NH3BH3 present.
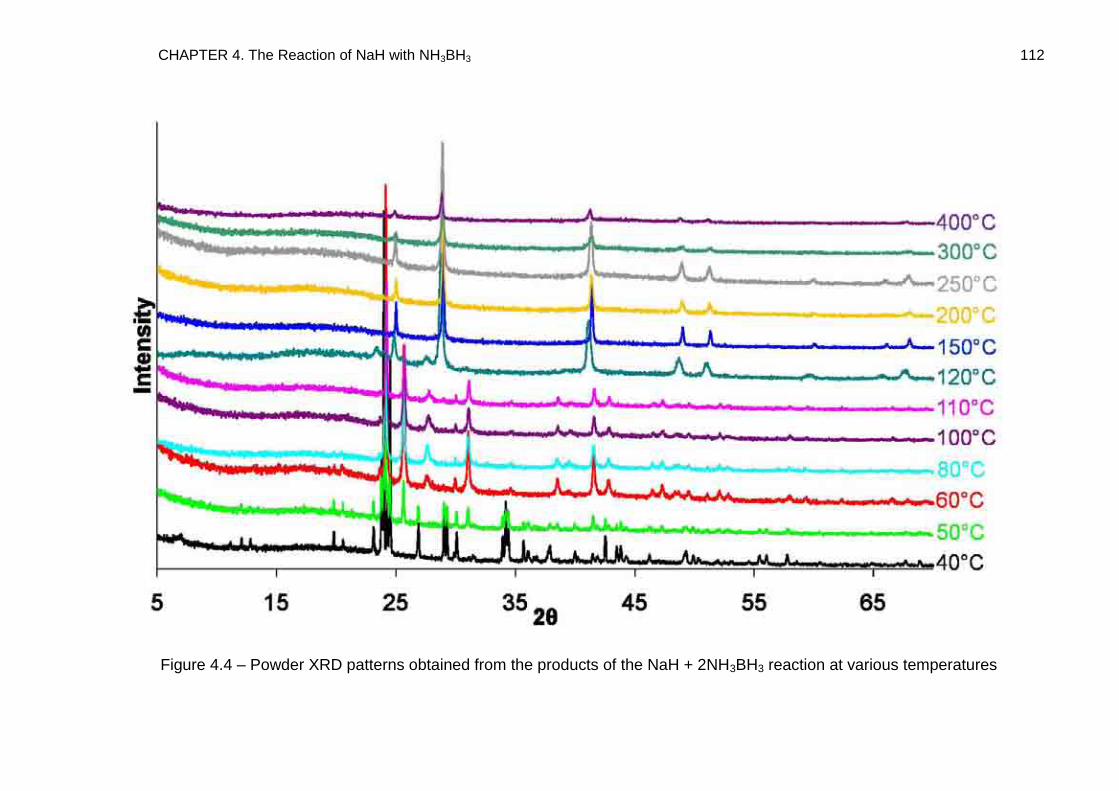
CHAPTER 4. The Reaction of NaH with NH3BH3 112
Figure 4.4 – Powder XRD patterns obtained from the products of the NaH + 2NH3BH3 reaction at various temperatures
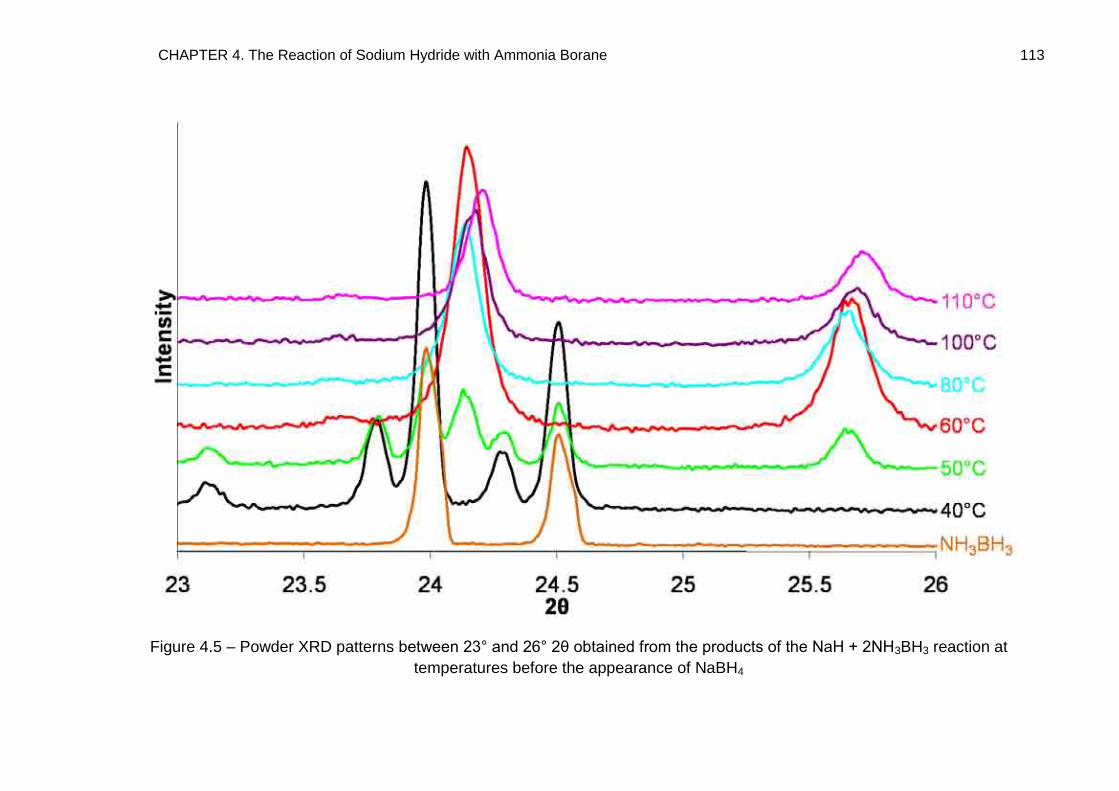
CHAPTER 4. The Reaction of Sodium Hydride with Ammonia Borane 113
Figure 4.5 – Powder XRD patterns between 23° and 26° 2θ obtained from the products of the NaH + 2NH3BH3 reaction at
temperatures before the appearance of NaBH4
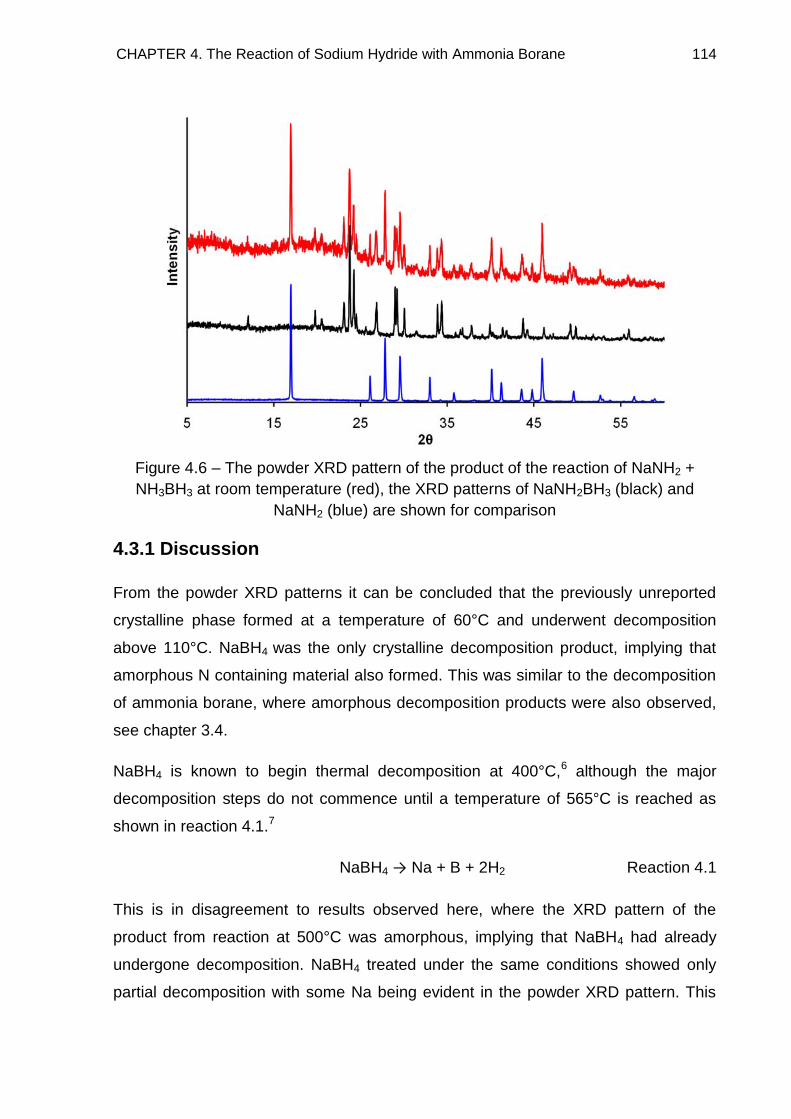
CHAPTER 4. The Reaction of Sodium Hydride with Ammonia Borane 114
Figure 4.6 – The powder XRD pattern of the product of the reaction of NaNH2 +
NH3BH3 at room temperature (red), the XRD patterns of NaNH2BH3 (black) and
NaNH2 (blue) are shown for comparison
4.3.1 Discussion
From the powder XRD patterns it can be concluded that the previously unreported
crystalline phase formed at a temperature of 60°C and underwent decomposition
above 110°C. NaBH4 was the only crystalline decomposition product, implying that
amorphous N containing material also formed. This was similar to the decomposition
of ammonia borane, where amorphous decomposition products were also observed,
see chapter 3.4.
NaBH4 is known to begin thermal decomposition at 400°C,6 although the major
decomposition steps do not commence until a temperature of 565°C is reached as
shown in reaction 4.1.7
NaBH4 → Na + B + 2H2 Reaction 4.1
This is in disagreement to results observed here, where the XRD pattern of the
product from reaction at 500°C was amorphous, implying that NaBH4 had already
undergone decomposition. NaBH4 treated under the same conditions showed only
partial decomposition with some Na being evident in the powder XRD pattern. This
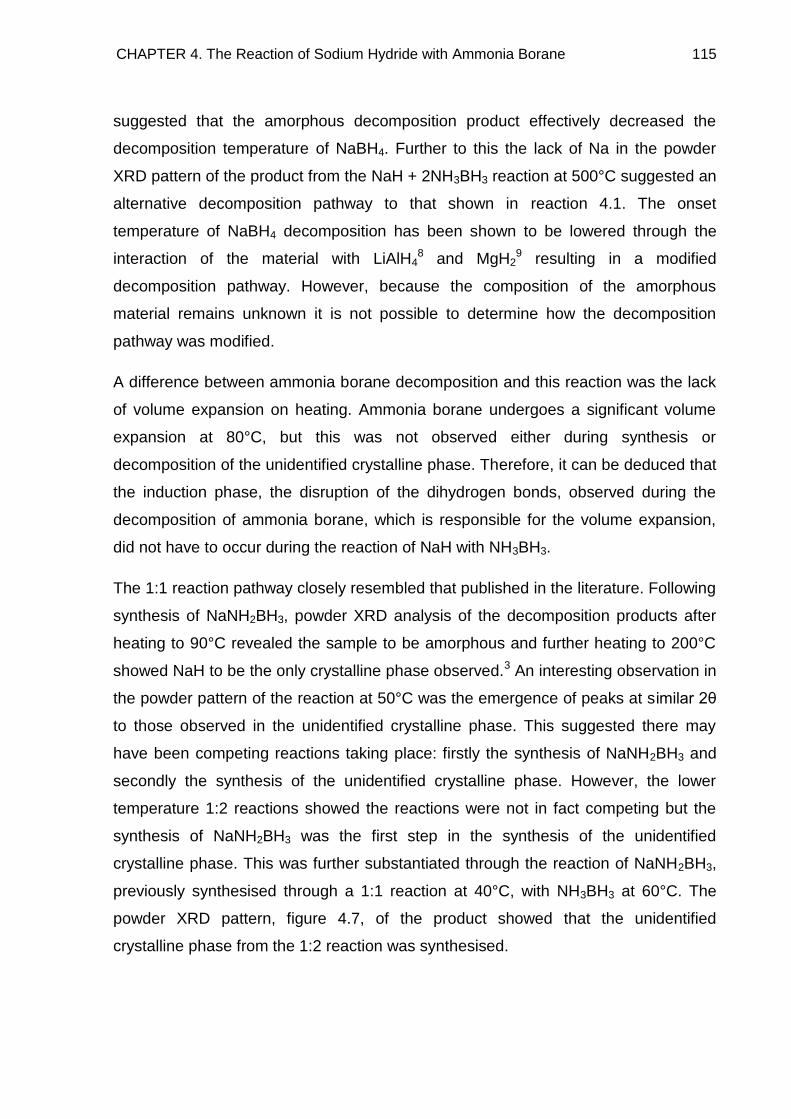
CHAPTER 4. The Reaction of Sodium Hydride with Ammonia Borane 115
suggested that the amorphous decomposition product effectively decreased the
decomposition temperature of NaBH4. Further to this the lack of Na in the powder
XRD pattern of the product from the NaH + 2NH3BH3 reaction at 500°C suggested an
alternative decomposition pathway to that shown in reaction 4.1. The onset
temperature of NaBH4 decomposition has been shown to be lowered through the
interaction of the material with LiAlH48 and MgH2
9 resulting in a modified
decomposition pathway. However, because the composition of the amorphous
material remains unknown it is not possible to determine how the decomposition
pathway was modified.
A difference between ammonia borane decomposition and this reaction was the lack
of volume expansion on heating. Ammonia borane undergoes a significant volume
expansion at 80°C, but this was not observed either during synthesis or
decomposition of the unidentified crystalline phase. Therefore, it can be deduced that
the induction phase, the disruption of the dihydrogen bonds, observed during the
decomposition of ammonia borane, which is responsible for the volume expansion,
did not have to occur during the reaction of NaH with NH3BH3.
The 1:1 reaction pathway closely resembled that published in the literature. Following
synthesis of NaNH2BH3, powder XRD analysis of the decomposition products after
heating to 90°C revealed the sample to be amorphous and further heating to 200°C
showed NaH to be the only crystalline phase observed.3 An interesting observation in
the powder pattern of the reaction at 50°C was the emergence of peaks at similar 2θ
to those observed in the unidentified crystalline phase. This suggested there may
have been competing reactions taking place: firstly the synthesis of NaNH2BH3 and
secondly the synthesis of the unidentified crystalline phase. However, the lower
temperature 1:2 reactions showed the reactions were not in fact competing but the
synthesis of NaNH2BH3 was the first step in the synthesis of the unidentified
crystalline phase. This was further substantiated through the reaction of NaNH2BH3,
previously synthesised through a 1:1 reaction at 40°C, with NH3BH3 at 60°C. The
powder XRD pattern, figure 4.7, of the product showed that the unidentified
crystalline phase from the 1:2 reaction was synthesised.
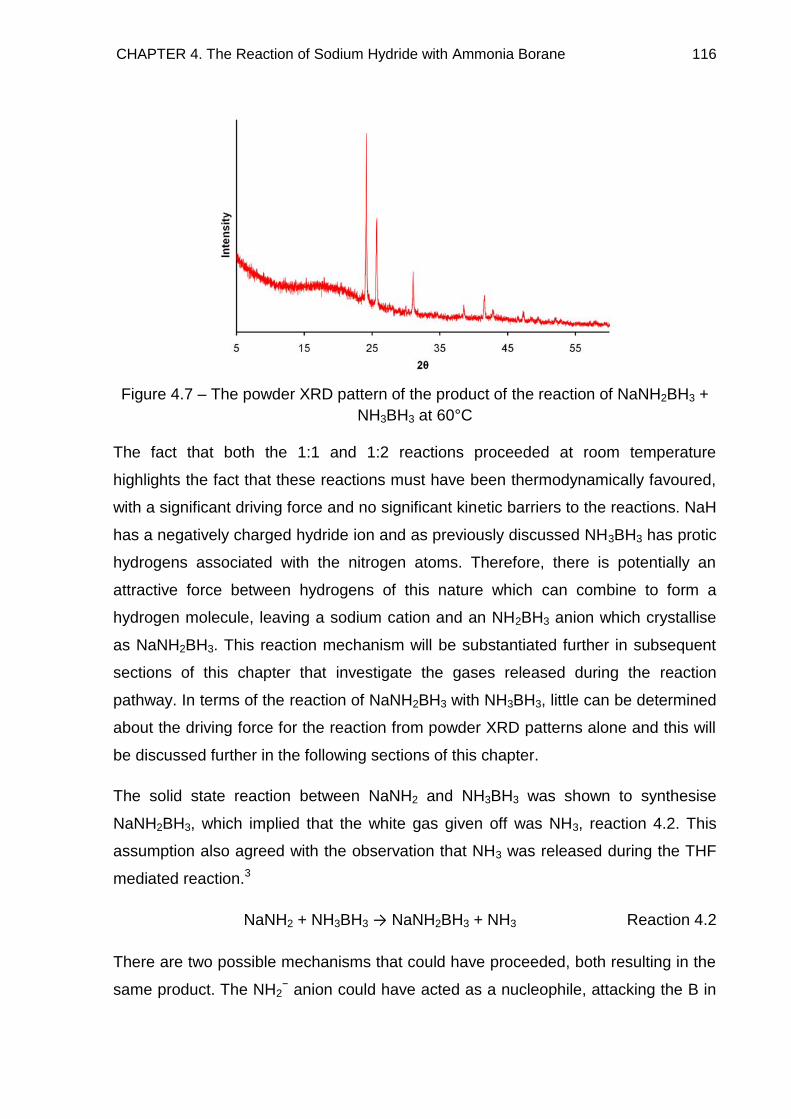
CHAPTER 4. The Reaction of Sodium Hydride with Ammonia Borane 116
Figure 4.7 – The powder XRD pattern of the product of the reaction of NaNH2BH3 +
NH3BH3 at 60°C
The fact that both the 1:1 and 1:2 reactions proceeded at room temperature
highlights the fact that these reactions must have been thermodynamically favoured,
with a significant driving force and no significant kinetic barriers to the reactions. NaH
has a negatively charged hydride ion and as previously discussed NH3BH3 has protic
hydrogens associated with the nitrogen atoms. Therefore, there is potentially an
attractive force between hydrogens of this nature which can combine to form a
hydrogen molecule, leaving a sodium cation and an NH2BH3 anion which crystallise
as NaNH2BH3. This reaction mechanism will be substantiated further in subsequent
sections of this chapter that investigate the gases released during the reaction
pathway. In terms of the reaction of NaNH2BH3 with NH3BH3, little can be determined
about the driving force for the reaction from powder XRD patterns alone and this will
be discussed further in the following sections of this chapter.
The solid state reaction between NaNH2 and NH3BH3 was shown to synthesise
NaNH2BH3, which implied that the white gas given off was NH3, reaction 4.2. This
assumption also agreed with the observation that NH3 was released during the THF
mediated reaction.3
NaNH2 + NH3BH3 → NaNH2BH3 + NH3 Reaction 4.2
There are two possible mechanisms that could have proceeded, both resulting in the
same product. The NH2− anion could have acted as a nucleophile, attacking the B in
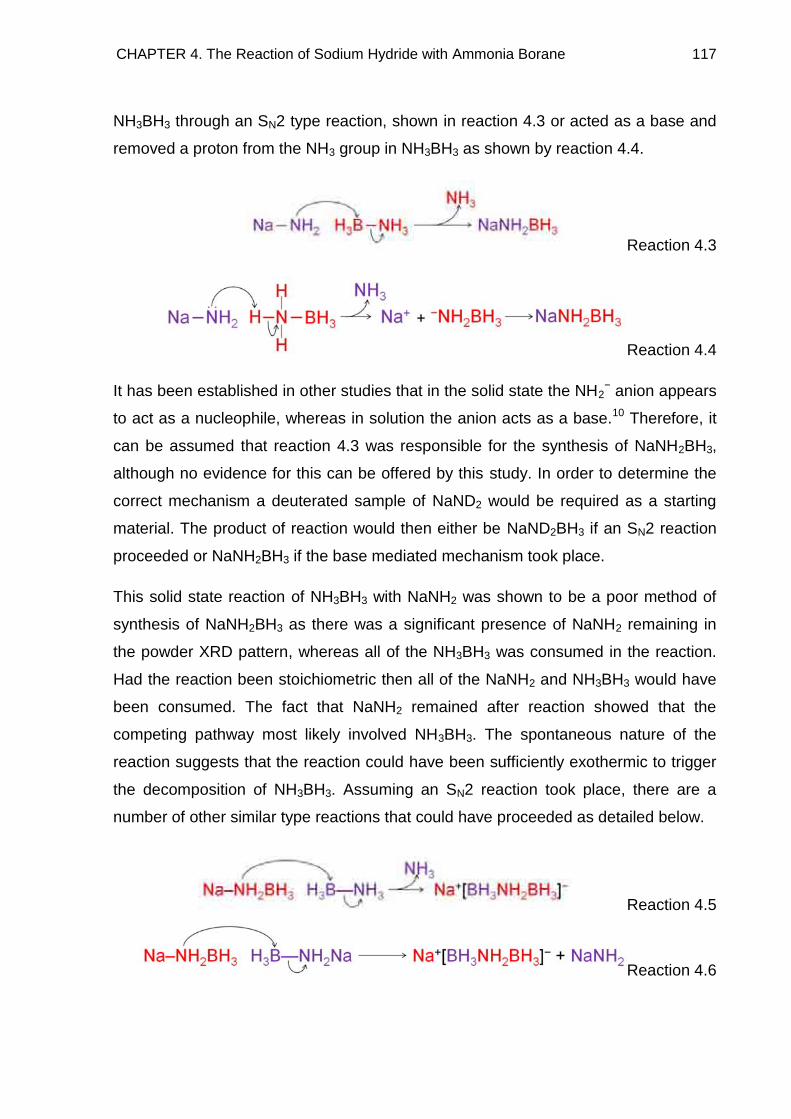
CHAPTER 4. The Reaction of Sodium Hydride with Ammonia Borane 117
NH3BH3 through an SN2 type reaction, shown in reaction 4.3 or acted as a base and
removed a proton from the NH3 group in NH3BH3 as shown by reaction 4.4.
Reaction 4.3
Reaction 4.4
It has been established in other studies that in the solid state the NH2− anion appears
to act as a nucleophile, whereas in solution the anion acts as a base.10 Therefore, it
can be assumed that reaction 4.3 was responsible for the synthesis of NaNH2BH3,
although no evidence for this can be offered by this study. In order to determine the
correct mechanism a deuterated sample of NaND2 would be required as a starting
material. The product of reaction would then either be NaND2BH3 if an SN2 reaction
proceeded or NaNH2BH3 if the base mediated mechanism took place.
This solid state reaction of NH3BH3 with NaNH2 was shown to be a poor method of
synthesis of NaNH2BH3 as there was a significant presence of NaNH2 remaining in
the powder XRD pattern, whereas all of the NH3BH3 was consumed in the reaction.
Had the reaction been stoichiometric then all of the NaNH2 and NH3BH3 would have
been consumed. The fact that NaNH2 remained after reaction showed that the
competing pathway most likely involved NH3BH3. The spontaneous nature of the
reaction suggests that the reaction could have been sufficiently exothermic to trigger
the decomposition of NH3BH3. Assuming an SN2 reaction took place, there are a
number of other similar type reactions that could have proceeded as detailed below.
Reaction 4.5
Reaction 4.6
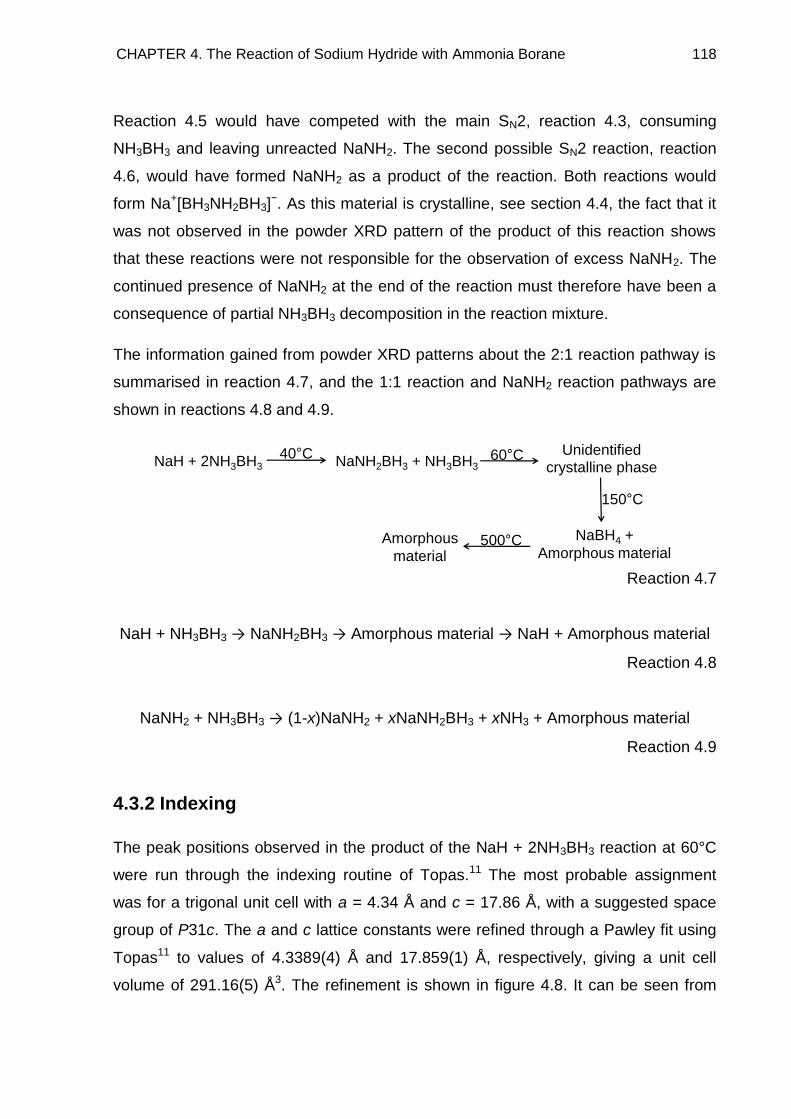
CHAPTER 4. The Reaction of Sodium Hydride with Ammonia Borane 118
Reaction 4.5 would have competed with the main SN2, reaction 4.3, consuming
NH3BH3 and leaving unreacted NaNH2. The second possible SN2 reaction, reaction
4.6, would have formed NaNH2 as a product of the reaction. Both reactions would
form Na+[BH3NH2BH3]−. As this material is crystalline, see section 4.4, the fact that it
was not observed in the powder XRD pattern of the product of this reaction shows
that these reactions were not responsible for the observation of excess NaNH2. The
continued presence of NaNH2 at the end of the reaction must therefore have been a
consequence of partial NH3BH3 decomposition in the reaction mixture.
The information gained from powder XRD patterns about the 2:1 reaction pathway is
summarised in reaction 4.7, and the 1:1 reaction and NaNH2 reaction pathways are
shown in reactions 4.8 and 4.9.
Reaction 4.7
NaH + NH3BH3 → NaNH2BH3 → Amorphous material → NaH + Amorphous material
Reaction 4.8
NaNH2 + NH3BH3 → (1-x)NaNH2 + xNaNH2BH3 + xNH3 + Amorphous material
Reaction 4.9
4.3.2 Indexing
The peak positions observed in the product of the NaH + 2NH3BH3 reaction at 60°C
were run through the indexing routine of Topas.11 The most probable assignment
was for a trigonal unit cell with a = 4.34 Å and c = 17.86 Å, with a suggested space
group of P31c. The a and c lattice constants were refined through a Pawley fit using
Topas11 to values of 4.3389(4) Å and 17.859(1) Å, respectively, giving a unit cell
volume of 291.16(5) Å3. The refinement is shown in figure 4.8. It can be seen from
NaH + 2NH3BH3 NaNH2BH3 + NH3BH3
Unidentified crystalline phase
NaBH4 +
Amorphous materialAmorphous
material
40°C 60°C
500°C
150°C
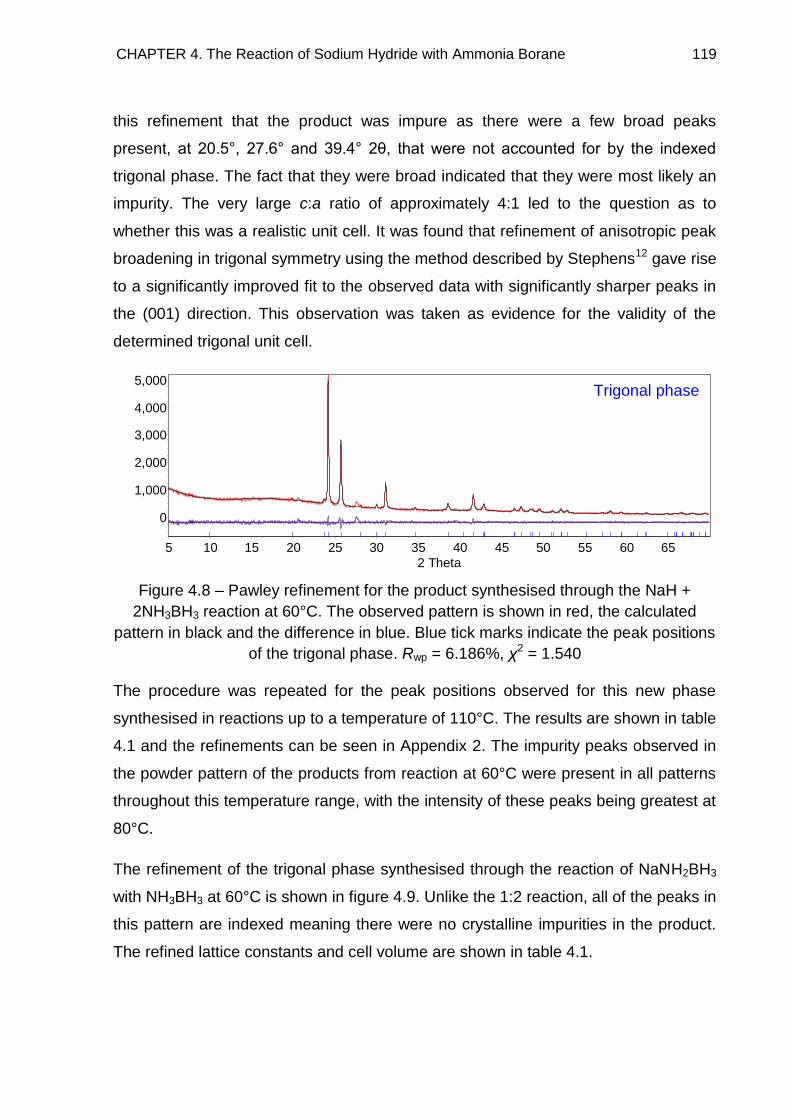
CHAPTER 4. The Reaction of Sodium Hydride with Ammonia Borane 119
this refinement that the product was impure as there were a few broad peaks
present, at 20.5°, 27.6° and 39.4° 2θ, that were not accounted for by the indexed
trigonal phase. The fact that they were broad indicated that they were most likely an
impurity. The very large c:a ratio of approximately 4:1 led to the question as to
whether this was a realistic unit cell. It was found that refinement of anisotropic peak
broadening in trigonal symmetry using the method described by Stephens12 gave rise
to a significantly improved fit to the observed data with significantly sharper peaks in
the (001) direction. This observation was taken as evidence for the validity of the
determined trigonal unit cell.
Figure 4.8 – Pawley refinement for the product synthesised through the NaH +
2NH3BH3 reaction at 60°C. The observed pattern is shown in red, the calculated
pattern in black and the difference in blue. Blue tick marks indicate the peak positions
of the trigonal phase. Rwp = 6.186%, χ2 = 1.540
The procedure was repeated for the peak positions observed for this new phase
synthesised in reactions up to a temperature of 110°C. The results are shown in table
4.1 and the refinements can be seen in Appendix 2. The impurity peaks observed in
the powder pattern of the products from reaction at 60°C were present in all patterns
throughout this temperature range, with the intensity of these peaks being greatest at
80°C.
The refinement of the trigonal phase synthesised through the reaction of NaNH2BH3
with NH3BH3 at 60°C is shown in figure 4.9. Unlike the 1:2 reaction, all of the peaks in
this pattern are indexed meaning there were no crystalline impurities in the product.
The refined lattice constants and cell volume are shown in table 4.1.
2 Theta
6560555045403530252015105
Co
un
ts
5,000
4,000
3,000
2,000
1,000
0
Na 1:2 0.00 %
Trigonal phase
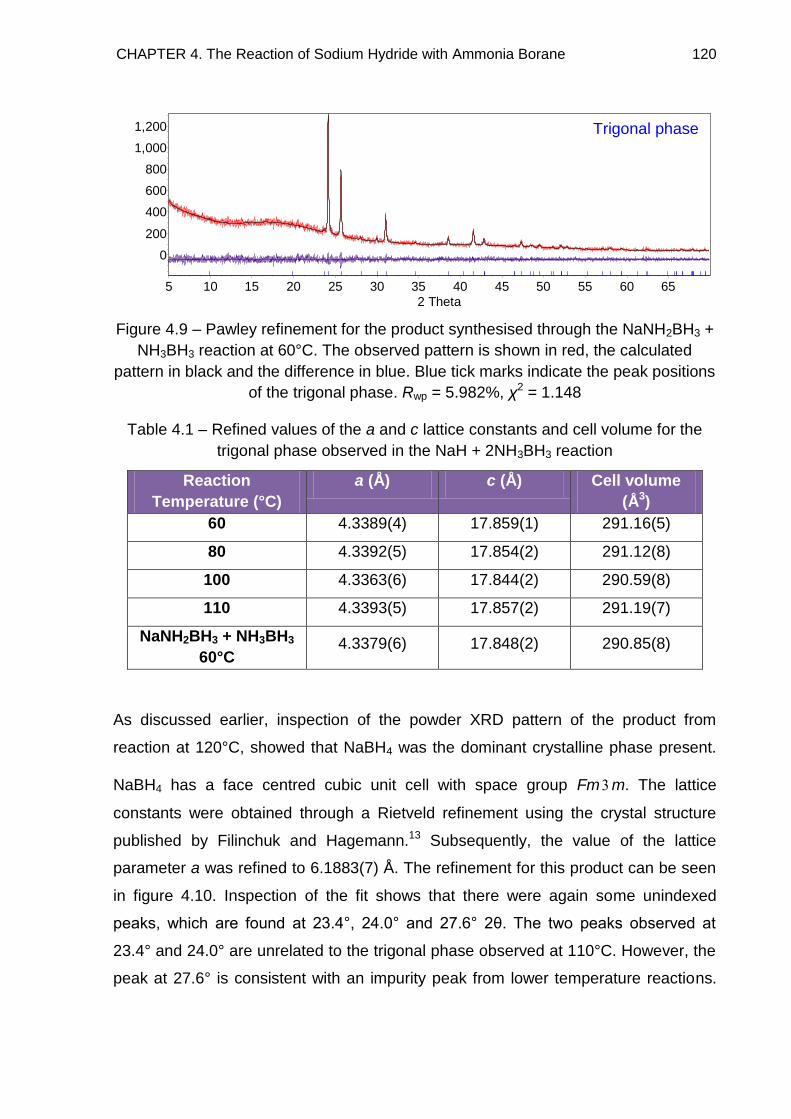
CHAPTER 4. The Reaction of Sodium Hydride with Ammonia Borane 120
Figure 4.9 – Pawley refinement for the product synthesised through the NaNH2BH3 +
NH3BH3 reaction at 60°C. The observed pattern is shown in red, the calculated
pattern in black and the difference in blue. Blue tick marks indicate the peak positions
of the trigonal phase. Rwp = 5.982%, χ2 = 1.148
Table 4.1 – Refined values of the a and c lattice constants and cell volume for the
trigonal phase observed in the NaH + 2NH3BH3 reaction
Reaction
Temperature (°C)
a (Å) c (Å) Cell volume
(Å3)
60 4.3389(4) 17.859(1) 291.16(5)
80 4.3392(5) 17.854(2) 291.12(8)
100 4.3363(6) 17.844(2) 290.59(8)
110 4.3393(5) 17.857(2) 291.19(7)
NaNH2BH3 + NH3BH3
60°C 4.3379(6) 17.848(2) 290.85(8)
As discussed earlier, inspection of the powder XRD pattern of the product from
reaction at 120°C, showed that NaBH4 was the dominant crystalline phase present.
NaBH4 has a face centred cubic unit cell with space group Fm3 m. The lattice
constants were obtained through a Rietveld refinement using the crystal structure
published by Filinchuk and Hagemann.13 Subsequently, the value of the lattice
parameter a was refined to 6.1883(7) Å. The refinement for this product can be seen
in figure 4.10. Inspection of the fit shows that there were again some unindexed
peaks, which are found at 23.4°, 24.0° and 27.6° 2θ. The two peaks observed at
23.4° and 24.0° are unrelated to the trigonal phase observed at 110°C. However, the
peak at 27.6° is consistent with an impurity peak from lower temperature reactions.
2 Theta
6560555045403530252015105
Co
un
ts
1,200
1,000
800
600
400
200
0
Na Phase 0.00 %
Trigonal phase
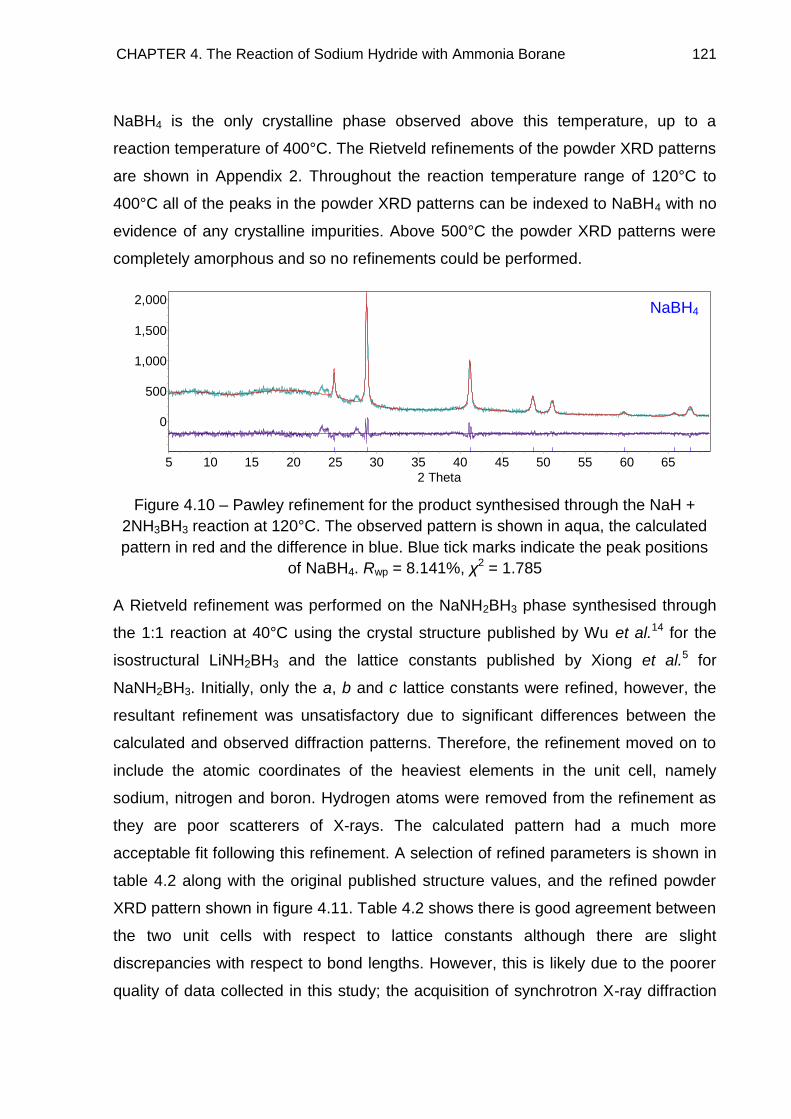
CHAPTER 4. The Reaction of Sodium Hydride with Ammonia Borane 121
NaBH4 is the only crystalline phase observed above this temperature, up to a
reaction temperature of 400°C. The Rietveld refinements of the powder XRD patterns
are shown in Appendix 2. Throughout the reaction temperature range of 120°C to
400°C all of the peaks in the powder XRD patterns can be indexed to NaBH4 with no
evidence of any crystalline impurities. Above 500°C the powder XRD patterns were
completely amorphous and so no refinements could be performed.
Figure 4.10 – Pawley refinement for the product synthesised through the NaH +
2NH3BH3 reaction at 120°C. The observed pattern is shown in aqua, the calculated
pattern in red and the difference in blue. Blue tick marks indicate the peak positions
of NaBH4. Rwp = 8.141%, χ2 = 1.785
A Rietveld refinement was performed on the NaNH2BH3 phase synthesised through
the 1:1 reaction at 40°C using the crystal structure published by Wu et al.14 for the
isostructural LiNH2BH3 and the lattice constants published by Xiong et al.5 for
NaNH2BH3. Initially, only the a, b and c lattice constants were refined, however, the
resultant refinement was unsatisfactory due to significant differences between the
calculated and observed diffraction patterns. Therefore, the refinement moved on to
include the atomic coordinates of the heaviest elements in the unit cell, namely
sodium, nitrogen and boron. Hydrogen atoms were removed from the refinement as
they are poor scatterers of X-rays. The calculated pattern had a much more
acceptable fit following this refinement. A selection of refined parameters is shown in
table 4.2 along with the original published structure values, and the refined powder
XRD pattern shown in figure 4.11. Table 4.2 shows there is good agreement between
the two unit cells with respect to lattice constants although there are slight
discrepancies with respect to bond lengths. However, this is likely due to the poorer
quality of data collected in this study; the acquisition of synchrotron X-ray diffraction
2 Theta
6560555045403530252015105
Co
un
ts
2,000
1,500
1,000
500
0
NaBH4 100.00 %
NaBH4
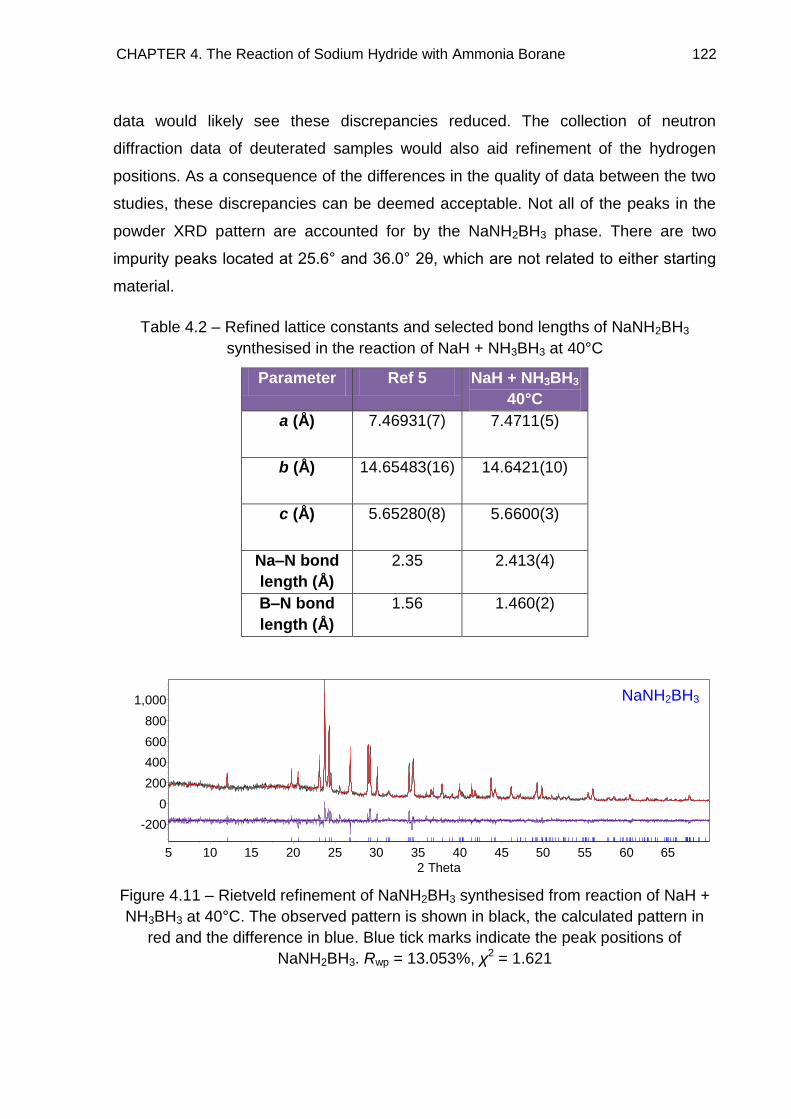
CHAPTER 4. The Reaction of Sodium Hydride with Ammonia Borane 122
data would likely see these discrepancies reduced. The collection of neutron
diffraction data of deuterated samples would also aid refinement of the hydrogen
positions. As a consequence of the differences in the quality of data between the two
studies, these discrepancies can be deemed acceptable. Not all of the peaks in the
powder XRD pattern are accounted for by the NaNH2BH3 phase. There are two
impurity peaks located at 25.6° and 36.0° 2θ, which are not related to either starting
material.
Table 4.2 – Refined lattice constants and selected bond lengths of NaNH2BH3
synthesised in the reaction of NaH + NH3BH3 at 40°C
Parameter Ref 5 NaH + NH3BH3
40°C
a (Å) 7.46931(7)
7.4711(5)
b (Å) 14.65483(16)
14.6421(10)
c (Å) 5.65280(8)
5.6600(3)
Na–N bond
length (Å)
2.35 2.413(4)
B–N bond
length (Å)
1.56 1.460(2)
Figure 4.11 – Rietveld refinement of NaNH2BH3 synthesised from reaction of NaH +
NH3BH3 at 40°C. The observed pattern is shown in black, the calculated pattern in
red and the difference in blue. Blue tick marks indicate the peak positions of
NaNH2BH3. Rwp = 13.053%, χ2 = 1.621
2 Theta
6560555045403530252015105
Co
un
ts
1,000
800
600
400
200
0
-200
NaNH2BH3 100.00 %
NaNH2BH3
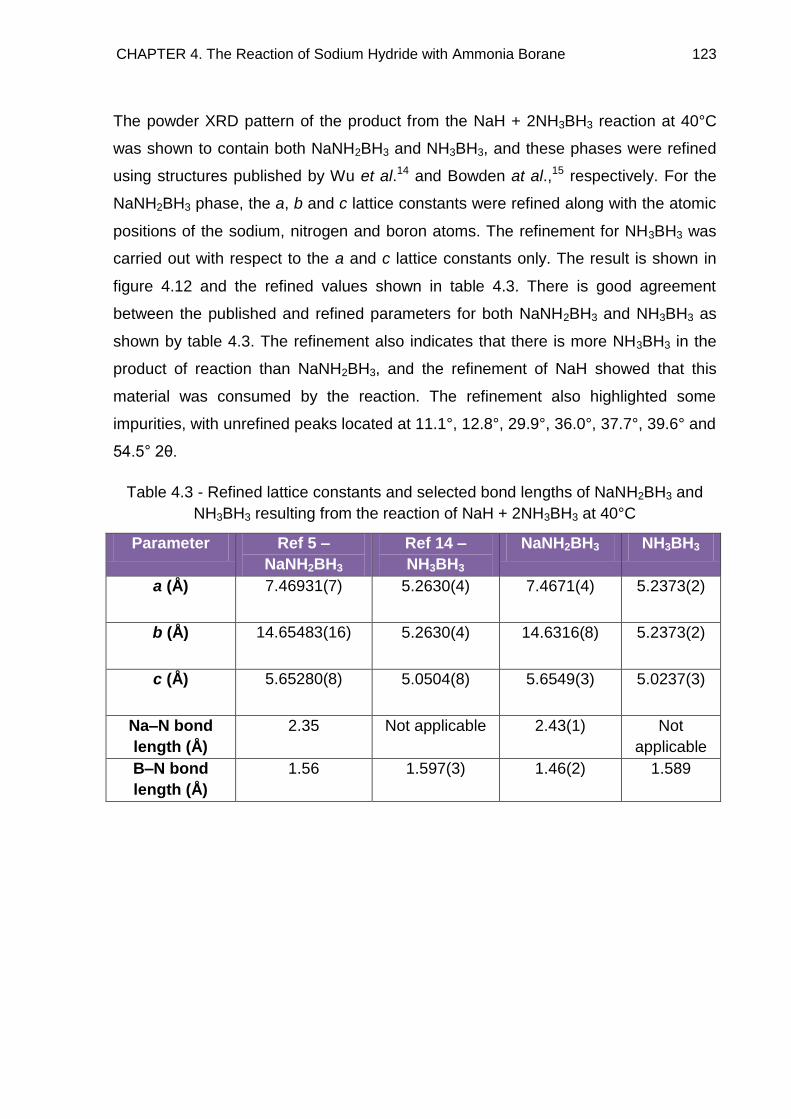
CHAPTER 4. The Reaction of Sodium Hydride with Ammonia Borane 123
The powder XRD pattern of the product from the NaH + 2NH3BH3 reaction at 40°C
was shown to contain both NaNH2BH3 and NH3BH3, and these phases were refined
using structures published by Wu et al.14 and Bowden at al.,15 respectively. For the
NaNH2BH3 phase, the a, b and c lattice constants were refined along with the atomic
positions of the sodium, nitrogen and boron atoms. The refinement for NH3BH3 was
carried out with respect to the a and c lattice constants only. The result is shown in
figure 4.12 and the refined values shown in table 4.3. There is good agreement
between the published and refined parameters for both NaNH2BH3 and NH3BH3 as
shown by table 4.3. The refinement also indicates that there is more NH3BH3 in the
product of reaction than NaNH2BH3, and the refinement of NaH showed that this
material was consumed by the reaction. The refinement also highlighted some
impurities, with unrefined peaks located at 11.1°, 12.8°, 29.9°, 36.0°, 37.7°, 39.6° and
54.5° 2θ.
Table 4.3 - Refined lattice constants and selected bond lengths of NaNH2BH3 and
NH3BH3 resulting from the reaction of NaH + 2NH3BH3 at 40°C
Parameter Ref 5 –
NaNH2BH3
Ref 14 –
NH3BH3
NaNH2BH3 NH3BH3
a (Å) 7.46931(7)
5.2630(4) 7.4671(4) 5.2373(2)
b (Å) 14.65483(16)
5.2630(4) 14.6316(8) 5.2373(2)
c (Å) 5.65280(8)
5.0504(8) 5.6549(3) 5.0237(3)
Na–N bond
length (Å)
2.35 Not applicable 2.43(1) Not
applicable
B–N bond
length (Å)
1.56 1.597(3) 1.46(2) 1.589
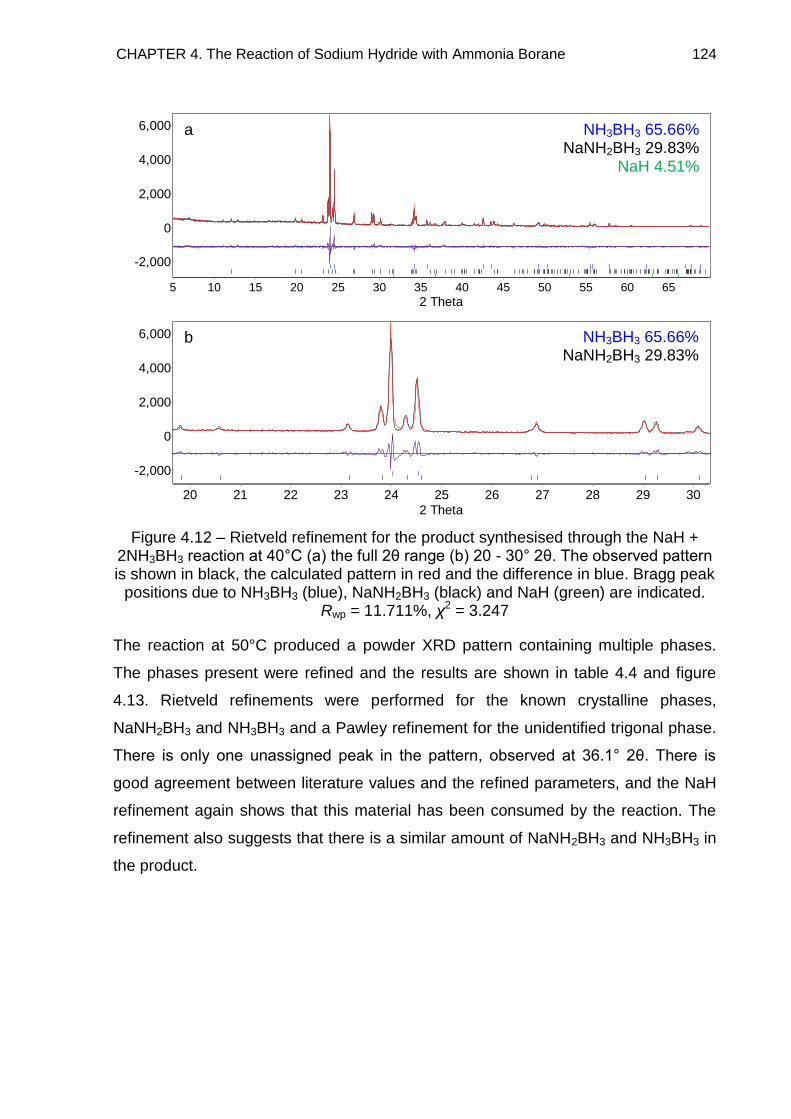
CHAPTER 4. The Reaction of Sodium Hydride with Ammonia Borane 124
Figure 4.12 – Rietveld refinement for the product synthesised through the NaH + 2NH3BH3 reaction at 40°C (a) the full 2θ range (b) 20 - 30° 2θ. The observed pattern is shown in black, the calculated pattern in red and the difference in blue. Bragg peak
positions due to NH3BH3 (blue), NaNH2BH3 (black) and NaH (green) are indicated. Rwp = 11.711%, χ2 = 3.247
The reaction at 50°C produced a powder XRD pattern containing multiple phases.
The phases present were refined and the results are shown in table 4.4 and figure
4.13. Rietveld refinements were performed for the known crystalline phases,
NaNH2BH3 and NH3BH3 and a Pawley refinement for the unidentified trigonal phase.
There is only one unassigned peak in the pattern, observed at 36.1° 2θ. There is
good agreement between literature values and the refined parameters, and the NaH
refinement again shows that this material has been consumed by the reaction. The
refinement also suggests that there is a similar amount of NaNH2BH3 and NH3BH3 in
the product.
2 Theta6560555045403530252015105
Co
un
ts
6,000
4,000
2,000
0
-2,000
AB 56.18 %
NaAB 43.79 %
NaH 0.03 %
2 Theta
3029282726252423222120
Co
un
ts
6,000
4,000
2,000
0
-2,000
AB 56.23 %
NaAB 43.74 %
NaH 0.03 %
a NH3BH3 65.66% NaNH2BH3 29.83%
NaH 4.51%
b NH3BH3 65.66% NaNH2BH3 29.83%
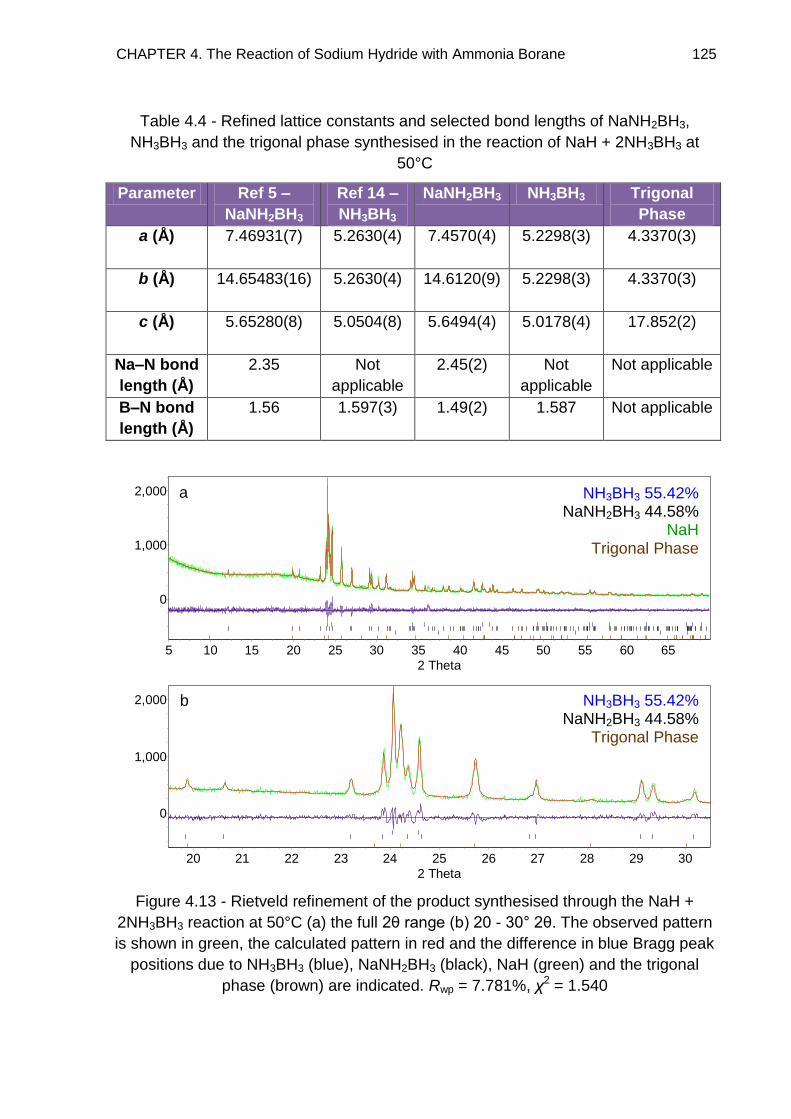
CHAPTER 4. The Reaction of Sodium Hydride with Ammonia Borane 125
Table 4.4 - Refined lattice constants and selected bond lengths of NaNH2BH3,
NH3BH3 and the trigonal phase synthesised in the reaction of NaH + 2NH3BH3 at
50°C
Parameter Ref 5 –
NaNH2BH3
Ref 14 –
NH3BH3
NaNH2BH3 NH3BH3 Trigonal
Phase
a (Å) 7.46931(7)
5.2630(4) 7.4570(4) 5.2298(3) 4.3370(3)
b (Å) 14.65483(16)
5.2630(4) 14.6120(9) 5.2298(3) 4.3370(3)
c (Å) 5.65280(8)
5.0504(8) 5.6494(4) 5.0178(4) 17.852(2)
Na–N bond
length (Å)
2.35 Not
applicable
2.45(2) Not
applicable
Not applicable
B–N bond
length (Å)
1.56 1.597(3) 1.49(2) 1.587 Not applicable
Figure 4.13 - Rietveld refinement of the product synthesised through the NaH +
2NH3BH3 reaction at 50°C (a) the full 2θ range (b) 20 - 30° 2θ. The observed pattern
is shown in green, the calculated pattern in red and the difference in blue Bragg peak
positions due to NH3BH3 (blue), NaNH2BH3 (black), NaH (green) and the trigonal
phase (brown) are indicated. Rwp = 7.781%, χ2 = 1.540
2 Theta
6560555045403530252015105
Co
un
ts
2,000
1,000
0
AB 42.06 %
SAB 57.94 %
NaH 0.00 %
Na 1:2 0.00 %
2 Theta
3029282726252423222120
Co
un
ts
2,000
1,000
0
AB 42.06 %
SAB 57.94 %
NaH 0.00 %
Na 1:2 0.00 %
a NH3BH3 55.42% NaNH2BH3 44.58%
NaH Trigonal Phase
b NH3BH3 55.42% NaNH2BH3 44.58%
Trigonal Phase
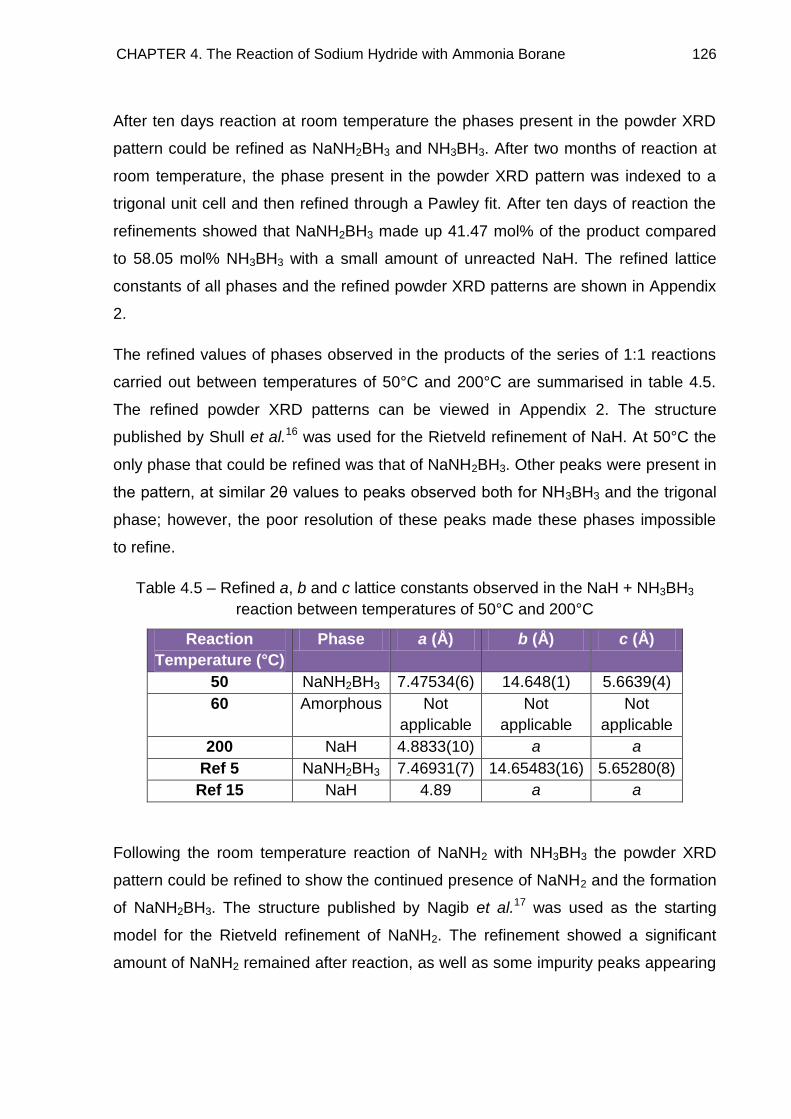
CHAPTER 4. The Reaction of Sodium Hydride with Ammonia Borane 126
After ten days reaction at room temperature the phases present in the powder XRD
pattern could be refined as NaNH2BH3 and NH3BH3. After two months of reaction at
room temperature, the phase present in the powder XRD pattern was indexed to a
trigonal unit cell and then refined through a Pawley fit. After ten days of reaction the
refinements showed that NaNH2BH3 made up 41.47 mol% of the product compared
to 58.05 mol% NH3BH3 with a small amount of unreacted NaH. The refined lattice
constants of all phases and the refined powder XRD patterns are shown in Appendix
2.
The refined values of phases observed in the products of the series of 1:1 reactions
carried out between temperatures of 50°C and 200°C are summarised in table 4.5.
The refined powder XRD patterns can be viewed in Appendix 2. The structure
published by Shull et al.16 was used for the Rietveld refinement of NaH. At 50°C the
only phase that could be refined was that of NaNH2BH3. Other peaks were present in
the pattern, at similar 2θ values to peaks observed both for NH3BH3 and the trigonal
phase; however, the poor resolution of these peaks made these phases impossible
to refine.
Table 4.5 – Refined a, b and c lattice constants observed in the NaH + NH3BH3
reaction between temperatures of 50°C and 200°C
Reaction
Temperature (°C)
Phase a (Å) b (Å) c (Å)
50 NaNH2BH3 7.47534(6) 14.648(1) 5.6639(4)
60 Amorphous Not
applicable
Not
applicable
Not
applicable
200 NaH 4.8833(10) a a
Ref 5 NaNH2BH3 7.46931(7) 14.65483(16) 5.65280(8)
Ref 15 NaH 4.89 a a
Following the room temperature reaction of NaNH2 with NH3BH3 the powder XRD
pattern could be refined to show the continued presence of NaNH2 and the formation
of NaNH2BH3. The structure published by Nagib et al.17 was used as the starting
model for the Rietveld refinement of NaNH2. The refinement showed a significant
amount of NaNH2 remained after reaction, as well as some impurity peaks appearing
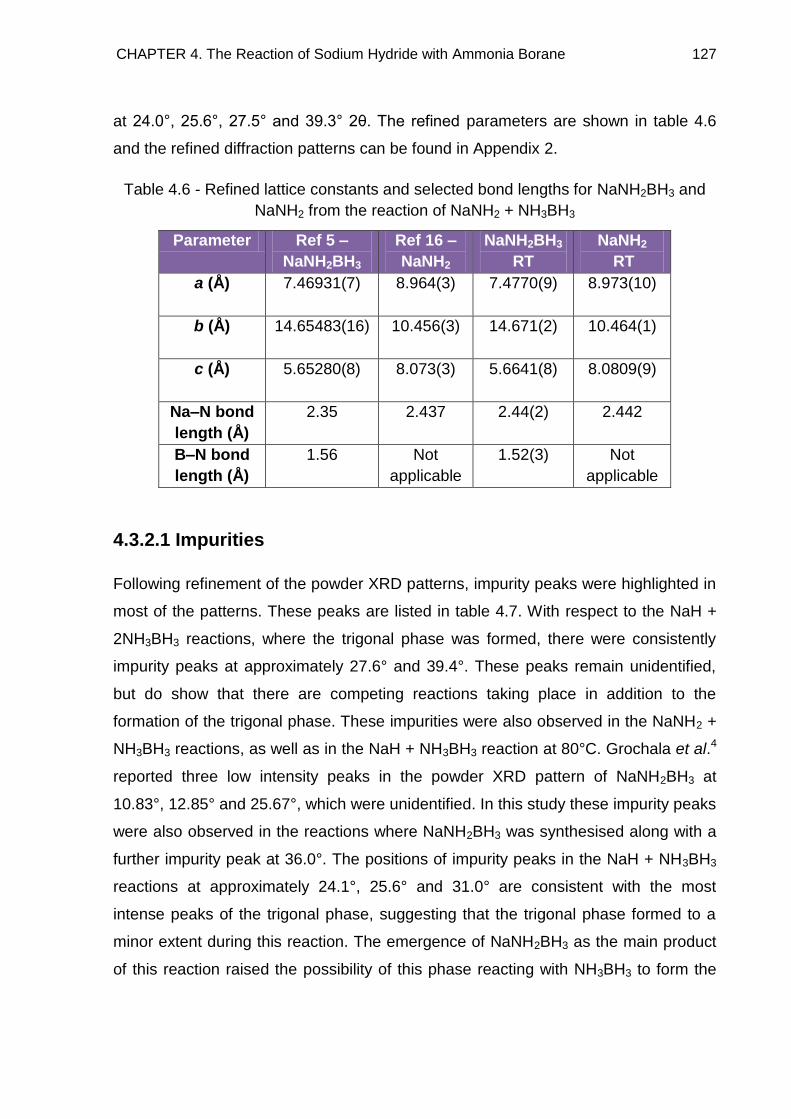
CHAPTER 4. The Reaction of Sodium Hydride with Ammonia Borane 127
at 24.0°, 25.6°, 27.5° and 39.3° 2θ. The refined parameters are shown in table 4.6
and the refined diffraction patterns can be found in Appendix 2.
Table 4.6 - Refined lattice constants and selected bond lengths for NaNH2BH3 and
NaNH2 from the reaction of NaNH2 + NH3BH3
Parameter Ref 5 –
NaNH2BH3
Ref 16 –
NaNH2
NaNH2BH3
RT
NaNH2
RT
a (Å) 7.46931(7)
8.964(3) 7.4770(9) 8.973(10)
b (Å) 14.65483(16)
10.456(3) 14.671(2) 10.464(1)
c (Å) 5.65280(8)
8.073(3) 5.6641(8) 8.0809(9)
Na–N bond
length (Å)
2.35 2.437 2.44(2) 2.442
B–N bond
length (Å)
1.56 Not
applicable
1.52(3) Not
applicable
4.3.2.1 Impurities
Following refinement of the powder XRD patterns, impurity peaks were highlighted in
most of the patterns. These peaks are listed in table 4.7. With respect to the NaH +
2NH3BH3 reactions, where the trigonal phase was formed, there were consistently
impurity peaks at approximately 27.6° and 39.4°. These peaks remain unidentified,
but do show that there are competing reactions taking place in addition to the
formation of the trigonal phase. These impurities were also observed in the NaNH2 +
NH3BH3 reactions, as well as in the NaH + NH3BH3 reaction at 80°C. Grochala et al.4
reported three low intensity peaks in the powder XRD pattern of NaNH2BH3 at
10.83°, 12.85° and 25.67°, which were unidentified. In this study these impurity peaks
were also observed in the reactions where NaNH2BH3 was synthesised along with a
further impurity peak at 36.0°. The positions of impurity peaks in the NaH + NH3BH3
reactions at approximately 24.1°, 25.6° and 31.0° are consistent with the most
intense peaks of the trigonal phase, suggesting that the trigonal phase formed to a
minor extent during this reaction. The emergence of NaNH2BH3 as the main product
of this reaction raised the possibility of this phase reacting with NH3BH3 to form the
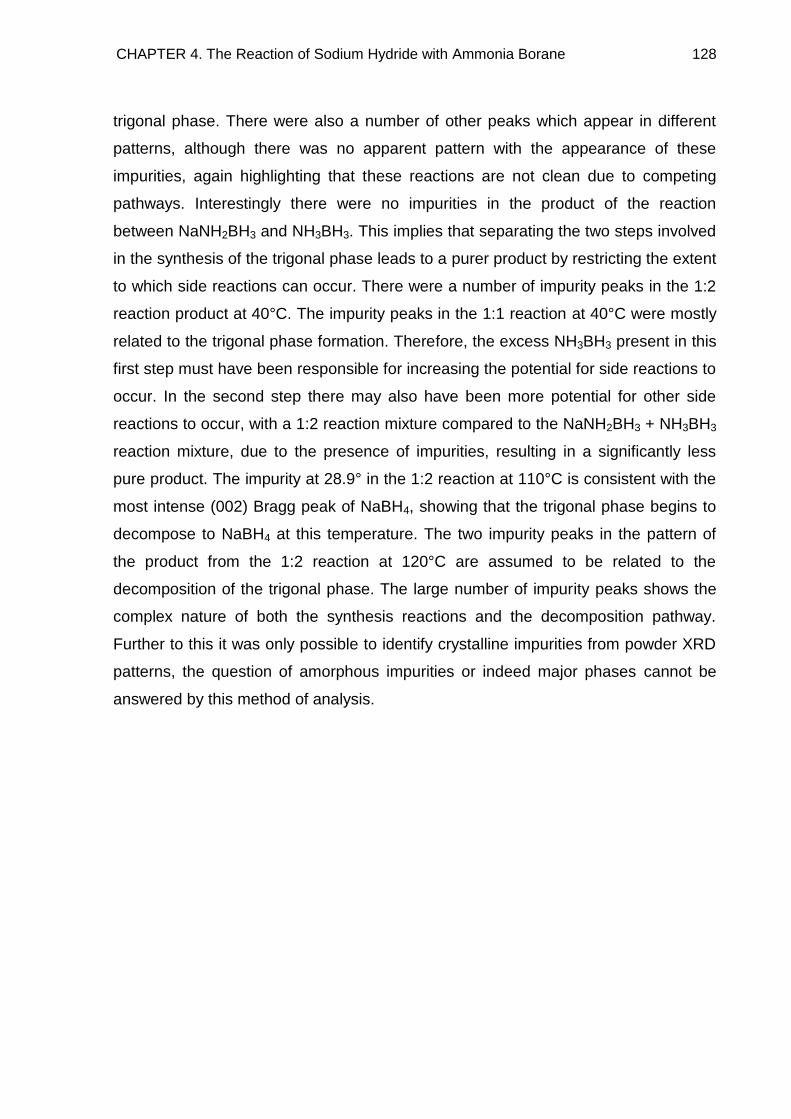
CHAPTER 4. The Reaction of Sodium Hydride with Ammonia Borane 128
trigonal phase. There were also a number of other peaks which appear in different
patterns, although there was no apparent pattern with the appearance of these
impurities, again highlighting that these reactions are not clean due to competing
pathways. Interestingly there were no impurities in the product of the reaction
between NaNH2BH3 and NH3BH3. This implies that separating the two steps involved
in the synthesis of the trigonal phase leads to a purer product by restricting the extent
to which side reactions can occur. There were a number of impurity peaks in the 1:2
reaction product at 40°C. The impurity peaks in the 1:1 reaction at 40°C were mostly
related to the trigonal phase formation. Therefore, the excess NH3BH3 present in this
first step must have been responsible for increasing the potential for side reactions to
occur. In the second step there may also have been more potential for other side
reactions to occur, with a 1:2 reaction mixture compared to the NaNH2BH3 + NH3BH3
reaction mixture, due to the presence of impurities, resulting in a significantly less
pure product. The impurity at 28.9° in the 1:2 reaction at 110°C is consistent with the
most intense (002) Bragg peak of NaBH4, showing that the trigonal phase begins to
decompose to NaBH4 at this temperature. The two impurity peaks in the pattern of
the product from the 1:2 reaction at 120°C are assumed to be related to the
decomposition of the trigonal phase. The large number of impurity peaks shows the
complex nature of both the synthesis reactions and the decomposition pathway.
Further to this it was only possible to identify crystalline impurities from powder XRD
patterns, the question of amorphous impurities or indeed major phases cannot be
answered by this method of analysis.
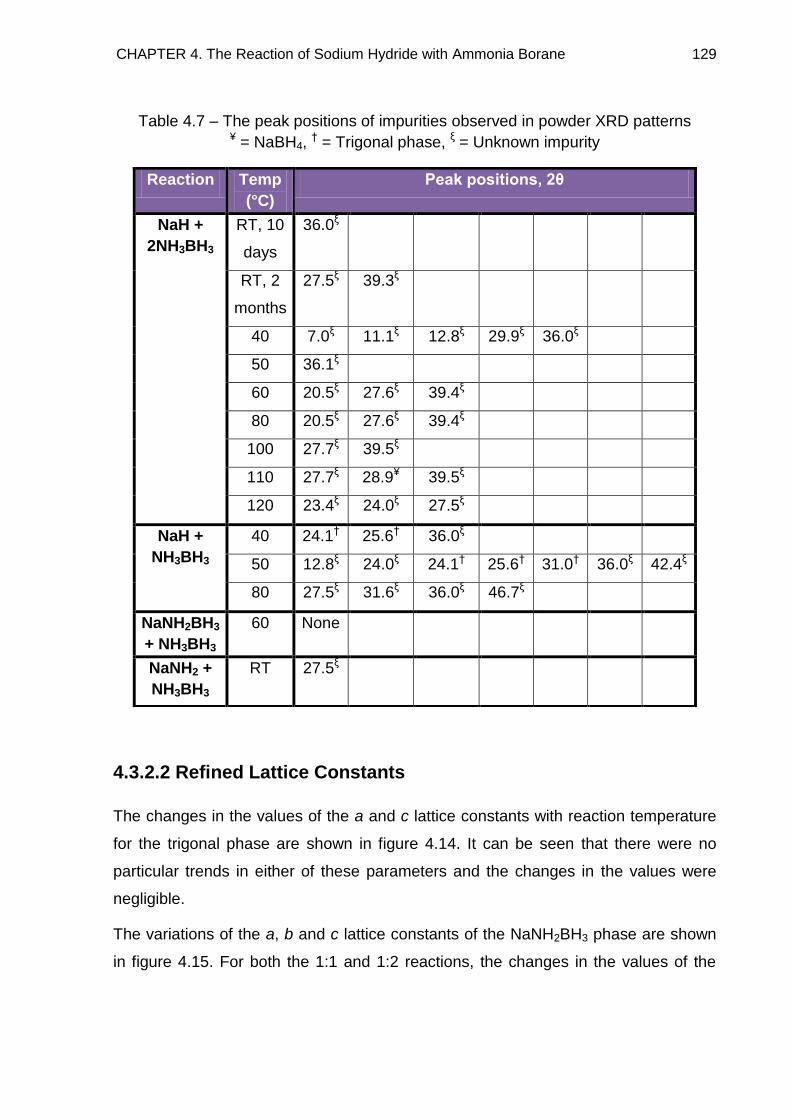
CHAPTER 4. The Reaction of Sodium Hydride with Ammonia Borane 129
Table 4.7 – The peak positions of impurities observed in powder XRD patterns ¥ = NaBH4,
† = Trigonal phase, ξ = Unknown impurity
Reaction Temp
(°C)
Peak positions, 2θ
NaH +
2NH3BH3
RT, 10
days
36.0ξ
RT, 2
months
27.5ξ 39.3ξ
40 7.0ξ 11.1ξ 12.8ξ 29.9ξ 36.0ξ
50 36.1ξ
60 20.5ξ 27.6ξ 39.4ξ
80 20.5ξ 27.6ξ 39.4ξ
100 27.7ξ 39.5ξ
110 27.7ξ 28.9¥ 39.5ξ
120 23.4ξ 24.0ξ 27.5ξ
NaH +
NH3BH3
40 24.1† 25.6† 36.0ξ
50 12.8ξ 24.0ξ 24.1† 25.6† 31.0† 36.0ξ 42.4ξ
80 27.5ξ 31.6ξ 36.0ξ 46.7ξ
NaNH2BH3
+ NH3BH3
60 None
NaNH2 +
NH3BH3
RT 27.5ξ
4.3.2.2 Refined Lattice Constants
The changes in the values of the a and c lattice constants with reaction temperature
for the trigonal phase are shown in figure 4.14. It can be seen that there were no
particular trends in either of these parameters and the changes in the values were
negligible.
The variations of the a, b and c lattice constants of the NaNH2BH3 phase are shown
in figure 4.15. For both the 1:1 and 1:2 reactions, the changes in the values of the
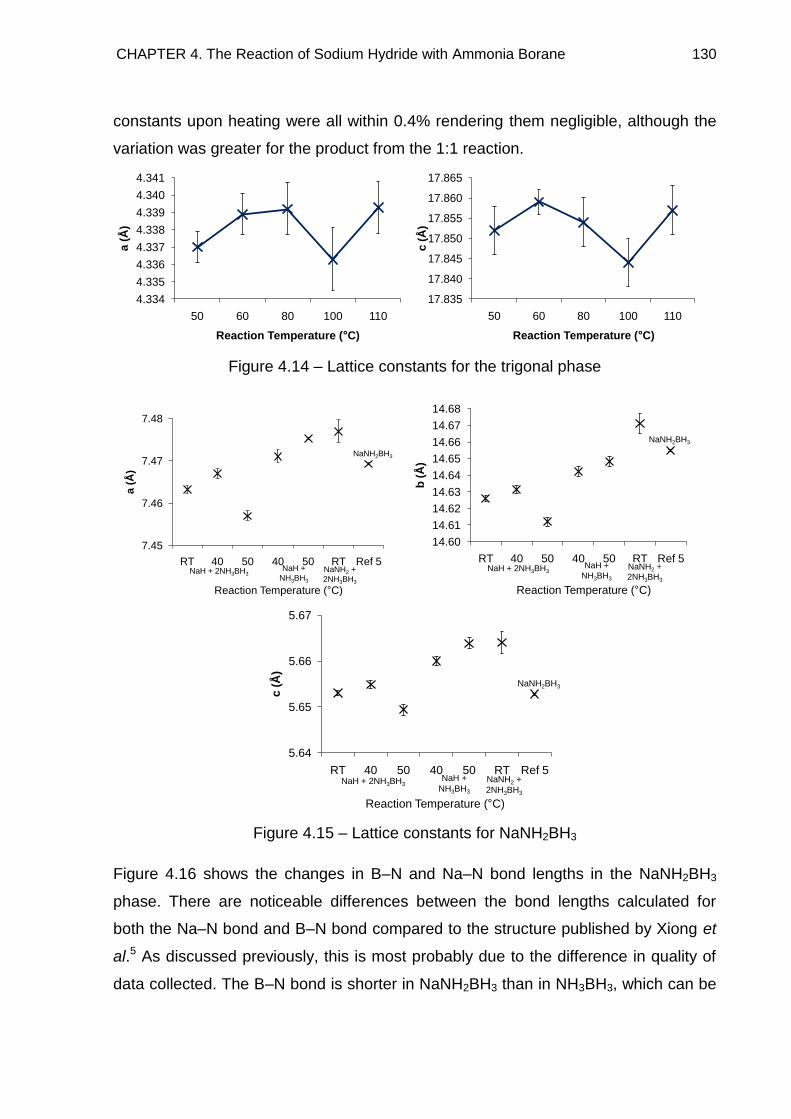
CHAPTER 4. The Reaction of Sodium Hydride with Ammonia Borane 130
constants upon heating were all within 0.4% rendering them negligible, although the
variation was greater for the product from the 1:1 reaction.
Figure 4.14 – Lattice constants for the trigonal phase
Figure 4.15 – Lattice constants for NaNH2BH3
Figure 4.16 shows the changes in B–N and Na–N bond lengths in the NaNH2BH3
phase. There are noticeable differences between the bond lengths calculated for
both the Na–N bond and B–N bond compared to the structure published by Xiong et
al.5 As discussed previously, this is most probably due to the difference in quality of
data collected. The B–N bond is shorter in NaNH2BH3 than in NH3BH3, which can be
4.334
4.335
4.336
4.337
4.338
4.339
4.340
4.341
50 60 80 100 110
a (
Å)
Reaction Temperature ( C)
17.835
17.840
17.845
17.850
17.855
17.860
17.865
50 60 80 100 110
c (
Å)
Reaction Temperature ( C)
7.45
7.46
7.47
7.48
RT 40 50 40 50 RT Ref 5
a (
Å)
NaH + 2NH3BH3NaH +
NH3BH3
NaNH2 +
2NH3BH3
NaNH2BH3
Reaction Temperature (°C)
14.60
14.61
14.62
14.63
14.64
14.65
14.66
14.67
14.68
RT 40 50 40 50 RT Ref 5
b (
Å)
NaNH2BH3
NaH + 2NH3BH3NaH +
NH3BH3
NaNH2 +
2NH3BH3
Reaction Temperature (°C)
5.64
5.65
5.66
5.67
RT 40 50 40 50 RT Ref 5
c (
Å)
NaNH2BH3
NaH + 2NH3BH3NaH +
NH3BH3
NaNH2 +
2NH3BH3
Reaction Temperature (°C)
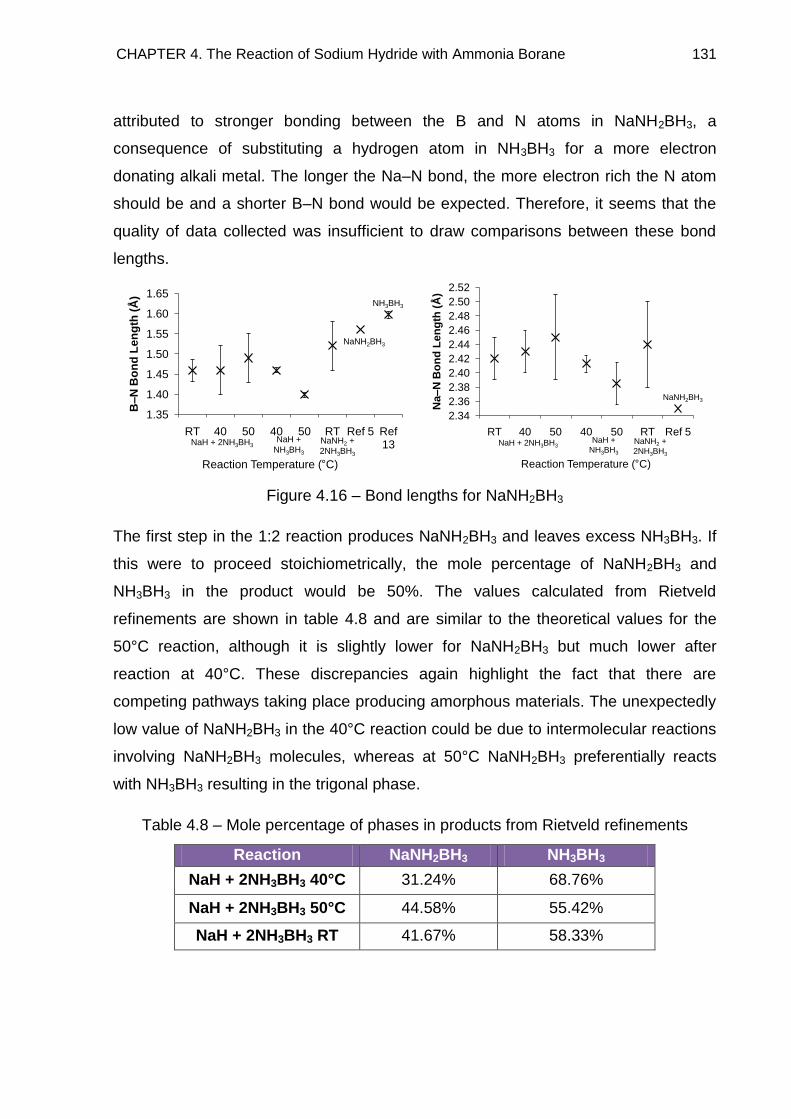
CHAPTER 4. The Reaction of Sodium Hydride with Ammonia Borane 131
attributed to stronger bonding between the B and N atoms in NaNH2BH3, a
consequence of substituting a hydrogen atom in NH3BH3 for a more electron
donating alkali metal. The longer the Na–N bond, the more electron rich the N atom
should be and a shorter B–N bond would be expected. Therefore, it seems that the
quality of data collected was insufficient to draw comparisons between these bond
lengths.
Figure 4.16 – Bond lengths for NaNH2BH3
The first step in the 1:2 reaction produces NaNH2BH3 and leaves excess NH3BH3. If
this were to proceed stoichiometrically, the mole percentage of NaNH2BH3 and
NH3BH3 in the product would be 50%. The values calculated from Rietveld
refinements are shown in table 4.8 and are similar to the theoretical values for the
50°C reaction, although it is slightly lower for NaNH2BH3 but much lower after
reaction at 40°C. These discrepancies again highlight the fact that there are
competing pathways taking place producing amorphous materials. The unexpectedly
low value of NaNH2BH3 in the 40°C reaction could be due to intermolecular reactions
involving NaNH2BH3 molecules, whereas at 50°C NaNH2BH3 preferentially reacts
with NH3BH3 resulting in the trigonal phase.
Table 4.8 – Mole percentage of phases in products from Rietveld refinements
Reaction NaNH2BH3 NH3BH3
NaH + 2NH3BH3 40°C 31.24% 68.76%
NaH + 2NH3BH3 50°C 44.58% 55.42%
NaH + 2NH3BH3 RT 41.67% 58.33%
1.35
1.40
1.45
1.50
1.55
1.60
1.65
RT 40 50 40 50 RT Ref 5 Ref 13
B–
N B
on
d L
en
gth
(Å
)
NaH + 2NH3BH3NaH +
NH3BH3
NaNH2 +
2NH3BH3
Reaction Temperature (°C)
NaNH2BH3
NH3BH3
2.34
2.36
2.38
2.40
2.42
2.44
2.46
2.48
2.50
2.52
RT 40 50 40 50 RT Ref 5N
a–
N B
on
d L
en
gth
(Å
)NaH + 2NH3BH3
NaH +
NH3BH3
NaNH2 +
2NH3BH3
Reaction Temperature (°C)
NaNH2BH3
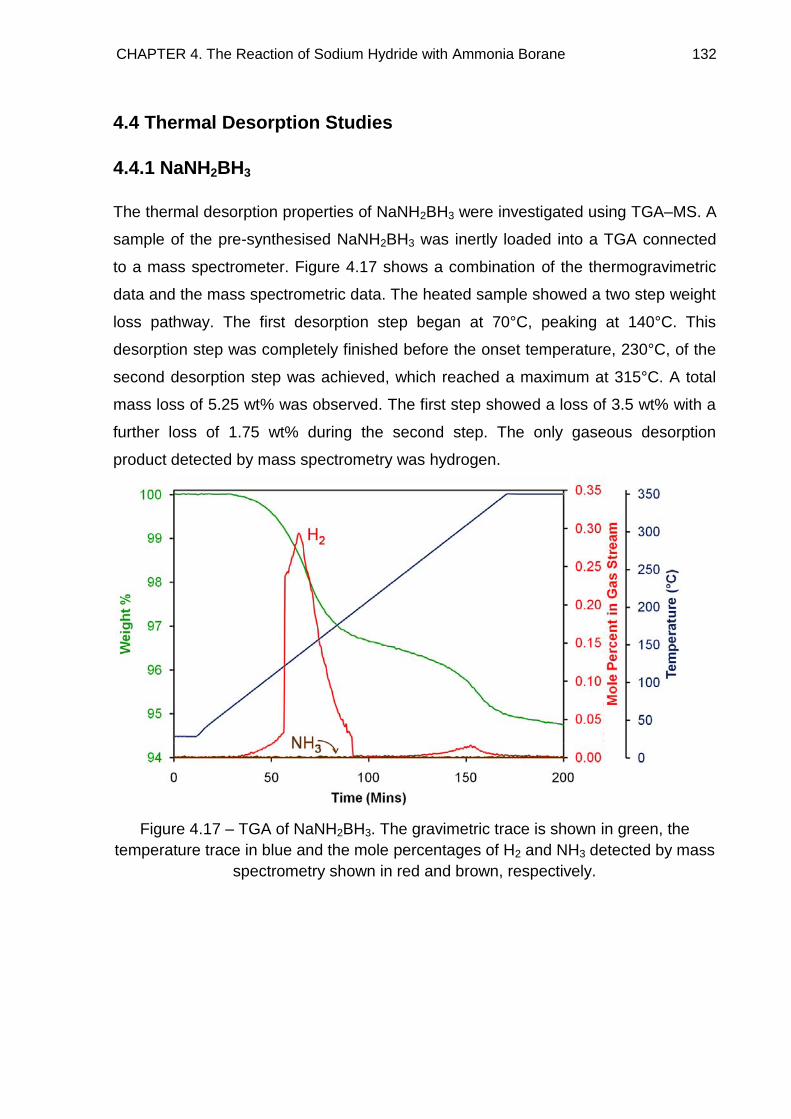
CHAPTER 4. The Reaction of Sodium Hydride with Ammonia Borane 132
4.4 Thermal Desorption Studies
4.4.1 NaNH2BH3
The thermal desorption properties of NaNH2BH3 were investigated using TGA–MS. A
sample of the pre-synthesised NaNH2BH3 was inertly loaded into a TGA connected
to a mass spectrometer. Figure 4.17 shows a combination of the thermogravimetric
data and the mass spectrometric data. The heated sample showed a two step weight
loss pathway. The first desorption step began at 70°C, peaking at 140°C. This
desorption step was completely finished before the onset temperature, 230°C, of the
second desorption step was achieved, which reached a maximum at 315°C. A total
mass loss of 5.25 wt% was observed. The first step showed a loss of 3.5 wt% with a
further loss of 1.75 wt% during the second step. The only gaseous desorption
product detected by mass spectrometry was hydrogen.
Figure 4.17 – TGA of NaNH2BH3. The gravimetric trace is shown in green, the
temperature trace in blue and the mole percentages of H2 and NH3 detected by mass
spectrometry shown in red and brown, respectively.
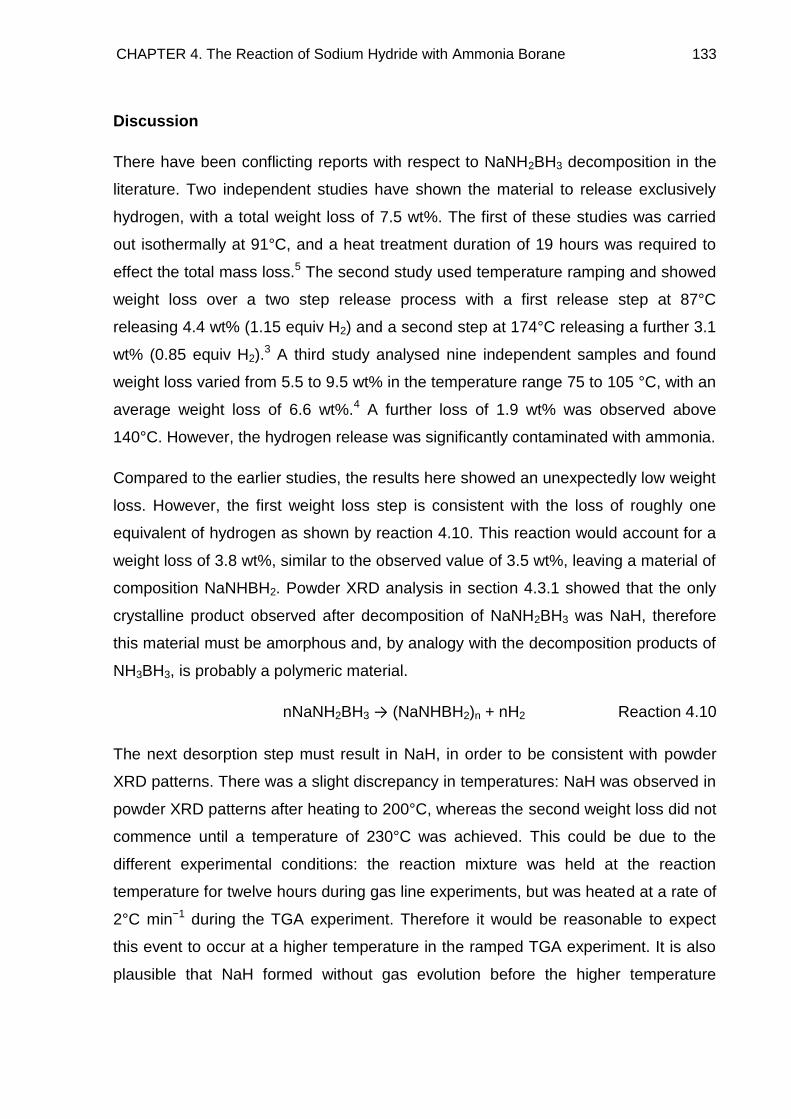
CHAPTER 4. The Reaction of Sodium Hydride with Ammonia Borane 133
Discussion
There have been conflicting reports with respect to NaNH2BH3 decomposition in the
literature. Two independent studies have shown the material to release exclusively
hydrogen, with a total weight loss of 7.5 wt%. The first of these studies was carried
out isothermally at 91°C, and a heat treatment duration of 19 hours was required to
effect the total mass loss.5 The second study used temperature ramping and showed
weight loss over a two step release process with a first release step at 87°C
releasing 4.4 wt% (1.15 equiv H2) and a second step at 174°C releasing a further 3.1
wt% (0.85 equiv H2).3 A third study analysed nine independent samples and found
weight loss varied from 5.5 to 9.5 wt% in the temperature range 75 to 105 °C, with an
average weight loss of 6.6 wt%.4 A further loss of 1.9 wt% was observed above
140°C. However, the hydrogen release was significantly contaminated with ammonia.
Compared to the earlier studies, the results here showed an unexpectedly low weight
loss. However, the first weight loss step is consistent with the loss of roughly one
equivalent of hydrogen as shown by reaction 4.10. This reaction would account for a
weight loss of 3.8 wt%, similar to the observed value of 3.5 wt%, leaving a material of
composition NaNHBH2. Powder XRD analysis in section 4.3.1 showed that the only
crystalline product observed after decomposition of NaNH2BH3 was NaH, therefore
this material must be amorphous and, by analogy with the decomposition products of
NH3BH3, is probably a polymeric material.
nNaNH2BH3 → (NaNHBH2)n + nH2 Reaction 4.10
The next desorption step must result in NaH, in order to be consistent with powder
XRD patterns. There was a slight discrepancy in temperatures: NaH was observed in
powder XRD patterns after heating to 200°C, whereas the second weight loss did not
commence until a temperature of 230°C was achieved. This could be due to the
different experimental conditions: the reaction mixture was held at the reaction
temperature for twelve hours during gas line experiments, but was heated at a rate of
2°C min−1 during the TGA experiment. Therefore it would be reasonable to expect
this event to occur at a higher temperature in the ramped TGA experiment. It is also
plausible that NaH formed without gas evolution before the higher temperature
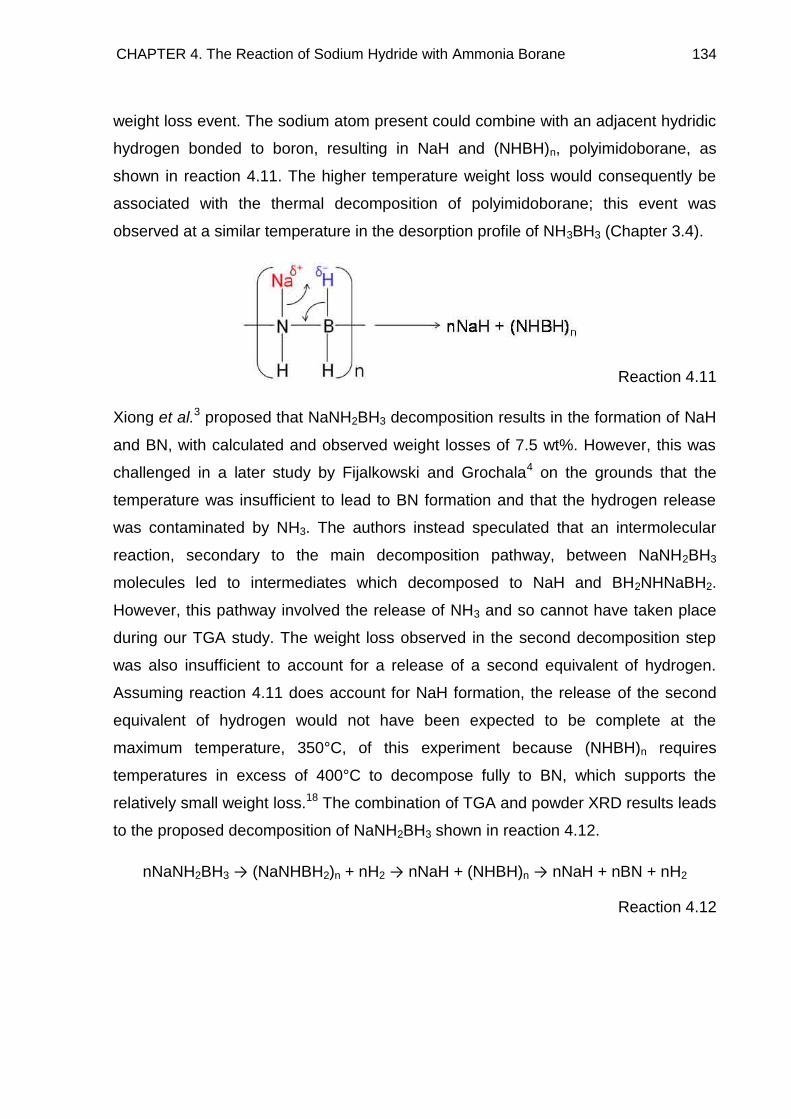
CHAPTER 4. The Reaction of Sodium Hydride with Ammonia Borane 134
weight loss event. The sodium atom present could combine with an adjacent hydridic
hydrogen bonded to boron, resulting in NaH and (NHBH)n, polyimidoborane, as
shown in reaction 4.11. The higher temperature weight loss would consequently be
associated with the thermal decomposition of polyimidoborane; this event was
observed at a similar temperature in the desorption profile of NH3BH3 (Chapter 3.4).
Reaction 4.11
Xiong et al.3 proposed that NaNH2BH3 decomposition results in the formation of NaH
and BN, with calculated and observed weight losses of 7.5 wt%. However, this was
challenged in a later study by Fijalkowski and Grochala4 on the grounds that the
temperature was insufficient to lead to BN formation and that the hydrogen release
was contaminated by NH3. The authors instead speculated that an intermolecular
reaction, secondary to the main decomposition pathway, between NaNH2BH3
molecules led to intermediates which decomposed to NaH and BH2NHNaBH2.
However, this pathway involved the release of NH3 and so cannot have taken place
during our TGA study. The weight loss observed in the second decomposition step
was also insufficient to account for a release of a second equivalent of hydrogen.
Assuming reaction 4.11 does account for NaH formation, the release of the second
equivalent of hydrogen would not have been expected to be complete at the
maximum temperature, 350°C, of this experiment because (NHBH)n requires
temperatures in excess of 400°C to decompose fully to BN, which supports the
relatively small weight loss.18 The combination of TGA and powder XRD results leads
to the proposed decomposition of NaNH2BH3 shown in reaction 4.12.
nNaNH2BH3 → (NaNHBH2)n + nH2 → nNaH + (NHBH)n → nNaH + nBN + nH2
Reaction 4.12
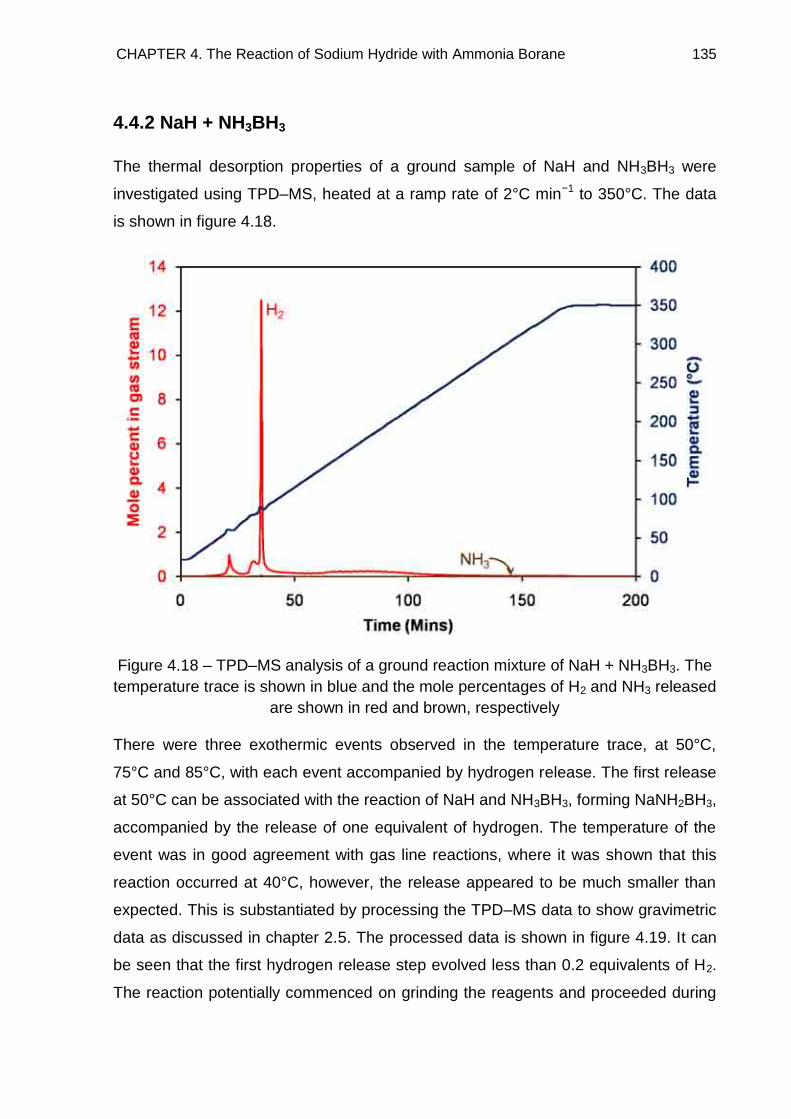
CHAPTER 4. The Reaction of Sodium Hydride with Ammonia Borane 135
4.4.2 NaH + NH3BH3
The thermal desorption properties of a ground sample of NaH and NH3BH3 were
investigated using TPD–MS, heated at a ramp rate of 2°C min−1 to 350°C. The data
is shown in figure 4.18.
Figure 4.18 – TPD–MS analysis of a ground reaction mixture of NaH + NH3BH3. The
temperature trace is shown in blue and the mole percentages of H2 and NH3 released
are shown in red and brown, respectively
There were three exothermic events observed in the temperature trace, at 50°C,
75°C and 85°C, with each event accompanied by hydrogen release. The first release
at 50°C can be associated with the reaction of NaH and NH3BH3, forming NaNH2BH3,
accompanied by the release of one equivalent of hydrogen. The temperature of the
event was in good agreement with gas line reactions, where it was shown that this
reaction occurred at 40°C, however, the release appeared to be much smaller than
expected. This is substantiated by processing the TPD–MS data to show gravimetric
data as discussed in chapter 2.5. The processed data is shown in figure 4.19. It can
be seen that the first hydrogen release step evolved less than 0.2 equivalents of H2.
The reaction potentially commenced on grinding the reagents and proceeded during
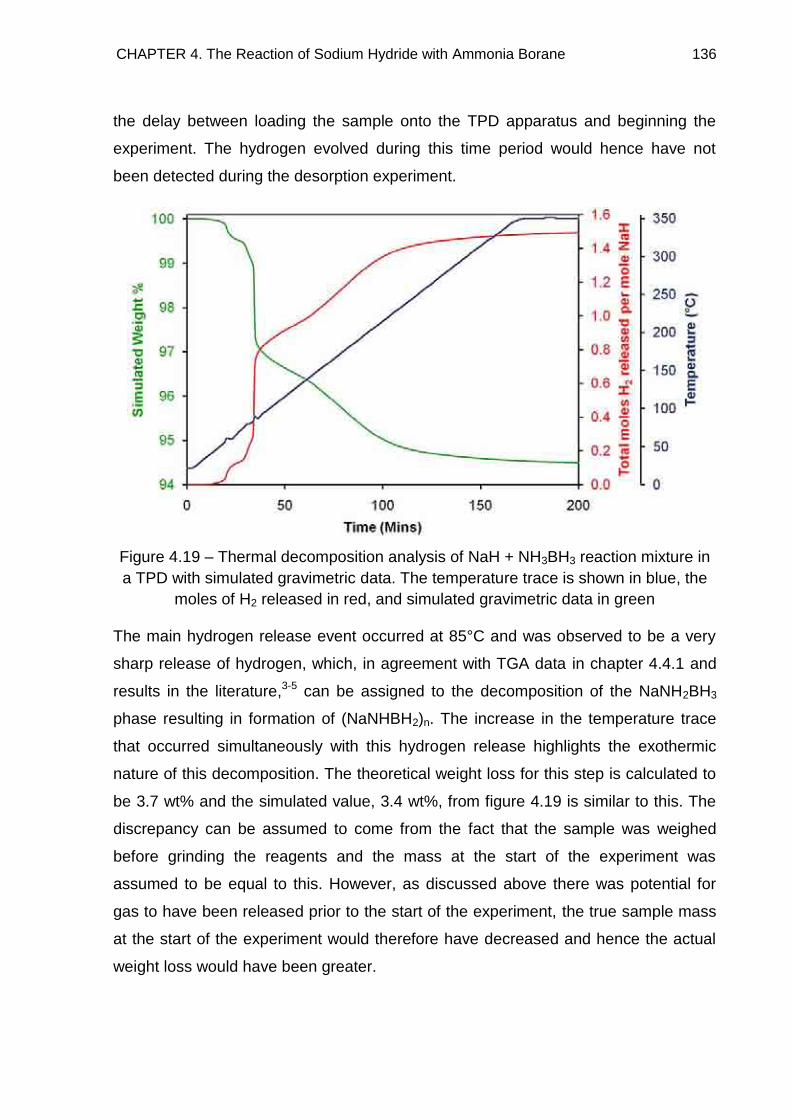
CHAPTER 4. The Reaction of Sodium Hydride with Ammonia Borane 136
the delay between loading the sample onto the TPD apparatus and beginning the
experiment. The hydrogen evolved during this time period would hence have not
been detected during the desorption experiment.
Figure 4.19 – Thermal decomposition analysis of NaH + NH3BH3 reaction mixture in
a TPD with simulated gravimetric data. The temperature trace is shown in blue, the
moles of H2 released in red, and simulated gravimetric data in green
The main hydrogen release event occurred at 85°C and was observed to be a very
sharp release of hydrogen, which, in agreement with TGA data in chapter 4.4.1 and
results in the literature,3-5 can be assigned to the decomposition of the NaNH2BH3
phase resulting in formation of (NaNHBH2)n. The increase in the temperature trace
that occurred simultaneously with this hydrogen release highlights the exothermic
nature of this decomposition. The theoretical weight loss for this step is calculated to
be 3.7 wt% and the simulated value, 3.4 wt%, from figure 4.19 is similar to this. The
discrepancy can be assumed to come from the fact that the sample was weighed
before grinding the reagents and the mass at the start of the experiment was
assumed to be equal to this. However, as discussed above there was potential for
gas to have been released prior to the start of the experiment, the true sample mass
at the start of the experiment would therefore have decreased and hence the actual
weight loss would have been greater.
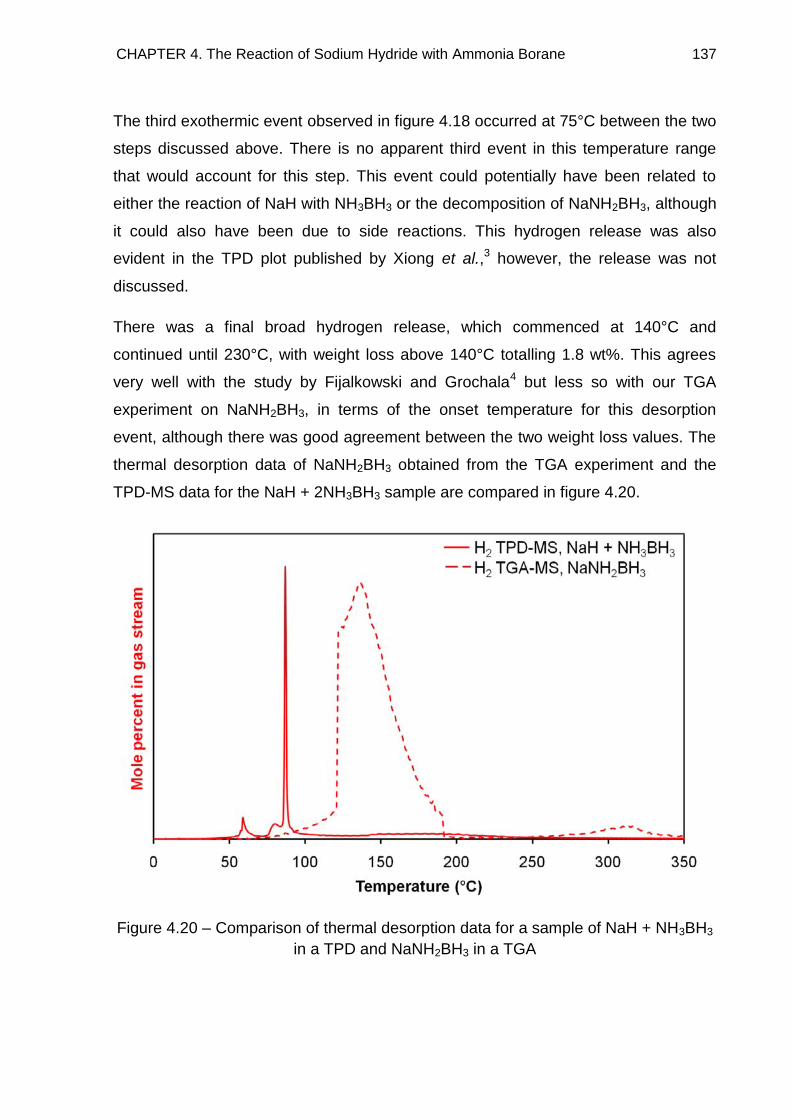
CHAPTER 4. The Reaction of Sodium Hydride with Ammonia Borane 137
The third exothermic event observed in figure 4.18 occurred at 75°C between the two
steps discussed above. There is no apparent third event in this temperature range
that would account for this step. This event could potentially have been related to
either the reaction of NaH with NH3BH3 or the decomposition of NaNH2BH3, although
it could also have been due to side reactions. This hydrogen release was also
evident in the TPD plot published by Xiong et al.,3 however, the release was not
discussed.
There was a final broad hydrogen release, which commenced at 140°C and
continued until 230°C, with weight loss above 140°C totalling 1.8 wt%. This agrees
very well with the study by Fijalkowski and Grochala4 but less so with our TGA
experiment on NaNH2BH3, in terms of the onset temperature for this desorption
event, although there was good agreement between the two weight loss values. The
thermal desorption data of NaNH2BH3 obtained from the TGA experiment and the
TPD-MS data for the NaH + 2NH3BH3 sample are compared in figure 4.20.
Figure 4.20 – Comparison of thermal desorption data for a sample of NaH + NH3BH3
in a TPD and NaNH2BH3 in a TGA
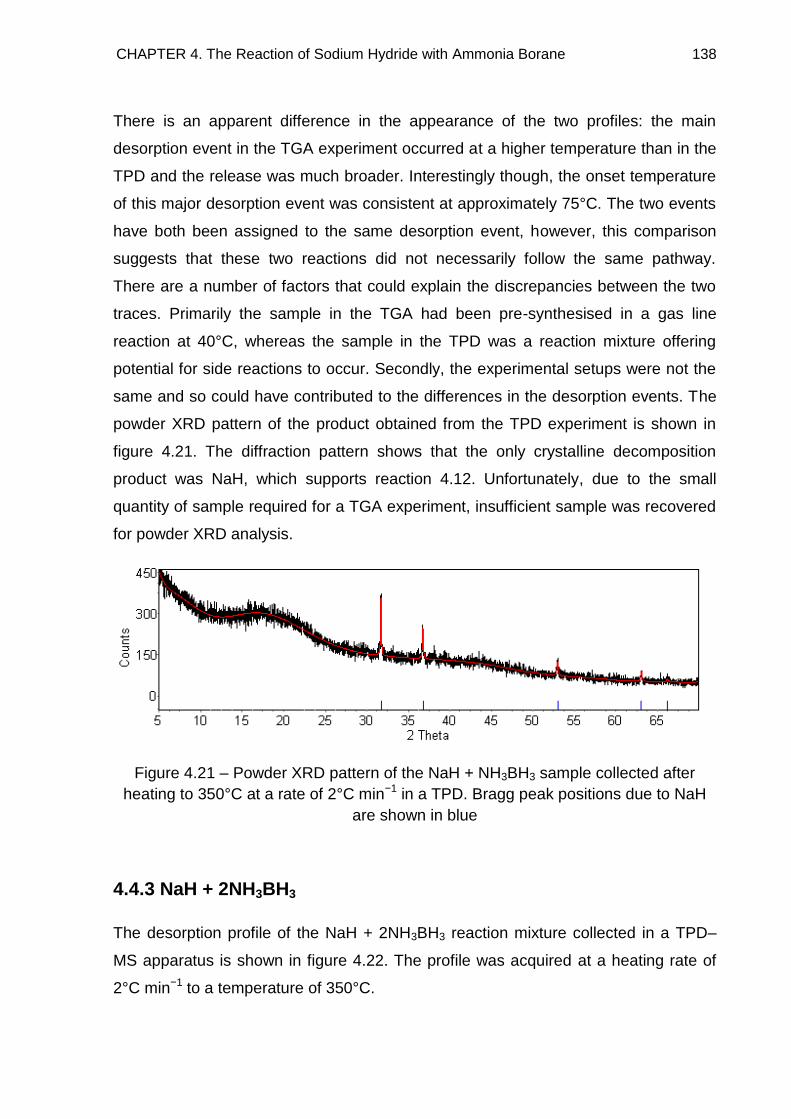
CHAPTER 4. The Reaction of Sodium Hydride with Ammonia Borane 138
There is an apparent difference in the appearance of the two profiles: the main
desorption event in the TGA experiment occurred at a higher temperature than in the
TPD and the release was much broader. Interestingly though, the onset temperature
of this major desorption event was consistent at approximately 75°C. The two events
have both been assigned to the same desorption event, however, this comparison
suggests that these two reactions did not necessarily follow the same pathway.
There are a number of factors that could explain the discrepancies between the two
traces. Primarily the sample in the TGA had been pre-synthesised in a gas line
reaction at 40°C, whereas the sample in the TPD was a reaction mixture offering
potential for side reactions to occur. Secondly, the experimental setups were not the
same and so could have contributed to the differences in the desorption events. The
powder XRD pattern of the product obtained from the TPD experiment is shown in
figure 4.21. The diffraction pattern shows that the only crystalline decomposition
product was NaH, which supports reaction 4.12. Unfortunately, due to the small
quantity of sample required for a TGA experiment, insufficient sample was recovered
for powder XRD analysis.
Figure 4.21 – Powder XRD pattern of the NaH + NH3BH3 sample collected after
heating to 350°C at a rate of 2°C min−1 in a TPD. Bragg peak positions due to NaH
are shown in blue
4.4.3 NaH + 2NH3BH3
The desorption profile of the NaH + 2NH3BH3 reaction mixture collected in a TPD–
MS apparatus is shown in figure 4.22. The profile was acquired at a heating rate of
2°C min−1 to a temperature of 350°C.
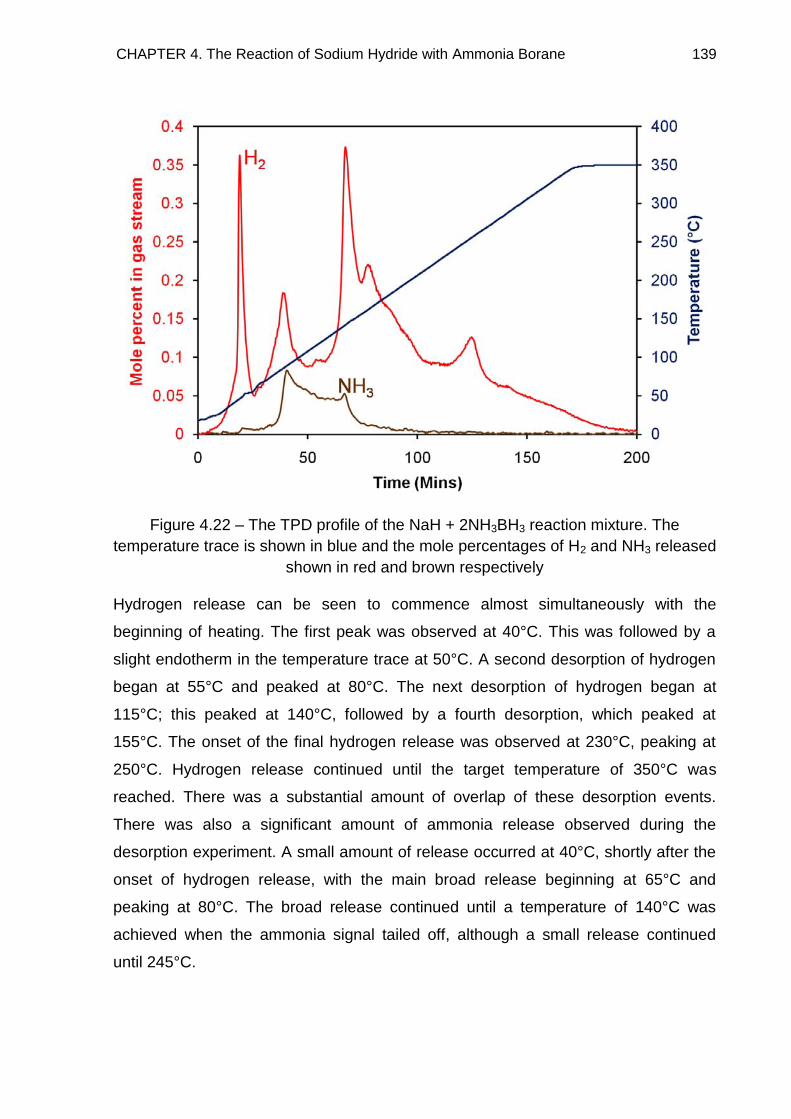
CHAPTER 4. The Reaction of Sodium Hydride with Ammonia Borane 139
Figure 4.22 – The TPD profile of the NaH + 2NH3BH3 reaction mixture. The
temperature trace is shown in blue and the mole percentages of H2 and NH3 released
shown in red and brown respectively
Hydrogen release can be seen to commence almost simultaneously with the
beginning of heating. The first peak was observed at 40°C. This was followed by a
slight endotherm in the temperature trace at 50°C. A second desorption of hydrogen
began at 55°C and peaked at 80°C. The next desorption of hydrogen began at
115°C; this peaked at 140°C, followed by a fourth desorption, which peaked at
155°C. The onset of the final hydrogen release was observed at 230°C, peaking at
250°C. Hydrogen release continued until the target temperature of 350°C was
reached. There was a substantial amount of overlap of these desorption events.
There was also a significant amount of ammonia release observed during the
desorption experiment. A small amount of release occurred at 40°C, shortly after the
onset of hydrogen release, with the main broad release beginning at 65°C and
peaking at 80°C. The broad release continued until a temperature of 140°C was
achieved when the ammonia signal tailed off, although a small release continued
until 245°C.
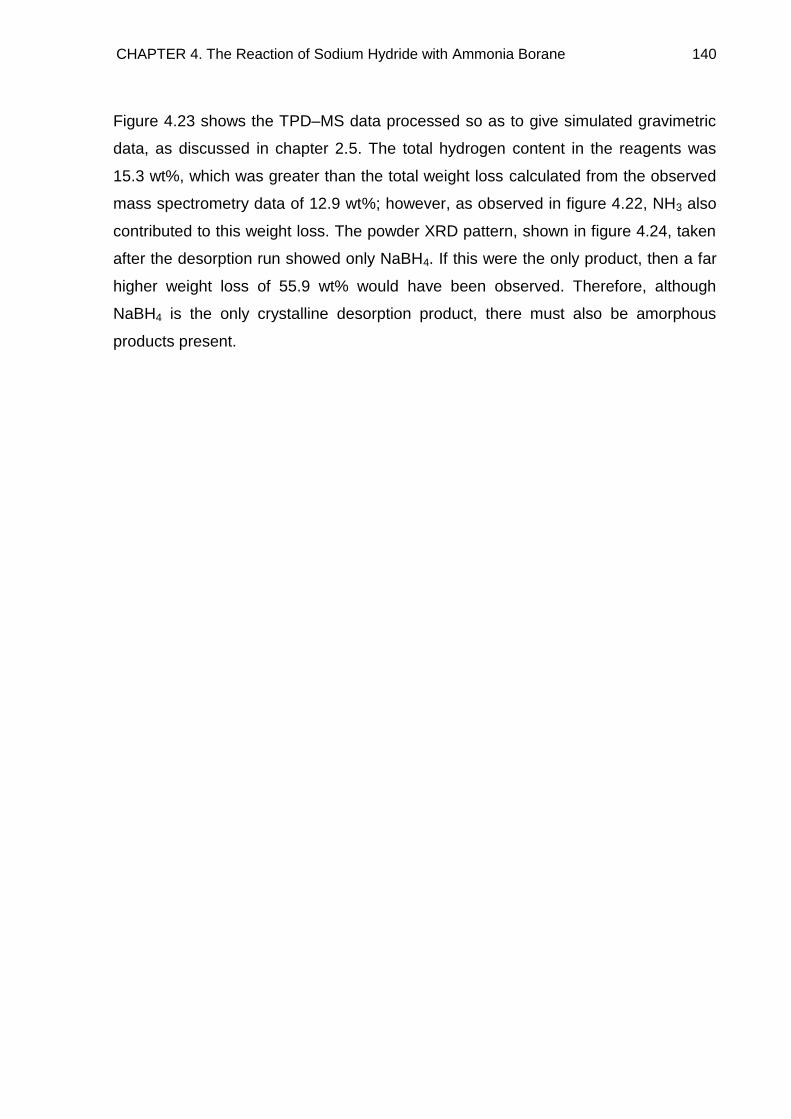
CHAPTER 4. The Reaction of Sodium Hydride with Ammonia Borane 140
Figure 4.23 shows the TPD–MS data processed so as to give simulated gravimetric
data, as discussed in chapter 2.5. The total hydrogen content in the reagents was
15.3 wt%, which was greater than the total weight loss calculated from the observed
mass spectrometry data of 12.9 wt%; however, as observed in figure 4.22, NH3 also
contributed to this weight loss. The powder XRD pattern, shown in figure 4.24, taken
after the desorption run showed only NaBH4. If this were the only product, then a far
higher weight loss of 55.9 wt% would have been observed. Therefore, although
NaBH4 is the only crystalline desorption product, there must also be amorphous
products present.
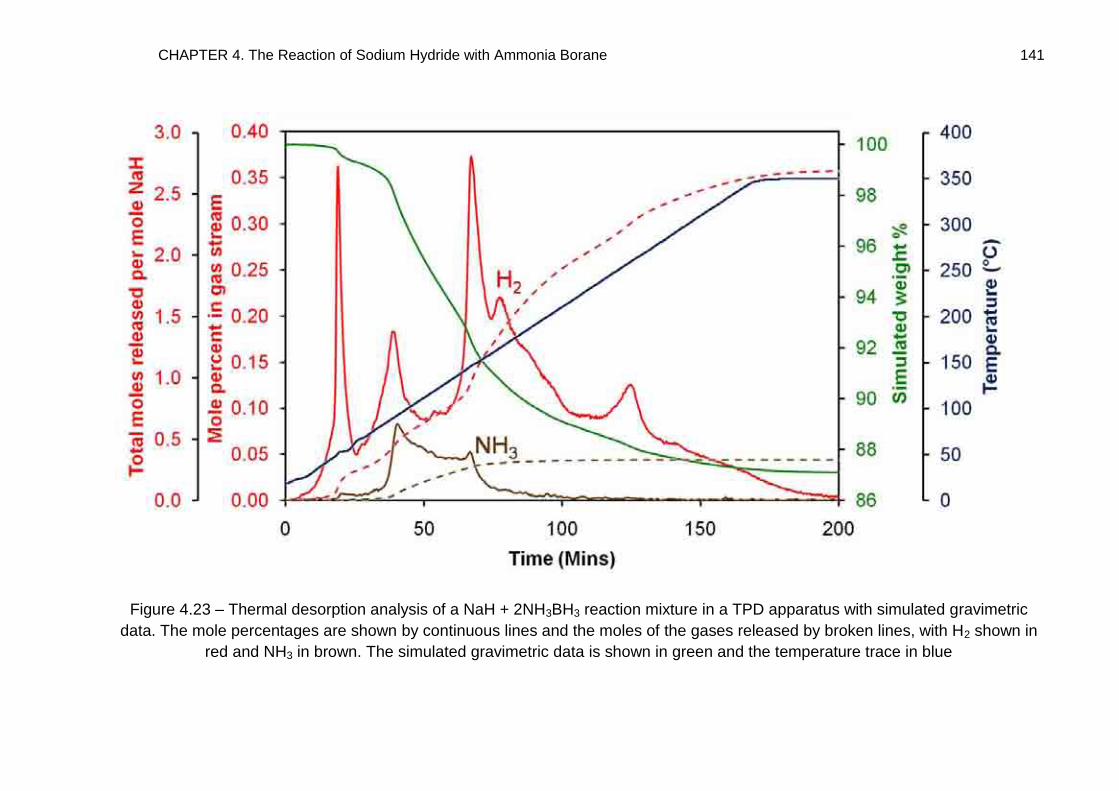
CHAPTER 4. The Reaction of Sodium Hydride with Ammonia Borane 141
Figure 4.23 – Thermal desorption analysis of a NaH + 2NH3BH3 reaction mixture in a TPD apparatus with simulated gravimetric
data. The mole percentages are shown by continuous lines and the moles of the gases released by broken lines, with H2 shown in
red and NH3 in brown. The simulated gravimetric data is shown in green and the temperature trace in blue
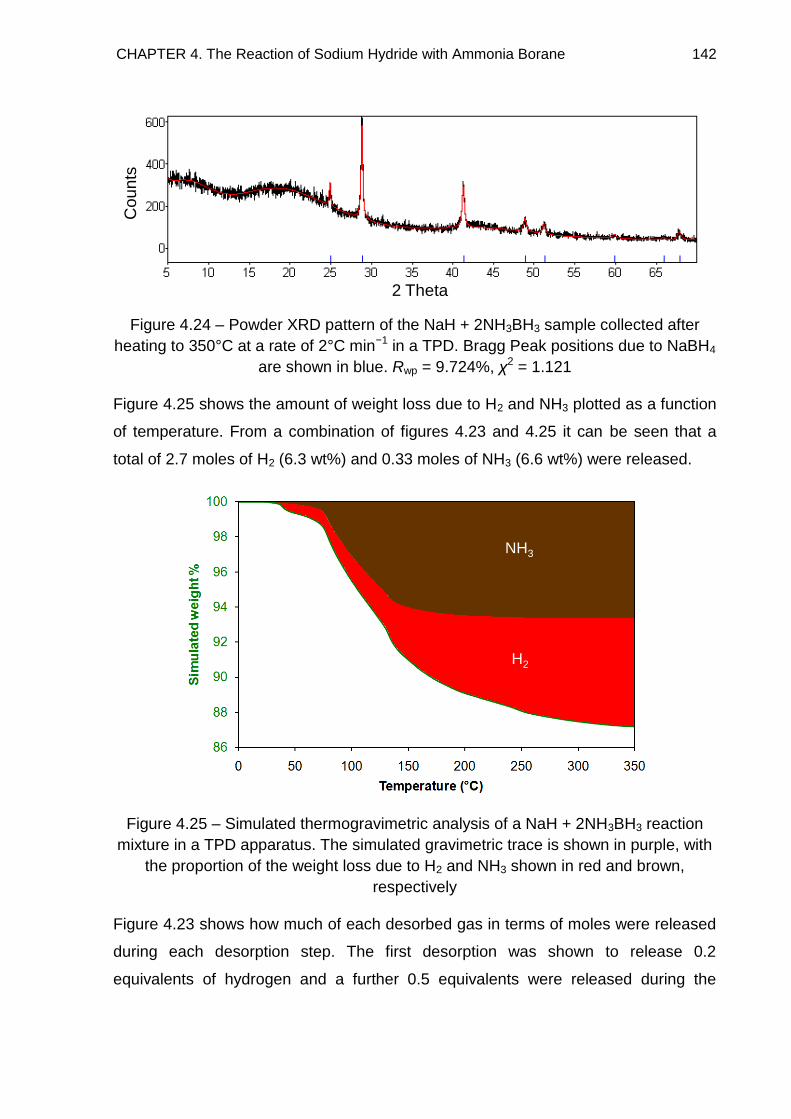
CHAPTER 4. The Reaction of Sodium Hydride with Ammonia Borane 142
Figure 4.24 – Powder XRD pattern of the NaH + 2NH3BH3 sample collected after
heating to 350°C at a rate of 2°C min−1 in a TPD. Bragg Peak positions due to NaBH4
are shown in blue. Rwp = 9.724%, χ2 = 1.121
Figure 4.25 shows the amount of weight loss due to H2 and NH3 plotted as a function
of temperature. From a combination of figures 4.23 and 4.25 it can be seen that a
total of 2.7 moles of H2 (6.3 wt%) and 0.33 moles of NH3 (6.6 wt%) were released.
Figure 4.25 – Simulated thermogravimetric analysis of a NaH + 2NH3BH3 reaction
mixture in a TPD apparatus. The simulated gravimetric trace is shown in purple, with
the proportion of the weight loss due to H2 and NH3 shown in red and brown,
respectively
Figure 4.23 shows how much of each desorbed gas in terms of moles were released
during each desorption step. The first desorption was shown to release 0.2
equivalents of hydrogen and a further 0.5 equivalents were released during the
2 Theta
Co
un
ts
NH3
H2
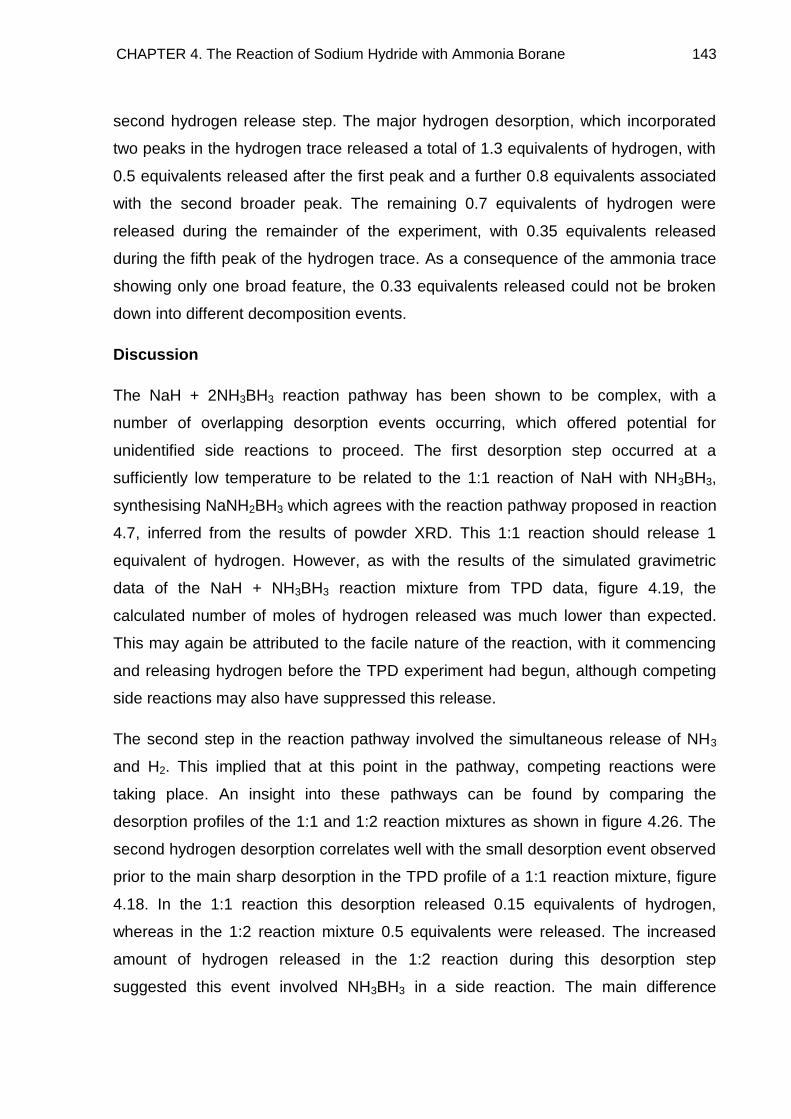
CHAPTER 4. The Reaction of Sodium Hydride with Ammonia Borane 143
second hydrogen release step. The major hydrogen desorption, which incorporated
two peaks in the hydrogen trace released a total of 1.3 equivalents of hydrogen, with
0.5 equivalents released after the first peak and a further 0.8 equivalents associated
with the second broader peak. The remaining 0.7 equivalents of hydrogen were
released during the remainder of the experiment, with 0.35 equivalents released
during the fifth peak of the hydrogen trace. As a consequence of the ammonia trace
showing only one broad feature, the 0.33 equivalents released could not be broken
down into different decomposition events.
Discussion
The NaH + 2NH3BH3 reaction pathway has been shown to be complex, with a
number of overlapping desorption events occurring, which offered potential for
unidentified side reactions to proceed. The first desorption step occurred at a
sufficiently low temperature to be related to the 1:1 reaction of NaH with NH3BH3,
synthesising NaNH2BH3 which agrees with the reaction pathway proposed in reaction
4.7, inferred from the results of powder XRD. This 1:1 reaction should release 1
equivalent of hydrogen. However, as with the results of the simulated gravimetric
data of the NaH + NH3BH3 reaction mixture from TPD data, figure 4.19, the
calculated number of moles of hydrogen released was much lower than expected.
This may again be attributed to the facile nature of the reaction, with it commencing
and releasing hydrogen before the TPD experiment had begun, although competing
side reactions may also have suppressed this release.
The second step in the reaction pathway involved the simultaneous release of NH3
and H2. This implied that at this point in the pathway, competing reactions were
taking place. An insight into these pathways can be found by comparing the
desorption profiles of the 1:1 and 1:2 reaction mixtures as shown in figure 4.26. The
second hydrogen desorption correlates well with the small desorption event observed
prior to the main sharp desorption in the TPD profile of a 1:1 reaction mixture, figure
4.18. In the 1:1 reaction this desorption released 0.15 equivalents of hydrogen,
whereas in the 1:2 reaction mixture 0.5 equivalents were released. The increased
amount of hydrogen released in the 1:2 reaction during this desorption step
suggested this event involved NH3BH3 in a side reaction. The main difference
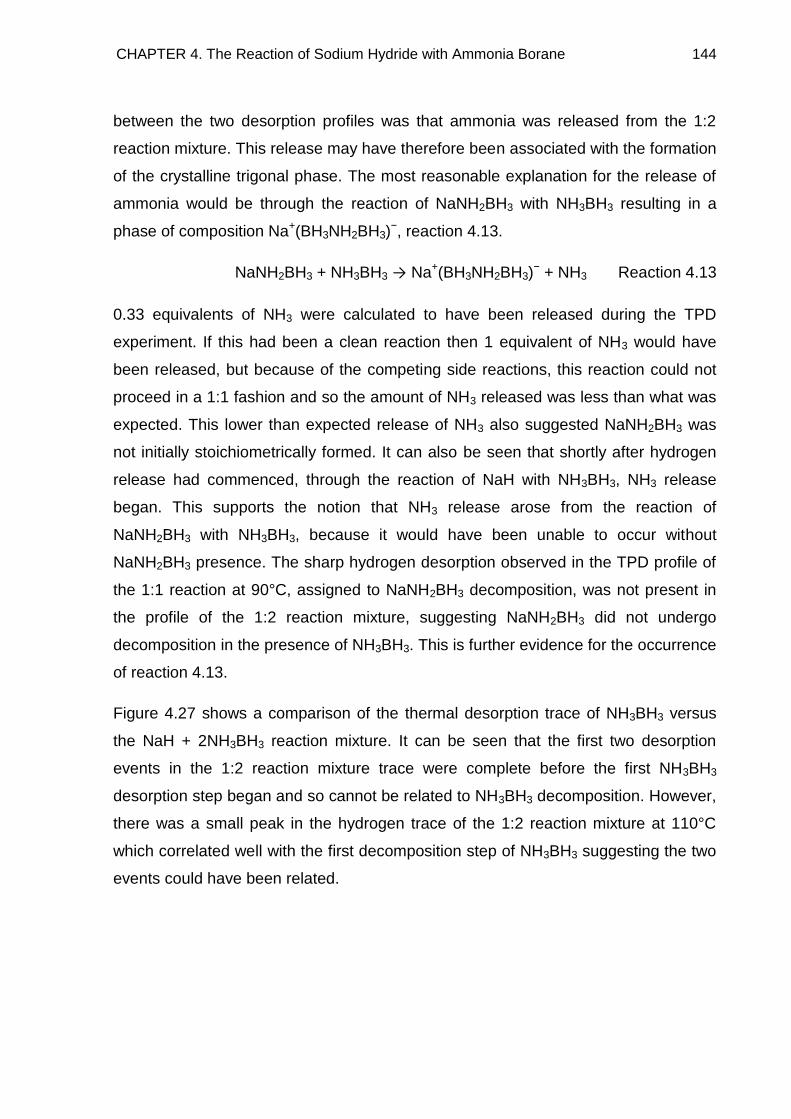
CHAPTER 4. The Reaction of Sodium Hydride with Ammonia Borane 144
between the two desorption profiles was that ammonia was released from the 1:2
reaction mixture. This release may have therefore been associated with the formation
of the crystalline trigonal phase. The most reasonable explanation for the release of
ammonia would be through the reaction of NaNH2BH3 with NH3BH3 resulting in a
phase of composition Na+(BH3NH2BH3)−, reaction 4.13.
NaNH2BH3 + NH3BH3 → Na+(BH3NH2BH3)− + NH3 Reaction 4.13
0.33 equivalents of NH3 were calculated to have been released during the TPD
experiment. If this had been a clean reaction then 1 equivalent of NH3 would have
been released, but because of the competing side reactions, this reaction could not
proceed in a 1:1 fashion and so the amount of NH3 released was less than what was
expected. This lower than expected release of NH3 also suggested NaNH2BH3 was
not initially stoichiometrically formed. It can also be seen that shortly after hydrogen
release had commenced, through the reaction of NaH with NH3BH3, NH3 release
began. This supports the notion that NH3 release arose from the reaction of
NaNH2BH3 with NH3BH3, because it would have been unable to occur without
NaNH2BH3 presence. The sharp hydrogen desorption observed in the TPD profile of
the 1:1 reaction at 90°C, assigned to NaNH2BH3 decomposition, was not present in
the profile of the 1:2 reaction mixture, suggesting NaNH2BH3 did not undergo
decomposition in the presence of NH3BH3. This is further evidence for the occurrence
of reaction 4.13.
Figure 4.27 shows a comparison of the thermal desorption trace of NH3BH3 versus
the NaH + 2NH3BH3 reaction mixture. It can be seen that the first two desorption
events in the 1:2 reaction mixture trace were complete before the first NH3BH3
desorption step began and so cannot be related to NH3BH3 decomposition. However,
there was a small peak in the hydrogen trace of the 1:2 reaction mixture at 110°C
which correlated well with the first decomposition step of NH3BH3 suggesting the two
events could have been related.
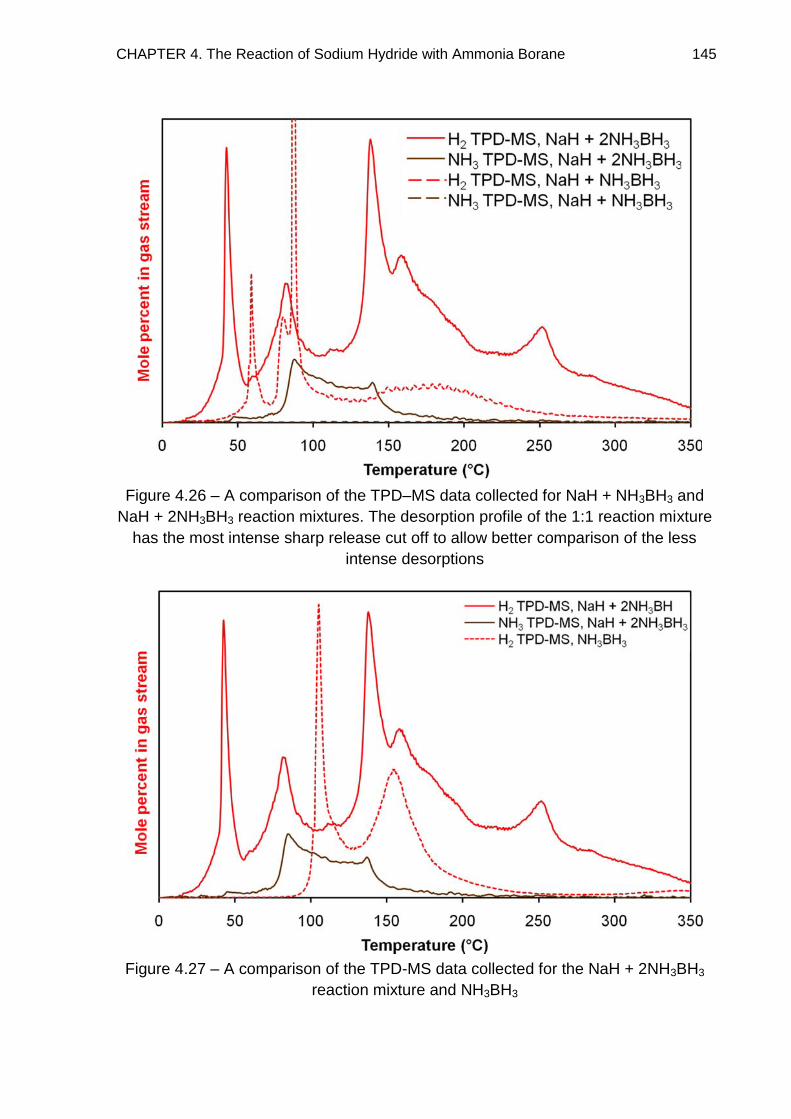
CHAPTER 4. The Reaction of Sodium Hydride with Ammonia Borane 145
Figure 4.26 – A comparison of the TPD–MS data collected for NaH + NH3BH3 and
NaH + 2NH3BH3 reaction mixtures. The desorption profile of the 1:1 reaction mixture
has the most intense sharp release cut off to allow better comparison of the less
intense desorptions
Figure 4.27 – A comparison of the TPD-MS data collected for the NaH + 2NH3BH3
reaction mixture and NH3BH3
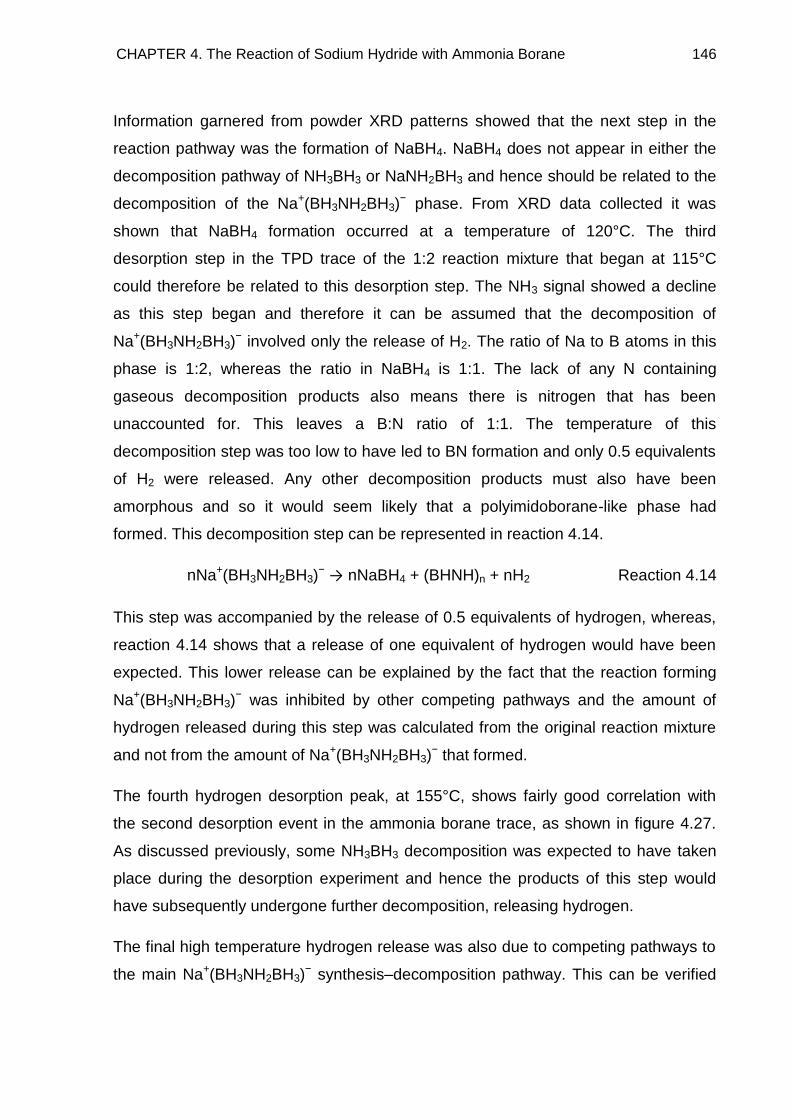
CHAPTER 4. The Reaction of Sodium Hydride with Ammonia Borane 146
Information garnered from powder XRD patterns showed that the next step in the
reaction pathway was the formation of NaBH4. NaBH4 does not appear in either the
decomposition pathway of NH3BH3 or NaNH2BH3 and hence should be related to the
decomposition of the Na+(BH3NH2BH3)− phase. From XRD data collected it was
shown that NaBH4 formation occurred at a temperature of 120°C. The third
desorption step in the TPD trace of the 1:2 reaction mixture that began at 115°C
could therefore be related to this desorption step. The NH3 signal showed a decline
as this step began and therefore it can be assumed that the decomposition of
Na+(BH3NH2BH3)− involved only the release of H2. The ratio of Na to B atoms in this
phase is 1:2, whereas the ratio in NaBH4 is 1:1. The lack of any N containing
gaseous decomposition products also means there is nitrogen that has been
unaccounted for. This leaves a B:N ratio of 1:1. The temperature of this
decomposition step was too low to have led to BN formation and only 0.5 equivalents
of H2 were released. Any other decomposition products must also have been
amorphous and so it would seem likely that a polyimidoborane-like phase had
formed. This decomposition step can be represented in reaction 4.14.
nNa+(BH3NH2BH3)− → nNaBH4 + (BHNH)n + nH2 Reaction 4.14
This step was accompanied by the release of 0.5 equivalents of hydrogen, whereas,
reaction 4.14 shows that a release of one equivalent of hydrogen would have been
expected. This lower release can be explained by the fact that the reaction forming
Na+(BH3NH2BH3)− was inhibited by other competing pathways and the amount of
hydrogen released during this step was calculated from the original reaction mixture
and not from the amount of Na+(BH3NH2BH3)− that formed.
The fourth hydrogen desorption peak, at 155°C, shows fairly good correlation with
the second desorption event in the ammonia borane trace, as shown in figure 4.27.
As discussed previously, some NH3BH3 decomposition was expected to have taken
place during the desorption experiment and hence the products of this step would
have subsequently undergone further decomposition, releasing hydrogen.
The final high temperature hydrogen release was also due to competing pathways to
the main Na+(BH3NH2BH3)− synthesis–decomposition pathway. This can be verified
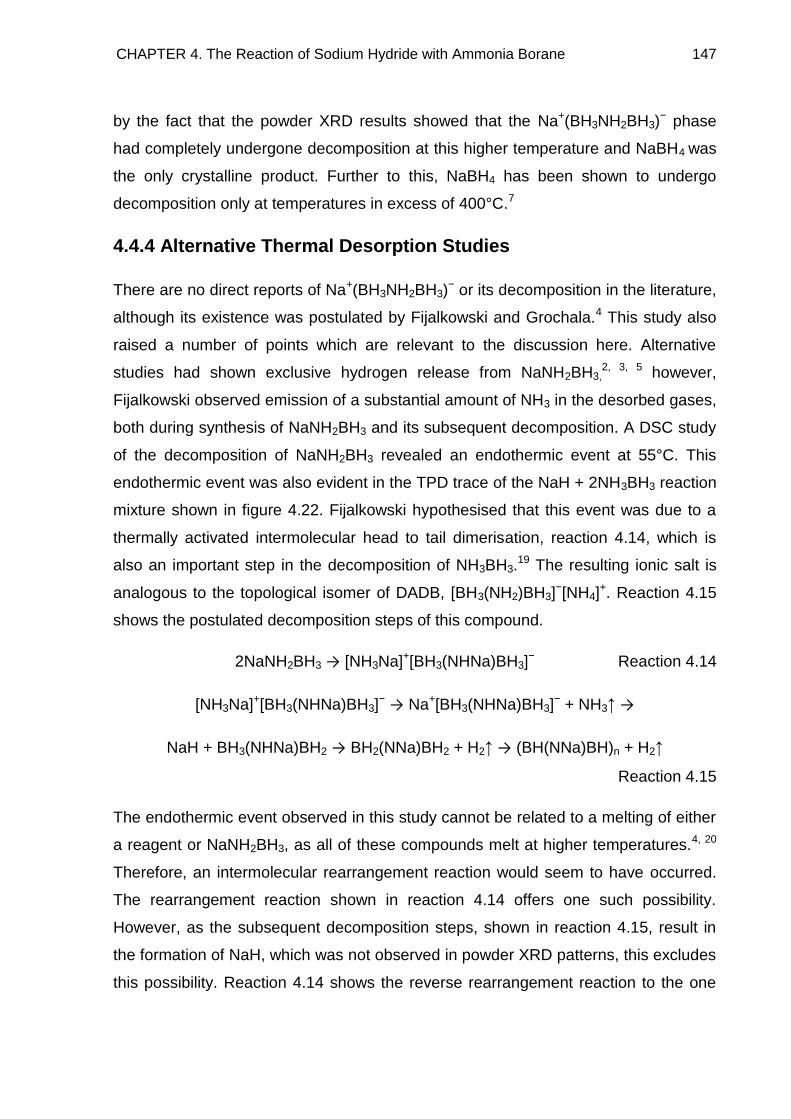
CHAPTER 4. The Reaction of Sodium Hydride with Ammonia Borane 147
by the fact that the powder XRD results showed that the Na+(BH3NH2BH3)− phase
had completely undergone decomposition at this higher temperature and NaBH4 was
the only crystalline product. Further to this, NaBH4 has been shown to undergo
decomposition only at temperatures in excess of 400°C.7
4.4.4 Alternative Thermal Desorption Studies
There are no direct reports of Na+(BH3NH2BH3)− or its decomposition in the literature,
although its existence was postulated by Fijalkowski and Grochala.4 This study also
raised a number of points which are relevant to the discussion here. Alternative
studies had shown exclusive hydrogen release from NaNH2BH3,2, 3, 5 however,
Fijalkowski observed emission of a substantial amount of NH3 in the desorbed gases,
both during synthesis of NaNH2BH3 and its subsequent decomposition. A DSC study
of the decomposition of NaNH2BH3 revealed an endothermic event at 55°C. This
endothermic event was also evident in the TPD trace of the NaH + 2NH3BH3 reaction
mixture shown in figure 4.22. Fijalkowski hypothesised that this event was due to a
thermally activated intermolecular head to tail dimerisation, reaction 4.14, which is
also an important step in the decomposition of NH3BH3.19 The resulting ionic salt is
analogous to the topological isomer of DADB, [BH3(NH2)BH3]−[NH4]
+. Reaction 4.15
shows the postulated decomposition steps of this compound.
2NaNH2BH3 → [NH3Na]+[BH3(NHNa)BH3]− Reaction 4.14
[NH3Na]+[BH3(NHNa)BH3]− → Na+[BH3(NHNa)BH3]
− + NH3↑ →
NaH + BH3(NHNa)BH2 → BH2(NNa)BH2 + H2↑ → (BH(NNa)BH)n + H2↑
Reaction 4.15
The endothermic event observed in this study cannot be related to a melting of either
a reagent or NaNH2BH3, as all of these compounds melt at higher temperatures.4, 20
Therefore, an intermolecular rearrangement reaction would seem to have occurred.
The rearrangement reaction shown in reaction 4.14 offers one such possibility.
However, as the subsequent decomposition steps, shown in reaction 4.15, result in
the formation of NaH, which was not observed in powder XRD patterns, this excludes
this possibility. Reaction 4.14 shows the reverse rearrangement reaction to the one
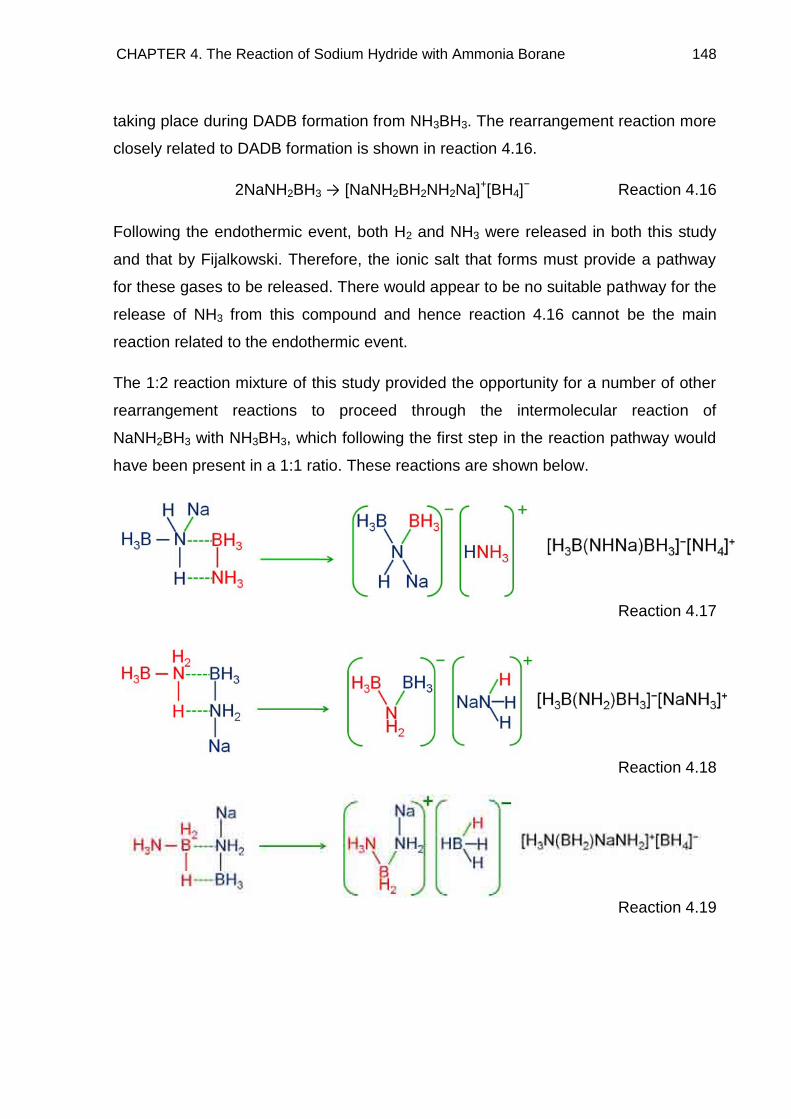
CHAPTER 4. The Reaction of Sodium Hydride with Ammonia Borane 148
taking place during DADB formation from NH3BH3. The rearrangement reaction more
closely related to DADB formation is shown in reaction 4.16.
2NaNH2BH3 → [NaNH2BH2NH2Na]+[BH4]− Reaction 4.16
Following the endothermic event, both H2 and NH3 were released in both this study
and that by Fijalkowski. Therefore, the ionic salt that forms must provide a pathway
for these gases to be released. There would appear to be no suitable pathway for the
release of NH3 from this compound and hence reaction 4.16 cannot be the main
reaction related to the endothermic event.
The 1:2 reaction mixture of this study provided the opportunity for a number of other
rearrangement reactions to proceed through the intermolecular reaction of
NaNH2BH3 with NH3BH3, which following the first step in the reaction pathway would
have been present in a 1:1 ratio. These reactions are shown below.
Reaction 4.17
Reaction 4.18
Reaction 4.19
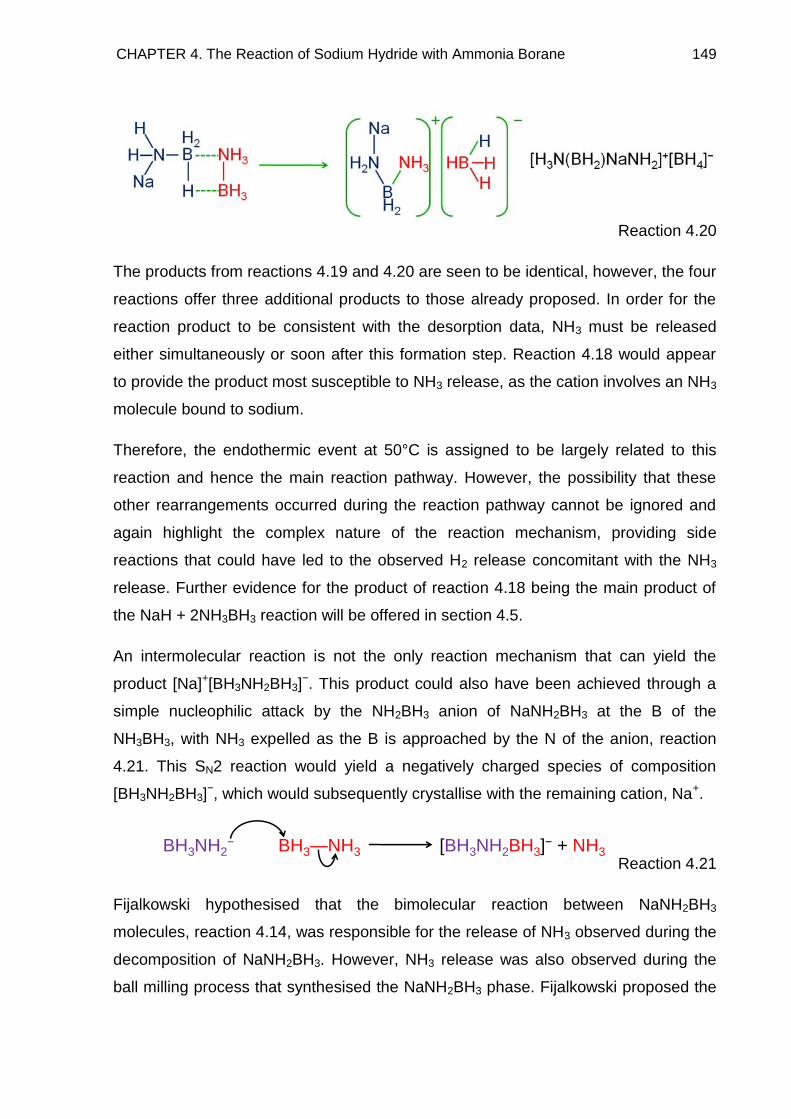
CHAPTER 4. The Reaction of Sodium Hydride with Ammonia Borane 149
Reaction 4.20
The products from reactions 4.19 and 4.20 are seen to be identical, however, the four
reactions offer three additional products to those already proposed. In order for the
reaction product to be consistent with the desorption data, NH3 must be released
either simultaneously or soon after this formation step. Reaction 4.18 would appear
to provide the product most susceptible to NH3 release, as the cation involves an NH3
molecule bound to sodium.
Therefore, the endothermic event at 50°C is assigned to be largely related to this
reaction and hence the main reaction pathway. However, the possibility that these
other rearrangements occurred during the reaction pathway cannot be ignored and
again highlight the complex nature of the reaction mechanism, providing side
reactions that could have led to the observed H2 release concomitant with the NH3
release. Further evidence for the product of reaction 4.18 being the main product of
the NaH + 2NH3BH3 reaction will be offered in section 4.5.
An intermolecular reaction is not the only reaction mechanism that can yield the
product [Na]+[BH3NH2BH3]−. This product could also have been achieved through a
simple nucleophilic attack by the NH2BH3 anion of NaNH2BH3 at the B of the
NH3BH3, with NH3 expelled as the B is approached by the N of the anion, reaction
4.21. This SN2 reaction would yield a negatively charged species of composition
[BH3NH2BH3]−, which would subsequently crystallise with the remaining cation, Na+.
Reaction 4.21
Fijalkowski hypothesised that the bimolecular reaction between NaNH2BH3
molecules, reaction 4.14, was responsible for the release of NH3 observed during the
decomposition of NaNH2BH3. However, NH3 release was also observed during the
ball milling process that synthesised the NaNH2BH3 phase. Fijalkowski proposed the
BH3NH2− BH3—NH3 [BH3NH2BH3]
− + NH3
CHAPTER 4. The Reaction of Sodium Hydride with Ammonia Borane 150
intermolecular reaction between unreacted NH3BH3 and NaNH2BH3 was responsible
for this release, shown in reaction 4.22.
NaNH2BH3 + NH3BH3 → [NaNH3]+[BH3(NH2)BH3]
− → Na+[BH3(NH2)BH3]− + NH3↑
Reaction 4.22
The results described here provide support for this assignment, although as
discussed they are equally consistent with an SN2 reaction. Fijalkowski proposed that
the decomposition of this material would proceed as shown by reaction 4.23.
Na+[BH3(NH2)BH3]− → BH3(NHNa)BH2 + H2↑ Reaction 4.23
Our results do not agree with this proposed reaction, because NaBH4 was shown to
be a decomposition product, also accompanied by H2 release. However, the results
of a 11B NMR study by Fijalkowski revealed the presence of BH4− during the reaction.
Fijalkowski commented that any number of pathways could be responsible for BH4−
formation. The two reactions that were put forward are shown below.
2NaNH2BH3 → [(NH2Na)(BH2)(NH2Na)]+[BH4]− Reaction 4.24
2NaNH2BH3 → NaBH4 + NaNH2 + (NH2BH2)n Reaction 4.25
Our results are able to provide an alternative answer for the appearance of this BH4−
signal, through the decomposition of the Na+[BH3(NH2)BH3]− phase. Reaction 4.24
could still be in part responsible for BH4− formation. However, a contribution from
reaction 4.25 is not supported by the results of this study because there were no
Bragg peaks due to NaNH2 observed in any of the powder XRD patterns, section 4.3.
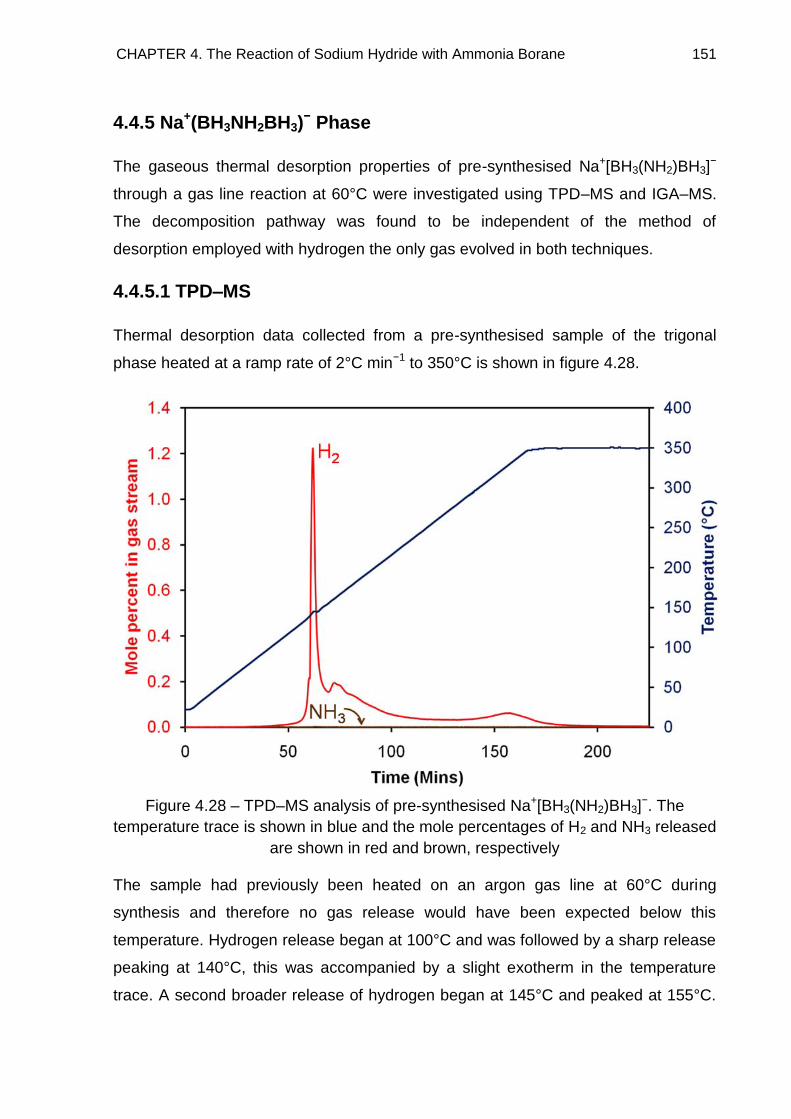
CHAPTER 4. The Reaction of Sodium Hydride with Ammonia Borane 151
4.4.5 Na+(BH3NH2BH3)− Phase
The gaseous thermal desorption properties of pre-synthesised Na+[BH3(NH2)BH3]−
through a gas line reaction at 60°C were investigated using TPD–MS and IGA–MS.
The decomposition pathway was found to be independent of the method of
desorption employed with hydrogen the only gas evolved in both techniques.
4.4.5.1 TPD–MS
Thermal desorption data collected from a pre-synthesised sample of the trigonal
phase heated at a ramp rate of 2°C min−1 to 350°C is shown in figure 4.28.
Figure 4.28 – TPD–MS analysis of pre-synthesised Na+[BH3(NH2)BH3]−. The
temperature trace is shown in blue and the mole percentages of H2 and NH3 released
are shown in red and brown, respectively
The sample had previously been heated on an argon gas line at 60°C during
synthesis and therefore no gas release would have been expected below this
temperature. Hydrogen release began at 100°C and was followed by a sharp release
peaking at 140°C, this was accompanied by a slight exotherm in the temperature
trace. A second broader release of hydrogen began at 145°C and peaked at 155°C.
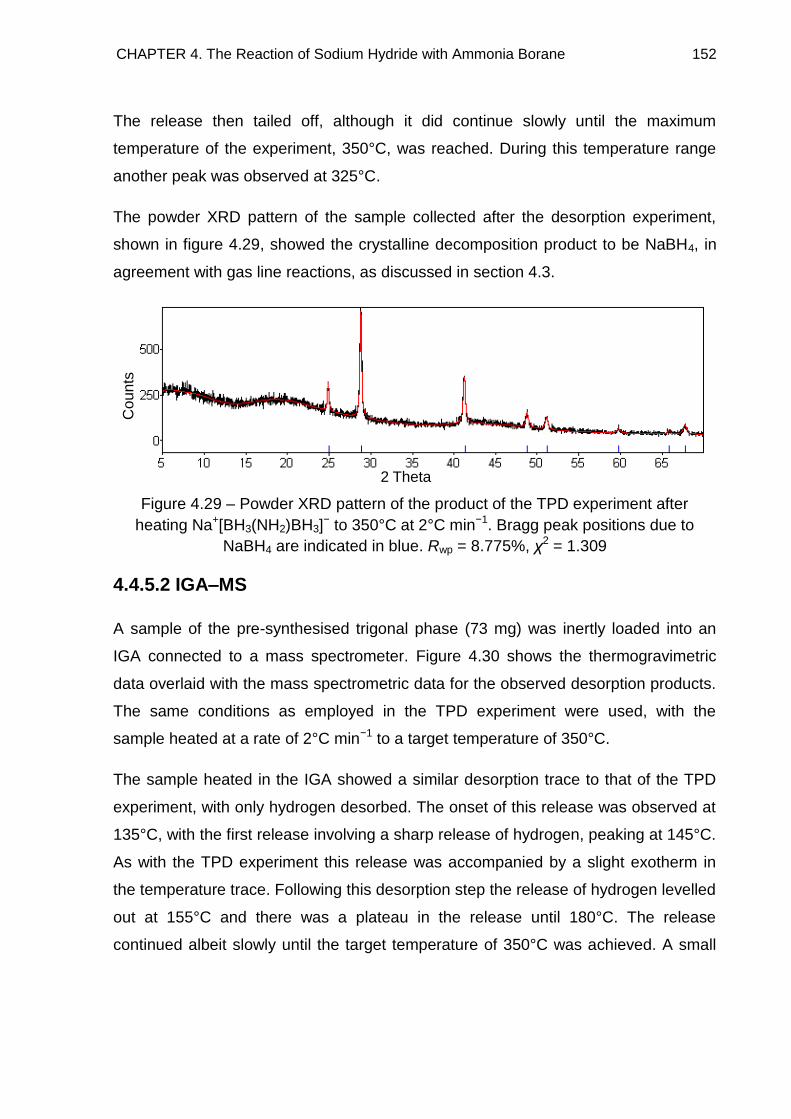
CHAPTER 4. The Reaction of Sodium Hydride with Ammonia Borane 152
The release then tailed off, although it did continue slowly until the maximum
temperature of the experiment, 350°C, was reached. During this temperature range
another peak was observed at 325°C.
The powder XRD pattern of the sample collected after the desorption experiment,
shown in figure 4.29, showed the crystalline decomposition product to be NaBH4, in
agreement with gas line reactions, as discussed in section 4.3.
Figure 4.29 – Powder XRD pattern of the product of the TPD experiment after
heating Na+[BH3(NH2)BH3]− to 350°C at 2°C min−1. Bragg peak positions due to
NaBH4 are indicated in blue. Rwp = 8.775%, χ2 = 1.309
4.4.5.2 IGA–MS
A sample of the pre-synthesised trigonal phase (73 mg) was inertly loaded into an
IGA connected to a mass spectrometer. Figure 4.30 shows the thermogravimetric
data overlaid with the mass spectrometric data for the observed desorption products.
The same conditions as employed in the TPD experiment were used, with the
sample heated at a rate of 2°C min−1 to a target temperature of 350°C.
The sample heated in the IGA showed a similar desorption trace to that of the TPD
experiment, with only hydrogen desorbed. The onset of this release was observed at
135°C, with the first release involving a sharp release of hydrogen, peaking at 145°C.
As with the TPD experiment this release was accompanied by a slight exotherm in
the temperature trace. Following this desorption step the release of hydrogen levelled
out at 155°C and there was a plateau in the release until 180°C. The release
continued albeit slowly until the target temperature of 350°C was achieved. A small
2 Theta
Counts
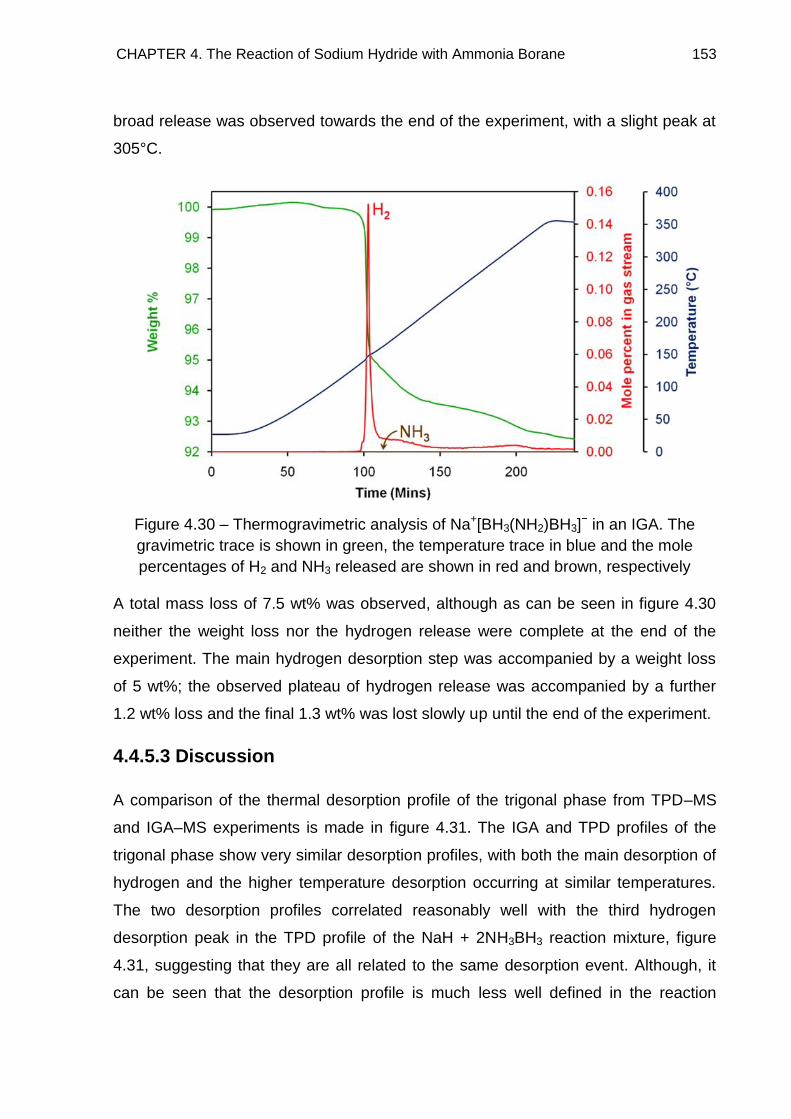
CHAPTER 4. The Reaction of Sodium Hydride with Ammonia Borane 153
broad release was observed towards the end of the experiment, with a slight peak at
305°C.
Figure 4.30 – Thermogravimetric analysis of Na+[BH3(NH2)BH3]− in an IGA. The
gravimetric trace is shown in green, the temperature trace in blue and the mole
percentages of H2 and NH3 released are shown in red and brown, respectively
A total mass loss of 7.5 wt% was observed, although as can be seen in figure 4.30
neither the weight loss nor the hydrogen release were complete at the end of the
experiment. The main hydrogen desorption step was accompanied by a weight loss
of 5 wt%; the observed plateau of hydrogen release was accompanied by a further
1.2 wt% loss and the final 1.3 wt% was lost slowly up until the end of the experiment.
4.4.5.3 Discussion
A comparison of the thermal desorption profile of the trigonal phase from TPD–MS
and IGA–MS experiments is made in figure 4.31. The IGA and TPD profiles of the
trigonal phase show very similar desorption profiles, with both the main desorption of
hydrogen and the higher temperature desorption occurring at similar temperatures.
The two desorption profiles correlated reasonably well with the third hydrogen
desorption peak in the TPD profile of the NaH + 2NH3BH3 reaction mixture, figure
4.31, suggesting that they are all related to the same desorption event. Although, it
can be seen that the desorption profile is much less well defined in the reaction
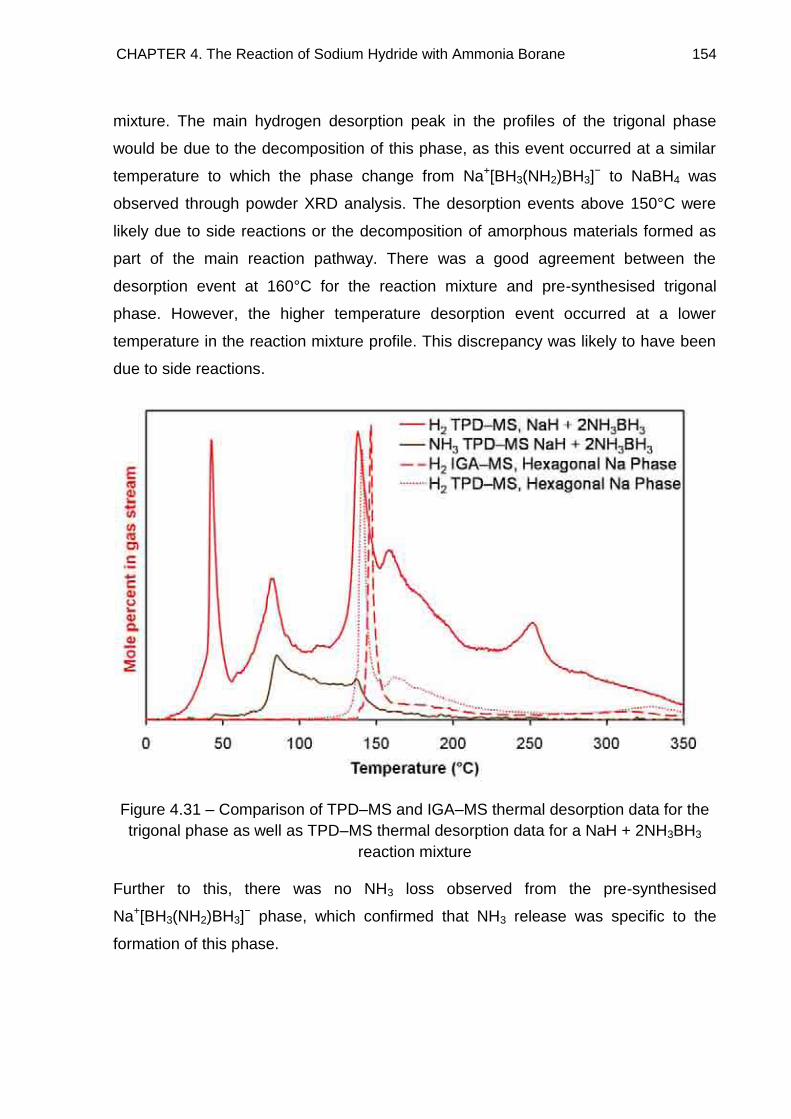
CHAPTER 4. The Reaction of Sodium Hydride with Ammonia Borane 154
mixture. The main hydrogen desorption peak in the profiles of the trigonal phase
would be due to the decomposition of this phase, as this event occurred at a similar
temperature to which the phase change from Na+[BH3(NH2)BH3]− to NaBH4 was
observed through powder XRD analysis. The desorption events above 150°C were
likely due to side reactions or the decomposition of amorphous materials formed as
part of the main reaction pathway. There was a good agreement between the
desorption event at 160°C for the reaction mixture and pre-synthesised trigonal
phase. However, the higher temperature desorption event occurred at a lower
temperature in the reaction mixture profile. This discrepancy was likely to have been
due to side reactions.
Figure 4.31 – Comparison of TPD–MS and IGA–MS thermal desorption data for the
trigonal phase as well as TPD–MS thermal desorption data for a NaH + 2NH3BH3
reaction mixture
Further to this, there was no NH3 loss observed from the pre-synthesised
Na+[BH3(NH2)BH3]− phase, which confirmed that NH3 release was specific to the
formation of this phase.
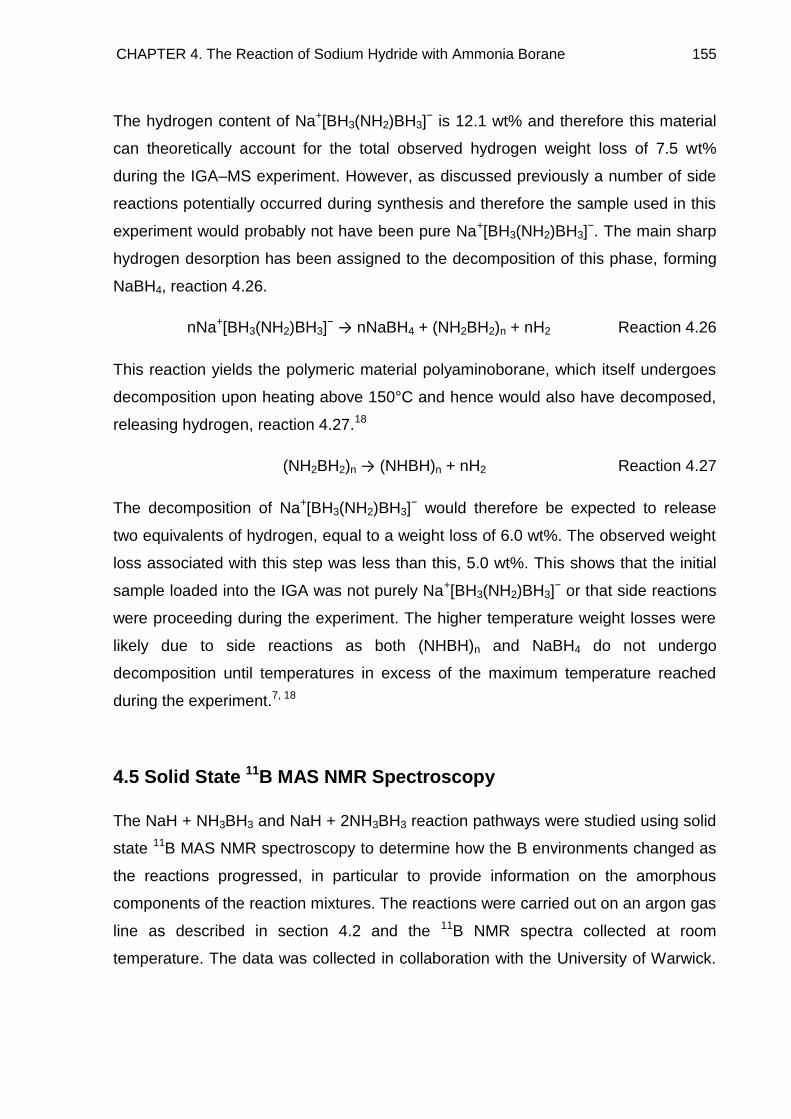
CHAPTER 4. The Reaction of Sodium Hydride with Ammonia Borane 155
The hydrogen content of Na+[BH3(NH2)BH3]− is 12.1 wt% and therefore this material
can theoretically account for the total observed hydrogen weight loss of 7.5 wt%
during the IGA–MS experiment. However, as discussed previously a number of side
reactions potentially occurred during synthesis and therefore the sample used in this
experiment would probably not have been pure Na+[BH3(NH2)BH3]−. The main sharp
hydrogen desorption has been assigned to the decomposition of this phase, forming
NaBH4, reaction 4.26.
nNa+[BH3(NH2)BH3]− → nNaBH4 + (NH2BH2)n + nH2 Reaction 4.26
This reaction yields the polymeric material polyaminoborane, which itself undergoes
decomposition upon heating above 150°C and hence would also have decomposed,
releasing hydrogen, reaction 4.27.18
(NH2BH2)n → (NHBH)n + nH2 Reaction 4.27
The decomposition of Na+[BH3(NH2)BH3]− would therefore be expected to release
two equivalents of hydrogen, equal to a weight loss of 6.0 wt%. The observed weight
loss associated with this step was less than this, 5.0 wt%. This shows that the initial
sample loaded into the IGA was not purely Na+[BH3(NH2)BH3]− or that side reactions
were proceeding during the experiment. The higher temperature weight losses were
likely due to side reactions as both (NHBH)n and NaBH4 do not undergo
decomposition until temperatures in excess of the maximum temperature reached
during the experiment.7, 18
4.5 Solid State 11B MAS NMR Spectroscopy
The NaH + NH3BH3 and NaH + 2NH3BH3 reaction pathways were studied using solid
state 11B MAS NMR spectroscopy to determine how the B environments changed as
the reactions progressed, in particular to provide information on the amorphous
components of the reaction mixtures. The reactions were carried out on an argon gas
line as described in section 4.2 and the 11B NMR spectra collected at room
temperature. The data was collected in collaboration with the University of Warwick.
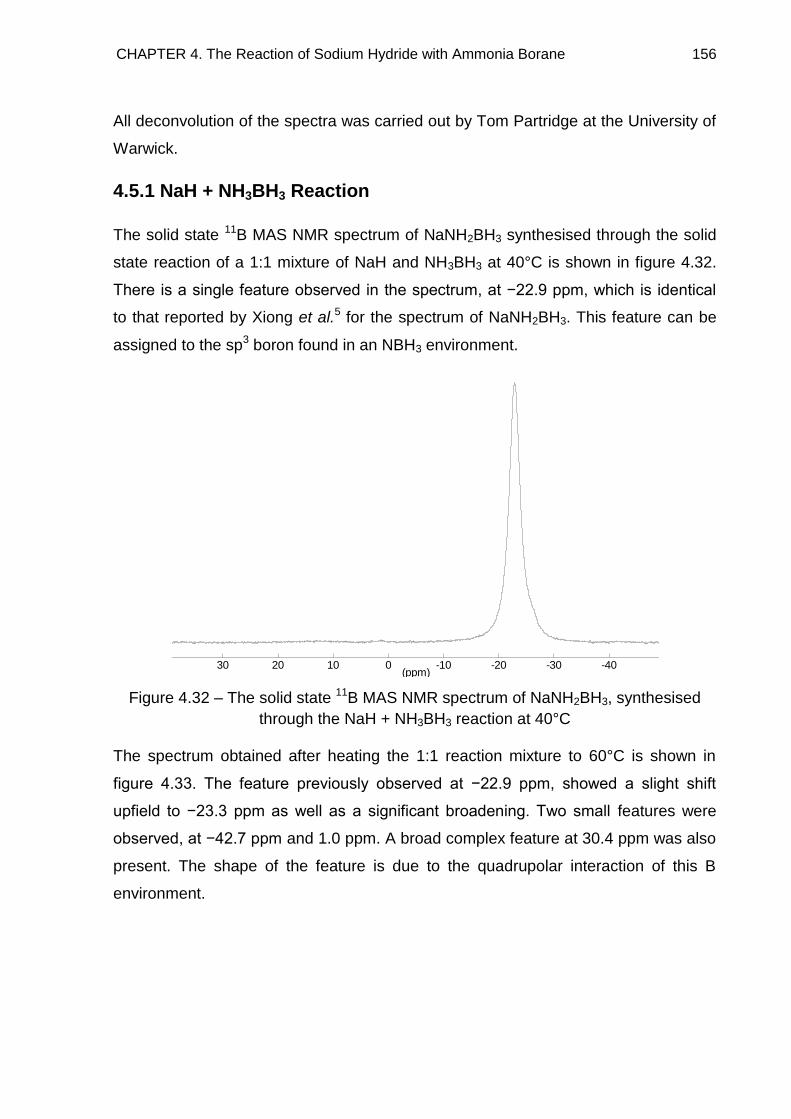
CHAPTER 4. The Reaction of Sodium Hydride with Ammonia Borane 156
All deconvolution of the spectra was carried out by Tom Partridge at the University of
Warwick.
4.5.1 NaH + NH3BH3 Reaction
The solid state 11B MAS NMR spectrum of NaNH2BH3 synthesised through the solid
state reaction of a 1:1 mixture of NaH and NH3BH3 at 40°C is shown in figure 4.32.
There is a single feature observed in the spectrum, at −22.9 ppm, which is identical
to that reported by Xiong et al.5 for the spectrum of NaNH2BH3. This feature can be
assigned to the sp3 boron found in an NBH3 environment.
Figure 4.32 – The solid state 11B MAS NMR spectrum of NaNH2BH3, synthesised
through the NaH + NH3BH3 reaction at 40°C
The spectrum obtained after heating the 1:1 reaction mixture to 60°C is shown in
figure 4.33. The feature previously observed at −22.9 ppm, showed a slight shift
upfield to −23.3 ppm as well as a significant broadening. Two small features were
observed, at −42.7 ppm and 1.0 ppm. A broad complex feature at 30.4 ppm was also
present. The shape of the feature is due to the quadrupolar interaction of this B
environment.
(ppm)-40-30-20-100102030
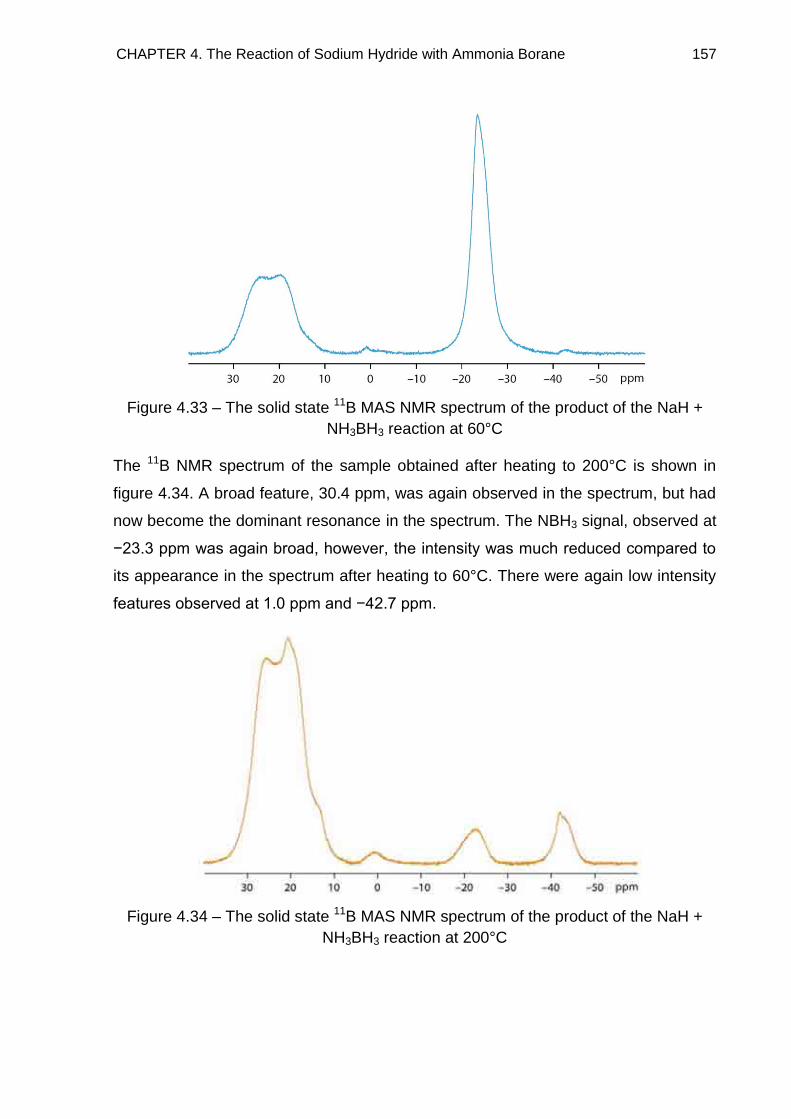
CHAPTER 4. The Reaction of Sodium Hydride with Ammonia Borane 157
Figure 4.33 – The solid state 11B MAS NMR spectrum of the product of the NaH +
NH3BH3 reaction at 60°C
The 11B NMR spectrum of the sample obtained after heating to 200°C is shown in
figure 4.34. A broad feature, 30.4 ppm, was again observed in the spectrum, but had
now become the dominant resonance in the spectrum. The NBH3 signal, observed at
−23.3 ppm was again broad, however, the intensity was much reduced compared to
its appearance in the spectrum after heating to 60°C. There were again low intensity
features observed at 1.0 ppm and −42.7 ppm.
Figure 4.34 – The solid state 11B MAS NMR spectrum of the product of the NaH +
NH3BH3 reaction at 200°C
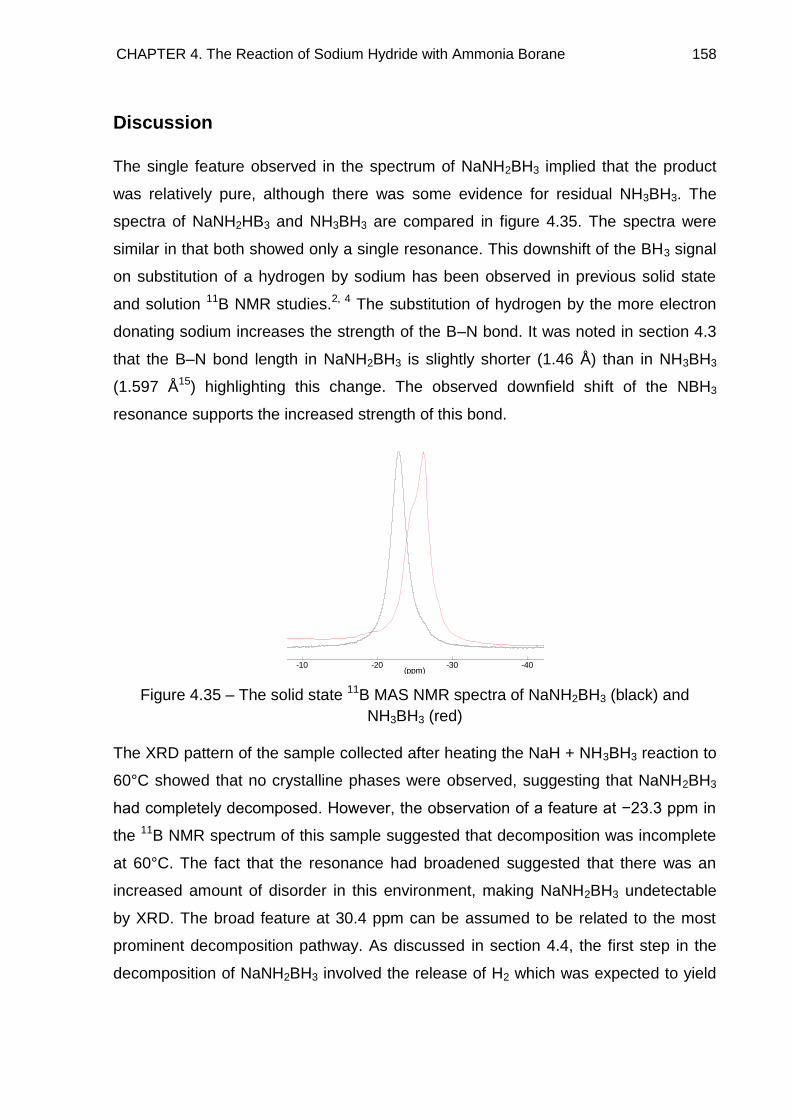
CHAPTER 4. The Reaction of Sodium Hydride with Ammonia Borane 158
Discussion
The single feature observed in the spectrum of NaNH2BH3 implied that the product
was relatively pure, although there was some evidence for residual NH3BH3. The
spectra of NaNH2HB3 and NH3BH3 are compared in figure 4.35. The spectra were
similar in that both showed only a single resonance. This downshift of the BH3 signal
on substitution of a hydrogen by sodium has been observed in previous solid state
and solution 11B NMR studies.2, 4 The substitution of hydrogen by the more electron
donating sodium increases the strength of the B–N bond. It was noted in section 4.3
that the B–N bond length in NaNH2BH3 is slightly shorter (1.46 Å) than in NH3BH3
(1.597 Å15) highlighting this change. The observed downfield shift of the NBH3
resonance supports the increased strength of this bond.
Figure 4.35 – The solid state 11B MAS NMR spectra of NaNH2BH3 (black) and
NH3BH3 (red)
The XRD pattern of the sample collected after heating the NaH + NH3BH3 reaction to
60°C showed that no crystalline phases were observed, suggesting that NaNH2BH3
had completely decomposed. However, the observation of a feature at −23.3 ppm in
the 11B NMR spectrum of this sample suggested that decomposition was incomplete
at 60°C. The fact that the resonance had broadened suggested that there was an
increased amount of disorder in this environment, making NaNH2BH3 undetectable
by XRD. The broad feature at 30.4 ppm can be assumed to be related to the most
prominent decomposition pathway. As discussed in section 4.4, the first step in the
decomposition of NaNH2BH3 involved the release of H2 which was expected to yield
(ppm)-40-30-20-100
..\1r
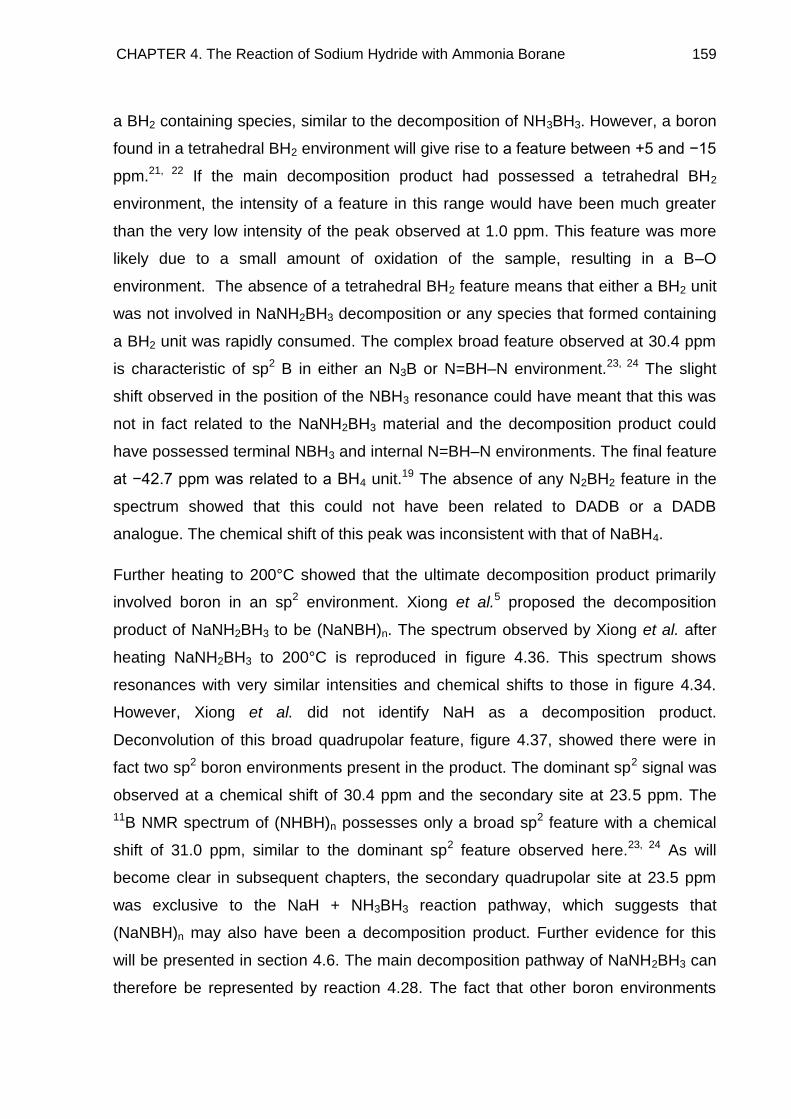
CHAPTER 4. The Reaction of Sodium Hydride with Ammonia Borane 159
a BH2 containing species, similar to the decomposition of NH3BH3. However, a boron
found in a tetrahedral BH2 environment will give rise to a feature between +5 and −15
ppm.21, 22 If the main decomposition product had possessed a tetrahedral BH2
environment, the intensity of a feature in this range would have been much greater
than the very low intensity of the peak observed at 1.0 ppm. This feature was more
likely due to a small amount of oxidation of the sample, resulting in a B–O
environment. The absence of a tetrahedral BH2 feature means that either a BH2 unit
was not involved in NaNH2BH3 decomposition or any species that formed containing
a BH2 unit was rapidly consumed. The complex broad feature observed at 30.4 ppm
is characteristic of sp2 B in either an N3B or N=BH–N environment.23, 24 The slight
shift observed in the position of the NBH3 resonance could have meant that this was
not in fact related to the NaNH2BH3 material and the decomposition product could
have possessed terminal NBH3 and internal N=BH–N environments. The final feature
at −42.7 ppm was related to a BH4 unit.19 The absence of any N2BH2 feature in the
spectrum showed that this could not have been related to DADB or a DADB
analogue. The chemical shift of this peak was inconsistent with that of NaBH4.
Further heating to 200°C showed that the ultimate decomposition product primarily
involved boron in an sp2 environment. Xiong et al.5 proposed the decomposition
product of NaNH2BH3 to be (NaNBH)n. The spectrum observed by Xiong et al. after
heating NaNH2BH3 to 200°C is reproduced in figure 4.36. This spectrum shows
resonances with very similar intensities and chemical shifts to those in figure 4.34.
However, Xiong et al. did not identify NaH as a decomposition product.
Deconvolution of this broad quadrupolar feature, figure 4.37, showed there were in
fact two sp2 boron environments present in the product. The dominant sp2 signal was
observed at a chemical shift of 30.4 ppm and the secondary site at 23.5 ppm. The
11B NMR spectrum of (NHBH)n possesses only a broad sp2 feature with a chemical
shift of 31.0 ppm, similar to the dominant sp2 feature observed here.23, 24 As will
become clear in subsequent chapters, the secondary quadrupolar site at 23.5 ppm
was exclusive to the NaH + NH3BH3 reaction pathway, which suggests that
(NaNBH)n may also have been a decomposition product. Further evidence for this
will be presented in section 4.6. The main decomposition pathway of NaNH2BH3 can
therefore be represented by reaction 4.28. The fact that other boron environments
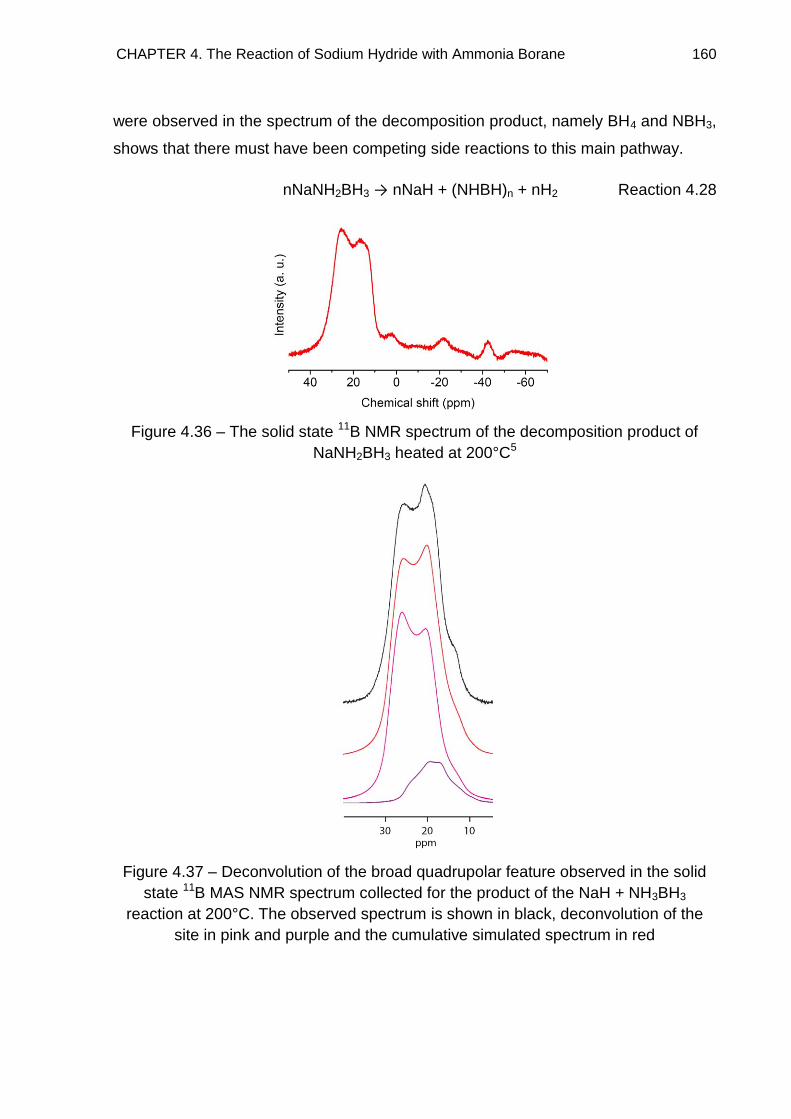
CHAPTER 4. The Reaction of Sodium Hydride with Ammonia Borane 160
were observed in the spectrum of the decomposition product, namely BH4 and NBH3,
shows that there must have been competing side reactions to this main pathway.
nNaNH2BH3 → nNaH + (NHBH)n + nH2 Reaction 4.28
Figure 4.36 – The solid state 11B NMR spectrum of the decomposition product of
NaNH2BH3 heated at 200°C5
Figure 4.37 – Deconvolution of the broad quadrupolar feature observed in the solid
state 11B MAS NMR spectrum collected for the product of the NaH + NH3BH3
reaction at 200°C. The observed spectrum is shown in black, deconvolution of the
site in pink and purple and the cumulative simulated spectrum in red
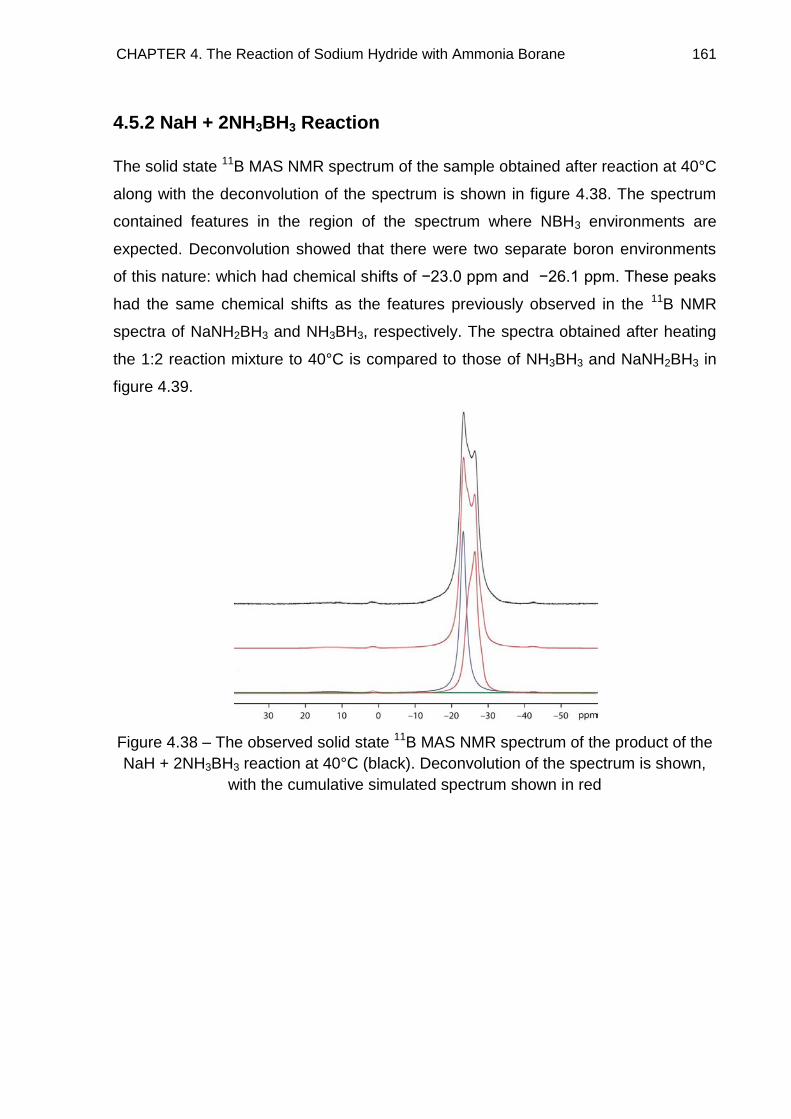
CHAPTER 4. The Reaction of Sodium Hydride with Ammonia Borane 161
4.5.2 NaH + 2NH3BH3 Reaction
The solid state 11B MAS NMR spectrum of the sample obtained after reaction at 40°C
along with the deconvolution of the spectrum is shown in figure 4.38. The spectrum
contained features in the region of the spectrum where NBH3 environments are
expected. Deconvolution showed that there were two separate boron environments
of this nature: which had chemical shifts of −23.0 ppm and −26.1 ppm. These peaks
had the same chemical shifts as the features previously observed in the 11B NMR
spectra of NaNH2BH3 and NH3BH3, respectively. The spectra obtained after heating
the 1:2 reaction mixture to 40°C is compared to those of NH3BH3 and NaNH2BH3 in
figure 4.39.
Figure 4.38 – The observed solid state 11B MAS NMR spectrum of the product of the
NaH + 2NH3BH3 reaction at 40°C (black). Deconvolution of the spectrum is shown,
with the cumulative simulated spectrum shown in red
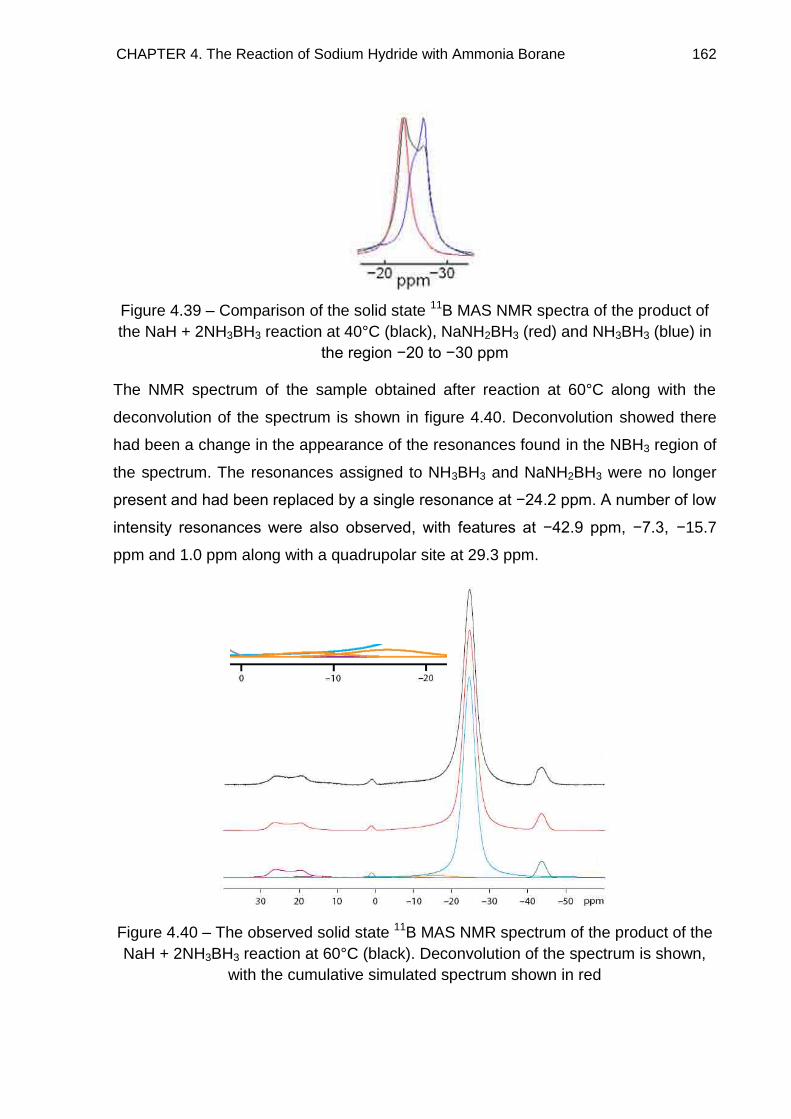
CHAPTER 4. The Reaction of Sodium Hydride with Ammonia Borane 162
Figure 4.39 – Comparison of the solid state 11B MAS NMR spectra of the product of
the NaH + 2NH3BH3 reaction at 40°C (black), NaNH2BH3 (red) and NH3BH3 (blue) in
the region −20 to −30 ppm
The NMR spectrum of the sample obtained after reaction at 60°C along with the
deconvolution of the spectrum is shown in figure 4.40. Deconvolution showed there
had been a change in the appearance of the resonances found in the NBH3 region of
the spectrum. The resonances assigned to NH3BH3 and NaNH2BH3 were no longer
present and had been replaced by a single resonance at −24.2 ppm. A number of low
intensity resonances were also observed, with features at −42.9 ppm, −7.3, −15.7
ppm and 1.0 ppm along with a quadrupolar site at 29.3 ppm.
Figure 4.40 – The observed solid state 11B MAS NMR spectrum of the product of the
NaH + 2NH3BH3 reaction at 60°C (black). Deconvolution of the spectrum is shown,
with the cumulative simulated spectrum shown in red
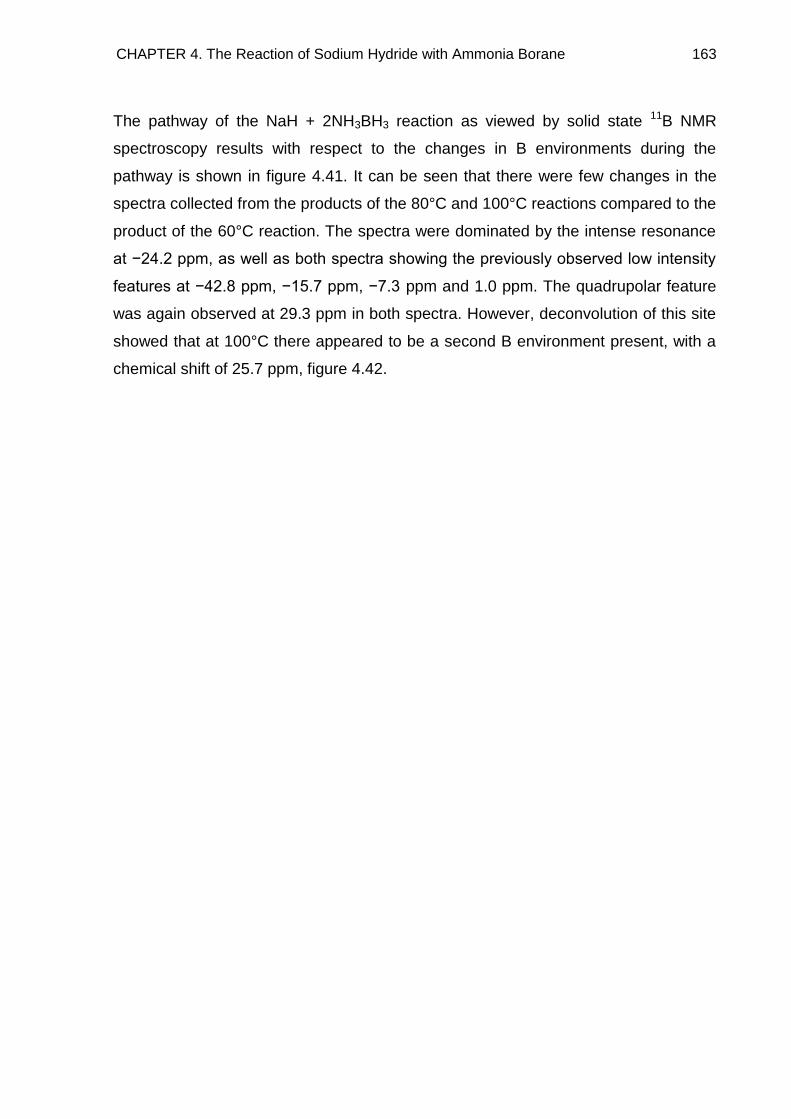
CHAPTER 4. The Reaction of Sodium Hydride with Ammonia Borane 163
The pathway of the NaH + 2NH3BH3 reaction as viewed by solid state 11B NMR
spectroscopy results with respect to the changes in B environments during the
pathway is shown in figure 4.41. It can be seen that there were few changes in the
spectra collected from the products of the 80°C and 100°C reactions compared to the
product of the 60°C reaction. The spectra were dominated by the intense resonance
at −24.2 ppm, as well as both spectra showing the previously observed low intensity
features at −42.8 ppm, −15.7 ppm, −7.3 ppm and 1.0 ppm. The quadrupolar feature
was again observed at 29.3 ppm in both spectra. However, deconvolution of this site
showed that at 100°C there appeared to be a second B environment present, with a
chemical shift of 25.7 ppm, figure 4.42.
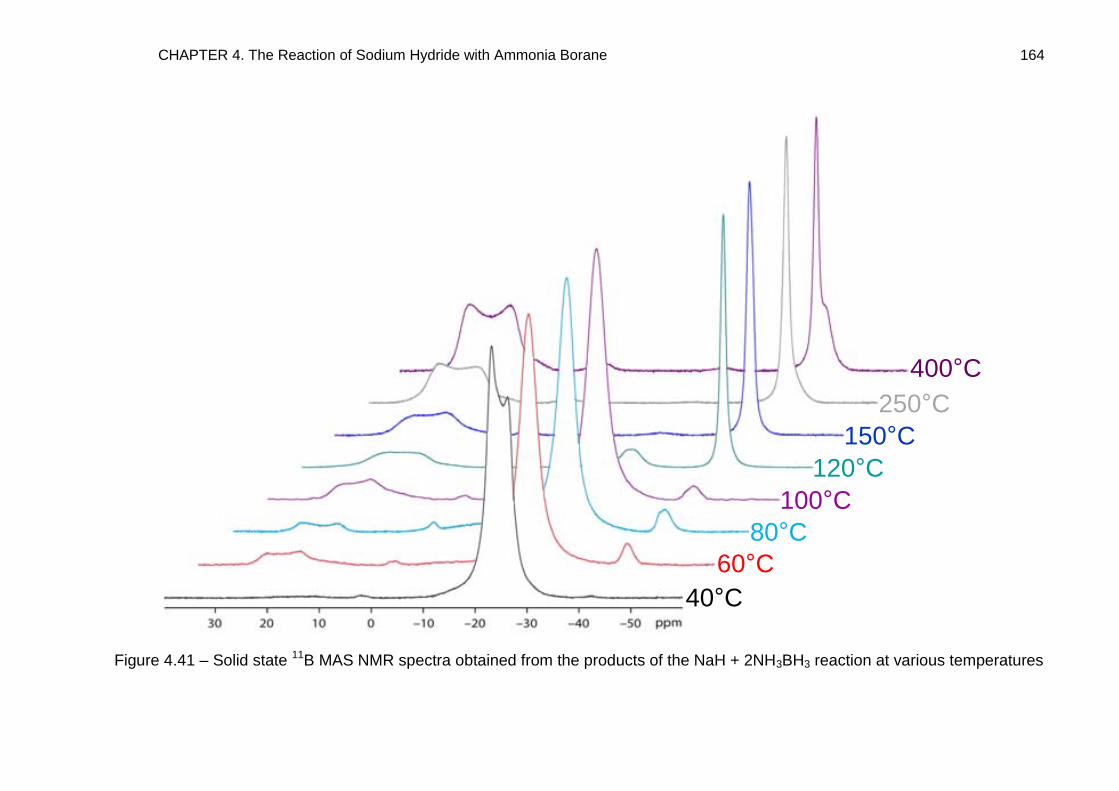
CHAPTER 4. The Reaction of Sodium Hydride with Ammonia Borane 164
Figure 4.41 – Solid state 11B MAS NMR spectra obtained from the products of the NaH + 2NH3BH3 reaction at various temperatures
400°C
250°C
150°C
120°C
100°C
80°C
60°C
40°C
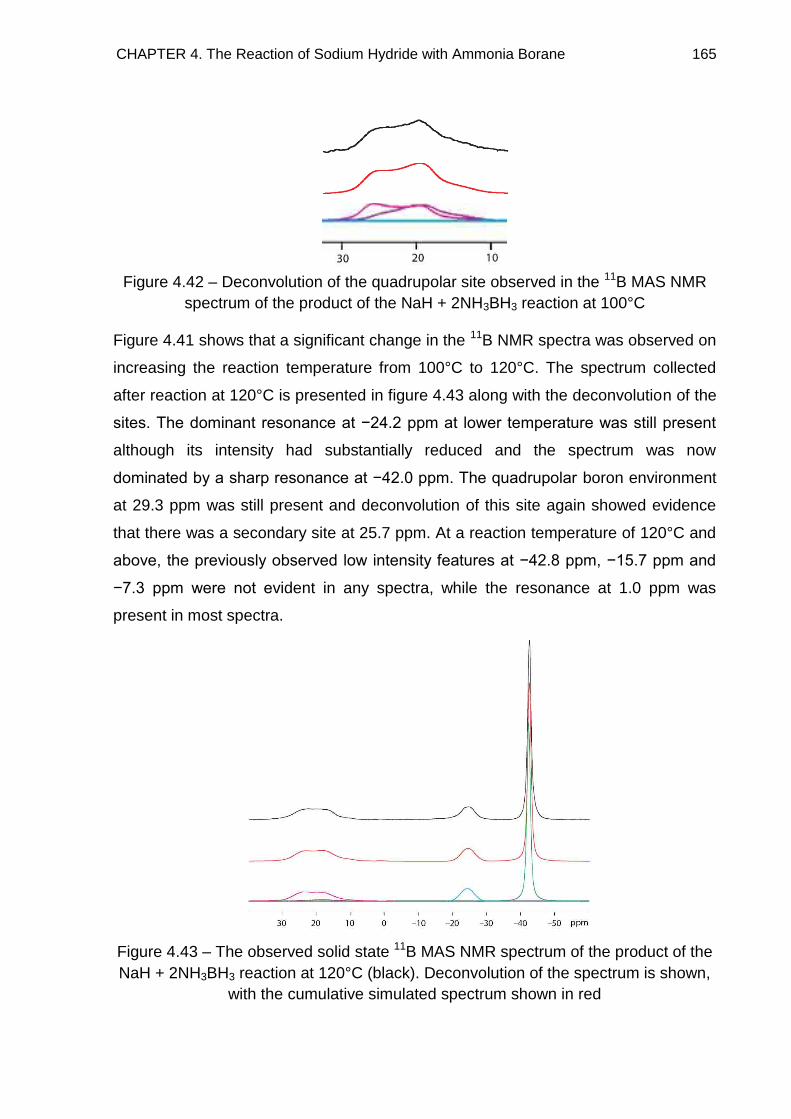
CHAPTER 4. The Reaction of Sodium Hydride with Ammonia Borane 165
Figure 4.42 – Deconvolution of the quadrupolar site observed in the 11B MAS NMR
spectrum of the product of the NaH + 2NH3BH3 reaction at 100°C
Figure 4.41 shows that a significant change in the 11B NMR spectra was observed on
increasing the reaction temperature from 100°C to 120°C. The spectrum collected
after reaction at 120°C is presented in figure 4.43 along with the deconvolution of the
sites. The dominant resonance at −24.2 ppm at lower temperature was still present
although its intensity had substantially reduced and the spectrum was now
dominated by a sharp resonance at −42.0 ppm. The quadrupolar boron environment
at 29.3 ppm was still present and deconvolution of this site again showed evidence
that there was a secondary site at 25.7 ppm. At a reaction temperature of 120°C and
above, the previously observed low intensity features at −42.8 ppm, −15.7 ppm and
−7.3 ppm were not evident in any spectra, while the resonance at 1.0 ppm was
present in most spectra.
Figure 4.43 – The observed solid state 11B MAS NMR spectrum of the product of the
NaH + 2NH3BH3 reaction at 120°C (black). Deconvolution of the spectrum is shown,
with the cumulative simulated spectrum shown in red
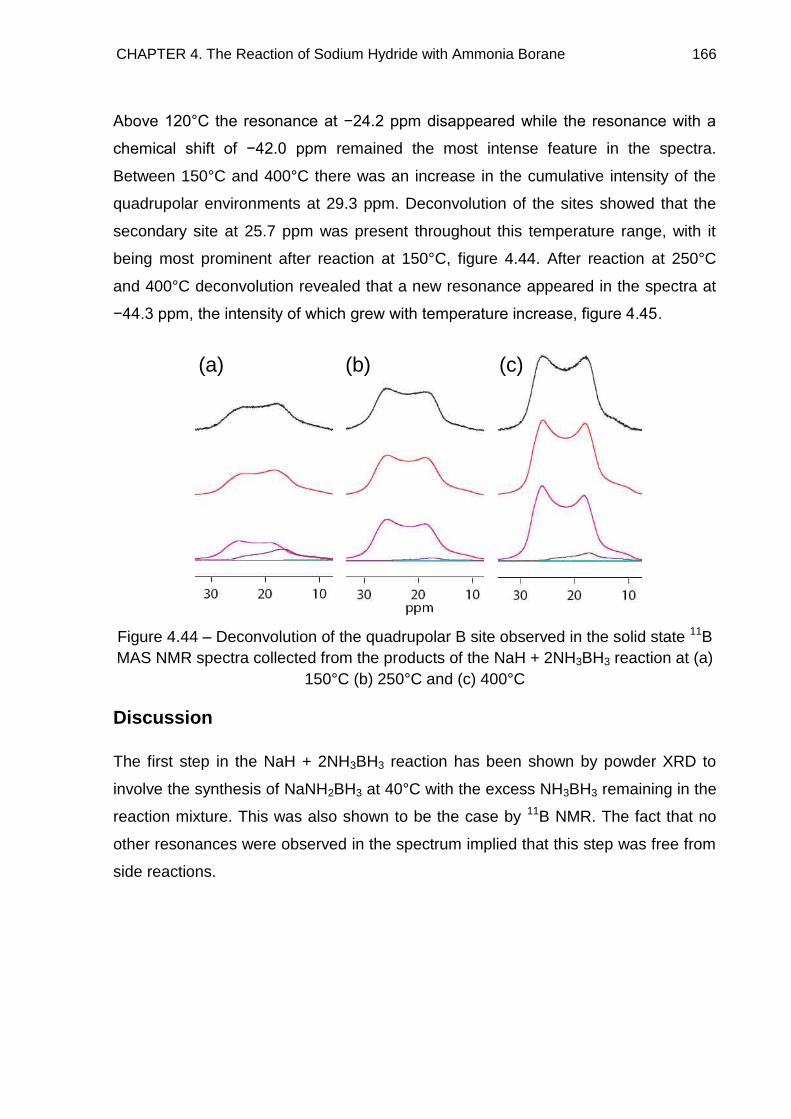
CHAPTER 4. The Reaction of Sodium Hydride with Ammonia Borane 166
Above 120°C the resonance at −24.2 ppm disappeared while the resonance with a
chemical shift of −42.0 ppm remained the most intense feature in the spectra.
Between 150°C and 400°C there was an increase in the cumulative intensity of the
quadrupolar environments at 29.3 ppm. Deconvolution of the sites showed that the
secondary site at 25.7 ppm was present throughout this temperature range, with it
being most prominent after reaction at 150°C, figure 4.44. After reaction at 250°C
and 400°C deconvolution revealed that a new resonance appeared in the spectra at
−44.3 ppm, the intensity of which grew with temperature increase, figure 4.45.
Figure 4.44 – Deconvolution of the quadrupolar B site observed in the solid state 11B
MAS NMR spectra collected from the products of the NaH + 2NH3BH3 reaction at (a)
150°C (b) 250°C and (c) 400°C
Discussion
The first step in the NaH + 2NH3BH3 reaction has been shown by powder XRD to
involve the synthesis of NaNH2BH3 at 40°C with the excess NH3BH3 remaining in the
reaction mixture. This was also shown to be the case by 11B NMR. The fact that no
other resonances were observed in the spectrum implied that this step was free from
side reactions.
(a) (b) (c)
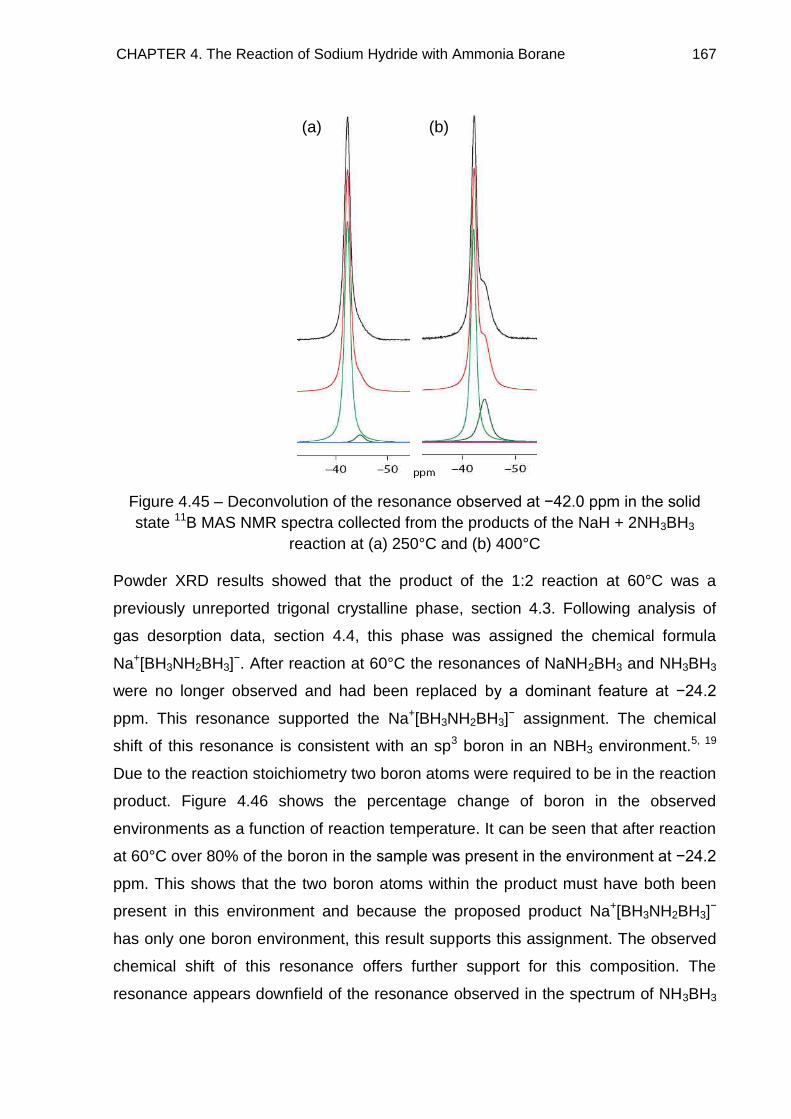
CHAPTER 4. The Reaction of Sodium Hydride with Ammonia Borane 167
Figure 4.45 – Deconvolution of the resonance observed at −42.0 ppm in the solid
state 11B MAS NMR spectra collected from the products of the NaH + 2NH3BH3
reaction at (a) 250°C and (b) 400°C
Powder XRD results showed that the product of the 1:2 reaction at 60°C was a
previously unreported trigonal crystalline phase, section 4.3. Following analysis of
gas desorption data, section 4.4, this phase was assigned the chemical formula
Na+[BH3NH2BH3]−. After reaction at 60°C the resonances of NaNH2BH3 and NH3BH3
were no longer observed and had been replaced by a dominant feature at −24.2
ppm. This resonance supported the Na+[BH3NH2BH3]− assignment. The chemical
shift of this resonance is consistent with an sp3 boron in an NBH3 environment.5, 19
Due to the reaction stoichiometry two boron atoms were required to be in the reaction
product. Figure 4.46 shows the percentage change of boron in the observed
environments as a function of reaction temperature. It can be seen that after reaction
at 60°C over 80% of the boron in the sample was present in the environment at −24.2
ppm. This shows that the two boron atoms within the product must have both been
present in this environment and because the proposed product Na+[BH3NH2BH3]−
has only one boron environment, this result supports this assignment. The observed
chemical shift of this resonance offers further support for this composition. The
resonance appears downfield of the resonance observed in the spectrum of NH3BH3
(a) (b)
CHAPTER 4. The Reaction of Sodium Hydride with Ammonia Borane 168
but upfield of that in NaNH2BH3. Electron donation from the Na causes the resonance
to shift downfield compared to NH3BH3. However, the fact that this downfield shift
was reduced compared to that observed with NaNH2BH3 shows that there was a
reduced amount of electron donation, as would be expected with Na+[BH3NH2BH3]−.
The decreased intensity of the Na+[BH3NH2BH3]− resonance after reaction at 120°C
showed decomposition of this phase had occurred. This was accompanied by the
appearance of the resonance at −42.0 ppm. Powder XRD results showed that NaBH4
formed at 120°C and consistent with this, the observed resonance has a chemical
shift associated with an alkali metal borohydride and can therefore be assigned to
NaBH4.25 Whereas powder XRD could not identify other products of this
decomposition, 11B NMR revealed that a second product formed, which produced the
quadrupolar boron resonance at 29.3 ppm. As NaBH4 showed an increased amount
of hydrogen bound to boron, this site should show reduced hydrogen compared to a
BH3. Quadrupolar boron sites have been identified for sp2 boron at similar chemical
shifts to those identified in the spectra presented here.26 Two environments that
satisfy this requirement are BHN2 and BN3, which have both been identified by
Gervais et al.27 in the structure of polyborazylene. The chemical shifts of these were
identified as 31 ppm and 27 ppm for the BHN2 and BN3 environments, respectively.
The observed chemical shift of the quadrupolar boron resonance in our study is
similar to that of the BHN2 environment, suggesting that the amorphous
decomposition product of Na+[BH3NH2BH3]− likely possesses this environment.
Hexagonal BN also possesses sp2 boron and both Marchetti et al.26 and Jeschke et
al.28 have observed this quadrupolar resonance at 30 ppm and 30.4 ppm,
respectively. However, it is unlikely that this compound was responsible for the
resonance observed in our study as temperatures in excess of 800°C are required for
its synthesis.23 The second quadrupolar site identified at 25.7 ppm shows a similar
upfield shift to the BN3 environment observed by Gervais et al. as did the BHN2
environment. Figure 4.44 showed that this secondary site did not show a correlation
with reaction temperature increase. It is therefore probable that this environment
formed as a consequence of side reactions, possibly related to cross linking
reactions between polymers possessing BHN2 environments, which would release H2
and form polymers containing BN3 environments, as observed in the decomposition
CHAPTER 4. The Reaction of Sodium Hydride with Ammonia Borane 169
of polyaminoborane.29 Figure 4.46 showed that the sp2 and NaBH4 environments
were present in approximately equal amounts following decomposition of
Na+[BH3NH2BH3]−. This implied that all of the sodium in the decomposed products
was present as NaBH4. This will be considered further in section 4.6.
Above 250°C a second BH4 resonance was observed in the spectra of the products
at −44.3 ppm, whose appearance and subsequent growth was accompanied by a
decrease in the amount of NaBH4 and increase in sp2 boron in the sample. This
would therefore be expected to be related to NaBH4 decomposition. However, the
decomposition of NaBH4 has only been reported in the temperature range 400°C to
565°C.7, 30, 31 Therefore, the changes in B environment observed at 250°C would not
have been related to this decomposition. The fact that a second BH4 environment
appeared in the spectrum may be an indication that a phase transition occurs during
the decomposition of NaBH4. Phase transitions in the decomposition of both LiBH4
and Ca(BH4)2 have previously been reported.32, 33 However, there no literature
reports have identified such a transition for NaBH4. The reason behind the
appearance of this resonance therefore remains unknown. The decomposition of
NaBH4 has been shown to proceed through either reaction 4.29 or reaction 4.30.34
NaBH4 → Na + B + 2H2 Reaction 4.29
NaBH4 → NaH + B + 3/2H2 Reaction 4.30
The absence of Na and NaH in the powder XRD patterns of the reaction products
suggested that NaBH4 decomposition did not proceed. Therefore the changes in the
spectra were likely due to unidentified side reactions involving NaBH4.
Below 120°C a third BH4 resonance was observed at −42.8 ppm, along with two
resonances at −7.3 ppm and −15.7 ppm. Stowe et al.19 identified resonances at
similar chemical shifts during the thermal decomposition of NH3BH3, which were
assigned to the formation of DADB. The amount of boron in BH2 and BH4
environments was similar at temperatures below 120°C and both sites disappeared
above this temperature. This collective behaviour was a good indication that the two
sites were related. NH3BH3 decomposes to (NH2BH2)n through DADB formation and
this polymer further decomposes to (NHBH)n above 130°C.18 Therefore above 120°C

CHAPTER 4. The Reaction of Sodium Hydride with Ammonia Borane 170
it can be concluded that the BH2 environments released H2 to form sp2 boron and the
BH4 crystallised with Na to form NaBH4.
Finally the low intensity resonance at approximately 1 ppm, observed in most
spectra, was thought to be due to a small amount of sample oxidation.
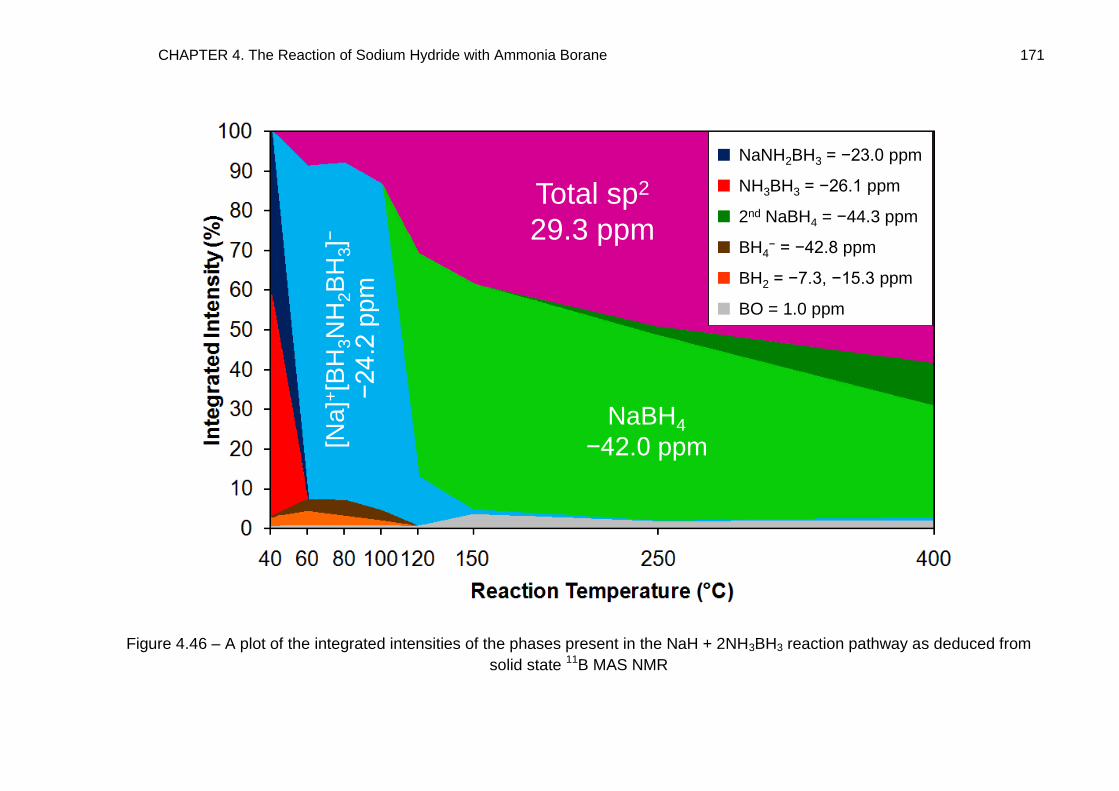
CHAPTER 4. The Reaction of Sodium Hydride with Ammonia Borane 171
Figure 4.46 – A plot of the integrated intensities of the phases present in the NaH + 2NH3BH3 reaction pathway as deduced from
solid state 11B MAS NMR
Total sp2
29.3 ppm
NaBH4
−42.0 ppm[Na
]+[B
H3N
H2B
H3]−
−24.2 p
pm
NaNH2BH3 = −23.0 ppm
NH3BH3 = −26.1 ppm
2nd NaBH4 = −44.3 ppm
BH4− = −42.8 ppm
BH2 = −7.3, −15.3 ppm
BO = 1.0 ppm
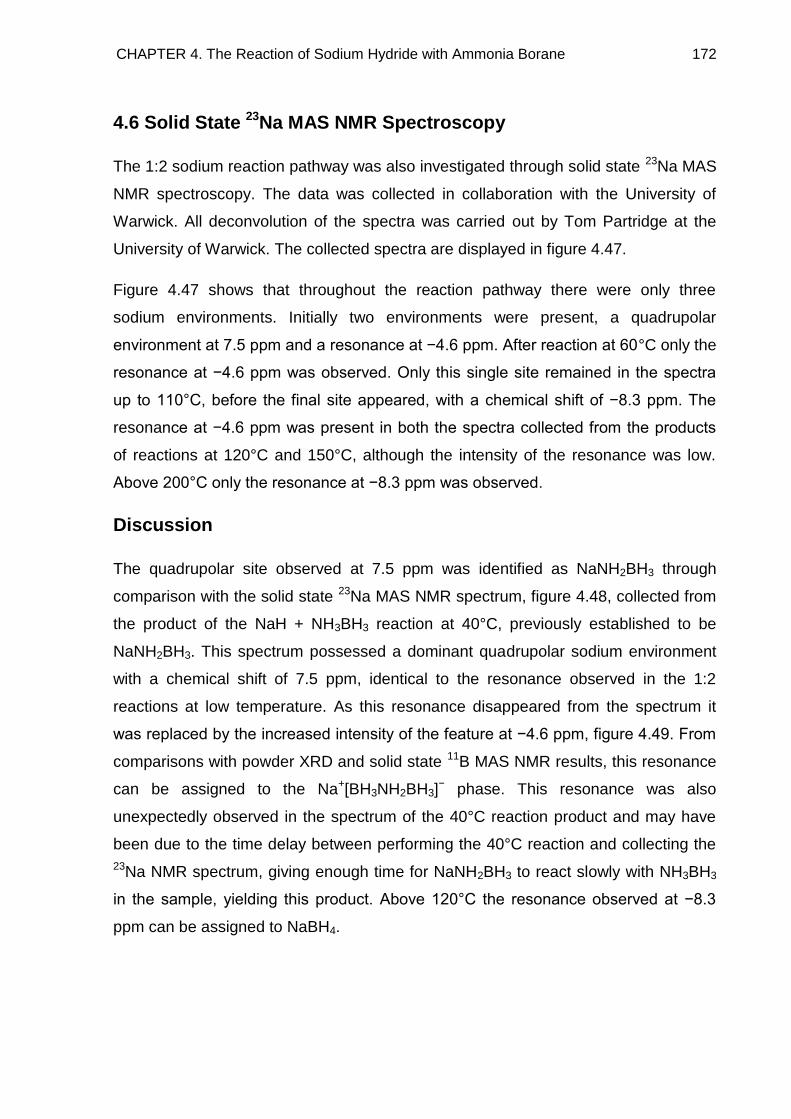
CHAPTER 4. The Reaction of Sodium Hydride with Ammonia Borane 172
4.6 Solid State 23Na MAS NMR Spectroscopy
The 1:2 sodium reaction pathway was also investigated through solid state 23Na MAS
NMR spectroscopy. The data was collected in collaboration with the University of
Warwick. All deconvolution of the spectra was carried out by Tom Partridge at the
University of Warwick. The collected spectra are displayed in figure 4.47.
Figure 4.47 shows that throughout the reaction pathway there were only three
sodium environments. Initially two environments were present, a quadrupolar
environment at 7.5 ppm and a resonance at −4.6 ppm. After reaction at 60°C only the
resonance at −4.6 ppm was observed. Only this single site remained in the spectra
up to 110°C, before the final site appeared, with a chemical shift of −8.3 ppm. The
resonance at −4.6 ppm was present in both the spectra collected from the products
of reactions at 120°C and 150°C, although the intensity of the resonance was low.
Above 200°C only the resonance at −8.3 ppm was observed.
Discussion
The quadrupolar site observed at 7.5 ppm was identified as NaNH2BH3 through
comparison with the solid state 23Na MAS NMR spectrum, figure 4.48, collected from
the product of the NaH + NH3BH3 reaction at 40°C, previously established to be
NaNH2BH3. This spectrum possessed a dominant quadrupolar sodium environment
with a chemical shift of 7.5 ppm, identical to the resonance observed in the 1:2
reactions at low temperature. As this resonance disappeared from the spectrum it
was replaced by the increased intensity of the feature at −4.6 ppm, figure 4.49. From
comparisons with powder XRD and solid state 11B MAS NMR results, this resonance
can be assigned to the Na+[BH3NH2BH3]− phase. This resonance was also
unexpectedly observed in the spectrum of the 40°C reaction product and may have
been due to the time delay between performing the 40°C reaction and collecting the
23Na NMR spectrum, giving enough time for NaNH2BH3 to react slowly with NH3BH3
in the sample, yielding this product. Above 120°C the resonance observed at −8.3
ppm can be assigned to NaBH4.
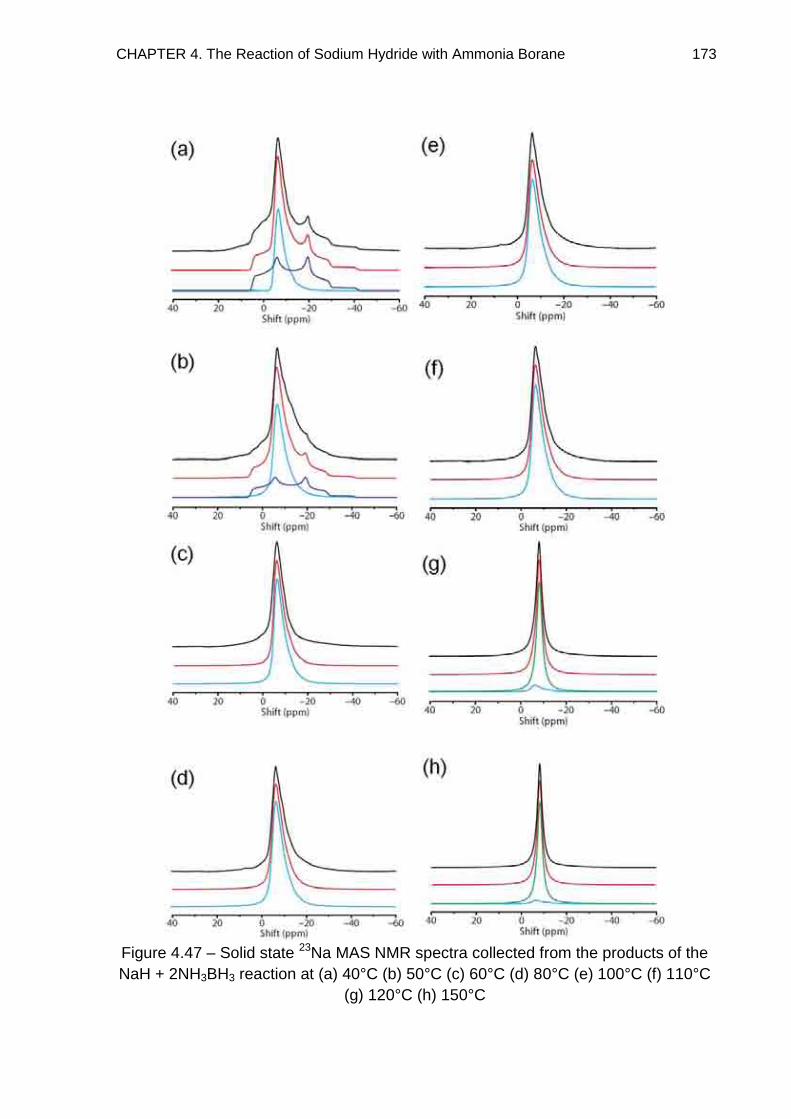
CHAPTER 4. The Reaction of Sodium Hydride with Ammonia Borane 173
Figure 4.47 – Solid state 23Na MAS NMR spectra collected from the products of the
NaH + 2NH3BH3 reaction at (a) 40°C (b) 50°C (c) 60°C (d) 80°C (e) 100°C (f) 110°C
(g) 120°C (h) 150°C
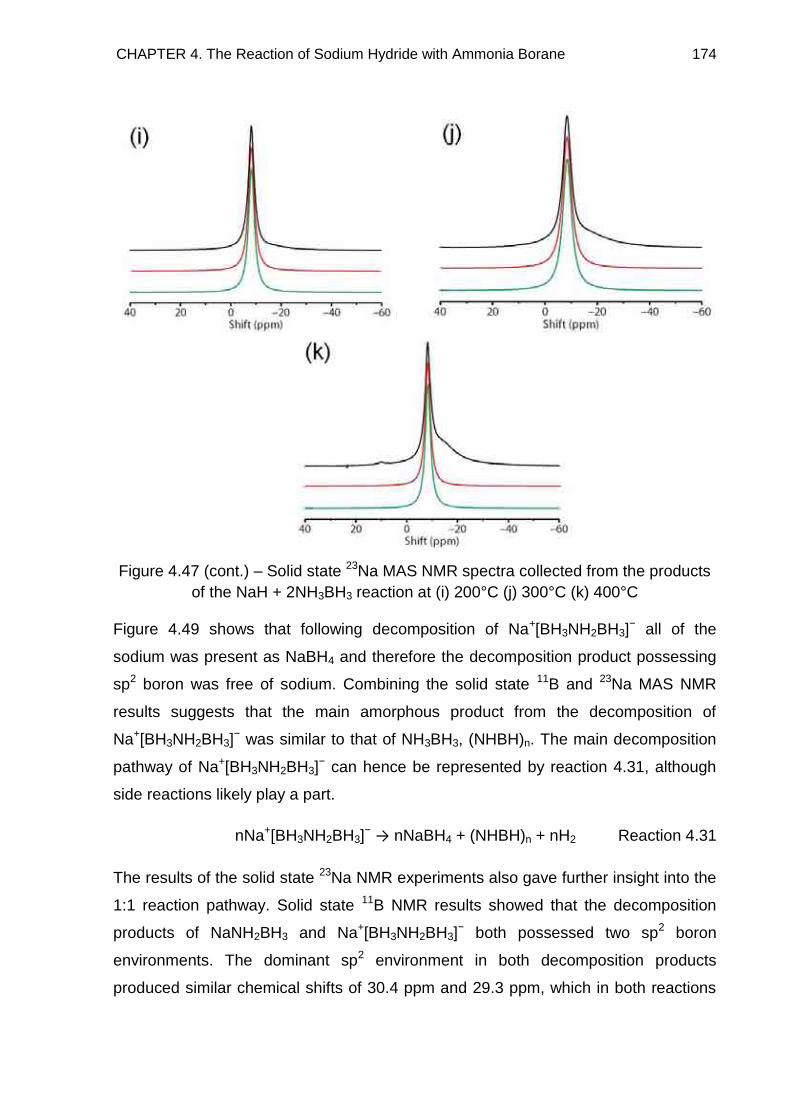
CHAPTER 4. The Reaction of Sodium Hydride with Ammonia Borane 174
Figure 4.47 (cont.) – Solid state 23Na MAS NMR spectra collected from the products
of the NaH + 2NH3BH3 reaction at (i) 200°C (j) 300°C (k) 400°C
Figure 4.49 shows that following decomposition of Na+[BH3NH2BH3]− all of the
sodium was present as NaBH4 and therefore the decomposition product possessing
sp2 boron was free of sodium. Combining the solid state 11B and 23Na MAS NMR
results suggests that the main amorphous product from the decomposition of
Na+[BH3NH2BH3]− was similar to that of NH3BH3, (NHBH)n. The main decomposition
pathway of Na+[BH3NH2BH3]− can hence be represented by reaction 4.31, although
side reactions likely play a part.
nNa+[BH3NH2BH3]− → nNaBH4 + (NHBH)n + nH2 Reaction 4.31
The results of the solid state 23Na NMR experiments also gave further insight into the
1:1 reaction pathway. Solid state 11B NMR results showed that the decomposition
products of NaNH2BH3 and Na+[BH3NH2BH3]− both possessed two sp2 boron
environments. The dominant sp2 environment in both decomposition products
produced similar chemical shifts of 30.4 ppm and 29.3 ppm, which in both reactions
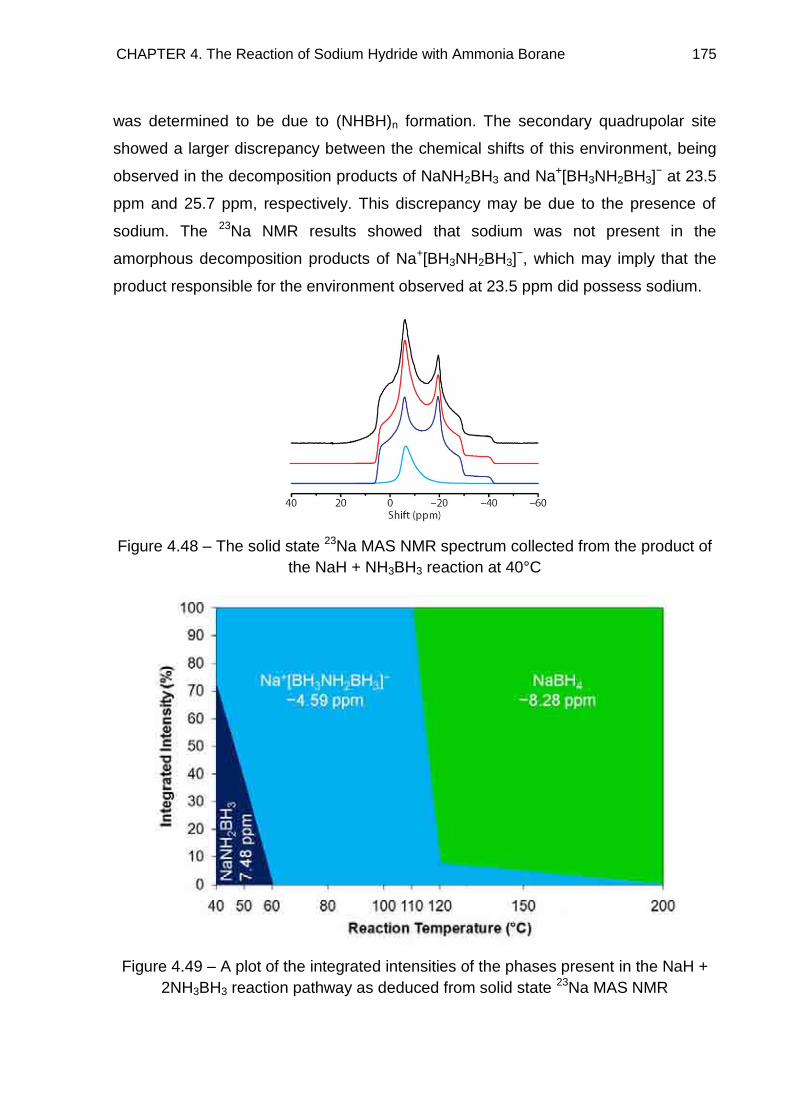
CHAPTER 4. The Reaction of Sodium Hydride with Ammonia Borane 175
was determined to be due to (NHBH)n formation. The secondary quadrupolar site
showed a larger discrepancy between the chemical shifts of this environment, being
observed in the decomposition products of NaNH2BH3 and Na+[BH3NH2BH3]− at 23.5
ppm and 25.7 ppm, respectively. This discrepancy may be due to the presence of
sodium. The 23Na NMR results showed that sodium was not present in the
amorphous decomposition products of Na+[BH3NH2BH3]−, which may imply that the
product responsible for the environment observed at 23.5 ppm did possess sodium.
Figure 4.48 – The solid state 23Na MAS NMR spectrum collected from the product of
the NaH + NH3BH3 reaction at 40°C
Figure 4.49 – A plot of the integrated intensities of the phases present in the NaH +
2NH3BH3 reaction pathway as deduced from solid state 23Na MAS NMR
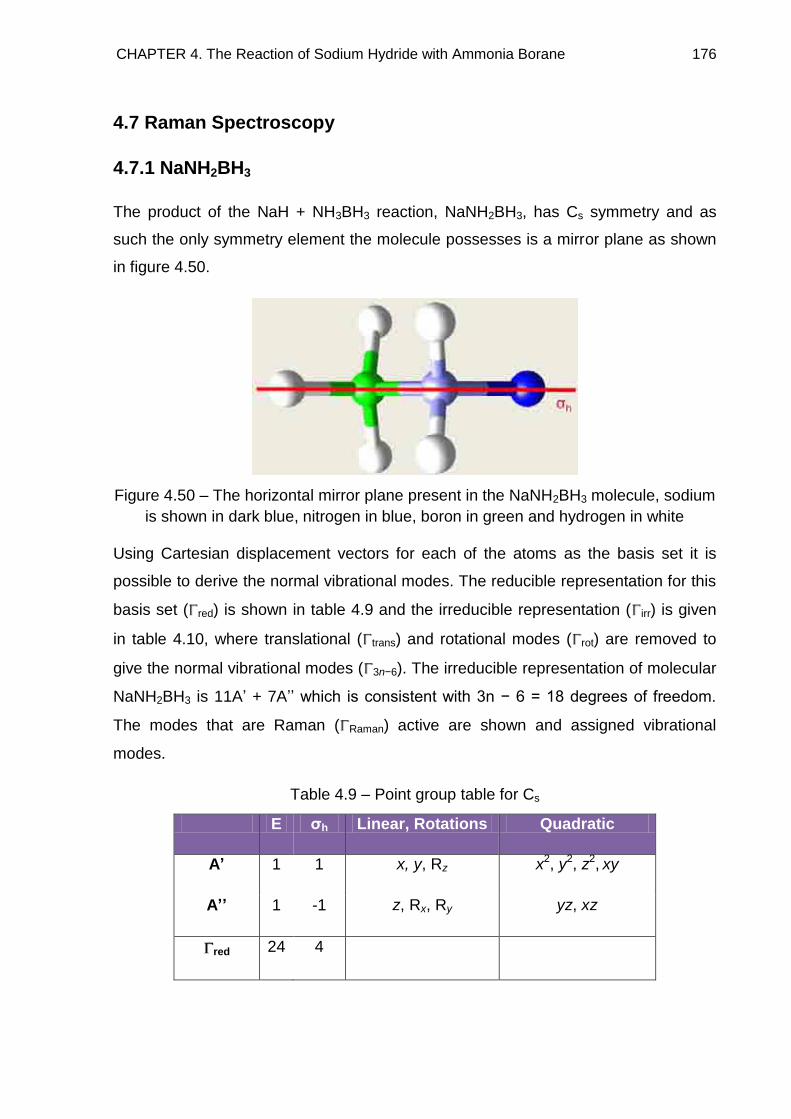
CHAPTER 4. The Reaction of Sodium Hydride with Ammonia Borane 176
4.7 Raman Spectroscopy
4.7.1 NaNH2BH3
The product of the NaH + NH3BH3 reaction, NaNH2BH3, has Cs symmetry and as
such the only symmetry element the molecule possesses is a mirror plane as shown
in figure 4.50.
Figure 4.50 – The horizontal mirror plane present in the NaNH2BH3 molecule, sodium
is shown in dark blue, nitrogen in blue, boron in green and hydrogen in white
Using Cartesian displacement vectors for each of the atoms as the basis set it is
possible to derive the normal vibrational modes. The reducible representation for this
basis set ( red) is shown in table 4.9 and the irreducible representation ( irr) is given
in table 4.10, where translational ( trans) and rotational modes ( rot) are removed to
give the normal vibrational modes ( 3n−6). The irreducible representation of molecular
NaNH2BH3 is 11A‘ + 7A‘‘ which is consistent with 3n − 6 = 18 degrees of freedom.
The modes that are Raman ( Raman) active are shown and assigned vibrational
modes.
Table 4.9 – Point group table for Cs
E σh Linear, Rotations Quadratic
A’ 1 1 x, y, Rz x2, y2, z2, xy
A’’ 1 -1 z, Rx, Ry yz, xz
red 24 4
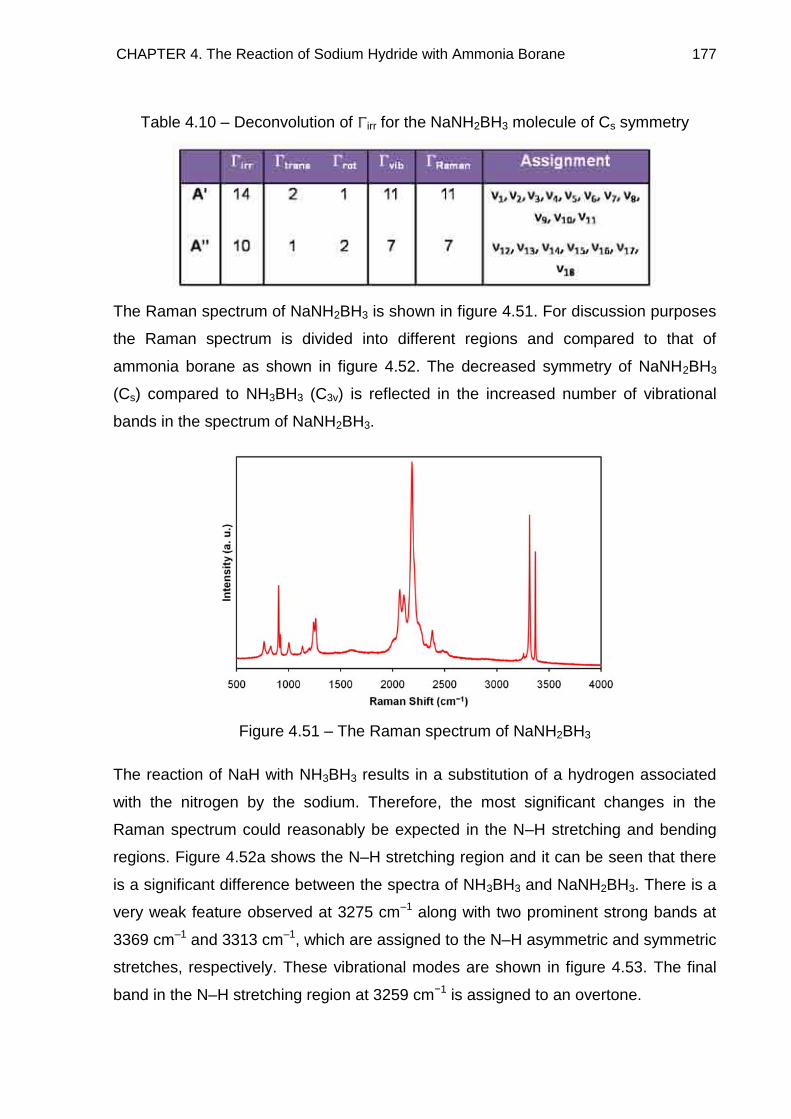
CHAPTER 4. The Reaction of Sodium Hydride with Ammonia Borane 177
Table 4.10 – Deconvolution of irr for the NaNH2BH3 molecule of Cs symmetry
The Raman spectrum of NaNH2BH3 is shown in figure 4.51. For discussion purposes
the Raman spectrum is divided into different regions and compared to that of
ammonia borane as shown in figure 4.52. The decreased symmetry of NaNH2BH3
(Cs) compared to NH3BH3 (C3v) is reflected in the increased number of vibrational
bands in the spectrum of NaNH2BH3.
Figure 4.51 – The Raman spectrum of NaNH2BH3
The reaction of NaH with NH3BH3 results in a substitution of a hydrogen associated
with the nitrogen by the sodium. Therefore, the most significant changes in the
Raman spectrum could reasonably be expected in the N–H stretching and bending
regions. Figure 4.52a shows the N–H stretching region and it can be seen that there
is a significant difference between the spectra of NH3BH3 and NaNH2BH3. There is a
very weak feature observed at 3275 cm–1 along with two prominent strong bands at
3369 cm–1 and 3313 cm–1, which are assigned to the N–H asymmetric and symmetric
stretches, respectively. These vibrational modes are shown in figure 4.53. The final
band in the N–H stretching region at 3259 cm−1 is assigned to an overtone.
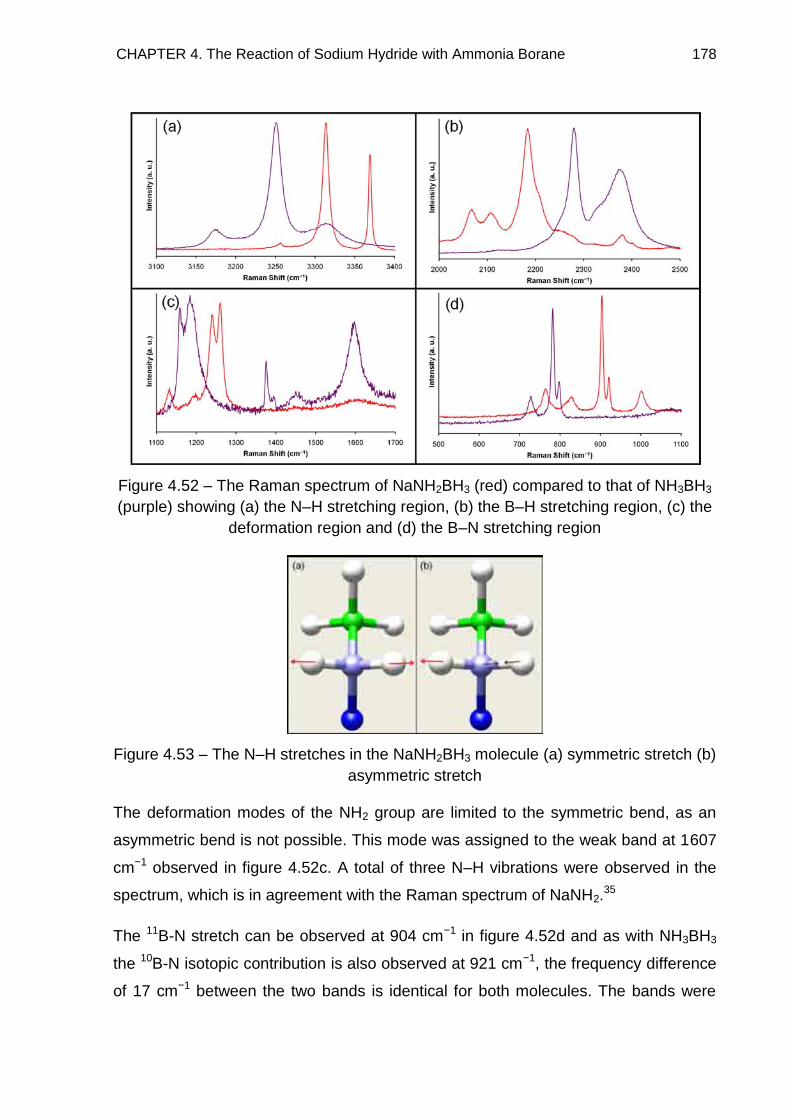
CHAPTER 4. The Reaction of Sodium Hydride with Ammonia Borane 178
Figure 4.52 – The Raman spectrum of NaNH2BH3 (red) compared to that of NH3BH3
(purple) showing (a) the N–H stretching region, (b) the B–H stretching region, (c) the
deformation region and (d) the B–N stretching region
Figure 4.53 – The N–H stretches in the NaNH2BH3 molecule (a) symmetric stretch (b)
asymmetric stretch
The deformation modes of the NH2 group are limited to the symmetric bend, as an
asymmetric bend is not possible. This mode was assigned to the weak band at 1607
cm−1 observed in figure 4.52c. A total of three N–H vibrations were observed in the
spectrum, which is in agreement with the Raman spectrum of NaNH2.35
The 11B-N stretch can be observed at 904 cm−1 in figure 4.52d and as with NH3BH3
the 10B-N isotopic contribution is also observed at 921 cm−1, the frequency difference
of 17 cm−1 between the two bands is identical for both molecules. The bands were
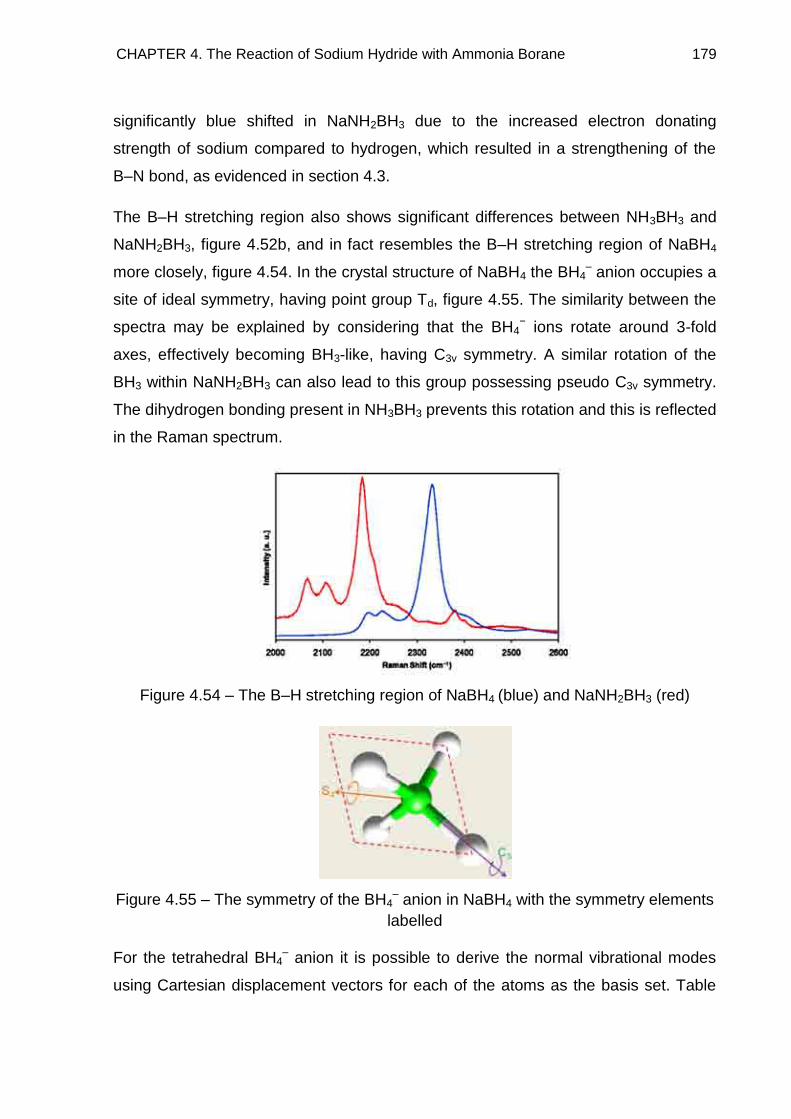
CHAPTER 4. The Reaction of Sodium Hydride with Ammonia Borane 179
significantly blue shifted in NaNH2BH3 due to the increased electron donating
strength of sodium compared to hydrogen, which resulted in a strengthening of the
B–N bond, as evidenced in section 4.3.
The B–H stretching region also shows significant differences between NH3BH3 and
NaNH2BH3, figure 4.52b, and in fact resembles the B–H stretching region of NaBH4
more closely, figure 4.54. In the crystal structure of NaBH4 the BH4– anion occupies a
site of ideal symmetry, having point group Td, figure 4.55. The similarity between the
spectra may be explained by considering that the BH4− ions rotate around 3-fold
axes, effectively becoming BH3-like, having C3v symmetry. A similar rotation of the
BH3 within NaNH2BH3 can also lead to this group possessing pseudo C3v symmetry.
The dihydrogen bonding present in NH3BH3 prevents this rotation and this is reflected
in the Raman spectrum.
Figure 4.54 – The B–H stretching region of NaBH4 (blue) and NaNH2BH3 (red)
Figure 4.55 – The symmetry of the BH4– anion in NaBH4 with the symmetry elements
labelled
For the tetrahedral BH4– anion it is possible to derive the normal vibrational modes
using Cartesian displacement vectors for each of the atoms as the basis set. Table
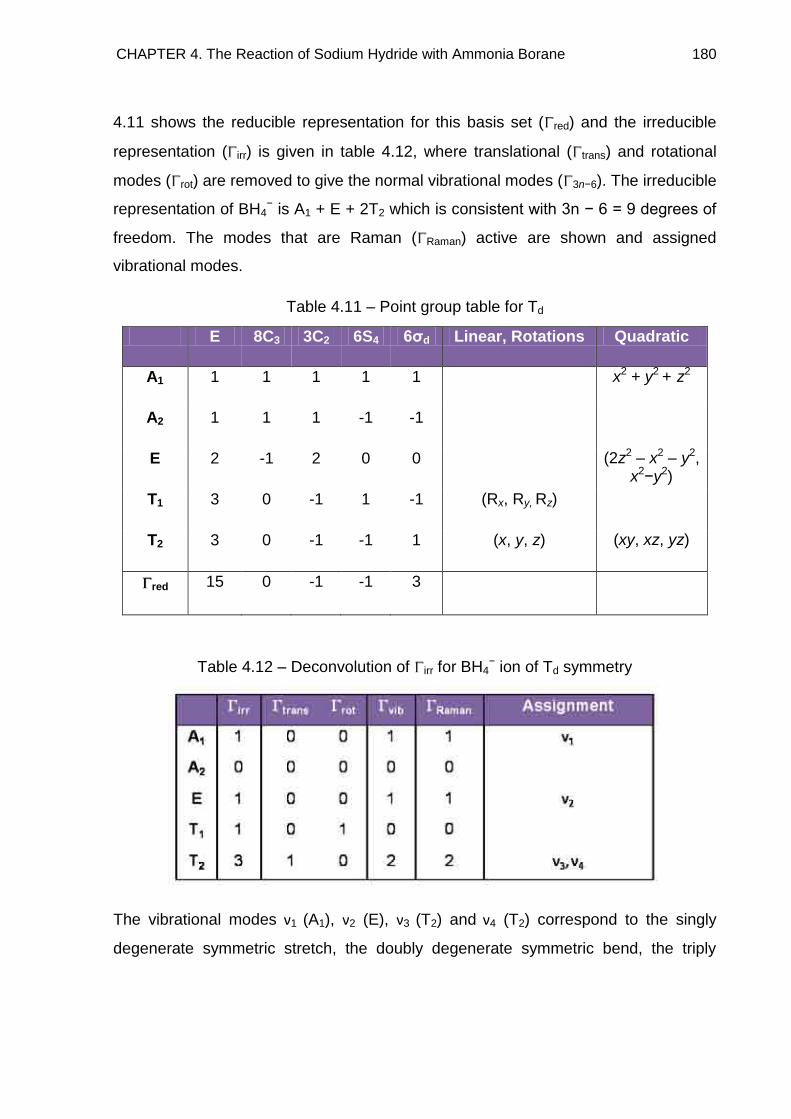
CHAPTER 4. The Reaction of Sodium Hydride with Ammonia Borane 180
4.11 shows the reducible representation for this basis set ( red) and the irreducible
representation ( irr) is given in table 4.12, where translational ( trans) and rotational
modes ( rot) are removed to give the normal vibrational modes ( 3n−6). The irreducible
representation of BH4− is A1 + E + 2T2 which is consistent with 3n − 6 = 9 degrees of
freedom. The modes that are Raman ( Raman) active are shown and assigned
vibrational modes.
Table 4.11 – Point group table for Td
E 8C3 3C2 6S4 6σd Linear, Rotations Quadratic
A1 1 1 1 1 1 x2 + y2 + z2
A2 1 1 1 -1 -1
E 2 -1 2 0 0 (2z2 – x2 – y2, x2−y2)
T1 3 0 -1 1 -1 (Rx, Ry, Rz)
T2 3 0 -1 -1 1 (x, y, z) (xy, xz, yz)
red 15 0 -1 -1 3
Table 4.12 – Deconvolution of irr for BH4− ion of Td symmetry
The vibrational modes ν1 (A1), ν2 (E), ν3 (T2) and ν4 (T2) correspond to the singly
degenerate symmetric stretch, the doubly degenerate symmetric bend, the triply
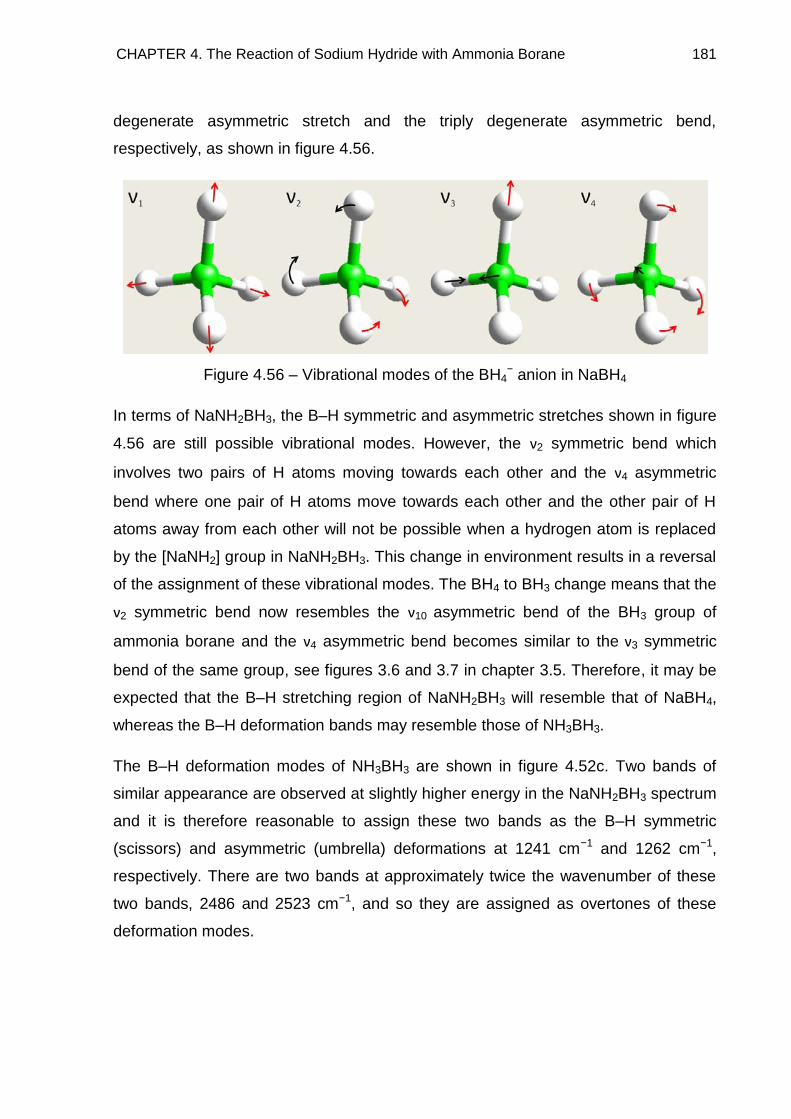
CHAPTER 4. The Reaction of Sodium Hydride with Ammonia Borane 181
degenerate asymmetric stretch and the triply degenerate asymmetric bend,
respectively, as shown in figure 4.56.
Figure 4.56 – Vibrational modes of the BH4− anion in NaBH4
In terms of NaNH2BH3, the B–H symmetric and asymmetric stretches shown in figure
4.56 are still possible vibrational modes. However, the ν2 symmetric bend which
involves two pairs of H atoms moving towards each other and the ν4 asymmetric
bend where one pair of H atoms move towards each other and the other pair of H
atoms away from each other will not be possible when a hydrogen atom is replaced
by the [NaNH2] group in NaNH2BH3. This change in environment results in a reversal
of the assignment of these vibrational modes. The BH4 to BH3 change means that the
ν2 symmetric bend now resembles the ν10 asymmetric bend of the BH3 group of
ammonia borane and the ν4 asymmetric bend becomes similar to the ν3 symmetric
bend of the same group, see figures 3.6 and 3.7 in chapter 3.5. Therefore, it may be
expected that the B–H stretching region of NaNH2BH3 will resemble that of NaBH4,
whereas the B–H deformation bands may resemble those of NH3BH3.
The B–H deformation modes of NH3BH3 are shown in figure 4.52c. Two bands of
similar appearance are observed at slightly higher energy in the NaNH2BH3 spectrum
and it is therefore reasonable to assign these two bands as the B–H symmetric
(scissors) and asymmetric (umbrella) deformations at 1241 cm−1 and 1262 cm−1,
respectively. There are two bands at approximately twice the wavenumber of these
two bands, 2486 and 2523 cm−1, and so they are assigned as overtones of these
deformation modes.
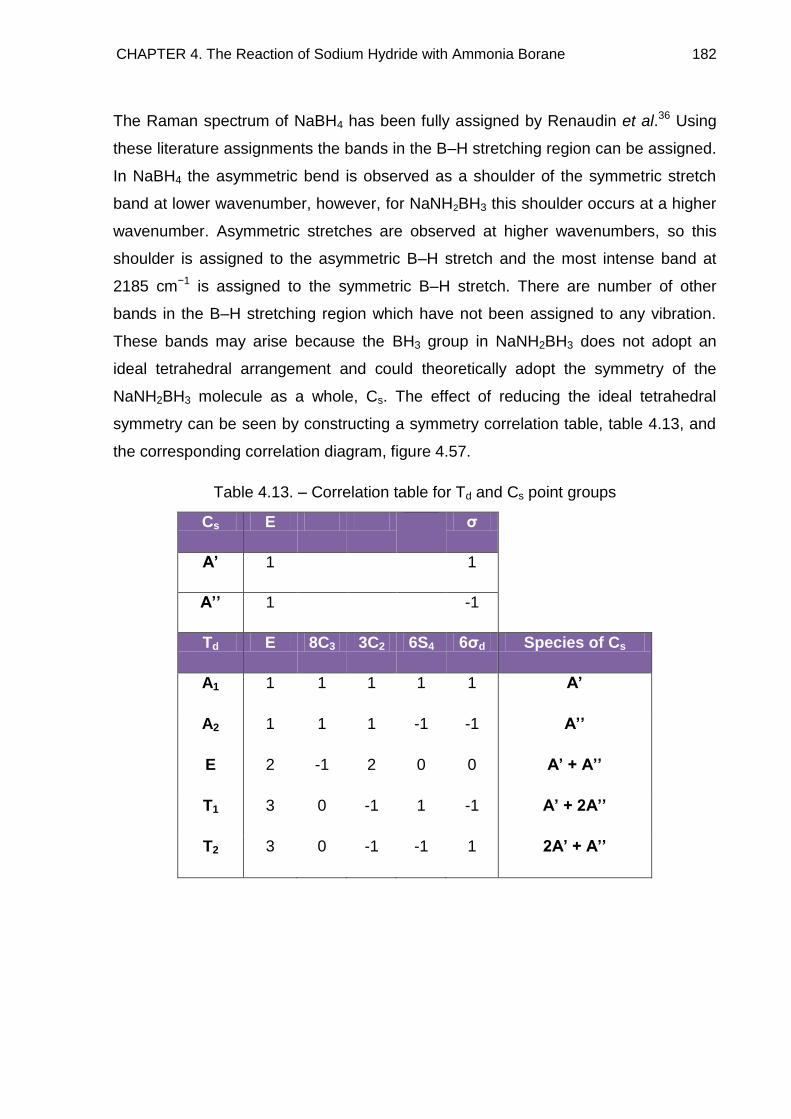
CHAPTER 4. The Reaction of Sodium Hydride with Ammonia Borane 182
The Raman spectrum of NaBH4 has been fully assigned by Renaudin et al.36 Using
these literature assignments the bands in the B–H stretching region can be assigned.
In NaBH4 the asymmetric bend is observed as a shoulder of the symmetric stretch
band at lower wavenumber, however, for NaNH2BH3 this shoulder occurs at a higher
wavenumber. Asymmetric stretches are observed at higher wavenumbers, so this
shoulder is assigned to the asymmetric B–H stretch and the most intense band at
2185 cm−1 is assigned to the symmetric B–H stretch. There are number of other
bands in the B–H stretching region which have not been assigned to any vibration.
These bands may arise because the BH3 group in NaNH2BH3 does not adopt an
ideal tetrahedral arrangement and could theoretically adopt the symmetry of the
NaNH2BH3 molecule as a whole, Cs. The effect of reducing the ideal tetrahedral
symmetry can be seen by constructing a symmetry correlation table, table 4.13, and
the corresponding correlation diagram, figure 4.57.
Table 4.13. – Correlation table for Td and Cs point groups
Cs E σ
A’ 1 1
A’’ 1 -1
Td E 8C3 3C2 6S4 6σd Species of Cs
A1 1 1 1 1 1 A’
A2 1 1 1 -1 -1 A’’
E 2 -1 2 0 0 A’ + A’’
T1 3 0 -1 1 -1 A’ + 2A’’
T2 3 0 -1 -1 1 2A’ + A’’
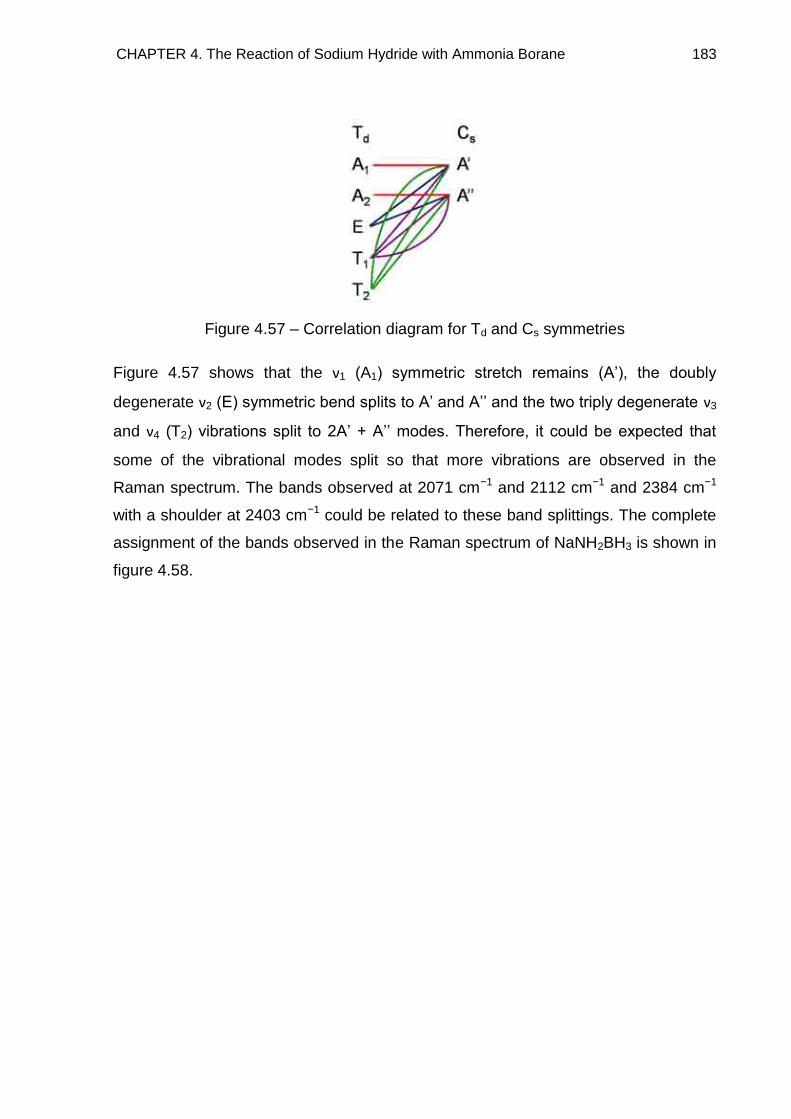
CHAPTER 4. The Reaction of Sodium Hydride with Ammonia Borane 183
Figure 4.57 – Correlation diagram for Td and Cs symmetries
Figure 4.57 shows that the ν1 (A1) symmetric stretch remains (A‘), the doubly
degenerate ν2 (E) symmetric bend splits to A‘ and A‘‘ and the two triply degenerate ν3
and ν4 (T2) vibrations split to 2A‘ + A‘‘ modes. Therefore, it could be expected that
some of the vibrational modes split so that more vibrations are observed in the
Raman spectrum. The bands observed at 2071 cm−1 and 2112 cm−1 and 2384 cm−1
with a shoulder at 2403 cm−1 could be related to these band splittings. The complete
assignment of the bands observed in the Raman spectrum of NaNH2BH3 is shown in
figure 4.58.
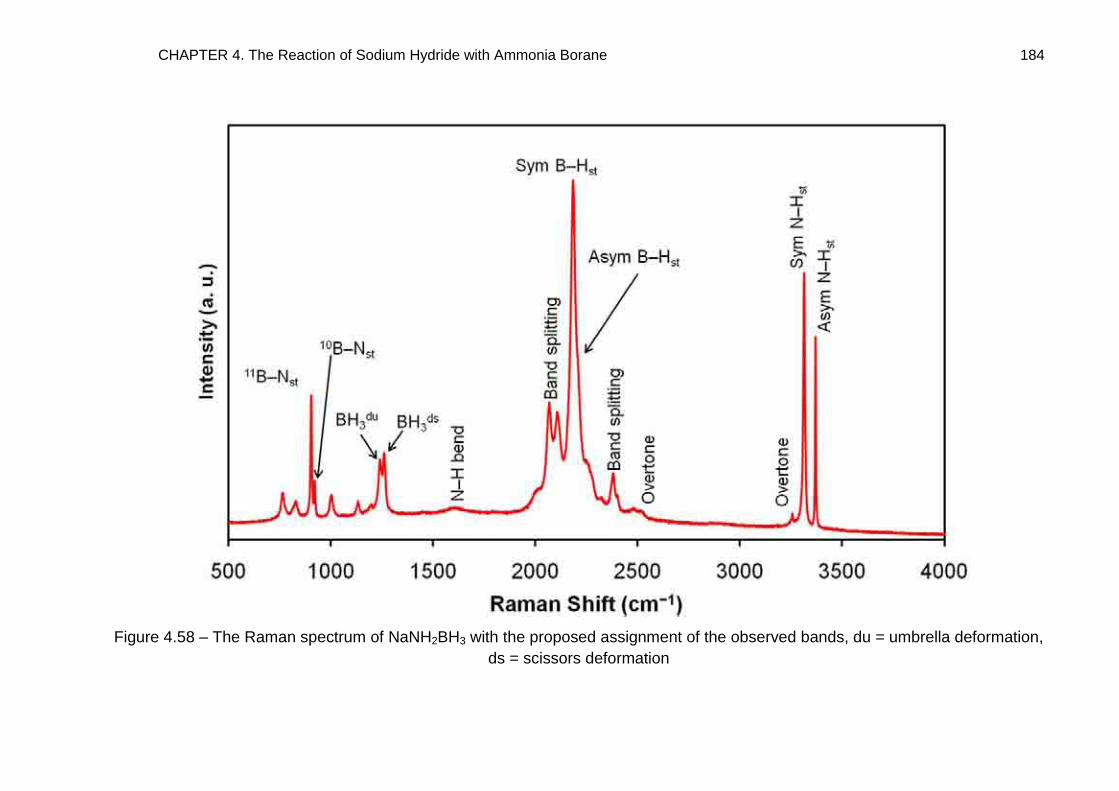
CHAPTER 4. The Reaction of Sodium Hydride with Ammonia Borane 184
Figure 4.58 – The Raman spectrum of NaNH2BH3 with the proposed assignment of the observed bands, du = umbrella deformation,
ds = scissors deformation
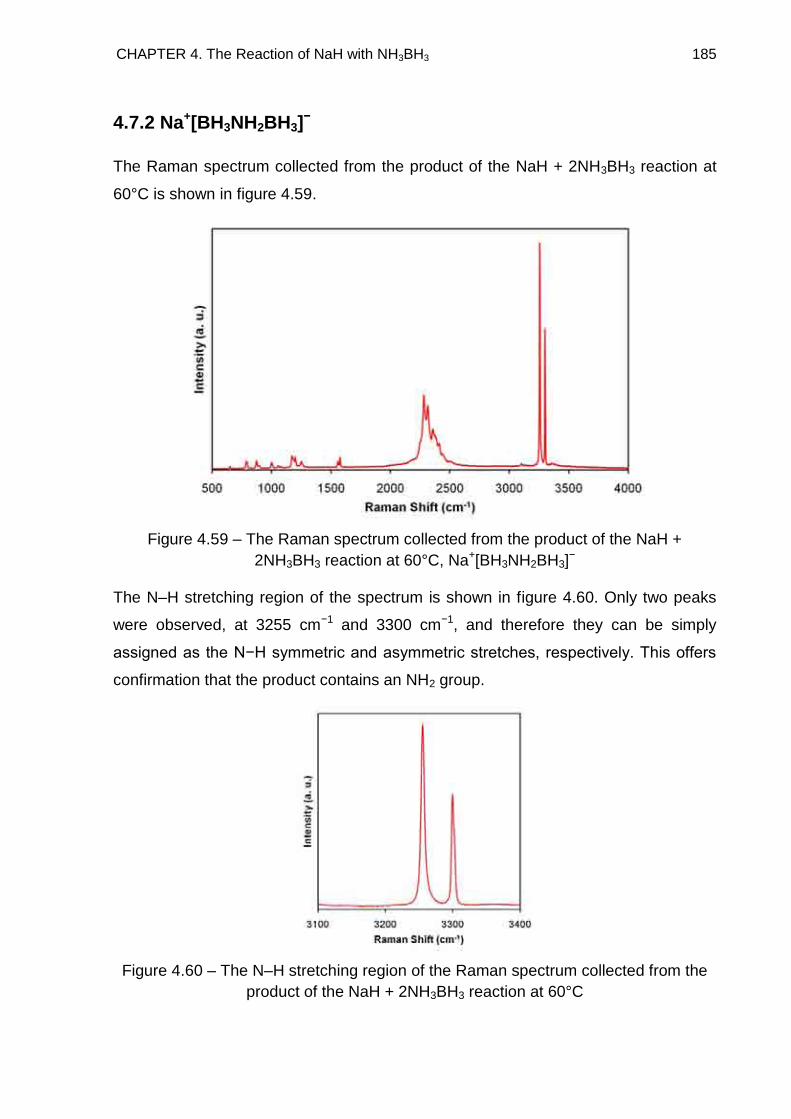
CHAPTER 4. The Reaction of NaH with NH3BH3 185
4.7.2 Na+[BH3NH2BH3]−
The Raman spectrum collected from the product of the NaH + 2NH3BH3 reaction at
60°C is shown in figure 4.59.
Figure 4.59 – The Raman spectrum collected from the product of the NaH +
2NH3BH3 reaction at 60°C, Na+[BH3NH2BH3]−
The N–H stretching region of the spectrum is shown in figure 4.60. Only two peaks
were observed, at 3255 cm−1 and 3300 cm−1, and therefore they can be simply
assigned as the N−H symmetric and asymmetric stretches, respectively. This offers
confirmation that the product contains an NH2 group.
Figure 4.60 – The N–H stretching region of the Raman spectrum collected from the
product of the NaH + 2NH3BH3 reaction at 60°C
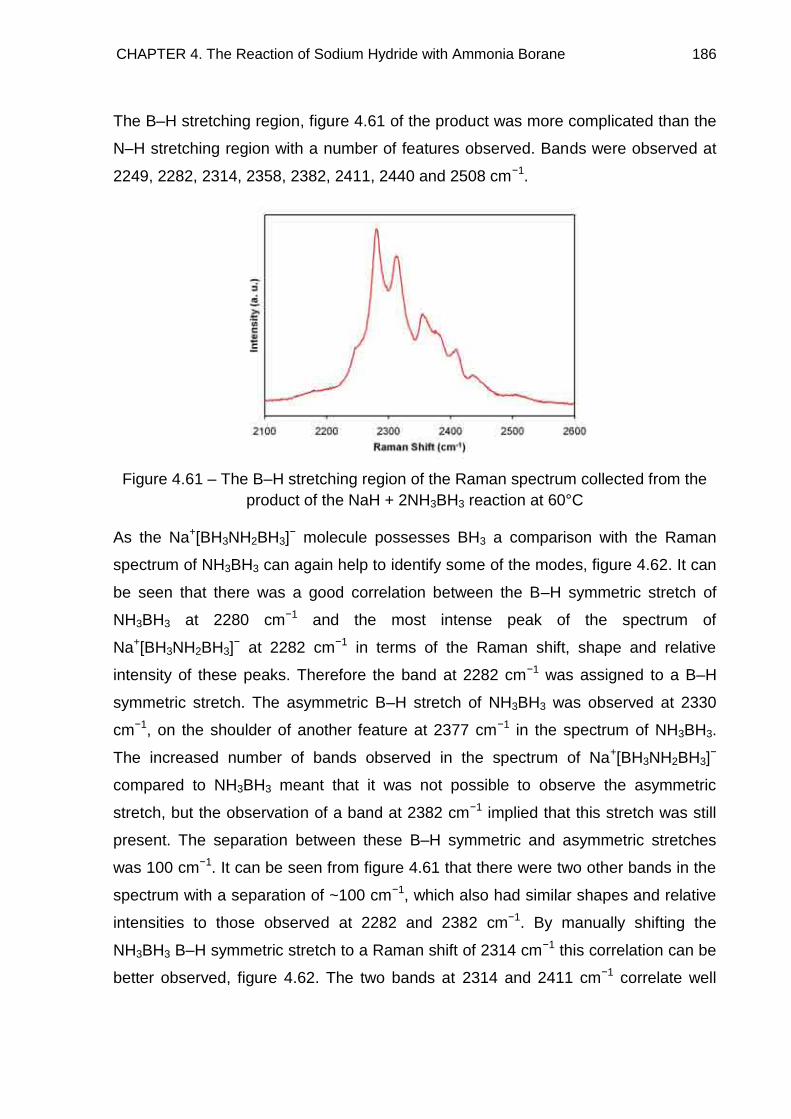
CHAPTER 4. The Reaction of Sodium Hydride with Ammonia Borane 186
The B–H stretching region, figure 4.61 of the product was more complicated than the
N–H stretching region with a number of features observed. Bands were observed at
2249, 2282, 2314, 2358, 2382, 2411, 2440 and 2508 cm−1.
Figure 4.61 – The B–H stretching region of the Raman spectrum collected from the
product of the NaH + 2NH3BH3 reaction at 60°C
As the Na+[BH3NH2BH3]− molecule possesses BH3 a comparison with the Raman
spectrum of NH3BH3 can again help to identify some of the modes, figure 4.62. It can
be seen that there was a good correlation between the B–H symmetric stretch of
NH3BH3 at 2280 cm−1 and the most intense peak of the spectrum of
Na+[BH3NH2BH3]− at 2282 cm−1 in terms of the Raman shift, shape and relative
intensity of these peaks. Therefore the band at 2282 cm−1 was assigned to a B–H
symmetric stretch. The asymmetric B–H stretch of NH3BH3 was observed at 2330
cm−1, on the shoulder of another feature at 2377 cm−1 in the spectrum of NH3BH3.
The increased number of bands observed in the spectrum of Na+[BH3NH2BH3]−
compared to NH3BH3 meant that it was not possible to observe the asymmetric
stretch, but the observation of a band at 2382 cm−1 implied that this stretch was still
present. The separation between these B–H symmetric and asymmetric stretches
was 100 cm−1. It can be seen from figure 4.61 that there were two other bands in the
spectrum with a separation of ~100 cm−1, which also had similar shapes and relative
intensities to those observed at 2282 and 2382 cm−1. By manually shifting the
NH3BH3 B–H symmetric stretch to a Raman shift of 2314 cm−1 this correlation can be
better observed, figure 4.62. The two bands at 2314 and 2411 cm−1 correlate well
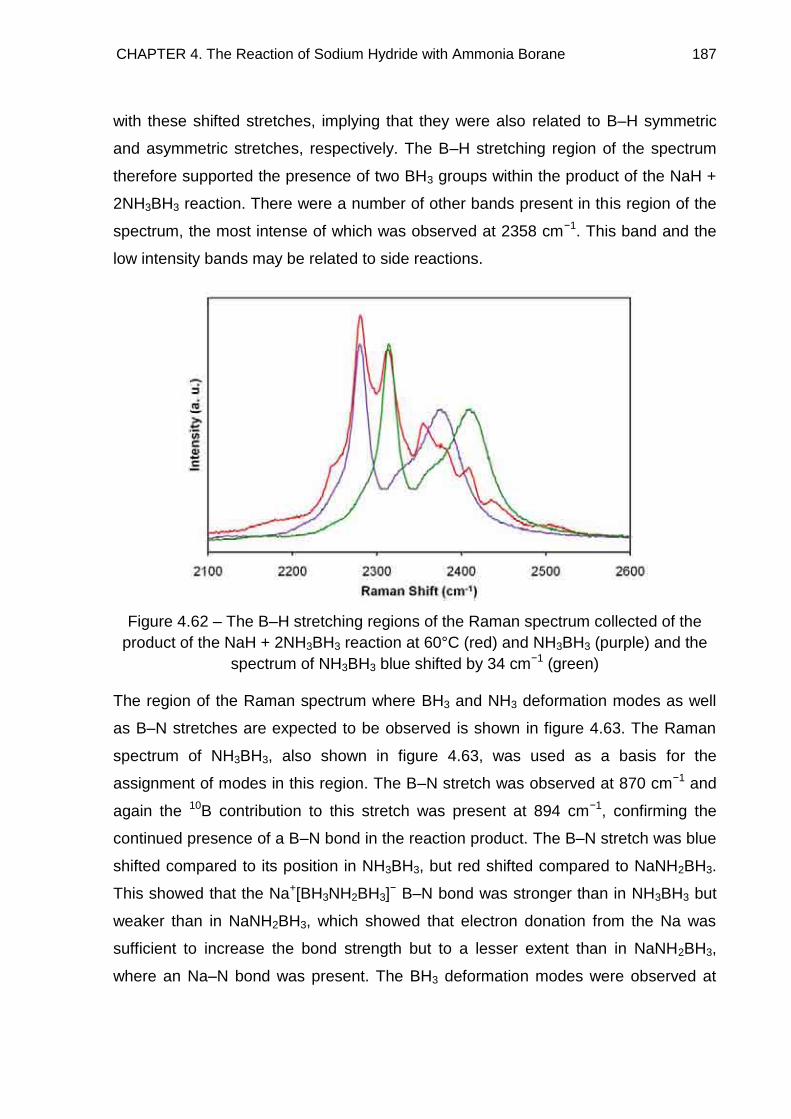
CHAPTER 4. The Reaction of Sodium Hydride with Ammonia Borane 187
with these shifted stretches, implying that they were also related to B–H symmetric
and asymmetric stretches, respectively. The B–H stretching region of the spectrum
therefore supported the presence of two BH3 groups within the product of the NaH +
2NH3BH3 reaction. There were a number of other bands present in this region of the
spectrum, the most intense of which was observed at 2358 cm−1. This band and the
low intensity bands may be related to side reactions.
Figure 4.62 – The B–H stretching regions of the Raman spectrum collected of the
product of the NaH + 2NH3BH3 reaction at 60°C (red) and NH3BH3 (purple) and the
spectrum of NH3BH3 blue shifted by 34 cm−1 (green)
The region of the Raman spectrum where BH3 and NH3 deformation modes as well
as B–N stretches are expected to be observed is shown in figure 4.63. The Raman
spectrum of NH3BH3, also shown in figure 4.63, was used as a basis for the
assignment of modes in this region. The B–N stretch was observed at 870 cm−1 and
again the 10B contribution to this stretch was present at 894 cm−1, confirming the
continued presence of a B–N bond in the reaction product. The B–N stretch was blue
shifted compared to its position in NH3BH3, but red shifted compared to NaNH2BH3.
This showed that the Na+[BH3NH2BH3]− B–N bond was stronger than in NH3BH3 but
weaker than in NaNH2BH3, which showed that electron donation from the Na was
sufficient to increase the bond strength but to a lesser extent than in NaNH2BH3,
where an Na–N bond was present. The BH3 deformation modes were observed at
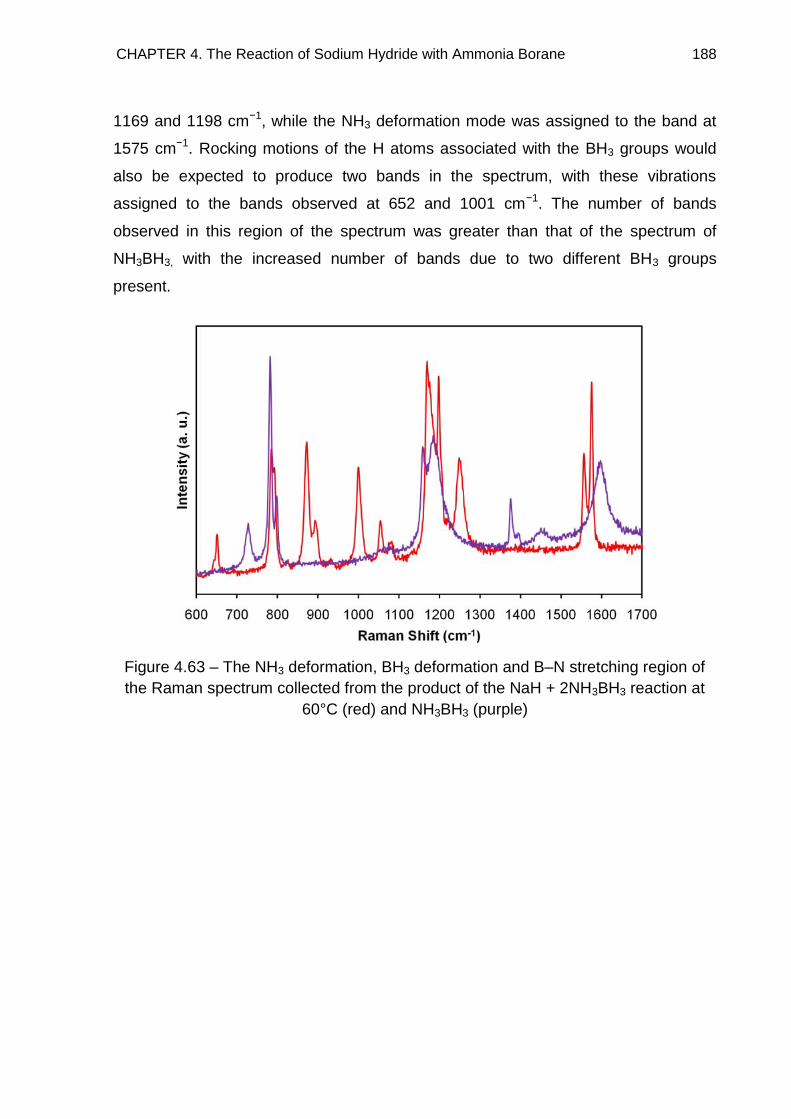
CHAPTER 4. The Reaction of Sodium Hydride with Ammonia Borane 188
1169 and 1198 cm−1, while the NH3 deformation mode was assigned to the band at
1575 cm−1. Rocking motions of the H atoms associated with the BH3 groups would
also be expected to produce two bands in the spectrum, with these vibrations
assigned to the bands observed at 652 and 1001 cm−1. The number of bands
observed in this region of the spectrum was greater than that of the spectrum of
NH3BH3, with the increased number of bands due to two different BH3 groups
present.
Figure 4.63 – The NH3 deformation, BH3 deformation and B–N stretching region of
the Raman spectrum collected from the product of the NaH + 2NH3BH3 reaction at
60°C (red) and NH3BH3 (purple)
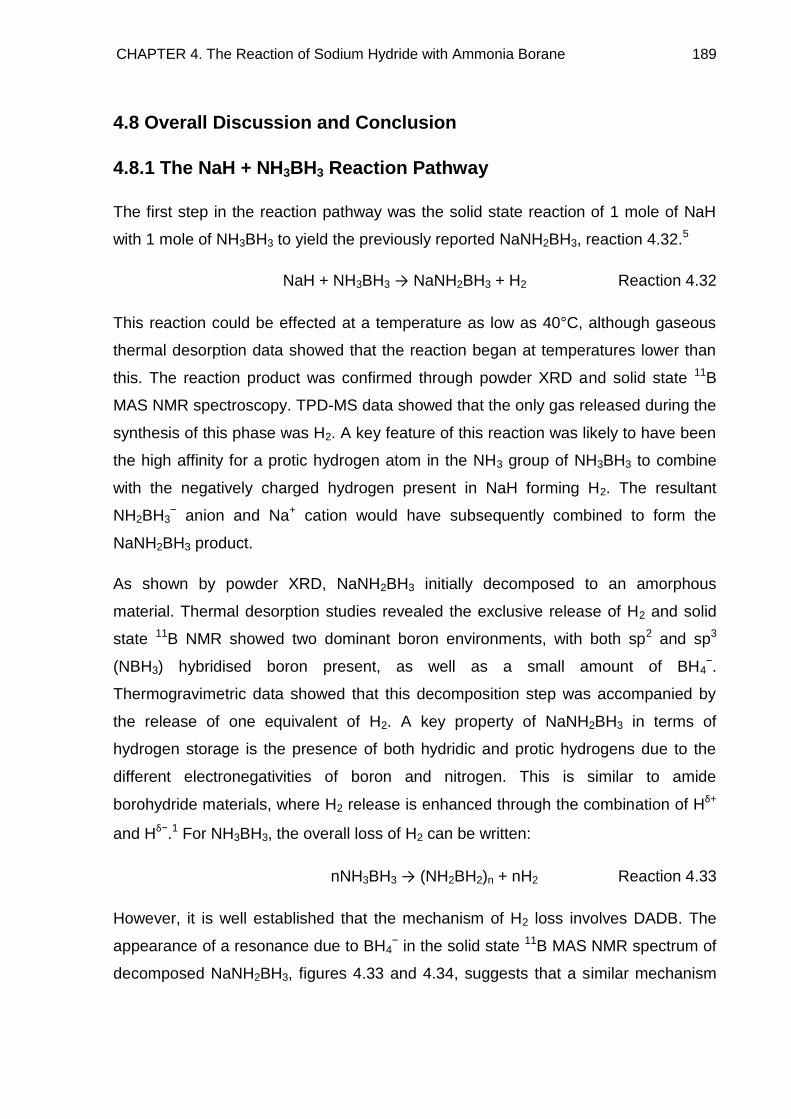
CHAPTER 4. The Reaction of Sodium Hydride with Ammonia Borane 189
4.8 Overall Discussion and Conclusion
4.8.1 The NaH + NH3BH3 Reaction Pathway
The first step in the reaction pathway was the solid state reaction of 1 mole of NaH
with 1 mole of NH3BH3 to yield the previously reported NaNH2BH3, reaction 4.32.5
NaH + NH3BH3 → NaNH2BH3 + H2 Reaction 4.32
This reaction could be effected at a temperature as low as 40°C, although gaseous
thermal desorption data showed that the reaction began at temperatures lower than
this. The reaction product was confirmed through powder XRD and solid state 11B
MAS NMR spectroscopy. TPD-MS data showed that the only gas released during the
synthesis of this phase was H2. A key feature of this reaction was likely to have been
the high affinity for a protic hydrogen atom in the NH3 group of NH3BH3 to combine
with the negatively charged hydrogen present in NaH forming H2. The resultant
NH2BH3− anion and Na+ cation would have subsequently combined to form the
NaNH2BH3 product.
As shown by powder XRD, NaNH2BH3 initially decomposed to an amorphous
material. Thermal desorption studies revealed the exclusive release of H2 and solid
state 11B NMR showed two dominant boron environments, with both sp2 and sp3
(NBH3) hybridised boron present, as well as a small amount of BH4−.
Thermogravimetric data showed that this decomposition step was accompanied by
the release of one equivalent of H2. A key property of NaNH2BH3 in terms of
hydrogen storage is the presence of both hydridic and protic hydrogens due to the
different electronegativities of boron and nitrogen. This is similar to amide
borohydride materials, where H2 release is enhanced through the combination of Hδ+
and Hδ−.1 For NH3BH3, the overall loss of H2 can be written:
nNH3BH3 → (NH2BH2)n + nH2 Reaction 4.33
However, it is well established that the mechanism of H2 loss involves DADB. The
appearance of a resonance due to BH4− in the solid state 11B MAS NMR spectrum of
decomposed NaNH2BH3, figures 4.33 and 4.34, suggests that a similar mechanism
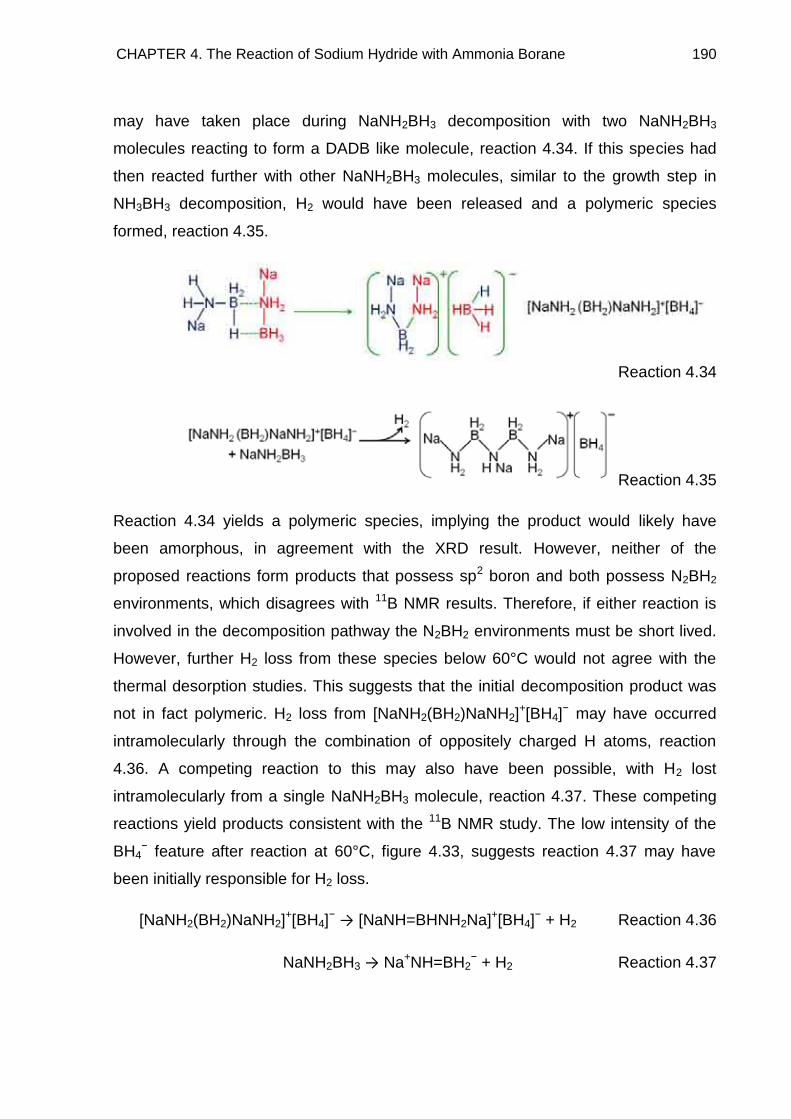
CHAPTER 4. The Reaction of Sodium Hydride with Ammonia Borane 190
may have taken place during NaNH2BH3 decomposition with two NaNH2BH3
molecules reacting to form a DADB like molecule, reaction 4.34. If this species had
then reacted further with other NaNH2BH3 molecules, similar to the growth step in
NH3BH3 decomposition, H2 would have been released and a polymeric species
formed, reaction 4.35.
Reaction 4.34
Reaction 4.35
Reaction 4.34 yields a polymeric species, implying the product would likely have
been amorphous, in agreement with the XRD result. However, neither of the
proposed reactions form products that possess sp2 boron and both possess N2BH2
environments, which disagrees with 11B NMR results. Therefore, if either reaction is
involved in the decomposition pathway the N2BH2 environments must be short lived.
However, further H2 loss from these species below 60°C would not agree with the
thermal desorption studies. This suggests that the initial decomposition product was
not in fact polymeric. H2 loss from [NaNH2(BH2)NaNH2]+[BH4]
− may have occurred
intramolecularly through the combination of oppositely charged H atoms, reaction
4.36. A competing reaction to this may also have been possible, with H2 lost
intramolecularly from a single NaNH2BH3 molecule, reaction 4.37. These competing
reactions yield products consistent with the 11B NMR study. The low intensity of the
BH4− feature after reaction at 60°C, figure 4.33, suggests reaction 4.37 may have
been initially responsible for H2 loss.
[NaNH2(BH2)NaNH2]+[BH4]
− → [NaNH=BHNH2Na]+[BH4]− + H2 Reaction 4.36
NaNH2BH3 → Na+NH=BH2− + H2 Reaction 4.37
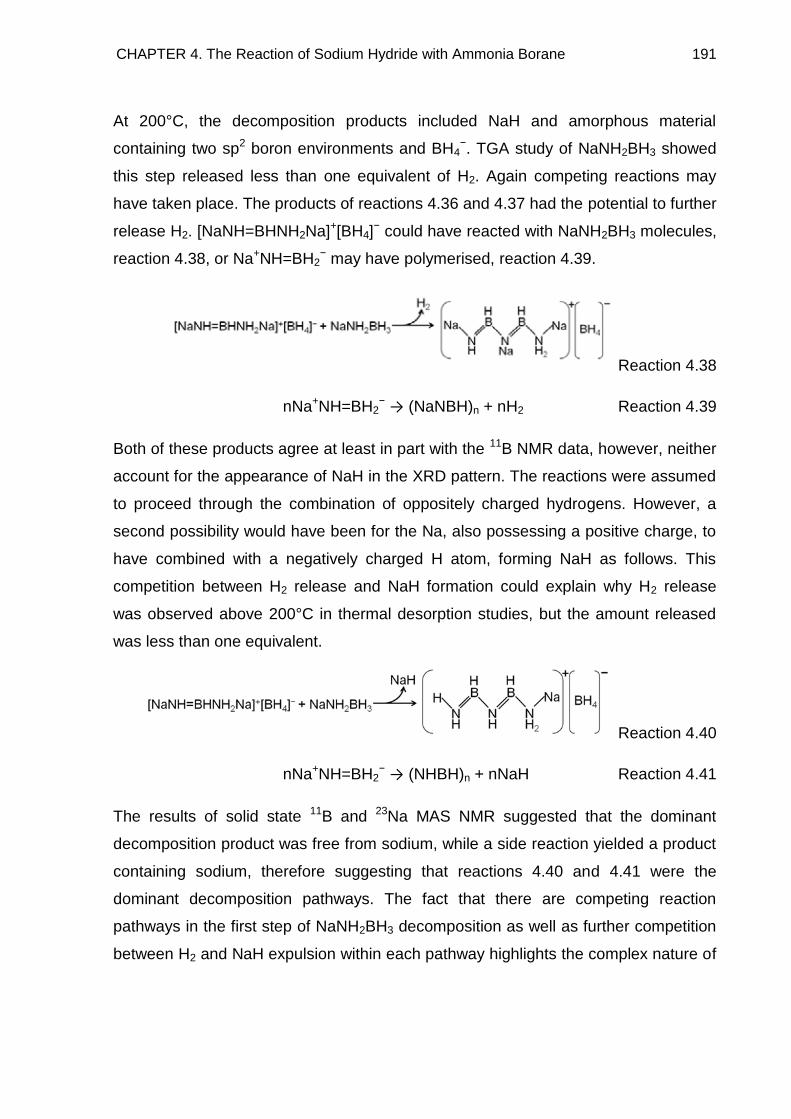
CHAPTER 4. The Reaction of Sodium Hydride with Ammonia Borane 191
At 200°C, the decomposition products included NaH and amorphous material
containing two sp2 boron environments and BH4−. TGA study of NaNH2BH3 showed
this step released less than one equivalent of H2. Again competing reactions may
have taken place. The products of reactions 4.36 and 4.37 had the potential to further
release H2. [NaNH=BHNH2Na]+[BH4]− could have reacted with NaNH2BH3 molecules,
reaction 4.38, or Na+NH=BH2− may have polymerised, reaction 4.39.
Reaction 4.38
nNa+NH=BH2− → (NaNBH)n + nH2 Reaction 4.39
Both of these products agree at least in part with the 11B NMR data, however, neither
account for the appearance of NaH in the XRD pattern. The reactions were assumed
to proceed through the combination of oppositely charged hydrogens. However, a
second possibility would have been for the Na, also possessing a positive charge, to
have combined with a negatively charged H atom, forming NaH as follows. This
competition between H2 release and NaH formation could explain why H2 release
was observed above 200°C in thermal desorption studies, but the amount released
was less than one equivalent.
Reaction 4.40
nNa+NH=BH2− → (NHBH)n + nNaH Reaction 4.41
The results of solid state 11B and 23Na MAS NMR suggested that the dominant
decomposition product was free from sodium, while a side reaction yielded a product
containing sodium, therefore suggesting that reactions 4.40 and 4.41 were the
dominant decomposition pathways. The fact that there are competing reaction
pathways in the first step of NaNH2BH3 decomposition as well as further competition
between H2 and NaH expulsion within each pathway highlights the complex nature of
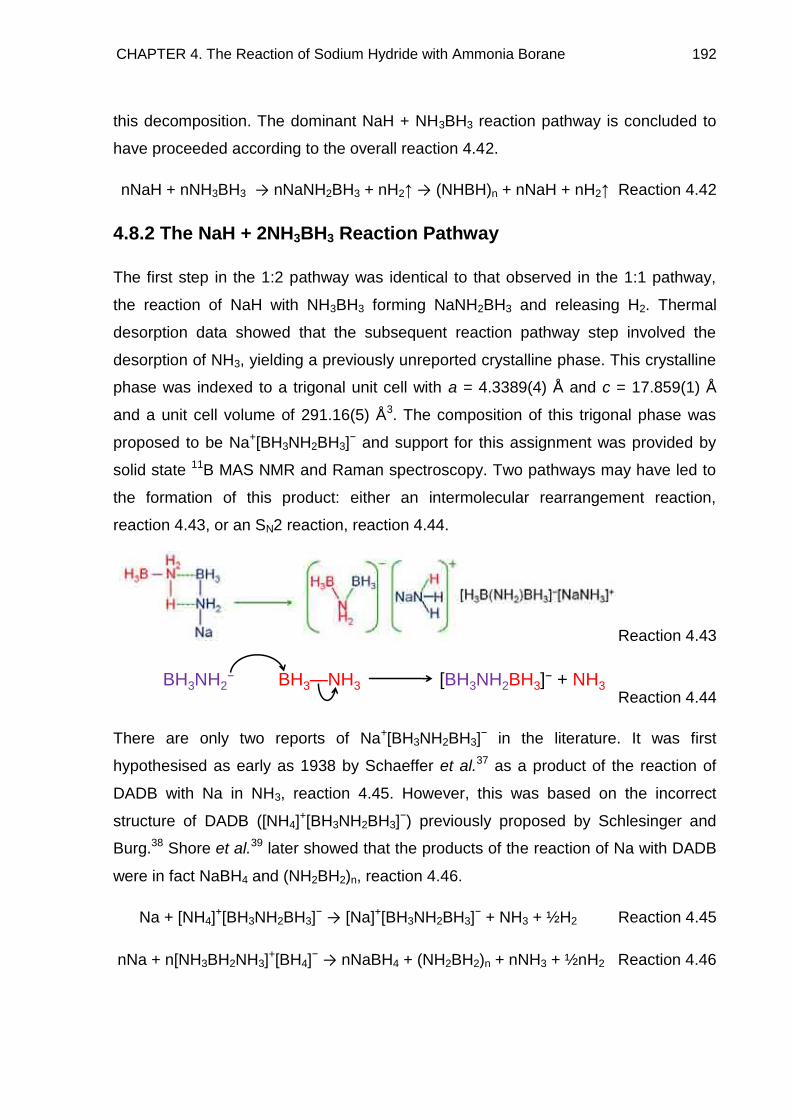
CHAPTER 4. The Reaction of Sodium Hydride with Ammonia Borane 192
this decomposition. The dominant NaH + NH3BH3 reaction pathway is concluded to
have proceeded according to the overall reaction 4.42.
nNaH + nNH3BH3 → nNaNH2BH3 + nH2↑ → (NHBH)n + nNaH + nH2↑ Reaction 4.42
4.8.2 The NaH + 2NH3BH3 Reaction Pathway
The first step in the 1:2 pathway was identical to that observed in the 1:1 pathway,
the reaction of NaH with NH3BH3 forming NaNH2BH3 and releasing H2. Thermal
desorption data showed that the subsequent reaction pathway step involved the
desorption of NH3, yielding a previously unreported crystalline phase. This crystalline
phase was indexed to a trigonal unit cell with a = 4.3389(4) Å and c = 17.859(1) Å
and a unit cell volume of 291.16(5) Å3. The composition of this trigonal phase was
proposed to be Na+[BH3NH2BH3]− and support for this assignment was provided by
solid state 11B MAS NMR and Raman spectroscopy. Two pathways may have led to
the formation of this product: either an intermolecular rearrangement reaction,
reaction 4.43, or an SN2 reaction, reaction 4.44.
Reaction 4.43
Reaction 4.44
There are only two reports of Na+[BH3NH2BH3]− in the literature. It was first
hypothesised as early as 1938 by Schaeffer et al.37 as a product of the reaction of
DADB with Na in NH3, reaction 4.45. However, this was based on the incorrect
structure of DADB ([NH4]+[BH3NH2BH3]
−) previously proposed by Schlesinger and
Burg.38 Shore et al.39 later showed that the products of the reaction of Na with DADB
were in fact NaBH4 and (NH2BH2)n, reaction 4.46.
Na + [NH4]+[BH3NH2BH3]
− → [Na]+[BH3NH2BH3]− + NH3 + ½H2 Reaction 4.45
nNa + n[NH3BH2NH3]+[BH4]
− → nNaBH4 + (NH2BH2)n + nNH3 + ½nH2 Reaction 4.46
BH3NH2− BH3—NH3 [BH3NH2BH3]
− + NH3
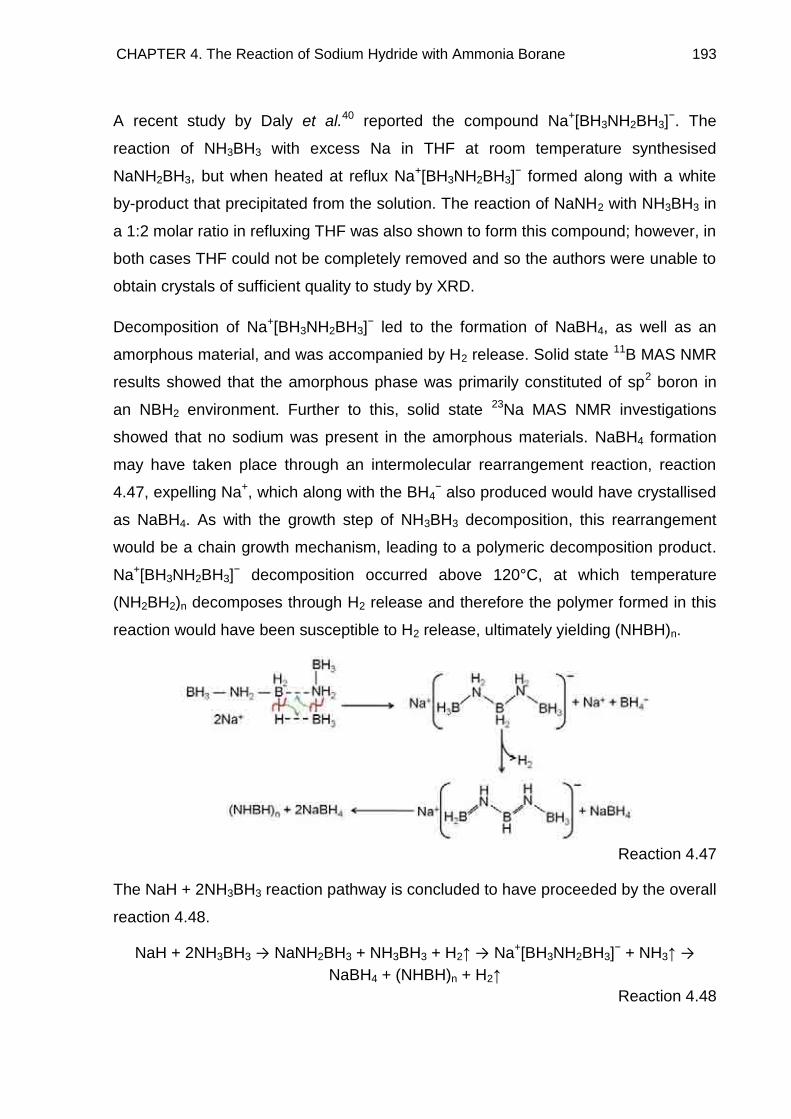
CHAPTER 4. The Reaction of Sodium Hydride with Ammonia Borane 193
A recent study by Daly et al.40 reported the compound Na+[BH3NH2BH3]−. The
reaction of NH3BH3 with excess Na in THF at room temperature synthesised
NaNH2BH3, but when heated at reflux Na+[BH3NH2BH3]− formed along with a white
by-product that precipitated from the solution. The reaction of NaNH2 with NH3BH3 in
a 1:2 molar ratio in refluxing THF was also shown to form this compound; however, in
both cases THF could not be completely removed and so the authors were unable to
obtain crystals of sufficient quality to study by XRD.
Decomposition of Na+[BH3NH2BH3]− led to the formation of NaBH4, as well as an
amorphous material, and was accompanied by H2 release. Solid state 11B MAS NMR
results showed that the amorphous phase was primarily constituted of sp2 boron in
an NBH2 environment. Further to this, solid state 23Na MAS NMR investigations
showed that no sodium was present in the amorphous materials. NaBH4 formation
may have taken place through an intermolecular rearrangement reaction, reaction
4.47, expelling Na+, which along with the BH4− also produced would have crystallised
as NaBH4. As with the growth step of NH3BH3 decomposition, this rearrangement
would be a chain growth mechanism, leading to a polymeric decomposition product.
Na+[BH3NH2BH3]− decomposition occurred above 120°C, at which temperature
(NH2BH2)n decomposes through H2 release and therefore the polymer formed in this
reaction would have been susceptible to H2 release, ultimately yielding (NHBH)n.
Reaction 4.47
The NaH + 2NH3BH3 reaction pathway is concluded to have proceeded by the overall
reaction 4.48.
NaH + 2NH3BH3 → NaNH2BH3 + NH3BH3 + H2↑ → Na+[BH3NH2BH3]− + NH3↑ →
NaBH4 + (NHBH)n + H2↑
Reaction 4.48
CHAPTER 4. The Reaction of Sodium Hydride with Ammonia Borane 194
4.8.3 Potential as Hydrogen Storage Materials
The lower onset temperature of H2 release from NaNH2BH3 (70°C) compared to
Na+[BH3NH2BH3]− (100°C) suggests NaNH2BH3 has more potential as a hydrogen
storage material. However, NaNH2BH3 has a lower hydrogen content (9.5 wt%) than
Na+[BH3NH2BH3]− (12.5 wt%). Thermogravimetric studies also showed that upon
heating to 350°C Na+[BH3NH2BH3]− showed the higher weight loss of 7.5 wt%
compared to 5.25 wt% from NaNH2BH3, with both weight losses due to H2 only. The
use of Na+[BH3NH2BH3]− is, however, complicated by the desorption of NH3 during its
synthesis from NaNH2BH3 and NH3BH3.
A key advantage of NaNH2BH3 is the presence of oppositely charged hydrogens
which aids the desorption of H2 from the material. These oppositely charged
hydrogens are also present in Na+[BH3NH2BH3]−. As shown in reaction 4.47 these
opposite charges were not involved in the initial decomposition step of
Na+[BH3NH2BH3]− but following the formation of polymeric material, H2 release would
have been promoted due to their presence.
As with the parent material NH3BH3, both materials show initial sharp desorptions of
H2. Following this initial release, the broad desorption of H2 observed for NH3BH3 is
avoided. Despite this, the ultimate decomposition products of both NaNH2BH3 and
Na+[BH3NH2BH3]− involve the formation of (NHBH)n, an amorphous polymer, also a
decomposition product of NH3BH3. Therefore, for all three materials the reversibility
of the system is significantly hampered by the rehydriding of (NHBH)n. Furthermore,
the crystalline decomposition products of NaNH2BH3 and Na+[BH3NH2BH3]− are NaH
and NaBH4, respectively. Clearly, these materials cannot be rehydrogenated
individually. In fact the only material that offers the potential for recycling individually
is (NHBH)n. Therefore following the initial dehydrogenation and rehydrogenation
cycle, NaNH2BH3, Na+[BH3NH2BH3]− and NH3BH3 would all lead to NH3BH3 being
regenerated, eliminating the initial advantages that the NaNH2BH3 and
Na+[BH3NH2BH3]− storage systems held over their parent material. In the case of
NaNH2BH3 this may be avoided if the decomposition pathway leading to (NaNBH)n
formation can be promoted, giving the potential for NaNH2BH3 to be regenerated.
This is not a possibility with Na+[BH3NH2BH3]− as all of the Na in the decomposition
CHAPTER 4. The Reaction of Sodium Hydride with Ammonia Borane 195
products is found in the form of NaBH4. However, this does not rule out the possibility
of these materials being able to react with other dehydrogenation products in the
presence of H2. As has been shown NaH reacts with NH3BH3 and so there may be
potential for NaH or NaBH4 to react with the amorphous decomposition products,
yielding sodium containing products, which could offer the storage system a
recyclable pathway.
CHAPTER 4. The Reaction of Sodium Hydride with Ammonia Borane 196
4.9 References
1. Chater, P. A.; Anderson, P. A.; Prendergast, J. W.; Walton, A.; Mann, V. S. J.;
Book, D.; David, W. I. F.; Johnson, S. R.; Edwards, P. P., Synthesis and
characterisation of amide-borohydrides: New complex light hydrides for potential
hydrogen storage. Journal of Alloys and Compounds 2007, 446–447, 350–354.
2. Autrey, T.; Luedtke, A., Hydrogen release studies of alkali metal
amidoboranes. Inorganic Chemistry 2010, 49, 3905–3910.
3. Xiong, Z.; Wu, G.; Chua, Y. S.; Hu, J.; He, T.; Xu, W.; Chen, P., Synthesis of
sodium amidoborane (NaNH2BH3) for hydrogen production. Energy and
Environmental Science 2008, 1, 360–363.
4. Fijalkowski, K. J.; Grochala, W., Substantial emission of NH3 during thermal
decomposition of sodium amidoborane, NaNH2BH3. Journal of Materials Chemistry
2009, 19, 2043-2050.
5. Xiong, Z.; Yong, C. K.; Wu, G.; Chen, P.; Shaw, W. J.; Karkamkar, A.; Autrey,
T.; Jones, M. O.; Johnson, S. R.; Edwards, P. P.; David, W. I. F., High-capacity
hydrogen storage in lithium and sodium amidoboranes. Nature Materials 2008, 7,
138–141.
6. Zuttel, A.; Wenger, P.; Rentsch, S.; Sudan, P.; Mauron, P.; Emmenegger, C.,
LiBH4 a new hydrogen storage material. Journal of Power Sources 2003, 118, 1-7.
7. Orimo, S.; Nakamori, Y.; Züttel, A., Material properties of MBH4 (M = Li, Na
and K). Materials Science and Engineering 2004, B108, 51–53.
8. Mao, J. F.; Yu, X. B.; Guo, Z. P.; Poh, C. K.; Liu, H. K.; Wu, Z.; Ni, J.,
Improvement of the LiAlH4-NaBH4 system for reversible hydrogen storage. Journal Of
Physical Chemistry C 2009, 113, 10813–10818.
9. Mao, J. F.; Yu, X. B.; Guo, Z. P.; Liu, H. K.; Wu, Z.; Ni, J., Enhanced hydrogen
storage performances of NaBH4–MgH2 system. Journal of Alloys and Compounds
2009, 479, 619–623.
10. Burrell, A. K., Los Alamos National Laboratory. Personal Communication.
11. Coelho, A. A. Topas, General Profile and Structure Analysis Software for
Powder Diffraction Data, Bruker AXS, Karlsruhe, Germany, 3rd edition: 2004.
12. Stephens, P. W., Phenomenological model of anisotropic peak broadening in
powder diffraction. Journal of Applied Crystallography 1999, 32, 281–289.
13. Filinchuk, Y.; Hagemann, H., Structure and properties of NaBH4.2H2O and
NaBH4. European Journal of Inorganic Chemistry 2008, 20, 3127-3133.
CHAPTER 4. The Reaction of Sodium Hydride with Ammonia Borane 197
14. Wu, H.; Zhou, W.; Yildirim, T., Alkali and alkaline-earth metal amidoboranes:
Structure, crystal chemistry, and hydrogen storage properties. Journal of the
American Chemical Society 2008, 130, 14834–14839.
15. Bowden, M. E.; Gainsford, G. J.; Robinson, W. T., The room temperature
structure of ammonia borane. Australian Journal of Chemistry 2007, 60, 149–153.
16. Shull, C. G.; Wollan, E. O.; Morton, G. A.; Davidson, W. L., Neutron diffraction
studies of NaH and NaD. Physical Review 1948, 73, 842–847.
17. Nagib, M.; Kistrup, H.; Jacobs, H., Neutron diffraction by sodium-
deuteroamide, NaND2. Atomkernenergie 1975, 26, 87–90.
18. Bowden, M. E.; Autrey, T.; Brown, I.; Ryan, M., The thermal decomposition of
ammonia borane: A potential hydrogen storage material. Current Applied Physics
2008, 8, 498–500.
19. Stowe, A. C.; Shaw, W. J.; Linehan, J. C.; Schmid, B.; Autrey, T., In situ solid
state 11B MAS-NMR studies of the thermal decomposition of ammonia borane:
mechanistic studies of the hydrogen release pathways from a solid state hydrogen
storage material. Physical Chemistry Chemical Physics 2007, 9, 1831–1836.
20. Mayer, E., Symmetrical cleavage of diborane by ammonia in solution.
Inorganic Chemistry 1972, 11, 866–869.
21. Bluhm, M. E.; Bradley, M. G.; Butterick III, R.; Kusari, U.; Sneddon, L. G.,
Amineborane-based chemical hydrogen storage: Enhanced ammonia borane
dehydrogenation in ionic liquids. Journal of the American Chemical Society 2006,
128, 7748–7749.
22. Miller, A. J. M.; Bercaw, J. E., Dehydrogenation of amine–boranes with a
frustrated Lewis pair. Chemical Communications 2010, 46, 1709–1711.
23. Gervais, C.; Babonneau, F., High resolution solid state NMR investigation of
various boron nitride preceramic polymers. Journal of Organometallic Chemistry
2002, 657, 75–82.
24. Gervais, C.; Framery, E.; Duriez, C.; Maquet, J.; Vaultier, M.; Babonneau, F., 11B and 15N solid state NMR investigation of a boron nitride preceramic polymer
prepared by ammonolysis of borazine. Journal of the European Ceramic Society
2005, 25, 129–135.
25. Hwang, S.-J.; Bowman Jr, R. C.; Reiter, J. W.; Rijssenbeek, J.; Soloveichik, G.
L.; Zhao, J.-C.; Kabbour, H.; Ahn, C. C., NMR confirmation for formation of [B12H12]2−
complexes during hydrogen desorption from metal borohydrides. The Journal of
Physical Chemistry C 2008, 112, 3164–3169.
CHAPTER 4. The Reaction of Sodium Hydride with Ammonia Borane 198
26. Marchetti, P. S.; Kwon, D.; Schmidt, W. R.; Interrante, L. V.; Maciel, G. E.,
High-field 11B Magic-Angle Spinning NMR characterization of boron nitrides.
Chemistry of Materials 1991, 3, 482–486.
27. Gervais, C.; Maquet, J.; Babonneau, F.; Duriez, C.; Framery, E.; Vaultier, M.;
Florian, P.; Massiot, D., Chemically derived BN ceramics: Extensive 11B and 15N
solid-state NMR study of a preceramic polyborazilene. Chemistry of Materials 2001,
13, 1700–1707.
28. Jeschke, G.; Hoffbauer, W.; Jansen, M., A comprehensive NMR study of cubic
and hexagonal boron nitride. Solid State Nuclear Magnetic Resonance 1998, 12, 1–
7.
29. Kim, D.; Moon, K.; Kho, J.; Economy, J.; Gervais, C.; Babonneau, F.,
Synthesis and characterization of poly(aminoborane) as a new boron nitride
precursor. Polymers for Advanced Technologies 1999, 10, 702–712.
30. Schlesinger, H. I.; Brown, H. C.; Hoekstra, H. R.; Rapp, L. R., Reactions of
diborane with alkali metal hydrides and their addition compounds. New synthesis of
borohydrides. Sodium and potassium borohydrides. Journal of the American
Chemical Society 1953, 75, 199–204.
31. Martelli, P.; Caputo, R.; Remhof, A.; Mauron, P.; Borgschulte, A.; Züttel, A.,
Stability and decomposition of NaBH4. Journal of Physical Chemistry C 2010, 114,
7173–7177.
32. Züttel, A.; Rentsch, S.; Fischer, P.; Wenger, P.; Sudan, P.; Mauron, P.;
Emmenegger, C., Hydrogen storage properties of LiBH4. Journal of Alloys and
Compounds 2003, 356-357, 515–520.
33. Filinchuk, Y. E.; Rönnebro, E.; Chandra, D., Crystal structures and phase
transformations in Ca(BH4)2. Acta Materialia 2009, 57, 732–738.
34. Urgnani, J.; Torres, F. J.; Palumbo, M.; Baricco, M., Hydrogen release from
solid state NaBH4. International Journal of Hydrogen Energy 2008, 33, 3111–3115.
35. Cunningham, P. T.; Maroni, V. T., Laser Raman spectra of solid and molten
NaNH2: Evidence for hindered rotation of the NH2− ion. The Journal of Chemical
Physics 1972, 57, 1415–1418.
36. Renaudin, G.; Gomes, S.; Hagemann, H.; Keller, L.; Yvon, K., Structural and
spectroscopic studies on the alkali borohydrides MBH4 (M = Na, K, Rb, Cs). Journal
of Alloys and Compounds 2004, 375, 98–106.
37. Schaeffer, G. W.; Adams, M. D.; Koenig, F. J., On the alkali metal salts
derived from the diammoniate of diborane. Journal of the American Chemical Society
1956, 78, 725–728.
CHAPTER 4. The Reaction of Sodium Hydride with Ammonia Borane 199
38. Schlesinger, H. I.; Burg, A. B., Hydrides of boron. VIII. The structure of the
diammoniate of diborane and its relation to the structure of diborane. Journal of the
American Chemical Society 1938, 60, 290–299.
39. Shore, S. G.; Girardot, P. R.; Parry, R. W., Chemical evidence for the structure
of the "Diammoniate of Diborane." V. A tracer study of the reaction between sodium
and the "Diammoniate of Diborane". Journal of the American Chemical Society 1958,
80, 20–24.
40. Daly, S. R.; Bellott, B. J.; Kim, D. Y.; Girolami, G. S., Synthesis of the long
sought unsubstituted aminodiboranate Na(H3BNH2BH3) and its N-Alkyl analogs.
Journal of the American Chemical Society 2010, 132, 7254–7255.
200
Chapter 5
The Reaction of Lithium Hydride
with Ammonia Borane
5.1 Introduction
At the commencement of this research there had been no reported investigations into
the interaction of lithium hydride with ammonia borane. This investigation was initially
focused on the attempted synthesis of Li2BH4NH2, a previously reported material.1
The reaction mixture of LiH and NH3BH3 in a molar ratio of 2:1 left excess LiH at the
end of the experiment. The 1:1 reaction mixture also resulted in the formation of a
product which was contaminated with the LiH starting material. A stoichiometry of 1:2
in favour of NH3BH3 was subsequently found to be required to yield a crystalline
product free from starting materials. This new tetragonal crystalline phase differed
from Li2BH4NH2. The hydrogen desorption properties of this material were
investigated and spectroscopic characterisation carried out.
5.2 Experimental
Lithium hydride (Sigma-Aldrich, 95% purity) and ammonia borane (Sigma-Aldrich,
97% purity) were ground together in a 1:2 molar ratio in an argon filled glove box
(>10 ppm O2, >1 ppm H2O), and heated under a flowing argon atmosphere at 50°C.
The sample was reground and annealed at 50°C to improve the crystallinity of the
product.

CHAPTER 5. The Reaction of Lithium Hydride with Ammonia Borane 201
The synthesis of LiNH2BH3 was attempted through the reaction of LiNH2 (Sigma-
Aldrich, 95% purity) and NH3BH3 (Sigma-Aldrich, 97% purity) in a 1:1 molar ratio. The
reagents were mixed together in an argon filled glove box (>10 ppm O2, >1 ppm
H2O). The nature of the reaction dictated that the reagents could not be ground
together, because the reaction mixture became wet upon mixing and took several
hours to dry under ambient conditions in the glove box.
5.3. Powder X-Ray Diffraction
Powder XRD patterns were collected for the products following the heating of the
reaction mixture. It was found that a new crystalline phase formed at a temperature
of 50°C, which was collected as a white powder at the end of the experiment. No
reports of this phase had previously appeared in the literature. The powder XRD
pattern of this phase is shown in figure 5.1.
Figure 5.1 – The powder XRD pattern collected from the product of the reaction of
LiH + 2NH3BH3 at 50°C
Higher temperature reactions showed that this phase persisted up to a temperature
of 120°C. At reaction temperatures above 120°C no crystalline phases were
observed in the powder XRD pattern, showing that only amorphous phases
remained. The ultimate decomposition product of the reaction was investigated using
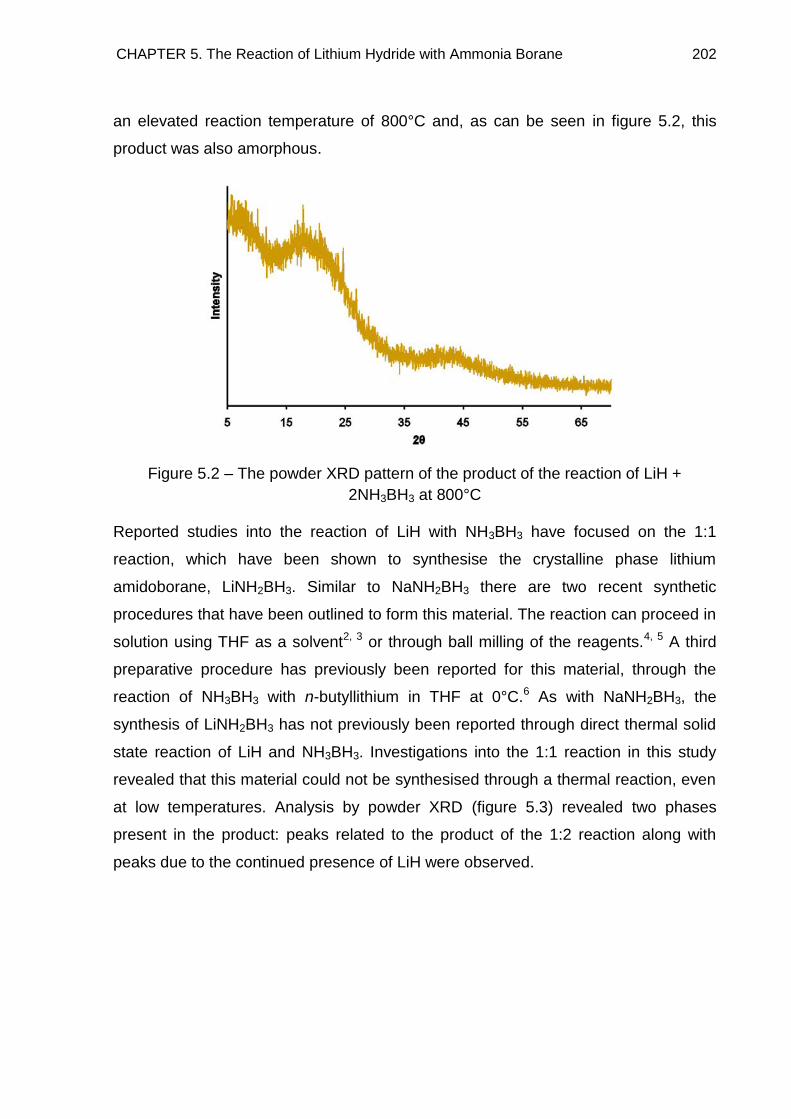
CHAPTER 5. The Reaction of Lithium Hydride with Ammonia Borane 202
an elevated reaction temperature of 800°C and, as can be seen in figure 5.2, this
product was also amorphous.
Figure 5.2 – The powder XRD pattern of the product of the reaction of LiH +
2NH3BH3 at 800°C
Reported studies into the reaction of LiH with NH3BH3 have focused on the 1:1
reaction, which have been shown to synthesise the crystalline phase lithium
amidoborane, LiNH2BH3. Similar to NaNH2BH3 there are two recent synthetic
procedures that have been outlined to form this material. The reaction can proceed in
solution using THF as a solvent2, 3 or through ball milling of the reagents.4, 5 A third
preparative procedure has previously been reported for this material, through the
reaction of NH3BH3 with n-butyllithium in THF at 0°C.6 As with NaNH2BH3, the
synthesis of LiNH2BH3 has not previously been reported through direct thermal solid
state reaction of LiH and NH3BH3. Investigations into the 1:1 reaction in this study
revealed that this material could not be synthesised through a thermal reaction, even
at low temperatures. Analysis by powder XRD (figure 5.3) revealed two phases
present in the product: peaks related to the product of the 1:2 reaction along with
peaks due to the continued presence of LiH were observed.
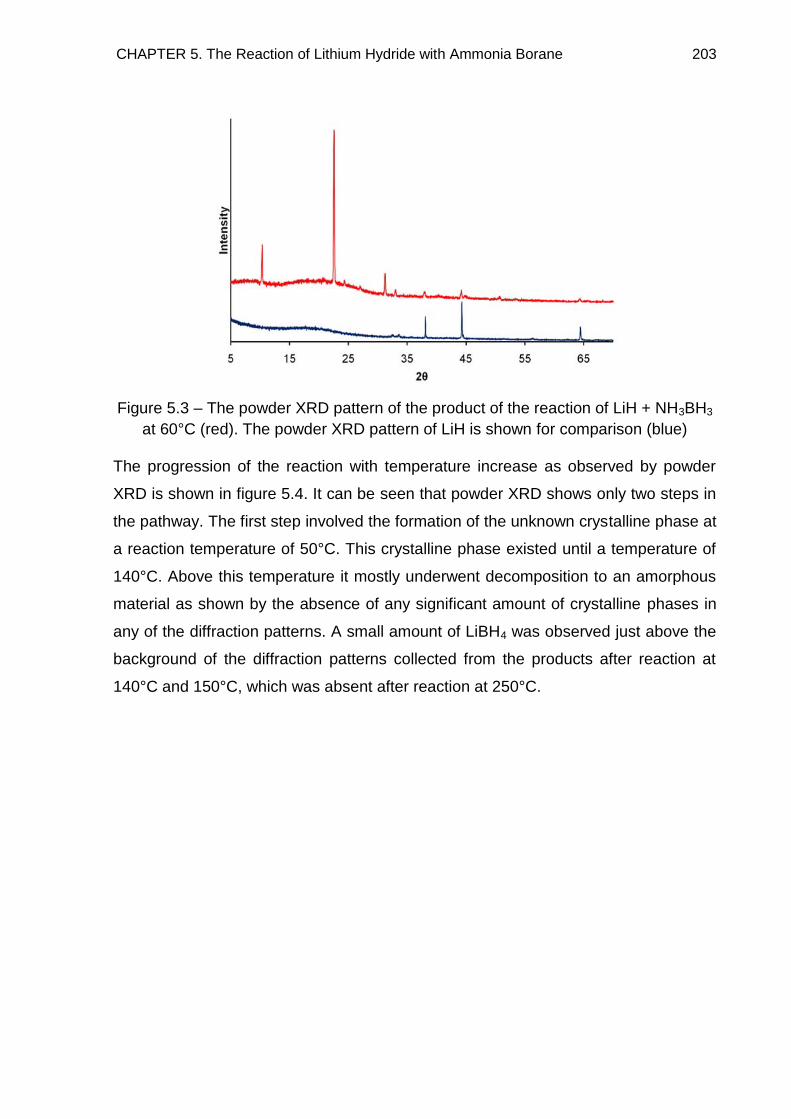
CHAPTER 5. The Reaction of Lithium Hydride with Ammonia Borane 203
Figure 5.3 – The powder XRD pattern of the product of the reaction of LiH + NH3BH3
at 60°C (red). The powder XRD pattern of LiH is shown for comparison (blue)
The progression of the reaction with temperature increase as observed by powder
XRD is shown in figure 5.4. It can be seen that powder XRD shows only two steps in
the pathway. The first step involved the formation of the unknown crystalline phase at
a reaction temperature of 50°C. This crystalline phase existed until a temperature of
140°C. Above this temperature it mostly underwent decomposition to an amorphous
material as shown by the absence of any significant amount of crystalline phases in
any of the diffraction patterns. A small amount of LiBH4 was observed just above the
background of the diffraction patterns collected from the products after reaction at
140°C and 150°C, which was absent after reaction at 250°C.
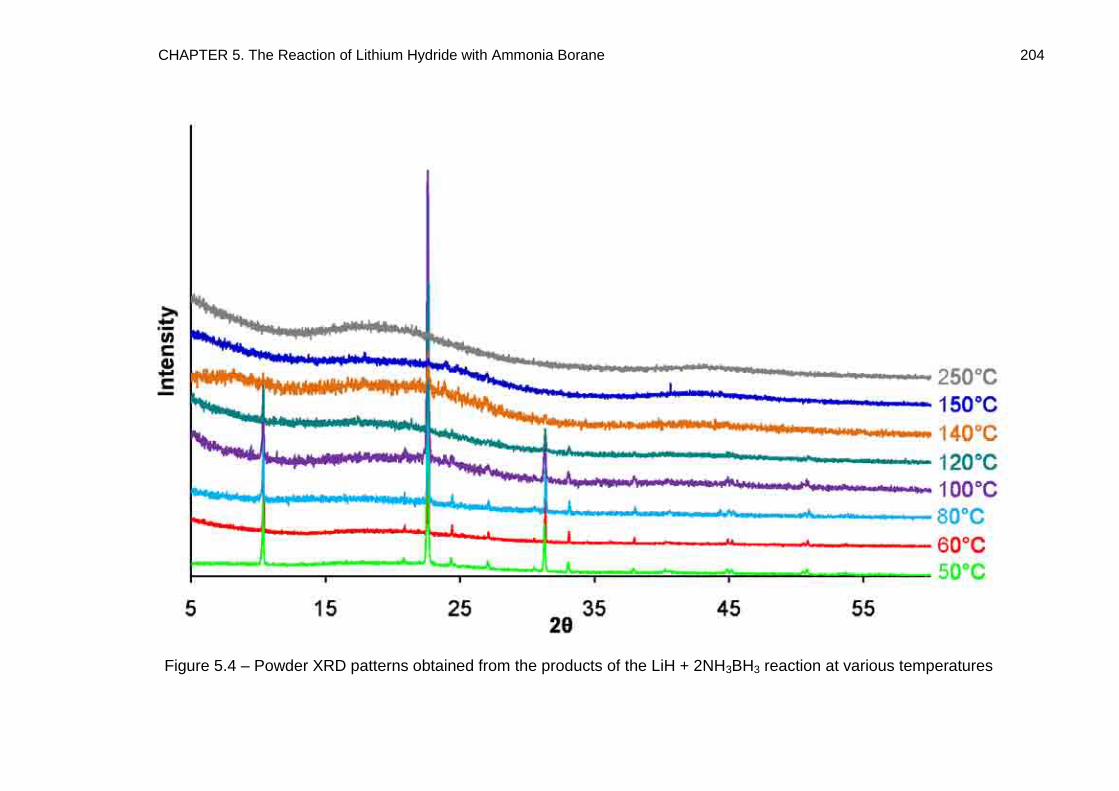
CHAPTER 5. The Reaction of Lithium Hydride with Ammonia Borane 204
Figure 5.4 – Powder XRD patterns obtained from the products of the LiH + 2NH3BH3 reaction at various temperatures
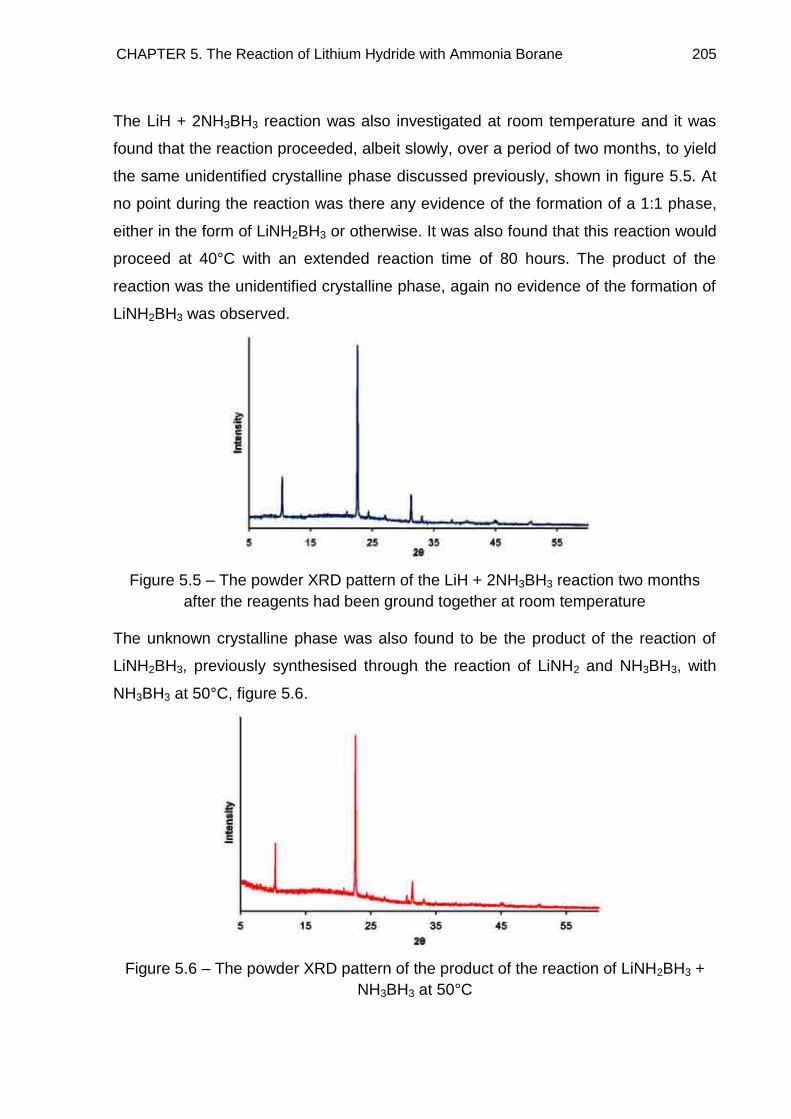
CHAPTER 5. The Reaction of Lithium Hydride with Ammonia Borane 205
The LiH + 2NH3BH3 reaction was also investigated at room temperature and it was
found that the reaction proceeded, albeit slowly, over a period of two months, to yield
the same unidentified crystalline phase discussed previously, shown in figure 5.5. At
no point during the reaction was there any evidence of the formation of a 1:1 phase,
either in the form of LiNH2BH3 or otherwise. It was also found that this reaction would
proceed at 40°C with an extended reaction time of 80 hours. The product of the
reaction was the unidentified crystalline phase, again no evidence of the formation of
LiNH2BH3 was observed.
Figure 5.5 – The powder XRD pattern of the LiH + 2NH3BH3 reaction two months
after the reagents had been ground together at room temperature
The unknown crystalline phase was also found to be the product of the reaction of
LiNH2BH3, previously synthesised through the reaction of LiNH2 and NH3BH3, with
NH3BH3 at 50°C, figure 5.6.
Figure 5.6 – The powder XRD pattern of the product of the reaction of LiNH2BH3 +
NH3BH3 at 50°C
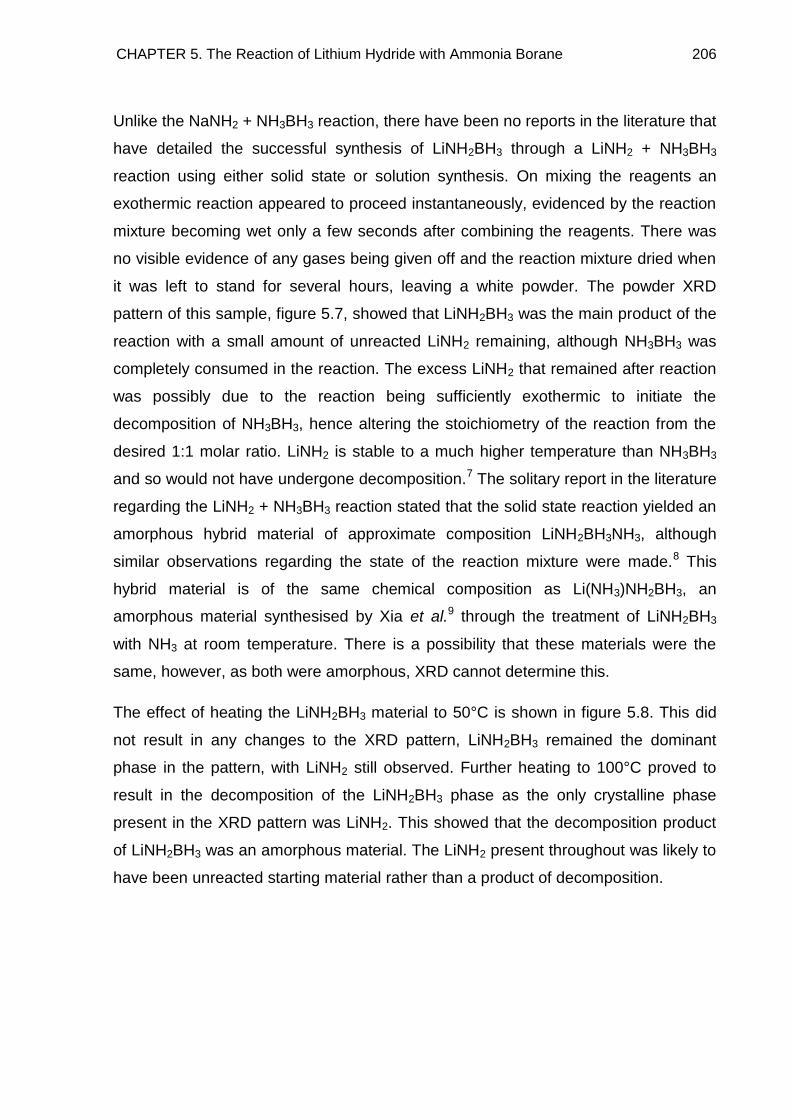
CHAPTER 5. The Reaction of Lithium Hydride with Ammonia Borane 206
Unlike the NaNH2 + NH3BH3 reaction, there have been no reports in the literature that
have detailed the successful synthesis of LiNH2BH3 through a LiNH2 + NH3BH3
reaction using either solid state or solution synthesis. On mixing the reagents an
exothermic reaction appeared to proceed instantaneously, evidenced by the reaction
mixture becoming wet only a few seconds after combining the reagents. There was
no visible evidence of any gases being given off and the reaction mixture dried when
it was left to stand for several hours, leaving a white powder. The powder XRD
pattern of this sample, figure 5.7, showed that LiNH2BH3 was the main product of the
reaction with a small amount of unreacted LiNH2 remaining, although NH3BH3 was
completely consumed in the reaction. The excess LiNH2 that remained after reaction
was possibly due to the reaction being sufficiently exothermic to initiate the
decomposition of NH3BH3, hence altering the stoichiometry of the reaction from the
desired 1:1 molar ratio. LiNH2 is stable to a much higher temperature than NH3BH3
and so would not have undergone decomposition.7 The solitary report in the literature
regarding the LiNH2 + NH3BH3 reaction stated that the solid state reaction yielded an
amorphous hybrid material of approximate composition LiNH2BH3NH3, although
similar observations regarding the state of the reaction mixture were made.8 This
hybrid material is of the same chemical composition as Li(NH3)NH2BH3, an
amorphous material synthesised by Xia et al.9 through the treatment of LiNH2BH3
with NH3 at room temperature. There is a possibility that these materials were the
same, however, as both were amorphous, XRD cannot determine this.
The effect of heating the LiNH2BH3 material to 50°C is shown in figure 5.8. This did
not result in any changes to the XRD pattern, LiNH2BH3 remained the dominant
phase in the pattern, with LiNH2 still observed. Further heating to 100°C proved to
result in the decomposition of the LiNH2BH3 phase as the only crystalline phase
present in the XRD pattern was LiNH2. This showed that the decomposition product
of LiNH2BH3 was an amorphous material. The LiNH2 present throughout was likely to
have been unreacted starting material rather than a product of decomposition.
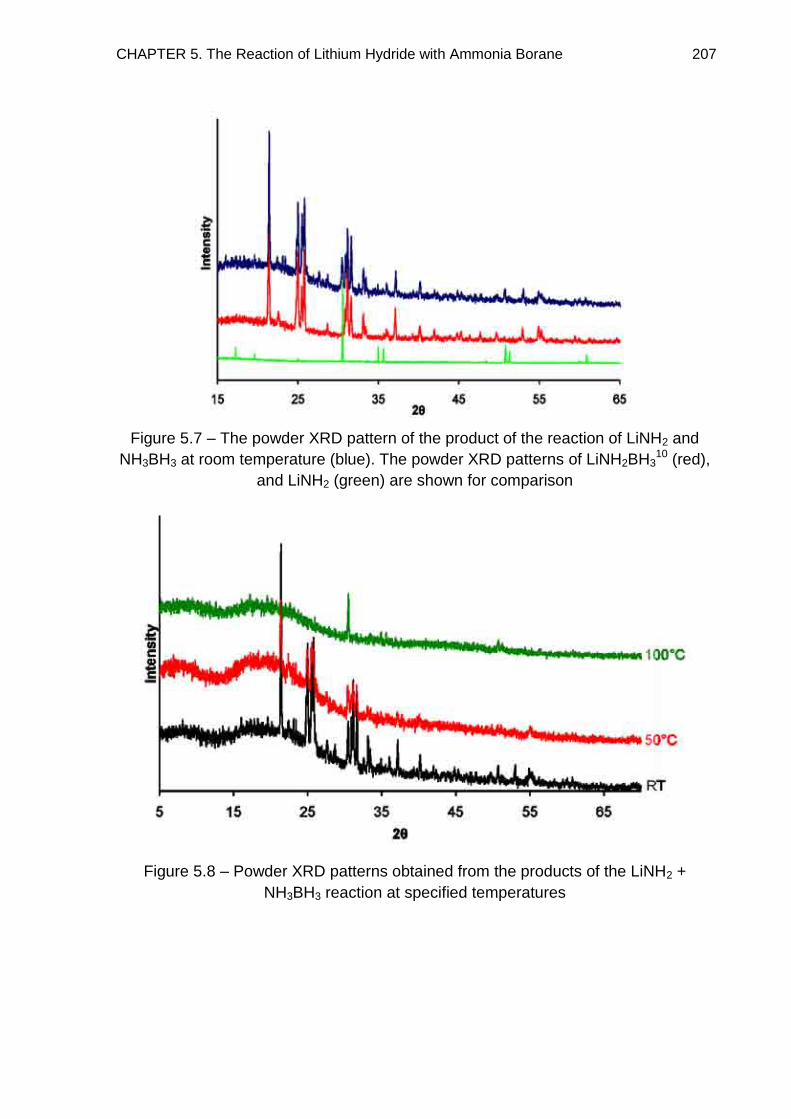
CHAPTER 5. The Reaction of Lithium Hydride with Ammonia Borane 207
Figure 5.7 – The powder XRD pattern of the product of the reaction of LiNH2 and
NH3BH3 at room temperature (blue). The powder XRD patterns of LiNH2BH310 (red),
and LiNH2 (green) are shown for comparison
Figure 5.8 – Powder XRD patterns obtained from the products of the LiNH2 +
NH3BH3 reaction at specified temperatures
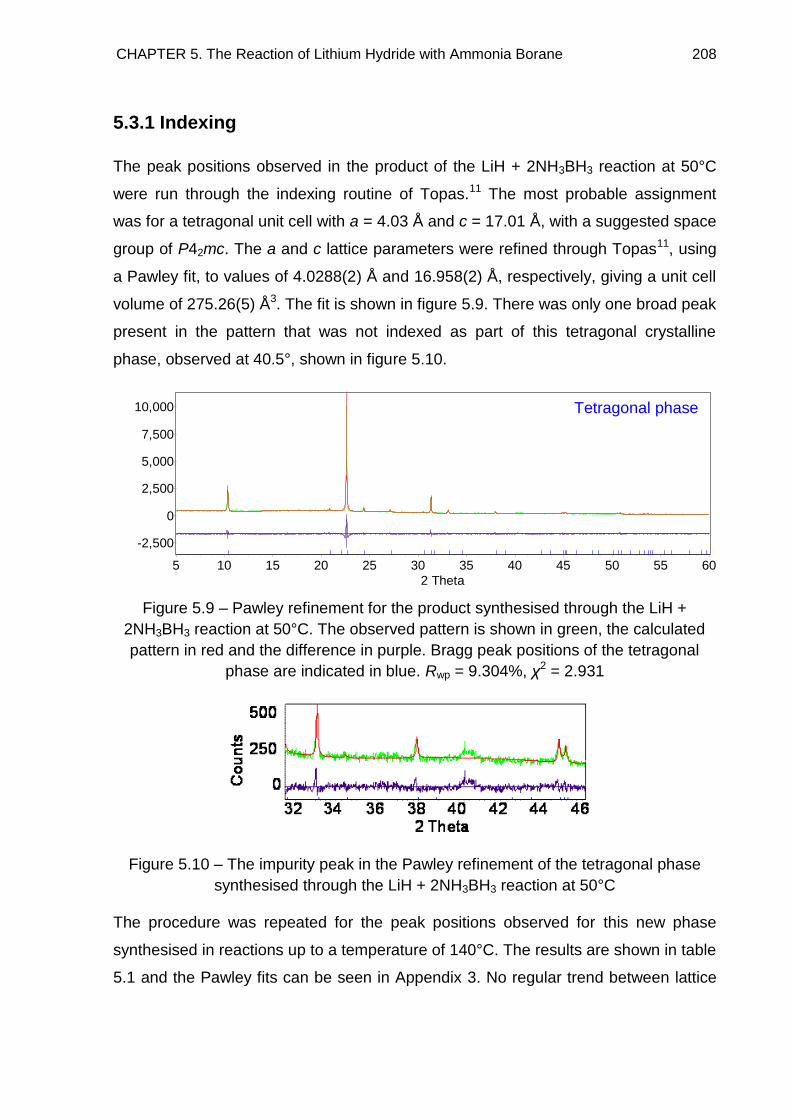
CHAPTER 5. The Reaction of Lithium Hydride with Ammonia Borane 208
5.3.1 Indexing
The peak positions observed in the product of the LiH + 2NH3BH3 reaction at 50°C
were run through the indexing routine of Topas.11 The most probable assignment
was for a tetragonal unit cell with a = 4.03 Å and c = 17.01 Å, with a suggested space
group of P42mc. The a and c lattice parameters were refined through Topas11, using
a Pawley fit, to values of 4.0288(2) Å and 16.958(2) Å, respectively, giving a unit cell
volume of 275.26(5) Å3. The fit is shown in figure 5.9. There was only one broad peak
present in the pattern that was not indexed as part of this tetragonal crystalline
phase, observed at 40.5°, shown in figure 5.10.
Figure 5.9 – Pawley refinement for the product synthesised through the LiH +
2NH3BH3 reaction at 50°C. The observed pattern is shown in green, the calculated
pattern in red and the difference in purple. Bragg peak positions of the tetragonal
phase are indicated in blue. Rwp = 9.304%, χ2 = 2.931
Figure 5.10 – The impurity peak in the Pawley refinement of the tetragonal phase
synthesised through the LiH + 2NH3BH3 reaction at 50°C
The procedure was repeated for the peak positions observed for this new phase
synthesised in reactions up to a temperature of 140°C. The results are shown in table
5.1 and the Pawley fits can be seen in Appendix 3. No regular trend between lattice
2 Theta
60555045403530252015105
Co
un
ts
10,000
7,500
5,000
2,500
0
-2,500
Tet Li 0.00 %
Tetragonal phase
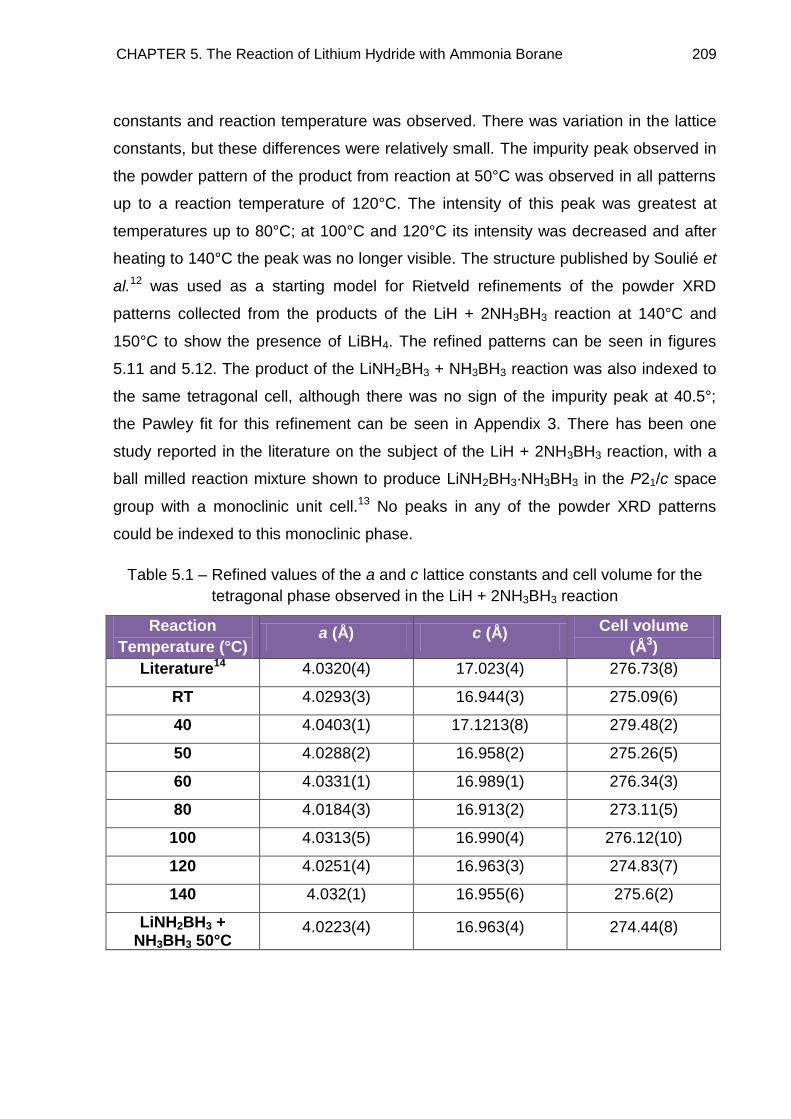
CHAPTER 5. The Reaction of Lithium Hydride with Ammonia Borane 209
constants and reaction temperature was observed. There was variation in the lattice
constants, but these differences were relatively small. The impurity peak observed in
the powder pattern of the product from reaction at 50°C was observed in all patterns
up to a reaction temperature of 120°C. The intensity of this peak was greatest at
temperatures up to 80°C; at 100°C and 120°C its intensity was decreased and after
heating to 140°C the peak was no longer visible. The structure published by Soulié et
al.12 was used as a starting model for Rietveld refinements of the powder XRD
patterns collected from the products of the LiH + 2NH3BH3 reaction at 140°C and
150°C to show the presence of LiBH4. The refined patterns can be seen in figures
5.11 and 5.12. The product of the LiNH2BH3 + NH3BH3 reaction was also indexed to
the same tetragonal cell, although there was no sign of the impurity peak at 40.5°;
the Pawley fit for this refinement can be seen in Appendix 3. There has been one
study reported in the literature on the subject of the LiH + 2NH3BH3 reaction, with a
ball milled reaction mixture shown to produce LiNH2BH3·NH3BH3 in the P21/c space
group with a monoclinic unit cell.13 No peaks in any of the powder XRD patterns
could be indexed to this monoclinic phase.
Table 5.1 – Refined values of the a and c lattice constants and cell volume for the
tetragonal phase observed in the LiH + 2NH3BH3 reaction
Reaction
Temperature (°C) a (Å) c (Å) Cell volume
(Å3)
Literature14 4.0320(4) 17.023(4) 276.73(8)
RT 4.0293(3) 16.944(3) 275.09(6)
40 4.0403(1) 17.1213(8) 279.48(2)
50 4.0288(2) 16.958(2) 275.26(5)
60 4.0331(1) 16.989(1) 276.34(3)
80 4.0184(3) 16.913(2) 273.11(5)
100 4.0313(5) 16.990(4) 276.12(10)
120 4.0251(4) 16.963(3) 274.83(7)
140 4.032(1) 16.955(6) 275.6(2)
LiNH2BH3 + NH3BH3 50°C
4.0223(4) 16.963(4) 274.44(8)
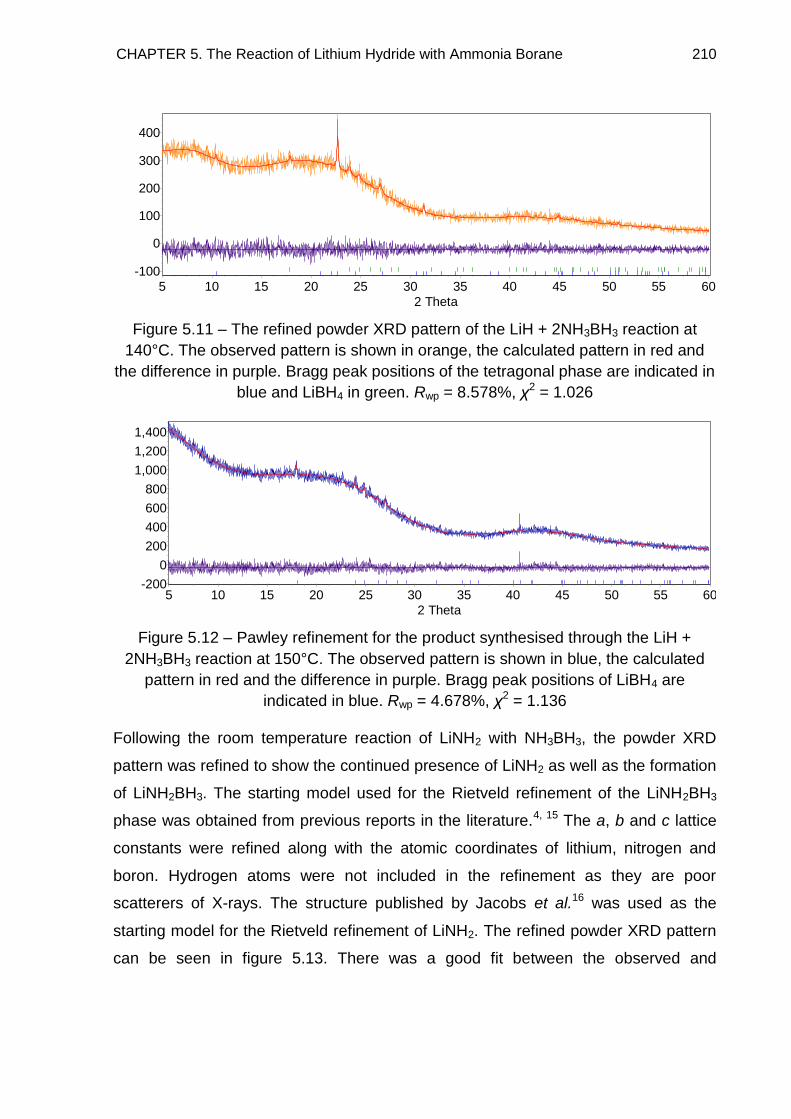
CHAPTER 5. The Reaction of Lithium Hydride with Ammonia Borane 210
Figure 5.11 – The refined powder XRD pattern of the LiH + 2NH3BH3 reaction at
140°C. The observed pattern is shown in orange, the calculated pattern in red and
the difference in purple. Bragg peak positions of the tetragonal phase are indicated in
blue and LiBH4 in green. Rwp = 8.578%, χ2 = 1.026
Figure 5.12 – Pawley refinement for the product synthesised through the LiH +
2NH3BH3 reaction at 150°C. The observed pattern is shown in blue, the calculated
pattern in red and the difference in purple. Bragg peak positions of LiBH4 are
indicated in blue. Rwp = 4.678%, χ2 = 1.136
Following the room temperature reaction of LiNH2 with NH3BH3, the powder XRD
pattern was refined to show the continued presence of LiNH2 as well as the formation
of LiNH2BH3. The starting model used for the Rietveld refinement of the LiNH2BH3
phase was obtained from previous reports in the literature.4, 15 The a, b and c lattice
constants were refined along with the atomic coordinates of lithium, nitrogen and
boron. Hydrogen atoms were not included in the refinement as they are poor
scatterers of X-rays. The structure published by Jacobs et al.16 was used as the
starting model for the Rietveld refinement of LiNH2. The refined powder XRD pattern
can be seen in figure 5.13. There was a good fit between the observed and
2 Theta
60555045403530252015105
Co
un
ts
400
300
200
100
0
-100
LiBH4 100.00 %
Li Tet 0.00 %
2 Theta
60555045403530252015105
Co
un
ts
1,400
1,200
1,000
800
600
400
200
0
-200
LiBH4 100.00 %
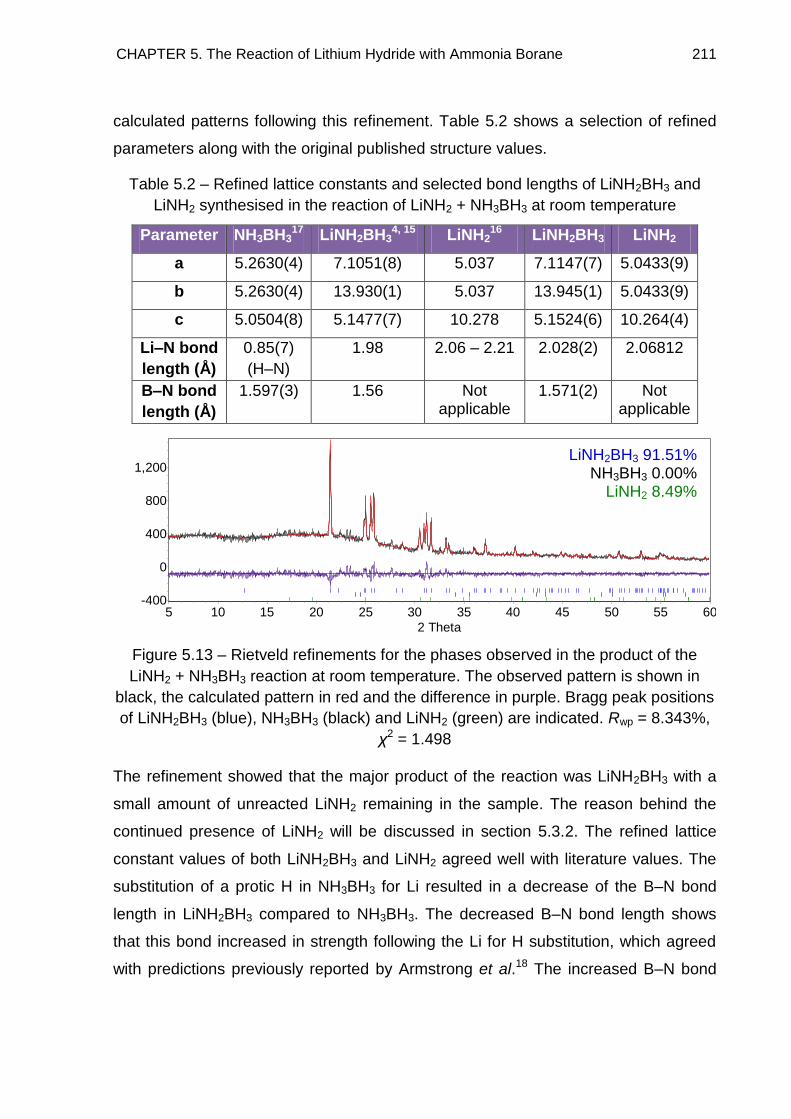
CHAPTER 5. The Reaction of Lithium Hydride with Ammonia Borane 211
calculated patterns following this refinement. Table 5.2 shows a selection of refined
parameters along with the original published structure values.
Table 5.2 – Refined lattice constants and selected bond lengths of LiNH2BH3 and
LiNH2 synthesised in the reaction of LiNH2 + NH3BH3 at room temperature
Parameter NH3BH317 LiNH2BH3
4, 15 LiNH216 LiNH2BH3 LiNH2
a 5.2630(4) 7.1051(8) 5.037 7.1147(7) 5.0433(9)
b 5.2630(4) 13.930(1) 5.037 13.945(1) 5.0433(9)
c 5.0504(8) 5.1477(7) 10.278 5.1524(6) 10.264(4)
Li–N bond
length (Å)
0.85(7)
(H–N)
1.98 2.06 – 2.21 2.028(2) 2.06812
B–N bond
length (Å)
1.597(3) 1.56 Not applicable
1.571(2) Not applicable
Figure 5.13 – Rietveld refinements for the phases observed in the product of the
LiNH2 + NH3BH3 reaction at room temperature. The observed pattern is shown in
black, the calculated pattern in red and the difference in purple. Bragg peak positions
of LiNH2BH3 (blue), NH3BH3 (black) and LiNH2 (green) are indicated. Rwp = 8.343%,
χ2 = 1.498
The refinement showed that the major product of the reaction was LiNH2BH3 with a
small amount of unreacted LiNH2 remaining in the sample. The reason behind the
continued presence of LiNH2 will be discussed in section 5.3.2. The refined lattice
constant values of both LiNH2BH3 and LiNH2 agreed well with literature values. The
substitution of a protic H in NH3BH3 for Li resulted in a decrease of the B–N bond
length in LiNH2BH3 compared to NH3BH3. The decreased B–N bond length shows
that this bond increased in strength following the Li for H substitution, which agreed
with predictions previously reported by Armstrong et al.18 The increased B–N bond
2 Theta
60555045403530252015105
Co
un
ts
1,200
800
400
0
-400
LiNH2BH3 91.51 %
NH3BH3 0.01 %
LiNH2 8.48 %LiNH2BH3 91.51%
NH3BH3 0.00% LiNH2 8.49%
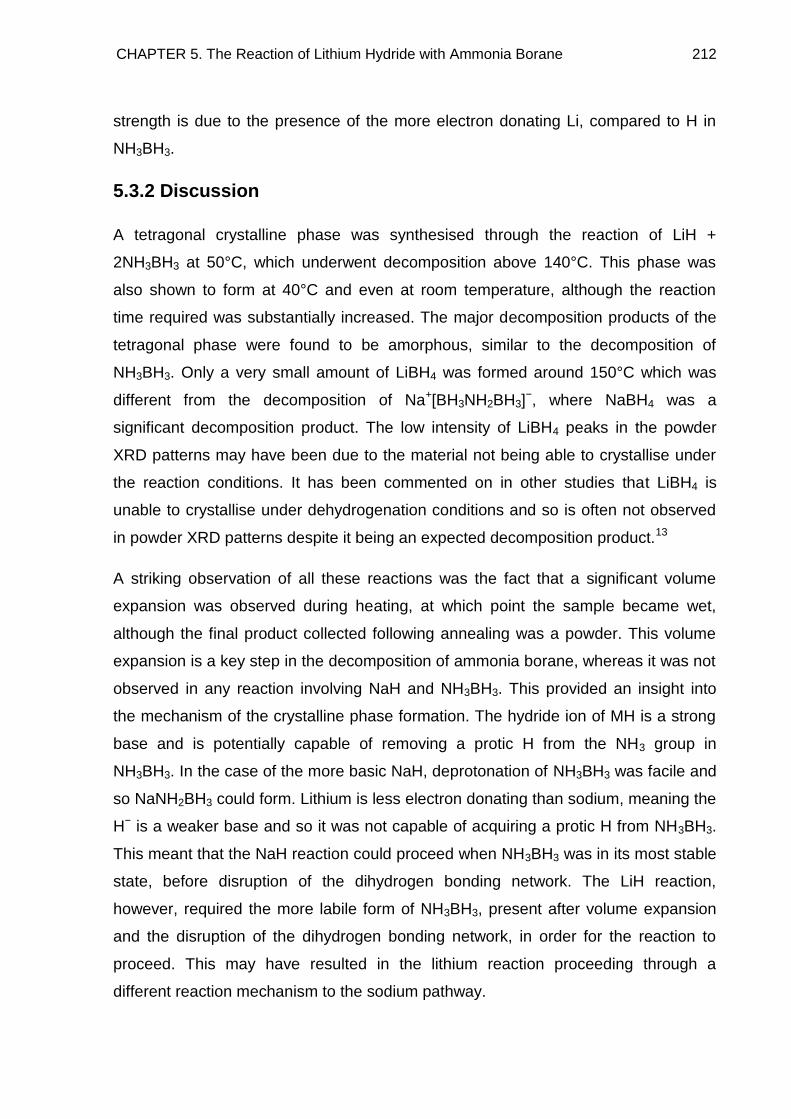
CHAPTER 5. The Reaction of Lithium Hydride with Ammonia Borane 212
strength is due to the presence of the more electron donating Li, compared to H in
NH3BH3.
5.3.2 Discussion
A tetragonal crystalline phase was synthesised through the reaction of LiH +
2NH3BH3 at 50°C, which underwent decomposition above 140°C. This phase was
also shown to form at 40°C and even at room temperature, although the reaction
time required was substantially increased. The major decomposition products of the
tetragonal phase were found to be amorphous, similar to the decomposition of
NH3BH3. Only a very small amount of LiBH4 was formed around 150°C which was
different from the decomposition of Na+[BH3NH2BH3]−, where NaBH4 was a
significant decomposition product. The low intensity of LiBH4 peaks in the powder
XRD patterns may have been due to the material not being able to crystallise under
the reaction conditions. It has been commented on in other studies that LiBH4 is
unable to crystallise under dehydrogenation conditions and so is often not observed
in powder XRD patterns despite it being an expected decomposition product.13
A striking observation of all these reactions was the fact that a significant volume
expansion was observed during heating, at which point the sample became wet,
although the final product collected following annealing was a powder. This volume
expansion is a key step in the decomposition of ammonia borane, whereas it was not
observed in any reaction involving NaH and NH3BH3. This provided an insight into
the mechanism of the crystalline phase formation. The hydride ion of MH is a strong
base and is potentially capable of removing a protic H from the NH3 group in
NH3BH3. In the case of the more basic NaH, deprotonation of NH3BH3 was facile and
so NaNH2BH3 could form. Lithium is less electron donating than sodium, meaning the
H− is a weaker base and so it was not capable of acquiring a protic H from NH3BH3.
This meant that the NaH reaction could proceed when NH3BH3 was in its most stable
state, before disruption of the dihydrogen bonding network. The LiH reaction,
however, required the more labile form of NH3BH3, present after volume expansion
and the disruption of the dihydrogen bonding network, in order for the reaction to
proceed. This may have resulted in the lithium reaction proceeding through a
different reaction mechanism to the sodium pathway.
CHAPTER 5. The Reaction of Lithium Hydride with Ammonia Borane 213
The tetragonal phase has been identified in a number of literature studies as being a
side product to the main reaction under investigation. A study by H. Wu et al.,15
primarily focused on investigating the 1:1 reaction, was the first to discuss the
product of the LiH + 2NH3BH3 reaction. Following ball milling of a 1:1 reaction mixture
a number of low intensity unindexed peaks in the powder XRD pattern were
observed along with peaks due to LiNH2BH3. The intensity of the unindexed peaks
increased on decreasing the ratio of LiH to NH3BH3 to 1:2 in the reaction mixture.
The majority of these peaks did not appear in our powder XRD pattern of the product
of the LiH + 2NH3BH3 reaction, although the three dominant peaks observed at 2θ =
10.4°, 22.6° and 31.3° were present. However, both the observed and unobserved
peaks were indexed to the same crystalline material and the product was concluded
to have the chemical formula LiNH2BH3·NH3BH3. A structure was subsequently
solved in the Cmc21 space group, with lattice constants a = 13.992 Å, b = 10.742 Å
and c = 10.110 Å. The fact that a number of the peaks in this XRD pattern occurred
in the powder XRD pattern of our product from the LiH + 2NH3BH3 reaction
suggested that the product observed by H. Wu et al. was in fact multiphase.
A second study by C. Wu et al.13 focused on the synthesis of the LiNH2BH3·NH3BH3
phase through ball milling of LiH + 2NH3BH3 and LiNH2BH3 + NH3BH3 reaction
mixtures. The XRD pattern of the product was similar to the one observed by H. Wu
et al.15 However, the three peaks observed at 2θ = 10.3°, 22.7° and 31.4° were
assigned as impurities in the LiNH2BH3·NH3BH3 XRD pattern. The intensities of these
peaks were also greatly reduced compared to those observed in the study by H. Wu
et al.15 Consequently, the two determined structures of LiNH2BH3·NH3BH3 were
significantly different. It was noted that the LiNH2BH3·NH3BH3 material underwent
decomposition slowly at room temperature and subsequently the three impurity
peaks at 2θ = 10.3°, 22.7° and 31.4° increased in intensity while the peaks indexed
to the LiNH2BH3·NH3BH3 phase disappeared from the pattern. It can therefore be
concluded that the data used by H. Wu et al. to solve the structure of
LiNH2BH3·NH3BH3 did in fact contain two phases. Heating LiNH2BH3·NH3BH3 to
100°C resulted in the decomposition of this material. The XRD pattern obtained after
heating LiNH2BH3·NH3BH3 to 100°C resembled that of the tetragonal phase, with the
three dominant peaks observed at 2θ = 10.4°, 22.6° and 31.3° present in both
CHAPTER 5. The Reaction of Lithium Hydride with Ammonia Borane 214
patterns. These observations therefore suggested that the tetragonal phase was a
product of the decomposition of LiNH2BH3·NH3BH3.
A further study by C. Wu et al.14 investigated the phase transitions during the ball
milled LiH + NH3BH3 reaction forming LiNH2BH3. The reaction pathway, reaction 5.1,
was proposed to involve formation of LiNH2BH3·NH3BH3 as an intermediate.
2LiH + 2NH3BH3 → LiH + LiNH2BH3·NH3BH3 + H2 → 2LiNH2BH3 + 2H2
Reaction 5.1
An impurity phase was identified in most samples, the most intense peak of which
was observed in the XRD pattern at 22.7°, consistent with our observations.
Furthermore, this crystalline phase was indexed to a tetragonal unit cell with lattice
constants a = 4.0320(4) Å and c = 17.023(4) Å and a unit cell volume of 276.73(8) Å3.
These parameters showed good agreement with those calculated for the tetragonal
phase formed in our study, confirming that the same crystalline phase had formed.
This impurity phase was thought to have originated from the decomposition of the
LiNH2BH3·NH3BH3 phase during the reaction.
From comparisons of the literature reports to the results outlined here, it can be
concluded that the thermal LiH + 2NH3BH3 reaction did not result in the crystalline
phase LiNH2BH3·NH3BH3. Literature studies showed the LiNH2BH3·NH3BH3 material
was synthesised through room temperature ball milling of the reagents whereas this
study used thermal treatment of the reagents in order to effect a reaction. C. Wu et
al. 13, 14 showed that LiNH2BH3·NH3BH3 decomposed slowly at room temperature,
with the resulting XRD pattern showing the presence of the tetragonal phase.13, 14
Due to the LiH + 2NH3BH3 reaction being carried out at temperatures in excess of
50°C, any formation of LiNH2BH3·NH3BH3 would have been rapidly followed by the
transition to the tetragonal phase and so this material was not detected in the powder
XRD patterns of the products. These results do, however, suggest that
LiNH2BH3·NH3BH3 may have been involved in the LiH + 2NH3BH3 reaction
mechanism.
The product of the LiNH2BH3 + NH3BH3 reaction at 50°C was also the tetragonal
phase, suggesting that LiNH2BH3 was also involved in the reaction mechanism,
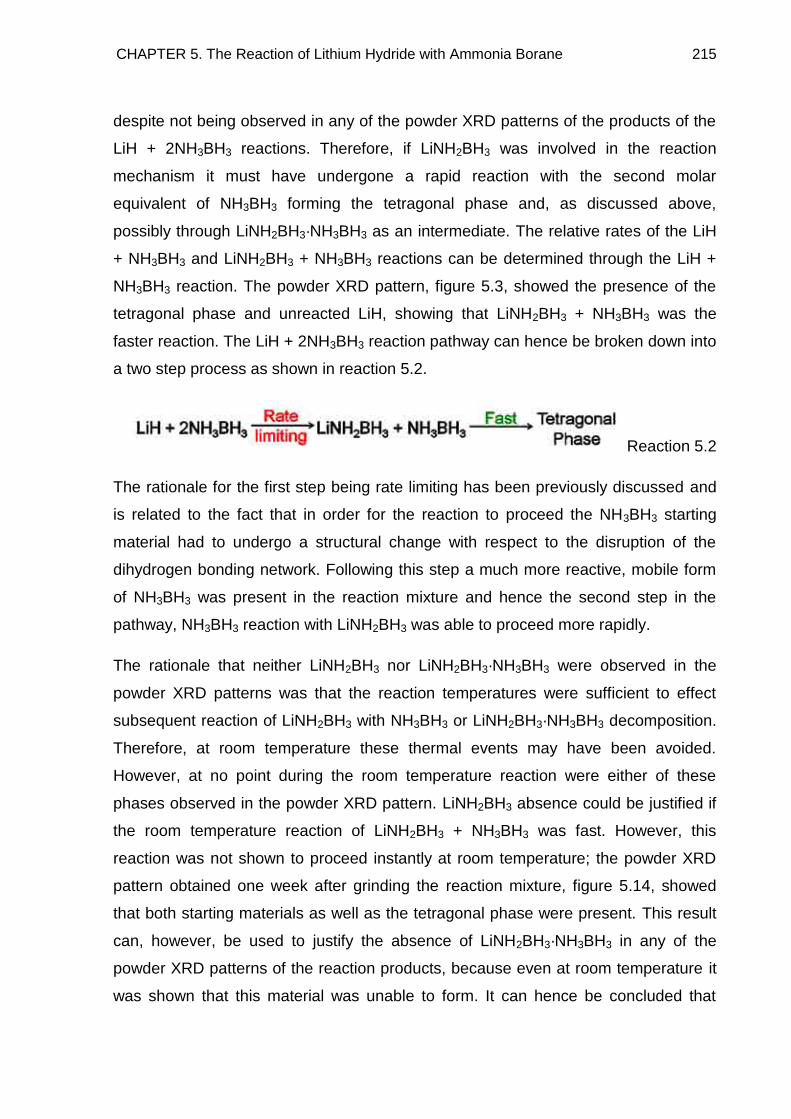
CHAPTER 5. The Reaction of Lithium Hydride with Ammonia Borane 215
despite not being observed in any of the powder XRD patterns of the products of the
LiH + 2NH3BH3 reactions. Therefore, if LiNH2BH3 was involved in the reaction
mechanism it must have undergone a rapid reaction with the second molar
equivalent of NH3BH3 forming the tetragonal phase and, as discussed above,
possibly through LiNH2BH3·NH3BH3 as an intermediate. The relative rates of the LiH
+ NH3BH3 and LiNH2BH3 + NH3BH3 reactions can be determined through the LiH +
NH3BH3 reaction. The powder XRD pattern, figure 5.3, showed the presence of the
tetragonal phase and unreacted LiH, showing that LiNH2BH3 + NH3BH3 was the
faster reaction. The LiH + 2NH3BH3 reaction pathway can hence be broken down into
a two step process as shown in reaction 5.2.
Reaction 5.2
The rationale for the first step being rate limiting has been previously discussed and
is related to the fact that in order for the reaction to proceed the NH3BH3 starting
material had to undergo a structural change with respect to the disruption of the
dihydrogen bonding network. Following this step a much more reactive, mobile form
of NH3BH3 was present in the reaction mixture and hence the second step in the
pathway, NH3BH3 reaction with LiNH2BH3 was able to proceed more rapidly.
The rationale that neither LiNH2BH3 nor LiNH2BH3·NH3BH3 were observed in the
powder XRD patterns was that the reaction temperatures were sufficient to effect
subsequent reaction of LiNH2BH3 with NH3BH3 or LiNH2BH3·NH3BH3 decomposition.
Therefore, at room temperature these thermal events may have been avoided.
However, at no point during the room temperature reaction were either of these
phases observed in the powder XRD pattern. LiNH2BH3 absence could be justified if
the room temperature reaction of LiNH2BH3 + NH3BH3 was fast. However, this
reaction was not shown to proceed instantly at room temperature; the powder XRD
pattern obtained one week after grinding the reaction mixture, figure 5.14, showed
that both starting materials as well as the tetragonal phase were present. This result
can, however, be used to justify the absence of LiNH2BH3·NH3BH3 in any of the
powder XRD patterns of the reaction products, because even at room temperature it
was shown that this material was unable to form. It can hence be concluded that
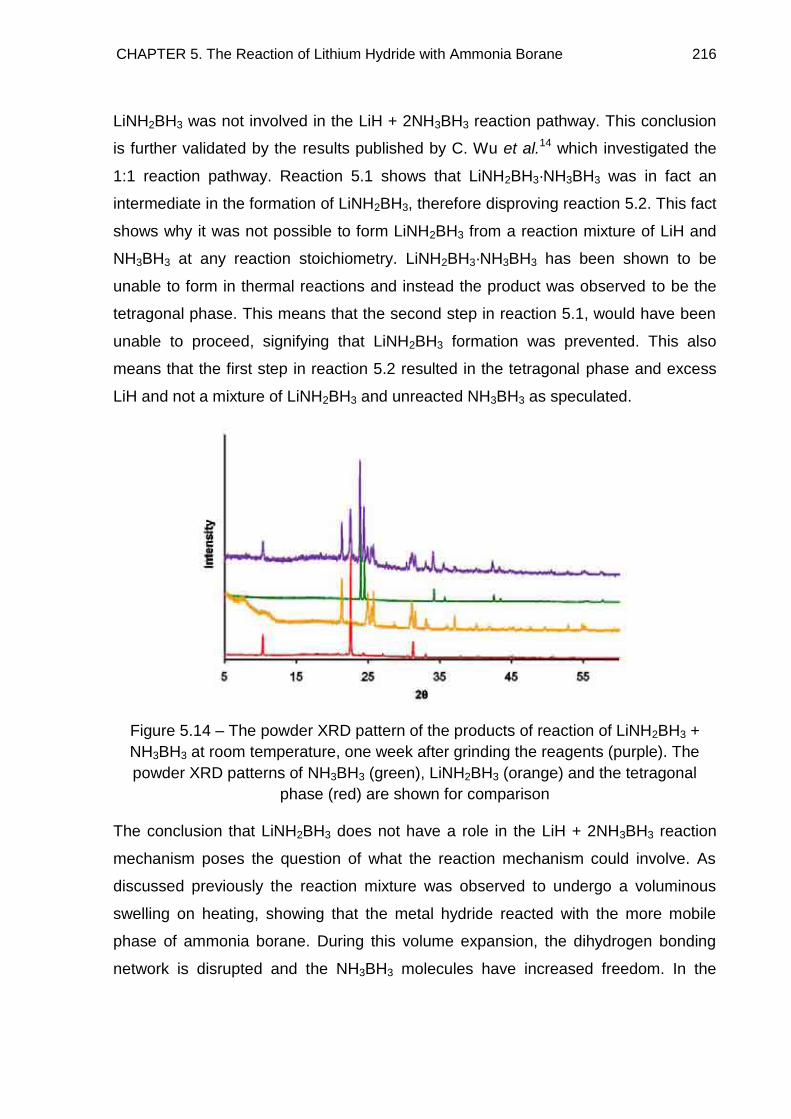
CHAPTER 5. The Reaction of Lithium Hydride with Ammonia Borane 216
LiNH2BH3 was not involved in the LiH + 2NH3BH3 reaction pathway. This conclusion
is further validated by the results published by C. Wu et al.14 which investigated the
1:1 reaction pathway. Reaction 5.1 shows that LiNH2BH3·NH3BH3 was in fact an
intermediate in the formation of LiNH2BH3, therefore disproving reaction 5.2. This fact
shows why it was not possible to form LiNH2BH3 from a reaction mixture of LiH and
NH3BH3 at any reaction stoichiometry. LiNH2BH3·NH3BH3 has been shown to be
unable to form in thermal reactions and instead the product was observed to be the
tetragonal phase. This means that the second step in reaction 5.1, would have been
unable to proceed, signifying that LiNH2BH3 formation was prevented. This also
means that the first step in reaction 5.2 resulted in the tetragonal phase and excess
LiH and not a mixture of LiNH2BH3 and unreacted NH3BH3 as speculated.
Figure 5.14 – The powder XRD pattern of the products of reaction of LiNH2BH3 +
NH3BH3 at room temperature, one week after grinding the reagents (purple). The
powder XRD patterns of NH3BH3 (green), LiNH2BH3 (orange) and the tetragonal
phase (red) are shown for comparison
The conclusion that LiNH2BH3 does not have a role in the LiH + 2NH3BH3 reaction
mechanism poses the question of what the reaction mechanism could involve. As
discussed previously the reaction mixture was observed to undergo a voluminous
swelling on heating, showing that the metal hydride reacted with the more mobile
phase of ammonia borane. During this volume expansion, the dihydrogen bonding
network is disrupted and the NH3BH3 molecules have increased freedom. In the
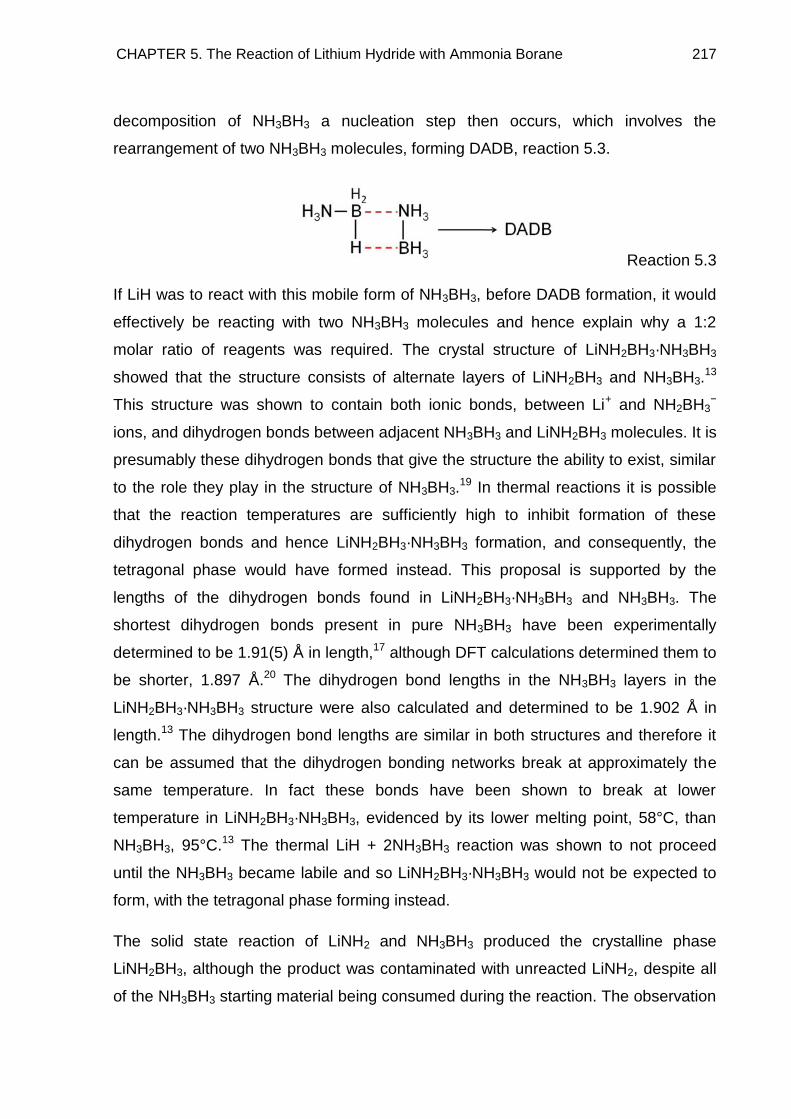
CHAPTER 5. The Reaction of Lithium Hydride with Ammonia Borane 217
decomposition of NH3BH3 a nucleation step then occurs, which involves the
rearrangement of two NH3BH3 molecules, forming DADB, reaction 5.3.
Reaction 5.3
If LiH was to react with this mobile form of NH3BH3, before DADB formation, it would
effectively be reacting with two NH3BH3 molecules and hence explain why a 1:2
molar ratio of reagents was required. The crystal structure of LiNH2BH3·NH3BH3
showed that the structure consists of alternate layers of LiNH2BH3 and NH3BH3.13
This structure was shown to contain both ionic bonds, between Li+ and NH2BH3−
ions, and dihydrogen bonds between adjacent NH3BH3 and LiNH2BH3 molecules. It is
presumably these dihydrogen bonds that give the structure the ability to exist, similar
to the role they play in the structure of NH3BH3.19 In thermal reactions it is possible
that the reaction temperatures are sufficiently high to inhibit formation of these
dihydrogen bonds and hence LiNH2BH3·NH3BH3 formation, and consequently, the
tetragonal phase would have formed instead. This proposal is supported by the
lengths of the dihydrogen bonds found in LiNH2BH3·NH3BH3 and NH3BH3. The
shortest dihydrogen bonds present in pure NH3BH3 have been experimentally
determined to be 1.91(5) Å in length,17 although DFT calculations determined them to
be shorter, 1.897 Å.20 The dihydrogen bond lengths in the NH3BH3 layers in the
LiNH2BH3·NH3BH3 structure were also calculated and determined to be 1.902 Å in
length.13 The dihydrogen bond lengths are similar in both structures and therefore it
can be assumed that the dihydrogen bonding networks break at approximately the
same temperature. In fact these bonds have been shown to break at lower
temperature in LiNH2BH3·NH3BH3, evidenced by its lower melting point, 58°C, than
NH3BH3, 95°C.13 The thermal LiH + 2NH3BH3 reaction was shown to not proceed
until the NH3BH3 became labile and so LiNH2BH3·NH3BH3 would not be expected to
form, with the tetragonal phase forming instead.
The solid state reaction of LiNH2 and NH3BH3 produced the crystalline phase
LiNH2BH3, although the product was contaminated with unreacted LiNH2, despite all
of the NH3BH3 starting material being consumed during the reaction. The observation
CHAPTER 5. The Reaction of Lithium Hydride with Ammonia Borane 218
of the reaction mixture foaming and becoming wet almost simultaneously with the
mixing of the reagents showed that there was no significant kinetic barrier to the
reaction. The product of the reaction being LiNH2BH3 implied that NH3 release
accompanied the formation of this phase as shown in reaction 5.4.
LiNH2 + NH3BH3 → LiNH2BH3 + NH3 Reaction 5.4
The release of NH3 from this reaction was consistent with the NaNH2 + NH3BH3
reaction. The reaction mechanism can therefore be assumed to have been the same
as for the NaNH2 + NH3BH3 reaction, chapter 4.3, with the NH2− anion acting as a
nucleophile and attacking the B through an SN2 reaction, although there was still the
possibility that the NH2− anion acted as a base, forming the same product. LiND2
would be required as a starting material to substantiate the reaction mechanism.
The release of NH3 from these reactions also gave the potential for a second reaction
to proceed. Exposing LiNH2BH3 to ammonia has been shown to yield a coordination
compound, Li(NH3)NH2BH3.9 This material is amorphous in nature at room
temperature and exists as a sticky liquid, although it does crystallise at lower
temperature. The observation that the LiNH2 + NH3BH3 reaction mixture became wet
on mixing the reagents suggested that this NH3 adduct could have formed, although
as it would have formed as an amorphous material it would not have been detected
by powder XRD. This possible reaction will be discussed further in section 5.4.
The continued presence of LiNH2 in the powder XRD pattern after reaction again
showed that competing reactions must have been taking place. Two such competing
reactions were proposed for the NaNH2 + NH3BH3 reaction in chapter 4.3, reactions
4.5 and 4.6. The product of both reactions was Na+[BH3NH2BH3]−. The powder XRD
pattern of this material is now known, but it was not observed in the product of the
NaNH2 + NH3BH3 reaction, showing that these reactions probably did not proceed.
Neither is there any evidence that the lithium analogue, Li+[BH3NH2BH3]−, formed
during the LiNH2 + NH3BH3 reaction. The continued presence of LiNH2 at the end of
the reaction is therefore attributed to the partial decomposition of NH3BH3 during the
exothermic reaction upon mixing the reagents.
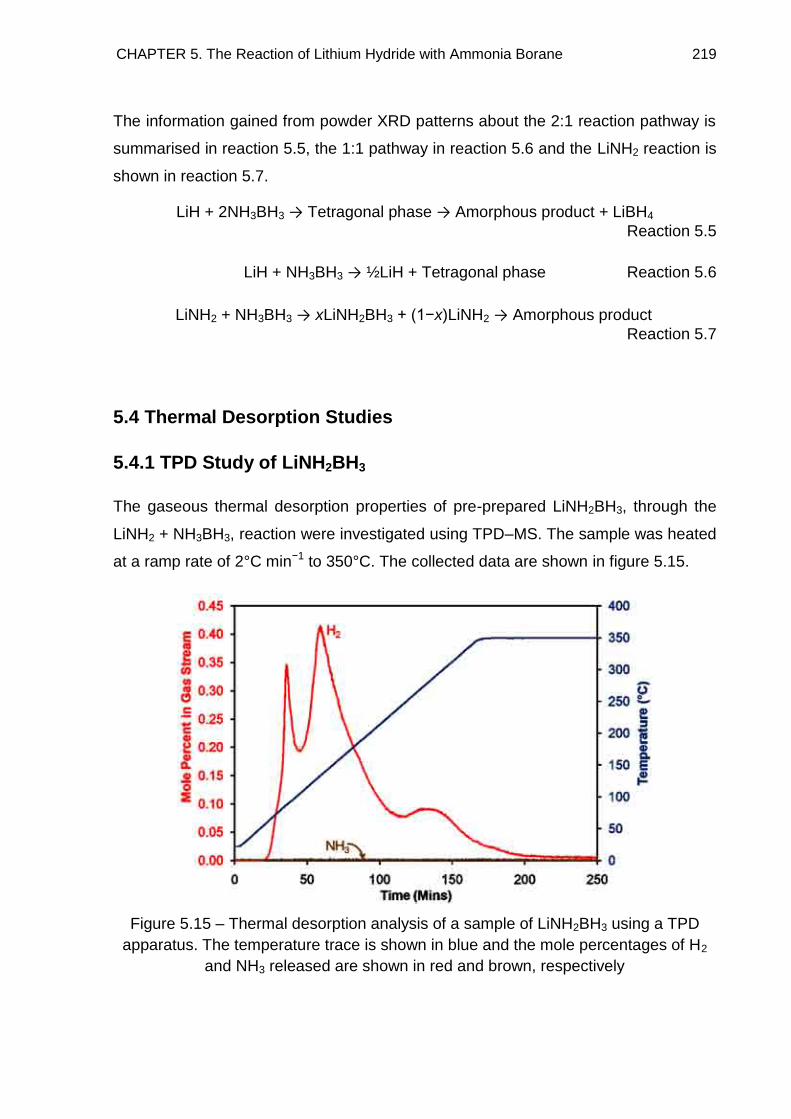
CHAPTER 5. The Reaction of Lithium Hydride with Ammonia Borane 219
The information gained from powder XRD patterns about the 2:1 reaction pathway is
summarised in reaction 5.5, the 1:1 pathway in reaction 5.6 and the LiNH2 reaction is
shown in reaction 5.7.
LiH + 2NH3BH3 → Tetragonal phase → Amorphous product + LiBH4
Reaction 5.5
LiH + NH3BH3 → ½LiH + Tetragonal phase Reaction 5.6
LiNH2 + NH3BH3 → xLiNH2BH3 + (1−x)LiNH2 → Amorphous product
Reaction 5.7
5.4 Thermal Desorption Studies
5.4.1 TPD Study of LiNH2BH3
The gaseous thermal desorption properties of pre-prepared LiNH2BH3, through the
LiNH2 + NH3BH3, reaction were investigated using TPD–MS. The sample was heated
at a ramp rate of 2°C min−1 to 350°C. The collected data are shown in figure 5.15.
Figure 5.15 – Thermal desorption analysis of a sample of LiNH2BH3 using a TPD
apparatus. The temperature trace is shown in blue and the mole percentages of H2
and NH3 released are shown in red and brown, respectively

CHAPTER 5. The Reaction of Lithium Hydride with Ammonia Borane 220
It can be seen that there were three hydrogen release steps during the desorption
experiment, which were free from ammonia pollution. The first release commenced at
55°C and peaked at 87°C, with the second release beginning at 100°C and peaking
at 130°C and also seeing a greater amount of hydrogen released. The final broad
release started at 245°C and reached a maximum at 275°C.
Discussion
Literature reports regarding the thermal desorption of LiNH2BH3 have shown that
exclusively hydrogen is released. Temperature ramping experiments have shown
that the material vigorously releases H2 below 100°C, with this sharp release
observed at either 92°C4, 15 or 86°C.5 These studies also identified a second small
broad H2 desorption at 120°C. These earlier reports did not agree with the thermal
desorption profile presented here. This may have been due to the presence of other
amorphous materials in the sample. As discussed in section 5.3.2, the release of NH3
during the LiNH2 + NH3BH3 reaction led to the possibility of the amorphous material
Li(NH3)NH2BH3 also forming. Xia et al.9 reported that this material releases H2 at a
lower temperature than LiNH2BH3, with desorption commencing at 40°C and peaking
at 71°C. NH3 release was also observed in the desorption profile between 25 and
150°C. The amorphous material LiNH2BH3NH3 identified by Graham et al.8 was also
shown to release H2 at a lower temperature than LiNH2BH3, with the release
commencing at approximately 40°C and peaking at 60°C. Therefore figure 5.15
suggests that the sample contained both amorphous Li(NH3)NH2BH3, which was
responsible for the first H2 desorption and crystalline LiNH2BH3, which was
responsible for the second H2 desorption.
None of the literature studies were heated to a sufficiently high temperature to
observe the third higher temperature hydrogen release. This higher temperature
desorption was due to further H2 loss from the polymeric decomposition products of
both Li(NH3)NH2BH3 and LiNH2BH3.
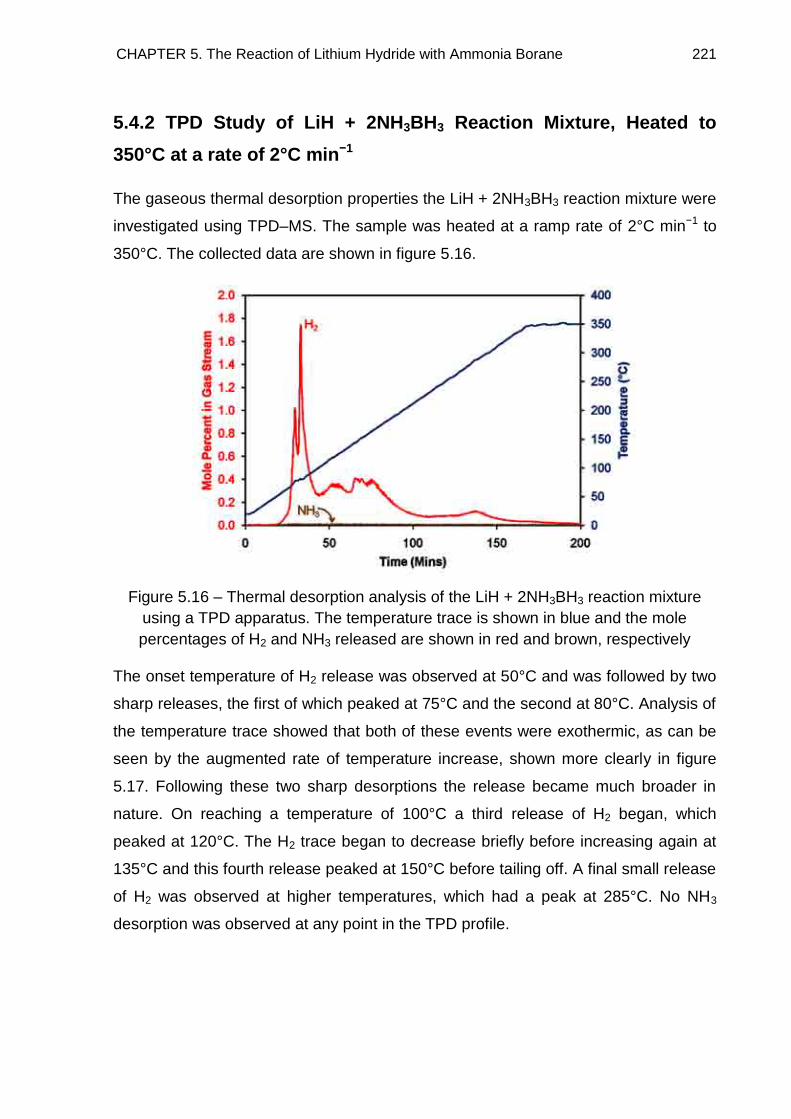
CHAPTER 5. The Reaction of Lithium Hydride with Ammonia Borane 221
5.4.2 TPD Study of LiH + 2NH3BH3 Reaction Mixture, Heated to
350°C at a rate of 2°C min−1
The gaseous thermal desorption properties the LiH + 2NH3BH3 reaction mixture were
investigated using TPD–MS. The sample was heated at a ramp rate of 2°C min−1 to
350°C. The collected data are shown in figure 5.16.
Figure 5.16 – Thermal desorption analysis of the LiH + 2NH3BH3 reaction mixture
using a TPD apparatus. The temperature trace is shown in blue and the mole
percentages of H2 and NH3 released are shown in red and brown, respectively
The onset temperature of H2 release was observed at 50°C and was followed by two
sharp releases, the first of which peaked at 75°C and the second at 80°C. Analysis of
the temperature trace showed that both of these events were exothermic, as can be
seen by the augmented rate of temperature increase, shown more clearly in figure
5.17. Following these two sharp desorptions the release became much broader in
nature. On reaching a temperature of 100°C a third release of H2 began, which
peaked at 120°C. The H2 trace began to decrease briefly before increasing again at
135°C and this fourth release peaked at 150°C before tailing off. A final small release
of H2 was observed at higher temperatures, which had a peak at 285°C. No NH3
desorption was observed at any point in the TPD profile.
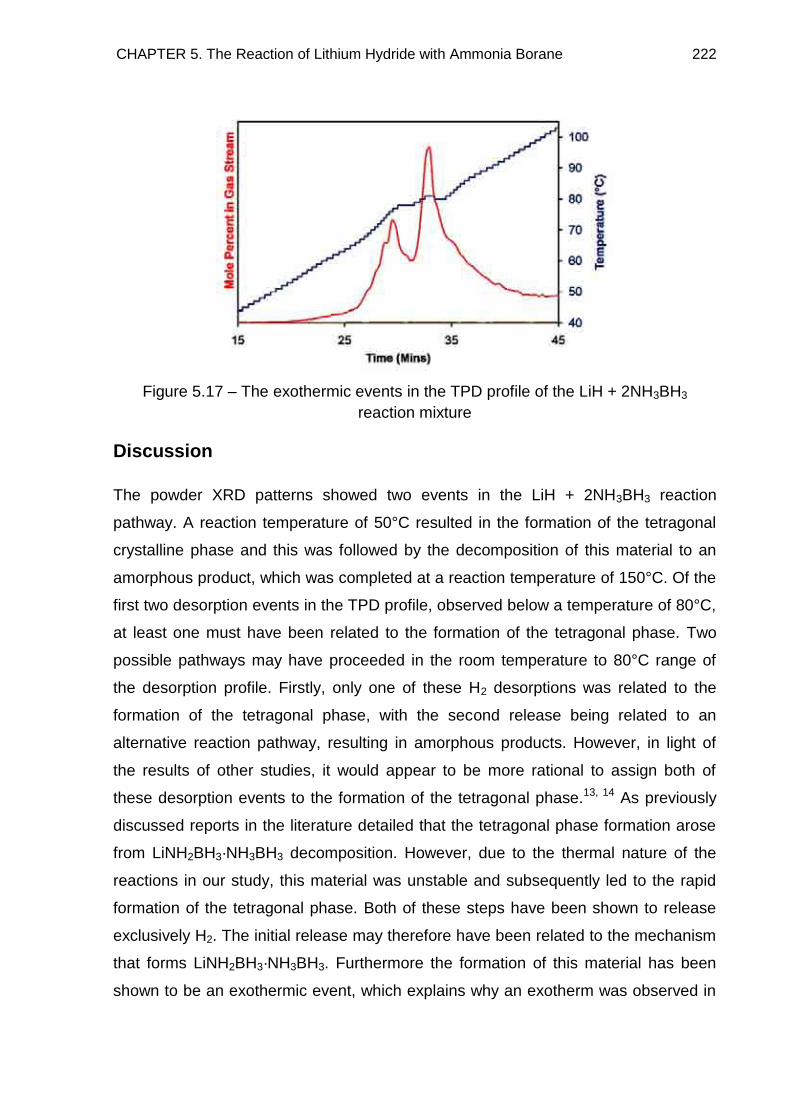
CHAPTER 5. The Reaction of Lithium Hydride with Ammonia Borane 222
Figure 5.17 – The exothermic events in the TPD profile of the LiH + 2NH3BH3
reaction mixture
Discussion
The powder XRD patterns showed two events in the LiH + 2NH3BH3 reaction
pathway. A reaction temperature of 50°C resulted in the formation of the tetragonal
crystalline phase and this was followed by the decomposition of this material to an
amorphous product, which was completed at a reaction temperature of 150°C. Of the
first two desorption events in the TPD profile, observed below a temperature of 80°C,
at least one must have been related to the formation of the tetragonal phase. Two
possible pathways may have proceeded in the room temperature to 80°C range of
the desorption profile. Firstly, only one of these H2 desorptions was related to the
formation of the tetragonal phase, with the second release being related to an
alternative reaction pathway, resulting in amorphous products. However, in light of
the results of other studies, it would appear to be more rational to assign both of
these desorption events to the formation of the tetragonal phase.13, 14 As previously
discussed reports in the literature detailed that the tetragonal phase formation arose
from LiNH2BH3·NH3BH3 decomposition. However, due to the thermal nature of the
reactions in our study, this material was unstable and subsequently led to the rapid
formation of the tetragonal phase. Both of these steps have been shown to release
exclusively H2. The initial release may therefore have been related to the mechanism
that forms LiNH2BH3·NH3BH3. Furthermore the formation of this material has been
shown to be an exothermic event, which explains why an exotherm was observed in
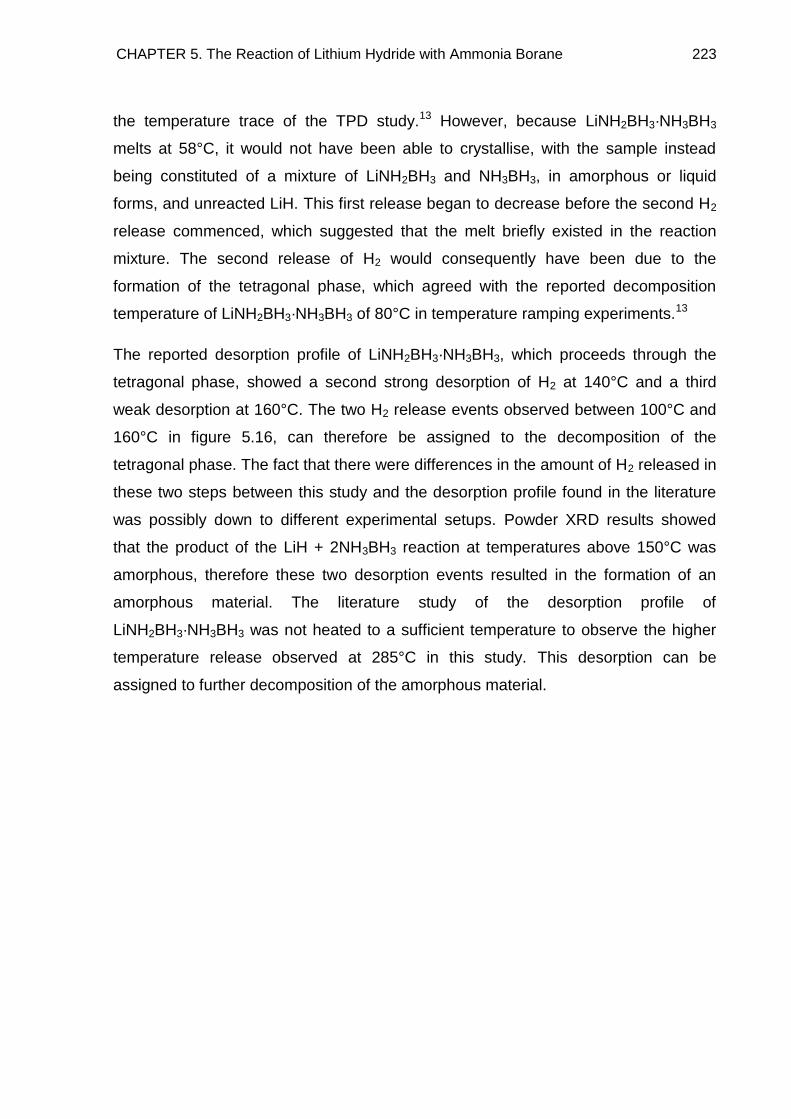
CHAPTER 5. The Reaction of Lithium Hydride with Ammonia Borane 223
the temperature trace of the TPD study.13 However, because LiNH2BH3·NH3BH3
melts at 58°C, it would not have been able to crystallise, with the sample instead
being constituted of a mixture of LiNH2BH3 and NH3BH3, in amorphous or liquid
forms, and unreacted LiH. This first release began to decrease before the second H2
release commenced, which suggested that the melt briefly existed in the reaction
mixture. The second release of H2 would consequently have been due to the
formation of the tetragonal phase, which agreed with the reported decomposition
temperature of LiNH2BH3·NH3BH3 of 80°C in temperature ramping experiments.13
The reported desorption profile of LiNH2BH3·NH3BH3, which proceeds through the
tetragonal phase, showed a second strong desorption of H2 at 140°C and a third
weak desorption at 160°C. The two H2 release events observed between 100°C and
160°C in figure 5.16, can therefore be assigned to the decomposition of the
tetragonal phase. The fact that there were differences in the amount of H2 released in
these two steps between this study and the desorption profile found in the literature
was possibly down to different experimental setups. Powder XRD results showed
that the product of the LiH + 2NH3BH3 reaction at temperatures above 150°C was
amorphous, therefore these two desorption events resulted in the formation of an
amorphous material. The literature study of the desorption profile of
LiNH2BH3·NH3BH3 was not heated to a sufficient temperature to observe the higher
temperature release observed at 285°C in this study. This desorption can be
assigned to further decomposition of the amorphous material.
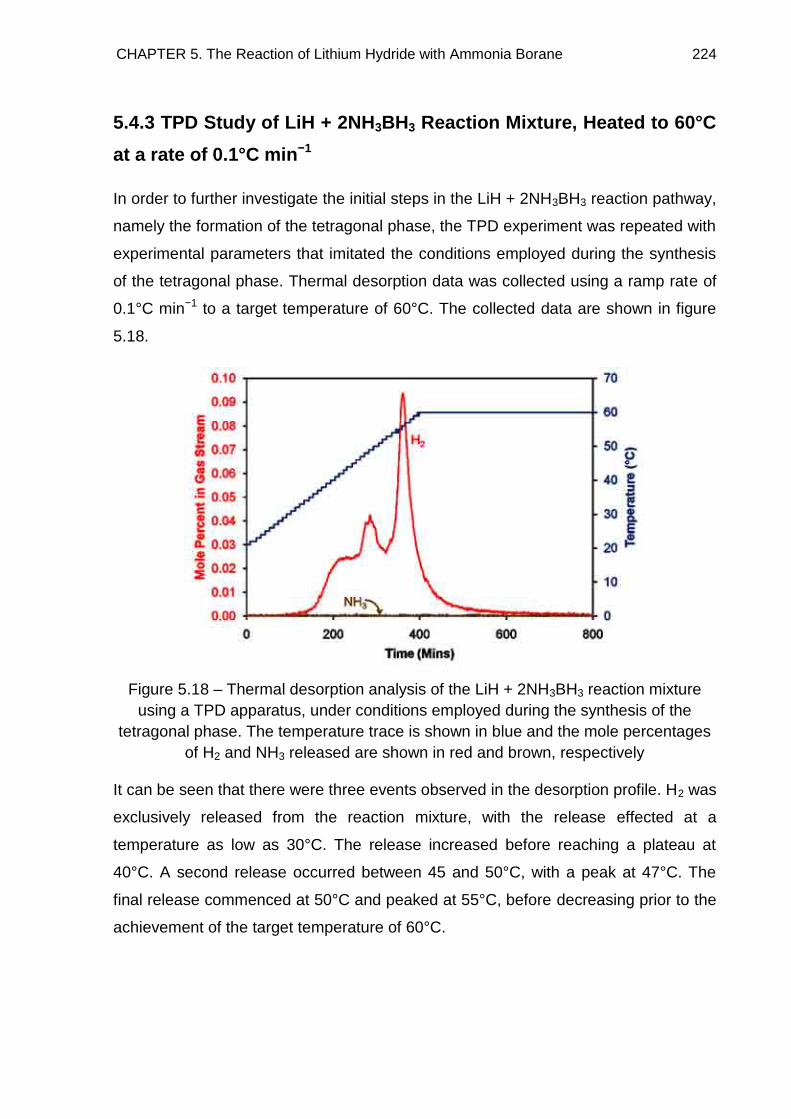
CHAPTER 5. The Reaction of Lithium Hydride with Ammonia Borane 224
5.4.3 TPD Study of LiH + 2NH3BH3 Reaction Mixture, Heated to 60°C
at a rate of 0.1°C min−1
In order to further investigate the initial steps in the LiH + 2NH3BH3 reaction pathway,
namely the formation of the tetragonal phase, the TPD experiment was repeated with
experimental parameters that imitated the conditions employed during the synthesis
of the tetragonal phase. Thermal desorption data was collected using a ramp rate of
0.1°C min−1 to a target temperature of 60°C. The collected data are shown in figure
5.18.
Figure 5.18 – Thermal desorption analysis of the LiH + 2NH3BH3 reaction mixture
using a TPD apparatus, under conditions employed during the synthesis of the
tetragonal phase. The temperature trace is shown in blue and the mole percentages
of H2 and NH3 released are shown in red and brown, respectively
It can be seen that there were three events observed in the desorption profile. H2 was
exclusively released from the reaction mixture, with the release effected at a
temperature as low as 30°C. The release increased before reaching a plateau at
40°C. A second release occurred between 45 and 50°C, with a peak at 47°C. The
final release commenced at 50°C and peaked at 55°C, before decreasing prior to the
achievement of the target temperature of 60°C.
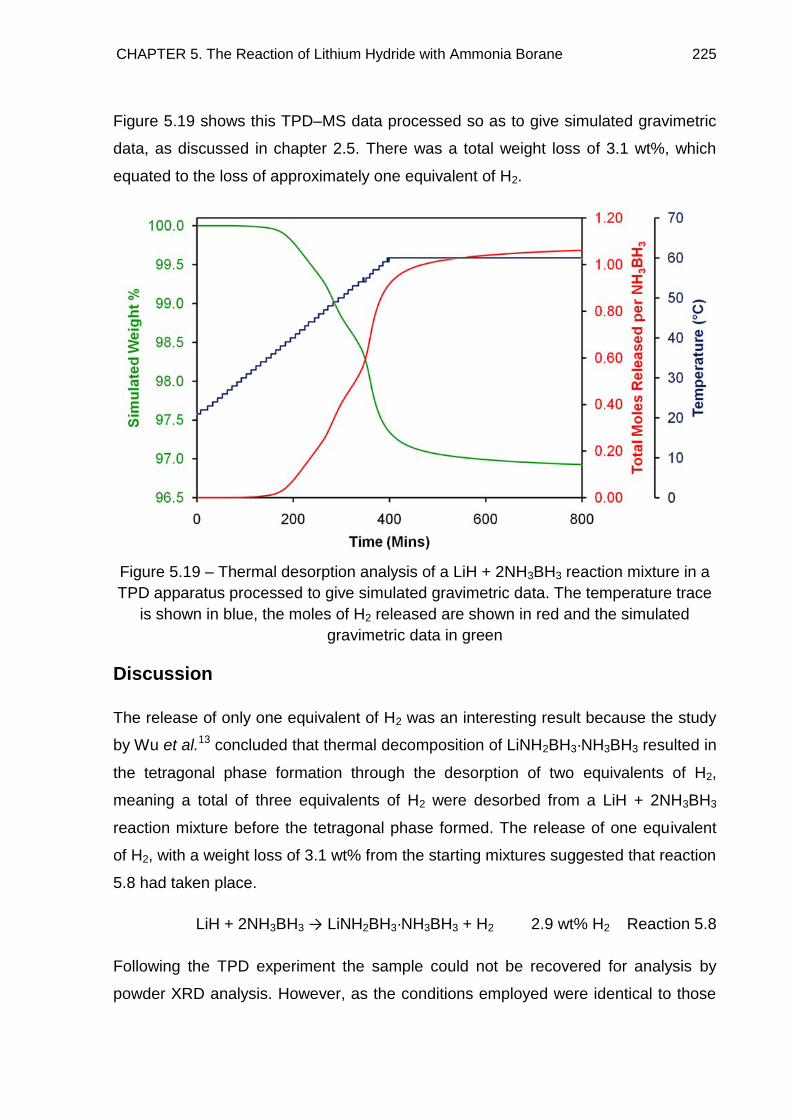
CHAPTER 5. The Reaction of Lithium Hydride with Ammonia Borane 225
Figure 5.19 shows this TPD–MS data processed so as to give simulated gravimetric
data, as discussed in chapter 2.5. There was a total weight loss of 3.1 wt%, which
equated to the loss of approximately one equivalent of H2.
Figure 5.19 – Thermal desorption analysis of a LiH + 2NH3BH3 reaction mixture in a
TPD apparatus processed to give simulated gravimetric data. The temperature trace
is shown in blue, the moles of H2 released are shown in red and the simulated
gravimetric data in green
Discussion
The release of only one equivalent of H2 was an interesting result because the study
by Wu et al.13 concluded that thermal decomposition of LiNH2BH3·NH3BH3 resulted in
the tetragonal phase formation through the desorption of two equivalents of H2,
meaning a total of three equivalents of H2 were desorbed from a LiH + 2NH3BH3
reaction mixture before the tetragonal phase formed. The release of one equivalent
of H2, with a weight loss of 3.1 wt% from the starting mixtures suggested that reaction
5.8 had taken place.
LiH + 2NH3BH3 → LiNH2BH3·NH3BH3 + H2 2.9 wt% H2 Reaction 5.8
Following the TPD experiment the sample could not be recovered for analysis by
powder XRD analysis. However, as the conditions employed were identical to those
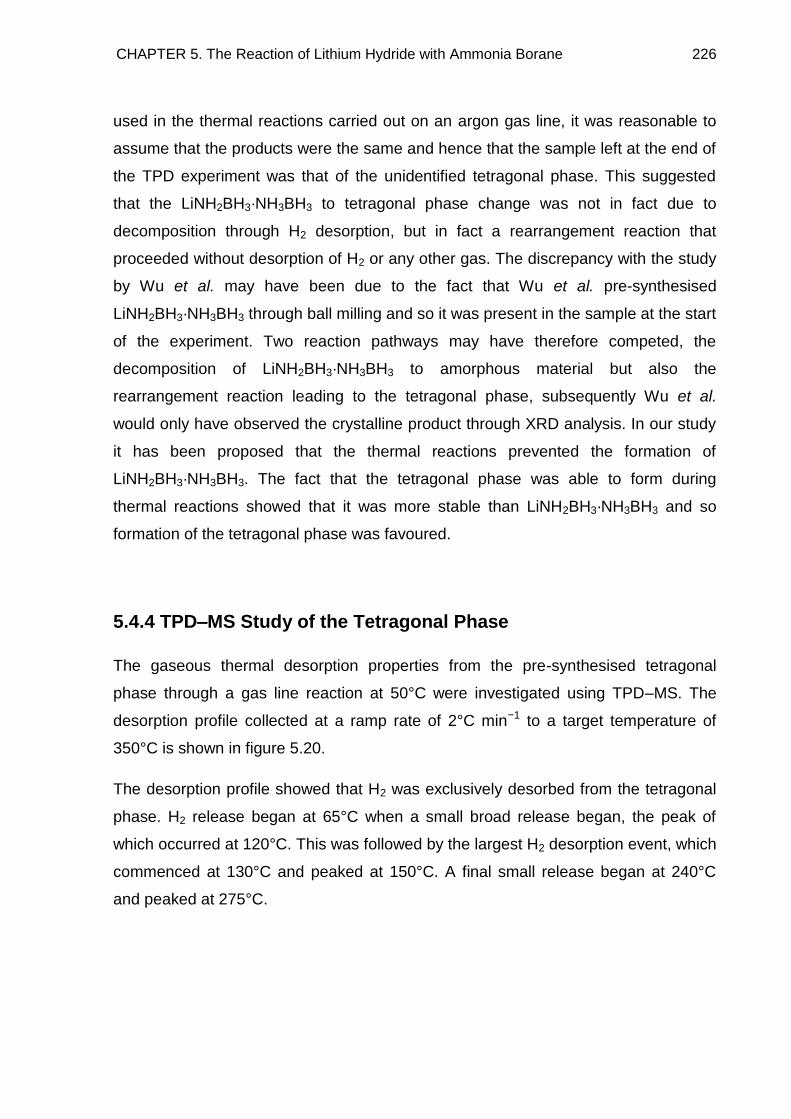
CHAPTER 5. The Reaction of Lithium Hydride with Ammonia Borane 226
used in the thermal reactions carried out on an argon gas line, it was reasonable to
assume that the products were the same and hence that the sample left at the end of
the TPD experiment was that of the unidentified tetragonal phase. This suggested
that the LiNH2BH3·NH3BH3 to tetragonal phase change was not in fact due to
decomposition through H2 desorption, but in fact a rearrangement reaction that
proceeded without desorption of H2 or any other gas. The discrepancy with the study
by Wu et al. may have been due to the fact that Wu et al. pre-synthesised
LiNH2BH3·NH3BH3 through ball milling and so it was present in the sample at the start
of the experiment. Two reaction pathways may have therefore competed, the
decomposition of LiNH2BH3·NH3BH3 to amorphous material but also the
rearrangement reaction leading to the tetragonal phase, subsequently Wu et al.
would only have observed the crystalline product through XRD analysis. In our study
it has been proposed that the thermal reactions prevented the formation of
LiNH2BH3·NH3BH3. The fact that the tetragonal phase was able to form during
thermal reactions showed that it was more stable than LiNH2BH3·NH3BH3 and so
formation of the tetragonal phase was favoured.
5.4.4 TPD–MS Study of the Tetragonal Phase
The gaseous thermal desorption properties from the pre-synthesised tetragonal
phase through a gas line reaction at 50°C were investigated using TPD–MS. The
desorption profile collected at a ramp rate of 2°C min−1 to a target temperature of
350°C is shown in figure 5.20.
The desorption profile showed that H2 was exclusively desorbed from the tetragonal
phase. H2 release began at 65°C when a small broad release began, the peak of
which occurred at 120°C. This was followed by the largest H2 desorption event, which
commenced at 130°C and peaked at 150°C. A final small release began at 240°C
and peaked at 275°C.
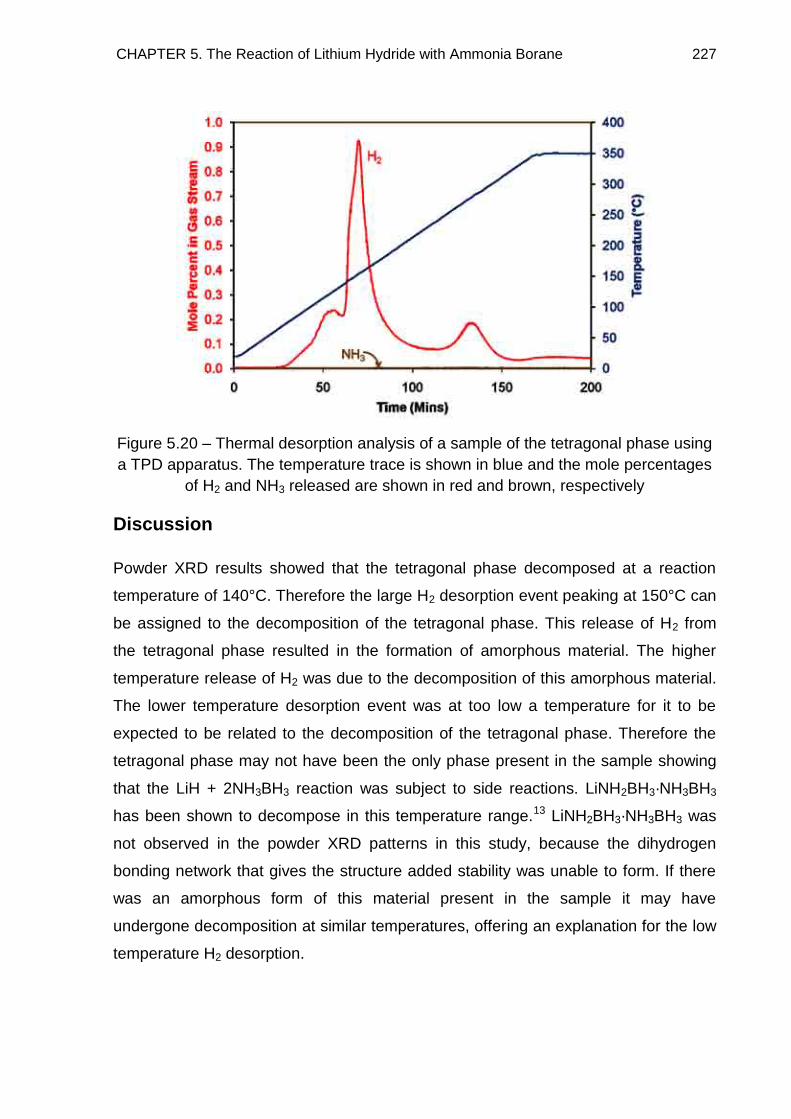
CHAPTER 5. The Reaction of Lithium Hydride with Ammonia Borane 227
Figure 5.20 – Thermal desorption analysis of a sample of the tetragonal phase using
a TPD apparatus. The temperature trace is shown in blue and the mole percentages
of H2 and NH3 released are shown in red and brown, respectively
Discussion
Powder XRD results showed that the tetragonal phase decomposed at a reaction
temperature of 140°C. Therefore the large H2 desorption event peaking at 150°C can
be assigned to the decomposition of the tetragonal phase. This release of H2 from
the tetragonal phase resulted in the formation of amorphous material. The higher
temperature release of H2 was due to the decomposition of this amorphous material.
The lower temperature desorption event was at too low a temperature for it to be
expected to be related to the decomposition of the tetragonal phase. Therefore the
tetragonal phase may not have been the only phase present in the sample showing
that the LiH + 2NH3BH3 reaction was subject to side reactions. LiNH2BH3·NH3BH3
has been shown to decompose in this temperature range.13 LiNH2BH3·NH3BH3 was
not observed in the powder XRD patterns in this study, because the dihydrogen
bonding network that gives the structure added stability was unable to form. If there
was an amorphous form of this material present in the sample it may have
undergone decomposition at similar temperatures, offering an explanation for the low
temperature H2 desorption.
CHAPTER 5. The Reaction of Lithium Hydride with Ammonia Borane 228
5.4.5 IGA–MS Study of the Tetragonal Phase
A sample of the pre-synthesised tetragonal phase (81 mg) was inertly loaded into an
IGA connected to a mass spectrometer. Figure 5.21 shows the thermogravimetric
data overlaid with the mass spectrometric data for the observed desorption products.
The same conditions as employed in the TPD experiment were used, with the
sample heated at a rate of 2°C min−1 to a target temperature of 350°C.
Figure 5.21 – Thermogravimetric analysis of the tetragonal lithium phase in an IGA.
The gravimetric trace is shown in green, the temperature trace in blue and the
signals detected by mass spectrometry of H2 in red and NH3 (×100) in brown
The IGA–MS trace showed that H2 release began at 100°C, the release of H2 initially
increased steadily, until a temperature of 135°C was achieved, at which point a
significant increase in the amount of H2 release occurred. This desorption event
showed two peaks at 145°C and 160°C. A small desorption of H2 was observed to
commence at 255°C, peaking at 275°C and a final small release was observed
above 330°C. This desorption profile was very similar to that observed in the TPD–
MS experiment, however, the IGA–MS experiment also showed NH3 desorption from
the tetragonal phase. This desorption began at 75°C and peaked at 110°C, with no
NH3 release observed above 150°C.
CHAPTER 5. The Reaction of Lithium Hydride with Ammonia Borane 229
The rate of weight loss from the sample showed five separate events. The first of
which showed a weight loss of 3.6 wt% up to a temperature of 145°C, which was
primarily due to NH3 release, although H2 desorption would also have contributed to
this weight loss. The largest H2 desorption was accompanied by a weight loss of 9.4
wt%. Between 165°C and 255°C, where the H2 desorption profile reached a plateau,
a further weight loss of 1.4 wt% occurred. The H2 desorption between 255°C and
275°C was accompanied by a weight loss of 1.1 wt% and above this temperature a
further weight loss of 0.6 wt% was observed. This was a total weight loss of 16.1 wt%
from the sample, with H2 desorption being responsible for a loss of approximately
12.5 wt%.
Discussion
The low temperature NH3 release offered an alternative explanation to the reason
behind the observed H2 desorption below the decomposition temperature of the
tetragonal phase in both the TPD and IGA studies of the tetragonal phase. NH3
desorption has been shown to be dependent on the setup of the desorption
experiment. In a flowing system, NH3 release is detectable, whereas in a closed
system H2 is often detected instead.21, 22 In the flowing system the carrier gas
removes the NH3 from the surroundings of the sample, whereas in a closed system
the NH3 is able to interact with the sample and this can result in the release of H2
instead. The TPD setup was such that the argon carrier gas did not flow directly over
the sample and so any NH3 released may have been able to interact with the sample,
therefore resulting in H2 being detected by the mass spectrometer. In the IGA
experiment, the argon carrier gas passed directly over the sample and hence the NH3
was removed quickly meaning it was detectable. The H2 desorption below 130°C in
the IGA experiment could have been related to the decomposition of the tetragonal
phase.
The higher temperature H2 desorptions occurred at similar temperature to those in
the TPD experiment. Therefore the previous assignments that the main H2 release at
135°C was due to decomposition of the tetragonal phase and H2 release above
255°C was due to further release from the decomposition products of this material
are valid.
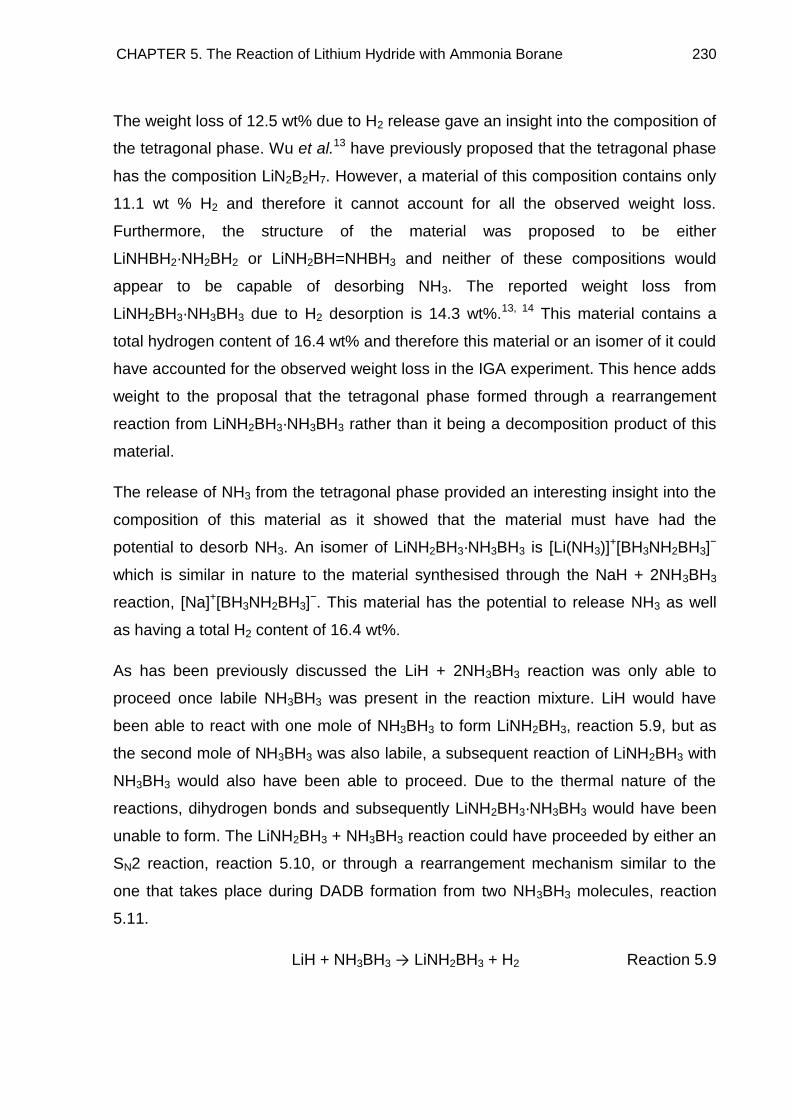
CHAPTER 5. The Reaction of Lithium Hydride with Ammonia Borane 230
The weight loss of 12.5 wt% due to H2 release gave an insight into the composition of
the tetragonal phase. Wu et al.13 have previously proposed that the tetragonal phase
has the composition LiN2B2H7. However, a material of this composition contains only
11.1 wt % H2 and therefore it cannot account for all the observed weight loss.
Furthermore, the structure of the material was proposed to be either
LiNHBH2·NH2BH2 or LiNH2BH=NHBH3 and neither of these compositions would
appear to be capable of desorbing NH3. The reported weight loss from
LiNH2BH3·NH3BH3 due to H2 desorption is 14.3 wt%.13, 14 This material contains a
total hydrogen content of 16.4 wt% and therefore this material or an isomer of it could
have accounted for the observed weight loss in the IGA experiment. This hence adds
weight to the proposal that the tetragonal phase formed through a rearrangement
reaction from LiNH2BH3·NH3BH3 rather than it being a decomposition product of this
material.
The release of NH3 from the tetragonal phase provided an interesting insight into the
composition of this material as it showed that the material must have had the
potential to desorb NH3. An isomer of LiNH2BH3·NH3BH3 is [Li(NH3)]+[BH3NH2BH3]
−
which is similar in nature to the material synthesised through the NaH + 2NH3BH3
reaction, [Na]+[BH3NH2BH3]−. This material has the potential to release NH3 as well
as having a total H2 content of 16.4 wt%.
As has been previously discussed the LiH + 2NH3BH3 reaction was only able to
proceed once labile NH3BH3 was present in the reaction mixture. LiH would have
been able to react with one mole of NH3BH3 to form LiNH2BH3, reaction 5.9, but as
the second mole of NH3BH3 was also labile, a subsequent reaction of LiNH2BH3 with
NH3BH3 would also have been able to proceed. Due to the thermal nature of the
reactions, dihydrogen bonds and subsequently LiNH2BH3·NH3BH3 would have been
unable to form. The LiNH2BH3 + NH3BH3 reaction could have proceeded by either an
SN2 reaction, reaction 5.10, or through a rearrangement mechanism similar to the
one that takes place during DADB formation from two NH3BH3 molecules, reaction
5.11.
LiH + NH3BH3 → LiNH2BH3 + H2 Reaction 5.9
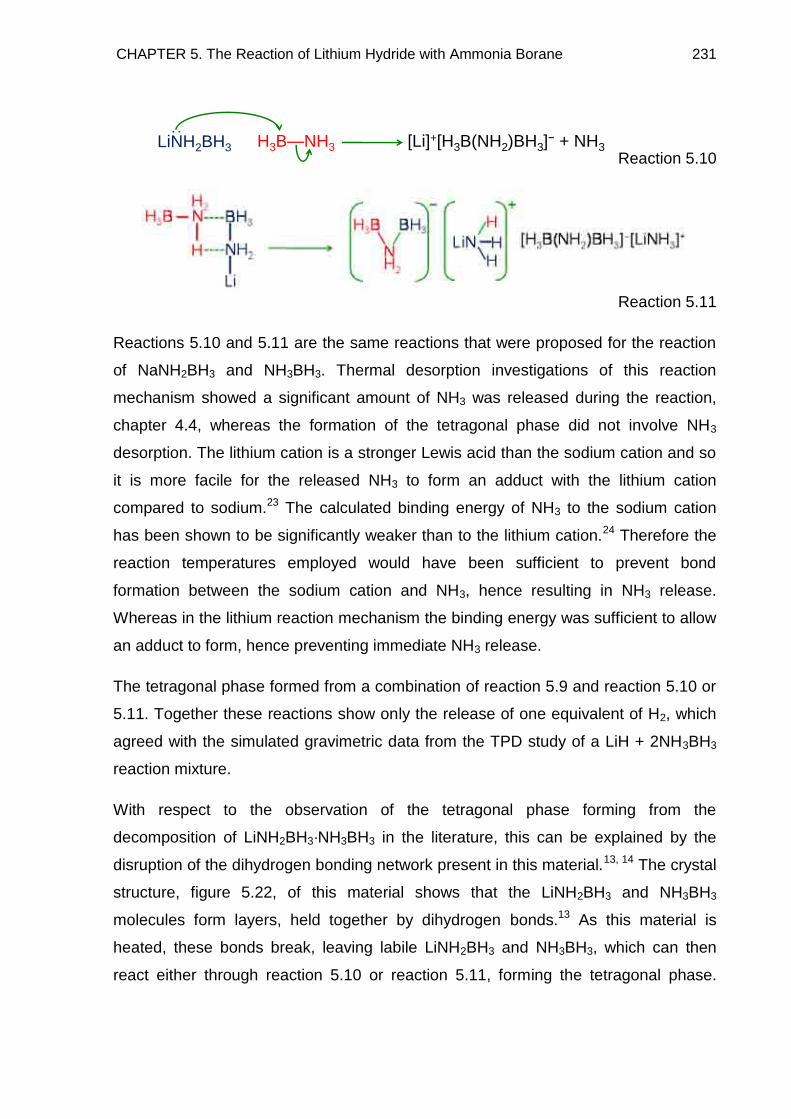
CHAPTER 5. The Reaction of Lithium Hydride with Ammonia Borane 231
Reaction 5.10
Reaction 5.11
Reactions 5.10 and 5.11 are the same reactions that were proposed for the reaction
of NaNH2BH3 and NH3BH3. Thermal desorption investigations of this reaction
mechanism showed a significant amount of NH3 was released during the reaction,
chapter 4.4, whereas the formation of the tetragonal phase did not involve NH3
desorption. The lithium cation is a stronger Lewis acid than the sodium cation and so
it is more facile for the released NH3 to form an adduct with the lithium cation
compared to sodium.23 The calculated binding energy of NH3 to the sodium cation
has been shown to be significantly weaker than to the lithium cation.24 Therefore the
reaction temperatures employed would have been sufficient to prevent bond
formation between the sodium cation and NH3, hence resulting in NH3 release.
Whereas in the lithium reaction mechanism the binding energy was sufficient to allow
an adduct to form, hence preventing immediate NH3 release.
The tetragonal phase formed from a combination of reaction 5.9 and reaction 5.10 or
5.11. Together these reactions show only the release of one equivalent of H2, which
agreed with the simulated gravimetric data from the TPD study of a LiH + 2NH3BH3
reaction mixture.
With respect to the observation of the tetragonal phase forming from the
decomposition of LiNH2BH3·NH3BH3 in the literature, this can be explained by the
disruption of the dihydrogen bonding network present in this material.13, 14 The crystal
structure, figure 5.22, of this material shows that the LiNH2BH3 and NH3BH3
molecules form layers, held together by dihydrogen bonds.13 As this material is
heated, these bonds break, leaving labile LiNH2BH3 and NH3BH3, which can then
react either through reaction 5.10 or reaction 5.11, forming the tetragonal phase.
LiNH2BH3 H3B—NH3
:
[Li]+[H3B(NH2)BH3]− + NH3
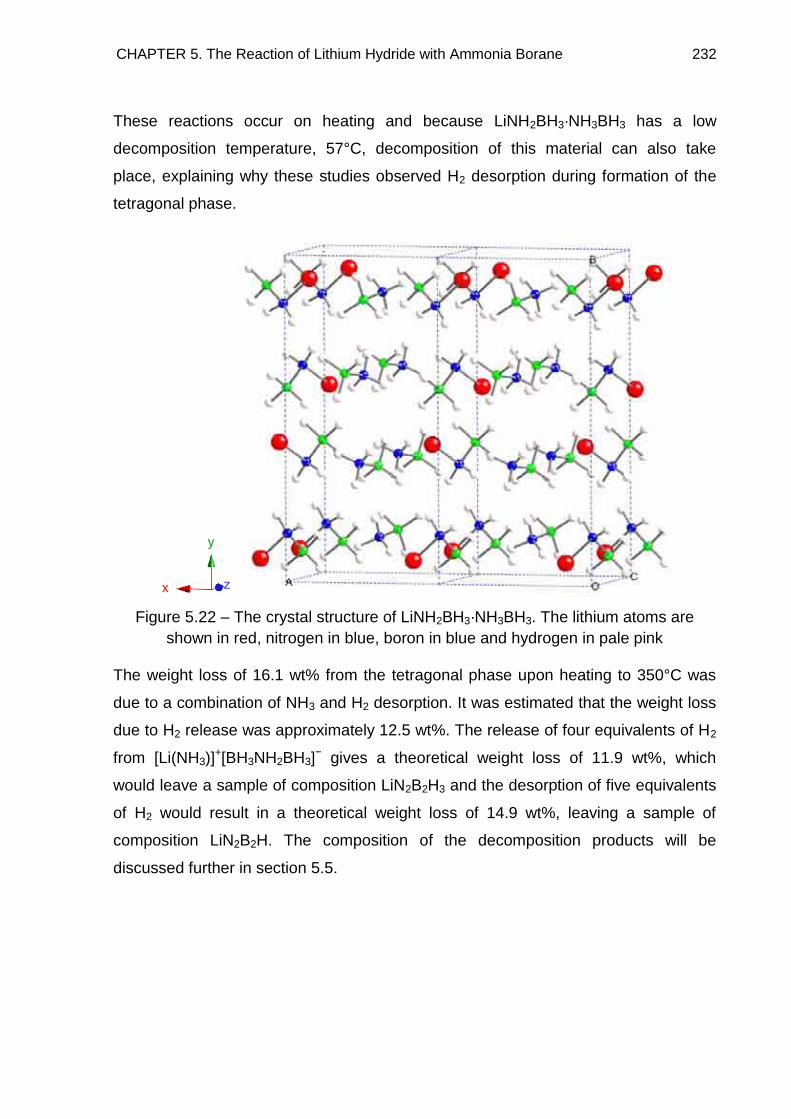
CHAPTER 5. The Reaction of Lithium Hydride with Ammonia Borane 232
These reactions occur on heating and because LiNH2BH3·NH3BH3 has a low
decomposition temperature, 57°C, decomposition of this material can also take
place, explaining why these studies observed H2 desorption during formation of the
tetragonal phase.
Figure 5.22 – The crystal structure of LiNH2BH3·NH3BH3. The lithium atoms are
shown in red, nitrogen in blue, boron in blue and hydrogen in pale pink
The weight loss of 16.1 wt% from the tetragonal phase upon heating to 350°C was
due to a combination of NH3 and H2 desorption. It was estimated that the weight loss
due to H2 release was approximately 12.5 wt%. The release of four equivalents of H2
from [Li(NH3)]+[BH3NH2BH3]
− gives a theoretical weight loss of 11.9 wt%, which
would leave a sample of composition LiN2B2H3 and the desorption of five equivalents
of H2 would result in a theoretical weight loss of 14.9 wt%, leaving a sample of
composition LiN2B2H. The composition of the decomposition products will be
discussed further in section 5.5.
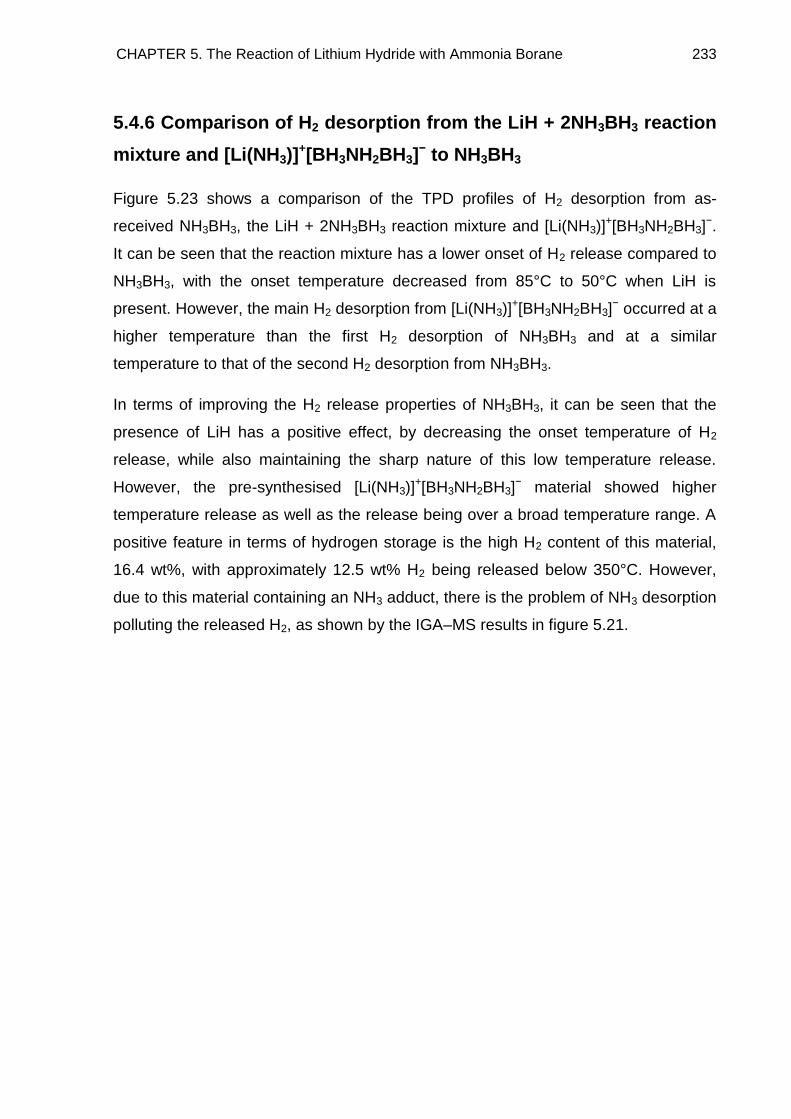
CHAPTER 5. The Reaction of Lithium Hydride with Ammonia Borane 233
5.4.6 Comparison of H2 desorption from the LiH + 2NH3BH3 reaction
mixture and [Li(NH3)]+[BH3NH2BH3]
− to NH3BH3
Figure 5.23 shows a comparison of the TPD profiles of H2 desorption from as-
received NH3BH3, the LiH + 2NH3BH3 reaction mixture and [Li(NH3)]+[BH3NH2BH3]
−.
It can be seen that the reaction mixture has a lower onset of H2 release compared to
NH3BH3, with the onset temperature decreased from 85°C to 50°C when LiH is
present. However, the main H2 desorption from [Li(NH3)]+[BH3NH2BH3]
− occurred at a
higher temperature than the first H2 desorption of NH3BH3 and at a similar
temperature to that of the second H2 desorption from NH3BH3.
In terms of improving the H2 release properties of NH3BH3, it can be seen that the
presence of LiH has a positive effect, by decreasing the onset temperature of H2
release, while also maintaining the sharp nature of this low temperature release.
However, the pre-synthesised [Li(NH3)]+[BH3NH2BH3]
− material showed higher
temperature release as well as the release being over a broad temperature range. A
positive feature in terms of hydrogen storage is the high H2 content of this material,
16.4 wt%, with approximately 12.5 wt% H2 being released below 350°C. However,
due to this material containing an NH3 adduct, there is the problem of NH3 desorption
polluting the released H2, as shown by the IGA–MS results in figure 5.21.
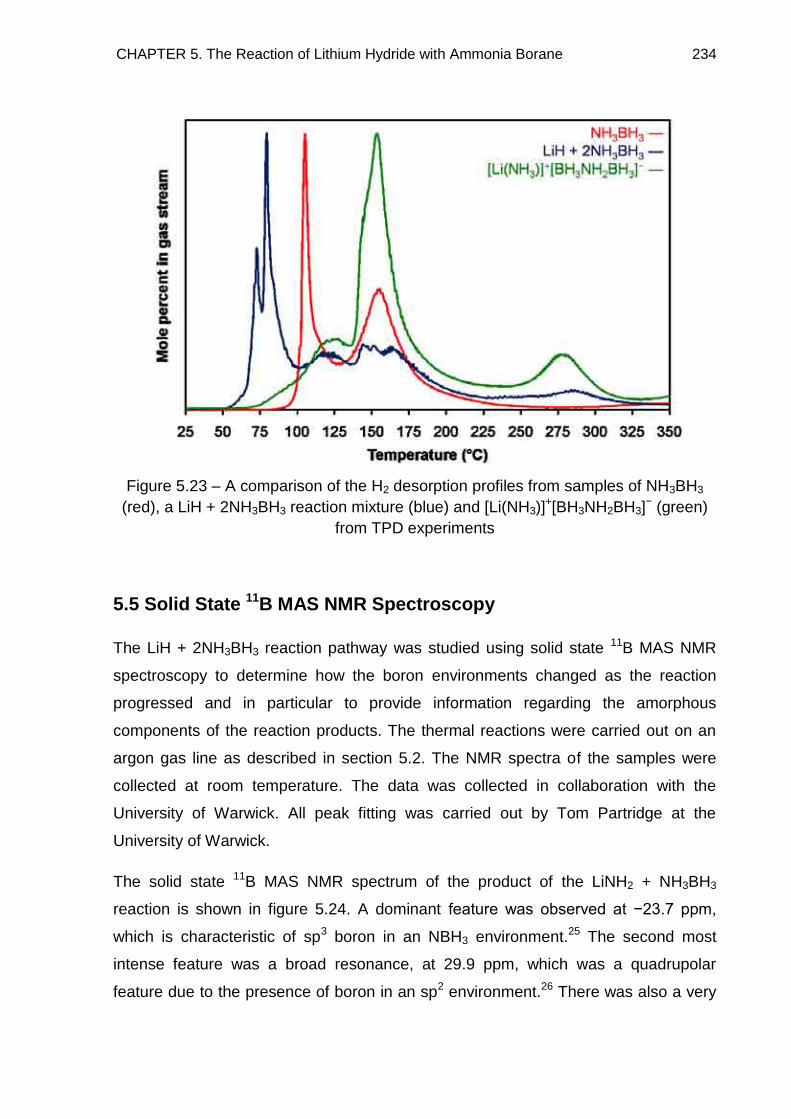
CHAPTER 5. The Reaction of Lithium Hydride with Ammonia Borane 234
Figure 5.23 – A comparison of the H2 desorption profiles from samples of NH3BH3
(red), a LiH + 2NH3BH3 reaction mixture (blue) and [Li(NH3)]+[BH3NH2BH3]
− (green)
from TPD experiments
5.5 Solid State 11B MAS NMR Spectroscopy
The LiH + 2NH3BH3 reaction pathway was studied using solid state 11B MAS NMR
spectroscopy to determine how the boron environments changed as the reaction
progressed and in particular to provide information regarding the amorphous
components of the reaction products. The thermal reactions were carried out on an
argon gas line as described in section 5.2. The NMR spectra of the samples were
collected at room temperature. The data was collected in collaboration with the
University of Warwick. All peak fitting was carried out by Tom Partridge at the
University of Warwick.
The solid state 11B MAS NMR spectrum of the product of the LiNH2 + NH3BH3
reaction is shown in figure 5.24. A dominant feature was observed at −23.7 ppm,
which is characteristic of sp3 boron in an NBH3 environment.25 The second most
intense feature was a broad resonance, at 29.9 ppm, which was a quadrupolar
feature due to the presence of boron in an sp2 environment.26 There was also a very
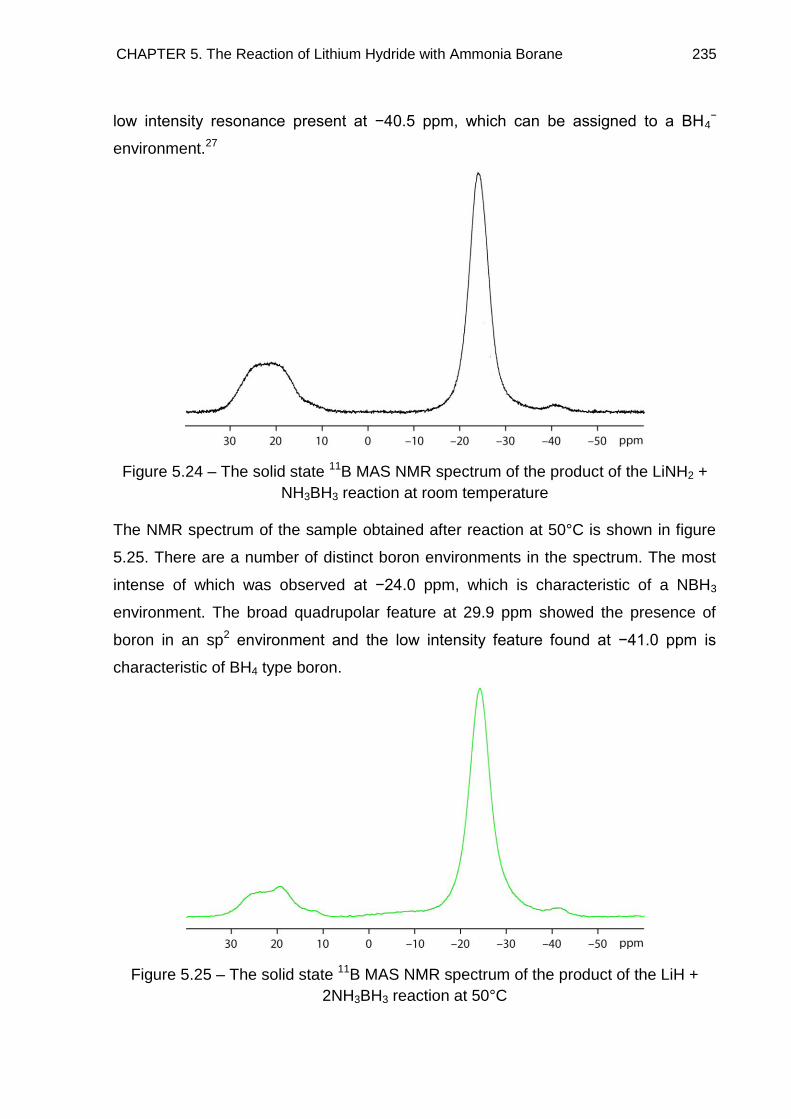
CHAPTER 5. The Reaction of Lithium Hydride with Ammonia Borane 235
low intensity resonance present at −40.5 ppm, which can be assigned to a BH4−
environment.27
Figure 5.24 – The solid state 11B MAS NMR spectrum of the product of the LiNH2 +
NH3BH3 reaction at room temperature
The NMR spectrum of the sample obtained after reaction at 50°C is shown in figure
5.25. There are a number of distinct boron environments in the spectrum. The most
intense of which was observed at −24.0 ppm, which is characteristic of a NBH3
environment. The broad quadrupolar feature at 29.9 ppm showed the presence of
boron in an sp2 environment and the low intensity feature found at −41.0 ppm is
characteristic of BH4 type boron.
Figure 5.25 – The solid state 11B MAS NMR spectrum of the product of the LiH +
2NH3BH3 reaction at 50°C
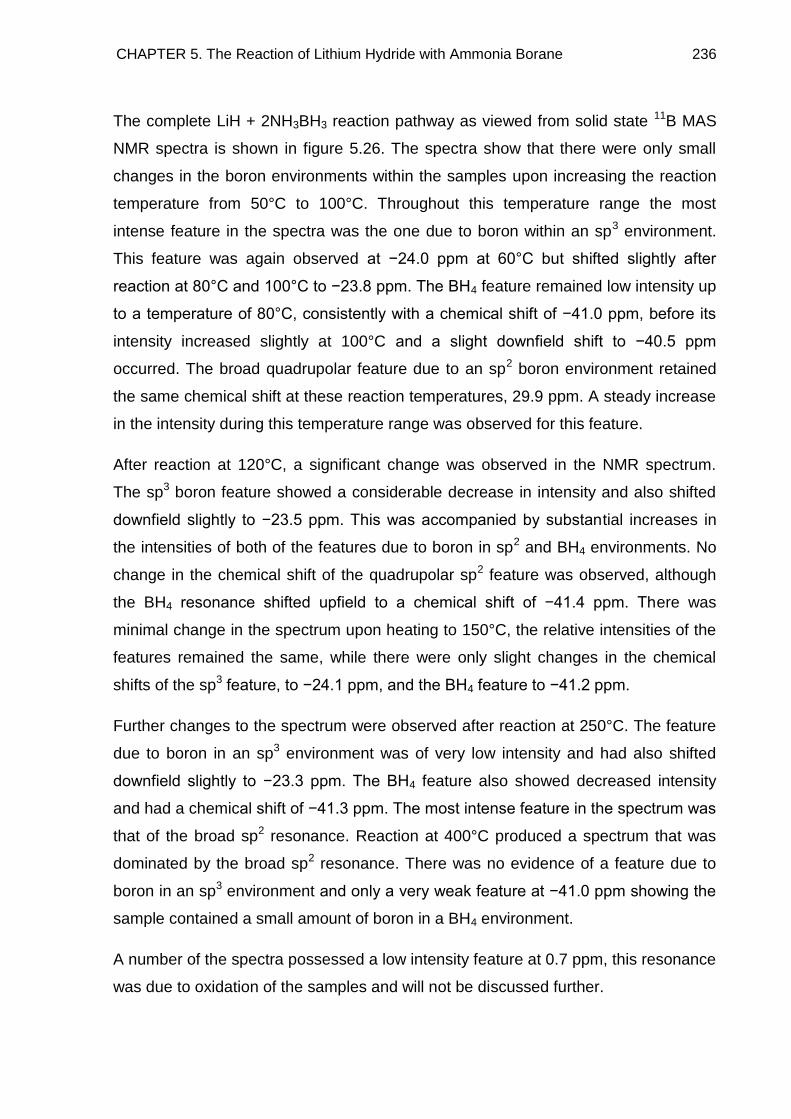
CHAPTER 5. The Reaction of Lithium Hydride with Ammonia Borane 236
The complete LiH + 2NH3BH3 reaction pathway as viewed from solid state 11B MAS
NMR spectra is shown in figure 5.26. The spectra show that there were only small
changes in the boron environments within the samples upon increasing the reaction
temperature from 50°C to 100°C. Throughout this temperature range the most
intense feature in the spectra was the one due to boron within an sp3 environment.
This feature was again observed at −24.0 ppm at 60°C but shifted slightly after
reaction at 80°C and 100°C to −23.8 ppm. The BH4 feature remained low intensity up
to a temperature of 80°C, consistently with a chemical shift of −41.0 ppm, before its
intensity increased slightly at 100°C and a slight downfield shift to −40.5 ppm
occurred. The broad quadrupolar feature due to an sp2 boron environment retained
the same chemical shift at these reaction temperatures, 29.9 ppm. A steady increase
in the intensity during this temperature range was observed for this feature.
After reaction at 120°C, a significant change was observed in the NMR spectrum.
The sp3 boron feature showed a considerable decrease in intensity and also shifted
downfield slightly to −23.5 ppm. This was accompanied by substantial increases in
the intensities of both of the features due to boron in sp2 and BH4 environments. No
change in the chemical shift of the quadrupolar sp2 feature was observed, although
the BH4 resonance shifted upfield to a chemical shift of −41.4 ppm. There was
minimal change in the spectrum upon heating to 150°C, the relative intensities of the
features remained the same, while there were only slight changes in the chemical
shifts of the sp3 feature, to −24.1 ppm, and the BH4 feature to −41.2 ppm.
Further changes to the spectrum were observed after reaction at 250°C. The feature
due to boron in an sp3 environment was of very low intensity and had also shifted
downfield slightly to −23.3 ppm. The BH4 feature also showed decreased intensity
and had a chemical shift of −41.3 ppm. The most intense feature in the spectrum was
that of the broad sp2 resonance. Reaction at 400°C produced a spectrum that was
dominated by the broad sp2 resonance. There was no evidence of a feature due to
boron in an sp3 environment and only a very weak feature at −41.0 ppm showing the
sample contained a small amount of boron in a BH4 environment.
A number of the spectra possessed a low intensity feature at 0.7 ppm, this resonance
was due to oxidation of the samples and will not be discussed further.
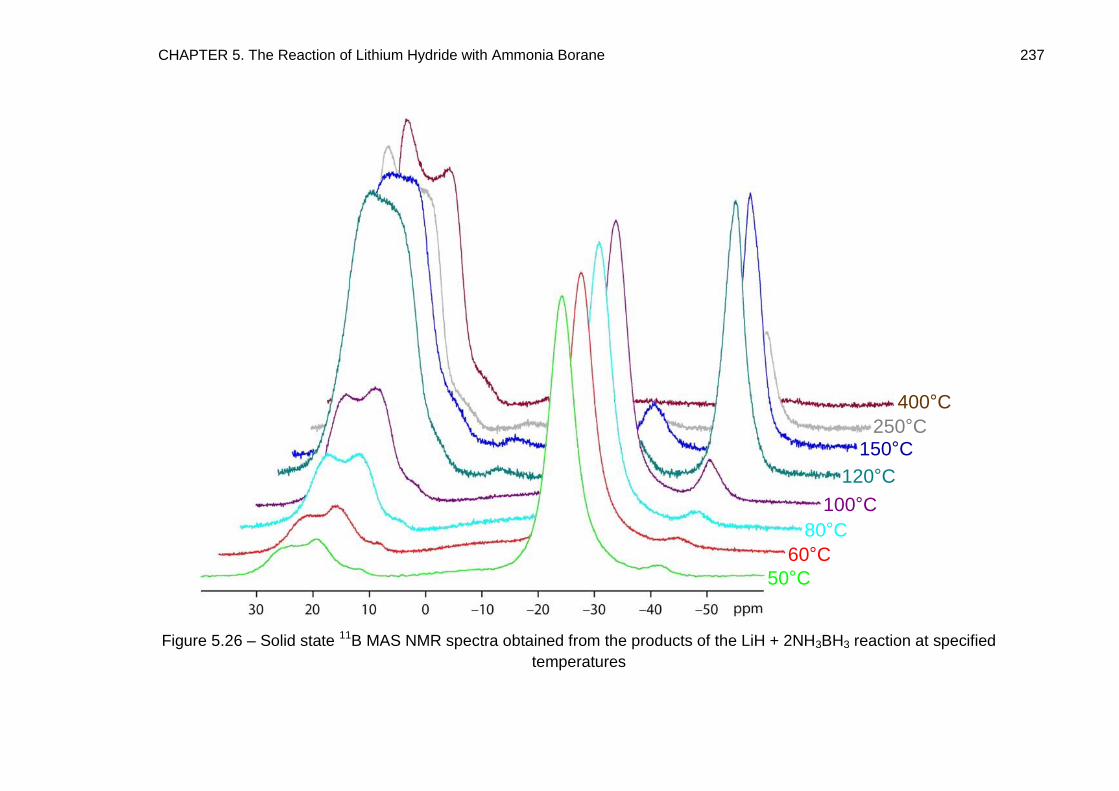
CHAPTER 5. The Reaction of Lithium Hydride with Ammonia Borane 237
Figure 5.26 – Solid state 11B MAS NMR spectra obtained from the products of the LiH + 2NH3BH3 reaction at specified
temperatures
50°C
60°C
80°C
100°C
120°C
150°C250°C
400°C
CHAPTER 5. The Reaction of Lithium Hydride with Ammonia Borane 238
5.5.1 Discussion
Powder XRD results showed that the crystalline product of the LiNH2 + NH3BH3
reaction was LiNH2BH3, although thermal desorption investigations suggested that
the amorphous phase Li(NH3)NH2BH3 had also formed. Literature studies have
shown that these two materials produce different 11B NMR spectra. The solid state
11B NMR spectrum of LiNH2BH3 shows a single resonance at −22.9 ppm,4 while that
of the ammoniated material has a single resonance at −23.2 ppm.9 Therefore it may
have been expected that the NMR spectrum of the product of the LiNH2 + NH3BH3
reaction displayed two resonances at similar chemical shifts to these materials. The
single resonance observed in the spectrum, however, disagreed with this hypothesis.
The chemical shift, −23.7 ppm, of this resonance was also shifted upfield compared
to the literature values of LiNH2BH3 and Li(NH3)NH2BH3. The NMR spectrum
therefore showed that the sample contained only one BH3 environment. The fact that
the chemical shift of this environment was shifted upfield compared to LiNH2BH3 was
a good indication that the product of the LiNH2 + NH3BH3 reaction was an
ammoniated material. Similar observations have been made when ammoniating
Ca(BH4)2, with the chemical shift of Ca(BH4)2 observed at −32.7 ppm, while that of
the ammoniated compound was observed at −34.7 ppm.22 Ammoniated Ca(NH2BH3)2
also shows an upfield shift from −17 ppm in Ca(NH2BH3)2 to −21 ppm.21 The
presence of coordinated NH3 results in electron donation to the lithium and
consequently an upfield shift in the position of the BH3 resonance due to increased
shielding. Therefore the material responsible for the resonance at −23.7 ppm was
most likely Li(NH3)NH2BH3. However, it is unclear as to why LiNH2BH3 would have
been absent from the sample. This may in part have been due to the delay between
sample synthesis and spectrum collection, with residual NH3 in the glove box binding
to LiNH2BH3, forming the ammoniated material. It seems unlikely, however, that this
would have resulted in the complete absence of LiNH2BH3 from the sample.
In section 5.3.2 it was hypothesised that remaining LiNH2 in the product of the LiNH2
+ NH3BH3 reaction was due to the decomposition of NH3BH3. This hypothesis was
supported by the 11B NMR spectrum of this product. The broad quadrupolar
resonance due to the presence of boron in an sp2 environment at 29.9 ppm is also
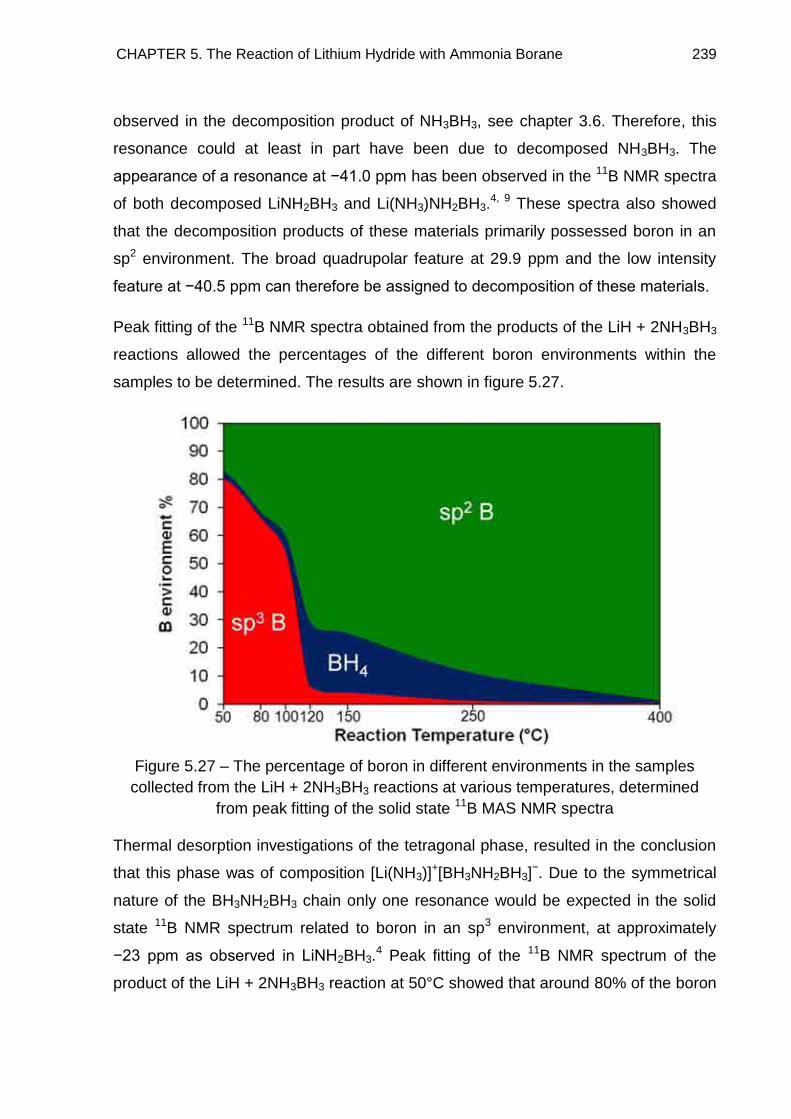
CHAPTER 5. The Reaction of Lithium Hydride with Ammonia Borane 239
observed in the decomposition product of NH3BH3, see chapter 3.6. Therefore, this
resonance could at least in part have been due to decomposed NH3BH3. The
appearance of a resonance at −41.0 ppm has been observed in the 11B NMR spectra
of both decomposed LiNH2BH3 and Li(NH3)NH2BH3.4, 9 These spectra also showed
that the decomposition products of these materials primarily possessed boron in an
sp2 environment. The broad quadrupolar feature at 29.9 ppm and the low intensity
feature at −40.5 ppm can therefore be assigned to decomposition of these materials.
Peak fitting of the 11B NMR spectra obtained from the products of the LiH + 2NH3BH3
reactions allowed the percentages of the different boron environments within the
samples to be determined. The results are shown in figure 5.27.
Figure 5.27 – The percentage of boron in different environments in the samples
collected from the LiH + 2NH3BH3 reactions at various temperatures, determined
from peak fitting of the solid state 11B MAS NMR spectra
Thermal desorption investigations of the tetragonal phase, resulted in the conclusion
that this phase was of composition [Li(NH3)]+[BH3NH2BH3]
−. Due to the symmetrical
nature of the BH3NH2BH3 chain only one resonance would be expected in the solid
state 11B NMR spectrum related to boron in an sp3 environment, at approximately
−23 ppm as observed in LiNH2BH3.4 Peak fitting of the 11B NMR spectrum of the
product of the LiH + 2NH3BH3 reaction at 50°C showed that around 80% of the boron
CHAPTER 5. The Reaction of Lithium Hydride with Ammonia Borane 240
in the product was in an sp3 environment, with 2.5% present as BH4 and 17.5% in an
sp2 environment. This spectrum showed that the main product of the LiH + 2NH3BH3
reaction at 50°C was primarily that of [Li(NH3)]+[BH3NH2BH3]
−, however, the presence
of both BH4 and sp2 boron environments showed that other reactions were also
taking place. The chemical shift of the main resonance in the spectrum, −24.0 ppm,
was supportive of the proposal that the tetragonal phase contained an NH3 molecule
bound to the Li cation. The chemical shifts of BH3 groups in the metal amidoboranes
are observed at lower chemical shifts than this and several NMR studies on
ammoniating materials have shown that the resonance experiences a shift upfield
due to electron donation from the NH3 to the metal cation.4, 9, 21, 22 The chemical shift
of this boron resonance therefore supports the presence of an NH3 adduct within the
tetragonal phase.
On increasing the reaction temperature to 100°C there was a decrease in the
percentage of boron within an sp3 environment, which was accompanied by an
increase in the amount of sp2 boron. This showed that the decomposition of
[Li(NH3)]+[BH3NH2BH3]
− led to the formation of a material possessing boron only in an
sp2 environment. During this temperature range there was no increase in the amount
of boron present as BH4. This partial decomposition of [Li(NH3)]+[BH3NH2BH3]
− below
100°C also showed that the observed H2 release from this material below this
temperature in thermal desorption studies, section 5.4, was related to this
decomposition as well as the other possibilities previously discussed. Figure 5.27
shows that reaction at 120°C resulted in a significant amount of decomposition of
[Li(NH3)]+[BH3NH2BH3]
− with the change in boron environment mostly from sp3 to sp2,
although there was also an increase in the amount of boron present as BH4. The
appearance of BH4 in the reaction pathway was only detected by powder XRD
patterns in minimal amounts. The chemical shift of the BH4 resonance was consistent
with that observed in crystalline LiBH4.28 Furthermore, because NaBH4 was observed
in the decomposition pathway of [Na]+[BH3NH2BH3]− it would be reasonable to expect
LiBH4 to form during the decomposition of [Li(NH3)]+[BH3NH2BH3]
−. The reaction
temperatures employed may have been insufficient to promote the crystallisation of
LiBH4 and hence it was not observed in powder XRD patterns. The percentage of
BH4 in the sample decreased upon heating to 250°C, showing that the LiBH4 had
CHAPTER 5. The Reaction of Lithium Hydride with Ammonia Borane 241
partly decomposed and after reaction at 400°C there was very little LiBH4 remaining
in the sample. The decomposition of LiBH4 after heating to 250°C has been reported,
although the main decomposition event occurs at 453°C.29 The decreased BH4
resonance was accompanied by an increase in the sp2 resonance. This is a
discrepancy with the known decomposition pathway of LiBH4. The ultimate
decomposition product has been shown to be elemental boron, which produces a
broad resonance in 11B NMR spectra over 2 ppm.30 Further to this a number of
studies have identified an intermediate product in the decomposition pathway as
Li2B12H12, which produces a resonance at −12 ppm.30 Neither of these two
resonances were observed in any of the spectra of this study, suggesting that the
non-crystalline state of LiBH4 must have affected its decomposition pathway.
The weight loss observed in the IGA–MS study of [Li(NH3)]+[BH3NH2BH3]
−, section
5.4, implied that the decomposition product of this material was of composition
LiN2B2H3. This composition was probably a combination of a number of materials. It
has been established that one of the decomposition products involved the BH4− ion.
The remaining decomposition products must have contained boron in an sp2
environment. Therefore potential products included Li3BN2, (LiNBH)n, (NHBH)n and
BN. All of these materials produce broad quadrupolar resonances in solid state 11B
NMR spectra at similar chemical shifts and therefore it was not possible to determine
which of these sp2 boron containing materials formed.4, 31-33
Wu et al.13 concluded that the tetragonal phase was of composition LiN2B2H7 and
could be either LiNHBH2·NH2BH2 or LiNH2BH=NHBH3. These compositions were
based on solid state 11B NMR measurements, which showed the tetragonal phase
produced resonances at −24.1 ppm and 29.9 ppm, in agreement with the results
presented here. The LiNH2BH=NHBH3 possibility does not appear to fit with the NMR
results, as this material possesses boron in two environments, both of which would
account for 50% of the boron in the compound, which disagrees with the results from
peak fitting. The authors noted that the NMR spectrum resembled that of
polyaminoborane, which suggested that the LiNHBH2·NH2BH2 was a polymeric
product.25, 31 However, as discussed above, the weight loss observed in IGA
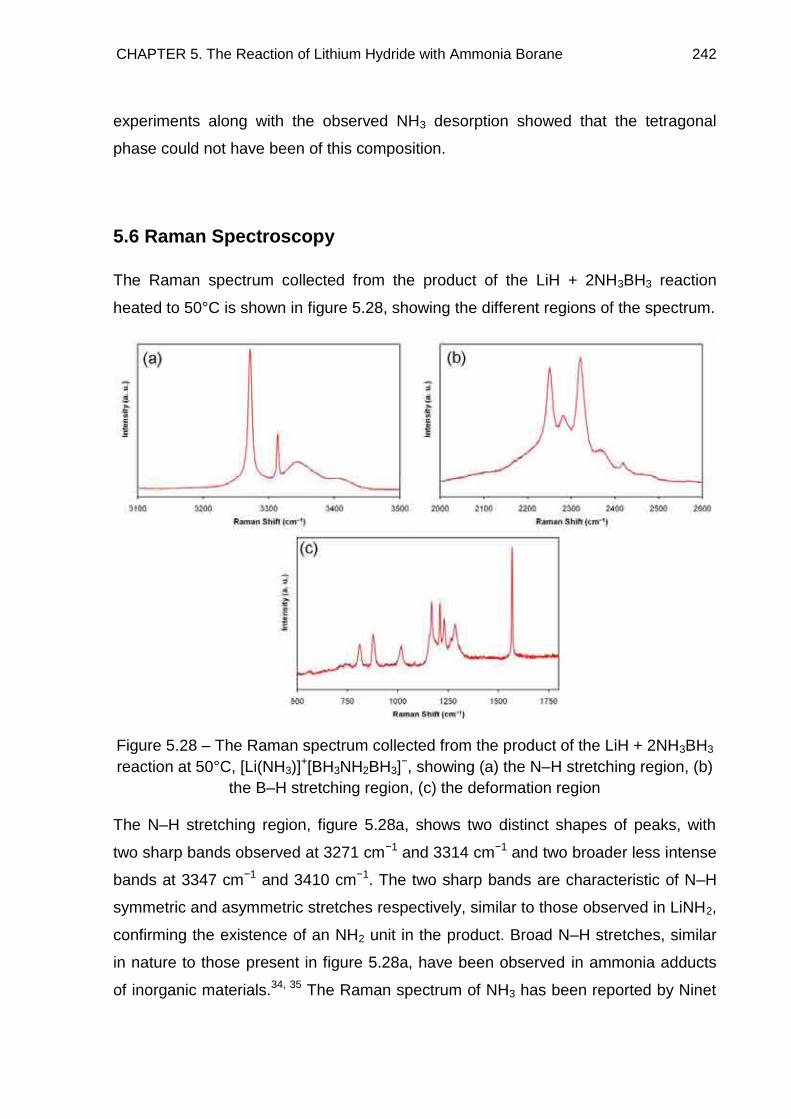
CHAPTER 5. The Reaction of Lithium Hydride with Ammonia Borane 242
experiments along with the observed NH3 desorption showed that the tetragonal
phase could not have been of this composition.
5.6 Raman Spectroscopy
The Raman spectrum collected from the product of the LiH + 2NH3BH3 reaction
heated to 50°C is shown in figure 5.28, showing the different regions of the spectrum.
Figure 5.28 – The Raman spectrum collected from the product of the LiH + 2NH3BH3
reaction at 50°C, [Li(NH3)]+[BH3NH2BH3]
−, showing (a) the N–H stretching region, (b)
the B–H stretching region, (c) the deformation region
The N–H stretching region, figure 5.28a, shows two distinct shapes of peaks, with
two sharp bands observed at 3271 cm−1 and 3314 cm−1 and two broader less intense
bands at 3347 cm−1 and 3410 cm−1. The two sharp bands are characteristic of N–H
symmetric and asymmetric stretches respectively, similar to those observed in LiNH2,
confirming the existence of an NH2 unit in the product. Broad N–H stretches, similar
in nature to those present in figure 5.28a, have been observed in ammonia adducts
of inorganic materials.34, 35 The Raman spectrum of NH3 has been reported by Ninet
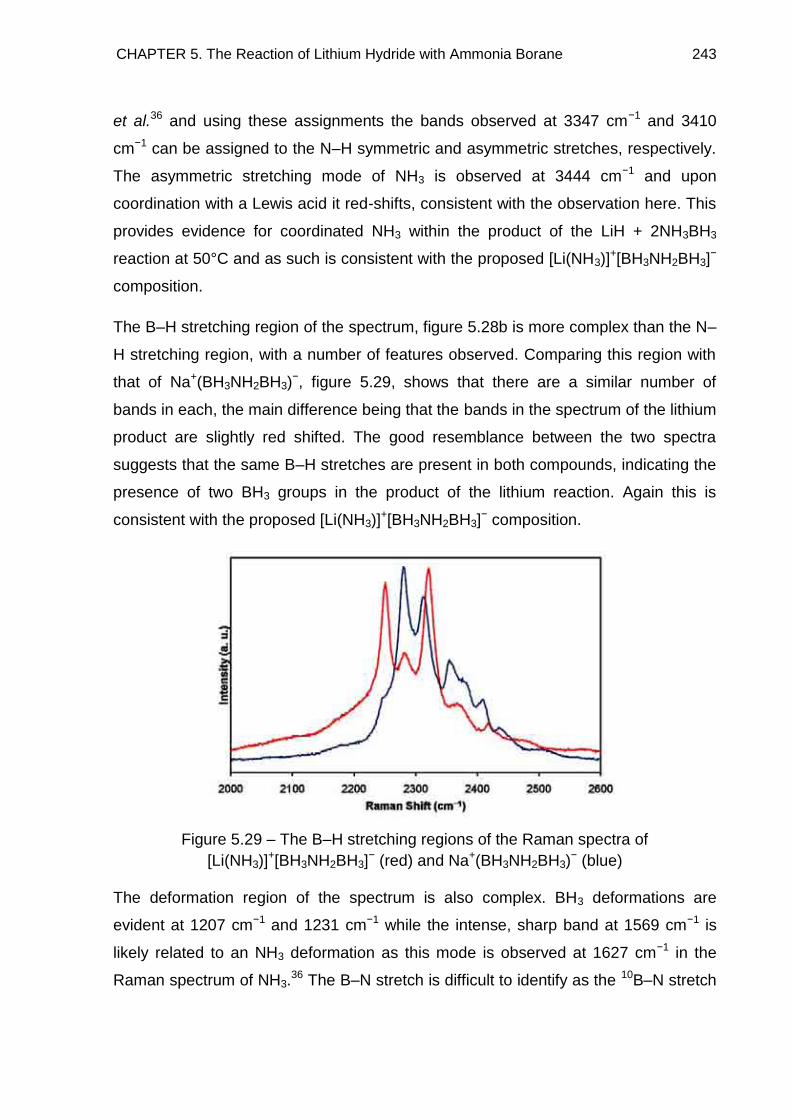
CHAPTER 5. The Reaction of Lithium Hydride with Ammonia Borane 243
et al.36 and using these assignments the bands observed at 3347 cm−1 and 3410
cm−1 can be assigned to the N–H symmetric and asymmetric stretches, respectively.
The asymmetric stretching mode of NH3 is observed at 3444 cm−1 and upon
coordination with a Lewis acid it red-shifts, consistent with the observation here. This
provides evidence for coordinated NH3 within the product of the LiH + 2NH3BH3
reaction at 50°C and as such is consistent with the proposed [Li(NH3)]+[BH3NH2BH3]
−
composition.
The B–H stretching region of the spectrum, figure 5.28b is more complex than the N–
H stretching region, with a number of features observed. Comparing this region with
that of Na+(BH3NH2BH3)−, figure 5.29, shows that there are a similar number of
bands in each, the main difference being that the bands in the spectrum of the lithium
product are slightly red shifted. The good resemblance between the two spectra
suggests that the same B–H stretches are present in both compounds, indicating the
presence of two BH3 groups in the product of the lithium reaction. Again this is
consistent with the proposed [Li(NH3)]+[BH3NH2BH3]
− composition.
Figure 5.29 – The B–H stretching regions of the Raman spectra of
[Li(NH3)]+[BH3NH2BH3]
− (red) and Na+(BH3NH2BH3)− (blue)
The deformation region of the spectrum is also complex. BH3 deformations are
evident at 1207 cm−1 and 1231 cm−1 while the intense, sharp band at 1569 cm−1 is
likely related to an NH3 deformation as this mode is observed at 1627 cm−1 in the
Raman spectrum of NH3.36 The B–N stretch is difficult to identify as the 10B–N stretch
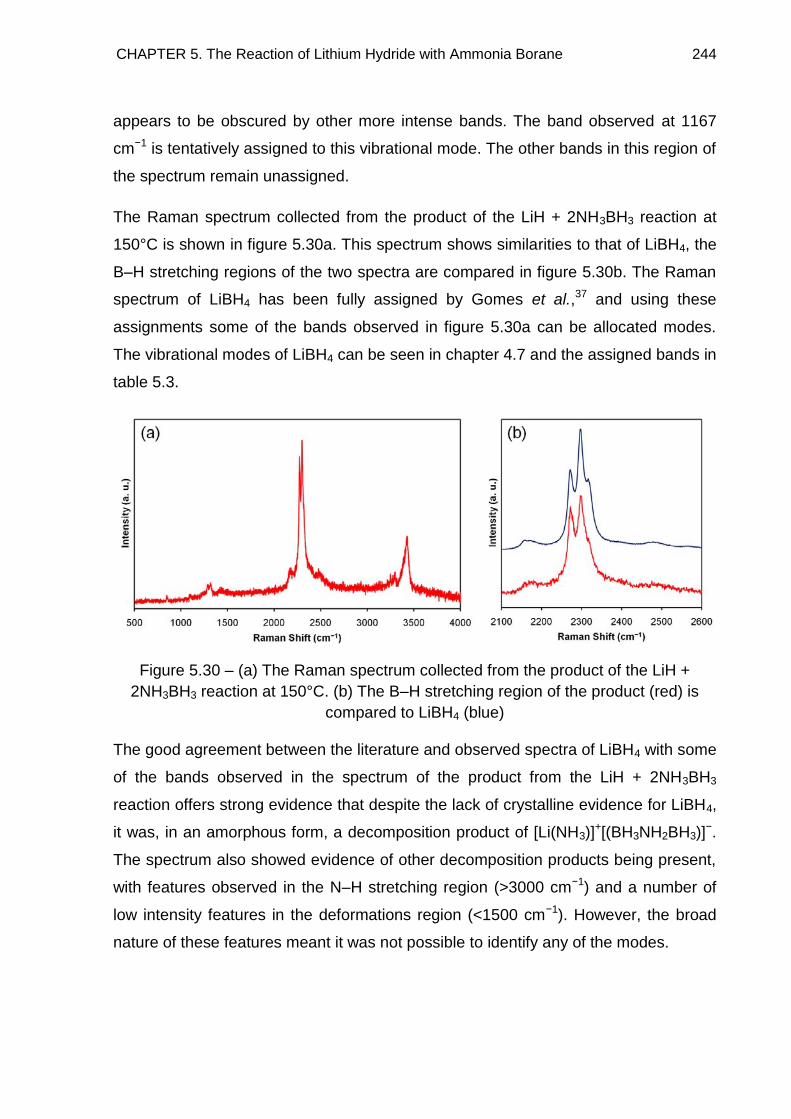
CHAPTER 5. The Reaction of Lithium Hydride with Ammonia Borane 244
appears to be obscured by other more intense bands. The band observed at 1167
cm−1 is tentatively assigned to this vibrational mode. The other bands in this region of
the spectrum remain unassigned.
The Raman spectrum collected from the product of the LiH + 2NH3BH3 reaction at
150°C is shown in figure 5.30a. This spectrum shows similarities to that of LiBH4, the
B–H stretching regions of the two spectra are compared in figure 5.30b. The Raman
spectrum of LiBH4 has been fully assigned by Gomes et al.,37 and using these
assignments some of the bands observed in figure 5.30a can be allocated modes.
The vibrational modes of LiBH4 can be seen in chapter 4.7 and the assigned bands in
table 5.3.
Figure 5.30 – (a) The Raman spectrum collected from the product of the LiH +
2NH3BH3 reaction at 150°C. (b) The B–H stretching region of the product (red) is
compared to LiBH4 (blue)
The good agreement between the literature and observed spectra of LiBH4 with some
of the bands observed in the spectrum of the product from the LiH + 2NH3BH3
reaction offers strong evidence that despite the lack of crystalline evidence for LiBH4,
it was, in an amorphous form, a decomposition product of [Li(NH3)]+[(BH3NH2BH3)]
−.
The spectrum also showed evidence of other decomposition products being present,
with features observed in the N–H stretching region (>3000 cm−1) and a number of
low intensity features in the deformations region (<1500 cm−1). However, the broad
nature of these features meant it was not possible to identify any of the modes.
CHAPTER 5. The Reaction of Lithium Hydride with Ammonia Borane 245
Table 5.3 – Literature and observed Raman shifts and assignments for LiBH4 with
observed data for the product of the LiH + 2NH3BH3 reaction at 150°C
LiBH4 Product of LiH +
2NH3BH3 at 150°C
Literature37 Observed Observed
Assignment Raman shift
(cm−1)
Raman shift
(cm−1)
Raman shift (cm−1)
ν4 1090 1095 1099
ν4‘ 1099
3νL 1235 1237 1236
ν2 1286 1288 1289
ν2‘ 1316 1320 1322
2ν4 2157 2161 2163
2ν4‘ 2177 2178 2179
ν3 2275 2274 2274
ν1 2301 2299 2300
ν3‘ 2321 (sh) 2319 2318
com 2391 2395
com 2491 2487 2485
com 2572 2571 2560
sh = shoulder, com = combination bands
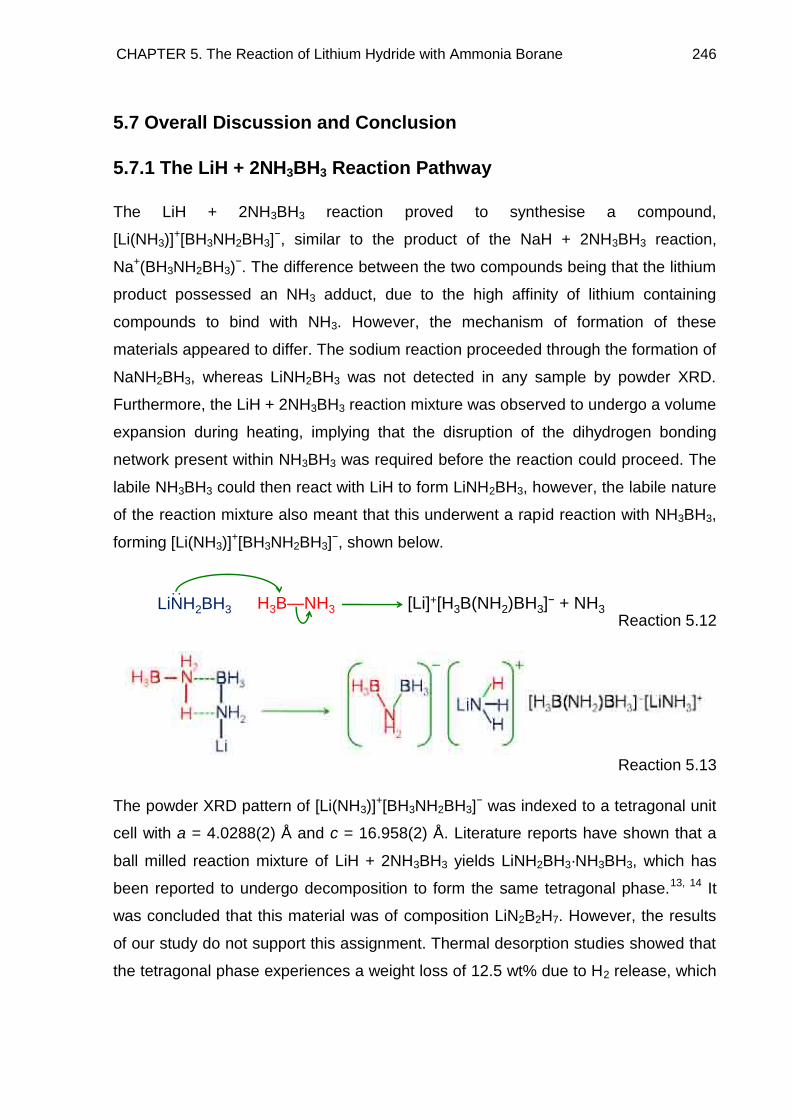
CHAPTER 5. The Reaction of Lithium Hydride with Ammonia Borane 246
5.7 Overall Discussion and Conclusion
5.7.1 The LiH + 2NH3BH3 Reaction Pathway
The LiH + 2NH3BH3 reaction proved to synthesise a compound,
[Li(NH3)]+[BH3NH2BH3]
−, similar to the product of the NaH + 2NH3BH3 reaction,
Na+(BH3NH2BH3)−. The difference between the two compounds being that the lithium
product possessed an NH3 adduct, due to the high affinity of lithium containing
compounds to bind with NH3. However, the mechanism of formation of these
materials appeared to differ. The sodium reaction proceeded through the formation of
NaNH2BH3, whereas LiNH2BH3 was not detected in any sample by powder XRD.
Furthermore, the LiH + 2NH3BH3 reaction mixture was observed to undergo a volume
expansion during heating, implying that the disruption of the dihydrogen bonding
network present within NH3BH3 was required before the reaction could proceed. The
labile NH3BH3 could then react with LiH to form LiNH2BH3, however, the labile nature
of the reaction mixture also meant that this underwent a rapid reaction with NH3BH3,
forming [Li(NH3)]+[BH3NH2BH3]
−, shown below.
Reaction 5.12
Reaction 5.13
The powder XRD pattern of [Li(NH3)]+[BH3NH2BH3]
− was indexed to a tetragonal unit
cell with a = 4.0288(2) Å and c = 16.958(2) Å. Literature reports have shown that a
ball milled reaction mixture of LiH + 2NH3BH3 yields LiNH2BH3·NH3BH3, which has
been reported to undergo decomposition to form the same tetragonal phase.13, 14 It
was concluded that this material was of composition LiN2B2H7. However, the results
of our study do not support this assignment. Thermal desorption studies showed that
the tetragonal phase experiences a weight loss of 12.5 wt% due to H2 release, which
LiNH2BH3 H3B—NH3
:
[Li]+[H3B(NH2)BH3]− + NH3
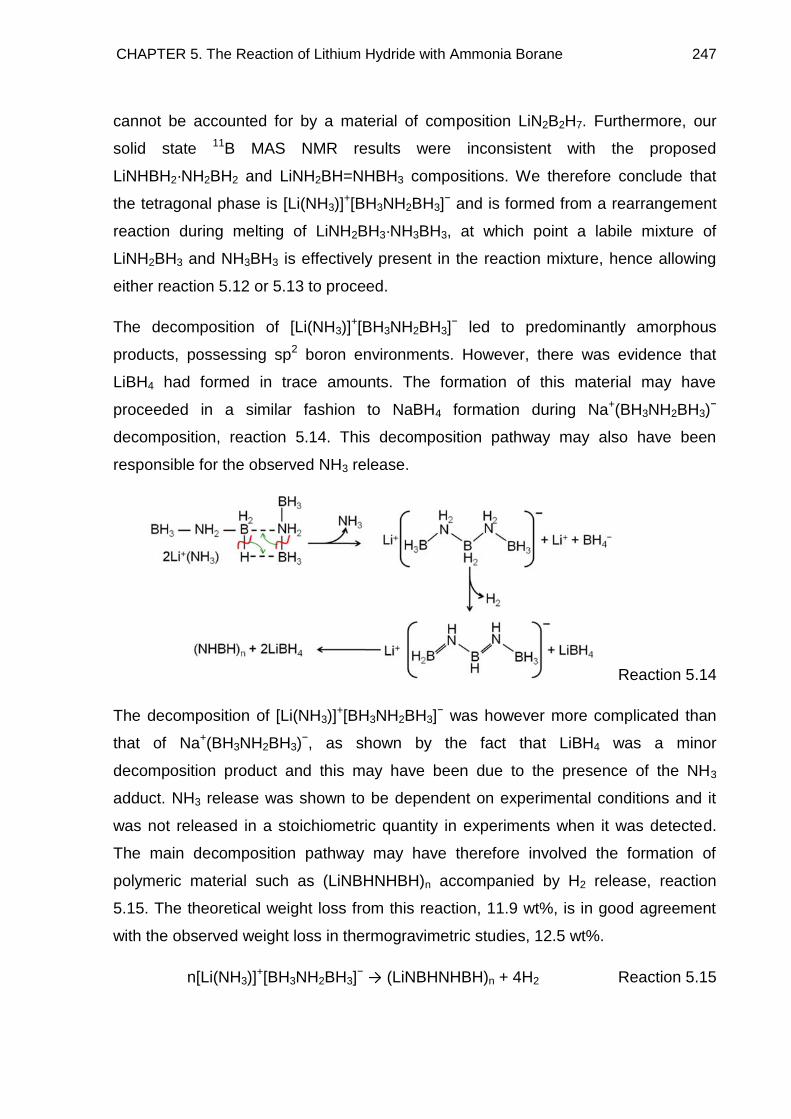
CHAPTER 5. The Reaction of Lithium Hydride with Ammonia Borane 247
cannot be accounted for by a material of composition LiN2B2H7. Furthermore, our
solid state 11B MAS NMR results were inconsistent with the proposed
LiNHBH2·NH2BH2 and LiNH2BH=NHBH3 compositions. We therefore conclude that
the tetragonal phase is [Li(NH3)]+[BH3NH2BH3]
− and is formed from a rearrangement
reaction during melting of LiNH2BH3·NH3BH3, at which point a labile mixture of
LiNH2BH3 and NH3BH3 is effectively present in the reaction mixture, hence allowing
either reaction 5.12 or 5.13 to proceed.
The decomposition of [Li(NH3)]+[BH3NH2BH3]
− led to predominantly amorphous
products, possessing sp2 boron environments. However, there was evidence that
LiBH4 had formed in trace amounts. The formation of this material may have
proceeded in a similar fashion to NaBH4 formation during Na+(BH3NH2BH3)−
decomposition, reaction 5.14. This decomposition pathway may also have been
responsible for the observed NH3 release.
Reaction 5.14
The decomposition of [Li(NH3)]+[BH3NH2BH3]
− was however more complicated than
that of Na+(BH3NH2BH3)−, as shown by the fact that LiBH4 was a minor
decomposition product and this may have been due to the presence of the NH3
adduct. NH3 release was shown to be dependent on experimental conditions and it
was not released in a stoichiometric quantity in experiments when it was detected.
The main decomposition pathway may have therefore involved the formation of
polymeric material such as (LiNBHNHBH)n accompanied by H2 release, reaction
5.15. The theoretical weight loss from this reaction, 11.9 wt%, is in good agreement
with the observed weight loss in thermogravimetric studies, 12.5 wt%.
n[Li(NH3)]+[BH3NH2BH3]
− → (LiNBHNHBH)n + 4H2 Reaction 5.15
CHAPTER 5. The Reaction of Lithium Hydride with Ammonia Borane 248
5.7.2 Potential as a Hydrogen Storage Material
The high hydrogen content, 16.4 wt%, of [Li(NH3)]+[BH3NH2BH3]
− suggests that this
material may have potential as a material for hydrogen storage. It also shows
moderate temperature H2 desorption, with a sharp release at 150°C. This is at a
slightly higher temperature than the initial release of H2 from the parent compound
NH3BH3, but the subsequent broad desorptions are avoided. The final mixture of
decomposition products may offer potential for reactions to occur in the presence of
H2, offering a rehydrogenation pathway.
A drawback to the use of this material as a hydrogen store is that under certain
conditions NH3 can be released. This release must be suppressed in order for the
material to reach its full potential in the field of hydrogen storage.
CHAPTER 5. The Reaction of Lithium Hydride with Ammonia Borane 249
5.8 References
1. Chater, P. A.; David, W. I. F.; Anderson, P. A., Synthesis and structure of the
new complex hydride Li2BH4NH2. Chemical Communications 2007, 4770–4772.
2. Xiong, Z.; Chua, Y. S.; Wu, G.; Xu, W.; Chen, P.; Shaw, W. J.; Karkamkar, A.;
Linehan, J. C.; Smurthwaite, T.; Autrey, T., Interaction of lithium hydride and
ammonia borane in THF. Chemical Communications 2008, 5595–5597.
3. Autrey, T.; Luedtke, A., Hydrogen release studies of alkali metal
amidoboranes. Inorganic Chemistry 2010, 49, 3905–3910.
4. Xiong, Z.; Yong, C. K.; Wu, G.; Chen, P.; Shaw, W. J.; Karkamkar, A.; Autrey,
T.; Jones, M. O.; Johnson, S. R.; Edwards, P. P.; David, W. I. F., High-capacity
hydrogen storage in lithium and sodium amidoboranes. Nature Materials 2008, 7,
138–141.
5. Kang, X.; Fang, Z.; Kong, L.; Cheng, H.; Yao, X.; Lu, G.; Wang, P., Ammonia
borane destabilized by lithium hydride: An advanced on-board hydrogen storage
material. Advanced Materials 2008, 20, 2756–2759.
6. Myers, A. G.; Yang, B. H.; Kopecky, D. J., Lithium amidotrihydroborate, a
powerful new reductant. Transformation of tertiary amides to primary alcohols.
Tetrahedron Letters 1996, 37, 3623–3626.
7. Juza, R.; Opp, K., Metallamide und metallnitride, 24. Mitteilung. Die
kristallstruktur des lithiumamides. Zeitschrift fur anorganische und allgemeine chemie
1951, 266, 313–324.
8. Graham, K. R.; Kemmitt, T.; Bowden, M. E., High capacity hydrogen storage in
a hybrid ammonia borane-lithium amide material. Energy and Environmental Science
2009, 2, 706–710.
9. Xia, G.; Yu, X.; Guo, Y.; Wu, Z.; Yang, C.; Liu, H.; Dou, S., Amminelithium
amidoborane Li(NH3)NH2BH3: A new coordination compound with favourable
dehydrogenation characteristics. Chemistry – A European Journal 2010, 16, 3763–
3769.
10. The powder XRD pattern of LiNH2BH3 was collected from a sample received
from the University of Oxford, synthesised through ball milling a mixture of LiH and
NH3BH3 in a 1:1 molar ratio.
11. Coelho, A. A. Topas, General Profile and Structure Analysis Software for
Powder Diffraction Data, Bruker AXS, Karlsruhe, Germany, 3rd edition: 2004.
12. Soulié, J. P.; Renaudin, G.; Cerny, R.; Yvon, K., Lithium boro-hydride LiBH4 I.
Crystal structure. Journal of Alloys and Compounds 2002, 346, 200–205.
CHAPTER 5. The Reaction of Lithium Hydride with Ammonia Borane 250
13. Wu, C.; Wu, G.; Xiong, Z.; Han, X.; Chu, H.; He, T.; Chen, P.,
LiNH2BH3•NH3BH3: Structure and hydrogen storage properties. Chemistry of
Materials 2010, 22, 3−5.
14. Wu, C.; Wu, G.; Xiong, Z.; David, W. I. F.; Ryan, K. R.; Jones, M. O.; Edwards,
P. P.; Chu, H.; Chen, P., Stepwise phase transition in the formation of lithium
amidoborane. Inorganic Chemistry 2010, 49, 4319−4323.
15. Wu, H.; Zhou, W.; Yildirim, T., Alkali and alkaline-earth metal amidoboranes:
Structure, crystal chemistry, and hydrogen storage properties. Journal of the
American Chemical Society 2008, 130, 14834–14839.
16. Jacobs, H.; Juza, R., Neubestimmung der Kristallstruktur des Lithiumamids.
Zeitschrift für anorganische und allgemeine Chemie 1972, 391, 3247–3259.
17. Bowden, M. E.; Gainsford, G. J.; Robinson, W. T., The room temperature
structure of ammonia borane. Australian Journal of Chemistry 2007, 60, 149–153.
18. Armstrong, D. R.; Perkins, P. G.; Walker, G. T., The electronic structure of the
monomers, dimers, a trimer, the oxides and the borane complexes of the lithiated
ammonias. Journal of Molecular Structure (Theochem) 1985, 122, 189–203.
19. Klooster, W. T.; Koetzle, T. F.; Siegbahn, P. E. M.; Richardson, T. B.;
Crabtree, R. H., Study of the N–H---H–B dihydrogen bond including the crystal
structure of BH3NH3 by neutron diffraction. Journal of the American Chemical Society
1999, 121, 6337–6343.
20. Lee, S. M.; Kang, X.; Wang, P.; Cheng, H.; Lee, Y. H., A comparative study of
the structural, electronic and vibrational properties of NH3BH3 and LiNH2BH3: Theory
and experiment. Chemical Physics and Physical Chemistry 2009, 10, 1825–1833.
21. Chua, Y. S.; Wu, G.; Xiong, Z.; He, T.; Chen, P., Calcium Amidoborane
Ammoniate – Synthesis, Structure, and Hydrogen Storage Properties. Chemistry of
Materials 2009, 21, 4899–4904.
22. Chu, H.; Wu, G.; Xiong, Z.; Guo, J.; He, T.; Chen, P., Structure and hydrogen
storage properties of calcium borohydride diammoniate. Chemistry of Materials 2010,
22, 6021–6028.
23. Brown, I. D.; Skowron, A., Electronegativity and Lewis acid strength. Journal of
the American Chemical Society 1990, 112, 3401–3403.
24. Magnusson, E., Binding of polar molecules to Li+, Na+, KS, Mg2+, and Ca2+ in
single-ligand adducts M+L and M2+L (L = H2O, NH3, H2S, PH3). Journal of Physical
Chemistry 1994, 98, 12558–12569.
25. Gervais, C.; Babonneau, F., High resolution solid state NMR investigation of
various boron nitride preceramic polymers. Journal of Organometallic Chemistry
2002, 657, 75–82.
CHAPTER 5. The Reaction of Lithium Hydride with Ammonia Borane 251
26. Gervais, C.; Framery, E.; Duriez, C.; Maquet, J.; Vaultier, M.; Babonneau, F., 11B and 15N solid state NMR investigation of a boron nitride preceramic polymer
prepared by ammonolysis of borazine. Journal of the European Ceramic Society
2005, 25, 129–135.
27. Mosegaard, L.; Møller, B.; Jørgensen, J. E.; Bosenberg, U.; Dornheim, M.;
Hanson, J. C.; Cerenius, Y.; Walker, G.; Jakobsen, H. J.; Besenbacher, F.; Jensen,
T. R., Intermediate phases observed during decomposition of LiBH4. Journal of Alloys
and Compounds 2007, 446–447, 301–305.
28. Johnson, S. R.; Anderson, P. A.; Edwards, P. P.; Gameson, I.; Prendergast, J.
W.; Al-Mamouri, M.; Book, D.; Harris, I. R.; Speight, J. D.; Walton, A., Chemical
activation of MgH2; a new route to superior hydrogen storage materials. Chemical
Communications 2005, 2823–2825.
29. Züttel, A.; Wenger, P.; Rentsch, S.; Sudan, P.; Mauron, P.; Emmenegger, C.,
LiBH4 a new hydrogen storage material. Journal of Power Sources 2003, 118, 1–7.
30. Hwang, S.-J.; Bowman Jr, R. C.; Reiter, J. W.; Rijssenbeek, J.; Soloveichik, G.
L.; Zhao, J.-C.; Kabbour, H.; Ahn, C. C., NMR confirmation for formation of [B12H12]2−
complexes during hydrogen desorption from metal borohydrides. The Journal of
Physical Chemistry C 2008, 112, 3164–3169.
31. Kim, D.; Moon, K.; Kho, J.; Economy, J.; Gervais, C.; Babonneau, F.,
Synthesis and characterization of poly(aminoborane) as a new boron nitride
precursor. Polymers for Advanced Technologies 1999, 10, 702–712.
32. Worle, M.; Meyer zu Altenschildescheb, H.; Nesper, R., Synthesis, properties
and crystal structures of α-Ca3(BN2)2 and Ca9 + x(BN2, CBN)6 – two compounds with
BN23− and CBN4− anions. Journal of Alloys and Compounds 1998, 264, 107–114.
33. Marchetti, P. S.; Kwon, D.; Schmidt, W. R.; Interrante, L. V.; Maciel, G. E.,
High-field 11B Magic-Angle Spinning NMR characterization of boron nitrides.
Chemistry of Materials 1991, 3, 482–486.
34. Fahys, B.; Herlem, M.; Daher, J.; Robert, G., Lithium perchlorate ammoniate
ionic liquid, LiClO4•4NH3. Journal of the Electrochemical Society 1988, 135, 2679–
2682.
35. Mikuli, E.; Hetmańczyk, Ł.; Medycki, W.; Kowalska, A., Phase transitions and
molecular motions in [Zn(NH3)4](BF4)2 studied by nuclear magnetic resonance,
infrared and Raman spectroscopy. Journal of Physics and Chemistry of Solids 2007,
68, 96–103.
36. Ninet, S.; Datchi, F.; Saitta, A. M.; Lazzeri, M.; Canny, B., Raman spectrum of
ammonia IV. Physical Review B 2006, 74, 104101.
37. Gomes, S.; Hagemann, H.; Yvon, K., Lithium boro-hydride LiBH4 II. Raman
spectroscopy. Journal of Alloys and Compounds 2002, 346, 206–210.
252
Chapter 6
The Reaction of Calcium Hydride
with Ammonia Borane
6.1 Introduction
Prior to the start of this research there had been no reported studies into the reaction
of calcium hydride with ammonia borane. Mixed amide borohydride materials have
previously been reported for the alkali metals lithium and sodium, but the synthesis of
the alkaline earth metal analogues has yet to be reported.1-8 The study was initially
focused on the potential synthesis of calcium mixed amide borohydrides. The CaH2 +
NH3BH3 reaction was investigated with different molar ratios and it was found that a
molar ratio of 1:4 seemed to be stoichiometric. This stoichiometry yielded a
crystalline phase free from starting materials at a reaction temperature of 80°C,
which was identified to be Ca(BH4)2·2NH3. Further heating of the reaction mixture to
120°C formed a second crystalline phase, Ca(BH4)2·NH3, and when the reaction
temperature was increased to 225°C, Ca(BH4)2 was observed. The hydrogen
desorption properties of the reaction pathway were investigated and spectroscopic
characterisation of the crystalline phases by solid state 11B MAS NMR was carried
out. The crystal structures of both Ca(BH4)2·2NH3 and Ca(BH4)2·NH3 were solved,
with the crystal structure of Ca(BH4)2·NH3 being previously unreported.
6.2 Experimental
Calcium hydride (Sigma-Aldrich, 99.99%) and ammonia borane (Sigma-Aldrich, 97%)
were ground together in a 1:4 molar ratio in an argon filled glove box (>10 ppm O2,
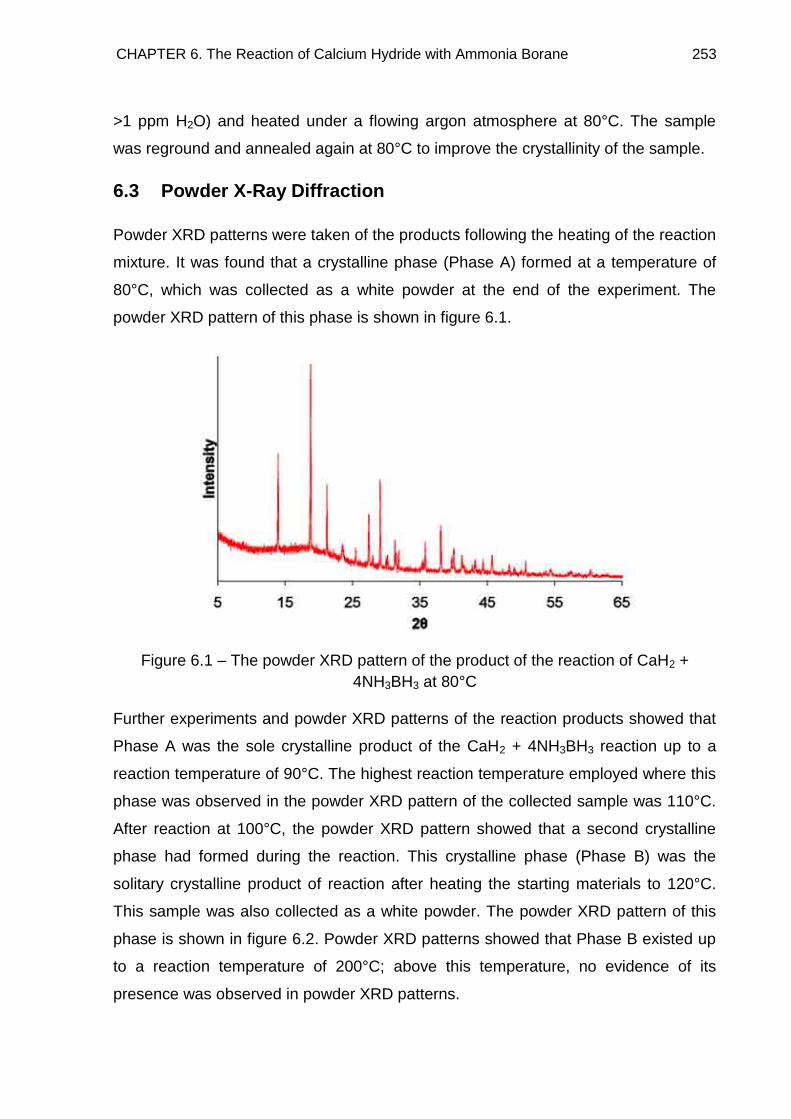
CHAPTER 6. The Reaction of Calcium Hydride with Ammonia Borane 253
>1 ppm H2O) and heated under a flowing argon atmosphere at 80°C. The sample
was reground and annealed again at 80°C to improve the crystallinity of the sample.
6.3 Powder X-Ray Diffraction
Powder XRD patterns were taken of the products following the heating of the reaction
mixture. It was found that a crystalline phase (Phase A) formed at a temperature of
80°C, which was collected as a white powder at the end of the experiment. The
powder XRD pattern of this phase is shown in figure 6.1.
Figure 6.1 – The powder XRD pattern of the product of the reaction of CaH2 +
4NH3BH3 at 80°C
Further experiments and powder XRD patterns of the reaction products showed that
Phase A was the sole crystalline product of the CaH2 + 4NH3BH3 reaction up to a
reaction temperature of 90°C. The highest reaction temperature employed where this
phase was observed in the powder XRD pattern of the collected sample was 110°C.
After reaction at 100°C, the powder XRD pattern showed that a second crystalline
phase had formed during the reaction. This crystalline phase (Phase B) was the
solitary crystalline product of reaction after heating the starting materials to 120°C.
This sample was also collected as a white powder. The powder XRD pattern of this
phase is shown in figure 6.2. Powder XRD patterns showed that Phase B existed up
to a reaction temperature of 200°C; above this temperature, no evidence of its
presence was observed in powder XRD patterns.
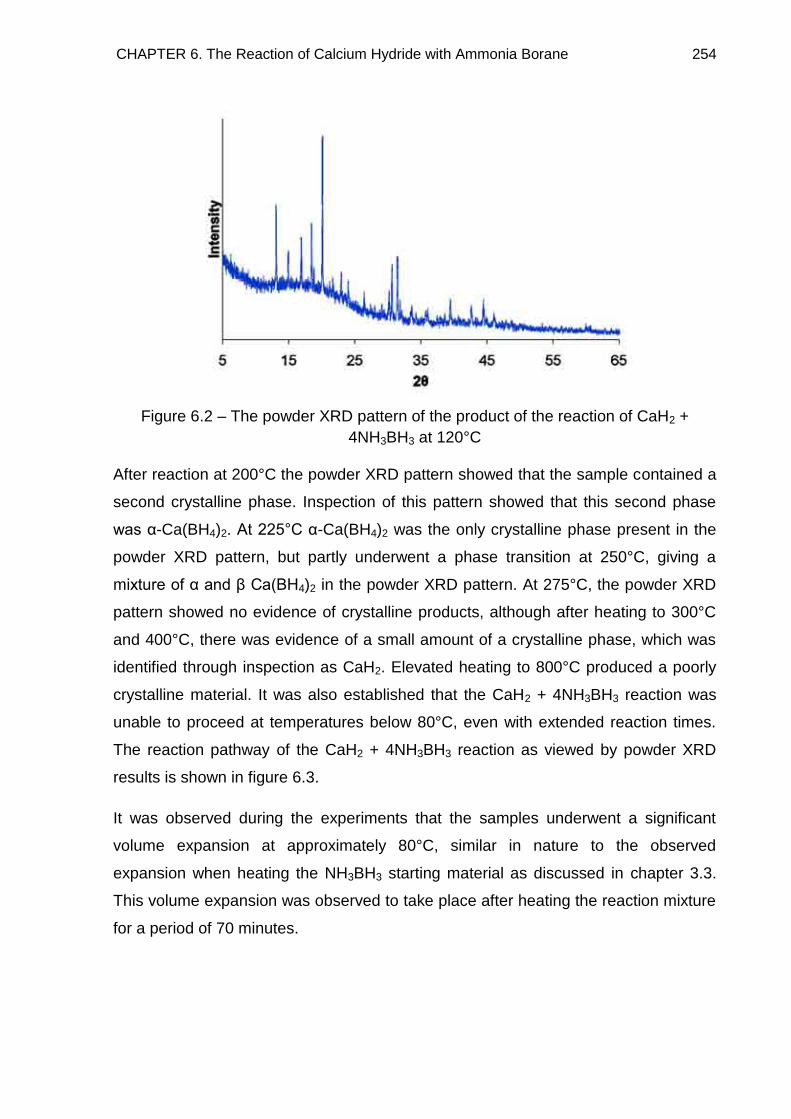
CHAPTER 6. The Reaction of Calcium Hydride with Ammonia Borane 254
Figure 6.2 – The powder XRD pattern of the product of the reaction of CaH2 +
4NH3BH3 at 120°C
After reaction at 200°C the powder XRD pattern showed that the sample contained a
second crystalline phase. Inspection of this pattern showed that this second phase
was α-Ca(BH4)2. At 225°C α-Ca(BH4)2 was the only crystalline phase present in the
powder XRD pattern, but partly underwent a phase transition at 250°C, giving a
mixture of α and β Ca(BH4)2 in the powder XRD pattern. At 275°C, the powder XRD
pattern showed no evidence of crystalline products, although after heating to 300°C
and 400°C, there was evidence of a small amount of a crystalline phase, which was
identified through inspection as CaH2. Elevated heating to 800°C produced a poorly
crystalline material. It was also established that the CaH2 + 4NH3BH3 reaction was
unable to proceed at temperatures below 80°C, even with extended reaction times.
The reaction pathway of the CaH2 + 4NH3BH3 reaction as viewed by powder XRD
results is shown in figure 6.3.
It was observed during the experiments that the samples underwent a significant
volume expansion at approximately 80°C, similar in nature to the observed
expansion when heating the NH3BH3 starting material as discussed in chapter 3.3.
This volume expansion was observed to take place after heating the reaction mixture
for a period of 70 minutes.
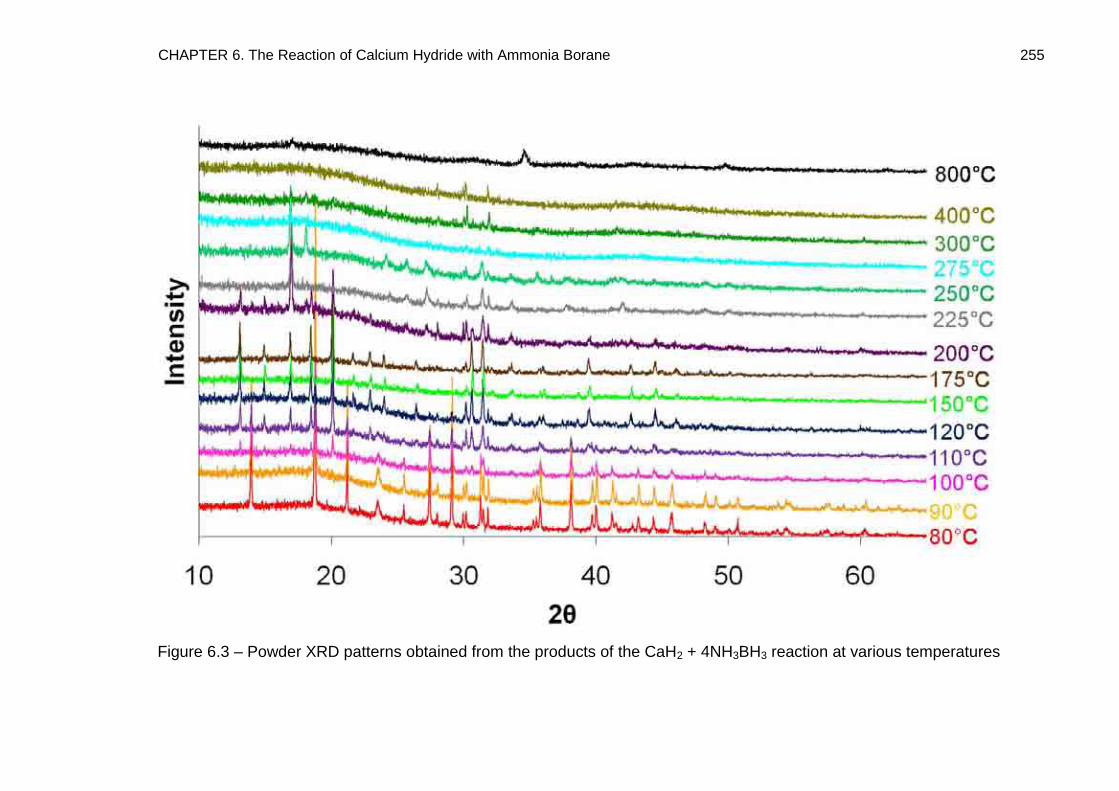
CHAPTER 6. The Reaction of Calcium Hydride with Ammonia Borane 255
Figure 6.3 – Powder XRD patterns obtained from the products of the CaH2 + 4NH3BH3 reaction at various temperatures
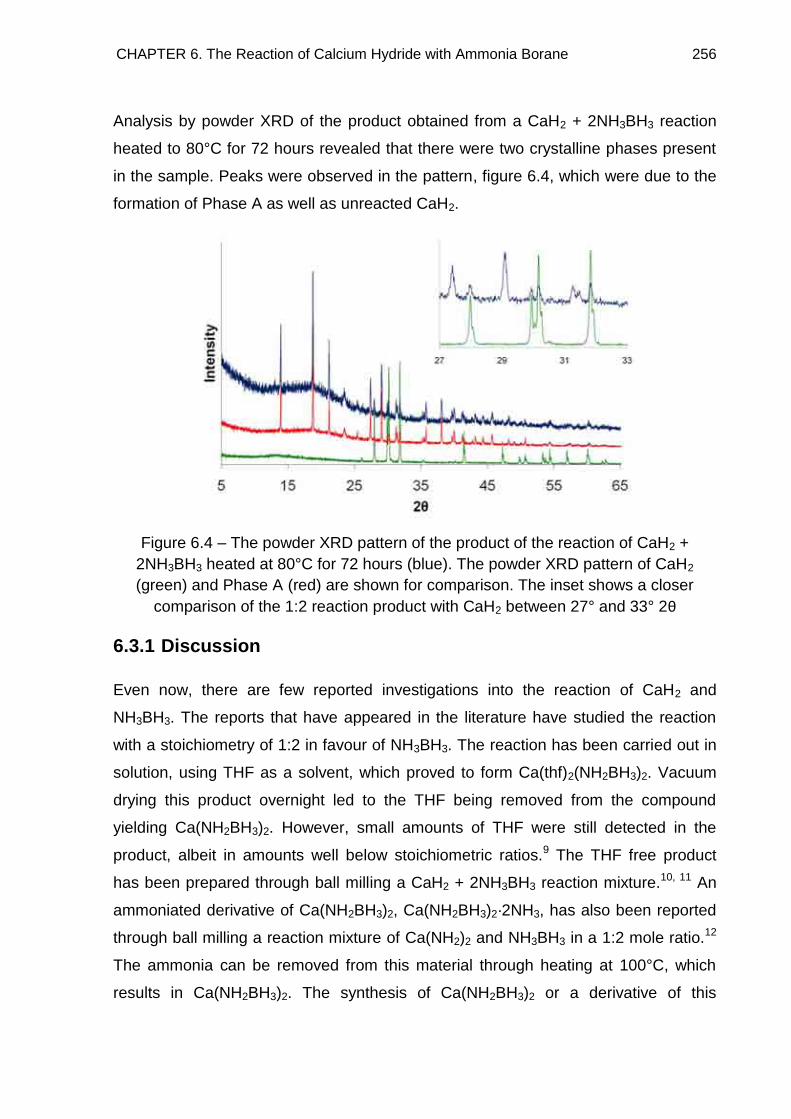
CHAPTER 6. The Reaction of Calcium Hydride with Ammonia Borane 256
Analysis by powder XRD of the product obtained from a CaH2 + 2NH3BH3 reaction
heated to 80°C for 72 hours revealed that there were two crystalline phases present
in the sample. Peaks were observed in the pattern, figure 6.4, which were due to the
formation of Phase A as well as unreacted CaH2.
Figure 6.4 – The powder XRD pattern of the product of the reaction of CaH2 +
2NH3BH3 heated at 80°C for 72 hours (blue). The powder XRD pattern of CaH2
(green) and Phase A (red) are shown for comparison. The inset shows a closer
comparison of the 1:2 reaction product with CaH2 between 27° and 33° 2θ
6.3.1 Discussion
Even now, there are few reported investigations into the reaction of CaH2 and
NH3BH3. The reports that have appeared in the literature have studied the reaction
with a stoichiometry of 1:2 in favour of NH3BH3. The reaction has been carried out in
solution, using THF as a solvent, which proved to form Ca(thf)2(NH2BH3)2. Vacuum
drying this product overnight led to the THF being removed from the compound
yielding Ca(NH2BH3)2. However, small amounts of THF were still detected in the
product, albeit in amounts well below stoichiometric ratios.9 The THF free product
has been prepared through ball milling a CaH2 + 2NH3BH3 reaction mixture.10, 11 An
ammoniated derivative of Ca(NH2BH3)2, Ca(NH2BH3)2·2NH3, has also been reported
through ball milling a reaction mixture of Ca(NH2)2 and NH3BH3 in a 1:2 mole ratio.12
The ammonia can be removed from this material through heating at 100°C, which
results in Ca(NH2BH3)2. The synthesis of Ca(NH2BH3)2 or a derivative of this
CHAPTER 6. The Reaction of Calcium Hydride with Ammonia Borane 257
compound has not been reported through direct solid state thermal reaction of CaH2
and NH3BH3. Investigations into the 1:2 reaction in this study revealed that
Ca(NH2BH3)2 could not be synthesised through thermal methods even at low reaction
temperatures or with extended reaction times.
The chemical compositions of both Phase A and Phase B were identified through
comparisons with the results of a recent study published by Chu et al.13 This study
investigated the reaction of Ca(BH4)2 with NH3 and a number of ammoniated forms of
Ca(BH4)2; the NH3 content varied between a maximum of Ca(BH4)2·6NH3 and
Ca(BH4)2·NH3. The published powder XRD pattern of Ca(BH4)2·2NH3 was identical to
that of Phase A synthesised in the 1:4 CaH2 and NH3BH3 reactions in this study.
Furthermore the published Ca(BH4)2·NH3 powder XRD pattern matched that of
Phase B. It can therefore be concluded that the first step in the CaH2 + 4NH3BH3
reaction resulted in the formation of Ca(BH4)2·2NH3. As a consequence of these
observations the initial steps in the CaH2 + 4NH3BH3 reaction can be summarised
through reaction 6.1.
Reaction 6.1
The question of what gases are released during the reaction pathway will be
addressed in section 6.6, although from analysis of reaction 6.1 it would be
reasonable to assume that the pathway involves the release of NH3. It is also evident
that the stoichiometry shown in reaction 6.1 is incorrect. The reaction suggests that
the actual stoichiometry was CaH2 + 2NH3BH3, as Phase A is B, N and H deficient
with respect to the 1:4 starting mixture. However, as discussed previously a reaction
stoichiometry of 1:2 was shown to leave unreacted CaH2 in the product. Therefore, it
would be reasonable to conclude that the reaction pathway may have involved the
formation of amorphous products containing the remaining B, N and H, which would
have been undetectable by powder XRD.
There have been a number of studies regarding the structure and decomposition
products of the polymorphs of Ca(BH4)2. A number of polymorphs have been
CaH2 + 4NH3BH3 Ca(BH4)2·2NH3 Ca(BH4)2·NH3 α-Ca(BH4)2
Phase A Phase B
CHAPTER 6. The Reaction of Calcium Hydride with Ammonia Borane 258
identified with reports relating to the existence of α,14-21 α',17 β,14, 16-23 γ16, 20, 22-24 and
δ22, 23 phases presented in the literature. The first polymorph observed in this study
was that of the α phase, after carrying out the CaH2 + 4NH3BH3 reaction at 200°C,
which on further heating to 250°C showed evidence of a phase transition to the β
polymorph. Literature studies regarding the decomposition pathway of Ca(BH4)2 have
also detailed this phase transformation, with it being shown to be completed by a
temperature of 300°C.17, 18 However, none of the collected samples in this study
produced powder XRD patterns that showed only the presence of β-Ca(BH4)2. The
transformation of the α polymorph to the β phase must therefore have completed
during the reaction carried out at 275°C. This powder XRD pattern was observed to
be amorphous and therefore the decomposition of the β polymorph must have also
taken place during the timescale of this reaction. The α' polymorph has been
observed as the first step in the α to β phase transition by Filinchuk et al.17 There was
no evidence of the α' polymorph forming in this study during the α to β phase
transition, however, the study by Filinchuk et al. is the sole report that has identified
the existence of this polymorph. The δ polymorph has also not been widely reported
in the literature and furthermore it is only observed in trace amounts, forming in the
temperature range 290 – 330°C from either the γ or β polymorphs.22, 23 Formation of
both the α' and δ polymorphs are therefore very specific to the reaction conditions
and it is hence unsurprising that they were not observed in this study. The remaining
polymorph that was not observed in this study, the γ phase, is not involved in the α to
β phase transition. This polymorph has been observed following heating
Ca(BH4)2·2THF at 100°C under vacuum. The main product collected after THF
removal was the α polymorph, but this was contaminated by a small amount of the γ
polymorph.20 The γ polymorph can be synthesised in greater amounts by wet
chemical synthesis, through the reaction of CaH2 with triethylamine borane,
Et3N·BH3.16, 22-24 There have been no reports regarding a phase transformation of the
α form of Ca(BH4)2 to the γ phase and therefore because the CaH2 + 4NH3BH3
reaction pathway initially led to the formation of the α polymorph, the γ phase is not
expected to form.
The decomposition of the β phase has been reported to commence at temperatures
above 330°C.14, 20-23 This is not entirely consistent with our observations that there
CHAPTER 6. The Reaction of Calcium Hydride with Ammonia Borane 259
was no evidence of any polymorph of Ca(BH4)2 in powder XRD patterns above a
reaction temperature of 250°C. At 275°C the powder XRD pattern showed no
evidence of crystalline phases and hence decomposition of the material had at least
begun. The discrepancy between the literature reports and the results of this study
was likely due to differences in reaction conditions. Whereas the studies in the
literature reported temperature ramping experiments, with a heating rate of 2°C
min−1, the reactions of this study were heated slowly to the target temperature and
then held for 12 hours. This difference could result in the observed difference in
apparent decomposition temperature. It should also be considered that Ca(BH4)2 was
unlikely to have been the only decomposition product, with amorphous products also
present in the sample. Previous studies have shown that the decomposition
temperature of Ca(BH4)2 can be reduced through the interaction with other
materials.25-27 Therefore the possibility that these amorphous materials could have
interacted with the Ca(BH4)2 and lowered its decomposition temperature cannot be
ignored. The decomposition of Ca(BH4)2 has been shown consistently to result in the
crystalline material CaH2.14, 15, 18, 20-23, 28 This was reflected in the powder XRD
patterns collected at 300°C and 400°C, where CaH2 was observed to be the only
crystalline product. The other products of the decomposition of Ca(BH4)2 have not
been completely identified, although there have been a number of studies related to
identifying these unknown products. The decomposition pathway of Ca(BH4)2 has
been postulated to involve one or both of the following reactions.15, 18, 20, 21
Ca(BH4)2 → 2/3CaH2 + 1/3CaB6 + 10/3H2 Reaction 6.2
Ca(BH4)2 → CaH2 + 2B + 3H2 Reaction 6.3
The identification of B and CaB6 through powder XRD has proved unsuccessful with
the majority of studies not observing these phases in the powder XRD patterns of
decomposed Ca(BH4)2 as they are present in amorphous forms. Only two studies
have identified the possible presence of CaB6 through XRD patterns.20, 23 However,
in both of these studies this identification was limited to an observation that there was
a broad increase in the background of the powder XRD pattern at the 2θ position,
30.4°, where the most intense peak in the CaB6 would be found and both studies
used Raman spectroscopy to confirm the presence of this material. In both of these
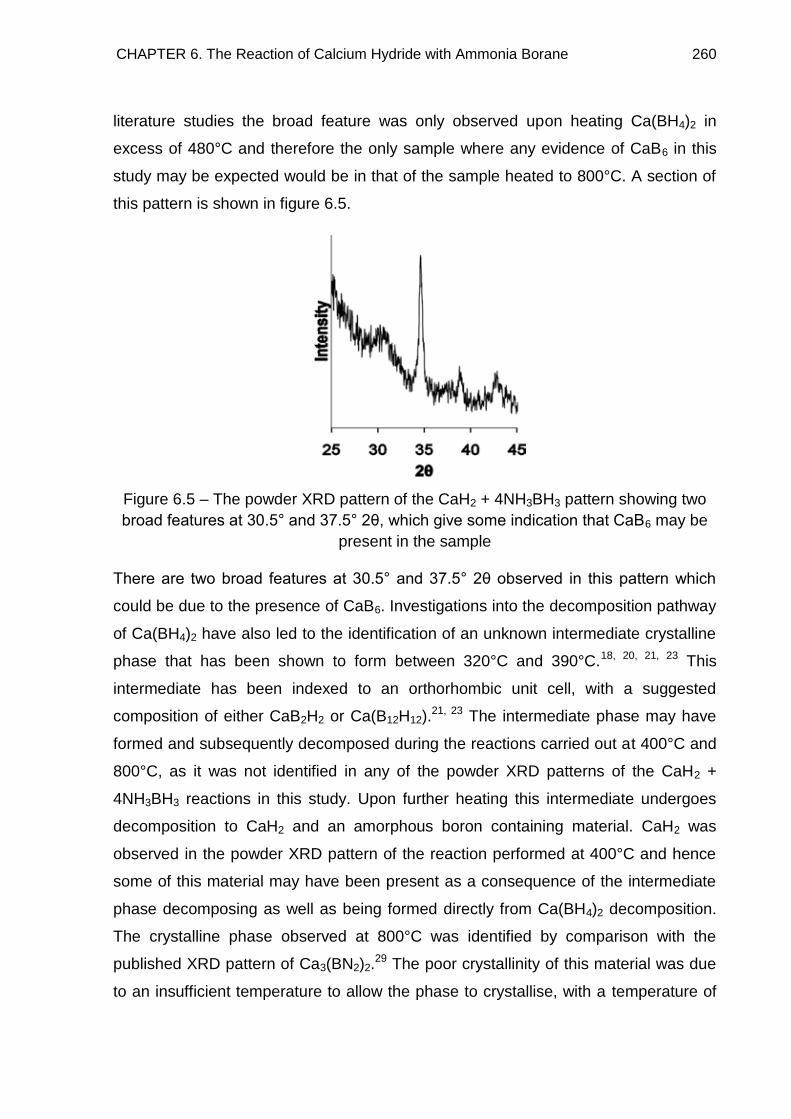
CHAPTER 6. The Reaction of Calcium Hydride with Ammonia Borane 260
literature studies the broad feature was only observed upon heating Ca(BH4)2 in
excess of 480°C and therefore the only sample where any evidence of CaB6 in this
study may be expected would be in that of the sample heated to 800°C. A section of
this pattern is shown in figure 6.5.
Figure 6.5 – The powder XRD pattern of the CaH2 + 4NH3BH3 pattern showing two
broad features at 30.5° and 37.5° 2θ, which give some indication that CaB6 may be
present in the sample
There are two broad features at 30.5° and 37.5° 2θ observed in this pattern which
could be due to the presence of CaB6. Investigations into the decomposition pathway
of Ca(BH4)2 have also led to the identification of an unknown intermediate crystalline
phase that has been shown to form between 320°C and 390°C.18, 20, 21, 23 This
intermediate has been indexed to an orthorhombic unit cell, with a suggested
composition of either CaB2H2 or Ca(B12H12).21, 23 The intermediate phase may have
formed and subsequently decomposed during the reactions carried out at 400°C and
800°C, as it was not identified in any of the powder XRD patterns of the CaH2 +
4NH3BH3 reactions in this study. Upon further heating this intermediate undergoes
decomposition to CaH2 and an amorphous boron containing material. CaH2 was
observed in the powder XRD pattern of the reaction performed at 400°C and hence
some of this material may have been present as a consequence of the intermediate
phase decomposing as well as being formed directly from Ca(BH4)2 decomposition.
The crystalline phase observed at 800°C was identified by comparison with the
published XRD pattern of Ca3(BN2)2.29 The poor crystallinity of this material was due
to an insufficient temperature to allow the phase to crystallise, with a temperature of
CHAPTER 6. The Reaction of Calcium Hydride with Ammonia Borane 261
1200°C shown to be required for the material to form with good crystallinity.29 This
was an interesting observation considering the Ca within the reaction, as far as XRD
showed, was present in the form of Ca(BH4)2 and CaH2 prior to the formation of
Ca3(BN2)2. The appearance of nitrogen in a calcium containing phase at 800°C
therefore suggested that an amorphous Ca, B and N containing phase formed during
the reaction pathway and began to crystallise as Ca3(BN2)2 after heating to 800°C.
Alternatively Ca3(BN2)2 could have formed as a result of the decomposition of CaH2,
which has been shown to take place at a temperature of 700°C, leaving Ca metal
and releasing H2.30 The Ca metal may have subsequently reacted with an
amorphous B and N containing compound, such as BN. However, the stability of BN
renders the synthesis of Ca3(BN2)2 from such a reaction unlikely. The formation of
Ca3(BN2)2 will be discussed further in section 6.7. The formation of Ca3(BN2)2 offered
proof that there was an amorphous nitrogen containing compound present in the
sample, although the composition of the material cannot be determined from powder
XRD investigations.
6.4 Crystal Structure Determination of Ca(BH4)2·2NH3 (Phase A)
The crystal structure of Ca(BH4)2·2NH3 was determined from powder diffraction data
using the computer program Topas.31 The structure was found to consist of
octahedral Ca2+ surrounded by four BH4− and two NH3 units.
6.4.1 Indexing
The observed peak positions from the Ca(BH4)2·2NH3 phase were run through the
indexing routine of the computer program Topas.32 The most probable assignment
was for an orthorhombic unit cell with a = 12.67 Å, b = 8.38 Å and c = 6.40 Å, which
was similar to the assignment of Chu et al.13 The suggested space group was Pca21
(#29), see table 6.1. The lattice constants and unit cell volume were refined in a
Pawley fit using Topas as a = 12.6717(4) Å, b = 8.3665(3) Å, c = 6.3966(2) Å, giving
a unit cell volume of 678.10(4) Å3.
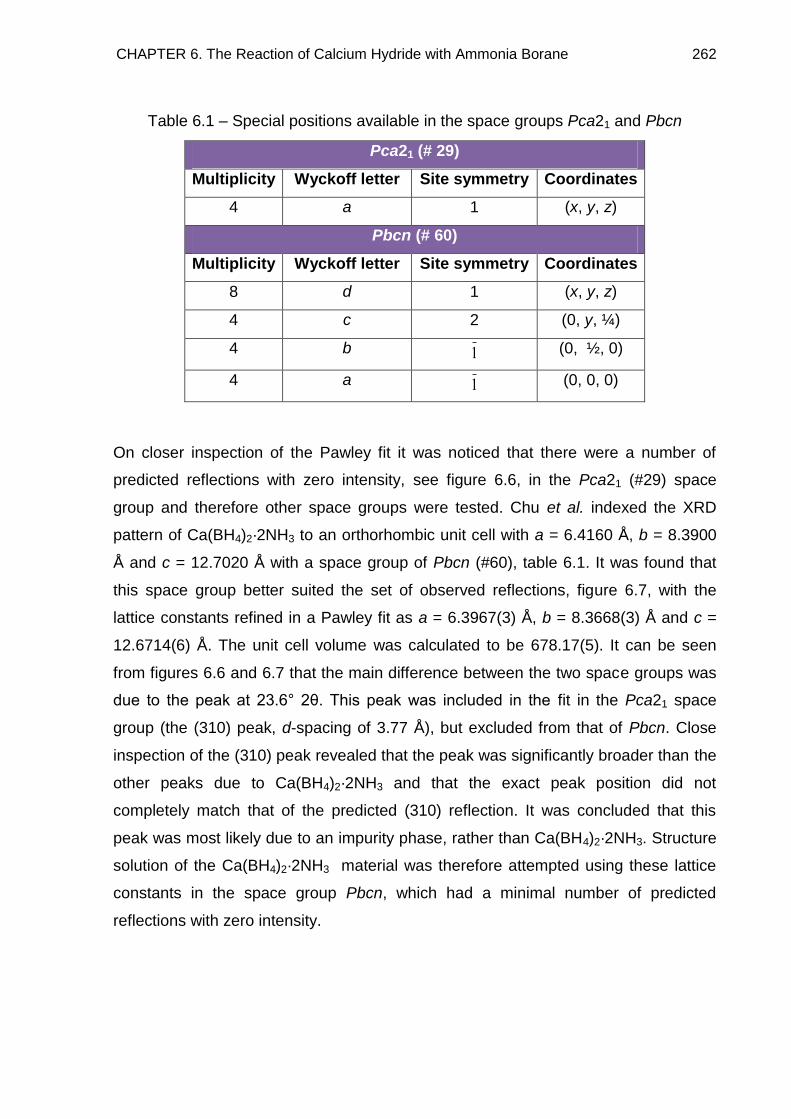
CHAPTER 6. The Reaction of Calcium Hydride with Ammonia Borane 262
Table 6.1 – Special positions available in the space groups Pca21 and Pbcn
Pca21 (# 29)
Multiplicity Wyckoff letter Site symmetry Coordinates
4 a 1 (x, y, z)
Pbcn (# 60)
Multiplicity Wyckoff letter Site symmetry Coordinates
8 d 1 (x, y, z)
4 c 2 (0, y, ¼)
4 b 1 (0, ½, 0)
4 a 1 (0, 0, 0)
On closer inspection of the Pawley fit it was noticed that there were a number of
predicted reflections with zero intensity, see figure 6.6, in the Pca21 (#29) space
group and therefore other space groups were tested. Chu et al. indexed the XRD
pattern of Ca(BH4)2·2NH3 to an orthorhombic unit cell with a = 6.4160 Å, b = 8.3900
Å and c = 12.7020 Å with a space group of Pbcn (#60), table 6.1. It was found that
this space group better suited the set of observed reflections, figure 6.7, with the
lattice constants refined in a Pawley fit as a = 6.3967(3) Å, b = 8.3668(3) Å and c =
12.6714(6) Å. The unit cell volume was calculated to be 678.17(5). It can be seen
from figures 6.6 and 6.7 that the main difference between the two space groups was
due to the peak at 23.6° 2θ. This peak was included in the fit in the Pca21 space
group (the (310) peak, d-spacing of 3.77 Å), but excluded from that of Pbcn. Close
inspection of the (310) peak revealed that the peak was significantly broader than the
other peaks due to Ca(BH4)2·2NH3 and that the exact peak position did not
completely match that of the predicted (310) reflection. It was concluded that this
peak was most likely due to an impurity phase, rather than Ca(BH4)2·2NH3. Structure
solution of the Ca(BH4)2·2NH3 material was therefore attempted using these lattice
constants in the space group Pbcn, which had a minimal number of predicted
reflections with zero intensity.
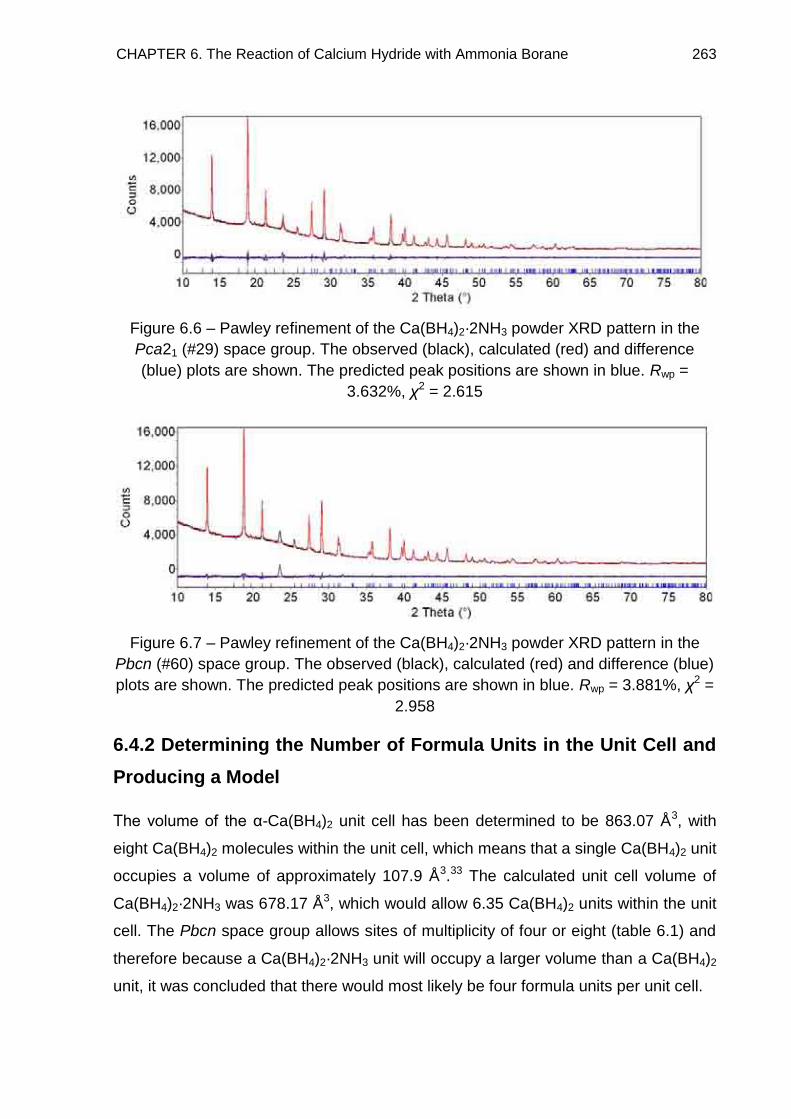
CHAPTER 6. The Reaction of Calcium Hydride with Ammonia Borane 263
Figure 6.6 – Pawley refinement of the Ca(BH4)2·2NH3 powder XRD pattern in the
Pca21 (#29) space group. The observed (black), calculated (red) and difference
(blue) plots are shown. The predicted peak positions are shown in blue. Rwp =
3.632%, χ2 = 2.615
Figure 6.7 – Pawley refinement of the Ca(BH4)2·2NH3 powder XRD pattern in the
Pbcn (#60) space group. The observed (black), calculated (red) and difference (blue)
plots are shown. The predicted peak positions are shown in blue. Rwp = 3.881%, χ2 =
2.958
6.4.2 Determining the Number of Formula Units in the Unit Cell and
Producing a Model
The volume of the α-Ca(BH4)2 unit cell has been determined to be 863.07 Å3, with
eight Ca(BH4)2 molecules within the unit cell, which means that a single Ca(BH4)2 unit
occupies a volume of approximately 107.9 Å3.33 The calculated unit cell volume of
Ca(BH4)2·2NH3 was 678.17 Å3, which would allow 6.35 Ca(BH4)2 units within the unit
cell. The Pbcn space group allows sites of multiplicity of four or eight (table 6.1) and
therefore because a Ca(BH4)2·2NH3 unit will occupy a larger volume than a Ca(BH4)2
unit, it was concluded that there would most likely be four formula units per unit cell.
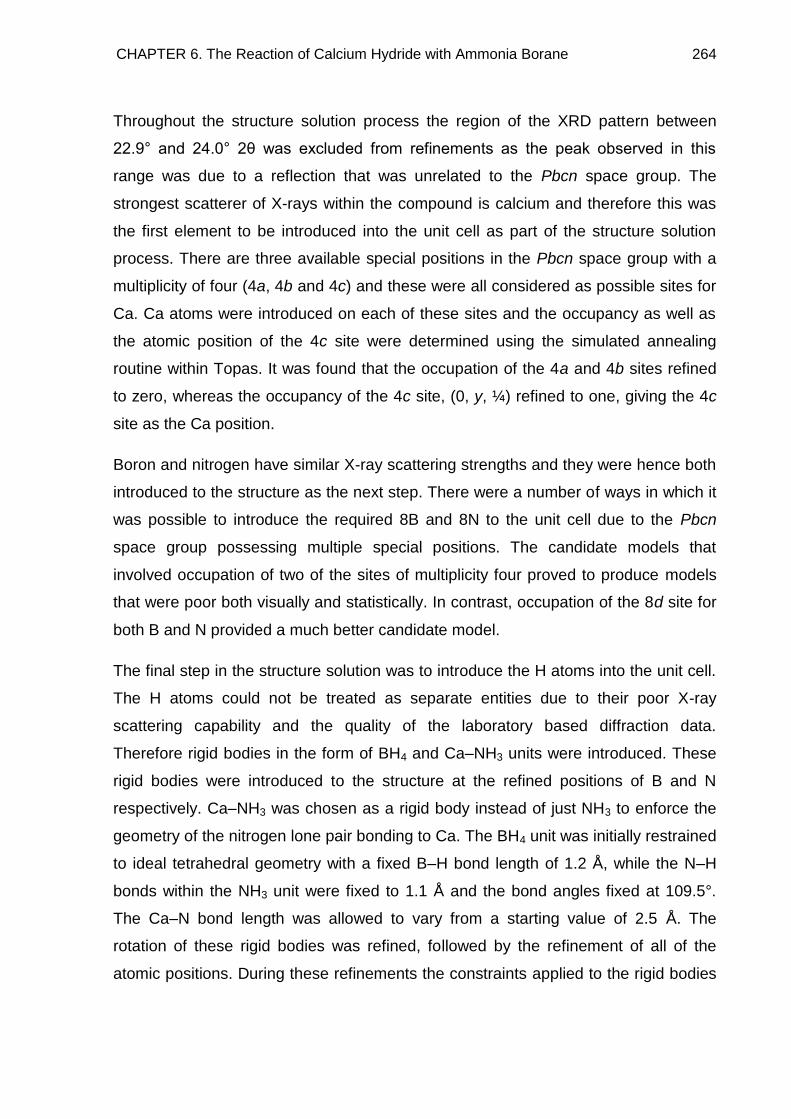
CHAPTER 6. The Reaction of Calcium Hydride with Ammonia Borane 264
Throughout the structure solution process the region of the XRD pattern between
22.9° and 24.0° 2θ was excluded from refinements as the peak observed in this
range was due to a reflection that was unrelated to the Pbcn space group. The
strongest scatterer of X-rays within the compound is calcium and therefore this was
the first element to be introduced into the unit cell as part of the structure solution
process. There are three available special positions in the Pbcn space group with a
multiplicity of four (4a, 4b and 4c) and these were all considered as possible sites for
Ca. Ca atoms were introduced on each of these sites and the occupancy as well as
the atomic position of the 4c site were determined using the simulated annealing
routine within Topas. It was found that the occupation of the 4a and 4b sites refined
to zero, whereas the occupancy of the 4c site, (0, y, ¼) refined to one, giving the 4c
site as the Ca position.
Boron and nitrogen have similar X-ray scattering strengths and they were hence both
introduced to the structure as the next step. There were a number of ways in which it
was possible to introduce the required 8B and 8N to the unit cell due to the Pbcn
space group possessing multiple special positions. The candidate models that
involved occupation of two of the sites of multiplicity four proved to produce models
that were poor both visually and statistically. In contrast, occupation of the 8d site for
both B and N provided a much better candidate model.
The final step in the structure solution was to introduce the H atoms into the unit cell.
The H atoms could not be treated as separate entities due to their poor X-ray
scattering capability and the quality of the laboratory based diffraction data.
Therefore rigid bodies in the form of BH4 and Ca–NH3 units were introduced. These
rigid bodies were introduced to the structure at the refined positions of B and N
respectively. Ca–NH3 was chosen as a rigid body instead of just NH3 to enforce the
geometry of the nitrogen lone pair bonding to Ca. The BH4 unit was initially restrained
to ideal tetrahedral geometry with a fixed B–H bond length of 1.2 Å, while the N–H
bonds within the NH3 unit were fixed to 1.1 Å and the bond angles fixed at 109.5°.
The Ca–N bond length was allowed to vary from a starting value of 2.5 Å. The
rotation of these rigid bodies was refined, followed by the refinement of all of the
atomic positions. During these refinements the constraints applied to the rigid bodies
CHAPTER 6. The Reaction of Calcium Hydride with Ammonia Borane 265
were maintained. This model gave a fit that was both visually, figure 6.8, and
statistically, Rwp = 4.608%, satisfactory. At this point the number of terms in the
background function was increased in order to improve the fit. A satisfactory model
had now been produced to proceed with a full Rietveld refinement.
Figure 6.8 – The fit for Ca(BH4)2·2NH3 with refined Ca, B and N positions and refined
BH4 and Ca–NH3 rigid bodies within the Pbcn space group. The observed (black),
calculated (red) and difference (blue) plots are shown. The predicted peak positions
are shown in blue. Rwp = 4.608%, χ2 = 2.124
6.4.3 Full Rietveld Refinement
A complete Rietveld refinement was performed in Topas by refining a zero point
error, a pseudo-Voigt peak shape (6 parameters) and a Chebyshev background
function (17 parameters). Atomic positions were determined within the enforced
geometry of the rigid bodies described in section 6.4.2 by refining the translation and
rotation of the rigid bodies (6 parameters for each rigid body). The Ca–N bond length
was refined, however, attempts to refine the N–H and B–H bond lengths resulted in
the bond lengths reaching the minimum applied limit (0.8 Å) and so the N–H and B–H
bond lengths were fixed at the values published by Chu et al.13 (1.03 Å and 1.23 Å,
respectively). It was not possible to obtain accurate H positions from room
temperature laboratory diffraction data. Higher quality diffraction data, obtained at low
temperature to minimise thermal motion, would be advantageous. Isotropic thermal
parameters (Beq) were also introduced to the refinement for Ca, B, N and H, and
refined from starting values of 1 Å2. Refinement of these parameters resulted in non-
sensible values in every case except Ca, and so values for B, N and H were fixed at
1 Å2. The final refinement contained 40 refined parameters. The resultant crystal
2 Theta (°)
807570656055504540353025201510
Co
un
ts
15,000
10,000
5,000
0
-5,000
Ca(BH4)2.2NH3 100.00 %
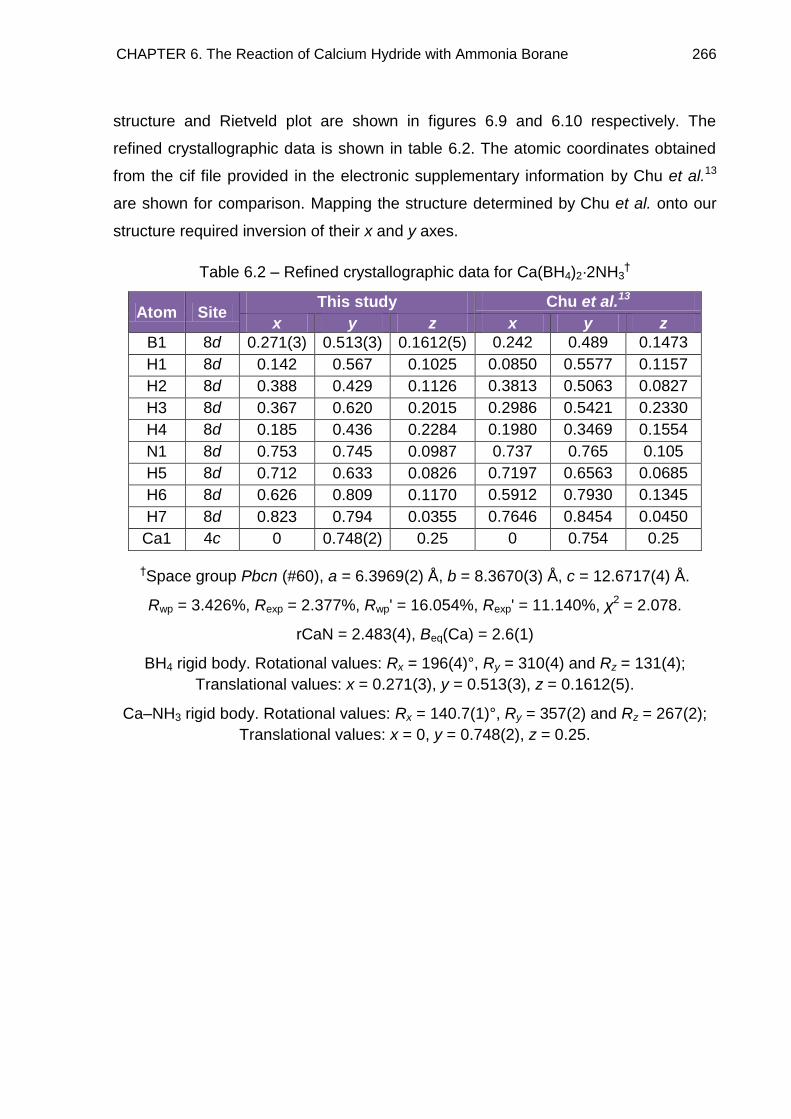
CHAPTER 6. The Reaction of Calcium Hydride with Ammonia Borane 266
structure and Rietveld plot are shown in figures 6.9 and 6.10 respectively. The
refined crystallographic data is shown in table 6.2. The atomic coordinates obtained
from the cif file provided in the electronic supplementary information by Chu et al.13
are shown for comparison. Mapping the structure determined by Chu et al. onto our
structure required inversion of their x and y axes.
Table 6.2 – Refined crystallographic data for Ca(BH4)2·2NH3†
Atom Site This study Chu et al.13
x y z x y z
B1 8d 0.271(3) 0.513(3) 0.1612(5) 0.242 0.489 0.1473
H1 8d 0.142 0.567 0.1025 0.0850 0.5577 0.1157
H2 8d 0.388 0.429 0.1126 0.3813 0.5063 0.0827
H3 8d 0.367 0.620 0.2015 0.2986 0.5421 0.2330
H4 8d 0.185 0.436 0.2284 0.1980 0.3469 0.1554
N1 8d 0.753 0.745 0.0987 0.737 0.765 0.105
H5 8d 0.712 0.633 0.0826 0.7197 0.6563 0.0685
H6 8d 0.626 0.809 0.1170 0.5912 0.7930 0.1345
H7 8d 0.823 0.794 0.0355 0.7646 0.8454 0.0450
Ca1 4c 0 0.748(2) 0.25 0 0.754 0.25
†Space group Pbcn (#60), a = 6.3969(2) Å, b = 8.3670(3) Å, c = 12.6717(4) Å.
Rwp = 3.426%, Rexp = 2.377%, Rwp' = 16.054%, Rexp' = 11.140%, χ2 = 2.078.
rCaN = 2.483(4), Beq(Ca) = 2.6(1)
BH4 rigid body. Rotational values: Rx = 196(4)°, Ry = 310(4) and Rz = 131(4);
Translational values: x = 0.271(3), y = 0.513(3), z = 0.1612(5).
Ca–NH3 rigid body. Rotational values: Rx = 140.7(1)°, Ry = 357(2) and Rz = 267(2);
Translational values: x = 0, y = 0.748(2), z = 0.25.
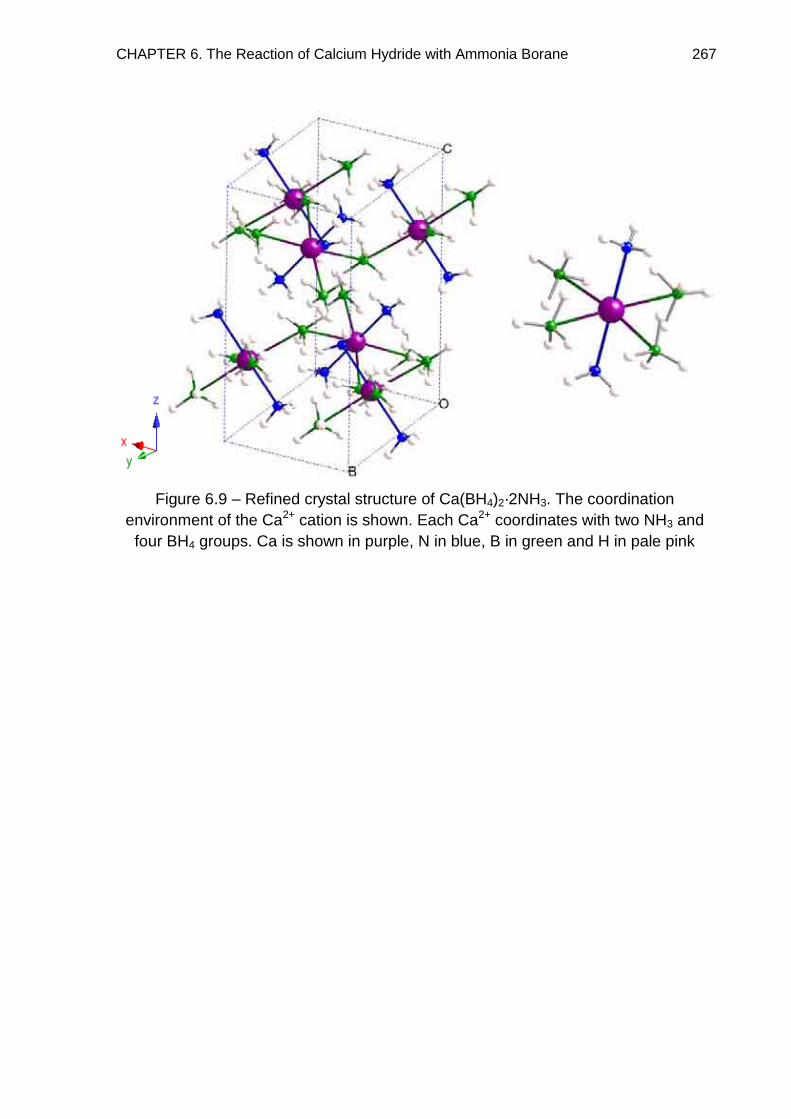
CHAPTER 6. The Reaction of Calcium Hydride with Ammonia Borane 267
Figure 6.9 – Refined crystal structure of Ca(BH4)2·2NH3. The coordination
environment of the Ca2+ cation is shown. Each Ca2+ coordinates with two NH3 and
four BH4 groups. Ca is shown in purple, N in blue, B in green and H in pale pink
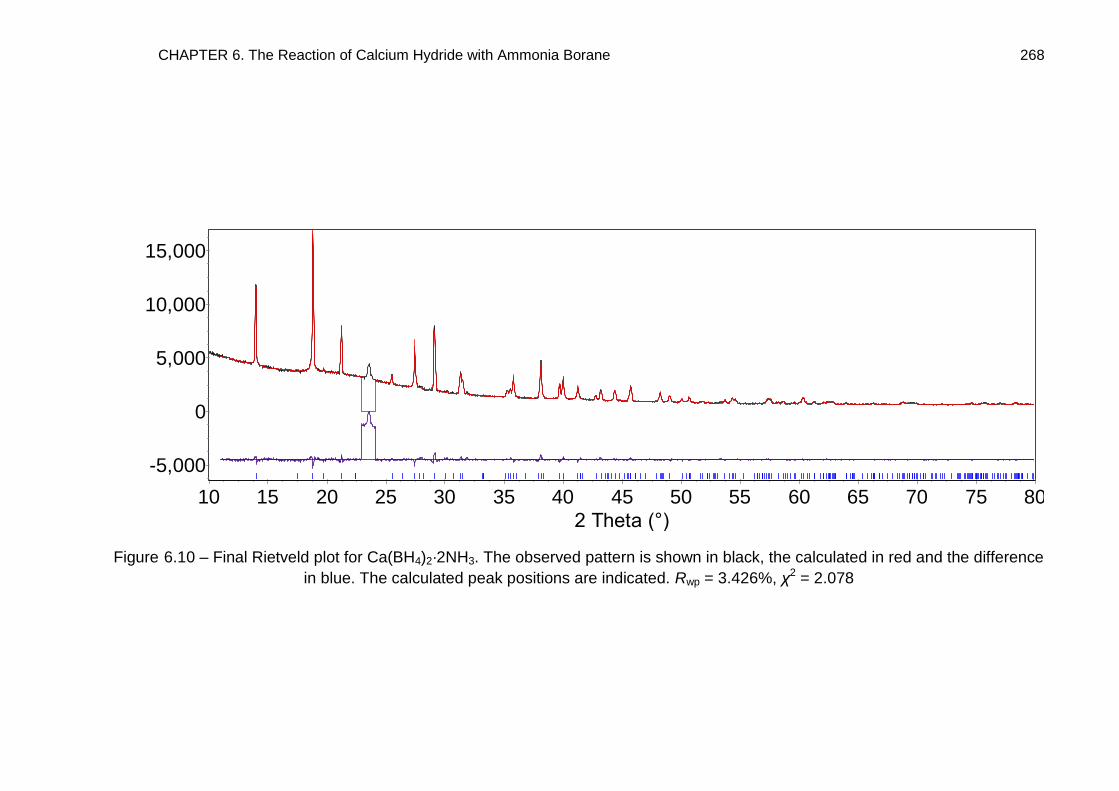
CHAPTER 6. The Reaction of Calcium Hydride with Ammonia Borane 268
Figure 6.10 – Final Rietveld plot for Ca(BH4)2·2NH3. The observed pattern is shown in black, the calculated in red and the difference
in blue. The calculated peak positions are indicated. Rwp = 3.426%, χ2 = 2.078
2 Theta (°)
807570656055504540353025201510
Counts
15,000
10,000
5,000
0
-5,000
Ca(BH4)2-2NH3 100.00 %
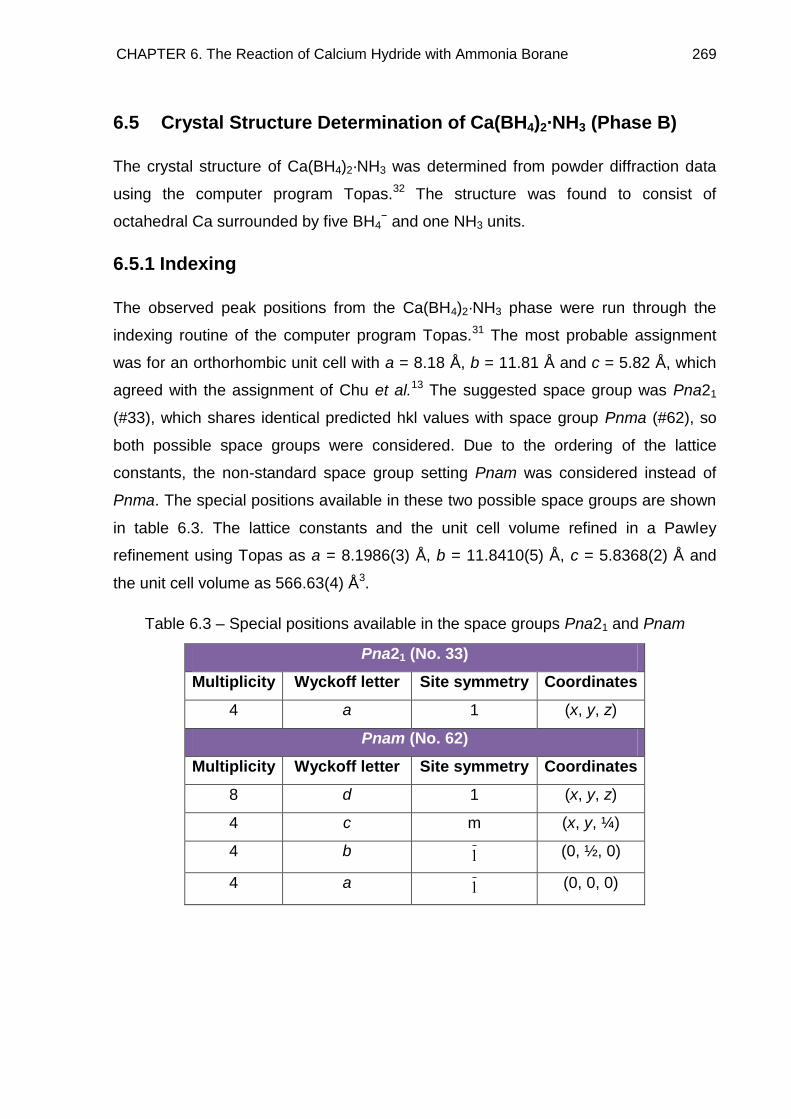
CHAPTER 6. The Reaction of Calcium Hydride with Ammonia Borane 269
6.5 Crystal Structure Determination of Ca(BH4)2·NH3 (Phase B)
The crystal structure of Ca(BH4)2·NH3 was determined from powder diffraction data
using the computer program Topas.32 The structure was found to consist of
octahedral Ca surrounded by five BH4− and one NH3 units.
6.5.1 Indexing
The observed peak positions from the Ca(BH4)2·NH3 phase were run through the
indexing routine of the computer program Topas.31 The most probable assignment
was for an orthorhombic unit cell with a = 8.18 Å, b = 11.81 Å and c = 5.82 Å, which
agreed with the assignment of Chu et al.13 The suggested space group was Pna21
(#33), which shares identical predicted hkl values with space group Pnma (#62), so
both possible space groups were considered. Due to the ordering of the lattice
constants, the non-standard space group setting Pnam was considered instead of
Pnma. The special positions available in these two possible space groups are shown
in table 6.3. The lattice constants and the unit cell volume refined in a Pawley
refinement using Topas as a = 8.1986(3) Å, b = 11.8410(5) Å, c = 5.8368(2) Å and
the unit cell volume as 566.63(4) Å3.
Table 6.3 – Special positions available in the space groups Pna21 and Pnam
Pna21 (No. 33)
Multiplicity Wyckoff letter Site symmetry Coordinates
4 a 1 (x, y, z)
Pnam (No. 62)
Multiplicity Wyckoff letter Site symmetry Coordinates
8 d 1 (x, y, z)
4 c m (x, y, ¼)
4 b 1 (0, ½, 0)
4 a 1 (0, 0, 0)
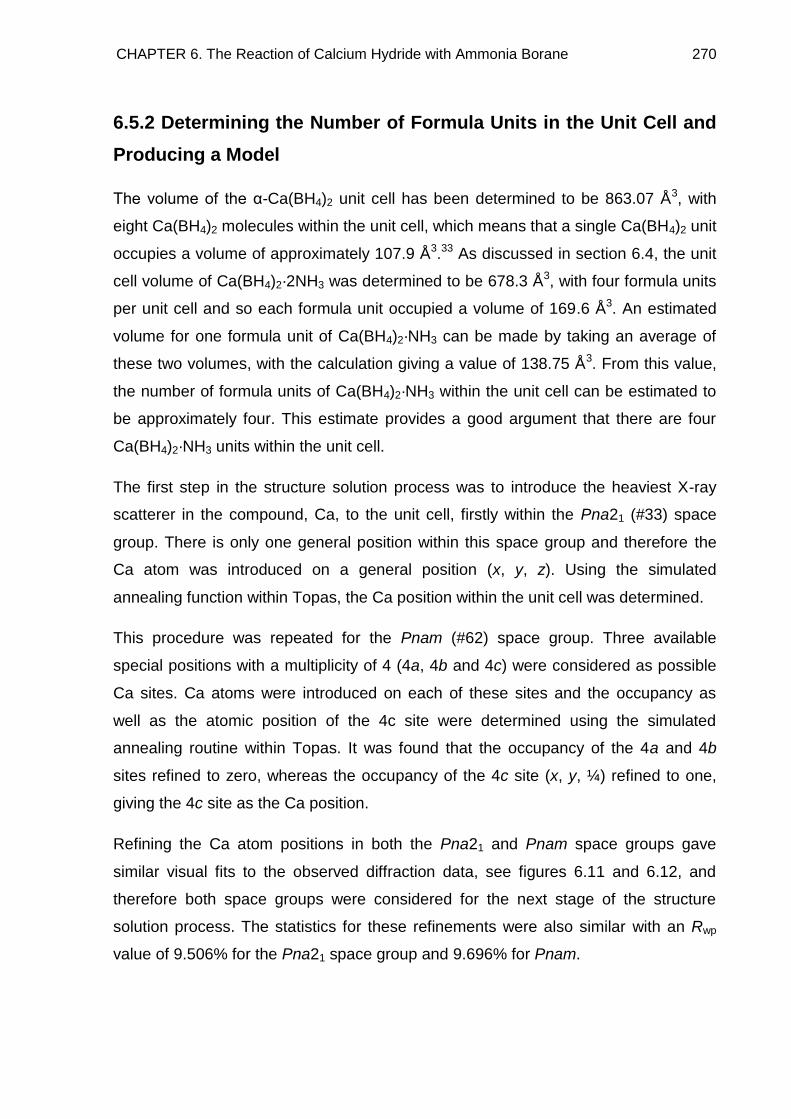
CHAPTER 6. The Reaction of Calcium Hydride with Ammonia Borane 270
6.5.2 Determining the Number of Formula Units in the Unit Cell and
Producing a Model
The volume of the α-Ca(BH4)2 unit cell has been determined to be 863.07 Å3, with
eight Ca(BH4)2 molecules within the unit cell, which means that a single Ca(BH4)2 unit
occupies a volume of approximately 107.9 Å3.33 As discussed in section 6.4, the unit
cell volume of Ca(BH4)2·2NH3 was determined to be 678.3 Å3, with four formula units
per unit cell and so each formula unit occupied a volume of 169.6 Å3. An estimated
volume for one formula unit of Ca(BH4)2·NH3 can be made by taking an average of
these two volumes, with the calculation giving a value of 138.75 Å3. From this value,
the number of formula units of Ca(BH4)2·NH3 within the unit cell can be estimated to
be approximately four. This estimate provides a good argument that there are four
Ca(BH4)2·NH3 units within the unit cell.
The first step in the structure solution process was to introduce the heaviest X-ray
scatterer in the compound, Ca, to the unit cell, firstly within the Pna21 (#33) space
group. There is only one general position within this space group and therefore the
Ca atom was introduced on a general position (x, y, z). Using the simulated
annealing function within Topas, the Ca position within the unit cell was determined.
This procedure was repeated for the Pnam (#62) space group. Three available
special positions with a multiplicity of 4 (4a, 4b and 4c) were considered as possible
Ca sites. Ca atoms were introduced on each of these sites and the occupancy as
well as the atomic position of the 4c site were determined using the simulated
annealing routine within Topas. It was found that the occupancy of the 4a and 4b
sites refined to zero, whereas the occupancy of the 4c site (x, y, ¼) refined to one,
giving the 4c site as the Ca position.
Refining the Ca atom positions in both the Pna21 and Pnam space groups gave
similar visual fits to the observed diffraction data, see figures 6.11 and 6.12, and
therefore both space groups were considered for the next stage of the structure
solution process. The statistics for these refinements were also similar with an Rwp
value of 9.506% for the Pna21 space group and 9.696% for Pnam.
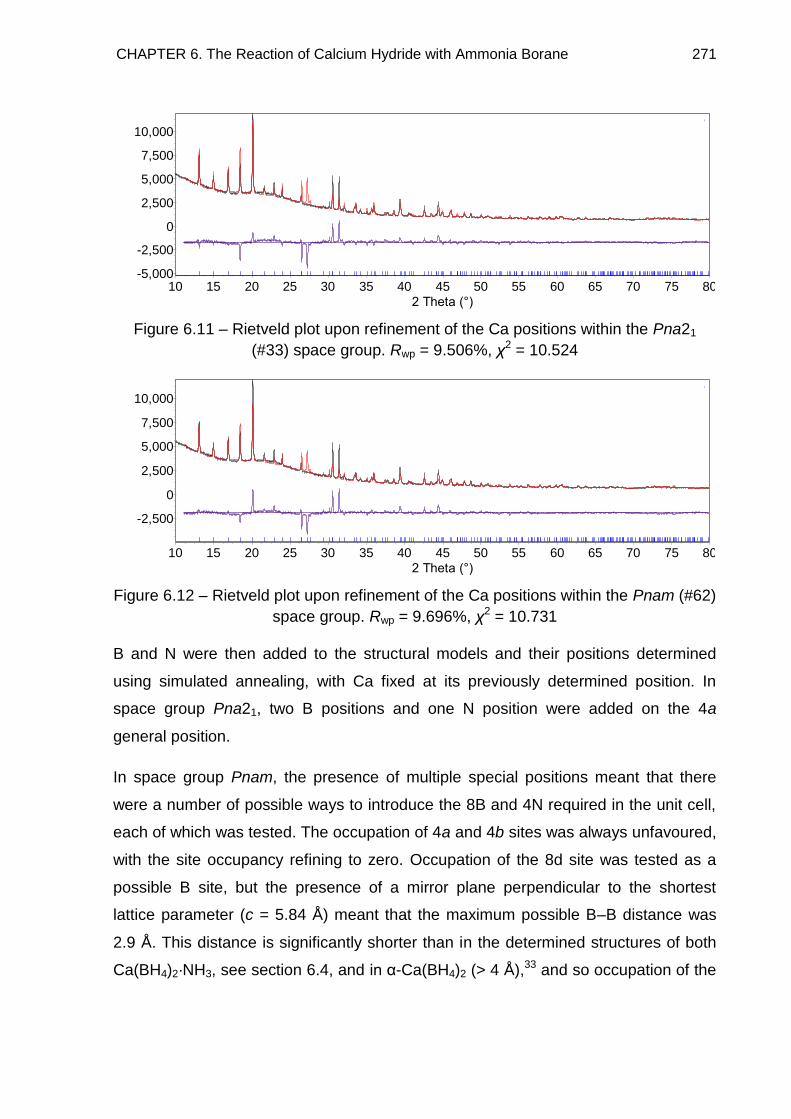
CHAPTER 6. The Reaction of Calcium Hydride with Ammonia Borane 271
Figure 6.11 – Rietveld plot upon refinement of the Ca positions within the Pna21
(#33) space group. Rwp = 9.506%, χ2 = 10.524
Figure 6.12 – Rietveld plot upon refinement of the Ca positions within the Pnam (#62)
space group. Rwp = 9.696%, χ2 = 10.731
B and N were then added to the structural models and their positions determined
using simulated annealing, with Ca fixed at its previously determined position. In
space group Pna21, two B positions and one N position were added on the 4a
general position.
In space group Pnam, the presence of multiple special positions meant that there
were a number of possible ways to introduce the 8B and 4N required in the unit cell,
each of which was tested. The occupation of 4a and 4b sites was always unfavoured,
with the site occupancy refining to zero. Occupation of the 8d site was tested as a
possible B site, but the presence of a mirror plane perpendicular to the shortest
lattice parameter (c = 5.84 Å) meant that the maximum possible B–B distance was
2.9 Å. This distance is significantly shorter than in the determined structures of both
Ca(BH4)2·NH3, see section 6.4, and in α-Ca(BH4)2 (> 4 Å),33 and so occupation of the
2 Theta (°)
807570656055504540353025201510
Co
un
ts
10,000
7,500
5,000
2,500
0
-2,500
-5,000
Ca(BH4)2.NH3 100.00 %
2 Theta (°)
807570656055504540353025201510
Co
un
ts
10,000
7,500
5,000
2,500
0
-2,500
Ca(BH4)2.NH3 100.00 %
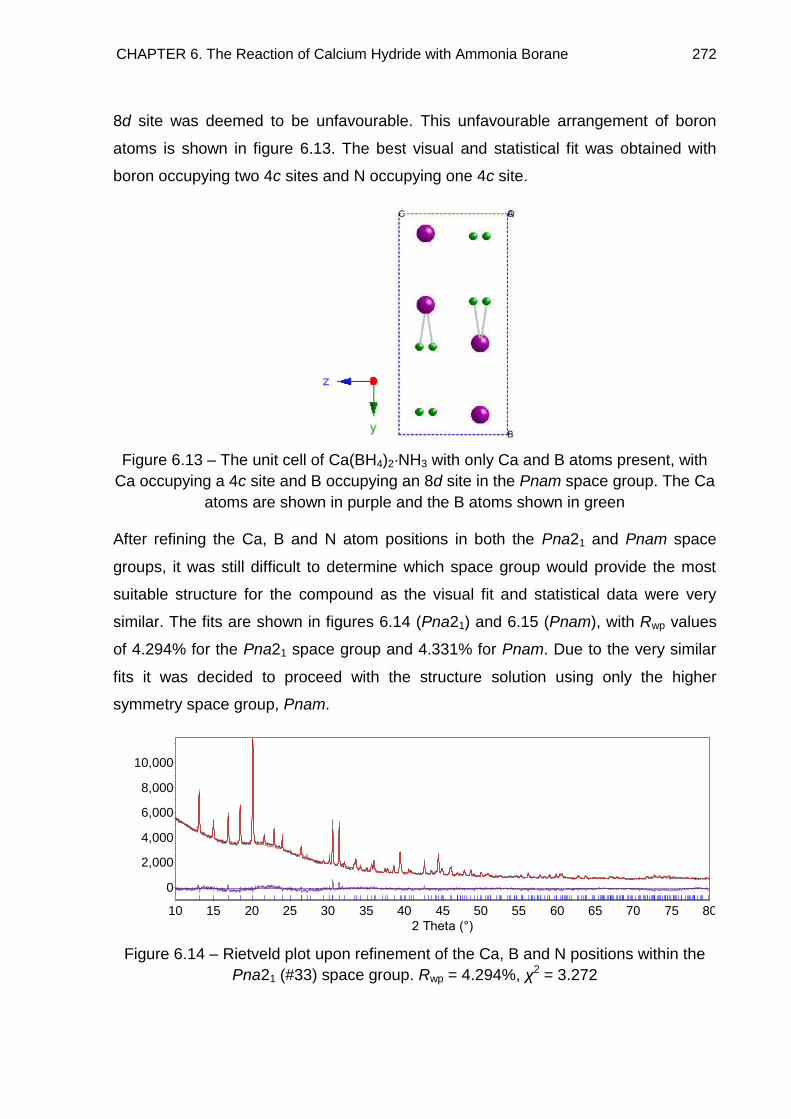
CHAPTER 6. The Reaction of Calcium Hydride with Ammonia Borane 272
8d site was deemed to be unfavourable. This unfavourable arrangement of boron
atoms is shown in figure 6.13. The best visual and statistical fit was obtained with
boron occupying two 4c sites and N occupying one 4c site.
Figure 6.13 – The unit cell of Ca(BH4)2·NH3 with only Ca and B atoms present, with
Ca occupying a 4c site and B occupying an 8d site in the Pnam space group. The Ca
atoms are shown in purple and the B atoms shown in green
After refining the Ca, B and N atom positions in both the Pna21 and Pnam space
groups, it was still difficult to determine which space group would provide the most
suitable structure for the compound as the visual fit and statistical data were very
similar. The fits are shown in figures 6.14 (Pna21) and 6.15 (Pnam), with Rwp values
of 4.294% for the Pna21 space group and 4.331% for Pnam. Due to the very similar
fits it was decided to proceed with the structure solution using only the higher
symmetry space group, Pnam.
Figure 6.14 – Rietveld plot upon refinement of the Ca, B and N positions within the
Pna21 (#33) space group. Rwp = 4.294%, χ2 = 3.272
2 Theta (°)
807570656055504540353025201510
Co
un
ts
10,000
8,000
6,000
4,000
2,000
0
Ca(BH4)2.NH3 100.00 %
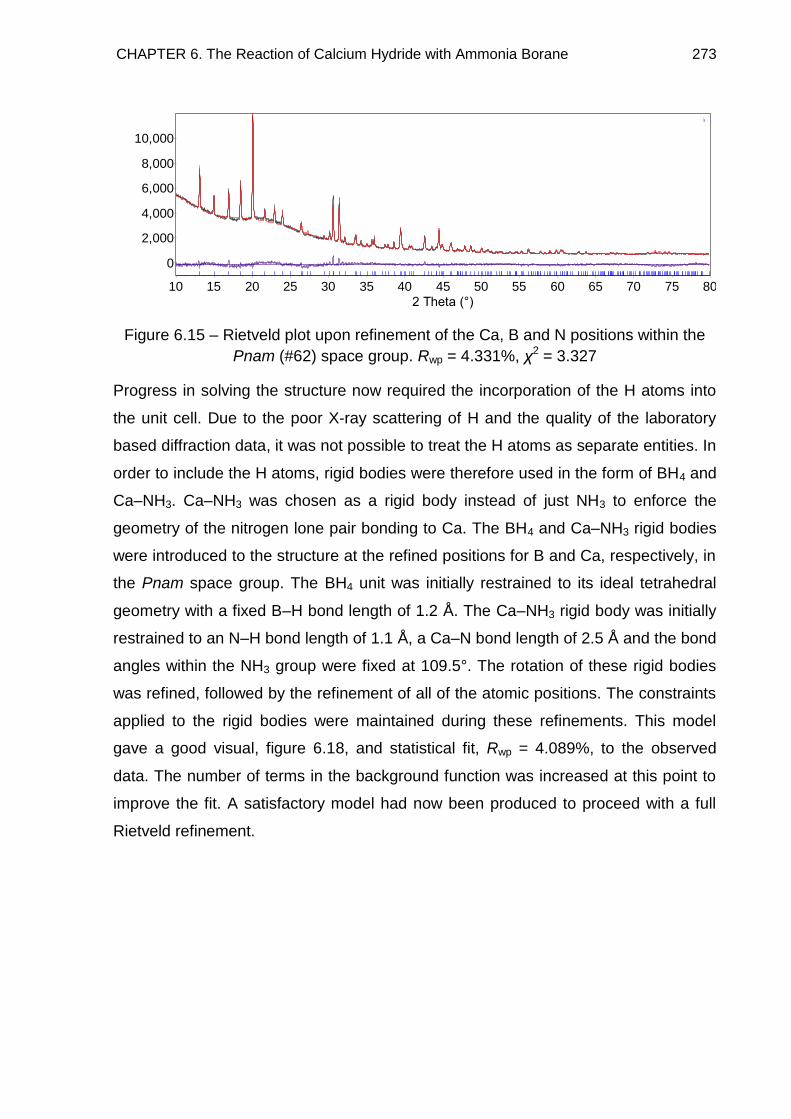
CHAPTER 6. The Reaction of Calcium Hydride with Ammonia Borane 273
Figure 6.15 – Rietveld plot upon refinement of the Ca, B and N positions within the
Pnam (#62) space group. Rwp = 4.331%, χ2 = 3.327
Progress in solving the structure now required the incorporation of the H atoms into
the unit cell. Due to the poor X-ray scattering of H and the quality of the laboratory
based diffraction data, it was not possible to treat the H atoms as separate entities. In
order to include the H atoms, rigid bodies were therefore used in the form of BH4 and
Ca–NH3. Ca–NH3 was chosen as a rigid body instead of just NH3 to enforce the
geometry of the nitrogen lone pair bonding to Ca. The BH4 and Ca–NH3 rigid bodies
were introduced to the structure at the refined positions for B and Ca, respectively, in
the Pnam space group. The BH4 unit was initially restrained to its ideal tetrahedral
geometry with a fixed B–H bond length of 1.2 Å. The Ca–NH3 rigid body was initially
restrained to an N–H bond length of 1.1 Å, a Ca–N bond length of 2.5 Å and the bond
angles within the NH3 group were fixed at 109.5°. The rotation of these rigid bodies
was refined, followed by the refinement of all of the atomic positions. The constraints
applied to the rigid bodies were maintained during these refinements. This model
gave a good visual, figure 6.18, and statistical fit, Rwp = 4.089%, to the observed
data. The number of terms in the background function was increased at this point to
improve the fit. A satisfactory model had now been produced to proceed with a full
Rietveld refinement.
2 Theta (°)
807570656055504540353025201510
Co
un
ts
10,000
8,000
6,000
4,000
2,000
0
Ca(BH4)2.NH3 100.00 %
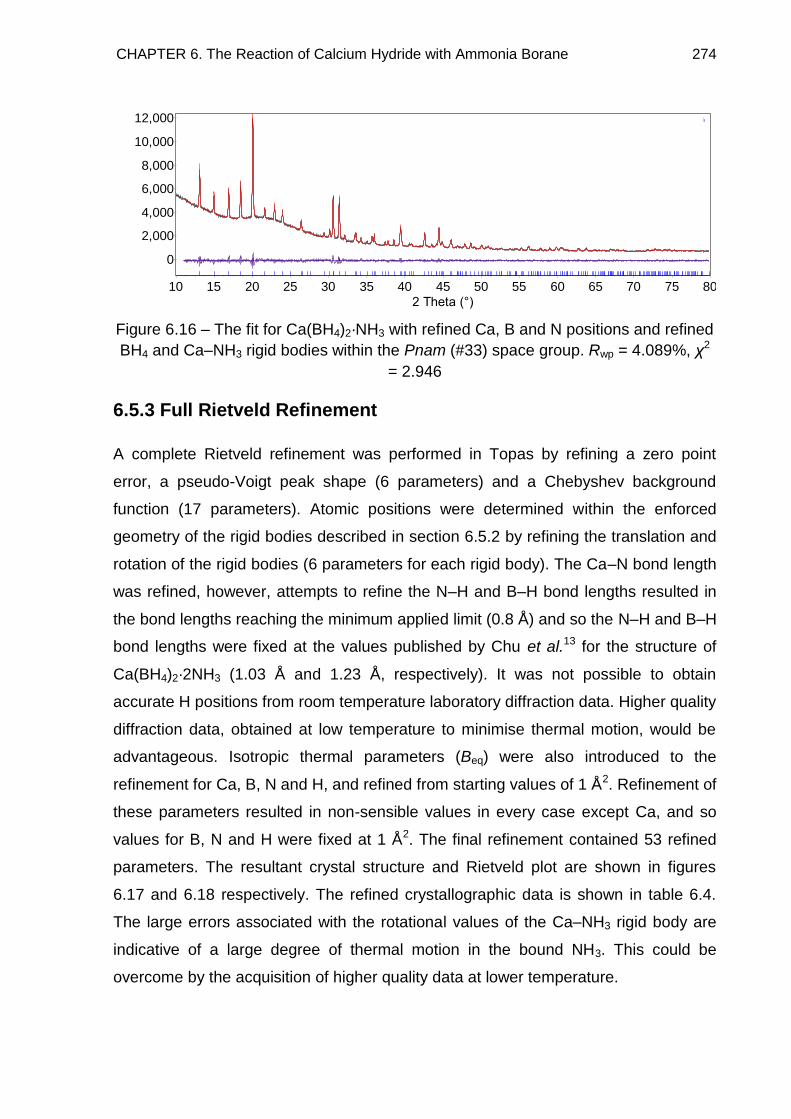
CHAPTER 6. The Reaction of Calcium Hydride with Ammonia Borane 274
Figure 6.16 – The fit for Ca(BH4)2·NH3 with refined Ca, B and N positions and refined
BH4 and Ca–NH3 rigid bodies within the Pnam (#33) space group. Rwp = 4.089%, χ2
= 2.946
6.5.3 Full Rietveld Refinement
A complete Rietveld refinement was performed in Topas by refining a zero point
error, a pseudo-Voigt peak shape (6 parameters) and a Chebyshev background
function (17 parameters). Atomic positions were determined within the enforced
geometry of the rigid bodies described in section 6.5.2 by refining the translation and
rotation of the rigid bodies (6 parameters for each rigid body). The Ca–N bond length
was refined, however, attempts to refine the N–H and B–H bond lengths resulted in
the bond lengths reaching the minimum applied limit (0.8 Å) and so the N–H and B–H
bond lengths were fixed at the values published by Chu et al.13 for the structure of
Ca(BH4)2·2NH3 (1.03 Å and 1.23 Å, respectively). It was not possible to obtain
accurate H positions from room temperature laboratory diffraction data. Higher quality
diffraction data, obtained at low temperature to minimise thermal motion, would be
advantageous. Isotropic thermal parameters (Beq) were also introduced to the
refinement for Ca, B, N and H, and refined from starting values of 1 Å2. Refinement of
these parameters resulted in non-sensible values in every case except Ca, and so
values for B, N and H were fixed at 1 Å2. The final refinement contained 53 refined
parameters. The resultant crystal structure and Rietveld plot are shown in figures
6.17 and 6.18 respectively. The refined crystallographic data is shown in table 6.4.
The large errors associated with the rotational values of the Ca–NH3 rigid body are
indicative of a large degree of thermal motion in the bound NH3. This could be
overcome by the acquisition of higher quality data at lower temperature.
2 Theta (°)
807570656055504540353025201510
Co
un
ts
12,000
10,000
8,000
6,000
4,000
2,000
0
Ca(BH4)2.NH3 100.00 %
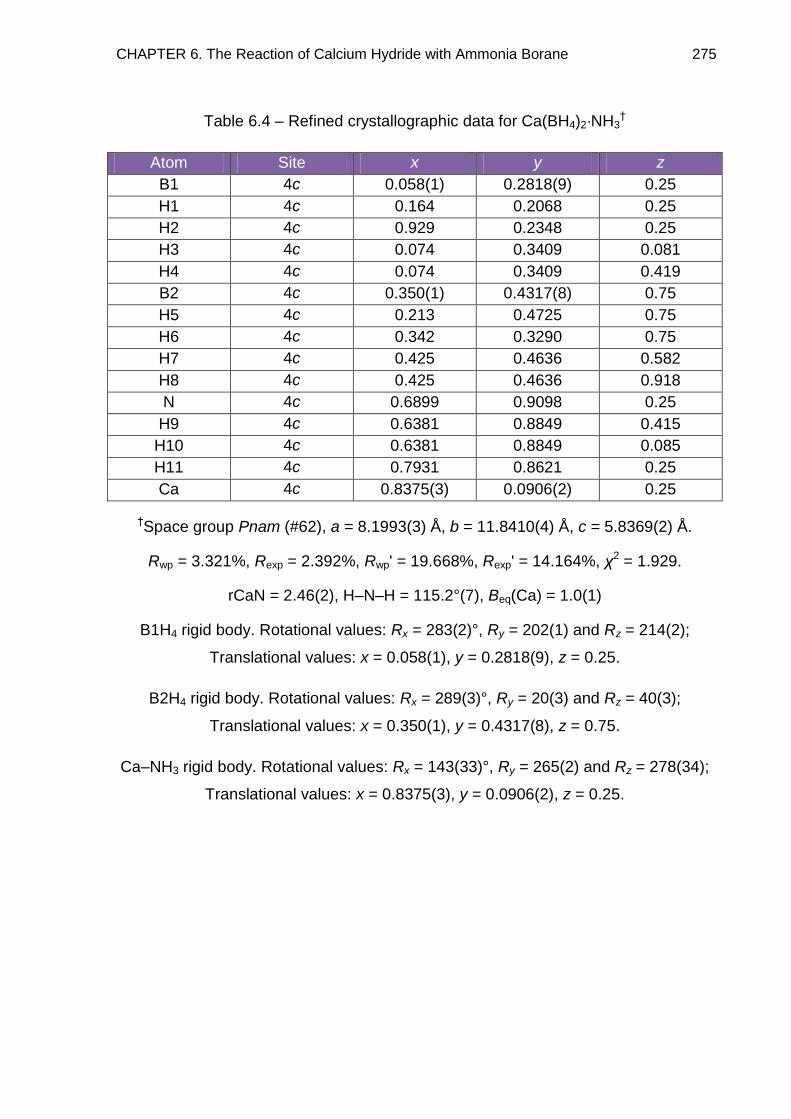
CHAPTER 6. The Reaction of Calcium Hydride with Ammonia Borane 275
Table 6.4 – Refined crystallographic data for Ca(BH4)2·NH3†
Atom Site x y z
B1 4c 0.058(1) 0.2818(9) 0.25
H1 4c 0.164 0.2068 0.25
H2 4c 0.929 0.2348 0.25
H3 4c 0.074 0.3409 0.081
H4 4c 0.074 0.3409 0.419
B2 4c 0.350(1) 0.4317(8) 0.75
H5 4c 0.213 0.4725 0.75
H6 4c 0.342 0.3290 0.75
H7 4c 0.425 0.4636 0.582
H8 4c 0.425 0.4636 0.918
N 4c 0.6899 0.9098 0.25
H9 4c 0.6381 0.8849 0.415
H10 4c 0.6381 0.8849 0.085
H11 4c 0.7931 0.8621 0.25
Ca 4c 0.8375(3) 0.0906(2) 0.25
†Space group Pnam (#62), a = 8.1993(3) Å, b = 11.8410(4) Å, c = 5.8369(2) Å.
Rwp = 3.321%, Rexp = 2.392%, Rwp' = 19.668%, Rexp' = 14.164%, χ2 = 1.929.
rCaN = 2.46(2), H–N–H = 115.2°(7), Beq(Ca) = 1.0(1)
B1H4 rigid body. Rotational values: Rx = 283(2)°, Ry = 202(1) and Rz = 214(2);
Translational values: x = 0.058(1), y = 0.2818(9), z = 0.25.
B2H4 rigid body. Rotational values: Rx = 289(3)°, Ry = 20(3) and Rz = 40(3);
Translational values: x = 0.350(1), y = 0.4317(8), z = 0.75.
Ca–NH3 rigid body. Rotational values: Rx = 143(33)°, Ry = 265(2) and Rz = 278(34);
Translational values: x = 0.8375(3), y = 0.0906(2), z = 0.25.
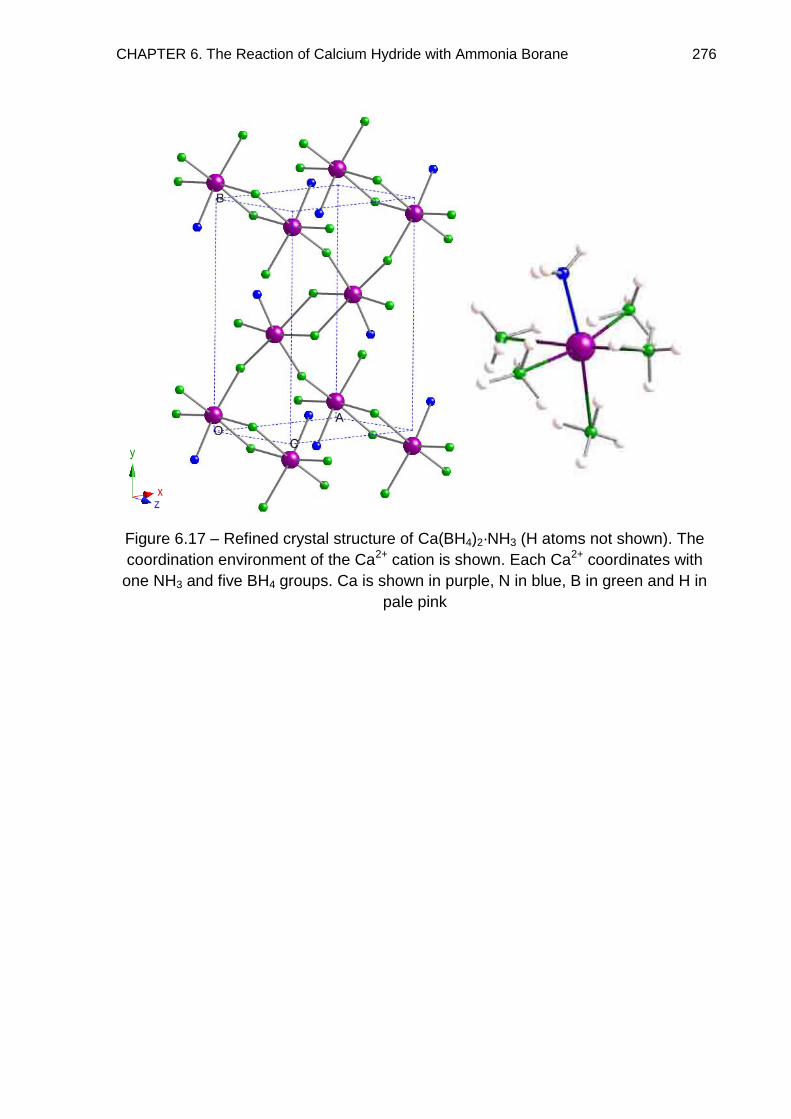
CHAPTER 6. The Reaction of Calcium Hydride with Ammonia Borane 276
Figure 6.17 – Refined crystal structure of Ca(BH4)2·NH3 (H atoms not shown). The
coordination environment of the Ca2+ cation is shown. Each Ca2+ coordinates with
one NH3 and five BH4 groups. Ca is shown in purple, N in blue, B in green and H in
pale pink
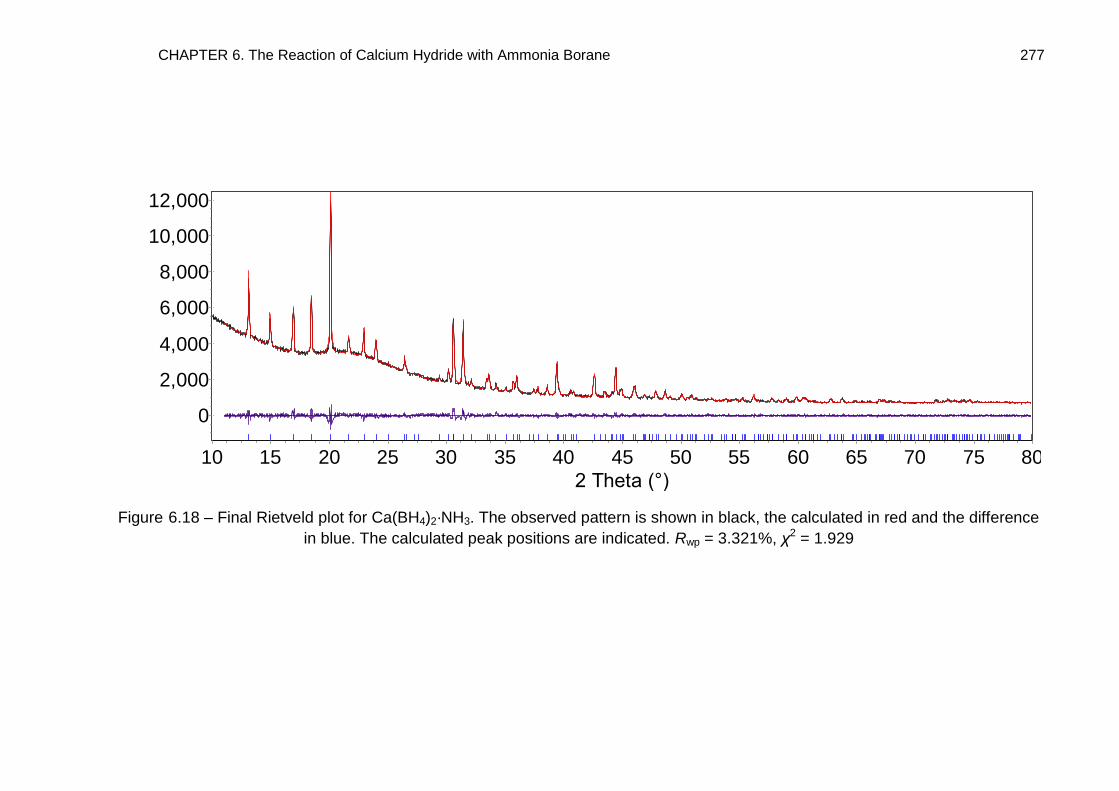
CHAPTER 6. The Reaction of Calcium Hydride with Ammonia Borane 277
Figure 6.18 – Final Rietveld plot for Ca(BH4)2·NH3. The observed pattern is shown in black, the calculated in red and the difference
in blue. The calculated peak positions are indicated. Rwp = 3.321%, χ2 = 1.929
2 Theta (°)
807570656055504540353025201510
Counts
12,000
10,000
8,000
6,000
4,000
2,000
0
Ca(BH4)2.NH3 100.00 %
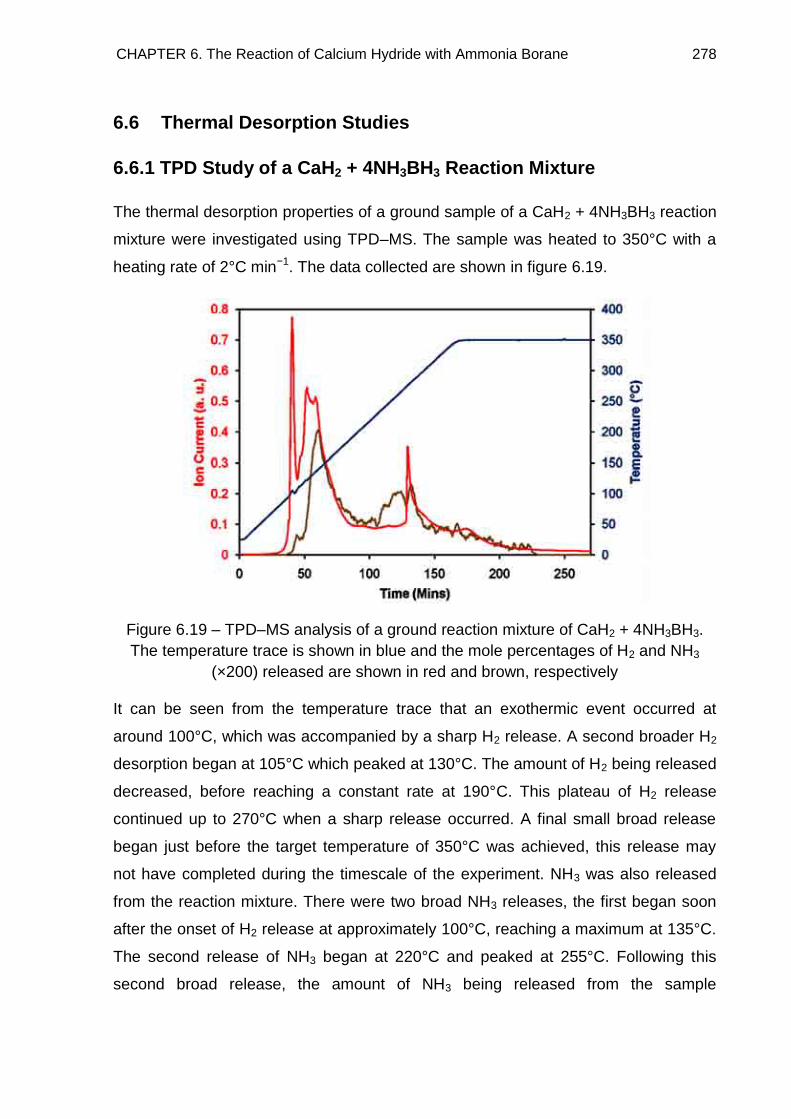
CHAPTER 6. The Reaction of Calcium Hydride with Ammonia Borane 278
6.6 Thermal Desorption Studies
6.6.1 TPD Study of a CaH2 + 4NH3BH3 Reaction Mixture
The thermal desorption properties of a ground sample of a CaH2 + 4NH3BH3 reaction
mixture were investigated using TPD–MS. The sample was heated to 350°C with a
heating rate of 2°C min−1. The data collected are shown in figure 6.19.
Figure 6.19 – TPD–MS analysis of a ground reaction mixture of CaH2 + 4NH3BH3.
The temperature trace is shown in blue and the mole percentages of H2 and NH3
(×200) released are shown in red and brown, respectively
It can be seen from the temperature trace that an exothermic event occurred at
around 100°C, which was accompanied by a sharp H2 release. A second broader H2
desorption began at 105°C which peaked at 130°C. The amount of H2 being released
decreased, before reaching a constant rate at 190°C. This plateau of H2 release
continued up to 270°C when a sharp release occurred. A final small broad release
began just before the target temperature of 350°C was achieved, this release may
not have completed during the timescale of the experiment. NH3 was also released
from the reaction mixture. There were two broad NH3 releases, the first began soon
after the onset of H2 release at approximately 100°C, reaching a maximum at 135°C.
The second release of NH3 began at 220°C and peaked at 255°C. Following this
second broad release, the amount of NH3 being released from the sample
CHAPTER 6. The Reaction of Calcium Hydride with Ammonia Borane 279
decreased, although it did continue until the maximum temperature of 350°C was
reached.
Discussion
From the knowledge of the CaH2 + 4NH3BH3 reaction pathway garnered from powder
XRD patterns, the desorptions observed in the TPD experiment would be expected to
be related to events in the reaction pathway. The steps of the reaction pathway
observed through powder XRD are shown below as well as the expected desorbed
gases.
CaH2 + 4NH3BH3 → Ca(BH4)2·2NH3 + B2N2H(12−2n) + nH2 Reaction 6.4
Ca(BH4)2·2NH3 → Ca(BH4)2·NH3 + NH3 Reaction 6.5
Ca(BH4)2·NH3 → α-Ca(BH4)2 + NH3 Reaction 6.6
α-Ca(BH4)2 → β-Ca(BH4)2 Reaction 6.7
α + β-Ca(BH4)2 → 2/3CaH2 + 1/3CaB6 + 10/3H2 Reaction 6.8
The two desorptions of NH3 can hence be assigned to reactions 6.5 and 6.6. These
reactions were shown to be completed at 150°C and 225°C, respectively, by powder
XRD. The first NH3 desorption correlated well with this temperature, with the majority
of this first desorption being completed below 180°C. The majority of the second NH3
desorption took place below a temperature of 300°C, with the peak rate of release at
255°C. This discrepancy in temperature could have been due to the different
experimental setups: the TPD experiment was heated at 2°C min−1 whereas the gas
line reactions were held for 12 hours at the reaction temperature. Therefore, events
in the TPD trace were likely to occur at higher temperatures than in gas line
reactions. As shown in the structural model of Ca(BH4)2·2NH3, section 6.4, each Ca
centre was coordinated with two NH3 molecules. The relatively low onset temperature
of NH3 release, 100°C, highlighted that the NH3 molecules were coordinated to the
Ca. This was a much lower temperature release of NH3 compared to Ca(NH2)2
(347°C) and LiNH2 (380°C), where the N is more strongly bound to the metal atom.34,
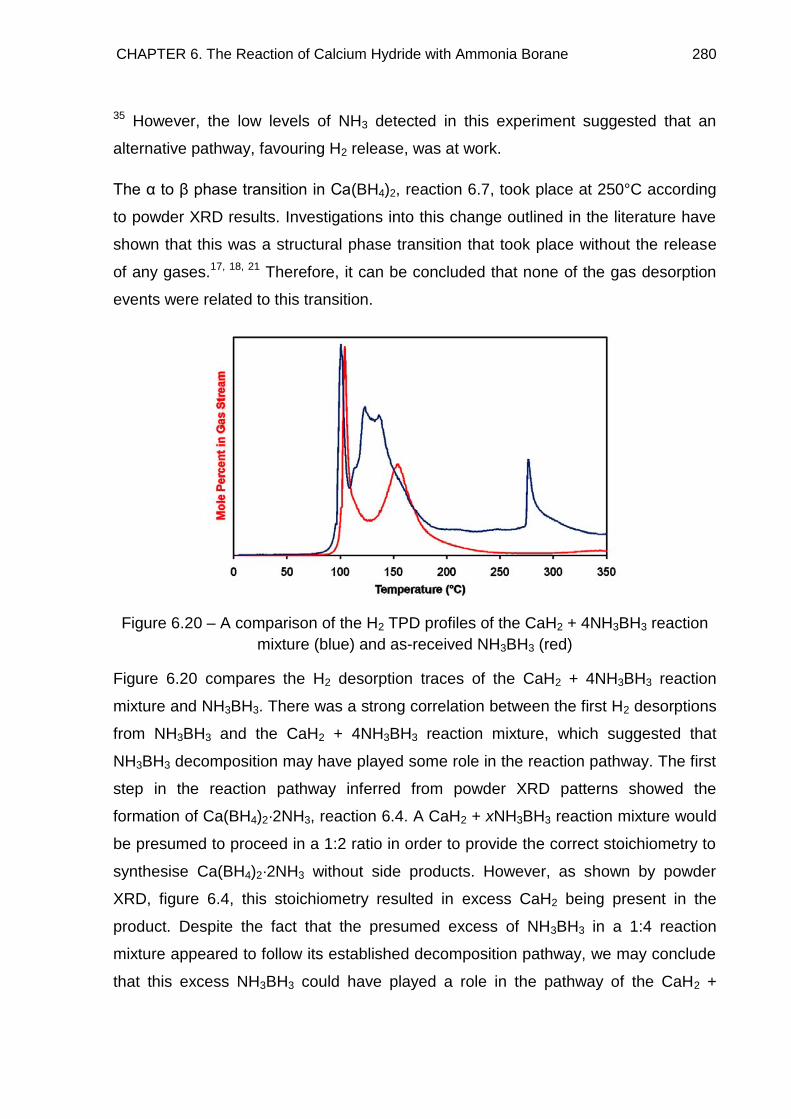
CHAPTER 6. The Reaction of Calcium Hydride with Ammonia Borane 280
35 However, the low levels of NH3 detected in this experiment suggested that an
alternative pathway, favouring H2 release, was at work.
The α to β phase transition in Ca(BH4)2, reaction 6.7, took place at 250°C according
to powder XRD results. Investigations into this change outlined in the literature have
shown that this was a structural phase transition that took place without the release
of any gases.17, 18, 21 Therefore, it can be concluded that none of the gas desorption
events were related to this transition.
Figure 6.20 – A comparison of the H2 TPD profiles of the CaH2 + 4NH3BH3 reaction
mixture (blue) and as-received NH3BH3 (red)
Figure 6.20 compares the H2 desorption traces of the CaH2 + 4NH3BH3 reaction
mixture and NH3BH3. There was a strong correlation between the first H2 desorptions
from NH3BH3 and the CaH2 + 4NH3BH3 reaction mixture, which suggested that
NH3BH3 decomposition may have played some role in the reaction pathway. The first
step in the reaction pathway inferred from powder XRD patterns showed the
formation of Ca(BH4)2·2NH3, reaction 6.4. A CaH2 + xNH3BH3 reaction mixture would
be presumed to proceed in a 1:2 ratio in order to provide the correct stoichiometry to
synthesise Ca(BH4)2·2NH3 without side products. However, as shown by powder
XRD, figure 6.4, this stoichiometry resulted in excess CaH2 being present in the
product. Despite the fact that the presumed excess of NH3BH3 in a 1:4 reaction
mixture appeared to follow its established decomposition pathway, we may conclude
that this excess NH3BH3 could have played a role in the pathway of the CaH2 +
CHAPTER 6. The Reaction of Calcium Hydride with Ammonia Borane 281
4NH3BH3 reaction, because it was only at this stoichiometry that the starting
materials were completely consumed during the reaction. The possible role of
NH3BH3 in the reaction mechanism will be discussed in section 6.8. The first H2
desorption step in the decomposition of NH3BH3 results in the formation of the
amorphous material polyaminoborane, (NH2BH2)n, see chapter 3.4. As the only
crystalline phase observed in the powder XRD pattern of the product of the CaH2 +
4NH3BH3 reaction at 80°C was Ca(BH4)2·2NH3, the remaining B, N and H must have
been present in an amorphous material. The first H2 desorption may therefore involve
the following reaction:
CaH2 + 4NH3BH3 → Ca(BH4)2·2NH3 + 2(NH2BH2)n + 2H2 Reaction 6.9
A key observation of the reaction was that during heating the sample underwent a
significant volume expansion, a phenomenon also observed during the thermal
decomposition of as-received NH3BH3, which supports the notion that NH3BH3
decomposition was involved in the reaction pathway. Furthermore, this
decomposition is an exothermic process, explaining the observed exothermic event
in figure 6.19. Following this first step, two separate desorption pathways could then
proceed: firstly as discussed above the two step NH3 release from Ca(BH4)2·2NH3
and secondly, as discussed in chapter 3.4, further H2 release from (NH2BH2)n. Figure
6.20 shows that the second desorption of NH3BH3 occurred as a shoulder on the
broad desorption from the mixture. This provided evidence that the decomposition of
(NH2BH2)n, yielding (NHBH)n took place, reaction 6.10, but that other desorption
events also proceeded, underlining the complicated nature of the desorption
pathway.
2(NH2BH2)n → 2(NHBH)n + 2nH2 Reaction 6.10
The broad desorption of H2 between the two NH3BH3 related desorptions occurred
just after the onset of NH3 release. A study by Chu et al.13 with respect to the
decomposition of Ca(BH4)2·2NH3 reported that under flowing conditions NH3 was the
only desorbed product, whereas H2 was exclusively released in a closed system.
This was rationalised by the fact that in a closed system the NH3 would remain in
close proximity to Ca(BH4)2, giving the potential to interact with nearby species and
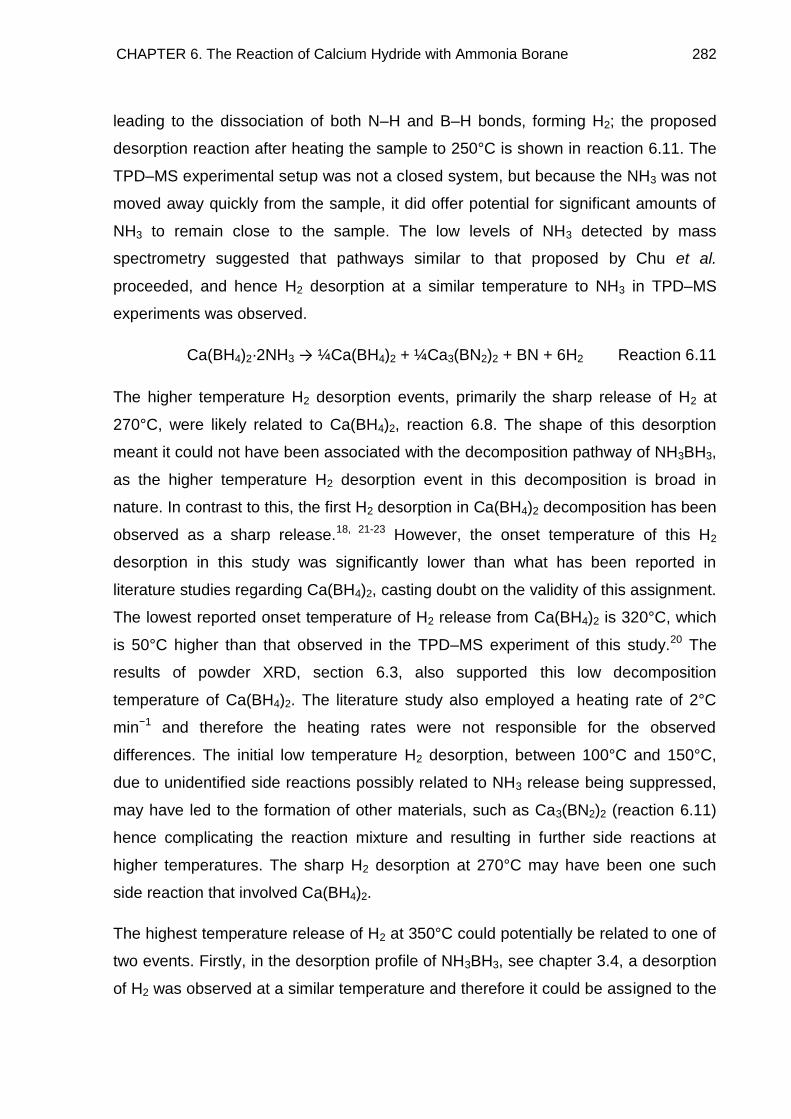
CHAPTER 6. The Reaction of Calcium Hydride with Ammonia Borane 282
leading to the dissociation of both N–H and B–H bonds, forming H2; the proposed
desorption reaction after heating the sample to 250°C is shown in reaction 6.11. The
TPD–MS experimental setup was not a closed system, but because the NH3 was not
moved away quickly from the sample, it did offer potential for significant amounts of
NH3 to remain close to the sample. The low levels of NH3 detected by mass
spectrometry suggested that pathways similar to that proposed by Chu et al.
proceeded, and hence H2 desorption at a similar temperature to NH3 in TPD–MS
experiments was observed.
Ca(BH4)2·2NH3 → ¼Ca(BH4)2 + ¼Ca3(BN2)2 + BN + 6H2 Reaction 6.11
The higher temperature H2 desorption events, primarily the sharp release of H2 at
270°C, were likely related to Ca(BH4)2, reaction 6.8. The shape of this desorption
meant it could not have been associated with the decomposition pathway of NH3BH3,
as the higher temperature H2 desorption event in this decomposition is broad in
nature. In contrast to this, the first H2 desorption in Ca(BH4)2 decomposition has been
observed as a sharp release.18, 21-23 However, the onset temperature of this H2
desorption in this study was significantly lower than what has been reported in
literature studies regarding Ca(BH4)2, casting doubt on the validity of this assignment.
The lowest reported onset temperature of H2 release from Ca(BH4)2 is 320°C, which
is 50°C higher than that observed in the TPD–MS experiment of this study.20 The
results of powder XRD, section 6.3, also supported this low decomposition
temperature of Ca(BH4)2. The literature study also employed a heating rate of 2°C
min−1 and therefore the heating rates were not responsible for the observed
differences. The initial low temperature H2 desorption, between 100°C and 150°C,
due to unidentified side reactions possibly related to NH3 release being suppressed,
may have led to the formation of other materials, such as Ca3(BN2)2 (reaction 6.11)
hence complicating the reaction mixture and resulting in further side reactions at
higher temperatures. The sharp H2 desorption at 270°C may have been one such
side reaction that involved Ca(BH4)2.
The highest temperature release of H2 at 350°C could potentially be related to one of
two events. Firstly, in the desorption profile of NH3BH3, see chapter 3.4, a desorption
of H2 was observed at a similar temperature and therefore it could be assigned to the
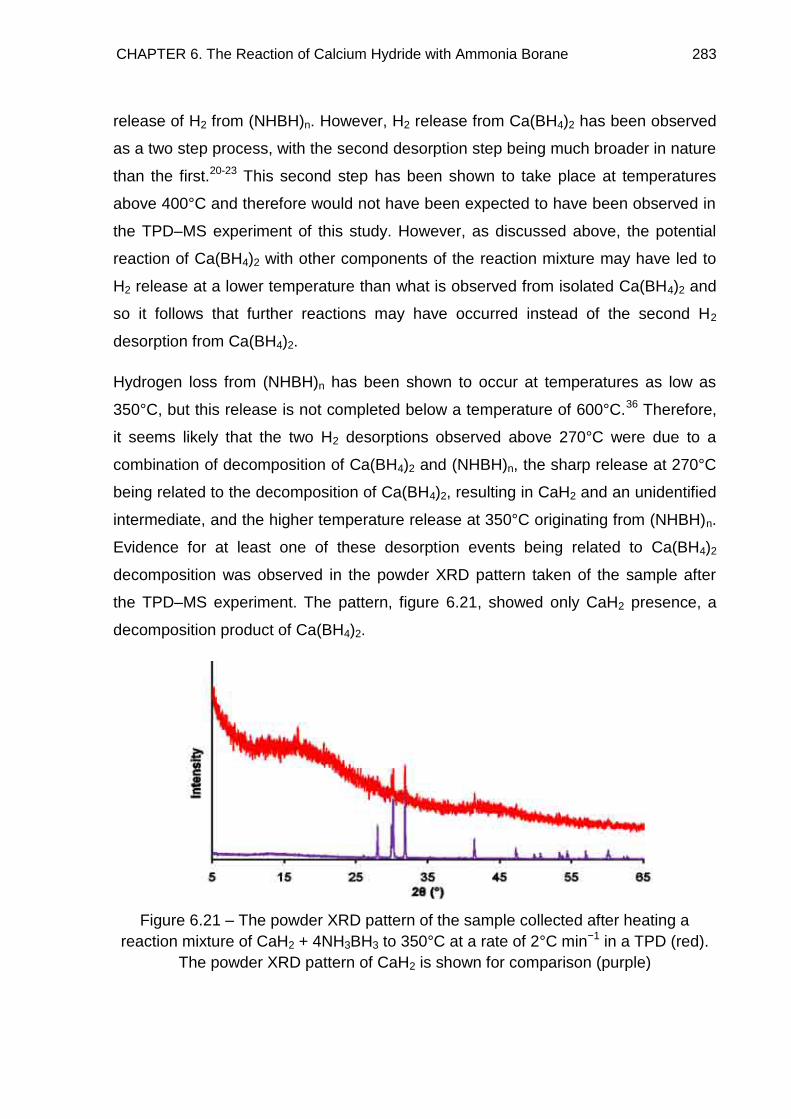
CHAPTER 6. The Reaction of Calcium Hydride with Ammonia Borane 283
release of H2 from (NHBH)n. However, H2 release from Ca(BH4)2 has been observed
as a two step process, with the second desorption step being much broader in nature
than the first.20-23 This second step has been shown to take place at temperatures
above 400°C and therefore would not have been expected to have been observed in
the TPD–MS experiment of this study. However, as discussed above, the potential
reaction of Ca(BH4)2 with other components of the reaction mixture may have led to
H2 release at a lower temperature than what is observed from isolated Ca(BH4)2 and
so it follows that further reactions may have occurred instead of the second H2
desorption from Ca(BH4)2.
Hydrogen loss from (NHBH)n has been shown to occur at temperatures as low as
350°C, but this release is not completed below a temperature of 600°C.36 Therefore,
it seems likely that the two H2 desorptions observed above 270°C were due to a
combination of decomposition of Ca(BH4)2 and (NHBH)n, the sharp release at 270°C
being related to the decomposition of Ca(BH4)2, resulting in CaH2 and an unidentified
intermediate, and the higher temperature release at 350°C originating from (NHBH)n.
Evidence for at least one of these desorption events being related to Ca(BH4)2
decomposition was observed in the powder XRD pattern taken of the sample after
the TPD–MS experiment. The pattern, figure 6.21, showed only CaH2 presence, a
decomposition product of Ca(BH4)2.
Figure 6.21 – The powder XRD pattern of the sample collected after heating a
reaction mixture of CaH2 + 4NH3BH3 to 350°C at a rate of 2°C min−1 in a TPD (red).
The powder XRD pattern of CaH2 is shown for comparison (purple)
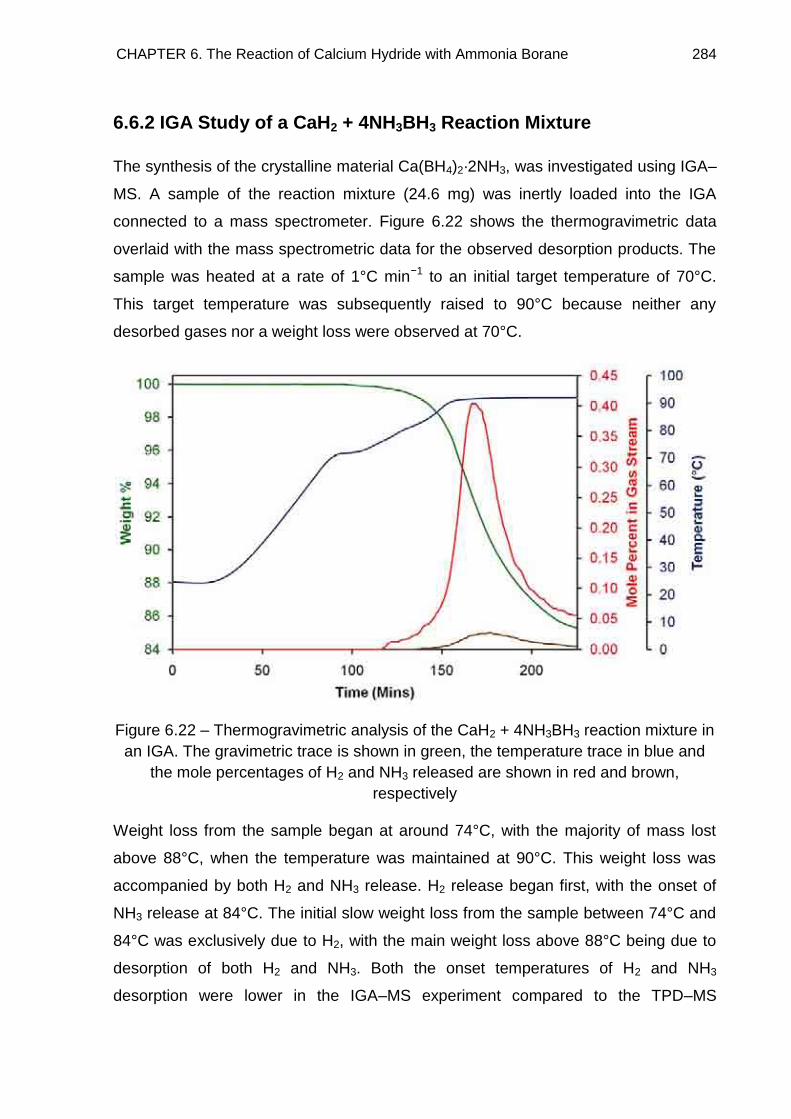
CHAPTER 6. The Reaction of Calcium Hydride with Ammonia Borane 284
6.6.2 IGA Study of a CaH2 + 4NH3BH3 Reaction Mixture
The synthesis of the crystalline material Ca(BH4)2·2NH3, was investigated using IGA–
MS. A sample of the reaction mixture (24.6 mg) was inertly loaded into the IGA
connected to a mass spectrometer. Figure 6.22 shows the thermogravimetric data
overlaid with the mass spectrometric data for the observed desorption products. The
sample was heated at a rate of 1°C min−1 to an initial target temperature of 70°C.
This target temperature was subsequently raised to 90°C because neither any
desorbed gases nor a weight loss were observed at 70°C.
Figure 6.22 – Thermogravimetric analysis of the CaH2 + 4NH3BH3 reaction mixture in
an IGA. The gravimetric trace is shown in green, the temperature trace in blue and
the mole percentages of H2 and NH3 released are shown in red and brown,
respectively
Weight loss from the sample began at around 74°C, with the majority of mass lost
above 88°C, when the temperature was maintained at 90°C. This weight loss was
accompanied by both H2 and NH3 release. H2 release began first, with the onset of
NH3 release at 84°C. The initial slow weight loss from the sample between 74°C and
84°C was exclusively due to H2, with the main weight loss above 88°C being due to
desorption of both H2 and NH3. Both the onset temperatures of H2 and NH3
desorption were lower in the IGA–MS experiment compared to the TPD–MS
CHAPTER 6. The Reaction of Calcium Hydride with Ammonia Borane 285
experiment. This was probably related to the lower heating rate employed in the
IGA–MS experiment. The sample showed a weight loss of 14.7 wt% during the
timescale of the experiment.
Discussion
The release of both H2 and NH3 during the IGA–MS experiment suggested that
decomposition of NH3BH3 to (NH2BH2)n had occurred, resulting in H2 release, along
with formation of Ca(BH4)2·2NH3 and its subsequent decomposition, releasing NH3 to
yield Ca(BH4)2·NH3. The theoretical weight losses for these two events are shown
below.
CaH2 + 4NH3BH3 → Ca(BH4)2·2NH3 + 2(NH2BH2)n + 2H2 2.4 wt%
Ca(BH4)2·2NH3 → Ca(BH4)2·NH3 + NH3 10.3 wt%
These two reactions account for a weight loss of 12.7 wt% from the initial sample,
which was lower than the observed weight loss of 14.7 wt%. The additional weight
loss must have therefore been due to either the next steps in the reaction pathways
or side reactions.
6.6.3 Thermal Desorption Studies of Product A
6.6.3.1 TPD Study of Product A
The thermal desorption properties of the product of the CaH2 + 4NH3BH3 reaction
heated at 80°C were investigated using TPD–MS. Powder XRD of the sample prior to
the TPD–MS experiment confirmed that the sample contained the crystalline phase
Ca(BH4)2·2NH3. The sample was heated to 350°C with a heating rate of 2°C min−1.
The data collected are shown in figure 6.23.
The desorption profile (figure 6.23) showed that both H2 and NH3 were released from
the sample, with the onset of H2 release at a lower temperature, 95°C, than that of
NH3, 125°C. The first desorption of H2 peaked at 135°C, which was shortly followed
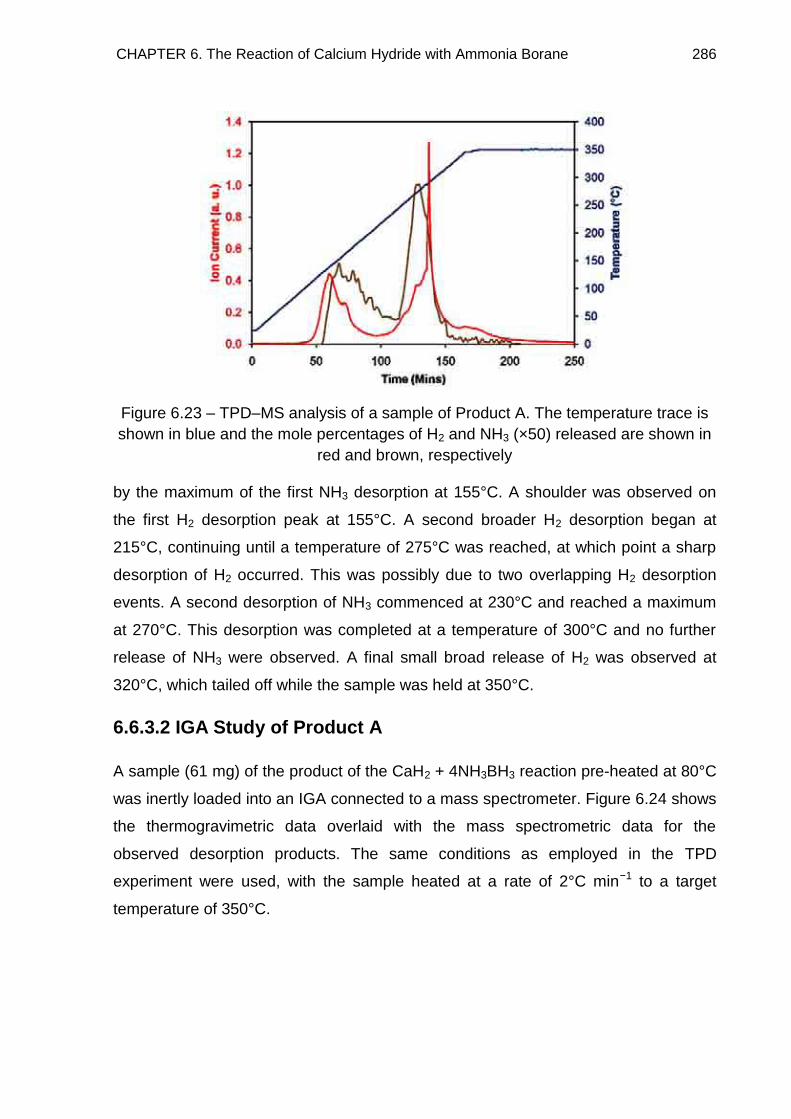
CHAPTER 6. The Reaction of Calcium Hydride with Ammonia Borane 286
Figure 6.23 – TPD–MS analysis of a sample of Product A. The temperature trace is
shown in blue and the mole percentages of H2 and NH3 (×50) released are shown in
red and brown, respectively
by the maximum of the first NH3 desorption at 155°C. A shoulder was observed on
the first H2 desorption peak at 155°C. A second broader H2 desorption began at
215°C, continuing until a temperature of 275°C was reached, at which point a sharp
desorption of H2 occurred. This was possibly due to two overlapping H2 desorption
events. A second desorption of NH3 commenced at 230°C and reached a maximum
at 270°C. This desorption was completed at a temperature of 300°C and no further
release of NH3 were observed. A final small broad release of H2 was observed at
320°C, which tailed off while the sample was held at 350°C.
6.6.3.2 IGA Study of Product A
A sample (61 mg) of the product of the CaH2 + 4NH3BH3 reaction pre-heated at 80°C
was inertly loaded into an IGA connected to a mass spectrometer. Figure 6.24 shows
the thermogravimetric data overlaid with the mass spectrometric data for the
observed desorption products. The same conditions as employed in the TPD
experiment were used, with the sample heated at a rate of 2°C min−1 to a target
temperature of 350°C.
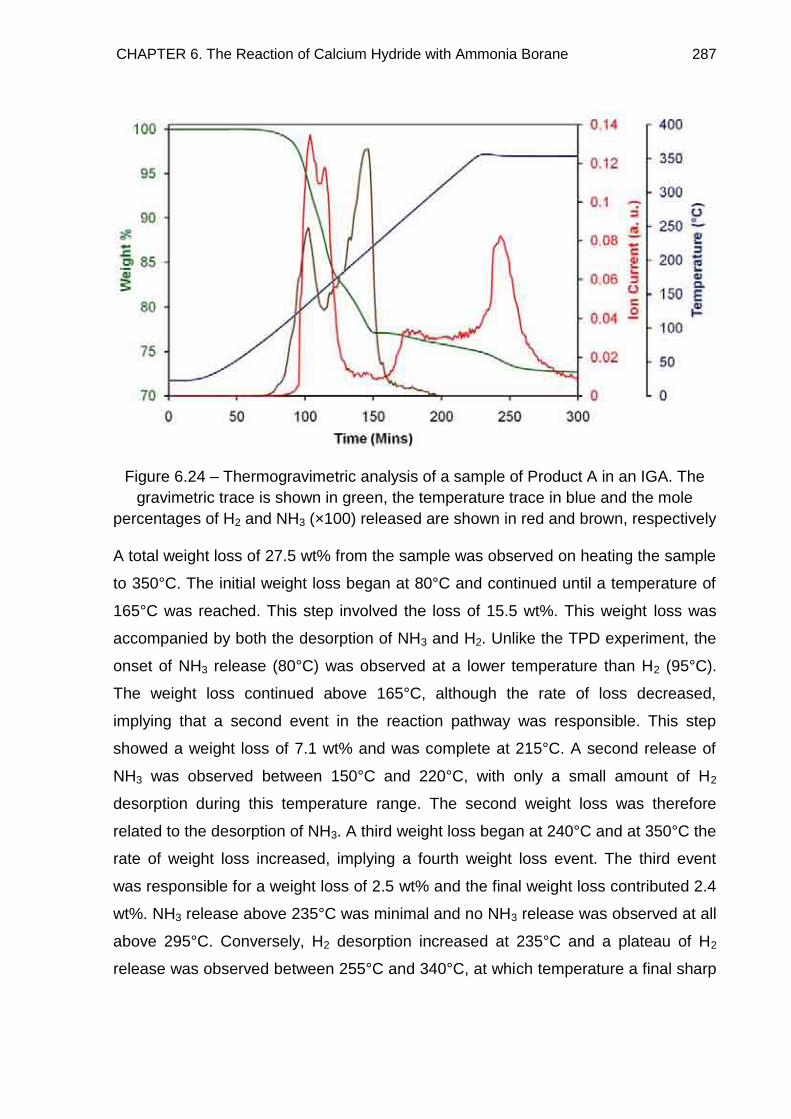
CHAPTER 6. The Reaction of Calcium Hydride with Ammonia Borane 287
Figure 6.24 – Thermogravimetric analysis of a sample of Product A in an IGA. The
gravimetric trace is shown in green, the temperature trace in blue and the mole
percentages of H2 and NH3 (×100) released are shown in red and brown, respectively
A total weight loss of 27.5 wt% from the sample was observed on heating the sample
to 350°C. The initial weight loss began at 80°C and continued until a temperature of
165°C was reached. This step involved the loss of 15.5 wt%. This weight loss was
accompanied by both the desorption of NH3 and H2. Unlike the TPD experiment, the
onset of NH3 release (80°C) was observed at a lower temperature than H2 (95°C).
The weight loss continued above 165°C, although the rate of loss decreased,
implying that a second event in the reaction pathway was responsible. This step
showed a weight loss of 7.1 wt% and was complete at 215°C. A second release of
NH3 was observed between 150°C and 220°C, with only a small amount of H2
desorption during this temperature range. The second weight loss was therefore
related to the desorption of NH3. A third weight loss began at 240°C and at 350°C the
rate of weight loss increased, implying a fourth weight loss event. The third event
was responsible for a weight loss of 2.5 wt% and the final weight loss contributed 2.4
wt%. NH3 release above 235°C was minimal and no NH3 release was observed at all
above 295°C. Conversely, H2 desorption increased at 235°C and a plateau of H2
release was observed between 255°C and 340°C, at which temperature a final sharp
CHAPTER 6. The Reaction of Calcium Hydride with Ammonia Borane 288
release occurred, which peaked at 350°C. As 350°C was the highest temperature
that the sample was exposed to, the experiment seemed to have captured an
isothermal desorption. The two higher temperature weight losses were clearly due to
the desorption of H2.
6.6.3.3 Discussion
The TPD–MS results (figure 6.23) showed the expected two step NH3 desorption
pathway, for the decomposition of Ca(BH4)2·2NH3 to Ca(BH4)2·NH3, followed by its
subsequent decomposition to Ca(BH4)2. The low levels of NH3 detected again
suggested that this was in fact a minority pathway within this experimental setup. The
initial H2 desorption was similar to what was observed from the reaction mixture,
figure 6.19, with the initial release being related to alternative desorption pathways
previously discussed, section 6.6.1, and the shoulder of this release being due to
(NH2BH2)n decomposition. The broad higher temperature H2 release at 320°C may
subsequently have been associated with the decomposition of (NHBH)n. H2 release
between 215°C and 320°C was not observed during the TPD study of NH3BH3,
chapter 3.4, and therefore it cannot have been associated with this decomposition
pathway. Hence, this H2 release was likely associated with Ca(BH4)2, with the
possibility of side reactions or unexpected interactions between compounds present
in the two main desorption pathways being responsible. As with the TPD–MS study
of the CaH2 + 4NH3BH3 reaction mixture, the temperature at which the sharp release
of H2 occurred at, 275°C, was lower than what would be expected for isolated
Ca(BH4)2. Therefore, the rationale discussed previously for this lower than expected
H2 release in section 6.6.1 can also be applied here. The fact that this H2 release
occurred shortly after the peak of the second NH3 desorption showed that the
formation of Ca(BH4)2 was rapidly followed by either its decomposition or involvement
in side reactions.
The IGA desorption study of Ca(BH4)2·2NH3 revealed a total weight loss of 27.5 wt%,
with a 22.6 wt% loss below 215°C. The majority of the NH3 desorption took place
below this temperature. Theoretically the release of one equivalent of NH3 from
Ca(BH4)2·2NH3 would result in a weight loss of 16.4 wt% and as two equivalents
would be lost on forming Ca(BH4)2 the expected weight loss for the IGA study was
CHAPTER 6. The Reaction of Calcium Hydride with Ammonia Borane 289
32.8 wt%. The much lower observed weight loss offers support to the notion that
there was amorphous material present in the sample, such as (NH2BH2)n. The
calculated weight losses from the initial sample assuming a composition of
Ca(BH4)2·2NH3 + 2(NH2BH2)n are shown below for the desorption events observed
below 215°C.
Ca(BH4)2·2NH3 + 2(NH2BH2)n → Ca(BH4)2·NH3 + 2(NH2BH2)n + NH3 10.5 wt%
Ca(BH4)2·NH3 + 2(NH2BH2)n → Ca(BH4)2·NH3 + 2(NHBH)n + 2H2 2.5 wt%
Ca(BH4)2·NH3 + 2(NHBH)n → Ca(BH4)2 + 2(NHBH)n + NH3 10.5 wt%
This gives a total theoretical weight loss of 23.5 wt% which agrees well with the
observed weight loss. The slight discrepancy was due to the fact that there was a
small amount of NH3 released above 215°C. The loss of 4.9 wt% above 215°C was
primarily due to H2 desorption although it was slightly contaminated with NH3. Below
215°C the observed weight loss was 0.9 wt% less than the theoretical value due to
NH3 loss not being completed. Therefore it can be assumed that above 215°C, H2
desorption caused a weight loss of 4.0 wt%, which was equal to a desorption of three
equivalents of H2. H2 desorption from Ca(BH4)2 and (NHBH)n could both have
contributed to this weight loss. Thermogravimetric studies of Ca(BH4)2 have shown
that weight loss totalled 6 wt%, equal to two equivalents of H2, up to a temperature of
350°C.18, 20, 21 Therefore, two of the three equivalents of H2 released above 215°C in
the IGA–MS study can be assigned to Ca(BH4)2 decomposition with the remaining
one equivalent desorbed from amorphous material in the sample. The good
agreement between the theoretical and calculated weight losses suggests that in the
IGA study the two pathways operated more or less separately and that side reactions
were less of an issue. Significant support for this comes from the higher temperature
H2 release. The release at 350°C agrees much better with the reported
decomposition temperature of Ca(BH4)2, implying that in the IGA experiment this
phase was not involved in side reactions.
There were a number of differences between the TPD–MS and IGA–MS
experiments. In the TPD–MS experiment, the onset of NH3 release was at a higher
temperature than that of H2, whereas this was reversed for the IGA–MS experiment.
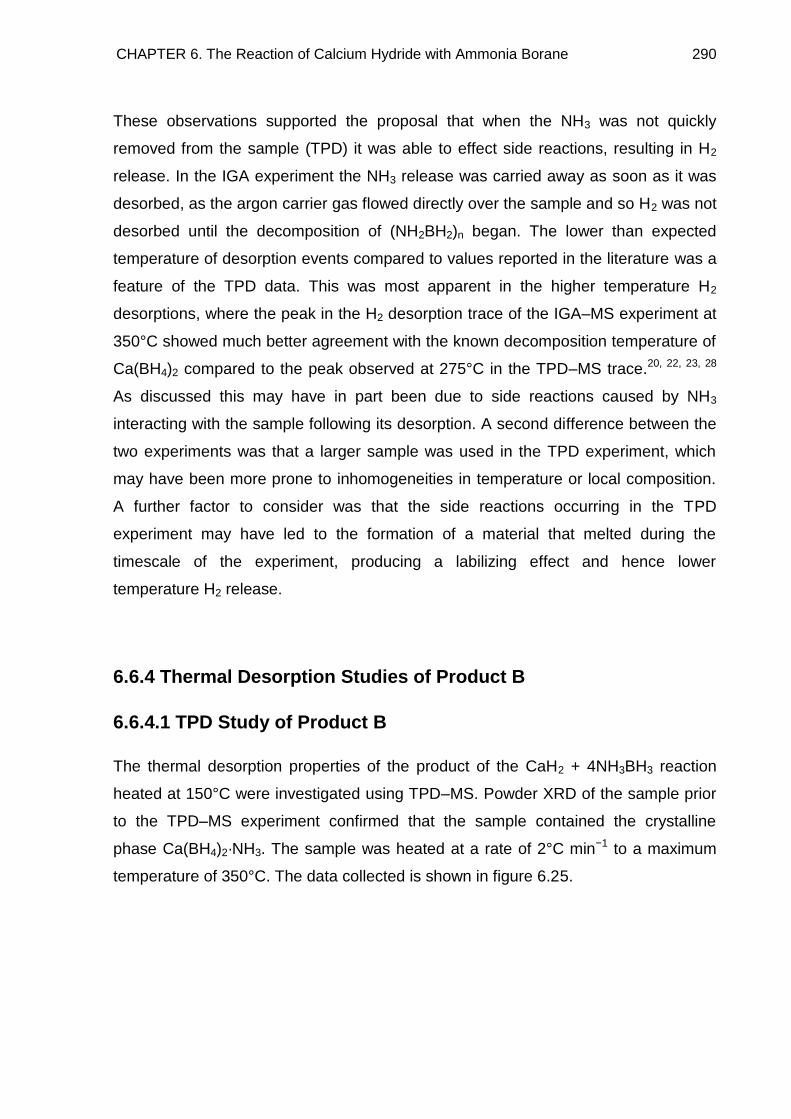
CHAPTER 6. The Reaction of Calcium Hydride with Ammonia Borane 290
These observations supported the proposal that when the NH3 was not quickly
removed from the sample (TPD) it was able to effect side reactions, resulting in H2
release. In the IGA experiment the NH3 release was carried away as soon as it was
desorbed, as the argon carrier gas flowed directly over the sample and so H2 was not
desorbed until the decomposition of (NH2BH2)n began. The lower than expected
temperature of desorption events compared to values reported in the literature was a
feature of the TPD data. This was most apparent in the higher temperature H2
desorptions, where the peak in the H2 desorption trace of the IGA–MS experiment at
350°C showed much better agreement with the known decomposition temperature of
Ca(BH4)2 compared to the peak observed at 275°C in the TPD–MS trace.20, 22, 23, 28
As discussed this may have in part been due to side reactions caused by NH3
interacting with the sample following its desorption. A second difference between the
two experiments was that a larger sample was used in the TPD experiment, which
may have been more prone to inhomogeneities in temperature or local composition.
A further factor to consider was that the side reactions occurring in the TPD
experiment may have led to the formation of a material that melted during the
timescale of the experiment, producing a labilizing effect and hence lower
temperature H2 release.
6.6.4 Thermal Desorption Studies of Product B
6.6.4.1 TPD Study of Product B
The thermal desorption properties of the product of the CaH2 + 4NH3BH3 reaction
heated at 150°C were investigated using TPD–MS. Powder XRD of the sample prior
to the TPD–MS experiment confirmed that the sample contained the crystalline
phase Ca(BH4)2·NH3. The sample was heated at a rate of 2°C min−1 to a maximum
temperature of 350°C. The data collected is shown in figure 6.25.
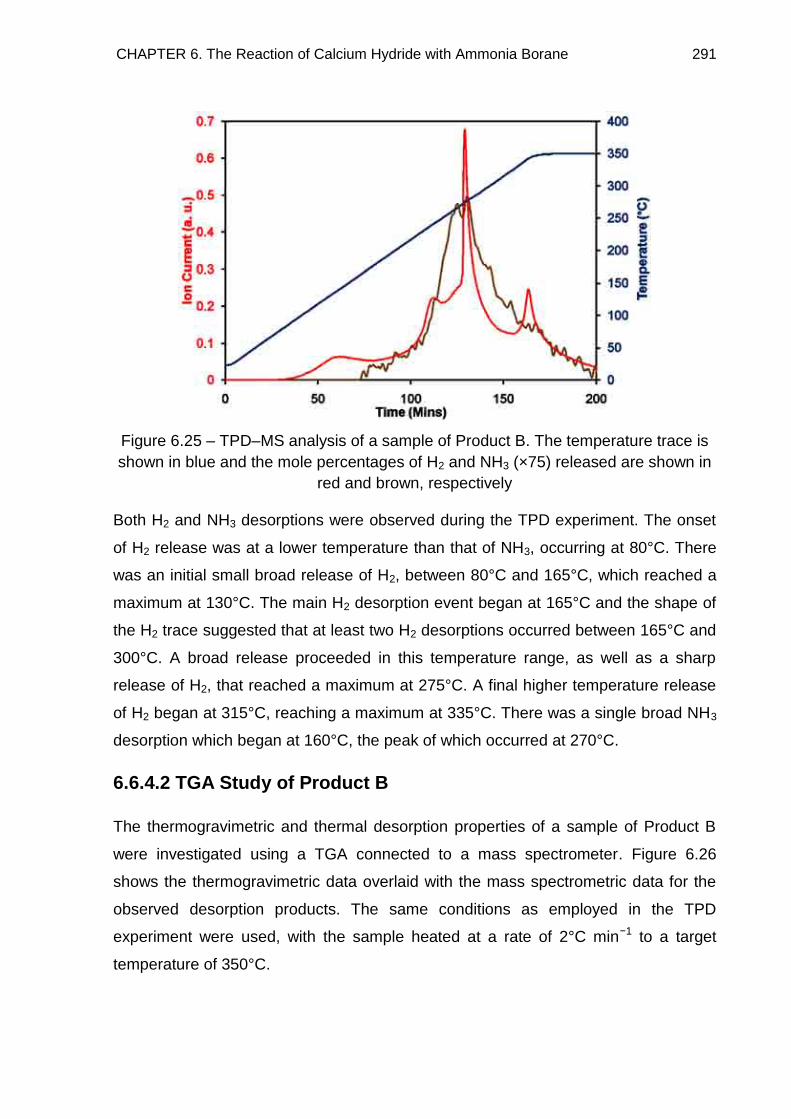
CHAPTER 6. The Reaction of Calcium Hydride with Ammonia Borane 291
Figure 6.25 – TPD–MS analysis of a sample of Product B. The temperature trace is
shown in blue and the mole percentages of H2 and NH3 (×75) released are shown in
red and brown, respectively
Both H2 and NH3 desorptions were observed during the TPD experiment. The onset
of H2 release was at a lower temperature than that of NH3, occurring at 80°C. There
was an initial small broad release of H2, between 80°C and 165°C, which reached a
maximum at 130°C. The main H2 desorption event began at 165°C and the shape of
the H2 trace suggested that at least two H2 desorptions occurred between 165°C and
300°C. A broad release proceeded in this temperature range, as well as a sharp
release of H2, that reached a maximum at 275°C. A final higher temperature release
of H2 began at 315°C, reaching a maximum at 335°C. There was a single broad NH3
desorption which began at 160°C, the peak of which occurred at 270°C.
6.6.4.2 TGA Study of Product B
The thermogravimetric and thermal desorption properties of a sample of Product B
were investigated using a TGA connected to a mass spectrometer. Figure 6.26
shows the thermogravimetric data overlaid with the mass spectrometric data for the
observed desorption products. The same conditions as employed in the TPD
experiment were used, with the sample heated at a rate of 2°C min−1 to a target
temperature of 350°C.
CHAPTER 6. The Reaction of Calcium Hydride with Ammonia Borane 292
Figure 6.26 – Thermogravimetric analysis of a sample of Product B in a TGA. The
gravimetric trace is shown in green, the temperature trace in blue and the mole
percentages of H2 and NH3 released shown in red and brown, respectively
The thermogravimetric data showed that a total weight loss of 14.8 wt% took place
during the experiment. There were a number of weight loss events that took place,
with the initial weight loss beginning at a temperature of 120°C. A second weight loss
event appeared to start before the completion of the first at 160°C, due to a change
in the rate of weight loss. The sample lost 2.2 wt% up to a temperature of 160°C. The
second weight loss was completed at 235°C and a further 8.4 wt% was lost from the
sample during this temperature range. Further weight loss was observed above
260°C in a two step process. The sample lost weight slowly between 260°C and
350°C, with a loss of 1.8 wt%. A final weight loss of 2.4 wt% took place while the
sample was maintained at a temperature of 350°C. Analysis of the gases desorbed
showed that the first two weight loss events were almost exclusively accompanied by
NH3 release. NH3 desorption began at 125°C, with an initially slow rate of desorption.
The rate of desorption increased greatly at 210°C and the majority of NH3 was
released above this temperature in a single step desorption, peaking at 220°C. This
desorption was complete at 240°C, with no further NH3 desorbed above this
temperature. Only a minimal amount of H2 was released below 240°C, with two very
small releases of H2 at 140°C and 235°C. The main H2 release occurred above
CHAPTER 6. The Reaction of Calcium Hydride with Ammonia Borane 293
250°C, with two desorptions evident above this temperature. The absence of NH3
release above this temperature showed that the two higher temperature weight
losses were due entirely to H2 loss. There was a sharp increase in the amount of H2
released at 250°C, while the rate of H2 release decreased slowly until a temperature
of 345°C was reached, when a sharp release of H2 began.
6.6.4.3 Discussion
Desorption of H2 below 150°C was unexpected because the sample was synthesised
at this temperature prior to the desorption experiments. This low temperature H2
release in the TPD–MS experiment could have been due to the presence of
(NH2BH2)n in the sample. The NH3 desorbed in both the experiments was due to the
decomposition of Ca(BH4)2·NH3, the discrepancy in the observed temperature of the
desorption being due to the different experimental setups as discussed in section
6.6.3. Assuming the initial sample contained Ca(BH4)2·NH3 and (NH2BH2)n, the
theoretical weight loss for this decomposition step is 11.7 wt%. The observed weight
loss due to NH3 release was less than this, 10.6 wt%, this difference was possibly
due to sample degradation, due to NH3 release, during the delay between
synthesising the sample and running the TGA experiment. The weight loss of 4.2
wt% above 260°C was exclusively due to H2 desorption, which meant that three
equivalents of H2 were desorbed. This was the same result as for the IGA–MS study
of Ca(BH4)2·2NH3, as would be expected and therefore the same conclusion can be
drawn: two equivalents of H2 were desorbed due to the decomposition of Ca(BH4)2
and the other equivalent desorbed from polymeric material in the sample.
The H2 desorption trace from Ca(BH4)2·NH3 again showed the same discrepancy as
with Ca(BH4)2·2NH3, where the H2 desorption assumed to be related to the
decomposition of Ca(BH4)2 occurred at a lower temperature than expected in the
TPD–MS experiment, whereas the TGA experiment showed the release at the
expected temperature. The H2 desorption from the TGA experiment was very similar
to that observed in the IGA trace of Product A at high temperature, which suggests
this data may be more reliable than TPD. The TGA experiment was similar in nature
to that of IGA–MS, in the sense that the argon carrier gas flowed directly over the
sample. This supports the proposal that the interaction of NH3 with sample
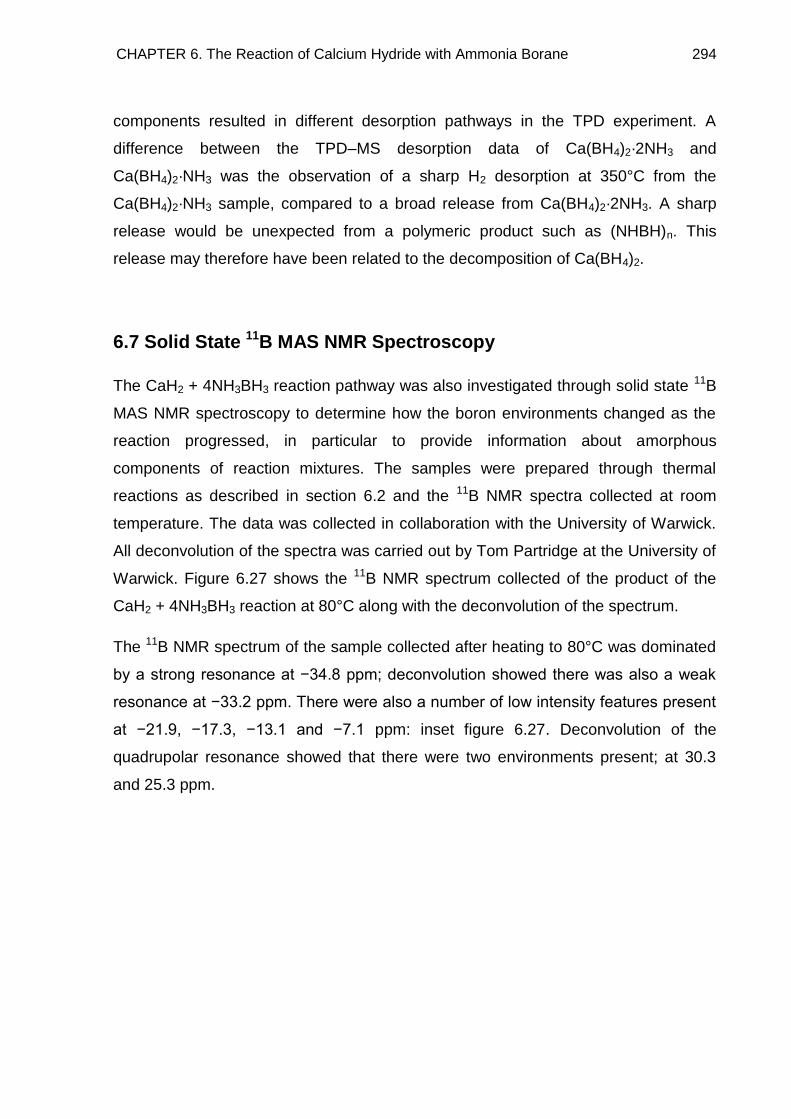
CHAPTER 6. The Reaction of Calcium Hydride with Ammonia Borane 294
components resulted in different desorption pathways in the TPD experiment. A
difference between the TPD–MS desorption data of Ca(BH4)2·2NH3 and
Ca(BH4)2·NH3 was the observation of a sharp H2 desorption at 350°C from the
Ca(BH4)2·NH3 sample, compared to a broad release from Ca(BH4)2·2NH3. A sharp
release would be unexpected from a polymeric product such as (NHBH)n. This
release may therefore have been related to the decomposition of Ca(BH4)2.
6.7 Solid State 11B MAS NMR Spectroscopy
The CaH2 + 4NH3BH3 reaction pathway was also investigated through solid state 11B
MAS NMR spectroscopy to determine how the boron environments changed as the
reaction progressed, in particular to provide information about amorphous
components of reaction mixtures. The samples were prepared through thermal
reactions as described in section 6.2 and the 11B NMR spectra collected at room
temperature. The data was collected in collaboration with the University of Warwick.
All deconvolution of the spectra was carried out by Tom Partridge at the University of
Warwick. Figure 6.27 shows the 11B NMR spectrum collected of the product of the
CaH2 + 4NH3BH3 reaction at 80°C along with the deconvolution of the spectrum.
The 11B NMR spectrum of the sample collected after heating to 80°C was dominated
by a strong resonance at −34.8 ppm; deconvolution showed there was also a weak
resonance at −33.2 ppm. There were also a number of low intensity features present
at −21.9, −17.3, −13.1 and −7.1 ppm: inset figure 6.27. Deconvolution of the
quadrupolar resonance showed that there were two environments present; at 30.3
and 25.3 ppm.
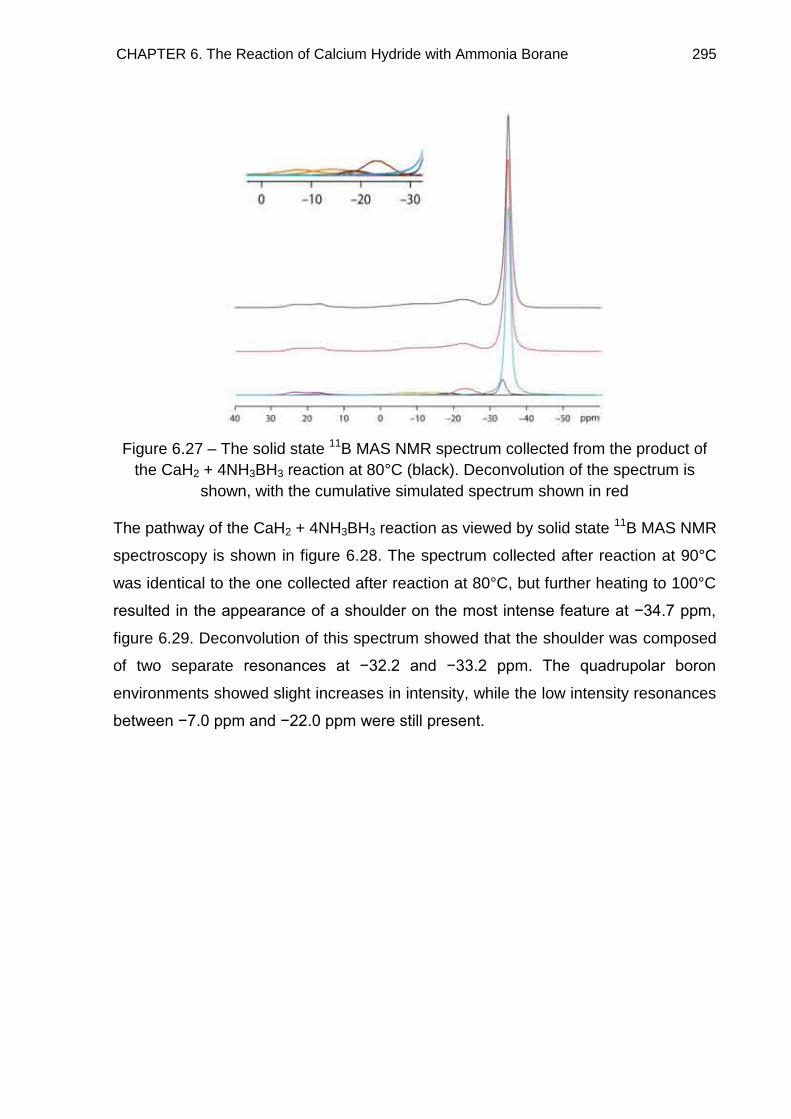
CHAPTER 6. The Reaction of Calcium Hydride with Ammonia Borane 295
Figure 6.27 – The solid state 11B MAS NMR spectrum collected from the product of
the CaH2 + 4NH3BH3 reaction at 80°C (black). Deconvolution of the spectrum is
shown, with the cumulative simulated spectrum shown in red
The pathway of the CaH2 + 4NH3BH3 reaction as viewed by solid state 11B MAS NMR
spectroscopy is shown in figure 6.28. The spectrum collected after reaction at 90°C
was identical to the one collected after reaction at 80°C, but further heating to 100°C
resulted in the appearance of a shoulder on the most intense feature at −34.7 ppm,
figure 6.29. Deconvolution of this spectrum showed that the shoulder was composed
of two separate resonances at −32.2 and −33.2 ppm. The quadrupolar boron
environments showed slight increases in intensity, while the low intensity resonances
between −7.0 ppm and −22.0 ppm were still present.
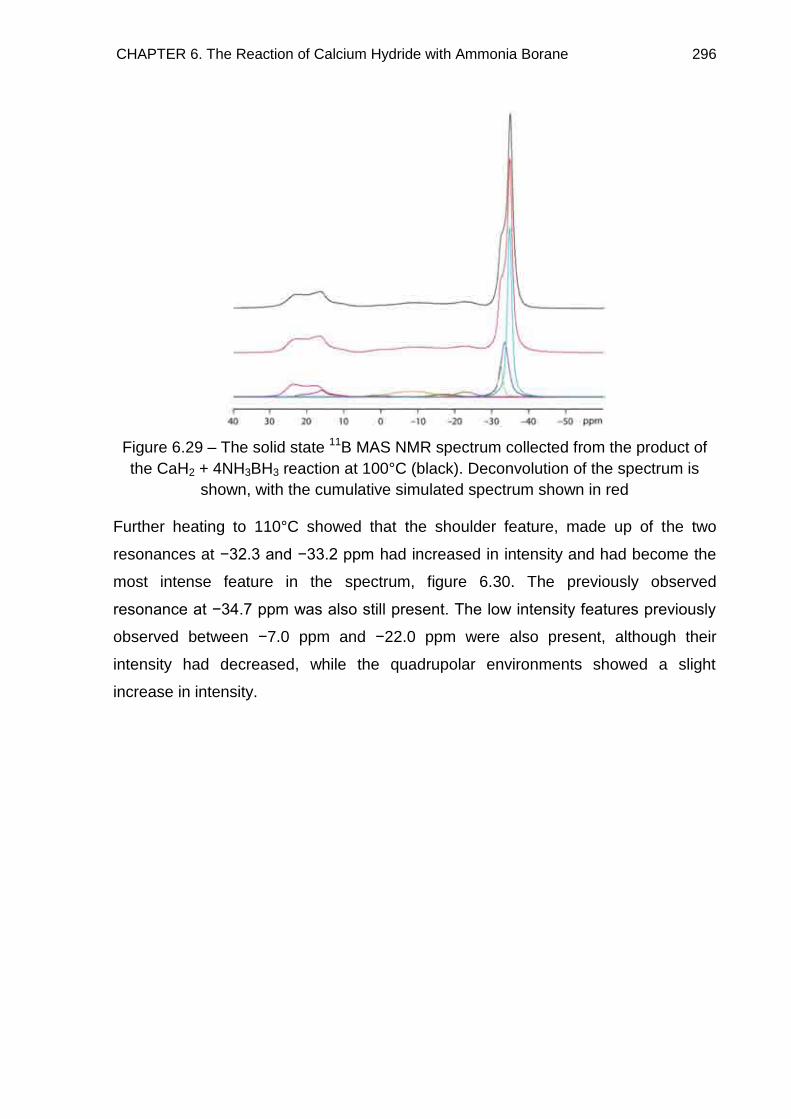
CHAPTER 6. The Reaction of Calcium Hydride with Ammonia Borane 296
Figure 6.29 – The solid state 11B MAS NMR spectrum collected from the product of
the CaH2 + 4NH3BH3 reaction at 100°C (black). Deconvolution of the spectrum is
shown, with the cumulative simulated spectrum shown in red
Further heating to 110°C showed that the shoulder feature, made up of the two
resonances at −32.3 and −33.2 ppm had increased in intensity and had become the
most intense feature in the spectrum, figure 6.30. The previously observed
resonance at −34.7 ppm was also still present. The low intensity features previously
observed between −7.0 ppm and −22.0 ppm were also present, although their
intensity had decreased, while the quadrupolar environments showed a slight
increase in intensity.
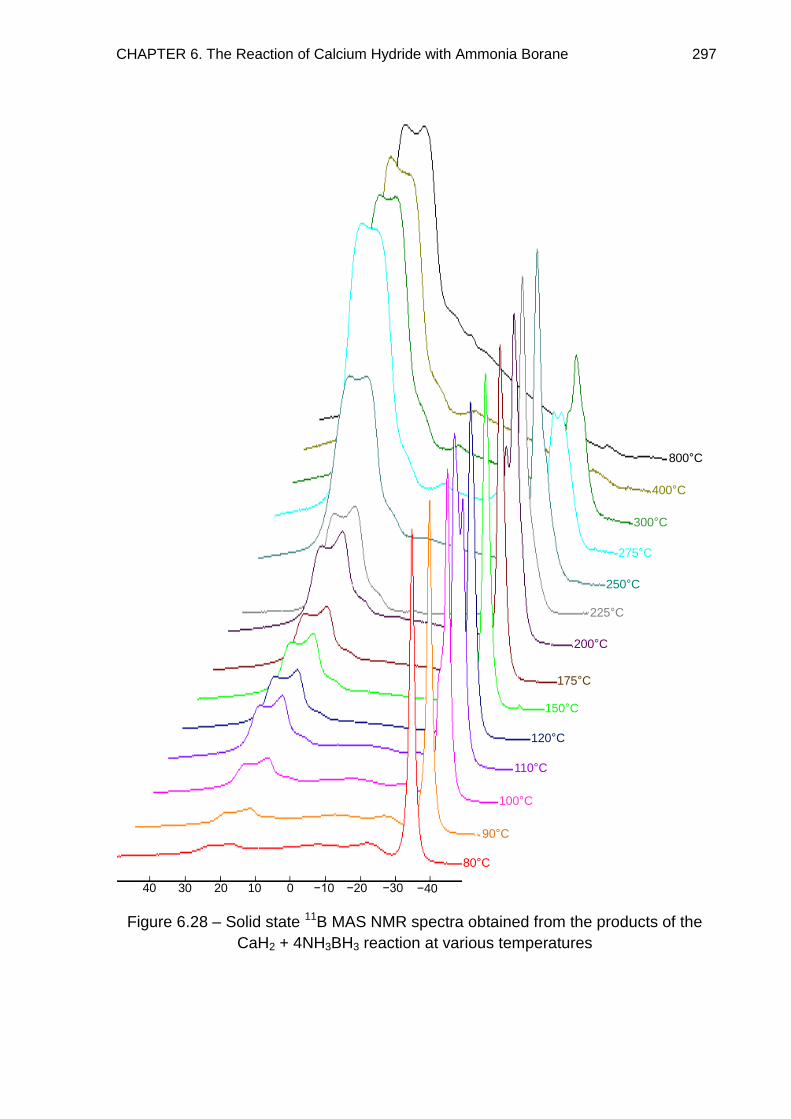
CHAPTER 6. The Reaction of Calcium Hydride with Ammonia Borane 297
Figure 6.28 – Solid state 11B MAS NMR spectra obtained from the products of the
CaH2 + 4NH3BH3 reaction at various temperatures
−3040 30 −20−1020 10 0 −40
80°C
90°C
100°C
110°C
120°C
150°C
175°C
200°C
225°C
250°C
275°C
300°C
400°C
800°C
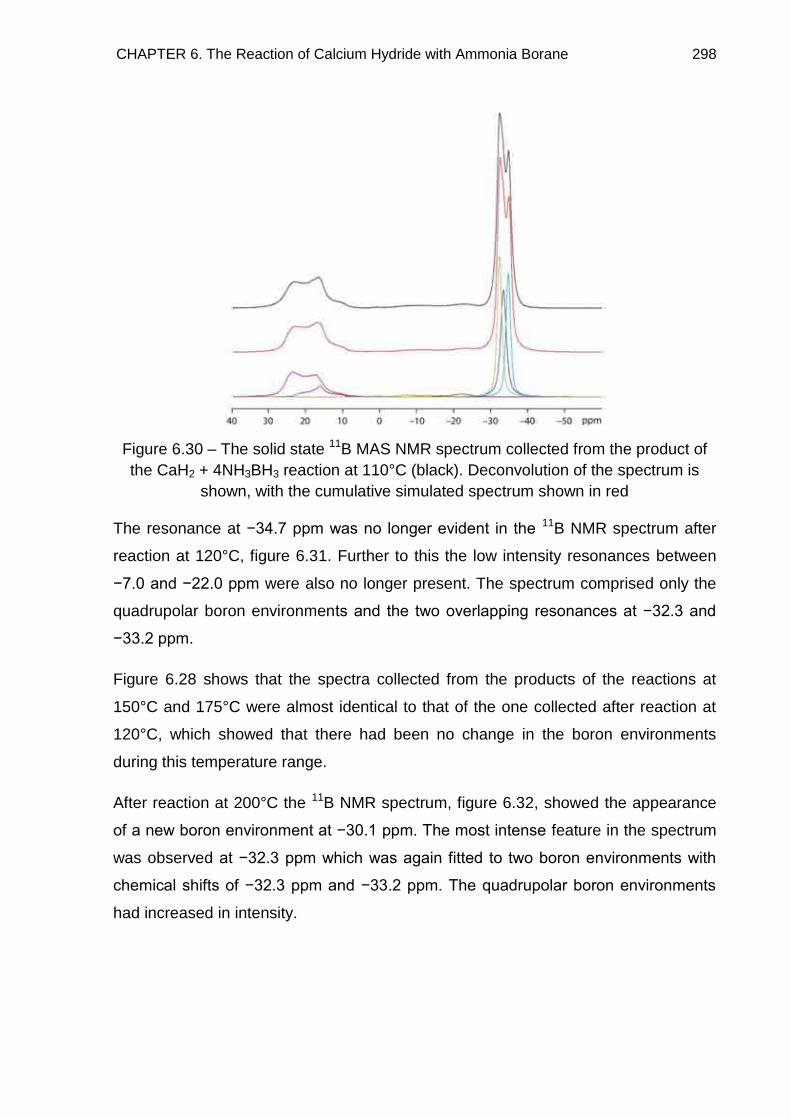
CHAPTER 6. The Reaction of Calcium Hydride with Ammonia Borane 298
Figure 6.30 – The solid state 11B MAS NMR spectrum collected from the product of
the CaH2 + 4NH3BH3 reaction at 110°C (black). Deconvolution of the spectrum is
shown, with the cumulative simulated spectrum shown in red
The resonance at −34.7 ppm was no longer evident in the 11B NMR spectrum after
reaction at 120°C, figure 6.31. Further to this the low intensity resonances between
−7.0 and −22.0 ppm were also no longer present. The spectrum comprised only the
quadrupolar boron environments and the two overlapping resonances at −32.3 and
−33.2 ppm.
Figure 6.28 shows that the spectra collected from the products of the reactions at
150°C and 175°C were almost identical to that of the one collected after reaction at
120°C, which showed that there had been no change in the boron environments
during this temperature range.
After reaction at 200°C the 11B NMR spectrum, figure 6.32, showed the appearance
of a new boron environment at −30.1 ppm. The most intense feature in the spectrum
was observed at −32.3 ppm which was again fitted to two boron environments with
chemical shifts of −32.3 ppm and −33.2 ppm. The quadrupolar boron environments
had increased in intensity.
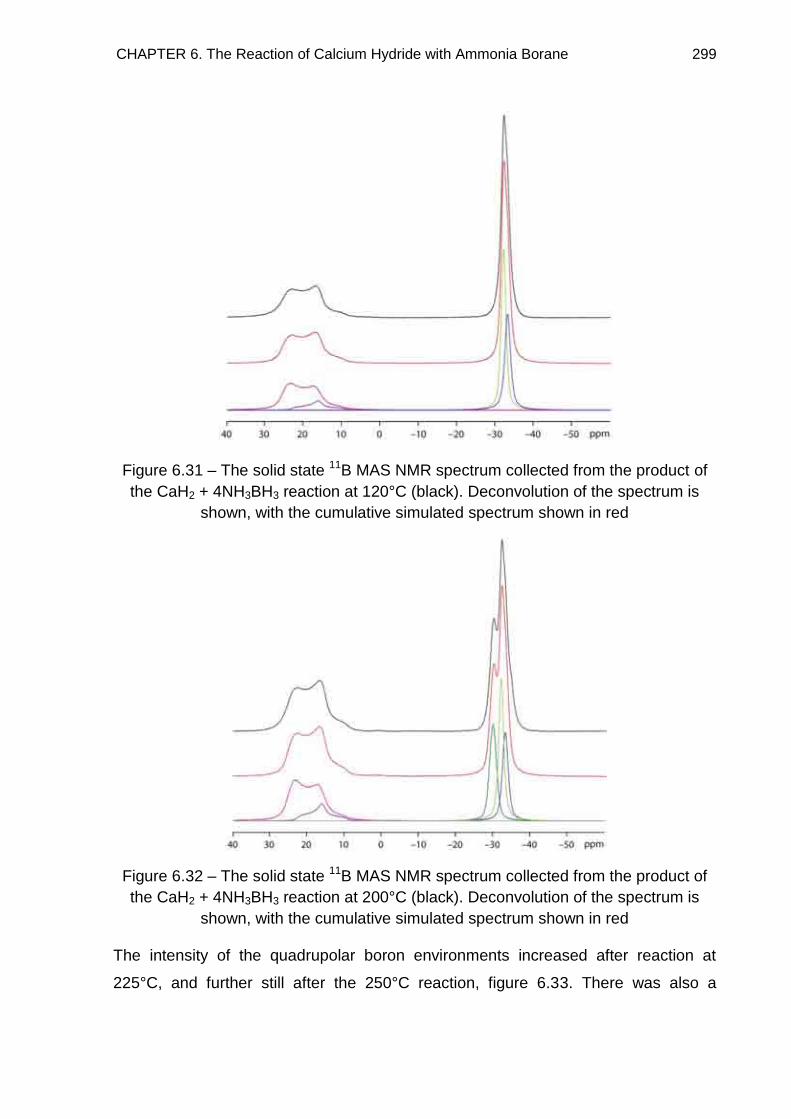
CHAPTER 6. The Reaction of Calcium Hydride with Ammonia Borane 299
Figure 6.31 – The solid state 11B MAS NMR spectrum collected from the product of
the CaH2 + 4NH3BH3 reaction at 120°C (black). Deconvolution of the spectrum is
shown, with the cumulative simulated spectrum shown in red
Figure 6.32 – The solid state 11B MAS NMR spectrum collected from the product of
the CaH2 + 4NH3BH3 reaction at 200°C (black). Deconvolution of the spectrum is
shown, with the cumulative simulated spectrum shown in red
The intensity of the quadrupolar boron environments increased after reaction at
225°C, and further still after the 250°C reaction, figure 6.33. There was also a
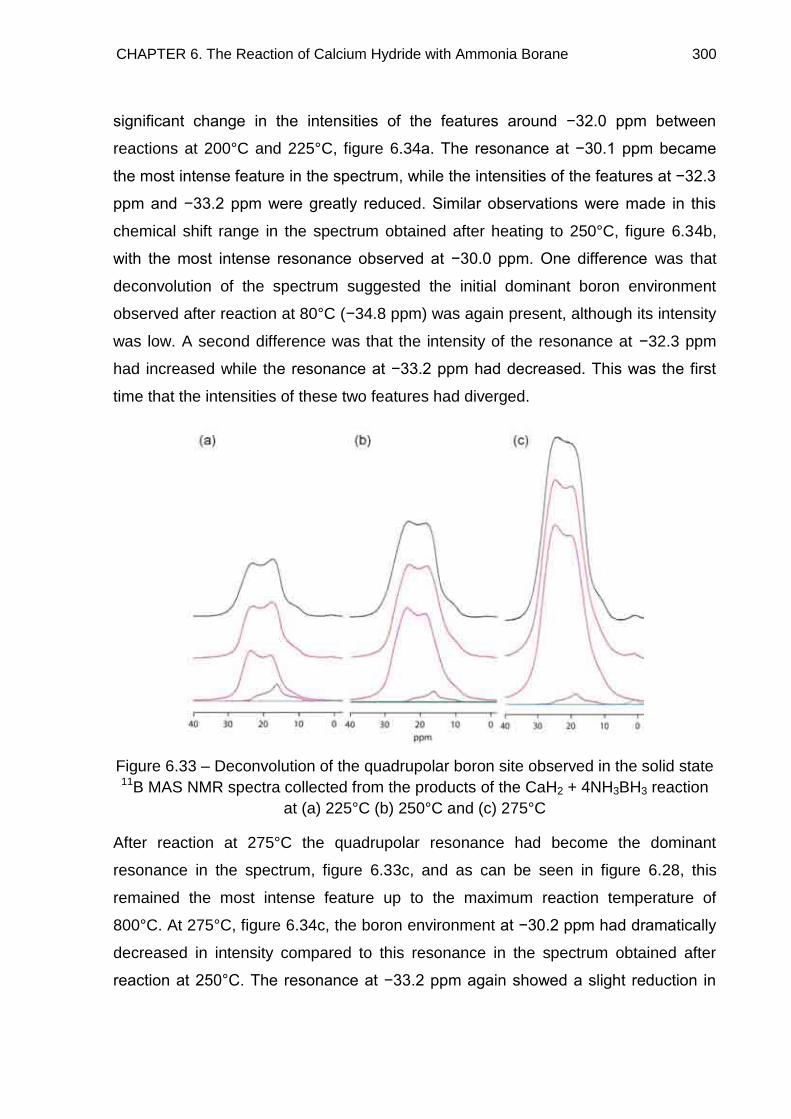
CHAPTER 6. The Reaction of Calcium Hydride with Ammonia Borane 300
significant change in the intensities of the features around −32.0 ppm between
reactions at 200°C and 225°C, figure 6.34a. The resonance at −30.1 ppm became
the most intense feature in the spectrum, while the intensities of the features at −32.3
ppm and −33.2 ppm were greatly reduced. Similar observations were made in this
chemical shift range in the spectrum obtained after heating to 250°C, figure 6.34b,
with the most intense resonance observed at −30.0 ppm. One difference was that
deconvolution of the spectrum suggested the initial dominant boron environment
observed after reaction at 80°C (−34.8 ppm) was again present, although its intensity
was low. A second difference was that the intensity of the resonance at −32.3 ppm
had increased while the resonance at −33.2 ppm had decreased. This was the first
time that the intensities of these two features had diverged.
Figure 6.33 – Deconvolution of the quadrupolar boron site observed in the solid state 11B MAS NMR spectra collected from the products of the CaH2 + 4NH3BH3 reaction
at (a) 225°C (b) 250°C and (c) 275°C
After reaction at 275°C the quadrupolar resonance had become the dominant
resonance in the spectrum, figure 6.33c, and as can be seen in figure 6.28, this
remained the most intense feature up to the maximum reaction temperature of
800°C. At 275°C, figure 6.34c, the boron environment at −30.2 ppm had dramatically
decreased in intensity compared to this resonance in the spectrum obtained after
reaction at 250°C. The resonance at −33.2 ppm again showed a slight reduction in
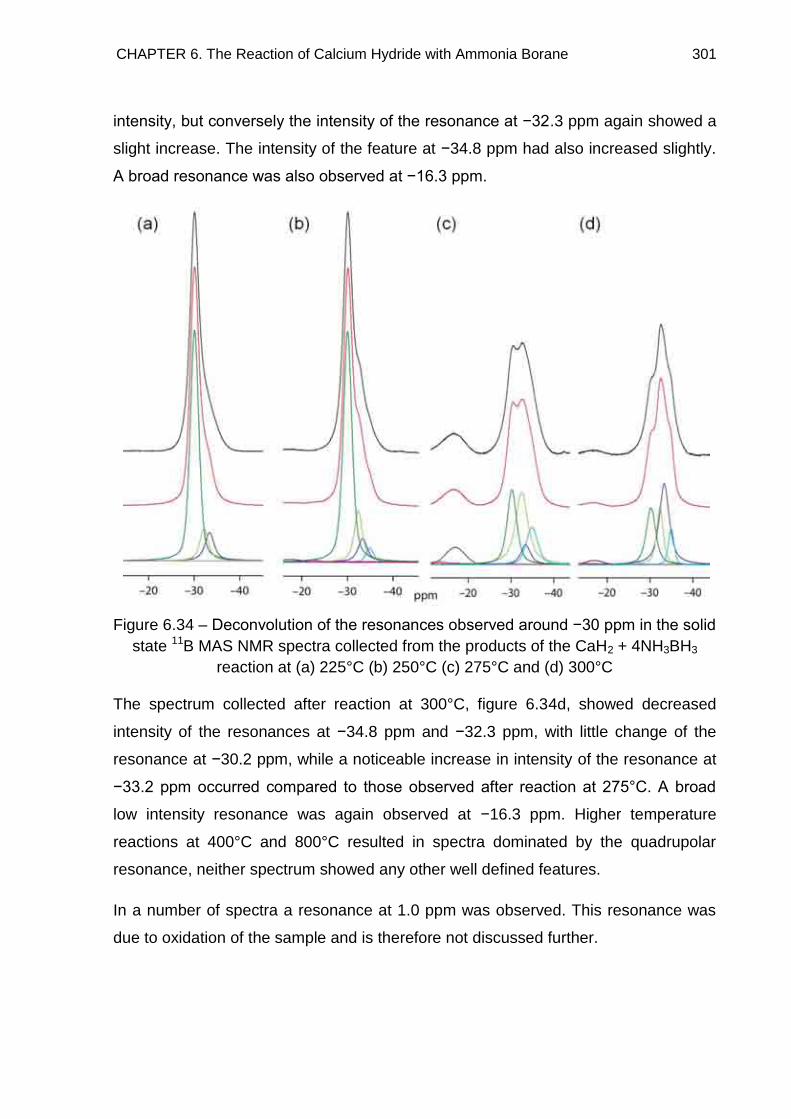
CHAPTER 6. The Reaction of Calcium Hydride with Ammonia Borane 301
intensity, but conversely the intensity of the resonance at −32.3 ppm again showed a
slight increase. The intensity of the feature at −34.8 ppm had also increased slightly.
A broad resonance was also observed at −16.3 ppm.
Figure 6.34 – Deconvolution of the resonances observed around −30 ppm in the solid
state 11B MAS NMR spectra collected from the products of the CaH2 + 4NH3BH3
reaction at (a) 225°C (b) 250°C (c) 275°C and (d) 300°C
The spectrum collected after reaction at 300°C, figure 6.34d, showed decreased
intensity of the resonances at −34.8 ppm and −32.3 ppm, with little change of the
resonance at −30.2 ppm, while a noticeable increase in intensity of the resonance at
−33.2 ppm occurred compared to those observed after reaction at 275°C. A broad
low intensity resonance was again observed at −16.3 ppm. Higher temperature
reactions at 400°C and 800°C resulted in spectra dominated by the quadrupolar
resonance, neither spectrum showed any other well defined features.
In a number of spectra a resonance at 1.0 ppm was observed. This resonance was
due to oxidation of the sample and is therefore not discussed further.
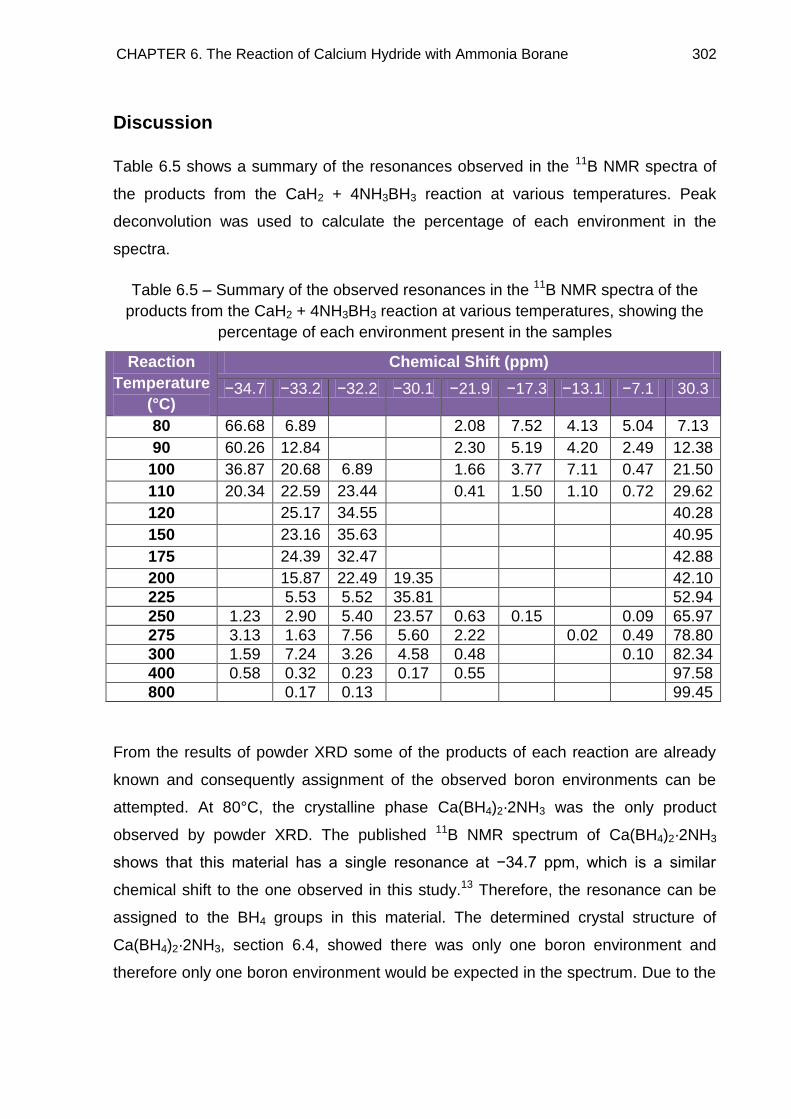
CHAPTER 6. The Reaction of Calcium Hydride with Ammonia Borane 302
Discussion
Table 6.5 shows a summary of the resonances observed in the 11B NMR spectra of
the products from the CaH2 + 4NH3BH3 reaction at various temperatures. Peak
deconvolution was used to calculate the percentage of each environment in the
spectra.
Table 6.5 – Summary of the observed resonances in the 11B NMR spectra of the
products from the CaH2 + 4NH3BH3 reaction at various temperatures, showing the
percentage of each environment present in the samples
Reaction
Temperature
(°C)
Chemical Shift (ppm)
−34.7 −33.2 −32.2 −30.1 −21.9 −17.3 −13.1 −7.1 30.3
80 66.68 6.89 2.08 7.52 4.13 5.04 7.13
90 60.26 12.84 2.30 5.19 4.20 2.49 12.38
100 36.87 20.68 6.89 1.66 3.77 7.11 0.47 21.50
110 20.34 22.59 23.44 0.41 1.50 1.10 0.72 29.62
120 25.17 34.55 40.28
150 23.16 35.63 40.95
175 24.39 32.47 42.88
200 15.87 22.49 19.35 42.10
225 5.53 5.52 35.81 52.94
250 1.23 2.90 5.40 23.57 0.63 0.15 0.09 65.97
275 3.13 1.63 7.56 5.60 2.22 0.02 0.49 78.80
300 1.59 7.24 3.26 4.58 0.48 0.10 82.34
400 0.58 0.32 0.23 0.17 0.55 97.58
800 0.17 0.13 99.45
From the results of powder XRD some of the products of each reaction are already
known and consequently assignment of the observed boron environments can be
attempted. At 80°C, the crystalline phase Ca(BH4)2·2NH3 was the only product
observed by powder XRD. The published 11B NMR spectrum of Ca(BH4)2·2NH3
shows that this material has a single resonance at −34.7 ppm, which is a similar
chemical shift to the one observed in this study.13 Therefore, the resonance can be
assigned to the BH4 groups in this material. The determined crystal structure of
Ca(BH4)2·2NH3, section 6.4, showed there was only one boron environment and
therefore only one boron environment would be expected in the spectrum. Due to the
CHAPTER 6. The Reaction of Calcium Hydride with Ammonia Borane 303
effect of two NH3 groups donating electrons to the calcium and consequently
increased shielding at the boron sites, this resonance was the furthest upfield.
The next crystalline phase observed by powder XRD was Ca(BH4)2·NH3; this was the
only phase observed after reaction at 120°C and so either of the resonances
observed at −33.2 ppm or −32.2 ppm could have been related to this material. In
order to make the correct assignment the other crystalline phases observed in
powder XRD patterns should be considered. α-Ca(BH4)2 was first observed in
powder XRD patterns after reaction at 200°C and after reaction at 225°C was the
only crystalline phase observed. The resonance at −30.1 ppm was not observed in
the NMR spectra until reaction at 200°C and furthermore this was the dominant
resonance in the spectrum of the product of the reaction at 225°C. Assignment of this
resonance to the boron environment in α-Ca(BH4)2 is therefore justified. This
assignment also agreed with that of Reiter et al.37
The β polymorph of Ca(BH4)2 was first observed by powder XRD after reaction at
275°C. Interestingly no resonance in the 11B NMR spectra first appeared at this
temperature, but by a process of elimination the boron environment within this
compound must have produced a resonance at either −33.2 ppm or −32.2 ppm.
These two resonances were therefore due to Ca(BH4)2·NH3 and β-Ca(BH4)2. Again
the presence of the electron donating group, NH3, in the monoammoniate would have
caused a downfield shift in the position of the BH4 environment within this material
and so the resonance at −33.2 ppm was assigned to Ca(BH4)2·NH3 and the
resonance at −32.2 ppm was assigned to β-Ca(BH4)2. This assignment for β-
Ca(BH4)2 also agreed with that of Reiter et al.37
Below 300°C Ca(BH4)2·2NH3, Ca(BH4)2·NH3, α-Ca(BH4)2 and β-Ca(BH4)2 were the
only crystalline phases observed in powder XRD patterns. Therefore, the resonances
observed at −21.9 ppm, −17.3 ppm, −13.1 ppm and −7.1 ppm could not have been
present as crystalline material. As discussed in section 6.6, the decomposition
pathway of NH3BH3 has been inferred to play a role in the CaH2 + 4NH3BH3 reaction
pathway. Stowe et al.38 conducted a solid state 11B NMR investigation into the
thermal decomposition of NH3BH3 at 88°C. Resonances were observed at −38 ppm
and −13 ppm which were assigned to the BH4 and BH2 environments present in
CHAPTER 6. The Reaction of Calcium Hydride with Ammonia Borane 304
DADB respectively. No resonance at −38 ppm was observed in any spectra in this
study. However, the initial formation of Ca(BH4)2·2NH3 would have required the
presence of a BH4− ion in the reaction mixture. DADB formation could have provided
this ion and hence the pathway to form Ca(BH4)2. This reaction would also explain
why there was no BH4 resonance due to DADB presence observed in the NMR
spectra. The BH2 resonances at −7.1 and −13 ppm observed by Stowe et al. were,
however, observed in this study between 80°C and 110°C. Despite the consumption
of the BH4− ion from DADB, the decomposition of NH3BH3 would have still been able
to proceed to form polymeric NH2BH2, and therefore a BH2 environment would be
expected in the NMR spectrum. As NH3BH3 decomposition proceeded Stowe et al.
noted that these resonances broadened and decreased in intensity due to continued
polymerisation. Similar observations were noted in this study, with the intensities of
both of these resonances decreasing as well as the peaks broadening with
increasing reaction temperature. The 11B NMR spectrum obtained after reaction at
120°C no longer showed these two resonances, indicating that the first two steps in
NH3BH3 decomposition, reaction 6.12, were complete. The product of these steps
(NHBH)n possessed boron only in an sp2 environment. Boron in an sp2 environment
is observed in the range 0 ppm to 40 ppm.39-42 This decomposition product was
shown by thermal desorption studies to form at around 150°C and therefore the
broad feature at 30.3 ppm can be assigned to this decomposition product up to this
reaction temperature.
nNH3BH3 → (NH2BH2)n + nH2 → (NHBH)n + nH2 Reaction 6.12
The resonances at −21.9 ppm and −17.3 ppm were observed between 80°C and
110°C; however, only Ca(BH4)2·2NH3 and Ca(BH4)2·NH3 were detected by powder
XRD in this temperature range. Therefore, a literature search was undertaken in an
attempt to assign these features. Chua et al.12 studied the reaction of Ca(NH2)2 with
NH3BH3 in a 1:2 molar ratio and found that an ammoniated derivative of
Ca(NH2BH3)2 was synthesised, Ca(NH2BH3)2·2NH3. The NH3 was desorbed upon
heating this material above 73°C. Solid state 11B NMR investigations of these
materials showed that the boron environments within Ca(NH2BH3)2·2NH3 and
Ca(NH2BH3)2 were observed at −21 and −17 ppm, respectively. Re-examination of
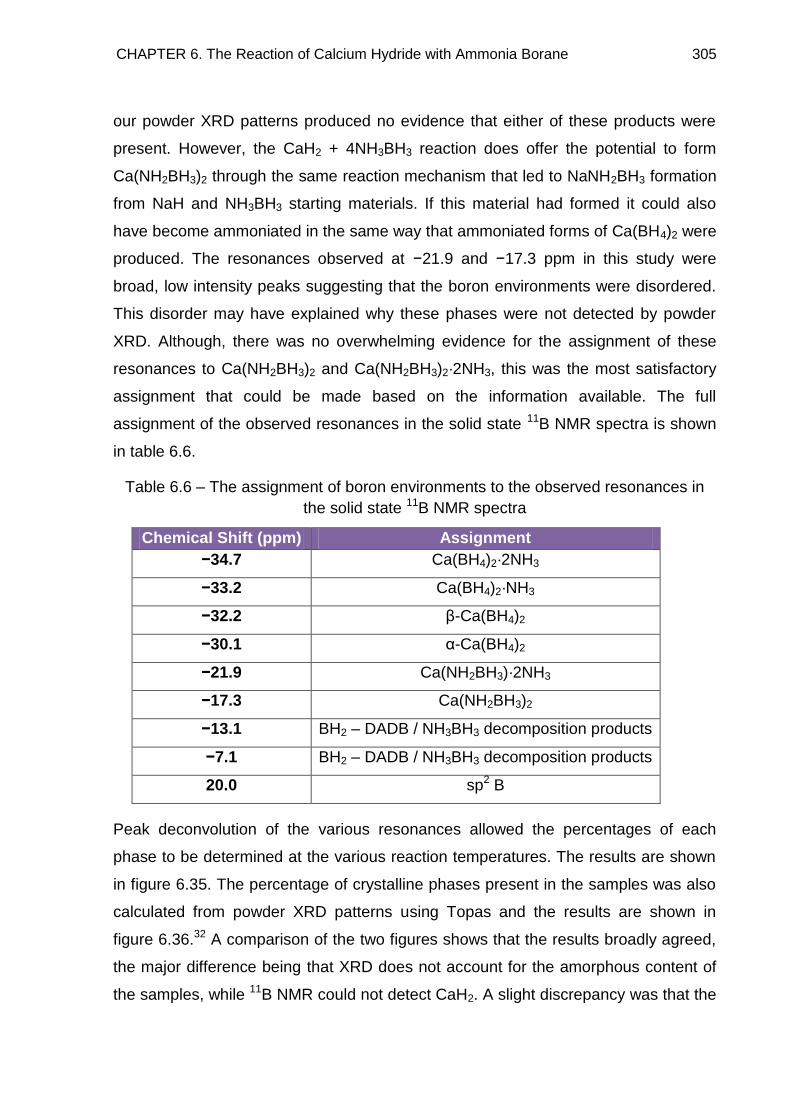
CHAPTER 6. The Reaction of Calcium Hydride with Ammonia Borane 305
our powder XRD patterns produced no evidence that either of these products were
present. However, the CaH2 + 4NH3BH3 reaction does offer the potential to form
Ca(NH2BH3)2 through the same reaction mechanism that led to NaNH2BH3 formation
from NaH and NH3BH3 starting materials. If this material had formed it could also
have become ammoniated in the same way that ammoniated forms of Ca(BH4)2 were
produced. The resonances observed at −21.9 and −17.3 ppm in this study were
broad, low intensity peaks suggesting that the boron environments were disordered.
This disorder may have explained why these phases were not detected by powder
XRD. Although, there was no overwhelming evidence for the assignment of these
resonances to Ca(NH2BH3)2 and Ca(NH2BH3)2·2NH3, this was the most satisfactory
assignment that could be made based on the information available. The full
assignment of the observed resonances in the solid state 11B NMR spectra is shown
in table 6.6.
Table 6.6 – The assignment of boron environments to the observed resonances in
the solid state 11B NMR spectra
Chemical Shift (ppm) Assignment
−34.7 Ca(BH4)2·2NH3
−33.2 Ca(BH4)2·NH3
−32.2 β-Ca(BH4)2
−30.1 α-Ca(BH4)2
−21.9 Ca(NH2BH3)·2NH3
−17.3 Ca(NH2BH3)2
−13.1 BH2 – DADB / NH3BH3 decomposition products
−7.1 BH2 – DADB / NH3BH3 decomposition products
20.0 sp2 B
Peak deconvolution of the various resonances allowed the percentages of each
phase to be determined at the various reaction temperatures. The results are shown
in figure 6.35. The percentage of crystalline phases present in the samples was also
calculated from powder XRD patterns using Topas and the results are shown in
figure 6.36.32 A comparison of the two figures shows that the results broadly agreed,
the major difference being that XRD does not account for the amorphous content of
the samples, while 11B NMR could not detect CaH2. A slight discrepancy was that the

CHAPTER 6. The Reaction of Calcium Hydride with Ammonia Borane 306
resonances due to ammoniated phases reappeared in the spectra above 250°C. This
was probably because during cooling, any NH3 that had remained in the vicinity of
Ca(BH4)2 following its earlier release, was able to recombine with this material and
reform the ammoniates. As powder XRD did not reveal this phase at these
temperatures, the material may have been finely divided or highly disordered.
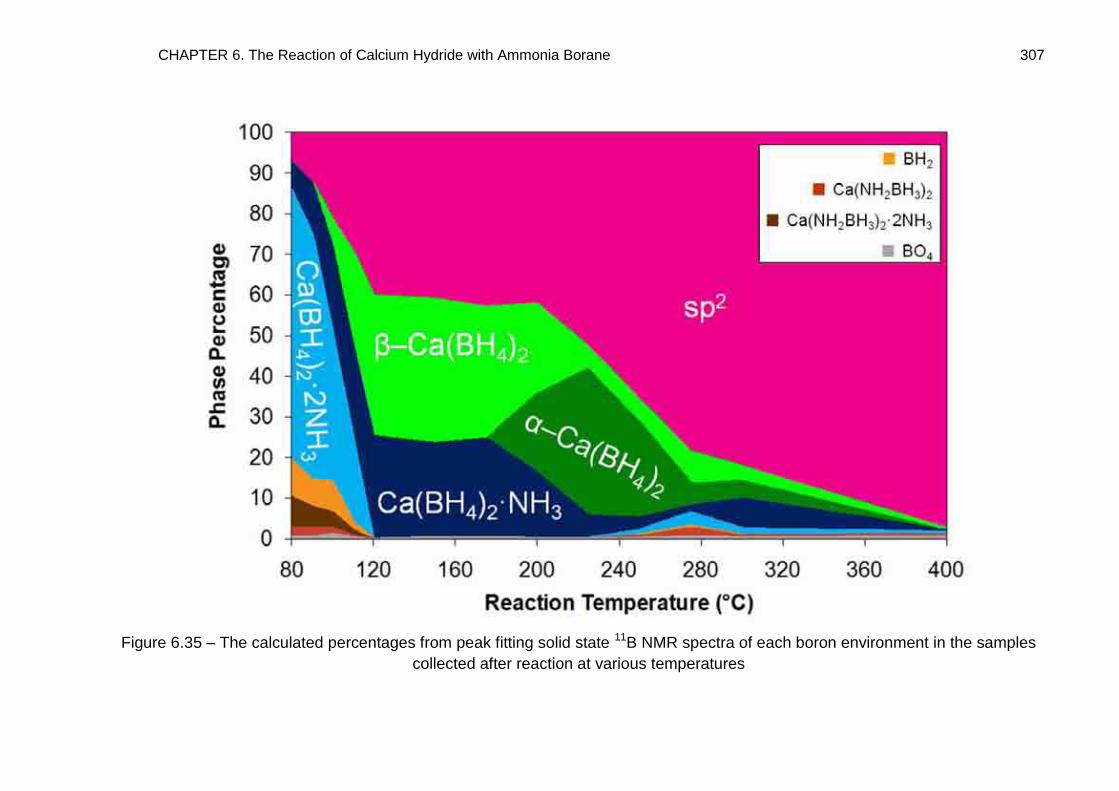
CHAPTER 6. The Reaction of Calcium Hydride with Ammonia Borane 307
Figure 6.35 – The calculated percentages from peak fitting solid state 11B NMR spectra of each boron environment in the samples
collected after reaction at various temperatures
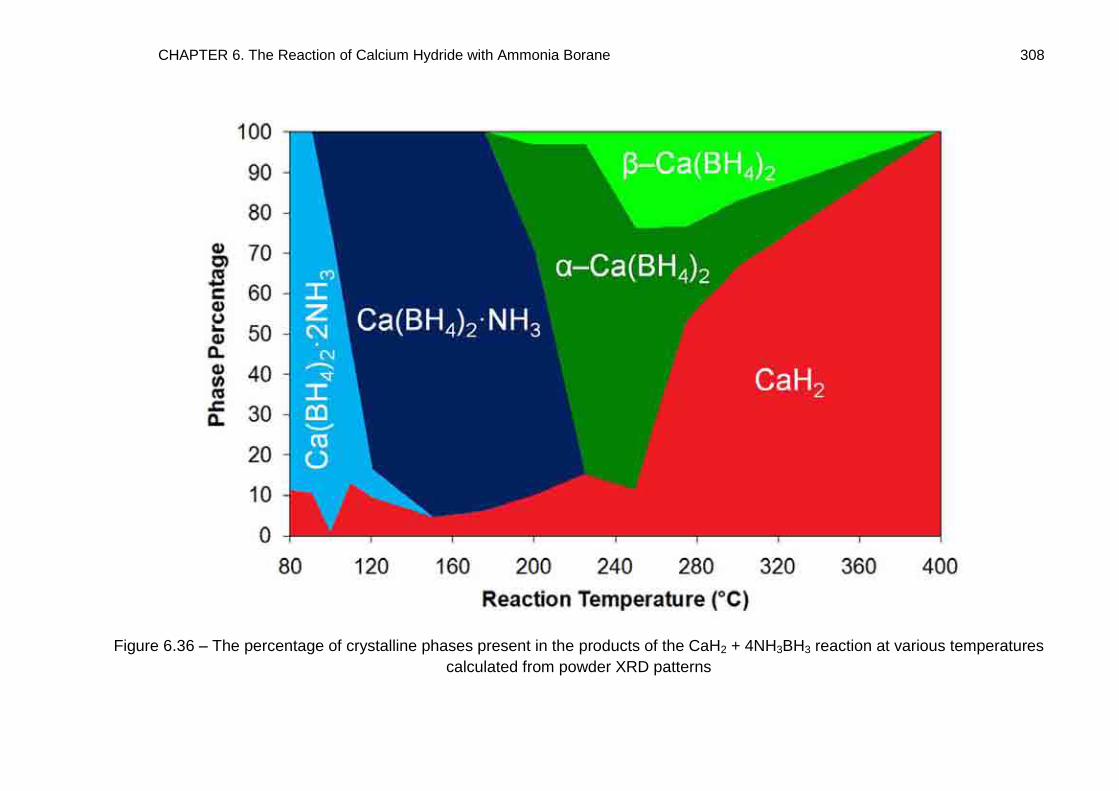
CHAPTER 6. The Reaction of Calcium Hydride with Ammonia Borane 308
Figure 6.36 – The percentage of crystalline phases present in the products of the CaH2 + 4NH3BH3 reaction at various temperatures
calculated from powder XRD patterns
CHAPTER 6. The Reaction of Calcium Hydride with Ammonia Borane 309
Figure 6.35 showed that the decrease in boron present as Ca(BH4)2·2NH3 was
accompanied by an increase in the boron environment within Ca(BH4)2·NH3.
However, this percentage decrease in the former was significantly greater than the
observed increase in the latter. Further to this the resonance at −32.2 ppm was
observed from 100°C onwards, previously assigned to β-Ca(BH4)2. This is a
significant discrepancy with the results of thermal desorption studies, where the
second release of NH3 did not occur until temperatures in excess of 200°C and
powder XRD results revealed that it was in fact the α polymorph that formed first. The
crystal structure determination of Ca(BH4)2·NH3, section 6.5, revealed that this
structure contains two distinct boron positions within the unit cell, with the B1–Ca and
B2–Ca distances shorter and longer than 2.9 Å, respectively. The B–Ca distance in
β-Ca(BH4)2 is longer than 2.9 Å suggesting the B2 site of Ca(BH4)2·NH3 may have
been similar to the boron site in β-Ca(BH4)2, hence producing a resonance with a
similar chemical shift.17 Therefore, between reaction temperatures of 100°C and
225°C the resonance assigned to β-Ca(BH4)2 may actually have been due to a
second boron environment within Ca(BH4)2·NH3. This is substantiated by the fact that
the percentage traces of Ca(BH4)2·NH3 and ‗β-Ca(BH4)2‘ follow each other relatively
closely in this temperature range. Above 225°C the percentage of β-Ca(BH4)2
present showed an increase whereas that of Ca(BH4)2·NH3 decreased, which was
also the temperature at which powder XRD showed the presence of crystalline β-
Ca(BH4)2 within the product, and so above this temperature the resonance at −32.2
ppm was genuinely due to β-Ca(BH4)2.
As expected from powder XRD patterns the percentage decrease of boron in the
environments of Ca(BH4)2·NH3 was accompanied by the increase of α-Ca(BH4)2
within the sample. Once the reaction temperature had surpassed the onset
temperature for the α to β phase transition, the percentage of the α polymorph began
to decrease and the percentage of the β polymorph increased, although the decrease
in α was greater than the increase in β. There was, however, also an increase in the
percentage of boron in an sp2 environment within the sample and this must therefore
also have been related to the decrease of α-Ca(BH4)2. There were two increases in
sp2 boron environments. The first increase was observed up to a temperature of
120°C. As discussed previously the formation of material containing boron in sp2
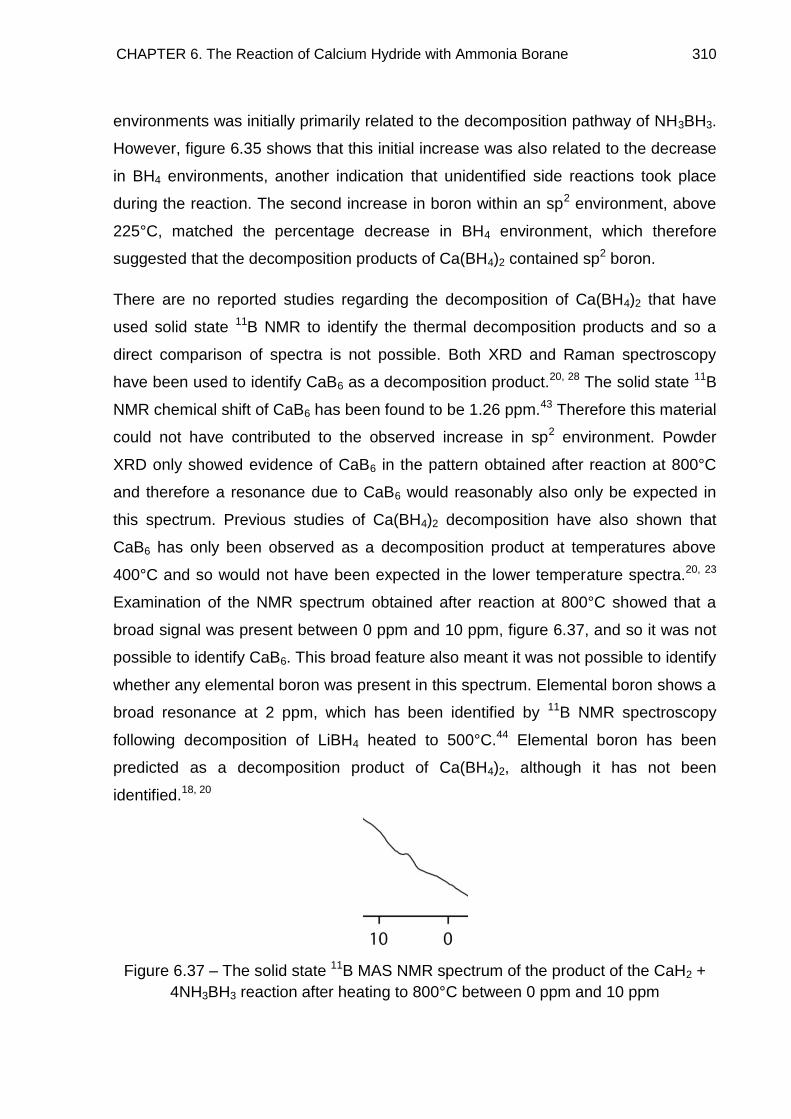
CHAPTER 6. The Reaction of Calcium Hydride with Ammonia Borane 310
environments was initially primarily related to the decomposition pathway of NH3BH3.
However, figure 6.35 shows that this initial increase was also related to the decrease
in BH4 environments, another indication that unidentified side reactions took place
during the reaction. The second increase in boron within an sp2 environment, above
225°C, matched the percentage decrease in BH4 environment, which therefore
suggested that the decomposition products of Ca(BH4)2 contained sp2 boron.
There are no reported studies regarding the decomposition of Ca(BH4)2 that have
used solid state 11B NMR to identify the thermal decomposition products and so a
direct comparison of spectra is not possible. Both XRD and Raman spectroscopy
have been used to identify CaB6 as a decomposition product.20, 28 The solid state 11B
NMR chemical shift of CaB6 has been found to be 1.26 ppm.43 Therefore this material
could not have contributed to the observed increase in sp2 environment. Powder
XRD only showed evidence of CaB6 in the pattern obtained after reaction at 800°C
and therefore a resonance due to CaB6 would reasonably also only be expected in
this spectrum. Previous studies of Ca(BH4)2 decomposition have also shown that
CaB6 has only been observed as a decomposition product at temperatures above
400°C and so would not have been expected in the lower temperature spectra.20, 23
Examination of the NMR spectrum obtained after reaction at 800°C showed that a
broad signal was present between 0 ppm and 10 ppm, figure 6.37, and so it was not
possible to identify CaB6. This broad feature also meant it was not possible to identify
whether any elemental boron was present in this spectrum. Elemental boron shows a
broad resonance at 2 ppm, which has been identified by 11B NMR spectroscopy
following decomposition of LiBH4 heated to 500°C.44 Elemental boron has been
predicted as a decomposition product of Ca(BH4)2, although it has not been
identified.18, 20
Figure 6.37 – The solid state 11B MAS NMR spectrum of the product of the CaH2 +
4NH3BH3 reaction after heating to 800°C between 0 ppm and 10 ppm
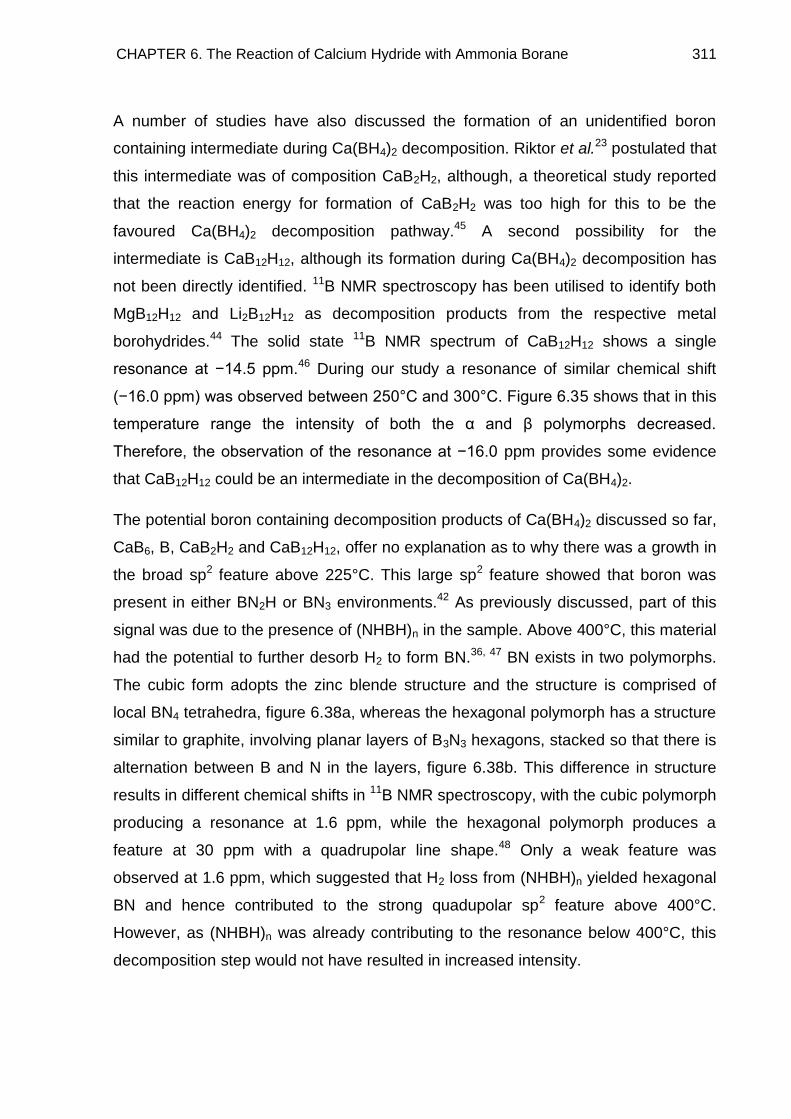
CHAPTER 6. The Reaction of Calcium Hydride with Ammonia Borane 311
A number of studies have also discussed the formation of an unidentified boron
containing intermediate during Ca(BH4)2 decomposition. Riktor et al.23 postulated that
this intermediate was of composition CaB2H2, although, a theoretical study reported
that the reaction energy for formation of CaB2H2 was too high for this to be the
favoured Ca(BH4)2 decomposition pathway.45 A second possibility for the
intermediate is CaB12H12, although its formation during Ca(BH4)2 decomposition has
not been directly identified. 11B NMR spectroscopy has been utilised to identify both
MgB12H12 and Li2B12H12 as decomposition products from the respective metal
borohydrides.44 The solid state 11B NMR spectrum of CaB12H12 shows a single
resonance at −14.5 ppm.46 During our study a resonance of similar chemical shift
(−16.0 ppm) was observed between 250°C and 300°C. Figure 6.35 shows that in this
temperature range the intensity of both the α and β polymorphs decreased.
Therefore, the observation of the resonance at −16.0 ppm provides some evidence
that CaB12H12 could be an intermediate in the decomposition of Ca(BH4)2.
The potential boron containing decomposition products of Ca(BH4)2 discussed so far,
CaB6, B, CaB2H2 and CaB12H12, offer no explanation as to why there was a growth in
the broad sp2 feature above 225°C. This large sp2 feature showed that boron was
present in either BN2H or BN3 environments.42 As previously discussed, part of this
signal was due to the presence of (NHBH)n in the sample. Above 400°C, this material
had the potential to further desorb H2 to form BN.36, 47 BN exists in two polymorphs.
The cubic form adopts the zinc blende structure and the structure is comprised of
local BN4 tetrahedra, figure 6.38a, whereas the hexagonal polymorph has a structure
similar to graphite, involving planar layers of B3N3 hexagons, stacked so that there is
alternation between B and N in the layers, figure 6.38b. This difference in structure
results in different chemical shifts in 11B NMR spectroscopy, with the cubic polymorph
producing a resonance at 1.6 ppm, while the hexagonal polymorph produces a
feature at 30 ppm with a quadrupolar line shape.48 Only a weak feature was
observed at 1.6 ppm, which suggested that H2 loss from (NHBH)n yielded hexagonal
BN and hence contributed to the strong quadupolar sp2 feature above 400°C.
However, as (NHBH)n was already contributing to the resonance below 400°C, this
decomposition step would not have resulted in increased intensity.
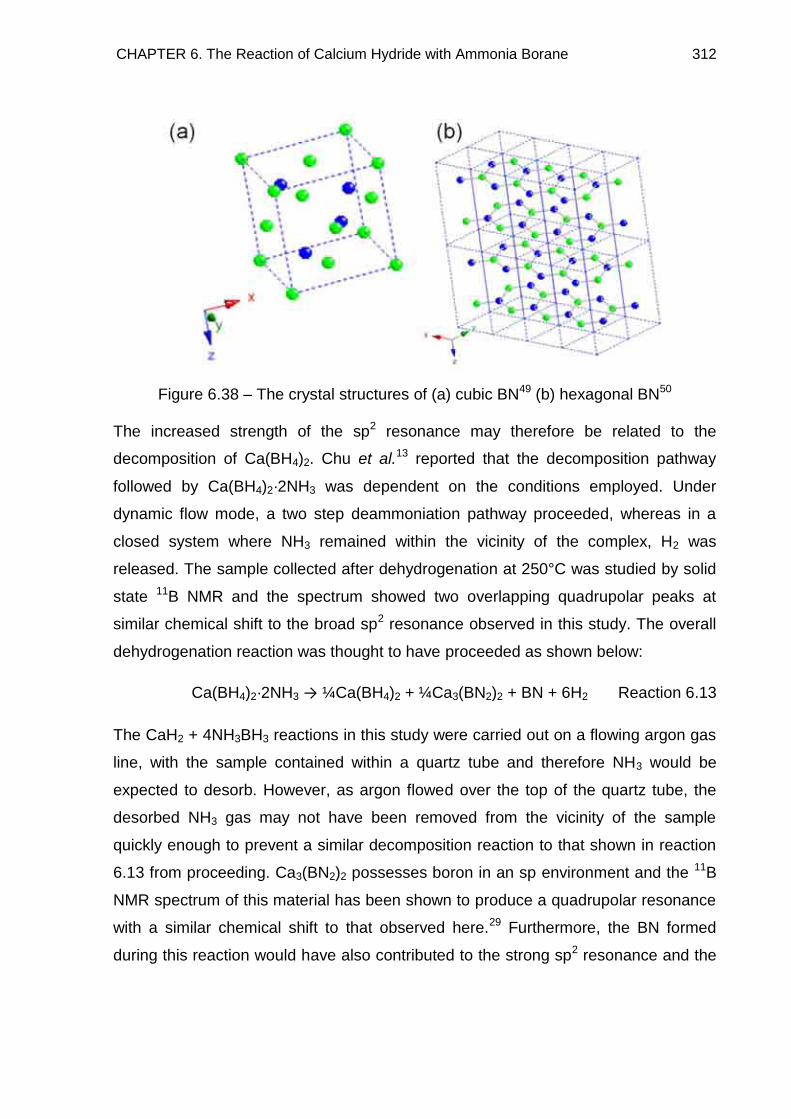
CHAPTER 6. The Reaction of Calcium Hydride with Ammonia Borane 312
Figure 6.38 – The crystal structures of (a) cubic BN49 (b) hexagonal BN50
The increased strength of the sp2 resonance may therefore be related to the
decomposition of Ca(BH4)2. Chu et al.13 reported that the decomposition pathway
followed by Ca(BH4)2·2NH3 was dependent on the conditions employed. Under
dynamic flow mode, a two step deammoniation pathway proceeded, whereas in a
closed system where NH3 remained within the vicinity of the complex, H2 was
released. The sample collected after dehydrogenation at 250°C was studied by solid
state 11B NMR and the spectrum showed two overlapping quadrupolar peaks at
similar chemical shift to the broad sp2 resonance observed in this study. The overall
dehydrogenation reaction was thought to have proceeded as shown below:
Ca(BH4)2·2NH3 → ¼Ca(BH4)2 + ¼Ca3(BN2)2 + BN + 6H2 Reaction 6.13
The CaH2 + 4NH3BH3 reactions in this study were carried out on a flowing argon gas
line, with the sample contained within a quartz tube and therefore NH3 would be
expected to desorb. However, as argon flowed over the top of the quartz tube, the
desorbed NH3 gas may not have been removed from the vicinity of the sample
quickly enough to prevent a similar decomposition reaction to that shown in reaction
6.13 from proceeding. Ca3(BN2)2 possesses boron in an sp environment and the 11B
NMR spectrum of this material has been shown to produce a quadrupolar resonance
with a similar chemical shift to that observed here.29 Furthermore, the BN formed
during this reaction would have also contributed to the strong sp2 resonance and the
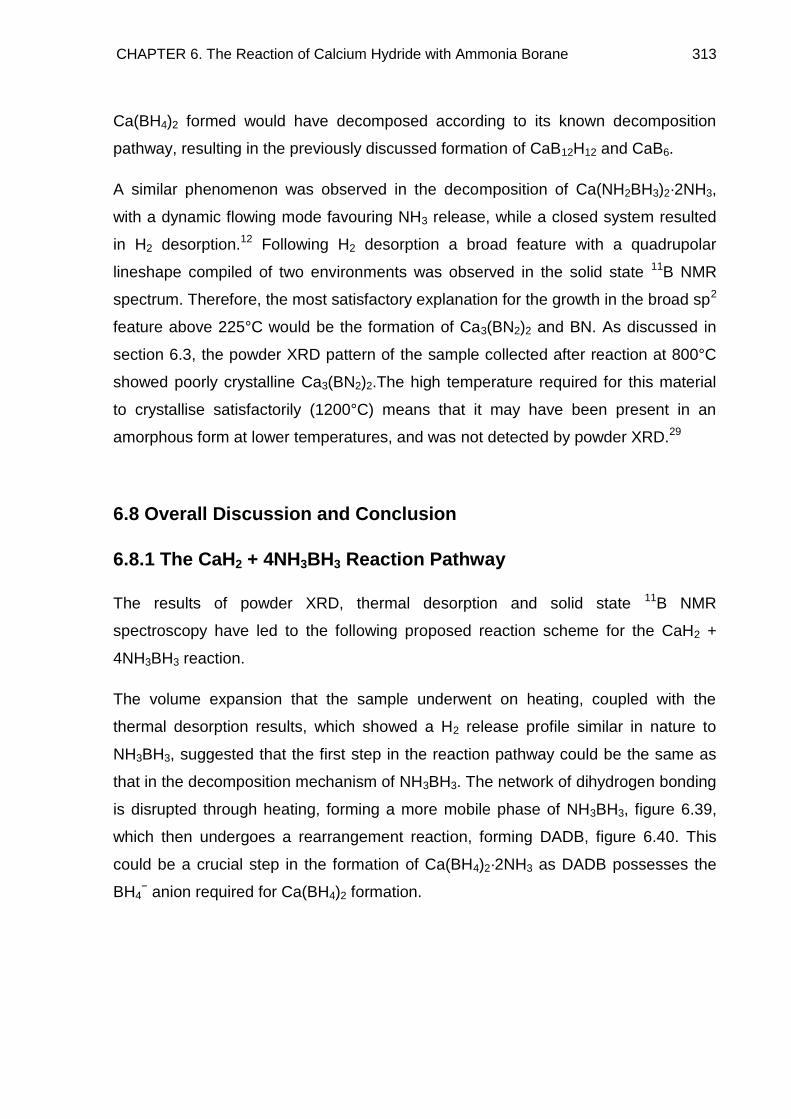
CHAPTER 6. The Reaction of Calcium Hydride with Ammonia Borane 313
Ca(BH4)2 formed would have decomposed according to its known decomposition
pathway, resulting in the previously discussed formation of CaB12H12 and CaB6.
A similar phenomenon was observed in the decomposition of Ca(NH2BH3)2·2NH3,
with a dynamic flowing mode favouring NH3 release, while a closed system resulted
in H2 desorption.12 Following H2 desorption a broad feature with a quadrupolar
lineshape compiled of two environments was observed in the solid state 11B NMR
spectrum. Therefore, the most satisfactory explanation for the growth in the broad sp2
feature above 225°C would be the formation of Ca3(BN2)2 and BN. As discussed in
section 6.3, the powder XRD pattern of the sample collected after reaction at 800°C
showed poorly crystalline Ca3(BN2)2.The high temperature required for this material
to crystallise satisfactorily (1200°C) means that it may have been present in an
amorphous form at lower temperatures, and was not detected by powder XRD.29
6.8 Overall Discussion and Conclusion
6.8.1 The CaH2 + 4NH3BH3 Reaction Pathway
The results of powder XRD, thermal desorption and solid state 11B NMR
spectroscopy have led to the following proposed reaction scheme for the CaH2 +
4NH3BH3 reaction.
The volume expansion that the sample underwent on heating, coupled with the
thermal desorption results, which showed a H2 release profile similar in nature to
NH3BH3, suggested that the first step in the reaction pathway could be the same as
that in the decomposition mechanism of NH3BH3. The network of dihydrogen bonding
is disrupted through heating, forming a more mobile phase of NH3BH3, figure 6.39,
which then undergoes a rearrangement reaction, forming DADB, figure 6.40. This
could be a crucial step in the formation of Ca(BH4)2·2NH3 as DADB possesses the
BH4− anion required for Ca(BH4)2 formation.
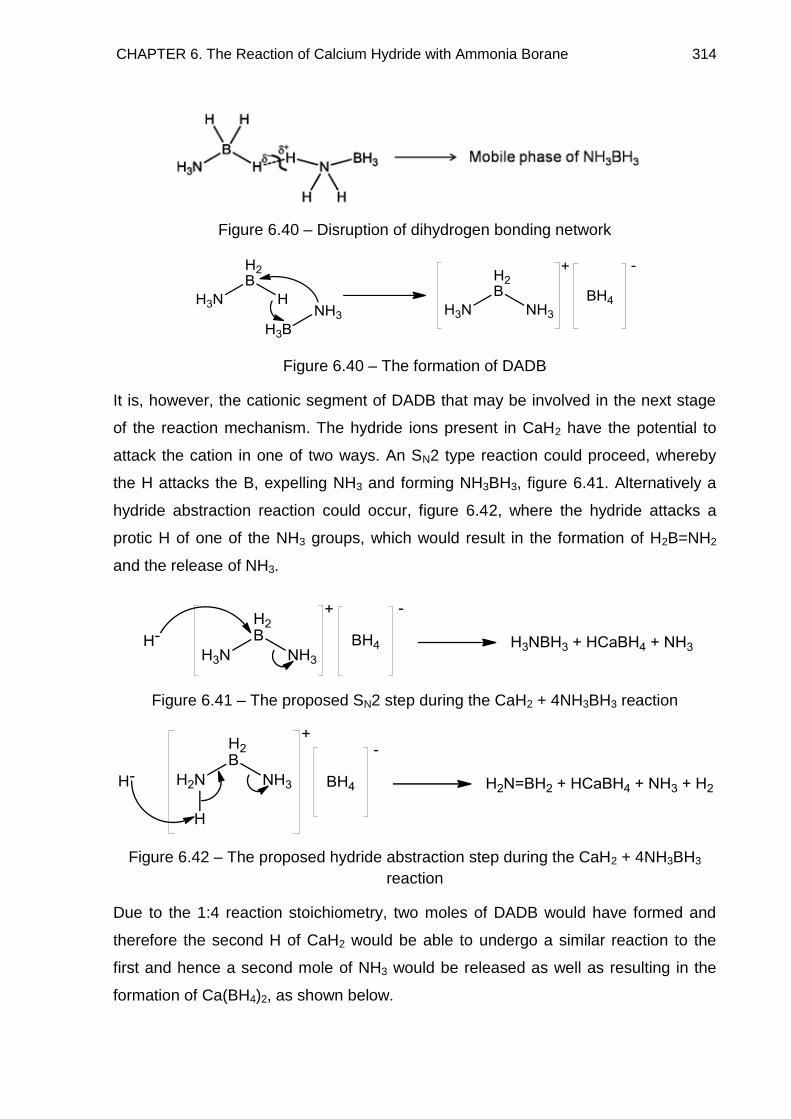
CHAPTER 6. The Reaction of Calcium Hydride with Ammonia Borane 314
Figure 6.40 – Disruption of dihydrogen bonding network
Figure 6.40 – The formation of DADB
It is, however, the cationic segment of DADB that may be involved in the next stage
of the reaction mechanism. The hydride ions present in CaH2 have the potential to
attack the cation in one of two ways. An SN2 type reaction could proceed, whereby
the H attacks the B, expelling NH3 and forming NH3BH3, figure 6.41. Alternatively a
hydride abstraction reaction could occur, figure 6.42, where the hydride attacks a
protic H of one of the NH3 groups, which would result in the formation of H2B=NH2
and the release of NH3.
Figure 6.41 – The proposed SN2 step during the CaH2 + 4NH3BH3 reaction
Figure 6.42 – The proposed hydride abstraction step during the CaH2 + 4NH3BH3
reaction
Due to the 1:4 reaction stoichiometry, two moles of DADB would have formed and
therefore the second H of CaH2 would be able to undergo a similar reaction to the
first and hence a second mole of NH3 would be released as well as resulting in the
formation of Ca(BH4)2, as shown below.
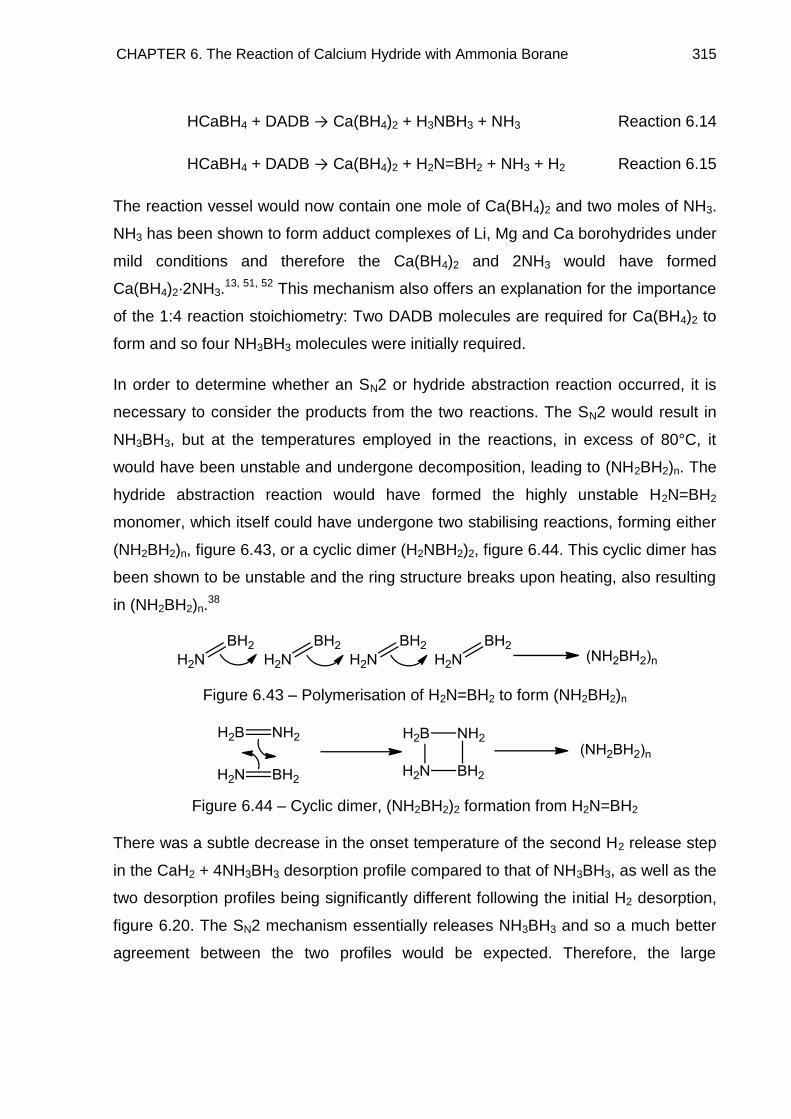
CHAPTER 6. The Reaction of Calcium Hydride with Ammonia Borane 315
HCaBH4 + DADB → Ca(BH4)2 + H3NBH3 + NH3 Reaction 6.14
HCaBH4 + DADB → Ca(BH4)2 + H2N=BH2 + NH3 + H2 Reaction 6.15
The reaction vessel would now contain one mole of Ca(BH4)2 and two moles of NH3.
NH3 has been shown to form adduct complexes of Li, Mg and Ca borohydrides under
mild conditions and therefore the Ca(BH4)2 and 2NH3 would have formed
Ca(BH4)2·2NH3.13, 51, 52 This mechanism also offers an explanation for the importance
of the 1:4 reaction stoichiometry: Two DADB molecules are required for Ca(BH4)2 to
form and so four NH3BH3 molecules were initially required.
In order to determine whether an SN2 or hydride abstraction reaction occurred, it is
necessary to consider the products from the two reactions. The SN2 would result in
NH3BH3, but at the temperatures employed in the reactions, in excess of 80°C, it
would have been unstable and undergone decomposition, leading to (NH2BH2)n. The
hydride abstraction reaction would have formed the highly unstable H2N=BH2
monomer, which itself could have undergone two stabilising reactions, forming either
(NH2BH2)n, figure 6.43, or a cyclic dimer (H2NBH2)2, figure 6.44. This cyclic dimer has
been shown to be unstable and the ring structure breaks upon heating, also resulting
in (NH2BH2)n.38
Figure 6.43 – Polymerisation of H2N=BH2 to form (NH2BH2)n
Figure 6.44 – Cyclic dimer, (NH2BH2)2 formation from H2N=BH2
There was a subtle decrease in the onset temperature of the second H2 release step
in the CaH2 + 4NH3BH3 desorption profile compared to that of NH3BH3, as well as the
two desorption profiles being significantly different following the initial H2 desorption,
figure 6.20. The SN2 mechanism essentially releases NH3BH3 and so a much better
agreement between the two profiles would be expected. Therefore, the large
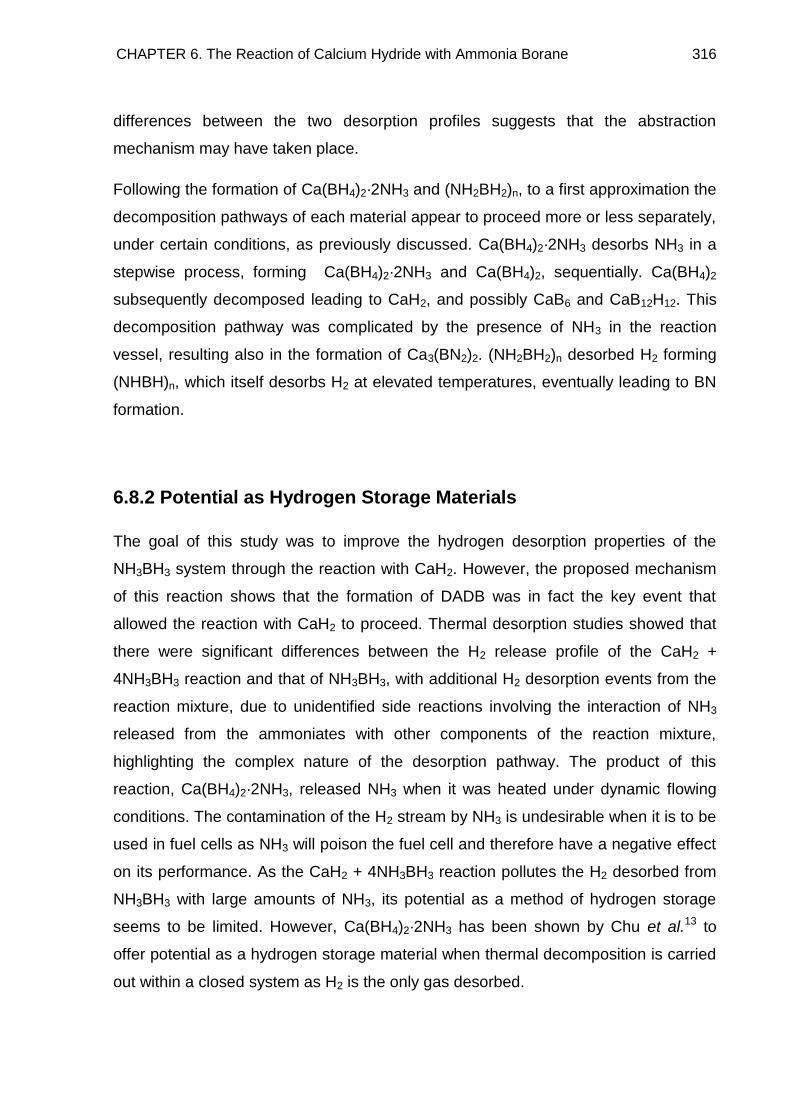
CHAPTER 6. The Reaction of Calcium Hydride with Ammonia Borane 316
differences between the two desorption profiles suggests that the abstraction
mechanism may have taken place.
Following the formation of Ca(BH4)2·2NH3 and (NH2BH2)n, to a first approximation the
decomposition pathways of each material appear to proceed more or less separately,
under certain conditions, as previously discussed. Ca(BH4)2·2NH3 desorbs NH3 in a
stepwise process, forming Ca(BH4)2·2NH3 and Ca(BH4)2, sequentially. Ca(BH4)2
subsequently decomposed leading to CaH2, and possibly CaB6 and CaB12H12. This
decomposition pathway was complicated by the presence of NH3 in the reaction
vessel, resulting also in the formation of Ca3(BN2)2. (NH2BH2)n desorbed H2 forming
(NHBH)n, which itself desorbs H2 at elevated temperatures, eventually leading to BN
formation.
6.8.2 Potential as Hydrogen Storage Materials
The goal of this study was to improve the hydrogen desorption properties of the
NH3BH3 system through the reaction with CaH2. However, the proposed mechanism
of this reaction shows that the formation of DADB was in fact the key event that
allowed the reaction with CaH2 to proceed. Thermal desorption studies showed that
there were significant differences between the H2 release profile of the CaH2 +
4NH3BH3 reaction and that of NH3BH3, with additional H2 desorption events from the
reaction mixture, due to unidentified side reactions involving the interaction of NH3
released from the ammoniates with other components of the reaction mixture,
highlighting the complex nature of the desorption pathway. The product of this
reaction, Ca(BH4)2·2NH3, released NH3 when it was heated under dynamic flowing
conditions. The contamination of the H2 stream by NH3 is undesirable when it is to be
used in fuel cells as NH3 will poison the fuel cell and therefore have a negative effect
on its performance. As the CaH2 + 4NH3BH3 reaction pollutes the H2 desorbed from
NH3BH3 with large amounts of NH3, its potential as a method of hydrogen storage
seems to be limited. However, Ca(BH4)2·2NH3 has been shown by Chu et al.13 to
offer potential as a hydrogen storage material when thermal decomposition is carried
out within a closed system as H2 is the only gas desorbed.
CHAPTER 6. The Reaction of Calcium Hydride with Ammonia Borane 317
6.9 References
1. Filinchuk, Y. E.; Yvon, K.; Meisner, G. P.; Pinkerton, F. E.; Balogh, M. P., On
the composition and crystal structure of the new quaternary hydride phase Li4BN3H10.
Inorganic Chemistry 2006, 45, 1433–1435.
2. Noritake, T.; Aoki, M.; Towata, S.; Ninomiya, A.; Nakamori, Y.; Orimo, S.,
Crystal structure analysis of novel complex hydrides formed by the combination of
LiBH4 and LiNH2. Applied Physics A 2006, 83, 277–279.
3. Chater, P. A.; Anderson, P. A.; Prendergast, J. W.; Walton, A.; Mann, V. S. J.;
Book, D.; David, W. I. F.; Johnson, S. R.; Edwards, P. P., Synthesis and
characterisation of amide-borohydrides: New complex light hydrides for potential
hydrogen storage. Journal of Alloys and Compounds 2007, 446–447, 350–354.
4. Chater, P. A.; David, W. I. F.; Johnson, S. R.; Edwards, P. P.; Anderson, P. A.,
Synthesis and crystal structure of Li4BH4(NH2)3. Chemical Communications 2006,
2439–2441.
5. Chater, P. A.; David, W. I. F.; Anderson, P. A., Synthesis and structure of the
new complex hydride Li2BH4NH2. Chemical Communications 2007, 4770–4772.
6. Yang, J. B.; Wang, X. J.; Cai, Q.; Yelon, W. B.; James, W. J., Crystal and
electronic structures of the complex hydride Li4BN3H10. Journal of Applied Physics
2007, 102, 033507.
7. Wu, H.; Zhou, W.; Udovic, T. J.; Rush, J. J.; Yildirim, T., Structures and crystal
chemistry of Li2BNH6 and Li4BN3H10. Chemistry of Materials 2008, 20, 1245–1247.
8. Meisner, G. P.; Scullin, M. L.; Balogh, M. P.; Pinkerton, F. E.; Meyer, M. S.,
Hydrogen release from mixtures of lithium borohydride and lithium amide: A phase
diagram study. Journal Of Physical Chemistry B 2006, 110, 4186–4192.
9. Diyabalanage, H. V.; Shrestha, R. P.; Semelsberger, T. A.; Scott, B. L.;
Bowden, M. E.; Davis, B. L.; Burrell, A. K., Calcium Amidotrihydroborate: A Hydrogen
Storage Material. Angewandte Chemie-International Edition 2007, 46, 8995–8997.
10. Wu, H.; Zhou, W.; Yildirim, T., Alkali and alkaline-earth metal amidoboranes:
Structure, crystal chemistry, and hydrogen storage properties. Journal of the
American Chemical Society 2008, 130, 14834–14839.
11. Zhang, Y.; Shimoda, K.; Miyaoka, H.; Ichikawa, T.; Kojima, Y., Thermal
decomposition of alkaline-earth metal hydride and ammonia borane composites.
International Journal of Hydrogen Energy 2010, 35, 12405–12409.
12. Chua, Y. S.; Wu, G.; Xiong, Z.; He, T.; Chen, P., Calcium Amidoborane
Ammoniate – Synthesis, Structure, and Hydrogen Storage Properties. Chemistry of
Materials 2009, 21, 4899–4904.
CHAPTER 6. The Reaction of Calcium Hydride with Ammonia Borane 318
13. Chu, H.; Wu, G.; Xiong, Z.; Guo, J.; He, T.; Chen, P., Structure and hydrogen
storage properties of calcium borohydride diammoniate. Chemistry of Materials 2010,
22, 6021–6028.
14. Majzoub, E. H.; Rönnebro, E., Crystal structures of calcium borohydride:
Theory and experiment. Journal Of Physical Chemistry C 2009, 113, 3352–3358.
15. Miwa, K.; Aoki, M.; Noritake, T.; Ohba, N.; Nakamori, Y.; Towata, S.; Züttel, A.;
Orimo, S., Thermodynamical stability of calcium borohydride Ca(BH4)2. Physical
Review B 2006, 74, 155122.
16. Buchter, F.; Łodziana, Z.; Remhof, A.; Friedrichs, O.; Borgschulte, A.; Mauron,
P.; Züttel, A.; Sheptyakov, D.; Barkhordarian, G.; Bormann, R.; Chłopek, K.; Fichtner,
M.; Sørby, M. H.; Riktor, M. D.; Hauback, B. C.; Orimo, S., Structure of Ca(BD4)2 β-
phase from combined neutron and synchrotron X-ray powder diffraction data and
density functional calculations. Journal Of Physical Chemistry B 2008, 112, 8042–
8048.
17. Filinchuk, Y. E.; Rönnebro, E.; Chandra, D., Crystal structures and phase
transformations in Ca(BH4)2. Acta Materialia 2009, 57, 732–738.
18. Kim, J.-H.; Jin, S.-A.; Shim, J.-H.; Cho, Y. W., Thermal decomposition
behavior of calcium borohydride Ca(BH4)2. Journal of Alloys and Compounds 2008,
461, L20–L22.
19. Kim, J.-H.; Jin, S.-A.; Shim, J.-H.; Cho, Y. W., Reversible hydrogen storage in
calcium borohydride Ca(BH4)2. Scripta Materialia 2008, 58, 481–483.
20. Kim, Y.; Reed, D.; Lee, Y.-S.; Y., L. J.; Shim, J.-H.; Book, D.; Cho, Y. W.,
Identification of the dehydrogenated product of Ca(BH4)2. Journal Of Physical
Chemistry C 2009, 113, 5865–5871.
21. Aoki, M.; Miwa, K.; Noritake, T.; Ohba, N.; Matsumoto, M.; Li, H.-W.;
Nakamori, Y.; Towata, S.; Orimo, S., Structural and dehydriding properties of
Ca(BH4)2. Applied Physics A 2008, 92, 601–605.
22. Riktor, M. D.; Sørby, M. H.; Chłopek, K.; Fichtner, M.; Buchter, F.; Züttel, A.;
Hauback, B. C., In situ synchrotron diffraction studies of phase transitions and
thermal decomposition of Mg(BH4)2 and Ca(BH4)2. Journal of Materials Chemistry
2007, 17, 4939–4942.
23. Riktor, M. D.; Sørby, M. H.; Chłopek, K.; Fichtner, M.; Hauback, B. C., The
identification of a hitherto unknown intermediate phase CaB2Hx from decomposition
of Ca(BH4)2. Journal of Materials Chemistry 2009, 19, 2754–2759.
24. Buchter, F.; Łodziana, Z.; Remhof, A.; Friedrichs, O.; Borgschulte, A.; Mauron,
P.; Züttel, A.; Sheptyakov, D.; Palatinus, L.; Chłopek, K.; Fichtner, M.; Barkhordarian,
G.; Bormann, R.; Hauback, B. C., Structure of the orthorhombic γ-phase and phase
transitions of Ca(BD4)2. Journal Of Physical Chemistry C 2009, 113, 17223–17230.
CHAPTER 6. The Reaction of Calcium Hydride with Ammonia Borane 319
25. Lee, J. Y.; Ravnsbaek, D.; Lee, Y. S.; Kim, Y.; Cerenius, Y.; Shim, J.-H.;
Jensen, T. R.; Nur, N. H.; Cho, Y. W., Decomposition reactions and reversibility of
the LiBH4-Ca(BH4)2 composite. Journal Of Physical Chemistry C 2009, 113, 15080–
15086.
26. Wu, H.; Zhou, W.; Pinkerton, F. E.; Meyer, M. S.; Srinivas, G.; Yildirim, T.;
Udovic, T. J.; Rush, J. J., A new family of metal borohydride ammonia borane
complexes: Synthesis, structures, and hydrogen storage properties. Journal of
Materials Chemistry 2010, 20, 6550–6556.
27. Durojaiye, T.; Ibikunle, A.; Goudy, A. J., Hydrogen storage in destabilized
borohydride materials. International Journal of Hydrogen Energy 2010, 35, 10329–
10333.
28. Rönnebro, E.; Majzoub, E. H., Calcium borohydride for hydrogen storage:
Catalysis and reversibility. Journal of Physical Chemistry B 2007, 111, 12045–12047.
29. Worle, M.; Meyer zu Altenschildescheb, H.; Nesper, R., Synthesis, properties
and crystal structures of α-Ca3(BN2)2 and Ca9 + x(BN2, CBN)6 – two compounds with
BN23− and CBN4− anions. Journal of Alloys and Compounds 1998, 264, 107–114.
30. Hu, J.; Xiong, Z.; Wu, G.; Chen, P.; Murata, K.; Sakata, K., Hydrogen
releasing reaction between Mg(NH2)2 and CaH2. Journal of Power Sources 2006,
159, 116–119.
31. Coelho, A. A., Indexing of powder diffraction patterns by iterative use of
singular value decomposition. Journal of Applied Crystallography 2003, 36, 86–95.
32. Coelho, A. A. Topas, General Profile and Structure Analysis Software for
Powder Diffraction Data, Bruker AXS, Karlsruhe, Germany, 3rd edition: 2004.
33. Noritake, T.; Aoki, M.; Matsumoto, M.; Miwa, K.; Towata, S.; Li, H.-W.; Orimo,
S., Crystal structure and charge density analysis of Ca(BH4)2. Journal of Alloys and
Compounds 2010, 491, 57–62.
34. Xiong, Z.; Wu, G.; Hu, J.; Chen, P., Ca–Na–N–H system for reversible
hydrogen storage. Journal of Alloys and Compounds 2007, 441, 152–156.
35. Pinkerton, F. E., Decomposition kinetics of lithium amide for hydrogen storage
materials. Journal of Alloys and Compounds 2005, 400, 76–82.
36. Bowden, M. E.; Autrey, T.; Brown, I.; Ryan, M., The thermal decomposition of
ammonia borane: A potential hydrogen storage material. Current Applied Physics
2008, 8, 498–500.
37. Reiter, J. W.; Zan, J. A.; Bowman Jr, R. C.; Hwang, S.-J., Development and
evaluation of advanced hydride systems for reversible hydrogen storage. DoE 2009
Annual Progress Report 2009.
CHAPTER 6. The Reaction of Calcium Hydride with Ammonia Borane 320
38. Stowe, A. C.; Shaw, W. J.; Linehan, J. C.; Schmid, B.; Autrey, T., In situ solid
state 11B MAS-NMR studies of the thermal decomposition of ammonia borane:
mechanistic studies of the hydrogen release pathways from a solid state hydrogen
storage material. Physical Chemistry Chemical Physics 2007, 9, 1831–1836.
39. Gervais, C.; Framery, E.; Duriez, C.; Maquet, J.; Vaultier, M.; Babonneau, F., 11B and 15N solid state NMR investigation of a boron nitride preceramic polymer
prepared by ammonolysis of borazine. Journal of the European Ceramic Society
2005, 25, 129–135.
40. Gervais, C.; Babonneau, F.; Maquet, J.; Bonhomme, C.; Massiot, D.; Framery,
E.; Vaultier, M., 15N Cross-polarization using the Inversion-Recovery Cross-
Polarization technique and 11B Magic Angle Spinning NMR studies of reference
compounds containing B–N bonds. Magnetic Resonance in Chemistry 1998, 36,
407–414.
41. Gervais, C.; Maquet, J.; Babonneau, F.; Duriez, C.; Framery, E.; Vaultier, M.;
Florian, P.; Massiot, D., Chemically derived BN ceramics: Extensive 11B and 15N
solid-state NMR study of a preceramic polyborazilene. Chemistry of Materials 2001,
13, 1700–1707.
42. Gervais, C.; Babonneau, F., High resolution solid state NMR investigation of
various boron nitride preceramic polymers. Journal of Organometallic Chemistry
2002, 657, 75–82.
43. Sears, R. E. J., 11B chemical shifts and quadrupole coupling constants in the
alkaline-earth hexaborides. Journal of Chemical Physics 1982, 76, 5651–5652.
44. Hwang, S.-J.; Bowman Jr, R. C.; Reiter, J. W.; Rijssenbeek, J.; Soloveichik, G.
L.; Zhao, J.-C.; Kabbour, H.; Ahn, C. C., NMR confirmation for formation of [B12H12]2−
complexes during hydrogen desorption from metal borohydrides. The Journal of
Physical Chemistry C 2008, 112, 3164–3169.
45. Frankcombe, T. J., Calcium borohydride for hydrogen storage: A
computational study of Ca(BH4)2 crystal structures and the CaB2Hx intermediate.
Journal of Physical Chemistry C 2010, 114, 9503–9509.
46. Stavila, V.; Her, J.-H.; Zhou, W.; Hwang, S.-J.; Kim, C.; Ottley, L. A. M.;
Udovic, T. J., Probing the structure, stability and hydrogen storage properties of
calcium dodecahydro-closo-dodecaborate. Journal of Solid State Chemistry 2010,
183, 1133–1140.
47. Sit, V.; Geanangel, R. A.; Wendlandt, W. W., The thermal dissociation of
NH3BH3. Thermochimica Acta 1986, 113, 379–382.
48. Marchetti, P. S.; Kwon, D.; Schmidt, W. R.; Interrante, L. V.; Maciel, G. E.,
High-field 11B Magic-Angle Spinning NMR characterization of boron nitrides.
Chemistry of Materials 1991, 3, 482–486.
CHAPTER 6. The Reaction of Calcium Hydride with Ammonia Borane 321
49. Eichhorn, K. D.; Kirfel, A.; Grochowski, J.; Serda, P., Accurate structure
analysis with synchrotron radiation. An application to borazone, cubic BN. Acta
Crystallographica B 1992, 47, 843–848.
50. Pease, R. S., An X-ray study of boron nitride. Acta Crystallographica 1952, 5,
356–361.
51. Guo, Y.; Xia, G.; Zhu, Y.; Gao, L.; Yu, X., Hydrogen release from
amminelithium borohydride, LiBH4.NH3. Chemical Communications 2010, 46, 2599–
2601.
52. Soloveichik, G. L.; Her, J.-H.; Stephens, P. W.; Gao, Y.; Rijssenbeek, J.;
Andrus, M.; Zhao, J.-C., Ammine magnesium borohydride complex as a new material
for hydrogen storage: Structure and properties of Mg(BH4)2·2NH3. Inorganic
Chemistry 2008, 47, 4290–4298.
322
Chapter 7
Conclusions and Suggestions for
Further Work
7.1 Conclusions
The thermal decomposition pathway of ammonia borane has been investigated. It
was observed that upon heating ammonia borane foamed, due to the release of
gaseous products of decomposition, identified to be hydrogen by TPD–MS
investigations. A sharp hydrogen release began at 85°C, while subsequent
desorptions were much broader, with releases commencing at 125°C and 290°C.
Following the first decomposition step powder XRD analysis showed there were no
crystalline materials present. Solid state 11B MAS NMR spectroscopy played a more
important role in determining the composition of the amorphous decomposition
products. A number of boron environments were present in the samples after heating
NH3BH3 to 80°C and 200°C. The observed environments showed that DADB played
an important role in the decomposition pathway. The appearance of N2BH2
environments revealed the initial decomposition products were polyaminoboranes,
(NH2BH2)n, while further heating resulted in boron predominantly residing in sp2
environments, in the form of polyiminoboranes, (NHBH)n. The formation of these
polymeric products was further supported by Raman spectroscopic studies.
The bulk of this research focused on the thermal reactions of metal hydrides with
ammonia borane. The products of the reactions were initially investigated by powder
XRD. In the case of NaH, the reaction was found to be able to proceed with a
reaction stoichiometry of 1:1 at a temperature of 40°C, forming NaNH2BH3. A
CHAPTER 7. Conclusions and Suggestions for Further Work 323
reaction stoichiometry of 1:2 in favour of NH3BH3 led to the formation of a new
previously unreported crystalline phase at a reaction temperature of 60°C. The
powder XRD pattern collected for this material was indexed to a trigonal unit cell, with
a suggested space group of P31c. The a and c lattice constants were refined through
a Pawley fit to values of 4.3389(4) Å and 17.859(1) Å, respectively. It was
subsequently determined that the first step in the reaction pathway was the reaction
of 1 mole of NaH with 1 mole of NH3BH3, forming NaNH2BH3, which then reacted
with the excess NH3BH3 forming the trigonal phase. The trigonal phase was
observed to exist until a reaction temperature of 150°C was achieved. Powder XRD
analysis revealed that the only crystalline decomposition product was NaBH4, which
implied that there were also amorphous decomposition products present. Thermal
desorption investigations showed that the formation of NaNH2BH3 was exclusively
accompanied by H2 release, while the formation of the trigonal phase was
accompanied by the release of both H2 and NH3. The desorption of NH3 was
concluded to be related to the formation of the trigonal phase, reaction 7.1, which led
to the conclusion that the trigonal phase was of composition Na+(BH3NH2BH3)−. The
desorption of H2 was attributed to side reactions.
NaNH2BH3 + NH3BH3 → Na+(BH3NH2BH3)− + NH3 Reaction 7.1
The reaction of LiH with NH3BH3 was observed to proceed differently to that of NaH.
A reaction stoichiometry of 1:1 failed to yield LiNH2BH3 and it was only when a
reaction stoichiometry of 1:2 in favour of NH3BH3 was employed that a single
crystalline product could be obtained. The powder XRD pattern collected for this
material was indexed to a tetragonal unit cell with a suggested space group of
P42mc. The a and c lattice parameters were refined through a Pawley fit, to values of
4.0288(2) Å and 16.958(2) Å, respectively. A powder XRD investigation revealed that
this tetragonal phase existed until a reaction temperature of 150°C was reached. At
this temperature there was some evidence that LiBH4 had formed, although the
decomposition products were predominantly amorphous. Thermal desorption
investigations showed that the formation of the tetragonal phase was exclusively
accompanied by the release of H2, while both H2 and NH3 were desorbed during this
CHAPTER 7. Conclusions and Suggestions for Further Work 324
materials decomposition. These observations helped reach the conclusion that the
tetragonal phase was of composition [Li(NH3)]+[BH3NH2BH3]
−.
The reaction of CaH2 with NH3BH3 was found to require a reaction stoichiometry of
1:4 and a reaction temperature of 80°C in order to yield a product free from starting
materials. The crystalline products of the reaction were analysed by powder XRD and
a literature search allowed this product to be identified as Ca(BH4)2·2NH3. Further
heating to 120°C yielded a second crystalline material, which was identified as
Ca(BH4)2·NH3, before this material decomposed to form α-Ca(BH4)2 at 225°C.
Powder XRD data was employed to solve the previously unreported structure of
Ca(BH4)2·NH3 using Rietveld refinements. The structure was found to possess an
orthorhombic unit cell in the Pnam space group with a = 8.1991(3) Å, b = 11.8406(4)
Å and c = 5.8369(2) Å. The structure of Ca(BH4)2·2NH3 was also solved from powder
XRD data, although this structure has previously been reported. Thermal desorption
investigations showed that only H2 was released during the formation of
Ca(BH4)2·2NH3 from starting materials, while both H2 and NH3 were desorbed in
subsequent reaction steps.
In order to obtain a more complete picture of the three reaction pathways discussed
above, solid state 11B MAS NMR spectroscopy was employed, primarily to provide
information about amorphous components of reaction mixtures. In all three reaction
pathways the NMR spectra revealed that amorphous materials were significant
decomposition products. The crystalline products of the lithium and sodium reactions
possessed boron in only sp3 environments, however, the NMR spectra revealed sp2
boron was present in all samples, even at reaction temperatures that were lower than
the decomposition temperature of the crystalline products. This low temperature
presence of sp2 boron showed that there were competing reactions taking place.
Following decomposition of Na+(BH3NH2BH3)− boron was found to exist in
approximately equal amounts in sp2 and BH4 environments. Solid state 23Na MAS
NMR spectroscopy revealed that all of the sodium in the decomposition products was
found in the form of NaBH4, leading to the conclusion that the amorphous
decomposition products were polyiminoboranes, (NHBH)n. The 11B NMR spectrum of
the sample collected following the decomposition of [Li(NH3)]+[BH3NH2BH3]
− was
CHAPTER 7. Conclusions and Suggestions for Further Work 325
dominated by an sp2 boron feature, as well as possessing a small BH4 resonance.
The chemical shift of the sp2 feature was similar to that of the one observed in the
spectrum collected from decomposed Na+(BH3NH2BH3)−, implying that the same
amorphous material had formed, namely polyiminoborane.
The solid state 11B MAS NMR spectra of the CaH2 + 4NH3BH3 reaction pathway
showed BH4 and sp2 features at all temperatures. The BH4 environment showed
slight changes in chemical shift as the crystalline material present in the reaction
mixture changed, while the appearance of sp2 boron at low temperature gave an
important insight into the reaction pathway. The observation of both BH4 and sp2
features following the first step in the reaction pathway led to the conclusion that the
decomposition of NH3BH3 had an integral role in the reaction pathway, specifically
the decomposition step resulting in the formation of DADB. DADB formation provided
the BH4− anion necessary to effect formation of Ca(BH4)2·2NH3. This reaction step
rationalised the need for a reaction stoichiometry of 1:4, as two DADB units were
required for Ca(BH4)2·2NH3 formation, which initially required four NH3BH3
molecules. The NH3BH2NH3 unit present in DADB underwent chain growth and
released hydrogen, following the same decomposition pathway as NH3BH3, forming
an amorphous material possessing sp2 boron. The observed sp2 environment had
the same chemical shift to that of polyiminoborane.
The desorption profile of the NaH + 2NH3BH3 reaction mixture showed that H2
release commenced almost instantaneously, with the first peak in the H2 trace
observed at 40°C. A second H2 release began at 55°C and peaked at 80°C. The LiH
+ 2NH3BH3 reaction mixture showed H2 release did not commence until 50°C, with a
peak at 75°C. The observed lower onset temperature of H2 release from the NaH
containing reaction mixture was due to the initial formation of NaNH2BH3, a reaction
step that was not observed in the LiH + 2NH3BH3 reaction pathway. The second H2
desorption from the NaH + 2NH3BH3 reaction mixture was due to Na+(BH3NH2BH3)−
formation. The first H2 desorption from the LiH + 2NH3BH3 reaction mixture was due
to the equivalent step in this reaction pathway, the formation of
[Li(NH3)]+[BH3NH2BH3]
−, showing that the two materials formed at similar
temperatures. A significant difference between the desorption profiles was the
CHAPTER 7. Conclusions and Suggestions for Further Work 326
release of NH3 from the NaH + 2NH3BH3 reaction mixture between 65°C and 140°C,
which occurred during Na+(BH3NH2BH3)− formation, whereas the formation of
[Li(NH3)]+[BH3NH2BH3]
− did not involve NH3 desorption.
A comparison of the desorption profiles of Na+(BH3NH2BH3)− and
[Li(NH3)]+[BH3NH2BH3]
− showed decomposition of these materials began at similar
temperatures, with the onset of H2 release observed at 135°C and 130°C,
respectively. The observed weight loss for [Li(NH3)]+[BH3NH2BH3]
− in this initial
decomposition step, 9.4 wt%, was greater than that observed for Na+(BH3NH2BH3)−,
5 wt%. Heating the materials to 350°C resulted in total weight losses due to H2
release of 12.5 wt% for [Li(NH3)]+[BH3NH2BH3]
− and 7.5 wt% for Na+(BH3NH2BH3)−.
The higher weight loss from [Li(NH3)]+[BH3NH2BH3]
− suggests that it has more
potential as a hydrogen storage material than Na+(BH3NH2BH3)−. However, a further
difference between the two desorption profiles was that [Li(NH3)]+[BH3NH2BH3]
−
showed a weight loss of 3.6 wt% between 75°C and 150°C due to NH3 release,
whereas decomposition of Na+(BH3NH2BH3)− was free from NH3 desorption. This
NH3 release is a significant drawback in the potential of [Li(NH3)]+[BH3NH2BH3]
− as a
hydrogen storage material and so unless this release can be suppressed, it is
Na+(BH3NH2BH3)− that shows the greatest potential as a hydrogen store.
It was observed that the reactions of LiH and NaH with NH3BH3 proceeded through
different mechanisms, despite yielding similar products. A significant difference
between the two reactions was that the LiH and NH3BH3 reaction mixture foamed,
whereas, the NaH reaction did not, providing an insight into the mechanism of the
crystalline phase formation. The hydride ion of MH is a strong base and is potentially
capable of removing a protic H from the NH3 group in NH3BH3. In the case of the
more basic NaH, deprotonation of NH3BH3 was facile and so NaNH2BH3 could form.
Lithium is less electron donating than sodium, meaning the H− is a weaker base and
so it was not capable of acquiring a protic H from NH3BH3. This meant that the NaH
reaction could proceed when NH3BH3 was in its most stable state, before disruption
of the dihydrogen bonding network, initially forming NaNH2BH3, before this material
reacted with the second mole of NH3BH3 to yield Na+(BH3NH2BH3)−. The fact that the
LiH reaction mixture foamed showed that this metal hydride reacted with the more
CHAPTER 7. Conclusions and Suggestions for Further Work 327
mobile phase of NH3BH3. Following foaming LiH would have been able to react with
one mole of NH3BH3 to form LiNH2BH3, but as the second mole of NH3BH3 was also
labile, a subsequent reaction of LiNH2BH3 with NH3BH3 would also have been able to
proceed. This meant that LiNH2BH3 was never observed as a reaction product and
[Li(NH3)]+[BH3NH2BH3]
− formed instead.
Thermal desorption investigations of the reaction pathways showed a significant
amount of ammonia was released during the NaH reaction, whereas the formation of
[Li(NH3)]+[BH3NH2BH3]
− was exclusively accompanied by hydrogen release. The
lithium cation is a stronger Lewis acid than the sodium cation and so it is more facile
for the released NH3 to form an adduct with the lithium cation compared to sodium.
Consequently, ammonia desorption was observed during the decomposition of
[Li(NH3)]+[BH3NH2BH3]
−, whereas hydrogen desorption was exclusively observed
during Na+(BH3NH2BH3)− decomposition.
The reaction of CaH2 with NH3BH3 yielded a borohydride containing product, showing
that this reaction mechanism involved the formation of DADB, a very different
mechanism to that observed in the cases of LiH and NaH. The reason behind this is
that LiH and NaH are both metallic hydrides, whereas CaH2 is an insulator. This
means a thermal reaction involving CaH2 could not proceed until the more reactive
DADB had formed in the reaction mixture, which resulted in a reaction product
unrelated to [Li(NH3)]+[BH3NH2BH3]
− and Na+(BH3NH2BH3)−.
7.2 Suggestions for Further Work
This research has opened up avenues to further research into metallated derivatives
of ammonia borane. In terms of the products already synthesised in this research,
namely Na+[BH3NH2BH3]−, [Li(NH3)]
+[BH3NH2BH3]−, Ca(BH4)2·2NH3 and
Ca(BH4)2·NH3, it would be beneficial to continue crystallographic studies on all
materials. The acquisition of synchrotron powder diffraction data would be desirable.
This higher quality data would allow the diffraction data to be indexed and refined to
a higher degree of accuracy. Furthermore, the crystal structures solved for
CHAPTER 7. Conclusions and Suggestions for Further Work 328
Ca(BH4)2·2NH3 and Ca(BH4)2·NH3 could be more accurately determined with
synchrotron powder diffraction data.
The crystalline phases Na+[BH3NH2BH3]− and [Li(NH3)]
+[BH3NH2BH3]− have been
characterised by a variety of techniques in this research, however, the crystal
structures of both materials remained unsolved. Further work related to these two
materials should therefore focus on the successful solution of both of these crystal
structures.
The research could be further extended to investigate the interaction of ammonia
borane with other group 1 and group 2 light hydrides as well as incorporating light
transition metal hydrides. The possibility of synthesising mixed metal products would
also be an interesting avenue to explore as a potential method of optimising
hydrogen release.
This research investigated the hydrogen desorption properties of the synthesised
materials. However, in order to fully evaluate the potential of these materials for
hydrogen storage it will be necessary to investigate their capability to be
rehydrogenated following dehydrogenation. Hydrogenation at a variety of
temperatures and pressures should be undertaken to investigate this potential. If
hydrogenation proves successful, the systems capability to be recycled numerous
times should be investigated.
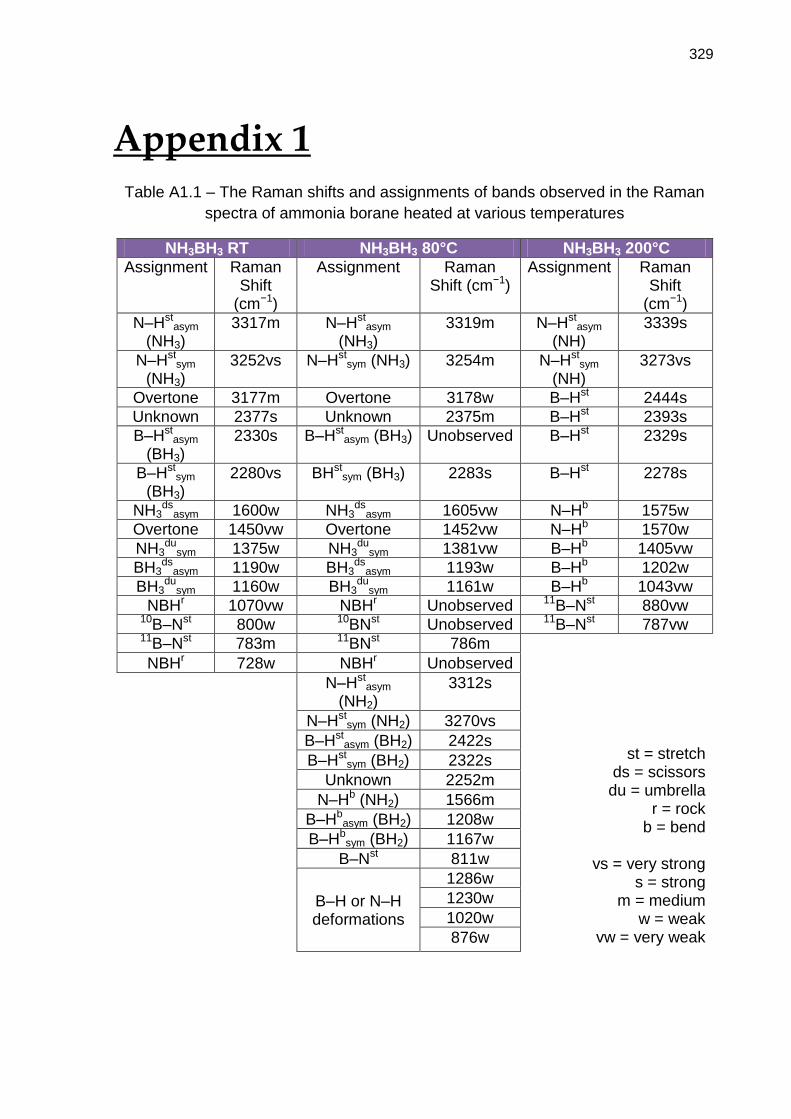
329
Appendix 1
Table A1.1 – The Raman shifts and assignments of bands observed in the Raman
spectra of ammonia borane heated at various temperatures
NH3BH3 RT NH3BH3 80°C NH3BH3 200°C
Assignment Raman Shift
(cm−1)
Assignment Raman Shift (cm−1)
Assignment Raman Shift
(cm−1)
N–Hstasym
(NH3) 3317m N–Hst
asym (NH3)
3319m N–Hstasym
(NH) 3339s
N–Hstsym
(NH3) 3252vs N–Hst
sym (NH3) 3254m N–Hstsym
(NH) 3273vs
Overtone 3177m Overtone 3178w B–Hst 2444s
Unknown 2377s Unknown 2375m B–Hst 2393s
B–Hstasym
(BH3) 2330s B–Hst
asym (BH3) Unobserved B–Hst 2329s
B–Hstsym
(BH3) 2280vs BHst
sym (BH3) 2283s B–Hst 2278s
NH3ds
asym 1600w NH3ds
asym 1605vw N–Hb 1575w
Overtone 1450vw Overtone 1452vw N–Hb 1570w
NH3du
sym 1375w NH3du
sym 1381vw B–Hb 1405vw
BH3ds
asym 1190w BH3ds
asym 1193w B–Hb 1202w
BH3du
sym 1160w BH3du
sym 1161w B–Hb 1043vw
NBHr 1070vw NBHr Unobserved 11B–Nst 880vw 10B–Nst 800w 10BNst Unobserved 11B–Nst 787vw 11B–Nst 783m 11BNst 786m
st = stretch ds = scissors
du = umbrella r = rock
b = bend
vs = very strong s = strong
m = medium w = weak
vw = very weak
NBHr 728w NBHr Unobserved
N–Hstasym
(NH2) 3312s
N–Hstsym (NH2) 3270vs
B–Hstasym (BH2) 2422s
B–Hstsym (BH2) 2322s
Unknown 2252m
N–Hb (NH2) 1566m
B–Hbasym (BH2) 1208w
B–Hbsym (BH2) 1167w
B–Nst 811w
B–H or N–H deformations
1286w
1230w
1020w
876w
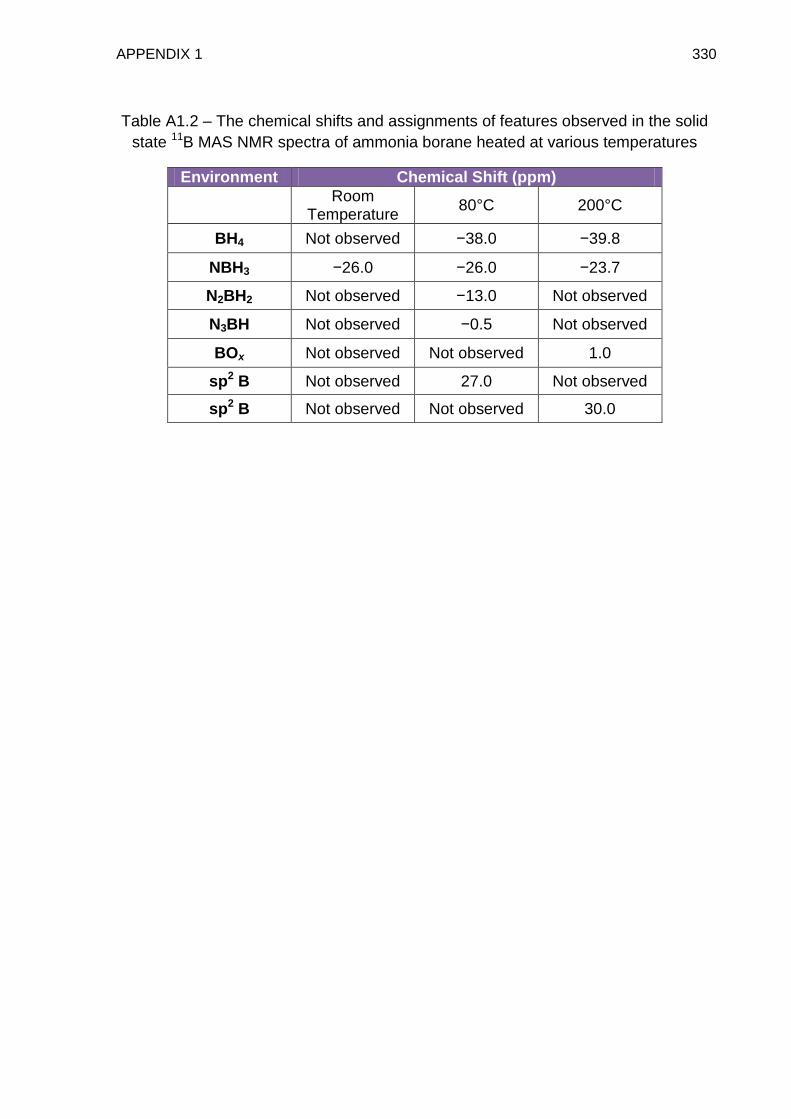
APPENDIX 1 330
Table A1.2 – The chemical shifts and assignments of features observed in the solid
state 11B MAS NMR spectra of ammonia borane heated at various temperatures
Environment Chemical Shift (ppm)
Room
Temperature 80°C 200°C
BH4 Not observed −38.0 −39.8
NBH3 −26.0 −26.0 −23.7
N2BH2 Not observed −13.0 Not observed
N3BH Not observed −0.5 Not observed
BOx Not observed Not observed 1.0
sp2 B Not observed 27.0 Not observed
sp2 B Not observed Not observed 30.0
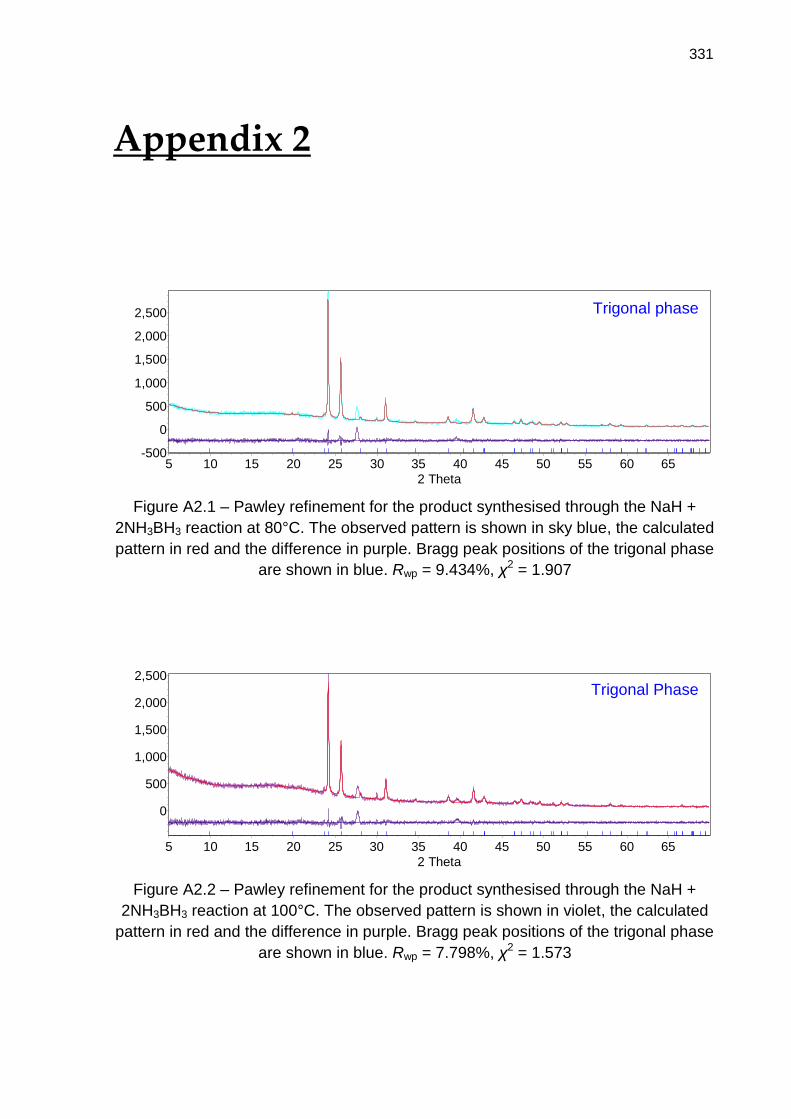
331
Appendix 2
Figure A2.1 – Pawley refinement for the product synthesised through the NaH +
2NH3BH3 reaction at 80°C. The observed pattern is shown in sky blue, the calculated
pattern in red and the difference in purple. Bragg peak positions of the trigonal phase
are shown in blue. Rwp = 9.434%, χ2 = 1.907
Figure A2.2 – Pawley refinement for the product synthesised through the NaH +
2NH3BH3 reaction at 100°C. The observed pattern is shown in violet, the calculated
pattern in red and the difference in purple. Bragg peak positions of the trigonal phase
are shown in blue. Rwp = 7.798%, χ2 = 1.573
2 Theta
6560555045403530252015105
Co
un
ts
2,500
2,000
1,500
1,000
500
0
-500
Na Phase 0.00 %
2 Theta
6560555045403530252015105
Co
un
ts
2,500
2,000
1,500
1,000
500
0
Na Phase 0.00 %
Trigonal phase
Trigonal Phase
phase
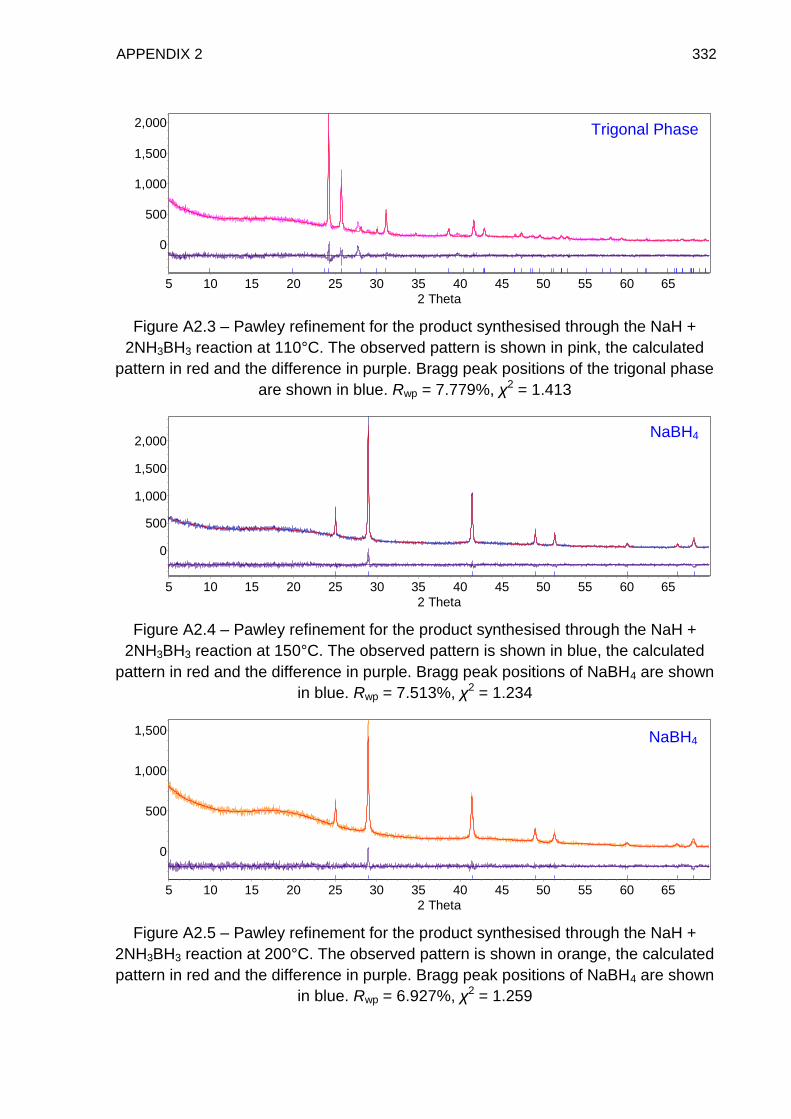
APPENDIX 2 332
Figure A2.3 – Pawley refinement for the product synthesised through the NaH +
2NH3BH3 reaction at 110°C. The observed pattern is shown in pink, the calculated
pattern in red and the difference in purple. Bragg peak positions of the trigonal phase
are shown in blue. Rwp = 7.779%, χ2 = 1.413
Figure A2.4 – Pawley refinement for the product synthesised through the NaH +
2NH3BH3 reaction at 150°C. The observed pattern is shown in blue, the calculated
pattern in red and the difference in purple. Bragg peak positions of NaBH4 are shown
in blue. Rwp = 7.513%, χ2 = 1.234
Figure A2.5 – Pawley refinement for the product synthesised through the NaH +
2NH3BH3 reaction at 200°C. The observed pattern is shown in orange, the calculated
pattern in red and the difference in purple. Bragg peak positions of NaBH4 are shown
in blue. Rwp = 6.927%, χ2 = 1.259
2 Theta
6560555045403530252015105
Co
un
ts
2,000
1,500
1,000
500
0
Na Phase 0.00 %
2 Theta
6560555045403530252015105
Co
un
ts
2,000
1,500
1,000
500
0
NaBH4 100.00 %
2 Theta
6560555045403530252015105
Co
un
ts
1,500
1,000
500
0
NaBH4 100.00 %
Trigonal Phase
NaBH4
NaBH4
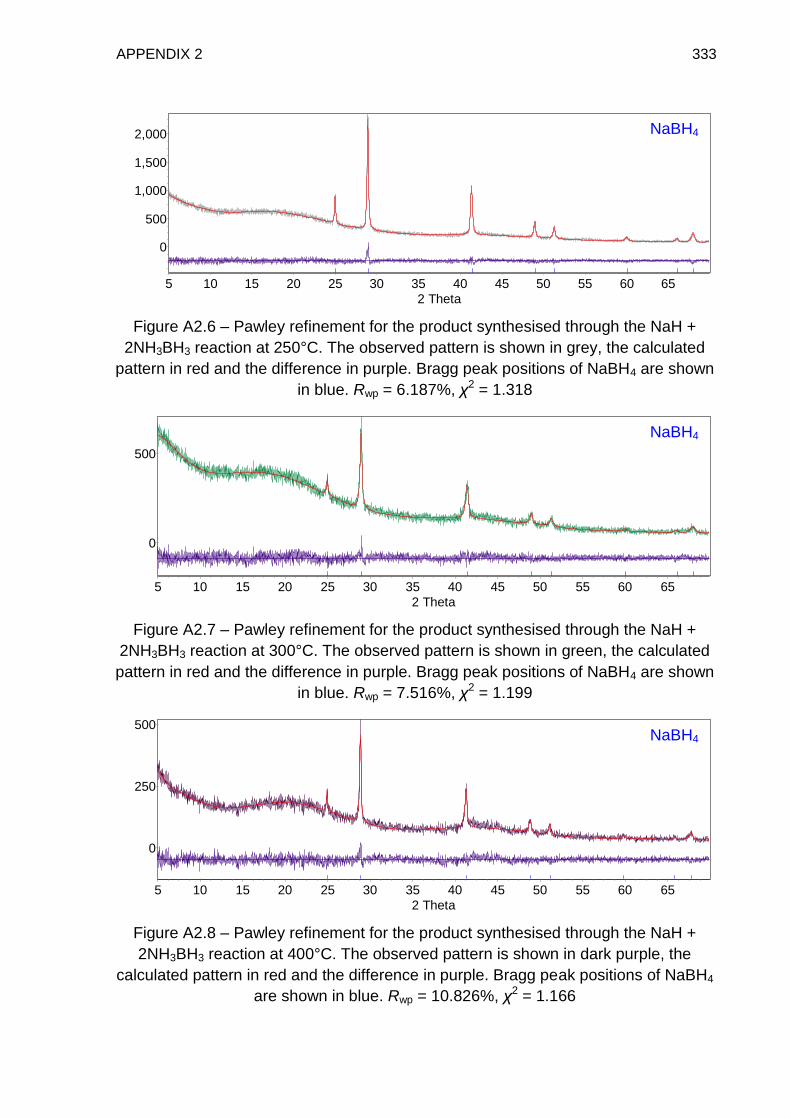
APPENDIX 2 333
Figure A2.6 – Pawley refinement for the product synthesised through the NaH +
2NH3BH3 reaction at 250°C. The observed pattern is shown in grey, the calculated
pattern in red and the difference in purple. Bragg peak positions of NaBH4 are shown
in blue. Rwp = 6.187%, χ2 = 1.318
Figure A2.7 – Pawley refinement for the product synthesised through the NaH +
2NH3BH3 reaction at 300°C. The observed pattern is shown in green, the calculated
pattern in red and the difference in purple. Bragg peak positions of NaBH4 are shown
in blue. Rwp = 7.516%, χ2 = 1.199
Figure A2.8 – Pawley refinement for the product synthesised through the NaH +
2NH3BH3 reaction at 400°C. The observed pattern is shown in dark purple, the
calculated pattern in red and the difference in purple. Bragg peak positions of NaBH4
are shown in blue. Rwp = 10.826%, χ2 = 1.166
2 Theta
6560555045403530252015105
Co
un
ts
2,000
1,500
1,000
500
0
NaBH4 100.00 %
2 Theta
6560555045403530252015105
Co
un
ts
500
0
NaBH4 100.00 %
2 Theta
6560555045403530252015105
Co
un
ts
500
250
0
NaBH4 100.00 %
NaBH4
NaBH4
NaBH4
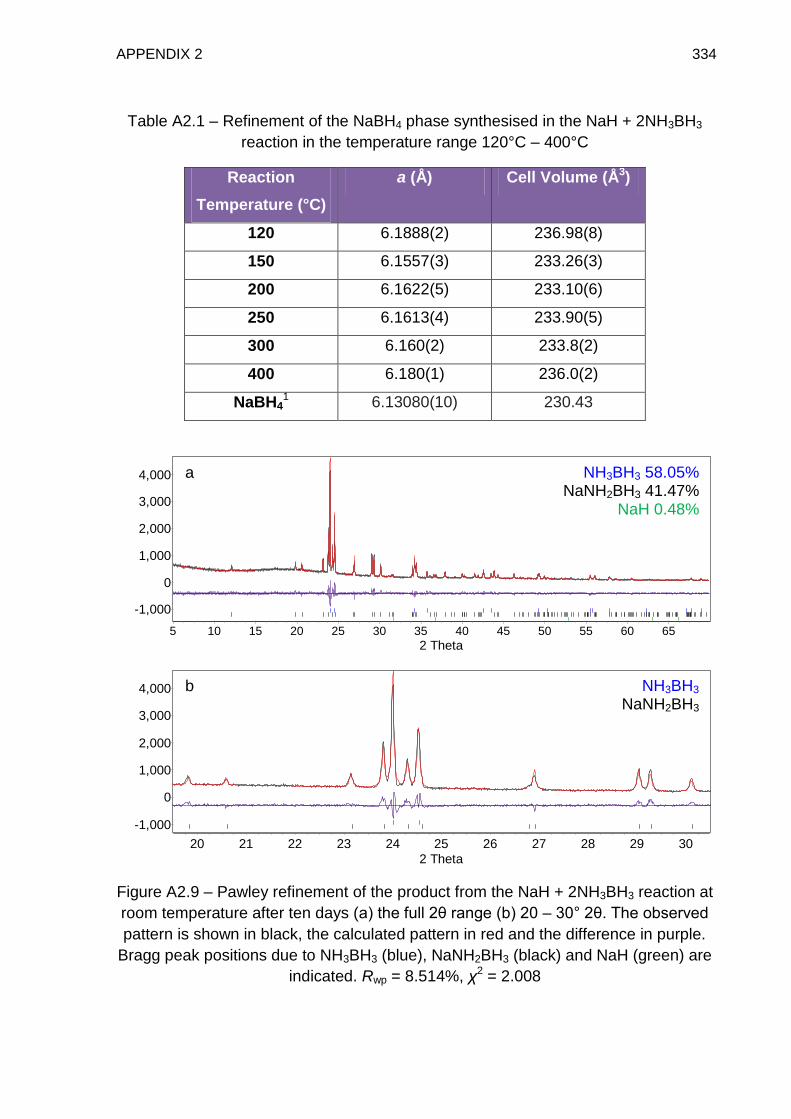
APPENDIX 2 334
Table A2.1 – Refinement of the NaBH4 phase synthesised in the NaH + 2NH3BH3
reaction in the temperature range 120°C – 400°C
Reaction
Temperature (°C)
a (Å) Cell Volume (Å3)
120 6.1888(2) 236.98(8)
150 6.1557(3) 233.26(3)
200 6.1622(5) 233.10(6)
250 6.1613(4) 233.90(5)
300 6.160(2) 233.8(2)
400 6.180(1) 236.0(2)
NaBH41 6.13080(10) 230.43
Figure A2.9 – Pawley refinement of the product from the NaH + 2NH3BH3 reaction at
room temperature after ten days (a) the full 2θ range (b) 20 – 30° 2θ. The observed
pattern is shown in black, the calculated pattern in red and the difference in purple.
Bragg peak positions due to NH3BH3 (blue), NaNH2BH3 (black) and NaH (green) are
indicated. Rwp = 8.514%, χ2 = 2.008
2 Theta6560555045403530252015105
Co
un
ts
4,000
3,000
2,000
1,000
0
-1,000
AB 44.85 %
NaAB 54.86 %
NaH 0.28 %
2 Theta
3029282726252423222120
Co
un
ts
4,000
3,000
2,000
1,000
0
-1,000
AB 44.85 %
NaAB 54.86 %
NaH 0.28 %b
a NH3BH3 58.05% NaNH2BH3 41.47%
NaH 0.48%
NH3BH3
NaNH2BH3
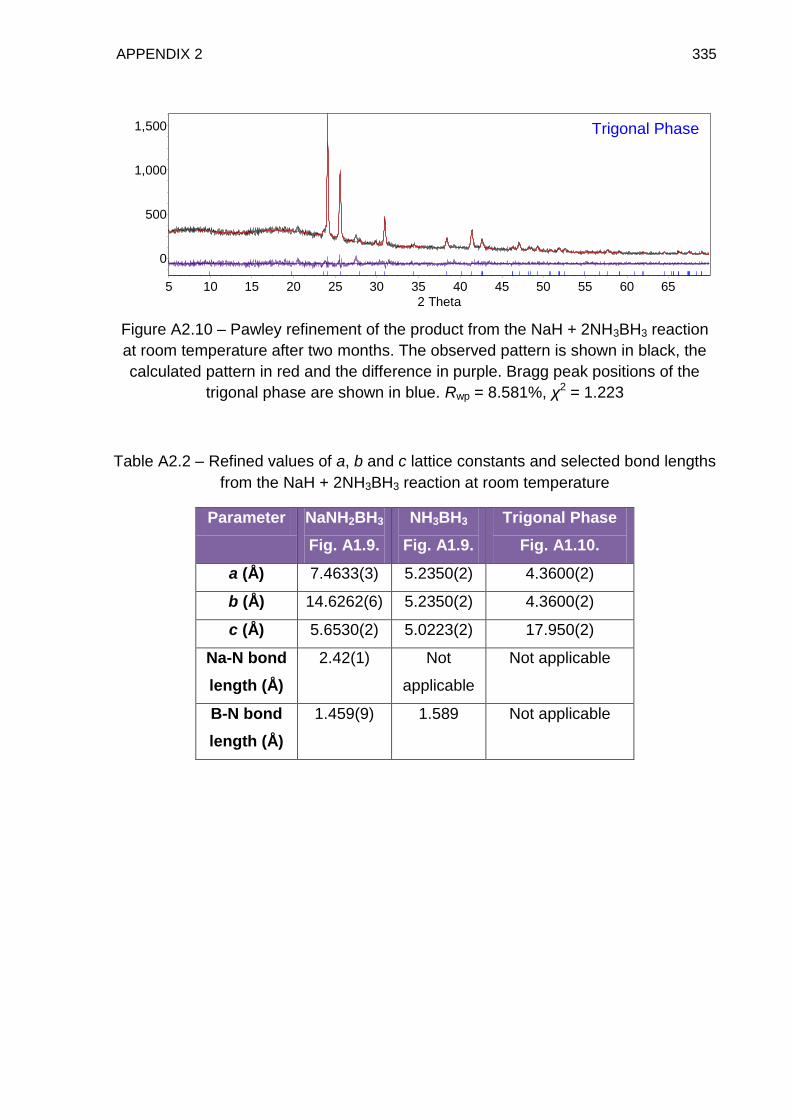
APPENDIX 2 335
Figure A2.10 – Pawley refinement of the product from the NaH + 2NH3BH3 reaction
at room temperature after two months. The observed pattern is shown in black, the
calculated pattern in red and the difference in purple. Bragg peak positions of the
trigonal phase are shown in blue. Rwp = 8.581%, χ2 = 1.223
Table A2.2 – Refined values of a, b and c lattice constants and selected bond lengths
from the NaH + 2NH3BH3 reaction at room temperature
Parameter NaNH2BH3
Fig. A1.9.
NH3BH3
Fig. A1.9.
Trigonal Phase
Fig. A1.10.
a (Å) 7.4633(3) 5.2350(2) 4.3600(2)
b (Å) 14.6262(6) 5.2350(2) 4.3600(2)
c (Å) 5.6530(2) 5.0223(2) 17.950(2)
Na-N bond
length (Å)
2.42(1) Not
applicable
Not applicable
B-N bond
length (Å)
1.459(9) 1.589 Not applicable
2 Theta
6560555045403530252015105
Co
un
ts
1,500
1,000
500
0
Na 1:2 0.00 %
Trigonal Phase
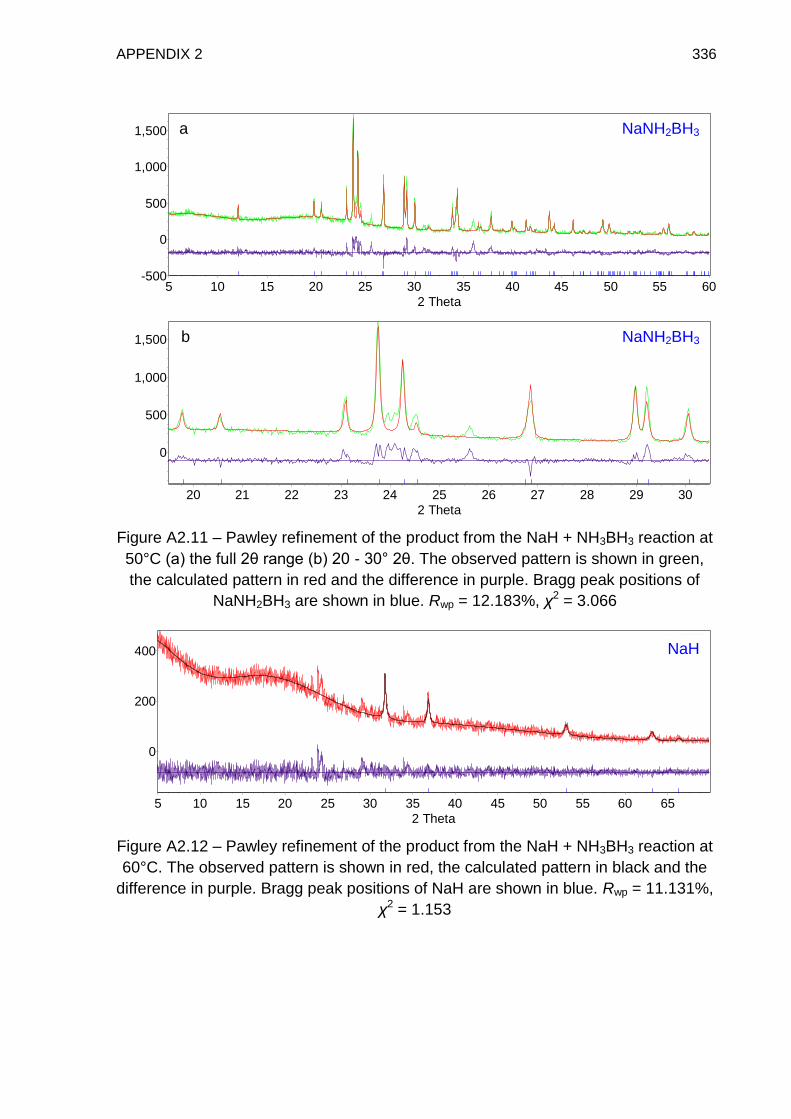
APPENDIX 2 336
Figure A2.11 – Pawley refinement of the product from the NaH + NH3BH3 reaction at
50°C (a) the full 2θ range (b) 20 - 30° 2θ. The observed pattern is shown in green,
the calculated pattern in red and the difference in purple. Bragg peak positions of
NaNH2BH3 are shown in blue. Rwp = 12.183%, χ2 = 3.066
Figure A2.12 – Pawley refinement of the product from the NaH + NH3BH3 reaction at
60°C. The observed pattern is shown in red, the calculated pattern in black and the
difference in purple. Bragg peak positions of NaH are shown in blue. Rwp = 11.131%,
χ2 = 1.153
2 Theta
60555045403530252015105
Co
un
ts
1,500
1,000
500
0
-500
NaAB 100.00 %
2 Theta
3029282726252423222120
Co
un
ts
1,500
1,000
500
0
NaAB 100.00 %
2 Theta
6560555045403530252015105
Co
un
ts
400
200
0
NaH 100.00 %
NaH
NaNH2BH3
NaNH2BH3 b
a
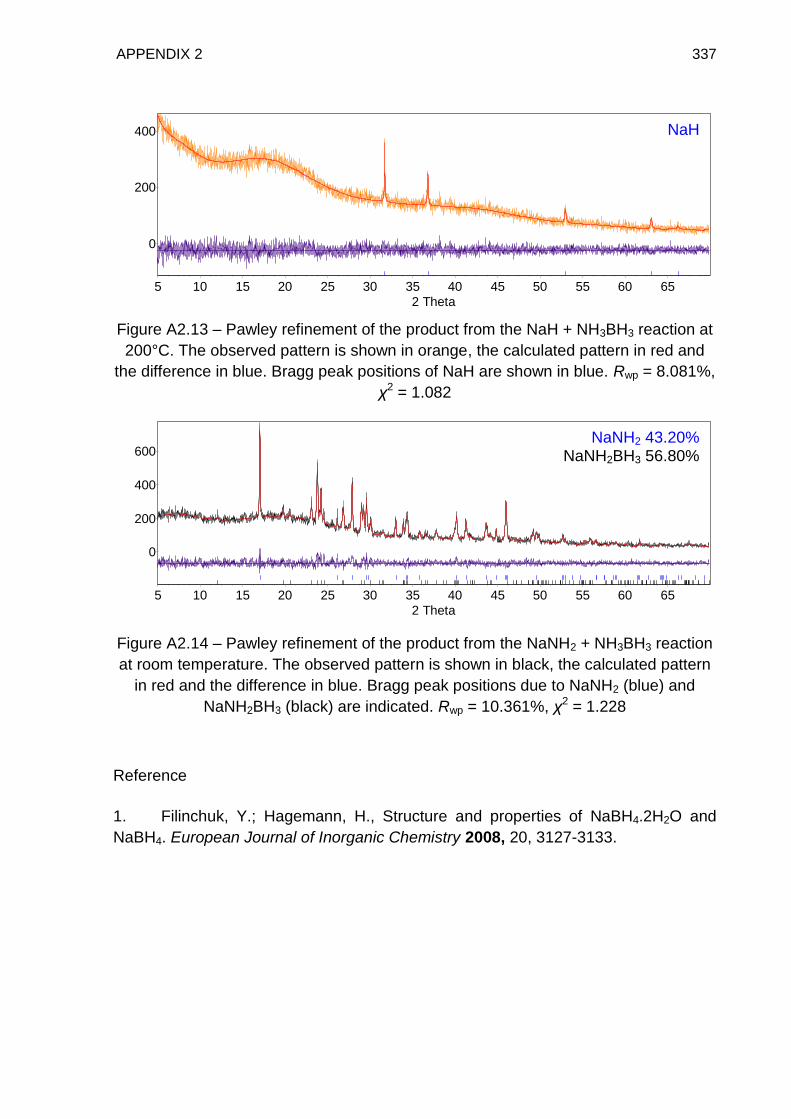
APPENDIX 2 337
Figure A2.13 – Pawley refinement of the product from the NaH + NH3BH3 reaction at
200°C. The observed pattern is shown in orange, the calculated pattern in red and
the difference in blue. Bragg peak positions of NaH are shown in blue. Rwp = 8.081%,
χ2 = 1.082
Figure A2.14 – Pawley refinement of the product from the NaNH2 + NH3BH3 reaction
at room temperature. The observed pattern is shown in black, the calculated pattern
in red and the difference in blue. Bragg peak positions due to NaNH2 (blue) and
NaNH2BH3 (black) are indicated. Rwp = 10.361%, χ2 = 1.228
Reference
1. Filinchuk, Y.; Hagemann, H., Structure and properties of NaBH4.2H2O and
NaBH4. European Journal of Inorganic Chemistry 2008, 20, 3127-3133.
2 Theta
6560555045403530252015105
Co
un
ts
400
200
0
NaH 100.00 %
2 Theta
6560555045403530252015105
Co
un
ts
600
400
200
0
NaNH2 35.94 %
NaAB 64.06 %
NaH
NaNH2 43.20% NaNH2BH3 56.80%
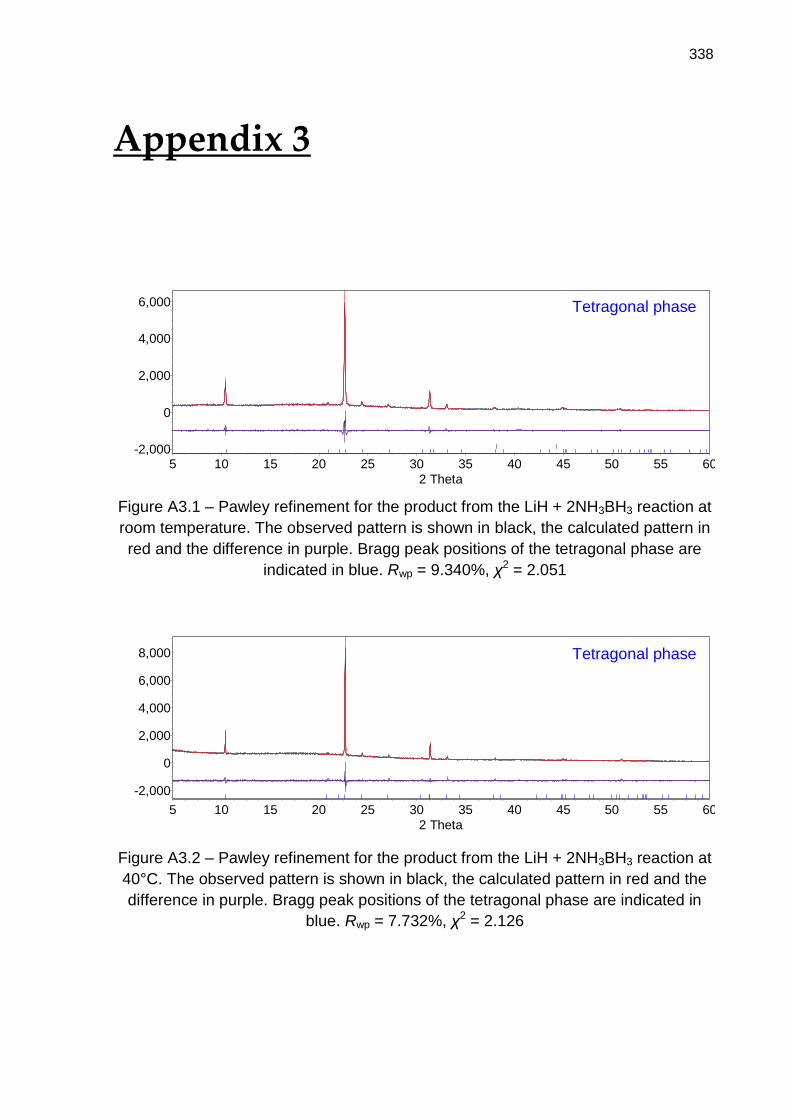
338
Appendix 3
Figure A3.1 – Pawley refinement for the product from the LiH + 2NH3BH3 reaction at
room temperature. The observed pattern is shown in black, the calculated pattern in
red and the difference in purple. Bragg peak positions of the tetragonal phase are
indicated in blue. Rwp = 9.340%, χ2 = 2.051
Figure A3.2 – Pawley refinement for the product from the LiH + 2NH3BH3 reaction at
40°C. The observed pattern is shown in black, the calculated pattern in red and the
difference in purple. Bragg peak positions of the tetragonal phase are indicated in
blue. Rwp = 7.732%, χ2 = 2.126
2 Theta
60555045403530252015105
Counts
6,000
4,000
2,000
0
-2,000
LiH 100.00 %
Li Tet 0.00 %
2 Theta
60555045403530252015105
Counts
8,000
6,000
4,000
2,000
0
-2,000
Li Tet 0.00 %
Tetragonal phase
Tetragonal phase
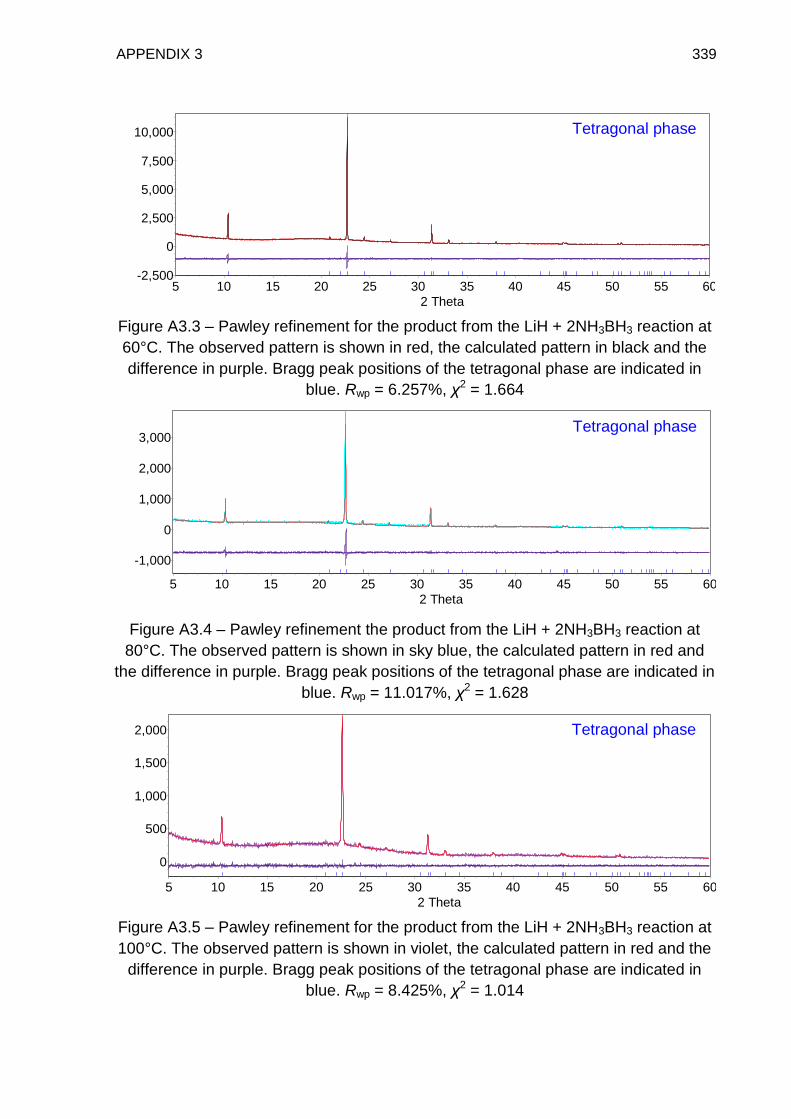
APPENDIX 3 339
Figure A3.3 – Pawley refinement for the product from the LiH + 2NH3BH3 reaction at
60°C. The observed pattern is shown in red, the calculated pattern in black and the
difference in purple. Bragg peak positions of the tetragonal phase are indicated in
blue. Rwp = 6.257%, χ2 = 1.664
Figure A3.4 – Pawley refinement the product from the LiH + 2NH3BH3 reaction at
80°C. The observed pattern is shown in sky blue, the calculated pattern in red and
the difference in purple. Bragg peak positions of the tetragonal phase are indicated in
blue. Rwp = 11.017%, χ2 = 1.628
Figure A3.5 – Pawley refinement for the product from the LiH + 2NH3BH3 reaction at
100°C. The observed pattern is shown in violet, the calculated pattern in red and the
difference in purple. Bragg peak positions of the tetragonal phase are indicated in
blue. Rwp = 8.425%, χ2 = 1.014
2 Theta
60555045403530252015105
Co
un
ts
10,000
7,500
5,000
2,500
0
-2,500
Tet Li 0.00 %
2 Theta
60555045403530252015105
Co
un
ts
3,000
2,000
1,000
0
-1,000
Tet Li 0.00 %
2 Theta
60555045403530252015105
Co
un
ts
2,000
1,500
1,000
500
0
Tet Li 0.00 %
Tetragonal phase
Tetragonal phase
Tetragonal phase
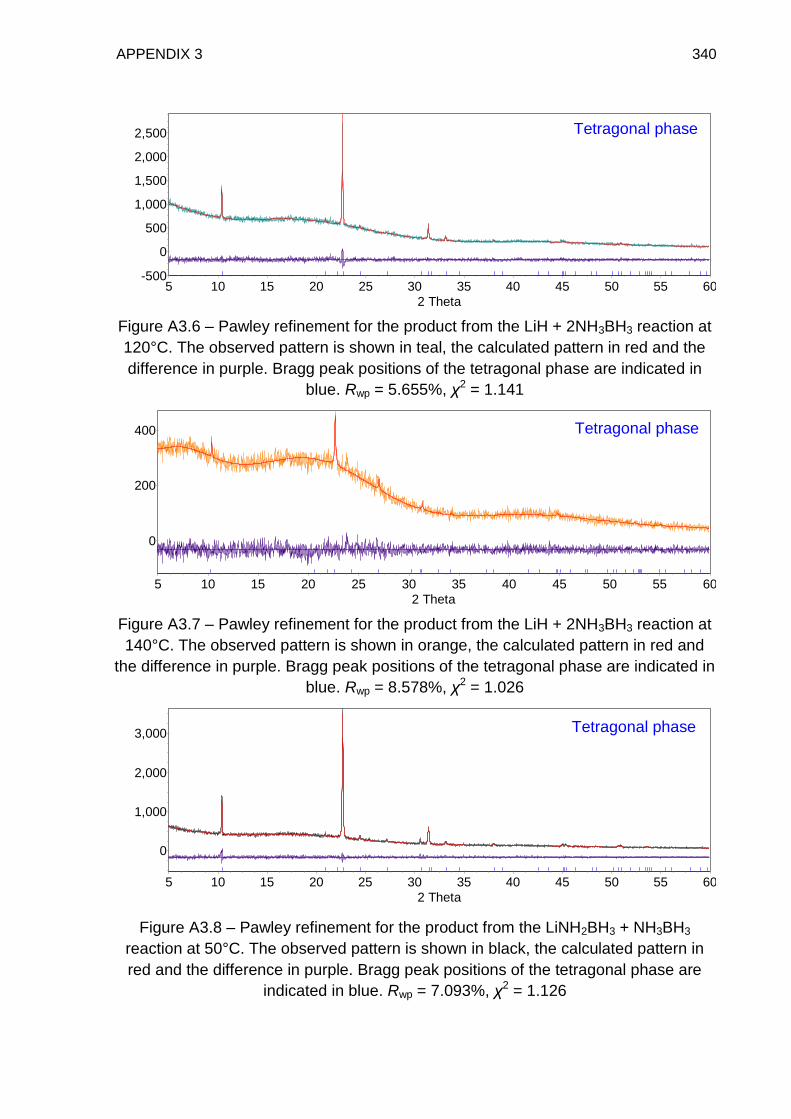
APPENDIX 3 340
Figure A3.6 – Pawley refinement for the product from the LiH + 2NH3BH3 reaction at
120°C. The observed pattern is shown in teal, the calculated pattern in red and the
difference in purple. Bragg peak positions of the tetragonal phase are indicated in
blue. Rwp = 5.655%, χ2 = 1.141
Figure A3.7 – Pawley refinement for the product from the LiH + 2NH3BH3 reaction at
140°C. The observed pattern is shown in orange, the calculated pattern in red and
the difference in purple. Bragg peak positions of the tetragonal phase are indicated in
blue. Rwp = 8.578%, χ2 = 1.026
Figure A3.8 – Pawley refinement for the product from the LiNH2BH3 + NH3BH3
reaction at 50°C. The observed pattern is shown in black, the calculated pattern in
red and the difference in purple. Bragg peak positions of the tetragonal phase are
indicated in blue. Rwp = 7.093%, χ2 = 1.126
2 Theta
60555045403530252015105
Co
un
ts
2,500
2,000
1,500
1,000
500
0
-500
Tet Li 0.00 %
2 Theta
60555045403530252015105
Co
un
ts
400
200
0
Tet Li 0.00 %
2 Theta
60555045403530252015105
Counts
3,000
2,000
1,000
0
Li Tet 0.00 %
Tetragonal phase
Tetragonal phase
Tetragonal phase