Metabolic syndrome is linked to chromosome 7q21 and associated with genetic variants in CD36 and...
10
OBESITY | VOLUME 20 NUMBER 10 | OCTOBER 2012 2083 nature publishing group ARTICLES GENETICS INTRODUCTION Metabolic abnormalities such as obesity, insulin resistance, and hyperinsulinemia, impaired glucose tolerance, dyslipidemia, and hypertension oſten cluster to constitute the metabolic syndrome (MS). e MS is a predictor of both type 2 diabe- tes (T2DM) and coronary heart disease, and its prevalence has been rising alarmingly worldwide. In the United States, more than 47 million people are affected with MS. Specifically, its prevalence is high in minority populations such as Mexican Americans, who had the highest age-adjusted prevalence of MS (~32%) when compared to the non-Hispanic whites, African Americans, and other ethnic groups (1). Added to this burden, over the past 20 years, the prevalence of MS among children and adolescents has also been increasing at epidemic rates in several populations including Hispanics (2). e MS and its components are complex disease condi- tions that are influenced by genetic and environmental factors and their interactions MS can be defined as a single, compos- ite phenotype for genetic analysis using criteria such as the National Cholesterol Education Program/Adult Treatment Panel III (NCEP/ATPIII) recommendations, the most widely used definition in the United States (3,4). In addition to the NCEP/ATPIII criteria, several organizations have proposed different definitions for MS. While the various definitions use similar core components of MS, primarily including the meas- urements of obesity, glucose, lipids, and blood pressure, they Metabolic Syndrome Is Linked to Chromosome 7q21 and Associated With Genetic Variants in CD36 and GNAT3 in Mexican Americans Vidya S. Farook 1 , Sobha Puppala 1 , Jennifer Schneider 1 , Sharon P. Fowler 2 , Geetha Chittoor 1 , Thomas D. Dyer 1 , Hooman Allayee 3 , Shelley A. Cole 1 , Rector Arya 4 , Mary H. Black 3 , Joanne E. Curran 1 , Laura Almasy 1 , Thomas A. Buchanan 5,6 , Christopher P. Jenkinson 7 , Donna M. Lehman 2 , Richard M. Watanabe 3,6 , John Blangero 1 and Ravindranath Duggirala 1 The prevalence of metabolic syndrome (MS) has been rising alarmingly worldwide, including in the United States, but knowledge on specific genetic determinants of MS is very limited. Therefore, we planned to identify the genetic determinants of MS as defined by National Cholesterol Education Program/Adult Treatment Panel III (NCEP/ATPIII) criteria. We performed linkage screen for MS using data from 692 Mexican Americans, who participated in the San Antonio Family Diabetes/Gallbladder Study (SAFDGS). We found strong evidence for linkage of MS on chromosome 7q (LOD = 3.6, empirical P = 6.0 × 10 –5 ), between markers D7S2212 and D7S821. In addition, six chromosomal regions exhibited potential evidence for linkage (LOD ≥1.2) with MS. Furthermore, we examined 29 single-nucleotide polymorphisms (SNPs) from the fatty acid translocase (FAT or CD36, 18 SNPs) gene and guanine nucleotide binding protein, α transducing 3 (GNAT3, 11 SNPs) gene, located within the 1-LOD support interval region for their association with MS and its related traits. Several SNPs were associated with MS and its related traits. Remarkably, rs11760281 in GNAT3 and rs1194197 near CD36 exhibited the strongest associations with MS (P = 0.0003, relative risk (RR) = 1.6 and P = 0.004, RR = 1.7, respectively) and several other related traits. These two variants explained ~18% of the MS linkage evidence on chromosome 7q21, and together conferred approximately threefold increase in MS risk (RR = 2.7). In conclusion, our linkage and subsequent association studies implicate a region on chromosome 7q21 to influence MS in Mexican Americans. Obesity (2012) 20, 2083–2092. doi:10.1038/oby.2012.74 1 Department of Genetics, Texas Biomedical Research Institute (formerly Southwest Foundation for Biomedical Research), San Antonio, Texas, USA; 2 Department of Medicine, Division of Clinical Epidemiology, University of Texas Health Science Center, San Antonio, Texas, USA; 3 Department of Preventive Medicine, Keck School of Medicine of USC, Los Angeles, California, USA; 4 Department of Pediatrics, Division of Endocrinology and Diabetes, University of Texas Health Science Center, San Antonio, Texas, USA; 5 Department of Medicine, Keck School of Medicine of USC, Los Angeles, California, USA; 6 Department of Physiology and Biophysics, Keck School of Medicine of USC, Los Angeles, California, USA; 7 Division of Diabetes, Department of Medicine, University of Texas Health Science Center, San Antonio, Texas, USA. Correspondence: Vidya S. Farook ([email protected]) Received 31 May 2011; accepted 23 February 2012; advance online publication 3 May 2012. doi:10.1038/oby.2012.74
Transcript of Metabolic syndrome is linked to chromosome 7q21 and associated with genetic variants in CD36 and...

obesity | VOLUME 20 NUMBER 10 | OctOBER 2012 2083
nature publishing group articlesGenetics
IntroductIonMetabolic abnormalities such as obesity, insulin resistance, and hyperinsulinemia, impaired glucose tolerance, dyslipidemia, and hypertension often cluster to constitute the metabolic syndrome (MS). The MS is a predictor of both type 2 diabe-tes (T2DM) and coronary heart disease, and its prevalence has been rising alarmingly worldwide. In the United States, more than 47 million people are affected with MS. Specifically, its prevalence is high in minority populations such as Mexican Americans, who had the highest age-adjusted prevalence of MS (~32%) when compared to the non-Hispanic whites, African Americans, and other ethnic groups (1). Added to this burden, over the past 20 years, the prevalence of MS among children
and adolescents has also been increasing at epidemic rates in several populations including Hispanics (2).
The MS and its components are complex disease condi-tions that are influenced by genetic and environmental factors and their interactions MS can be defined as a single, compos-ite phenotype for genetic analysis using criteria such as the National Cholesterol Education Program/Adult Treatment Panel III (NCEP/ATPIII) recommendations, the most widely used definition in the United States (3,4). In addition to the NCEP/ATPIII criteria, several organizations have proposed different definitions for MS. While the various definitions use similar core components of MS, primarily including the meas-urements of obesity, glucose, lipids, and blood pressure, they
Metabolic Syndrome Is Linked to chromosome 7q21 and Associated With Genetic Variants in CD36 and GNAT3 in Mexican AmericansVidya S. Farook1, Sobha Puppala1, Jennifer Schneider1, Sharon P. Fowler2, Geetha Chittoor1, Thomas D. Dyer1, Hooman Allayee3, Shelley A. Cole1, Rector Arya4, Mary H. Black3, Joanne E. Curran1, Laura Almasy1, Thomas A. Buchanan5,6, Christopher P. Jenkinson7, Donna M. Lehman2, Richard M. Watanabe3,6, John Blangero1 and Ravindranath Duggirala1
The prevalence of metabolic syndrome (MS) has been rising alarmingly worldwide, including in the United States, but knowledge on specific genetic determinants of MS is very limited. Therefore, we planned to identify the genetic determinants of MS as defined by National Cholesterol Education Program/Adult Treatment Panel III (NCEP/ATPIII) criteria. We performed linkage screen for MS using data from 692 Mexican Americans, who participated in the San Antonio Family Diabetes/Gallbladder Study (SAFDGS). We found strong evidence for linkage of MS on chromosome 7q (LOD = 3.6, empirical P = 6.0 × 10⁻⁵), between markers D7S2212 and D7S821. In addition, six chromosomal regions exhibited potential evidence for linkage (LOD ≥1.2) with MS. Furthermore, we examined 29 single-nucleotide polymorphisms (SNPs) from the fatty acid translocase (FAT or CD36, 18 SNPs) gene and guanine nucleotide binding protein, α transducing 3 (GNAT3, 11 SNPs) gene, located within the 1-LOD support interval region for their association with MS and its related traits. Several SNPs were associated with MS and its related traits. Remarkably, rs11760281 in GNAT3 and rs1194197 near CD36 exhibited the strongest associations with MS (P = 0.0003, relative risk (RR) = 1.6 and P = 0.004, RR = 1.7, respectively) and several other related traits. These two variants explained ~18% of the MS linkage evidence on chromosome 7q21, and together conferred approximately threefold increase in MS risk (RR = 2.7). In conclusion, our linkage and subsequent association studies implicate a region on chromosome 7q21 to influence MS in Mexican Americans.
Obesity (2012) 20, 2083–2092. doi:10.1038/oby.2012.74
1Department of Genetics, Texas Biomedical Research Institute (formerly Southwest Foundation for Biomedical Research), San Antonio, Texas, USA; 2Department of Medicine, Division of Clinical Epidemiology, University of Texas Health Science Center, San Antonio, Texas, USA; 3Department of Preventive Medicine, Keck School of Medicine of USC, Los Angeles, California, USA; 4Department of Pediatrics, Division of Endocrinology and Diabetes, University of Texas Health Science Center, San Antonio, Texas, USA; 5Department of Medicine, Keck School of Medicine of USC, Los Angeles, California, USA; 6Department of Physiology and Biophysics, Keck School of Medicine of USC, Los Angeles, California, USA; 7Division of Diabetes, Department of Medicine, University of Texas Health Science Center, San Antonio, Texas, USA. Correspondence: Vidya S. Farook ([email protected])
Received 31 May 2011; accepted 23 February 2012; advance online publication 3 May 2012. doi:10.1038/oby.2012.74
2084 VOLUME 20 NUMBER 10 | OctOBER 2012 | www.obesityjournal.org
articlesGenetics
differ in the number of traits and the cutoff points required for the diagnosis. Despite certain caveats, several studies have used the NCEP/ATPIII definition for its simplicity, in the context of clinical practice and epidemiological investigations (5); most importantly, as noted by Grundy et al. (4), it avoids emphasis on a single cause.
Several genome-wide linkage and association studies have been performed to understand the genetic basis of the com-ponents of MS by using a number of analytical tools such as multivariate genetic analysis and factor analysis (6–9). Such studies have identified several genetic regions linked to MS-related traits, but showing limited concordance in their results (10). In contrast to the above approaches, a single, com-posite MS phenotype using the NCEP/ATPIII or other criteria can be used to identify genetic regions with potential common genetic influences on MS; however, there have been a few such studies (10,11).
Therefore, the aim of our study was to identify the suscep-tibility loci for MS using the NCEP/ATPIII definition in a Mexican American population who are at high risk for the development of MS. Here, we report the results of our genome-wide linkage screen for MS performed by using the multipoint variance components (VC) linkage analysis and the phenotypic and genotypic (~10 cM map) data collected from the Mexican American individuals who participated in our San Antonio Family Diabetes/Gallbladder Study (SAFDGS). In addition, we report the results of our preliminary MS association study performed by examining the genetic variants in two of the positional candidate genes, which are physically close to each other, located within the 1-LOD support interval region of our MS linkage signal on chromosome 7q.
Methods and ProceduressaFdGsPhenotypic and genotypic data for the present study were obtained from about 720 individuals from 39 low-income Mexican American families, who were recruited during the years 1998 through 2001 for the San Antonio Family Gallbladder Study (SAFGS), a follow-up and extension of the San Antonio Family Diabetes Study (SAFDS). These studies are collectively referred to as the SAFDGS and the particulars and proce-dures of the SAFDGS participant’s recruitment and data collection have been detailed elsewhere (12).
Phenotype dataBlood samples from the participants were obtained after a 12-h fast, and measured for various metabolic parameters including glucose concentrations, triglycerides, high-density lipoprotein cholesterol (HDL-C) levels at the Frederic C. Bartter General Clinical Research Center (GCRC) laboratory, South Texas Veterans Healthcare System, Audie L. Murphy Division, San Antonio, as described elsewhere (12). Blood samples were collected again 2-h after a standardized oral glucose load for plasma glucose measurements. In addition to the collection of demographic and medical history information, the anthropometric (height, weight, and waist circumference) and blood pressure (systolic and diastolic blood pressure) data were collected using standardized protocols (12). T2DM was diagnosed in accordance with the 1999 cri-teria of the World Health Organization. Also, individuals who did not meet these criteria but reported that they were under treatment with either oral antidiabetic agents or insulin and gave a history of diabetes were considered to have T2DM (12).
The MS was defined in accordance with NCEP/ATPIII criteria which use the presence of at least three or more of the following five risk factors: increased waist circumference (>102 cm in men and >88 cm in women), hypertriglyceridemia (≥150 mg/dl), low HDL-C levels (<40 mg/dl in men and <50 mg/dl in women), hypertension (≥130/85 mm Hg or individu-als who were on hypertensive medication with normal blood pressure values), and high-fasting glucose concentrations (≥110 mg/dl or a diag-nosis of T2DM, as defined above) (3). Subsequently, the NCEP/ATPIII definition has changed the threshold for high-fasting glucose values to ≥100 mg/dl, in accordance with the ADA recommendation for impaired fasting glucose (4,13). In the present study, although we are aware of this change, we have used the earlier definition which uses the threshold for high-fasting glucose values ≥110 mg/dl (NCEP/ATPIII, 2001), for the purpose of comparison with other studies. However, we have also reanalyzed the data with the newer threshold for impaired fasting glucose (i.e., ≥100 mg/dl).
Genotype dataThe genotypic data and genetic maps used for this study were described in detail previously (12). Briefly, we used the genotypic data (i.e., ~10 cM map) generated by the Center for Inherited Disease Research (CIDR) that contained information from 382 highly polymorphic autosomal markers. The marker genotyping errors and the pedigree discrepancies were resolved using analytical techniques as implemented in programs Simwalk2 and PREST (12). The Marshfield genetic maps were used, and the multipoint identical-by-descent matrices given a number of genetic markers (map distance in Haldane cM) were calculated using Markov chain Monte Carlo methods implemented in the program Loki (12).
Positional candidate genes, snP identification, selection, and genotypingAs part of our preliminary screening of positional candidate genes for identifying the potential functional variants within the 1 LOD-unit support interval surrounding the MS linkage peak on chromosome 7q21, the fatty acid translocase (FAT; also called leukocyte differentia-tion antigen CD36; MIM 173510) gene with potential functional rel-evance to MS and its flanking gene guanine nucleotide binding protein, α-transducing 3 (GNAT3; MIM 139395) were chosen for initial associa-tion studies. We performed partial resequencing (coding exons, includ-ing their flanking regions, 5′-UTRs, 3′-UTRs, and ~1 kb of the putative promoter regions of the reported alternatively spliced transcripts; 14) of the CD36 gene. Sequencing was performed by Polymorphic DNA Technologies (Alameda, CA) from 30 SAFDGS subjects, who contrib-uted positively to the evidence for linkage of MS on chromosome 7q21. Briefly, primers were designed for the above mentioned regions based on the genomic sequences (NCBI Build36) of the alternative transcripts NM_001001547; AK129899; NM _001001548; AK096858; NM_0072. NA10791. Using conventional PCR amplification these regions were amplified and sequenced in both directions using Big Dye Terminator system on ABI 3730xl automated sequencers. DNA from chromosome 7 specific somatic cell hybrid was used in all the sequencing reactions as a “hemizygous” nonpolymorphic control representing a single allelic version of all variants on this chromosome. The sequencing results of all these 30 subjects, sent as chromatograms by the company were aligned, visualized and compared against the reference sequence, to identify the sequence variations between individuals, using software Sequencher version 3 (Gene Codes, Ann Arbor, MI). As a quality control one encrypted duplicate was included in all the sequencing reactions which showed 100% concordance in the sequences. All the identified sequence variants were confirmed with the chromatogram sequences derived from the other direction.
Partial resequencing of CD36 gene and snP identificationWe identified 22 SNPs, of which one was unique to our study popula-tion. Among the 22 SNPs, 14 SNPs which were polymorphic and for whom probes were designable were chosen for genotyping. In addition, 5 SNPs in the CD36 gene and 11 SNPs in the GNAT3 gene available in

obesity | VOLUME 20 NUMBER 10 | OctOBER 2012 2085
articlesGenetics
the public SNP database were chosen for genotyping to assure adequate coverage of the locus. All together, 30 single-nucleotide polymorphisms (SNPs) were examined.
Genotyping was performed in ~720 SAFDGS subjects by the PCR-based, 5′ nuclease Taqman allelic discrimination method, employed by Applied Biosystems’s (ABI) TaqMan platform per the company’s protocol (Foster City, CA). Following PCR amplification, end-point fluorescence was read in the ABI’s Primer 7900HT sequence detection system and genotypes were assigned using SDS2.1 Allelic Discrimination Software. Each analysis included negative controls with no DNA and 10% dupli-cated samples (randomly selected and genotyped) for reproducibility.
Vc linkage analysisThe VC approach uses information from all possible biological relation-ships simultaneously in an attempt to disentangle the genetic architec-ture of a quantitative trait. The VC method was extended to analyze the dichotomous trait MS using a liability or threshold model. The VC (i.e., heritability attributed to the susceptibility locus and heritability attrib-uted to the residual additive genetic effects), and covariates for MS (i.e., age) were estimated simultaneously in likelihood terms. Since sex infor-mation was used for the definition of certain risk factors of MS, it was not considered as a covariate for the genetic analysis. The hypothesis of no linkage (i.e., h2
q = 0) was tested by comparing the likelihood of this restricted model with that of a model in which the parameter h2
q was estimated. Twice the difference in ln likelihoods of these two models yields a test statistic that is asymptotically distributed as a ½:½ mixture of a χ2
1 and a point mass at zero. To obtain lod scores, the ln likeli-hood values were converted into values of log10. A LOD score of 3.0 and above was considered as strong or significant evidence in support of linkage (15). For the purpose of discussion, other genetic regions across the genome with LOD ≥1.2 were considered as evidence for potential linkage.
Because the SAFDGS families were ascertained on T2DM probands, as a conservative approach, all our genetic analyses incorporated correc-tion for ascertainment bias by computing the likelihood of a pedigree conditional on the phenotype (i.e., MS) of the proband. To verify our major MS linkage finding on chromosome 7q, we performed simulation analysis to determine the empirical P value, using information obtained from 100,000 replicates. All analytical procedures are incorporated in the program SOLAR as described elsewhere (12).
association analysisWe performed association analysis of the SNP data with MS and vari-ous MS-related traits, using the measured genotype analysis (MGA) and Bayesian quantitative trait nucleotide (BQTN) analysis. The geno-typic data were checked for Mendelian consistency using the program SimWalk2 (16). This program employs Markov Chain Monte Carlo and simulated annealing algorithms to assign probabilities of mistyping to each genotype that will be used to make decisions about the appropri-ate genotypes to blank. This approach also takes into account the low likelihood of recombination events within the gene; thus, can be used to identify spurious recombinations due to typing error. Using SOLAR, the allele frequencies were calculated, SNPs were tested for Hardy–Weinberg equilibrium, and linkage disequilibrium (LD) between SNP pairs was estimated using r2 values.
MGaIn the VC approach described above, VC are modeled as random effects, whereas the effects of measured covariates are modeled as fixed effects on the trait mean. In the MGA, the marker genotypes are gener-ally incorporated in the mean effects model as a measured covariate assuming additively of allelic effects (17). The maximum likelihood techniques were used to estimate the VCs, the association parameters, and the other covariate effects (e.g., age and sex). The hypothesis of no association was tested by comparing likelihood of a model in which the effect of measured genotype was estimated with a model where the
effect of measured genotype was fixed at zero. Before performing MGA, the presence of population stratification was tested using quantitative transmission disequilibrium test, as implemented in SOLAR. With regard to the dichotomous traits, the threshold-based liability model was projected onto the dichotomous outcome in a manner directly analogous to logistic regression to obtain genotypic relative risks (RRs). These calculations of genotype-specific prevalence were obtained from the estimated liability model using a standard normal distribution function. In reference to the quantitative traits, we estimated mean trait values by genotype category. The program SOLAR was used to carry out these analyses.
BQtn analysisThe BQTN technique was used to analyze SNPs simultaneously to find the nucleotide variants responsible for influencing MS, using a meas-ured genotype approach (18). This technique can be used with a set of SNP data from a candidate gene to identify the sequence variants that are either functional or that exhibit the highest disequilibria with the true functional sites and is detailed elsewhere (18). Given that a can-didate gene may contain a number of SNPs that could generate several possible competing models of QTN action, a Bayesian model averaging approach was used to analyze the SNP data simultaneously in order to estimate the probability that each SNP has an effect on the MS pheno-type. The BQTN approach is described in detail elsewhere (18).
conditional linkage/association analysisTo determine whether the associated SNP(s) account for the MS link-age signal, we combined the QTN analysis with our identity-by- descent-based VC linkage analysis (17). If a variant or set of variants is/are responsible for the observed linkage signal, linkage analysis conditional on a fixed-effect measured genotype analysis of the polymorphism will yield an expected LOD score near zero. Alternatively, if the associated polymorphism is in less than complete LD with the true functional site, linkage analysis will generally yield a non-zero LOD score. The analytical procedures described above are implemented in the program SOLAR.
resultsThe clinical characteristics of the 692 individuals, for whom information on MS (NCEP/ATPIII) were available, are shown in Table 1. The mean age (±SD) was 44.5 (±16.3) years; and ~61% of the study sample were females. The prevalence of MS in our family data was 43.5% and the prevalence rates of its components ranged from 33.4% (high-fasting glucose) to 60.1% (abdominal obesity) (Table 1).
Multipoint linkage analysisPrior to conducting linkage analysis, after accounting for the age effects on MS, we detected a high heritability for MS (h2 = 0.51 ± 0.10). The results of our genome-wide linkage screen are provided in Table 2 and Figure 1. The strongest evi-dence for linkage of MS (LOD = 3.6; empirical P = 6.0 × 10⁻⁵) occurred on chromosome 7q, between markers D7S2212 and D7S821, after accounting for age influences (Figures 1 and 2). Of the examined 39 families, 22 families (56.4%) positively contributed to this linkage signal, and the evidence for link-age in this subset of 22 families is much stronger (LOD = 7.8). As shown in Table 3, all of the five MS risk factors as defined by NCEP/ATPIII criteria in the total data set, exhibited some evidence of linkage at this location. For the purpose of com-parison, evidence for linkage of the quantitative measures of these dichotomized risk factors was also reported in Table 3.

2086 VOLUME 20 NUMBER 10 | OctOBER 2012 | www.obesityjournal.org
articlesGenetics
In addition, six genetic locations representing 5 chromo-somes across the genome exhibited potential evidence for linkage (i.e., LOD ≥1.2) with MS (Table 2 and Figure 1). The 1 LOD-unit support intervals surrounding the MS linkage peak on chromosome 7q is flanked by the markers D7S2490 and D7S2539. This chromosomal region is ~21 cM long and harbors about 123 genes (NCBI Build 36.2). Of the positional candidate genes most relevant to MS in this region, the CD36 gene (MIM 173510) and its adjacent gene GNAT3 were cho-sen for our preliminary association studies in order to identify
the potential functional variant(s) that could relate to our MS linkage signal. The reanalysis of our data using the newer threshold for impaired fasting glucose (i.e., ≥ 100 mg/dl) was found to be moderately heritable (h2 = 0.43 ± 0.10). The strongest evidence for linkage (LOD = 3.1) again occurred at the 7q chromosomal region, between markers D7S2212 and D7S821, although it was attenuated slightly. Such an observa-tion suggests that the threshold for impaired fasting glucose (i.e., ≥110 mg/dl) used for the original analysis was more informative for linkage.
association analysis and conditional linkage/association analysisAs described earlier, 19 SNPs in or near the CD36 gene and 11 SNPs in the GNAT3 gene were genotyped in our entire sam-ple of approximately 720 individuals. We tested all the 30 SNP data for Hardy–Weinberg equilibrium, in turn finding that only one SNP in theCD36 gene (rs13230419) deviated from the Hardy–Weinberg equilibrium expectation. This SNP was thus excluded from further analysis. The particulars of the 29 SNPs (i.e., CD36 = 18 and GNAT3 = 11) including their physical location and minor allele frequencies considered for further analysis are reported in Table 4. The LD patterns between 18 SNPs in CD36 are depicted in Supplementary Figure S1 online. The pair wise LD (r2) for the 18 SNPs examined in CD36 ranged between 0 and 1, and the following SNP pairs exhibited strong LD (r2 > 0.80): rs57312550 and rs59637606 (r2 = 1.0), rs7755-rs1049673 (r2 = 0.99), rs1194182-rs1761667 (r2 = 0.97),
table 2 chromosomal regions linked to Ms with lod scores ≥1.2 based on multipoint linkage analyses
Marker regionDistance from
p-ter (cM)aChromosomal
locationMaximum
LODb
D2S1360 38 2p24.2 1.2
D2S1328 133 2q14.3 1.3
D5S2845 36 5p14.3 1.5
D7S2212-D7S821/GATA5D08
95–109 7q21.11–7q21.3
3.6
D8S1136/GATA41A01
82 8q13.1 2.6
D11S1999 17 11p15.4 2.3
D13S1265-D13S285 99–111 13q33.3–13q34
1.6
MS, metabolic syndrome.aMarshfield data (Kosambi cM). bMS adjusted for covariate effects of age.
table 1 characteristics of the 692 saFdGs participants
Mean ± SD or %
Total (N = 692) Males (N = 270) Females (N = 422)
Quantitative MS componentsa
Mean age (years) 44.5 ± 16.3 44.2 ± 16.7 44.8 ± 16.1
Waist circumference (mm) 1,003.0 ± 161.7 1,029.7 ± 146.0 976.2 ± 177.4
Fasting glucose (mg/dl) 115.9 ± 49.2 116.2 ± 47.4 115.5 ± 51.0
Systolic blood pressure (mm Hg) 127.7 ± 17.4 130.4 ± 15.4 126.0 ± 18.4
Diastolic blood pressure (mm Hg) 70.3 ± 9.7 72.1 ± 9.6 68.8 ± 9.4
Triglycerides (mg/dl) 163.8 ± 170.7 184.4 ± 241.6 143.2 ± 99.8
High-density lipoprotein cholesterol (mg/dl) 45.5 ± 11.9 43.0 ± 11.2 47.9 ± 12.6
Dichotomous MS componentsaand MS
Abdominal obesity 60.1 45.6 69.4
High-fasting glucose 33.4 35.2 32.2
High-blood pressure 47.5 55.9 42.0
High triglycerides 37.1 44.5 32.5
Low HDL-C 53.8 43.4 60.3
Metabolic syndromeb 43.5 43.3 43.6
HDL-C, high-density lipoprotein cholesterol; MS, metabolic syndrome; NCEP/ATPIII, National Cholesterol Education Program/Adult Treatment Panel III; SAFDGS, San Antonio Family Diabetes/Gallbladder Study.aThe sample size used for the lipid traits were slightly different from the 692 as shown below: Triglycerides/high density lipoprotein cholesterol = total: 665/663; males: 256/256; females: 409/407. bThe MS was defined in accordance with NCEP/ATPIII criteria (2001). The criteria uses the presence of at least three or more of the follow-ing five risk factors: increased waist circumference (>102 cm in men and >88 cm in women), hypertriglyceridemia (≥150 mg/dl), low HDL-C levels (<40 mg/dl in men and <50 mg/dl in women), hypertension (≥130/85 mm Hg or individuals who were on hypertensive medication with normal blood pressure values), and high-fasting glucose concentrations (≥110 mg/dl or a diagnosis of T2DM as described in the text).

obesity | VOLUME 20 NUMBER 10 | OctOBER 2012 2087
articlesGenetics
1 2 3 4 5 6 7 8 9 10 11cM
cM
0
50
100
150
200
250
300
0
12 13 14 15 16 17 18 19 20 21 22
1 2LOD
0 1 2LOD
0 1 2LOD
0 1 2 3 4LOD
0 1 2 3LOD
0 1 2 3LOD
0
50
100
150
200
Figure 1 Multipoint linkage findings of metabolic syndrome in Mexican Americans.
4
D7S
2477
D7S
3056
D7S
513
D7S
3051D
7S1802
D7S
1808
D7S
817
D7S
2846
D7S
1818
D7S
3046
D7S
2204D
7S2212
D7S
821D
7S1799
D7S
3061
D7S
1804
D7S
1824D
7S2195
D7S
3070
D7S
3058
D7S
559
3
M1 (without association)
M2 (with association)
2
LOD
1
00 50 100
Chromosome position (cM)150 200
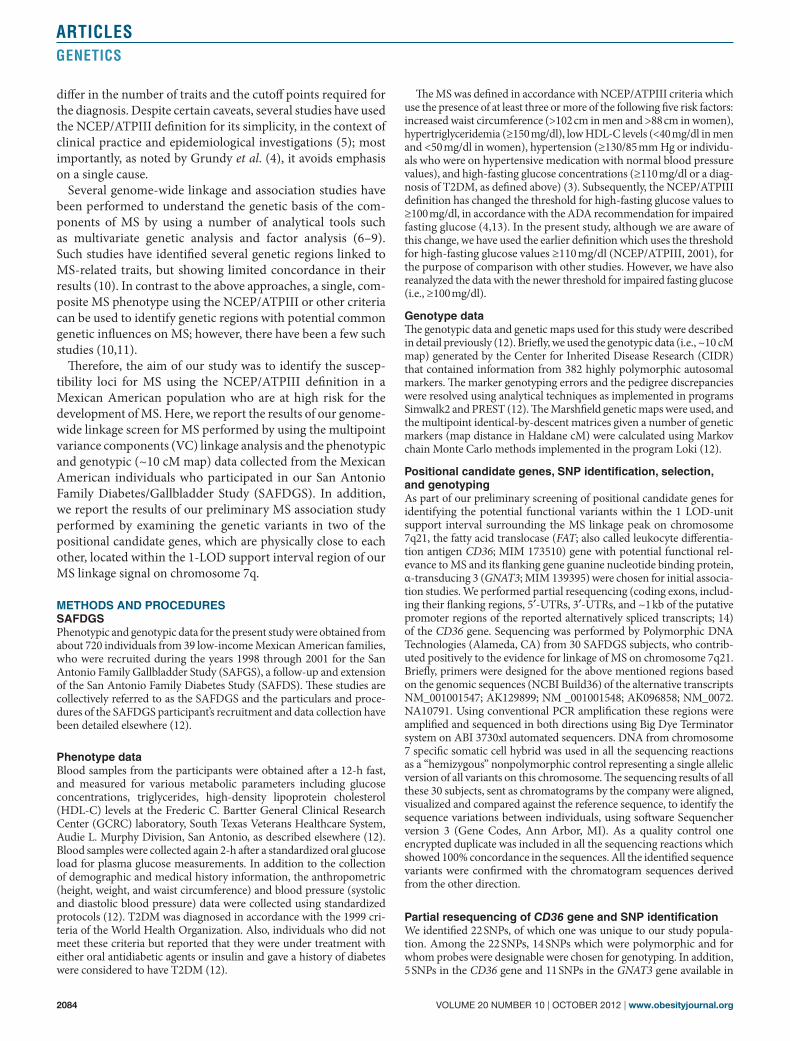
Figure 2 Linkage* of MS on chromosome 7q21 without (M1) and with (M2) associations involving rs11760281 (GNAT3) and rs1194197 (CD36). *Reanalyzed data (N = 648), given the availability of rs11760281 and rs1194197 marker data.

2088 VOLUME 20 NUMBER 10 | OctOBER 2012 | www.obesityjournal.org
articlesGenetics
rs2366855-rs1049654 (r2 = 0.88), and rs2151916-rs997906 (r2 = 0.86). The LD patterns between 11 SNPs in GNAT3 are shown in Supplementary Figure S2 online. The range of pair wise LD observed for the 11 SNPs in GNAT3 was between 0 and 0.93. The following SNP pairs showed strong pair wise LD (r2 > 0.80): rs2944398-rs799929 (r2 = 0.93), rs1473122-rs799929 (r2 = 0.90), rs6467212-rs1524600 (r2 = 0.90), and rs2944398-rs1473122 (r2 = 0.84).
Association between MS and SNPs in CD36 and GNAT3 was examined using MGA, and the presence of population strati-fication was tested by performing quantitative transmission disequilibrium test prior to MGA. There was no evidence for the presence of population stratification. The nominally signif-icant results (P ≤ 0.05) of our association analysis are reported in Table 4. Briefly, among the 18 SNPs examined in CD36, 4 were associated with MS (rs1194197: P = 0.0044; rs1194182: P = 0.0164; rs1761667: P = 0.0431; and rs3173798: P = 0.0481), although the markers rs1194182 and rs1761667 were found to be in strong LD (r2 = 0.97). Of the 11 SNPs examined in GNAT3, 5 exhibited nominally significant associations with MS (rs799975: P = 0.0414; rs2944398: P = 0.0326; rs6942728: P = 0.0437; rs1473122: P = 0.0271; and rs11760281: P = 0.0003). As shown in Table 4, the markers rs2944398, rs1473122, and rs799929 were in strong LD (r2 ≥ 0.84). To address the issue of multiple testing, given the LD patterns among the exam-ined SNPs, an effective number of SNPs was obtained using the method of Li and Ji (19) to derive a P value adjusted for multiple testing. The effective number of SNPs was 17, and the required significance threshold was 0.0030. Thus, the observed associa-tion between MS and rs11760281 remained significant after correction for multiple testing and the association between MS and rs1194197 appeared to exhibit a similar trend, but failed to meet the required statistical significance threshold.
Subsequently, we performed BQTN analysis on our SNP data from both CD36 and GNAT3 genes simultaneously. Models which used rs1194197 and rs11760281 provided the strongest
evidence for associations with the estimated probability of 0.78 and 0.77, respectively. As stated above, these were the two markers which exhibited relatively strong associations with MS. The minor allele A of marker rs11760281 and the major allele T of marker rs1194197 were associated with increased risk for MS. The RR associated with these markers were esti-mated to be 1.6 (rs11760281) and 1.7 (rs1194197), respectively. These two variants together conferred an approximately three-fold increase in MS risk (RR = 2.7). Subsequently, we reana-lyzed our data by performing linkage analysis conditional on the associations involving these two variants; and, determined that these two sequence variants explained about 18% of the MS linkage evidence on chromosome 7q (Figure 2).
secondary data analyses of quantitative traits related to MsAfter determining the correlations between the 29 SNPs and MS, association analyses of the same markers with various MS-related quantitative traits, including the MS individual components (Table 1) treated as continuous traits, were per-formed. As can be seen in Supplementary Table S1 online, several of the traits were associated with various SNPs exam-ined in this study. On multiple occasions, more than one MS-related quantitative trait was associated with a given SNP. For example, rs11760281, the SNP that showed the strongest association with MS, also was found to be significantly associ-ated with waist circumference (P = 0.0090), BMI (P = 0.0028), fasting glucose (P = 0.0171), and fasting insulin (nondiabetic individuals only) (P = 0.0037). As detailed in Supplementary Table S1 online, the carriers of the minor allele were found to be at increased risk for all of these four traits as indicated by the mean trait value by genotype class. In contrast, the marker rs1194197 that exhibited the second strongest association with MS, also showed significant associations with waist circum-ference (P = 0.0087), BMI (P = 0.0507), fasting glucose (P = 0.0054). The carriers of the major allele were at increased risk for all of the three traits as indicated by the mean trait value by genotype class. Since the traits/models were correlated (thus, not completely independent), no attempt was made to adjust the P values reported in Supplementary Table S1 online for multiple comparisons.
dIscussIonMS is a complex phenotype, representing a constellation of several traits related to obesity, T2DM and coronary heart dis-ease. Despite the debate on its clinical utility (5,20), as stated earlier, previous studies including our own have shown that the MS-related traits are under potentially strong common genetic (or pleiotropic) influences, using multivariate genetic analy-ses and/or factor analytical techniques. In this study, we aimed to determine the heritability of MS and to localize its suscep-tibility loci, using the NCEP/ATPIII definition in a Mexican American population at high risk for the development of MS. The prevalence of MS in our family data was 43.5%. This study suggests that additive genetic effects (h2 = 51%) significantly influence variation in susceptibility to MS. Given that the herit-ability estimates are population sample specific, some previous
table 3 evidence for linkage of the five dichotomous Ms risk factors as defined by nceP/atPIII criteria and the corresponding quantitative traits on chromosome 7q
Traits (dichotomous; quantitative)
Distance from p-ter (cM)a Maximum LODb
Abdominal obesity; WC 95-109 1.45; 1.65
High triglycerides; TG 95-109 0.76; 0.19
Low HDL-C; HDL-C 95-109 1.12; 1.36
High-fasting glucose; FG 95-109 0.85; 0.22
High-blood pressure; SBP and DBP
95-109 0.43; 0.05 and 0.54
DBP, diastolic blood pressure; FG, fasting glucose; HDL-C, high-density lipo-protein cholesterol; MS, metabolic syndrome; NCEP/ATPIII, National Cholesterol Education Program/Adult Treatment Panel III; SBP, systolic blood pressure; TG, triglycerides; WC, waist circumference.aMarshfield data (Kosambi cM). bAll dichotomous traits adjusted for covariate effects of age as in the case of original linkage analysis (Table 2); quantitative traits were adjusted for age and sex terms as well as for medication status for TG, HDL-C, FG, SBP, and DBP.

obesity | VOLUME 20 NUMBER 10 | OctOBER 2012 2089
articlesGenetics
studies determined the heritability for MS defined by NCEP/ATPIII criteria to be ~13–60% (8,21,22), which are compara-ble to our finding in Mexican Americans.
Importantly, we found the strongest evidence (LOD = 3.6) for linkage of MS on chromosome 7q21 between the mark-ers D7S2212 (7q21.11) and D7S821/GATA5D08 (7q21.3). This region has been implicated by several studies, including our previous studies, to contain susceptibility loci that influence MS or its related traits (see Supplementary Table S2 online). These findings consistent with our suggest that the relatively broad 7q chromosomal region of interest in this study could
harbor one or more MS susceptibility genes with potential common genetic influences.
As a preliminary susceptibility gene identification effort, we screened two positional candidate genes in the 1-LOD support interval region on chromosome 7q, CD36 and GNAT3, which are physically very close to each other (Table 4); and, found two sequence variants, one each from these genes (GNAT3, rs11760281 and CD36, rs1194197), that were relatively strongly associated with MS and together explained together ~18% of the observed MS linkage evidence. Of these two genes, CD36 has been the focus of various investigations in humans with
table 4 characteristics of the snPs near or in CD36 and GNAT3 genes and their association with Ms (nceP/atPIII)
Gene SNPMajor/minor alleles*
Physical distance (bp)** Location**
Minor allele frequency (MAF) P value
GNAT3 SNP1 (rs799975) G/C 79920950 Downstream of 3′-UTR
0.228 0.0414
SNP2 (rs2944398)a C/T 79924797 Near 3′-UTR 0.425 0.0326
SNP3 (rs6942728) T/C 79932864 Intron 0.048 0.0437
SNP4 (rs1473122)a A/T 79933295 Intron 0.380 0.0271
SNP5 (rs799929)a A/G 79935512 Intron 0.403 0.0737
SNP6 (rs6961082) C/A 79938905 Intron 0.012 0.4313
SNP7 (rs11760281) G/A 79942485 Intron 0.442 0.0003
SNP8 (rs10280807) T/C 79946464 Intron 0.093 0.5679
SNP9 (rs6467212)b A/G 79955940 Intron 0.060 0.4319
SNP10 (rs10234980) C/T 79958990 Intron 0.035 0.8846
SNP11 (rs1524600)b C/T 79976239 Intron 0.067 0.5536
CD36 SNP1 (rs1194197) T/C 80013542 Upstream of 5′-UTR1
0.476 0.0044
SNP2 (rs1194182)c G/C 80069440 5′-UTR1 0.375 0.0164
SNP3 (rs1984112) A/G 80080856 Intron1 0.266 0.2819
SNP4 (rs1761667)c A/G 80082875 Intron1 0.378 0.0431
SNP5 (rs57312550)d C/A 80090631 Intron1 0.070 0.4929
SNP6 (rs59637606)d A/G 80090743 Intron1 0.070 0.5638
SNP7 (rs62461694) T/C 80090989 Intron1 0.043 0.6636
SNP8 (rs2151916)e T/C 80091319 Intron1 0.272 0.4414
SNP9 (rs2366855)f A/T 80091391 Intron1 0.445 0.0898
SNP10 (new) G/T 80105623 Near 5′-UT R2 0.022 0.5163
SNP11 (rs1049654)f C/A 80113391 5′-UT R2 0.413 0.2377
SNP12 (rs3211805)g G/T 80113512 Intron1,2 0.004 0.4243
SNP13 (rs997906)e A/T 80117771 Intron1,2 0.244 0.8259
SNP14 (rs3173798) T/C 80123786 Intron1,2 0.145 0.0481
SNP15 (rs3211891)g T/C 80128284 Intron1,2 0.004 0.4248
SNP16 (rs3211956) T/G 80141698 Near 3′-UTR1; intron2
0.056 0.2740
SNP17 (rs7755)h G/A 80144207 3′-UT R2 0.324 0.5031
SNP18 (rs1049673)h C/G 80144286 3′-UT R2 0.318 0.3493
MS, metabolic syndrome; NCEP/ATPIII, National Cholesterol Education Program/Adult Treatment Panel III; SNP, single-nucleotide polymorphism.*Risk allele in bold font. **(NCBI build36; dbSNP BUILD127). 1Transcript NM_001001547.1. 2Transscript NM_001001548.2. aThree markers are in strong LD with each other (r2 ≥ 0.84); bTwo markers are in strong LD with each other (r2 = 0.90). cTwo markers are in strong LD with each other (r2 = 0.97). dTwo markers are in strong LD with each other (r2 = 1.00). eTwo markers are in strong LD with each other (r2 = 0.86). fTwo markers are in strong LD with each other (r2 = 0.88). gTwo markers are in strong LD with each other (r2 = 1.00). hTwo markers are in strong LD with each other (r2 = 0.99).

2090 VOLUME 20 NUMBER 10 | OctOBER 2012 | www.obesityjournal.org
articlesGenetics
regard to MS and/or its correlated disease conditions. A unique feature of the CD36 gene is alternative splicing of its exons and their upstream promoters, which appear to be tis-sue specific (14). Indeed, as remarked by Andersen et al. (23), the CD36 gene is regulated by an unusually complex molecu-lar mechanism, mirroring the multifunctional role of CD36 in different tissues and conditions. Given that insulin resistance, obesity and their associated inflammatory processes are the major underlying mechanisms of MS, experimental evidence suggests that CD36 could play a significant role in such inter-related complex mechanisms (24). Thus, CD36 is a strong can-didate gene for susceptibility to various components of MS including obesity, insulin resistance, dyslipidemia, inflamma-tion and atherosclerosis.
In the spontaneous hypertensive rat, an animal model for MS, a region on chromosome 4 provided evidence for link-age of various MS-related traits. Subsequently, a deletion in the CD36 gene located in the linked chromosome 4 region was found to be responsible for the underlying insulin resistance, defective fatty acid metabolism and hypertriglyceridemia (25). The insulin insensitivity was restored in these rats by trans-genically rescuing the CD36 gene (26). In humans, deficiency in CD36 was found to be associated with insulin resistance in the Japanese population (27). In addition, following their pre-vious findings of association between CD36 sequence variants and HDL-C levels (28), Love-Gregory et al. (29) have recently reported the influence of such HDL-associated genetic poly-morphisms on CD36 expression, revealing the causality of the link between expression and HDL-C. In consideration of its potential functional significance and location on chromosome 7q in humans, it is possible that the genetic variants in CD36 by themselves or together with other variants in the neighbor-ing gene(s) could contribute to the MS linkage signal found in this study. Of the 29 SNPs examined, 11 from CD36 and 9 from GNAT3 were significantly associated with MS and/or MS-related traits, although some of the SNPs were found to be in LD (Table 4 and Supplementary Table S1 online).
Numerous studies have reported findings in support of the association between genetic variation at CD36 and MS and its related traits (see Supplementary Table S3 online). Although there is a certain degree of overlap of the SNP sets used among the studies, some of the associations reported by such studies were not always between a specific variant and a MS-related trait; instead, with a different, but correlated MS-related trait(s). Two studies used MS diagnostic criteria similar to the one used in this study involving African Americans (28) and Boston Puerto Ricans (30). The best associated CD36 SNP (rs1194197) in our study was not examined in these studies, instead they found other SNPs in this gene to be associated with MS. Of the remain-ing three SNPs nominally associated with MS in our study, rs3173798 was evaluated in the African-American data, and rs1761667 was examined in the Puerto Rican sample. Although rs3173798 was not correlated with MS in African Americans, it exhibited association with HDL-C levels (28). In the Puerto Rican data, rs1761667 exhibited suggestive association with MS (P = 0.016); but, another SNP (rs7807607) in strong LD with
it was part of one of the haplotypes consisting of three SNPs (rs1049673, rs3211931, and rs7807607) significantly associated with MS (30). It is worth noting that rs1049673 is associated with fasting glucose in both the Puerto Rican and our data sets.
Several studies have reported associations between CD36 genetic variants and MS correlates (see Supplementary Table S3 online). Some SNPs found to be associated with MS-related traits in our study were also shown to be correlated with other related phenotypes by several investigations as discussed below. Ma et al. (31) reported the association of some common genetic variants in CD36 with increased risk of cardiovascular disease and serum lipid levels in a white population. A common haplo-type derived from five tagging SNPs was found to be associated with free-fatty acids and triglycerides in men. Interestingly, two of these tagging polymorphisms (i.e., rs1761667 and rs1049673) which were associated with free-fatty acids, were also found to be associated in our study, with MS (rs1761667), fasting glucose (rs1761667 and 1049673), and diastolic blood pres-sure (rs1049673). In a North Indian population, T2DM was strongly associated with rs1761667 (32). This polymorphism (i.e., rs1761667) was one of the four CD36 SNPs recently found to be associated with decreased CD36 expression in monocytes (29). It should be noted that the observation of more of the SNPs associated with glucose traits in our study compared to others may be due to the high background prevalence of diabetes in our data. However, a thorough evaluation of the genetic region of interest to identify potential functional variants with the use of deep sequencing could reveal the true patterns of correlation between a full spectrum of sequence variants, both common and rare, and correlated MS-related traits.
To our knowledge, sequence variants in the GNAT3 (or α-gustducin) gene, which flanks CD36, have not been examined for their correlation with MS or its components. Gustducin is a G-protein originally found to be expressed in taste receptor cells and is considered to be an essential component of the mamma-lian sweet taste transduction pathway (33,34). The GNAT3 gene encodes α-gustducin, one of the three subunits of gustducin. Fushan et al. (34) have recently reported significant associa-tions between 11 SNPs in GNAT3 and sweet taste perception, using data from individuals with white, African-American, and Asian population backgrounds. Of these variants, two were examined in our study (rs1524600 and rs6961082), but only rs6961082 exhibited significant associations with BMI, fasting glucose and 2-h glucose levels. It is worthwhile noting that, Laugerette et al. (35), based on studies in animal mod-els, have shown that CD36 is involved in oral long-chain fatty acid detection; thus, highlighting its role in “fat taste” percep-tion (33). Toguri examined whether CD36 genetic variants (rs1984112, rs1761667, rs1527483, and rs1049673) were asso-ciated with habitual fat intake in white and Asian populations, in turn finding associations of rs1984112 and rs1761667 with %energy from fat in whites and rs1049673 with %energy from carbohydrate in Asians, respectively (36; Ph.D dissertation; http://proquest.umi.com/pqdlink?Ver=1&Exp=11-07-2016&FMT=7&DID=1671905181&RQT=309&attempt=1&cfc=1). All of these three associated SNPs were examined in our study,

obesity | VOLUME 20 NUMBER 10 | OctOBER 2012 2091
articlesGenetics
and rs1761667 and rs1049673 exhibited associations with MS or its components (i.e., fasting glucose and diastolic blood pressure).
It is well known that glucagon-like-peptide-1 (GLP-1) is a regulator of appetite, insulin secretion and gut motility which is released in the enteroendocrine cells of the gut in response to glucose. Still the mechanism of how the glucose taken orally can signal the release of GLP in the gut is not well understood. Interestingly, recent studies have shown that the taste G-protein gustducin (α-gustducin, GNAT3) along with other taste signaling elements could play a very important role in this link (37,38). Recently, in a sample of 97 Japanese individuals at high risk for cardiovascular disease with abdominal obesity, fasting serum GLP-1 levels were found to be on average 28% higher in individuals with MS compared to those with pre-MS, and the GLP-1 levels were elevated with increasing numbers of MS components or risk factors (39). In the present study, 5 of 11 GNAT3 SNPs examined were associated with MS (Table 4), and sev-eral SNPs exhibited correlations with various MS-related quantitative traits including obesity measures; fasting lip-ids, insulin and glucose concentrations; and 2-h glucose concentrations (see Supplementary Table S1 online).
We also tested rs11760281 for association with MS-related quantitative traits in an independent sample of Mexican American families ascertained on probands with or with-out a previous diagnosis of gestational diabetes mellitus; the BetaGene Study (40). Data were available on a maximum of 1,703 nondiabetic individuals (687 males, 1016 females) with average age of 34.8 ± 8.4 years (mean ± SD) and BMI of 29.5 ± 5.9 (mean ± SD) kg/m2. The A allele of rs11760281 was associated with increased 30-min OGTT insulin lev-els, both absolute (P = 0.006) and the increment above fast-ing (P = 0.007), increased insulinogenic index (P = 0.004), and with increased acute insulin response to intravenous glucose (P = 0.036) adjusting for age and sex. The addi-tional adjustment for body fat did not substantially alter the results. These results are consistent with the hypothesis that gut-expressed proteins related to taste signaling may regu-late glucose-stimulated secretion of GLP-1 and its effects as an insulin secretagogue.
In conclusion, we performed a genome-wide linkage screen to localize MS susceptibility loci in Mexican Americans, a population at high risk for the development of MS, and found the strongest evidence for MS linkage on chromosome 7q21. Subsequent screening and examination of sequence variants in positional candidate genes CD36 and its flanking gene GNAT3 provided strong evidence for their association with MS and their related traits. Importantly, two variants (one from each gene) that exhibited strongest associations par-tially contributed to the linkage signal on chromosome 7q21. On one hand, the current observations shed light on the role of genetic variation at CD36 and GNAT3 genes, which are associated with complex pathways related to insulin action, insulin secretion, and food taste perception, in determining susceptibility to MS and/or its risk factors including obesity,
insulin resistance/hyperinsulinemia, hyperglycemia, dysli-pidemia, and elevated blood pressure. On other hand, these findings strongly support an immediate need for a systematic targeted sequencing of not only CD36 and GNAT3 genes but also other genes within the 1-LOD support interval in the 7q chromosomal region of interest to identify the causal genes and the functional relevance of the implicated genetic vari-ants, both common and rare. Such activities may ultimately help to develop effective strategies to prevent disease or treat individuals that are at high risk for MS and its comorbid dis-ease conditions.
suPPleMentarY MaterIalSupplementary material is linked to the online version of the paper at http://www.nature.com/oby
acknowledGMentsthis study was supported by grants from the National Institute of Diabetes, Digestive, and Kidney Diseases (DK53889, DK42273, and DK47482), Kronkosky Foundation, and texas Biomedical Research Institute (formerly, Southwest Foundation for Biomedical Research) Forum Research Support Funds. the nursing and dietetic care provided by the staff of the Frederic c. Bartter General clinical Research center at the South texas Veterans Health care Systems—Audie Murphy Division is appreciated. We wish to acknowledge Richard Granato, Irma Jean Gomez, and Roy G. Resendez for excellent technical support. We thank the center for Inherited Disease Research (cIDR) for providing a genome scan using the SAFDGS data. We warmly thank the families from SAFDGS for their enthusiasm and cooperation.
dIsclosurethe authors declared no conflict of interest.
© 2012 The Obesity Society
reFerences1. Ford ES, Giles WH, Dietz WH. Prevalence of the metabolic syndrome among
US adults: findings from the third National Health and Nutrition Examination Survey. JAMA 2002;287:356–359.
2. Johnson WD, Kroon JJ, Greenway FL et al. Prevalence of risk factors for metabolic syndrome in adolescents: National Health and Nutrition Examination Survey (NHANES), 2001-2006. Arch Pediatr Adolesc Med 2009;163:371–377.
3. NCEP/ATPIII Expert panel on detection, evaluation and treatment of High Blood Cholesterol in adults. Executive summary of the Third report of National Cholesterol Education Program (NCEP) Expert Panel on Detection, Evaluation, and Treatment of High blood cholesterol in adults (ATP III). JAMA 2001;285:2486–2497.
4. Grundy SM, Cleeman JI, Daniels SR et al.; American Heart Association; National Heart, Lung, and Blood Institute. Diagnosis and management of the metabolic syndrome: an American Heart Association/National Heart, Lung, and Blood Institute Scientific Statement. Circulation 2005;112:2735–2752.
5. Simmons RK, Alberti KG, Gale EA et al. The metabolic syndrome: useful concept or clinical tool? Report of a WHO Expert Consultation. Diabetologia 2010;53:600–605.
6. Duggirala R, Blangero J, Almasy L et al. A major locus for fasting insulin concentrations and insulin resistance on chromosome 6q with strong pleiotropic effects on obesity-related phenotypes in nondiabetic Mexican Americans. Am J Hum Genet 2001;68:1149–1164.
7. Arya R, Blangero J, Williams K et al. Factors of insulin resistance syndrome–related phenotypes are linked to genetic locations on chromosomes 6 and 7 in nondiabetic mexican-americans. Diabetes 2002;51:841–847.
8. Terán-García M, Bouchard C. Genetics of the metabolic syndrome. Appl Physiol Nutr Metab 2007;32:89–114.
9. Kraja AT, Vaidya D, Pankow JS et al. A bivariate genome-wide approach to metabolic syndrome: STAMPEED consortium. Diabetes 2011;60: 1329–1339.

2092 VOLUME 20 NUMBER 10 | OctOBER 2012 | www.obesityjournal.org
articlesGenetics
10. Langefeld CD, Wagenknecht LE, Rotter JI et al.; Insulin Resistance Atherosclerosis Study Family Study. Linkage of the metabolic syndrome to 1q23-q31 in Hispanic families: the Insulin Resistance Atherosclerosis Study Family Study. Diabetes 2004;53:1170–1174.
11. Ng MC, So WY, Lam VK et al. Genome-wide scan for metabolic syndrome and related quantitative traits in Hong Kong Chinese and confirmation of a susceptibility locus on chromosome 1q21-q25. Diabetes 2004;53: 2676–2683.
12. Puppala S, Dodd GD, Fowler S et al. A genomewide search finds major susceptibility loci for gallbladder disease on chromosome 1 in Mexican Americans. Am J Hum Genet 2006;78:377–392.
13. Genuth S, Alberti KG, Bennett P et al.; Expert Committee on the Diagnosis and Classification of Diabetes Mellitus. Follow-up report on the diagnosis of diabetes mellitus. Diabetes Care 2003;26:3160–3167.
14. Noushmehr H, D’Amico E, Farilla L et al. Fatty acid translocase (FAT/CD36) is localized on insulin-containing granules in human pancreatic beta-cells and mediates fatty acid effects on insulin secretion. Diabetes 2005;54:472–481.
15. Lander E, Kruglyak L. Genetic dissection of complex traits: guidelines for interpreting and reporting linkage results. Nat Genet 1995;11:241–247.
16. Sobel E, Lange K. Descent graphs in pedigree analysis: applications to haplotyping, location scores, and marker-sharing statistics. Am J Hum Genet 1996;58:1323–1337.
17. Almasy L, Blangero J. Multipoint quantitative-trait linkage analysis in general pedigrees. Am J Hum Genet 1998;62:1198–1211.
18. Blangero J, Goring HH, Kent JW Jr et al. Quantitative trait nucleotide analysis using Bayesian model selection. Hum Biol 2005;77:541–559.
19. Li J, Ji L. Adjusting multiple testing in multilocus analyses using the eigenvalues of a correlation matrix. Heredity (Edinb) 2005;95:221–227.
20. Tenenbaum A, Fisman EZ. “The metabolic syndrome. is dead”: these reports are an exaggeration. Cardiovasc Diabetol 2011;10:11.
21. Henneman P, Aulchenko YS, Frants RR et al. Prevalence and heritability of the metabolic syndrome and its individual components in a Dutch isolate: the Erasmus Rucphen Family study. J Med Genet 2008;45:572–577.
22. Sung J, Lee K, Song YM. Heritabilities of the metabolic syndrome phenotypes and related factors in Korean twins. J Clin Endocrinol Metab 2009;94:4946–4952.
23. Andersen M, Lenhard B, Whatling C, Eriksson P, Odeberg J. Alternative promoter usage of the membrane glycoprotein CD36. BMC Mol Biol 2006;7:8.
24. Yang Z, Ming XF. CD36: the common soil for inflammation in obesity and atherosclerosis? Cardiovasc Res 2011;89:485–486.
25. Aitman TJ, Glazier AM, Wallace CA et al. Identification of Cd36 (Fat) as an insulin-resistance gene causing defective fatty acid and glucose metabolism in hypertensive rats. Nat Genet 1999;21:76–83.
26. Pravenec M, Landa V, Zidek V et al. Transgenic rescue of defective Cd36 ameliorates insulin resistance in spontaneously hypertensive rats. Nat Genet 2001;27:156–158.
27. Miyaoka K, Kuwasako T, Hirano K et al. CD36 deficiency associated with insulin resistance. Lancet 2001;357:686–687.
28. Love-Gregory L, Sherva R, Sun L et al. Variants in the CD36 gene associate with the metabolic syndrome and high-density lipoprotein cholesterol. Hum Mol Genet 2008;17:1695–1704.
29. Love-Gregory L, Sherva R, Schappe T et al. Common CD36 SNPs reduce protein expression and may contribute to a protective atherogenic profile. Hum Mol Genet 2011;20:193–201.
30. Noel SE, Lai CQ, Mattei J et al. Variants of the CD36 gene and metabolic syndrome in Boston Puerto Rican adults. Atherosclerosis 2010;211:210–215.
31. Ma X, Bacci S, Mlynarski W et al. A common haplotype at the CD36 locus is associated with high free fatty acid levels and increased cardiovascular risk in Caucasians. Hum Mol Genet 2004;13:2197–2205.
32. Banerjee M, Gautam S, Saxena M, Bid HM, Agrawal CG. Association of CD36 gene variants rs1761667 (G > A) and rs1527483 (C > T) with Type 2 diabetes in North Indian population. In J Diabetes Mellitus 2010;2:179–183.
33. Garcia-Bailo B, Toguri C, Eny KM, El-Sohemy A. Genetic variation in taste and its influence on food selection. OMICS 2009;13:69–80.
34. Fushan AA, Simons CT, Slack JP, Drayna D. Association between common variation in genes encoding sweet taste signaling components and human sucrose perception. Chem Senses 2010;35:579–592.
35. Laugerette F, Passilly-Degrace P, Patris B et al. CD36 involvement in orosensory detection of dietary lipids, spontaneous fat preference, and digestive secretions. J Clin Invest 2005;115:3177–3184.
36. Toguri, C. Genetic Variation in CD36 and Dietary Fat Intake. M.Sc. Dissertation, University of Toronto, 2008, MR45176.
37. Jang HJ, Kokrashvili Z, Theodorakis MJ et al. Gut-expressed gustducin and taste receptors regulate secretion of glucagon-like peptide-1. Proc Natl Acad Sci USA 2007;104:15069–15074.
38. Steinert RE, Gerspach AC, Gutmann H et al. The functional involvement of gut-expressed sweet taste receptors in glucose-stimulated secretion of glucagon-like peptide-1 (GLP-1) and peptide YY (PYY). Clin Nutr 2011;30:524–532.
39. Yamaoka-Tojo M, Tojo T, Takahira N et al. Elevated circulating levels of an incretin hormone, glucagon-like peptide-1, are associated with metabolic components in high-risk patients with cardiovascular disease. Cardiovasc Diabetol 2010;9:17.
40. Watanabe RM, Allayee H, Xiang AH et al. Transcription factor 7-like 2 (TCF7L2) is associated with gestational diabetes mellitus and interacts with adiposity to alter insulin secretion in Mexican Americans. Diabetes 2007;56:1481–1485.