
Americans with Disabili - LIFE Center for Independent Living
Gene Expression and Functional Studies of the OpticNerve Head Astrocyte Transcriptome from NormalAfrican Americans and Caucasian Americans DonorsHaixi Miao1, Lin Chen1, Sean M. Riordan1, Wenjun Li1, Santiago Juarez1, Andrea M. Crabb1, Thomas J.
Lukas2, Pan Du3, Simon M. Lin3, Alexandria Wise4, Olga A. Agapova5, Ping Yang6, Charles C. Gu7, M.
Rosario Hernandez1*
1 Department of Ophthalmology, Feinberg School of Medicine, Northwestern University, Chicago, Illinois, United States of America, 2 Department of Molecular
Pharmacology and Biological Chemistry, Feinberg School of Medicine, Northwestern University, Chicago, Illinois, United States of America, 3 Robert H, Lurie
Comprehensive Cancer Center, Feinberg School of Medicine, Northwestern University, Chicago, Illinois, United States of America, 4 Department of Biology, City College of
New York, New York, New York, United States of America, 5 Department of Ophthalmology and Visual Sciences, Washington University School of Medicine, St. Louis,
Missouri, United States of America, 6 Department of Pediatrics, Washington University School of Medicine, St. Louis, Missouri, United States of America, 7 Division of
Biostatistics, Washington University School of Medicine, St. Louis, Missouri, United States of America
Abstract
Purpose: To determine whether optic nerve head (ONH) astrocytes, a key cellular component of glaucomatous neuropathy,exhibit differential gene expression in primary cultures of astrocytes from normal African American (AA) donors comparedto astrocytes from normal Caucasian American (CA) donors.
Methods: We used oligonucleotide Affymetrix microarray (HG U133A & HG U133A 2.0 chips) to compare gene expressionlevels in cultured ONH astrocytes from twelve CA and twelve AA normal age matched donor eyes. Chips were normalizedwith Robust Microarray Analysis (RMA) in R using Bioconductor. Significant differential gene expression levels were detectedusing mixed effects modeling and Statistical Analysis of Microarray (SAM). Functional analysis and Gene Ontology were usedto classify differentially expressed genes. Differential gene expression was validated by quantitative real time RT-PCR.Protein levels were detected by Western blots and ELISA. Cell adhesion and migration assays tested physiological responses.Glutathione (GSH) assay detected levels of intracellular GSH.
Results: Multiple analyses selected 87 genes differentially expressed between normal AA and CA (P,0.01). The mostrelevant genes expressed in AA were categorized by function, including: signal transduction, response to stress, ECM genes,migration and cell adhesion.
Conclusions: These data show that normal astrocytes from AA and CA normal donors display distinct expression profilesthat impact astrocyte functions in the ONH. Our data suggests that differences in gene expression in ONH astrocytes may bespecific to the development and/or progression of glaucoma in AA.
Citation: Miao H, Chen L, Riordan SM, Li W, Juarez S, et al. (2008) Gene Expression and Functional Studies of the Optic Nerve Head Astrocyte Transcriptome fromNormal African Americans and Caucasian Americans Donors. PLoS ONE 3(8): e2847. doi:10.1371/journal.pone.0002847
Editor: Dawn N. Albertson, Minnesota State University Mankato, United States of America
Received May 13, 2008; Accepted July 7, 2008; Published August 6, 2008
Copyright: � 2008 Miao et al. This is an open-access article distributed under the terms of the Creative Commons Attribution License, which permitsunrestricted use, distribution, and reproduction in any medium, provided the original author and source are credited.
Funding: This work was supported by NIH grant EY-06416 and an unrestricted grant from Research to Prevent Blindness. The funders had no role in studydesign, data collection and analysis, decision to publish, or preparation of the manuscript.
Competing Interests: The authors have declared that no competing interests exist.
* E-mail: [email protected]
Introduction
Primary open angle glaucoma (POAG), the most common form
of glaucoma, is a blinding disease that affects older adults [1].
POAG in many individuals is associated with elevated intraocular
pressure (IOP), a common risk factor [2]. Visual impairment in
glaucoma is due to progressive loss of retinal ganglion cells (RGC)
that clinically presents loss of visual field and cupping of the optic
disc [3]. The site of initial damage to the retinal neurons in
glaucoma is thought to be at the level of the lamina cribrosa in the
optic nerve head (ONH) [4].
Astrocytes, the major glial cell type in the ONH in humans,
provide cellular support function to the axons while interfacing
between connective tissue surfaces and surrounding blood vessels
[5]. In response to elevated IOP in human POAG and in
experimental glaucoma, astrocytes undergo marked phenotypic
changes [5]. Changes from the quiescent to the reactive astrocyte
phenotype and the onset and progression of various human central
nervous system (CNS) diseases are well established [6,7]. In
POAG, reactive astrocytes express neurotoxic mediators such as
nitric oxide [8] and TNF-a [9] that may damage the axons of
RGCs and remodel the extracellular matrix (ECM) of the lamina
PLoS ONE | www.plosone.org 1 August 2008 | Volume 3 | Issue 8 | e2847
cribrosa leading to loss of elasticity and resiliency and rendering
the ONH more susceptible to damage [5,10].
In this study, we referred to African American individuals (AA)
as Black Americans of African ancestry and to Caucasian
Americans individuals (CA) as White Americans of Western
European ancestry. We used the race, gender and age identifica-
tion provided with the anonymous donor history according to
guidelines published in JAMA and Genome Biology [11,12]. POAG
affects AA population at least three times more often than CA
population [11]. POAG is a complex, genetically heterogeneous
disease. Of the three genes from 22 genetic loci that have been
identified for POAG using linkage analyses, myocilin (MYOC,
OMIM 601652), optineurin (OPTN, OMIM 602432), and WD
repeat-domain 36 (WDR36, OMIM 609669), none of these genes
have been found to associate with POAG in African Americans,
Afro Caribbeans or in West African populations [12,13].
We have investigated possible differences in ONH astrocytes from
populations with different genetic backgrounds, using well charac-
terized primary human astrocytes cultures. We have found that
astrocytes derived from normal AA donors exhibit differential gene
expression profiles compared to astrocytes derived from normal age-
matched CA donors. Our data shows that genes associated with
oxidative stress, astrocyte motility, ECM structure, immune responses
and the reactive astrocyte phenotype are differentially expressed in
normal astrocytes from these different populations. These results
demonstrate baseline differences in ONH astrocytes from human
populations with different genetic backgrounds and provide a
molecular framework for future analyses from normal and
glaucomatous astrocytes from different populations.
Results
We established primary cultures of ONH astrocytes from 16
normal African American donors (age 60611) and 21 normal
Caucasian American donors (age 62612) as described in Material
and Methods. For each different assay and determination,
astrocytes were cultured under identical conditions until reaching
90% confluence and then processed. ONH astrocytes from the AA
and CA populations displayed a uniform polygonal shape in
culture and were positive for GFAP and NCAM, which are
markers of ONH astrocytes in vivo and in vitro [14,15].
Identification of differentially expressed genes in normalAA and CA ONH astrocytes
There were no significantly different demographic variables
between populations of the 24 astrocyte lines used in microarray
(Table S1). We analyzed global gene expression differences in
mRNA samples from primary cultures of ONH astrocytes from 12
AA normal donors (age 58612 years) and 12 CA normal donors
(age 58611 years). We used Affymetrix GeneChip HG U133A
chips for 3 AA and 3 CA donor samples [GSE9939] and HG
U133A 2.0 chips for 9 AA and 9 CA donor samples [GSE9939].
Of the 22,277 gene probes in the Affymetrix GeneChips, there
were 16,710 present calls, representing 10504 genes left for the
analysis. Data normalized using RMA and analyzed by SAM
identified a total of 132 probe sets as differentially expressed
between AA and CA (P,0.01, fold change .1.3; false discovery
rate was set at #5%). Because many of the transcripts were
represented by multiple probe sets, the actual number of genes
differentially expressed in AA astrocytes compared to CA
astrocytes was 87. Among these, 47 genes were upregulated and
40 genes were downregulated in AA (Table S2).
To better demonstrate the process of identifying significant genes,
Figure 1A shows the volcano plot of comparison between AA and
CA based on the result using the Limma package. The volcano plot
indicates the size of biological effect (fold change) versus the
statistical significance of the result (statistical p-value). A number of
genes are shown to have high fold-change and significant p-values,
which can also be seen from the p-value distribution, shown in
Figure 1B. After considering the effect of multiple testing (through
FDR adjustment [16]) and the size of fold-change, we identified the
significant genes (with FDR,0.05 and fold-change .1.3), shown as
red dots in Figure 1A. A complete list of the differential expressed
genes is shown in Table S3.
Gene Ontology comparing AA astrocytes and CAastrocytes
To classify differentially expressed genes, we separated the genes
from RMA-SAM analysis manually by function using available data
from public databases (UniGene, OMIM and Entrez PubMed).
The complete list of the functional categories is shown in Table S4.
In AA astrocytes compared to CA astrocytes, the most important
groups of differentially expressed genes separated by function were
related to signal transduction (15 genes up-regulated, 5 down-
regulated), cell adhesion (4 genes up-regulated and 4 genes down-
regulated), motility (3 genes up-regulated), ECM related (3 genes
up-regulated and 4 genes down-regulated), responses to oxidative
stress (8 genes up-regulated) and growth factors and receptors (5
genes upregulated and 2 genes downregulated) (Table 1). The
number of genes that changed in selected categories is shown in
Figure 1C. Classification by the Gene Ontology database (Gene
Ontology Consortium) using gene list generated by Limma package
yielded similar results as above (Table S5).
Validation of selected differentially expressed genes inAA and CA astrocytes by real-time qRT-PCR
RNA from 13 AA and 17 CA age-matched normal donors was
used to validate microarray data. Twenty-six genes were selected
from 10 functional groups from the RMA-SAM analysis and from
the GO lists. 18S was used to normalize the expression value. Fold
change obtained by qRT-PCR correlated well with the direction
of fold change obtained from the normalized intensity data,
confirming the validity of the microarray gene expression patterns
(Table S6).
AA astrocytes exhibit altered signal transductionpathways
Genes that are associated with intracellular signaling were
differentially expressed in AA astrocytes, including cAMP
signaling, intracellular vesicular transport, G protein regulation
and protein phosphatases (Table 1). Differences in the mRNA
abundance of signaling molecules comparing AA and CA
astrocytes indicate the potential for differential activation of these
signaling pathways in response to stress.
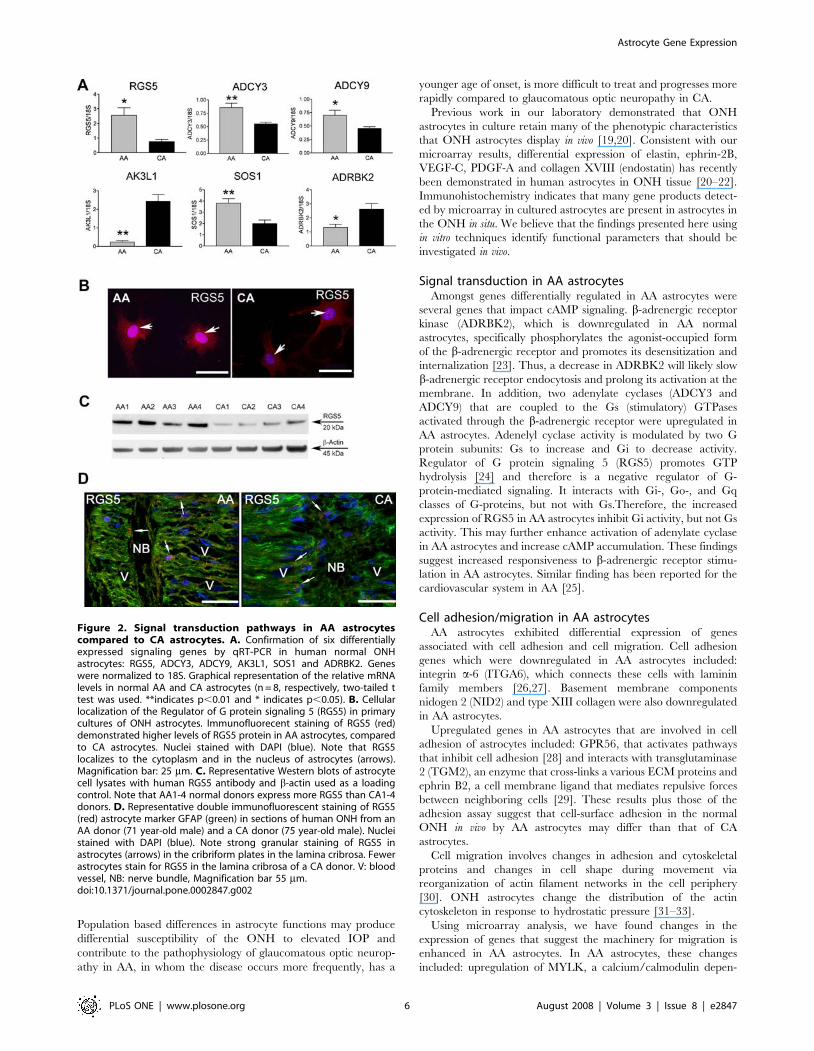
Regulator of G protein signaling 5 (RGS5). Expression of
the RGS5 gene was upregulated in AA astrocytes by microarray
and confirmed by qRT-PCR (Figure 2A). The protein product
appeared greater in AA astrocytes as shown by immunostaining
localized to the cytoplasm and the nucleus (Figure 2B). Western
blot detected RGS5 increased protein in cell lysates of AA
astrocytes (Figure 2C). Astrocytes in the lamina cribrosa tissue
from normal AA donors contained abundant RGS5 compared to
CA tissues (Figure 2D). The abundant expression of RGS5 in AA
astrocytes suggests an inhibitory role in the regulation of signal
transduction in this population.
Cyclic AMP signaling. Amongst genes differentially
regulated in AA astrocytes were several genes that impact upon
Astrocyte Gene Expression
PLoS ONE | www.plosone.org 2 August 2008 | Volume 3 | Issue 8 | e2847

cAMP signaling. b-adrenergic receptor kinase (ADRBK2) is
downregulated in AA normal astrocytes (Figure 2A). The
AK3L1 gene that regulates the amount of available nucleotides
in cells was also downregulated. Two adenylyl cyclases (ADYC3
and ADYC9) were upregulated in normal AA astrocytes
(Figure 2A) however there were no differences in basal levels of
cAMP amongst normal AA and CA astrocytes (data not shown),
suggesting other components of the cAMP pathway are also
involved in the regulation of cAMP basal level. Additional
upregulated signaling genes were: Phosphodiesterase 4D
(PDE4D) interacting protein (PDE4DIP) and SOS1, son of
sevenless 1 (Table S8).
AA astrocytes exhibit decreased cell adhesionComparing AA to CA astrocytes, differentially expressed genes
that are associated with cell adhesion were ephrin B2 and GPR56,
which were both upregulated, and ITGA6, which was downreg-
ulated (Table 1, Figure 3A, and B) Differential expression in AA
astrocytes was consistent with differences in the protein products of
GPR56, EFNB2 and ITGA6 by immunoblot (Figure 3C). GPR56
was visibly more abundant in AA astrocytes and localized to the
cell surface and cell borders in vitro (Figure 3A). We also detected
strong staining for GPR56 in astrocytes in the lamina cribrosa of
AA normal donor tissue (Figure 3D).
The molecular changes described above suggested to us
decreased cell adhesion of AA astrocytes. An assay was used to
compare AA astrocytes to CA astrocytes for adhesion to collagen
type IV. We found decreased attachment to collagen type IV of
AA astrocytes compared to CA astrocytes (Figure 3E, p,0.05).
AA astrocytes exhibit increased migrationmRNA levels of the autocrine motility factor receptor (AMFR),
myosin light chain kinase (MYLK) a calcium/calmodulin
dependent kinase and PPP1R12B (also refered as MYPT2), a
myosin phosphatase were upregulated in AA astrocytes compared
to CA astrocytes (Table 1, Figure 4A).
Western blots detected two isoforms of MYLK: 210 kDa and
130 kDa. The 130 kDa isoform was the predominant form in both
AA and CA normal astrocytes. The protein level of MYLK
130 kDa was significantly higher in AA astrocytes compared to
CA astrocytes (Figure 4B and C). 210 kDa isoform was expressed
at very low levels in both AA and CA normal astrocytes and no
difference was detected (Figure 4B and C).
Figure 1. Differential gene expression in primary cultures ofONH astrocytes from age-matched normal donors (12 AA and12 CA). A. Volcano plot indicates the size of biological effect (foldchange) versus the statistical significance of the result (statistical p-
value). Volcano plot represents the total number of genes used in theanalysis after removing ‘absent’ genes and redundant probes (10504)on the Affymetrix Human Genome HG U133A Chip. Each pointrepresents a gene plotted as a function of fold change (Log2 (foldchange), x-axis) and statistical significance (2Log 10 (p-value), y-axis).Vertical dotted lines represent fold changes of 61.3, respectively. Thehorizontal dotted line represent FDR = 0.05 (p-value is 0.00086 for thisdata). The red dots represent 239 selected differentially expressedgenes with FDR,0.05 and fold-change .1.3. B. Estimate of theproportion of genes differentially expressed among populations. The p-value distribution of AA-CA comparison shows that a number of geneshave very small p-values, which are significant even after consideringthe effect of multiple testing through FDR adjustment. C. Changes ingene expression in major categories in AA astrocytes, compared to CAastrocytes. The x-axis is the selected categories: signal transduction,adhesion, motility, ECM related, oxidative stress and growth factors. They-axis is the number of genes under the category from thedifferentiated gene list (Table 1). Red represents the number of genesdownregulated in AA and black represents number of genesupregulated in AA.doi:10.1371/journal.pone.0002847.g001
Astrocyte Gene Expression
PLoS ONE | www.plosone.org 3 August 2008 | Volume 3 | Issue 8 | e2847

Table 1. Selected functional categories of genes differentially expressed in AA vs. CA.
Gene Symbol Gene Title Fold Change P-value Chromosome location
Signal Tranduction
PSPH phosphoserine phosphatase 2.70 0.0000 7q11.2
PDE4DIP phosphodiesterase 4D interacting protein 2.50 0.0000 1q12
RGS5 regulator of G-protein signalling 5 2.35 0.0007 1q23.1
SOS1 son of sevenless homolog 1 1.67 0.0001 2p22-p21
RAB3B Member RAS oncogene family 1.64 0.0006 1p32-p31
GPR56 G protein-coupled receptor 56 1.62 0.0051 16q12.2-q21
PLA2G4C phospholipase A2, group IVC 1.60 0.0016 19q13.3
PPP1R12B protein phosphatase 1, regulatory (inhibitor) subunit 12B, (MYPT2) 1.53 0.0026 1q32.1
MYLK myosin, light polypeptide kinase 1.47 0.0435 3q21
CENTG2 centaurin, gamma 2 1.35 0.0103 2p24.3-p24.1
NPR3 natriuretic peptide receptor C 1.35 0.0404 5p14-p13
SYDE1 synapse defective 1, Rho GTPase, homolog 1 1.34 0.0012 19p13.12
PTK2 protein tyrosine kinase 2 1.33 0.0393 8q24-qter
ADCY3 adenylate cyclase 3 1.30 0.0300 2p23.3
ADCY9 adenylate cyclase 9 1.21 0.0216 16p13.3
TEK TEK tyrosine kinase 22.08 0.0006 9p21
AK3L1 (AK3) adenylate kinase 3-like 1 21.81 0.0055 1p31.3
STAC SH3 and cysteine rich domain 21.71 0.0067 3p22.3
FZD7 frizzled homolog 7 21.45 0.0041 2q33
ADRBK2 adrenergic, beta, receptor kinase 2 21.31 0.001 22q12.1
Cell Adhesion
WISP2 WNT1 inducible signaling pathway protein 2 2.00 0.0001 20q12-q13.1
EFNB2 ephrin-B2 1.95 0.0038 13q33
NLGN1 neuroligin 1 1.73 0.0045 3q26.31
EPB41L3 erythrocyte membrane protein band 4.1-like 3 1.66 0.0020 18p11.32
ITGA6 integrin, alpha 6 21.64 0.0055 2q31.1
JUP junction plakoglobin 21.55 0.0024 17q21
ST3GAL5 ST3 beta-galactoside alpha-2,3-sialyltransferase 5 21.50 0.0005 2p11.2
ANTXR1 anthrax toxin receptor 1 22.30 0.0000 2p13.1
Cell motility
AMFR autocrine motility factor receptor 2.79 0.0000 16q21
MYLK myosin, light polypeptide kinase 1.47 0.0435 3q21
PPP1R12B protein phosphatase 1, regulatory (inhibitor) subunit 12B 1.53 0.0026 1q32.1
ECM and related protein
ELN elastin 2.20 0.0023 7q11.23
COL18A1 collagen type XVIII, alpha 1 1.41 0.0169 21q22.3
LTBP1 latent transforming growth factor beta binding protein 1 1.54 0.0239 2p22-p21
MFAP2 microfibrillar-associated protein 2 21.51 0.0016 1p36.1-p35
MTCBP-1 membrane-type 1 matrix metalloproteinase cytoplasmic tail binding protein-1 21.43 0.0012 2p25.2
NID2 nidogen 2 21.41 0.0001 14q21-q22
PLOD2 procollagen-lysine, 2-oxoglutarate 5-dioxygenase 2 21.60 0.0054 3q23-q24
Cellular detoxification/oxidative stress
GSTT2 glutathione S-transferase theta 2 2.82 0.0000 22q11.2; 22q11.23
GGT1 gamma-glutamyltransferase 1 1.62 0.0004 22q11.22
GGT2 gamma-glutamyltransferase 2 1.54 0.0019 22q11.1
GGTLA4 gamma-glutamyltransferase-like activity 4 1.44 0.0091 20p11.1
GSTM4 glutathione S-transferase M4 1.42 0.0245 1p13.3
GSTM1 glutathione S-transferase M1 1.38 0.0010 1p13.3
Astrocyte Gene Expression
PLoS ONE | www.plosone.org 4 August 2008 | Volume 3 | Issue 8 | e2847
Based on the gene expression and protein data for MYLK, we
compared migration in AA and CA astrocytes. Experiments using
a chemotaxis model indicated that AA astrocytes migrated faster
than CA (Figure 4D). Since AA astrocytes migrated faster and
have higher levels of MYLK, we tested ML-7, a known inhibitor of
MYLK, on its effect on migration in astrocytes derived from three
AA normal donors. The ML-7 treated cells migrated significantly
slower, compare to vehicle treated cells (Figure 4E), suggesting
increased migration in AA astrocytes is due at least in part to
MYLK. In normal AA and CA astrocytes stained with phalloidin,
stress fibers run parallel to the major axis of the cells (Figure 4F,
4G). Treatment with with ML-7, a known inhibitor of MYLK,
caused a marked loss in actin stress fibers from the center of the
cell (Figure 4H, 4I) supporting the role of MYLK in maintenance
of the astrocyte cytoskeleton in both AA and CA astrocytes.
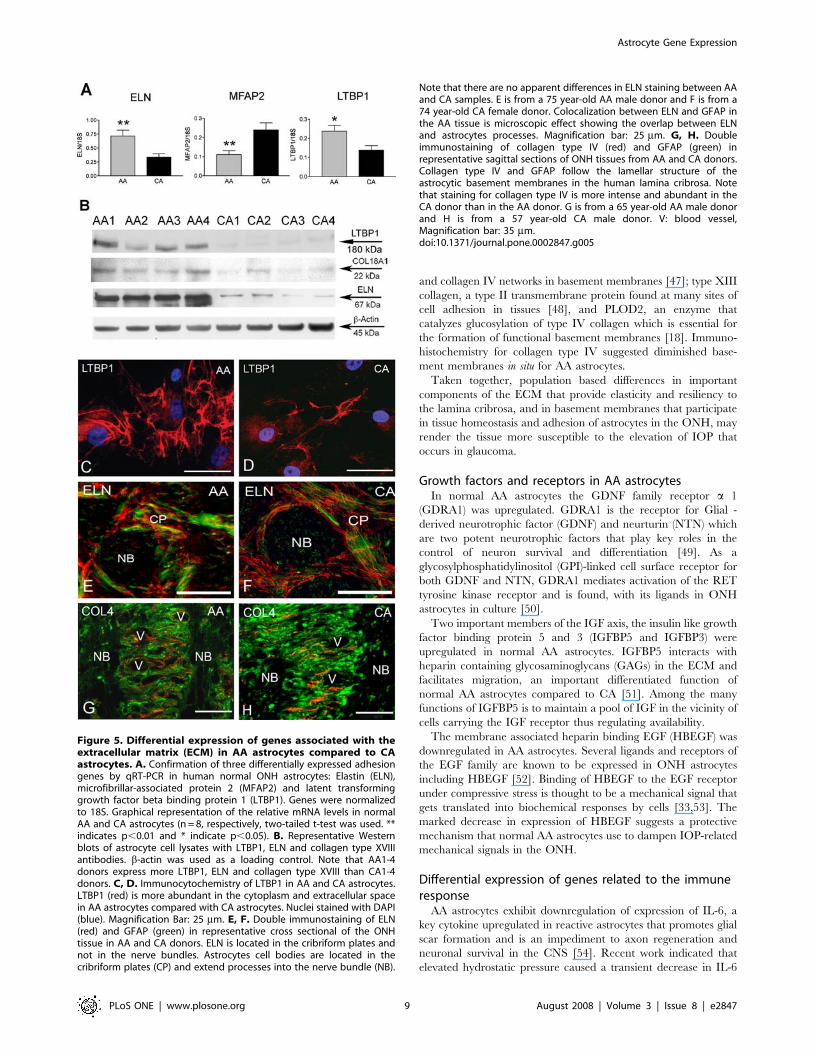
Differential expression of genes associated with theextracellular matrix in AA astrocytes
Microarray analysis indicated a significant upregulation of
elastin (ELN) mRNA which was confirmed by qRT-PCR and
immunoblot in AA astrocytes (Figure 5A, B). LTBP1, a member of
the elastin microfibrils that binds TGF-b was also upregulated in
AA astrocytes in vitro (Figure 5A, B, C, and D). MFAP2, the gene
encoding for MAGP1, a component of the elastin associated
microfibrils, was downregulated in AA astrocytes (Figure 5A).
However, ONH tissue immunostaining with ELN antibody did
not show differences in ELN between populations (Figure 5 E, F).
COL18A1, a collagen with strong anti-angiogenic properties, was
upregulated in AA astrocytes compared to CA astrocytes by qRT-
PCR and immunoblot (Figure 5B).
Several genes associated with basement membranes were
downregulated in AA astrocytes (Table 1, Table S6); including
Nidogen 2 (NID2), type XIII collagen [17], and PLOD2 [18].
Figures 5G and H show decreased immunostaining for collagen
type IV, a ubiquitous component of basement membranes, in
donor ONH tissue from AA compared to an age matched normal
CA donor. AA astrocytes may be attached to an altered ECM.
Upregulation of glutathione metabolic enzymes in AAastrocytes
Genes involved in GSH metabolism, including glutathione S-
transferases (GSTs) and gamma-glutamyltransferases (GGTs), are
upregulated in AA astrocytes (Table 1, Figure 6A). We measured
basal levels of GSH in astrocytes from 10 AA lines and 10 CA
lines. Consistent with upregulation of the GSH metabolizing
enzymes, AA astrocytes exhibited lower GSH levels compared
with CA astrocytes (Figure 6B, p,0.01).
Several chaperones were upregulated in AA astrocytes com-
pared to CA astrocytes, including heat shock protein 70 protein 2
(HSPA2), alpha-crystallin-related heat shock protein B6 (HSPB6),
and crystallin-b B2 (CRYBB2) (Table 1). HSP70 protein are more
abundant in AA astrocytes compared to CA astrocytes (Figure 6C
and D).
Differential expression of growth factors and cytokines inAA astrocytes
Among the upregulated genes by microarray in AA astrocytes
compared to CA astrocytes were two members of the IGFBP
family, IGFBP3 and IGFBP5, the GDNF family receptor a1, the
receptor for glial derived growth factor-1 and neurturin (Table 1).
Real time RT- PCR confirmed increased expression of IGFBP5
(Figure 7A).
To verify the expression of growth factors and cytokines, we
used ELISA to measure the quantity of both secreted (medium)
and intracellular (cell lysate) forms in 6 AA and 7 CA age matched
astrocyte lines. Consistent with lower mRNA levels in AA
astrocytes (Figure 7A), the total amount of HBEGF was
significantly lower in AA astrocytes compared to CA astrocytes
(Figure 7B). IL-6 was present mainly as the secreted form in the
culture medium and was significantly lower in AA astrocytes
compared to CA astrocytes (Figure 7C).
Discussion
Astrocytes are the major cell type that controls the homeostasis
and microenvironment of the retinal ganglion cells axons as they
traverse the optic nerve head. The complex interplay of astrocytes
with RGC axons involves cell-cell signaling, synthesis of ECM,
control of ions and pH, inter- and intracellular transport, immune
surveillance, synthesis of growth factors and cytokines, and many
other interactions. This study presents data that demonstrate
population based differences (AA compared to CA) that may affect
important astrocyte functions in the normal ONH. Based on data
from gene expression, protein levels and functional assays in vitro,
we hypothesize that there are in vivo differences in ONH astrocytes
in these normal populations relating to cell adhesion/migration,
intracellular signaling, extracellular matrix assembly, responses to
oxidative stress, innate immune responses and neuronal survival.
Gene Symbol Gene Title Fold Change P-value Chromosome location
GSTM3 glutathione S-transferase M3 1.31 0.0145 1p13.3
GSTM2 glutathione S-transferase M2 1.30 0.0021 1p13.3
Growth factors and receptors
IGFBP3 insulin-like growth factor binding protein 3 1.74 0.0488 7p13-p12
FGF9 fibroblast growth factor 9 (glia-activating factor) 1.51 0.0268 13q11-q12
GFRA1 GDNF family receptor alpha 1 1.49 0.0060 10q26
CX3CL1 chemokine (C-X3-C motif) ligand 1 1.48 0.0498 16q13
IGFBP5 insulin-like growth factor binding protein 5 1.46 0.0113 2q33-q36
VEGF vascular endothelial growth factor 21.48 0.0051 6p12
HBEGF heparin-binding EGF-like growth factor 21.57 0.0044 5q23
doi:10.1371/journal.pone.0002847.t001
Table 1. cont.
Astrocyte Gene Expression
PLoS ONE | www.plosone.org 5 August 2008 | Volume 3 | Issue 8 | e2847
Population based differences in astrocyte functions may produce
differential susceptibility of the ONH to elevated IOP and
contribute to the pathophysiology of glaucomatous optic neurop-
athy in AA, in whom the disease occurs more frequently, has a
younger age of onset, is more difficult to treat and progresses more
rapidly compared to glaucomatous optic neuropathy in CA.
Previous work in our laboratory demonstrated that ONH
astrocytes in culture retain many of the phenotypic characteristics
that ONH astrocytes display in vivo [19,20]. Consistent with our
microarray results, differential expression of elastin, ephrin-2B,
VEGF-C, PDGF-A and collagen XVIII (endostatin) has recently
been demonstrated in human astrocytes in ONH tissue [20–22].
Immunohistochemistry indicates that many gene products detect-
ed by microarray in cultured astrocytes are present in astrocytes in
the ONH in situ. We believe that the findings presented here using
in vitro techniques identify functional parameters that should be
investigated in vivo.
Signal transduction in AA astrocytesAmongst genes differentially regulated in AA astrocytes were
several genes that impact cAMP signaling. b-adrenergic receptor
kinase (ADRBK2), which is downregulated in AA normal
astrocytes, specifically phosphorylates the agonist-occupied form
of the b-adrenergic receptor and promotes its desensitization and
internalization [23]. Thus, a decrease in ADRBK2 will likely slow
b-adrenergic receptor endocytosis and prolong its activation at the
membrane. In addition, two adenylate cyclases (ADCY3 and
ADCY9) that are coupled to the Gs (stimulatory) GTPases
activated through the b-adrenergic receptor were upregulated in
AA astrocytes. Adenelyl cyclase activity is modulated by two G
protein subunits: Gs to increase and Gi to decrease activity.
Regulator of G protein signaling 5 (RGS5) promotes GTP
hydrolysis [24] and therefore is a negative regulator of G-
protein-mediated signaling. It interacts with Gi-, Go-, and Gq
classes of G-proteins, but not with Gs.Therefore, the increased
expression of RGS5 in AA astrocytes inhibit Gi activity, but not Gs
activity. This may further enhance activation of adenylate cyclase
in AA astrocytes and increase cAMP accumulation. These findings
suggest increased responsiveness to b-adrenergic receptor stimu-
lation in AA astrocytes. Similar finding has been reported for the
cardiovascular system in AA [25].
Cell adhesion/migration in AA astrocytesAA astrocytes exhibited differential expression of genes
associated with cell adhesion and cell migration. Cell adhesion
genes which were downregulated in AA astrocytes included:
integrin a-6 (ITGA6), which connects these cells with laminin
family members [26,27]. Basement membrane components
nidogen 2 (NID2) and type XIII collagen were also downregulated
in AA astrocytes.
Upregulated genes in AA astrocytes that are involved in cell
adhesion of astrocytes included: GPR56, that activates pathways
that inhibit cell adhesion [28] and interacts with transglutaminase
2 (TGM2), an enzyme that cross-links a various ECM proteins and
ephrin B2, a cell membrane ligand that mediates repulsive forces
between neighboring cells [29]. These results plus those of the
adhesion assay suggest that cell-surface adhesion in the normal
ONH in vivo by AA astrocytes may differ than that of CA
astrocytes.
Cell migration involves changes in adhesion and cytoskeletal
proteins and changes in cell shape during movement via
reorganization of actin filament networks in the cell periphery
[30]. ONH astrocytes change the distribution of the actin
cytoskeleton in response to hydrostatic pressure [31–33].
Using microarray analysis, we have found changes in the
expression of genes that suggest the machinery for migration is
enhanced in AA astrocytes. In AA astrocytes, these changes
included: upregulation of MYLK, a calcium/calmodulin depen-
Figure 2. Signal transduction pathways in AA astrocytescompared to CA astrocytes. A. Confirmation of six differentiallyexpressed signaling genes by qRT-PCR in human normal ONHastrocytes: RGS5, ADCY3, ADCY9, AK3L1, SOS1 and ADRBK2. Geneswere normalized to 18S. Graphical representation of the relative mRNAlevels in normal AA and CA astrocytes (n = 8, respectively, two-tailed ttest was used. **indicates p,0.01 and * indicates p,0.05). B. Cellularlocalization of the Regulator of G protein signaling 5 (RGS5) in primarycultures of ONH astrocytes. Immunofluorecent staining of RGS5 (red)demonstrated higher levels of RGS5 protein in AA astrocytes, comparedto CA astrocytes. Nuclei stained with DAPI (blue). Note that RGS5localizes to the cytoplasm and in the nucleus of astrocytes (arrows).Magnification bar: 25 mm. C. Representative Western blots of astrocytecell lysates with human RGS5 antibody and b-actin used as a loadingcontrol. Note that AA1-4 normal donors express more RGS5 than CA1-4donors. D. Representative double immunofluorescent staining of RGS5(red) astrocyte marker GFAP (green) in sections of human ONH from anAA donor (71 year-old male) and a CA donor (75 year-old male). Nucleistained with DAPI (blue). Note strong granular staining of RGS5 inastrocytes (arrows) in the cribriform plates in the lamina cribrosa. Fewerastrocytes stain for RGS5 in the lamina cribrosa of a CA donor. V: bloodvessel, NB: nerve bundle, Magnification bar 55 mm.doi:10.1371/journal.pone.0002847.g002
Astrocyte Gene Expression
PLoS ONE | www.plosone.org 6 August 2008 | Volume 3 | Issue 8 | e2847

dent enzyme which phosphorylates myosin regulatory light chains
to facilitate myosin interaction with actin filaments, producing
contractile activity [34]; upregulation of AMFR, a cell surface
receptor that initiates migration via activation of inositol
phosphate, tyrosine kinase and protein kinase C [35] and has
been characterized in glia during normal cell migration in wound
healing and embryogenesis [36]; myosin phosphatase target
subunit 2 (MYPT2), which dephosphorylates the phosphorylated
myosin light chain to modulate the levels of contractibility in cells
and is uniquely abundant in brain and in the heart [37].
Figure 3. AA astrocytes exhibit decreased cell adhesion compared to CA astrocytes. A. Cellular localization of G protein-coupled receptor56 (GPR56), ephrin-B2 (EFNB2) and integrin a 6 (ITGA6) in primary cultures of ONH astrocytes. Nuclei stained with DAPI (blue). Magnification bar:25 mm. Upper: Double immunofluorescence for GFAP (green), an intermediate filament characteristic of astrocytes and GPR56 (red). Note granularstaining for GPR56 (red) is more abundant in the cytoplasm of AA astrocytes compared to CA astrocytes. Middle: Immunofluorescence showed thatEFNB2 is more abundant in the cytoplasm of AA astrocytes compared to CA astrocytes. Lower: Immunofluorescence showed that Integrin a 6 is lessabundant in the cytoplasm of AA astrocytes compared to CA astrocytes. B. Confirmation of three differentially expressed adhesion genes by qRT-PCRin human normal ONH astrocytes: GPR56, EFNB2 and ITGA6. Genes were normalized to 18S. Graphical representation of the relative mRNA levels inAA and CA astrocytes (n = 8, respectively, *indicates p,0.05 in two-tailed t-test). C. Representative Western blots of astrocyte cell lysates with GPR56,EFNB2 and ITGA6 antibodies. b-actin was used as a loading control. Note that AA1-4 donors express more GPR56 and EFNB2, less ITGA6 than CA1-4donors. D. Representative immunohistochemistry showed more abundant granular staining of GPR56 (red) in astrocytes in the lamina cribrosa fromAA donors compared to CA donors. Note that GPR56 is also localized in astrocyte processes in the nerve bundles (NB). CP: cribriform plates,Magnification bar: 25 mm. E. AA astrocytes adhered to collagen IV 26.5% less than CA astrocytes did (* indicates p,0.05 in two-tailed t-test). Valuesrepresent mean optical density (OD)6standard deviation of triplicate experiments using primary astrocyte cultures of four AA donors and six CAdonors.doi:10.1371/journal.pone.0002847.g003
Astrocyte Gene Expression
PLoS ONE | www.plosone.org 7 August 2008 | Volume 3 | Issue 8 | e2847

MYLK genetic variants confer increased risk of sepsis and
sepsis-associated with acute lung injury and a more severe asthma
phenotype in individuals of African ancestry [38,39]. Therefore it
is possible that the effects of increased expression of MYLK in AA
astrocytes may be further modified by genetic polymorphisms.
In vivo, quiescent astrocytes are terminally differentiated cells
that exhibit strong and stable attachments to the ECM and
neighboring astrocytes. Under conditions of stress, injury and
disease, reactive astrocytes become migratory and detach from the
underlying ECM. Our microarray data plus those of the migration
assay obtained from primary astrocyte cultures strongly suggest
that normal AA astrocytes in situ have the potential of becoming
migratory cells in response to stress such elevated IOP as in
glaucoma.
Extracellular matrix in AA astrocytesOur microarray data suggests that alterations in elastic fibers
and associated microfibrils, a major component of the ECM in the
lamina cribrosa, may be a susceptibility factor predisposing the
remodeling of the ONH in response to elevated IOP in glaucoma
in the AA population. Microarray analysis indicated a significant
upregulation in AA astrocytes of elastin (ELN), LTBP1, a member
of the elastin microfibrils that binds TGF-b, and COL18A1, a
collagen with strong anti-angiogenic properties. MFAP2, the gene
encoding for MAGP1, a component of the elastin associated
microfibrils, and the gene encoding for LOXL2, a lysyl oxidase
that participates in maturation of elastic fiber, were downregulated
in AA astrocytes. We previously reported that normal AA
astrocytes expressed high levels of elastin mRNA and protein,
and decreased levels of LOXL2 [22]. CA patients of Scandinavian
ancestry with pseudoexfoliation glaucoma exhibit variations in the
LOXL1 gene sequence that may predispose this group to elevated
IOP and glaucomatous optic neuropathy due to accumulation of
pseudoexfoliation material [40]. We previously published marked
elastosis in the ONHs of patients with pseudoexfoliation glaucoma
[41]. The downregulation of LOXL2 in AA astrocytes may confer
a similar susceptibility to elevated IOP.
LTBP1 is an ECM glycoprotein that plays a major role in
storage of latent TGF-b in the ECM and regulate its availability
[42], Most studies suggest that LTBPs are secreted together with
TGF-b as part of the TGF-b large latent complex [43,44]. LTBP1
is upregulated in AA astrocytes. The expression of ONH astrocyte-
specific genes appears to be controlled by TGF-b activity [45,46]
in particular synthesis and degradation of ECM in the optic nerve
in glaucoma [46]. Higher levels of TGF-b may be available and
affect homeostasis of the ECM in the ONH in the AA population.
Additional ECM related genes that were downregulated
included: nidogen 2 (NID2), a linker protein that joins laminin
Figure 4. AA astrocytes exhibit increased migration comparedto CA astrocytes. A. Confirmation of three differentially expressedmotility genes by qRT-PCR in human normal ONH astrocytes: autocrinemotility factor receptor (AMFR), myosin light chain kinase (MYLK) andmyosin phosphatase target subunit 2 (MYPT2). Genes were normalizedto 18S. Graphical representation of the relative mRNA levels in AA andCA astrocytes (n = 8, respectively, * indicates p,0.05 in two-tailed t-test). B. Representative Western blots of astrocyte cell lysates withMYLK antibody. b-actin was used as a loading control. Note that AA1-4donors express more MYLK 130 kDa than CA1-4 donors. No difference
was detected at the levels of 210 kDa isoforms. C. Densitometryanalysis of MYLK western blots. b-actin was used as loading control.Astrocytes derived from 7 AA and 10 CA were used in this experiment.The level of the 130 kDa isoform was significantly higher in AAastrocytes, compared to CA astrocytes. D. Cell migration assay showsthat AA astrocytes migrate significantly faster than CA astrocytes. Theassay was performed as described in the Materials and Methods. Valuesrepresent mean optical density (OD)6standard deviation of triplicateexperiments using primary astrocyte cultures of six AA donors and fiveCA donors. * indicate p value,0.05. E. Inhibition of MYLK by ML-7(10 mM), leads to a decrease in migration of African American ONHastrocytes (n = 3). F, G, H, I. Phalloidin staining of the actincytoskeleton in normal AA (F) and CA (G) astrocytes. Inhibition ofMYLK by ML-7, leads to a disruption of cytoskeleton in AA (H) and CA (I)ONH astrocytes. Magnification bar: 25 mm.doi:10.1371/journal.pone.0002847.g004
Astrocyte Gene Expression
PLoS ONE | www.plosone.org 8 August 2008 | Volume 3 | Issue 8 | e2847
and collagen IV networks in basement membranes [47]; type XIII
collagen, a type II transmembrane protein found at many sites of
cell adhesion in tissues [48], and PLOD2, an enzyme that
catalyzes glucosylation of type IV collagen which is essential for
the formation of functional basement membranes [18]. Immuno-
histochemistry for collagen type IV suggested diminished base-
ment membranes in situ for AA astrocytes.
Taken together, population based differences in important
components of the ECM that provide elasticity and resiliency to
the lamina cribrosa, and in basement membranes that participate
in tissue homeostasis and adhesion of astrocytes in the ONH, may
render the tissue more susceptible to the elevation of IOP that
occurs in glaucoma.
Growth factors and receptors in AA astrocytesIn normal AA astrocytes the GDNF family receptor a 1
(GDRA1) was upregulated. GDRA1 is the receptor for Glial -
derived neurotrophic factor (GDNF) and neurturin (NTN) which
are two potent neurotrophic factors that play key roles in the
control of neuron survival and differentiation [49]. As a
glycosylphosphatidylinositol (GPI)-linked cell surface receptor for
both GDNF and NTN, GDRA1 mediates activation of the RET
tyrosine kinase receptor and is found, with its ligands in ONH
astrocytes in culture [50].
Two important members of the IGF axis, the insulin like growth
factor binding protein 5 and 3 (IGFBP5 and IGFBP3) were
upregulated in normal AA astrocytes. IGFBP5 interacts with
heparin containing glycosaminoglycans (GAGs) in the ECM and
facilitates migration, an important differentiated function of
normal AA astrocytes compared to CA [51]. Among the many
functions of IGFBP5 is to maintain a pool of IGF in the vicinity of
cells carrying the IGF receptor thus regulating availability.
The membrane associated heparin binding EGF (HBEGF) was
downregulated in AA astrocytes. Several ligands and receptors of
the EGF family are known to be expressed in ONH astrocytes
including HBEGF [52]. Binding of HBEGF to the EGF receptor
under compressive stress is thought to be a mechanical signal that
gets translated into biochemical responses by cells [33,53]. The
marked decrease in expression of HBEGF suggests a protective
mechanism that normal AA astrocytes use to dampen IOP-related
mechanical signals in the ONH.
Differential expression of genes related to the immuneresponse
AA astrocytes exhibit downregulation of expression of IL-6, a
key cytokine upregulated in reactive astrocytes that promotes glial
scar formation and is an impediment to axon regeneration and
neuronal survival in the CNS [54]. Recent work indicated that
elevated hydrostatic pressure caused a transient decrease in IL-6
Figure 5. Differential expression of genes associated with theextracellular matrix (ECM) in AA astrocytes compared to CAastrocytes. A. Confirmation of three differentially expressed adhesiongenes by qRT-PCR in human normal ONH astrocytes: Elastin (ELN),microfibrillar-associated protein 2 (MFAP2) and latent transforminggrowth factor beta binding protein 1 (LTBP1). Genes were normalizedto 18S. Graphical representation of the relative mRNA levels in normalAA and CA astrocytes (n = 8, respectively, two-tailed t-test was used. **indicates p,0.01 and * indicate p,0.05). B. Representative Westernblots of astrocyte cell lysates with LTBP1, ELN and collagen type XVIIIantibodies. b-actin was used as a loading control. Note that AA1-4donors express more LTBP1, ELN and collagen type XVIII than CA1-4donors. C, D. Immunocytochemistry of LTBP1 in AA and CA astrocytes.LTBP1 (red) is more abundant in the cytoplasm and extracellular spacein AA astrocytes compared with CA astrocytes. Nuclei stained with DAPI(blue). Magnification Bar: 25 mm. E, F. Double immunostaining of ELN(red) and GFAP (green) in representative cross sectional of the ONHtissue in AA and CA donors. ELN is located in the cribriform plates andnot in the nerve bundles. Astrocytes cell bodies are located in thecribriform plates (CP) and extend processes into the nerve bundle (NB).
Note that there are no apparent differences in ELN staining between AAand CA samples. E is from a 75 year-old AA male donor and F is from a74 year-old CA female donor. Colocalization between ELN and GFAP inthe AA tissue is microscopic effect showing the overlap between ELNand astrocytes processes. Magnification bar: 25 mm. G, H. Doubleimmunostaining of collagen type IV (red) and GFAP (green) inrepresentative sagittal sections of ONH tissues from AA and CA donors.Collagen type IV and GFAP follow the lamellar structure of theastrocytic basement membranes in the human lamina cribrosa. Notethat staining for collagen type IV is more intense and abundant in theCA donor than in the AA donor. G is from a 65 year-old AA male donorand H is from a 57 year-old CA male donor. V: blood vessel,Magnification bar: 35 mm.doi:10.1371/journal.pone.0002847.g005
Astrocyte Gene Expression
PLoS ONE | www.plosone.org 9 August 2008 | Volume 3 | Issue 8 | e2847

levels in retinal glial cultures [55] and in human brain astrocytes
exposed to hypoxia in vitro [56]. Decreased IL-6 in AA astrocytes
may limit the transition to a reactive phenotype.
Major histocompatibility complex (MHC) Class I genes (HLA-A,
HLA-B, HLA-F and HLA-G) and other molecules in the Class I
antigen presentation pathway, such the immunoproteasome
(PSMB9, PSMB8), were marginally up-regulated in AA astrocytes.
HLA-A and HLA-B belong to the classical class I genes and are
expressed in astrocytes in the CNS in disease [57]. HLA-F and
HLA-G belong to the non classical class I type genes and their
function is under study. Current studies of high-resolution HLA
allele and haplotype frequency data are being carried out for typing
and use in population-based disease studies [58]. The function of the
immunoproteasome (PSMB9, PSMB8) is to process class I MHC
peptides for degradation. Finally, the endoplasmic reticulum
enzyme, leukocyte-derived arginine aminopeptidase (LRAP) which
processes antigenic peptides presented to class I molecules was also
upregulated in AA astrocytes. Expression of LRAP was reported in
human brain astrocytes in response to hypoxia.
Astrocytes in the CNS participate in the innate immune
response by modulating local reactions to endogenous or
exogenous antigens, and by modulating astrogliosis through
release of cytokines and by isolating areas of inflammation [59].
Differential expression of immune genes in AA astrocytes may
have an impact on astrocyte reactivation in response to stress in
glaucoma.
Oxidative stress in normal AA ONH astrocytesThe antioxidant glutathione (GSH) is vital for cellular defense
against oxidative stress in astrocytes and neurons [60]. Microarray
analysis revealed upregulation of seven genes involved in GSH
metabolism in AA astrocytes, including glutathione S-transferases
(GSTs) and gamma-glutamyltransferases (GGTs). GSTs are a
superfamily of enzymes that catalyze the conjugation of GSH to a
variety of electrophilic and hydrophobic compounds. Polymor-
phisms in the GSTM1 and GSTT1 genes may be associated with
risk of POAG [61–63]. GGTs initiate extracellular GSH
breakdown, thus generating substrates for intracellular GSH
synthesis [64] and allow a continuous ‘GSH cycling’ to occur
across the plasma membrane.
Upregulation of GSTs in AA astrocytes may indicate active
detoxification activity by GSH metabolizing enzymes, resulting
lower levels of GSH as we demonstrated in vitro and perhaps in vivo.
Upregulation of GGTs leads to increase in GSH cycling and thus
GSH synthesis. The fact that GSH level is siginificantly lower in
AA astrocytes, despite higher level of GGTs, suggesting there may
be a compromised oxidation-reduction system or a deficient
antioxidant response. Oxidative stress may be an important
process in glaucomatous optic neuropathy [65]. Perhaps consistent
with decreased ability to respond to oxidative stress, AA astrocytes
have upregulated transcription of an array of cytoprotective genes
responsible for stabilizing the cytoskeleton. In this study, several
chaperones were upregulated in AA compared to CA astrocytes,
including: heat shock protein 70 protein 2 (HSPA2), alpha-
crystallin-related heat shock protein B6 (HSPB6), and crystallin-bB2 (CRYBB2). Upregulation of various heat shock proteins occur
Figure 6. Upregulation of glutathione (GSH) metabolic en-zymes in AA astrocytes. A. Confirmation of two differentiallyexpressed glutathione metabolic enzyme genes by qRT-PCR in humannormal ONH astrocytes: glutathione S-transferase theta 2 (GSTT2) andgamma-glutamyltransferase 1 (GGT1). Genes were normalized to 18S.Graphical representation of the relative mRNA levels in AA and CAastrocytes (n = 8, respectively, * indicate p,0.05 in two-tailed t-test). B.AA astrocytes have significantly lower level of intracellular GSH in vitro,compared to CA astrocytes (n = 10, ** indicated p,0.01 in two-tailed t-test). GSH content is normalized by the amount of the protein. C.Representative Western blots of astrocyte cell lysates with heat shock70 kDa protein (HSP70) antibody. b-actin was used as a loading control.HSP70 levels are higher in AA astrocytes compared to CA astrocytes. D.Immunofluorecent staining for HSP70 shows that AA astrocytes exhibitmore abundant intracellular HSP70 staining compared to CA astrocytes.Magnification bar: 25 mm.doi:10.1371/journal.pone.0002847.g006
Figure 7. Differential expression of growth factors andcytokines in AA astrocytes. A. Confirmation of two differentiallyexpressed growth factor genes by qRT-PCR in human normal ONHastrocytes: insulin-like growth factor binding protein 5 (IGFBP5) andheparin-binding EGF-like growth factor (HBEGF). Genes were normal-ized to 18S. Graphical representation of the relative mRNA levels innormal AA and CA astrocytes (n = 8, respectively, two-tailed t-test wasused. * indicate p,0.05). B, C. Seven CA samples and six AA sampleswere used in ELISA experiment. B. The total amount of secreted andintracellular HBEGF is significantly lower in AA astrocytes compared toCA astrocytes (** indicated p,0.01 in two-tailed t-test) C. The level ofsecreted IL-6 is significantly lower in AA astrocytes compared to CAastrocytes (* indicated p,0.05 in two-tailed t-test).doi:10.1371/journal.pone.0002847.g007
Astrocyte Gene Expression
PLoS ONE | www.plosone.org 10 August 2008 | Volume 3 | Issue 8 | e2847

in the retina and ONH in response to oxidative stress and in
glaucoma [65].
Our study raises many questions that will require future
investigations. Our data indicates that the microenvironment
supported by astrocytes in the normal ONH in AA has important
differences that may impact susceptibility to glaucomatous optic
neuropathy. An important question that remains is whether the
observed differential gene expressions in AA astrocytes compared
to CA astrocytes are the result of continued exposure to stress
signals in vivo or represent subtle genetic changes in the AA
population. Thus, differential gene expression amongst AA and
CA astrocytes may provide a basis for higher risk for developing
glaucoma in AA. Current studies in ONH astrocytes from
glaucomatous donors further supports our hypothesis that the
gene expression profile of normal AA astrocytes anticipates the
changes seen in reactive astrocytes in glaucomatous optic
neuropathy.
Materials and Methods
Human eyesTwenty one human eyes from 21 normal age-matched
Caucasian American (CA) donors (age 62612) and 16 human
eyes from 16 normal African Americans (AA) (age 60611) were
used in this study to generate primary cultures of optic nerve head
(ONH) astrocytes (Table S1).
Donors did not have history of eye disease, diabetes, or chronic
CNS disease. Eyes were obtained from the local eye banks and
from the National Disease Research Interchange (NDRI) (Table
S1). Eyes were enucleated shortly after death and maintained at
4uC. Optic nerve heads were dissected within 24 hr of death and
processed to generate ONH astrocytes [14,15]. In order to
determine whether the eyes in this study did not have hidden optic
nerve disease, samples of the myelinated nerves were fixed in 4%
paraformaldehyde, post-fixed in osmium, embedded in epoxy
resin and stained with paraphenylendiamine to detect axon
degeneration [66,67].
Astrocytes CulturesCultures of human ONH astrocytes were generated as
previously described [15]. Briefly, four explants from each lamina
cribrosa were dissected and placed into 25-cm2 Primaria tissue
culture flasks (Falcon, Lincoln Park, NJ). Explants were main-
tained in DMEM/F-12 supplemented with 10% FBS (Biowhit-
taker, Walkerswille, MD) and 10 ml/ml of PSFM (10,000 U/ml
penicillin, 10,000 mg/ml streptomycin and 25 mg/ml amphoter-
icin B; Gibco/BRL, Gaithersburg, MD). Cells were kept in a
37uC, 5% CO2 incubator. After 2–4 weeks, primary cultures were
purified by using modified immunopanning procedure described
by Mi and Barres (1999) [68]. Purified cells were expanded after
characterization by immunostaining for astrocyte markers GFAP
and NCAM as described [15]. Second passage cell cultures were
stored in RPMI 1640 with 10% DMSO in liquid nitrogen until
use. For each set of experiments, cells were thawed and cultured
for one more passage so that sufficient cells from the same batch
were available in each set of experiments.
Oligonucleotide Microarray AnalysisNormal human eyes used for microarray were from 12 CA
normal donors (age 58611) and 12 AA normal donors (age
58612) (Table S1). Total RNA was extracted using Qiagen
RNeasy mini kits (Qiagen, Valencia, CA). RNA was then purified
and quantified by measuring absorbance at 260 nm. Quality and
intactness of the RNA was assessed by capillary electrophoresis
analysis using an Agilent 2100 Bioanalyzer (Agilent, Palo Alto,
CA). cDNA was synthesized from 2–5 mg purified RNA by using
Superscript Choice system (Gibco BRL Life Technologies,
Gaithersburg, MD ) and T7-(dT)24 primer (GENSET, La Jolla,
CA). Using Bioassay High Yield RNA Transcript Labeling Kit
(Enzo Diagnostics, Farmingdale, NY), in vitro transcription was
carried out by using the cleaned double-stranded cDNA as a
template in the presence of biotinylated UTP and CTP. Purified
biotin-labeled cRNA was fragmented before the hybridization.
Hybridization of the labeled cRNA to Human Genome HG
U133A and HG U133A 2.0 chips (Affymetrix, Santa Clara, CA)
was carried out by using Genechip Instrument System (Affymetrix)
at the Genechip Core Facility of Washington University (Saint
Louis, MO). The arrays were washed and stained with
streptavidin-phycoerythrin (Molecular Probes, Eugene, OR)
followed by scanning with an Agilent GeneArray Scanner
G2500A (Agilent Technologies, Palo Alto, CA).
Data AnalysisPretreatment of Data. The first step in the analysis of the
microarray data was to determine which genes were to be
considered ‘‘present’’ or ‘‘absent.’’ We estimated the probe-set
present/absent calls by using the Wilcoxon signed rank-based
algorithm [69]. In order to reduce false positives, we removed the
‘‘absent’’ probe-sets from all samples.
Comparison between ONH astrocytes from normal AA and
CA donors. We used RMA and Bioconductor in R [70] for
background correction and normalization [71,72]. Genes with
significant differential expression levels were detected by SAM
(significance analysis of microarray data) and ANOVA. The false
discovery rate (FDR) was set #5%. A total of 54 chips of non-pooled
RNAs represented 2 or 3 technical replicates for each of the 24
biological samples. Of the 54 chips, 18 were Human Genome U133A
chips (6 biological samples) and 36 were Human Genome U133A 2.0
chips (18 biological samples). Expression values on the slightly
different two Affymetrix platforms were first matched and merged in
R. In addition, we also applied routines implemented in Limma of
Bioconductor [73] to fit linear models to identify differentially
expressed genes between both populations. A mixed effects model
was used to account for the effect of technical replicates. The results
are generally consistent between both methods.
Gene Ontology Analysis. To assess the biological significance
of the gene list derived above we classified differentially expressed
genes in normal AA and CA by manual separation by function
using available data from public databases such as UniGene,
OMIM and Entrez PubMed and the gene lists from RMA/SAM.
In addition, we used GOstats Bioconductor package [70] for the
gene ontology (GO) analysis. The identification process of
differentially expressed gene was similar as described in previous
section. In order to get longer gene lists, the p-value threshold was
set at 0.05 without FDR adjustment. The Hypergeometric test was
used to identify the over-represented GO categories based on the
identified gene list. Patterns of gene expression within the
differentially expressed genes in each group were assessed for
over-representation in the context of molecular function, biolog-
ical process, and cellular component.
Real-time quantitative RT-PCRIndependent confirmation of differential expression was con-
ducted using 17 astrocyte cultures from CA and 13 astrocyte
cultures from AA age-matched donors obtained as described earlier
in Methods. Cytoplasmic RNA was isolated from cultured ONH
astrocytes (passage 3) as previously described [74]. Primers
sequences are described in Table S7. cDNA was synthesized using
Astrocyte Gene Expression
PLoS ONE | www.plosone.org 11 August 2008 | Volume 3 | Issue 8 | e2847

SuperScript III First-strand synthesis system (Invitrogen, CA)
following manufacturer’s protocol. Quantitative RT-PCR was
performed by monitoring in real time the increase in fluorescence
of SYBR-Green using the MyiQ Single Color Real-Time PCR
Detection System (Bio-Rad; Hercules, CA). cDNA from all samples
were mixed and used as standards. Serial dilutions (1:5, 1:10, 1:40,
1:160 and 1:640) of the mixed cDNA were used for standard curves.
Sample cDNA was used at 1:20 dilution. All experiments were
carried out in triplicate and astrocytes derived from one eye of each
donor were used. And the relative amounts of mRNA for target
genes were normalized to the amounts of reference gene RNA (18S)
in each sample. The means of relative expression values were
considered significantly different when p,0.05 (unpaired t- test).
Primer sequence were described in Table S7.
Western BlotsHuman ONH astrocytes were grown until reaching 90%
confluence and Western blot analysis was carried out as previously
described [74]. Protein lysate were generated from eight AA
cultures and eight CA cultures each from one eye of each
individual. The antibodies names, sources and dilutions used are
described in Table S8. Membranes were washed in TBS-T and
then incubated with the appropriate secondary antibody conju-
gated to horseradish peroxidase for 1 h. For detection we used BM
chemiluminescence detection system (Roche, Indianapolis, IN).
Membranes were stripped and reprobed with anti-b-actin
antibody as loading control. Western blots were run in duplicate,
each containing four normal AA and four normal CA samples.
Detail methods are described in Text S1.
ELISAELISA was used to determine the content of HB-EGF and IL-6,
using ELISA kits (R & D Systems) specific for each protein. Both
cell lysate and culture medium were measured. When cells
reached confluence, they were washed with PBS before changed
into serum-free DMEM/F-12 medium. After 24 hours of
incubation, medium was collected, clarified by centrifugation,
and concentrated using Centriprep YM-10 (Millipore) with a
molecular weight cut-off of 10,000 kDa. As a control, fresh
medium was collected and concentrated in the same fashion. Cells
were collected and lysed in 100 ml of 50 mM phosphate buffer
with sonication. Five ml of the supernatant was used to measure
protein concentration using the Pierce Protein Assay Kit (BCA
method). Assay was carried out according to manufacture’s
protocol. The content for each sample was calculated based on
the standard curve, and results were expressed as content (nmol)
per mg protein. Six normal AA and seven CA samples were used.
The means of the content were considered significantly different if
p,0.05 (unpaired t-test).
Cell adhesion assayAdhesion was measured in six CA samples and four AA samples
using CytoSelectTM Cell Adhesion Assay (Cell Biolabs). Cells were
harvested and resuspended in serum-free DMEM/F-12 medium.
For each donor, four Collagen IV coated wells and one BSA
coated well were used. Fifty thousand cells were added to each well
in a volume of 150 ml. For each donor, one Collagen IV well was
treated with sterile serum-free DMEM F12 as a negative control.
The plate was then incubated at 37uC, 5% CO2 for 90 minutes.
The cells were then washed 4 times with 250 ml of PBS. 200 ml of
cell stain solution (Cell Biolabs) was then added to each well and
incubated for 10 minutes at room temperature. The stain was then
removed and the cells were washed four times with 500 ml
deionized water. After allowing the cells to air dry for 25 minutes,
200 ml of extraction solution (Cell Biolabs) was added to each well
and placed on an orbital shaker for 10 minutes. Extracted
samples’ absorbance was measured at 560 nm by a Thermo
Multiskan Spectrum plate reader. Results were corrected by
subtracting absorbance of the negative controls. The means from
AA and CA groups were considered significantly different if
p,0.05 (unpaired t-test).
Migration assayMigratory properties of five CA samples and six AA samples
were measured by CytoSelectTM 24-well cell migration assay (Cell
BioLabs). Assay was performed according to the manufacture’s
protocol. Five hundred ml of media supplemented with 10% fetal
bovine serum was added to the bottom wells. Fifty thousand cells
resuspended in 300 ml serum-free medium were added to the
inserts. The plate was then incubated at 37uC, 5% CO2 for
24 hours. After removing the media from the inserts, non-
migratory cells from the interior of the inserts were removed with
cotton-tipped swabs. The inserts were stained with 400 ml of cell
staining solution and washed three times with water before
transferred to a clean well with 200 ml of extraction solution. The
absorbance of the extracted samples was measured at 560 nm by a
Thermo Multiskan Spectrum plate reader. The means from AA
and CA groups were considered significantly different if p,0.05
(unpaired t-test). To inhibit MYLK, 10 mM of ML-7 (EMD
Biosciences) [75] was added to culture medium 24 hours before
the migration assay and maintained during the assay. Assay was
performed according to the manufacturer’s protocol, as described
above. Three AA samples were used in the assay with ML-7
inhibition. The means from treated and untreated were considered
significantly different if p,0.05 (unpaired t-test).
Glutathione (GSH) assayTotal GSH content was quantified in astrocyte cell lysates based on
previously described methods using the Glutathione Assay Kit from
Cayman Chemical (Ann Arbor, MI) [76]. Cells were grown to
confluence in 100 mm dishes and collected in 1.0 mL sterile PBS
using a disposable cell lifter. Cell suspension were centrifuged,
supernatant was removed, and 100 ml of 50 mM phosphate buffer
were added to the cell pellet and sonicated in icy bath for 30 min.
Samples were then centrifuged for 15 min at 4uC, the supernatant
was collected, and 5 ml of the supernatant were used to measure the
protein concentration using the Pierce Protein Assay Kit (BCA
method). The remaining supernatant was deproteinated as described
in the assay protocol. Standards and samples were then aliquoted in a
96-well plate. Freshly prepared assay cocktail was added to each well,
then the plate was incubated in the dark on an orbital shaker for
25 min. Absorbance was measured at 405 nm using a plate reader.
Total GSH content for each sample was calculated based on the
standard curve, and results were expressed as total GSH content
(nmol) per mg protein. Ten AA and 10 CA normal donor samples
were measured and the means of the content were considered
significantly different when p,0.05 (Unpaired t-test).
Immunohistochemistry (IHC)Six eyes from normal Caucasian donors (CA) and six eyes from
normal age-matched African American (AA) donors were used.
Detail methods are described in Text S1.
ImmunocytochemistryPrimary ONH astrocytes from six normal AA donors and from
six normal CA donors were used. Detail methods are described in
Text S1.
Astrocyte Gene Expression
PLoS ONE | www.plosone.org 12 August 2008 | Volume 3 | Issue 8 | e2847
Supporting Information
Table S1 Demographic information of normal donors. Demo-
graphic information of CA and AA normal donor eyes used to
generate primary cultures of ONH astrocytes.
Found at: doi:10.1371/journal.pone.0002847.s001 (0.09 MB
DOC)
Table S2 Genes differentially expressed in ONH astrocytes from
normal AA donors compared to their caucasian counterpart using
RMA SAM. List of genes differentially expressed in AA ONH
astrocytes compared to CA ONH astrocytes, obtained by RMA-
SAM analysis.
Found at: doi:10.1371/journal.pone.0002847.s002 (0.11 MB
DOC)
Table S3 Genes differentially expressed in normal AA ONH
astrocytes compared to their CA counterpart using Lima. List of
genes differentially expressed in AA ONH astrocytes compared to
CA ONH astrocytes, obtained by using Limma package in
Bioconductor.
Found at: doi:10.1371/journal.pone.0002847.s003 (0.06 MB
DOC)
Table S4 Functional analysis of genes differentially expressed in
AA vs. CA. Functional classification of genes differentially
expressed in AA ONH astrocytes compared to and CA ONH
astrocytes.
Found at: doi:10.1371/journal.pone.0002847.s004 (0.06 MB
DOC)
Table S5 Selected Gene ontology for AA-CA comparison. Gene
Ontology for genes differentially expressed in AA ONH astrocytes
compared to and CA ONH astrocytes.
Found at: doi:10.1371/journal.pone.0002847.s005 (0.04 MB
DOC)
Table S6 Real-Time PCR validation of microarray expression
analysis of normal Caucasian American and African American
ONH astrocytes. Real-Time PCR validation of microarray
expression analysis of normal CA and AA ONH astrocytes.
Found at: doi:10.1371/journal.pone.0002847.s006 (0.08 MB
DOC)
Table S7 Quantitative RT-PCR primer information. RT-PCR
primer infortion
Found at: doi:10.1371/journal.pone.0002847.s007 (0.10 MB
DOC)
Table S8 Primary Antibodies Used in this study. Information on
the primary antibodies used in this study.
Found at: doi:10.1371/journal.pone.0002847.s008 (0.04 MB
DOC)
Text S1 Supplemental Methods. Detailed methods for Western
Blots, immunohistochemistry and immunocytochemistry.
Found at: doi:10.1371/journal.pone.0002847.s009 (0.05 MB
DOC)
Acknowledgments
We gratefully acknowledge Jose Bongolan for immunohistochemistry
staining and Marina Vracar-Grabar for cell culture. We also thank
Genechip Core Facility of Washington University for microarray
experiments.
Author Contributions
Conceived and designed the experiments: MRH. Performed the
experiments: HM LC SMR WL SJ AMC AW OAA PY. Analyzed the
data: PD SML CG. Wrote the paper: HM TL MRH.
References
1. Weinreb RN, Khaw PT (2004) Primary open-angle glaucoma. Lancet 363:1711–1720.
2. Sommer A, Tielsch JM, Katz J, Quigley HA, Gottsch JD, et al. (1991)
Relationship between intraocular pressure and primary open angle glaucomaamong white and black Americans. The Baltimore Eye Survey. Arch
Ophthalmol 109: 1090–1095.
3. Quigley HA (1999) Neuronal death in glaucoma. Prog Retin Eye Res 18: 39–57.
4. Quigley HA, Hohman RM, Addicks EM, Massof RW, Green WR (1983)Morphologic changes in the lamina cribrosa correlated with neural loss in open-
angle glaucoma. Am J Ophthalmol 95: 673–691.
5. Hernandez MR, Pena JD (1997) The optic nerve head in glaucomatous opticneuropathy. Arch Ophthalmol 115: 389–395.
6. Ridet JL, Malhotra SK, Privat A, Gage FH (1997) Reactive astrocytes: cellular
and molecular cues to biological function. Trends Neurosci 20: 570–577.
7. Hatten ME, Liem RK, Shelanski ML, Mason CA (1991) Astroglia in CNSinjury. Glia 4: 233–243.
8. Neufeld AH, Hernandez MR, Gonzalez M (1997) Nitric oxide synthase in the
human glaucomatous optic nerve head. Arch Ophthalmol 115: 497–503.
9. Tezel G, Wax MB (2000) Increased production of tumor necrosis factor-alphaby glial cells exposed to simulated ischemia or elevated hydrostatic pressure
induces apoptosis in cocultured retinal ganglion cells. J Neurosci 20: 8693–8700.
10. Burgoyne CF, Downs JC, Bellezza AJ, Suh JK, Hart RT (2005) The optic nervehead as a biomechanical structure: a new paradigm for understanding the role of
IOP-related stress and strain in the pathophysiology of glaucomatous optic nervehead damage. Prog Retin Eye Res 24: 39–73.
11. Leske MC (2007) Open-angle glaucoma – an epidemiologic overview.
Ophthalmic Epidemiol 14: 166–172.
12. Nemesure B, Jiao X, He Q, Leske MC, Wu SY, et al. (2003) A genome-widescan for primary open-angle glaucoma (POAG): the Barbados Family Study of
Open-Angle Glaucoma. Hum Genet 112: 600–609.
13. Rotimi CN, Chen G, Adeyemo AA, Jones LS, Agyenim-Boateng K, et al. (2006)Genomewide scan and fine mapping of quantitative trait loci for intraocular
pressure on 5q and 14q in West Africans. Invest Ophthalmol Vis Sci 47:
3262–3267.
14. Kobayashi S, Vidal I, Pena JD, Hernandez MR (1997) Expression of neural cell
adhesion molecule (NCAM) characterizes a subpopulation of type 1 astrocytes in
human optic nerve head. Glia 20: 262–273.
15. Yang P, Hernandez MR (2003) Purification of astrocytes from adult humanoptic nerve heads by immunopanning. Brain Res Brain Res Protoc 12: 67–76.
16. Benjamini Y, Hochberg Y (1995) Controlling the False Discovery Rate: A
Practical and Powerful Approach to Multiple Testing. Journal of the RoyalStatistical Society Series B (Methodological) 57: 289–300.
17. Ohlmann AV, Ohlmann A, Welge-Lussen U, May CA (2005) Localization of
collagen XVIII and endostatin in the human eye. Curr Eye Res 30: 27–34.
18. Ruotsalainen H, Sipila L, Vapola M, Sormunen R, Salo AM, et al. (2006)
Glycosylation catalyzed by lysyl hydroxylase 3 is essential for basementmembranes. J Cell Sci 119: 625–635.
19. Agapova OA, Kaufman PL, Lucarelli MJ, Gabelt BT, Hernandez MR (2003)
Differential expression of matrix metalloproteinases in monkey eyes withexperimental glaucoma or optic nerve transection. Brain Res 967: 132–143.
20. Schmidt JF, Agapova OA, Yang P, Kaufman PL, Hernandez MR (2007)
Expression of ephrinB1 and its receptor in glaucomatous optic neuropathy.Br J Ophthalmol 91: 1219–1224.
21. Rudzinski MN, Chen L, Hernandez MR (2008) Antiangiogenic characteristics
of astrocytes from optic nerve heads with primary open-angle glaucoma. Arch
Ophthalmol 126: 679–685.
22. Urban Z, Agapova O, Hucthagowder V, Yang P, Starcher BC, et al. (2007)Population differences in elastin maturation in optic nerve head tissue and
astrocytes. Invest Ophthalmol Vis Sci 48: 3209–3215.
23. Violin JD, Ren XR, Lefkowitz RJ (2006) G-protein-coupled receptor kinasespecificity for beta-arrestin recruitment to the beta2-adrenergic receptor revealed
by fluorescence resonance energy transfer. J Biol Chem 281: 20577–20588.
24. Liang Y, Li C, Guzman VM, Chang WW, Evinger AJ 3rd, et al. (2005)Identification of a novel alternative splicing variant of RGS5 mRNA in human
ocular tissues. Febs J 272: 791–799.
25. Heckbert SR, Hindorff LA, Edwards KL, Psaty BM, Lumley T, et al. (2003)
Beta2-adrenergic receptor polymorphisms and risk of incident cardiovascularevents in the elderly. Circulation 107: 2021–2024.
26. Morrison JC (2006) Integrins in the optic nerve head: potential roles in
glaucomatous optic neuropathy (an American Ophthalmological Society thesis).Trans Am Ophthalmol Soc 104: 453–477.
27. Milner R, Relvas JB, Fawcett J, ffrench-Constant C (2001) Developmental
regulation of alphav integrins produces functional changes in astrocyte behavior.
Mol Cell Neurosci 18: 108–118.
Astrocyte Gene Expression
PLoS ONE | www.plosone.org 13 August 2008 | Volume 3 | Issue 8 | e2847

28. Ke N, Sundaram R, Liu G, Chionis J, Fan W, et al. (2007) Orphan G protein-
coupled receptor GPR56 plays a role in cell transformation and tumorigenesisinvolving the cell adhesion pathway. Mol Cancer Ther 6: 1840–1850.
29. Fuller T, Korff T, Kilian A, Dandekar G, Augustin HG (2003) Forward EphB4
signaling in endothelial cells controls cellular repulsion and segregation fromephrinB2 positive cells. J Cell Sci 116: 2461–2470.
30. Vuori K, Ruoslahti E (1999) Connections count in cell migration. Nat Cell Biol1: E85–87.
31. Ricard CS, Kobayashi S, Pena JD, Salvador-Silva M, Agapova O, et al. (2000)
Selective expression of neural cell adhesion molecule (NCAM)-180 in optic nervehead astrocytes exposed to elevated hydrostatic pressure in vitro. Brain Res Mol
Brain Res 81: 62–79.32. Wax MB, Tezel G, Kobayashi S, Hernandez MR (2000) Responses of different
cell lines from ocular tissues to elevated hydrostatic pressure. Br J Ophthalmol84: 423–428.
33. Salvador-Silva M, Aoi S, Parker A, Yang P, Pecen P, et al. (2004) Responses and
signaling pathways in human optic nerve head astrocytes exposed to hydrostaticpressure in vitro. Glia 45: 364–377.
34. Gallagher PJ, Herring BP, Griffin SZ, Stull JT (1992) Molecular characterizationof a mammalian smooth muscles myosin light chain kinase. J Biol Chem 267:
9450.
35. Onishi Y, Tsukada K, Yokota J, Raz A (2003) Overexpression of autocrinemotility factor receptor (AMFR) in NIH3T3 fibroblasts induces cell transfor-
mation. Clin Exp Metastasis 20: 51–58.36. Leclerc N, Vallee A, Nabi IR (2000) Expression of the AMF/neuroleukin
receptor in developing and adult brain cerebellum. J Neurosci Res 60: 602–612.37. Ito M, Nakano T, Erdodi F, Hartshorne DJ (2004) Myosin phosphatase:
structure, regulation and function. Mol Cell Biochem 259: 197–209.
38. Gao L, Grant A, Halder I, Brower R, Sevransky J, et al. (2006) Novelpolymorphisms in the myosin light chain kinase gene confer risk for acute lung
injury. Am J Respir Cell Mol Biol 34: 487–495.39. Flores C, Ma SF, Maresso K, Ober C, Garcia JG (2007) A variant of the myosin
light chain kinase gene is associated with severe asthma in African Americans.
Genet Epidemiol 31: 296–305.40. Thorleifsson G, Magnusson KP, Sulem P, Walters GB, Gudbjartsson DF, et al.
(2007) Common sequence variants in the LOXL1 gene confer susceptibility toexfoliation glaucoma. Science 317: 1397–1400.
41. Netland PA, Ye H, Streeten BW, Hernandez MR (1995) Elastosis of the laminacribrosa in pseudoexfoliation syndrome with glaucoma. Ophthalmology 102:
878–886.
42. Karonen T, Jeskanen L, Keski-Oja J (1997) Transforming growth factor beta 1and its latent form binding protein-1 associate with elastic fibres in human
dermis: accumulation in actinic damage and absence in anetoderma.Br J Dermatol 137: 51–58.
43. Saharinen J, Hyytiainen M, Taipale J, Keski-Oja J (1999) Latent transforming
growth factor-beta binding proteins (LTBPs)–structural extracellular matrixproteins for targeting TGF-beta action. Cytokine Growth Factor Rev 10:
99–117.44. Annes JP, Munger JS, Rifkin DB (2003) Making sense of latent TGFbeta
activation. J Cell Sci 116: 217–224.45. Lutjen-Drecoll E (2005) Morphological changes in glaucomatous eyes and the
role of TGFbeta2 for the pathogenesis of the disease. Exp Eye Res 81: 1–4.
46. Pena JD, Taylor AW, Ricard CS, Vidal I, Hernandez MR (1999) Transforminggrowth factor beta isoforms in human optic nerve heads. Br J Ophthalmol 83:
209–218.47. Gersdorff N, Kohfeldt E, Sasaki T, Timpl R, Miosge N (2005) Laminin gamma3
chain binds to nidogen and is located in murine basement membranes. J Biol
Chem 280: 22146–22153.48. Tu H, Sasaki T, Snellman A, Gohring W, Pirila P, et al. (2002) The type XIII
collagen ectodomain is a 150-nm rod and capable of binding to fibronectin,nidogen-2, perlecan, and heparin. J Biol Chem 277: 23092–23099.
49. Sariola H, Saarma M (2003) Novel functions and signalling pathways for
GDNF. J Cell Sci 116: 3855–3862.50. Wordinger RJ, Lambert W, Agarwal R, Liu X, Clark AF (2003) Cells of the
human optic nerve head express glial cell line-derived neurotrophic factor(GDNF) and the GDNF receptor complex. Mol Vis 9: 249–256.
51. Beattie J, Allan GJ, Lochrie JD, Flint DJ (2006) Insulin-like growth factor-binding protein-5 (IGFBP-5): a critical member of the IGF axis. Biochem J 395:
1–19.
52. Liu B, Chen H, Johns TG, Neufeld AH (2006) Epidermal growth factor receptoractivation: an upstream signal for transition of quiescent astrocytes into reactive
astrocytes after neural injury. J Neurosci 26: 7532–7540.
53. Tschumperlin DJ, Dai G, Maly IV, Kikuchi T, Laiho LH, et al. (2004)
Mechanotransduction through growth-factor shedding into the extracellular
space. Nature 429: 83–86.
54. Gris P, Tighe A, Levin D, Sharma R, Brown A (2007) Transcriptional regulation
of scar gene expression in primary astrocytes. Glia 55: 1145–1155.
55. Sappington RM, Calkins DJ (2006) Pressure-induced regulation of IL-6 in
retinal glial cells: involvement of the ubiquitin/proteasome pathway and
NFkappaB. Invest Ophthalmol Vis Sci 47: 3860–3869.
56. Mense SM, Sengupta A, Zhou M, Lan C, Bentsman G, et al. (2006) Gene
expression profiling reveals the profound upregulation of hypoxia-responsive
genes in primary human astrocytes. Physiol Genomics 25: 435–449.
57. Ransohoff RM, Estes ML (1991) Astrocyte expression of major histocompat-
ibility complex gene products in multiple sclerosis brain tissue obtained by
stereotactic biopsy. Arch Neurol 48: 1244–1246.
58. Maiers M, Gragert L, Klitz W (2007) High-resolution HLA alleles and
haplotypes in the United States population. Hum Immunol 68: 779–788.
59. Farina C, Aloisi F, Meinl E (2007) Astrocytes are active players in cerebral innate
immunity. Trends Immunol 28: 138–145.
60. Dringen R (2000) Metabolism and functions of glutathione in brain. Prog
Neurobiol 62: 649–671.
61. Unal M, Guven M, Devranoglu K, Ozaydin A, Batar B, et al. (2007)
Glutathione S transferase M1 and T1 genetic polymorphisms are related to the
risk of primary open-angle glaucoma: a study in a Turkish population.
Br J Ophthalmol 91: 527–530.
62. Yildirim O, Ates NA, Tamer L, Oz O, Yilmaz A, et al. (2005) May glutathione
S-transferase M1 positive genotype afford protection against primary open-angle
glaucoma? Graefes Arch Clin Exp Ophthalmol 243: 327–333.
63. Juronen E, Tasa G, Veromann S, Parts L, Tiidla A, et al. (2000) Polymorphic
glutathione S-transferase M1 is a risk factor of primary open-angle glaucoma
among Estonians. Exp Eye Res 71: 447–452.
64. Drozdz R, Parmentier C, Hachad H, Leroy P, Siest G, et al. (1998) gamma-
Glutamyltransferase dependent generation of reactive oxygen species from a
glutathione/transferrin system. Free Radic Biol Med 25: 786–792.
65. Tezel G (2006) Oxidative stress in glaucomatous neurodegeneration: mecha-
nisms and consequences. Prog Retin Eye Res 25: 490–513.
66. Pena JDO, Agapova O, Gabelt BAT, Levin LA, Lucarelli MJ, et al. (2001)
Increased elastin expression in astrocytes of the lamina cribrosa in response to
elevated intraocular pressure. Investigative Ophthalmology & Visual Science 42:
2303–2314.
67. Hernandez MR, Agapova OA, Yang P, Salvador-Silva M, Ricard CS, et al.
(2002) Differential gene expression in astrocytes from human normal and
glaucomatous optic nerve head analyzed by cDNA microarray. Glia 38: 45–64.
68. Mi H, Barres BA (1999) Purification and characterization of astrocyte precursor
cells in the developing rat optic nerve. J Neurosci 19: 1049–1061.
69. Liu WM, Mei R, Di X, Ryder TB, Hubbell E, et al. (2002) Analysis of high
density expression microarrays with signed-rank call algorithms. Bioinformatics
18: 1593–1599.
70. Gentleman RC, Carey VJ, Bates DM, Bolstad B, Dettling M, et al. (2004)
Bioconductor: open software development for computational biology and
bioinformatics. Genome Biol 5: R80.
71. Irizarry RA, Hobbs B, Collin F, Beazer-Barclay YD, Antonellis KJ, et al. (2003)
Exploration, normalization, and summaries of high density oligonucleotide array
probe level data. Biostatistics 4: 249–264.
72. Bolstad BM, Irizarry RA, Astrand M, Speed TP (2003) A comparison of
normalization methods for high density oligonucleotide array data based on
variance and bias. Bioinformatics 19: 185–193.
73. Smyth GK, Michaud J, Scott HS (2005) Use of within-array replicate spots for
assessing differential expression in microarray experiments. Bioinformatics 21:
2067–2075.
74. Agapova OA, Ricard CS, Salvador-Silva M, Hernandez MR (2001) Expression
of matrix metalloproteinases and tissue inhibitors of metalloproteinases in
human optic nerve head astrocytes. Glia 33: 205–216.
75. Gutjahr MC, Rossy J, Niggli V (2005) Role of Rho, Rac, and Rho-kinase in
phosphorylation of myosin light chain, development of polarity, and spontane-
ous migration of Walker 256 carcinosarcoma cells. Exp Cell Res 308: 422–438.
76. Hu XM, Hirano T, Oka K (2003) Arsenic trioxide induces apoptosis in cells of
MOLT-4 and its daunorubicin-resistant cell line via depletion of intracellular
glutathione, disruption of mitochondrial membrane potential and activation of
caspase-3. Cancer Chemother Pharmacol 52: 47–58.
Astrocyte Gene Expression
PLoS ONE | www.plosone.org 14 August 2008 | Volume 3 | Issue 8 | e2847
Copyright © 2022 FDOKUMEN