Metabolic regulation analysis of an ethanologenic Escherichia coli strain based on RT-PCR and...
13
BioMed Central Page 1 of 13 (page number not for citation purposes) Biotechnology for Biofuels Open Access Research Metabolic regulation analysis of an ethanologenic Escherichia coli strain based on RT-PCR and enzymatic activities Montserrat Orencio-Trejo, Noemí Flores, Adelfo Escalante, Georgina Hernández-Chávez, Francisco Bolívar, Guillermo Gosset and Alfredo Martinez* Address: Departamento de Ingeniería Celular y Biocatálisis, Instituto de Biotecnología, Universidad Nacional Autónoma de México. Cuernavaca, Mor., México Email: Montserrat Orencio-Trejo - [email protected]; Noemí Flores - [email protected]; Adelfo Escalante - [email protected]; Georgina Hernández-Chávez - [email protected]; Francisco Bolívar - [email protected]; Guillermo Gosset - [email protected]; Alfredo Martinez* - [email protected] * Corresponding author Abstract Background: A metabolic regulation study was performed, based upon measurements of enzymatic activities, fermentation performance, and RT-PCR analysis of pathways related to central carbon metabolism, in an ethanologenic Escherichia coli strain (CCE14) derived from lineage C. In comparison with previous engineered strains, this E coli derivative has a higher ethanol production rate in mineral medium, as a result of the elevated heterologous expression of the chromosomally integrated genes encoding PDC Zm and ADH Zm (pyruvate decarboxylase and alcohol dehydrogenase from Zymomonas mobilis). It is suggested that this behavior might be due to lineage differences between E. coli W and C. Results: This study demonstrated that the glycolytic flux is controlled, in this case, by reactions outside glycolysis, i.e., the fermentative pathways. Changes in ethanol production rate in this ethanologenic strain result in low organic acid production rates, and high glycolytic and ethanologenic fluxes, that correlate with enhanced transcription and enzymatic activity levels of PDC Zm and ADH Zm . Furthermore, a higher ethanol yield (90% of the theoretical) in glucose-mineral media was obtained with CCE14 in comparison with previous engineered E. coli strains, such as KO11, that produces a 70% yield under the same conditions. Conclusion: Results suggest that a higher ethanol formation rate, caused by ahigher PDC Zm and ADH Zm activities induces a metabolic state that cells compensate through enhanced glucose transport, ATP synthesis, and NAD-NADH+H turnover rates. These results show that glycolytic enzymatic activities, present in E. coli W and C under fermentative conditions, are sufficient to contend with increases in glucose consumption and product formation rates. Published: 1 May 2008 Biotechnology for Biofuels 2008, 1:8 doi:10.1186/1754-6834-1-8 Received: 12 February 2008 Accepted: 1 May 2008 This article is available from: http://www.biotechnologyforbiofuels.com/content/1/1/8 © 2008 Orencio-Trejo et al; licensee BioMed Central Ltd. This is an Open Access article distributed under the terms of the Creative Commons Attribution License (http://creativecommons.org/licenses/by/2.0 ), which permits unrestricted use, distribution, and reproduction in any medium, provided the original work is properly cited.
Transcript of Metabolic regulation analysis of an ethanologenic Escherichia coli strain based on RT-PCR and...
BioMed CentralBiotechnology for Biofuels
ss
Open AcceResearchMetabolic regulation analysis of an ethanologenic Escherichia coli strain based on RT-PCR and enzymatic activitiesMontserrat Orencio-Trejo, Noemí Flores, Adelfo Escalante, Georgina Hernández-Chávez, Francisco Bolívar, Guillermo Gosset and Alfredo Martinez*Address: Departamento de Ingeniería Celular y Biocatálisis, Instituto de Biotecnología, Universidad Nacional Autónoma de México. Cuernavaca, Mor., México
Email: Montserrat Orencio-Trejo - [email protected]; Noemí Flores - [email protected]; Adelfo Escalante - [email protected]; Georgina Hernández-Chávez - [email protected]; Francisco Bolívar - [email protected]; Guillermo Gosset - [email protected]; Alfredo Martinez* - [email protected]
* Corresponding author
AbstractBackground: A metabolic regulation study was performed, based upon measurements ofenzymatic activities, fermentation performance, and RT-PCR analysis of pathways related to centralcarbon metabolism, in an ethanologenic Escherichia coli strain (CCE14) derived from lineage C. Incomparison with previous engineered strains, this E coli derivative has a higher ethanol productionrate in mineral medium, as a result of the elevated heterologous expression of the chromosomallyintegrated genes encoding PDCZm and ADHZm (pyruvate decarboxylase and alcohol dehydrogenasefrom Zymomonas mobilis). It is suggested that this behavior might be due to lineage differencesbetween E. coli W and C.
Results: This study demonstrated that the glycolytic flux is controlled, in this case, by reactionsoutside glycolysis, i.e., the fermentative pathways. Changes in ethanol production rate in thisethanologenic strain result in low organic acid production rates, and high glycolytic andethanologenic fluxes, that correlate with enhanced transcription and enzymatic activity levels ofPDCZm and ADHZm. Furthermore, a higher ethanol yield (90% of the theoretical) in glucose-mineralmedia was obtained with CCE14 in comparison with previous engineered E. coli strains, such asKO11, that produces a 70% yield under the same conditions.
Conclusion: Results suggest that a higher ethanol formation rate, caused by ahigher PDCZm andADHZm activities induces a metabolic state that cells compensate through enhanced glucosetransport, ATP synthesis, and NAD-NADH+H turnover rates. These results show that glycolyticenzymatic activities, present in E. coli W and C under fermentative conditions, are sufficient tocontend with increases in glucose consumption and product formation rates.
Published: 1 May 2008
Biotechnology for Biofuels 2008, 1:8 doi:10.1186/1754-6834-1-8
Received: 12 February 2008Accepted: 1 May 2008
This article is available from: http://www.biotechnologyforbiofuels.com/content/1/1/8
© 2008 Orencio-Trejo et al; licensee BioMed Central Ltd. This is an Open Access article distributed under the terms of the Creative Commons Attribution License (http://creativecommons.org/licenses/by/2.0), which permits unrestricted use, distribution, and reproduction in any medium, provided the original work is properly cited.
Page 1 of 13(page number not for citation purposes)
Biotechnology for Biofuels 2008, 1:8 http://www.biotechnologyforbiofuels.com/content/1/1/8
BackgroundFermentative metabolism constitutes a fundamental cel-lular capacity for industrial biocatalysis. Endogenousorganic compounds used by cells as terminal electronacceptors under oxygen deprivation are converted intobiochemical products that are waste products for the cell,such as ethanol, lactate, acetate, succinate, formate andhydrogen, but represent valuable molecules to society [1].For example, renewable fuels from biomass, such as etha-nol, constitute energy sources that preserve the environ-ment since the carbon dioxide released from theircombustion can be integrated into a photosynthetic cycle,which does not participate in a net carbon dioxidebuildup into the atmosphere.
Metabolic engineering strategies have been used to mod-ify microorganisms to convert all sugars arising fromchemical-enzymatic hydrolysis of lignocellulose, such asxylose, arabinose, and glucose into ethanol. A wide varietyof research approaches have been employed for this pur-pose; among the most effective attempts are the engineer-ing of different Gram-negative bacteria, such as Escherichiacoli [2-6], Klebsiella oxytoca [7-9] and Zymomonas mobilis[10,11] as well as yeast, such as Saccharomyces cerevisiae[12-16]. One of the most successful strategies to developethanologenic bacteria was developed by Ingram and co-workers [2,3,6-8,17]. In the case of E. coli, the W strain wasengineered for ethanol production by integrating thepyruvate decarboxylase (pdc) and alcohol dehydrogenase(adhII) genes from Z. mobilis, under the control of the pflBpromoter, to obtain strain KO11 [3,17]. Expression fromthis promoter is high under anaerobic conditions [18,19],and ethanologenic E. coli strains, such as KO11 and LY01have shown to be efficient in the conversion of all sugarspresent in lignocellulosic hydrolysates into ethanol[20,21].
Expression profiling is a powerful tool for analyzing genetranscription at a genomic scale. It can be used to compareglobal relative changes in gene expression that occur inresponse to an environmental stimulus or to compare theeffects of genetic modifications on gene expression. Thistype of analysis can provide important information aboutcell physiology and has the potential to identify connec-tions between regulatory or metabolic pathways not pre-viously known [22,23]. Since the physiological state andfermentation performance of a cell is dictated primarily atthe protein level, transcription results should be comple-mented by determining specific enzyme activities to pro-vide a better understanding of the observed phenomenon,considering that enzymatic and transcriptional regulationmechanisms are different [22].
Previous studies have shown that plasmid-encoded levelsof Z. mobilis pyruvate decarboxylase (PDCZm) and alcohol
dehydrogenase II (ADHZm) in E. coli correlate with thetiter and the formation rate of ethanol [24,21,25]. Fur-thermore, the introduction of this heterologous pathwayhas several effects on E. coli physiology under fermentativeconditions, i.e., increases its growth rate and glycolyticflux when cultivated in Luria Broth with xylose [26] orglucose [27]. Gene array studies have also shown that sev-eral genes from the pentose phosphate and glycolyticpathways have statistically significant higher expressionlevels when ethanologenic E. coli (strain KO11) fermentsxylose [26,27].
The present study was conducted to understand the rolethat chromosomally integrated pdcZm and adhZm heterolo-gous expression has on the physiology and metabolic per-formance of E. coli during glucose fermentation in mineralmedia. The regulation of metabolic pathways, related tocentral carbon metabolism and fermentation perform-ance, was studied using mainly the measurements forboth the enzymatic activities of the glycolytic and fermen-tative pathways, as well as transcript levels from genescoding for the enzymes involved in the glycolytic, pentosephosphate, and fermentative pathways. Glucose trans-porters and anaerobic regulators were also analyzed usingtranscriptome data. Evaluation was performed using wildtype E. coli C as the reference strain, and a new ethanolo-genic strain derived from E. coli C, CCE14 (E. coli C:pflB::pdc adhB cat). Interestingly, strain CCE14 has ca. five-fold higher values of PDCZm and ADHZm enzymatic activ-ities than strain KO11 (E. coli W: pflB::pdc adhB cat, ∆frd)[3,17]. The results show that not only the specific ethanolrate, but also the glucose consumption rate (glycolyticflux) are increased as pyruvate decarboxylase and alcoholdehydrogenase transcripts and enzymatic activities areincreased. Moreover, glycolytic flux is controlled by reac-tions outside glycolysis.
Results and discussionEffect of PDCZm and ADHZm activity levels on fermentation performanceIn comparison with the KO11 strain, PDCZm and ADHZmenzymatic specific activities were on average, 5 and 4-foldlarger, respectively, in CCE14 during both exponentialand stationary phases (Fig. 1). Even though the heterolo-gous pathway was integrated into the chromosome ofstrains KO11 and CCE14 using the same method (seematerials and methods section), strong differences wereencountered between PDCZm and ADHZm enzymatic activ-ities, as well as in transcript levels (as shown below). Thisbehavior might be due to lineage differences betweenKO11 and CCE14. It is noteworthy that strain KO11 wassubmitted to high chloramphenicol pressure selection toincrease ethanol productivity [3], in spite of this addi-tional strategy, PDCZm and ADHZm activities were higher
Page 2 of 13(page number not for citation purposes)
Biotechnology for Biofuels 2008, 1:8 http://www.biotechnologyforbiofuels.com/content/1/1/8
in CCE14, wich was not further selected on high chloram-phenicol.
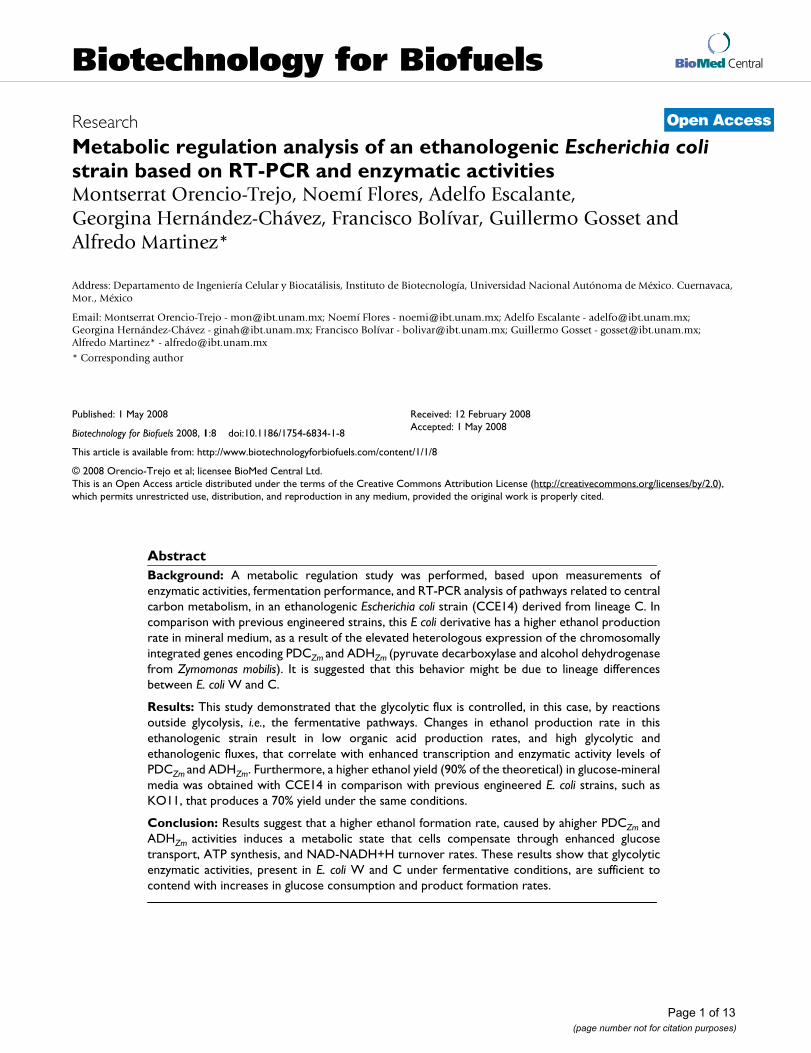
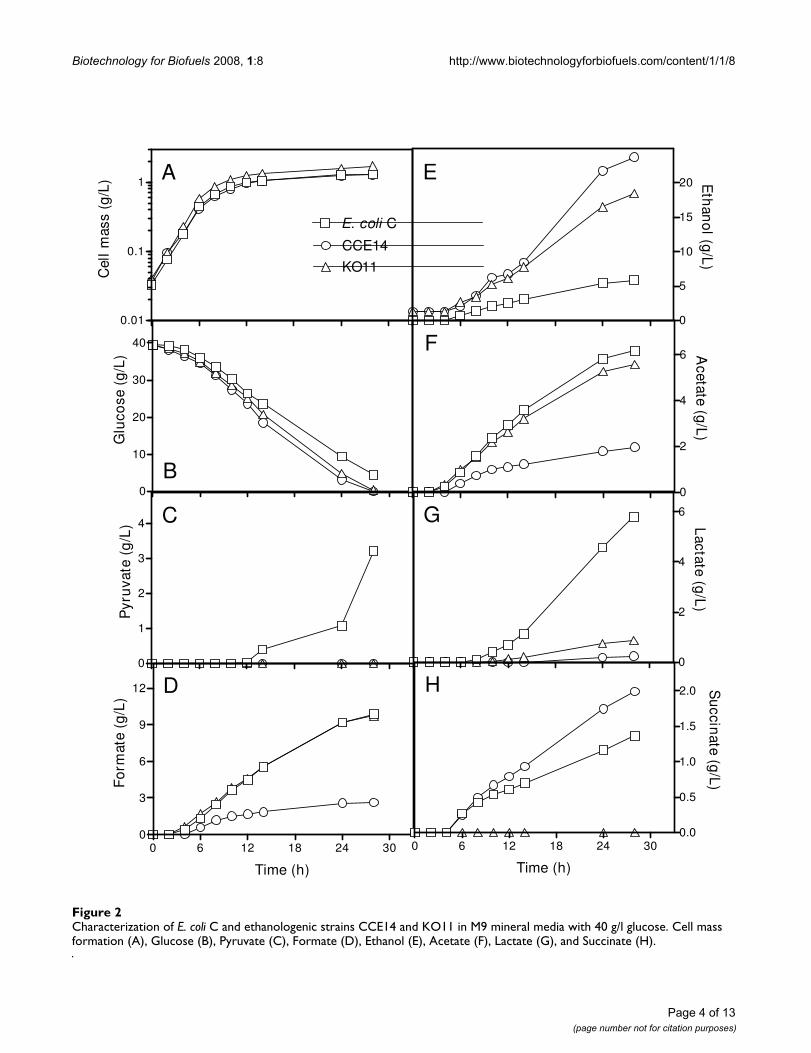
Fermentation performance in mineral medium with 40 g/L glucose is presented in Fig. 2. Fig. 2A–B shows resultsobtained for cell mass formation and glucose consump-tion. Table 2 summarizes rates obtained during the expo-nential and stationary phases. The growth rates of E. coliC, CCE14, and KO11 were similar. During exponentialgrowth, specific glucose consumption rates of the two eth-anologenic strains (KO11 and CCE14) were 28 and 34%higher, respectively, than that obtained for E. coli C, indi-cating that the glycolytic flux increased as a result of pdcZmand adhZm expressions. This behavior correlates well withpreviously reported results for KO11 fermenting xylose[26] or glucose [27] in Luria Broth, where the maximumsugar consumption rate was 50% higher for KO11 thanfor strain W. In spite of the fact that the growth rate wassimilar for the three strains, the maximum cell massobtained at the onset of the stationary phase (after 20hours of fermentation) was similar for KO11 and E. coli C,and lower for CCE14 (Table 2). These results, and data
presented in Fig. 1, indicate that CCE14 directs more car-bon to ethanol production than to biomass biosynthesis.
Fig 2C shows that no pyruvate was secreted by ethanolo-genic strains, but E. coli C produced a significant amount(> 3 g/L) of this metabolite during the stationary phase(Fig 2C). Furthermore, formate production by KO11 andE. coli C were similar, reaching up to 9 g/L when glucosewas exhausted (Fig. 2D). However, formate productionwas lower than 2 g/L for CCE14. PDCZm was originallyselected by Ohta et al [3], largely because it has a very highaffinity for pyruvate (Km for pyruvate 0.4 mM) [28,29] incomparison with all competing fermentation enzymes[24]. This fact and our results indicate that competitionoccurs at the pyruvate node level, and that higher levels ofPDCZm and ADHZm apparently allow more efficient car-bon channeling through the heterologous ethanol path-way.
Although glycolytic fluxes for CCE14 and KO11 were sim-ilar, the ethanol specific formation rate in the exponentialphase (first 6 hours of fermentation elapsed time) was21% higher for CCE14 as compared to KO11 (Table 3).During this phase, the ethanol formation rate in E. coli Cwas negligible (Fig. 2E), whereas formate (Fig. 2D) andacetate (Fig. 2F) were the main products. The increase inethanol production rate was obtained at the expense ofacid production (Table 3, Fig. 2). Pyruvate and lactate(Fig. 2C, 2G) were not produced during this phase inCCE14, whereas formate, acetate, (Fig. 2D, 2F), and succi-nate (Fig. 2H) production were significantly lower thanfor E. coli C and KO11. Balances for this phase indicatecarbon recoveries very close to 100% for the three strainsevaluated (Table 3). These results indicate that the glyco-lytic flux can be controlled by the efficient conversion ofpyruvate into ethanol through the enzymatic activity lev-els of PDCZm and ADHZm in ethanologenic E. coli. It ishypothesized that other fermentative pathways that allowthe efficient regeneration of NAD+ could have the sameeffect.
During the stationary phase, CCE14 produced ethanol80% faster than KO11 (Table 4). Accordingly, specificenzyme activities of PDCZm and ADHZm were 6 and 4.7-fold higher for CCE14 (Fig. 1). Ethanol yields at 30 hourswere 15, 70 and 90% of theoretical yield for E. coli C,KO11, and CCE14, respectively.
Metabolic regulation at transcript levelTranscript levels of 49 genes from the CCE14 strain wereanalyzed in the exponential growth phase and normalizedfor values obtained with E. coli C. Levels of pdcZm andadhZm were normalized with KO11 values and analyzedfor both exponential and stationary phases. A Student' t-test with a p value of ≤ 0.05 was applied to each set of nor-
Specific enzyme activities values of PDCZm and ADHZm for strains KO11 and CCE14 during exponential (A) and station-ary phases (B)Figure 1Specific enzyme activities values of PDCZm and ADHZm for strains KO11 and CCE14 during exponential (A) and station-ary phases (B).
0
1
2
3KO11
CCE14A
IU/m
g p
rote
in
PDCZm ADHZm
0
1
2
3 B
IU/m
g p
rote
in
Page 3 of 13(page number not for citation purposes)
Biotechnology for Biofuels 2008, 1:8 http://www.biotechnologyforbiofuels.com/content/1/1/8
Page 4 of 13(page number not for citation purposes)
Characterization of E. coli C and ethanologenic strains CCE14 and KO11 in M9 mineral media with 40 g/l glucose. Cell mass formation (A), Glucose (B), Pyruvate (C), Formate (D), Ethanol (E), Acetate (F), Lactate (G), and Succinate (H)Figure 2Characterization of E. coli C and ethanologenic strains CCE14 and KO11 in M9 mineral media with 40 g/l glucose. Cell mass formation (A), Glucose (B), Pyruvate (C), Formate (D), Ethanol (E), Acetate (F), Lactate (G), and Succinate (H).
0.01
0.1
1
E. coli C
KO11
CCE14
A
Cell
mass (
g/L
)
0
5
10
15
20 Eth
an
ol (g
/L)
E
0
10
20
30
40
Glu
co
se (
g/L
)
B0
2
4
6 Aceta
te (g
/L)
F
0
1
2
3
4
Pyru
vate
(g
/L) C
0
2
4
6
Lacta
te (g
/L)
G
0 6 12 18 24 300
3
6
9
12
Time (h)
Fo
rmate
(g
/L)
D
0 6 12 18 24 300.0
0.5
1.0
1.5
2.0
Time (h)
Su
ccin
ate
(g/L
)
H

Biotechnology for Biofuels 2008, 1:8 http://www.biotechnologyforbiofuels.com/content/1/1/8
malized values in order to determine statistical significantdifferences in expression levels.
Interestingly, the comparison of CCE14 and KO11 gave adirect relationship between increases in both pdcZm andadhZm transcript values (4.51 and 9.06-fold, respectively)(Fig. 3) and specific enzyme activity levels (5.1 and 3.8-fold, respectively) (Fig. 1). It has been reported that pdcZmand adhZm mRNA are more stable than other transcripts inZ. mobilis [30]. A correlation was also found betweenCCE14 and KO11 during the stationary phase for tran-scripts (3.66-fold and 4.78-fold for pdcZm and adhZm,respectively) and specific enzyme activity levels (6-foldand 4.7-fold, respectively) (Fig. 1). Nevertheless, absolutevalues of the enzyme activity for these enzymes decreasedaround 50% during the stationary phase. The increase inspecific ethanol formation rate (Table 4) correlated withhigher transcript (Fig. 3) and specific enzyme activity (Fig.1) levels for CCE14 in comparison to KO11. The require-ments of higher PDCZm enzymatic levels were demon-strated by Huerta-Beristain and co-workers [25]. Theseauthors reported that when PDCZm activity increased 7-fold, using a multicopy plasmid, the yield of ethanol fromglucose increased from 70 to 85%, whereas organic acidformation rates were reduced in the KO11 strain. Accord-ingly, results in Fig. 1 clearly show that increases in thespecific activities of the enzymes participating in the eth-anologenic pathway boost the carbon flow to ethanol instrain CCE14. These results also suggest that high levels ofboth enzymes are essential to increase the ethanol pro-duction rate. Pyruvate pools in ethanologenic E. coli aresubstantially reduced by high-level expression of these Z.mobilis genes, but cells adjust their metabolism to variouslevels along the glycolytic pathway to fulfill the carbon
flux. Direct increments between transcripts and specificenzyme activities demonstrate the correct translation ofpyruvate decarboxylase and alcohol dehydrogenase whenthey are over expressed.
Glucose transport and phosphorilationGenes coding for proteins related to transport and regula-tion of glucose such as ptsG (1.98-fold), transcriptionalrepressor coding mlc (4.08-fold) [31,32], high-affinityglucose transporters coding lamB (4.05-fold) and mglB(1.50-fold) [33], glucose kinase glk (2.58-fold), fruR(2.28-fold), and crp (2.02-fold) were more highlyexpressed in CCE14 than in E. coli C (Fig. 3). Specific glu-cose consumption rates (Table 2) and transport activities(Fig. 4) were on average 30 and 50% higher, respectively,for CCE14 in comparison with E. coli C. When glucose isphosphorylated in the course of transport, PTS proteinsare dephosphorylated; unphosphorylated EIICBGlc causesthe formation of the Mlc-EIICBGlc complex, derepressingthe expression of target genes, such as mlc itself, as well asthe pts operon [32]. Therefore, higher levels of ptsG andmlc correlate with increases in IICBGlc (ptsG product) andMLC protein. The observed transcriptional pattern is con-sistent with a response that results in higher synthesiscapacity for more PTS proteins necessary for glucoseuptake.
On the other hand, wild type E. coli strains, growing onmicromolar concentrations of glucose, synthetize galac-tose and maltodextrines as autoinducers derepressing thesynthesis of the high-affinity glucose transport systems(MGLB and the LAMB maltoporin), which are responsiblefor glucose transport under these conditions [33]. Analy-ses of gene expression response in wild type E. coli from
Table 2: Kinetic constants in anaerobic cultures
Strain µ qGlc Exponential phase qGlc Stationary phase Cell Mass
E. coli C 0.42 ± 0.01 2.73 ± 0.02 1.11 ± 0.11 1.28 ± 0.07CCE14 0.38 ± 0.01 3.68 ± 0.12 1.20 ± 0.10 1.07 ± 0.04KO11 0.45 ± 0.01 3.49 ± 0.09 0.97 ± 0.06 1.39 ± 0.09
µ = Specific growth rate (1/h).qGlc = Specific glucose consumption rate (gGlc/gDCW h).Cell mass obtained at the onset of the stationary phase (gDCW/L).± Standard deviation of three independent experiments.
Table 3: Specific formation rates (qP) for organic acids and ethanol during the exponential phase (gPRODUCT/gDCW h)
Strain Acetate Formate Succinate Ethanol Carbon Recovery (%)
E. coli C 0.95 ± 0.08 1.21 ± 0.03 0.29 ± 0.03 0.58 ± 0.05 100.9 ± 0.41CCE14 0.39 ± 0.04 0.67 ± 0.04 0.28 ± 0.04 2.08 ± 0.01 104.5 ± 0.22KO11 0.79 ± 0.04 1.59 ± 0.06 ND 1.63 ± 0.01 98.7 ± 0.32
± Standard deviation of three independent experiments.ND. Not Detected.
Page 5 of 13(page number not for citation purposes)
Biotechnology for Biofuels 2008, 1:8 http://www.biotechnologyforbiofuels.com/content/1/1/8
glucose non-limiting to glucose-limiting growth condi-tions, in chemostat cultures, have demonstrated that sev-eral genes including mglB and lamB are upregulated [34].Furthermore, the crp transcript is higher when E. coli expe-rience glucose limitation [35] and CRP regulates genessuch as mglB, lamb, glk, and ptsG [36]. Our results showthat even though cultures were growing in large amountsof glucose (40 g/L) throughout the exponential phase(Fig. 2), transcription results suggest that CCE14 was sens-ing partial glucose limitation. This response might be dueto increases in the fermentation and glycolytic rates that inturn will induce a response to scavenge sugar throughtransport activation of alternative glucose transporters.Interestingly, glk transcript levels were significantly higherin CCE14. This result suggests that besides the PTS system,glucose could also be transported by MGLB and LAMBand phosphorylated by GLK. The higher glk transcript isalso related to an elicited response due to the over expres-sion of heterologous genes as demonstrated by Arora andPederson [37].
As mentioned earlier, fruR (2.28-fold) was more highlyexpressed in CCE14. FRUR (or CRA) is a key regulatorcontrolling the balance between glycolysis and gluconeo-genesis [38-40]. Many gluconeogenic genes are activatedby FRUR, while glycolytic genes such as glk, pfkA, gapA,eno, and pykF are repressed. [41,42]. However, none of thegenes studied above was repressed. Probably FRUR waspartially inactivated in the presence of glucose, becausefructose-1-phosphate and fructose-1,6-bisphosphate bindto FRUR and inactivate its DNA-binding capacity [43,44].
Glycolytic pathwayIn general, only slight changes were detected in the tran-scription level of genes related to glycolysis. For instance,gapA (1.36-fold), fbaA (2.16-fold), and pgk (1.66-fold)transcript levels were higher in CCE14 strain than in E. coliC (Fig. 3). In E. coli, the gapA gene is transcribed from atleast four promoters, three recognized by the RNApolymerase Eσ70 and one by the heat shock RNA polymer-ase Eσ32. This complex region of differentially regulatedpromoters allows the production of large amounts of gapAtranscripts in a wide variety of environmental conditions[45]. On the other hand, in γ-proteobacteria (E. coli, forexample), the pgk and fbaA genes are cotranscriptionally
expressed using two transcriptional promoters, thoughonly one is required to get a strong production of PGK andFBA proteins in the presence of glucose [46]. It has beenproposed that when glucose is present in the growthmedium, pts, gapA, and pgk genes are coordinately acti-vated by a mechanism dependent upon the EIIGlc protein(coded by the ptsG gene) [47]. Our results correlate withthese facts, given the increases found in fbaA, pgk, and ptsGtranscript levels.
Surprisingly, only the PGK enzymatic activity was higher(1.54-fold) in CCE14, whereas GAPDH activity was lower(0.64-fold) in this strain. As mentioned previously, it ispossible that in the exponential phase, in spite of a highertranscript level of gapA, the low GAPDH activity could berelated to a redox balance between GAPDH and higherADHZm and PDCZm transcripts and enzymatic activities.
Several glycolytic genes showed no significant changes inthe transcription level, and some of the transcripts andenzymatic activities did not show the same tendency. Thisbehavior could be related to posttranscriptional regula-tion and RNA segmentation, leading to the production ofindividual mRNAs with selective stabilization. Theseprocesses allow the adaptation of gene expression to vari-ations in environmental conditions, as has been observedin glycolytic gene expressions in B. subtilis [48,49], Z.mobilis [50], and L. delbrueckii [51]. Another explanationcould be that enzyme levels are sufficient to carry out theircatalytic role.
On the other hand, only the pgi transcript from CCE14was lower than in the wild type strain. Likewise, the PGIenzymatic activity was slightly lower than that of E. coli C.Despite the importance of PGI in glycolysis, little infor-mation is available about the regulation of the pgi gene.However, due to the results in terms of glucose consump-tion and ethanol formation rate, the lower transcript andenzymatic activity does not cause any reduction in the gly-colytic flux.
Entner-Doudoroff and pentose pathwaysThe zwf gene, that codes for glucose 6-P dehydrogenase,plays an important role in the control of carbon distribu-tion at the glucose 6-phosphate node. It directs carbon
Table 4: Specific formation rates (qP) for organic acids and ethanol during the stationary phase (gPRODUCT/gDCW h).
Strain Acetate Formate Succinate Lactate Pyruvate Ethanol
E. coli C 0.14 ± 0.07 0.26 ± 0.06 0.04 ± 0.01 0.26 ± 0.04 0.25 ± 0.02 0.12 ± 0.06CCE14 0.04 ± 0.08 0.05 ± 0.04 0.06 ± 0.01 0.01 ± 0.015 ND 0.68 ± 0.01KO11 0.10 ± 0.01 0.19 ± 0.02 ND 0.03 ± 0.05 ND 0.37 ± 0.03
± Standard deviation of three independent experiments.ND. Not Detected.
Page 6 of 13(page number not for citation purposes)
Biotechnology for Biofuels 2008, 1:8 http://www.biotechnologyforbiofuels.com/content/1/1/8
Page 7 of 13(page number not for citation purposes)
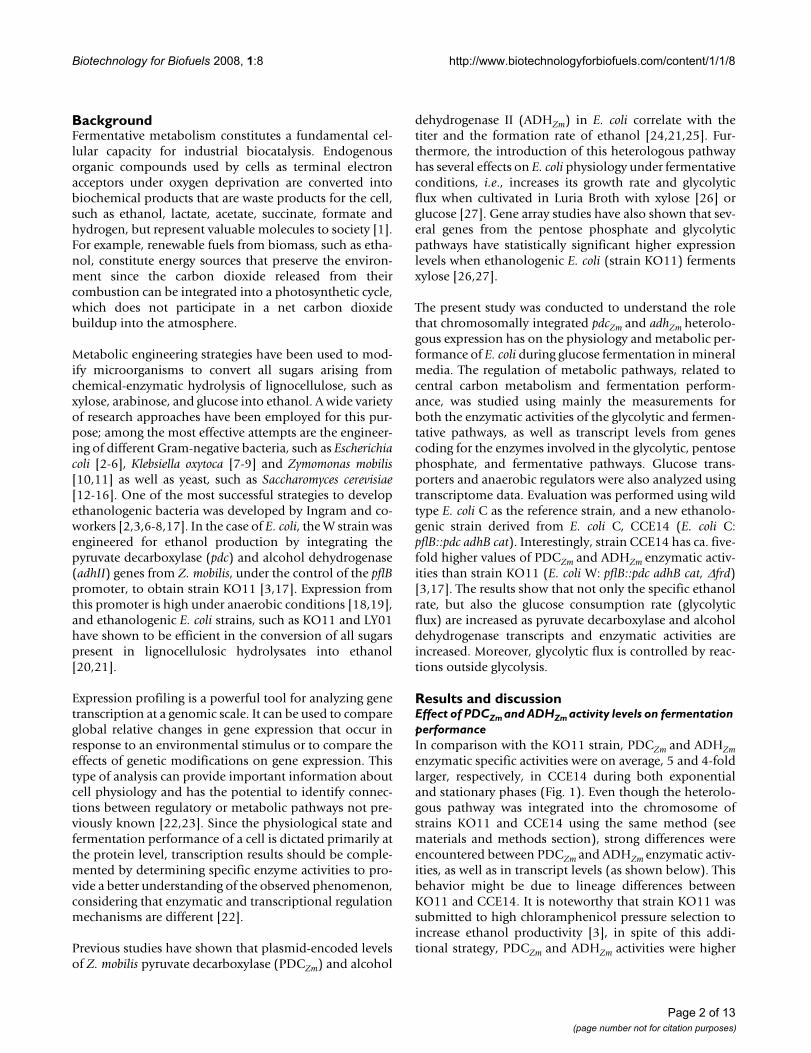
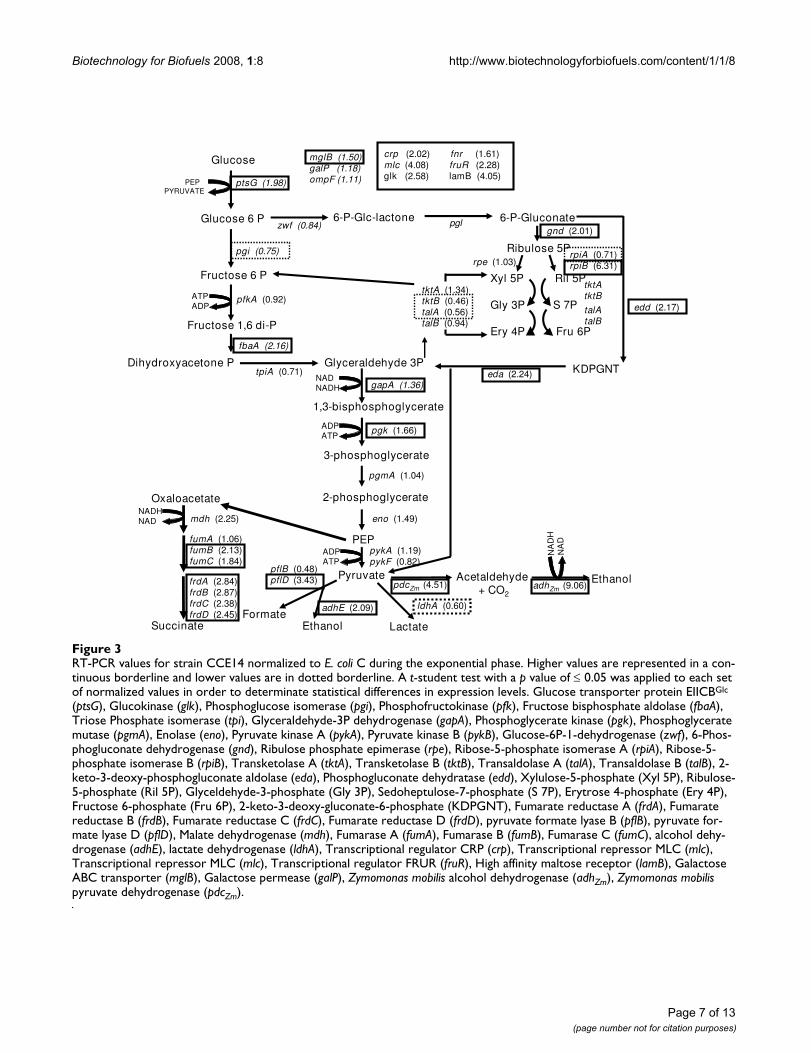
RT-PCR values for strain CCE14 normalized to E. coli C during the exponential phaseFigure 3RT-PCR values for strain CCE14 normalized to E. coli C during the exponential phase. Higher values are represented in a con-tinuous borderline and lower values are in dotted borderline. A t-student test with a p value of ≤ 0.05 was applied to each set of normalized values in order to determinate statistical differences in expression levels. Glucose transporter protein EIICBGlc
(ptsG), Glucokinase (glk), Phosphoglucose isomerase (pgi), Phosphofructokinase (pfk), Fructose bisphosphate aldolase (fbaA), Triose Phosphate isomerase (tpi), Glyceraldehyde-3P dehydrogenase (gapA), Phosphoglycerate kinase (pgk), Phosphoglycerate mutase (pgmA), Enolase (eno), Pyruvate kinase A (pykA), Pyruvate kinase B (pykB), Glucose-6P-1-dehydrogenase (zwf), 6-Phos-phogluconate dehydrogenase (gnd), Ribulose phosphate epimerase (rpe), Ribose-5-phosphate isomerase A (rpiA), Ribose-5-phosphate isomerase B (rpiB), Transketolase A (tktA), Transketolase B (tktB), Transaldolase A (talA), Transaldolase B (talB), 2-keto-3-deoxy-phosphogluconate aldolase (eda), Phosphogluconate dehydratase (edd), Xylulose-5-phosphate (Xyl 5P), Ribulose-5-phosphate (Ril 5P), Glyceldehyde-3-phosphate (Gly 3P), Sedoheptulose-7-phosphate (S 7P), Erytrose 4-phosphate (Ery 4P), Fructose 6-phosphate (Fru 6P), 2-keto-3-deoxy-gluconate-6-phosphate (KDPGNT), Fumarate reductase A (frdA), Fumarate reductase B (frdB), Fumarate reductase C (frdC), Fumarate reductase D (frdD), pyruvate formate lyase B (pflB), pyruvate for-mate lyase D (pflD), Malate dehydrogenase (mdh), Fumarase A (fumA), Fumarase B (fumB), Fumarase C (fumC), alcohol dehy-drogenase (adhE), lactate dehydrogenase (ldhA), Transcriptional regulator CRP (crp), Transcriptional repressor MLC (mlc), Transcriptional repressor MLC (mlc), Transcriptional regulator FRUR (fruR), High affinity maltose receptor (lamB), Galactose ABC transporter (mglB), Galactose permease (galP), Zymomonas mobilis alcohol dehydrogenase (adhZm), Zymomonas mobilis pyruvate dehydrogenase (pdcZm).
Glucose
Glucose 6 P
Fructose 6 P
Dihydroxyacetone P Glyceraldehyde 3P
PEP
PYRUVATE
PEP
Pyruvate Acetaldehyde + CO2
Ethanol
Fructose 1,6 di-P
1,3-bisphosphoglycerate
3-phosphoglycerate
2-phosphoglycerate
6-P-Gluconate
Oxaloacetate
Succinate
ATPADP
ADPATP
ADPATP
NADH
NAD
NA
DH
NA
D
NADNADH
Ribulose 5P
Xyl 5P Ril 5P
Gly 3P S 7P
Ery 4P Fru 6P
KDPGNT
6-P-Glc-lactone
ptsG (1.98)
pgi (0.75)
pfkA (0.92)
fbaA (2.16)
tpiA (0.71)
gapA (1.36)
pgk (1.66)
pgmA (1.04)
pykA (1.19)pykF (0.82)
eno (1.49)
zwf (0.84)
edd (2.17)
gnd (2.01)
rpiA (0.71)rpiB (6.31)rpe (1.03)
tktAtktB
talAtalB
tktA (1.34)tktB (0.46)talA (0.56)talB (0.94)
eda (2.24)
pdcZm (4.51) adhZm (9.06)
pflB (0.48)pflD (3.43)frdA (2.84)
frdB (2.87)frdC (2.38)frdD (2.45)
fumA (1.06)fumB (2.13)fumC (1.84)
mdh (2.25)
pgl
crp (2.02) fnr (1.61)mlc (4.08) fruR (2.28)glk (2.58) lamB (4.05)
mglB (1.50)galP (1.18)ompF (1.11)
FormateLactate
ldhA (0.60)
Ethanol
adhE (2.09)
Biotechnology for Biofuels 2008, 1:8 http://www.biotechnologyforbiofuels.com/content/1/1/8
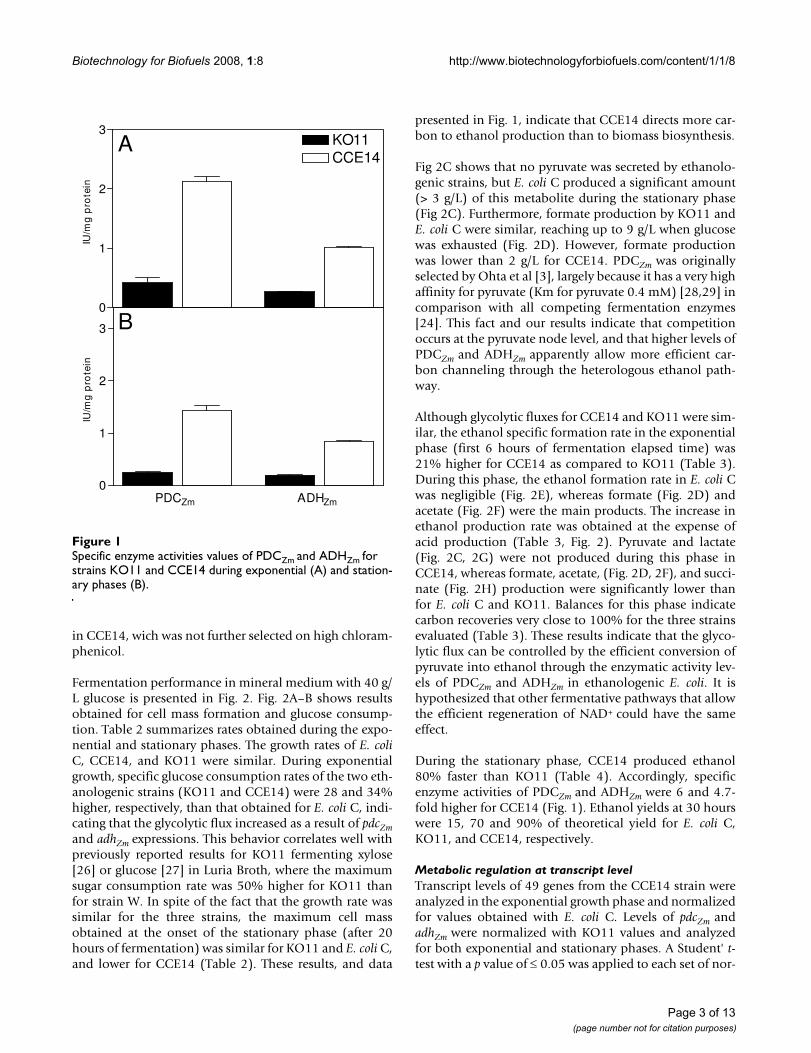
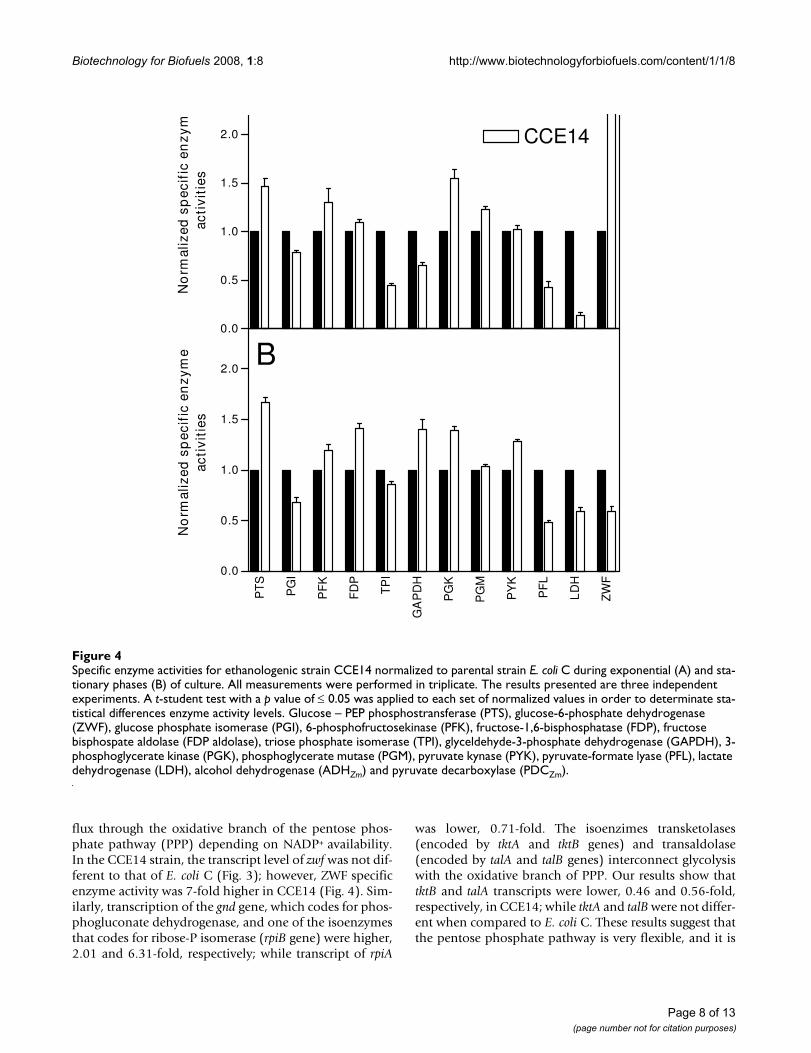
Specific enzyme activities for ethanologenic strain CCE14 normalized to parental strain E. coli C during exponential (A) and sta-tionary phases (B) of cultureFigure 4Specific enzyme activities for ethanologenic strain CCE14 normalized to parental strain E. coli C during exponential (A) and sta-tionary phases (B) of culture. All measurements were performed in triplicate. The results presented are three independent experiments. A t-student test with a p value of ≤ 0.05 was applied to each set of normalized values in order to determinate sta-tistical differences enzyme activity levels. Glucose – PEP phosphostransferase (PTS), glucose-6-phosphate dehydrogenase (ZWF), glucose phosphate isomerase (PGI), 6-phosphofructosekinase (PFK), fructose-1,6-bisphosphatase (FDP), fructose bisphospate aldolase (FDP aldolase), triose phosphate isomerase (TPI), glyceldehyde-3-phosphate dehydrogenase (GAPDH), 3-phosphoglycerate kinase (PGK), phosphoglycerate mutase (PGM), pyruvate kynase (PYK), pyruvate-formate lyase (PFL), lactate dehydrogenase (LDH), alcohol dehydrogenase (ADHZm) and pyruvate decarboxylase (PDCZm).
0.0
0.5
1.0
1.5
2.0 CCE14
No
rma
lize
d s
pe
cif
ic e
nz
ym
ac
tiv
itie
s
PT
S
PG
I
PF
K
FD
P
TP
I
GA
PD
H
PG
K
PG
M
PY
K
PF
L
LD
H
ZW
F
0.0
0.5
1.0
1.5
2.0B
No
rma
lize
d s
pe
cif
ic e
nz
ym
e
ac
tiv
itie
s
flux through the oxidative branch of the pentose phos-phate pathway (PPP) depending on NADP+ availability.In the CCE14 strain, the transcript level of zwf was not dif-ferent to that of E. coli C (Fig. 3); however, ZWF specificenzyme activity was 7-fold higher in CCE14 (Fig. 4). Sim-ilarly, transcription of the gnd gene, which codes for phos-phogluconate dehydrogenase, and one of the isoenzymesthat codes for ribose-P isomerase (rpiB gene) were higher,2.01 and 6.31-fold, respectively; while transcript of rpiA
was lower, 0.71-fold. The isoenzimes transketolases(encoded by tktA and tktB genes) and transaldolase(encoded by talA and talB genes) interconnect glycolysiswith the oxidative branch of PPP. Our results show thattktB and talA transcripts were lower, 0.46 and 0.56-fold,respectively, in CCE14; while tktA and talB were not differ-ent when compared to E. coli C. These results suggest thatthe pentose phosphate pathway is very flexible, and it is
Page 8 of 13(page number not for citation purposes)
Biotechnology for Biofuels 2008, 1:8 http://www.biotechnologyforbiofuels.com/content/1/1/8
likely that overall catalytic rates are similar in the twostrains tested.
Unexpectedly, genes edd that codes for 6-phosphogluco-nate dehydratase and eda which codes for 2-keto-3-deoxy-6-phosphogluconate aldolase in the Entner-Doudoroffpathway were more highly expressed, -2.17 and 2.24-fold,respectively, in CCE14 (Fig. 3). These results suggest thatthe Entner-Doudoroff pathway is functional, although ithas been reported that for aerobic cultures with glucosethe carbon flux through this route is not very high [52,53].In addition, ATP yield is lower through this pathway ver-sus the Embden-Meyerhof pathway [54].
Fermentative pathwaysIn the CCE14 strain, adhE (2.09-fold), fumB (2.13-fold),fumC (1.84-fold), frdABCD (2.84, 2.87, 2.38 2.45-fold),and pflD (3.43-fold) gene expressions were higher than inthe wild type. It is known that frdABCD is induced underanaerobic conditions [55], though a recent study showedthat this gene can be induced by glucose limitations [56].
It has been demonstrated that the fumB transcript is moreabundant under anaerobic conditions, and that FNR isnecessary as a transcriptional activator [57,58]. In agree-ment with these reports, the transcription of fumB and theanaerobic regulator fnr (1.61-fold) were also more highlyexpressed in the CCE14 strain (Fig. 3). These results indi-cate that the pathways to produce succinate, formate, andethanol (for native pathway) are active, although specificenzyme activity values of PFL and LDH and transcript lev-els of pflB and ldhA decreased in the exponential phase. Itis important to mention that CCE14 produces formateand succinate in low concentrations. These results couldindicate a competition phenomenon for pyruvatebetween PFL and PDCZm. However, it is important to con-sider the disruption of routes to compete for the ethanolproduction in these conditions such as succinate and lac-tate pathways. We found that in cultures with high glucoseconcentrations (100 g/L), the production of succinateincreases significantly in strain CCE14 (data no shown).This could be due to osmolarity problems or to a partiallimitation of PYK enzyme causing PEP accumulation;hence, the carbon flux may be partially redirected towardssuccinate formation.
Metabolic regulation at the enzyme activity levelEnzyme activity levels for CCE14 strain were analyzed inexponential and stationary phases and normalized for val-ues obtained with E. coli C (Fig. 4). Enzymatic levels forpdcZm and adhZm were normalized with KO11. A t-studenttest with a p value of ≤ 0.05 was applied to each set of nor-malized values to determine statistical differences inenzyme activity levels.
In the CCE14 strain, PTS and PGK enzymatic activitieswere higher, whereas TPI and PFL activities were lowerduring the exponential growth phase. These data correlatewith the fact that ethanologenic strains consume glucoseat a higher rate. In addition, increases in PGK activity sug-gest that the over expression of the genes coding forPDCZm and ADHZm modify the ATP/ADP balance. It isknown that in aerobic conditions, a high ATP demandcauses an increase in glycolytic flux in E. coli [59]. For Lac-tococcus lactis, the control of glycolytic flux resides to alarge extent in processes outside the pathway, such as ATPconsuming reactions and glucose transport [60]. As dis-cussed above, the heterologous ethanologenic pathwayincreases glycolytic flux with the subsequent increases inATP production and consumption. Therefore, it appearsthat cells tend to increase ATP formation through anincrease in PGK synthesis; although no increase in PYKactivity was found. ATP is also produced when acetate isformed; however, CCE14 does not produce acetate duringthe exponential phase. A decrease in PFL activity in CCE14correlates with a strong reduction in formate production(Fig. 2D). On the other hand, the observed 50% reductionin the TPI specific enzyme activity does not reduce glyco-lytic flux. A large increase in ZWF specific activity wasfound, and was discussed above.
A comparison of enzymatic activity data between CCE14and E coli C during the stationary phase, indicates highervalues of PTS, FDP, GAPDH, PGK, and PYK for the eth-anologenic strain. The LDH enzymatic activity was lowerin CCE14. It is known that lactate dehydrogenase is allos-terically activated by pyruvate [61]. Lactate productionwas found only during the stationary phase of two cul-tures. Pyruvate formation in E. coli C correlates with lac-tate production (Fig. 2C–G), and lower levels of thismetabolite in CCE14 correlate with a 40% lower LDHspecific activity (Fig. 4). These results suggest that a higherethanol formation rate, i.e., higher PDCZm and ADHZmspecific activities originate higher rates of glucose trans-port, ATP synthesis, and NAD-NADH+H turnover.
ConclusionA higher glycolytic flux in CCE14 results from increasedchromosomal expression of pdcZm and adhZm genes andhigher specific enzyme activities of heterologous PDCZmand ADHZm enzymes involved in ethanol formation.These results indicate that under the conditions used inthis study, the glycolytic flux is controlled by reactionsoutside this pathway, that is, by the fermentative heterol-ogous route. The metabolic adjustments carried out in thecell entail low organic acid production and an increase inthe ethanol formation rate, as well as higher ethanol yield(90% of the theoretical) in glucose-mineral media whencompared with previous engineered efficient strains, suchas KO11 (70% of the theoretical yield). In spite of the
Page 9 of 13(page number not for citation purposes)

Biotechnology for Biofuels 2008, 1:8 http://www.biotechnologyforbiofuels.com/content/1/1/8
higher PDCZm and ADHZm transcript and enzymatic activ-ities in the CCE14 strain, the differences are mediated byhigher glucose transport rates and an increase in the turn-over rate of NAD-NADH+H+ and ATP.
Overall, these results also show that E. coli glycolytic enzy-matic activities under fermentative conditions are suffi-cient to contend with increases in the rates of glucoseconsumption and higher transcript and enzymatic activi-ties of the heterologous ethanol pathway. Also, the studyprovides the basis for the implementation of appropriategenetic modifications to increase the ethanol yield whenmineral media is used; for instance, the disruption of suc-cinate and lactate pathways that compete for ethanol pro-duction.
MethodsBacterial strains, media and growth conditionsE. coli strains used in this work are listed in Table 1. Withthe purpose to have an ethanologenic strain with differentPDCZm and ADHZm enzymatic levels, a new strain CCE14was constructed integrating into the chromosome thepyruvate decarboxylase (pdc) and the alcohol dehydroge-nase (adh) genes of Zymomonas mobilis under the controlof the pfl native promoter. This chromosome integrationwas made with pLOI510 as described previously, [3]. Thevector pLOI510, was constructed to allow direct selectionfor the integration of pdc and adhB of Z. mobilis genes intothe pfl region of the chromosome by using a DNA frag-ment which lacks a replicon [3]. Transformants werescreened for chloramphenicol resistance (20 µg/ml) andCO2 production in tubes, and subsequently tested for eth-anol production in mini-fermentors with 20 g/l of glu-cose.
All stock cultures were stored at -70°C in Luria Broth (LB)medium [62] containing 40% glycerol. To develop inoc-ula, cells were transferred twice on LB-agar plates supple-mented with 20 g/L of glucose-chloramphenicol (20 µg/ml), and no chloramphenicol for E. coli C. Single colonieswere transferred to overnight cultures in shake flasks(35°C, 120 rpm), containing glucose (20 g/L) in mineralM9-medium [62]. M9-medium contains: 6 g/L Na2HPO4,3 g/L KH2PO4, 1 g/L NH4Cl, 0.5 g/L NaCl. The followingcomponents were sterilized by filtration, and then added(per liter of final medium): 2 ml of 1 M MgSO47H2O, 1
mL of 0.1 M of CaCl2, 1 mL of 1 mg/mL thiamine-HCl.These cells were harvested in exponential growth phase bycentrifugation and used to inoculate non-aerated mini-fermentors [63], containing 200 ml of M9-medium with40 g/L of glucose. Starting OD600 was 0.1, chlorampheni-col (0, 40 and 20 µg/ml) was included for strains C, KO11and CCE14, (respectively), cells were cultivated at 35°C,100 rpm, and the pH was maintained at 7 by the auto-matic addition of 2 N KOH. All cultures were carried outin triplicate.
Analytical methodsSamples were periodically taken from cultures to measureoptical density at 600 nm using a spectrophotometer(Beckman DU-70, Palo Alto, CA) and the dry cell weightwas calculated using a previously determined conversionfactor of 1 OD600 = 0.37 g/L. An HPLC system (600E qua-ternary bomb, 717 automatic injector, 2410 refractiveindex, and 996 photodiode array detectors, Waters, Mil-ford, MA) and an Aminex HPX-87H column (300 × 7.8mm; 9 µm) (Bio-Rad, Hercules, CA) were used to separateand quantify D-glucose, formate, acetate, succinate, andlactate concentrations. Running conditions were: mobilephase, 5 mM H2SO4, flow 0.5 ml/min, and temperature50°C. Under these conditions glucose was detected byrefractive index, and organic acids were identified by pho-todiode array at 210 nm. Ethanol was quantified by gaschromatography (Agilent 6850, Wilmington, D.E.), using1-butanol as internal standard.
Preparation of cell extracts and enzymatic assaysSamples were taken at the mid-exponential and stationaryphases. All operations were carried out at 4°C. 1 mL of cellculture was harvested by centrifugation at 10,000 × g for10 min, washed twice with 1 mL of 100 mM Tris-HCl (pH7.0) containing 20 mM KCl, 5 mM MnSO4, 2 mM DTTand 0.1 mM EDTA, and then suspended in 1 mL of thesame buffer. Cells were disrupted by four sonication steps(15 s each) in an ultrasonic disrupter (Soniprep 150, UK).The cell debris was removed by centrifugation; 10 min at10,000 × g. The resulting crude extracts were used imme-diately for determination of enzymatic activities and pro-tein, or stored at -20°C.
Enzyme activities were measured spectrophotometricallyat 340 nm in a thermostatically controlled (30°C) spec-
Table 1: Escherichia coli strains used in this study
Strain Relevant features Reference
E. coli C Wild type ATCC 8739CCE14 E. coli C: pflB::pdc adhB cat This workKO11 E coli W: pflB::pdc adhB cat, ∆frd Ohta et al 1991 Jarboe et al 2007
Page 10 of 13(page number not for citation purposes)
Biotechnology for Biofuels 2008, 1:8 http://www.biotechnologyforbiofuels.com/content/1/1/8
trophotometer (BioMate 5, ThermoSpectronic, NY). Allcompounds of the reaction mixtures were pipetted into 1cm light path cuvettes, reactions were initiated by addingthe cell extract or substrate to give a final volume of 1 mL.The millimolar extinction coefficient for NAD+, NADH,NADP+ and NADPH is 6.22 cm-1. mM-1.
The assay conditions for glucose:PEP phosphotransferase(PTS), 6-phosphofructosekinase (PFK), fructose-1,6-bisphosphatase (FDP), glucose phosphate isomerase(PGI), fructose bisphosphate aldolase (FDP aldolase),glyceldehyde-3-phosphate dehydrogenase (GAPDH), tri-ose phosphate isomerase (TPI), 3-phosphoglyceratekinase (PGK), pyruvate kynase (PYK), 6-phosphogluco-nate dehydrogenase (ZWF), pyruvate-formate lyase (PFL),and lactate dehydrogenase (LDH) were measured basedon the methods used by Peng et al [64]. The assay condi-tions used for alcohol dehydrogenase (ADHZm) and pyru-vate decarboxylase (PDCZm) were based on the methodsreported by Conway et al [65]. Phosphoglycerate mutasewas measured based on the method of Maitra et al [66].Protein concentration was estimated by the Bradfordmethod, [67], with bovine serum albumin used as thestandard. Each assay was performed three times for thesame culture, from three independent experiments. A t-student test with a p value of ≤ 0.05 was applied to eachset of normalized values in order to determinate statisticaldifferences in enzyme activity levels.
RNA extraction and cDNA synthesisTotal RNA extraction was performed using hot-phenolequilibrated with water, precipitated with 3 M sodiumacetate and ethanol, and treated with DNase kit (DNA-free™, Ambion; [33]. RNA integrity was tested by densit-ometry in 1.2% agarose gels. RNA quantification was per-formed by absorbance at 260/280 nm. cDNA wassynthesized using RevertAid™ H First Strand cDNA Syn-thesis kit (Fermentas Inc.) and a mixture of specific DNAprimers. The sequences of the primers used for cDNA syn-thesis were those reported by Flores et al [33], except forpdcZm (5'-GACAAAGTTGCCGTCCTCGT and 5'-ATGG-TAGCAACTGCGCCAC) and adhZm (5'-TTACCCCGAT-GGTTTCCGT and 5'-TTCAAATGCGTGGGTCAGAG)genes. cDNA obtained in this way was used as templatefor RT-PCR assays. Reproducibility of this procedure wasdetermined by performing two separate cDNA synthesisexperiments from the RNA extracted for each strain. Simi-lar results were obtained for the transcription of all genesthat were measured.
Real-time PCR
Real-time PCR (RT-PCR) was performed with the ABIPrism 7000 Sequence Detection System (Perkin Elmer/Applied Biosystems, Foster City, CA), using the SYBRGreen PCR Master Mix (Perkin Elmer/Applied Biosys-
tems, Foster City, CA) and amplification conditionsdescribed by Flores et al [33]. The primers for specificamplification were designated using the Primer Expresssoftware (Perkin Elmer/Applied Biosystems, Foster City,CA). The size of all amplimers was 101 bp. The final
primer concentration, in a total volume of 15 µl, was 0.2
µM. Five nanograms of target cDNA for each gene wasadded to the reaction mixture. All experiments were per-formed in triplicate for each gene of each strain, obtainingvery similar values. A non-template control reaction mix-ture was included for each gene. The quantification tech-
nique used to analyze data was the methoddescribed by Livak and Shmittgen [68]. The data were nor-malized using the ihfB gene as an internal control (house-keeping gene). We detected the same expression level ofthis gene in all the strains in the conditions in which thebacteria were grown. For each analyzed gene in all strains,the transcription level of the wild type gene, considered asone, was used as the control to normalize the data. Datais reported as relative expression levels compared to theexpression levels of E. coli C. A t-student test with a p value
of ≤ 0.05 was applied to each set of normalized values inorder to determinate statistical differences in expressionlevels.
Competing interestsThe authors declare that they have no competing interests.
Authors' contributionsMOT Constructed the ethanologenic strain, carried outthe kinetic, RT-PCR and enzyme characterization, the dataanalysis and drafted the manuscript. NF Participated inRT-PCR analysis and proofreading the manuscript. AEParticipated in RT-PCR technique and proofreading themanuscript. GHC Participated in HPLC analysis. FBReviewed and commented the manuscript. GG Reviewedand commented the manuscript. AM Conceived the study,designed and supervised the experiments, participated inresults analysis and helped with manuscript preparation.
AcknowledgementsWe thank Dr. Lonnie O. Ingram (University of Florida) for kindly providing strain KOll and pLOI510. We thank Mercedes Enzaldo, Ricardo Ciria and Manuel Hurtado for technical support. We thank Jonathan C. Moore (Uni-versity of Florida) for proofreading of the manuscript. This work was sup-ported by the Mexican Council of Science and Technology (CONACyT) grants: CONACyT-SAGARPA 2004-C01-224, CONACyT – Estado de Morelos MOR-2004-C02-048, CONACyT 44126 and PAPIIT-DGAPA-UNAM IN220908-3. Montserrat Orencio-Trejo held a scholarship from CONACyT.
2−∆∆C T
Page 11 of 13(page number not for citation purposes)
Biotechnology for Biofuels 2008, 1:8 http://www.biotechnologyforbiofuels.com/content/1/1/8
References1. Gottschalk G: Bacterial Metabolism. 2nd edition. Springer, New
York Berlin Heidelberg; 1986:237. 2. Ingram LO, Conway T, Clark DP, Sewell GW, Preston JF: Genetic
Engineering of Ethanol Production in Escherichia coli. ApplEnviron Microbiol 1987, 53:2420-2425.
3. Ohta K, Beall DS, Mejia JL, Shanmugam KT, Ingram LO: Geneticimprovement of Escherichia coli for ethanol production:Chromosomal integration of Zymomonas mobilis genesencoding pyruvate decarboxylase and alcohol dehydroge-nase II. Appl Environ Microbiol 1991, 57:893-900.
4. Dien B, Hespell RB, Wyckoff HA, Bothast R: Fermentation of hex-ose and pentose sugars using a novel ethanologenicEscherichia coli strain. Enz Microbiol Technol 1998, 23:366-371.
5. Bothast RJ, Nichols NN, Dien BS: Fermentations with NewRecombinant Organisms. Biotechnol Prog 1999, 15:867-875.
6. Martinez A, Grabar TB, Shanmugam KT, Yomano LP, York SW,Ingram LO: Low salt medium for lactate and ethanol produc-tion by recombinant Escherichia coli B. Biotechnol Lett 2007,29:397-404.
7. Ohta K, Beall DS, Mejia JL, Shanmugam KT, Ingram LO: Metabolicengineering of Klebsiella oxytoca strain M5A1 for ethanolproduction from xylose and glucose. Appl Environ Microbiol 1991,57:2810-2815.
8. Wood BE, Ingram LO: Ethanol production from cellobiose,amorphous cellulose, and crystalline cellulose by recom-binant Klebsiella oxytoca containing chromosomally inte-grated Zymomonas mobilis genes for ethanol production andplasmids expressing thermostable cellulose genes fromClostidium thermocellum. Appl Environ Microbiol 1992,58:2103-2110.
9. Golias H, Dumsday GJ, Stanley GA, Pamment NB: Evaluation of arecombinant Klebsiella oxytoca strain for ethanol productionfrom cellulose by simultaneous saccharification and fermen-tation: comparision with native cellobiose-utilising yeaststrains and performance in co-culture with thermotolerantyeast and Zymomonas mobilis. J Biotechnol 2002, 96:155-168.
10. Zhang M, Eddy C, Deanda K, Finkelstein M, Picataggio S: Metabolicengineering of a Pentose Metabolism Pathway in Ethanolo-genic Zymomonas mobilis. Science 1995, 267:240-243.
11. Deanda K, Zhang M, Eddy , Picataggio S: Development of an Ara-binose-Fermenting Zymomonas mobilis strain by MetabolicPathway Engineering. Appl Environ Microbiol 1996, 62:4465-4470.
12. Ho NWY, Chen Z, Brainard AP: Genetically engineered Saccha-romyces yeast capable of effective cofermentation of glucoseand xylose. Appl Environ Microbiol 1998, 64:1852-1859.
13. Becker J, Boles E: A Modified Saccharomyces cerevisiae StrainThat Consumes L-Arabinose and Produces Ethanol. ApplEnviron Microbiol 2003, 69(7):4144-4150.
14. Jeffries TW, Jin YS: Metabolic engineering for improved fer-mentation of pentoses by yeast. Appl Microbiol Biotechnol 2004,63:495-509.
15. Hahn-Hägerdal B, Karhumaa K, Fonseca C, Spencer-Martins I,Gorwa-Grauslund MF: Towards industrial pentose-fermentingyeast strains. Appl Microbiol Biotechnol 2007, 74:937-953.
16. van Maris AJA, Abbott DA, Bellissimi E, van den Brink J, Kuyper M,Luttik MAH, Wisselink HW, Scheffers WA, van Dijken JP, Pronk JT:Alcoholic fermentation of carbon sources in biomass hydro-lysates by Saccharomyces cerevisiae : current status. Antonievan Leeuwenhoek 2006, 90:391-418.
17. Jarboe LR, Grabar TB, Yomano LP, Shanmugam KT, Ingram LO:Development of Ethanologenic Bacteria. Adv Biochem Engin/Bio-technol 2007, 108:237-261 [http://www.ncbi.nlm.nih.gopubme17665158?ordinalpos=5&itool=EntrezSystem2.PEnt rez.Pubmed.Pubmed_ResultsPanel.Pubmed_RVDocSum].
18. Sawers G, Bock A: Anaerobic regulation of pyruvate formate-lyase from Escherichia coli K-12. J Bacteriol 1988, 170:5330-5336.
19. Sawers G, Bock A: Novel transcriptional control of the pyru-vate formate-lyase gene: upstream regulatory sequencesand multiple promoters regulate anaerobic expression. J Bac-teriol 1989, 171:2485-2498.
20. Yomano LP, York SW, Ingram LO: Isolation and characterizationof ethanol-tolerant mutants of Escherichia coli KO11 for fuelethanol production. J Ind Microbiol Biotechnol 1998, 20:132-138.
21. Martinez A, York SW, Yomano LP, Pineda VL, Davis FC, Shelton JC,Ingram LO: Biosynthetic burden and plasmid burden limit
expression of chromosomally integrated heterologus genes(pdc, adhB) in Escherichia coli. Biotechnol Prog 1999, 15:891-897.
22. Kabir Md, Shimizu K: Gene expression patterns for metabolicpathway in pgi knockout Escherichia coli with and withoutphb genes based on RT-PCR. J Biotechnol 2003, 105:11-31.
23. Flores N, Escalante A, de Anda R, Báez-Viveros JL, Merino E, FrancoB, Georgellis D, Gosset G, Bolívar F: New Insights into the Roleof Sigma factor RpoS as Revealed in Escherichia coli StrainsLacking the Phosphoenolpyruvate:Carbohydrate Phospho-transferase System. J Mol Microbiol Biotechnol 2008, 14:176-192.
24. Ingram LO, Conway T: Expression of Different Levels of Eth-anologenic Enzymes from Zymomonas mobilis in Recom-binant Strains of Escherichia coli. Appl Environ Microbiol 1988,54:397-404.
25. Huerta-Beristain G, Utrilla J, Hernández-Chávez G, Bolívar F, GossetG, Martinez A: Specific Ethanol Production Rate in Ethanolo-genic Escherichia coli strain KO11 Is Limited by PyruvateDecarboxylase. J Mol Microbiol Biotechnol 2008, 15:55-64.
26. Tao H, Gonzalez R, Martinez A, Rodriguez M, Ingram LO, Preston JF,Shanmugam KT: Engineering a Homo-Ethanol Pathway inEscherichia coli : Increased Glycolytic Flux and Levels ofExpression of Glycolitic Genes during Xylose Fermentation.J Bacteriol 2001, 183:2979-2988.
27. Gonzalez R, Tao H, Shanmugam KT, York SW, Ingram LO: GlobalGene Expression Differences Associated with Changes inGlycolytic Flux and Growth Rate in Escherichia coli duringthe Fermentation of Glucose and Xylose. Biotechnol Prog 2002,18:6-20.
28. Brau B, Sahm H: Cloning and expression of the structural genefor pyruvate decarboxylase of Zymomonas mobilis inEscherichia coli. Arch Microbiol 1986, 144:296-301.
29. Neale AD, Scopes RK, Wettenhall REH, Hoogenraad NJ: Pyruvatedecarboxylase of Zymomonas mobilis : Isolation, propertiesand genetic expression in Escherichia coli. J Bacteriol 1987,169:1024-1028.
30. Mejia JP, Burnett ME, Haejung AN, Barnell WO, Keshav KF, ConwayT, Ingram LO: Coordination of Expression of Zymomonas mobi-lis Glycolytic and Fermentative Enzymes: a Simple Hypoth-esis Based on mRNA Stability. J Bacteriol 1992, 174:6438-6443.
31. Plumbridge J: Expression of ptsG, the gene for the major glu-cose PTS transporter in Escherichia coli, is repressed by Mlcand induced by growth on glucose. Mol Microbiol 1998,29:1053-1063.
32. Nam TW, Cho SH, Shin D, Kim JH, Jeong JY, Lee JH, Roe JH,Peterkofsky A, Kang SO, Ryu S, Seok YJ: The Escherichia coli glu-cose transporter enzyme IICBGlc recruits the global repres-sor Mlc. EMBO J 2001, 20:491-498.
33. Flores N, Flores S, Escalante A, de Anda R, Leal L, Malpica R, George-lis D, Gosset G, Bolivar F: Adaptation for fast growth on glucoseby differential expression of central carbon metabolism andgal regulon genes in an Escherichia coli strain lacking thephosphoenolpyruvate: carbohydrate phosphotransferasesystem. Metabol Eng 2005, 7:70-87 [http://www.ncbi.nlm.nih.gopmed/15781417?ordinalpos=18&itool=EntrezSystem2.PEntrez.Pubmed.Pubmed_ResultsPanel.Pubmed_RVDocSum].
34. Hua Q, Yand C, Oshima T, Mori H, Shimizu K: Analysis of geneexpression in Escherichia coli in response to changes ofgrowth-limiting nutrient in chemostat cultures. Appl EnvironMicrobiol 2004, 70:2354-66.
35. Postma PW, Lengeler JW, Jacobson GR: Phosphoenolpyruvate:Carbohydrate phosphotransferase systems. In Escherichia coliand Salmonella. Cellular and Molecular Biology Edited by: Neidhardt FC.Washington, DC: American Society for Microbiology;1996:1149-1174.
36. Báez-Viveros JL, Flores N, Juárez K, Castillo-España P, Bolivar F, Gos-set G: Metabolic transcription analysis of engineeredEscherichia coli strains that overproduce L-phenylalanine.Microb Cell Fact 2007, 6:30.
37. Arora KK, Pedersen PL: Glucokinase of Escherichia coli : Induc-tion in Response to the Stress of Overexpressing ForeignProteins. Arch Biochem Biophys 1995, 319(2):574-578.
38. Saier MH Jr: Cyclic AMP-independent catabolite repression inbacteria. FEMS Microbiol lett 1996, 138:97-103.
Page 12 of 13(page number not for citation purposes)
http://www.ncbi.nlm.nih.gov/entrez/query.fcgi?cmd=Retrieve&db=PubMed&dopt=Abstract&list_uids=3322191
http://www.ncbi.nlm.nih.gov/entrez/query.fcgi?cmd=Retrieve&db=PubMed&dopt=Abstract&list_uids=2059047
http://www.ncbi.nlm.nih.gov/entrez/query.fcgi?cmd=Retrieve&db=PubMed&dopt=Abstract&list_uids=2059047
http://www.ncbi.nlm.nih.gov/entrez/query.fcgi?cmd=Retrieve&db=PubMed&dopt=Abstract&list_uids=2059047
http://www.ncbi.nlm.nih.gov/entrez/query.fcgi?cmd=Retrieve&db=PubMed&dopt=Abstract&list_uids=1746941
http://www.ncbi.nlm.nih.gov/entrez/query.fcgi?cmd=Retrieve&db=PubMed&dopt=Abstract&list_uids=1746941
http://www.ncbi.nlm.nih.gov/entrez/query.fcgi?cmd=Retrieve&db=PubMed&dopt=Abstract&list_uids=1637151
http://www.ncbi.nlm.nih.gov/entrez/query.fcgi?cmd=Retrieve&db=PubMed&dopt=Abstract&list_uids=8953718
http://www.ncbi.nlm.nih.gov/entrez/query.fcgi?cmd=Retrieve&db=PubMed&dopt=Abstract&list_uids=8953718
http://www.ncbi.nlm.nih.gov/entrez/query.fcgi?cmd=Retrieve&db=PubMed&dopt=Abstract&list_uids=9572962
http://www.ncbi.nlm.nih.gov/entrez/query.fcgi?cmd=Retrieve&db=PubMed&dopt=Abstract&list_uids=9572962
http://www.ncbi.nlm.nih.gov/entrez/query.fcgi?cmd=Retrieve&db=PubMed&dopt=Abstract&list_uids=3053657
http://www.ncbi.nlm.nih.gov/entrez/query.fcgi?cmd=Retrieve&db=PubMed&dopt=Abstract&list_uids=2651404
http://www.ncbi.nlm.nih.gov/entrez/query.fcgi?cmd=Retrieve&db=PubMed&dopt=Abstract&list_uids=2651404
http://www.ncbi.nlm.nih.gov/entrez/query.fcgi?cmd=Retrieve&db=PubMed&dopt=Abstract&list_uids=2651404
http://www.ncbi.nlm.nih.gov/entrez/query.fcgi?cmd=Retrieve&db=PubMed&dopt=Abstract&list_uids=9611822
http://www.ncbi.nlm.nih.gov/entrez/query.fcgi?cmd=Retrieve&db=PubMed&dopt=Abstract&list_uids=9611822
http://www.ncbi.nlm.nih.gov/entrez/query.fcgi?cmd=Retrieve&db=PubMed&dopt=Abstract&list_uids=3546263
http://www.ncbi.nlm.nih.gov/entrez/query.fcgi?cmd=Retrieve&db=PubMed&dopt=Abstract&list_uids=1400196
http://www.ncbi.nlm.nih.gov/entrez/query.fcgi?cmd=Retrieve&db=PubMed&dopt=Abstract&list_uids=1400196
http://www.ncbi.nlm.nih.gov/entrez/query.fcgi?cmd=Retrieve&db=PubMed&dopt=Abstract&list_uids=9767573
http://www.ncbi.nlm.nih.gov/entrez/query.fcgi?cmd=Retrieve&db=PubMed&dopt=Abstract&list_uids=9767573
http://www.ncbi.nlm.nih.gov/entrez/query.fcgi?cmd=Retrieve&db=PubMed&dopt=Abstract&list_uids=7786044
http://www.ncbi.nlm.nih.gov/entrez/query.fcgi?cmd=Retrieve&db=PubMed&dopt=Abstract&list_uids=7786044
http://www.ncbi.nlm.nih.gov/entrez/query.fcgi?cmd=Retrieve&db=PubMed&dopt=Abstract&list_uids=7786044
Biotechnology for Biofuels 2008, 1:8 http://www.biotechnologyforbiofuels.com/content/1/1/8
Publish with BioMed Central and every scientist can read your work free of charge
"BioMed Central will be the most significant development for disseminating the results of biomedical research in our lifetime."
Sir Paul Nurse, Cancer Research UK
Your research papers will be:
available free of charge to the entire biomedical community
peer reviewed and published immediately upon acceptance
cited in PubMed and archived on PubMed Central
yours — you keep the copyright
Submit your manuscript here:http://www.biomedcentral.com/info/publishing_adv.asp
BioMedcentral
39. Saier MH Jr, Ramseier TM: Minireview. The catabolite repres-sor/activator (Cra) protein of enteric bacteria. J bacteriol 1996,178:3411-3417.
40. Crasnier-Mednansky M, Park MC, Studley WK, Saier MH Jr: Cra-mediated regulation of Escherichia coli adenylate cyclase.Microbiology 1997, 143:785-792.
41. Chin AM, Feldheim DA, Saier MH Jr: Altered transcription pat-terns affecting several metabolic pathways in strains of Sal-monella typhimurium which overexpress the fructoseregulon. J Bacteriol 1989, 171:2424-2434.
42. Ramseier TM, Bleding S, Michotey V, Feghali R, Saier MH Jr: The glo-bal regulatory protein FruR modulates the direction of car-bon flow in Escherichia coli. Mol Microbiol 1995, 16:1157-1169.
43. Eisen MB, Spellman PT, Brown PO, Botstein D: Cluster analysisand display of genome-wide expression patterns. Proceedingsof the National Academy of Sciences of the United States of America 1998,95:14863-14868.
44. Bledig SA, Ramseier TM, Saier MH Jr: FruR mediates cataboliteactivation of pyruvate kinase (pykF) gene expression inEscherichia coli. J Bacteriol 1996, 178:280-283.
45. Charpentier B, Branlant C: The Escherichia coli gapA Gene IsTranscribed by the Vegetative RNA Polymerase Holoen-zyme Eσ70 and the Heat Shock RNA Polymerase Eσ32. J Bac-teriol 1994, 176:830-839.
46. Bardey V, Vallet C, Robas N, Charpentier B, Thouvenot B, Mougin A,Hajnsdorf E, Régnier P, Springer M, Bralant C: Characterization ofthe molecular mechanisms involved in the differential pro-duction of erythrose-4-phosphate dehydrogenase, 3-phos-phoglycerate kinase and class II fructose-1,6-bisphosphatealdolase in Escherichia coli. Mol Microbiol 2005, 57:1265-1287.
47. Charpentier B, Bardey V, Robas N, Branlant C: The EIIGlc ProteinIs Involved in Glucose-Mediated Activation of Escherichia coligapA and gapB-pgk Transcription. J Bacteriol 1998,180:6473-6483 [http://www.ncbi.nlm.nih.gov/pubmed/9851989?ordinalpos=3&itool=EntrezSystem2.PEntz.Pubmed.Pubmed_ResultsPanel.Pubmed_RVDocSum].
48. Ludwing H, Homuth G, Schmalisch M, Dyka FM, Hecker M, Stulke J:Transcription of glycolytic genes and operons in Bacillus sub-tilis : evidence for the presence of multiple levels of controlof the gapA operon. Mol Microbiol 2001, 41:409-422.
49. Doan T, Aymerich S: Regulation of glycolytic genes in Bacillussubtilis : binding of the repressor CggR to its single DNA tar-get sequence is modulated by fructose-1,6-bisphosphate. MolMicrobiol 2003, 47:1709-1721.
50. Burchhardt G, Keshav KF, Yomano L, Ingram LO: Mutational Anal-ysis of Segmental Stabilization of Transcripts from theZymomonas mobilis gap-pgk Operon. J Biotechnol 1993,175:2327-2333 [http://jb.asm.org/cgi/reprint/175/8/2327?view=long&pmid=8468293].
51. Branny P, de la Torre F, Garel JR: An operon encoding three gly-colytic enzymes in Lactobacillus delbrueckii subsp. bulgaris:glyceraldehydes-3-phosphate dehydrogenase, phosphoglyc-erate kinase and triosephosphate isomerase. Microbiology1998, 144:905-914.
52. Flores S, Gosset G, Flores N, de Graaf AA, Bolívar F: Analysis ofcarbon metabolism in Escherichia coli strains with an inactivephosphotransferase system by 13C labeling and NMR spec-troscopy. Metabol Eng 2002, 4:124-137 [http://www.sciencedirect.com/science?_ob=ArticleURL&_udi=B6WN3-45V8024&_user=945819&_rdoc=1&_fmt=&_orig=search&_sort=d&view&_acct=C000048981&_version=1&_urlVersion=0&_userid=9458&md5=537d9456dc0f637cc3d453e1d7c6f11a].
53. Conway T: The Entner-Doudoroff pathway: history, physiol-ogy and molecular biology. FEMS Microbiol Rev 1992, 103:1-28[http://www.ncbi.nlm.nih.gov/pubmed/1389313?ordinalpos=11&itool=EntrezSystem2.PEntz.Pubmed.Pubmed_ResultsPanel.Pubmed_RVDocSum].
54. Sprenger GA: Carbohydrate metabolism in Zymomonas mobi-lis : a catabolic highway with some scenic routes. FEMS Micro-biol Lett 1996, 145:301-307.
55. Jones HM, Gunsalus RP: Transcription of the Escherichia coliFumarate Reductase Genes (frdABCD) and Their Coordi-nate Regulation by Oxygen, Nitrate, and Fumarate. J Bacteriol1985, 164:1100-1109.
56. Franchini AG, Egli T: Global gene expression in Escherichia coliK-12 during short-term and long-term adaptation to glu-cose-limited continuos culture conditions. Microbiol 2006,152(Pt 72111-2127 [http://mic.sgmjournals.org/cgi/content/full/152/7/2111?view=long&pmid=16804185].
57. Tseng C, Yu C, Lin H, Chang C, Kuo J: Oxygen- and Growth Rate-Dependent Regulation of Escherichia coli Fumarase (FumA,FumB and FumC) Activity. J Bacteriol 2000, 183(2461-467[httpww.ncbi.nlm.nih.gov/pubmed/11133938?ordinalpos=15&itool=EntrezSystem2.PEntz.Pubmed.Pubmed_ResultsPanel.Pubmed_RVDocSum].
58. Partridge J, Scott C, Tang Y, Poole R, Green J: Escherichia coli Tran-scriptome Dynamics during the Transition from Anaerobicto Aerobic Conditions. J Biol Chem 2006, 281:27806-27815.
59. Koebmann BJ, Westerhoff HV, Snoep JL, Nilsson D, Jensen PR: Theglycolytic flux in Escherichia coli is controlled by the demandfor ATP. J Bacteriol 2002, 184:3909-3916.
60. Papagianni M, Avramidis N, Filiousis G: Glycolysis and the regula-tion of glucose transport in Lactococcus lactis spp. lactis inbatch and fed-batch culture. Microbial Cell Factories 2007, 6:16.
61. Tarmy EM, Kaplan NO: Kinetics of Escherichia coli B D-LactateDehydrogenase and Evidence for Pyruvate-controlledChange in Conformation. J Biological Chemistry 1968,243:2587-2596 [http://www.ncbi.nlm.nih.gov/pubmed/4297266?ordinalpos=1&itool=EntrezSystem2.PEntz.Pubmed.Pubmed_ResultsPanel.Pubmed_RVDocSum].
62. Maniatis T, Fritsch EF, Sambrook J: Molecular Cloning. In A Labo-ratory Manual Cold Spring Harbor, Cold Spring Harbor LaboratoryPress; 1982.
63. Beall DS, Ohta K, Ingram LO: Parametric studies of ethanol pro-duction from xylose and other sugars by recombinantEscherichia coli. Biotechnol Bioeng 1991, 38:296-303.
64. Peng L, Shimizu K: Global metabolic regulation analysis forEscherichia coli K-12 based on protein expression by 2-dimen-sional electrophoresis and enzyme activity measurement.Appl Microbiol Biotechnol 2003, 61:163-178.
65. Conway T, Osman YA, Donnan EM, Ingram LO: Promoter andnucleotide sequences of the Zymomonas mobilis pyruvatedecarboxylase. J Bacteriol 1987, 169:949-954.
66. Maitra PK, Lobo Z: A kinetic study of glycolytic enzyme synthe-sis in yeast. J Biol Chem 1971, 246:475-488.
67. Bradford MM: A rapid and sensitive method for the quantita-tion of microgram quantitites of protein utilizing the princi-ple of protein-dye binding. Analytical Biochemistry 1976,72:248-254.
68. Livak K, Shmittgen TD: Analysis of relative gene expressiondata using real-time quantitative PCR and the 2-∆∆CTmethod. Methods 2001, 25:402-408.
Page 13 of 13(page number not for citation purposes)
http://www.ncbi.nlm.nih.gov/entrez/query.fcgi?cmd=Retrieve&db=PubMed&dopt=Abstract&list_uids=8655535
http://www.ncbi.nlm.nih.gov/entrez/query.fcgi?cmd=Retrieve&db=PubMed&dopt=Abstract&list_uids=8655535
http://www.ncbi.nlm.nih.gov/entrez/query.fcgi?cmd=Retrieve&db=PubMed&dopt=Abstract&list_uids=9084162
http://www.ncbi.nlm.nih.gov/entrez/query.fcgi?cmd=Retrieve&db=PubMed&dopt=Abstract&list_uids=2496106
http://www.ncbi.nlm.nih.gov/entrez/query.fcgi?cmd=Retrieve&db=PubMed&dopt=Abstract&list_uids=2496106
http://www.ncbi.nlm.nih.gov/entrez/query.fcgi?cmd=Retrieve&db=PubMed&dopt=Abstract&list_uids=8577250
http://www.ncbi.nlm.nih.gov/entrez/query.fcgi?cmd=Retrieve&db=PubMed&dopt=Abstract&list_uids=9843981
http://www.ncbi.nlm.nih.gov/entrez/query.fcgi?cmd=Retrieve&db=PubMed&dopt=Abstract&list_uids=9843981
http://www.ncbi.nlm.nih.gov/entrez/query.fcgi?cmd=Retrieve&db=PubMed&dopt=Abstract&list_uids=8550429
http://www.ncbi.nlm.nih.gov/entrez/query.fcgi?cmd=Retrieve&db=PubMed&dopt=Abstract&list_uids=8300536
http://www.ncbi.nlm.nih.gov/entrez/query.fcgi?cmd=Retrieve&db=PubMed&dopt=Abstract&list_uids=9579064
http://www.ncbi.nlm.nih.gov/entrez/query.fcgi?cmd=Retrieve&db=PubMed&dopt=Abstract&list_uids=9579064
http://www.ncbi.nlm.nih.gov/entrez/query.fcgi?cmd=Retrieve&db=PubMed&dopt=Abstract&list_uids=9579064
http://www.ncbi.nlm.nih.gov/entrez/query.fcgi?cmd=Retrieve&db=PubMed&dopt=Abstract&list_uids=2999070
http://www.ncbi.nlm.nih.gov/entrez/query.fcgi?cmd=Retrieve&db=PubMed&dopt=Abstract&list_uids=2999070
http://www.ncbi.nlm.nih.gov/entrez/query.fcgi?cmd=Retrieve&db=PubMed&dopt=Abstract&list_uids=3029037
http://www.ncbi.nlm.nih.gov/entrez/query.fcgi?cmd=Retrieve&db=PubMed&dopt=Abstract&list_uids=3029037
http://www.ncbi.nlm.nih.gov/entrez/query.fcgi?cmd=Retrieve&db=PubMed&dopt=Abstract&list_uids=5542016