META-REGRESSION OF RISK FACTORS FOR ...
12
455 Vol 43 No. 2 March 2012 Correspondence: Jayanton Patumanond, Faculty of Medicine, Chiang Mai University, Chiang Mai 50200, Thailand. E-mail: [email protected] META-REGRESSION OF RISK FACTORS FOR MICROALBUMINURIA IN TYPE 2 DIABETES Sirima Mongkolsomlit 1 , Jayanton Patumanond 1 , Chamaiporn Tawichasri 1 , Chulalux Komoltri 2 and Petch Rawdaree 3 1 Faculty of Medicine, Chiang Mai University, Chiang Mai; 2 Faculty of Medicine, Siriraj Hospital, Mahidol University, Bangkok; 3 Bangkok Metropolitan College of Medicine, Bangkok, Thailand Abstract. We aimed to determine the risk factors associated with microalbumin- uria in type 2 diabetes patients through a systematic review and meta-regression analysis. The analyzed studies were obtained from PubMed, Scopus, British Medical Journal and ProQuest databases. All studies published from 2000 to 2009 were included. The search yielded 1,243 citations, of which 22 studies were ana- lyzed. Pooled odds ratio estimates were obtained using a random effect model. The association of each risk factor with microalbuminuria was examined after adjusting for age and sex using meta-regression analysis. The adjusted odds ratio was 1.26 (95% CI 1.08-1.46) for systolic blood pressure; 1.16 (95% CI 1.03-1.31) for diastolic blood pressure; 1.43 (95% CI 1.14-1.80) for fasting plasma glucose level; 1.37 (95% CI 0.95-1.98) for smoking and 1.49 (95% CI 0.91-2.46) for waist circumference. The risk factors associated with microalbuminuria were found to be poor glycemic control, uncontrolled hypertension, smoking and central obe- sity. There is an urgent need to launch a health promotion program for changes in individual health behaviors to mitigate these risk factors for microalbuminuria in patients with type 2 diabetes. Keywords: type 2 diabetes, microalbuminuria, meta-regression INTRODUCTION The burdens of chronic diabetic com- plications are increasing worldwide. The causal association between microalbu- minuria and the development of diabetic complications has been well established (Bakris et al, 1994; Golan et al, 1999; Bakris et al, 2002; Poulsen, 2003). Several studies have determined the risk of microalbu- minuria depends on several determinants in patients with type 2 diabetes. These determinants include age, gender, body mass index (BMI), duration of diabetes, poor glycemic control, uncontrolled blood pressure and dyslipidemia related to mi- croalbuminuria. However, no systematic reviews have been undertaken to deter- mine risk factors for microalbuminuria in patients with type 2 diabetes. Previ- ous studies of the relationship between various risk factors and microalbumin- uria have provided controversial results (Mongkolsomlit and Rawdaree, 2010). Meta-regression is a well-established methodological approach for summariz- ing research findings. To our knowledge,
-
Upload
khangminh22 -
Category
Documents
-
view
0 -
download
0
Transcript of META-REGRESSION OF RISK FACTORS FOR ...

AnAlysis of Risk fActoRs AssociAted with MicRoAlbuMinuRiA
455Vol 43 No. 2 March 2012
Correspondence: Jayanton Patumanond, Faculty of Medicine, Chiang Mai University, Chiang Mai 50200, Thailand. E-mail: [email protected]
META-REGRESSION OF RISK FACTORS FOR MICROALBUMINURIA IN TYPE 2 DIABETES
Sirima Mongkolsomlit1, Jayanton Patumanond1, Chamaiporn Tawichasri1,Chulalux Komoltri2 and Petch Rawdaree3
1Faculty of Medicine, Chiang Mai University, Chiang Mai; 2Faculty of Medicine, Siriraj Hospital, Mahidol University, Bangkok; 3Bangkok Metropolitan College of
Medicine, Bangkok, Thailand
Abstract. We aimed to determine the risk factors associated with microalbumin-uria in type 2 diabetes patients through a systematic review and meta-regression analysis. The analyzed studies were obtained from PubMed, Scopus, British Medical Journal and ProQuest databases. All studies published from 2000 to 2009 were included. The search yielded 1,243 citations, of which 22 studies were ana-lyzed. Pooled odds ratio estimates were obtained using a random effect model. The association of each risk factor with microalbuminuria was examined after adjusting for age and sex using meta-regression analysis. The adjusted odds ratio was 1.26 (95% CI 1.08-1.46) for systolic blood pressure; 1.16 (95% CI 1.03-1.31) for diastolic blood pressure; 1.43 (95% CI 1.14-1.80) for fasting plasma glucose level; 1.37 (95% CI 0.95-1.98) for smoking and 1.49 (95% CI 0.91-2.46) for waist circumference. The risk factors associated with microalbuminuria were found to be poor glycemic control, uncontrolled hypertension, smoking and central obe-sity. There is an urgent need to launch a health promotion program for changes in individual health behaviors to mitigate these risk factors for microalbuminuria in patients with type 2 diabetes.
Keywords: type 2 diabetes, microalbuminuria, meta-regression
INTRODUCTION
The burdens of chronic diabetic com-plications are increasing worldwide. The causal association between microalbu-minuria and the development of diabetic complications has been well established (Bakris et al, 1994; Golan et al, 1999; Bakris et al, 2002; Poulsen, 2003). Several studies have determined the risk of microalbu-minuria depends on several determinants
in patients with type 2 diabetes. These determinants include age, gender, body mass index (BMI), duration of diabetes, poor glycemic control, uncontrolled blood pressure and dyslipidemia related to mi-croalbuminuria. However, no systematic reviews have been undertaken to deter-mine risk factors for microalbuminuria in patients with type 2 diabetes. Previ-ous studies of the relationship between various risk factors and microalbumin-uria have provided controversial results (Mongkolsomlit and Rawdaree, 2010). Meta-regression is a well-established methodological approach for summariz-ing research findings. To our knowledge,

southeAst AsiAn J tRop Med public heAlth
456 Vol 43 No. 2 March 2012
no meta-regression analysis has been performed to estimate the overall effect of a particular factor on the risk of microal-buminuria. To increase our current knowl-edge of these risk factors, we performed a systematic review and meta-regression analysis of studies to assess the risk fac-tors associated with microalbuminuria in patients with type 2 diabetes.
MATERIALS AND METHODS
Search strategy and data sourcesWe included both observational stud-
ies (analytical cross sectional studies, case-control studies and cohort studies) and randomized control trials (RCTs) published during 2000-2009. The follow-ing terms were used for the search: “mi-croalbuminuria AND risk factor,” “fasting plasma glucose AND microalbuminuria,” “body mass index AND microalbumin-uria,” “HbA1c AND microalbuminuria,” “duration of diabetes AND microalbu-minuria,” “gender or sex AND microalbu-minuria,” “age AND microalbuminuria,” “smoking AND microalbuminuria,” “lipid AND microalbuminuria” and “blood pressure AND microalbuminuria.” We performed our searches using the PubMed, Scopus, British Medical Journal and ProQuest databases.
The full articles were retrieved and screened using the following inclusion criteria: 1) study subjects were patients with type 2 diabetes who were more than 18 years old, and 2) microalbuminuria must have been evaluated in the subjects by quantitative or semi-quantitative meth-ods (Micral test). Studies that included participants with end-stage renal disease who were undergoing dialysis or renal transplantation were excluded.
The outcome of interest was micro-
albuminuria. Our definition of microal-buminuria was based on the American Diabetes Association (ADA) definition (American Diabetes Association, 2009). Microalbuminuria is defined by the ADA as the presence of more than 30 milligrams of albumin per day, more than 20 micro-grams of albumin per minute or more than 30-299 micrograms of albumin per milligram of urine. Smoking, blood pres-sure, blood glucose, lipid profile, BMI and waist circumference were recorded as exposures. Age and gender were recorded as confounding factors.Study selection and quality assessment
Of the 1,243 identified articles, 1,135 studies were excluded by initial screening by one investigator. Two investigators independently examined the full text of the remaining 108 studies to confirm they met eligibility criteria using a structured eligibility form. We resolved any disagree-ments by mutual discussion. Finally, we included 22 studies for analysis (Fig 1).
Because no standardized criteria have been established for judging the quality of observational studies, we adapted the meta-analysis of observational studies in epidemiology (MOOSE) group guidelines by selecting as a priori several important design characteristics that might affect study quality (Stroup et al, 2000). This selection was performed to evaluate possible sources of heterogeneity, includ-ing measurement bias, selection bias, selection of cases and controls and clear definitions of exposures and outcomes. To judge the quality of the randomized control trials, we adapted the quality as-sessment criteria from Jadad’s guidelines (Jadad et al, 1996), including eligibility criteria for participants, data collection settings and intervention allocations. In both observational studies and RCT

AnAlysis of Risk fActoRs AssociAted with MicRoAlbuMinuRiA
457Vol 43 No. 2 March 2012
quality assessments, we used the structured quality assessment form for analysis. Data extraction
The data were extracted using a struc-tured data entry form that categorized the data under the following headings: author, year of publication, population, urine collection method, urine measure-ments, outcomes and exposures. The units of measurement for the laboratory variables were converted from traditional units into international measurement units (SI units). The standard error of the mean (SEM) was converted to standard deviation (SD) by the following equation: SEM = SD/square root (n). The summa-rized data were evaluated twice to avoid transcription errors.Data analysis methods
The relationships between the out-
RESULTS
Studies reporting characteristicsA summary of the main character-
istics of the 22 studies included in the meta-regression analysis is shown in Table 1. Seventeen studies were cross sectional studies, two were case-control studies, two were cohort studies and one was a RCT. The majority of the studies (n=16) were carried out in hospitals. Five stud-ies were conducted at multiple centers and one was population-based. Fourteen studies used the spot morning method for urine collection, five studies used 24-hour urine collection, three studies used a timed urine collection method and one study had an unspecified method of urine collection.Heterogeneity test and publication bias
This meta-regression analysis of the
Fig 1–Study flow diagram.
Articles selected for key words(n=1,243)
Articles excluded on initial screening: abstract, review articles, duplicated articles, commentaries (n=1,135)
Articles selected for exclusion criteria consideration
(n=108)
Articles excluded on exclusion criteria: published before the year 2000, participants with end-stage renal disease, patients with no type 2
diabetes (n=47)
Articles selected for inclusion criteria consideration
(n=61)
Articles excluded on inclusion criteria: only males, only elderly patients, no information/not
clear about microalbuminuria cutoff point, urine collection technique and urine
measurement technique for microalbuminuria, (n=39)
Articles included in analysis(n=22)
come and risk variables were estimated using the pooled odds ratio and 95% confidence inter-vals of the pooled odds ratio. For undesirable outcomes, an odds ratio greater than 1 indicated the variable was a risk factor for microalbuminuria. We as-sessed heterogeneity among the studies using Cochrane Q and I2 statistics. Heterogeneity sig-nificance was an alpha (a) of 0.10. Egger’s test was used to assess potential publication bias (Egger et al, 1997). We used random ef-fect meta-regression to examine the association of risk factors with microalbuminuria after adjusting for age and sex in the model. All analyses were con-ducted using STATA software, version 11.0 (Stata Corporation, College Station, TX).

southeAst AsiAn J tRop Med public heAlth
458 Vol 43 No. 2 March 2012
Aut
hor
Publ
icat
ion
Po
pula
tion
Stud
y
Stud
y ba
sed
on
Urin
e
MA
M
A
Fact
ors r
ecor
ded
for
ye
ar
de
sign
colle
ctio
n po
sitiv
e ne
gativ
e ex
posu
rea
Mod
ebe
O
2000
Ba
hrai
ni
Cro
ss se
ctio
nal
Hos
pita
l bas
ed
24-h
our
132
180
1, 2
, 4, 5
, 6, 7
, 9, 1
0, 1
2, 1
3Va
rghe
se A
20
01
Sout
h In
dian
C
ross
sect
iona
l H
ospi
tal b
ased
Sp
ot m
orni
ng
518
907
1, 2
, 3, 4
, 5, 6
, 8, 9
, 10,
12,
13
Abd
ella
NA
20
02
Kuw
aiti
Cro
ss se
ctio
nal
Hos
pita
l bas
ed
Spot
mor
ning
14
1 16
2 2,
8, 9
, 10,
11,
12,
13
Brun
o G
20
03
Italia
n C
ohor
t H
ospi
tal b
ased
Ti
med
urin
e 42
6 67
7 1,
2, 3
, 4, 5
, 6, 7
, 9, 1
0, 1
2, 1
3H
ashi
m R
20
04
Paki
stan
i C
ross
sect
iona
l H
ospi
tal b
ased
Sp
ot m
orni
ng
70
80
1, 2
, 3, 4
, 7, 8
, 9, 1
0, 1
1, 1
2, 1
3M
atsu
i J
2004
Ja
pane
se
Cro
ss se
ctio
nal
Hos
pita
l bas
ed
24-h
our
11
12
1, 3
, 4, 5
, 6, 7
, 8, 9
, 10,
11,
12,
13
Yero
ng Y
20
04
Chi
nese
C
ross
sect
iona
l H
ospi
tal b
ased
Sp
ot m
orni
ng
12
12
1, 2
, 3, 5
, 6, 8
, 9, 1
0, 1
1, 1
2, 1
3, 1
4W
u AY
T
2005
A
sian
eth
nic
Cro
ss se
ctio
nal
Mul
ticen
ter
Spot
mor
ning
2,
211
2,29
7 1,
2, 3
, 4, 5
, 6, 8
, 9A
hmed
ani M
Y 20
05
Paki
stan
i C
ross
sect
iona
l M
ultic
ente
r U
nkno
wn
475
921
2, 7
, 9, 1
0Bu
rana
kitja
roen
P 2
005
Thai
C
ross
sect
iona
l H
ospi
tal b
ased
Sp
ot m
orni
ng
42
42
1, 2
, 3, 4
, 5, 6
, 8C
eder
holm
J 20
05
Swed
ish
Cro
ss se
ctio
nal
Mul
ticen
ter
Spot
mor
ning
1,
151
5,36
2 1,
2, 3
, 4, 5
, 6, 7
Bayk
an M
20
06
Turk
ish
Cro
ss se
ctio
nal
Hos
pita
l bas
ed
24-h
our
29
39
1, 2
, 3, 4
, 7, 9
, 10,
11,
12,
13
Luta
le JJ
K
2007
Ta
nzan
ian
Cro
ss se
ctio
nal
Hos
pita
l bas
ed
Tim
ed u
rine
26
127
1, 4
, 5, 6
, 9A
min
i M
2007
Is
faha
n C
ohor
t H
ospi
tal b
ased
24
-hou
r 17
6 32
9 1,
2, 3
, 4, 5
, 6, 7
, 8, 9
, 10,
11,
12,
13
Hel
aly
MA
20
07
Man
sour
a RC
T H
ospi
tal b
ased
Sp
ot m
orni
ng
20
20
1, 2
, 4, 5
, 6, 8
, 9, 1
0, 1
1, 1
2, 1
3U
nnik
rishn
an R
20
07
Indi
an
Cro
ss se
ctio
nal
Popu
latio
n ba
sed
Spot
mor
ning
46
2 1,
163
1, 2
, 3, 4
, 5, 6
, 7, 8
, 9, 1
4Yo
koya
ma
H
2007
Ja
pane
se
Cro
ss se
ctio
nal
Mul
ticen
ter
Spot
mor
ning
2,
812
5,15
2 1,
2, 3
, 4, 5
, 6, 9
Ross
i MC
20
08
Italia
n C
ross
sect
iona
l H
ospi
tal b
ased
Sp
ot m
orni
ng
308
1,24
9 1,
2, 3
, 4, 5
, 6, 7
, 9, 1
0, 11
, 12,
13,
14
Piar
ulli,
F
2009
Ita
lian
Cas
e-co
ntro
l H
ospi
tal b
ased
Ti
med
urin
e 62
37
1,
2, 3
, 4, 5
, 6, 7
, 8, 9
, 10,
11,
12,
13
Este
gham
ati A
20
09
Iran
ian
Cro
ss se
ctio
nal
Hos
pita
l bas
ed
24-h
our
237
563
1, 2
, 3, 4
, 5, 6
, 8, 9
, 10,
11, 1
2, 1
3, 1
4Ba
ris N
20
09
Turk
ish
Cas
e-co
ntro
l H
ospi
tal b
ased
24
-hou
r 45
46
1,
2, 3
, 4, 8
, 9, 1
0, 1
1, 1
2, 1
3, 1
4A
ekpl
akor
n W
20
09
Thai
C
ross
sect
iona
l M
ultic
ente
r Sp
ot m
orni
ng
1,62
8 2,
208
1, 2
, 3, 4
, 7, 9
, 10,
11,
12,
13,
14
Tabl
e 1
Cha
ract
eris
tics
of th
e st
udie
s re
port
ing
asso
ciat
ions
bet
wee
n ri
sk fa
ctor
s an
d m
icro
albu
min
uria
(N=2
2).
a 1, a
ge; 2
, gen
der;
3, B
MI;
4, d
urat
ion
of D
M; 5
, SBP
; 6, D
BP; 7
, sm
oke;
8, F
BS; 9
, HbA
1c; 1
0, to
tal c
hole
ster
ol; 1
1, L
DL;
12,
HD
L; 1
3, tr
igly
cerid
e;
14, w
aist
circ
umfe
renc
e

AnAlysis of Risk fActoRs AssociAted with MicRoAlbuMinuRiA
459Vol 43 No. 2 March 2012
Fact
ors
MA
+
MA
-
Eg
ger’
s tes
t I 2
df
Egge
r’s
(N
=10,
994)
(N
=21,
585)
Q
test
p-
valu
e
test
Age
(yea
rs)
58.7
±10.
9 57
.6±1
0.5
68.8
1 <0
.001
0.
60
72.4
19
0.
60M
ale
52.6
%
51.5
%
156.
01
<0.0
01
0.12
87
.3
19
0.12
BMI (
kg/m
2 ) 26
.7±4
.2
26.5
±4.0
53
.64
<0.0
01
0.41
70
.2
16
0.41
Dur
atio
n of
dia
bete
s (ye
ars)
8.
8±7.
3 7.
3±6.
4 56
.32
<0.0
01
0.08
68
.0
18
0.08
Syst
olic
BP
(mm
Hg)
14
1.3±
22.9
13
5.2±
19.7
70
.62
<0.0
01
0.93
78
.8
15
0.93
Dia
stol
ic B
P (m
mH
g)
82.7
±11.
8 80
.6±1
0.8
30.9
7 0.
009
0.18
51
.6
15
0.18
Toba
cco
smok
ing
10.4
%
10.2
%
72.0
6 <0
.001
0.
75
84.7
11
0.
75FB
S (m
mol
/l)
9.2±
2.9
8.2±
2.6
72.9
1 <0
.001
0.
39
83.5
12
0.
39H
bA1c
(%)
8.5±
2.1
7.9±
2.0
194.
55
<0.0
01
0.41
90
.2
19
0.41
Tota
l cho
lest
erol
(mm
ol/l)
5.
4±1.
2 5.
2±1.
1 24
3.83
<0
.001
0.
68
93.8
15
0.
68LD
L (m
mol
/l)
3.3±
1.1
3.2±
0.9
12.7
6 0.
309
0.14
13
.8
11
0.14
HD
L (m
mol
/l)
1.1±
0.3
1.2±
0.3
58.4
4 <0
.001
0.
52
76.0
14
0.
52Tr
igly
cerid
es (m
mol
/l)
2.0±
1.0
1.8±
0.9
48.2
8 <0
.001
0.
33
71.0
14
0.
33W
aist
circ
umfe
renc
e (c
m)
93.1
±10.
4 91
.4±1
0.1
9.84
0.
080
0.39
49
.2
5 0.
39
Tabl
e 2
Het
erog
enei
ty s
tatis
tics
and
publ
icat
ion
bias
test
.
Het
erog
enei
ty
stat
istic
s
MA
, mic
roal
bum
inur
ia

southeAst AsiAn J tRop Med public heAlth
460 Vol 43 No. 2 March 2012
22 studies included 10,994 cases of mi-croalbuminuric diabetes and 21,585 cases with non-microalbuminuric diabetes. To determine the level of heterogeneity among the studies, we performed the Cochran’s Q test. Since we found a statisti-cally significant level of heterogeneity (p < 0.10) among the exposure variables except for low-density lipoprotein (LDL) levels, we conducted a random effect model for all the studies to estimate the effect size of each of the exposures. We found no significant evidence of publication bias on any of the factors in our analysis with the Egger’s test (Table 2). Risk factors and microalbuminuria
Table 2 shows the heterogeneity sta-tistics and publication bias test results. All factors showed statistically significant heterogeneity, except for the LDL and waist circumference variables. None of the variables showed significant differences with the publication bias test.
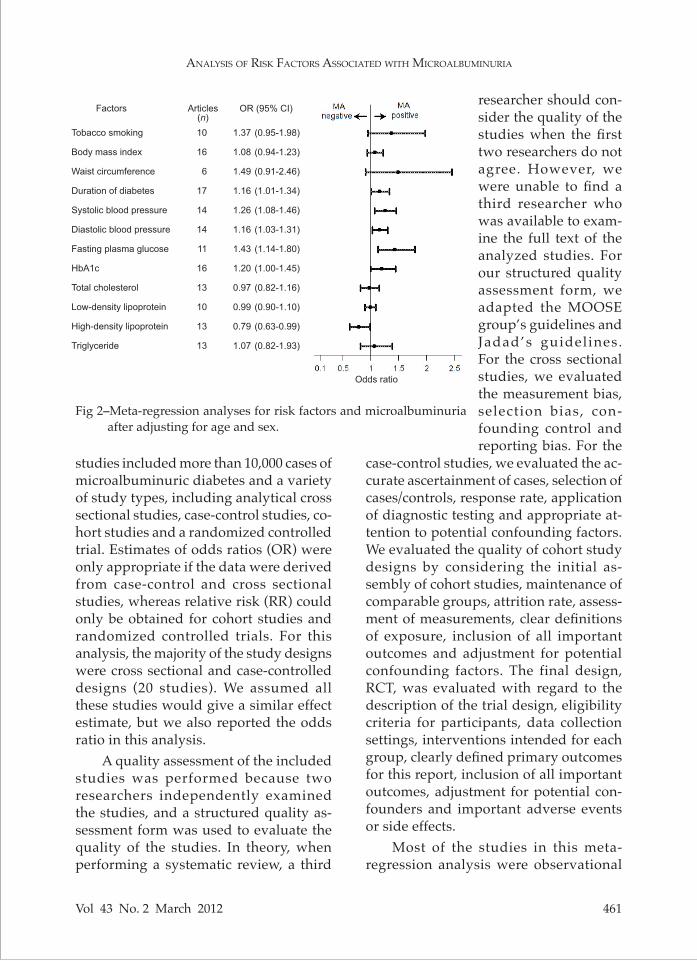
After performing the heterogene-ity and publication bias assessments, we performed a meta-regression model analysis using the random effect method to examine the association of each factor with microalbuminuria after adjusting for age and sex (Fig 2). The duration of diabe-tes, systolic and diastolic blood pressure, fasting plasma glucose and high-density lipoprotein (HDL) values were signifi-cantly associated with microalbuminuria (OR 1.16, 95% CI 1.01-1.34; OR 1.26, 95% CI 1.08-1.46; OR 1.16, 95%CI, 1.03-1.31; OR 1.43, 95% CI, 1.14-1.80; OR 0.79, 95% CI, 0.63-0.99, respectively). Smoking and waist circumference were possible risk factors for microalbuminuria, but the dif-ferences were not statistically significant (OR 1.37, 95% CI 0.95-1.98; OR 1.49, 95% CI 0.91-2.46, respectively).
DISCUSSION
This meta-regression analysis of 22
Source of heterogeneity Age Sex Smoker FBS HbA1c SBP DBP
Urine collection 24 hour 33.6 78.6 0.00 19.3 93.2 0.00 0.00 Spot morning 82.6 87.2 37.3 87.8 87.0 86.7 63.3 Timed urine 0.00 0.00 0.00 NAa 0.00 0.00 0.00Study design Cross sectional 78.6 88.4 88.4 88.0 82.3 82.4 56.7 Cohort 0.00 93.8 50.3 NAa 98.8 84.2 76.6 Case-control 0.00 0.00 NAa 0.00 0.00 NAa NAa
RCT NAa NAa NAa NAa NAa NAa NAa
Study setting Hospital 37.0 76.6 96.7 34.3 88.9 0.1 0.0 Multi-center 93.5 95.9 0.00 NAa 89.1 96.0 3.9 Community NAa NAa NAa NAa NAa NAa NAa
Table 3Sources of heterogeneity in the analyzed studies.
Variation in ES attributable to heterogeneity (I2)
a NA, not applicable
AnAlysis of Risk fActoRs AssociAted with MicRoAlbuMinuRiA
461Vol 43 No. 2 March 2012
Tobacco smoking
Body mass index
Waist circumference
Duration of diabetes
Systolic blood pressure
Diastolic blood pressure
Fasting plasma glucose
HbA1c
Total cholesterol
Low-density lipoprotein
High-density lipoprotein
Triglyceride
Factors
10
16
6
17
14
14
11
16
13
10
13
13
Articles(n)
1.37
1.08
1.49
1.16
1.26
1.16
1.43
1.20
0.97
0.99
0.79
1.07
(0.95-1.98)
(0.94-1.23)
(0.91-2.46)
(1.01-1.34)
(1.08-1.46)
(1.03-1.31)
(1.14-1.80)
(1.00-1.45)
(0.82-1.16)
(0.90-1.10)
(0.63-0.99)
(0.82-1.93)
OR (95% CI)
Odds ratio
Fig 2–Meta-regression analyses for risk factors and microalbuminuria after adjusting for age and sex.
studies included more than 10,000 cases of microalbuminuric diabetes and a variety of study types, including analytical cross sectional studies, case-control studies, co-hort studies and a randomized controlled trial. Estimates of odds ratios (OR) were only appropriate if the data were derived from case-control and cross sectional studies, whereas relative risk (RR) could only be obtained for cohort studies and randomized controlled trials. For this analysis, the majority of the study designs were cross sectional and case-controlled designs (20 studies). We assumed all these studies would give a similar effect estimate, but we also reported the odds ratio in this analysis.
A quality assessment of the included studies was performed because two researchers independently examined the studies, and a structured quality as-sessment form was used to evaluate the quality of the studies. In theory, when performing a systematic review, a third
case-control studies, we evaluated the ac-curate ascertainment of cases, selection of cases/controls, response rate, application of diagnostic testing and appropriate at-tention to potential confounding factors. We evaluated the quality of cohort study designs by considering the initial as-sembly of cohort studies, maintenance of comparable groups, attrition rate, assess-ment of measurements, clear definitions of exposure, inclusion of all important outcomes and adjustment for potential confounding factors. The final design, RCT, was evaluated with regard to the description of the trial design, eligibility criteria for participants, data collection settings, interventions intended for each group, clearly defined primary outcomes for this report, inclusion of all important outcomes, adjustment for potential con-founders and important adverse events or side effects.
Most of the studies in this meta-regression analysis were observational
researcher should con-sider the quality of the studies when the first two researchers do not agree. However, we were unable to find a third researcher who was available to exam-ine the full text of the analyzed studies. For our structured quality assessment form, we adapted the MOOSE group’s guidelines and Jadad’s guidelines. For the cross sectional studies, we evaluated the measurement bias, selection bias, con-founding control and reporting bias. For the

southeAst AsiAn J tRop Med public heAlth
462 Vol 43 No. 2 March 2012
studies, but no significant publication bias was found (p > 0.05 for all). Because significant heterogeneity was present, we used the random effects model, since it assumes the true effect estimate for each study does vary. We explored the sources of heterogeneity in the study outcomes among the studies by subgroup analysis. The sources of heterogeneity in the main risk factors were the method of urine col-lection, study design and study setting. Table 3 shows the variations in effect sizes that are attributable to heterogeneity in the variables of our study. The studies that used the spot morning collection method and a cross sectional study de-sign were affected by high heterogeneity (I2 of nearly 100%). We cannot explain these heterogeneity effects. The sources of intra-study variability could include differences in study populations, such as age and gender; therefore, we used meta-regression analysis to estimate the effect of each risk factor on microalbuminuria in diabetes type 2 after adjusting for the influences of age and gender.
The findings of this study confirm a substantially higher risk associated with male gender, older age, tobacco smoking, longer duration of diabetes, uncontrolled blood pressure, uncontrolled blood glu-cose and uncontrolled dyslipidemia as-sociated with microalbuminuria. After ad-justing for age and sex by meta-regression analysis, we also found tobacco smoking, longer duration of diabetes, uncontrolled blood pressure and uncontrolled blood glucose are risk factors for microalbumin-uria. However, total cholesterol, LDL and triglyceride levels are not associated with microalbuminuria.
The associations between age and sex and microalbuminuria have been confirmed. Age and sex cannot be altered
to reduce risk of developing microalbu-minuria. However, if greater attention is paid to risk factors among males and older people, this knowledge could help to identify patients in high-risk groups for developing microalbuminuria.
This study confirmed that smoking is a risk factor for microalbuminuric type 2 diabetes. The greater the number of total pack-years smoked the greater the risk of developing proteinuria (p < 0.05) (Mat-tock et al, 1992). Duration of diabetes was confirmed as risk factor for microalbumin-uria in type 2 diabetes. As a worldwide epidemic, type 2 diabetes has become more common among children and teens. A child with type 2 diabetes will have a long duration of diabetes. However, type 2 diabetes can be reduced or eliminated among younger people by providing health education and health promotion programs. The programs should focus on people who care for children, such as par-ents, high school teachers and childcare providers; these programs should include students in boarding schools and students attending day schools.
Uncontrolled FBS, HbA1c and elevat-ed blood pressure levels were significantly associated with microalbuminuria. This result was expected because high blood glucose levels are known to result in the thickening of the vascular basement mem-brane (Cagliego et al, 1991). Moreover, elevated blood pressure is documented to be the most significant contributing factor in the pathogenesis and progression of an abnormal urinary albumin excretion rate (AER) and, eventually, in the development of diabetic nephropathy in type 2 diabetic patients (Schmitz et al, 1994).
Abnormalities in lipoprotein metabo-lism, such as elevated triglyceride levels and reduced HDL cholesterol levels, have

AnAlysis of Risk fActoRs AssociAted with MicRoAlbuMinuRiA
463Vol 43 No. 2 March 2012
been demonstrated in microalbuminuric type 2 diabetic patients (Bonnet et al, 2000; Shoji et al, 2001). The majority of studies included in this analysis found an asso-ciation between an abnormal lipid profile and increased urine albumin excretion, but the present study, after adjusting for age and sex by meta-regression analysis, found total cholesterol, LDL and trigly- ceride levels were not associated with microalbuminuria.
Several studies have found that BMI is associated with microalbuminuria, while others have not. In the past, evi-dence of an association between basal BMI and increased albumin excretion has been equivocal. This meta-regression analysis shows BMI is not associated with micro-albuminuria but waist circumference is possibly associated with microalbumin-uria. Waist circumference is an interesting variable. Behan and Mbizo (2007) studied the relationship between waist circum-ference and biomarkers for diabetes and cardiovascular disease (CVD) among healthy, non-obese women. The results showed waist circumference was corre-lated with triglyceride, CRP, cholesterol/HDL, non-HDL, LDL and glucose levels and inversely correlated with HDL levels (r = 0.465, 0.414, 0.321, 0.299, 0.267, 0.279, -0.266, respectively; p < 0.001 for all). It is possible waist circumference depends on the lipid profile of a person and the lipid profile is related to waist circumference. The knowledge analysis of lipid levels is dispensable may enable a reduction in costs to governments and patients when screening for risk factors for microalbu-minuria.
Compared to the general population, patients with type 2 diabetes mellitus are at a significantly increased risk for the development of atherosclerotic compli-cations that can lead to cardiovascular
morbidity and death; this risk is even greater in diabetic patients who present with microalbuminuria (Friedman et al, 2004). Preventing the development of microalbuminuria is a key treatment goal for nephroprotection, retinoprotec-tion and cardioprotection (Turner et al, 1998; Ritz, 2003). Several studies have documented microalbuminuria can be reduced by using the angiotensin drug rennin. Early detection of risk factors for microalbuminuria and the early control of diabetes retards the development of structural changes that can lead to early diabetic complications.
Many studies have confirmed mi-croalbuminuria is an early predictor of nephropathic and cardiovascular com-plications of diabetes (Bennett, 1989; Messent et al, 1992; Mattock et al, 1998). Nephropathy is a microvascular com-plication, and cardiovascular problems represent a macrovascular complication. The cause of macrovascular diseases is metabolic syndrome. The criteria for the diagnosis of metabolic syndrome by the International Diabetes Federation (IDF) include central obesity (a waist circumfirance ≥90 cm in males or ≥80 cm in females), elevated TG levels, reduced HDL-C levels, elevated blood pressure and elevated fasting plasma glucose (In-ternational Diabetes Federation resourses page). The characteristics of lipid abnor-malities in metabolic syndrome are low HDL levels, high triglyceride levels, low LDL levels and high apoprotein B levels. These risk factors are similar to risk fac-tors for microalbuminuria found in this meta-regression analysis. Only LDL level had no significant association with micro-albuminuria. At present, we do not know what causes the difference between micro- and macrovascular complications or why some patients with type 2 diabetes present

southeAst AsiAn J tRop Med public heAlth
464 Vol 43 No. 2 March 2012
with microvascular complications, while others present with macrovascular dis-eases. It is possible the LDL level might be an indicator for this difference.
This study highlights the importance of the early detection of microalbuminuria among patients with type 2 diabetes. With regard to our study limitations, we did not study all of the factors that could influence microalbuminuria. Baris et al (2009) found markers of inflammation, including serum hs-CRP and L-arginine, were correlated with microalbuminuria in type 2 diabetes; serum hs-CRP concentrations were signif-icantly elevated in diabetic patients with microalbuminuria (p = 0.012). L-arginine concentrations differed significantly be-tween diabetic patients with and without microalbuminuria (p <0.001). This study did not evaluate these factors because it is difficult to include them when screening for microalbuminuria.
ACKNOWLEDGEMENTS
This research was supported by grants from the Faculty of Medicine Research Fund, Chiang Mai University, Chiang Mai, Thailand.
REFERENCES
Abdella NA, Mojiminiyi OA, Akanji AO, Moussa MA. Associations of plasma ho-mocysteine in subjects with type 2 diabetes mellitus. Acta Diabetol 2002; 39: 183-90.
Aekplakorn W, Srivanichakorn S, Sangwatan-aroj S. Microabluminuria and metabolic risk factors in patients with type 2 diabetes in primary care setting in Thailand. Diab Res Clin Prac 2009; 84: 92-98.
Ahmedani MY, Hydrie MZI, Iqbal A, Gul A, Mirza WB. Prevalence of microalbumin-uria in type 2 diabetic patients in Karachi: Pakistan: a multi-center study. J Pak Med Assoc 2005; 55: 382-6.
American Diabetes Association. Standards of medical care in diabetes. Diabetes Care 2009; 32: S13-61.
Amini M, Safaei H, Aminorroaya A. The incidence of microalbuminuria and its associated risk factors in type 2 diabetic patients in Isfahan, Iran. Rev Diabetic Stud 2007; 4: 242-8.
Bakris GL, Slataper R, Vicknair N, Sadler R. ACE inhibitor mediated reductions in renal size and microalbuminuria in nor-motensive, diabetic subjects. J Diabetes Complications 1994; 8: 2-6.
Bakris GL, Smith AC, Richardson DJ, et al. Impact of an ACE inhibitor and calcium antagonist on microalbuminuria and lipid subfractions in type 2 diabetes: a randomised, multi-centre pilot study. J Hum Hypertens 2002; 16: 185-91.
Baris N, Erdogan M, Sezer E, et al. Alterations in L-arginine and inflammatory markers in type 2 diabetic patients with and without microalbuminuria. Acta Diabetol 2009; 46: 309-16.
Baykan M, Erdogan T, Erem C, et al. The re-lationship between flow-mediated dilata-tion and lift ventricular in type 2 diabetic patients with microalbuminuria. Endocrine 2006; 30: 197-202.
Behan KJ, Mbizo J. The relationship between waist circumference and biomarkers for diabetes and CVD in healthy non-obese women. The Pensacola Study. Lab Med 2007; 38: 422-27.
Bennett PH. ‘Microalbuminuria’ and diabetes: a critique–assessment of urinary albumin excretion and its role in screening for dia-betic nephropathy. Am J Kidney Dis 1989; 13: 29-34.
Bonnet F, Cooper ME. Potential influence of lipids in diabetic nephropathy: insights from experimental data and clinical stud-ies. Diabet Med 2000; 26: 254-64.
Bruno G, Merletti F, Biggeri A, et al. Progres-sion to overt nephropathy in type 2 diabe-tes. Diabetes Care 2003; 26: 2150-5.

AnAlysis of Risk fActoRs AssociAted with MicRoAlbuMinuRiA
465Vol 43 No. 2 March 2012
Buranakitjaroen P, Deerochanawong C, Bunnag P. Microalbuminuria prevalence study (MAPS) in hypertensive patients with type 2 diabetes in Thailand. J Med Assoc Thai 2005; 88: 1624-29.
Cagliego E, Roth T, Roy S, Orenzi M. Charac-teristics and mechanism of high glucose induced over expression of basement membrance components in cultured hu-man endothelial cells. Diabetes 1991; 40: 102-12.
Cederholm J, Eliasson B, Nilsson PM, Weiss L, Gudbjornsdottir S. Microalbuminuria and risk factors in type 1 and type 2 diabetic patients. Diab Res Clin Prac 2005; 67: 258-66.
Egger M, Devey Smith G, Stettler C, Diem P. Risk of adverse effects of intensified treatment in insulin-dependent diabetes mellitus: a meta-analysis. Diabet Med 1997; 14: 919-28.
Esteghamati A, Khalilzadeh O, Anvari M, et al. Association of serum leptin levels with ho-meostasis model assessment-estimated in-sulin resistance and metabolic syndrome: the key role of central obesity. Metab Syndr Relat Disord 2009; 7: 447-52.
Friedman AN, Hunsicker LG, Selhub J, Bostom AG. Clinical and nutritional correlates of C-reactive protein in type 2 diabetic ne-phropathy. Atherosclerosis 2004; 172: 121-5.
Golan L, Birkmeyer JD, Welch HG. The cost-effectiveness of treating all patients with Type 2 diabetes with angiotensin-convert-ing enzyme inhibitors. Ann Intern Med 1999; 131: 660-7.
Hashim R, Rehman K-U, Ahmed TA, et al. Mi-croalbuminuria and associated risk factors in type 2 diabetics. J Coll Physicial Surg Pak 2004; 14: 84-7.
Helaly MA, Sheashaa HA, Hatata ESZ, et al. En-dothelial dysfunction in geriatric diabetic patients: the role of microalbuminuria in elderly type 2 diabetic patients? A random-ized controlled study. Int Urol Nephrol 2007; 39: 333-8.
International Diabetes Federation resourses page. The IDF consensus worldwide defi-
nition of the metabolic syndrome. [Cited 2010 Mar 15]. Available from: URL: http://www.idf.org/webdata/docs/MetS_def_up-date2006.pdf
Jadad AR, Moore RA, Carroll D, et al. Assessing the quality of reports of randomized clini-cal trials: Is blinding necessary? Control Clin Trials 1996; 17: 1-12.
Lutale JJK, Thordarson H, Abbas ZG, Vetvik K. Microalbuminuria among type 1 and type 2 diabetic patients of African origin in Dar Es Salaam, Tanzania. BMC Nephrol 2007; 8(2). [Cited 2008 Feb 8]. Available from URL: http://www.biomedcentral.com/1471-2369/8/2. doi:10.1186/1471-2369-8-2.
Matsui J, Tamasawa N, Tanabe J, et al. LDL particle size and lipid composition are risk factors for microalbuminuria in normoten-sive and normocholesterolemic patients with type 2 diabetes. Diab Res Clin Prac 2004; 66: 229-36.
Mattock MB, Barnes DJ, Viberti G, et al. Micro-albuminuria and coronary heart disease in NIDDM: an incidence study. Diabetes 1998; 47: 1786-92.
Mattock MB, Morrish NJ, Viberti G, et al. Pro-spective study of microalbuminuria as predictor of mortality in NIDDM. Diabetes 1992; 41: 736-41.
Messent JWC, Elliott TG, Hill RD, et al. Prog-nostic significance of microalbuminuria in insulin-dependent diabetes mellitus: a twenty-three year follow-up study. Kidney Int 1992; 41: 836-9.
Modebe O, Masoomi MA. Microalbuminuria and associated factors in Bahraini patients with type 2 diabetes mellitus. Ann Saudi Med 2000; 20: 157-60.
Mongkolsomlit S, Rawdaree P. Factors affecting microalbuminuria in type 2 diabetes: meta-analysis. Srinagarind Med J 2010; 25: 185-93.
Piarulli F, Sartore G, Ceriello A, et al. Relation-ship between glyco-oxidation, antioxidant status and microalbuminuria in type 2 diabetic patients. Diabetologia 2009; 52: 1419-25.

southeAst AsiAn J tRop Med public heAlth
466 Vol 43 No. 2 March 2012
Poulsen PL. ACE inhibitor intervention in Type 1 diabetes with low grade microalbumin-uria. J Renin Angiotensin Aldosterone Syst 2003; 4: 17-26.
Ritz E. Albuminuria and vascular damage-the vicious twins. N Engl J Med 2003; 348: 2349-52.
Rossi MC, Nicolucci A, Pellegrini F, et al. Iden-tifying patients with type 2 diabetes at high risk of microalbuminuria: results of the DEMAND (Developing Education on Microalbuminuria for Awareness of reNal and cardiovascular risk in Diabetes) study. Nephrol Dial Transplant 2008; 23: 1278-84.
Schmitz A, Vaeth M, Mogensen C. Systolic blood pressure relates to the rate of pro-gression of albuminuria in NIDDM. Dia-betologia 1994; 37: 1251-8.
Shoji T, Emoto M, Kawagishi T, et al. Athero-genic lipoprotein changes in diabetic ne-phropathy. Atherosclerosis 2001; 156: 425-33.
Stroup D, Berlin J, Morton S, et al. Meta-analysis of observational studies in epidemiology: a proposal for reporting. Meta-analysis Of Observational Studies in Epidemiology (MOOSE) group. JAMA 2000; 283: 2008-12.
Turner R, Holman R, Stratton I, et al. Tight blood pressure control and risk of macro-vascular and microvascular complications
in type 2 diabetes: UKPDS 38. BMJ 1998; 317: 703-13.
Unnikrishnan R, Rema M, Pradeepa R, Deepa M. Prevalence and risk factors of diabetic nephropathy in an urban South Indian population: The Chennai Urban Rural Epidemiology Study (CURES 45). Diabetes Care 2007; 30: 2019-24.
Varghese A, Deepa R, Rema M, Mohan V. Prevalence of microalbuminuria in type 2 diabetes mellitus at a diabetes centre in southern India. Postgrad Med J 2001; 77: 399-402.
Wu AYT, Kong NCT, de Leon FA, et al. An alarmingly high prevalence of diabetic nephropathy in Asian type 2 diabetic pa-tients: the microalbuminuira prevalence (MAP) study. Diabetologia 2005; 48: 17-26.
Yerong Y, Lixia S, Hongling Y, Chun W, Hong T. Insulin resistance and endothelial dys-function in type 2 diabetes patients with or without microalbuminuria. Diab Res Clin Prac 2004; 65: 95-104.
Yokoyama H, Kawai K, Kobayashi M. Micro-albuminuria is common in Japanese type 2 diabetic patients:A nationwide survey from the Japan Diabetes Clinical Data Management Study Group (JDDM 10). Diabetes Care 2007; 30: 989-92.