Mental Health, Health Behaviors, Social Support, Self-Efficacy and ...
129
University of Rhode Island University of Rhode Island DigitalCommons@URI DigitalCommons@URI Open Access Dissertations 2015 Mental Health, Health Behaviors, Social Support, Self-Efficacy and Mental Health, Health Behaviors, Social Support, Self-Efficacy and Disease: An Integrative Model Disease: An Integrative Model N. Simay Gokbayrak University of Rhode Island, [email protected] Follow this and additional works at: https://digitalcommons.uri.edu/oa_diss Recommended Citation Recommended Citation Gokbayrak, N. Simay, "Mental Health, Health Behaviors, Social Support, Self-Efficacy and Disease: An Integrative Model" (2015). Open Access Dissertations. Paper 391. https://digitalcommons.uri.edu/oa_diss/391 This Dissertation is brought to you for free and open access by DigitalCommons@URI. It has been accepted for inclusion in Open Access Dissertations by an authorized administrator of DigitalCommons@URI. For more information, please contact [email protected].
-
Upload
khangminh22 -
Category
Documents
-
view
0 -
download
0
Transcript of Mental Health, Health Behaviors, Social Support, Self-Efficacy and ...

University of Rhode Island University of Rhode Island
DigitalCommons@URI DigitalCommons@URI
Open Access Dissertations
2015
Mental Health, Health Behaviors, Social Support, Self-Efficacy and Mental Health, Health Behaviors, Social Support, Self-Efficacy and
Disease: An Integrative Model Disease: An Integrative Model
N. Simay Gokbayrak University of Rhode Island, [email protected]
Follow this and additional works at: https://digitalcommons.uri.edu/oa_diss
Recommended Citation Recommended Citation Gokbayrak, N. Simay, "Mental Health, Health Behaviors, Social Support, Self-Efficacy and Disease: An Integrative Model" (2015). Open Access Dissertations. Paper 391. https://digitalcommons.uri.edu/oa_diss/391
This Dissertation is brought to you for free and open access by DigitalCommons@URI. It has been accepted for inclusion in Open Access Dissertations by an authorized administrator of DigitalCommons@URI. For more information, please contact [email protected].

MENTAL HEALTH, HEALTH BEHAVIORS, SOCIAL SUPPORT, SELF-
EFFICACY AND DISEASE: AN INTEGRATIVE MODEL
BY
N. SIMAY GOKBAYRAK
A DISSERTATION SUBMITTED IN PARTIAL FULFILLMENT OF THE
REQUIREMENTS FOR THE DEGREE OF
DOCTOR OF PHILOSOPHY
IN
PSYCHOLOGY
UNIVERSITY OF RHODE ISLAND
2015
DOCTOR OF PHILOSOPHY DISSERTATION
OF
N. SIMAY GOKBAYRAK
APPROVED:
Dissertation Committee
Major Professor James O. Prochaska
Andrea L. Paiva
Bryan J. Blissmer
Nasser H. Zawia
UNIVERSITY OF RHODE ISLAND
2015

Abstract
The utility of modifiable health behaviors for better physical health outcomes
is well-established. Because mental illness is a serious public health concern
worldwide, an important question pertains to whether health behaviors likewise have
benefits for mental health. Although simple research methods indicate positive
relations, no investigations have tested models with mediating factors to discern
specific pathways between health behaviors and mental health. As such, this study
aimed to do so using path analysis to examine the impact of three key health behaviors
(i.e., smoking cessation, exercise, and healthy eating) on mental health. In addition,
the potential roles of perceived social support, general self-efficacy and physical
health within the health behaviors and mental health relationship were investigated. A
population-based sample of 427 adults completed survey measures. One important
finding was the mediating effect of physical health between exercise/ healthy eating,
and mental health functioning. Implications are further discussed. Group comparisons
indicated that : 1) Smoking doesn’t appear significantly related to self-efficacy,
perceived social support and mental health functioning, 2) engaging in exercise and
healthy eating for at least six months is strongly linked to better general self-efficacy
and mental health, 3) those who are contemplating engaging in exercise and/or healthy
eating in the next six months appear to be particularly different than maintainers in
terms of their mental health status, 4) perceived social support is significantly related
to physical and mental health functioning, and 5) general self-efficacy is significantly
linked to mental health functioning.

iii
Acknowledgements
I would like to take this opportunity to acknowledge my major professor, Dr.
James Prochaska for all of his time, feedback, and patience over the past several years.
I am also grateful to my core committee members. Dr. Andrea Paiva, whose feedback
and guidance particularly on study design and data interpretation, care for my research
questions, and continuous support have helped me tremendously through this process.
Dr. Bryan Blissmer, for sharing his experienced ideas and evaluations to improve this
project. Further, Si Yang and Hui-Qing Yin have provided complementary
perspectives on this research project and statistical insight that have been invaluable in
the execution of this project. Lastly, I would like to thank my family and friends for
supporting my academic and professional goals throughout the past decade.

iv
TABLE OF CONTENTS
ABSTRACT ii
ACKNOWLEDGEMENTS iii
TABLE OF CONTENTS iv
LIST OF TABLES v
LIST OF FIGURES viii
CHAPTER 1 1
DEFINITION AND SIGNIFICANCE OF THE PROBLEM 1
CHAPTER 2 3
REVIEW OF LITERATURE 3
CHAPTER 3 16
PURPOSE OF THE PRESENT STUDY 16
CHAPTER 4 19
METHODOLOGY 19
CHAPTER 5 29
RESULTS 29
CHAPTER 6 43
CONCLUSION 43
APPENDICES 78
BIBLIOGRAPHY 102
v
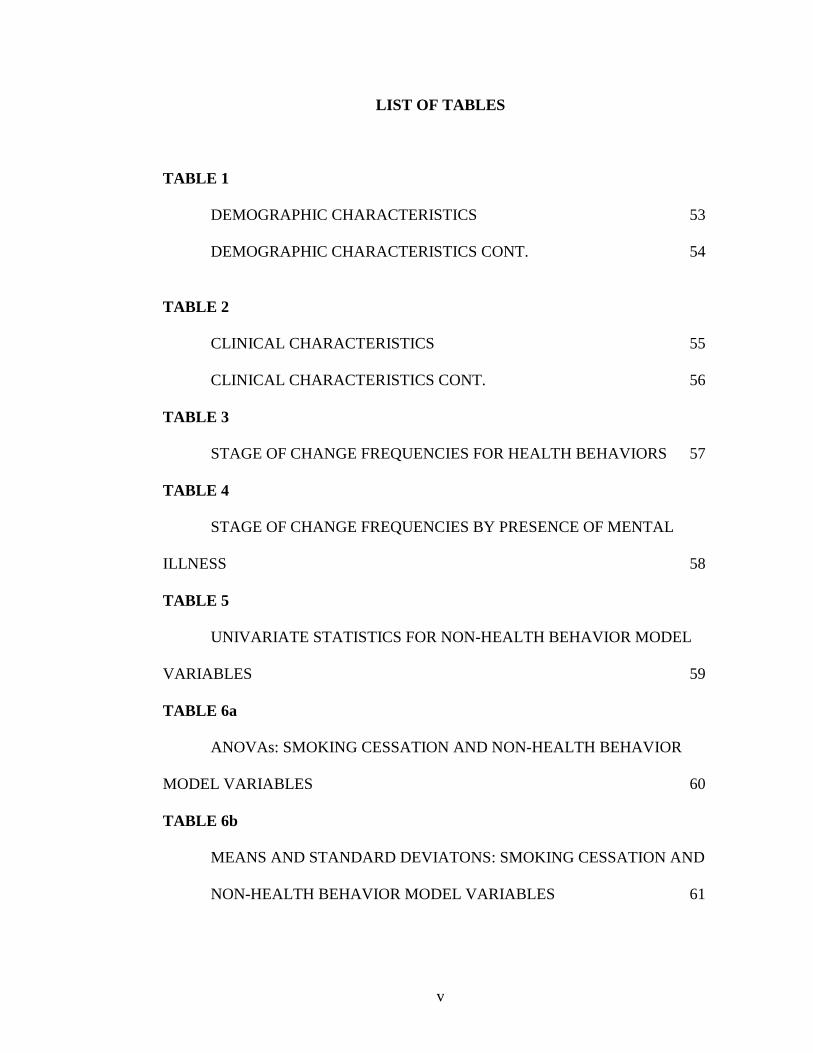
LIST OF TABLES
TABLE 1
DEMOGRAPHIC CHARACTERISTICS 53
DEMOGRAPHIC CHARACTERISTICS CONT. 54
TABLE 2
CLINICAL CHARACTERISTICS 55
CLINICAL CHARACTERISTICS CONT. 56
TABLE 3
STAGE OF CHANGE FREQUENCIES FOR HEALTH BEHAVIORS 57
TABLE 4
STAGE OF CHANGE FREQUENCIES BY PRESENCE OF MENTAL
ILLNESS 58
TABLE 5
UNIVARIATE STATISTICS FOR NON-HEALTH BEHAVIOR MODEL
VARIABLES 59
TABLE 6a
ANOVAs: SMOKING CESSATION AND NON-HEALTH BEHAVIOR
MODEL VARIABLES 60
TABLE 6b
MEANS AND STANDARD DEVIATONS: SMOKING CESSATION AND
NON-HEALTH BEHAVIOR MODEL VARIABLES 61

vi
TABLE 7a
ANOVAs: EXERCISE AND NON-HEALTH BEHAVIOR MODEL
VARIABLES 62
TABLE 7b
MEANS AND STANDARD DEVIATONS: EXERCISE AND NON-
HEALTH BEHAVIOR MODEL VARIABLES 63
TABLE 8a
ANOVAs: HEALTHY EATING AND NON-HEALTH BEHAVIOR MODEL
VARIABLES 64
TABLE 8b
MEANS AND STANDARD DEVIATIONS: HEALTHY EATING AND
NON-HEALTH BEHAVIOR MODEL VARIABLES 65
TABLE 9
CORRELATIONS: NON-HEALTH BEHAVIOR MODEL VARIABLES 66
TABLE 10
CORRELATIONS: HEALTH BEHAVIORS 67
TABLE 11
DEMOGRAPHIC CHARACTERISTICS BY PRESENCE OF MENTAL
ILLNESS 68
TABLE 12
PHYSICAL HEALTH CHARACTERISTICS BY PRESENCE OF MENTAL
ILLNESS 69
TABLE 13
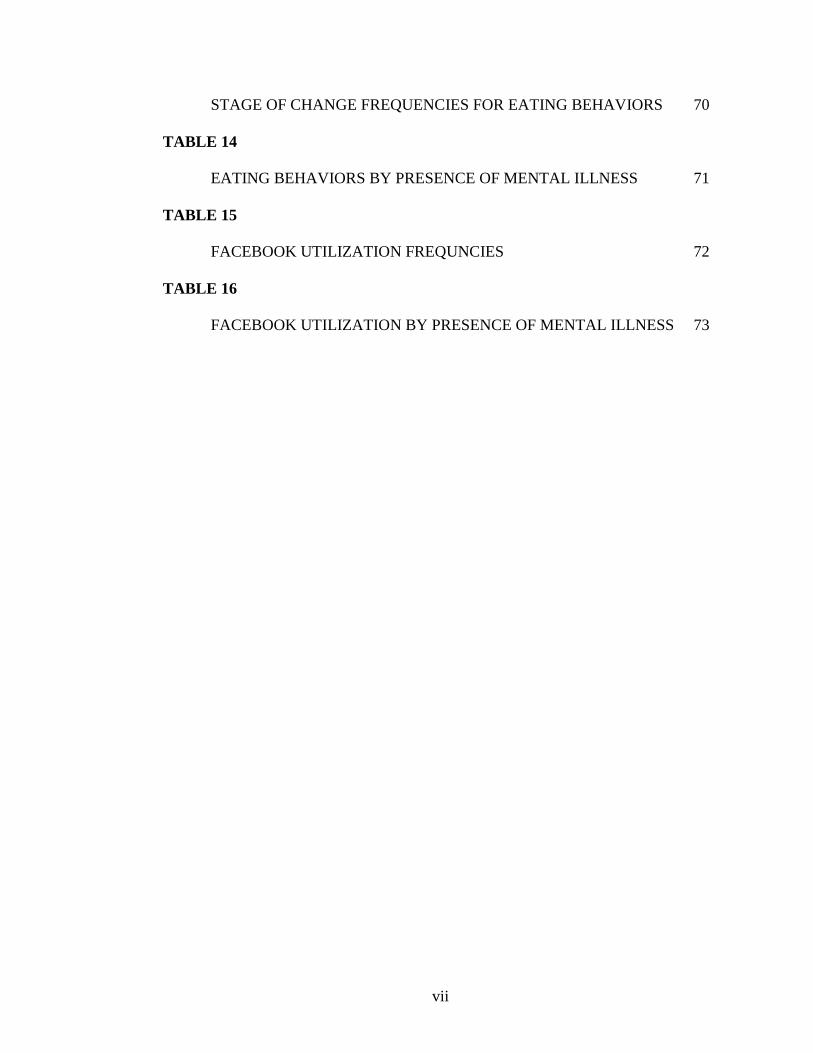
vii
STAGE OF CHANGE FREQUENCIES FOR EATING BEHAVIORS 70
TABLE 14
EATING BEHAVIORS BY PRESENCE OF MENTAL ILLNESS 71
TABLE 15
FACEBOOK UTILIZATION FREQUNCIES 72
TABLE 16
FACEBOOK UTILIZATION BY PRESENCE OF MENTAL ILLNESS 73

viii
LIST OF FIGURES
FIGURE 1
PROPOSED MEDIATIONAL MODEL 74
FIGURE 2
FULL MODEL 75
FIGURE 3
DIRECT MODEL 77
1
CHAPTER 1
DEFINITION AND SIGNIFICANCE OF THE PROBLEM
The positive impact of modifiable health behaviors such as smoking cessation,
exercise and healthy eating on physical health has been well-established. When these
key behaviors are enacted or present, the risk for chronic diseases, those that account
for the majority of morbidity and mortality of the adult U.S. population, is
significantly reduced or prevented (e.g. Centers for Disease Control and Prevention,
2013; Fryar, & Chen, 2012; US Department of Health and Human Service, 2014).
Similarly, social support and self-efficacy have also been linked to better
overall physical health and the reduction in the prevalence of diseases associated with
health behaviors. In a similar vein, a review article (Walsh, 2011) details the
significant, yet, underestimated relationship between modifiable health behaviors,
termed “lifestyle factors,” and mental health. Yet, the specific direction of
relationships between the latter health behaviors, social support and self-efficacy and
their impact on mental health functioning is less understood.
Given this limited understanding, the present study aimed to investigate the
relative role of three key health behaviors (smoking cessation, exercise and healthy
eating), perceived social support, general self-efficacy and physical health functioning
have in relation to mental health functioning in a cross-sectional population-based
sample of U.S. adults. Furthermore, as health behaviors are pro-social, cost-effective,
free of stigma and side-effects, and known to improve overall well-being, study
findings have the potential to reinforce the burgeoning understanding of the

2
importance of health behavior change for mental health within the new approach to
integrated health care systems.
In addition, this integrative study is timely in light of primary and behavioral
health care integration under the Affordable Healthcare Act (2010), the goals of the
American Psychological Association’s Blueprint for Change: Achieving Integrated
Health Care for an Aging Population (2008), and the National Institutes of Health’s
call for studies (2013; RFA-MH-14-060) looking at ways to improve the health and
well-being of those with severe mental illness. As such, there is a clear systemic shift
towards the further exploration of the role of health behaviors in primary and
secondary interventions and the management of mental illness.

3
CHAPTER 2
REVIEW OF LITERATURE
Prevalence of Mental Illness.
It is estimated that approximately 25% of the adult U.S. population currently
suffers from a diagnosable mental illness (MI) and that approximately 50% of the
population will have a diagnosable MI in their lifetime (Kessler, Chiu, Demler, &
Walters, 2005). Furthermore, approximately 45% of those with any MI meet criteria
for two or more MI’s, with severity correlated with comorbidity (Kessler et al., 2005).
MI’s are the leading causes of disability worldwide (WHO, 2004) and cost the U.S. an
estimated $300 billion annually (Mark Levit, Buck, Coffey, Vandivort-Warren, 2007).
The rate of those who are affected by mental illness that qualify for Supplemental
Security Income (SSI) or Social Security Disability Insurance (SSDI) increased
approximately 2.5 times during 1987-2007—from 1 in 184 Americans to 1 in 76
(Angell, 2011). Collectively, MI’s pose national and worldwide public health concern.
Physical Health and Mental Health.
Individuals with a MI are more likely to lead an unhealthy life compared to the
general population (Parks, Svendsen, & Singer, Foti et al., 2006) and have increased
rates of comorbid chronic physical illness such as cardiovascular disease, obesity,
diabetes and cancer (Walsh, 2011; Harris & Barraclough, 1998).
Wells and colleagues (1988) in the Epidemiologic Catchment Area Study
found that people suffering from one of eight chronic medical disorders (e.g. cancer,

4
cardiovascular disease) had a 42% increase in the risk of ever having a psychiatric
disorder compared with people without a medical disorder. In the 2003 National
Comorbidity Survey Replication study sponsored by the National Institutes of Health,
more than 68% of adults with a mental disorder had at least one medical condition,
and 29% of those with a medical disorder had a comorbid mental health condition
(Alegria, Jackson, Kessler, & Takeuchi, 2003).
Comorbidity is also indicated by the fact that cardiovascular disease is one of
the leading causes of mortality in people with schizophrenia (Casey & Hansen, 2003).
Similarly, individuals with depression and anxiety are more likely to develop
cardiovascular disease (Suls & Bunde, 2005). Depression has also been shown to
increase the risk of mortality in people with diabetes by 30% (World Federation for
Mental Health (WFMH), 2010). Conversely, individuals with a physical illness are at
increased risk for clinically significant mental illnesses (De Hert, Correll, Bobes,
Cetkovich-Bakmas, Cohen, Asai, et al., 2011). For instance, individuals with current
or chronic depression are 60% more likely to be obese than those with no history of
depression (WFMH, 2010). In sum, the staggering comorbidity rates between mental
and physical illness range from mild to severe.
Smoking Cessation and Mental Health.
There is evidence to suggest that being a non-smoker is positively linked to
better mental health. Close to 40% of adults with a MI are cigarette smokers compared
with only 21% of adults who do not have a MI (CDC, 2013). In other words, those
with a MI are about 70% more likely to smoke compared to adults with no MI (CDC,
2013). In a meta-analysis (Taylor, McNeill, Girling, Farley, Lindson-Hawley et al.,
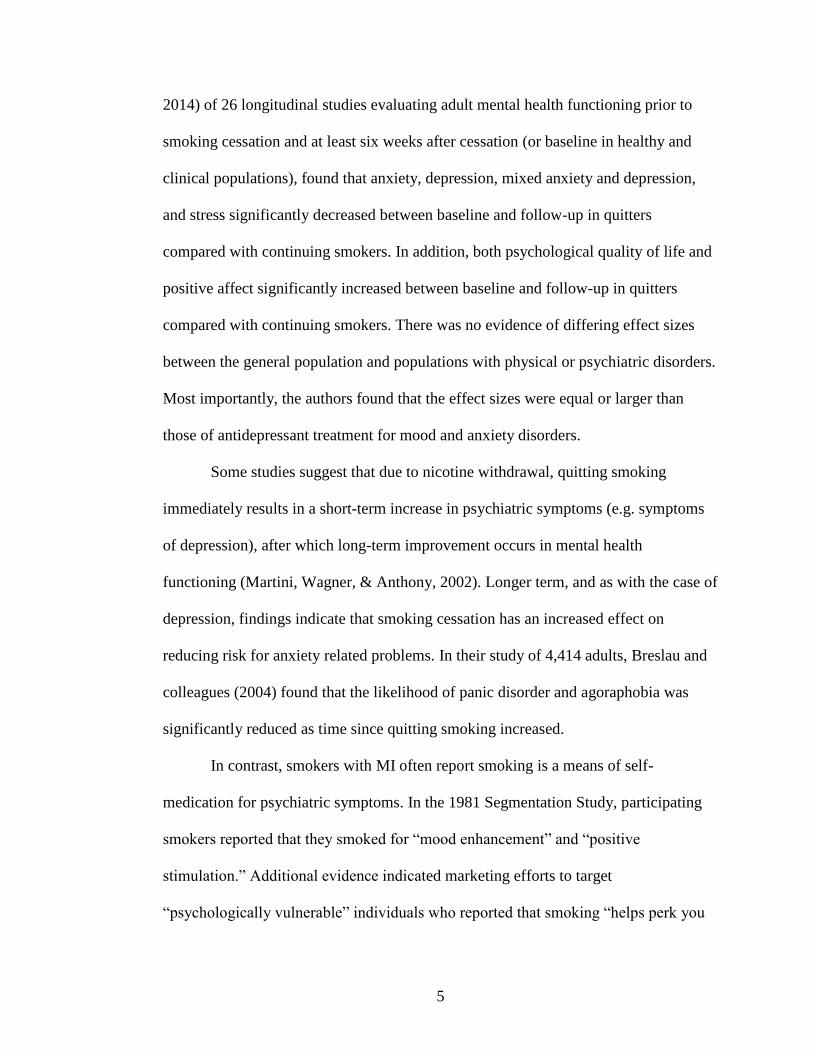
5
2014) of 26 longitudinal studies evaluating adult mental health functioning prior to
smoking cessation and at least six weeks after cessation (or baseline in healthy and
clinical populations), found that anxiety, depression, mixed anxiety and depression,
and stress significantly decreased between baseline and follow-up in quitters
compared with continuing smokers. In addition, both psychological quality of life and
positive affect significantly increased between baseline and follow-up in quitters
compared with continuing smokers. There was no evidence of differing effect sizes
between the general population and populations with physical or psychiatric disorders.
Most importantly, the authors found that the effect sizes were equal or larger than
those of antidepressant treatment for mood and anxiety disorders.
Some studies suggest that due to nicotine withdrawal, quitting smoking
immediately results in a short-term increase in psychiatric symptoms (e.g. symptoms
of depression), after which long-term improvement occurs in mental health
functioning (Martini, Wagner, & Anthony, 2002). Longer term, and as with the case of
depression, findings indicate that smoking cessation has an increased effect on
reducing risk for anxiety related problems. In their study of 4,414 adults, Breslau and
colleagues (2004) found that the likelihood of panic disorder and agoraphobia was
significantly reduced as time since quitting smoking increased.
In contrast, smokers with MI often report smoking is a means of self-
medication for psychiatric symptoms. In the 1981 Segmentation Study, participating
smokers reported that they smoked for “mood enhancement” and “positive
stimulation.” Additional evidence indicated marketing efforts to target
“psychologically vulnerable” individuals who reported that smoking “helps perk you

6
up” and “helps you think out problems” (Schellinck & Fenwick, 1981). The authors
also identified the act of smoking as helping people “gain self-control,” “calm-down,”
and “cope with stress.” One interpretation of the latter is that the positive appraisal of
smoking can potentially enhance the way one feels and improve mood for a short-
term. However, to date, long term mood enhancement has not been established.
Exercise and Mental Health.
The high incidence of obesity and other morbid conditions is strongly related
to physical inactivity among those with a MI. Exercise has been found to reduce risk
of depression, anxiety, eating, addictive, and body dysmorphic disorders, in addition
to, reducing the severity of several symptoms of schizophrenia (Hamer & Chida,
2009; Colcombe & Kramer, 2003; Daley, 2002; Deslandes, Moraes, Ferreira, Veiga,
Sileria, Mata et al., 2009; Stathopoulous, Powers, Berry, Smits, & Otto, 2006),
improve mental health conditions, particularly anxiety and depression, and enhance
general well-being (Schmitz, Kruse, & Kugher, 2004).
Walsh’s (2011) review indicated that the most studied disorder in relation to
exercise is mild to moderate depression. Overall, studies suggest that aerobic and non-
aerobic exercise is an effective concomitant treatment to pharmacotherapy and
psychotherapy as a preventive and/or therapeutic measure (Sidhu, Vandora, & Balon,
2009; Dowd, Vickers, & Krahn, 2004). Potential psychological mediating factors that
contribute to these antidepressant effects have been found to include enhanced self-
efficacy and self-esteem, and the interruption of negative thoughts (Dowd et al.,
2004).
7
The DOSE study (Dunn, Trivedi, Kampert, Clark, Chambliss, 2002; Dunn,
Chambliss, 2005) found that exercising 30 minutes five or more days a week was the
minimum needed to reduce depression. A review (Lawlor & Hopker, 2001) of 14
randomized controlled trials looking at the effectiveness of exercise in the
management of depression found antidepressant effects comparable to that of
cognitive therapy. A study of 16,483 university undergraduates found that exercise
correlated with lower levels of depression (Steptoe, Wardle, Filler, Holte, Justo,
Sanderman, 1997).
Similarly, aerobic exercise has been found to have anxiolytic, in other words,
calming effects (Salmon, 2000). In a general population sample of 55,000, a self-
reported correlation between recreational exercise and better mental health was
demonstrated, including fewer symptoms of depression and anxiety (Stephens, 1988).
Aerobic activity was shown to specifically reduce depression in two well-controlled
studies of 10–11 weeks of walking and running in two populations selected for
exposure to stress or high anxiety (Steptoe et al., 1989; Roth & Holmes., 1987, as
cited in Salmon, 2001). Aerobic exercise compared to strength and flexibility training
reduced anxious mood in subjects with high anxiety up to three months (Steptoe et al.,
1989).
Healthy Eating and Mental Health.
Nutrients. There is evidence of the importance of nutrition for mental health,
and the most prominent review of over 160 studies suggests that mental health is
linked to diet (Go´mez-Pinilla, 2008). Specifically, individuals who consume a diet
akin to the “Mediterranean diet” consisting of fruits, vegetables, nuts, whole grains,

8
fish, and unsaturated fat are approximately 30% less likely to develop depression than
those who typically consume a diet that consists of processed food and saturated fats
(Sánchez-Villegas, Delgado-Rodríguez, Alonso, Schlatter et al., 2009). Such a diet has
been shown to improve cognitive functions and academic performance in children and
alleviate affective and schizophrenia spectrum illnesses in adults (Walsh, 2011).
Some researchers strongly encourage the use of food supplements such as
particular vitamins, folic acid, and fish oil for improving mental health (Sarris,
Schoendorfer, & Kavanagh, 2009). While there are a number of studies advocating for
the link between specific nutrients and diet and mental health function, findings
remain limited and mixed with regard to nutritional supplementation as a specific
treatment for depression (Jacka, Mykletun, & Berk, 2012). Aside from the utility of
omega 3fatty acids in severe depression (Appleton, Rogers, & Ness, 2010) and folate
as a concomitant treatment (Taylor, Carney, Goodwin, & Geddes, 2004), there is little
robust evidence for such effectiveness (Jorm, Christensen, Griffiths, Rodgers, 2002).
Given the complex combinations and interactions among nutrients in an
individual’s daily diet, the analysis of the impact of a single food or nutrient on health
outcomes has its limitations. Therefore, dietary patterns have gained considerable
attention. Indeed, people do not consume nutrients or single foods but combinations of
foods (Munoz, Fito, Marrugat, Covas et al., 2009). Furthermore, dietary components
may interact, making the search for associations between single dietary factors and
health outcome more difficult (Munoz et al., 2009). Diet is a multifaceted
phenomenon and, hence, attempting to link specific single nutrients or food groups to
disease prevalence and symptoms will continue to pose challenges (Quirk, Williams,

9
O’Neill, Pasco et al., 2013). Furthermore, dietary patterns may confound specific diet
and illness relationships (Quirk et al., 2013).
One systematic review (Quirk et al., 2013) evaluated the association between
overall diet quality and depression in adults across 25 studies from nine countries.
Findings indicated limited evidence to support an association between traditional diets
(i.e., Mediterranean - further discussed in a separate section below - or Norwegian
diets) and depression. There was also mixed evidence for associations between a
traditional Japanese diet and depression, a “healthy” diet and depression, a Western
diet and depression, and individuals with depression and the likelihood of eating a less
healthy diet (Quirk et al., 2013). A significant amount of variability was observed in
relation to the measurement of diet quality and patterns, definitions of a “healthy diet,”
depression assessment and study samples (Quirk et al., 2013). The majority of studies
included in the latter review were cross-sectional precluding any interpretations of
directionality of associations. The authors commented that any potential association
between diet quality and patterns and mental illness are likely influenced by a large
number of confounding variables including demographic (e.g. socioeconomic),
behavioral, genetic, environmental and sociocultural characteristics (Quirk et al.,
2013). The analyses undertaken in each of the studies included in the review typically
controlled for age and gender (Quirk et al., 2013). The association between diet and
mental health is likely bi-directional, with depressed individuals to be more likely to
eat unhealthy (Kilian, Becker, Kruger, Schmid et al., 2006).
The Mediterranean Diet (MD) and Social Support.

10
MD is characterized by high consumption of green foods, modest consumption
of alcohol and low consumption of meat (Munoz, Fito, Marrugat, Covas et al., 2009).
The reported health effects of MD have substantial biochemical underpinnings (Serra-
Majem, Roman, & Estruch, 2006). In addition, this particular diet is embedded in a
social context that has suggested increasing personal well-being (Munoz et al., 2009).
One assumption is that that consuming a Mediterranean diet may reflect the living of
the “Mediterranean lifestyle” and practicing the corresponding behaviors, including
eating at home, spending time cooking, sharing lunchtime with other people and going
to the market to buy foods (Munoz et al., 2009). Eating within the context of social
gatherings may improve self-perceived quality of life (Munoz et al., 2009). Social and
family support can promote health by providing persons with positive experiences,
pro-social behaviors and roles and better ways of coping with stressors (Seeman,
2000).
Perceived social support from family members and significant others has
received increasing attention as a factor contributing to health outcomes
(Korkiakangas, Taanila, & Keinänen-Kiukaanniemi, 2011). A report from the Centers
for Disease Control and Prevention (2008) suggested an association between
perceived social support and health-related quality in older individuals. In addition,
perceived social support has been the target of lifestyle modification interventions for
persons with a variety of medical conditions, including obesity, cardiovascular
disease, and type 2 diabetes (Kumanyika & Economos, 2011; Van Dyck et al., 2011).
Perceived health has been shown to be a predictor of mortality at long term
(Wannamethee & Shaper, 1991). There is growing evidence supporting the

11
effectiveness of social support approaches enhancing diet and increasing physical
activity compared to interventions that focus solely on an individual (Gorin, Phelan,
Tate, Sherwood, Jeffery, & Wing, 2005). A positive environment may contribute to
having a better self-perceived health-related quality of life related to diet (Munoz et
al., 2009).
Social support has been shown to be an important predictor of having fruit at
the home (Baranowski, Watson, Missaghian, Broadfoot et al., 2008). Support from
friends, family, and co-workers helped participants exercise more and eat less fat in an
organizational health promotion program (Zimmerman & Conor, 1989). In a meta-
analytic review across 148 prospective studies (308,849 participants followed for an
average 7.5 years), the random effects weighted average effect size was OR = 1.50
(95%CI) of survival for participants with stronger social relationships (Holt-Lunstad,
Smith, & Layton, 2010) suggesting a comparable effect to prominent risk factors of
morbidity and mortality such as physical inactivity and obesity (Holt-Lunstad et al.,
2010).
In this realm, one cross-sectional study (N=158) specifically looked at
overweight participants with severe mental illness and characteristics of social support
around healthy eating and exercise (Aschbrenner, Mueser, Bartels, & Pratt, 2013).
Regular social contact was defined as at least twice monthly face-to-face contact with
either family members or friends (Aschbrenner et al., 2013). Findings indicated a
correlation between increased frequency of family contact and unhealthy family eating
environments (e.g. buying or eating unhealthy foods in front of the participants), as
well as increased friend contact and unhealthy eating environments (Aschbrenner et
12
al., 2013). Females compared to males were more likely to be exposed to unhealthy
environments (Aschbrenner et al., 2013). Yet, females compared to males were more
likely to receive encouragement for healthy eating behaviors from friends (t(93) = -
2.44, p < .05 (Aschbrenner et al., 2013). Of note, participants who reported greater
readiness to change their typical portion size were significantly more likely to receive
encouragement from friends for healthy eating behaviors (r(92) = .291, p < .01)
(Aschbrenner et al., 2013). And, higher level of symptoms was a significant predictor
of more unhealthy family eating environments (r(77) = .35, p < .001) (Aschbrenner et
al., 2013). This latter finding adds to the understanding of the complex bi-directional
relationship between diet and mental health (Aschbrenner et al., 2013). One plausible
assumption is that overweight and obese individuals attempting to make a lifestyle
change may feel discouraged by unhealthy eating behaviors of family members and,
thus, experience anxiety, frustration, and a sense of hopelessness in their efforts to
change their own behaviors (Aschbrenner et al., 2013). Another assumption is that
those with depression are potentially more likely to perceive the unhealthy behaviors
of others as intentionally discouraging which could create a barrier to healthy eating
(Aschbrenner et al., 2013).
In a 10-year longitudinal population-based study conducted in the U.S., data
were obtained from 2,379 girls assessed annually from ages 9-19 (Franko, Thompson,
Affenito, Barton, & Striegel-Moore, 2008). The mediational analysis sought to
evaluate whether the frequency of family meals in childhood was related to health
outcomes by examining the mediating links of family cohesion and coping skills, after
adjusting for baseline demographics and previous levels of the outcome variables

13
(Franko et al., 2008). More frequent family meals in the first 3 years predicted greater
family cohesion and coping in years 7 and 8 in to the study (Franko et al., 2008).
Family cohesion mediated family meals and risk of smoking in Year 10 (Franko et al.,
2008). Coping mediated family meals and stress in Year 10 (Franko et al., 2008). The
authors concluded that eating together as a family during childhood may have benefits
in adulthood (Franko et al., 2008).
Across most sub-areas of the healthy eating/diet research, it appears that eating
behavior is often used as the dependent variable, typically conceptualized as food
choice, selection, or preference or as food intake, and rarely as the independent
variable. A diverse list of factors have been shown to predict food choice including,
but not limited to, mood, parental influence, socioeconomic status, perceived stress,
self-efficacy, mental illness, and social relationships. Making healthy food choices can
make a person feel good about their choices, motivation, and dedication to eating
healthy. Such eating habits can help an individual move toward a desirable goal that is
likely consistent with his/her cultural values and may include preparing a meal for
one’s family, losing weight, increasing one’s energy level or increased awareness of
efforts aimed at improving one’s physical health. The perception of committing to a
behavior that is in line with what is considered as healthy, appropriate, or acceptable
in one’s own community, culture, or society also may have the ability to enhance self-
confidence, self-esteem, and overall mental health.
Since this is an emerging area of research, to date, most studies evaluating the
direct relationship between diet and mental health have been via biochemical based
studies, or studies looking at social support and self-efficacy only in relation to healthy

14
eating/diet. Importantly, to our knowledge, the components of mental health have yet
to be included as an outcome measure.
Social Support and Mental Health.
A concept that has been found to be linked to health just as strongly as health
risk behaviors such as smoking and sedentary life is perceived social support
(Cacioppo, Hawkley, Norman, & Berntson, 2011; Fratiglioni et al., 2004). Social
support has been extensively studied, and the subject of medical and behavioral
research for approximately 40 years, with the general conclusion that social support
has therapeutic value in mental and physical health (Hogan, Linden, & Najarian, 2002;
Uchino, 2009; Wallston et al., 1983) and is a key buffer to the effects of psychosocial
stressors. Specifically, social support may influence health outcomes by encouraging
individual behavior modification (Cohen, 1988) or adherence to medical
recommendations (Wallston et al., 1983).
Social support has been specifically linked to depression and anxiety, recovery
from chronic illnesses, greater life satisfaction, enhanced ability to cope with life
stressors, and with an overall ability to perform instrumental activities of daily living
(Cohen & Wils, 1985; Cohen, Underwood, & Gottlieb, 2000).
There are several pathways by which social relationships may affect health,
one of which may be in the provision of social support (Golden, Conray, Bruce,
Denihan, Greene, Kirby et al., 2009). Deficits in social support have been associated
with a variety of adverse health outcomes, ranging from physical health to depression
and self-harm (Dennis, Wakefield, Molloy, Andrews, & Friedman, 2005). Perceptions
of support may reduce stress by altering one’s evaluation of the stressors, by changing

15
one’s coping patterns, by affecting perceptions of one’s self-efficacy, or by altering
problem-solving behaviors (Rogers, Anthony, Lyass, 2004). Indicators of perceived
social support have been found to have the strongest links with indicators of reduced
stress and psychological distress, as well as indicators of improved well-being (e.g.,
Gjesfjeld, Greeno, Kim, & Anderson, 2010). Although a positive relationship between
social support and health have been demonstrated in the general population, less is
known about the effect of perceived social support on mental health functioning.
Self-Efficacy and Mental Health.
Self-efficacy has been defined as the belief that one is capable of performing in
a certain manner to attain a certain set of goals (Miller & Dollard, 1941). Health
behavior and functioning is also influenced by the belief in one’s own self-efficacy
(Bandura, 1977). Perceived self-efficacy is related to subsequent behavior and,
consequently, is relevant for clinical practice and behavior change (Schwarzer &
Jerusalem, 1995). This core belief affects each of the basic stages of change, whether
people even consider changing their health behaviors and how well they maintain the
behavior changes they have achieved (Bandura, 2004). Self-efficacy has a valuable
role in different aspects of life and health (Maddux , 2002; Dweck & Leggett, 1988)
and a main role in individuals' thinking modes, their decision-making, the quality of
their encounter with problems, and their depression and anxiety status (Kim, 2003).
Researchers have shown that general self-efficacy is negatively related to depression
and anxiety, as two main components of mental health, and positive self-efficacy
beliefs have an effective role in the treatment of mental diseases.

16
CHAPTER 3
PURPOSE OF THE PRESENT STUDY
From infections to cancer, the most effective way of contributing to physical
health has been through prevention efforts rather than treatment (Jacka, Mykletun, &
Berk, 2012). In contrast, although mental health issues are regarded high on the public
health agenda in the U.S. and worldwide, the prevention of mental health issues has
received less consideration compared to direct treatment (Jacka et al., 2012). As such,
there is a need for emphasis on the development of preventive approaches to mental
health issues at a population level (Cuijpers, Beekman, & Reynolds, 2012).
An important challenge of developing prevention approaches and models to
mental health is the vast number of interacting factors contributing (Jacka et al., 2012).
While other potentially modifiable factors such as socioeconomic variables and
childhood maltreatment contribute to mental health issues, prevention efforts should
capitalize on variables of utmost modifiability (Jacka et al., 2012). One such universal
modifiable variable is “lifestyle,” (Jacka et al., 2012; Walsh, 2010) which
encompasses health behaviors such as smoking cessation, exercise, and healthy eating.
As discussed, in the literature review, these health behaviors are shown to not only be
linked to chronic medical disease but also mental health issues.
In summary, growing evidence indicates that exercise has been shown to be
effective in treatment studies (Stathopoulous, Powers, Berry, Smits, & Otto, 2006).
There is some evidence for smoking also independently increasing the risk for

17
common mental health issues (e.g. Breslau, Novak, & Kessler, 2004; Mykletun,
Overland, Aaro, Liabo, & Stweart, 2008; Pasco, Williams, Jacka, Ng, Henry,
Nicholson, et al., 2008). Diet/healthy eating is the most recent area of interest in the
lifestyle-mental health research field (Jacka et al., 2012). Diet-mental health related
research has focused on nutritional supplementation to treat depression resulting in
inconsistent and limited findings (Jacka et al., 2012).
Taking in to consideration these findings, there appears to be a dearth of
research in the areas of delineating the specific pathways between health behaviors
and mental health. As such, it is important to start moving away from looking at
simple associations between such variables to utilizing more sophisticated multivariate
tools and modeling.
Specifically, structural modeling and mediational analysis can help determine
the relative role of each variable in a proposed relationship between variables
(Lockwood, DeFrancesco, Elliot, Beresford, & Toobert, 2010). For example, in a
review of 40 studies (Lockwood, et al., 2010), the authors presented all the
observational studies and randomized intervention trials published in nutritional
research utilizing mediational analysis. Of those, none of the studies looked at healthy
eating/diet or proxy measures of healthy eating/diet as the independent variable or any
mental health variable as the dependent variable.
Similarly, a different study on the applicability of a mediational model to study
how physical activity influences mental health (Cerin, 2010) pointed to the shortage of
such analyses in the exercise arena as well. Moreover, the author stated that even
though there have been several biophysical and psychosocial factors identified as

18
potential mechanisms responsible for the association between physical activity and
favorable mental health outcomes, by and large it is still fundamentally unknown how
physical activity predicts positive mental health outcomes (Cerin, 2010). This is a
startling fact given that physical activity is one of the most studied behaviors in health
research, and further reflects the limitations within the diet and smoking cessation
research fields.
In sum, although, the reviewed modifiable variables (i.e. health behaviors,
perceived social support, self-efficacy, and physical health) have been looked at
separately in relation to mental health, to our knowledge, they have not been looked at
simultaneously in relation to mental health within a model testing approach. Based on
this gap in the literature, the present cross-sectional study utilizes path analysis to
examine the role of smoking cessation, exercise, healthy eating, perceived social
support, self-efficacy, and physical health in relation to adult mental health
functioning among a diverse, population-based adult sample.
19
CHAPTER 4
METHODOLOGY
Procedure.
The Institutional Review Board at the University of Rhode Island approved the study
in May of 2014 prior to data collection.
To recruit participants representative of the general population, Survey
Monkey (SM), an online company, recruited the original pool of participants (N=400)
to complete the survey used for this study in a time-efficient manner. An additional 27
participants were also recruited by SM, at no additional cost, for oversampling
purposes. SM has a large database of subjects willing to participate in survey research
anonymously for pay. The company provided a cost of $7.00 per individual, aged 18-
65 (with equal gender sampling), who completed the entire survey. Funding source for
the study was provided by student researcher loans. On-line data collection took place
for approximately 24 hours in July 2014.
The online procedure provided anonymity as well as an online informed
consent. Contact information for the researchers was also provided for any questions
or concerns participants may have about the study. Participants were allowed to
withdraw from participation at any time. All procedures were IRB approved. The
study necessitated few additional resources. IBM SPSS Statistics, Version 22, and
EQS, Version 6.0 were utilized for analyses.
Measures.
20
Demographic Characteristics. Age, gender, race, sexual orientation, marital
status, education level, and health insurance status were all assessed via single item
measures (see Appendix).
Clinical Characteristics. Past and current diagnosis of mental illness, and
current psychotropic medication type and use were assessed. Chronic physical illness
was evaluated by asking participants if they currently suffer from the following:
Cancer, cerebrovascular disease, cardiovascular disease, and type 1 or 2 diabetes. In
addition, presence of obesity was assessed by self-reported height and weight, and
corresponding Body Mass Index (BMI). Based on Centers of Disease Control and
Prevention criteria, obesity is defined as a BMI of 30 or higher. (see Appendix)
Stage of Change.
The Transtheoretical Model of Behavior Change (TTM) is a comprehensive
model which lays out a blueprint for intentional behavior change (Prochaska &
DiClemente, 1983; Prochaska, DiClemente, & Norcross, 1992; Prochaska & Velicer,
1997). Stage of Change, one of the core constructs of the TTM, provides a useful
approach to conceptualizing readiness to change any particular healthy behavior
(Prochaska & Velicer, 1997). In the Precontemplation stage (PC), individuals are
intending to take action to change a given behavior in the next six months. Their
reluctance may be due to unawareness, misinformation, or resistance to change. In the
next stage, Contemplation (C), individuals tend to be ambivalent about change but at
the same time are intending to take action in their behavior in the next six months. In
Preparation (PR), individuals have a clear intention of changing their behavior in the
next 30 days and may have even started taking steps towards behavior change. In the

21
action stage (A), individuals are in the process of changing their behavior for at least
24 hours but have done so for less than six months. In the Maintenance (M) stage,
individuals work on maintaining the acquired healthy behavior which they have
managed for at least 6 months whilst also focusing on curtailing setbacks. In the
Termination (T) stage (for smoking cessation), individuals have not smoked for at
least 5 years.
Stages of Change for Smoking Cessation (SMK, Prochaska, Velicer,
Fava, & Rossi, 2001).
Participants were categorized in one of the seven Stages of Change
(Precontemplation, Contemplation, Preparation, Action, Maintenance, Termination,
and Never Smoker) of the Transtheoretical Model of Behavior Change that was used
to assess an individual’s readiness to quit smoking (see Appendix). Smoking cessation
was measured by assigning a numeric value to each of the stages of change (i.e.
1=Precontemplation, 2=Contemplation, 3=Preparation, 4=Action, and 5=Maintenance,
6=Termination, 7=Never Smoker) (see Appendix).
Stages of Change for Exercise (EX, CITE, Johnson, Paiva, Cummins,
Robbins, Johnson, Dyment, Wright et al. 2008 ). Participants were
categorized in one of the five stages of change (Precontemplation, Contemplation,
Preparation, Action, and Maintenance) of the Transtheoretical Model of Behavior
Change that was used to assess an individual’s readiness to initiate or adopt regular
exercise based on guidelines established by the Centers for Disease Control and
Prevention (see Appendix). Regular exercise was measured by assigning a numeric

22
value to each of the stages of change (i.e. 1=Precontemplation, 2=Contemplation,
3=Preparation, 4=Action, and 5=Maintenance) (see Appendix).
Stage of Change for Healthy Eating assessed by Calorie and Fat
Intake (CALFAT, Johnson et al., 2008). Participants were categorized in one of the
five stages of change of the Transtheoretical Model of Behavior Change that was used
to assess an individual’s readiness to eat the number of calories that allows an
individual to reach and maintain a healthy weight and eating a diet low in saturated
and trans fats. Healthy eating was measured by assigning a numeric value to each of
the stages of change (i.e. 1=Precontemplation, 2=Contemplation, 3=Preparation,
4=Action, and 5=Maintenance) (see Appendix).
The General Self-Efficacy Scale (GSE, Schwarzer & Jerusalem, 1995). This
is a 10-item one-dimensional assessment tool assessing general sense of perceived
self-efficacy with the aim in mind to predict coping with daily hassles, as well as
adaptation after experiencing all kinds of stressful life events. Participants rated
statements with response options ranging from 1 = Not at all True to 4 = Exactly True.
GSE was calculated by averaging the items. Higher scores indicated a higher level of
general self-efficacy. In samples from 23 nations, Cronbach’s alphas ranged from .76
to .90, with the majority in the high .80s. The Cronbach’s alpha for this sample was
.92, indicating a high level of internal consistency (see Appendix).
The Multidimensional Scale of Perceived Social Support (PSS, Zimet,
Dahlem, Zimet, & Farley, 1988). This measure is widely-used across a range of
cultures, clinical populations and age with a fourth grade reading-level. It consists of
12 items and three subscales: Support from Family (α=.87), Support from Friends

23
(α=.85) and Support from Significant Others (α=.91). Cronbach’s alpha for the total
scale was .88. High levels of perceived social support were associated with low levels
of depression and anxiety symptomatology (Zimet et al., 1988). The Cronbach’s alpha
for this sample was .95, indicating a high level of internal consistency. For the purpose
of this study, only the total score of the measure was utilized in the analyses (see
Appendix).
The Medical Outcome Study Short Form (McHorney, Ware, & Raczek,
1993). The SF-36 is a self-report questionnaire that is a reliable and valid measure of
physical and mental health-related functioning. It measures health on eight multi-item
dimensions, covering functional status, wellbeing and overall evaluation of health
(Brazier et al., 1992). For each dimension, item scores are coded, summed, and
transformed on a scale from 0 (worst health) to 100 (best health). The SF-36 is a generic
measure, one that does not target a specific age group or disease, but instead, can be
used with diverse populations. It was designed for use in surveys of general and specific
populations, health policy evaluations, clinical practice and/or research.
The SF-36 has been widely used in clinical studies and has demonstrated
adequate psychometric integrity (McHorney, Ware, & Raczek, 1993; Ware &
Sherbourne, 1992). Factor analytic studies confirm that the eight scales assessing eight
different health concepts make up two distinct factors: mental health and physical
health, and that these factors account for 80-85% of the reliable variance in the eight
scales in the U.S general population (Ware, Kosinski & Keller, 1994). The Mental
Component Summary score (MCS) is made up of three scales: Mental Health (MH),
Role-Emotional (RE), and Social Functioning (SF) and Physical Component Summary

24
score (PCS) is made up of three scales: Physical Functioning (PF), Role-Physical (RP),
Bodily Pain (BP). The eight dimensions have a median reliability coefficient equal or
greater than .80, except for SF which had a median reliability across studies of .76. For
the PCS, relative validity coefficients range from .20 to .94 (median, .79) and from .93
to 1.45 (median, 1.02) for the MCS (Ware, Kosinski, Bayliss, McHorney, Rogers, &
Raczek, 1995). As a result, the summary measures demonstrate adequate empiric
validity (Ware et al., 1995). In addition, the SF-36 demonstrated high test-retest
reliability (correlation = .60-.81) and high levels of internal consistency (Cronbach's a =
.73 - .96). In the current study, the Cronbach alpha coefficient was .85, indicating a high
level of internal consistency. Validation studies support the SF-36’s convergent and
discriminant validity when compared to similar measures (e.g., Nottingham
questionnaire) (Braizer et al., 1992). For the current study, the MCS and PCS composite
scores served as indicators of mental and physical health functioning, respectively.
Scores on the composite scales range from 0 to 100 with lower scores indicating more
impaired functioning (see Appendix).
Additional Measures Utilized for Exploratory Purposes.
Stage of Change for Fruit and Vegetable Intake (FV, LaForge, Greene, &
Prochaska, 1994; Cummins, Johnson, Mauriello, Paiva, & Dyment, 2006). Participants
were categorized in one of the five stages of change (Precontemplation,
Contemplation, Preparation, Action, and Maintenance) of the Transtheoretical Model
of Behavior Change that assessed an individual’s readiness to eat at least 4.5 cups of
fruits and vegetables per day. Healthy fruit and vegetable intake was measured by
25
assigning a numeric value to each of the stages of change (i.e. 1=Precontemplation,
2=Contemplation, 3=Preparation, 4=Action, and 5=Maintenance) (see Appendix).
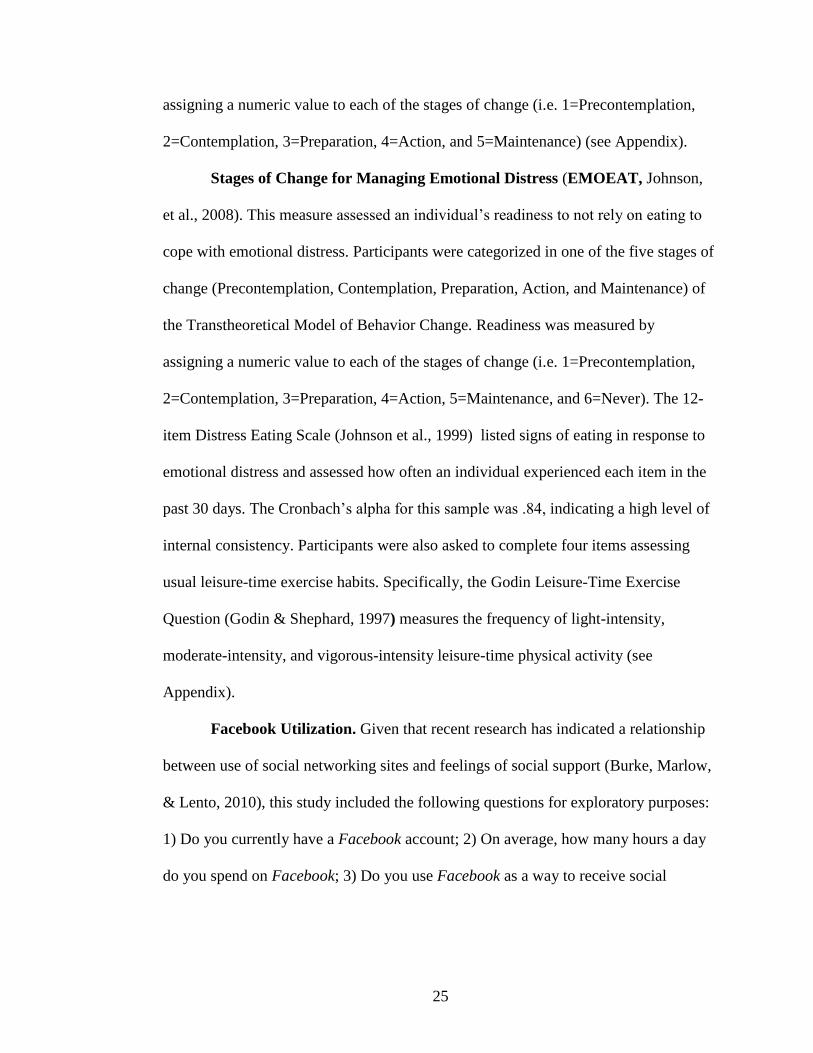
Stages of Change for Managing Emotional Distress (EMOEAT, Johnson,
et al., 2008). This measure assessed an individual’s readiness to not rely on eating to
cope with emotional distress. Participants were categorized in one of the five stages of
change (Precontemplation, Contemplation, Preparation, Action, and Maintenance) of
the Transtheoretical Model of Behavior Change. Readiness was measured by
assigning a numeric value to each of the stages of change (i.e. 1=Precontemplation,
2=Contemplation, 3=Preparation, 4=Action, 5=Maintenance, and 6=Never). The 12-
item Distress Eating Scale (Johnson et al., 1999) listed signs of eating in response to
emotional distress and assessed how often an individual experienced each item in the
past 30 days. The Cronbach’s alpha for this sample was .84, indicating a high level of
internal consistency. Participants were also asked to complete four items assessing
usual leisure-time exercise habits. Specifically, the Godin Leisure-Time Exercise
Question (Godin & Shephard, 1997) measures the frequency of light-intensity,
moderate-intensity, and vigorous-intensity leisure-time physical activity (see
Appendix).
Facebook Utilization. Given that recent research has indicated a relationship
between use of social networking sites and feelings of social support (Burke, Marlow,
& Lento, 2010), this study included the following questions for exploratory purposes:
1) Do you currently have a Facebook account; 2) On average, how many hours a day
do you spend on Facebook; 3) Do you use Facebook as a way to receive social

26
support?; and 4) In general, does your time on Facebook make you feel better, no
different, or worse (see Appendix).
All five Stage of Change measures (for smoking cessation, exercise, calorie
and fat intake, fruit and vegetable intake, and emotional eating) used for primary and
exploratory analyses were available at no cost through Pro-Change Behavior Systems,
Inc. The Multidimensional Scale of Perceived Social Support, and the General Self-
Efficacy measures were available online to the public at no cost. Permission to use the
Medical Outcome Study Short Form, SF-36 was granted by its publisher,
QualityMetric, Inc., at no cost.
Data Analysis.
For Hypotheses 1a-c and 2a, a series of univariate MANOVAs with
ANOVAs and follow-up Tukey post-hoc tests were conducted to assess the
relationships between the three health behaviors (SMK, EX, CALFAT) and the four
non-health behavior model variables including mental health functioning (MCS),
physical health functioning (PCS), general self-efficacy (GSE) and perceived social
support (PSS). For Hypotheses 2b, 3a-d, 4a-b, correlations were conducted to assess
the relationships between the four non-health behavior variables (MCS, PCS, GSE,
and PSS). For Hypothesis 5, three path analyses were conducted to determine the best
model fit to the data. Path analysis, a type of structural equation modeling, uses a
maximum likelihood estimation to determine if the proposed model will fit the data.
Finally, it is important to note that three of the model variables (SMK, EX CALFAT)
are categorical variables with five or more levels/groups. Bentler and Chou (1987)
indicate that when the number of categories are large (i.e. four or more categories) as

27
is in the present study, treating categorical variables as continuous variables is
appropriate as the chi-square statistic is less amenable to influence as the number of
categories increases (Green, Akey, Fleming, Hershberger, & Marquis, 1997). As such,
the aforementioned categorical variables (i.e SMK, EX, and CALFAT) will be treated
as continuous variables for the purposes of the path analyses.
Structural equation modeling must satisfy four conditions: (1) specification
(determining the causal paths between variables); (2) identification (determining
whether there was adequate information to estimate the model); (3) estimation (testing
the paths via structural equation modeling); and (4) model evaluation (see Kline,
2005).
Maximum likelihood (ML) estimation was used to estimate model parameters.
Models were compared to one another in terms of their empirical fit with the data,
using practical fit indices. Such indices consisted of the chi-square goodness-of-fit
index (GFI), the comparative fit index (CFI; Bentler, 1990), the root mean square error
of approximation (RMSEA; Steiger & Lind, 1998), R2 values for estimating effect
size, and standardized regression path coefficients for each model (Harlow, 2005).
More specifically, the CFI is a normed fit index that adjusts for degrees of freedom.
CFI greater than 0.90, and RMSEA of less than .10 are indicative of good fitting
models (Bentler & Wu, 1995). Insignificant chi-squares are ideal, however, due to the
large sample size, it is expected that the chi-squares may be significant for the main
analyses. If the macro fit indices for the model were deemed adequate, then the micro-
fit indices were examined. These included the number of significant paths, their

28
significance levels, and the strength of each relationship. For all analyses, a cut-off
value for significance was set at p= 0.05.

29
CHAPTER 5
RESULTS
Preliminary Findings.
Demographics Characteristics.
As expected, the sample had demographic characteristics (race and sexual
orientation) similar to that of the general U.S. population (U.S. Census Bureau, 2013).
The largest group of participants (28.3%) fell in the 45-54 age range. A little more
than half of the sample (54.1%) was married or in a domestic partnership/civil union.
The majority of participants had health insurance (87.8%) and at least some college or
equivalent education (i.e. vocational training) (76.5%). Participants participated from
all four regions of the U.S. (Northeast – 24.4%, Midwest – 24.1%, South – 32.6% and
West – 19.0%). See Table 1 for full demographic characteristics.
Clinical Characteristics.
Forty-three percent of participants indicated ever having (past or current) been
diagnosed with a mental illness. The most common diagnosed mental illness was
depression (15.4%) followed by an “other” illness (4.9%) and anxiety (4.4%). Of the
total sample, 37.5% indicated that, at some point in their life, they had been prescribed
medication for a mental health condition. Of those who were ever diagnosed, 57.4%
were prescribed an antidepressant, 16.4% antianxiety, 10.7% mood stabilizer/
anticonvulsant, 8.2% atypical antipsychotic, 6.6% stimulant, and 0.8% was prescribed
typical antipsychotic medication. Of the total sample, 16.7% indicated currently
30
having a chronic medical illness including cancer, cerebrovascular disease,
cardiovascular disease, and type I or II diabetes. A quarter of the total sample (25.5%)
indicated currently undergoing medical treatment for an illness. Sixty-one percent of
the total sample was overweight or obese. See Table 2 for full clinical characteristics.
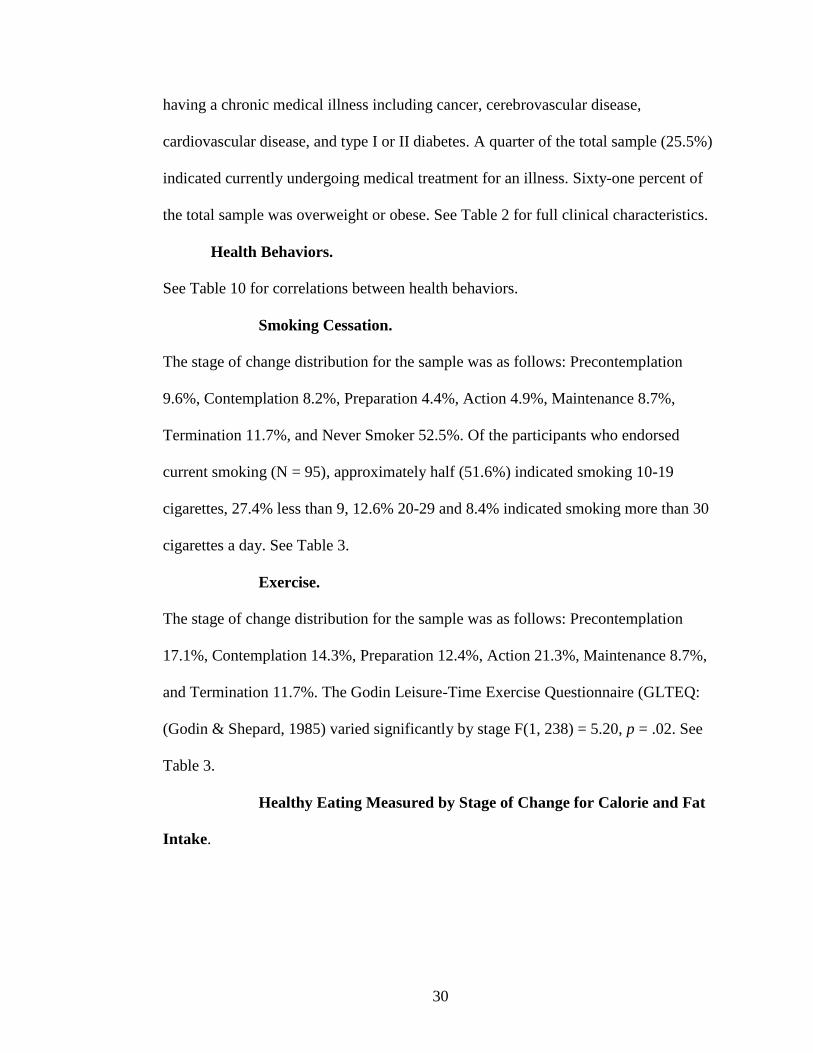
Health Behaviors.
See Table 10 for correlations between health behaviors.
Smoking Cessation.
The stage of change distribution for the sample was as follows: Precontemplation
9.6%, Contemplation 8.2%, Preparation 4.4%, Action 4.9%, Maintenance 8.7%,
Termination 11.7%, and Never Smoker 52.5%. Of the participants who endorsed
current smoking (N = 95), approximately half (51.6%) indicated smoking 10-19
cigarettes, 27.4% less than 9, 12.6% 20-29 and 8.4% indicated smoking more than 30
cigarettes a day. See Table 3.
Exercise.
The stage of change distribution for the sample was as follows: Precontemplation
17.1%, Contemplation 14.3%, Preparation 12.4%, Action 21.3%, Maintenance 8.7%,
and Termination 11.7%. The Godin Leisure-Time Exercise Questionnaire (GLTEQ:
(Godin & Shepard, 1985) varied significantly by stage F(1, 238) = 5.20, p = .02. See
Table 3.
Healthy Eating Measured by Stage of Change for Calorie and Fat
Intake.

31
The stage of change distribution for the sample was as follows: Precontemplation
16.9%, Contemplation 17.8%, Preparation 18.5%, Action 14.8%, and Maintenance
32.1%. See Table 3.
Non-Health Behavior Continuous Model Variables.
Means, standard deviations and observed ranges for mental health functioning (MCS),
physical health functioning (PCS), general self-efficacy (GSE) and perceived social
support (PSS) are presented in Table 5.
Mean Comparisons between Health Behaviors (SMK, EX, HE) and Non-Health
Behavior Model Variables (MCS, PCS, GSE, PSS).
Smoking Cessation. Based on one-way MANOVA, there was an overall
statistically significant difference in non-health behavior variables based on SMK,
F(24, 1456) = 2.23, p = .001; Wilk's Λ = .88, partial η2 = .03.
Exercise. Based on one-way MANOVA, there was an overall statistically
significant difference in non-health behavior variables based on EX, F(16, 1281) =
6.21, p = .000; Wilk's Λ = .80, partial η2 = .06.
Healthy Eating. Based on one-way MANOVA, there was an overall
statistically significant difference in non-health behavior variables based on HE
measured by CALFAT, F(16, 1281) = 2.87, p = .000; Wilk's Λ = .90, partial η2 = .03.
For Hypotheses 1-4, please see Tables 6-8 for complete findings on follow-up
ANOVAs (for the overall MANOVAs conducted above). See Tables 9 and 10 for
correlations between non-health behavior model variables, and stages of change for
each health behavior, respectively.
Hypothesis 1. Health Behaviors and Mental Health Functioning.
32
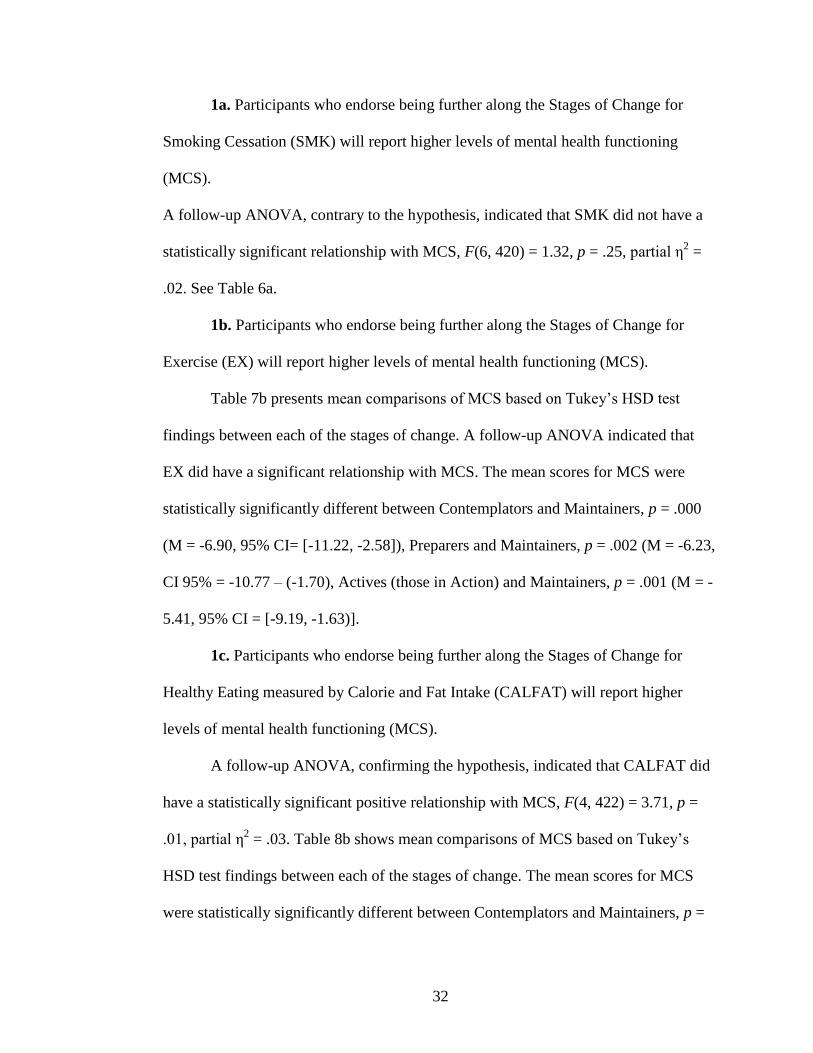
1a. Participants who endorse being further along the Stages of Change for
Smoking Cessation (SMK) will report higher levels of mental health functioning
(MCS).
A follow-up ANOVA, contrary to the hypothesis, indicated that SMK did not have a
statistically significant relationship with MCS, F(6, 420) = 1.32, p = .25, partial η2 =
.02. See Table 6a.
1b. Participants who endorse being further along the Stages of Change for
Exercise (EX) will report higher levels of mental health functioning (MCS).
Table 7b presents mean comparisons of MCS based on Tukey’s HSD test
findings between each of the stages of change. A follow-up ANOVA indicated that
EX did have a significant relationship with MCS. The mean scores for MCS were
statistically significantly different between Contemplators and Maintainers, p = .000
(M = -6.90, 95% CI= [-11.22, -2.58]), Preparers and Maintainers, p = .002 (M = -6.23,
CI 95% = -10.77 – (-1.70), Actives (those in Action) and Maintainers, p = .001 (M = -
5.41, 95% CI = [-9.19, -1.63)].
1c. Participants who endorse being further along the Stages of Change for
Healthy Eating measured by Calorie and Fat Intake (CALFAT) will report higher
levels of mental health functioning (MCS).
A follow-up ANOVA, confirming the hypothesis, indicated that CALFAT did
have a statistically significant positive relationship with MCS, F(4, 422) = 3.71, p =
.01, partial η2 = .03. Table 8b shows mean comparisons of MCS based on Tukey’s
HSD test findings between each of the stages of change. The mean scores for MCS
were statistically significantly different between Contemplators and Maintainers, p =
33
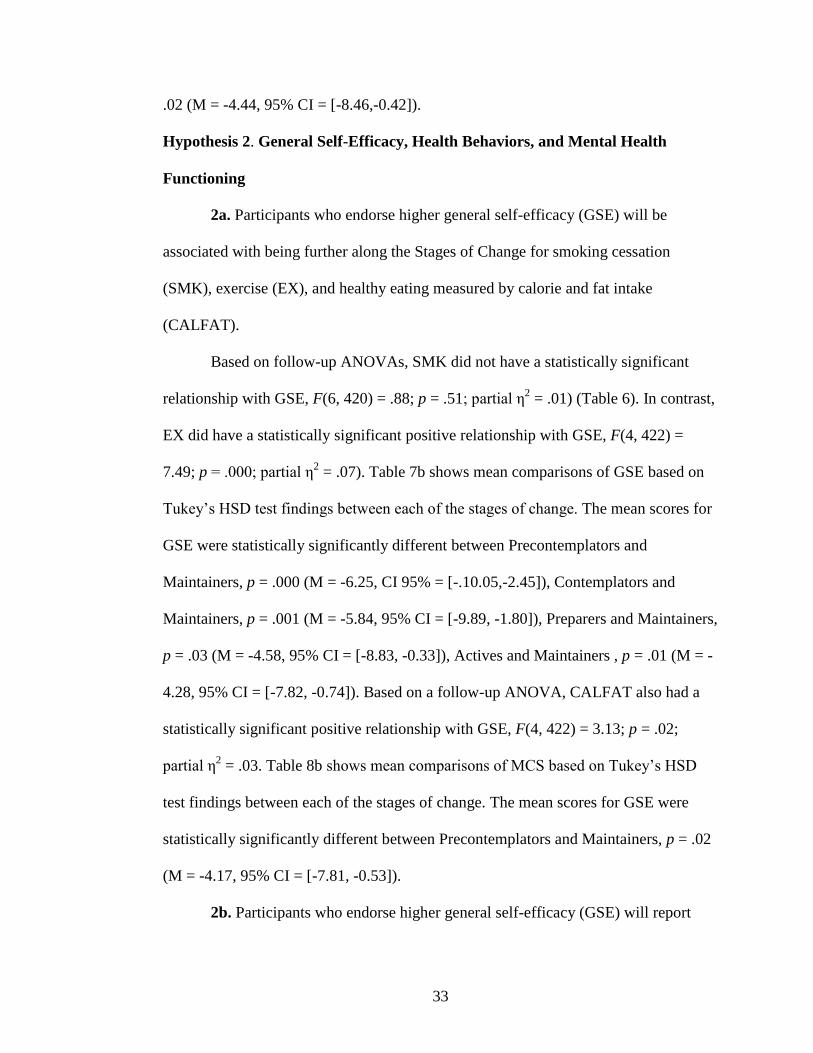
.02 (M = -4.44, 95% CI = [-8.46,-0.42]).
Hypothesis 2. General Self-Efficacy, Health Behaviors, and Mental Health
Functioning
2a. Participants who endorse higher general self-efficacy (GSE) will be
associated with being further along the Stages of Change for smoking cessation
(SMK), exercise (EX), and healthy eating measured by calorie and fat intake
(CALFAT).
Based on follow-up ANOVAs, SMK did not have a statistically significant
relationship with GSE, F(6, 420) = .88; p = .51; partial η2 = .01) (Table 6). In contrast,
EX did have a statistically significant positive relationship with GSE, F(4, 422) =
7.49; p = .000; partial η2 = .07). Table 7b shows mean comparisons of GSE based on
Tukey’s HSD test findings between each of the stages of change. The mean scores for
GSE were statistically significantly different between Precontemplators and
Maintainers, p = .000 (M = -6.25, CI 95% = [-.10.05,-2.45]), Contemplators and
Maintainers, p = .001 (M = -5.84, 95% CI = [-9.89, -1.80]), Preparers and Maintainers,
p = .03 (M = -4.58, 95% CI = [-8.83, -0.33]), Actives and Maintainers , p = .01 (M = -
4.28, 95% CI = [-7.82, -0.74]). Based on a follow-up ANOVA, CALFAT also had a
statistically significant positive relationship with GSE, F(4, 422) = 3.13; p = .02;
partial η2 = .03. Table 8b shows mean comparisons of MCS based on Tukey’s HSD
test findings between each of the stages of change. The mean scores for GSE were
statistically significantly different between Precontemplators and Maintainers, p = .02
(M = -4.17, 95% CI = [-7.81, -0.53]).
2b. Participants who endorse higher general self-efficacy (GSE) will report

34
higher levels of mental health functioning (MCS).
There was a moderate, positive correlation between MCS and GSE (GSE), r = .33, p
<.01. See Table 9.
Hypothesis 3. Perceived Social Support, Health Behaviors, Physical Health
Functioning, and Mental Health Functioning.
3a. Participants who endorse higher levels of perceived social support (PSS)
will report being further along the Stages of Change for smoking (SMK) cessation,
exercise (EX), and healthy eating measured by calorie and fat intake (CALFAT).
Contrary to the hypothesis, based on follow-up ANOVAs, SMK (F(6, 420) =
1.31; p = .25; partial η2 = .02), EX (F(4, 422) = 1.64; p = .16; partial η
2 = .02), and
CALFAT (F(4, 422) = .66; p = .62; partial η2 = .01) did not have a statistically
significant relationship with PSS. See Tables 6 and 8.
3b. Participants who endorse higher levels of perceived social support (PSS)
will report higher levels of physical health functioning (PCS).
Contrary to the hypothesis, there was no significant correlation between PSS and PCS,
r = .09. See Table 9.
3c. Participants who endorse higher levels of perceived social support (PSS)
will be associated with higher levels of general self-efficacy (GSE).
Confirming the hypothesis, there was a moderate, positive correlation between PSS
and GSE, r = .31, p <.01. See Table 9.
3d. Participants who endorse higher levels of perceived social support (PSS)
will be associated with higher levels of mental health functioning (MCS).
Confirming the hypothesis, there was a moderate, positive correlation between PSS

35
and MCS, r = .31, p <.01. See Table 9.
Hypothesis 4. Physical Health Functioning, General Self-Efficacy, and Mental
Health Functioning.
Participants who endorse higher levels of physical health functioning (PCS) will have:
4a. higher levels of general self-efficacy (GSE).
Contrary to the hypothesis, there was no significant correlation between PCS and
GSE, r = .09. See Table 9.
4b. higher levels of mental health functioning (MCS).
Confirming the hypothesis, there was a small, positive correlation between PCS and
MCS, r = .16, p <.01. See Table 9.
Please see Tables 6b, 7b, and 8b for complete findings (including those
evaluated outside of the hypotheses) on mean comparison of non-health-behavior
model variables (MCS, PCS, GSE, and PSS) based on Tukey’s HSD test findings
across each of the stages of change for SMK, EX and CALFAT.
Hypothesis 5. Proposed Mediational Model.
It was expected that the following Mediational Model (Figure 1) would offer the best
fit to the data: perceived social support, general-self-efficacy three health behaviors
(SMK, EX, CALFAT) physical health functioning mental health functioning.
To test the relationship between health behaviors and non-health behavior
model variables, and mental health functioning and explain the variances and
covariances, three separate path models were tested. This method is designed to
evaluate the way a set of variables relate and form a multivariate model (Schnoll,
Harlow, Stolbach, & Brandt, 1998). Three models including Proposed Mediational

36
Model, Full Model, and Direct Model were analyzed for a primary outcome variable
(mental health functioning). The Full Model (Figure 2) included all paths in order to
evaluate the following: 1) whether perceived social support and general self-efficacy
directly affects mental health functioning; 2) whether the three health behaviors
(smoking cessation, exercise, and healthy eating) and physical health functioning
indirectly mediate the latter relationship; and 3) whether physical health functioning
mediate the relationship between the three health behaviors and mental health
functioning. The third and final competing model, the Direct Model (Figure 3) tested
paths between general self-efficacy, perceived social support, the three health
behaviors and mental health functioning to examine the direct effects of the latter five
variables on mental health independent of each other.
Model 1: Proposed Mediational Model.
Results indicated that the Proposed Mediational Model did not provide a good
fit to the data at the macro and micro levels (χ2
(8, N=427) = 70.69, p = .000; CFI=.74;
RMSEA= .14, 90% CI = .11, .17]). Analysis of the largest standardized residuals
indicated values exceeding |0.20|, which shows that this model did not adequately
explain the relationships between variables.
Standardized parameter estimates are shown in Figure 1. However, because
this model was not a good fit, estimates of individual parameters were unreliable and
hence cannot be interpreted.
The Wald test suggested dropping the following parameters to improve fit: 1)
Calorie and fat intake to physical health 2) perceived social support to calorie and fat
intake, 3) calorie and fat intake to general self-efficacy, and 4) smoking cessation to

37
general self-efficacy. The Lagrange Multiplier test suggested adding the following
parameters to improve fit: 1) Perceived social support to general self-efficacy, 2)
perceived social support to mental health, and 3) perceived social support to physical
health.
Model 2: Full Model.
Results indicated that the full model did provide a good fit to the data at the
macro and micro levels (χ2
(1, N=427) = 2.33, p = .13; CFI=.99; RMSEA=.06, 90% CI
= [.00, .15]). Analysis of the largest standardized residuals indicated that all
relationships among observed variables were adequately explained by the model; no
residual values exceeded |0.20|. Physical health, general self-efficacy, and perceived
social support had a cumulative effect on mental health (R2
= 0.17), meaning that the
latter three variables accounted for approximately 17% of the variance in mental
health. Only EX and SMK had a small effect (R2
= .13) on physical health (i.e., EX
and SMK accounted for about 13% of the variance in physical health). GSE had a
small effect on EX (R2
= .06) and on CALFAT (R2
= .02). PSS had a small effect (R2
= .02) on SMK. Standardized parameter estimates are shown in Figure 2.
Unstandardized coefficients indicated that GSE had a direct effect on EX (β =
.07, SE = .02, p < .05) and CALFAT (β = .04, SE = .02, p < .05) and an indirect effect
on PCS (β = .10, SE = .04, p < .05). GSE did not have a direct effect on SMK (β = .04,
SE = .02, p > .05) and PCS (β = .04, SE = .10, p < .05). GSE did have a direct effect
on MCS (β = .53, SE = .10, p < .05).
PSS had a direct effect on SMK (β = .02, SE = .01, p < .05) but not on EX (β =
.01, SE = .01, p > .05) and CALFAT (β = .00, SE = 01, p > .05). PSS did not have a
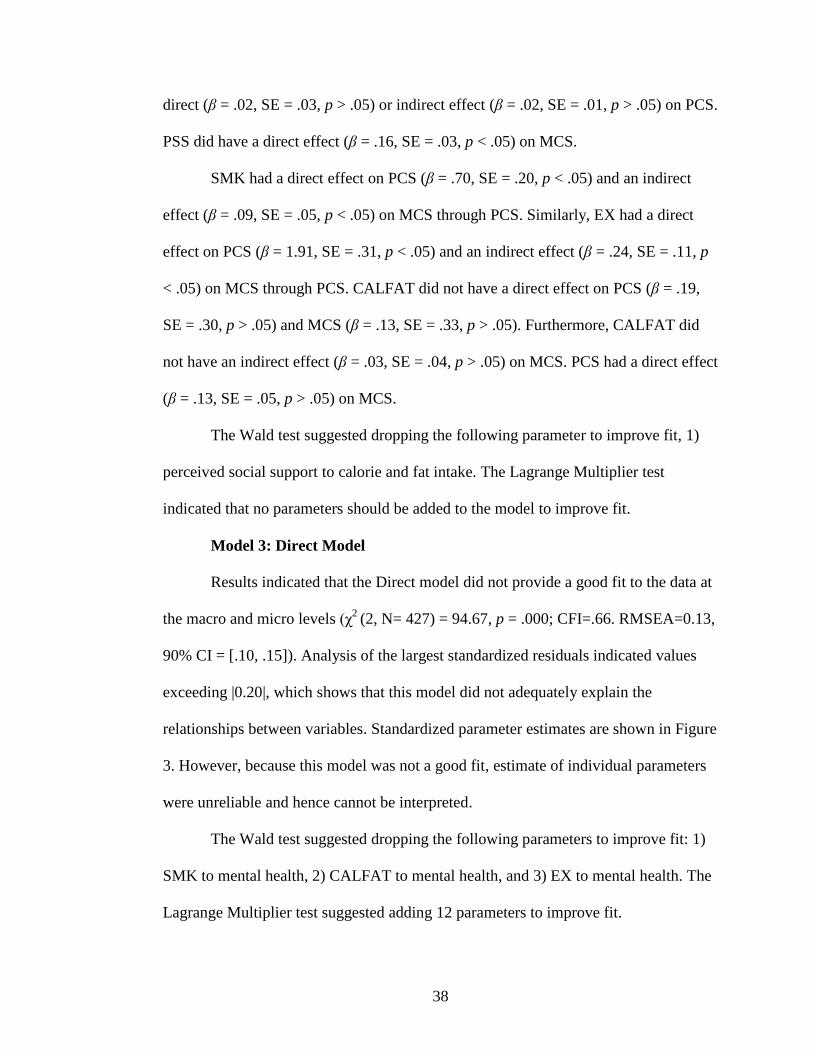
38
direct (β = .02, SE = .03, p > .05) or indirect effect (β = .02, SE = .01, p > .05) on PCS.
PSS did have a direct effect (β = .16, SE = .03, p < .05) on MCS.
SMK had a direct effect on PCS (β = .70, SE = .20, p < .05) and an indirect
effect (β = .09, SE = .05, p < .05) on MCS through PCS. Similarly, EX had a direct
effect on PCS (β = 1.91, SE = .31, p < .05) and an indirect effect (β = .24, SE = .11, p
< .05) on MCS through PCS. CALFAT did not have a direct effect on PCS (β = .19,
SE = .30, p > .05) and MCS (β = .13, SE = .33, p > .05). Furthermore, CALFAT did
not have an indirect effect (β = .03, SE = .04, p > .05) on MCS. PCS had a direct effect
(β = .13, SE = .05, p > .05) on MCS.
The Wald test suggested dropping the following parameter to improve fit, 1)
perceived social support to calorie and fat intake. The Lagrange Multiplier test
indicated that no parameters should be added to the model to improve fit.
Model 3: Direct Model
Results indicated that the Direct model did not provide a good fit to the data at
the macro and micro levels (χ2
(2, N= 427) = 94.67, p = .000; CFI=.66. RMSEA=0.13,
90% CI = [.10, .15]). Analysis of the largest standardized residuals indicated values
exceeding |0.20|, which shows that this model did not adequately explain the
relationships between variables. Standardized parameter estimates are shown in Figure
3. However, because this model was not a good fit, estimate of individual parameters
were unreliable and hence cannot be interpreted.
The Wald test suggested dropping the following parameters to improve fit: 1)
SMK to mental health, 2) CALFAT to mental health, and 3) EX to mental health. The
Lagrange Multiplier test suggested adding 12 parameters to improve fit.

39
Overall, of the three models tested, the Full Model, the model in which the
relationship between various relationships between the model variables and mental
health is the most appropriate model for the data based on the criteria of empirical fit
described earlier. SMK and EX, had an indirect effect on mental health (i.e., mediated
by physical health). The Mediational Model and the Direct Model each did not
provide an adequate fit for the data.
Exploratory Analyses Findings.
To capture a more comprehensive snapshot and richer understanding of the study
sample, additional descriptive analyses were conducted; some of the findings are
presented below.
Demographic Characteristics by Presence of Mental Illness.
Chi-square testes indicated that there was no overall statistically significant difference
between presence of mental illness across demographics characteristics including age
group, gender, race, sexual orientation, marital status, education level, health
insurance status, and region of residence. See Table 11.
Physical Health Characteristics by Presence of Mental Illness.
Chi-square tests indicated that there was an overall statistically significant difference
between presence of mental illness across physical health characteristics including
body mass index (χ² (3) = 10.34, p = .02) and currently undergoing any kind of
medical treatment (e.g. medication) (χ² (1) = 27.72, p = .000). See Table 12.
For post-hoc comparisons, Delucchi (1993) recommends identifying the cells
with the largest residuals. A residual is the difference between the observed and
expected values for a cell. The larger the residual, the greater the contribution of the
40
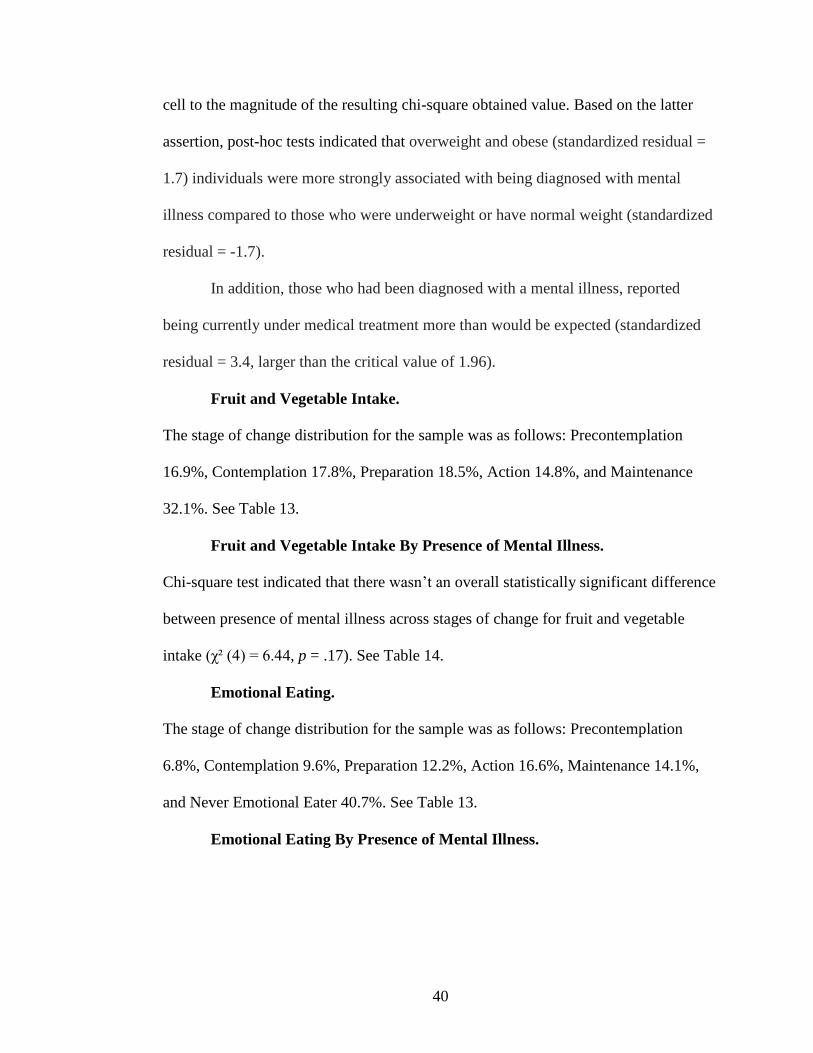
cell to the magnitude of the resulting chi-square obtained value. Based on the latter
assertion, post-hoc tests indicated that overweight and obese (standardized residual =
1.7) individuals were more strongly associated with being diagnosed with mental
illness compared to those who were underweight or have normal weight (standardized
residual = -1.7).
In addition, those who had been diagnosed with a mental illness, reported
being currently under medical treatment more than would be expected (standardized
residual = 3.4, larger than the critical value of 1.96).
Fruit and Vegetable Intake.
The stage of change distribution for the sample was as follows: Precontemplation
16.9%, Contemplation 17.8%, Preparation 18.5%, Action 14.8%, and Maintenance
32.1%. See Table 13.
Fruit and Vegetable Intake By Presence of Mental Illness.
Chi-square test indicated that there wasn’t an overall statistically significant difference
between presence of mental illness across stages of change for fruit and vegetable
intake (χ² (4) = 6.44, p = .17). See Table 14.
Emotional Eating.
The stage of change distribution for the sample was as follows: Precontemplation
6.8%, Contemplation 9.6%, Preparation 12.2%, Action 16.6%, Maintenance 14.1%,
and Never Emotional Eater 40.7%. See Table 13.
Emotional Eating By Presence of Mental Illness.

41
Chi-square test indicated that there was an overall statistically significant difference
between presence of mental illness across stages of change for emotional eating (χ² (5)
= 21.78, p = .001). See Table 14.
Post-hoc tests indicated that Never Eaters, in other words, those who had never
eaten food in response to emotional distress (standardized residual = -2.0 < -1.96)
were significantly less likely to be diagnosed with mental illness than expected.
Facebook Utilization.
Of the total sample, 85% indicated currently having a Facebook account. The
majority of the latter group (53.7%) indicated that they did not use Facebook as a way
to receive social support, while 36.1% indicated that they did use Facebook as a way
to receive social support and 10.2% were unsure about whether they used Facebook as
a way to receive social support. See Table 15.
Facebook Utilization by Presence of Mental Illness.
Chi-square tests indicated that there was no overall statistically significant
difference between presence of mental illness and having Facebook account or not (χ²
(1) = 2.58, p = .11). Similarly, there was no overall statistically significant difference
between presence of mental illness and whether an individual uses Facebook as a
means to receive social support or not (χ² (2) = 2.19, p = .33) and amount of time spent
on Facebook (χ² (5) = 1.32, p = .93). However, there was an overall statistically
significant difference between presence of mental illness and whether an individual’s
experiences on Facebook make them feel better, no different, or worse (χ² (2) = 7.87, p
= .02). However, it should be noted that a very small sample was evident for those

42
who felt worse when using Facebook; those with (n=8) and without (n=3) a diagnosed
mental illness. See Table 16.
43
CHAPTER 6
CONCLUSION
The present study’s primary goal was to explore the role of three key health
behaviors (SMK, EX, and CALFAT) in relation to mental health among a population-
based adult sample. In addition, the study explored the same three health behaviors
and physical health functioning as mediators of the relationship between other
modifiable variables including general self-efficacy and perceived social support, and
adult mental health functioning. To our knowledge, this study is the first to explore the
direct and indirect effects of multiple health behaviors on mental health functioning
among a population-based sample.
Importantly, the present study participant demographic characteristics (Table
1) are fairly consistent with U.S. Census statistics (2014) across race, sexual
orientation, marital status, and health insurance status prior to the launch of the
Affordable Healthcare Act (January 2015). However, education level was higher than
that of the general population. In terms of clinical characteristics (Table 2) and health
behaviors (Table 3), for example, a little over 20% of participants were current
smokers, higher than the national rate see among adults (17.8%) (CDC, 2015). Among
the total sample, approximately 58% of participants were engaging in recommended
regular exercise which is higher than the national trend at 49% (CDC, 2013), while
31% were engaging in healthy eating behaviors. Furthermore, 61% percent of the total
sample was overweight or obese, lower than the rate observed in the general U.S.

44
population (69%) (National Center for Health Statistics, 2014), yet still indicating a
substantial proportion of adults. Seventeen percent of participants were currently
suffering from one of the four “lifestyle” chronic physical illnesses assessed (i.e.
cardiovascular disease, cancer, cerebrovascular disease, and diabetes).
It must be noted that the rates of overweight/obesity, healthy eating and
adequate exercise were simultaneously high among this sample. There may be several
explanations for the latter finding in which unhealthy weight was coexisting with high
levels of engagement in health behaviors typically utilized for weight management.
One explanation is that adequate exercise and healthy eating measured by calorie and
fat intake may not be enough to curb weight issues. A study published in 2014 (Ng,
Slining, & Popkin) “found a small but steady decline” in the consumption of calories
between 2003 and 2011 (not due to the economic recession at the time) among
American youth and adults indicative of public attitudes shifting (i.e. anti-soda
messages). However, their findings also indicated that, on average, Americans spend
only approximately 25 minutes every day preparing food. A separate very recent study
(Poti, Mendez, Ng, & Popkin, 2015) indicated that the majority of the U.S. diet is
based on consuming “ready to eat” or “ready to heat” products typically highly
processed and high in sugar, salt and saturated fat. Furthermore, Poti and colleagues
(2015) found that, between 2000 and 2013, the moderately (e.g. flavored pasta,
cheese, flavored fruit and vegetable juice, potato chips) and highly processed foods
(e.g. soda, sports drinks, alcohol, hot dogs, bagels, frozen pizza, ice cream, candy),
with high saturated fat, sugar and salt, comprised more than 75% of people’s energy
intake. In other words, over 50% of calories consumed by youth and adults are from
45
refined carbohydrates, desserts, fast food, and savory snacks (Poti et al., 2015). This
shows that the U.S. diet is still not necessarily a healthier one. While there has been a
reduction in the amount of food/calories consumed over the past decade or so, the
quality and nutritional aspects of food consumed have not improved (Poti et al., 2015).
In terms of exercise, more than 27% of adults engaged in regular exercise have
graduated from college (CDC, 2013c). Those who had received less than a high school
diploma had the lowest rates (12%) of exercise (CDC, 2013c). Population-based self-
report data indicate that rates of exercise have plateaued, with those with higher
income more likely to engage in exercise and eating more fruit and vegetables
(Boseley, 2015). The present study sample did indicate engaging in high levels of fruit
and vegetable intake (47%). Diet and nutrition is an area that is complex and national
guidelines are consistently updated (about every 5 years) to reflect our current
scientific knowledge of the role of different types of nutrition such as sugar, fat, and
calories in our health and well-being.
In terms of mental health, 43% had been diagnosed with a mental illness at one
point in time; close to the national rate at 50% and, of the total sample, 38% had been
prescribed medication for a mental health issue. These findings portray the veracity of
this population-based sample and also the dominance and pervasiveness of physical
and mental health issues faced by the present sample, consistent with the general US
adult population findings.
Hypotheses 1-4 – Group Mean Differences and Correlations.
Contrary to what was hypothesized, findings indicated that SMK did not have
a significant relationship with mental health, general self-efficacy, or perceived social
46
support. As hypothesized, EX did have a significant relationship with mental health
and general self-efficacy with moderate to large effect sizes (partial η2 = .07).
Particularly, engaging in regular exercise for at least six months compared to
contemplating engaging in exercise, preparing to engage in exercise, and actually
actively engaging in regular exercise for less than six months was strongly linked to
better mental health. This may suggest that in order to feel the positive effects of
exercise on mental health, exercise has to become routine and longer-term.
Maintainers did not differ from Precontemplators perhaps since the latter group of
individuals isn’t even considering engaging in exercise and is content with their
“status quo,” and hence may not be feeling any distress about how they are leading
their life or potentially engaging in a new behavior that may come with its added
challenges. With respect to general self-efficacy, the sense of confidence in one’s own
ability to overcome challenges in everyday life, those who had been engaging in
regular exercise for more than six months differed in their level of confidence
compared to those not interested in engaging in EX, those considering engaging and
those actively engaging in EX for less than six months. These findings suggest that
engaging in longer-term exercise can potentially help build confidence.
As hypothesized, CALFAT had a significant relationship with general self-
efficacy and mental health. Again, maintainers were significantly different than
Precontemplators with respect to their level of confidence. One argument for this is
the fact that contemplators can be quite ambivalent towards engaging in a new
behavior, especially healthy eating, given the substantial lifestyle change it may
require to practice additional behaviors such as buying healthier foods, reading food
47
labels, and reorganizing daily schedules to buy healthier foods. In addition,
contemplators may have some awareness of the benefits of engaging in healthy eating
as well as the negative effects of unhealthy eating, and as a result may experience
more distress and less confidence about all of the challenges around this new behavior
compared to those who are moving towards healthy eating, and even those who are not
interested in healthy eating at all. With respect to mental health, those who had been
eating healthy for at least six months (maintainers) were particularly different from
those who were contemplating engaging in healthy eating in the next 6 months.
As expected, there was a significant relationship between general self-efficacy
and mental health, indicating that higher levels of self-efficacy were associated with
higher levels of mental health. As hypothesized, perceived social support and physical
health were significantly related, indicating that higher levels of perceived social
support were associated with higher levels of general self-efficacy. Similarly, there
was a significant relationship between perceived social support and mental health,
again, indicating that higher levels of perceived social support were associated with
higher levels of mental health.
Contrary to what was expected, physical health did not significantly relate to
general self-efficacy. And finally, as expected, there was a significant relationship
between physical health and mental health, indicating that higher levels of physical
health functioning were associated with higher levels of mental health functioning.
When looking at group comparisons, these finding can be summarized as: 1)
Smoking doesn’t appear significantly related to self-efficacy, perceived social support
and mental health functioning, 2) engaging in exercise and healthy eating for at least

48
six months is strongly linked to better general self-efficacy and mental health, 3) those
who are contemplating engaging in exercise and/or healthy eating in the next six
months appear to be particularly different than maintainers in terms of their mental
health status, 4) perceived social support is significantly related to physical and mental
health functioning, and 5) general self-efficacy is significantly linked to mental health
functioning.
Hypothesis 5 – Model Testing.
An examination of the fully saturated model (Figure 2), predicting mental
health from general self-efficacy, perceived social support, and physical health
functioning revealed good model fit, accounting for a small amount of variance (R2 =
.17). This finding supported hypotheses and previous research that higher levels of
general self-efficacy (e.g.Kim, 2003), perceived social support (e.g. Cacioppo et al.,
2011; Fratiglioni et al., 2004) and physical health (e.g.Walsh, 2010) are associated
with higher levels of mental health.
In contrast, the three health behaviors did not directly predict or have an effect
on mental health. Interestingly, though, exercise and healthy eating had an indirect
effect on mental health functioning through physical health. In other words, this may
mean that if an individual is engaging in risky health behaviors, for example, not
engaging in regular exercise or is a chronic smoker and as a result suffers from
physical health issues, then they are likely to experience worse mental health. This is a
nuanced finding supporting the significant levels of mental illness comorbidity seen
among individuals with physical health issues and vice versa. As such, then, engaging
in and maintaining health behaviors is strongly linked to improved physical health

49
which in turn can be linked to improved mental health. This finding is particularly
relevant given the recent focus on the integration of behavioral health care in to
primary care and medical settings. In such settings, mental and behavioral issues like
sedentary lifestyle can be targeted as a way to not only improve more chronic physical
health outcomes but also mental health issues.
Interestingly, exercise mediated the relationship between general self-efficacy
and mental health. Previous research has found that mediators of physical activity and
mental health have included self-efficacy and social interaction (e.g. Peluso, & Guerra
de Andrade, 2005). Both findings could be indicative of the dual or bi-directional
relationships between the variables.
Perceived social support predicted smoking behavior. This kind of social
support refers to the perceived availability of people who can be supportive when one
has problems, through behaviors such as empathic listening, providing tangible aid,
and/or informational aid for the provision of supportive behaviors specific to health
behavior change (Westmaas, Bontemps-Jones, & Bauer, 2010). These support
functions can be “abstinence specific” in that they pertain to specifically support the
quit attempt or they can be more general such as providing emotional support
contributing to a more “stress free” environment that can help with the challenges that
come with quitting (Mermelstein et al., 1986). An alternative is that specific supports
like a partner or friend can deliberately engage an individual to distract him or her
from withdrawal symptoms of smoking (Westmaas et al., 2010).
Exploratory Findings.
50
Fruit and vegetable intake were discussed previously. In terms of emotional
eating, consistent with previous findings, those who do not engage in emotional eating
tend to have had a mental illness diagnosis compared to those who have engaged in
emotional eating.
With regard to Facebook utilization, those who tended to feel worse
(importantly a small sample size) about Facebook experiences were inclined to have
had a mental illness diagnosis. It would be important to further explore the presence of
specific mental illness given that negative appraisals of experiences can be an inherent
feature of certain mental health issues.
Limitations.
First, one important limitation is that this is a cross-sectional study with
mediational analyses. Definitive statements about causality can be made only with
prospective and longitudinal design. Maxwell and Cole (2007) state that the use of
mediation in cross-sectional analyses is unlikely to accurately reflect longitudinal
effects. The present results serve as exploratory models to engender ideas for further
research. Ideally, the present results need to be replicated with longitudinal data with
at least two to three time points (Maxwell & Cole, 2007). Furthermore, there is likely
many other factors that play a role in mental health outcomes (e.g. genetic factors,
early life exposures, and other situational factors) that are antecedent to and the
present study only captured a small part of these complex relationships. In addition, a
bi-directional relationship between all of the model variables is plausible.
Second, there was an assessment related limitation. Given that it wasn’t within
the scope of the present study to assess different forms of perceived social support
51
(PSS), the path analyses combined all forms of PSS (i.e. social support received from
family, significant other, and friend) into one composite score that has been
established by the authors of that particular measure. By doing so, analyses were not
conducted on how a specific form of perceived social support may or may not
contribute to mental health. It can be expected that different forms of perceived social
support are qualitatively and quantitatively different and may or may not predict
different outcomes. Further studies can apply latent variable model testing to include
different types of perceived social support as potential predictors of mental health
outcomes.
Third, for the purpose of the study in looking at mental health on a population
level, the relationship between health behaviors and current (past 4 weeks) mental
health functioning was assessed. It would be important to assess past mental health
functioning as well to compare it to present functioning alongside the potential change
in health risk behaviors to better understand the relationship between health behaviors
and mental health functioning over time.
Future Recommendations
Based on the current study’s findings and limitations, one major
recommendation made is to further improve on the body of literature delineating the
relationships between health behaviors and mental health outcomes. First, it is
imperative that studies continue to explore direct outcomes health behaviors may have
on mental health across cross-sectional and longitudinal studies as well as multivariate
and model testing. Specifically, two recent studies have shown bi-directional
relationships between depression and obesity (Kontinnen et al., 2014) and mental

52
health and physical activity in older adults (Steinmo, Hagger-Johnson, & Shahab,
2014). It will be important to examine how the model variables relate to each other
within longitudinal bi-directional models given the emerging evidence in this realm.
Second, although it is important to continue to assess overall mental health
functioning in the general population for public health purposes, it is also important to
continue to look at the relative impact of health behaviors on the presence and severity
of specific mental illnesses to further our understanding of potential non-
pharmacologic prevention and intervention efforts for mental illness.

53
TABLE 1: DEMOGRAPHIC CHARACTERISTICS
N %
Gender Female 242 56.7
Male 184 43.1
Transgender 1 0.2
Age Group 18-24 51 11.9
25-34 104 24.4
35-44 83 19.4
45-54 121 28.3
55-64 68 15.9
Race White 311 72.8
Hispanic or Latino 26 6.1
Black or African American 49 11.5
Native American 3 0.7
Asian / Pacific Islander 24 5.6
Other 4 0.9
Mixed 10 2.3
Sexual Orientation Heterosexual or straight 396 92.7
Gay 10 2.3
Lesbian 4 0.9
Bisexual 16 3.7
Other 1 0.2
Marital Status Single, never married 128 30.0
Married or domestic partnership/ civil union 231 54.1
Widowed 5 1.2
Divorced 53 12.4
Separated 10 2.3

54
TABLE 1. DEMOGRAPHIC CHARACTERISTICS CONT.
N %
Education Level Some high school, no diploma 13 3.0
High school graduate, diploma or the equivalent 87 20.4
Some college credit, no degree 98 23.0
Trade/technical/vocational training 29 6.8
Associate degree 45 10.5
Bachelor’s degree 112 26.2
Master’s degree 33 7.7
Professional/ Doctorate degree 10 2.3
Health Insurance Status Private Plan 49 11.5
Employment-based Plan 206 48.2
Direct Purchase 8 1.9
Government Plan 24 5.6
Medicare 35 8.2
Medicaid 41 9.6
Military Healthcare 12 2.8
Uninsured 52 12.2
Region of Residence Northeast 104 24.4
Midwest 103 24.1
South 139 32.6
West 81 19.0

55
TABLE 2: CLINICAL CHARACTERISTICS
N %
Body Mass Index Categories
Underweight 20 4.8
Normal weight 144 34.4
Overweight 119 28.4
Obesity 136 32.5
Past or Current Diagnosis of Mental
Illness (Multiple Events)
Anxiety 99 23.2
Depression 127 29.7
Substance abuse/dependence 16 3.8
Bipolar disorder 16 3.8
Schizophrenia 7 1.6
Attention deficit/hyperactivity 20 4.7
Eating disorder 18 4.2
Panic 20 4.7
Post-traumatic stress disorder 19 4.5
Personality disorder 3 0.7
Obsessive Compulsive Disorder 13 3
Other 22 5.2
Never 242 56.7
622 145.8
Ever Been Prescribed Medication for
a Mental Health Condition?
Yes 160 37.5
No 267 62.5
Current Psychotropic Medication Use
Antianxiety 20 16.4
Antidepressant 70 57.4
Antipsychotic 11 9.0
Mood stabilizer/ Anticonvulsant 13 10.7
Stimulant 8 6.6

56
TABLE 2: CLINICAL CHARACTERISTICS CONT.
N %
Current Chronic Medical Illness
Cancer 4 0.9
Cerebrovascular 5 1.2
Cardiovascular 34 8.0
Type I or II diabetes 28 6.6
No 356 83.4
Current Medical Treatment
Yes 109 25.5
No 318 74.5
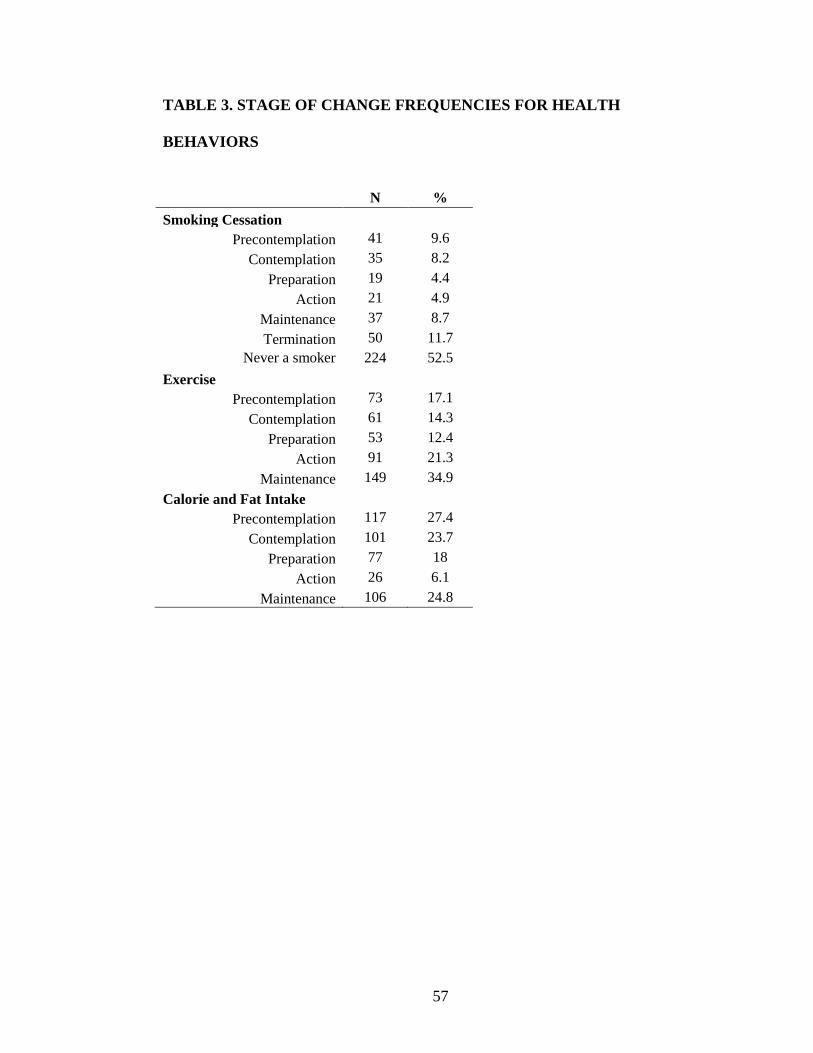
57
TABLE 3. STAGE OF CHANGE FREQUENCIES FOR HEALTH
BEHAVIORS
N %
Smoking Cessation
Precontemplation 41 9.6
Contemplation 35 8.2
Preparation 19 4.4
Action 21 4.9
Maintenance 37 8.7
Termination 50 11.7
Never a smoker 224 52.5
Exercise
Precontemplation 73 17.1
Contemplation 61 14.3
Preparation 53 12.4
Action 91 21.3
Maintenance 149 34.9
Calorie and Fat Intake
Precontemplation 117 27.4
Contemplation 101 23.7
Preparation 77 18
Action 26 6.1
Maintenance 106 24.8

58
TABLE 4: STAGE OF CHANGE FREQUENCIES BY PRESENCE OF
MENTAL ILLNESS
Current or past mental illness diagnosis
Yes No
N % N % χ2
Stage of Change for Smoking
Precontemplation 19 4.4 22 5.2 0.71
Contemplation 19 4.4 16 3.7
Preparation 9 2.1 10 2.3
Action 10 2.3 11 2.6
Maintenance 16 3.7 21 4.9
Termination 24 5.6 26 6.1
Never smoker 89 20.8 135 31.6
Stage of Change for Exercise
Precontemplation 25 5.9 48 11.2 0.10
Contemplation 26 6.1 35 8.2
Preparation 29 6.8 24 5.6
Action 46 10.8 45 10.5
Maintenance 60 14.1 89 20.8
Stage of Change for Calorie and Fat
Intake
Precontemplation 36 8.4 81 19.0 0.00**
Contemplation 51 11.9 50 11.7
Preparation 42 9.8 35 8.2
Action 15 3.5 11 2.6
Maintenance 42 9.8 64 15.0
Note.**. Significant at the .01 level.

59
TABLE 5: UNIVARIATE STATISTICS FOR NON-HEALTH BEHAVIOR
MODEL VARIABLES
Variable Range N=427
M(SD) Skewness Kurtosis
MCS 6.96-64.71 44.30(10.68) -0.496 -0. 1
PCS 19.44-70.61 50.75(9.50) -0.777 0.127
GSE 9.10-36.40 27.89(4.92) -0.538 1.063
PSS 11-77 53.80(15.02) -0.589 0.117
Note. MCS = The Medical Outcome Study Short Form Mental Health Composite Score;
PCS = The Medical Outcome Study Short Form Physical Health Composite Score; GSE
= The General Self-Efficacy Scale; PSS= The Multidimensional Scale of Perceived
Social Support. For all the variables, higher scores are indicative of improved
functioning.
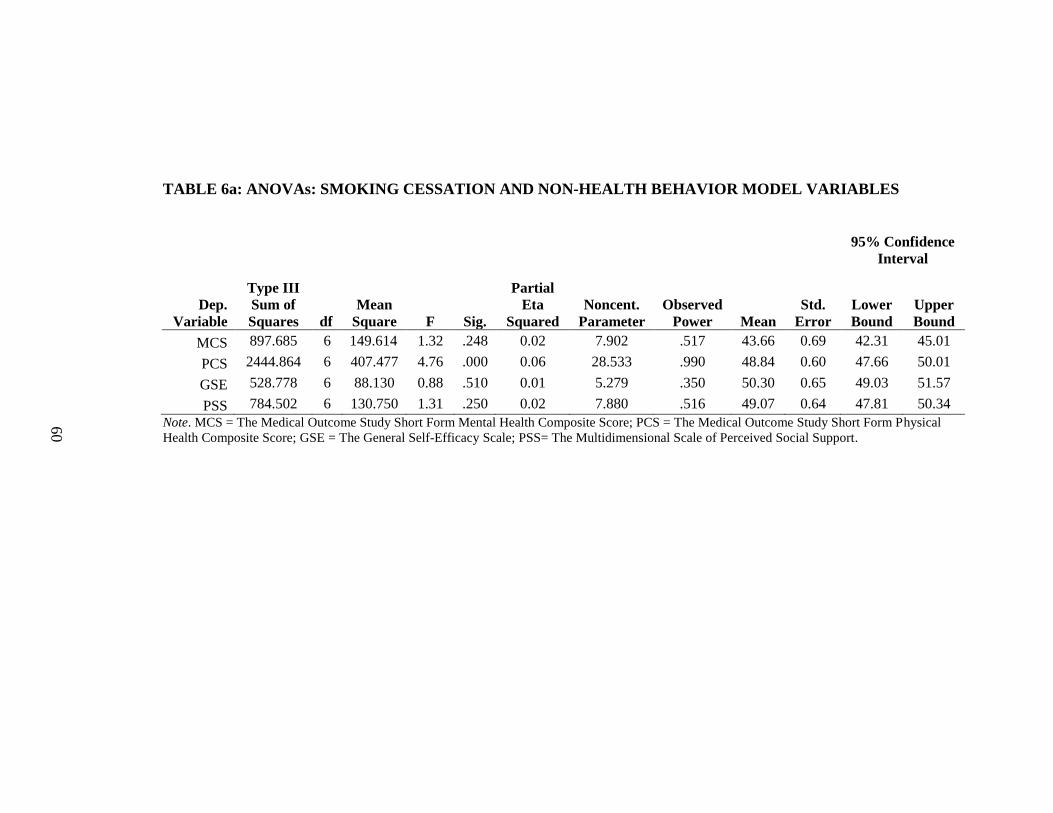
60
TABLE 6a: ANOVAs: SMOKING CESSATION AND NON-HEALTH BEHAVIOR MODEL VARIABLES
95% Confidence
Interval
Dep.
Variable
Type III
Sum of
Squares df
Mean
Square F Sig.
Partial
Eta
Squared
Noncent.
Parameter
Observed
Power Mean
Std.
Error
Lower
Bound
Upper
Bound
MCS 897.685 6 149.614 1.32 .248 0.02 7.902 .517 43.66 0.69 42.31 45.01
PCS 2444.864 6 407.477 4.76 .000 0.06 28.533 .990 48.84 0.60 47.66 50.01
GSE 528.778 6 88.130 0.88 .510 0.01 5.279 .350 50.30 0.65 49.03 51.57
PSS 784.502 6 130.750 1.31 .250 0.02 7.880 .516 49.07 0.64 47.81 50.34
Note. MCS = The Medical Outcome Study Short Form Mental Health Composite Score; PCS = The Medical Outcome Study Short Form Physical
Health Composite Score; GSE = The General Self-Efficacy Scale; PSS= The Multidimensional Scale of Perceived Social Support.

61
TABLE 6b: MEANS AND STANDARD DEVATIONS: SMOKING CESSATION AND NON-HEALTH
BEHAVIOR MODEL VARIABLES
PC C PR A M T NS
n = 41 n = 35 n = 19 n = 21 n = 37 n = 50 n = 224
Measures M SD M SD M SD M SD M SD M SD M SD
MANOVA F = 2.23; df = 24, 1455; p = .001, partial η2 = .03
MCS 43.64 10.57 46.07 12.40 38.93 11.07 42.33 9.83 44.27 10.92 45.95 9.48 44.42 10.63
PCS 49.49 9.18 47.24 11.54 46.8 10.29 48.3 8.62 48.5 8.31 48.55 9.13 52.96 9.01
GSE 51.09 7.96 50.54 10.13 48.18 15.57 50.55 6.01 50.08 8.43 52.38 10.56 49.27 10.14
PSS 47.78 9.8 50.13 11.41 48.35 12.34 48.83 11.72 48.91 9.15 48.32 10.01 51.19 9.5
Note. MCS=Mental Health Functioning; PCS=Physical Health Functioning; GSE=General Self-Efficacy; PSS=Perceived Social Support'
PC=Precontemplation; C=Contemplation; PR=Preparation; A=Action; M=Maintenance; T=Termination; NS=Never Smoker.

62
TABLE 7a: ANOVAs: EXERCISE AND NON-HEALTH BEHAVIOR MODEL VARIABLES
95% Confidence
Interval
Dep.
Variable
Type III
Sum of
Squares df
Mean
Square F Sig.
Partial
Eta
Squared
Noncent.
Parameter
Observed
Power Mean
Std.
Error
Lower
Bound
Upper
Bound
MCS 3277.797 4 819.449 7.63 0.000 0.07 30.513 0.997 43.42 0.54 42.37 44.47
PCS 4597.831 4 1149.46 12.76 0.000 0.11 51.057 1.000 49.72 0.47 48.81 50.64
GSE 2823.699 4 705.925 7.49 0.000 0.07 29.958 0.997 49.19 0.50 48.21 50.18
PSS 651.126 4 162.781 1.64 0.164 0.02 6.55 0.504 49.76 0.51 48.75 50.77
Note. MCS = The Medical Outcome Study Short Form Mental Health Composite Score; PCS = The Medical Outcome Study Short Form Physical
Health Composite Score; GSE = The General Self-Efficacy Scale; PSS= The Multidimensional Scale of Perceived Social Support.

63
TABLE 7b: MEANS AND STANDARD DEVATIONS: EXERCISE AND NON-HEALTH BEHAVIOR MODEL
VARIABLES
PC C PR A M
n = 73 n = 61 n = 53 n = 91 n = 149
Measures M SD M SD M SD M SD M SD
MANOVA F = 6.21; df = 16, 1280; p = .000, partial η2 = .06
MCS 44.76 10.54 40.82 10.04 41.49 10.46 42.3 10.24 47.72 10.45
PCS 46.53 10.72 48.05 10.18 47.94 9.32 47.94 9.32 51.76 9.12
GSE 47.14 11.31 47.54 7.67 48.8 8.71 49.1 9.56 53.38 10.02
PSS 47.87 9.46 48.62 10.26 50.69 9.85 50.63 10.56 50.98 9.76
Note. MCS=Mental Health Functioning; PCS=Physical Health Functioning; GSE=General Self-
Efficacy; PSS=Perceived Social Support' PC=Precontemplation; C=Contemplation;
PR=Preparation; A=Action; M=Maintenance.
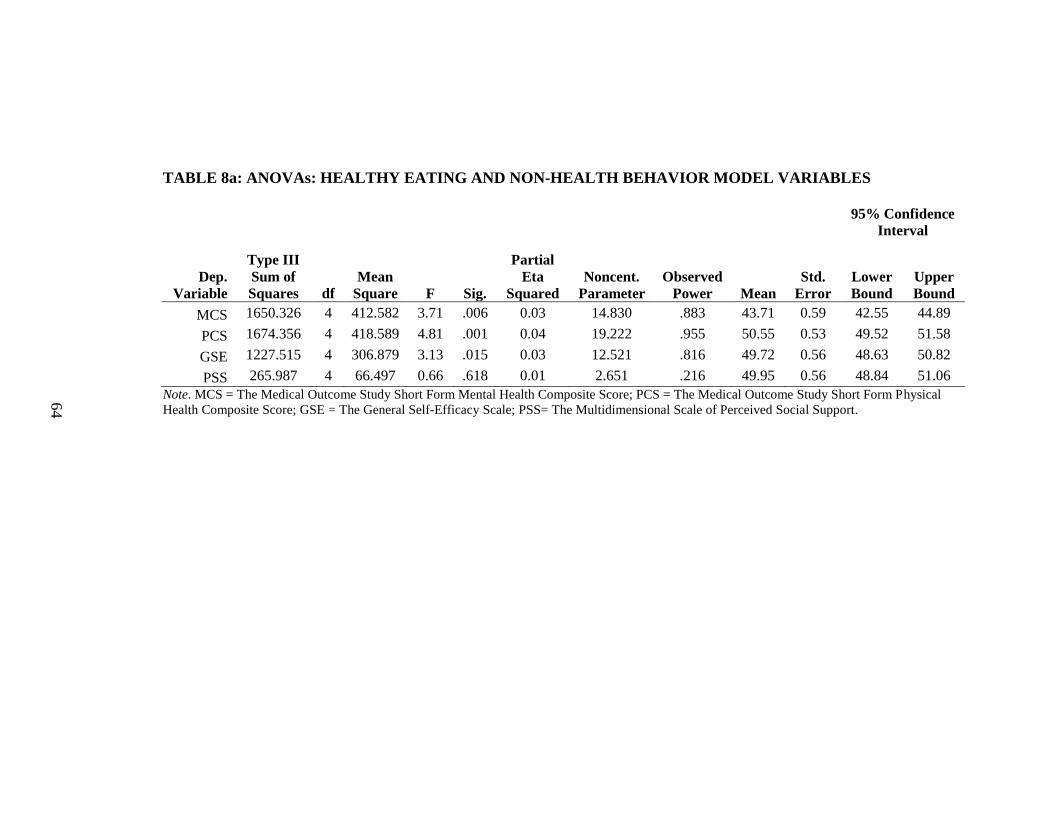
64
TABLE 8a: ANOVAs: HEALTHY EATING AND NON-HEALTH BEHAVIOR MODEL VARIABLES
95% Confidence
Interval
Dep.
Variable
Type III
Sum of
Squares df
Mean
Square F Sig.
Partial
Eta
Squared
Noncent.
Parameter
Observed
Power Mean
Std.
Error
Lower
Bound
Upper
Bound
MCS 1650.326 4 412.582 3.71 .006 0.03 14.830 .883 43.71 0.59 42.55 44.89
PCS 1674.356 4 418.589 4.81 .001 0.04 19.222 .955 50.55 0.53 49.52 51.58
GSE 1227.515 4 306.879 3.13 .015 0.03 12.521 .816 49.72 0.56 48.63 50.82
PSS 265.987 4 66.497 0.66 .618 0.01 2.651 .216 49.95 0.56 48.84 51.06
Note. MCS = The Medical Outcome Study Short Form Mental Health Composite Score; PCS = The Medical Outcome Study Short Form Physical
Health Composite Score; GSE = The General Self-Efficacy Scale; PSS= The Multidimensional Scale of Perceived Social Support.

65
TABLE 8b: MEANS AND STANDARD DEVIATIONS: HEALTHY EATING AND NON-HEALTH BEHAVIOR
MODEL VARIABLES
PC C PR A M
n = 117 n = 101 n = 77 n = 26 n = 106
Measures M SD M SD M SD M SD M SD
MANOVA F = 2.87; df = 16, 1280; p = .000, partial η2 = .03
MCS 45.71 10.48 42.15 11.4 42.85 10.12 41.3 10.20 46.59 10.16
PCS 51.85 9.05 47.54 10.03 50.78 8.62 49.73 9.69 52.84 9.37
GSE 48.65 10.22 49.92 8.55 48.82 9.9 48.42 9.57 52.82 10.79
PSS 48.87 9.39 50.84 10.18 49.95 9.46 49.49 10.90 50.61 10.68
Note. MCS=Mental Health Functioning; PCS=Physical Health Functioning; GSE=General Self-
Efficacy; PSS=Perceived Social Support; PC=Precontemplation; C=Contemplation;
PR=Preparation; A=Action; M=Maintenance.

66
TABLE 9. CORRELATIONS: NON-HEALTH BEHAVIOR MODEL
VARIABLES
MCS PCS GSE PSS
MCS 1 .162** .327** .307**
PCS .162** 1 .089 .086
GSE .327** .089 1 .312**
PSS .307** .086 .312** 1
Note.**. Correlation is significant at the .01 level (2-tailed). *. Correlation is significant at the
.05 level (2-tailed). MCS=The Medical Outcome Study Short Form Mental Health Composite
Score; PCS=The Medical Outcome Study Short Form Physical Health Composite Score;
GSE=The General Self-Efficacy Scale; PSS=Perceived Social Support.

67
TABLE 10. CORRELATIONS: HEALTH BEHAVIORS
SMK EX CALFAT FV EMOEAT
SMK 1 .117* .067 .076 .018
EX .117* 1 .315** .358** .081
CALFAT .067 .315** 1 .320** .116*
FV .076 .358** .320** 1 .050
EMOEAT .018 .081 .116* .050 1
Note.**. Correlation is significant at the .01 level (2-tailed). *. Correlation is significant at the .05 level
(2-tailed). SMK=Stage of Change for Smoking Cessation; EX=Stage of Change for Exercise;
CALFAT=Stage of Change for Calorie and Fat Intake; FV=Stage of Change for Fruit and Vegetable
Intake; EMOEAT=Stage of Change for Emotional Eating.

68
TABLE 11. DEMOGRAPHIC CHARACTERISTICS BY PRESENCE OF
MENTAL ILLNESS
Current or past mental illness
diagnosis
Yes No
N % N % χ2
Gender
Female 110 25.8 132 30.9 0.33
Male 75 17.6 109 25.5
Transgender 1 0.2 0 0.0
Age Group
18-24 24 5.6 27 6.3 0.65
25-34 44 10.3 60 14.1
35-44 34 8.0 49 11.5
45-54 53 12.4 68 15.9
55-64 31 7.3 37 8.7
Race
White 144 34.5 167 40.0 6.02
Non-White 20 4.8 33 7.9
Mixed 16 3.8 37 8.9
Sexual Orientation
Heterosexual or straight 169 39.6 227 53.2 1.73
Non-heterosexual/Non-straight 17 4.0 14 3.3
Marital Status
Single, never married 47 11.0 81 19.0 3.63
Married or domestic partnership/ civil union 106 24.8 125 29.3
Widowed/divorced/separated 33 7.7 35 8.2
Education Level
Some high school/High school diploma 51 12.0 49 11.5 5.95
Some college/Trade training/Associate's
degree 79 18.5 93 21.8
Bachelor's degree 40 9.4 72 16.9
Graduate degree 16 3.8 26 6.1
Health Insurance
Insured 164 38.3 211 49.4 Uninsured 22 5.2 30 7.0
Region of Residence
Northeast 47 11.0 57 13.3 4.91
Midwest 37 8.7 66 15.5
South 69 16.2 70 16.4
West 33 7.7 48 11.2

69
TABLE 12. PHYSICAL HEALTH CHARACTERISTICS BY PRESENCE OF
MENTAL ILLNESS
Current or past mental illness diagnosis
Yes No
N % N % χ2
Body Mass Index
Categories
Underweight 8 1.9 12 2.9 10.34*
Normal weight 49 11.7 95 22.7
Overweight 53 12.6 66 15.8
Obesity 72 17.2 64 15.3
Current Chronic
Medical Illness
Cancer 1 0.2 3 0.7 7.81
Cerebrovascular 5 1.2 0 0
Cardiovascular 17 4.0 17 4.0
Type I or II diabetes 12 2.8 16 3.7
No 151 35.4 205 48.0
Current Medical
Treatment
Yes 71 16.6 38 8.9 27.72***
No 115 26.9 203 47.5
Note.*p <. 05, ***p <. 001.

70
TABLE 13: STAGE OF CHANGE FREQUENCIES FOR EATING
BEHAVIORS
N %
Fruit and Vegetable Intake
Precontemplation 72 16.9
Contemplation 76 17.8
Preparation 79 18.5
Action 63 14.8
Maintenance 137 32.1
Emotional Eating
Precontemplation 29 6.8
Contemplation 41 9.6
Preparation 52 12.2
Action 71 16.6
Maintenance 60 14.1
Never 174 40.7
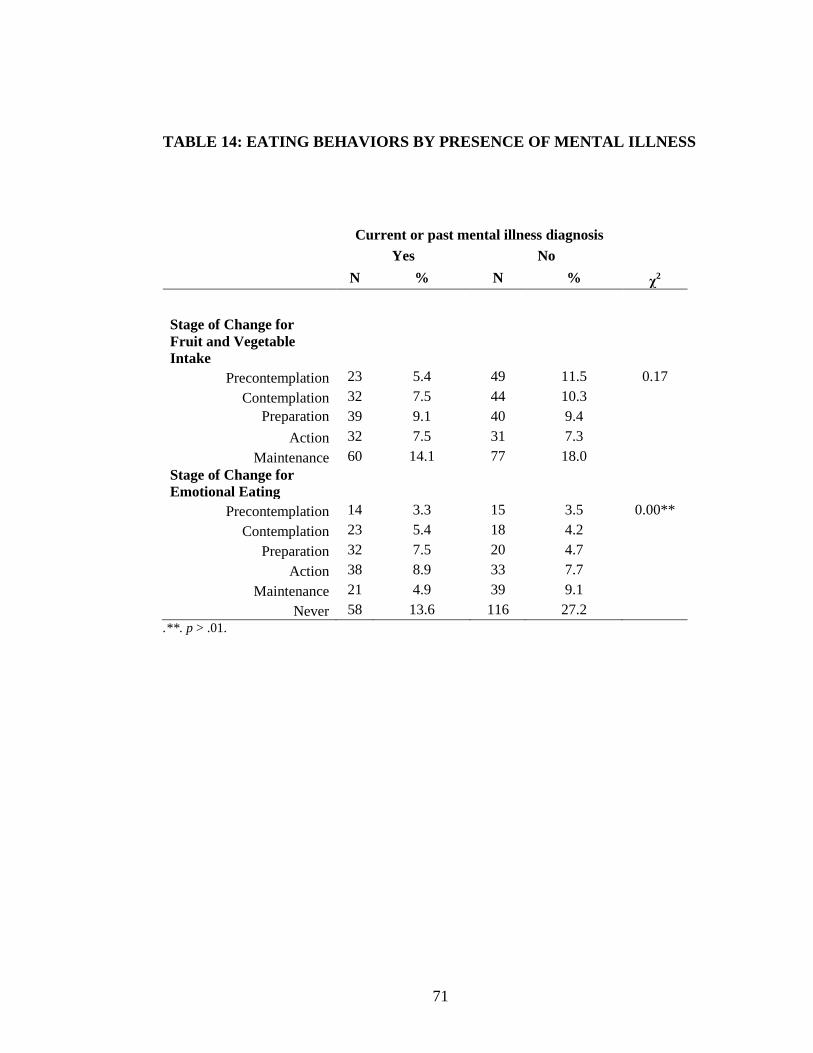
71
TABLE 14: EATING BEHAVIORS BY PRESENCE OF MENTAL ILLNESS
Current or past mental illness diagnosis
Yes No
N % N % χ2
Stage of Change for
Fruit and Vegetable
Intake
Precontemplation 23 5.4 49 11.5 0.17
Contemplation 32 7.5 44 10.3
Preparation 39 9.1 40 9.4
Action 32 7.5 31 7.3
Maintenance 60 14.1 77 18.0
Stage of Change for
Emotional Eating
Precontemplation 14 3.3 15 3.5 0.00**
Contemplation 23 5.4 18 4.2
Preparation 32 7.5 20 4.7
Action 38 8.9 33 7.7
Maintenance 21 4.9 39 9.1
Never 58 13.6 116 27.2
.**. p > .01.
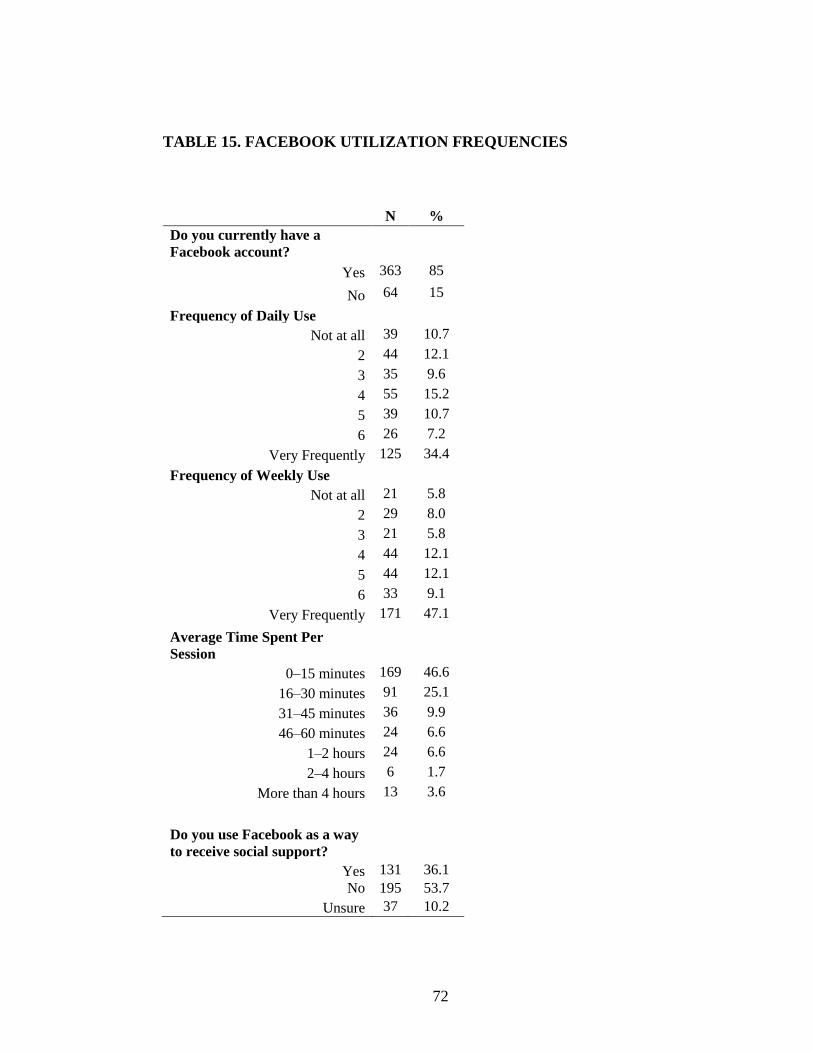
72
TABLE 15. FACEBOOK UTILIZATION FREQUENCIES
N %
Do you currently have a
Facebook account?
Yes 363 85
No 64 15
Frequency of Daily Use
Not at all 39 10.7
2 44 12.1
3 35 9.6
4 55 15.2
5 39 10.7
6 26 7.2
Very Frequently 125 34.4
Frequency of Weekly Use
Not at all 21 5.8
2 29 8.0
3 21 5.8
4 44 12.1
5 44 12.1
6 33 9.1
Very Frequently 171 47.1
Average Time Spent Per
Session
0–15 minutes 169 46.6
16–30 minutes 91 25.1
31–45 minutes 36 9.9
46–60 minutes 24 6.6
1–2 hours 24 6.6
2–4 hours 6 1.7
More than 4 hours 13 3.6
Do you use Facebook as a way
to receive social support?
Yes 131 36.1
No 195 53.7
Unsure 37 10.2

73
TABLE 16. FACEBOOK UTILIZATION BY PRESENCE OF MENTAL
ILLNESS
Current or past mental illness diagnosis
Yes No
N % N % χ2
Do you currently
have a Facebook
account?
Yes 164 38.4 199 46.6 0.11
No 22 5.2 42 9.8
Do you use
Facebook as a way
to receive social
support?
Yes 62 17.1 69 19.0 0.33
No 82 22.6 113 31.1
Unsure 20 5.5 17 4.7
In general, your
experiences on
Facebook make you
feel:
Better 62 17.1 57 15.7 0.02*
No different 94 25.9 139 38.3
Worse 8 2.2 3 0.8
Time spent per
session on Facebook
0–15 minutes 74 20.4 95 26.2 0.93
16–30 minutes 39 10.7 52 14.3
31–45 minutes 18 5.0 18 5.0
46–60 minutes 11 3.0 13 3.6
1–2 hours 12 3.3 12 3.3
More than 2 hours 10 2.8 9 2.5 .*. p > .05.

74
FIGURES
FIGURE 1. PROPOSED MEDIATIONAL MODEL
Standardized Parameter Estimates
PSSSMK, .12* GSESMK, -.08
PSSEX, .05 GSEEX, .22*
PSSCALFAT, .00 GSECALFAT, .13*
Note. MCS = The Medical Outcome Study Short Form Mental Health
Composite Score; PCS = The Medical Outcome Study Short Form Physical
Health Composite Score; GSE = The General Self-Efficacy Scale;
PSS= The Multidimensional Scale of Perceived Social Support,
CALFAT=Stage of Change for Calorie and Fat Intake, EX=Stage of Change
for Exercise. *significant at the α =.05 level. Blue arrows indicate covariance..
SMK
EX
CALFAT
PSS
GSE
PCS MCS
.16*
.31*
.03
.16*
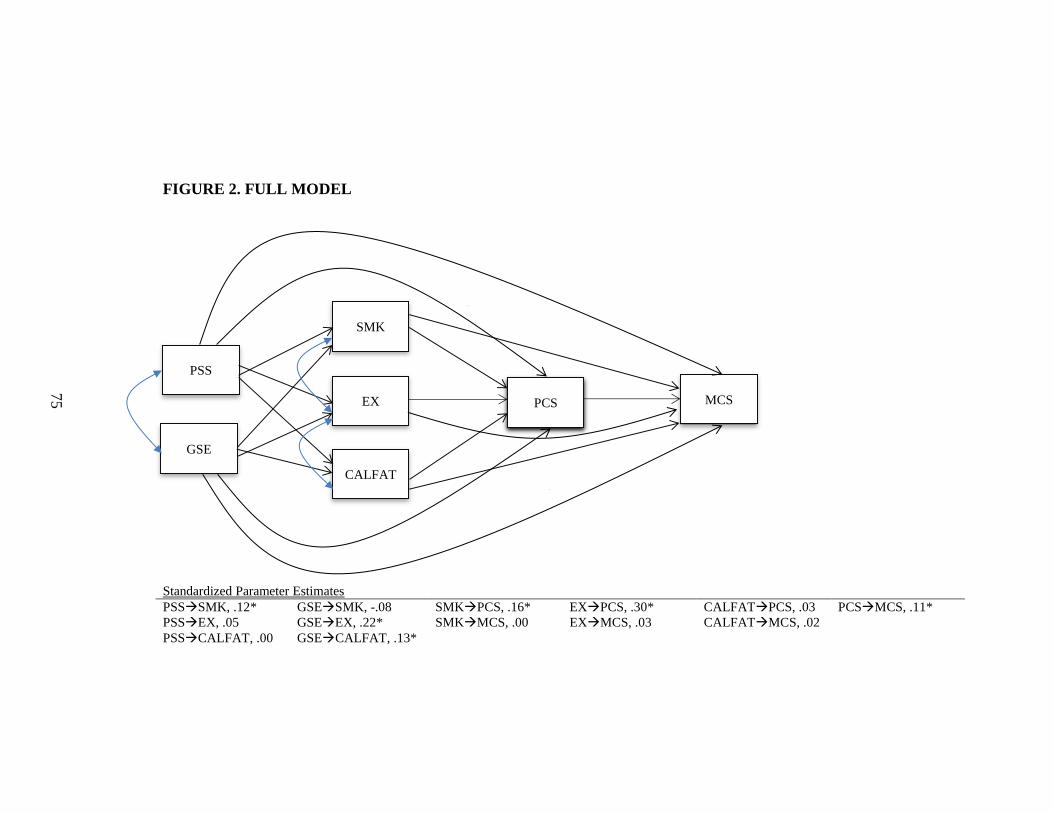
75
FIGURE 2. FULL MODEL
Standardized Parameter Estimates PSSSMK, .12* GSESMK, -.08 SMKPCS, .16* EXPCS, .30* CALFATPCS, .03 PCSMCS, .11*
PSSEX, .05 GSEEX, .22* SMKMCS, .00 EXMCS, .03 CALFATMCS, .02
PSSCALFAT, .00 GSECALFAT, .13*
SMK
EX
CALFAT
PSS
GSE
PCS MCS
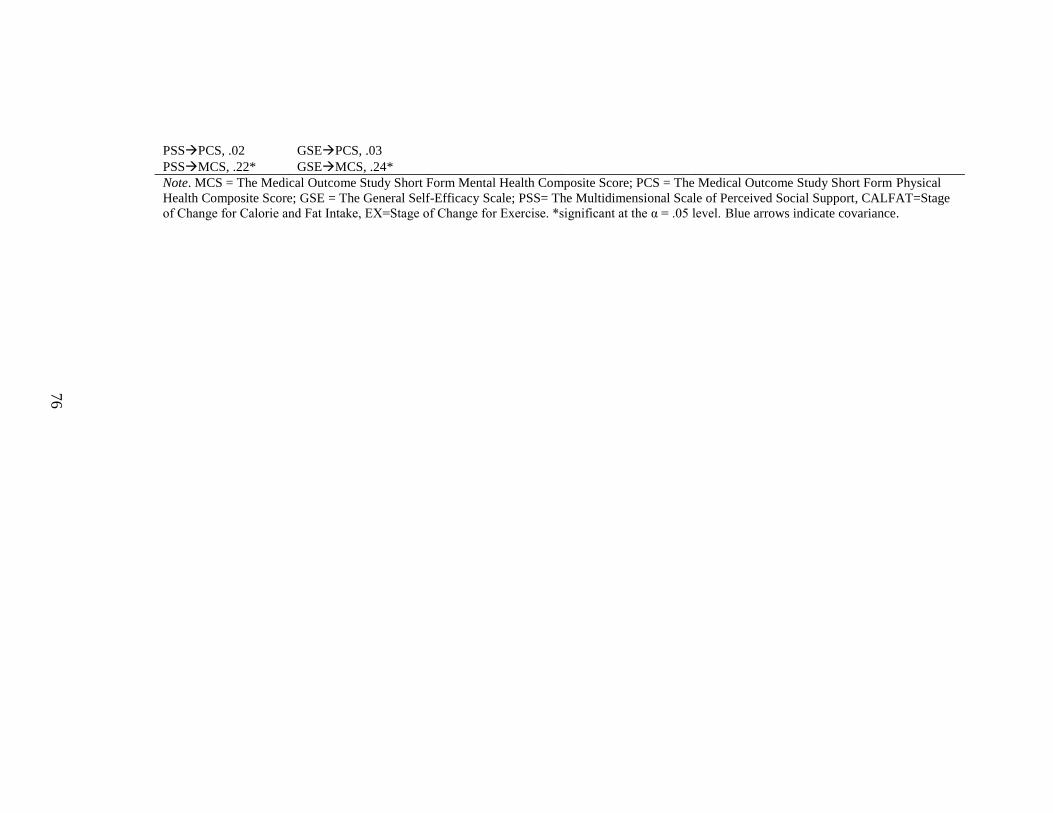
76
PSSPCS, .02 GSEPCS, .03
PSSMCS, .22* GSEMCS, .24* Note. MCS = The Medical Outcome Study Short Form Mental Health Composite Score; PCS = The Medical Outcome Study Short Form Physical
Health Composite Score; GSE = The General Self-Efficacy Scale; PSS= The Multidimensional Scale of Perceived Social Support, CALFAT=Stage
of Change for Calorie and Fat Intake, EX=Stage of Change for Exercise. *significant at the α = .05 level. Blue arrows indicate covariance.

77
FIGURE 3. DIRECT MODEL
Note. SMK=Stage of Change for Smoking Cessation; EX=Stage of Change for Exercise, CALFAT=
Stage of Change for Calorie and Fat Intake; PSS=Multidimensional Scale of Perceived Social Support
Total Score; GSE=The General Self-Efficacy Scale Total Score; MCS = The Medical Outcome Study Short
Form Mental Health Composite Score. *significant at the α = .05 level. Blue arrows indicate covariance.
MCS
SMK
EX
CALFAT
.00 11
.03 11
PSS
GSE
PCS
.02 11
.22* 11
.25* 11
.11* 11

78
APPENDICES

79
INFORMED CONSENT FORM
Title of Research Protocol: Mental health, health
behaviors, social support, self-
efficacy, and physical illness: An
integrative model
Principal Investigator: James O. Prochaska
CONSENT FORM FOR RESEARCH: ASSESSMENT BATTERY
You have been asked to take part in a research study described below. If you have
questions at any time, you may discuss them with principal investigator Dr. James
Prochaska. He may be reached at 401-874-2830.
1. Description of the Project: The purpose of this research is to test a statistical model
that looks at the relationships between three health behaviors, social support, self-
efficacy, and physical health and their relationship to mental health functioning
among adults.
2. What will be done: You are one of 400 people who will be asked to complete a
survey that asks about mental health, health behaviors, social support, self-
efficacy, physical health, and demographics. To participate, you must be at least
18 years-old and able to read and speak English. The survey is administered online
and should take approximately 20 minutes.
3. Risks or Discomforts: You might experience some discomfort discussing your
mental and physical health. There are no other known risks associated with
participating in this study.
4. Expected Benefits of the Study: You may not receive any direct benefit from taking
part in this study. Taking part in the study, however, may help others like you in the
future. Some people may find participation in this research informative and
personally beneficial.
5. Confidentiality: Participation in this project is completely confidential and
anonymous. Your information will not be shared with anyone except study
personnel working for the Cancer Prevention Research Center. Survey responses to
assessment questions will be stored by the secure database of the survey company
server (SurveyMonkey). We will not collect or store IP addresses. SurveyMonkey
makes no effort to identify individual responders by IP address and their privacy
practices are reviewed for compliance by TRUSTe. SurveyMonkey databases are
protected by passwords and database and network firewalls to protect survey

80
information. After online data collection is complete, the data will be transferred to a
secure server at URI which is firewall protected with restricted access to study
personnel through a virtual private network (VPN). These data will be destroyed
within ten years of the collection date.
6. Decision to Quit at Any Time: Taking part in this study is entirely voluntary. If you
wish, you may discontinue the survey at any time. You need not give any reasons for
discontinuation. Your decision about whether or not to complete the survey will in
no way affect on your relationship with the Cancer Prevention Research Center,
the personnel associated with this study, or employees of the University of Rhode
Island.
7. Rights and Complaints: If you are not satisfied with the way this study is
performed, or if you have questions about your rights as a research subject, you
may discuss your concerns with Dr. James Prochaska (401-874-2830),
anonymously, if you choose. In addition, you may contact the office of the Vice
President of Research, 70 Lower College Road, Suite 2, University of Rhode
Island, Kingston, RI 02882 (401-874-4328).
You have read this Consent Form and currently have no further questions concerning
your participation in this project. You understand that you may ask any additional
questions at any time and that your participation in this project is voluntary. By
participating in the project, you agree that your answers can be used without your
signed consent.
James O. Prochaska, Ph.D.
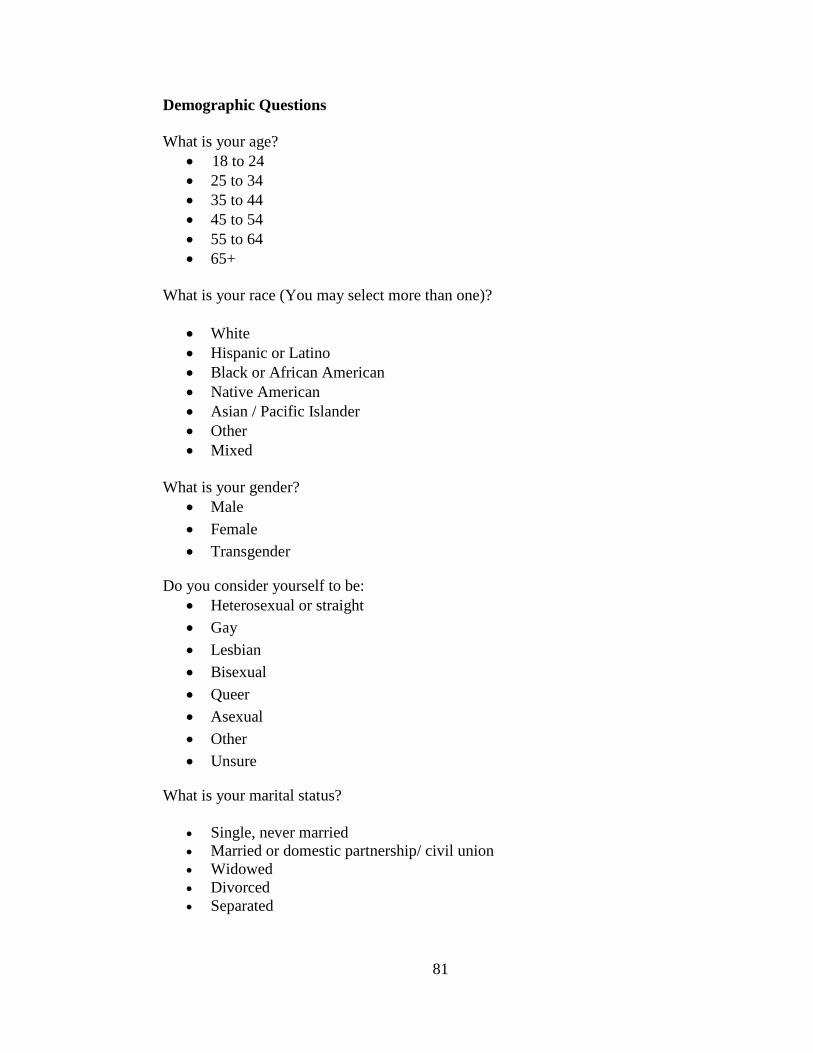
81
Demographic Questions
What is your age?
18 to 24
25 to 34
35 to 44
45 to 54
55 to 64
65+
What is your race (You may select more than one)?
White
Hispanic or Latino
Black or African American
Native American
Asian / Pacific Islander
Other
Mixed
What is your gender?
Male
Female
Transgender
Do you consider yourself to be:
Heterosexual or straight
Gay
Lesbian
Bisexual
Queer
Asexual
Other
Unsure
What is your marital status?
Single, never married
Married or domestic partnership/ civil union
Widowed
Divorced
Separated

82
What is the highest degree or level of school you have completed? If currently
enrolled, select highest degree received.
Some high school, no diploma
High school graduate, diploma or the equivalent (for example: GED)
Some college credit, no degree
Trade/technical/vocational training
Associate degree
Bachelor’s degree
Master’s degree
Professional degree
Doctorate degree
What is your health insurance status?
Private Plan
Employment-based Plan
Direct Purchase
Government Plan
Medicare
Medicaid
Military Healthcare
Uninsured
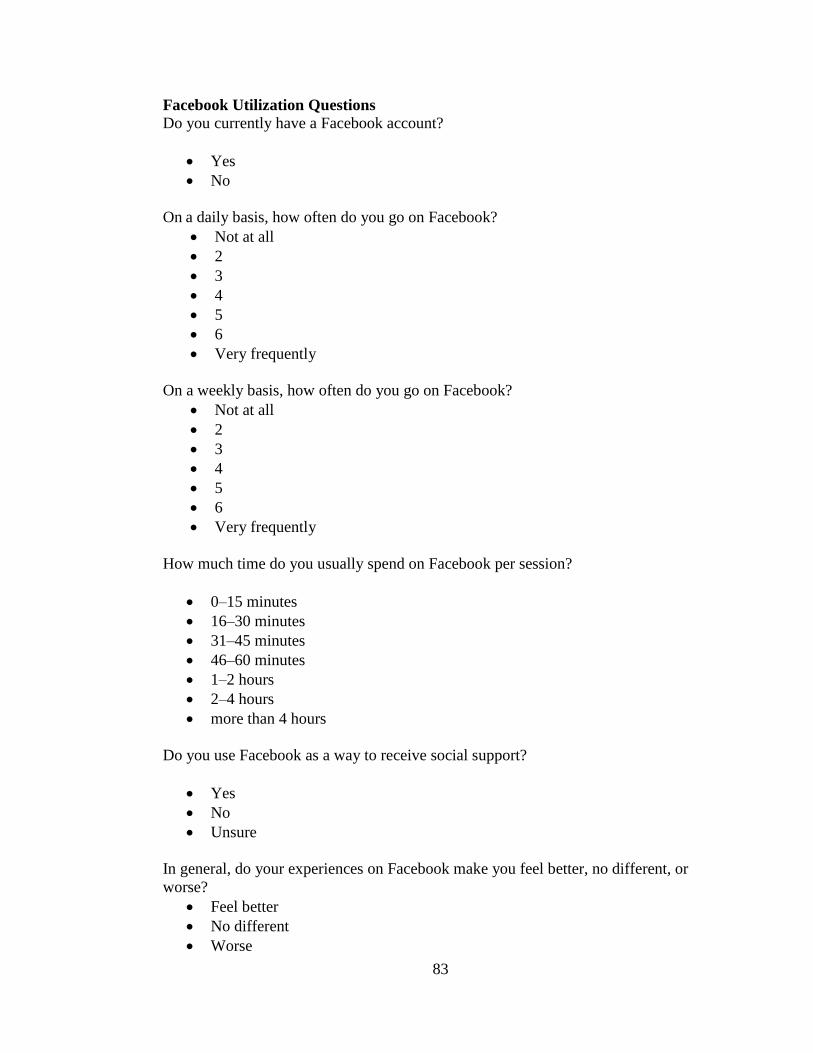
83
Facebook Utilization Questions
Do you currently have a Facebook account?
Yes
No
On a daily basis, how often do you go on Facebook?
Not at all
2
3
4
5
6
Very frequently
On a weekly basis, how often do you go on Facebook?
Not at all
2
3
4
5
6
Very frequently
How much time do you usually spend on Facebook per session?
0–15 minutes
16–30 minutes
31–45 minutes
46–60 minutes
1–2 hours
2–4 hours
more than 4 hours
Do you use Facebook as a way to receive social support?
Yes
No
Unsure
In general, do your experiences on Facebook make you feel better, no different, or
worse?
Feel better
No different
Worse
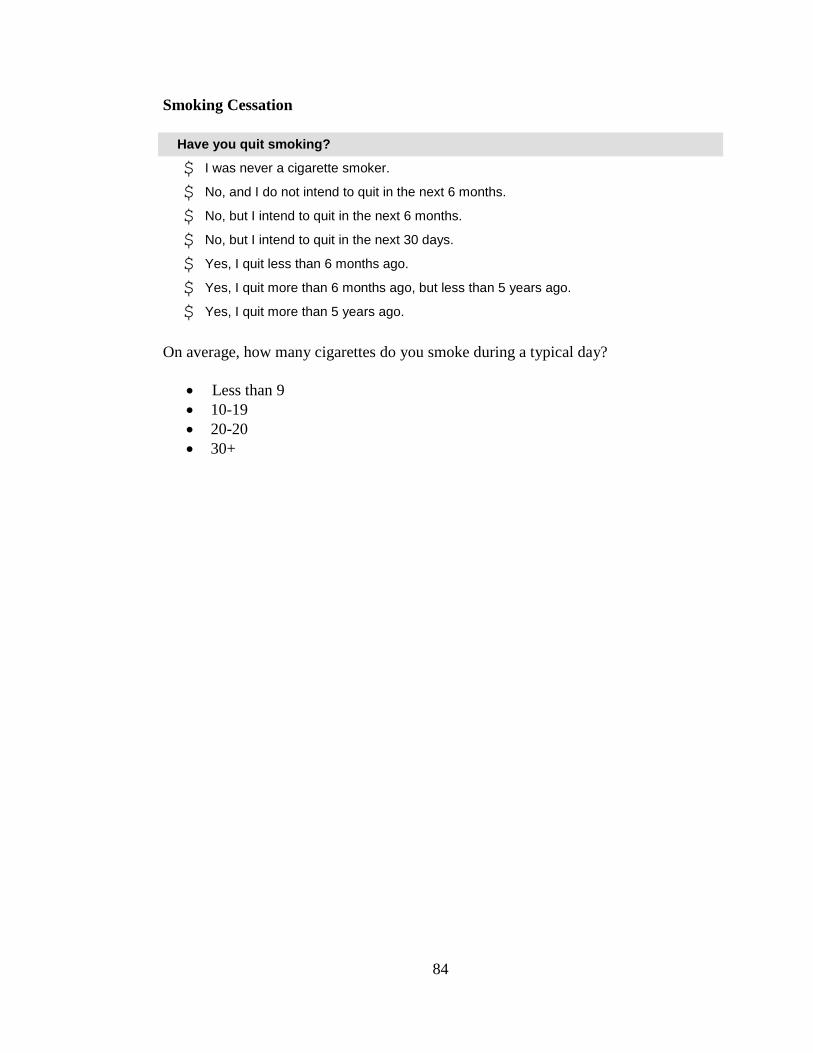
84
Smoking Cessation
Have you quit smoking?
$ I was never a cigarette smoker.
$ No, and I do not intend to quit in the next 6 months.
$ No, but I intend to quit in the next 6 months.
$ No, but I intend to quit in the next 30 days.
$ Yes, I quit less than 6 months ago.
$ Yes, I quit more than 6 months ago, but less than 5 years ago.
$ Yes, I quit more than 5 years ago.
On average, how many cigarettes do you smoke during a typical day?
Less than 9
10-19
20-20
30+
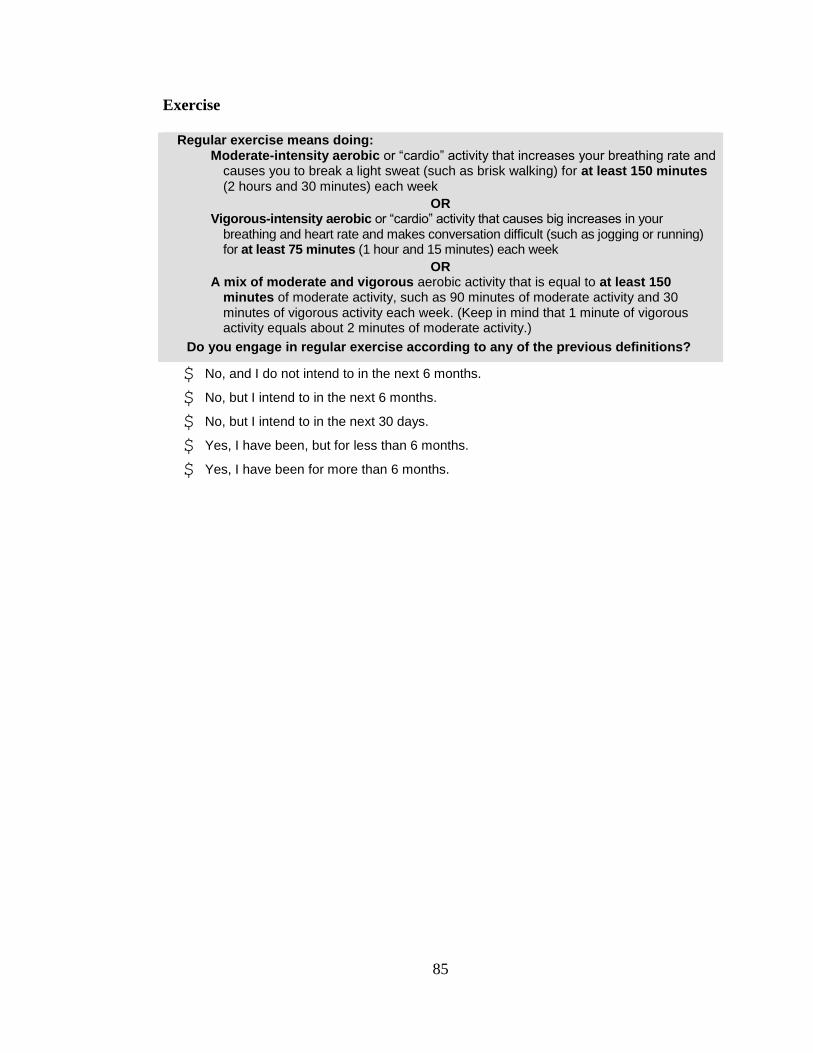
85
Exercise
Regular exercise means doing: Moderate-intensity aerobic or “cardio” activity that increases your breathing rate and
causes you to break a light sweat (such as brisk walking) for at least 150 minutes (2 hours and 30 minutes) each week
OR Vigorous-intensity aerobic or “cardio” activity that causes big increases in your
breathing and heart rate and makes conversation difficult (such as jogging or running) for at least 75 minutes (1 hour and 15 minutes) each week
OR A mix of moderate and vigorous aerobic activity that is equal to at least 150
minutes of moderate activity, such as 90 minutes of moderate activity and 30 minutes of vigorous activity each week. (Keep in mind that 1 minute of vigorous activity equals about 2 minutes of moderate activity.)
Do you engage in regular exercise according to any of the previous definitions?
$ No, and I do not intend to in the next 6 months.
$ No, but I intend to in the next 6 months.
$ No, but I intend to in the next 30 days.
$ Yes, I have been, but for less than 6 months.
$ Yes, I have been for more than 6 months.

86
Godin Leisure-Time Exercise Questionnaire
1) During a typical 7-Day period (a week), how many times on the average do you do
the following kinds of exercise for more than 15 minutes during your free time (write
on each line the appropriate number)?
a) Strenuous exercise (heart beats rapidly)
(e.g. running, jogging, hockey, football, soccer, squash, basketball, cross country
skiing, judo, roller skating, vigorous swimming, vigorous long distance bicycling)
Times per Week _____
b) Moderate exercise (not exhausting)
(e.g., fast walking, baseball, tennis, easy bicycling, volleyball, badminton, easy
swimming, alpine skiing, popular and folk dancing)
Times per Week _____
c) Mild exercise (minimal effort)
(e.g., yoga, archery, fishing from river bank, bowling, horseshoes, golf, snow-
mobiling, easy walking)
Times per Week _____
2) During a typical 7-Day period (a week), in your leisure time, how often do you
engage in any regular activity long enough to work up a sweat (heart beats rapidly)?
Often
Sometimes
Never/Rarely
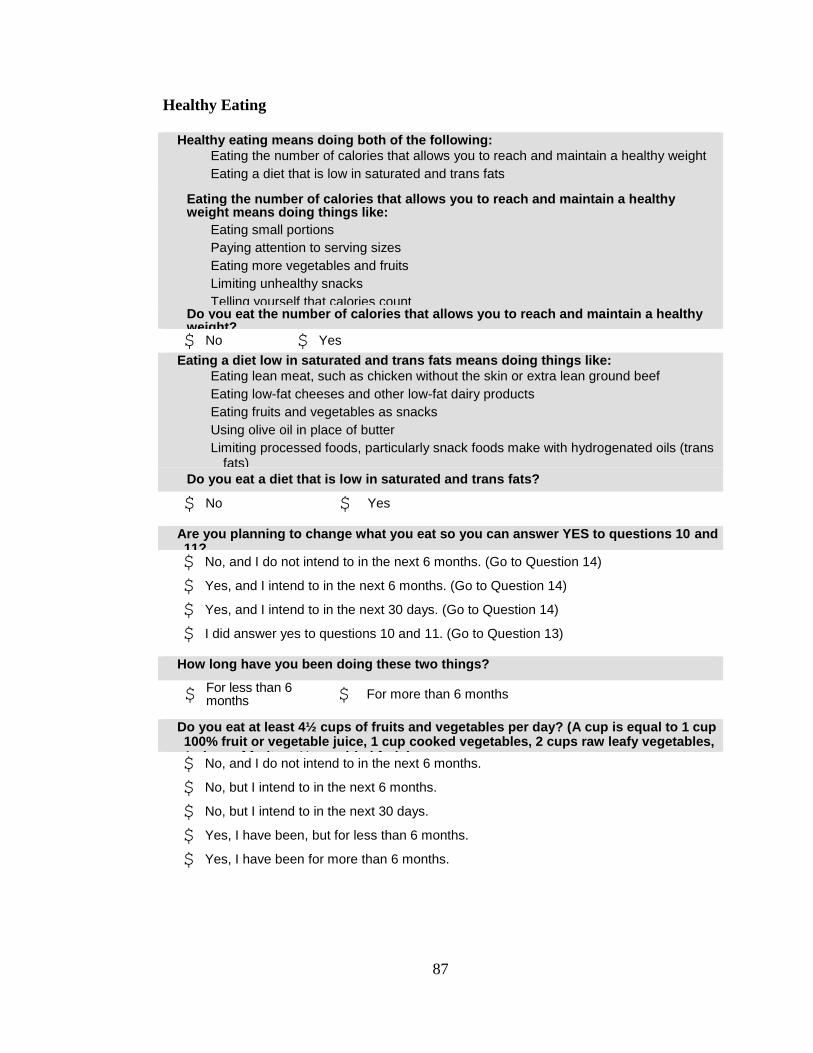
87
Healthy Eating
Healthy eating means doing both of the following:
Eating the number of calories that allows you to reach and maintain a healthy weight
Eating a diet that is low in saturated and trans fats
Eating the number of calories that allows you to reach and maintain a healthy weight means doing things like:
Eating small portions
Paying attention to serving sizes
Eating more vegetables and fruits
Limiting unhealthy snacks
Telling yourself that calories count
Do you eat the number of calories that allows you to reach and maintain a healthy weight?
$ No $ Yes
Eating a diet low in saturated and trans fats means doing things like:
Eating lean meat, such as chicken without the skin or extra lean ground beef
Eating low-fat cheeses and other low-fat dairy products
Eating fruits and vegetables as snacks
Using olive oil in place of butter
Limiting processed foods, particularly snack foods make with hydrogenated oils (trans fats)
Do you eat a diet that is low in saturated and trans fats?
$ No $ Yes
Are you planning to change what you eat so you can answer YES to questions 10 and 11?
$ No, and I do not intend to in the next 6 months. (Go to Question 14)
$ Yes, and I intend to in the next 6 months. (Go to Question 14)
$ Yes, and I intend to in the next 30 days. (Go to Question 14)
$ I did answer yes to questions 10 and 11. (Go to Question 13)
How long have you been doing these two things?
$
For less than 6 months $ For more than 6 months
Do you eat at least 4½ cups of fruits and vegetables per day? (A cup is equal to 1 cup 100% fruit or vegetable juice, 1 cup cooked vegetables, 2 cups raw leafy vegetables, 1 piece of fruit, or ½ cup dried fruit.)
$ No, and I do not intend to in the next 6 months.
$ No, but I intend to in the next 6 months.
$ No, but I intend to in the next 30 days.
$ Yes, I have been, but for less than 6 months.
$ Yes, I have been for more than 6 months.

88
One cup of fruit is equal to:
8 large strawberries
1 cup of 100% fruit juice
2 canned peach halves
a piece of fruit (such as an apple, orange, banana, or peach)
a handful (½ cup) of dried fruit like raisins or apricots
How many cups of fruits do you eat in a typical day?
0
1
2
3
4
5
6
7
8
9
10
11
12
13
14
15 and more
One cup of cooked or raw vegetables is equal to:
12 baby carrots
1 cup of 100% vegetable juice
1 large sweet potato
1 large ear of corn
a large plate of raw, leafy greens such as spinach or lettuce
How many cups of vegetables do you eat in a typical day?
0
1
2
3
4
5
6
7
8

89
9
10
11
12
13
14
15 and more
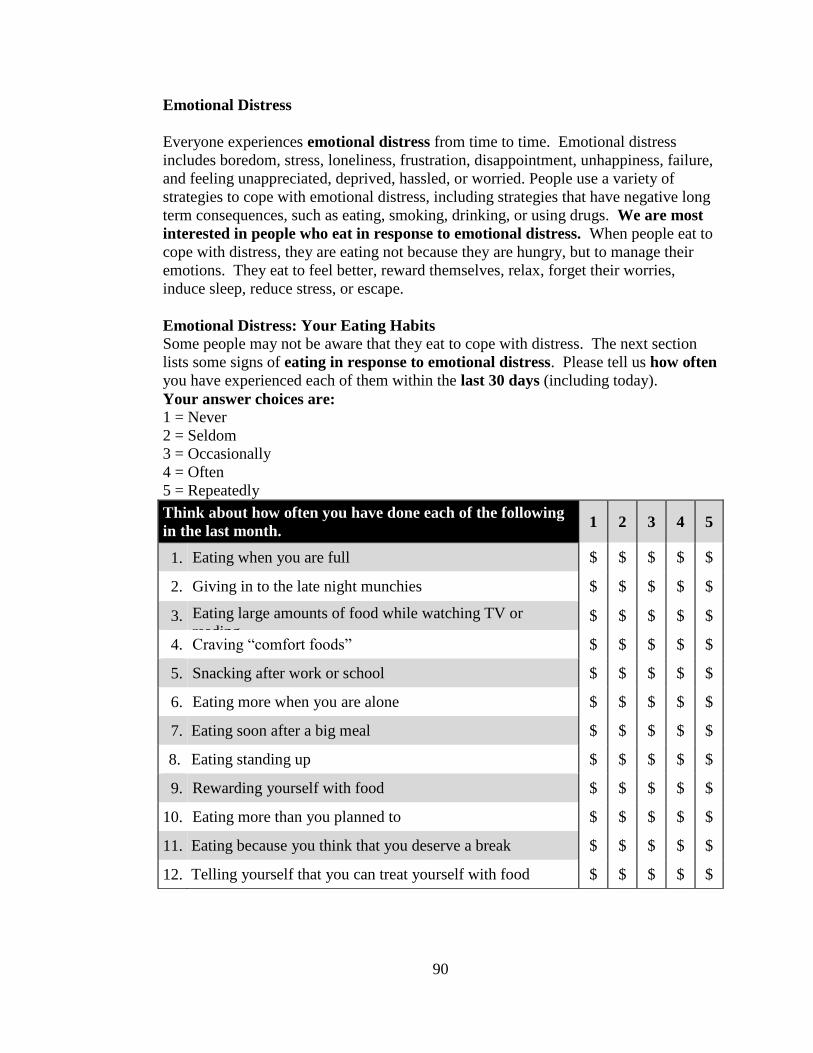
90
Emotional Distress
Everyone experiences emotional distress from time to time. Emotional distress
includes boredom, stress, loneliness, frustration, disappointment, unhappiness, failure,
and feeling unappreciated, deprived, hassled, or worried. People use a variety of
strategies to cope with emotional distress, including strategies that have negative long
term consequences, such as eating, smoking, drinking, or using drugs. We are most
interested in people who eat in response to emotional distress. When people eat to
cope with distress, they are eating not because they are hungry, but to manage their
emotions. They eat to feel better, reward themselves, relax, forget their worries,
induce sleep, reduce stress, or escape.
Emotional Distress: Your Eating Habits
Some people may not be aware that they eat to cope with distress. The next section
lists some signs of eating in response to emotional distress. Please tell us how often
you have experienced each of them within the last 30 days (including today).
Your answer choices are: 1 = Never
2 = Seldom
3 = Occasionally
4 = Often
5 = Repeatedly
Think about how often you have done each of the following
in the last month. 1 2 3 4 5
1. Eating when you are full $ $ $ $ $
2. Giving in to the late night munchies $ $ $ $ $
3. Eating large amounts of food while watching TV or
reading $ $ $ $ $
4. Craving “comfort foods” $ $ $ $ $
5. Snacking after work or school $ $ $ $ $
6. Eating more when you are alone $ $ $ $ $
7. Eating soon after a big meal $ $ $ $ $
8. Eating standing up $ $ $ $ $
9. Rewarding yourself with food $ $ $ $ $
10. Eating more than you planned to $ $ $ $ $
11. Eating because you think that you deserve a break $ $ $ $ $
12. Telling yourself that you can treat yourself with food $ $ $ $ $

91
1. Do you rely on eating as a way to cope with emotional distress?
$ YES, and I do NOT intend to stop in the next 6 months
$ YES, and I intend to stop in the next 6 months
$ YES, and I intend to stop in the next 30 days
$ NO, but I have in the past 6 months
$ NO, and I have NOT in the past 6 months
$ NO, and I never have

92
The Multidimensional Scale of Perceived Social Support
We are interested in how you feel about the following statements.
Read each statement carefully. Indicate how you feel about each statement.
Circle the “1” if you Very Strongly Disagree
Circle the “2” if you Strongly Disagree
Circle the “3” if you Mildly Disagree
Circle the “4” if you are Neutral
Circle the “5” if you Mildly Agree
Circle the “6” if you Strongly Agree
Circle the “7” if you Very Strongly Agree
1. There is a special person who is around when I am in need. 1 2 3 4 5 6 7
2. There is a special person with whom I can share my joys and sorrows. 1 2 3 4 5 6 7
3. My family really tries to help me. 1 2 3 4 5 6 7
4. I get the emotional help and support I need from my family. 1 2 3 4 5 6 7
5. I have a special person who is a real source of comfort to me. 1 2 3 4 5 6 7
6. My friends really try to help me. 1 2 3 4 5 6 7
7. I can count on my friends when things go wrong. 1 2 3 4 5 6 7
8. I can talk about my problems with my family. 1 2 3 4 5 6 7
9. I have friends with whom I can share my joys and sorrows. 1 2 3 4 5 6 7
10. There is a special person in my life who cares about my feelings. 1 2 3 4 5 6 7
11. My family is willing to help me make decisions. 1 2 3 4 5 6 7
12. I can talk about my problems with my friends. 1 2 3 4 5 6 7
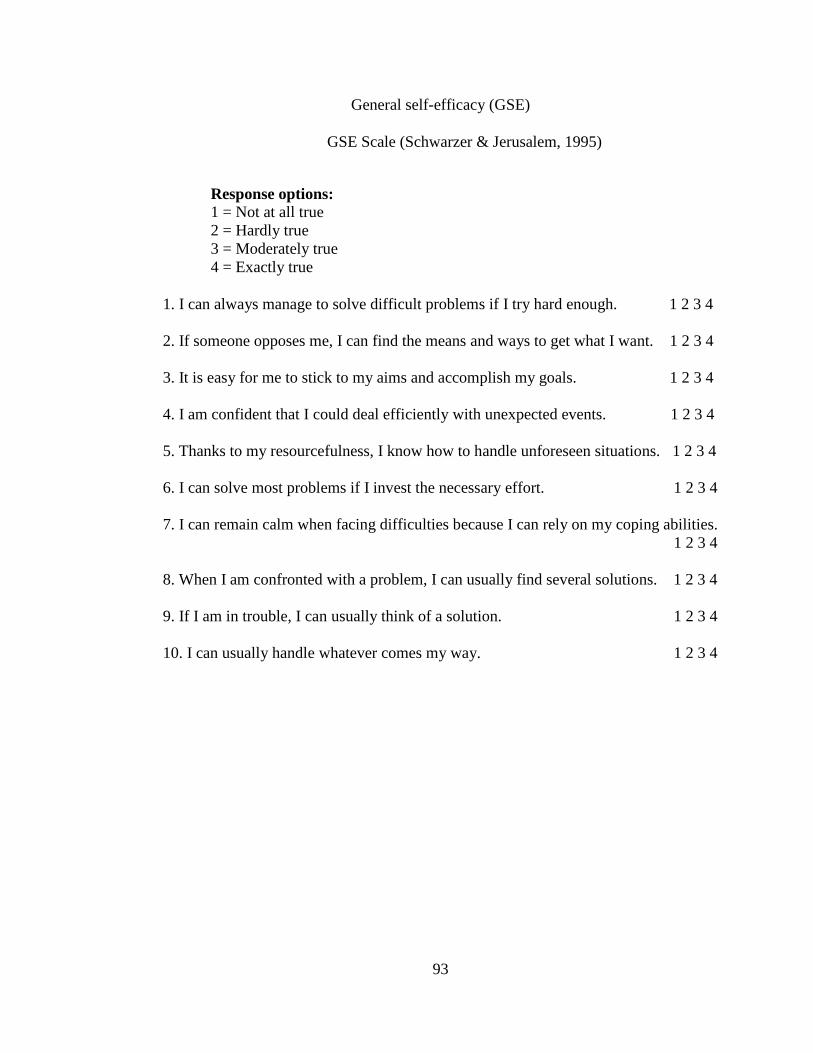
93
General self-efficacy (GSE)
GSE Scale (Schwarzer & Jerusalem, 1995)
Response options:
1 = Not at all true
2 = Hardly true
3 = Moderately true
4 = Exactly true
1. I can always manage to solve difficult problems if I try hard enough. 1 2 3 4
2. If someone opposes me, I can find the means and ways to get what I want. 1 2 3 4
3. It is easy for me to stick to my aims and accomplish my goals. 1 2 3 4
4. I am confident that I could deal efficiently with unexpected events. 1 2 3 4
5. Thanks to my resourcefulness, I know how to handle unforeseen situations. 1 2 3 4
6. I can solve most problems if I invest the necessary effort. 1 2 3 4
7. I can remain calm when facing difficulties because I can rely on my coping abilities.
1 2 3 4
8. When I am confronted with a problem, I can usually find several solutions. 1 2 3 4
9. If I am in trouble, I can usually think of a solution. 1 2 3 4
10. I can usually handle whatever comes my way. 1 2 3 4

94
The Medical Outcome Study Short Form (SF-36)
Your Health and Well-Being
This survey asks for your views about your health. This
information will help keep track of how you feel and how well you
are able to do your usual activities. Thank you for completing this
survey!
For each of the following questions, please mark an in the one box
that best describes your answer.
1. In general, would you say your health is:
Excellent Very
good
Good Fair Poor
1 2 3 4 5
2. Compared to one year ago, how would you rate your health in
general now?
Much better
now than
one year
ago
Somewhat
better
now than one
year ago
About the
same as
one year
ago
Somewhat worse
now than one
year ago
Much
worse
now than
one year
ago
1 2 3 4 5
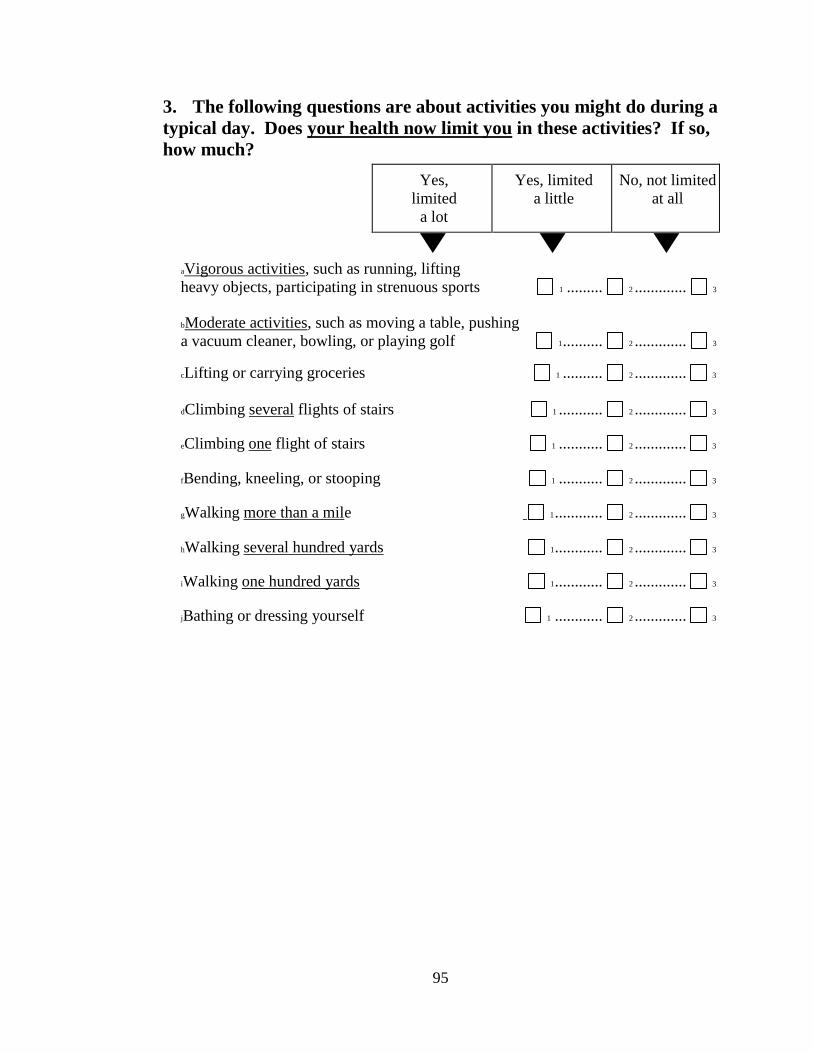
95
3. The following questions are about activities you might do during a
typical day. Does your health now limit you in these activities? If so,
how much?
Yes,
limited
a lot
Yes, limited
a little
No, not limited
at all
aVigorous activities, such as running, lifting
heavy objects, participating in strenuous sports 1 ......... 2 ............. 3
bModerate activities, such as moving a table, pushing
a vacuum cleaner, bowling, or playing golf 1 .......... 2 ............. 3
cLifting or carrying groceries 1 .......... 2 ............. 3
dClimbing several flights of stairs 1 ........... 2 ............. 3
eClimbing one flight of stairs 1 ........... 2 ............. 3
fBending, kneeling, or stooping 1 ........... 2 ............. 3
gWalking more than a mile 1 ............ 2 ............. 3
hWalking several hundred yards 1 ............ 2 ............. 3
iWalking one hundred yards 1 ............ 2 ............. 3
jBathing or dressing yourself 1 ............ 2 ............. 3

96
4. During the past 4 weeks, how much of the time have you had any
of the following problems with your work or other regular daily
activities as a result of your physical health?
All of
the time
Most of
the time
Some of
the time
A little of
the time
None of
the time
aCut down on the amount of
time you spent on work or
other activities ......................................... 1 ............. 2 ............. 3 .............. 4 ............. 5
bAccomplished less than you
would like ................................................ 1 ............. 2 ............. 3 .............. 4 ............. 5
cWere limited in the kind of
work or other activities ........................... 1 ............. 2 ............. 3 .............. 4 ............. 5
dHad difficulty performing the
work or other activities (for
example, it took extra effort)................... 1 ............. 2 ............. 3 .............. 4 ............. 5
5. During the past 4 weeks, how much of the time have you had any
of the following problems with your work or other regular daily
activities as a result of any emotional problems (such as feeling
depressed or anxious)?
All of
the time
Most of
the time
Some of
the time
A little of
the time
None of
the time
aCut down on the amount of
time you spent on work or
other activities ......................................... 1 ............. 2 ............. 3 .............. 4 ............. 5
bAccomplished less than you
would like ................................................ 1 ............. 2 ............. 3 .............. 4 ............. 5
cDid work or other activities
less carefully than usual .......................... 1 ............. 2 ............. 3 .............. 4 ............. 5

97
6. During the past 4 weeks, to what extent has your physical health
or emotional problems interfered with your normal social activities
with family, friends, neighbors, or groups?
Not at all Slightly Moderately Quite a bit Extremely
1 2 3 4 5
7. How much bodily pain have you had during the past 4 weeks?
None Very mild Mild Moderate Severe Very severe
1 2 3 4 5 6
8. During the past 4 weeks, how much did pain interfere with your
normal work (including both work outside the home and
housework)?
Not at all A little bit Moderately Quite a bit Extremely
1 2 3 4 5
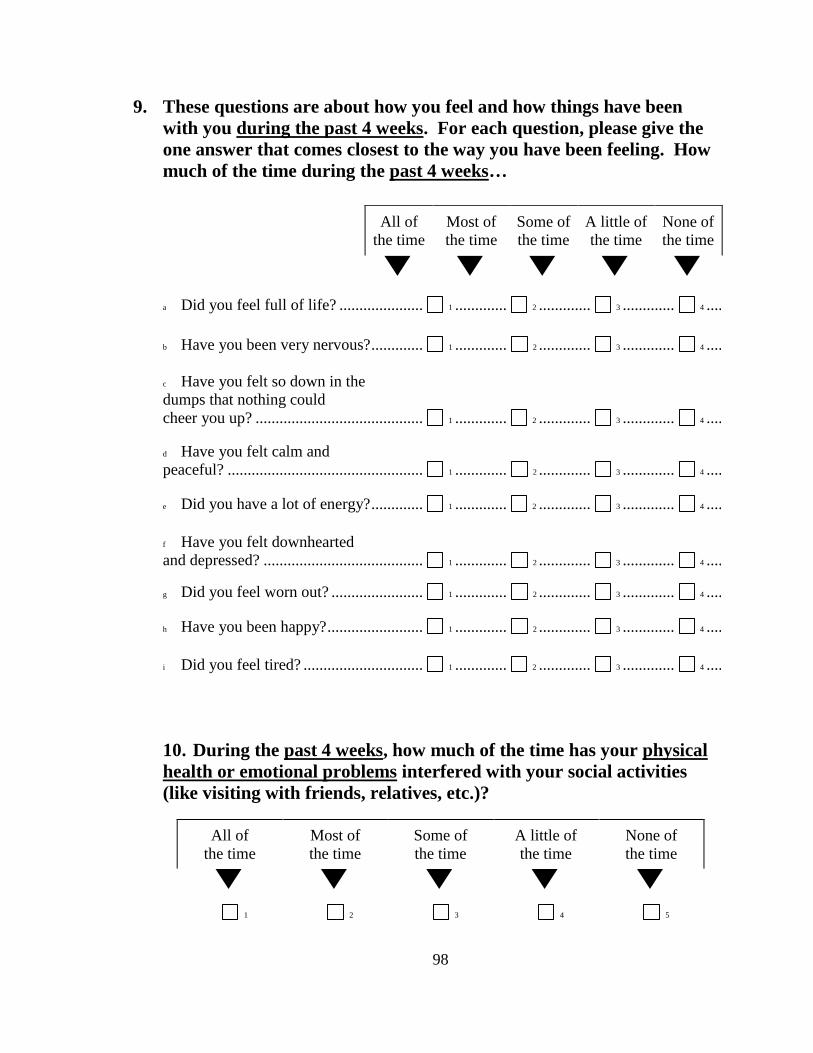
98
9. These questions are about how you feel and how things have been
with you during the past 4 weeks. For each question, please give the
one answer that comes closest to the way you have been feeling. How
much of the time during the past 4 weeks…
10. During the past 4 weeks, how much of the time has your physical
health or emotional problems interfered with your social activities
(like visiting with friends, relatives, etc.)?
All of
the time
Most of
the time
Some of
the time
A little of
the time
None of
the time
1 2 3 4 5
All of
the time
Most of
the time
Some of
the time
A little of
the time
None of
the time
a Did you feel full of life? ..................... 1 ............. 2 ............. 3 ............. 4 ............. 5
b Have you been very nervous? ............. 1 ............. 2 ............. 3 ............. 4 ............. 5
c Have you felt so down in the
dumps that nothing could
cheer you up? .......................................... 1 ............. 2 ............. 3 ............. 4 ............. 5
d Have you felt calm and
peaceful? ................................................. 1 ............. 2 ............. 3 ............. 4 ............. 5
e Did you have a lot of energy? ............. 1 ............. 2 ............. 3 ............. 4 ............. 5
f Have you felt downhearted
and depressed? ........................................ 1 ............. 2 ............. 3 ............. 4 ............. 5
g Did you feel worn out? ....................... 1 ............. 2 ............. 3 ............. 4 ............. 5
h Have you been happy? ........................ 1 ............. 2 ............. 3 ............. 4 ............. 5
i Did you feel tired? .............................. 1 ............. 2 ............. 3 ............. 4 ............. 5

99
11. How TRUE or FALSE is each of the following statements for
you?
Definitely
true
Mostly
true
Don’t
know
Mostly
false
Definitely
false
aI seem to get sick a little
easier than other people........................... 1 ............. 2 ............. 3 .............. 4 ............. 5
bI am as healthy as
anybody I know ....................................... 1 ............. 2 ............. 3 .............. 4 ............. 5
cI expect my health to
get worse ................................................. 1 ............. 2 ............. 3 .............. 4 ............. 5
dMy health is excellent ............................ 1 ............. 2 ............. 3 .............. 4 ............. 5

100
Mental Health Questions
Have you been diagnosed with any of the following mental health conditions by a
health professional in the past or currently? (You may select more than one)
Anxiety
Depression
Substance abuse/dependence
Bipolar disorder
Schizophrenia
Attention Deficit/ Hyperactivity Disorder
Eating disorder
Panic
Post-traumatic stress disorder
Personality disorder
Obsessive Compulsive disorder
Other
Never
Have you ever been prescribed medication for a mental health condition such as
anxiety or depression?
Yes
No
Do you currently have prescription(s) for any of the following mental health
medications? (You may select more than one category)
Anti-anxiety (e.g. Klonopin, Ativan, Valium, Xanax etc.)
Antidepressants (e.g. Celexa, Cymbalta, Effexor, Lexapro, Luvox, Paxil,
Prozac, Remeron, Wellbutrin etc.)
Typical antipsychotics (e.g. Thorazine, Haldol, Clozaril etc.)
Atypical antipsychotics (e.g. Risperdal, Zyprexa, Seroquel, Geodon, Abilify,
Invega)
Mood stabilizers/ Anticonvulsants (e.g. Depakote, Lamictal, Neurontin,
Tegretol, Topamax)
Stimulants (e.g. Ritalin, Concerta, Adderall, Dexedrine etc.)
No

101
Physical Health Questions
Do you currently suffer from any of the following medical conditions? (You may
select more than one)
Cancer (e.g. breast, lung, colon etc.)
Cerebrovascular disease (e.g. stroke)
Cardiovascular disease (e.g. coronary heart disease, high blood pressure or
hypertension, peripheral heart disease)
Type 1 or 2 diabetes
No
Do you receive medical treatment (e.g. medication) for any of the medical conditions
you previously indicated?
Yes
No
What is your height? (feet and inches)
What is your weight? (pounds)
102
BIBLIOGRAPHY
Alegria, M., Jackson, J. S., & Kessler, R. C. (2003). National Comorbidity Survey
Replication (NCS-R), 2001-2003. Ann Arbor: Interuniversity Consortium for
Political and Social Research.
American Psychological Association. (2008). Presidential task force on integrated
health care for an aging population. Blueprint for change: Achieving integrated
health care for an aging population. Washington, DC: American
Psychological Association. Retrieved from
https://www.apa.org/pi/aging/programs/integrated/integrated-healthcare-
report.pdf
Angell, M. (2011, June 11). The epidemic of mental illness: Why? Retrieved from
http://www.nybooks.com/articles/archives/2011/jun/23/epidemic-mental-
illness-why/?page=1
Appleton, K. M., Rogers, P. J, Ness, A. R. (2010). Updated systematic review and
meta-analysis of the effects of n-3 long-chain polyunsaturated fatty acids on
depressed mood. American Journal of Clinical Nutrition, 91, 757-70. doi:
10.3945/ajcn.2009.28313
Aschbrenner, K. A., Mueser, K. T., Bartels, S. J., & Pratt, S. I. (2013). Perceived
social support for diet and exercise among persons with serious mental illness
enrolled in a healthy lifestyle intervention. Psychiatric Rehabilitation Journal,
36, 65-71. doi: 10.1037/h0094973.
Baker, A., Richmond, R., Haile, M., et a.l (2006). A randomized controlled trial of a
103
smoking cessation intervention among people with a psychotic disorder.
American Journal of Psychiatry, 163, 1934–1942
Bandura, A. (2004). Health promotion and social cognitive means. Health Education
and Behavior, 31, 143-164.
Bandura, A. (1977). Self-efficacy: Toward a unifying theory of behavioral change.
Psychological Review, 84, 191-215.
Baranowski, T., Watson, K., Missaghian, M., Broadfoot, A., Cullen, K., Nicklas,
T., Fisher, .J, Baranowski, J., & O'Donnell, S. Social support is a primary
influence on home fruit, 100% juice, and vegetable availability. (2008).
Journal of the American Dietetic Association, 108, 1231-5. doi:
10.1016/j.jada.2008.04.016
Baron, R. M. & Kenny, D. A. (1986). The moderator-mediator variable distinction in
social psychological research: Conceptual, strategic, and statistical
considerations. Journal of Personality and Social Psychology, 51, 1173-1182.
Bentler, P. (1990). Comparative fit indexes in structural models. Psychological
Bulletin, 107, 238-246.
Bentler, P.M. & Chou, C. (1987). Practical issues in structural modeling. Sociological
Methods and Research, 16, 78–117.
Bentler, P. M., & Wu, E. (1995). EQS for Windows User’s Guide. Multivariate
Software Inc; Encino, CA.
Brazier, J. E., Harper, R., Jones, N. M., O'Cathain, A., Thomas, K. J., Usherwood, T.,
& Westlake, L. (1992). Validating the SF-36 health survey questionnaire: New

104
outcome measure for primary care. BMJ (Clinical Research Ed.), 305(6846),
160-164.
Breslau, N., Novak, S. P. & Kessler, R. C. (2004). Psychiatric disorders and stages of
smoking. Biological Psychiatry, 55, 69–76.
Burke, M., Marlow, C., & Lento, T. (2010). Social network activity and social well-
being. Retrieved from: http://www.cameronmarlow.com/media/burke-2010-
social-well-being.pdf.
Cacioppo, J. T., Hawkley, L. C., Norman, G. J., & Berntson, G. G. (2011). Social
isolation. Annals of the New York Academy of Sciences, 1231, 17-22.
Casey D. E & Hansen, T.E. (2003). Excessive Morbidity and Mortality in
Schizophrenia. Chapter 2 in J.M. Meyer and H.A. Nasrallah (editors). Medical
Illness and Schizophrenia (pp. 13–34). Washington, D.C.: American
Psychiatric Publishing.
Centers for Disease Control and Prevention. (2010). CDC Report: Mental illness
surveillance among U.S. Adults Retrieved from
http://www.cdc.gov/mentalhealthsurveillance/index.html.
Centers for Disease Control and Prevention. (2014). Current Cigarette Smoking
Among Adults—United States, 2005–2013. Morbidity and Mortality Weekly
Report 2014;63(47):1108–12 [accessed 2015 July 1].
Centers for Disease Control and Prevention. Exercise or physical activity. NCHS
FastStats web site. http://www.cdc.gov/nchs/fastats/exercise.htm. Accessed
July 3, 2013.
Centers for Disease Control and Prevention. (2013a). NCHS data on obesity. NCHS

105
Fact Sheet web site. Retrieved from
http://www.cdc.gov/nchs/data/factsheets/factsheet_obesity.htm. Accessed
March 7, 2015.
Centers for Disease Control and Prevention. (2013b). Vital signs: current cigarette
smoking among adults aged ≥18 Years with Mental Illness — United States,
2009–2011. Retrieved from
http://www.cdc.gov/mmwr/preview/mmwrhtml/mm6205a2.htm?s_cid=mm62
05a2_w.
Centers for Disease Control and Prevention. (2013c). Adult participation in aerobic
and muscle-strengthening physical activities — United States, 2011. Retrieved
from
http://www.cdc.gov/mmwr/preview/mmwrhtml/mm6217a2.htm?s_cid=mm62
17a2_w.
Cerin, E. (2010). Ways of unraveling how and why physical activity influences mental
health through statistical mediation analyses. Mental Health and Physical
Activity, 3, 51-60. doi: 10.1016/j.mhpa.2010.06.002
Colcombe, S. & Kramer, A. F. (2003). Fitness effects on the cognitive function of
older adults. A meta-analytic study. Psychological Science, 14, 125-130. doi:
10.1111/1467-9280.t01-1-01430.
Cohen, S., Underwood, L., & Gottlieb, .B (Eds.) (2000). Social support measurement
and interventions: A guide for health and social scientists. New York: Oxford.
Cohen, S. & Wils, T. A. (1985). Stress, social support, and the buffering hypothesis.
Psychological Bulletin, 98, 310-357.

106
Cohen, S. (1988). Psychosocial models of the role of social support in the etiology of
physical disease. Health Psychology, 7(3), 269-297.
Cuijpers, P., Beekman, A. T., & Reynolds, C. F. (2012). Preventing depression: A
global priority. JAMA, 307, 1033-34.
Cummins, C. O., Johnson, J. L., Mauriello, L. M., Paiva, A., Dyment, S. (2006).
Empirical support for the application of the Transtheoretical Model to fruit and
vegetable consumption among college students. Paper presented at the 134th
Annual Meeting of the American Public Health Association; Boston, MA.
Daley, A. J. (2002). Exercise therapy and mental health in clinical populations: Is
exercise therapy a worthwhile intervention? Advances in Psychiatric
Treatment, 8, 262-270. doi: 10.1192/apt.8.4.262.
De Hert, M., Correll, C. U., Bobes, J.,Cetkovich-Bakmas, M., Cohen, D., Asasi, I.,
Detraux, J., Gautman, S., Moller, H. J., Ndetei, D. M., Newcomer, J. W.,
Uwakwe, R., & Leucht, S. (2011). Physical illness in patients with severe
mental disorders. I. Prevalence, impact of medications and disparities in health
care. World Psychiatry, 10(1), 52–77.
Delucchi, K. L. (1993). On the use and misuse of chisquare. In G. Keren & C. Lewis
(Eds.), A handbook for data analysis in the behavioral sciences (pp. 294-319).
Hillsdale, NJ: Lawrence Erlbaum.
Dennis, M., Wakefield, P., Molloy, C., Andrews, H., & Friedman, T. (2005). Self-
harm in older people with depression: Comparison of social factors, life events
and symptoms. British Journal of Psychiatry, 186, 538–539. doi:
10.1192/bjp.186.6.538.
107
Deslandes, A., Moraes, H., Ferreira, C., Veiga, H., Silveria, H., Mouta, R.,. . . Laks, J.
(2009). Exercise and mental health: Many reasons to move.
Neuropsychobiology, 59, 191–198. doi:10.1159/000223730.
Dowd, S., Vickers, K., & Krahn, D. (2004). Exercise for depression: How to get
patients moving. Current Psychiatry, 3(6), 10–20.
Dunn, A. L., Trivedi, M. H., Kampert, J. B., Clark, C. G., Chambliss, H. O. (2002).
The DOSE study: exercise as treatment for depression: a clinical trial to
examine efficacy and dose response. Controlled Clinical Trials, 23, 584–603.
doi: 10.1016/S0197-2456(02)00226-X
Dunn, A. L., Trivedi, M. H., Kampert, J. B., Clark, C. G., Chambliss, H. O. (2005).
Exercise treatment for depression: efficacy and dose response. American
Journal of Preventive Medicine, 28, 1-8. doi:10.1016/j.amepre.2004.09.003
Dweck, C. S. & Leggett, E. L. (1988). A social cognitive approach to motivation and
personality. Psychological Review, 95, 256- 273.
Franko, D. L., Thompson, D., Affenito, S. G., Barton, B. A., Striegel-Moore, R. H.
(2008). What mediates the relationship between family
meals and adolescent health issues. Health Psychology, 27, S109-17.
doi: 10.1037/0278-6133.27.2(Suppl.).S109.
Fratiglioni, L., Paillard-Borg, S., & Winblad, B. (2004). An active and socially
integrated lifestyle in late life might protect against dementia. Lancet
Neurology, 3, 343–353. doi: 10.1016/S1474-4422(04)00767-7.
Fritz, M. S. & MacKinnon, D. P. (2007). Required sample size to detect the mediated
effect. Psychological Science, 18, 233-239.

108
Fryar, C. D., Chen, T., & Li, X. (Prevalence of uncontrolled risk factors for
cardiovascular disease: United States, 1999–2010. (2012). NCHS Data Brief,
No. 103. Hyattsville, MD: National Center for Health Statistics, Centers for
Disease Control and Prevention, US Dept. of Health and Human Services.
Gjesfjeld, C., Greeno, C., & Kim, K., & Anderson, C. (2010). Economic stress, social
support, and maternal depression: Is social support deterioration occurring?
Social Work Research, 34, 135–143.
Godin, G., & Shephard, R. J. (1997). Godin Leisure-Time Exercise Questionnaire.
Medicine and Science in Sports and Exercise, 29, S36-S38.
Gómez-Pinilla, F. (2008). Brain foods: The effects of nutrients on brain function.
Nature Reviews Neuroscience, 9(7), 568-578.
Gorin, A., Phelan, S., Tate, D., Sherwood, N., Jeffery, R., & Wing, R. (2005).
Involving support partners in obesity treatment. Journal of Consulting and
Clinical Psychology, 73(2), 341.
Green, S. B., Akey, T. M., Fleming, K. K., Hershberger, S. L., & Marquis, J. G..
(1997). Effect of the number of scale points on chi‐square fit indices in
confirmatory factor analysis. Structural Equation Modeling: A
Multidisciplinary Journal, 4, 108-120. doi: 10.1080/10705519709540064
Hamer, M., & Chida, Y. (2009). Physical activity and risk of neurodegenerative
disease: A systematic review of prospective evidence. Psychological Medicine,
39, 3–11. doi:10.1017/S0033291708003681.

109
Harlow, L. L. (2005). The essence of multivariate thinking: Basic themes and methods
(2nd Edition). Lawrence Erlbaum Associates, Inc., Publishers. New Jersey.
Harris, E. C. & Barraclough, B. (1998). Excess mortality of mental disorder. British
Journal of Psychiatry, 173, 11-53.
Hogan, B. E., Linden, W., & Najarian, B. (2002). Social support interventions do they
work? Clinical Psychology Review, 22(3), 381-440.
Holt-Lunstad, J., Smith, T. B., & Layton, J. B. (2010). Social relationships and
mortality risk: A meta-analytic review. PLoS Medicine, 7, e1000316.
doi:10.1371/journal.pmed.1000316
Hu, L. & Bentler, P. M. (1999). Cutoff criteria for fit indexes in structure analysis:
Conventional criteria versus new alternatives. Structural Equation Modeling,
6, 1-55.
Jacka, F. N., Mykletun, A., Berk, M. (2012). Moving towards a
population health approach to the primary prevention of
common mental disorders. BMC Medicine, 27, 10:149. doi: 10.1186/1741-
7015-10-149.
Johnson, S. S, Paiva, A. L. Cummins, C., Johnson, J. L. Dyment, S., Wright, J. A.,
Prochaska, J. O., Prochaska, J. M., & Sherman, K. (2008). Evidence-based
multiple behavior intervention for weight management: Effectiveness on a
population basis. Preventive Medicine, 46, 238-246. doi:
10.1016/j.ypmed.2007.09.010.
Jorm, A. F, Christensen, H., Griffiths, K. M., & Rodgers, B. (2002). Effectiveness of
110
complementary and self-help treatments for depression. Medical Journal of
Australia, 20, Suppl, S84-96.
Kessler, R. C., Chiu, W. T., Demler, O., & Walters, E. E. (2005). Prevalence, severity,
and comorbidity of twelve-month DSM-IV disorders in the National
Comorbidity Survey Replication (NCS-R). Archives of General Psychiatry, 62,
617-27.
Kilian, R., Becker, T., Krüger, K., Schmid, S., & Frasch K. (2006). Health behavior in
psychiatric in-patients compared with a German general population sample.
Acta Psychiatrica Scandinavica, 114(4), 242-8.
Kim, Y. H. (2003). Correlation of mental health problems with psychological
construction in adolescence: Final results from a 2 year study. International
Journal of Nursing Studies, 40, 115-125.
Kline, R. B. (2010) Principles and Practice of Structural Equation Modeling (3rd
Edition). New York, NY: The Guilford Press.
Korkiakangas, E., Taanila, A. M, Keinänen-Kiukaanniemi, S. (2011). Motivation to
physical activity among adults with high risk of type 2 diabetes who
participated in the Oulu substudy of the Finnish Diabetes Prevention Study.
Health & Social Care in the Community, 19, 15-22. doi: 10.1111/j.1365-
2524.2010.00942.x
Kumanyika, S. & Economos, C. (2011). Prevention of obesity. Finding the best
evidence. [Commentary] World Nutrition, 2, 283-299.
LaForge, R. G., Greene, G. W., & Prochaska, J. O. (1994). Psychosocial factors

111
influencing low fruit and vegetable consumption. Journal of Behavioral
Medicine, 17, 361–374.
Lawlor, D.A., & Hopker, S.W. (2001). The Effectiveness of exercise as an
intervention in the management of depression: Systematic review and meta-
regression analysis of randomised controlled trials. British Medical Journal,
322, 763–767.
Boseley, S. (2015, July 31). Americans cutting calorie intake but junk food proves a
hard habit to kick. The Guardian. Retrieved from
http://www.theguardian.com/us-news/2015/jul/31/americans-cutting-calorie-
intake-study-first-step?CMP=Share_AndroidApp_Gmail
Lockwood, C. M, DeFrancesco, C. A, Elliot, D. L., Beresford, S. A, & Toobert, D. J.
(2010). Mediation analyses: applications in nutrition research and reading the
literature. Journal of American Dietetic Association, 110, 753-62. doi:
10.1016/j.jada.2010.02.005.
MacCallum, R.C., Browne, M.W., and Sugawara, H., M. (1996). Power analysis and
determination of sample size for covariance structure modeling. Psychological
Methods, 1(2), 130-49. Maddux, J. E. (2002). Self- efficacy: the power of
believing you can. The handbook of positive psychology. New York: Oxford
University Press.
Mark, T. L., Levit, K. R., Buck, J. A., Coffey, R. M., Vandivort-Warren, R. (2007).
Mental health treatment expenditure trends, 1986--2003. Psychiatric Services,
58(8), 1041--8.

112
Martini, S., Wagner, F. A., & Anthony, J. C. (2002). The association of tobacco
smoking and depression in adolescence: Evidence from the United States.
Substance Use & Misuse, 3, 1853-1867.
Maxwell, S. E., & Cole, D. A. (2007). Bias in cross-sectional analyses of longitudinal
mediation. Psychological Methods, 12(1), 23.
McHorney, C. A., Ware, J. E., Jr., Lu, J. F. R., & Sherbourne, C. D. (1994). The MOS
36 Item Short Form Health Survey (SF 36): Tests of data quality, scaling
assumptions, and reliability across diverse patient groups. Medical Care,
32:40-66.
McHorney, C. A., Ware, J. E.,Jr, & Raczek, A. E. (1993). The MOS 36-item short-
form health survey (SF-36): II. psychometric and clinical tests of validity in
measuring physical and mental health constructs. Medical Care, 31(3), 247-263.
Mermelstein, R., Cohen, S., Lichtenstein, E., Baer, J. S., & Kamarck, T. (1986). Social
support and smoking cessation and maintenance. Journal of Consulting and
Clinical Psychology, 54, 447-453.
Miller, N. E., & Dollard, J. (1941). Social Learning and Imitation. New Haven: Yale
University Press.
Muñoz, M. A., Fíto, M., Marrugat, J., Covas, M. I., Schröder, H. (2009). Adherence to
the Mediterranean diet is associated with better mental and physical health.
British Journal of Nutrition, 101, 1821-7. doi: 10.1017/S0007114508143598.
Mykletun, A., Overlan, S., Aaro, L. E., Liabo, H. M., & Stewart, R. (2008). Smoking
in relation to anxiety and depression: Evidence from a large population survey:
The Hunt study. European Psychiatry, 23, 77-84.

113
National Center for Health Statistics. (2014). Health, United States, 2013: With special
feature on prescription drugs. Hyattsville, MD.
Ng, S.W., Slining, M. M., & Popkin, B. M. (2014). Turning point for US diets?
Recessionary effects or behavioral shifts in foods purchased and consumed.
American Journal of Clinical Nutrition, 99, 609-16. doi: 10.3945/
ajcn.113.072892
Pasco, J. A., Williams, L. J., Jacka, F. N., Ng, G., Henry, M. J., Nicholson, G. C.,
Kotowicz, M. A., & Berk, M. (2008). Tobacco smoking as a risk factor for
major depressive disorder: Population-based study. British Journal of
Psychiatry, 193, 322-326.
Parks J., Svendsen, D., Singer, P. & Foti, M. (2006). Morbidity and Mortality in
People with Serious Mental Illness. National Association of State Mental
Health Program Directors (NASMHPD) Medical Directors Council,
Alexandria, VA 22314. Available at:
www.nasmhpd.org/general_files/publications/med_directors_pubs/Technical%
20Report%20on%20Morbidity%20and%20Mortaility%20-%20Final%2011-
06.pdf(accessed17March2010).
Peluso, M. A., & Guerra de Andrade, L. H. (2005). Physical activity and mental
health: the association between exercise and mood. Clinics (Sao Paulo), 60,
61-70. doi: 10.1590/S1807-59322005000100012
Poti, J. M., Mendez, M. A., Ng, S. W., & Popkin, B. M. (2015). Is the degree of food
processing and convenience linked with the nutritional quality of foods

114
purchased by US households? American Journal of Clinical Nutrition, 101,
1251-62. doi: 10.3945/ajcn.114.100925
Prochaska, J. O., & DiClemente, C. C. (1992). Stages of change in the modification of
problem behaviors. In M. Hersen, R.M. Eisler, & P.M. Miller (Eds.), Progress
on behavior modification. Sycamore, IL: Sycamore Press.
Prochaska, J. O., & DiClemente, C. C. (1983). Stages and processes of self-change of
smoking: Toward an integrative model of change. Journal Consulting and
Clinical Psychology, 51(3), 390-5.
Prochaska, J.O., Diclemente, C.C., and Norcross, J.C. (1992). In search of how
people change: Applications to addictive behaviors. American Psychologist,
47(9), 1102–1114.
Prochaska, J. O., & Velicer, W. F. (1997). The transtheoretical model of behavior
change. American Journal of Health Promotion, 12(1), 38-48.
Quirk, S. E., Williams, L. J., O’Neil, A., Pasco, J. A., Jacka, F. N., Housden, S., Berk,
M., & Brennan, S. L. (2013). The association between diet quality, dietary
patterns and depression in adults: a systematic review. BMC Psychiatry, 13,
175. doi:10.1186/1471-244X-13-175.
Rogers, E. S., Anthony, W., & Lyass, A. (2004). The nature and dimensions of social
support among individuals with severe mental illnesses. Community Mental
Health Journal, 40(5), 437-50.
Roth, D. L., & Holmes, D. S. (1987). Influence of aerobic exercise training and
relaxation on physical and psychologic health following stressful life events.
Psychosomatic Medicine, 49, 355-365.

115
Sarris, J, Schoendorfer, N., Kavanagh, D. J. (2009). Major depressive disorder and
nutritional medicine: a review of monotherapies and adjuvant treatments.
Nutrition Reviews, 67, 125-31. doi: 10.1111/j.1753-4887.2009.00180.x.
Salmon, P. (2001). Effects of physical exercise on anxiety, depression, and sensitivity
to stress: a unifying theory. Clinical Psychology Review, 21(1), 33-61.
Sánchez-Villegas, A., Delgado-Rodríguez, M., Alonso, A., Schlatter, J., Lahortiga, F.,
Serra Majem, L., Martínez-González, M. A. (2009). Association of the
Mediterranean dietary pattern with the incidence of depression: the
Seguimiento Universidad de Navarra/University of Navarra follow-up (SUN)
cohort. Archives of General Psychiatry, 66, 1090-8. doi:
10.1001/archgenpsychiatry.2009.129.
Schellinck, T. & Fenwick, I. (1981). Testing the stability of market segmentation
analysis, in NA- Advances in Consumer Research Volume 08, eds. Kent B.
Monroe, Ann Abor, MI : Association for Consumer Research, Pages: 723-727.
Schmitz, N., Kruse, J., & Kugler, J. (2004). The association between physical
exercises and health-related quality of life in subjects with mental disorders:
results from a cross-sectional survey. Preventive Medicine, 39(6):1200-7.
Schwarzer, R., & Jerusalem, M. (1995). Generalized Self-Efficacy scale. In J.
Weinman, S. Wright, & M. Johnston, Measures in health psychology: A user’s
portfolio. Causal and control beliefs (pp. 35-37). Windsor, UK: NFER-
NELSON.
116
Serra-Majem, L., Roman, B., & Estruch, R. (2006). Scientific evidence of
interventions using the Mediterranean diet: a systematic review. Nutrition
Review, 64(2 Supplement), S27-47.
Sidhu, K. S., Vandana, P., & Balon, R. (2009). Exercise prescription: A practical
effective therapy for depression. Current Psychiatry, 8(6), 39–51.
Stathopoulous, G., Powers, M. B., Berry, A. C., Smits, A. J., & Otto, M. W. (2006).
Exercise interventions for mental health: A quantitative and qualitative review.
Clinical Psychological Science and Practice, 13, 179–193.
Steiger, J. (1998). A note on multiple sample extensions of the RMSEA fit index.
Structural Equation Modeling, 5, 411-419.
Stephens, T. (1988). Physical activity and mental health in the United States and
Canada: Evidence from four popular surveys. Preventive Medicine, 17, 35–47.
Steptoe, A., Wardle, J., Filler, R., Holte, A., Justo, J., Sanderman, R., Wichstrøm, L.
(1997). Leisure-time physical exercise: Prevalence, attitudinal correlates, and
behavioral correlates among young Europeans from 21 countries. Preventive
Medicine, 26, 845–854.
Steptoe, A., Edward, S., Moses, J., and Mathews, A. (1989). The effects of exercise
training on mood and perceived coping ability in anxious adults from the
general population. Journal of Psychosomatic Research, 33, 537–547.
Suls, J. & Bunde, J. (2005). Anger, anxiety, and depression as risk factors for
cardiovascular disease: the problems and implications of overlapping affective
dispositions. Psychological Bulletin, 131(2), 260-300.
Taylor, M. J, Carney, S. M, Goodwin, G. M., & Geddes, J. R. (2004). Folate for

117
depressive disorders: systematic review and meta-analysis of randomized
controlled trials. Journal of Psychopharmacology,18, 251-6.
Taylor, M. J., Carney, S. M., Goodwin, G. M., Geddes, J. R. (2004). Folate for
depressive disorders: systematic review and meta-analysis of randomized
controlled trials. Journal of Psychopharmacology, 18(2), 251-6.
Uchino, B. N. (2009). Understanding the links between social support and physical
health: A life-span perspective with emphasis on the separability of perceived
and received support. Perspectives on Psychological Science, 4(3), 236-255.
U.S. Census Bureau. (2013). State and County Quick Facts. Data derived from
Population Estimates, American Community Survey, Census of Population and
Housing, State and County Housing Unit Estimates, County Business Patterns,
Nonemployer Statistics, Economic Census, Survey of Business Owners,
Building Permits.
U.S. Department of Health and Human Services. (2014). The Health Consequences of
Smoking—50 Years of Progress: A Report of the Surgeon General. Atlanta,
GA: US Dept. of Health and Human Services, Centers for Disease Control and
Prevention.
Walsh, R. (2011). Lifestyle and mental health. American Psychologist, 66, 579-592.
doi: 10.1037/a0021769.
Wallston, B. S., Alagna, S. W., DeVellis, B. M., & DeVellis, R. F. (1983). Social
support and physical health. Health Psychology, 2(4), 367-391.
Wannamethee, G. & Shaper, A. G. (1991). Self-assessment of health status and

118
mortality in middle-aged British men. International Journal of Epidemiology,
20, 239-45.
Ware, J. E., Jr., Kosinski, M., Bayliss, M. S., McHorney, C. A., Rogers, W. H., &
Raczek, A. (1995). Comparison of methods for the scoring and statistical
analysis of SF 36 Health Profile and Summary Measures: Summary of results
from the Medical Outcomes Study. Medical Care, 33, AS264-AS279.
Ware, J. E., Kosinski, M., & Keller, S. D. (1994). SF 36 Physical and Mental Health
Summary Scales: A User's Manual. Boston, MA: The Health Institute, New
England Medical Center.
Ware, J. E., Jr., & Sherbourne, C. D. (1992). The MOS 36 Item Short Form Health
Survey (SF 36): Conceptual framework and item selection. Medical Care,
30:473-483.
Wells, K. B., Golding, J. M., & Burnham, M. A. (1988). Psychiatric disorder in a
sample of the general population with and without medical disorders.
American Journal of Psychiatry, 145, 976-981.
Westmaas, J. L., Bontemps-Jones, J., & Bauer, J. E. (2010). Social support in smoking
cessation: reconciling theory and evidence. Nicotine Tobacco Research. 12.
695–707. doi: 10.1093/ntr/ntq077
World Federation of Mental Health (WFMH). (2010). Mental health and chronic
physical illnesses. The need for continued and integrated care. Accessed at
http://www.wfmh.org/2010DOCS/WMHDAY2010.pdf. World Health
Organization (WHO). (2004).

119
World Health Organization. (2004). The global burden of disease: 2004 update.
Retrieved fromRetrieved from
http://www.who.int/healthinfo/global_burden_disease/GBD_report_2004updat
e_full.pdf
Zimet, G. D., Dahlem, N. W., Zimet, S. G., & Farley, G. K. (1988). The
Multidimensional Scale of Perceived Social Support. Journal of Personality
Assessment, 52, 30-41.
Zimmerman, R. S., & Conor, C. (1989). Health promotion in context: the effects of
significant others on health behavior change. Health Education Quarterly,
16(1), 57-75.