HEALTH PROMOTING BEHAVIORS OF THE RURAL WELL ...
178
HEALTH PROMOTING BEHAVIORS OF THE RURAL WELL OLDER ADULT By Shirley May Newberry B. S., University of Dubuque, 1980 M.S., Winona State University, 1995 Submitted to Rush University in partial Fulfillment of the requirements for the Degree of Doctor of Nursing Science © Copyright by Shirley May Newberry, 2002 All Rights Reserved Reproduced with permission of the copyright owner. Further reproduction prohibited without permission.
-
Upload
khangminh22 -
Category
Documents
-
view
1 -
download
0
Transcript of HEALTH PROMOTING BEHAVIORS OF THE RURAL WELL ...

HEALTH PROMOTING BEHAVIORS
OF THE RURAL WELL OLDER ADULT
By
Shirley May Newberry
B. S., University of Dubuque, 1980 M.S., Winona State University, 1995
Submitted to Rush University in partial Fulfillment of the requirements for the Degree of Doctor of Nursing Science
© Copyright by Shirley May Newberry, 2002 All Rights Reserved
Reproduced with permission of the copyright owner. Further reproduction prohibited without permission.

HEALTH PROMOTING BEHAVIORS OF THE RURAL WELL OLDER ADULT
Shirley May Newberry, Doctor of Nursing Science, 2002
Dissertation directed by: Dr. Julia Muennich-Cowell, Ph.D.,RNC, FAAN
One of the greatest challenges facing nursing in the future will be promoting wellness
among the increasing number of older adults, many of whom live in rural areas where
they are isolated from access to medical facilities and information about health
promotion. The purpose of this study was to examine the relationship between
perceived health status and the health promoting behaviors of the well older adult living
in the rural setting. In addition, demographic variables were examined in relationship to
the health promoting behaviors and self-perceived health status. A non-experimental
research design using survey methods was utilized to explore the health promoting
behaviors and perceived health status. The Short Form-8 (SF-8) was used to measure the
self-perceived health status and the Health Promoting Lifestyle H (HPLP H) was used to
measure the health promoting behaviors. Four hundred and forty older adults that
fulfilled the criteria for participation, completed surveys at rural dining sites located in
Southeast Minnesota. The self-perceived health status of the study sample is poorer than,
yet, comparable to other older adults in the areas of bodily pain, vitality, role emotional,
social functioning, and mental health. Spiritual growth is the most commonly used health
promoting behaviors for this sample. However, nutrition and stress management were
also commonly used health promoting behaviors. Overall, the perceived health status
was positively related to health promoting behaviors for this sample. The health
Reproduced with permission of the copyright owner. Further reproduction prohibited without permission.
Professor, Department of Community and Mental Health Nursing Rush University, Chicago, IL
Dj?: Julia Muenich Cowell, Ph.D., RNC, FAAN
u

promoting behavior of Health Responsibility, however, showed no correlation with health
status. The demographic variables for the rural older adult were found to be poor
predictors of either health promoting behaviors or perceived health status.
In spite of the identified need for research in the rural setting, limited data exists
describing the relationship of health status and health promoting behaviors, especially
with the older adult population. This research contributes to the nursing profession by
enhancing knowledge about health promoting behaviors and health status of older adults
living in rural areas. In order to develop nursing interventions focused on the older adult
population and behaviors that promote health, research such as this are necessary.
iii
Reproduced with permission of the copyright owner. Further reproduction prohibited without permission.

DISSERTATION APPROVAL FORM
The undersigned have examined the dissertation entitled:Health Promoting Behaviors o f the Rural Older Adult
Presented by: Shirley M. Newberry
A candidate for the degree o f Doctor o f Nursing Science
And hereby certify that in their judgment it is worthy o f acceptance.
Professor DateDepartment o f Community and Mental Health Nursing Rush University
Assistant Professor Psychology/Nursing Department Rush University
- la n e Walton. PhD. RN. APN/CCS Date Assistant Professor Department o f Adult Health Nursing Rush University
HatlevigZcque ProfessorDepartment o f Nursing Winona State University
iv
Reproduced with permission of the copyright owner. Further reproduction prohibited without permission.

Table of Contents
Chapter 1 ........................................................................................................................................1
Introduction.............................................................................................................................1
Health & W ellness.......................................................................................................... 3
Geographic location........................................................................................................5
Significance of the Problem................................................................................................. 6
Chronic Illness..................................................................................................................7
Strategies for Health Promotion.................................................................................... 7
Rural Issues......................................................................................................................9
Purpose...................................................................................................................................10
Research Questions..............................................................................................................11
Chapter 2 ......................................................................................................................................12
Literature Review................................................................................................................. 12
Wellness/Health Status Research....................................................................................... 12
SF-36......................................................................................................................................14
Health Promotion/Health Promoting Behaviors.............................................................. 16
Pender’s Theoretical Framework and Related Research................................................. 19
Individual Characteristics and Experiences............................................................... 21
Behavior Specific Cognitions and Affects................................................................. 21
Behavior Outcomes.......................................................................................................22
HPLP...............................................................................................................................26
H PL P B .......................................................................................................................... 34
Other Instruments.......................................................................................................... 37
v
Reproduced with permission of the copyright owner. Further reproduction prohibited without permission.

Demographic Variables....................................................................................................... 39
Summary...............................................................................................................................44
Chapter 3 ..................................................................................................................................... 47
Research Methods............................................................................................................... 47
Pilot Study......................................................................................................................47
Instruments.....................................................................................................................48
Short Portable Mental Status Questionnaire (SPMSQ)............................................ 48
The Health Promotion Lifestyle Profile II (HPLPII)............................................... 49
SF-36 Health Survey.....................................................................................................50
Data Collection...............................................................................................................52
Results of Pilot Study....................................................................................................54
Use of the Short Portable Mental Status Questionnaire (SPMSQ).........................59
Use of the Short Form -8 (SF-8)................................................................................. 59
Research Design...................................................................................................................59
Population/Setting.........................................................................................................60
Sample............................................................................................................................ 61
Inclusion Criteria........................................................................................................... 62
Exclusion Criteria.......................................................................................................... 62
Protection of Subjects....................................................................................................62
S F -8 ................................................................................................................................63
Data Collection.............................................................................................................. 64
Data Analysis.................................................................................................................65
Summary...............................................................................................................................66
vi
Reproduced with permission of the copyright owner. Further reproduction prohibited without permission.

Chapter 4 ......................................................................................................................................67
Results Of Analysis..............................................................................................................67
Sample Characteristics..................................................................................................67
Characteristics of the Non-participants.............................................................................71
Health Promoting Behaviors.............................................................................................. 73
Health Status.................................................................................................................. 76
Profile of the “Low” Rural Older Adult......................................................................93
Chapter 5 .................................................................................................................................... 101
Discussion........................................................................................................................... 102
Health Promoting Behaviors...................................................................................... 102
Perceived Health Status............................................................................................... 106
Relationship between Health Promoting Behaviors and Health Status................109
Low Profiler................................................................................................................. 112
Relationship of Finding to Pender’s Health Promotion Model..............................113
Limitations.......................................................................................................................... 115
Recommendations for Further Research......................................................................... 117
References..................................................................................................................................120
Appendix A Short Portable Mental Status Questionnaire (SPMSQ)................................. 132
Appendix B Health Promoting Lifestyle Profile II...............................................................133
Appendix C SF-36 Health Survey...........................................................................................138
Appendix D Demographic Information.................................................................................143
Appendix E Subject Information Sheet (version 1)............................................................. 144
Appendix F Demographic Information..................................................................................145
vii
Reproduced with permission of the copyright owner. Further reproduction prohibited without permission.

Appendix G The SF-8 Health Survey.................................................................................... 146
Appendix H Permission from Semcac...................................................................................148
Appendix I Subject Information Sheet (research study)..................................................... 149
Appendix J Permission from Rush University......................................................................150
Appendix K Cross tabulations.................................................................................................151
Appendix L Mean Age Comparison for HPLPII and SF-8 Subscales and Summary
Scales.......................................................................................................................................... 167
viii
Reproduced with permission of the copyright owner. Further reproduction prohibited without permission.

LIST OF FIGURES
Figure 1 Pender's Health Promotion Model............................................................................20
ix
Reproduced with permission of the copyright owner. Further reproduction prohibited without permission.

List of Tables
Table I Cut Points for Exclusion using the SPMSQ..............................................................48
Table 2 Demographic Data of Pilot Study by Age, Gender, Marital Status, Ethnic Origin
and Education - n=43.........................................................................................................55
Table 3 Subscale Mean Scores, SD, and Range for HPLPII and the Total H PL PII....... 57
Table 4 Subscale Scores for SF-36..........................................................................................58
Table 5 Summary of the Age Distribution of New Persons Enrolled in 1999................... 61
Table 6 Age, Gender, Marital Status, and Educational Level Listed by Characteristic,
Number and Percentage......................................................................................................69
Table 7 Reasons for Nonparticipation......................................................................................72
Table 8 HPLP II and Average Item Scores............................................................................. 75
Table 9 Results of the SF-8 Subscales.....................................................................................79
Table 10 Relationship of the SF-8 Physical Functioning Subscale and the HPLP II
Subscales..............................................................................................................................83
Table 11 Relationship of the SF-8 Physical Subscale and the HPLP II Subscales...84
Table 12 Relationship of the SF-8 Bodily Pain Subscale and the HPLP Subscales.85
Table 13 Relationship of the SF-8 General Health Subscale and the HPLP H Subscales 86
Table 14 Relationship of the SF-8 Vitality Subscale and the HPLP II Subscales....87
Table 15 Relationship of the SF-8 Social Functioning Subscale and the HPLP Q
Subscales..............................................................................................................................88
Table 16 Relationship of the SF-8 Role Emotional Subscale and the HPLP II Subscales89
Table 17 Relationship of the SF-8 Mental Health Subscale and the HPLP II Subscales .91
Table 18 Cross Tabulations for Low/Non-low Respondents for Selected HPLP H and
SF-8 Scales By Education................................................................................................. 96
Table 19 Mean Age Comparison for Selected HPLP II and SF-8 Scales by Low/Non-low
Respondents......................................................................................................................... 98
Table 20 Comparison of Mean and Standard Deviations of HPLP II subscale scores and
Summary Scores................................................................................................................105
Table 21 Comparison of Mean and Standard Deviations of SF-8 Subscales and Summary
Scores................................................................................................................................. 107
x
Reproduced with permission of the copyright owner. Further reproduction prohibited without permission.

ACKNOWLEDGEMENTS
I would like to dedicate this work to my father, Ewald (PeeWee) Pamow, who
thought there was no better way to spend the last 3 years of his life than at the rural cabin,
playing cards with his family, feeding deer in the woods, and fishing on the river. He
never had the opportunity to become an older adult.
I would like to thank my advisor, Dr. Julia Muennich Cowell, for her mentorship,
insight, and guidance during my doctoral dissertation. I would also like to thank my
clinical mentor. Dr. Kathleen Shanks for showing me the need for wellness for the older
adult and the joy of caring for them. I would also like to thank my committee members;
Dr. Jane Walton, and Dr. Lou Fogg; Dr. Jacqueline Vix Hatlevig, and Dr. Jeffrey
Draskoci-Johnson -Johnson for sharing their expertise and their commitment to this
research.
I would like to thank my mother, sisters, brothers, friends, and colleagues for their
patience, understanding, and support in this endeavor. I would like to say a special
thanks to Jackie for her constant prodding, reading, and for showing me the things is life
that are important. Most of all, I am especially thankful to my family; my husband and
partner, Bob, and daughters, Dana and Alece, whose constant faith and unending love
gave me the strength and persistence to Finish my doctoral education.
xi
Reproduced with permission of the copyright owner. Further reproduction prohibited without permission.

1
Chapter 1
Introduction
Older adults are living longer and are an increasing proportion of the population.
Since 1900, the percentage of adults over sixty-five in the U.S. population have tripled
and continues to rise dramatically. In 1994, the number of adults 65 and older
represented 12.7 % of the total population. According to the U.S. Census Bureau (1995),
the number of adults over the age of sixty-five will more than double by the year 2050.
In addition, the fastest growing segment of the older adult population are those over 85
years of age.
During the past century, numerous variables, including public health interventions
and medical progress in the United States have added an additional twenty-eight years to
the life span for the average person (Centers for Disease Control and Prevention, 1993).
The Centers for Disease Control and Prevention (CDC) (2001,) reports that life
expectancy of an American at birth is 76.7 years. The increase in lifespan can be
attributed, in part, to the advancement of technology and the elimination of many of the
acute diseases that once caused premature deaths. Diseases such as smallpox and cholera
are almost nonexistent in the United States. Also, whooping cough, tuberculosis,
pneumonia, and influenza have been significantly reduced in occurrence with a
subsequent reduction in mortality rates for these diseases (Centers for Disease Control,
1993). These decreases in mortality rates have had a significant effect on extending the
lives of older adults. Because older adults are living longer, they are at increased risk of
developing one or more chronic illnesses. In fact, many of these older adults will be
living with multiple chronic illnesses such as arthritis, diabetes, hypertension, pulmonary,
Reproduced with permission of the copyright owner. Further reproduction prohibited without permission.

and cardiovascular diseases. According to the Centers for Disease Control (1993), 10
million people in the United States are currently living with one or more chronic
conditions. In addition, the CDC (2001) predicts that limitations in activity due to
chronic health conditions in the older adult are more common in rural areas. Taking care
of persons with multiple chronic conditions and promoting wellness for this population
presents a unique challenge for professionals in the current health care system.
The cost of caring for increasing numbers of older adults is a concern for health
care professionals. According to the Centers for Disease Control and Prevention (CDC)
(2001), the amount of money spent on health care for the older adult population is higher
than that spent for those persons under sixty-five. In fact, the CDC (2001) reports that
medical expenses averaged $5,600 per person for people over sixty-five years of age.
This is an increase of 46 % since 1987. In addition, the CDC (2001) reports that in 1999,
Medicare had 39 million persons enrolled in their program and had expenditures of $ 213
billion.
The financial burden of providing care for this older population is currently very
costly and Waldo et al. (1989) predict it will significantly rise with the projected increase
in the number of older adults. The increase in the number of older adults and the great
amount of money being spent on care for the elderly suggests a need to study ways that
older adults maintain their health. High costs of health care can be decreased if older
adults remain healthy through use of health promoting behaviors. Therefore, it is
essential to understand the current health promoting behaviors of those older adults who
remain well and healthy.
Reproduced with permission of the copyright owner. Further reproduction prohibited without permission.

3
In the future, many nurses will find themselves caring for an ever-older
population (Falck, 1994). Falck proposes that nurses may be providing care for the
acutely or chronically ill older adult populations in the acute care setting, in home care, in
skilled nursing homes, or with the well older adult in the community or residential
settings. Nurses have the opportunity to make a difference in the well-being of this
population by emphasizing the basic steps individuals can take to maintain or improve
their health and continue to maintain independence and control over their lives. The first
step, however, is to determine what health-promoting behaviors well older adults use and
how they maintain wellness with one or more chronic illnesses.
Health & Wellness
Numerous definitions of health and wellness have been described in the literature.
As far back as 1948, the World Health Organization (1998) defined health as “a state of
complete physical, mental, and social well-being, and not merely the absence of disease
and infirmity” (p. 1). In the 1960’s, Dunn (1961) coined “high level wellness” as a
desired component of health.
Pender (1987) defines health as the “the actualization on inherent and acquired
human potential through goal-directed behavior, competent self-care, and satisfying
relationships with others while adjustments are made as needed to maintain structural
integrity and harmony with the environment” (p. 27). In addition, Pender (1987) suggests
that an individual’s perceived health status is related to the frequency and intensity in
which that individual engages in health promoting behaviors. Using Pender’s definition,
perceived health status can be observed and measured.
Reproduced with permission of the copyright owner. Further reproduction prohibited without permission.

4
Long (1993) reports that a client’s concept of health is known to have a
significant affect on health promoting behaviors, acceptance of prevention and treatment
interventions, and health care seeking behaviors. In order to understand a client’s
motivation for health promotion, health maintenance, and illness treatment, Long
suggests a need to understand what an individual’s concept of health is in order to
develop relevant and acceptable assessment approaches and intervention strategies.
Ardell (1985) defines wellness as “a conscious and deliberate approach to an
advanced state of physical and psychological/spiritual health” (p. 38). He proposes that
the individual can approach wellness by looking at the factors of self-responsibility,
stress awareness and management, physical fitness, environmental sensitivity, and
nutritional awareness. Ardell further purports the need to approach wellness in a
systematic fashion by balancing the social, emotional, spiritual, physical, occupational,
and intellectual dimensions. He explains further that the reward of wellness lifestyles is
an improvement in quality of life, thus reaching a richer existence for the individual.
Based on Ardell’s definition, wellness lifestyle is a decision, the conscious and deliberate
movement of individuals toward a state of wellness in their life.
Edelman and Mandle (1998) define wellness as the individual’s ability to adapt,
to relate to others effectively, and to function at near-maximum capacity. According to
the authors, wellness includes self-responsibility, nutritional awareness, physical fitness,
stress management, environmental sensitivity, productivity, expression of emotions, self-
expression in a variety of ways, creativity, personal care, and home and automobile
safety. These authors place the responsibility of maintenance of wellness upon the
individual. They suggest that the benefits of wellness for each individual will promote
Reproduced with permission of the copyright owner. Further reproduction prohibited without permission.

5
optimal functioning through awareness, physical activity, and overall improved quality of
life.
Long (1993) and Pender (1987) agree that the perceived health status of an
individual is related directly to the health promoting behaviors they engage in, yet, the
individuals’ perceptions of health status varies depending upon age, income, ethnicity,
race and occupation. They suggest there is a need to examine the interaction of these
demographic variables with respect to geographic location, such as rural populations. By
examining these interactions, improvements can be made in rural nursing practice.
In addition to the health status of the individual, the present health care system
needs changing, according to Shaw (1997). She reports there is a need for additional
services in the rural areas. Additional services identified by Shaw are lack of providers,
lack of transportation, inaccessible office hours, unavailability of elder care (spouses),
and excessive waiting time at the office or clinic according to a study of the perceptions
of rural Medicaid patients.
Geographic location
Weinert and Burman (1994) report that the literature pertaining to the definition
of rural is perplexing. The ability to adequately determine what is rural and is
problematic in terms of conceptualizing and measuring this variable in research. The U.S.
Census Bureau (1995) considers rural as 2,500 or fewer inhabitants; urban is defined as a
city of 50,000 or more persons. The Office of Technology Assessment (1990) refers to
non-metropolitan areas as those areas of less than 50,000 persons, but does not delineate
what an area is. The National Rural Health Organization (1999) suggests the designation
of frontier, which is 6 people or less per square mile, as being an improved definition of
Reproduced with permission of the copyright owner. Further reproduction prohibited without permission.

6
rural. Weinert and Burman suggest that a description of rural be used to describe a place
of residence or simply where a person lives. The CDC (2001) refers to the localities as
the counties in which people reside and separates them into more urban as a county with
a; A) Large central city, B) Large Fringe of a city, C) Small city, and Non-Metropolitan
(rural) as a county; D) with a city of 10,000 or less population, and E) without a city of
10.000 or more. In this study, the definition of rural pertains to the place of residence of
the participants where the sample is in an unincorporated town or city where less than
20.000 persons reside.
Significance of the Problem
Despite the fact that the definitions for health and wellness vary in the literature, it
needs to be studied. By examining the self-perceived health status of the older adult in
the rural setting, this research attempts to gain insight into the relationship of health status
and in health promoting behaviors of the older adult population in the rural setting. This
can lead to development of appropriate nursing strategies for promoting health and
wellness for other rural, older adults.
One of the greatest challenges facing nursing in the early part of the 21st century
will be promoting wellness among the increasing number of older adults in the United
States, many of whom are isolated from easy access to medical facilities and the
necessary information for health promotion. For the nursing profession the importance of
this issue is threefold in nature. The first concern is the overwhelming cost of treating
massive chronic illness among older adults, which is a societal concern. The second
concern is the increased attention of health professionals on strategies for health
promotion aimed at maintenance of a higher quality of life during the older adult years.
Reproduced with permission of the copyright owner. Further reproduction prohibited without permission.

7
The third concern is providing assistance for older adults to overcome the isolation and
resource limitation of living in rural areas.
Chronic Dlness
According to Dychtwald (1999), society is heading towards an era of chronic
illness for the older adult population “that is of epidemic proportion” (p. I). Currently,
over 34 million people are over the age of 65 and that number is projected to increase to
nearly 70 million by the year 2030. The Centers for Disease Control (1993) suggests the
incidence of chronic illnesses will increase for older individuals with most having four or
more illnesses. Dychtwald proposes that a better future is possible for this population
through primary and secondary prevention strategies. Dychtwald (1999) argues that
these prevention strategies could result in improved health and quality of life for the older
adult population.
Strategies for Health Promotion
The U.S. Government is striving to increase the healthy lifespan for Americans,
thereby increasing the number of years a person lives, while ensuring the individual is
healthy throughout those years. One of the major priorities of Healthy People 2010 (U.S.
Department of Health and Human Services, 2000) is the achievement of health promotion
and disease prevention for older adults. Healthy People 2010 is a policy document that
prescribes national health promotion and disease prevention strategies for this decade.
Strategies for health promotion identified in Healthy People 2010 relate to an individual’s
personal lifestyle and maintenance of health and functional independence. The goals of
Healthy People 2010 specific to the older adult are: a) a reduction in symptoms of
chronic illness, such as diabetes; b) an increase in the proportion of individuals who
Reproduced with permission of the copyright owner. Further reproduction prohibited without permission.

8
participate in physical activity; and c) health promotion strategies for reduction of weight
for overweight individuals. In addition, other goals specifically aimed at increasing the
number of people receiving Clinical Preventative Services are directed toward this
population.
Kligman (1990) and Hutchison (1990) recommend that an appropriate
preventative health strategy for an aging population is the promotion of a lifestyle that
focuses on wellness. Kligman suggests ten principles, covering the concepts of primary,
secondary, and tertiary prevention upon which to make decisions in promotion of a health
lifestyle and controlling chronic illness. The primary concepts include identification and
modification of risk factors prior to the onset of signs and symptoms of disease or injury
(i.e.: immunizations, seat belt use, physical activity, high fiber diets, and adequate social
support systems). Secondary concepts include screening for disease processes in the
asymptomatic phase (i.e.: coronary risk factors and osteoporosis). Tertiary interventions
are a means to delay progression of existing disabilities or prevention of further
complications (i.e.: safety issues and exercise).
Walker, Sechrist, and Pender (1987) define health-promoting lifestyle as a
“multidimensional pattern of self-initiative actions and perceptions that serve to maintain
or enhance the level of wellness, self-actualization, and fulfillment of the individual" (p.
79). Pender (1996) points out that there is increasing evidence that individuals can do a
great deal to maintain and promote their state of well being by engaging in a health-
promoting lifestyle. According to Walker, Volkan, Sechrist, and Pender (1988) there is a
need for research to understand what individuals do to protect their own health. They
also indicate that research is needed to determine why some people engage in and
Reproduced with permission of the copyright owner. Further reproduction prohibited without permission.

9
routinely incorporate healthy life style behaviors and why others choose to engage in
health-damaging patterns of behavior.
Heine (1992) reports that health for the older population is multidimensional and
suggests that health promotion is complex. He suggests that health promotion for older
adults should involve physical and mental health issues, the potential to continue
performing activities of daily living (ADLs), and learning about the economic, social, and
the environmental resources necessary to maintain independent lifestyles in their homes.
These health promotion behaviors represent many of the fundamental educational topics
and intervention strategies nurses can offer to the older adults for maintaining and
improving their health and well-being.
Rural Issues
As with most broad problems facing society, there is a segment with greater
needs. In this case, rural older adults tend to have less access to medical care and
information that might promote a wellness-focused lifestyle. Sharp (1991) and Koehler
(1998) point out that there is a substantial proportion (26%) of older adults are living in
rural areas. In addition, there are a substantially high proportion of older adults living in
rural areas compared to urban areas (Sharp, 1991 & Koehler, 1998). Coward,
McLaughlin, Duncan, and Bull (1994) and Mainous (1995) state that rural individuals
tend to be poorer, in worse health status, and less likely to have health insurance than
their urban counterparts. These issues increase the isolation, both geographically and
financially, from health care facilities and health promotion programs for the rural, well
older adult population (Busby, 1992). In addition, the CDC (2001) reports that the
relative scarcity of health care resources in rural communities is a continuing problem
Reproduced with permission of the copyright owner. Further reproduction prohibited without permission.

10
and that it will likely have an enduring negative impact on health outcomes of those
living in the rural areas. Yet, Koehler (1998) notes evidence that the rural elderly are
interested in and often attempt to practice health-promoting behaviors such as exercise,
compliance with medical advice, and taking prescribed medication. Thus, a substantial
number of rural older adults are candidates for programs promoting wellness-seeking
behavior. As health promotion leaders, it is appropriate that nurses pursue solutions for
the most needy of those in a health seeking population.
Falck (1994) proposes that nurses have the opportunity to make a difference in the
well being of this population by emphasizing the basic steps persons can take to maintain
or improve their health and continue to maintain independence and control over their
lives. According to Flack, one of the barriers to the development of health promotion
programs is that the general public remains uninformed regarding the benefits of health
promotion programs for older adults. In addition, these health promotion programs are
not in sufficient numbers, nor are they always accessible to the older adult population
especially those living in rural areas (Coward et al„ 1994).
In summary, behaviors promoting wellness enhance the quality of life during the
later years of life (Dychtwald, 1999). Since the introduction of Healthy People 2010,
various federal and state initiatives have made information about health promotion
strategies more available to the public. However, the effort must reach the most in need,
often rurally located, in order to assure health and wellness in the older adult.
Purpose
Clark (1998) reports that it is not well known what behaviors older adults
purposefully undertake to enhance their state of health and wellness. Clark cites the need
Reproduced with permission of the copyright owner. Further reproduction prohibited without permission.

II
for nurses to perform further research and develop theoretical frameworks for
understanding and providing support for the health-promoting behaviors of older adults.
Mainous (1995) notes that because rural populations are under-served and have difficulty
accessing care, their health status is particularly important. He further purports that
determination of health status of the elderly in the rural setting may be used to predict
services needed for that population in that geographic location. In addition, Weinert and
Burmam (1994) report that there is severely limited rural research, particularly, rural
nursing research, and the knowledge base is seriously fragmented.
The purpose of this study was to examine the relationship between the perceived
health status (Short Form Health Status-36) and the health promoting behaviors (Health
Promoting Lifestyle Profile H) of well older adults in rural settings. In addition,
demographic variables of the population were examined in relation to the health-
promoting behaviors and self-perceived health status.
Research Questions
1. What are the health promoting behaviors of well older adults living in the rural
setting?
2. What is the perceived health status of well older adults living in the rural
setting?
3. What is the relationship of health promoting behaviors and self-perceived
health status for well older adults in the rural setting?
4. What is the profile of the rural older adult person who measures low on the
HPLP H and the SF-36?
Reproduced with permission of the copyright owner. Further reproduction prohibited without permission.

12
Chapter 2
Literature Review
The following review of the literature chapter is designed to inform the reader
about the theories and research that represents wellness/health status and health
promoting behaviors of older adults. First, a review of the research pertinent to wellness
and health status, and the SF-36, which measures perceived health status will be
presented. Second, health promotion and health-promoting behaviors will be addressed.
Third, issues pertaining to rural populations are presented. Fourth, Pender’s Health
Promotion Model (Pender, 1996) is identified and described as the theoretical framework
for the proposed study. Research is then presented where the authors utilized the HPLP,
the HPLP II, and other instruments for measurement of health promoting behaviors.
Finally, literature is reviewed pertaining to how demographic variables impact health
promoting behaviors and perception of health status.
Wellness/Health Status Research
Watt, Verma, and Flynn (1998) used a computerized search of the medical
literature to identify studies from 1980 to 1996 pertaining to wellness and wellness
programs. The studies selected were limited to either prospective studies or randomized
controlled trials. Data extraction for their criteria were based upon the characteristics of
the population; population numbers in each study, including the number followed to
completion; length of follow-up; the type of intervention used in the study; outcome
measures used; and the final results. Watt et al. found only eleven studies that met their
criteria of level 1 (highest quality criteria). Significant statistical levels were reported in
Reproduced with permission of the copyright owner. Further reproduction prohibited without permission.

13
each of the identified eleven studies. Wellness interventions in these studies included the
treatments of exercises, meditation, intercessory prayer, walking, and Tai Chi. Watt et al.
(1998) determined their data was inconclusive due to their inability to control
confounding variables. However, they suggest that the studies they reviewed supported
the use of wellness interventions and that wellness programs may be cost-effective. Watt
et al. proposed that additional research is needed to evaluate wellness programs and their
effectiveness.
Miller (1991) conducted an ethnographic study to determine factors promoting
wellness in the aged person. The researcher sought to determine an understanding of
wellness for aging adults and sought to highlight factors that contributed to their wellness
and healthy aging. Miller identified personal relationships and physical activities as
factors having an impact upon their wellness among the sample of six participants.
Miller found the ethnographic attributes that emerged from the study-included altruism,
resiliency, drive or ambition, hardiness, global concern, and meta aging (self-
actualization). These attributes assist the older individual in self-motivation toward
continued personal growth. Miller concluded from the study that consideration should be
given to promotion of wellness activities for the older adults focusing on their minds and
bodies and the need to maintain relationships with others. She further suggests continued
research in the area of wellness and older adults, especially those with chronic illness, to
maximize the potential for this population. In addition, Miller postulates that there is a
need to understand the concept of wellness for the aging person in order to maximize the
potential of each person in the older adult population.
Reproduced with permission of the copyright owner. Further reproduction prohibited without permission.

14
SF-36
Construction of the Short Form - 36 Health Survey (SF-36) was to satisfy
minimum psychometric standards for group comparisons involving generic health
concepts (Rand Corporation & Ware, 1990). Generic health concepts refer to those
health concepts that are not specific to age, disease, or treatment group (Ware, 2000).
The eight concepts, hypothesized to represent the most frequently measured concepts and
those most affected by disease and treatment (Ware, 1996), were selected from the
original 40 concepts of the Medical Outcomes Study (MOS) (Ware & Sherboume, 1992).
The eight concepts represent operational definitions of health, including distress and well
being, subjective ratings and objective reports, function and dysfunction, and favorable or
unfavorable self-evaluation of health status (Ware, 2000). The eight concepts are
Physical Functioning (PF), Role - Physical (RP), Bodily Pain (BP), General Health (GH),
Vitality (VT), Social Functioning (SF), Role - Emotional (RE), and Mental Health (MH).
Ware (1996) investigated the changes in physical and mental health status of
elderly and poor, chronically ill patients enrolled in Fee for Services (FFS) and Health
Maintenance Organizations (HMO) over a four-year period in the Medical Outcomes
Study (MOS). The MOS was a study of the variations in outcome and practice styles for
FFS care and HMOs in sites located in Boston, Chicago, and Los Angeles and centers
included solo practices, large multi-specialty groups, and small, single-specialty groups.
A total of 28,257 adults were followed longitudinally and physicians specifically
identified patients with hypertension (n-1318), non-insulin diabetes mellitus (NIDDM)
(n-441), myocardial infarction (n-215), and congestive heart failure (n-104), and
depressive disorder (n-444). The summary measures captured 82% of the variance in the
Reproduced with permission of the copyright owner. Further reproduction prohibited without permission.

15
SF-36 scores using intemal-consistency reliability method. The researcher looked at
changes of health by subtracting the baseline from the four-year follow-up scores. The
findings indicated no significant differences in the patients from baseline to follow-up.
Average changes in physical and mental health were not distinguishable between the FFS
and HMO groups. Physical health declined approximately three points and mental health
rose in both systems. The physical decline for the elderly persons was greater than for
the non-elderly, however, mental health for the elderly scored higher than the non-elderly
at baseline, yet, did not improve over time. Ware (1996) suggests that the MOS findings
support the use of the SF-36 as a health status measure in monitoring outcomes across
diverse populations.
McHomey, Ware, Lu, and Sherboume (1994) utilized data from the Medical
Outcomes Study (MOS) to evaluate completeness, quality, test scaling assumptions, and
intemal-consistency reliability for the eight subscales of the SF-36 Health Survey. Data
obtained from 3,445 patients was replicated into 24 subgroups differing in disease
severity, diagnosis, and sociodemographic characteristics. All of the scales passed tests
for item-internal consistency (97%) and item-discriminant validity (92%) across all
patient groups. The range of reliability coefficients was from .65 to .94 across the scales
and varied among patient subgroups. McHomey et al (1994) purports that their findings
support the use of the SF-36 across diverse populations.
Brazier, Harper, Jones, O’Cathain, Thomas, Usherwood, and Westlake (1992) set
out to test the acceptability, validity, and reliability of the Short Form 36 (SF-36) and
compare the results to the Nottingham Health Profile (Hunt, McKenna, & McEwen,
1980) in a study of 1980 patients aged 16-74 years. A postal survey, using a
Reproduced with permission of the copyright owner. Further reproduction prohibited without permission.

16
questionnaire booklet was sent to patients of two general practices. Response rates were
high at 83% with completion rates at 95%. They found the SF-36 to be a reliable
instrument (Cronbach’s alpha greater than 0.85, reliability coefficient greater than 0.75
for all dimensions except social functioning) and for construct validity. Brazier et al.
(1992) report that the SF-36 fulfills stringent criteria of reliability and validity, yet, is
easy for participants to use, and is acceptable to general populations.
The purpose of a study by Weinberger, Samsa, Hanlon, Schmader, Doyle,
Cowper, Uttech, Cohen, and Feussner (1991) was to examine the feasibility of the SF-36
as a health status measure in a convenience sample of twenty-five elderly male veterans.
The veterans’ demographics included a mean age of 73.5 years, 68% white, 68%
currently married, and had a mean income of $7,000. Weinberger et al. compared the
SF-36 data to the Sickness Impact Profile (Bergner, Bobbitt, Carter, & Gibson, 1981) and
found the results highly correlated (overall functioning - r = 0.73, physical functioning -
r = 0.78, and social functioning - r = 0.67). They also noted, however, that the
participants took less time to complete the SF-36 and this made them consider it more
attractive for researchers and participants alike in assessing health status.
Health Promotion/Health Promoting Behaviors
Pender (1996) defines health promotion as the activities that increase the levels of
health and wellness and actualize or maximize the health potential of individuals,
families, groups, communities, and society. Pender proports that health promotion is not
necessarily disease specific, nor health problem specific. Health promotion seeks to
increase the direct, positive potential of the individual’s health status. Walker et al.
(1987) define health-promoting lifestyle as a “multidimensional pattern of self-initiative
Reproduced with permission of the copyright owner. Further reproduction prohibited without permission.

17
actions and perceptions that serve to maintain or enhance the level of wellness, self-
actualization, and fulfillment of the individual” (p. 79).
Clark (1998) examined the self-care behaviors of healthy older adults. Self-care
behaviors are defined by Clark as the methods older adults use to stay well. Clark relates
that there are specific health care behaviors which when associated with specific health
outcomes as a means for individuals to improve their functional status. Using Orem’s
self-care wellness model (Orem, 1971), she elicited data from 28 older, healthy adults
regarding how they stay well. Self-care activities reported in this study included nutrition
knowledge and practice, rest and sleep, stress management, and safety, [n addition, data
was collected regarding supportive relationships, energy and independence, and quality
of life issues, particularly zest for living. Clark reports that in her findings, older adults
associated wellness with independence. However, Clark notes that the generalizability of
the study is limited by the small sample size. She recommends further research in this
area so nurses can develop a framework for understanding and supporting healthy
behaviors is the older adult population. Issues such as self-care behaviors (Clark, 1998)
can influences a persons’ ability and desire to participate in health promoting behaviors.
These issues can propel an individual toward the desired state of wellness. Watt et al.
(1998) report research that promotes the notion that wellness focused education programs
are beneficial for individuals.
Walker et al. (1988) developed and utilized the Health-Promoting Lifestyle
Profile (HPLP) to measure the frequency of health-promoting behaviors of individuals
between the ages of 18 and 88 years of age. They found that older adults reported a
higher total frequency of health-promoting behaviors. In addition, Pender (1996)
Reproduced with permission of the copyright owner. Further reproduction prohibited without permission.

18
indicates that there is increasing evidence that older individuals can do a great deal to
maintain and enhance their well-being and prevent early onset of disabling health
problems by engaging in health-promoting behaviors and changing their lifestyles.
Wellness interventions for this older population can further be accomplished by
reviewing health habits and following-up with counseling and education. Pender suggests
that through participation in health promoting behaviors, older adults would greatly
increase their individual ability to self-motivate and thus improve their competence in
caring for themselves in a responsible manner. In addition, participation in health
promoting behaviors would enhance their ability to remain at home and perform their
activities of daily living independently.
Individuals can play a critical role in determining their own health status by active
participation in self-care activities such as exercise, weight management, and
socialization. Health-promoting behavior decisions made by individuals can shape their
lifestyles, social, and physical environment and lead them into wellness in older
adulthood. According to Pender (1996), an individual’s motivation is a critical factor in
the initiation and maintenance of health-promoting behaviors. In addition. Walker,
Secrist, & Pender (1987) postulated that an individual’s perceived health status may
influence health promotion behavior and provide a desire to maintain their health status.
Pender (1996) states, “the goals of individuals of all ages is the achievement of a
healthy lifestyle” (p. 55). She proposes that nurses need to determine what a healthy
lifestyle is through further research. This can be accomplished by understanding the
current health-promoting behaviors of the well older adult.
Reproduced with permission of the copyright owner. Further reproduction prohibited without permission.

19
Pender's Theoretical Framework and Related Research
Pender’s Health Promotion Model (HPM)(Pender, 1996) is the organizational
framework upon which this research study is based. The Health Promotion Model is
applicable to individuals, families, groups, and communities (Clark, 1996). Pender
describes the Health Promotion Model as an endeavor to delineate the multidimensional
nature of how individuals interact with their environment in the pursuit of health.
Pender’s (1996) model proposes that the cognitive-perceptual status and modifying
factors of an individual are important determinants of participation in health-promoting
behaviors. According to the model, the older adult who values health and desires a
longer, more vigorous life is more likely to participate in health promoting behaviors and
use the services offered in a wellness program.
The Health Promotion Model (Pender, l996)(See Figure 1) is based upon social
cognitive learning theory (Bandura, 1977) in which cognition, affect, actions, and
environmental events are proposed as operating interactively in delivery of a person’s
behavior. Pender (1996) relates that the HPM is an assessment of the relationship
between each independent variable with health promoting behaviors. The HPM is
organized for the individual into three stages of determinants of health-promoting
behavior 1) individual characteristics and experiences, 2) behaviors-specific cognitions
and affect, and 3) behavioral outcomes. According to Pender (1996), individuals
structure the health promoting behaviors as continuous by making them an integral part
of their lifestyle.
Reproduced with permission of the copyright owner. Further reproduction prohibited without permission.

20
Figure 1Pender’s Health Promotion Model
Individual Behavior-Specific BehavioralCharacteristics Cognitions OutcomesAnd Experiences and Effects
relatedbehavior
Personalfactors:biologicalpsychologicalsociocultural
Perceived Benefits Of Action
Perceived Barriers To Action
PerceivedSelf-efficacy
Activity-relatedaffect
Immediatecompeting
demands(low control)
and preferences (high control)
Interpersonal Influences (family, peers, providers): norms, support, models
Commitment to a plan of action
Health-promotingbehavior
Situational influences: options, demand characteristics aesthetics
(Pender.N.Health Promotion in Practice J /E © 1996. p-67) Reprinted with permission of Pearson Education. Inc. Upper SaHrilf River NJ______________
Reproduced with permission of the copyright owner. Further reproduction prohibited without permission.

21
Individual Characteristics and Experiences
Pender (1996) states “each individual has unique experiences and personal
characteristics that have an impact on their actions” (p. 66). The stage of determinants,
individual characteristics and experiences, is divided into prior related behavior and
personal factors (Pender, 1996, p. 66).
1. Prior related behavior that may be due to habit formation. Habit formation
predisposes the individual to engage in the activity automatically.
2. Personal factors include biological, psychological, and sociocultural variables.
Biological variables include age, gender, body mass index, strength, agility, balance, and
others. The psychological factors include self-esteem, self-motivation, perceived health
status, or personal competence. The sociocultural variables include race, education, or
socio-economic status.
Behavior Specific Cognitions and Affects
The six behavioral-specific cognition and affect variables of the HPM, include the
perceived benefits of actions, perceived barriers to action, perceived self-efficacy,
activity-related effect, interpersonal influences, and situational influences (Pender. 1996,
p. 68). Pender (1996) reports, “these variables can be targeted for modification by
nursing actions, thus constitute a critical core for intervention” (p. 68).
1. Perceived benefits of action refer to the anticipated benefits or actions that will
occur for the individual participating in the health-promoting behavior.
2. Perceived barriers to action may be imagined or real and may include
inconvenience, expense, or difficulty of performing the task for the individual. If the
barrier is perceived by the person as high and benefits considered low, the health-
Reproduced with permission of the copyright owner. Further reproduction prohibited without permission.

promotion behavior is unlikely to occur and vice-versa, if the barrier is considered low
and benefits high, the behavior will most likely be performed.
3. Perceived self-efficacy is referred to as individuals’ judgment of their personal
capacity to perform the activity.
4. Activity-related affect is how individuals feel with the activity or personal
knowledge of the activity.
5. Interpersonal influences refer to opinions of family, peers, providers or the
norms, support, models refers to the beliefs and attitudes of others. For example, if an
individual’s family members have a high value placed on group exercise and activities
and participated in these activities together for years, this individual is more likely to
participate if the opportunity arises.
6. Situational influences are the options, demand characteristics, and aesthetics in
the environment. Thus answering the questions regarding safety and reassurance for the
individual.
Behavior Outcomes
The third stage of the HPM is the initiation of a behavioral event for the
individual. Pender (1996) states, “unless there is a competing demand or competing
preference, the individual will start and carry through on the behavior”(p. 72).
Behavioral outcomes, includes the immediate competing demands and preferences,
commitment to a plan, and health promoting behavior (Pender, 1996, p.72). Immediate
competing demands refers to other behaviors which an individual has little or no control
over. This could involve a change in exercise class to a time that the individual has other
plans. Competing preferences is dependent upon the individuals ability to be self-
Reproduced with permission of the copyright owner. Further reproduction prohibited without permission.

23
regulating. This couid involve selection of a high fat food in place of a low fat
alternative. According to Pender, Murdaugh, and Parsons (2002), these alternative
behaviors can disrupt or delay the performance of a health promoting behavior by the
individual.
1. What are the thoughts of alternative behaviors, which intrude into the
individual’s consciousness immediately before the health-promoting behavior occurs?
For example, if the individual just does not feel like performing the behavior at that
particular moment or chooses to do something else, thus choosing not to engage in the
activity. An example of this might be an individual’s plan to attend exercise class at the
local community center and a friend calls and suggests going out for lunch rather than
attending the exercise class.
2. The commitment to a plan of action propels the individual to act on the health-
promoting behavior, the self-determination of the individual. Pender et al. (2002) suggest
that success of a plan of action depends greatly upon associated strategies to energize and
reinforce health-promoting behaviors.
3. Health-promoting behavior means the individual actually performs the
behavior and attains a positive health outcome.
Several researchers have performed studies to test Pender’s Health Promotion
Model with the purpose to understand behaviors and guide intervention programs (Lusk,
Kerr, Ronis, & Eakin, 1999, Eakin, Brady & Lusk, 2001, McCullagh, Lusk, & Ronis,
2002). McCullagh et. al. (2002) tested the HPM for its use of hearing protection in
farmers and found that each of the cognitive-affective factors that were included in their
study were specifically predicted use of hearing protective devices (HPD). Interpersonal
Reproduced with permission of the copyright owner. Further reproduction prohibited without permission.

24
influences, barriers and situational influences correctly predicted HPD use in 78% of
their sample (McCullagh et. al, 2002). McCullagh et. al.(2002) reports that value of use,
barriers to their use, self-efficacy of the individual, perceived health competence, age,
and gender were significant predictors of use of HPDs for this sample. Utilizing the
results of the McCullagh et. al. study, Lusk et. al. (1999) designed a training program to
increase HPD use among factory workers utilizing the strongest predictors of the HPM.
Those predictors included predicted noise exposure, self-efficacy, barriers to use, value of
use, and modeling of use. In addition, Eakin, Brady, and Lusk (2001), created a tailored
multimedia, computer based intervention for motivating behavior change in use of HPD
for a large mid-western automotive factory utilizing several aspects of Pender’s Health
Promotion Model. Eakin et. al (2001) report that provision of a tailored, behavior-change
intervention by computer was well accepted and effectively implemented for their sample
of workers and suggest that this type of intervention for health promoting in the future.
According to Pender (1996), this model (see Figure I) helps explain under what
circumstances and why people take health-promoting actions. For the proposed study,
two sections of the HPM will be the focus of this preliminary research. The first
construct under study is the outcome of Health Promoting Behaviors listed under
Behavioral Outcomes. Pender (1996) reports that an individual’s health promotion plan,
which identifies lifestyle strengths and resources, can be determined by examining the
individuals’ the profiles of means on the HPLP II. The HPLP II will measure the
behavioral outcome of health promoting behaviors for the study participants. The health
promoting behavior is considered the end-point or action outcome in the HPM (Pender,
1996) and is ultimately aimed at attaining positive health outcomes for the individual
Reproduced with permission of the copyright owner. Further reproduction prohibited without permission.

25
(Pender et. al, 2001). In addition, Pender (1996) proposes that the HPLP II can provide
information on areas for future growth for the individual. In this study, the Health
Promoting Behaviors will be operationalized in the HPLP II.
The second construct relates to the Personal Factors, listed under the Individual
Characteristics and Experiences. The Personal Factors of each individual, as identified
by Pender (1996) include biological, psychological, and sociocultural variables.
Biological variables include age, gender, body mass index, strength, agility, balance, and
others. The psychological factors include self-esteem, self-motivation, perceived health
status, or personal competence. The sociocultural variables include race, education, or
socio-economic status. The Personal factors have an impact upon maintenance of health
promoting behaviors (Pender, 1996). In the present study, the perceived health status will
be operationalized with the SF-36 Health Status Survey.
Fowler (1997) suggests a need for further research examining the aspects of
health promoting behaviors and it’s relationship to perceived health status. Many
researchers have utilized the HPLP as a tool to determine health-promoting behaviors in
their research (Felton, Parsons, Misener, & Oldaker, 1997; Duffy, 1988,1993: Ahijevych
& Bernhard, 1994; Lookinland & Harms, 1996; Padula, 1997; McManus, 1996; Foster,
1992; Riffle, Yoho, & Sams, 1989; Frauman & Nettles-Carlson, 1991). Other
researchers, (Fowler, 1997; Larouche, 1998; Stuifbergen & Roberts, 1997) have utilized
the HPLP H to identify health promoting behaviors for their studies. Another group of
researchers, (Conn, 1998; Morgan, Dallosso, Bassey, Ebrahim, Fentem, & Arie, 1991;
Melillo, Futrell, Williamson, Chamberlain, Bourque, MacDonnell, & Phaneuf, 1996;
Melillo, Williamson, Futrell, & Chamberlain, 1997; Wilson-Ford, 1992; Bausell, 1986)
Reproduced with permission of the copyright owner. Further reproduction prohibited without permission.

26
have used various other tools to study perceptions of health and health promoting
behaviors. None have utilized the HPLP II to examine the health promoting behaviors of
the well older adult living in the rural setting. Nor have any of the reported research
studies used the most recent version of Pender’s Health Promotion Model (1996) as the
theoretical framework for their studies.
HPLP
Felton et al. (1997) compared the health promoting behaviors, values, and health
definition of white and black female students of similar socioeconomic backgrounds in a
study performed at a southeastern university. No difference was revealed in their
research in paired t-tests of the black and white students (r = 1.819, p- 0.07). They
ranked health in importance with values on health, self-respect and inner
harmony/happiness in the top three categories. Results of the Bonferroni method (a =
0.05, a = 0.05/4 = 0.012) showed no differences in the student’s definitions of health.
Felton, et al. determined the women had similar values regarding health, definitions of
health, and levels of self-actualization, exercise, stress management, and health
responsibility. However, they found fewer interpersonal, social supports (t = 2.77, p =
0.007) and nutritional practices (t = 4.88, p = 0.0001) among the black females than the
white females. These findings indicate that the black and white students’ report similar
definitions of health and health value. In addition, the findings supported similarities in
health promotion practices of health responsibility, stress management, exercise, and self-
actualization.
Duffy (1988,1993) has presented two studies investigating the determinants of
health promoting behaviors. In the earlier study (1988), she analyzed health locus of
Reproduced with permission of the copyright owner. Further reproduction prohibited without permission.

27
control, self-esteem, and health status for their impact upon health promoting lifestyles of
middle-aged women. The study supported the relationship proposed in Pender’s Health
Promotion Model between health locus of control, self-esteem, and their influence on
health status and health promoting behaviors. Canonical correlational analysis was used
by Duffy (1988) to examine the relationship of the six health promotion subscales and the
predictor variables. Self-esteem, health outlook, current health, and internal locus of
control were positively related and strongly influenced the first variable. With a
canonical variable of .78, the first variable accounted for 36.3% of the explained
variance. On the other hand, chance locus of control was inversely related to the health-
promoting behaviors of self-actualization, interpersonal support, and exercise. The
second variate was influenced by health worry/concern and age of the respondent
explained 36.5% of the variance with a canonical correlation of .66. The combination of
the two variates explained 73% of the variance in scoring. Duffy concluded that those
participants that scored high on self-esteem, internal locus of control, and reported health
status, and scored low on chance health locus of control concurrently were those that
scored high subscales on self-satisfaction, nutrition, exercise, and interpersonal support.
In contrast, the older subjects reported high health worry/concern, poor health status, and
had low health locus of control scores had high scores on the health promotion subscales
of health responsibility, nutrition, and stress management. Duffy’s findings support the
posits of Pender’s 1982 version of the Health Promotion Model in that individuals’
perception of health locus on control, self-esteem, and health status influence health
promoting behavior.
Reproduced with permission of the copyright owner. Further reproduction prohibited without permission.

28
In the later study, Duffy (1993) investigated the determinants of health-promoting
lifestyles of the older person. The Health Promoting Lifestyle Profile (HPLP) instrument
developed by Walker et al. (1987) was used. Canonical correlation tests confirmed all of
the relationships that were hypothesized by Duffy, however, direction was not predicted.
Six canonical correlations were reported in the findings. The first canonical variate
indicated that participants reporting good health and had high self-esteem were more
likely to report practices of self-actualization, interpersonal support, nutrition, stress
management, and exercise as health promoting behaviors (61.5 % of variance). The
results indicated older persons with high internal locus of control and self-esteem
practiced a greater number of health promotion strategies. In addition, men with higher
incomes and higher self-esteem (second variate, explaining 19.6% of variance) often
exercised more or ate better despite the existence of poorer health. The third variate,
which explained 7.8 % of variance, showed older married individuals with higher locus
of control and higher incomes were more likely to engage in exercise, stress
management, and took more responsibility of their health. On the other hand, the older
married individuals demonstrated a decrease in participation of health promoting
behaviors when it related to interpersonal support of their spouse or significant other.
The remaining three canonical correlations were low and non-significant, however, the
first three explained 88.7% of the variance. These findings again provided direct support
for the relationships proposed by Pender’s 1982 version of the Health Promotion Model.
Padula (1997) examined fifty-nine elderly couples and their participation in health
promoting activities. Padula sought to determine the predictors of participation in health
promoting activities for this population of n= 55 (White) and n= 4 (Black) couples, ages
Reproduced with permission of the copyright owner. Further reproduction prohibited without permission.

29
ranging from 54 to 86 yean. Measures used included perceived health status, value of
health, health locus of control, social support, relationship quality, spousal influence, and
the HPLP (for participation in health promotion activities). Cronbach’s Alpha
reliabilities reported for the HPLP subscales were; self-actualization (a= .87), health
responsibility (a= .81), exercise (a = .75), nutrition (a = .66), interpersonal support (a =
.76), stress management (.74), and total scale (a = .93). The results indicated that
perceived health status was a strong indicator of participation in health promoting
activities (Walker, et al., 1988; Frank-Stromberg, Pender, Walker, & Sechrist, 1990).
Padula reports that various demographic variables contributed significantly to the health
behaviors for the elderly couples. Years of education for the individual (f = 2.83,
significance level - .005) was found to have a significant impact as reported in a previous
study (Walker et al, 1988). For this population, gender, was not found to have
significance. The quality of the spousal relationship (t = 3.07, significance level - .002)
was found to be a strong predictor of health promoting behaviors. Padula reports a belief
that the spousal relationship may be a contributing factor to health behaviors and
recommends further research in this area.
Ahijevych and Bernhard (1994) cite the limited information regarding health-
promoting behaviors of African American women as the rationale for studying this
population. The purpose of their study was to identify health promoting behaviors of this
population and compare their findings with other results using the Health-Promoting
Lifestyle Profile (HPLP) instrument (Walker et al., 1987). The results demonstrated that
the African American women performed fewer health-promoting behaviors than
previously reported for other groups in the literature. The other groups included older
Reproduced with permission of the copyright owner. Further reproduction prohibited without permission.

30
adults, work site populations, middle-aged adults, young adults, and women smokers.
The findings from the study for the HPLP subscale means were: Self-actualization {M -
2.89, SD = .53, Cronbach’s Alpha - .89), health responsibility (Af = 2.34, SD = .58,
Cronbach’s Alpha - .83), exercise (M= 1.95, SD - .65, Cronbach’s Alpha - .79), nutrition
(Af= 2.37, SD = .56, Cronbach’s Alpha - .72), interpersonal support (M= 2.90, SD = .59,
Cronbach’s Alpha - .84), stress management (Af= 2.45, SD = .55, Cronbach’s Alpha -
.76), and total HPLP (Af= 2.55, SD = .45, Cronbach’s Alpha - .95). Ahijevych and
Bernhard propose further research to determine health-promoting strategies for this and
other populations. In addition, they suggest the need is evident for innovative strategies
to strengthen nutrition, exercise, stress management, interpersonal support, and self-
actualization among African American women and to reinforce health-promoting
responsibility for all populations.
Health promotion and life satisfaction in elderly black adults was the focus of a
study by Foster (1992). The findings supported earlier work that perceived health status
is comparatively important with life satisfaction among this particular black elderly
population. The alpha scale for the total HPLP was .90 and subscales ranged from .65 to
.81. Self-actualization subscale received the highest alpha (.81). Second highest in
scoring was the Health Responsibility subscale at .73. No significant correlation was
found between the perceived health and health promoting behaviors. Foster measured
respondents’ perception of health with the Current Health Scale (Davies & Ware, 1981).
The findings in this section of the study remained at an alpha coefficient of .88, as per the
study by Davies & Ware (1981). Foster indicated that the high ratings on life satisfaction
(.74) and perceived health status (.88) may indicate a population that is experiencing
Reproduced with permission of the copyright owner. Further reproduction prohibited without permission.

31
healthy aging. In the discussion of the findings, the author comments upon the
difficulties encountered in the study. In the tool used, the HPLP, there was no mention of
home remedies, which Foster indicates is often attributed to the elderly black population.
Nor was there an opportunity to cite particular life situations that may have an impact
upon racial and other restraints as they were growing up. Foster determined that the
possibility exists that the tool (HPLP) used was not appropriate for the black elderly
population. However, Foster does make note that this study is a good beginning in
research in the black elderly population.
The relationship of health-promoting behaviors, perceived social support and self-
reported health of the Appalachian elderly was the focus of a study by Riffle et al. (1989).
One of the hypotheses postulated was that health-promoting behaviors of this population
were positively related to their self-reported health. Riffle et al. report that their findings
indicate that the participants who were younger and better educated did participate in
health promoting behaviors. Health promoting behaviors were also significantly related
to self-reported health measures (r = .0.2205; p = 0.0103). This research study utilized
the HPLP as a quantitative measure and three questions regarding health as a qualitative
measure. The average HPLP score was 135.408 (range of 74-182). The means of the
subscales were: self-actualization (39.727), health responsibility (26.454), exercise
(10.261), nutrition (18.274), interpersonal support (20.800), and stress management
(19.863). The qualitative section examined the relationships between subjective and
objective health ratings. Significant positive relationships between self-reported health
(mean score of 6.550) and the HPLP subscales of self-actualization and exercise were
also reported. Riffle et al. concluded from their results that active assessment and
Reproduced with permission of the copyright owner. Further reproduction prohibited without permission.

32
intervention of the needs of the Appalachian elderly, at nutritional sites, must be done by
nursing and social support services. In addition, Riffle et al. proposed further research is
needed focused upon the health promotion practices of the elderly population. They
suggest studies focused on the various age groups of elderly (young, old or old, old) and
compare those results to determine if various elderly age groups perform different health
promoting behaviors. They also suggest that studies in different geographic locations
should be executed.
Frauman and Nettles-Carlson (1991) sought to determine predictors of a health
promoting lifestyle in a randomized sample of well clients in a nursing practice. The
participant’s mean age was 39.7 years of age. Health promoting behaviors were
measured with the HPLP (Walker et al., 1987). Perceived control of health was
measured by the Multidimensional Health Locus of Control Scales (MHLC) developed
by Wallston, Wallston, Kaplan, and Maides (1976). In addition, Frauman and Nettles-
Carlson (1991) sought to determine what value the participants placed upon the
importance of health compared to other values such as happiness and freedom by using
Wallston’s 10-item value survey. Laffrey’s Health Conception scale (1986) was used to
measure the participant’s definition or conception of health. The result of this study
indicated no significant association between age, race, gender, or urban vs. rural
residency in the mean HPLP scores (129.6, range of 48-192). Higher income and more
education were found to make a difference in health promoting lifestyle behaviors in this
population (adjusted R 1 = .15, p = 0.0005). No relationship was found between the
participants’ health value and their health promoting behaviors. However, the findings
did support a relationship for the participants’ perceived control of health and
Reproduced with permission of the copyright owner. Further reproduction prohibited without permission.

33
engagement in health promoting behaviors. They determined that when clients defined
their health status as being well it predicted a health promoting life-style. Based upon
their findings, Frauman and Nettles-Carlson report that a “patient's concept of what being
healthy means influences behavior” (p. 178). Frauman and Nettles-Carlson propose
further research is necessary focusing on changeable factors influencing health behaviors
of individuals. They also recommend designing and testing interventions focused upon
achievement of healthier lifestyles for clients.
More pertinent to the proposed study, McCade, Walker, and Clark (1997) used
the HPLP with an older population living in long term care facilities. Their study was
two-fold in its’ purpose. First, McCade et al. (1997) wanted to determine the frequency
of health promoting behaviors among the older adults residing in long-term care
facilities, then, to determine the degree to which perceived control of health, definition of
health, and perceived health status explained the respondents health-promoting lifestyles.
The researchers used the Multidimensional Health Locus of Control Scale (Wallston,
Wallston & DeVellis, 1978), which measures the individual’s control of their health in
three dimensions (internal, external-chance, and external-powerful others) and the
Laffrey Health Conception Scale (Laffrey, 1986) to measure definitions of health. The
respondents mean scores were highest on HPLP II subscales of self-actualizing (3.3) and
interpersonal support (3.3). In addition, high scores were reported for internal (51.7),
powerful others (50.2), and for the wellness definition of health (104.6). Twenty-five
point two percent of the variance in the health-promoting lifestyle for the long-term care
residents was explained by the cognitive perceptual variables. The definition of wellness
made a significant independent contribution (P = .399). One of the subscales, nutrition.
Reproduced with permission of the copyright owner. Further reproduction prohibited without permission.

34
was not included in the study, due to an unreliable alpha coefficient for this sample
(possibly due to diet prescriptions or environment). However, for the other five
subscales, regression explained 20.0% of the variance in health responsibility and 23.0%
in self-actualizing behavior. Of the remaining subscales, exercise, inter-personal support,
nor stress management no significant amount of variance was explained. Thus, McCade
et al. concluded that the most frequently practiced health promoting behaviors for this
population was interpersonal support behaviors and self-actualizing behaviors, and the
least practiced behavior was exercise (2.4). Their findings suggest that residents of
long-term care facilities have an interest in practicing health promoting behaviors and
maintain that the focus of nursing diagnoses should include promotion of health
promoting behaviors for this population. In addition, the residents’ sense of control over
their health is another issue that the staff of long-term care facilities should focus on for
this population. McCade et al. suggest that the results of this study are a good baseline of
health promoting information for residents of long-term care facilities and that further
study could make a difference in health outcomes and quality of life for this population.
HPLP II
In a more recent study, Fowler (1997) sought to determine the relationship
between hope and health-promoting lifestyles in adults with various stages of Parkinson’s
Disease (PD). One of the instruments used was the Health-Promoting Lifestyle Profile II
(HPLP II). Participants scored a high level of hope (mean score - 38, range of 27 - 46).
Similarly, the total HPLP II mean score (2.85, range of 1.93 - 3.65) was moderately high
for health-promoting behaviors. The hypothesized relationship between hope and
health-promoting behaviors was supported by the findings. Subscale mean scores for the
Reproduced with permission of the copyright owner. Further reproduction prohibited without permission.

35
HPLP II included interpersonal relations (3.01), nutrition (2.99), health responsibility
(2.94), spiritual growth (2.92), stress management (2.88), and physical activity (2.33).
The patients in the study tended to remain hopeful despite the limitations of PD and
continued their participation in health promoting behaviors. Action, the actual
participation in an activity, was conceptualized in this study as a health-promoting
lifestyle. The participants in the study included mostly older adults, however, for this
study the participants had Parkinson’s disease in combination with being an older adult.
Fowler recommends further research is needed with the focus being on the outcomes of
hope and its’ relationship to other health promoting behaviors such as well being.
Larouche (1998) examined the determinants of health promoting lifestyles of
college students. Larouche’s Findings indicate that the health behaviors of college age
students are considered excessive, risk-taking behaviors. These identified high-risk
behaviors included binge-drinking, drinking and driving, smoking, and recreational drug
use all of which place this population at a higher risk for disease and premature death.
Larouche utilized the HPLP II and a demographic data sheet to collect personal data,
such as: college major, grade point average (GPA), and the participants’ perceived health
status. Perceived health status was determined by asking the participants a single
question “How do you rate your overall health at the present time?” (p. 38). For the
college students, the highest mean scores on the subscales were found in spiritual growth
(3.1) and interpersonal relationships (3.0). The lowest mean scores were in stress
management (2.3) and health responsibility (2.2). Correlational analysis, analysis of
variance, and multiple regression were used to examine the effects of four independent
variables (gender, perceived health status. Grade Point Average (GPA), and major of
Reproduced with permission of the copyright owner. Further reproduction prohibited without permission.

36
study) on the seven dependant variables (HPLP II six subscales and total score).
Larouche found that the college students in his study, who reported excellent health,
exercised regularly, noted a greater sense of purpose in life, had lower stress levels, and
indicated they utilized a greater number of health-promotion activities (mean - 2.8, p =
.0004). On the other hand, Larouche found those students, who reported poor health, had
higher stress levels, and reported participation in fewer health-promoting activities (mean
- 2.4, p = .0004).
In a research study exploring the health promotion behaviors of women with
Multiple Sclerosis (MS), Stuifbergen and Roberts (1997) utilized the HPLP II. The
women in the study were grouped according to their current clinical course and frequency
of health-promoting behaviors. Stuifbergen and Roberts sought to test the hypothesis that
quality of life and the health- promoting behaviors the women utilized had a direct
relationship with the illness severity for the women with MS. Total HPLP II scores and
subscales were compared, by Stuifbergen and Roberts to findings in a study by Walker
and Hill-Polerecky (1996) of a normative sample of /i = 712. The women with MS
scored higher means than the normative sample on the subscales of interpersonal
relationships (3.08) and stress management (2.69), whereas total HPLP H scores were
lower (2.63 vs. 2.69). The researchers concluded that the impact of living with such a
chronic disability had a major effect on the performance of their health promoting
behaviors. The researchers further suggest that health care professionals must find
effective strategies to promote the initiation and maintenance of health promoting
behaviors for persons with MS and other chronic conditions. They suggest that these
activities of health promotion will enhance overall well being for these populations.
Reproduced with permission of the copyright owner. Further reproduction prohibited without permission.

37
Stuifbergen and Roberts further identify the need for research to explore factors that
enhance initiation and continuation of health promoting behaviors.
Other Instruments
In a research study using other tools. Conn (1998) reported that health-promoting
behaviors such as exercise increased accordingly to the individual’s self-efficacy beliefs.
Conn defines self-efficacy as the conviction or belief by individuals that they can execute
a behavior successfully. Although the study was proposed to develop and test the
predictive ability of Bandura’s Social Cognitive Model (Bandura, 1977), Conn correlated
self-efficacy beliefs of individuals to indirect influences of age, barriers, and lifelong
leisure exercise among the study population of older adults.
Bandura’s Social Cognitive Model (Bandura, 1977) suggests that by determining
the beliefs of the individual, an understanding of health behavior will become evident.
Conn (1998) postulates that an individual’s participation in the activity is strongly
influenced by the individual’s ability to perform the behavior and the beliefs regarding
the consequences of performing the behavior. The study concluded the need to look at
the importance and value individuals place on perceived barriers and how it becomes a
deterrent for that individual’s participation in exercise. In addition. Conn suggests
research is needed to develop successful strategies for the older adult to overcome the
deterrents that lead to less participation in exercise.
Specific health promoting behaviors such as exercise for the older adult
population is another area under study. In a group of elderly men and women living at
home, Morgan et al. (1991) found a significant positive correlation between activity and
functional status. In addition, Melillo et al. (1996) developed a self-assessment tool that
Reproduced with permission of the copyright owner. Further reproduction prohibited without permission.

38
examined the perceptions of physical fitness and exercise activity among older adults.
Mellillo, Williamson, Futrell, and Chamberlain (1997) extended the research in another
study. Their research was motivated by an assumption that there is a need for a specific
instrument that would measure the perceptions of older adults regarding barriers and
motivators toward physical activity. Melillo et al. (1997) reported that their study
participants viewed physical fitness as an essential component in the their concept of
wellness. Morgan et al. (1991) notes that a scant amount of literature is available which
speaks directly to how and why older adults participate in specific health-promoting
exercise regimens to maintain their physical fitness or why they continue in exercise
programs.
In a comparative telephone survey of 1.254 adults of varying ages including older
adults, Bausell (1986) found that the older adults tended to comply with 20 recommended
health-seeking behaviors than did their younger counterparts. However, this same
population expressed they had very little control over their health. Bausell concluded that
a possible reason for the increased compliance in use of health seeking behaviors by this
population might be that the individuals who have survived into older age may have done
so by means of taking better care of themselves by maintaining health promoting
behaviors. Another factor suggested by Bausell was the high degree of importance the
older adult population places upon health-seeking behaviors.
Wilson-Ford (1992) utilized personal interviews to examine health-protective
behaviors in rural black elderly women. Data was collected on personal health care
practices, health beliefs, and health self-perception. The results of the study indicated
that rural black elderly women perform a mixture of health behaviors that range from
Reproduced with permission of the copyright owner. Further reproduction prohibited without permission.

39
those that protect health to those that harm health. Wilson-Ford deduced that the range of
health behaviors for this population is affected by their health beliefs, which can be
attributed to sociocultural circumstances of the rural community. Many of the health
behaviors chosen appeared congruent with independence and self-reliance theory that
often leads rural black elderly women to ignore symptoms and failure to seek out medical
care until the conditions becomes disabling. Another finding was that living by religious
principles and prayer related to the importance of health for this population. Wilson-Ford
refers to the social and structural barriers, such as transportation and financial resources,
as limitations for seeking health care and health promoting behaviors. This includes
transportation and financial resources. An unexpected finding of the study was the fact
that the older, elderly women (80-89 years of age) performed more health promoting
behaviors than those younger (60-69 years of age). The author suggests further research
is necessary in the area of rural elderly. Wilson-Ford comments that services for the rural
elderly are frequently fragmented and often non-responsive to the overall needs
pertaining to social, emotional, cultural, and socioeconomic perspective of the rural
elderly.
Demographic Variables
Numerous studies have looked at demographic variables as determinants of health
status and participation in health promoting behaviors (Padula, 1997). These
demographic variables include education (Frank-Stromberg, Pender, Walker, &
Sechrist,I990; Walker et al, 1988), age (Miller, 1991), gender (Walker et al, 1988), and
marital status (Padula, 1997). In addition, several studies have examined health status
and health promoting behaviors in reference to urban vs. rural locations (Mainous, 1995;
Reproduced with permission of the copyright owner. Further reproduction prohibited without permission.

40
Coward, McLaughlin, Duncan, & Bull, 1994). Further exploration of the relationships of
demographic variables will provide knowledge and understanding for development of
future health promotion programs and intervention strategies for nurses and health care
providers working in the rural areas.
As recently as August 2000, the National Institutes of Health (NIH, 2000)
provided a Profile of Older Americans from 1998 in which they report that compared to
the general public, twenty seven percent of older persons assess their health status as fair
to poor. In reference to race, older African-American persons (41.6%) and older
Hispanics (35.1%) are found to rate their health as fair or poor compared to Whites
(26%). They also report that little difference in health perception between genders is
noted in the older adult population. However, Walker et al (1988) determined that gender
was a strong predictor in health perception and health promoting behaviors for the older
adult.
According to Speake, Cowart, and Pellet (1989), demographic variables are found
to be associated with and influence the decisions made by the older adult to engage in
health promoting behaviors. Speake et al examined the demographic variables of age,
gender, marital status, race, education, and income in a study of 297 elderly volunteers,
as modifying factors in a person’s decision to engage in health promoting behaviors.
They examined the relationship of demographics and the Multidimensional Health Locus
of Control Scale (MHLC) developed by Wallston, Wallston, and DeVellis (1978). Race
and education were significantly associated with the internal subscale of the MHLC.
Those with a higher internal locus of control included Caucasians and individuals with
higher education levels. The subscale scores for higher chance and powerful others were
Reproduced with permission of the copyright owner. Further reproduction prohibited without permission.

41
associated with those participants that were older, female, unmarried, black, and having
fewer children. Better present health perception was associated with those participants
that were Caucasian, younger, female, married, and having more education. The Black
participants identified with more positive perceptions of their health status in the past.
The demographic variables of race and education were found to be significant predictors
of participation in health promoting behaviors. In addition, they report that the
participants’ perception of health status correlated with the demographic variables.
Speake et al. (1989) suggest the findings of their study support the posits of Pender’s
Health Promotion Model. This refers to the perceptive-cognitive modifying factors, that
when modified by the demographic variables or each individual’s personal factors, do
have an influence an individual’s decision to engage in health promoting behaviors.
McHomey, Ware, Lu, and Sherboume (1994) utilized data from the Medical
Outcomes Study (MOS) to evaluate completeness, quality, test scaling assumptions, and
intemal-consistency reliability for the eight subscales of the SF-36 Health Survey. Data
obtained from 3,445 patients was replicated into 24 subgroups differing in disease
severity, diagnosis, and sociodemographic characteristics. Sociodemographic
characteristics were analyzed separately. They included age (<65,65-74, and > 75), race
(white, black, and other), education (<8m grade, 9-11th grade, 12th grade, and > 12th
grade), and poverty status. Additional characteristics included diagnosis (hypertension,
congested heart failure, myocardial infarction, diabetes, clinical depression, and
symptomatic depression), and disease severity (uncomplicated medical, complicated
medical, psychiatric and uncomplicated medical, and psychiatric and complicated
medical).
Reproduced with permission of the copyright owner. Further reproduction prohibited without permission.

42
Completeness of data was lower among older adults (all scales), those with < 9th
grade education (all scales except Physical Functioning), black patients (Physical
Functioning, Role Physical, General Health, Vitality, & Role Emotional), and those in
poverty (Physical Functioning, Role Physical, Vitality, & Role Emotional). In addition,
data completeness was lower for females than males (except for Social Functioning &
Mental Health). McHomey et al. (1994) determined by multiple regression that age,
education, and poverty remained independent predictors of data completeness. This
information identifies the need to assure that participants understand and are supported to
fully complete questionnaires.
In a study examining the relationship of health promoting behaviors and
demographic variables of African-American rural women, Frank, Stevens, and Lee
(1998) determined that the participants with higher incomes and higher levels of
education exhibited an increased level of health promoting behaviors. They found that
for the variable of age, that as age increased the scores on self-actualization and
interpersonal support decreased. This might be indicative of the fact that as age
increases there is an increased number of women living alone due to death of a spouse,
siblings, and parents. This decreases their source for interpersonal support and may lead
to a decreased perception of their health status and thus, leading to a decreased
participation in health promoting behaviors. On the other hand, they found that as age
increased, health responsibility increased, which might lead to an increase in health
promoting behaviors. In both cases, the findings by Frank, Stephens, and Lee support the
need for continued study.
Reproduced with permission of the copyright owner. Further reproduction prohibited without permission.

43
In contrast to the findings by Frank et al. (1998), Frauman and Nettles-Carlson
(1991) in a study of 130 well adults in a Clinic setting examined the relationship between
variables of age, race, gender, and rural versus urban residence and health promoting
behaviors. It was determined that no significant relationship occurred with these
particular variables. They did determine that the participants with higher educational
levels and incomes did participate in an increased number of health promoting behaviors.
The findings of this study are limited however, in that the population size is relatively
small. In addition, the population mean was 39.4 years of age and the findings may not
be completely applicable to those participants over 60 years of age.
The research focused on rural individuals is very limited. As reported earlier,
rural individuals end to be older, in worse health status, and are less likely to have health
insurance than their counterparts living in metropolitan areas (Coward, McLaughlin,
Duncan, and Bull, 1994). According to Bushy (1996), traveling great distances to obtain
services, lack of outreach services, unpredictable weather, inability to pay for care, and
providers’ attitudes and knowledge levels regarding rural issues are some of the barriers
experienced by those individuals in the rural community.
Mainous (1995) found in a telephone survey of 1000 rural elders in Kentucky,
that indeed they reported significantly poorer health than their urban counterparts. The
findings also determined that these elderly persons indicated not only physical
functioning was lower, but emotional functioning and well-being were also worse for the
rural population.
These barriers in health care attainment and the present condition of their health
status promote the notion that these individuals are an extremely vulnerable population.
Reproduced with permission of the copyright owner. Further reproduction prohibited without permission.

44
Research such as the proposed will increase the knowledge and understanding of these
factors and their relationship with health status and health promoting behaviors that
contribute to the vulnerability of the rural older adult.
The research looking at relationships between health status, health promoting
behaviors, and the demographic variables of age, gender, marital status, and education
demonstrates similarities and differences in the findings. These findings and the lack of
strength of many of the studies further demonstrates the need to continue research and
foster knowledge building regarding the relationships of health status, health promoting
behaviors, and demographic variables. In addition. Long (1993) and the National Rural
Health Association (1999) posits that research for vulnerable populations such as those in
rural locations is also lacking in numbers and depth. There is a need to identify
intervening variables, understand the relationships, and then determine their influence on
the health status and health promoting behaviors to develop strategies and interventions.
By being proactive, nurses can use these research based strategies to promote well being
for the growing number in the older adult population, particularly those residing in the
rural setting where health care resources are limited.
Summary
An overview of the research and empirical information about health status,
wellness, health promotion, health promoting behaviors, and demographic variables has
been reported in this literature review. In addition, the review of Pender’s Health
Promotion Model provides further insight into the individual characteristics and
experiences and the behavior-specific cognitions and affects of an individual as important
determinants of participation in health-promoting behaviors. Research was presented
Reproduced with permission of the copyright owner. Further reproduction prohibited without permission.

45
using the Health Promoting Lifestyle Profile and the updated and tested version, the
Health Promoting Lifestyle Profile II, and the SF-36. There has been considerable
research focused upon health promoting behaviors and wellness. This research has been
done with a variety of populations including college age individuals (Larouche, 1998),
middle-aged individuals (Duffy, 1988), and the older adult populations (Clark, 1998;
Duffy, 1993; Morgan et al., 1991). Fowler (1997) reports that there is little empirical
data available describing the health promoting lifestyle in older adults with chronic
illnesses. Individual sectors of the population have been examined including women
with MS (Stuifbergen & Roberts, 1997), African American women (Ahijevych &
Bernard, 1994), African American elderly women (Wilson-Ford, 1992), African
American adults (Foster, 1992), a group of Appalachian elderly (Riffle et al., 1989),
adults with Parkinson's Disease (Fowler, 1997), and residents of Long Term Care
Facilities (McCade et al., 1997). However, the authors of the reported research suggest
the need for continued research examining the many aspects of health promoting
behaviors and its’ relationship to an individual’s health status (Fowler, 1997). In
addition, it is recommended that this research should be focused specifically on older
adults to determine how and why they participate in health promoting behaviors, how to
overcome deterrents to participation in these behaviors (Conn, 1998; Riffle et al., 1989;
Foster, 1992). Wilson-Ford (1992) suggests a specific need for research pertaining to the
rural elderly is necessary. The limited and reported fragmented services and
opportunities for health promotion indicate this rural population has needs for services
pertaining to social, emotional, cultural and socioeconomic perspectives. This research
can ultimately lead to the development of innovative strategies to assist the rural, older
Reproduced with permission of the copyright owner. Further reproduction prohibited without permission.

46
adult in the achievement of healthier lifestyles (Ahijevych & Bernard, 1994; Frauman &
Nettles-Carlson, 1991; Mainous, 1995).
As our population continues to age and grow in numbers of older adults, health
promotion will need to be focused at adding healthy living, rather than simply elongation
of life. Many older persons will be living alone and the need to keep them functional and
well is necessary. It has been determined that a greater share of the older adult
population resides in the rural setting (Sharp, 1991). Researchers need to determine what
health promoting behaviors the rural, well older adult utilizes to maintain function and
independence. Subsequently, health care professionals can promote those health
behaviors performed by rural, well older adults who value health, are well, and are living
a long, vigorous life.
Reproduced with permission of the copyright owner. Further reproduction prohibited without permission.

47
Chapter 3
Research Methods
The purpose of this study was to examine the relationship between the perceived
health status and the health promoting behaviors of well, older adults in rural settings. In
addition, demographic variables of the population were examined in relationship to the
health-promoting behaviors and self-perceived health status. In Chapter 3, the pilot
study, results of the pilot study, the research design, study population, and instruments,
the specific measures used for data collection, and the methods used for protecting the
confidentiality of the participants are described. The methods for data analysis are also
included.
Pilot Study
A pilot study was conducted for several reasons. First, the pilot study was
intended to provide information from which to estimate sample size in the main study.
Second, a pilot study assisted the researcher in assessing the clarity and readability of the
data collection instruments. Lastly, the pilot study provided the researcher with
experience in the mechanics of introduction of the study, data collection, and data
analysis. The pilot study was conducted at two dining centers located in Southwest
Wisconsin. The dining centers are located in a county immediately adjacent to the study
population area in Southeast Minnesota. There were 42 people present at the first dining
site and 15 at the second site. In total, 47 persons (82 %) agreed to participate in the pilot
study.
Reproduced with permission of the copyright owner. Further reproduction prohibited without permission.

48
Instruments
Short Portable Mental Status Questionnaire (SPMSO).
According to Kane and Kane (1981), the Short Portable Mental Status
Questionnaire (SPMSQ) has been determined to be appropriate as a tool to determine
cognitive functioning in the community setting and was used to determine cognitive
functioning in these community settings. Items include orientation, memory, remote
memory, practical survival skills for self-care in the community, and mathematical
ability. Test-retest reliability is greater than 0.8 (Pfeiffer, 1972). Validity is correlated
with clinical diagnosis of organic brain syndrome (Kane & Kane, 1981). The SPMSQ is
administered as an interview guide to each participant. The SPMSQ was chosen to
assure cognitive capability in completing the survey of health status and health behavior.
Guidelines recommended by Welch & West (1999) differentiated those persons
with significant cognitive impairment that impeded their ability to answer the
questionnaires. The scoring guidelines are presented in Table 1 showing the error rate by
education.
Table 1
Cut Points for Exclusion using the SPMSO
Educational Level Score Range
Grade School 6 errors
Beyond Grade School 5 errors
Some College 4 errors
Reproduced with permission of the copyright owner. Further reproduction prohibited without permission.

49
The Health Promotion Lifestyle Profile II fHPLP IT).
The HPLPII was used to measure the reported frequency of health promoting
behaviors of the study participants. The HPLP II is a 52 item summated behavior-rating
scale that utilizes a 4-point Likert scale response format (1 = never to 4 = routinely) to
measure the frequency of health promoting behaviors.
The Health Promoting Lifestyle Profile II (Walker. Personal communication,
2000) was retyped from the original format into one with a larger font size to increase the
readability for the older adult population. Permission to use the Health Promoting
Lifestyle Profile II (HPLP-II) was obtained from Dr. Susan Noble Walker (2000).
Walker (personal communication, 2000) identifies six dimensions of the HPLP II
as a health promoting life style through factor analysis (n = 712) and uses them as
subscales:
1. Spiritual growth refers to feelings of connection to a force greater than one’s
self and an awareness of what is important in life (questions -
6,12,18,24,30,36,42,48,52).
2. Health responsibility is attending to and accepting responsibility for one’s own
health, being educated about health, and seeking professional assistance when necessary
(questions - 3,9,15,21,27,33,39,45,51).
3. Physical activity is the adherence to a regular exercise pattern (questions -
4,10,16,22,28,34,40,46).
4. Nutrition is the establishment of meal patterns and making food choices
(questions - 2,8,14,20,26,32,38,44,50).
Reproduced with permission of the copyright owner. Further reproduction prohibited without permission.

50
5. Interpersonal support is the maintenance of relationships, which involve a
sense of intimacy and closeness (questions - 1,7,13,19,25,31,37,43,49).
6. Stress management involves recognition of sources of stress and action to
control stress and achieve relaxation (questions - 5,11,17,23,29,35,41,47)
The total score for health-promoting behaviors is obtained by calculating the
mean of the 52 items in the HPLP II. Similarly, the six subscale's scores are obtained by
calculating a mean of the responses to the above specified subscale items.
Walker (personal communication, August 9,2000) reports that data from 712
adults ranging in age from 18 to 92 years were analyzed to assess validity and reliability.
Content experts’ evaluation and literature review established content validity. The
presence of the six factors used as subscales is supported by a principal axis factor
analysis. Significant correlations with concurrent measures of perceived health and
quality of life indicated criterion-related validity with correlation coefficients ranging
from .269-.491. The Cronbach alpha coefficient for the Health-Promoting Lifestyle H in
each of the six subscales are: Spiritual growth (.86), Health Responsibility (.86), Physical
Activity (.85). Nutrition (.80), Interpersonal Relations (.87), Stress Management (.79),
and the Total HPLP II (.94). A test-retest resulted in a correlation coefficient for the total
score of r =.89. (personal communication with Susan Noble Walker, August 9, 2000).
SF-36 Health Survey.
The SF-36 was constructed to survey perceived health status in the Medical
Outcomes Study (Ware & Sherboume, 1992). The Medical Outcomes Study (MOS)
evaluated function and well-being of 9,385 patients with chronic conditions. The SF-36
Reproduced with permission of the copyright owner. Further reproduction prohibited without permission.

51
was designed for use in clinical practice, research, health policy evaluation, and general
population surveys, and assesses eight health concepts:
1. The concept of limitations in physical activities due to health problems (items -
3a, 3b, 3c, 3d, 3e, 3f, 3g, 3h, 3i, 3j.).
2. The concept of limitations in usual role activities due to physical health
problems (items - 4a, 4b, 4c, 4d).
3. The concept of bodily pain (items - 7, 8).
4. The concept of general health perceptions (items - 1, 1 la, 1 lb, 1 Ic, 1 Id).
5. The concept of vitality (energy and fatigue) (items - 9a, 9e, 9g, 9i).
6. The concept of limitations in social activities due to physical or emotional
problems (items - 6,10).
7. The concept of limitations in usual role activities due to emotional problems
(items - 5a, 5b, 5c).
8. The concept of general mental health (psychological distress and well-being)
(items - 9b. 9c, 9d, 9f, 9g) (Ware, Snow, & Kosinski, 2000, p. 6-18).
McHomey, Ware, & Raczek (1993) suggested that data completeness can be
improved among the older adult by use of larger type size in printing of the
questionnaires. The SF-36 was printed out from the original format into one with a larger
font size to increase the readability for the older adult population. Permission to use the
SF-36 has been obtained from John E. Ware, Jr., Ph.D. (2000).
Ware and Sherboume (1992) reports internal consistency coefficients for the eight
scales exceeding 0.80 for all scales except the social functioning scale (0.76). The
Cronbach Alpha Coefficients for the SF-36 (Ware & Sherboume, 1992) are reported as:
Reproduced with permission of the copyright owner. Further reproduction prohibited without permission.

52
physical functioning (0.93), role limitations (physical problems) (0.89), pain (0.90),
social functioning (0.76), mental health (0.84), role limitations (emotional
problems)(0.82), vitality (0.86), and general health perceptions (0.81).
Rand Corporation & Ware, (1990) reports general population norms for the scales
as: physical functioning (84.2), role limitations (physical problems) (81.0), pain (75.2),
social functioning (83.3), mental health (74.7), role limitations (emotional
problems)(8l.3), vitality (69.9), and general health perceptions (72.0). These findings
support the use of the SF-36 survey across diverse population that were studied in the
MOS.
According to Parker, Peet, Jagger, Farhan, and Castleden (1998) the SF-36 has
undergone extensive validation with general populations, ages fourteen years and older
(N = 18,573)(Ware, 2000) and is recommended as the instrument of choice for health
status assessment.
Data Collection for pilot study
The questionnaires and forms were given to four older adults for completion. The
timing for completion of the forms and questionnaires was estimated at 20 to 25 minutes.
Data collection for the pilot study occurred at the dining centers for older adults.
The consent form (see Appendix E), which conforms to the guidelines for protection of
human subjects was given to the participants who had verbally consented to participate in
the study. The Short Portable Mental Status Questionnaire (SPMSQ) (see Appendix G)
was administered to prospective participants to determine cognitive status rating. The
SF-36 Health Survey (Appendix A) and the Health Promoting Lifestyle Profile II
(Appendix C) were given to the participants to complete along with a form for obtaining
Reproduced with permission of the copyright owner. Further reproduction prohibited without permission.

53
demographic information (Appendix H). These forms were completed, by participants, at
tables specifically set up for this purpose or in a location of the participant’s choice
within the center. The location of the tables and chairs was in a quiet, secluded area to
protect the privacy of the participants and decrease the potential for disruption for the
participants. The signed consent and completed questionnaires were returned to the
researcher. If any subjects chose not to participate in the study, they were allowed to
return the uncompleted forms. The researcher was available to answer any questions the
participant had or gave assistance (such as assistance with filling out the form under the
participant’s guidance and direction) if the participant experienced difficulty filling out
the questionnaires due to physical limitations.
All participants met the criteria for inclusion based on the SPMSQ at the first site,
however, at the second site, two of fifteen participants who met the criteria for the
SPMSQ were unable to understand and fill out the questionnaires. The remaining
participants signed the consent form (see Appendix E), completed the SF-36 Health
Survey (Appendix A), the Health Promoting Lifestyle Profile H (Appendix C), and a
form for demographic information (Appendix H). Participants, at the tables where they
chose to sit for dining, completed the forms. None of the participants requested to sit
privately. The researcher roamed the room and answered a few questions pertaining to
the questionnaires. Assistance was given to one participant in filing out the form, as she
had forgotten her glasses and desired to participate. The questions were read verbatim
and the participant gave her answers, which the researcher marked on the questionnaire.
Four persons refused to continue participation in the study while filling out the
questionnaires, citing the questionnaires was too long. In addition, several other
Reproduced with permission of the copyright owner. Further reproduction prohibited without permission.

54
participants (n=6) commented to the researcher that the questionnaires were too lengthy.
However, the increased font for printing of the questionnaires was adequate size for
readability of the tools.
Results of Pilot Study
Demographic information (age, gender, marital status, ethnic origin, and
educational level) on the pilot study participants is presented in Table 2.
Reproduced with permission of the copyright owner. Further reproduction prohibited without permission.

55
Table 2-
Demographic Data of Pilot Study bv Age. Gender. Marital Status. Ethnic Origin, and
Education -n=43
Characteristic Number (n) Percent (%)
Age
60-64 1 2.3
65-69 3 7.0
70-74 8 18.60
75-79 16 37.21
80-84 10 23.26
85-89 5 11.63
90 and > 0 0.0
Gender
Female 24 55.80
Male 19 44.20
Marital Status
Single 2 4.7
Married 19 44.20
Divorced 2 4.7
Widowed 20 46.50
(table continues)
Reproduced with permission of the copyright owner. Further reproduction prohibited without permission.

56
Characteristic Number (n) Percent (%)
Ethnic Origin
Caucasian 35 81.40
African American 0 0.0
Asian American 0 0.0
Native American 8 18.60
Other 0 0.0
Education
8th Grade or less 3 7.0
Some High School 2 4.7
High School Grad 24 55.80
Some College 7 16.30
College Degree 3 7.0
Post Graduate 4 9.3
Higher Degree 0 0.0
The age distributions ranged from 67 to 84 years of age, with a mean age of 78
years of age. A note of possible confusion for the participants also is noted in the number
of persons claiming to be Native American (18.6%). As seen in the 2000 U.S Census, a
large number of these older adults marked their ethnic origin as Native American. This
may be true, however, for the study, the demographic form (see Appendix I) will also
reflect the choice of Native American to include the term American Indian. In addition,
Reproduced with permission of the copyright owner. Further reproduction prohibited without permission.

57
the Subject Information Sheet (See Appendix J) was changed to reflect the change of
time commitment for participants.
Descriptive statistics of the HPLP II and Health Status (SF -36) and Subscales
scores for the SF 36 collected in the Pilot Study are reported in Table 3 and 4 (See
below).
Table 3
Subscale Mean Scores, SD, and Range for HPLP II and the Total HPLP II
Subscales Mean SD Range
Health Responsibility 22.32 5.24 12-32
Interpersonal Relations 26.35 4.47 17-36
Nutrition 24.72 3.82 17-33
Physical Activity 17.63 4.49 8-27
Spiritual Growth 27.28 4.96 19-36
Stress Management 22.84 4.23 16-32
HPLP II Summary 140.18 18.63 105-174
Subscale scores for bodily pain, general health, mental health, physical
functioning, role-emotional, role-physical, social functioning, and vitality are listed in
Table 4 by mean, standard deviation, and range.
Reproduced with permission of the copyright owner. Further reproduction prohibited without permission.

58
Table 4
Subscale Scores for SF-36
Subscale Mean SD Range
Bodily Pain 66.51 23.62 0-90
General Health 70.91 17.21 35-100
Mental Health 61.14 14.14 12-76
Physical Functioning 66.47 22.73 15-100
Role-Emotional 75.19 36.44 0-100
Role-Physical 60.63 40.39 0-100
Social Functioning 86.63 18.58 37.5-100
Vitality 61.67 16.26 15-100
One of the purposes of the pilot study was to determine sample size. Only 2 of
the participants (4.9%) were divorced and only 2 (4.9%) were single, therefore, it was
determined that the entire population of older adults present at the dining centers should
be surveyed for adequate demographic data collection. Prior to data collection, a review
of the dining sites for the study revealed that several of the 49 dining sites included “high
rise” apartment buildings. Miller (1999) identifies such housing as providers of
supportive services, including meals, housekeeping, transportation, social, and
recreational services. The study is focused on health behaviors of healthy rural residents.
Since residents choosing such housing usually need additional supportive services due to
health problems (Arrington, 1997), the sample will not include high-rise residents. The
participation rate for the pilot study was 82% and dropout rate was 8.5%. If all those
Reproduced with permission of the copyright owner. Further reproduction prohibited without permission.

59
participating at the 28 dining sites would be surveyed, with the participation rate and drop
out rate comparable to the study, the total population studied would be approximately 590
persons, less 8.5%, that would leave approximately 540 participants for the study.
Use of the Short Portable Mental Status Questionnaire (SPMSO)
The SPMSQ was less effective in determining participant feasibility than
interview. Interviews with the participants determined that they were cognitively unable
to participate because perspective participants were not able to understand the verbal
request. Participants’ ability to complete the SF-36 and HPLP H questionnaires provided
evidence of their cognitive ability to participate. Thus it was determined that the SPMSQ
would not be used for the study.
Use of the Short Form -8 (SF-8)
Another purpose of the pilot study was to determine clarity and readability of the
instruments. It was also determined that the use of the SF-8 (see Appendix B) in place of
the SF-36 would be of benefit to the participants. By changing health status surveys and
eliminating the SPMSQ, there was a decrease in the number of questions from 88
questions to 60 questions. The time commitment of 20-25 minutes for completion of the
questionnaires was also decreased to 15-20 minutes as determined by administration of
the questionnaires to two additional older adults for timing purposes only.
Research Design
A non-experimental research design using survey methods was used in the study
to explore the health promoting behaviors and perceived health status of well older adults
in the rural setting. Pender’s Health Promotion Model depicts a positive relationship
between the variables of perceived health status (wellness) and health promoting
Reproduced with permission of the copyright owner. Further reproduction prohibited without permission.

60
behaviors utilized by the well older adult (Pender, 1996). The Short Form - 8 (SF - 8)
(See Appendix B) was used to measure the perceived health status for study participants.
The Health Promoting Lifestyle Profile II (HPLP II) (see Appendix C) was used to
measure the health promoting behaviors for the study participants.
Population/Setting
The setting for the rural participants for this study was dining centers located in
rural southeast Minnesota. Senior Dining Services program was established in 1973 in
response to the Older Americans Act Legislation by the Minnesota Board on Aging and
area agencies on aging. Semcac (the umbrella organization) is a private, non-profit
community action agency that provides a variety of community services for older adults
in the rural setting. Senior dining is offered at 49 locations in Southeastern Minnesota in
the eleven counties of Dodge, Fillmore, Freeborn, Goodhue, Houston, Mower, Olmsted,
Rice, Steele, Wabasha, and Winona. Dining sites with congregate living were excluded
because older adults with increased health problems and decreased health status tend to
choose congregate living. Of the 49 dining centers, 28 centers fit the criteria for data
collection. All of these dining sites were independent of congregate living and served an
average o f greater than eight persons fora meal. The dining sites ranged in location from
modem, newly built community centers, to churches, to space in the back room of an
established restaurant, and to space located in the rear of a town fire station. According
to the Semcac Senior Dining Annual Report (1999), Semcac served a total of 3 11,206
meals at their sites, averaging 1275 persons served per day. The sites varied in the meals
served from four meals per site to sixty-three meals per site, with an average of twenty-
six meals per site per day.
Reproduced with permission of the copyright owner. Further reproduction prohibited without permission.

61
Demographic data on persons served on a daily basis is not collected by Semcac,
however, data is kept on new persons served at the dining sites. In 1999, Semcac served
6212 meals to new persons (those not served in a prior year). The age distribution of new
persons enrolled is reflected in Table 5.
Table 5
Summary of the Age Distribution of New Persons Enrolled in 1999
Age % Enrolled
60-64 5.80 %
65-69 10.61 %
70-74 17.53 %
75-79 20.78 %
Over 80 42.84 %
In addition, gender variation for the new persons served included 30.22% males
and 69.78% females. Less than one percent of the new persons served were of an ethnic
origin other than Caucasian. The population included two American Indians, six persons
of Asian/Pacific Islander descent, two persons self-identified as Black, and one person of
Hispanic origin. Semcac authorized permission for the research study at the dining sites
(see Appendix D).
Sample
The participants in this study were selected using a convenience sampling
technique of older adults participating at twenty-eight Semcac dining centers. The
researcher requested volunteers by verbally informing them that information was being
gathered for a research project about older adults health status and health behaviors (see
Reproduced with permission of the copyright owner. Further reproduction prohibited without permission.

62
Appendix E). The volunteers expressed their interest in participation by notifying the
researcher at the center.
Inclusion Criteria
The inclusion criterion included all volunteers over the age of sixty who were
participants at the dining centers in a variety of rural dining locations sponsored by
Semcac. The participant was required to be able to read English and able to complete
questionnaires. The participants could be either male or female.
Exclusion Criteria
Exclusion criteria included those persons who did not desire to participate in the
study. All persons who were unable to complete the questionnaire due to decreased
cognitive ability or unable to complete due to vision problems (unable to read
questionnaires) were also excluded. This included persons that did not have reading
glasses at the dining site.
Protection of Subjects
The researcher verbally informed the participants that there was only minimal risk
to participants, other than the time commitment to complete the forms. Written consent
was obtained prior to distribution of the questionnaires. Informed consent included an
explanation of the purpose of the study, procedures that were to be followed, and the
risks and benefits of the study (see Appendix E). Participants were given a copy of the
signed consent form. In addition, there was an opportunity for the participants to ask
questions of the researcher regarding the research. The participant responses were kept
confidential. Questionnaires did not include names; however, they were coded for data
management. All of the data collected is reported as group data, to assure that no
Reproduced with permission of the copyright owner. Further reproduction prohibited without permission.

63
individual participants can be identified. The completed questionnaires and demographic
information forms were locked in a secure file and kept by the researcher. Participation
was voluntary and the participants had the opportunity to withdraw from the study at any
time. Participation or non-participation in the study did not affect the subject’s ability to
continue their participation in activities at the Dining Centers. Approval for this study
was obtained from the Rush Presbyterian St. Luke’s Medical Center Institutional Review
Board of Rush University prior to the initiation of the research (see Appendix F).
SF-8
The SF-8 was determined to replace the SF-36 for the study. The SF-8 measures
the same subscale criteria as the SF-36 (Ware, Kosinski, Dewey, & Gandek, 2001). The
SF-8 is a general, multipurpose, and comprehensive survey of health status. Reliability
studies for the SF-8 scales include use of alternate forms reliability coefficients for SF-8
items and summary scales. Ware et. al. (2001) reports the eight scales exceeding 0.70 for
all scales. Alternate forms reliability for the SF-8 scales includes physical functioning
(0.75), role limitations (physical problems) (0.79), pain (0.88), social functioning (0.81),
mental health (0.78), role limitations (emotional problems)(0.70), vitality (0.74), general
health perceptions (0.74), and summary scores for physical (0.88) and mental (0.82).
Test-retest reliability yielded estimates for the SF - 8 scales ranging from .59 - .70 and
the summary measures were .73 for physical and .74 for the mental. Scoring of the SF-8
is similar to scoring of the SF-36 as indicated in the SF-36 Manual (Ware, 2000).
Permission to reprint the SF-8 was obtained from Quality Metric (Ware).
Reproduced with permission of the copyright owner. Further reproduction prohibited without permission.
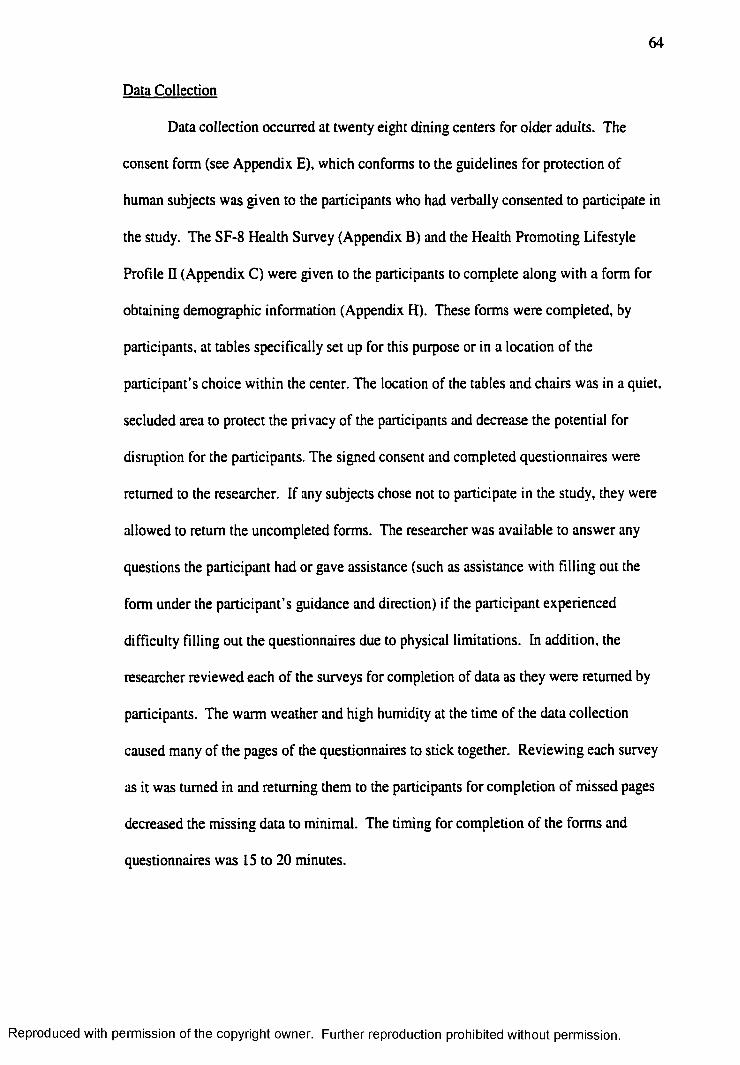
64
Data Collection
Data collection occurred at twenty eight dining centers for older adults. The
consent form (see Appendix E), which conforms to the guidelines for protection of
human subjects was given to the participants who had verbally consented to participate in
the study. The SF-8 Health Survey (Appendix B) and the Health Promoting Lifestyle
Profile II (Appendix C) were given to the participants to complete along with a form for
obtaining demographic information (Appendix H). These forms were completed, by
participants, at tables specifically set up for this purpose or in a location of the
participant’s choice within the center. The location of the tables and chairs was in a quiet,
secluded area to protect the privacy of the participants and decrease the potential for
disruption for the participants. The signed consent and completed questionnaires were
returned to the researcher. If any subjects chose not to participate in the study, they were
allowed to return the uncompleted forms. The researcher was available to answer any
questions the participant had or gave assistance (such as assistance with filling out the
form under the participant’s guidance and direction) if the participant experienced
difficulty filling out the questionnaires due to physical limitations. In addition, the
researcher reviewed each of the surveys for completion of data as they were returned by
participants. The warm weather and high humidity at the time of the data collection
caused many of the pages of the questionnaires to stick together. Reviewing each survey
as it was turned in and returning them to the participants for completion of missed pages
decreased the missing data to minimal. The timing for completion of the forms and
questionnaires was 15 to 20 minutes.
Reproduced with permission of the copyright owner. Further reproduction prohibited without permission.

65
Data Analysis
The out of range items (Ware, 2000) for the SF-8 were re-coded as missing. Re
coded and missing items were replaced with mean substitutions where warranted (Ware,
2000). Computation of raw scores took place. Transformation of raw scale scores to a 0-
100 scale and performance of scoring checks occurred (Ware, 2000). Computation of the
HPLPII subscales and Total HPLPII occurred (See Instrument Section for computation
of scores for HPLP II). SPSS for Windows Advanced Statistics, Release 6.0 (1993) was
used for data analysis.
The research questions for this study are:
1. What are the health promoting behaviors of the well older adult living in the
rural setting?
2. What is the perceived health status of the well older adult living in the rural
setting?
3. What is the relationship of health promoting behaviors and self-perceived
health status for well older adults in the rural setting?
4. What is the profile of the rural older adult person who measures low on the
HPLP II and the SF-8?
Data analysis of the research questions #1 and #2 included determination of mean
scores for all of the subscales in the HPLP II, the SF-8, and the Total HPLP H score.
Histograms and tables are used to display the descriptive statistics calculated from the
HPLP II and the SF-8 means scores. Data analysis of research question # 3 included
Analysis of Variance. Analysis of variance techniques were used to explore the
relationship between the SF-8 subscales, the HPLP H subscales, and Total HPLP H score.
Reproduced with permission of the copyright owner. Further reproduction prohibited without permission.

66
Data analysis of research question #4 focused on testing for differences in the key
theoretical relationships across demographic segments in the population using tests of
ANOVA or ANCOVA (Hocking, 1996).
Summary
In this chapter, the purpose of this research, the study design, study population,
instruments, specifics of data collection, and methods used for participant confidentiality
are described. The methods for data analysis are also included. Finally, the pilot study
and results of the pilot study are described.
Reproduced with permission of the copyright owner. Further reproduction prohibited without permission.

67
Chapter 4
Results Of Analysis
The primary purpose of this study was to examine the relationship between the
perceived health status (SF-8) and the health promoting behaviors (HPLP E) of the well
older adults in rural settings. Initially, this chapter will present the sampling
characteristics for this study. Next, the analysis explores differences in health promoting
behaviors and self-perceived health status across demographic characteristics. Finally,
the results of the analysis to determine relationship strength among different health
promoting behaviors and the components of self-perceived health status will be
presented.
The research questions for this study are:
1. What are the health promoting behaviors of the well older adult living in the
rural setting?
2.What is the perceived health status of the well older adult living in the rural
setting?
3. What is the relationship of health promoting behaviors and self-perceived
health status for well older adults in the rural setting?
4. What is the profile of the rural older adult person who measures low on the
HPLP H and the SF-8?
Sample Characteristics
Population members were contacted at senior dining centers in rural communities
throughout southeastern Minnesota just prior to the noontime meal. All of the dining
participants present on those days were given the opportunity to participate in the study.
Reproduced with permission of the copyright owner. Further reproduction prohibited without permission.

68
Four hundred and forty persons returned completed surveys to the researcher of the 616
persons present, constituting a participation rate of 71.42%.
The vast majority (95.23%) reported their ethnicity as Caucasian. Other reported
ethnic origins were two persons of African American descent (.45%); three persons of
Asian American descent (0.68 %); fifteen persons of Native American descent (3.4 %);
and one person as Other (0.27 %). Some of the respondents reported their ethnic origin
as Norwegian or German, and upon further questioning by the researcher were able to
report one of the choices listed. Table 6 presents the age, gender, marital status, and
educational level characteristics of the participants listed by number and percentage of
the total study sample.
Reproduced with permission of the copyright owner. Further reproduction prohibited without permission.

69
Table 6
Age. Gender. Marital Status, and Educational Level Listed bv Characteristic, Number,
and Percentage - n=440
Characteristic
Age
60-69
70-79
80-89
90 and >
r
Female
Male
Marital Status
Gender
Single
Married
Divorced
Widowed
Education
8th Grade or less
Some High School
High School Grad
Some College
Number (n) Percent (%)
56
178
186
20
300
140
32
150
16
242
99
63
159
82
12.73%
40.45 %
42.27 %
4.55%
68.18%
31.82%
7.27%
34.09%
3.64%
55.9%
22.9%
14.32%
36.14%
18.64%(table continues)
Reproduced with permission of the copyright owner. Further reproduction prohibited without permission.

70
Characteristic Number (n) Percent (%)
College Degree 23 5.23 %
Post Graduate 11 2.5%
Higher Degree 3 0.68 %
Almost half, (46.82%) of the respondents were 80 or more years old. resulting in
the oldest sample among research studies using the HPLP II or SF-8 located by the author
in the literature (Ware, 2000; Ware et. al., 2001; Walker & Hill-Polerecky, 1996; Pullen
et. al, 2001; Stuifbergen &Roberts, 1997).
In regards to demographic characteristics, approximately two-thirds of the sample
was female. This is consistent with known survival rates among this generation (CDC,
2001). About 90% of the responders were married or widowed. This supports the
concept of strong family commitment consistent with common perception of the rural
community (Letvak, 1997). In addition, this may help explain to some extent several of
the HPLP H and SF-8 subscale and summary scores discussed later in this chapter and
will be revisited at that time.
Lastly, there is often a perception of rural people having less formal education
(Shreffler, 1996). In this sample over 63% of the respondents reported an education level
of high school graduate or higher. Thus, the rural older adult in this study on the average
possesses a reasonably adequate level of knowledge and understanding.
Reproduced with permission of the copyright owner. Further reproduction prohibited without permission.

71
Characteristics of the Non-participants
To avoid missing data and incomplete surveys, the questionnaires were reviewed
by the researcher immediately upon completion. Approximately 90% of the participants
missed one entire page of the questionnaires. The fact that the weather was humid,
allowing the pages to stick to each other, and the length of the questionnaires (9 pages in
length) could explain this. In addition, the manual dexterity of the older adult is
generally deceased, thus possibly making it more difficult to differentiate between all the
pages in the survey booklet. Incomplete questionnaires were returned to the respondent
to be completed. In a few instances, some of the surveys had missing data missed by the
researcher in the review process. Thus, very few questionnaires were incomplete or had
missing data.
Aside from the pages sticking together some respondents (28.58%) were unable
or unwilling to complete the questionnaire. Of the 176 participants that did not
participate in the study, 75 of those persons simply refused to participate when
approached by the researcher. The remainder of non-participants attempted to complete
the survey but could not do so for numerous reasons. Some of them started the survey,
and then decided not to complete it for various reasons citing length of survey, questions
too personal, etc. Other persons were unable to finish due to cognitive status. Table 7
provides the number of non-participants by reason.
Reproduced with permission of the copyright owner. Further reproduction prohibited without permission.

72
Table 7
Reasons for Nonparticipation n=L76
Reason Number
Refused to Participate 75
Decreased cognition 35
Decreased Vision 32
Returned Surveys 18
Incomplete Surveys 8
Underage or other reason 8
Total 176
Reproduced with permission of the copyright owner. Further reproduction prohibited without permission.

73
Health Promoting Behaviors
In order to determine health-promoting behaviors of the well older adult living in
the rural setting, the Health Promoting Lifestyle Profile II (HPLP H) (Walker & Hill-
Polerecky, 1996) was administered. Completion of the HPLP H requires participants to
respond to 52 questions. Using factor analysis. Walker (personal communication, 2000)
identifies six dimensions of the HPLP H. She further suggests that these dimensions can
be used as subscales for analysis of a respondent’s health promoting behavior. The
subscales are:
• Spiritual growth which refers to feelings of connection to a force greater than
one’s self and an awareness of what is important in life,
• Health responsibility is attending to and accepting responsibility for one’s own
health, being educated about health, and seeking professional assistance when
necessary,
• Physical activity is the adherence to a regular exercise pattern,
• Nutrition is the establishment of meal patterns and making food choices.
Interpersonal support is the maintenance of relationships, which involve a sense
of intimacy and closeness,
• Stress management involves recognition of sources of stress and action to control
stress and achieve relaxation.
In addition to the six subscales, a Health Promoting Summary Score as an indicator for
overall health promoting behavior can be calculated.
Table 8 presents descriptive statistics for the HPLP II subscales and the Summary
Score. Because alternative subscales are comprised of different numbers of items from
Reproduced with permission of the copyright owner. Further reproduction prohibited without permission.

74
the questionnaire, the absolute scores, and thus the Mean subscale scores, are not
comparable to each other. However, when adjusting the scores by the number of items
included, comparisons can be made using the Average Item Score (Walker & Hill-
Polerecky, 1996). Thus, the differing health promoting behaviors for this sample can be
compared using the Average Item Mean.
Reproduced with permission of the copyright owner. Further reproduction prohibited without permission.

Table 8
HPLP 11 and Average Item Scores
Subscule MeanStandard
DeviationRange
Average Item
Mean
Cronbach
Alpha
Coefficient
Health Responsibility 21.98 5.27 9 - 3 6 2.44 0.76
Physical Activity 17.45 5.13 8 - 32 2.18 0.76
Nutrition 25.06 4.98 11 - 36 2.78 0.75
Spiritual Growth 26.11 5.40 1 1 - 3 6 2.90 0.84
Interpersonal Relations 25.79 4.56 1 4 - 3 6 2.87 0.77
Stress Management 22.05 4.44 10 - 32 2.76 0.73
HPLP II Summary 138.44 23.54 7 6 - 208 2.66 0.92

76
The Average Item Mean shows that four of the subscale means, Spiritual Growth,
Interpersonal Relations, Nutrition, and Stress Management are higher that the HPLP II
Summary Average Item Mean (2.66). To determine if the differences in health
promoting behaviors is not just a difference due to random sampling, an Analysis of
Variance to test for independence among the subscales was conducted. The null
hypothesis is that the six subscale means are equal in value for the population and that the
differences presented by the sample are due to sampling error common in all sampling
techniques. The alternative hypothesis is that the differences are due to differences in
behavior as reported in the questionnaire.
A one-way ANOVA was calculated comparing the variation between the Average
Item Mean subscales scores to the variation of each observation within the subscales.
The resulting F-Ratio = 10.24, was significant with a p-value of < .001 (5,434 d. f.).
This suggests that the Average Item Mean differences among subscales are due to
reported behavior, not random sampling behavior. It appears that for this particular
sample Spiritual Growth, Interpersonal Relations, Nutrition, and Stress Management are
pursued more vigorously than Health Responsibility and Physical Activity
Health Status
To measure health status, the SF-8 Health Status tool (Ware et.al., 2001) was
included in the questionnaire packet. The SF-8 was designed for use in clinical practice,
research health policy evaluation, and general population surveys. The tool assesses
eight health concepts: Physical Functioning - limitations in physical activities due to
health problems,
• Role Physical - limitations in usual role activities due to physical health problems,
Reproduced with permission of the copyright owner. Further reproduction prohibited without permission.

77
• Bodily pain,
• General health perceptions,
• Vitality - energy and fatigue,
• Social functioning - limitations in social activities due to physical or emotional
problems,
• Role Emotional - limitations in usual role activities due to emotional problems,
• Mental Health - psychological distress and well-being.
In addition, the SF 8 can result in the calculation of two summary scales: Mental Health
and Physical Health.
From the questionnaire items SF-8 subscales and accompanying summary scales
were calculated. Scoring of the SF-8 subscales and summary scales was accomplished in
accordance with Ware et. al’s (2001, p. 15-18) instructions. According to Ware et. al.
(2001), this process ensures the standardization of scoring of the SF-8 scales for the
purposes of interpretation of health status perception and comparison of the SF-8 results
with the previously standard measure, the SF-36.
Table 9 presents the SF- 8 subscales and the Mental and Physical Health
summary scales. In this case, the subscales as calculated have been standardized and
consequently are directly comparable. The grand mean for subscale scores (the mean of
the eight subscale means) equals 46.93. It appears that for this sample, rural older adults
perceive their health with respect to Physical Functioning, Role Physical, and General
Health as being worse than their perception with respect to Mental Health, Bodily Pain,
and Vitality. It appears that Social Functioning and Role Emotional are perceived as
moderate compared to the other subscales for their overall health status.
Reproduced with permission of the copyright owner. Further reproduction prohibited without permission.

78
To determine if the differences in health perception can be attributed to reported
perceptions and is not just a difference due to random sampling, an Analysis of Variance
to test for independence among subscales was conducted. The null hypothesis is that the
eight subscale means are equal in value for the population and that the differences
presented by the sample are due to sampling error. The alternative hypothesis is that the
differences are due to differences in behavior as reported in the questionnaire.
Reproduced with permission of the copyright owner. Further reproduction prohibited without permission.

79
Table 9
Results of the S F - 8 Subscales and Summary Scales- n=440
Subscale Mean SD Range
Physical functioning 43.98 9.01 21.46-54.05
Role Physical 44.72 9.29 23.01-53.98
Bodily Pain 48.23 9.27 25.45-60.77
General Health 45.38 6.51 32.56-59.45
Vitality 48.83 7.62 28.14-61.83
Social Functioning 47.45 7.82 23.44-55.25
Role Emotional 46.48 7.06 21.66-52.42
Mental Health 50.38 7.66 21.40-56.79
Mental Health Summary 50.77
Physical Health Summary 44.14
8.21
9.85
18.94-63.39
15.48-64.16
A one-way ANOVA was calculated comparing the variation of the SF-8 subscale
mean scores to the variation of each observation within the subscales. The resulting F-
Ratio = 32.41, this was significant with a p-value < .001 (7,432 d. f.). This suggests that
the Sf-8 subscale mean differences are due to reported perceptions, not random sampling
error. It appears that for this particular sample Physical Function, Role Physical and
General Health are perceived as posing substantial limitations on activity. While Mental
Health, Bodily Pain, and Vitality are not perceived as severely limiting activity.
Reproduced with permission of the copyright owner. Further reproduction prohibited without permission.

80
With regards to the Summary scales, it appears that the perception of Mental
Health is better than that for Physical Health. A test of two means was used to determine
if the difference was most likely due to sampling error or the result of reported
differences in perception. The null hypothesis is that the two summary scale means are
equal in value for the population and that the difference presented by the sample is due to
sampling error. The alternative hypothesis is that the difference is due to differences in
perception as reported in the questionnaire.
Since the samples are large (n> 30) and appear to approximate normal
distributions, and the variances are very similar, a simple z-statistic was calculated using
the two means and a combined measure of variance (Devore & Peck, 1993, pg. 487-497).
The resulting z-value = 10.87 (p < .001). Thus, this suggests that this population
perceives that their Mental Health is better than their Physical Health.
Comparison of the Health Promoting Behaviors and Health Status
A key issue for the community health nursing profession revolves around
intervention in health related behaviors of older adults prior to the occurrence of health
related problems. An examination of a relationship between health promoting behaviors
and health status may be a critical step in understanding what interventions may be
appropriate and how it may be delivered. To this end, question #3 will be examined.
The HPLP II and SF-8 were used to examine the health promoting behaviors and
perceived health status, respectively. The relationship between these two measures will
be examined with interest in the direction and strength of the relationships among the
individual component subscales of one tool (the HPLP H) with those of the other tool
Reproduced with permission of the copyright owner. Further reproduction prohibited without permission.

81
(SF-8). In theory, the order of interest would be the effect of health status on
participation in health promoting behaviors.
To determine if a relationship exists between each of the reported health
promoting behaviors and the perception of health status, two tests were conducted: a
Kruskal Wallis (Devore & Peck, 1993, pg. 786-790) and One-factor ANOVA (Fischer’s
Least Significant Differences) (Devore & Peck, 1993, pg. 732-750) test of independence
between distributions. In each case the tests were to determine of the differences in
health status perceptions across differing values of health promoting behaviors can be
attributed to reported behaviors or most likely due to random sampling error. In both
cases, the null hypothesis states that there is no relationship between the HPLP II
measure and the SF-8 measure. The alternative hypothesis states that if a no relationship
proposition (null hypothesis) is rejected, then a relationship does exist.
The reasoning for using two tests is due to the assumptions underlying the
stronger of these tests, the ANOVA. A one-factor ANOVA by its design assumes that
the sample being compared are independently derived and normally distributed (Devore
& Peck, 1993, pg. 736). The SF-8. perceived health status, is the factor that delineates
the comparable groups. One might argue that these groups are not independent samples.
In addition, an examination of the HPLP II and SF-8 subscales shows that several of them
are most likely not normally distributed. To avoid violating these assumptions a weaker
nonparametric test, Kruskai-Wallis is a generalization of the Mann-Whitney rank sum
test of two means and makes no assumptions about population independence or normality
(Hamburg, 1983, pg 559). However, many argue that a large sample like the one in this
study can overcome the ANOVA assumption violations and restore the statistics
Reproduced with permission of the copyright owner. Further reproduction prohibited without permission.

82
legitimacy (Devore & Peck, 1993, pg. 737). So as to make this argument mute, the
statistical analysis will utilize both test statistics. If an outcome conflict occurs, then a
discussion of the conflicting outcome will be used to clarify the implications.
Table 10 presents the results from the test to determine the relationships between
the SF-8 subscale Physical Functioning and each of the HPLP II subscales. Note that in
each case the pooled-variance (ANOVA) and the Kruskal-Wallis test statistic agree on
the outcome of the hypothesis test at an alpha level of .05. In four cases, three subscales
and on the HPLP II summary scale, the null hypothesis can be rejected. It appears that
there is a relationship between Physical Functioning and the HPLP II subscales Physical
Activity, Spiritual Growth and Stress Management and the HPLP II summary scale. The
relationship between Physical Functioning and Interpersonal Relationships appears to be
marginal, significant at a p-level below .1. It cannot be shown with this sample that there
is a relationship between the subscales of Physical Functioning and Health Responsibility
or the subscales of Physical Functioning and Health Responsibility. Overall, it appears
that numerous health promoting behaviors may be important in the perception of a
subject’s Physical Functioning health status.
Reproduced with permission of the copyright owner. Further reproduction prohibited without permission.

83
Table 10
Relationship of the SF-8 Physical Functioning Subscale and the HPLP II Subscales -
n=440
h p l p n
(Subscales and summary)
Kruskal-Wallis
(x2, p-value)
One factor ANOVA
(F-ratio, p-value)
Health Responsibility 6.711,.1519 1.273, .2799
Physical Activity 40.388, <.0001* 11.139, .0001*
Nutrition 6.101,.1918 1.388, .2372
Spiritual Growth 11.839, .0186* 2.945, .0201*
Interpersonal Relationships 8.857, .06493+ 2.258, .062+
Stress Management 13.578, .0088* 2.963, .0196*
HPLP H summary 15.539, .0037* 3.733, .0053*
(4.435 d. f.)*- significant at an oo .05 +- significant at an x .1
Table 11 presents the test results to determine the relationship status between the
SF-8 subscale Role Physical and each of the HPLP H subscales. Once again, note that in
each case the pooled-variance (ANOVA) and the Kruskal-Wallis test statistics agree on
the outcome of the hypothesis test at an alpha of .05. In five cases, four subscales and the
HPLP II summary scale, the null hypothesis can be rejected. It appear that there is a
relationship between the subscale for Role Physical and the HPLP II subscales Physical
Activity, Nutrition, Spiritual Growth, and Stress Management, and the HPLP II summary
scale. It cannot be shown with this sample that there is a relationship between the SF -8
subscale Role Physical and the HPLP H subscales Health Responsibility nor
Reproduced with permission of the copyright owner. Further reproduction prohibited without permission.

84
Interpersonal Relationships. The test results suggest that numerous health-promoting
behaviors may be important to rural older adults perception of their role physical health
status.
Table 11
Relationship of the SF-8 Role Physical Subscale and the HPLP H Subscales - n=440
h p l p n
(Subscales and summary)
Kruskal-Wallis
(x2, p-value)
One factor ANOVA
(F-ratio, p-value)
Health Responsibility 2.293, .682 .408, .8027
Physical Activity 35.808, < .0001* 9.604, < .0001*
Nutrition 12.708, .0128* 3.065, .0165*
Spiritual Growth 18.851,.0008* 5.127, .0005*
Interpersonal Relationships 5.661, .2259 I.517,.1964
Stress Management 10.260, .0074* 2.445, .0459*
HPLP II summary 14.340, .0063* 3.844, .0044*
(4,435 d. f.)*- significant at an oc .05
Table 12 presents the test for a relationship between the SF-8 subscale of Bodily
Pain and each of the HPLP H subscales. Again, note that in each case the pooled-
variance (ANOVA) and the Kruskal-Wallis test statistics agree on the outcome of the
hypothesis test at an alpha of .05. In five cases, four subscales and the HPLP II summary
scale, the null hypothesis can be rejected. It appear that there is a relationship between
the subscale for Bodily Pain and the HPLP H subscales Physical Activity, Interpersonal
Relationships, Spiritual Growth, and Stress Management and the HPLP II summary scale.
Reproduced with permission of the copyright owner. Further reproduction prohibited without permission.

85
It cannot be shown with this sample that there is a relationship between the SF -8
subscale Role Physical and the HPLP H subscales Health Responsibility nor Nutrition.
The test results suggest that numerous health-promoting behaviors may be important in
the perception of a subject’s bodily pain status.
Table 12
Relationship of the SF-8 Bodily Pain Subscale and the HPLP H Subscales - n=440
h p l p n(Subscales and summary)
Kruskal-Wallis
(x2, p-value)
One factor ANOVA
(F-ratio, p-value)
Health Responsibility 6.834, .2333 1.075, .3735
Physical Activity 31.486, < .0001* 6.651, <.0001*
Nutrition 5.094, .4045 1.088, .366
Spiritual Growth 14.413, .0132* 3.377, .0053*
Interpersonal Relationships 14.624, .0122* 2.846, .0153*
Stress Management 14.048, .0153* 2,640, .0229*
HPLP II summary 14.355, .0135* 2.793, .017*
(5,434 d. f.)*- significant at an oo .05
Table 13 presents the test results to determine the relationship between the SF-8
subscale General Health and each of the HPLP H subscales. Once again, note that in
each case the pooled-variance (ANOVA) and the Kruskal-Wallis test statistics agree on
the outcome of the hypothesis test at an alpha of .05. In six cases the null hypothesis can
be rejected. The data suggest that there is a relationship between the subscale for General
Health and the HPLP II subscales Physical Activity, Nutrition, Spiritual Growth,
Reproduced with permission of the copyright owner. Further reproduction prohibited without permission.

86
Interpersonal Relationships, and Stress Management and the HPLP II summary scale. It
cannot be shown with this sample that there is a relationship between the SF -8 subscale
General Health and the HPLP II subscales Health Responsibility. The test results suggest
that all of the health-promoting behaviors, except Health Responsibility may be important
to rural older adults perception of their general health status.
Table 13
Relationship of the SF-8 General Health Subscale and the HPLP II Subscales - n=440
HPLP II Kruskal-Wallis One factorANOVA
(Subscales and summary) (x2, p-value) (F-ratio, p-value)
Health Responsibility 4.291,.368 1.181, .3181
Physical Activity 25.177, < .0 0 0 1* 6.553,< .0001*
Nutrition 12.061, .0169* 2.813, .0252*
Spiritual Growth 36.061, < .0001* 9.640,< .0001*
Interpersonal Relationships 17.210, .0018* 5.019, .006*
Stress Management 16.394. .0025* 4.193,0024*
HPLP H summary 21.907, .0002* 5.879, .001*
(4,435 d. f.)*- significant at an * .05
Table 14 presents the test results to determine the relationship status between the
SF-8 subscale Vitality and each of the HPLP II subscales. Once again, note that in each
case the pooled-variance (ANOVA) and the Kruskal-Wallis test statistics agree the
hypothesis test outcome at an alpha of .05. In fact, for all six cases the null hypothesis
can be rejected at a p-level < .01, a strong indication of a relationship. Thus, the data
Reproduced with permission of the copyright owner. Further reproduction prohibited without permission.

87
suggests that there is a relationship between the subscale Vitality and the HPLPII
subscales Physical Activity, Nutrition, Spiritual Growth, Interpersonal Relationships, and
Stress Management and the HPLP II summary scale. It cannot be shown with this sample
that a relationship between the perceptions of vitality and health responsibility. The test
results strongly suggest that all of the health-promoting behaviors, except Health
Responsibility are important to the sample’s perception of their vitality.
Table 14
Relationship of the SF-8 Vitality Subscale and the HPLP II Subscales - n=440
h p l p n
(Subscales and summary)
Kruskal-Wallis
(x2, p-value)
One factor ANOVA
(F-ratio, p-value)
Health Responsibility 2.637, .6204 .701, .5913
Physical Activity 43.598, <.0001* 12.308, <.0001*
Nutrition 23.696, <.0001* 5.717, .0002*
Spiritual Growth 46.774, < .0001* 13.425, <.0001*
Interpersonal 16.998, .002* 5.053, .0005*Relationships Stress Management 26.608, < .0001* 7.411, <.0001*
HPLP II summary 38.032, <.0001* 10.011, <.0001*
(4,435 d. f.)*- significant at an oo .05
Table 15 presents the test results to determine the relationship status between the
SF-8 subscale Social Functioning and each of the HPLP II subscales. Note that
regardless of the test statistic, in each case the test statistics agree on the outcome of the
hypothesis test at an alpha of .05. In six cases, all but the subscale of Health
Responsibility, the null hypothesis can be rejected. It appear that there is a relationship
Reproduced with permission of the copyright owner. Further reproduction prohibited without permission.

88
between the subscale for Social Functioning and the HPLP II subscales Physical Activity,
Nutrition, Spiritual Growth, Interpersonal Relationships, and Stress Management, and the
HPLP II summary scale. It appears that all of the health-promoting behaviors subscales,
except Health Responsibility are important to this sample’s perception of their social
functioning health status.
Table 15
Relationship of the SF-8 Social Functioning Subscale and the HPLP H Subscales -
n=440
h p l p n
(Subscales and summary)
Kruskal-Wallis
(x2, p-value)
One factor ANOVA
(F-ratio, p-value)
Health Responsibility 2.364, .6691 .667, .6153
Physical Activity 42.737, < .0001* 11.408, <.0001*
Nutrition 10.859, .0282* 2.56, .038*
Spiritual Growth 3 1.403, <.0001* 8.229, < .0001*
Interpersonal Relationships 14.520, .0058* 3.805, .0047*
Stress Management 22.648, .0001* 5.856, .0001*
HPLP H summary 23.784, < .0001* 6.378, < .0001*
(4,435 d. f.)*- significant at an m .05
Table 16 presents the test results to determine the relationship status between the
SF-8 subscale Role Emotional and each of the HPLP II subscales. Once again, note that
in each case the pooled-variance (ANOVA) and the Kruskai-Wallis test statistics agree
on the outcome of the hypothesis test at an alpha of .05. In five cases, the rejection of the
null hypothesis is strong, p-value < .001. It appear that there is a relationship between the
Reproduced with permission of the copyright owner. Further reproduction prohibited without permission.

89
subscale for Role Emotional and the HPLP II subscales Physical Activity, Interpersonal
Relationships, and Stress Management, and the HPLP II summary scale. The
relationship between Role Emotional and Nutrition appears to be marginal, significant at
a p-level of <.1, but unable to reject at .5. There does not appear to be a relationship
between the subscales Role Emotional and Health Responsibility. Overall the outcomes
suggest that numerous health promotion behaviors may be important n the perception of a
rural older adult’s role emotional health status.
Table 16
Relationship of the SF-8 Role Emotional Subscale and the HPLP II Subscales - n=440
h p l p n
(subscales and summary)
Kruskal-Wallis
(x2, p-value)
One factor ANOVA
(F-ratio, p-value)
Health Responsibility 1.301,.198 .417, .7962
Physical Activity 20.539, .0002* 5.195, .0004*
Nutrition 8.768, .0599+ 2.207, .0675+
Spiritual Growth 40.799, < .0001* 11.211, <.0001*
Interpersonal Relationships 20.188, .0004* 5.346, .0003*
Stress Management 25.778, < .0001* 7.967, < .0001*
HPLP II summary 22.723, <.0001* 6.048, < .0001*
(4,435 d. f.)*- significant at an oo .05 +- significant at an oo .1
Table 17 presents the test results to determine the relationship status between the
SF-8 subscale Mental Health and each of the HPLP II subscales. In each case the pooled-
variance (ANOVA) and the Kruskal-Wallis test statistics agree on the outcome of the
Reproduced with permission of the copyright owner. Further reproduction prohibited without permission.

90
hypothesis test at an alpha of .05. In six cases the null hypothesis can be rejected. The
data strongly suggests (p < .01 for all rejected null hypotheses except nutrition) that there
is a relationship between the subscale for Mental Health and the HPLP H subscales
Physical Activity, Nutrition, Spiritual Growth, Interpersonal Relationships, and Stress
Management and the HPLP II summary scale. It cannot be shown with this sample that
there is a relationship between the SF -8 subscale Mental Health and the HPLP II
subscale Health Responsibility. The test results suggest that all of the health-promoting
behaviors, except health responsibility, are important to this sample of rural older adults
perception of their mental health.
Reproduced with permission of the copyright owner. Further reproduction prohibited without permission.

91
Table 17
Relationship of the SF-8 Mental Health Subscale and the HPLP n Subscales - n=440
h p l p n(subscales and summary)
Kruskal-Wallis
(x2, p-value)
One factor ANOVA
(F-ratio, p-value)
Health Responsibility 6.015, .198 1.428, .2235
Physical Activity 15.443,0039* 3.820, .0046*
Nutrition 9.505, .0497* 2.523, .0405*
Spiritual Growth 43.480, < .0001* 11.511, <.0001*
Interpersonal Relationships 21.247, .0003* 5.725, .0002*
Stress Management 22.713, .0001* 5.615, .0002*
HPLP II summary 23.144, .0001* 6.053, <.0001
(4,435 d. f.)*- significant at an x .05
The accumulation of test results above demonstrate a pattern of highly probable
relationships among the subscales of the HPLP II health promoting behaviors measures
and the SF-8 health perceptions measures. In 43 of 56 tests, the null hypothesis was
rejected at an alpha = .05. In well over half of the cases (34 of 56 using Kruskal-Wallis
and 33 of 56 using pooled variance), the null hypothesis could be reject at an alpha = .01.
The results strongly suggest that for the well, older adult living in the rural areas in
Southeastern Minnesota that health status is in many ways related to health promoting
behaviors.
The exception to this conclusion is the relationship any of the measures of health
status to health responsibility behaviors. The data fails to support a relationship between
Reproduced with permission of the copyright owner. Further reproduction prohibited without permission.

92
any of the SF-8 health perception measures and health responsibility behaviors. These
results account for 8 of the 13 tests that failed to reject the null hypothesis. One might
speculate that the independence and self-reliance often observed in rural living older
adults may cause them to respond less favorable to the components of this measure.
The most conclusive evidence point toward a strong relationship between
perceived health status (SF-8) and the health promoting behaviors of Physical, Spiritual
Growth, Stress Management, and the HPLP II summary scale. Across 64 tests (2 each
for each of the 32 relationships tested), strong evidence that each relationship exists was
presented through the rejection of the null hypothesis at a p < .05. Physical Activity
showed the strongest test outcomes with all 32 tests rejecting at a p < 01. The HPLP Q
summary scale rejected 14 of 16 times at p < .01. The Spiritual Growth subscale rejected
13 of 16 times at p < .01, and the Stress Management subscale rejected 12 of 16 times at
p < .01. The evidence supporting a relationship of between health perceptions and
Interpersonal Relationships was also convincing, if not as strong. The null hypothesis
was rejected in 12 of 16 tests at p < .05, and in 10 of 16 tests with a p < .01.
Several interesting patterns emerge from a close examination of the test statistics.
As mentioned, Physical Activity behavior and the HPLP II summary measures appear to
have strong relationships with all the health status measures. On the other hand, Spiritual
Growth appears to have a slightly weaker relationship with Physical Functioning and
Bodily Pain (.01 < p < .05), than with the other health promoting behaviors (p < .001).
Stress Management also appears to be less strongly related to several behaviors, most
notably Role Physical and Bodily Pain (.01 < p < .05), versus Vitality, Social
Functioning, Role Emotional, and Mental Health (p < .001). Of course, these are not
Reproduced with permission of the copyright owner. Further reproduction prohibited without permission.

93
statistically proven differences, but rather interesting observations that might spark
further discussion.
The outcome for Nutrition appears to have a relationship with five of the health
status scales, rejecting the null hypothesis 10 of 16 times at p < .05, but only 2 of 16
times at a p < .01. The five likely relationships include Role Physical, General Health,
Vitality, social functioning, and mental health. The health promoting behavior of
Nutrition also appears to have a weak, but notable relationship with Role Emotional
health status (.05 < p < . 1).
The results from question #3 strongly suggest a complex, but substantial set of
relationships among the perceived health status and the health promoting behaviors for
well older adults living in Southeastern Minnesota.
Profile of the “Low” Rural Older Adult
According to previous studies using the HPLP II and SF-8 tools, those at highest
risk of failing health and the corresponding lowering of quality of life tend to score lower
on the measurement tools (Pullen et. al, 2001; Fowler, 1997; Walker & Hill-Polerecky,
1996; Ware, 2000; Ware et.al, 2001). Thus, question four is a query to determine if a
demographic profile of those who score lower can be developed for this population.
The first step is to determine what qualifies as a low score. Having no previous
knowledge of what scores determine a status of “low”, the researcher decided upon the
bottom 25% of scores would label an individual as “Low” scoring for each of the HPLP
II and SF-8 scales. Since n=440, for each subscale and summary scale the lowest scoring
110 respondents were coded as being “Low” scoring. In some cases the actual sample
size of low scorers is different than 110 due to ties. Thus, the sample was divided into
Reproduced with permission of the copyright owner. Further reproduction prohibited without permission.

94
two groups for each subscale and summary scales; low scoring respondents and those not
scoring low. This resulted in two dichotomous groups coded as a categorical variable for
each subscale and summary scale.
To examine potential relationships two types of tests were administered. The
demographic variables Gender, Marital Status, Ethnicity and Education Level are also
categorical variables (as is the low scoring category coding above). Thus, cross
tabulations were created comparing each of these demographic variables with each of the
17 health related scales. On each of these cross tabulations a Chi-square Goodness-of-Fit
test was run. The Goodness-of-Fit test is based on the concept that, if there is no
relationship between the variables, the distribution of respondents in the individual cells
should be proportional to the row and column totals. If the cell counts are not
proportionally distributed consistent with the row and column totals then it is likely that
there is a relationship between the variables (Devore & Peck, 1993, pg. 808). A Chi-
square distribution approximates the distribution of the test statistic offering a means for
testing the goodness-of-fit (see Appendix K and L for each cross tabulation and Chi-
square test statistic).
A more rigorous test is appropriate when examining Age with the health related
scales. Since age is a continuous variable whose nature is at least interval, a mean age for
“Low” scoring versus those not scoring low can be calculated. Thus a simple t-test
comparing two means to determine if a difference exists between the two groups (low
scoring and those not scoring low) can be conducted. If a difference exists, then in all
likelihood a relationship exists between the Age and the scoring level of the respondents.
Reproduced with permission of the copyright owner. Further reproduction prohibited without permission.

95
Overall the study fails to support a broad demographic description of “Low”
scoring respondents. However, several individual relationships did emerge that may lend
some insight into who is most at risk of scoring low on specific subscale and summary
scores. Education Level and Age tested significant with several subscale and summary
scores. Unfortunately, of the 85 tests (5 demographic variables by 17 subscale and
summary scales scores) only 7 tests rejected the null hypothesis at a .05 significance
level. Another 7 tests demonstrated marginal results in that rejection could have occurred
at an a = . 1 significance level. Fortunately, the pattern o f test results does suggest that
the importance of Education Level and Age is not merely a random occurrence, but rather
that a relationship between the subscale and summary scores and those demographic
variables does exist.
In 5 of 17 tests there is strong evidence that a relationship does exist between
Education Level and select HPLPH and SF-8 subscale and summary scores. All 5 null
hypothesis rejections involved HPLP II scales. Table 18 shows the Chi-Square test
statistic and p-value for each goodness-of-fit test involving Education level and the HPLP
H scales. These results strongly suggest that lower scores on HPLP II subscales
Nutrition, Spiritual Growth, Interpersonal Relationships, and Stress Management, and for
the HPLP II summary scale are related to Education Level.
Reproduced with permission of the copyright owner. Further reproduction prohibited without permission.

96
Table 18
Cross Tabulations for Low/Non-low Respondents for Selected HPLP [I and SF-8 Scales
By Education
HIJL PII - Nutrition - LowNon-low Low Total
EducationNo diploma i l l 51 162Diploma only 120 39 159Diploma plus 99 20 119Total 330 110 440
Chi-Square - 7.909
d f - 2 p-value - .019
HI3LP II - Spiritual Growth - LowNon-low Low Total
Education
No diploma 105 57 162Diploma only 114 45 159Diploma plus 100 19 119Total 319 121 440
Chi-Square - df-2 p-value -12.790 .002
HIJLP H - Interpersonal Relationships LowNon-low Low Total
EducationNo diploma 111 51 162Diploma only 115 44 159Diploma plus 103 16 119Total 329 111 440
Chi-Square - df-2 p-value -12.621 .002
Reproduced with permission of the copyright owner. Further reproduction prohibited without permission.

97
(Table 18 continued)HI’L PII - Stress Management - Low
Non-low Low TotalEducationNo diploma n o 52 162Diploma only 123 36 159Diploma plus 100 19 119Total 333 107 440
Chi-Square - df-2 p-value -10.082 .006
HI5LPII - Summary - LowNon-low Low Total
EducationNo diploma 110 52 162Diploma only 118 41 159Diploma plus 104 15 119Total 332 108 440
Chi-Square - d f - 2 p-value -14.283 .001
It appears that in every case lower educational levels are suggestive of lower
HPLP II scores (see Appendix K and L). As an example, note that while 37% of the
sample reported no high school diploma, 48% of those scoring low on the HPLP II
summary scale reported no diploma. On the other hand, 27% of the sample reported
receiving a high school diploma and going on for additional education. Only 14% of
those scoring low reported the same circumstance. This pattern is repeated throughout
the five possible relationships mentioned above.
A sixth possible relationship involving Education may be with the HPLP II
Nutrition subscale. Although the goodness-of-fit test failed to reject at a .05 level of
significance, the test’s p-value = .068 does suggest the potential for relationship
existence.
Reproduced with permission of the copyright owner. Further reproduction prohibited without permission.

98
Table 19 shows the comparison of mean Age between “Low” scoring respondents
and those not scoring low for each health related scale. In two cases, HPLP HIR and SF-
8 RP, the null hypothesis can be rejected at a .05 significance level. It appears that a
relationship does exist between Age and HPLP II Interpersonal Relationships and Age
and SF-8 Role Physical. In each case those scoring lower reported an average age higher
than those not scoring low.
Table 19
Mean Age Comparison for Selected HPLP II and SF-8 Scales by Low/Non-low Respondents_______________ _________________________ ____________Subscale Mean-non
lowMean - low t-value p-value
HPLP II - Interpersonal Relationships
79.54 77.89 2.149 .032
SF-8 - Role Physical 80.29 77.96 2.501 .013
In addition, four other potential relationships were indicated by marginal test
results (those that could be rejected at .1 but not at a .05 significance level). The test
results suggest that future studies might examine the potential relationship between Age
and the HPLP II summary scale, and SF-8 subscales General Health, Physical
Functioning and Social Functioning.
Of the 17 tests between Gender and the HPLP H subscales and SF-8 subscales and
summary scores, only one test showed a tendency toward a relationship (HPLP II
Nutrition subscale with Gender). However, the test did fail to reject at .05 with a p-value
= .059 (rejection could occur at .01). At best this represents a potential relationship that
might be examined more closely in a future study (see Appendix K). Overall, it does not
appear that gender can be used as a demographic descriptor of low scoring members for
this population.
Reproduced with permission of the copyright owner. Further reproduction prohibited without permission.

99
None of the tests comparing Ethnicity with the subscales or summary scores could
reject the null hypothesis at a significance level of .05. However, one test showed a
marginal tendency toward a relationship (HPLP II subscale of Interpersonal Relationship
subscale with Ethnicity) at a p-value of .057 (see Appendix K). This potential
relationship may deserve further examination in the future. Thus, it does not appear that
gender can be used as a demographic descriptor of low scoring members of this
population.
All 17 tests between Marital Status and the subscales and summary scores failed
to support a relationship. In each case the null hypothesis, that there was not a
relationship, could not be rejected. It does not appear that marital status can be used as a
descriptor of low scoring members for this population.
The results of this study do not suggest that a broad demographic profile of
“Low” scoring population members can be created. Tests for a relationship between
Marital Status, Gender and Ethnicity, and the HPLP H and SF-8 subscales and summary
scores failed. A few specific relationships involving Education Level and Age and
selected subscales and summary scores appear to exist. In particular, Education seems to
be highly related to most HPLP II scales (the exceptions are Health Responsibility and
Physical Activity). Also, the relationship between Education and the HPLP H summary
scale appears to be strong (p-value = .001). The results suggest that the SF-8 subscale
scores may be more closely related to Age (4 of 8 SF-8 subscales demonstrated at least
some tendency toward a relationship with Age). The SF-8 subscales General Health,
Physical Functioning, Role Physical, and Social Functioning suggested some relationship
might exist. Role Physical showed a strong indication of such a relationship. Age also
Reproduced with permission of the copyright owner. Further reproduction prohibited without permission.

100
appears to be related the HPLP II subscale Interpersonal Relationships, and possibly a
relationship exists with the HPLP II summary scale. Again, these relationships are
scattered among the numerous health related scales and fail to form a comprehensive
profile of “Low” scoring respondents for this population.
Reproduced with permission of the copyright owner. Further reproduction prohibited without permission.

101
Chapter 5
In this chapter, the research finding are discussed and compared to current
literature. The implications of the findings and discussion relating to Pender’s Health
Promotion Model for use within the discipline of nursing are examined. Limitations of
this study and recommendations for further research are also included.
In spite of the identified need for research in the rural setting, limited data exists
describing the relationship of health status and health promoting behaviors, especially
with the older adult population. Another concern is the trouble of making meaning of
the scores. There is not empirical evidence of what the scores actually mean so the
continued use of the tool would provide the opportunity to consider norms for various age
levels. This research does contribute to the nursing profession by enhancing knowledge
about health promoting behaviors and health status of older adults living in rural areas.
In order to develop nursing interventions focused on the older adult population and
support behaviors that promote health, research such as this is necessary. Using Pender’s
Health Promotion Model as a theoretical framework, this study was conducted to answer
the following questions:
1. What are the health promoting behaviors of the well older adult living in the
rural setting?
2. What is the perceived health status of the well older adult living in the rural
setting?
3. What is the relationship of health promoting behaviors and self-perceived
health status for well older adults in the rural setting?
Reproduced with permission of the copyright owner. Further reproduction prohibited without permission.

102
4. What is the profile of the rural older adult person who measures low on the
HPLP Hand the SF-8?
Discussion
Health Promoting Behaviors
The research findings of this study indicate that the most commonly used health
promoting behaviors for this sample are related to Spiritual Growth, Interpersonal
Relationships, Nutrition, and Stress Management. Of those. Spiritual growth is the most
frequently used health promoting behavior for this sample. Walker (personal
communication, 2000) defines spiritual growth as a feeling of connection to a force
greater than one’s self and an awareness of what is important in life. The older adult
population, when facing death, may realize that spirituality is of the utmost importance in
the later years or at the end of life. A spiritual belief system can deepen the meaning of
their own lives and heighten their awareness of spirituality. In addition, a belief in God
was viewed as a source of guidance, comfort and pride for older adults (Davis &
Magilvy, 2000). Also older adults have a tendency to participate in organized religion
such as church services , which might be reflected in these findings. In a proposed
expansion of Pender’s Health Promotion Model, Boland (2000) found that Spiritual Well
being and Social support had direct and indirect influences on the level of commitment
and performance of health promoting behaviors. Boland (2000) suggests that factors
such as spirituality should be taken into account by health care professionals for
integration into planning care and health promotion programs and used as a resource to
promote participation and commitment by older adults.
Reproduced with permission of the copyright owner. Further reproduction prohibited without permission.

103
The second most endorsed health promoting behaviors was interpersonal support.
Interpersonal support reflects the maintenance of relationships, which involves a sense of
intimacy and closeness (Walker, personal communication, 2000). Davis and Magilvy
(2000) also found that the combined values related to spirituality and family support were
significant for older rural adults. They report that families were the major support system
for their sample. Letvak (1997) notes that rural elderly women describe their lives as one
of connectedness, relating themselves as mothers, friends and community members.
Letvak further frames their descriptions in the context of affiliations with other persons.
Letvak further states that nurses need to be aware of the importance of relationships with
others for the rural older adult. Family and friends should be included in the provision of
health promoting programs for this population. Additionally, older adults without family
support should be assessed for other sources of support.
The third most frequently endorsed Health Promoting Behavior for this sample
was in Nutrition. According to Walker (personal communication, 2000), nutrition is the
establishment of meal patterns and making food choices. The higher score for nutrition
might have been a result of this study actually taking place at dining sites where nutrition
information is provided to participants on a daily basis. However, continued focus on
healthy eating and proper food choices is necessary to maintaining the present health
status of this rural older adult population.
Stress management was another area of endorsed Health Promoting Behaviors for
this sample of rural older adults. Walker (personal communication, 2000) refers to stress
management as the recognition of sources of stress and action taken to control stress and
achieve relaxation. Duffy (1993) reports that in study of older adults, that they routinely
Reproduced with permission of the copyright owner. Further reproduction prohibited without permission.

104
practiced stress management. Many of these older adults have lived thru war, the Great
Depression, and other life experiences that may have made them better able to cope with
stress. Pullen, Walker, and Fiandt (2001) also found that high levels of stress
management for rural women had a significant influence on perceived mental health for
their sample. For both of the studies, Pullen et. al (2001) and this study, higher level of
perceived mental health was associated with higher levels of participation in other health
promoting behaviors. For this study, those Health Promoting Behaviors highly correlated
with Mental Health included Physical Activity, Nutrition, Spiritual Growth, Interpersonal
Relationships, and Stress Management.
The lowest health promoting behavior for this rural older adult sample is Physical
Activity. Walker (personal communication, 2000) defines physical activity as regular
adherence to an exercise program. While prevalence rates for chronic illness were not
established, the decrease in physical activity with advancing age is not surprising given
more incidences of chronic illnesses (Mainous, 1995; Fowler ,1997; and McCade,
Walker, & Clark, 1997). Physical strength may be defined by this sample as a sign of
wellness, resulting in lower scores for this sample on health status. If they identify
themselves as weak and unable to do physical activity, they may perceive themselves as
less healthy and less productive. Yet, those that did participate in physical activity and
reported higher scores as a health promoting behavior may connect this with the ability to
get around, maintain their independence, and be productive. The age of this sample was
in the high seventies, this might be directly correlated to the lower scores in physical
activity. However, this is another area of health promotion that could be addressed by
primary care providers or health promotion programs for the rural older adult population.
Reproduced with permission of the copyright owner. Further reproduction prohibited without permission.

105
When compared to other studies, most of the subscale scores for health promoting
behaviors of this well, older adult sample in the rural setting were lower than for the
populations reported in other studies (see table 19).
Table 20-
Comparison of Mean scores and Standard Deviations of HPLP H scores and Summary ScoresSubscale Newberry,
(2002)
Rural older adults
n=440
Pullen, et.al (2001)
Rural older women
n=102
Fowler(1997)
Persons with Parkinson’s Disease n=41
Stuifbergen& Roberts(1997)Women withMultipleSclerosisn=629
Walker & Hi 11-Polerecky(1996)(norm)
n= 712Healthresponsibility
2.44 (.59) na 2.94 (.60) 2.48 (.54) 2.49 (.64)
PhysicalActivity
2.18(.64) 2.18 (.73) 2.33 (.88) 1.88 (.66) 2.34 (.71)
Nutrition 2.78 (.55) 3.21 (.58) 2.99 (.57) 2.58 (.61) 2.60 (.59)SpiritualGrowth
2.90 (.60) na 2.92 (.66) 2.99 (.62) 3.08 (.54)
InterpersonalRelations
2.87 (.51) na 3.01 (.64) 3.08 (.53) 2.99 (.58)
StressManagement
2.76 (.55) 3.09 (.46) 2.88 (.65) 2.69 (.58) 2.61 (.55)
HealthPromotingLifestyle-(Summary)
2.66 (.45) 2.89 (.38) na 2.63 (.42) 2.69 (.45)
Mean age 78.31 (7.02) 74 (5.99) 71(9.11) 46.67 (9.94) 42.4(15.4)(na= data not available)
Reproduced with permission of the copyright owner. Further reproduction prohibited without permission.
106
The subscale scores for Stress management were slightly higher for this sample
than those scores reported in women with Multiple Sclerosis (MS) (Stuifbergen &
Roberts, 1997) and lower than rural older women (Pullen & Walker, 2001). In addition,
the nutrition subscale score was higher for this sample than for women with MS
(Stuifbergen and Roberts, 1997).
The overall summary score fell between the scores for women with MS
(Stuifbergen & Roberts, 1997) and the scores for a normed sample (Walker & Hill-
Polerecky, 1996) and lower yet, than the rural women in the study reported by Pullen et.
al (2001). However, the scores are relatively close in comparison, thus indicating that the
samples are very similar in overall health promoting behaviors. Pullen et. al (2001)
concluded that older adults may have survived into older age by taking care of
themselves by engaging in and maintaining more health promoting behaviors than
younger populations.
These findings will allow nurses a starting point from which to identify and assess
barriers, benefits, and activities around the individual’s capabilities, and focus teaching
and the methods used for teaching on self-management of chronic health problems and
physical disabilities. Dychtwald (1999) reports that an increased sense of health
responsibility will improve or ameliorate severity of chronic health problems for the older
adult. Further research is indicated.
Perceived Health Status
In comparing the scores from this study to the results of other studies, the
perceived health status of this rural older adult sample is lower then the reported general
population scores of persons with one physical condition (Ware, 2000). Also the scores
Reproduced with permission of the copyright owner. Further reproduction prohibited without permission.

107
are lower than the normed scores for persons over 60 years of age (Ware, 2000) for all of
the subscales and summary scales (See Table 20).
Table 21
Comparison of Mean and Standard Deviations of SF-8 Subscales and Summary Scores
Subscale Newberry(2002)
n= 440 Mean (SD)
General pop with 1+ physical condition (Ware, 2001) n = 18,794 Mean (SD)
NORM (Ware, 2001) age 60 and older
n = 1,661 Mean (SD)
PhysicalFunctioning
43.97 (9.01 48.12(8.19) 46.32 (5.39)
Role Physical 44.72 (9.29) 48.91 (7.76) 47.21 (4.78)Bodily Pain 48.23 (9.27) 50.14(8.64) 49.44 (6.50)General Health 45.37 (6.51) 49.47 (7.53) 49.07 (6.16)Vitality 48.83 (7.62) 50.80 (7.83) 50.50 (6.77)SocialFunctioning
47.45 (7.82) 49.87 (7.74) 49.21 (5.83)
Role Emotional 46.48 (7.06) 48.48 (6.28) 47.38 (4.74)Mental Health 50.38 (7.66) 51.21 (7.02) 51.61 (6.01)Mental Health Summary
50.77 (8.21) 51.73 (9.05) 52.06 (5.64)
Physical Health Summary
44.14(9.85) 49.01 (7.07) 46.99 (6.91)
This may indicate that rural individuals do, in fact, perceive their health status as
poorer than their urban counterparts as also reported by Coward, McLaughlin, Duncan
and Bull (1994) and Mainous (1995). Consistent with a study conducted by Pullen,
Walker, & Fiandt (2001), these older adults in the rural setting reported their general
health in a range from poor to excellent, with the majority reporting fair health status.
Pullen et. al (2001) suggest that it is possible that the older adults can see potential for
wellness in combination with chronic illness and that emotional wellness outlook allows
them to strive for a overall goal of wellness and participation in health promoting
behaviors. Edelman and Mandle (1998) define wellness as the individual’s ability to
Reproduced with permission of the copyright owner. Further reproduction prohibited without permission.

108
adapt, to relate to others effectively, and to function at near-maximum capacity.
According to the authors, wellness includes self-responsibility, nutritional awareness,
physical fitness, stress management, environmental sensitivity, productivity, expression
of emotions, self-expression in a variety of ways, creativity, personal care, and home and
automobile safety. The perceived Mental Health for this sample is better than the
perceived Physical Health as indicated by the summary scale scores for the SF-8. As
with the sample from Pullen et. al (2001), this sample of older adults may have a more
positive outlook on their emotional status, than on their physical status.
Overall, the subscale scores for this rural older adult sample are lower, but
comparable to other older adults in the areas of bodily pain, vitality, role emotional,
social functioning, and mental health (see table 20). The subscale scores for role physical
and physical functioning were lower for this rural older adult sample. This may be
directly related to the age of the sample in this study. With the mean age of greater than
78 years and more than 46 % of the sample over the age of eighty, they may very well be
experiencing several chronic illnesses, which impede their ability to perform routine
physical activities. In addition, Shaw (1997) reports that health for the rural population
can be connected to hardiness, independence, and the ability to work. However, it is
important to note that this volunteer sample represents persons attending dining activities
outside of their homes, indicating that they are capable of at least limited physical activity
in being able to come to the dining facility.
Relationship between Health Promoting Behaviors and Health Status
Many relationships were demonstrated in the data analysis of this study.
Consistent with Duffy (1988) and Padula (1997) this study found that perceived health
Reproduced with permission of the copyright owner. Further reproduction prohibited without permission.

109
status was positively related to health promoting behaviors. The findings indicate that
complex, yet, significant relationships exist between overall health promoting behaviors
and perceived health status for the older adult living in the rural setting. The SF-8
subscale of Physical Functioning was related to the HPLP H behaviors for Physical
Activity, Spiritual Growth, Stress Management, and the HPLP II Summary scale. Role
Physical was related to Physical Activity, Nutrition, Spiritual Growth, Stress
Management, and the HPLP II Summary scale. Bodily Pain was related to Physical
Activity, Interpersonal Relationships, Spiritual Growth, Stress Management, and the
HPLP H Summary scale. General Health was related to Physical Activity, Nutrition,
Spiritual Growth, Interpersonal Relationships, Stress Management, and the HPLP D
Summary scale. Vitality was related to Physical Activity, Nutrition, Spiritual Growth,
Interpersonal Relationships, Stress Management, and the HPLP Q Summary scale. Social
Functioning was related to Physical Activity, Nutrition, Spiritual Growth, Interpersonal
Relationships, Stress Management, and the HPLP H Summary scale. Role Emotional
was related to Physical Activity, Interpersonal Relationships, Stress Management, and the
HPLP H Summary scale. Mental Health was related to Physical Activity, Nutrition,
Spiritual Growth, Interpersonal Relationships, Stress Management, and the HPLP II
Summary scale. The strongest evidence demonstrates a relationship exists between the
perceived health status for the rural older adult and the Health Promoting Behaviors of
Physical Activity, Spiritual Growth, Stress Management, and the HPLP H Summary
scale. Only one of the subscales of the HPLP H, health responsibility, failed to have a
relationship with rural older adults’ self perceived health status. The lack of a
Reproduced with permission of the copyright owner. Further reproduction prohibited without permission.

110
relationship may be the result of an independent attitude or the lack of accessibility to
health care providers.
This seems to be consistent with what one might expect given the sample’s
demographics regarding family and education. Those who highly value family and are
sufficiently educated might be inclined to pursue just such behaviors. On the other hand,
rural people are commonly thought of as being independent, hardy, and are often heavily
involved in manual labor throughout their lives (Shaw, 1997). This may explain their
avoidance of Health Responsibility (the need for self-reliance) and Physical Activity.
Health responsibility in the HPLP II refers to attending and accepting
responsibility for one’s own health, being educated about health, and seeking
professional assistance when necessary (Walker & Hill-Polerecky, 1996). The questions
on the HPLP II tool that merge to make up the subscale for Health Responsibility query
the participants about their habits with health care professionals. The tool questions
whether the individual watches or attend programs about health, question instructions
from health care providers, get a second opinion, or perform monthly self exams.
Johnson (1991) reports that rural older adults have a difficult time seeing the
importance of seeking a health care provider as they age. This may be indicative of the
rugged independence often associated with self-reliance in rural residents (Shaw, 1997).
In addition, being independent most of their lives, they choose not to share information
with non-family members, such as health care providers. Pullen et.al. (2001) also noted
that rural elderly women in their study used formal health care services sparingly. They
report that lifestyle counseling for this population is low. The low scores in health
responsibility for both studies may be a consequence of or combination of two
Reproduced with permission of the copyright owner. Further reproduction prohibited without permission.

I l l
conditions; the lack of rural health care providers and the attitudes of the rural older
adults toward seeking out health information or health care practices. Rural older adult
populations have historically shown that when they arise in the early morning for chores
around the farm, that they do not consider ill health as a deterrent to performing those
duties. In part, this may be a consequence of their economic status being dependent upon
getting the work done. This may be a life-long attitude that presents itself in the findings.
This can have significant impact on how to approach this population with health
education. Further research is needed to validate this attitude.
The findings in this study are contrary to those reported by Koehler (1998) and
Riffle, Yoho, and Sams (1989). They report that rural elderly are interested in medical
regimen compliance and practicing health-promoting behaviors. This indicates a need for
further investigation into the concept of health responsibility as it applies to the rural
population. This may be an extremely important finding and an area of great concern,
since healthy aging may be dependent on individuals accepting responsibility for and
maintaining their health status and health promoting behaviors (Pullen et. al, 200 L).
Another finding was that the persons who scored high on General Health had high
scores on physical activity. Pender (1996) and Walker, Secrist, and Pender (1987)
suggest that an individual’s perceived health status may influence their health promoting
behaviors and provide the desire and ability to maintain their health status. Thus
indicating that those individuals that perceive themselves as well maintain higher levels
of physical activity. This is good news for the rural older adult in that those that perceive
themselves as well, are indeed continuing to practice the health promoting behavior of
Reproduced with permission of the copyright owner. Further reproduction prohibited without permission.

112
physical activity. In turn, this behavior will likely sustain their ability to maintain their
independence and activity levels.
Low Profiler
The demographic variables for the rural older adult were found to be poor
predictors of either health promoting behaviors or health status. Not surprisingly, the
older the individual, the lower they scored on all of the subscales for health status. This
may be a consequence of the age of this sample. The mean age for this rural sample was
greater than 78 years of age, in fact the largest cohort (greater than 46 %) were those aged
80 and older. The research findings of Walter, Munro, and Brazier, 2001 support the
expectation that health status will decline as an individual’s age increases. Yet, as Pullen
et. al (2001) suggest, the need to determine which factors may facilitate or impede the
practices of health promoting behaviors is especially important with the older adult
population given that they are living longer and with more incidences of chronic illness.
Consistent with Frank et. al (1998), Frauman and Nettles-Carlson (1991), and
Padula (1997), this study found that those individuals with higher educational levels
exhibited an increased number of health promoting behaviors. The study sample had a
high percentage of high school graduates (55.8 %) compared to the proportion of high
school graduates (36.03%) in the U.S. general population over 65 years of age (U.S.
Census, 2000). This is a somewhat surprising since one might think that the rural
population tend to be less educated according to Shreffler (1996) and Bushy (1996).
Rural older adults tend to have less access to medical care and health promotion
information that might promote a wellness-focused lifestyle. In addition, Sharp (1991)
and Koehler (1998) point out that there is a substantial proportion (26%) of older adults
Reproduced with permission of the copyright owner. Further reproduction prohibited without permission.

113
who are living in rural areas. The rural location of this study suggests a need to foster
partnerships with organizations, such as dining centers, to cultivate health promotion
programs. This appears to be a place where older adults congregate in the rural setting
and may be an ideal place for rural nurses to provide educational programs focused on
health promoting behaviors.
Relationship of Findings to Pender’s Health Promotion Model
Pender’s Health Promotion Model (HPM) was used to serve as a guide to explain
health behaviors in older adults. The HPM could serve as a framework in the
development of clinically appropriate interventions to promote the initiation and
maintenance of health promoting behaviors (Pender et. al, 2002). The first construct of
Pender’s Health Promotion Model examined was the outcome of Health Promoting
Behaviors listed under Behavioral Outcomes. Pender (1996) reports that an individual’s
health promotion plan identifies lifestyle strengths and resources. The HPLPII measured
the behavioral outcome of health promoting behaviors for the study participants. The
health promoting behavior is considered the end-point or action outcome in the HPM
(Pender, 1996). The participants of this study showed comparable HPLP II overall
summary scores to similar studies (Pullen, et. al. (2001), Fowler (1997), Stuifbergen &
Roberts (1997), and Walker & Hill-Polerecky (1996). However, the subscale scores for
Health Responsibility were lower for this sample than the other studies. Pender (1996)
and Pullen et. al (2001) posit that the increased knowledge base regarding factors that
facilitate or obstruct health promoting lifestyle behaviors will provide direction in the
development of health promotion programs. The area that presented lower scores,
Reproduced with permission of the copyright owner. Further reproduction prohibited without permission.

114
Health Responsibility in health promoting behaviors, may well be an area for education
and future growth for the rural older adult population.
The second construct of Pender’s Health Promotion Model under examination
relates to the Personal Factors, listed under the Individual Characteristics and
Experiences. The Personal Factors of each individual, as identified by Pender (1996)
have an impact upon maintenance of health promoting behaviors. The personal factors
include biological, psychological, and sociocultural variables. Biological variables
include age, gender, body mass index, strength, agility, balance, and others. The
psychological factors include self-esteem, self-motivation, perceived health status, or
personal competence. The sociocultural variables include race, education, or socio
economic status (Pender, 1996). An individuals’ perceived health status is considered a
Psychological factor of the Personal factors of the Individual Characteristics and
Experiences (Pender, 1996). In the present study, the perceived health status was
operationalized with the Short Form - 8 Health Status Survey. It was determined that the
rural older adult in this study perceived their health status as poorer than the reported
general population scores of persons with one physical condition (Ware et. al., 2001).
Also their scores are lower that the normed scores for persons over 60 years of age (Ware
et. al., 2001) for all of the subscales and summary scales (See Table 20). However, they
did not generally perceive their health as poor, the means were simply lower. The older
adults in the rural setting reported their general health in a range from poor to excellent,
with the majority reporting fair health status. It is also important to note that the mean
age of this sample was greater than 78 years of age, making them significantly older than
60 years of age.
Reproduced with permission of the copyright owner. Further reproduction prohibited without permission.

115
Overall, the results of this study support the use of Pender’s Health Promotion
Model to guide nurses in determination of which Personal Factors may be strengths or
weaknesses for the rural older adult populations. Pullen et. al (2001) agree that personal
influences make a significant contribution to the participation in health promoting
behaviors by rural older women. Pender et. al (2002) suggest that nurses’ assessment of
demographic variables, perceived health status, and prior participation in health
promoting can assist them in development of interventions to best meet the needs of
client populations. This can be accomplished by research that would operationalize the
full Health Promotion Model including all Pender’s variables and the issues of safety and
environment.
Limitations
The purpose of this study was to examine the relationship between the perceived
health status (SF-36) and the health promoting behaviors (HPLP II) of the well older
adults in rural settings. In addition, demographic variables of the sample were examined
in relation to the health-promoting behaviors and self-perceived health status. The study
included mostly white, rural older adults. The complexity of health status, health
promoting behaviors, and the present limitations to the generalizability of the study
results. The participants were self-selected out of the persons (71.4%) attending the
dining centers, thus they do represent the population of the person’s attending the dining
centers. Those persons responding may have had an interest in the outcome of the study
and their responses may have varied from those who chose not to participate or those
who did not meet the criteria for participation.
Reproduced with permission of the copyright owner. Further reproduction prohibited without permission.

116
Recommendations for Further Research
The results of this study add interesting information to the body of nursing
knowledge related to the health status and health promoting behaviors of the older adult
living in the rural setting. However, further study is needed. In this study the scores for
health responsibility were low and not correlated to health promoting behaviors. Further
investigation into the reasons for the findings reported regarding the lack of health
responsibility of this sample of rural older adults is warranted. These findings provide a
starting point for a qualitative inquiry concerning a lack of self-reported health
responsibility for this population. This study did not delve into the qualitative inquiry
that may be needed to answer further questions. Do rural older adults indeed demonstrate
a lack of responsibility for their health or is it that the tools do not translate to a rural
translation in the same manner as for their urban counterpart? Are there ways that rural
older adults would express health responsibility? It should be noted that at the very least
these clients are showing responsibility by attendance at the dining centers for proper
nutrition.
Comparison of these findings with a study of persons living in congregate housing
or those that are home bound would lead to an increase in knowledge leading to more
comprehensive information on all rural older adults. In addition, there is a vast number
of older adults that do not participate in activities at dining centers, yet they remain active
and participate in the rural culture. It is important to replicate this study in other
populations to determine if the relationships between the health promoting behaviors and
health status are similar. Additional studies in different geographic locations, especially
with samples of greater ethnic diversity are warranted. If nurses are providing education
Reproduced with permission of the copyright owner. Further reproduction prohibited without permission.

117
and interventions focused on need to keep rural older adults as active and healthy as
possible, then attention needs to be expanded to a wider assortment of older individuals
living in the rural community.
Additional questions arise that are related to other elderly populations their health
status and health promoting behaviors. Examining other populations and utilizing other
methods of gathering data might address their particular concerns and limitations.
Although these tools are considered appropriate for older adult populations (Ware et.al.,
2001 and Pullen et. al, 2001) participants reported the questionnaires were lengthy and
burdensome. Continued use and refinement of the tools is also warranted.
Another area of interest for future study is to question when the health promoting
behaviors began for this population. Were the behaviors present for one year, ten years,
was it life long practice or did they never practice certain health promoting behaviors? It
could be extremely useful information when nurses are preparing educational programs
to know which age group to target and as substantiation for program outcomes.
Since the age of this sample of rural older adults is quite elderly, a longitudinal
study may give a more thorough description of health status and health promoting
behaviors of older adults. How many people died out due to unhealthy lifestyles? Is
there important data missing from those who did not survive to be of this age? This
could give nurses a broader view for preparation and teaching of health promoting
behaviors that will benefit older adults and provide reinforcement of desirable behaviors
that will focus attention on patterns of prevention and maintenance of health.
Many theorists propose examples of health aging in their developmental theories.
Kelly (1990) identifies developmental tasks of aging by terms of three R’s; 1) acceptance
Reproduced with permission of the copyright owner. Further reproduction prohibited without permission.

118
of reality (acknowledgment of physical, social and financial limitations). 2) fulfillment of
responsibility ( planning for the remainder of one’s life and making arrangements for
loved one’s left behind), and 3) exercising of individual rights (rights of privacy, respect,
and refusal). Ebersole and Hess (1998) refers to health aging as the individual’s adaptive
capacity to experiences and events that will assure a greater knowledge and higher levels
of adaptation. Another example is Erickson’s theory of integrity vs. despair (1986)
suggests that the challenge of getting older is to accept and Find meaning in one’s own
life. If inadequate ego integrity is accomplished, then anger, bitterness, and depression
can result. Erickson, Erickson, Kivnick (1986) suggests that satisfaction is achieved
through a positive attitude and a positive outlook on life. The results of this study may
indicate that the sample has accepted the limitations of life and sense a self actualization
(Erickson, Erickson, & Kivnick (1986). The results reflected in stress management,
spiritual growth, and high scores on Mental health may demonstrate that developmental
tasks have been achieved for this sample and the years of working hard, close to the
earth, and their connectedness to others has given this rural older adult sample
cohesiveness and meaning in their lives. However, further research is indicated to show
in depth, healthy transition into very old age.
Reproduced with permission of the copyright owner. Further reproduction prohibited without permission.

119
References
Ahijevych, K., & Bernhard, L. (1994). Health-promoting behaviors of African-
American women. Nursing Research. 43(2). 86-89.
Ardell, D. B. (1985). The history and future of wellness. Health Values. 9(6). 37-
56.
Arrington, D. T. (1997). Retirement communities as creative clinical
opportunities. Nursing & Health Care: Perspectives on Community. 18(2), 82-85.
Bandura, A. (1977). Self-efficacy: Toward a unifying theory of behavioral
change. Psychological Review. 8 4 .191-215.
Bausell, R. B. (1986). Health-seeking behavior among the elderly. The
Gerontologist. 26(5), 556-559.
Bergner, M., Bobbitt, R. A., Carter, W. B., & Gibson. B. S. (1981). The sickness
impact profile: Development and final revision of a health status measure. Medical
Care. 8 .787-805.
Boland. C. S., (2000). Social support and spiritual well-being: empowering older
adults to commit to health-promoting behaviors. The Journal of Multicultural Nursing &
Health. 6(3). 12-23.
Brazier, J. E., Harper, R., Jones, N. M., O’Cathain, A., Thomas, K. J.,
Usherwood, T., & Westlake, L. (1992). Validating the SF-36 health survey
questionnaire: new outcome measure for primary care. British Medical Journal. 305.
(6846), 160-164.
Busby, A. (1992). Rural nursing research priorities. Journal of Nursing
Administration. 22(1). 50-57.
Reproduced with permission of the copyright owner. Further reproduction prohibited without permission.

120
Bushy, A. (1996). Community health nursing in rural environments. InM .
Stanhope and J Lancaster (Eds.). Community Health Nursing: Promoting the Health of
Aggregates. Families and Individuals (4th ed.). St Louis, MO, Mosby Year Book, p. 315-
332.
Centers for Disease Control and Prevention (1993). Public health focus: Physical
activity and prevention of coronary heart disease. Morbidity and Mortality Weekly
Report. 42 .669-672.
Centers for Disease Control and Prevention (2001). Retrieved on 12/01/01 from
the World Wide Web @ http://www.cdc.gov/maso/factbook/main.htm.
Clark, C.C. (1996). Wellness practitioner, concepts, research and strategies. New
York: Springer Publishing Company, Inc.
Clark, C. C. (1998). Wellness self-care by healthy older adults. Image: Journal
of Nursing Scholarship. 30(4). 351-355.
Conn, V. S. (1998). Older adults and exercise, path analysis of self-efficacy
related constructs. Nursing Research. 47(3). 180-189.
Coward, R. T„ McLaughlin, D. K., Duncan, R. P., & Bull, C. N. (1994). An
overview of health and aging in rural America. In R. R. Bowker & R. Elsevier (Eds.),
Health Services for rural elders. NewYork: Springer Publishing.
Davies, A. R. & Ware, J. E. (1981). Measuring health perceptions in the health
insurance experiment. Santa Monica, CA: RAND Corporation.
Davis, R. & Magilvy, J. K. (2000). Quiet pride: the experience of chronic illness
by rural older adults. Journal of Nursing Scholarship. 32(4), 385-390.
Reproduced with permission of the copyright owner. Further reproduction prohibited without permission.

121
Devore, J & Peck, R. (1993). Statistics: the exploration and analysis of data. (2nd
ed. Belmont, California; Duxbury Press
Duffy, M. E. (1988). Determinants of health promotion in midlife women.
Nursing Research. 37(6). 358-362.
Duffy, M. E. (1993). Determinants of health-promoting lifestyles in older
persons. Image: Journal of Nursing Scholarship. 25(1). 23-28.
Dunn, H. (1961). High level wellness. Arlington, VA.: Beatty Press.
Dychtwald, K. (1999). Healthy aging: challenges and solutions. Gaithersburg,
MD: Aspen Publications, Inc.
Eakin, B. L., Brady, J. S., & Lusk, S. L. (2001). Creating a tailored, multimedia,
computer-based intervention. Computers in Nursing. 19(4). 152-160.
Ebersole, P., Hess, P. (1998). Toward healthy aging: human needs and nursing
response (5th ed.). St. Louis, Mo.: Mosby.
Edelman, C. L. & Mandle, C. L. (1998). Health promotion throughout the
lifespan. (4th ed.). St. Louis, MO: Mosby-Year Book.
Erickson, E. H., Erickson, J. M., Kivnick, H. Q. (1986). Vital involvement in old
age. New York: W. W. Norton..
Falck, V. T. (1994). Promoting the health of aging adults in the community.
Journal of Community Health. 19(6), 389-393.
Felton, G. M., Parsons, M. A., Misener, T. R.. & Oldaker, S. (1997). Health-
promoting behaviors of black and white college women. Western Journal of Nursing
Research, 19(5). 654-666.
Reproduced with permission of the copyright owner. Further reproduction prohibited without permission.

122
Foster, M. F. (1992). Health promotion and life satisfaction in elderly black
adults. Western Journal of Nursing Research. 14(4). 444-463.
Fowler, S. B. (1997). Hope and a health-promoting lifestyle in persons with
Parkinson’s disease. Journal of Neuroscience Nursing. 29(2). 111-116.
Frank, D. I., Stephens, B., Lee, S. H. (1998). Health-promoting behaviors of
African-American rural women. Clinical Excellence for Nurse Practitioners. 2(3), 159-
165.
Frank-Stromberg, M., Pender, N., Walker, S., & Sechrist, K. (1990).
Determinants of health-promoting lifestyles in ambulatory cancer patients. Social
Science and Medicine. 31.1159-1169.
Frauman, A. C., & Nettles-Carison, B. (1991). Predictors of a health promoting
life-style among well adult clients in a nursing practice. Journal of the American
Academy of Nurse Practitioners. 3(4). 174-179.
Hamburg, M. (1983). Statistical analysis for decision making (3rd ed.). San
Diego, California; Harcourd Brace Jovanovich, Publishers
Heine, C. (1992). Community issues in the holistic care of the elderly. Holistic
Nurse Practitioner. 7(1). 53-60.
Hocking, R. R. (1996). Methods and applications of linear models: Regression
and the analysis of variance. NewYork: John Wiley & Sons, Inc.
Hunt, S. M., McKenna, S. P., & McEwen, J. A. (1980). A quantitative approach
to perceived health status: A validation study. Journal of Epidemiology and Community
Health. 3 4 .281-285.
Reproduced with permission of the copyright owner. Further reproduction prohibited without permission.

123
Hutchison, J. (1990). Wellness: A health care strategy for an aging population.
The ACHPER National Journal. March, 27-29.
Johnson, J. (1991). Health-care practices of the rural aged. Journal of
Gerontological Nursing. (17)8, p. 15-19.
Kane, R. A., & Kane, R. L. (1981). Assessing the elderly. A practical guide to
measurement. Lexington, MA.: Lexington Books.
Kligman, E. W. (1990). New series: Promoting healthy aging. Geriatrics. 47(7).
38-50.
Koehler. V. (1998). The substantive theory of protecting independence. In H. J.
Lee (Ed.), Conceptual Basis for Rural Nursing. New York: Springer Publishing Co. Inc.
Laffrey, S. C. (1986). Development of a health conception scale. Research in
Nursing and Health. 9 , 107-113.
Larouche, R. (1998). Determinants of college students’ health-promoting
lifestyles. Clinical Excellence for Nurse Practitioners. 2 (1). 35-44.
Letvak, S. (1997). Relational experiences of elderly women living alone in rural
communities: a phenomenologic inquiry. Journal of the New York State Nurses
Association. 28(2). 20-25.
Long, K. A. (1993). The concept of health: rural perspectives. Rural Nursing, 28.
123-130.
Lookinland, S., & Harms, J. (1996). Comparison of health-promotive behaviors
among seniors: Exercisers versus non-exercisers. Social Sciences in Health. 2(3), 147-
161.
Reproduced with permission of the copyright owner. Further reproduction prohibited without permission.

124
Lusk, S. L., Kerr, M. J., Ronis, D. L., & Eakin, B. L. (1999). Applying the health
promotion model in development of a worksite intervention. American Journal of Health
Promotion, 13(4), 219-227.
Mainous, A. G., Ill (1995). A comparison of health status between rural and
urban adults. Journal of Community Health. 20(5). 423-432.
McCade, B. W„ Walker, S. N„ & Clark, K. A. (1997). Health promotion in long
term care facilities. Journal of Nursing Science, 2:(5-6). 153-167.
McCullagh, M., Lusk, S. L., & Ronis, D. L. (2002). Factors influencing use of
heating protection among farmers. Nursing Research, 51(1). 33-39.
McHomey, C. A., Ware, J. E., Lu, J. F. K., & Sherboume, C. D. (1994). The
MOS SF-36 Short-Form Health Survey (SF-36): HI. Test of data quality, scaling
assumptions, and reliability across diverse patient groups. Medical Care. 32,40-66.
McHomey, C. A., Ware, J. E., & Raczek, A. E. (1993). The MOS 36-item short
form health survey (SF-36): II. Psychometric and clinical tests of validity in measuring
physical and mental health constructs. Medical Care, 31. 247-263.
McManus, E. M. (1996). Health promotion and social support for community-
based clients with chronic mental illness. Nursing Connections. 9(4), 49-55.
Melillo, K. D., Futrell, M., Williamson, E., Chamberlain, C., Bourque, M. M.,
MacDonnell, M.. & Phaneuf, J. P. (1996). Perceptions of physical fitness and exercise
activity among older adults. Journal of Advanced Nursing. 23(3), 542-547.
Mellillo, K. D., Williamson, E., Futrell, M., & Chamberlain, C. (1997). A self-
assessment tool to measure older adults’ perceptions regarding physical Fitness and
exercise activity. Journal of Advanced Nursing. 25(6). 1220-1226.
Reproduced with permission of the copyright owner. Further reproduction prohibited without permission.

125
Miller, C. A. (1999). Nursing care of older adults: theory and practice (3rd
edition). Philadelphia: Lippincott.
Miller, M. P. (1991). Factors promoting wellness in the aged person: An
ethnographic study. Advances in Nursing Science. 13(4). 38-51.
Morgan, K., Dallosso, H., Bassey, E., Ebrahim, S., Fentem, P, & Arie, T. (1991).
Customary physical activity and psychological well-being and successful aging. Aging
and Society. 11.399-415.
National Institute of Health (2000). Profile of older americans. Retrieved
December, 2000 from the World Wide Web: http://www.nih.gOv/nia/news/pr/html#.
National Rural Health Association^ 1999). Access to health care for the
uninsured in rural and frontier America. Retrieved February 17,2000 from the World
Wide Web: http://www.nrharural.org.on.
Norusis, M. J. (1993). SPSS for Windows Advanced Statistics, Release 6.0.
Chicago, II: SPSS Inc.
Office of Technology Assessment. (1990) Health care in rural America.
Washington, DC: U.S. Government Printing Office.
Orem, D. (1971). Nursing: Concepts of practice. NewYork: McGraw-Hill.
Padula, C. A. (1997). Prediction of participation in health promotion activities by
elderly couples. Journal of Family Nursing. 3( 1). 88-106.
Parker, S. G., Peet, S. M., Jagger, C., Farhan, M., & Castleden, C. M. (1998).
Measuring health status in older patients: The SF-36 in practice. Age and Aging, 2 7 ,13-
18.
Reproduced with permission of the copyright owner. Further reproduction prohibited without permission.

126
Pender, N. (1987). Health promotion in nursing practice. (2nd ed.). Norwalk,
CT: Appleton and Lange.
Pender, N. (1996). Health promotion in nursing practice. (3rd ed.). Stamford,
CT: Appleton and Lange.
Pender, N. J., Murdaugh, C. L., Parsons, M.A. (2001). Health promotion in
nursing practice. (4th ed). Upper Saddle River NJ: Prentice Hall.
Pfeiffer, E. (1972). The short portable mental status questionnaire for the
assessment of organic brain deficit. Journal of the American Geriatrics Society. 23( 10).
433-441.
Pullen, C., Walker, S. N„ Fiandt, K. (2001). Determinants of health-promoting
lifestyle behaviors in rural older women. Family Community Health, 24(2). 49-72.
Rand Corporation & Ware, J. E. (1990). The short-form-36 health survey.
Instruments for Clinical Health Care Research, (2nd ed.). Boston: Jones and Bartlett
Publishers.
Riffle, K. L., Yoho, J., & Sams, J. (1989). Health-promoting behaviors,
perceived social support, and self-reported health of the Appalachian elderly. Public
Health Nursing. 6(4). 204-211.
Semcac (2000). Semcac Annual Senior Dining Report. Rushford, MN.
Sharp, N. (1991). Rural healthcare: New opportunities for nurses. Nursing
Management. 22(3), 22-29.
Shaw, J. K. (1997). An assessment of two upstate New York rural counties to
determine unmet health needs of the Medicaid population, Journal of the New York State
Nurses Association 28(1). 12-15.
Reproduced with permission of the copyright owner. Further reproduction prohibited without permission.

127
Shenk, D. (1998). Subjective realities of rural older women’s lives: a case study.
Journal of Women & Aging. 10(4). 7-24.
Shreffler, J. M. (1996). An ecological view of the rural environment: levels of
influence on access to health care. Advances in Nursing Science. 18(4). 48-59.
Speake, D. L., Cowart, M. E., & Pellet, K. (1989). Health perceptions and
lifestyles of the elderly. Research in Nursing & Health. 12.93-100.
Stuifbergen. A. K., & Roberts, G. J. (1997). Health promotion practices of
women with multiple sclerosis. Archives of Physical Medicine and Rehabilitation.
78(12, suppl. 5), S3-S9.
U.S. Census 2000. Retrieved from the web on August 17th, 2001 @
www.census.gov/population/socdem/age/ppl-l47/tab07.txt
U.S. Department of Health and Human Services [USDHHS] (2000). Healthy
people 2010: National health promotion and disease prevention objectives. Washington,
DC: U.S. Government Printing Office, 2000. Retrieved February 17, 2000 from the
World Wide Web: www.hhs.gov.press/2000/200000125a.html.
U.S. Census Bureau, 1995. Urban and rural definitions. Retrieved on February
22, 2000 from the World Wide Web: http://www.census.gov.
U.S. Census Bureau, 1995. Sixty-five plus in the United States. Retrieved on
May 20,1997 from the World Wide Web: http://www.census.gov/socdemo/www/
agebrief.html.
Waldo, D., Sonnefeld, S., McKusick, D., & Amett, R. (1989). Health
expenditures by age group. Health Care Financing Review. 1 0 .111-120.
Reproduced with permission of the copyright owner. Further reproduction prohibited without permission.

128
Walker, S. N., & Hill-Polerecky, D. (1996). Psychometric evaluation of the
health-promoting lifestyle profile II [abstract]. Proceedings of the 1996 Scientific
Session of the American Nurses Association’s Council of Nurse Researchers. 1996 June
13-14*; Washington, DC. Washington, DC: American Nurses Association; 1996, p.
110.
Walker, S. N„ Sechrist, K., & Pender, N. J. (1987). The health-promoting
lifestyle profile: Development and psychometric characteristics. Nursing Research.
36(2), 76-81.
Walker, S. N., Volkan, K, Sechrist, K. R., & Pender, N. J. (1988). Health-
promoting life styles of older adults: Comparisons with young and middle-aged adults,
correlates and patterns. Advances in Nursing Science. 1 If 1). 76-90.
Wallston, B. S., Wallston, K. A., & DeVellis, R. (1978). Development of the
multidimensional health locus of control (MHCL) scales. Health Education Monograph,
6,160-170.
Wallston, B. S., Wallston, K. A., Kaplan, G., & Maides, S. (1976). Development
and validation of the health locus on control scale. Journal of Consult Clinical
Psychology. 4 4 .580-585.
Walters, S. J., Munro, J. F. & Brazier, J. E. (2001). Using the SF-36 with older
adults: a cross-sectional community-based survey. Age and Aging. 30(4). 337-343.
Ware, J. E. (1996). Differences in 4-year health outcomes for elderly and poor,
chronically ill patients treated in HMO and fee-for service systems: Results from the
Medical Outcomes Study. JAMA. 276(13), 1039-1048.
Reproduced with permission of the copyright owner. Further reproduction prohibited without permission.

129
Ware, J. E. (2000). The SF-36 health survey. Retrieved June 21, 2000 from the
World Wide Web: http://www.sf-36.eom/generaiysf36.html#scaling.
Ware, J. E., Kosinski, M., Dewey, J. E., Gandek, B. (2001). How to score and
interpret single-item health status measures: A manual for users of the SF-8 health
survey. Lincoln, RI: QualityMetric Incorporated.
Ware, J. E., & Sherboume, C. D. (1992). The MOS 36-item short-form health
survey (SF-36). Medical Care. 30(6). 473-481.
Ware, J. E., Snow, K. K., & Kosinski, M. (2000). SF-36 Health Survey: Manual
and Interpretation Guide. Lincoln, RI: QualityMetric Incorporated.
Watt, D., Verma, S., & Flynn, L. (1998). Wellness programs: A review of the
evidence. Canadian Medical Association. 158.224-230.
Weinberger, M.. Samsa, G. P., Hanlon, J. T., Schmader, K., Doyle, M. E.,
Cowper, P. A., Uttech, K. M., Cohen, H. J., & Feussner, J. R. (1991). An evaluation of a
brief health status measure in elderly veterans. Journal of the American Geriatric
Society. 39(7). 691-694.
Weinert, C. & Burman, M. E. (1994). Rural health and health seeking behaviors.
Annual Review of Nursing Research. 12.65-92.
Welch, D. C., & West, R. L. (1999). The short portable mental status
questionnaire: Assessing cognitive ability in nursing home residents. Nursing Research,
48(6), 329-332.
Wilson-Ford, V. (1992). Health-protective behaviors of rural black elderly
women. Health and Social Work. 17(1), 28-36.
Reproduced with permission of the copyright owner. Further reproduction prohibited without permission.

130
World Health Organization, 1998. Health Promotion Glossary. Geneva: World
Health Organization.
Reproduced with permission of the copyright owner. Further reproduction prohibited without permission.

131
Appendix A
Short Portable Mental Status Questionnaire (SPMSQ)
1. What is the date today?_______________________________________Month Day Year
2. What day of the week is it?____________________________________
3. What is the name of this place?_________________________________
4. What is your telephone number?________________________________
4a. What is your street address?___________________________________
5. How old are you?____________________________________________
6. When were you bom ?________________________________________
7. Who is the President of the U.S. now?___________________________
8. Who was President just before him?_____________________________
9. What was your mother’s maiden name?__________________________
10. Subtract 3 from 20 and keep subtracting 3 from each new number,
all the way down. ______________________________________________
+ -
Reproduced with permission of the copyright owner. Further reproduction prohibited without permission.

132
Appendix B
HEALTH PROMOTING LIFESTYLE PROFILE II
DIRECTIONS: This questionnaire contains statements about your present way of life or personal habits. Please respond to each item as accurately as possible, and try not to skip any item. Indicate the frequency with which you engage in each behavior by circling:
N for never, S for sometimes, O for often, or R for routinely
1. Discuss my problems and concerns with N S O Rpeople close to me.
2. Choose a diet low in fat, saturated fat, and N S O Rcholesterol.
3. Report any unusual signs or symptoms to a N S O Rphysician or other health professional
4. Follow a planned exercise program. N S O R
5. Get enough sleep. N S O R
6. Feel I am growing and changing in positive N S O R ways.
7. Praise other people easily for their N S O Rachievements.
8. Limit use of sugars and food containing N S O Rsugar (sweets).© S.N. Walker, K. Sechrist, N. Pender, 1995.Reprinted with permission.
Reproduced with permission of the copyright owner. Further reproduction prohibited without permission.

133
HEALTH PROMOTING LIFESTYLE PROFILE U (cont.)
N for never, S for sometimes, O for often, or R for routinely
9. Read or watch TV programs about N S O Rimproving health.
10. Exercise vigorously for 20 or more minutes N S O Rat least three times a week (such as briskwalking, bicycling, aerobic dancing, using a star climber).
11. Take some time for relaxation each day. N S 0 R
12. Believe that my life has purpose N S 0 R
13. Maintain meaningful and fulfilling relationships with others.
N s 0 R
14. Eat 6-11 servings of bread, cereal, rice and pasta each day.
N s 0 R
15. Question health professionals in order to understand their instructions.
N s 0 R
16. Take part in light to moderate physical activity (such as sustained walking 30-40 minutes 5 or more times a week).
N s 0 R
17. Accept those things in my life that I can not change.
N s 0 R
18. Look forward to the future. N s o R
19. Spend time with close friends. N s o R
Reproduced with permission of the copyright owner. Further reproduction prohibited without permission.

134
HEALTH PROMOTING LIFESTYLE PROFILE II (cont.)
N for never, S for sometimes, O for often, or R for routinely
20. Eat 2-4 servings of fruit each day. N S 0 R
21. Get a second opinion when I question my health care provider's advice.
N S 0 R
22. Take part in leisure-time (recreational) physical activity (such as swimming, dancing, bicycling).
N s 0 R
23. Concentrate on pleasant thoughts at bedtime.
N s 0 R
24. Feel content and at peace with myself. N s 0 R
25. Find it easy to show concern, love and warmth to others.
N s 0 R
26. Eat 3-5 servings of vegetables each day. N s 0 R
27. Discuss my health concerns with health professionals.
N s 0 R
28. Do stretching exercises at least 3 times per week.
N s 0 R
29. Use specific methods to control stress. N s o R
30. Work toward long-term goals in my life. N s 0 R
31. Touch and am touched by people I care N s 0 Rabout.
Reproduced with permission of the copyright owner. Further reproduction prohibited without permission.

135
HEALTH PROMOTING LIFESTYLE PROFILE II (cont.)
N for never, S for sometimes, O for often, or R for routinely
32. Eat 2-3 servings of milk, yogurt, or cheese N S O Reach day.
33. Inspect my body at least monthly for N S O Rphysical changes/danger signs.
34. Get exercise during usual daily activities N S O R(such as walking during lunch, using stairsinstead of elevators, parking car away from destination and walking).
35. Balance time between work and play. N S 0 R
36. Find each day interesting and challenging. N S 0 R
37. Find ways to meet my needs for intimacy. N s 0 R
38. Eat only 2-3 servings from the meat, poultry, fish, dried beans, eggs and nuts group each day.
N s 0 R
39. Ask for information from health professionals about how to take good care of myself.
N s 0 R
40. Check my pulse rate when exercising. N s 0 R
41. Practice relaxation or meditation for 15-20 minutes daily.
N s 0 R
42. Am aware of what is important to me in life.
N s 0 R
43. Get support from network of caring people. N s 0 R
Reproduced with permission of the copyright owner. Further reproduction prohibited without permission.

HEALTH PROMOTING LIFESTYLE PROFILE II (cont.)
N for never, S for sometimes, O for often, or R for routinely
Read labels to identify N S O R44. nutrients, fats and sodium
content in packaged food.
Attend educational programs N S O R45. on personal health care.
Reach my target heart rate N S O R46. when exercising.
Pace myself to prevent N S O R47. tiredness.
Feel connected with some N S O R48. force greater than myself.
Settle conflicts with others N S O R49. through discussion and
compromise.
Eat Breakfast. N S O R50.
Seek guidance or counseling N S O R51. when necessary.
Expose myself to new N S O R52. experiences and challenges.
© S.N. Walker, K. Sechrist, N. Pender, 1995. Reprinted with permission from Susan
Noble Walker, College of Nursing, University of Nebraska Medical Center, Omaha, NE
68198-5330.
Reproduced with permission of the copyright owner. Further reproduction prohibited without permission.

137
Appendix C
SF-36 Health Survey
DIRECTIONS: This survey contains questions regarding your health status. Fill in the circle under the response that most accurately answers the question for you.1. In general, would you say your health is:
Excellent Very Good Good Fair Pooro o o o o
2. Compared to one year ago, how would you rate your health in general: Much Somewhat About the Somewhat Much
better now better now same worse now worse nowo o o o o
3. The following questions are about activities you might do during a typical day. Does your health now limit you in these activities? If so, how much?
Vigorous activities, such as running, lifting heavy objects, participating in strenuous sports
Moderate activities, such as moving a table, pushing a vacuum cleaner, bowling, or playing golf
Lifting or carrying groceries
Climbing several flights of stairs
Climbing one flight of stairs
(Ware, 2000 - Permission to reprint received from author)
Yes, Yes, No, notLimited Limited LimitedA lot a little At all
O O O
0 o o
0 o oo o 00 0 0
Reproduced with permission of the copyright owner. Further reproduction prohibited without permission.

138
Bending, kneeling, or stooping
Walking more than a mile
Walking several blocks
Walking one block
Bathing or dressing yourself
Yes, Yes, No, not Limited Limited Limited A lot A little At all0 0 00 o 00 o o0 o 00 o 0
4. During the past 4 weeks, have you had any of the following problems with your work or other regular daily activities as a result of your physical health?
Cut down on the amount of time youYES NO
spent on work or other activities O 0
Accomplished less than you would like 0 0
Were limited in the kind of work or other activities
O 0
Had difficulty performing the work orother activities (for example, it took 0 0extra effort)
Reproduced with permission of the copyright owner. Further reproduction prohibited without permission.

139
5. During the past 4 weeks, have you had any of the following problems with your work or other regular daily activities as a result of any emotional problems (such as feeling depressed or anxious)?
YES NOCut down on the amount of time you spent on work or other activities 0 0
Accomplished less than you would like 0 0
Didn’t do work or other activities ascarefully as usual O 0
6. During the past 4 weeks, to what extent has your physical health or emotional problems interfered with you normal social activities with family, friends, neighbors, or groups?Not at all Slightly Moderately Quite a bit Extremely0 0 0 o o
7. How much bodily pain have you had during the past 4 weeks?None Very Mild Mild Moderate Severe Very Severe O 0 0 0 0 0
8. During the past 4 weeks, how much did pain interfere with your normal work (including both work outside the home and housework)?Not at all Slightly Moderately Quite a bit Extremely
o o o o o
Reproduced with permission of the copyright owner. Further reproduction prohibited without permission.

140
9. These questions are about how you feel and how things have been with you during the past 4 weeks. For each question, please give the one answer that come closest to the way you have been feeling.
How much of the time during the past 4 weeksAll Most A good Some A little None
Of the Of the Bit of Of the Of the Of the
Did you feel
Time Time theTime
Time Time Time
full of pep?
Have you been a very
0 0 0 0 0 0
nervousperson?
Have you felt so down in the dumps that
0 o 0 0 0 O
nothing could cheer you up?
o 0 0 0 0 o
Did you have a lot of energy?
o 0 0 0 0 0
Have you feltdownhearted and blue?
0 0 0 0 0 0
Did you feelworn out? 0 0 0 0 0 0Have youbeen a happy person?
0 o o 0 0 0
Did you feel tired?
0 o o 0 o 0
Reproduced with permission of the copyright owner. Further reproduction prohibited without permission.

10. During the past 4 weeks, how much of the time has your physical health or emotional problems interfered with your social activities (like visiting friends, relatives, etc.)?
All Most A little NoneOf the Of the Of the Of theTime Time Time Time
0 0 0 0
11. How TRUE or FALSE is each of the following statements for you ?
Mostly Definitelyfalse false
O O
o o
o o
Used with permission.
Definitely Mostly Don't I seem to get true true knowsick a little easier thanother people O O O
I am as healthy as anybody Iknow 0 0 0
My health isexcellent 0 0 0
Reproduced with permission of the copyright owner. Further reproduction prohibited without permission.

142
Appendix D
Demographic Information (version I)
Please fill in the information in the appropriate spaces. Answer all that apply.
Sex: Female Male_ _ _ _ _
Marital Status: Single_ _ _ _ _ _Married_____Widowed_ _ _ _ _Divorced_ _ _ _ _
Ethnic origin: Caucasian_ _ _ _ _African American. Asian A m erican_ Native Am erican. Other_ _ _ _ _ _ _ _
Highest level o f education achieved-8th Grade or less_ _ _ _Some High S ch o o l_ _ _High School Graduate__Some college__College Degree__Post Graduate__Higher Degree_ _ _
Reproduced with permission of the copyright owner. Further reproduction prohibited without permission.

143
Appendix E
Subject Information Sheet (pilot study)
CD RUSHYou are invited to participate in a research study about your health
status and health promoting behaviors. Approximately 400 people will participate in this study. If you agree to participate, please sign below and complete the attached questionnaire now. It should take approximately 20- 25 minutes.
There are minimal known risks or costs to you, other than your time. In addition, participation in this study will have no direct benefits to you. Benefits for well older adults in the future may be an increased knowledge about the benefits of health promoting behaviors, however, this is not guaranteed.
Your responses will be kept confidential. All data will be reported as group data and no individual will be identified. You will be identified by a code, and this identification code will be kept locked in the researcher’s file. Your participation is voluntary and you may withdraw at any time. Your decision whether or not to participate will not affect your involvement at this Dining Center. Your participation in this study may be ended at any time by the investigator without your consent.
If you are willing to help, please complete and return the questionnaire packet and signed consent form to the researcher. This consent form does not waive subject right. You will be given a copy of the signed and dated consent. If you have any questions regarding this research, please ask the researcher in person or call Shirley Newberry at
In addition, you may contact The Office of Research Affairs at Thank you very much for your participation.
(Signature of Participant)
(Signature of Investigator) Researcher: Advisor:Shirley Newberry
Dr. Kathleen Shanks Rush University Chicago, IL 60612
(Date)
(Date)Office of Research
AffairsRush University Chicago, IL 60612
Reproduced with permission of the copyright owner. Further reproduction prohibited without permission.

144
Appendix F
Demographic Information (version 2)
Please fill in the information in the appropriate spaces. Answer all that apply.
Age:_ _ _ _ _
Sex: Female Male_____
Marital Status: Single_ _ _ _ _ _Married_____W idowed_ _ _ _ _Divorced_ _ _ _ _
Ethnic origin: Caucasian_ _ _ _ _African American_ _ _ _ _Asian American_____Native American (American Indian)_____Other_ _ _ _ _ _ _ _ _ _ _ _ _ _
Highest level o f education achieved-8th Grade or less_ _ _ _Some High S ch o o l_ _ _High School Graduate__Some college__College Degree__Post Graduate__Higher Degree__ _
Reproduced with permission of the copyright owner. Further reproduction prohibited without permission.

145
Appendix G
The SF-8™ Health Surveym a i c S e y o u r o e s n e s p o n s e o y c i r c l m g ^ ^ ^ ^ ^ ^ ^ ^ ^ ^ ^
1. Overall, how would you rate your health during the p as t 4 w eeks?:
Excellent Very Good Fair Poor Very good Poor
2. During the o a s t 4 w eeks, how much did physical health problems limit your usual physical activities (such as walking or climbing stairs)?
Could not do Very physical
Not a t all little Som ew hat Quite alo t activities
3. During the p as t 4 w eeks, how much difficulty did you have doing your daily work, both at home and away from home, because of your physical health?
Could not do daily
None a t all A little bit Som e Quite a lot work
4. How much bodily pain have you had during the o a s t 4 w eek s?:
None Very mild Mild M oderate S evere VerySevere
W are, 2001 (Perm ission to reprint received from Quality Metric)
Reproduced with permission of the copyright owner. Further reproduction prohibited without permission.

1465. During the p as t 4 w eeks, how much energy did you have?
Very m uch Quite a lot Som e A little None
6. During the p as t 4 w eeks, how much did your physical health or emotional problems limit your usual social activities with family or friends?
Not a t all little Som ew hat Quite a lot activities
7. During the o as t 4 w eeks, how much have you been bothered by em otional problem s (such as feeling anxious, depressed or irritable)?
Not a t all Slightly M oderately Quite a lot Extremely
8. During the o as t 4 w eeks, how much did personal or emotional problems keep you from doing your usual work, school or other daily activities?
Not a t all little Som ew hat Quite a lot activities
Used with permission.
VeryCould not do social
VeryCould not do social
Reproduced with permission of the copyright owner. Further reproduction prohibited without permission.

147
Appendix H
Permission from Semcac
204 South Elm Street, PO Box 549
People Are Our BusinessRushford, Minnesota 55971-0549
Phone 507 864-7741 FAX 507 864-2440
July 14,2000
Shirley Newberry
Dear Shirley,
This letter is to confirm our discussion regarding a behavior research study that you would like to conduct among the seniors who participate in the Semcac Senior Nutrition Program. You have my authorization to carryout the study within our program, and specifically at any of our Congregate Dining sites.
I believe the results from such a study could be both helpful and interesting to us as well. We would look forward to working with you, and would offer you office space at the Rushford office if you would be interested.
I am enclosing information regarding the Program. Please let me know when you anticipate starting the study, so that I may notify the staff at the dining sites.
Sincerely,
Debbie Betthauser, R.D., L.D. Senior Nutrition Director
A Community Action Agency Serving Southeast MinnesotaDodge County Fillmore County Houston County Mower County Steele County Winona County
374-6401 765-2761 724-3677 433-5889 451-7134 452-8396
Reproduced with permission of the copyright owner. Further reproduction prohibited without permission.

An Equal Opportunity Employer
Appendix I
148
Subject Information Sheet (research study)
(DRUSHSubject Information Sheet
You are invited to participate in a research study about your health status and health promoting behaviors. The purpose of the study is to look at how healthy you think you are and what you do to stay healthy. Approximately 600 people will participate in this study. If you agree to participate, please sign below and complete the attached questionnaire now. It should take approximately 15-20 minutes.
There are minimal known risks or costs to you, other than your time. In addition, participation in this study will have no direct benefits to you. Benefits for well older adults in the future may be an increased knowledge about the benefits of health promoting behaviors, however, this is not guaranteed.
Your responses will be kept confidential. All data will be reported as group data and no individual will be identified. Your participation is voluntary and you may withdraw at any time. Your decision whether or not to participate will not affect your involvement at this Dining Center. Your participation in this study may be ended at any time by the investigator without your consent.
If you are willing to help, please complete and return the questionnaire packet and signed consent form to the researcher. This consent form does not waive subject right. You will be given a copy of the signed and dated consent. If you have any questions regarding this research, please ask the researcher in person or call Shirley Newberry at
. In addition, you may contact The Office of Research Affairs at . Thank you very much for your participation.
(Signature of Participant) (Date)
(Signature of Investigator)Researcher:Shirley Newberry
Advisor.Dr. Julia Muennich Cowell Rush University Chicago, IL 60612
(Date)Office of Research AffairsRush University Chicago, IL6061
Reproduced with permission of the copyright owner. Further reproduction prohibited without permission.

Appendix J
Permission from Rush University
149
M*SH*PRESBYTERIAN-ST. LUKE'S MEDICAL CENTER 1653 WEST CONGRESS PARKWAY. CHICAGO. ILLINOIS 60612-JtJ;
RUSHI^IVinLSITY
®RUSHOFFICE OFM SE.UICH AfFAIXS312M154793I234Z54W312M2JS7-KFaz)
ASSURANCE/CERTIFICATION OF PROTECTION OF HUMAN SUBJECTS IN RESEARCH
The following amendment has been reviewed and approved by the institutional Review Board at Rush-Presbyterian-St.-Luke’s Medical Center in accordance with the Common Rule (56FR28003. June 18.1991) and any other governing regulations or subparts.
ORA Number: 01011901Principal Investigator: Shirley M. NewberryProject Title: The Health Promoting Behaviors o f the Rural Well Older Adult Amendment No.: Consent Change
DHHS Assurance ID No: M138SDate of Approval: 01/29/2001Dale due for Continuing Review: 01/29/2002Date Amendment Approved: 05/30/2001Release Date: 05/31/2001
Q Full Review or Q3 Expedited Review
FDA Information:IND Number IDE Number:(ND or Biologic Product Name:‘'■ponson
Grant/Contract ID Number
Rush-Presbytenan-St. Luke's Medical Center Authorizing Official
Reproduced with permission of the copyright owner. Further reproduction prohibited without permission.

150
Appendix K
Cross tabulations
G enderHIJLPII - Health Responsibility - Low
Gender Not low Low TotalFemale 217 83 300Male 102 38 140Total 319 120 440
Chi-square df p-value.013 I .909
HI>LP II - Physical Activity - LowGender Not low Low TotalFemale 227 73 300Male 106 34 140Total 333 107 440
Chi-Square df p-value.000 1 .991
HIlLP H- Nutrition - LowGender Not low Low TotalFemale 233 67 300Male 97 43 140Total 330 110 440
Chi-Square df p-value3.576 1 .059
HPL 5 H - Spiritual Growth - LowGender Not low Low TotalFemale 216 84 300Male 103 37 140Total 319 121 440
Chi-Square df p-value.118 I .731
Reproduced with permission of the copyright owner. Further reproduction prohibited without permission.

151
HI’LPII - Interpersonal Relationships -LowGender Not low Low TotalFemale 228 72 300Male 101 39 140Total 329 111 440
Chi-Square df p-value.753 1 .386
HIPLPII - Stress Management - LowGender Not low Low TotalFemale 224 76 300Male 109 31 140Total 333 107 440
Chi-Square df p-value.528 I .467
HI*LP II - Summary Scale - LowGender Not low Low TotalFemale 230 70 300Male 102 38 140Total 332 108 440
Chi-Square df p-value.748 1 .387
SF-8 - General Health - LowGender Not low Low TotalFemale 201 99 300Male 96 44 140Total 297 143 440
Chi-Square df p-value.107 I .743
SF-8 - Physical functioning - LowGender Not low Low TotalFemale 243 57 300Male 109 31 140Total 352 88 440
Chi-Square df p-value.589 I .443
Reproduced with permission of the copyright owner. Further reproduction prohibited without permission.

152
SF-8 -Role Physical - LowGender Not low Low TotalFemale 253 47 300Male 121 19 140Total 374 66 440
Chi-Square df p-value.329 I .566
SF-8 - Bodily Pain - LowGender Not low Low TotalFemale 183 117 300Male 88 52 140Total 271 189 440
Chi-Square df p-value.139 I .709
SF-8 - Vitality - LowGender Not low Low TotalFemale 262 38 300Male 123 17 140Total 385 55 440
Chi-Square df p-value.024 I .877
SF-8- Social Functioning - LowGender Not low Low TotalFemale 191 109 300Male 96 44 140Total 287 153 440
Chi-Square df p-value1.012 I .314
SF-8 - Mental Health - LowG ender Not low 1.000 TotalFemale 236 64 300Male 108 32 140Total 344 96 440
Chi-Square df p-value.130 1 .718
Reproduced with permission of the copyright owner. Further reproduction prohibited without permission.

153
SF-8 - Role Emotional - LowGender Not low 1.000 TotalFemale 219 81 300Male n o 30 140Total 329 111 440
Chi-Square df p-value1.57 I .210
SF-8 - Physical Summary - LowGender Not low 1.000 TotalFemale 223 77 300Male 107 33 140Total 330 110 440
Chi-Square df p-value.22 1 .636
SF-8 - Mental Summary - LowGender Not low Low TotalFemale 225 75 300Male 105 35 140Total 330 110 440
Chi-Square df p-value.000 1 1.000
Marital S ta tu s
HPLP H - Health Responsibility - LowMarital Status Not low Low TotalDivorced 10 6 16Married 112 38 150Single 20 12 32Widowed 177 65 242Total 319 121 440
Chi-Square df p-value2.811 3 .422
Reproduced with permission of the copyright owner. Further reproduction prohibited without permission.

154
HPLP It - Physical Activity - LowMarital Status Not low Low TotalDivorced 11 5 16Married 112 38 150Single 26 6 32Widowed 184 58 242Total 333 107 440
Chi-Square df p-value1.057 3 .787
HPLP H - Nutrition - LowMarital Status Not low Low TotalDivorced 9 7 16Married 119 31 150Single 25 7 32Widowed 177 65 242Total 330 110 440
Chi-Square df p-value5.115 3 .164
HPLP Q - Spiritual Growth - LowMarital Status Not low Low TotalDivorced 13 3 16Married 109 41 150Single 24 8 32Widowed 173 69 242Total 319 121 440
Chi-Square df p-value.841 3 .840
HPLP H - Interpersonal Relationships - LowMarital Status Not low Low TotalDivorced 14 2 16Married 115 35 150Single 23 9 32Widowed 177 65 242Total 329 111 440
Chi-Square df p-value2.143 3 .543
Reproduced with permission of the copyright owner. Further reproduction prohibited without permission.

155
HPLP II - Stress Management - LowMarital Status Not low Low TotalDivorced 11 5 16Married 114 36 150Single 25 7 32Widowed 183 59 242Total 333 107 440
Chi-Square df p-value.530 3 .912
HPLP II - Summary - LowMarital Status Not low Low TotalDivorced 10 6 16Married 116 34 150Single 23 9 32Widowed 183 59 242Total 332 108 440
Chi-Square df p-value1.961 3 .581
SF-8 - General f ealth - LowMarital Status Not low Low TotalDivorced 11 5 16Married 94 56 150Single 27 5 32Widowed 165 77 242Total 297 143 440
Chi-Square df p-value5.814 3 .121
SF-8 - Physical Functioning - LowMarital Status Not low Low TotalDivorced 13 3 16Married 123 27 150Single 25 7 32Widowed 191 51 242Total 352 88 440
Chi-Square df p-value.636 3 .888
Reproduced with permission of the copyright owner. Further reproduction prohibited without permission.

156
SF-8 - Role Physical - LowMarital Status Not low Low TotalDivorced 13 3 16Married 126 24 150Single 29 3 32Widowed 206 36 242Total 374 66 440
Chi-Square df p-value1.091 3 .779
SF-8 - Bodily Pain - LowMarital Status Not low Low TotalDivorced 12 4 16Married 85 65 150Single 23 9 32Widowed 151 91 242Total 271 169 440
Chi-Square df p-value4.251 3 .236
SF-8 - Vitality - LowMarital Status Not low Low TotalDivorced 13 3 16Married 130 20 150Single 28 4 32Widowed 214 28 242Total 385 55 440
Chi-Square df p-value.858 3 .836
SF-8 - Social Functioning - LowMarital Status Not low Low TotalDivorced 12 4 16Married 90 60 150Single 25 7 32Widowed 160 82 242Total 287 153 440
Chi-Square df p-value4.912 3 .178
Reproduced with permission of the copyright owner. Further reproduction prohibited without permission.

157
SF-8 - Mental Health - LowMarital Status Not low Low TotalDivorced 12 4 16Married 110 40 150Single 26 6 32Widowed 196 46 242Total 344 96 440
Chi-Square df p-value3.459 3 .326
SF-8 - Role Emotional - LowMarital Status Not low Low TotalDivorced 12 4 16Married 112 38 150Single 25 7 32Widowed 180 62 242Total 329 111 440
Chi-Square df p-value.212 3 .976
SF-8 - Physical Summary - LowMarital Status Not low Low TotalDivorced 12 4 16Married 112 38 150Single 24 8 32Widowed 182 60 242Total 330 110 440
Chi-Square df p-value.014 3 1.000
SF-8 - Mental Summary - LowMarital Status Not low Low TotalDivorced 12 4 16Married 107 43 150Single 27 5 32Widowed 184 58 242Total 330 110 440
Chi-Square df p-value2.713 3 .438
Reproduced with permission of the copyright owner. Further reproduction prohibited without permission.

158
Ethnic
HPLP II - Health Responsibility - LowEthnic Not low Low TotalCaucasian 305 114 419Other 14 7 21Total 319 121 440
Chi-Square df p-value.376 1 .540
HPLP H - Physical Activity - LowEthnic Not low Low TotalCaucasian 316 103 419Other 17 4 21Total 333 107 440
Chi-Square df p-value.333 1 .654
HPLP II - Nutrition - LowEthnic Not low Low TotalCaucasian 316 103 419Other 14 7 21Total 330 110 440
Chi-Square df p-value.817 I .366
HPLP II - Spiritual Growth - LowEthnic Not low Low TotalCaucasian 306 113 419Other 13 8 21Total 319 121 440
Chi-Square df p-value1.242 1 .265
Reproduced with permission of the copyright owner. Further reproduction prohibited without permission.

159
HPLP II - Interpersonal Relationshi ps - LowEthnic Not low Low TotalCaucasian 317 102 419Other 12 9 21Total 329 111 440
Chi-Square df p-value3.634 I .057
HPLP H - Stress Management - LowEthnic Not low Low TotalCaucasian 318 101 419Other 15 6 21Total 333 107 440
Chi-Square df p-value.217 I .642
HPLP II - Summary - LowEthnic Not low Low TotalCaucasian 317 102 419Other 15 6 21Total 332 108 440
Chi-Square df p-value.193 I .660
SF-8 - General I- ealth - LowEthnic Not low Low TotalCaucasian 281 138 419Other 16 5 21Total 297 143 440
Chi-Square df p-value.759 1 .384
SF-8 - Physical Functioning - LowEthnic Not low Low TotalCaucasian 334 85 419Other 18 3 21Total 352 88 440
Chi-Square df p-value.450 I .502
Reproduced with permission of the copyright owner. Further reproduction prohibited without permission.

160
SF-8 - Role Physical - LowEthnic Not low Low TotalCaucasian 355 64 419Other 19 2 21Total 374 66 440Chi-Square TestsValue df p-value.519 1 .471
SF-8 - Bodily Pain - LowEthnic Not low Low TotalCaucasian 260 159 419Other 11 10 21Total 271 169 440Chi-Square TestsValue df p-value.791 I .374
SF-8 - Vitality - JOV/Ethnic Not low Low TotalCaucasian 366 53 419Other 19 2 21Total 385 55 440Chi-Square TestsValue df p-value.179 I .673
SF-8 - Social Functioning - LowEthnic Not low Low TotalCaucasian 273 146 419Other 14 7 21Total 287 153 440
Chi-Square df p-value.020 1 .887
SF-8 - Mental Health - LowEthnic Not low Low TotalCaucasian 327 92 419Other 17 4 21Total 344 96 440
Chi-Square df p-value.099 I .753
Reproduced with permission of the copyright owner. Further reproduction prohibited without permission.

161
SF-8 - Role Emotional - LowEthnic Not low Low TotalCaucasian 313 106 419Other 16 5 21Total 329 111 440
Chi-Square df p-value.023 I .878
SF-8 - Physical Summary - LowEthnic Not low Low TotalCaucasian 314 105 419Other 16 5 21Total 330 110 440
Chi-Square df p-value.017 1 .897
SF-8 - Mental -Summary - LowEthnic Not low Low TotalCaucasian 315 104 419Other 15 6 21Total 330 110 440
Chi-Square df p-value.150 1 .699
Education
HPLP II - Health Responsibility - LowEducation Not low Low TotalNo diploma 113 49 162Diploma only 114 45 159Diploma plus 92 27 119Total 319 121 440
Chi-Square df p-value2.046 2 .360
Reproduced with permission of the copyright owner. Further reproduction prohibited without permission.

162
HPLPII - Physical Activity - LowEducation Not low Low Total
No diploma 114 48 162Diploma only 121 38 159Diploma plus 98 21 119Total 333 107 440
Chi-Square df p-value5.376 2 .068
HPLPII - Nutrition - LowEducation Not low Low TotalNo diploma 111 51 162Diploma only 120 39 159Diploma plus 99 20 119Total 330 110 440
Chi-Square df p-value7.909 2 .019
HPLP H - Spiritual Growth - LowEducation Not low Low TotalNo diploma 105 57 162Diploma only 114 45 159Diploma plus 100 19 119Total 319 121 440
Chi-Square df p-value12.790 2 .002
HPLP II - Interpersonal Relationships - LowEducation Not low Low TotalNo diploma 111 51 162Diploma only 115 44 159Diploma plus 103 16 119Total 329 I I I 440
Chi-Square df p-value12.621 2 .002
Reproduced with permission of the copyright owner. Further reproduction prohibited without permission.

163
HPLP II - Stress Management - LowEducation Not low Low TotalNo diploma 110 52 162Diploma only 123 36 159Diploma plus 100 19 119Total 333 107 440
Chi-Square df p-value10.082 2 .006
HPLP II - Summary - LowEducation Not low Low TotalNo diploma n o 52 162Diploma only 118 41 159Diploma plus 104 15 119Total 332 108 440
Chi-Square df p-value14.283 2 .001
SF-8 - General Hlealth - LowEducation Not low Low TotalNo diploma 105 57 162Diploma only 103 56 159Diploma plus 89 30 119Total 297 143 440
Chi-Square df p-value3.951 2 .139
SF-8 - Physical Functioning - LowEducation Not low Low TotalNo diploma 131 31 162Diploma only 125 34 159Diploma plus 96 23 119Total 352 88 440
Chi-Square df p-value.299 2 .861
Reproduced with permission of the copyright owner. Further reproduction prohibited without permission.

164
SF-8 - Role Physical - LowEducation Not low Low TotalNo diploma 134 28 162Diploma only 134 25 159Diploma plus 106 13 119Total 374 66 440
Chi-Square df p-value2.278 2 .320
SF-8 - BP LowEducation Not low Low TotalNo diploma 100 62 162Diploma only 92 67 159Diploma plus 79 40 119Total 271 169 440
Chi-Square df p-value2.093 2 .351
SF-8 - Vitality - LowEducation Not low Low TotalNo diploma 142 20 162Diploma only 134 25 159Diploma plus 109 10 119Total 385 55 440
Chi-Square df p-value3.340 2 .188
SF-8 - Social Functioning - LowEducation Not low Low TotaiNo diploma 99 63 162Diploma only 108 51 159Diploma plus 80 39 119Total 287 153 440
Chi-Square df p-value1.930 2 .381
Reproduced with permission of the copyright owner. Further reproduction prohibited without permission.

165
SF-8 - Mental Health - LowEducation Not low Low TotalNo diploma 122 40 162Diploma only 12 37 159Diploma plus 100 19 119Total 344 96 440
Chi-Square df p-value3.370 2 .185
SF-8 - Role Emotional - LowEducation Not low Low TotalNo diploma 122 40 162Diploma only 120 39 159Diploma plus 87 32 119Total 329 I I I 440
Chi-Square df p-value.036 2 .982
SF-8 - Physical-Summary - LowEducation Not low Low TotalNo diploma 121 41 162Diploma only 119 40 159Diploma plus 90 29 119Total 330 110 440
Chi-Square df p-value.036 2 .982
SF-8 - Mental-Summary - LowEducation Not low Low TotalNo diploma 117 45 162Diploma only 120 39 159Diploma plus 93 26 119Total 330 n o 440
Chi-Square df p-value1.316 2 .518
Reproduced with permission of the copyright owner. Further reproduction prohibited without permission.

166
Appendix L
Mean Age Comparison for HPLP H and SF-8 Subscales and Summary Scales Crosstabulations
AgeSubscale Mean-low Mean - non-low t-value p-valueHPLP II - Health Responsibility 79.10 78.01 1.459 .145HPLP H - Physical Activity 78.66 78.19 .604 .546HPLP II - Nutrition 78.87 78.12 .976 .330HPLP II - Spiritual Growth 79.10 78.01 1.459 .145HPLP H - Interpersonal Relationships 79.54 77.89 2.149 .032HPLP II - Stress Management 78.08 78.38 -.377 .707HPLP II - Summary scale 79.28 77.99 1.657 .098SF-8 - General Health 79.22 77.87 1.906 .057SF-8 - Physical Functioning 79.51 78.01 1.804 .072SF-8 - Role Physical 80.29 77.96 2.501 .013SF-8 - Bodily Pain 78.60 78.12 .699 .485SF-8 - Vitality 79.44 78.15 1.276 .203SF-8 - Social Functioning 79.09 77.89 1.715 .087SF-8 - Mental Health 78.59 78.23 .452 .651SF-8 - Role Emotional 78.71 78.17 .702 .483SF-8 - Physical-Summary 79.07 78.05 1.322 .187SF-8 - Mental-Summary 78.86 78.12 .966 .338df for all is n1 + n2 - 2 = 438
Reproduced with permission of the copyright owner. Further reproduction prohibited without permission.

COPYRIGHT STATEMENT
I hereby guarantee that no part of the Health Promoting Behaviors of the Rural Well Older Adult, which I have submitted for publication, has been copied from a copyrighted work, except in cases of passages properly quoted from a copyrighted work, copied with permission of the author, or copied from a work in which I own the copyright; that I am the sole author and proprietor of the Health Promoting Behaviors of the Rural Well Older Adult; that the Health Promoting Behaviors of the Rural Well Older Adult Setting contains no matter which, if published, will be libelous or otherwise injurious to, or infringe in any way the copyright of any other party, and that 1 will defend, indemnify and hold harmless Rush-Presbyterian-St. Luke;s Medical Center against all suits and proceedings which may be brought and against all claims which may be made against Rush-Presbyterian-St. Luke’s Medical Center by reason of the publication of The Health Promoting Behaviors of the Rural Well Older Adult.
February 22,2002
Reproduced with permission of the copyright owner. Further reproduction prohibited without permission.