online travel information search behaviors - CiteSeerX
104
ONLINE TRAVEL INFORMATION SEARCH BEHAVIORS: AN INFORMATION FORAGING PERSPECTIVE A Thesis Presented to the Graduate School of Clemson University In Partial Fulfillment of the Requirements for the Degree Master of Science Parks, Recreation and Tourism Management by Evan James Jordan August 2008 Accepted by: Dr. William C. Norman, Committee Chair Dr. Francis K. McGuire Dr. Sheila Backman
-
Upload
khangminh22 -
Category
Documents
-
view
3 -
download
0
Transcript of online travel information search behaviors - CiteSeerX

ONLINE TRAVEL INFORMATION SEARCH BEHAVIORS: AN INFORMATION FORAGING PERSPECTIVE
A Thesis Presented to
the Graduate School of Clemson University
In Partial Fulfillment of the Requirements for the Degree
Master of Science Parks, Recreation and Tourism Management
by Evan James Jordan
August 2008
Accepted by: Dr. William C. Norman, Committee Chair
Dr. Francis K. McGuire Dr. Sheila Backman

1456435
1456435 2008

ii
ABSTRACT
Information search has been a topic of research for a multitude of studies across
several fields, including travel and tourism. However, information search on the internet,
especially in travel and tourism, has rarely been examined. As a result, this research was
undertaken to explore travel information search behaviors on the Internet.
This thesis uses information foraging theory (Pirolli & Card, 1999) as a basis to
examine online travel information search behaviors. In addition, other established
measures of online information search (Hodkinson, Kiel, & McColl-Kennedy, 2000)
were used to supplement findings based upon information foraging theory. Groups of
students from two different countries of origin (Belgium and the United States) were
compared based on the body of literature started by Hofstede (1980) on uncertainty
avoidance. Additionally, Students from the United states were compared when planning
trips over two different travel planning horizons (One week and three months) based on
the body of literature started by Gitelson and Crompton (1983).
Measures of information foraging were measured by frequency of use, and it was
found that such measures applied to online travel information foraging. It was also found
that the majority of additional measures were applicable to online travel information
foraging, with the addition of several measures found to be unique to the travel genre.
Additionally, with the use of independent sample t-tests, this research revealed several
significant differences in search behaviors between Belgians and Americans. Finally,
with the exception of one measurement, this research revealed that participants with
different travel planning horizons were not significantly different

iii
DEDICATION
This thesis is dedicated to everyone who has helped me realize how important
education is: My family (Mom, Dad and Erin); two special professors (Dr. Vogt and Dr.
Norman); my Michigan State group of encouragers (Paige, Pavlina and Ariel); and all my
friends who have stuck with me when this document made me a not so pleasant person.
Without these people I would have never made it.

iv
ACKNOWLEDGMENTS
A special thank you to Dr. Norman and Dr. Vogt who decided I would be
attending graduate school. Thank you to my other committee members Dr. McGuire and
Dr. Backman for being so flexible. In addition, thanks to Dr. Govers and Dr. Vanneste in
Belgium, and Dr. Howard for his usability expertise and software.

v
TABLE OF CONTENTS
Page
TITLE PAGE .................................................................................................................... i ABSTRACT ..................................................................................................................... ii DEDICATION ................................................................................................................ iii ACKNOWLEDGMENTS ............................................................................................... iv LIST OF TABLES ........................................................................................................ viii LIST OF FIGURES ......................................................................................................... ix CHAPTER I. INTRODUCTION .......................................................................................... 1 Introduction .............................................................................................. 1 The Internet .............................................................................................. 1 The Internet and Travel and Tourism ....................................................... 2 Academic Research on Travel and Tourism on the Internet............................................................................... 4 Trends in Research on Travel and Tourism
and the Internet ............................................................. ...............4
Impact of the Internet on the Travel and
Tourism Industry .......................................................................... 5 Information Search .................................................................................... 6 Online Information Search in the Travel and
Tourism Industry .......................................................................... 7 Information Foraging Theory ............................................................ 9 Research Gap................................................................................ ..........10 Statement of Purpose .............................................................................. 11 Research Questions ................................................................................ 11 Contribution of Study ............................................................................. 12 Outline of Thesis .................................................................................... 12 II. LITERATURE REVIEW ............................................................................. 13 Introduction ............................................................................................ 13
vi
Travel Information Search ..................................................................... 13 Travel Information Search Using the Internet........................................ 17 Country of Origin and Travel Information
Search on the Internet ................................................................ 19 Travel Planning Horizon and Travel Information
Search on the Internet ................................................................ 21 Information Foraging Theory ................................................................. 22 Use of Information Foraging Theory in Tourism Literature .................................................................................... 28 Conclusions ............................................................................................ 29 III. METHODS................................................................................................... 31 Introduction ............................................................................................ 31 Study Overview ...................................................................................... 31 Participant Recruitment .......................................................................... 32 Research Procedures .............................................................................. 32 Study Variables ...................................................................................... 33 Independent Variables...................................................................... 33 Dependent Variables ........................................................................ 34 Hypotheses ............................................................................................. 37 Research Question 1 Hypotheses ..................................................... 37 Research Question 2 Hypotheses ..................................................... 38 Research Question 3 Hypotheses ..................................................... 39 Research Question 4 Hypotheses ..................................................... 40 Data Collection Procedures .................................................................... 41 Data Coding Process .............................................................................. 43 Reliability ............................................................................................... 43 Analysis .................................................................................................. 43 Assumptions ........................................................................................... 44 IV. RESULTS..................................................................................................... 45 Introduction ............................................................................................ 43 Overall Participant Profile ...................................................................... 43 Profile of Belgians and Americans......................................................... 46 Profile of Americans with Different Travel Planning Horizons ...................................................................... 47 Sample Distribution................................................................................ 48 Hypothesis Testing ................................................................................. 50 Research Question 1 Hypothesis Tests............................................. 50
Research Question 2 Hypothesis Tests............................................. 52

vii
Travel Search Engine Phenomenon ................................................. 57 Research Question 3 Hypothesis Tests............................................. 60 Research Question 4 Hypothesis Tests............................................. 67
V. CONCLUSIONS AND IMPLICATIONS ................................................... 75 Summary ................................................................................................ 75 Conclusions ............................................................................................ 77 Theoretical Implications ......................................................................... 77 Implications for Industry and Consumers .............................................. 79 Study Limitations ................................................................................... 79 Recommendations for Future Research ................................................. 80 APPENDICES ................................................................................................................ 81 A: Travel Information Searching Questionnaire ............................................... 82 B: Travel Information Searching Activity ........................................................ 84 C: Data Coding Sheet ........................................................................................ 88 REFERENCES ............................................................................................................... 89

viii
LIST OF TABLES
Table Page 3.1 Dependent variable measurements ............................................................... 37 4.1 Overall profile of research participants ........................................................ 46 4.2 Profile of Belgians and Americans............................................................... 47 4.3 Profile of American participants receiving different travel planning horizons ......................................................................... 48 4.4 Measures of skewness and kurtosis .............................................................. 49 4.5 Established measures hypothesis test results ............................................... 56 4.6 Measurements including travel search engines ............................................ 57 4.7 Travel search engine measures of skewness and kurtosis ........................................................................................... 60 4.8 Country of origin hypothesis test results ...................................................... 66 4.9 Travel planning horizon hypothesis test results ........................................... 74

ix
LIST OF FIGURES
Figure Page 2.1 Information foraging function ...................................................................... 26 2.2 Illustration of search engine use ................................................................... 26 2.3 Example of information foraging behavior in an online environment ........................................................................... 27

1
CHAPTER ONE
INTRODUCTION
Introduction
The Internet is a world wide, publicly accessible network of computers used by a
variety of people for a vast range of activities. One of the most popular activities
undertaken by Internet users is searching for travel information (Horrigan, 2008). Popular
media and research indicate that use of the Internet to search for travel information has
already surpassed traditional media sources, and will continue to increase into the
foreseeable future (Patkose, Stokes & Cook, 2004; Tews & Merritt, 2007).
The Internet
Netcraft, a company dedicated to measuring the number of unique websites there
are, estimated that in June 2008 there were just over 172 million unique websites in
existence (Netcraft, 2008.). In 2005, it was found that each unique website contained an
average of 50 web pages (Boutell, 2008). They have estimated that there are more than
8.6 trillion web pages on the Internet today. However, with the recent explosion of user
generated content (Web 2.0) the breadth and depth of the Internet is set to grow
exponentially in coming years (O’Reilly, 2005).
The global nature of the Internet provides an opportunity for citizens of the world
to access the abundant resources available online. In 2008, over 1.4 billion people
throughout the world, just over 21% of the entire world population had Internet access
(Internet World Stats, 2008). This represents an increase of 290% in worldwide Internet

2
usage from 2000 to 2008. The Pew Internet and American Life Survey found in 2007 that
76% of American adults use the Internet. The age range of 18-29 years old had an
Internet use rate of 92% (Horrigan, 2008). Also, Survey respondents with at least some
college education had a use rate of 84% (Horrigan, 2008).
The large number of websites available and widespread use, especially in the
United States, makes the Internet a viable source for a multitude of activities. In 2006
Pew Research found that of the 75% of American adults who use the Internet, 91%
utilized online search engines to find information. In addition, Pew Research found that
81% of Internet users used the Internet to look for information online about a service or
product they were thinking of buying. Pew Research also found that searching for travel
information was among the most popular online activities, with 73% of Internet users
searching for travel information (Horrigan, 2008).
Widespread Internet use in the United States has led many types of organizations
to promote online sales (e-commerce) and even spawned organizations that deal solely in
Internet transactions. The U.S. Department of Commerce recently released a report
indicating that e-commerce was the fastest growing business sector in 2006. The report
states that e-commerce accounted for nearly 3 trillion dollars worth of shipments, sales
and revenue during the 2006 fiscal year (US Census, 2008).
The Internet and Travel and Tourism
The type of websites used by travel searchers cover a broad spectrum such as
online travel agency sites (e.g. Expedia, Travelocity, Orbitz), travel company websites

3
(e.g. airlines, hotels, rental car companies), general search engines (e.g. Google, Yahoo,
Ask), destination specific sites (e.g. Travel2sc), special interest sites (e.g. Wine tasting,
skiing, boating), or even newspaper or magazine sites (Patkose et al, 2004). These sites
represent the major industry presence on the Internet and don’t include more recent
developments such as Web 2.0 type sites like TripAdvisor and RealTravel. Web 2.0 type
sites provide user generated travel advice and stories from their own travel experiences.
Further, there is new breed of meta-travel agency websites such as Kayak that search
travel agency sites, and travel company sites and then routes users directly to those
websites.
Of the nearly 120 million adult users of the Internet in 2004, approximately 98
million users utilized the Internet to find travel information (Patkose et al, 2004). This
figure represents a 233% increase since the 1997 figure of 42 million users utilizing the
Internet for travel information. According to the Travel Industry Association of America
(TIA), people utilizing the Internet for travel purposes are most likely to middle aged,
well educated and had an average household income of $73,000. (Patkose et al, 2004).
While many Internet users are utilizing the Internet to find travel information,
there has been some research suggesting that there is some apprehensiveness when it
comes to the actual purchase of travel products online. The TIA found that 31% of all
travelers are actually booking or making travel reservations online. This figure represents
an increase from 29% of all travelers who booked online in 2003 and an increase from
10% of all travelers who booked online in 1999 (Patkose et al, 2004). Travelers utilizing
the Internet for booking purchased a variety of products and services. In 2004, the top
4
three items booked or purchased online were airline tickets (82% of online travel
bookers), overnight lodging accommodations (67%), and activities (66%) (Patkose et al
2004).
Online travel purchases have recently become a significant source of revenue for
many organizations; according to the US Department of Commerce the travel industry
generated 27% of its total revenue via e-commerce in 2007. The most recent monetary
figures available indicate that in 2003 online travel sales generated 39.4 billion dollars of
revenue (Patkose et al, 2004). All indications point toward an increasing percentage of
revenue in the travel and tourism industry being generated by online bookings and
purchases in the future.
Academic Research on Travel and Tourism on the Internet
Trends in Research on Travel and Tourism on the Internet
The Internet has become an increasingly important element in the travel and tourism
industry and, as such, a quickly growing body of literature has been developed over the
past 10 years. A review of the proceedings from the 2007 ENTER conference (A
conference dedicated to research on information technology in travel and tourism) shows
three important trends in research on travel and tourism on the Internet. First, new
hardware and software packages such as recommender systems (i.e. systems that
recommend future travel options based on past travel purchases) have received much
attention for their potential to revolutionize travel marketing. Second, Web 2.0 (i.e. user
generated content) has become a hot topic because of the recent development of a large

5
number of sites with an incredible volume of information. Third, the topic of information
searching on the Internet has received much attention recently because of its important
role in the travel decision making process and the development of search engines and
other websites dedicated solely to travel searching (Jang, 2004). This thesis research will
focus on the topic of travel information search on the Internet.
Impact of the Internet on the Travel and Tourism Industry
The travel and tourism industry has been impacted by the Internet in many ways,
the most important of which is the destruction of the traditional travel distribution
channel structure (O’Connor, 2008). The Internet has revolutionized the relationships
between suppliers, intermediaries and consumers, essentially creating a flat distribution
channel where consumers have access to suppliers and intermediaries simultaneously.
The travel industry is suited particularly well to rely heavily on the Internet as a
distribution channel as the majority of offerings within travel and tourism are intangible
services rather than durable goods (Buhalis, 1998). These services are almost exclusively
purchased before the customer has begun to travel. Thus, it has become extremely
important that tourists receive timely and accurate information in order to satisfy their
demand for pre-purchase information (Buhalis, 1998). The Internet provides the perfect
opportunity for travel and tourism organizations and marketers to reach travel and
tourism consumers with the information they need to make pre-travel decisions and
purchases.

6
Information Search
A substantial body of literature exists that attempts to understand information
search behaviors exhibited by travelers during various stages of the planning process.
This body of literature covers subjects ranging from information search and experience
(Perdue, 1985; Snepenger, Meged, Snelling, & Worral, 1990), information search and
welcome centers (Gitelson & Crompton, 1983; Gitelson & Perdue, 1987; Howard &
Gitelson, 1989, information searcher typology (Fodness & Murray, 1998), and models of
information search behaviors (Vogt & Fesenmaier, 1998; Fodness & Murray, 1999).
These studies all utilize information search using traditional forms of communication
such as brochures, newspapers, and radio.
Upon further examination of research on information search behaviors several
studies discuss the phenomenon of travel planning horizons. Specifically, a majority of
these studies discussed how travel planning horizon, or how far in the future actual travel
was going to be, had a significant effect on which sources travel planners used and what
type of search behaviors they exhibited. As these studies were focusing on traditional
communication forms, a search for research on travel planning horizons and the Internet
was conducted. Surprisingly, only a small number of studies even mentioning travel
planning horizon in an online context were found (Pan & Fesenmaier, 2006; Kim, Lehto
& Morrison, 2007). These studies have only made peripheral reference to online travel
planning horizons, indicated that they should be studied in the future.

7
Online Information Search in the Travel and Tourism Industry
The body of literature on online travel information search is fairly young, first
starting around 1998 and has since grown into a larger body of literature today. Jang
(2004) produced a summary of research done on online travel information search. In
Jang’s (2004) study, three areas of previous research are highlighted: uncertainty
avoidance (The process by which potential travelers appease the uncertainty of travel by
planning in detail), benefits to travelers and marketers, and concerns and opportunities.
Academic work on uncertainty avoidance was begun by Hofstede’s (1980) study
on cultural dimensions and, more recently, the effect culture has on uncertainty avoidance
(Hofstede, 2001). Since then, there have been several other studies examining the impact
of uncertainty avoidance on online travel information searching (Chen & Gursoy, 2000;
Litvin, Crotts, & Heffner, 2004; Gursoy & Umbreit, 2004; Brengman, Geuens, Weijters,
Smith, & Swinyard 2005). Of particular interest, Brengman et al. determined that the
information search behaviors of Belgians and Americans were acceptable for
comparison. In addition, there have been several studies that indicated uncertainty
avoidance has significant implications for purchases travel searchers eventually make
(Palmer & McCole, 2000; Money & Crotts, 2003; Susskind, Bonn, & Dev, 2003).
Benefits of utilizing the Internet for travel information search are not only limited
to the information searcher, travel industry marketers stands to benefit as well. Benefits
of online travel marketing include 24 hour accessibility, customized information,
relatively low access cost, ease of product comparison, and interactivity. (Hoffman &

8
Novak, 1997; Wang, Head & Arthur, 2002; Luo, Feng & Kai, 2004; Gursoy & McCleary,
2004).
Concerns and opportunities with online travel information search are centered
around the fact that it is a new field. Jang (2004) states that individuals who utilize the
Internet for travel and tourism information search are often young and well educated
which represent a rather small market segment. These young users expect a great deal
from their online information sources, as they have grown up in an age where
information is abundantly available and customized. The opportunities here for online
travel marketers are that these young, well educated users will eventually be well paid
professionals with a large amount of discretionary income to spend. Therefore, Jang
(2004) recommends more research be done, especially on young users from a variety of
backgrounds, in order to prepare the travel and tourism industry for this opportunity to
reach a new market.
Building on Jang’s work in 2004, two recent studies of online travel information
search behaviors take into account his recommendations. Pan and Fesenmaier (2006)
completed a study covering the micro-level process of vacation planning on the Internet.
In examining micro-level vacation planning, the authors deconstructed the online travel
information search process into episodes and chapters reflecting the specific problem
being addressed. This study sought to examine each individual process of online travel
searching, while leaving the broader overall (Macro) search behaviors untouched.
Furthermore, the authors found that information foraging theory (Pirolli & Card, 1999)
was effective in examining the broader behaviors of online information searchers.

9
Further work by Jun, Vogt, and MacKay (2007) found that online travel
information search behaviors differed by what stage of the travel planning process users
were in. Utilizing case-based travel planning theory developed by Stewart and Vogt
(1999), Jun et al. found that the Internet was used more in the pre-trip planning stage than
it was in later stages, particularly when searching for accommodations, activities, and
flights. Recommendations by the authors indicate it would be beneficial to further
research online travel information search behaviors in the pre-trip planning stage.
Information Foraging Theory
Based on the work of Pan and Fesenmaier (2006), this research utilizes
information foraging theory (Pirolli & Card,1999) in order to examine how users search
at the macro level for travel information online. The macro level travel planning involves
examining the travel planning process as a whole, not just individual clickstreams.
Information foraging theory posits that users will modify their environment in order to
maximize their rate of valuable information gained (Pirolli & Card 1999). The task
environment of an information searcher is generally comprised of ‘information patches’
(Pirolli & Card 1999). On the Internet, such patches range from individual websites to
search engine results, or online compilations.
In the simplest form, there are two ways users can maximize their rate of valuable
information gain: environmental enrichment and scent following (Pirolli & Card 1999).
Online, environmental enrichment consists of behaviors that maximize the amount of
valuable information contained in an information patch or minimizes the time it takes a

10
forager to get between patches. An example of this could be refining keywords used in a
search engine so that it returns the best possible results. Scent following on the Internet
involves clicking several links in succession, taking the user from site to site until they
reach the information they were looking for.
Research Gap
It has been determined that information foraging theory is a good fit for examining online
travel information search. Additional measurements of information search, however, are
scattered throughout a variety of fields and generally only work in the context of one
field or another. As a result, the academic literature was searched for a set of measures
commonly used to examine online information search behavior. This review led to the
discovery of measures developed by Hodkinson, Kiel, and McColl-Kennedy (2000) that
can be applied to information foraging to better understand and interpret time
measurement of information foraging. Additionally, several of the studies mentioned in
this chapter discuss a need to examine how online travel information search behaviors
differ between countries. As the body of literature started by Hofstede (1980) found, a
variety of countries have different elements of uncertainty avoidance, which in turn leads
them to search for travel information differently. Information search behaviors have also
been found to differ over travel planning horizons. Both of these fields of work need to
be further examined in the context of online travel information searching.

11
Statement of Purpose
The purpose of this thesis research is to build upon the framework of the online
travel information finding activity examined by Pan and Fesenmaier (2006) by using an
expanded search environment where participants are allowed to browse the Internet
freely while searching for online travel information of their choosing. This includes the
incorporation of information foraging theory, comparison of travel search behaviors
between two countries and examining behaviors over multiple travel planning horizons,
while using established measures previously used to evaluate online search behaviors.
Research Questions
A set of research questions were developed to address the research gaps that were
found in the literature and to fulfill the purpose of this study.
Research Question 1: Is information foraging theory applicable to an online travel and
tourism information search setting?
Research Question 2: Can the measures developed by Hodkinson, Kiel & McColl-
Kennedy measure online travel information search behaviors?
Research Question 3: Do Belgian students search differently for online travel
information than American students?
Research Question 4: Does travel planning horizon make a difference in online
information search behaviors?

12
Contribution of Study
These research questions were designed to contribute to the growing body of
literature on online travel information search as well as provide some insight for travel
organizations and consumers. While information foraging theory has been applied to
micro level travel and tourism information searching studies before, it has not been
proven applicable to a macro level study where participants are given a more realistic
search activity. In addition, the use of established measures will provide insight on how
online travel information searchers go about finding information. As suggested by
previous research, search behaviors of two countries’ citizens will be measured and two
travel planning horizons will be used. This information is of particular importance to the
online travel industry, which caters to multiple countries and travelers with a variety of
planning horizons.
Outline of Thesis
Chapter II will review in detail all of the academic literature on information
search in travel and tourism, online information search in travel and tourism, information
foraging theory, country of origin and uncertainty avoidance, and travel planning
horizons. Chapter III will describe the research methods used in this study, including
variables, measurement, hypotheses, timeline, and coding and analysis methods. Chapter
IV will present descriptive statistics and tests results as well as hypothesis testing for each
research question. Chapter V will include a summary of results, research implications,
conclusions, recommendations for future research and study limitations.

13
CHAPTER TWO
LITERATURE REVIEW
Introduction
Travel and tourism information search has been an important area of study over
the past several decades. This literature review will first cover travel and tourism
information search using traditional sources such as print, radio, and television in order to
understand the history of the topic. Next, research on travel and tourism information
search on the Internet will be presented. Then, a review of the underlying theory used to
examine travel and tourism information search on the Internet, information foraging
theory, will be discussed. Finally, the topics of country of origin and the role of
uncertainty avoidance on information search and information search over differing travel
planning horizons will be reviewed.
Travel and Tourism Information Search
The body of literature on travel and tourism information search began with a
study of planning horizons and information sources used by visitors to highway welcome
centers (Gitelson & Crompton, 1983). Prior to this study, research on information search
had been centered primarily in the consumer behaviors literature (Claxton, Fry & Portis,
1974; Newman, 1977). Gitelson and Crompton (1983) focused on answering two
questions; what type of and how many information sources were travelers using, and how
long before their trip travelers started planning. The authors found that there was a
significant level of association between planning horizon and the number of different

14
sources that were used. Travelers who had a long travel planning horizon (more than
three months) used significantly more information sources than travelers who had a short
travel planning horizon (less than one month). After this publication, several other studies
(Perdue, 1985; Gitelson & Perdue, 1987; Howard & Gitelson, 1989) were conducted
utilizing visitors to highway welcome centers that extended the information search body
of literature
Perdue’s (1985) study of visitors to highway welcome centers indicated that state
created information brochures sent to travelers before their trips were successful in luring
potential visitors. In addition, this study continued the body of literature in finding that
informational brochures not only attracted visitors, but also influenced what type of
attractions they visited. Continuing the trend of highway welcome center visitor studies,
Gitelson and Perdue (1987) found that information obtained by travelers during their trip
likely influenced their travel route decisions, activities, and lodging decisions during that
trip as well as during future trips. Additionally, Howard and Gitelson (1989) validated
previous studies of visitors to highway welcome centers by finding that travelers who
visit welcome centers were not significantly different in any trip characteristics than
travelers who do not visit welcome centers.
The next landmark study in which traditional information sources were used was
that of Fodness and Murray (1997). This study was unique in that it was the first research
to examine the broad range information sources used by travel information searchers.
Three information search strategies were revealed during the data analysis of this study –
Routine information search, limited information search, and extensive information

15
search. Routine information search was carried out quickly and with a limited number of
sources, generally associated with travelers planning a trip to visit friends or relatives
who could give additional travel advice. Limited information search was either time
limited or source limited. Time limited tourists tended to search quickly using a higher
than average number of sources, while source limited tourists tended to use an above-
average travel planning horizon on one or two information rich sources (Fodness &
Murray, 1997).
Vogt and Fesenmaier (1998) continued the trend of examining travelers using
multiple information sources along with the addition of why they used such sources. The
authors found that there were four functional aspects of information search that are
designed to answer specific questions or reduce identified risks associated with purchase.
The first functional role of information search is finding data that serves to gain product
knowledge. While some travelers may already have knowledge from their own
experiences, invariably travelers search out other information sources to assist in decision
making processes. The second functional role of information searching is reduction of
consumer uncertainty. Travelers often associate travel, especially to foreign countries, a
somewhat risky endeavor, and therefore seek information that reduces their perceived
risk of travel. The third functional component of information search is utility. Utility of
information search is determined by how much information the searcher gains relative to
the cost of finding that information. The fourth and final functional role of information
searching is efficiency. Search efficiency is determined by assessing each source of

16
information available and determining which source or group of sources will return the
greatest amount of information in the least amount of time.
It has been established that there are a multitude of travel information sources
available and several functional purposes that the information search process serves. In
an attempt to discover how potential travelers utilize these sources to achieve their search
goals, Fodness and Murray (1998) developed a typology of tourist information search
strategies. The authors discovered seven major search strategies, the majority of which
took place pre-purchase, during their data analysis: (1) Pre-purchase mix – included a
heavy use of a wide variety of contributory sources, (2) Tourist bureau – pre-purchase
users of state travel guides and local tourist offices, (3) Personal experience – Ongoing
evaluation of ones own travel experiences, (4) Ongoing – An ongoing evaluation of
popular media such as newspapers and magazines, (5) On-site – Ongoing evaluation of
sources such as friends and relatives, (6) Automobile club – Pre-purchase use of
automobile club advice such as AAA, (7) Travel agency – Pre-purchase use of travel
agents as a decisive source with limited use of brochures and guidebooks. These seven
search strategies highlight the difference between those who do all of their searching
before they travel, and those who take an ongoing search approach.
After constructing their typology of tourist information search strategies, Fodness
and Murray sought to integrate them into a model of tourist information search behavior
(1999). This study attempted to correlate the search strategies previously mentioned with
other variables such as search contingencies and individual traveler characteristics.
Interestingly, of all survey respondents, over half used only one or two information

17
sources. Also of interest, as length of stay, number of attractions visited, and number of
destinations visited increased, the number of information sources used by travelers
significantly increased. Results of this study are consistent with Vogt & Fesenmaier
(1998) in that information searchers evaluated relative risk and cost of finding proper
information for their travels.
Travel and Tourism Information Search on the Internet
Research on travel and tourism information search behaviors first made the jump
the Internet when Weber and Roehl (1999) profiled people searching for and purchasing
travel products on online. Even as early as 1999 the Internet was deemed important
enough to the travel and tourism industry to merit research projects, even though at that
point a mere 5% of travel information searchers were actually purchasing online. At this
point in time, the distribution of travel products was in a state of change. Weber and
Roehl (1999) make an important conclusion based upon their data: The future of online
travel retailing is bright, and as more people gain experience in an online environment,
they should become more comfortable with purchasing travel products online.
Continuing the trend of examining online travelers’ apprehension toward actually
purchasing on the Internet, Susskind, Bonn and Dev (2003) examined why online travel
searchers were reluctant to actually purchase what the found. The authors discovered
through their research that individuals view online information seeking and online
purchasing differently. While a majority of travel information searchers have little
apprehension about finding travel information online, they are concerned about actually

18
purchasing such information. This research found that a new trend of online
intermediaries which search direct sellers and then guide travel searchers to the sellers
themselves has helped to eliminate such apprehensiveness toward buying online.
Building upon previous research, Gursoy and McCleary (2004) sought to create a
model of tourists’ information search behavior. This research is of great importance in the
online tourist information search literature, as it highlights the online information search
process and costs associated with the search process. Gursoy and McCleary (2004)
highlight the fact that before external search occurs, travelers undertake an internal search
of previous travel and travel planning experiences. Thus, these two elements are useful in
explaining the external search actions of online travel information searchers. External
search, however, does not come without cost. The authors indicate that in the context of
searching for travel information, time is the most important external cost, and is
commonly accepted as affecting the extent of external search. Gursoy and McCleary
(2004) also indicate that given low cost and ease of information retrieve on the Internet,
searchers will expend more external search effort on the Internet rather than traditional
information sources.
In 2007, Jun, Vogt and MacKay attempted to establish a relationship between
travel information search and travel purchase in a pre-trip context. The pre-trip context is
of great importance to this thesis research, as this is the portion of information searching
it seeks to explore. Jun et al. found that the gap between searchers and purchasers had
nearly disappeared. This research shows that online searchers have become online
bookers much more frequently than they had in the past. However, some online

19
information searchers still switched to offline purchase methods after they had found
what they were looking for online. Interestingly, the products that were searched for and
purchased the most on the Internet were accommodations, activities, and flights.
Country of Origin and Travel and Tourism Information Search on the Internet
A major body of literature exists founded upon Geert Hofstede’s (1980) work on
cultural dimensions and, more recently, the effect culture has on uncertainty avoidance
(Hofstede, 2001). Specifically, Hofstede states that societies with high uncertainty
avoidance are not comfortable with situations that are not carefully planned out while low
uncertainty avoidance societies tend to be more comfortable with unstructured travel
situations. Several studies, including Litvin, Crotts and Hefner (2004) have shown that
uncertainty avoidance plays a major role in travelers’ external information search
behaviors. Further, Chen and Gursoy (2000) discovered more differences in search
behaviors across cultures and call for more future research exploring how cultures search
differently.
Litvin, et al. (2004) found that travelers with high uncertainty avoidance (UA)
were much more likely to acquire information from friends, relatives or state and city
travel offices, while those travelers with low UA were more likely to use marketing
dominated sources from major media outlets. Also, travelers with high UA were found to
purchase significantly more pre-packaged travel bundles including tour guides, cruises
and lodging while travelers with low UA were likely to include a rental car in their pre-

20
travel purchases. These findings indicate that travelers with low UA were much more
comfortable finding their own unique information without the help of others.
In addition, a study conducted by Gursoy and Umbreit (2004) further support the
findings of Litvin, et al (2004) by examining external travel information sources used by
citizens of European Union countries. Gursoy and Umbreit utilized statistical information
from EUROBAROMETER 48, a public opinion poll conducted twice per year in all EU
member states. The authors found that most Europeans and specifically Belgians, rarely
made use of the Internet when searching for travel information. Of particular interest, of
the Belgians in this survey, only 0.66% of participants responded that they used the
Internet when searching for travel information. Instead, more traditional information
sources such as travel agents and print media sources such as pamphlets or brochures
were much more commonly used.
Further, a study by Brengman, Geuens, Weijters, Smith, & Swinyard (2005)
validated the cross cultural comparison of Belgians and Americans based on web usage
patterns of Internet shoppers. It was found that similar segments of shoppers in the U.S.
and Belgium used the Internet for shopping purposes. In addition, it was found that
Belgians tended to be more explorative in their searching, actually browsing in a sense,
while Americans tended to be very linear in their searches and valued efficiency
Brengman et al (2005).

21
Travel Planning Horizon and Travel and Tourism Information Searching on the Internet
The body of literature concerning travel planning horizons is lacking in recent
work, especially travel planning horizons and the use of the Internet. While two studies
briefly mention travel planning horizons (Pan & Fesenmaier, 2006; Kim et al, 2007),
neither examine behavior over separate planning horizons. This finding is surprising
considering one of the first information searching pieces of literature in travel and
tourism (Gitelson & Crompton, 1983) found that travel planning horizon had a significant
effect on information search behaviors.
In contrast to the academic literature, popular media often mentions travel
planning horizons when discussing online travel planning. Several articles ranging from
information technology magazines (PC World, 2008) to newspapers (Houston Chronicle,
2005) have given special attention to the phenomenon of last minute deal finding web
sites. Indeed, some popular travel websites such as Hotwire.com have built their business
model around providing last minute services to both businesses and consumers. Hotwire
takes items such as unfilled hotel beds or airplane seats and sells them at the last minute
at discounted prices. Such a model provides a benefit to tourism businesses as often the
tourism product, such as an airplane seat, is a perishable commodity and airlines will take
a loss if their seats aren’t filled. On the other had, travelers may benefit by waiting until
the last minute to book their trips; sometimes seats are unavailable, but to some travelers
that is a risk they are willing to take. Clearly the academic literature is lacking this
important part of the online travel information search process.

22
Information Foraging Theory
Based on a review of previous literature, it became apparent that a traditional
travel information search model would not be suitable to measure online information
search behaviors. As a result, literature of other disciplines was searched in order to find
a theory that, while being consistent with travel information search literature, provided
some additional explanation of the online information search process. The theory found
that best suited this study was information foraging, developed by Pirolli and Card
(1999). Information foraging has been widely used throughout the information
technology and human computer interaction fields, as shown by its index in the ISI Web
of Knowledge, which shows it has been cited 98 times in just nine years. There is just one
study within the travel and tourism field that makes reference to information foraging,
that of Pan and Fesenmaier (1999).
Information foraging theory is a derivative of the optimal foraging theory, first
developed by Stephens and Krebs in 1986. “Optimal foraging theory seeks to explain
adaptations of organism structure and behavior to the environmental problems and
constraints of foraging for food” (Pirolli & Card 1999, p. 643). Information foraging
theory takes food foraging behaviors described above and applies them to the information
seeking process (Pirolli & Card, 1999).
The basic hypothesis of the information foraging theory is that natural
information systems (the relationship between information forager and information
sources), when feasible, will evolve toward stable states that maximize gains of valuable
information per unit cost (Pirolli & Card, 1999). In other words, “This theory assumes
23
that information foragers will modify their strategies, or modify the structure of the
interface, if it is malleable, in order to maximize their rate of valuable information”
(Pirolli & Card, 1999, p. 644). Based on this assumption the authors are trying to
understand the degree to which information foraging behavior is adaptive given the
environmental context in which it occurs (Pirolli & Card, 1999).
For a complete understanding of Information Foraging Theory, one must become
familiar with its natural resource background. Patch models in optimal foraging theory
concern situations in which the environment of some particular animal has a “patchy”
structure. For instance, imagine a bird that forages for berries found in patches on berry
bushes. The forager must expend some amount of between-patches time getting to the
next food patch. Once in a patch, the forager engages in within-patch foraging and faces
the decision of continuing to forage in the patch or leaving to seek a new one. At some
point, the forager must decide when the expected future gains from foraging within a
current patch of food will diminish to the point that they are less than the expected gains
that could be made by leaving the patch and searching for a new one (Pirolli & Card,
1999).
By analogy, the task environment of an information forager often has a “patchy”
structure (Pirolli & Card, 1999). Information patches could be relatively static on-line
collections, such as a single website, or they could be dynamic, such as a search engine.
The information forager has to decide what will be more beneficial: Staying with a patch
of information until it has been exhausted or moving from information patch to

24
information patch, only taking the most beneficial information from each patch (Pirolli &
Card, 1999).
One method an information forager can implement maximized information gained
is called “environmental enrichment:” There are two types of environmental enrichment.
The first is the process of changing the information foraging environment so that the
amount of time it takes to get between patches is minimized (Pirolli & Card, 1999). In
the context of web information search, this process could be upgrading to a faster
computer or upgrading ones Internet connection speed so that multiple websites could be
navigated quickly or even simultaneously.
The second type of environmental enrichment involves creating information
patches that will ultimately contain the most valuable information possible. This type of
environmental enrichment is most effective when it involves refining the information
search within one patch, such as a search engine (Pirolli & Card, 1999). Building on the
search engine example – one could begin with a very broad keyword and, as results are
returned, refine that keyword to maximize the amount of information specific to the
forager’s interest that is returned. The common term used to define this behavior is
called “filtering” and many applications such as email and search engine applications
have filter that can be used without having to do multiple searches (Pirolli & Card, 1999).
The other method maximizing information gained is called “scent following;” a
process similar to the user filtering search engine results. “Scent following is navigating
through spaces (in this case, virtual) to find high-yield patches” (Pirolli & Card, 1999
p647). Scent following is another adaptation of a biological phenomenon in which an
25
animal would go from one patch to another by following the smell of the food. The
concept is similar with information; the forager may start with a search engine, select one
website, find a link to another website on that website, and so on and so forth. Once
again, it is important to remember that the goal of the information forager is to maximize
the information gained while spending the least amount of time and energy possible
(Pirolli & Card, 1999).
When Pirolli and Card (1999) published information foraging, they applied it to
physical settings such as a library or an office workplace. In these types of places it is
easier to differentiate between environmental enrichment and scent following because
environmental enrichment often occurs before the actual search process and involves
physically organizing a space so that less time is used when going between information
patches. For example, putting two stacks of frequently used papers or books next to each
other. Scent following in a physical environment generally occurs after environmental
enrichment, and is usually a continual process such as reading a journal article, then
browsing the references for more useful sources, and then searching those articles’
references, etc. etc.
When discussing an online workspace, however, the line between environmental
enrichment and scent following blurs. As can be seen in Figure 2.1, n a physical
environment, information foraging is calculated using a measure of information gained
(I) over time spent between information patches plus time spent within patches. This
measures the combined success of environmental enrichment (Te) and scent following Ts

26
(Ts). Within this function, it is possible to differentiate between measures of both
behaviors.
I
Te + Ts
Figure 2.1. Information foraging function
However, online users will often change back and forth between environmental
enrichment and scent following behaviors during a single search process. Instead of
environmental enrichment being a simple organization process, it becomes a continual
process of refining, often as users return to a search engine after following a scent path
unsuccessfully.
For the purpose of this study, environmental enrichment is defined as use of a
search engine. Scent following is defined as clicking a link that takes the user from one
unique site to another. As figure 2.2 Illustrates, it is impossible for an online information
forager to use environmental enrichment without then using scent following.
Figure 2.2 – Illustration of search engine use
Enter search
engine URL
Search with any
search term Click link
Environmental Enrichment Scent Following

27
As environmental enrichment and scent following in an online environment
combine, information foraging appears to be a continual evaluation process of the users’
environment while repetitively using both behaviors involved in the information search.
An illustration of typical user behavior has been included below (See Figure 2.3). Such a
constant evaluation process makes it virtually impossible to evaluate environmental
enrichment and scent following separately in an online environment. As a result, scent
following and environmental enrichment are combined, leaving only the total time spent
foraging in the function.
Figure 2.3 Example of information foraging behavior in an online environment
Enter Search Engine URL
Search with general
search term
Click Link
Arrive at travel
web site Click link Decide to
leave
Enter Search Engine URL
Search with refined search term
Arrive at useful travel information

28
Obviously, information search behaviors cannot simply be measured by how long
the information searcher takes to find information. For this reason, a set of measures
previously developed to assess consumer search behavior on the Internet were found to
provide additional information on travelers’ information search behaviors. Measures of
search effort, final site arrival method, breadth and depth, and search engine use
organized by Hodkinson et al. were discovered. These measures, utilized by several
studies involving information foraging theory, including Pan and Fesenmaier (2006),
provide a good base of knowledge to better understand why users took different amounts
of time.
Use of Information Foraging in Travel and Tourism Literature
Pan and Fesenmaier (2006) recently conducted an exploratory study in an effort to
“investigate the micro-level structure of online travel planning in the vacation planning
process and compare the semantic models of tourists with that of information space” (Pan
& Fesenmaier, 2006). This study utilized the use of a short travel planning horizon with
a formal vacation planning exercise to San Diego, California. Four types of data were
collected to capture the online vacation planning process: (1) participants were asked to
write a short paragraph regarding their vacation plan when they were through with the
study, (2) Participants were asked to vocalize their thought process and that qualitative
data was collected through a microphone and digital camcorder, (3) An online camcorder
program (Camtasia, www.techsmith.com) was used to record screen activities as well as
mouse clicks and keyboard activities, (4) Another program (iOpus, www.iopus.com) was

29
used to record websites visited, time stamps, keystrokes, and names of computer
programs used in the information searching process. A pre-exercise survey was also
administered to obtain travel experience, computer and Internet use knowledge, and prior
experience using the Internet as a vacation planning source.
The extent of information foraging use in Pan and Fesenmaiers study was that
they confirmed that participants in their study exhibited behaviors predicted by
information foraging theory. Specifically, it was revealed that users modified their
environment to maximize their rate of information gained. Considering this was the first
study in the travel and tourism field to even mention information foraging theory, it
seems appropriate that the authors’ findings be validated in another study. While Pan and
Fesenmaier only made peripheral reference to information foraging in their research, it
created the backbone for this thesis work.
Conclusions
A large body of literature exists which examines travel information search
behaviors, however information search behaviors in an online environment have been
examined far less than search behaviors using traditional information sources.
Information foraging theory provides a good basis from which online information search
behaviors can be examined. The nature of an online environment however, makes
measurements proposed by information foraging theory difficult. For this reason,
additional measurements were found to help explain information search behaviors.

30
In addition, literature points to significant relationships between country of origin and
information search behaviors and travel planning horizons and information search
behavior. These two concepts have also not yet been examined in an online environment.

31
CHAPTER THREE
METHODS
Introduction
The purpose of this thesis research was to build upon the framework of the online
travel information finding activity examined by Pan and Fesenmaier (2006) by using an
expanded search environment where participants are allowed to browse the Internet
freely while searching for online travel information of their choosing. This includes the
incorporation of information foraging theory, comparison of travel search behaviors
between two countries and examining behaviors over multiple travel planning horizons,
while using established measures previously used to evaluate online search behaviors.
This chapter describes in detail the methods used to collect and analyze data.
First, the study is outlined in detail and participant recruitment is discussed. Second,
variables and measures used in this study are outlined and defined. Third, Hypotheses are
listed based on the four research questions developed for this study. Finally, methods of
data collection and analysis as well as assumptions are described in detail.
Study Overview
In order to address the purpose of this study and research questions, data were
collected in a one-shot study (Babbie, 1992). One-shot studies are useful for gaining
information about behaviors when a long period of time necessary for a longitudinal
study is not feasible (Babbie, 1992). In an effort to allow study participants an open
environment, it was determined that a travel planning exercise similar to that used by Pan

32
and Fesenmaier (2006) was implemented. In order to emulate real life travel planning
situations, participants searched for several elements of an international trip. A usability
testing software package called Morae was determined to be the least intrusive and best
fitting system of measurement for this study. Morae allows for the measurement of time
as recommended by information foraging theory as well as additional measurements
developed by Hodkinson et al. (2000).
Participant Recruitment
Undergraduate students enrolled in upper level geography courses at a Flemish speaking
Belgian University and a University in the Southeastern United States were asked to
participate in this study with the incentive of extra credit given to anyone who
volunteered, Eight out of a possible thirty-two students at the Belgian university
volunteered while eleven out of a possible twenty-two students signed up to participate in
this study. Three Belgian participants and one American participant were removed
because of incomplete data. The resulting data was based on the five Belgian students
and ten American students.
Research Procedures
First, a brief questionnaire was completed by each participant that asked questions
about Internet search proficiency, prior trip planning experience, general Internet use
questions and demographic information (See Appendix A). Internet search proficiency
questions were taken with permission from the Internet searching proficiency test
33
developed by O’Hanlon in 1999. Four questions were used for this research. This data
were collected in order to create a profile of characteristics deemed important for each
group of students.
Second, students were asked to search for several elements (Accommodation, air
transport, and activities) of a trip to Australia using only the Internet. The general
framework of the trip was laid out for them such as locations and dates, while how they
found the rest was left up to the individual (See Appendix B). Australia was chosen as a
destination because of its immense distance from Belgium and the United States, as well
as its diverse range of travel opportunities. Three cities (Darwin, Cairns, and Sydney)
within Australia were chosen for students to plan for. Each city is within an entirely
different geographical region of Australia, and each has a unique blend of
accommodation and activity varieties in ensuring a diversity of choices for study
participants. The travel planning activity required each participant to find air transport to
and from Australia as well as between each city within the country. Participants were also
required to find accommodation for five days in each city and an activity to do each of
the five days they would be staying there.
Study Variables
Independent Variables
Independent variables used in this thesis research were country of origin (Belgium
and the United States) and travel planning horizon (One week and three months). All
Belgian students were asked to find elements of their trips with a travel planning horizon

34
of three months, while students from the U.S. were split into groups of five students using
a one week travel planning horizon and five students using a three month travel planning
horizon. Belgium and the United States were chosen for several reasons including
cultural distance, proficiency in the English language, and ease of data collection. One
week and three months were chose as travel planning horizons in order to capture
differences between the last minute traveler and one who is planning a trip in advance. In
tourism, the concept of yield management has lead tourism businesses to heavily discount
their products at the last minute in an attempt to fill as many rooms or seats as possible.
Dependent Variables
The key dependent measurement of information foraging in this study was the
amount of time participants were engaged in a travel information searching activity. The
information search task resulted in twenty two items that each participant searched for. In
addition to total time spent, there are several other measurements that can provide insight
into why users took various amounts of time to complete the same activity. Hodkinson,
Kiel, and McColl-Kennedy (2000) developed several measures that can be used to learn
more about why people were more or less efficient in their information foraging (See
Table 3.1). Measures developed by Hodkinson et al. (2000) encompass several categories
in order to get an accurate profile of all elements of Internet searching.

35
The dependent variable categories and measurements are as follows:
1) Effort – An overall measure of how hard the participant tried to find exactly what
they were looking for. Measurements include:
a. Number of links clicked – any time a participant clicked a URL or button
on any website that took them to a different, unique website.
b. Number of search actions – activities that constituted a “search action”
were – clicking a link, performing a search engine search, entering a URL
and surfing to that page, clicking any link or button within a website that
took the participant to other content on that same website.
2) Final Site Arrival Method – Indicates which search method led directly to the
successful discovery of a piece of travel information. Measurements include:
a. Link from search engine – When a participant reached a trip selection as a
direct result of clicking on a link from a list of search engine results.
b. Site to site link – When a participant reached a trip selection as a direct
result of clicking on a link from any website other than a search engine.
c. Entered URL – When a participant reached a trip selection as a direct
result of entering a URL other than a search engine.
3) Breadth/Depth – Measures the overall amount of information viewed by the
participant as well as how widely the user searched the web. Indicates what type
of search methods the user used such as wide, meandering search or a linear
search directly to a piece of information. Measurements include:

36
a. Unique webpage – sites with a completely different root page (e.g.
www.google.com and www.google.com/maps or any other site with a root
of www.google.com would only count as one unique website).
b. Total web pages viewed – the total number of web pages viewed by
participants regardless of site uniqueness (e.g. www.google.com and
www.google.com/maps would count as two web pages).
4) Search Engines – Indicates how often and to what extent study participants
utilized search engines to aid their search. Search engines are an easy way for
users to increase their search efficiency by allowing them to browse results from
multiple sites on one page. Measurements include:
a. Number of general search engines used – the total number of search
engines that the participant used (e.g. www.google.com, www.yahoo.com,
www.ask.com, etc.).
b. Number of general search outputs produced – total number of search
outputs produced by clicking the “search” or “find” button on a general
search engine website.

37
Effort Final site
arrival
method
Breadth/
depth
Search engines
Measurement 1. Number of links clicked 2. Number of search actions
1. Link from search engine 2. Site-to-site link 3. Entered URL
1. Total web pages viewed 2. Number of unique web sites visited
1. Number of general search engines used 2. Number of search outputs produced
Table 3.1 – Dependent variable measurements
Hypotheses
A series of hypotheses based upon previous literature were developed to test each
research question. Hypotheses for research questions three and four were directional
hypotheses based upon literature presented in chapter two.
Research Question 1 Hypothesis
Research Question 1: Is information foraging theory applicable to an online travel and
tourism information search setting?
Hypothesis 1: Study participants will exhibit information foraging behavior by using
environmental enrichment and scent following.
To test this hypothesis, two measures of information foraging were used. First,
environmental enrichment was measured by use of general search engines. Participants
were considered to be using environmental enrichment if they used at least one general
search engine. Second, scent following was measured by the use of clicking links.

38
Participants were considered to be using scent following clicked at least one link during
the online travel information search.
Research Question 2 Hypotheses
Research Question 2: Can measures developed by Hodkinson, Kiel & McColl-Kennedy
measure online travel information search behaviors?
Hypothesis 2a: Study participants will click multiple links
Hypothesis 2b: Study participants will complete multiple search actions
Hypothesis 2c: Study participants will arrive at their final site decision via multiple
search engine links
Hypothesis 2d: Study participants will arrive at their final site decision via multiple site
to site links
Hypothesis 2e: Study participants will arrive at their final site decision via multiple
directly entered URLs
Hypothesis 2f: Study participants will view multiple web pages
Hypothesis 2g: Study participants will view multiple unique web sites
Hypothesis 2h: Study participants will use multiple general search engines
Hypothesis 2i: Study participants will produce multiple general search engine outputs
To test these hypotheses, frequencies of each behavior were run. In order to be
considered a valid measure of online travel information search behavior, each measure
must have been used multiple times.

39
Research Question 3 Hypotheses
Research Question 3: Do Belgian students search differently for online travel
information than American students?
Hypothesis 3a: Belgian students will spend more time searching than American
students.
Hypothesis 3b: Belgian students will click more links than American students
Hypothesis 3c: Belgian students will attempt more search actions than American
students
Hypothesis 3d: American students will arrive at more sites containing information they
wish to use via search engine links than Belgian students
Hypothesis 3e: Belgian students will arrive at more sites containing information they
wish to use from site to site links than American students
Hypothesis 3f: American students will arrive at more sites containing information they
wish to use from entering direct URLs than Belgian students
Hypothesis 3g: Belgian students will view more total web pages than American students
Hypothesis 3h: Belgian students will view more unique web sites than American
students
Hypothesis 3i: Belgian students will use more search engines than American students.
Hypothesis 3j: Belgian students will produce more search outputs than American
students.

40
To test these hypotheses a series of one tailed t-tests were run. A significance level of 0.1
was used for these tests.
Research Question 4 Hypotheses
Research Question 4: Does travel planning horizon make a difference in online
information search behaviors?
Hypothesis 4a: Students with a one week travel planning horizon will take less time
searching than students with a three month travel planning horizon.
Hypothesis 4b: Students with a one week travel planning horizon will click less links
than students with a three month travel planning horizon.
Hypothesis 4c: Students with a one week travel planning horizon will attempt less
search actions than students with a three month travel planning horizon.
Hypothesis 4d: Students with a one week travel planning horizon will arrive at more
sites containing information they wish to use via search engine links
than students with a three month travel planning horizon.
Hypothesis 4e: Students with a one week travel planning horizon will arrive at more
sites containing information they wish to use from site to site links than
students with a three month travel planning horizon.
Hypothesis 4f: Students with a one week travel planning horizon will arrive at more
sites containing information they wish to use from directly entering a
URL than students with a three month travel planning horizon.

41
Hypothesis 4g: Students with a one week travel planning horizon will view less total
web pages than students with a three month travel planning horizon.
Hypothesis 4h: Students with a one week travel planning horizon will view less unique
web sites than students with a three month travel planning horizons
Hypothesis 4i: Students with a one week travel planning horizon will use less search
engines than students with a three month travel planning horizon.
Hypothesis 4j: Students with a one week travel planning horizon will produce less
search outputs than students with a three month travel planning horizon.
To test these hypotheses a series of one tailed t-tests were run. A significance level of 0.1
was used for these tests.
Data collection procedures
Data were collected over a three week period in October during the fall semester
of 2007 in Belgium at a large university. Data from a university in the South Eastern
United States were collected over a two month period in March and April during the
spring semester of 2008. As travel planning horizon has been previously found to effect
trip planning behavior, the group of students from the South Eastern United States
University was split in half with each half completing their trip planning activity under
different planning horizons (one week and three months). During the task, participants
were asked to record their decisions on designated areas provided to them on the task
information sheets to ensure accuracy in choice identification (See Appendix B).

42
The recording of data using Morae usability testing software loaded on a single
laptop computer. The Morae software package is an industry standard in the usability
testing field, and records a variety of data including: screen video (i.e. Everything
occurring on the computer screen as a video file), screen text, key strokes, web page
changes, audio via computer microphone, and windows events. While Morae is generally
used for usability testing (e.g. examining ease of navigation and data organization of a
particular website) its capabilities are well suited for testing Internet search behaviors.
Morae has been used throughout the information technology literature,
particularly in studies dealing with usability testing (Fagan, 2006; Moha, Gaffar, &
Michel, 2007; Howarth, Andre, & Hartson; 2007). However, a similar software package
developed by the same company called Camtasia was used by Pan & Fesenmaier (2006)
to measure information search behaviors in travel and tourism. Furthermore, Moha,
Gafffar, & Michel (2007) recommend Morae for those not trained in usability testing in
commercial situations.
A single laptop computer in an empty room was used help reduce extraneous
sources of variability such as distractions from other experiment participants or variations
in computer configurations. During the task, experiment participants were left in a quiet
room by themselves in order to ensure concentration on the task. Participants were asked
to simply exit the room when they have completed their task.

43
Data Coding Process
With the use of Morae software, each participant video was watched in full to
record measurements developed by Hodkinson, et al. A tally sheet was developed in
order to accommodate each measurement (See Appendix C). Once tally sheets were
completed for every study participant, results were entered into SPSS 15.0 for further
analysis.
Reliability
There was some concern that reliability could be diminished because a researcher
had to watch a video of participant activity and tally actions. For this reason, strict
definitions were adhered to during the movie watching and tallying process. In addition,
the Morae software package provides on screen indicators of mouse clicks and key
strokes, enhancing the researchers focus on these actions. After the research videos were
watched and tallied, results were compared with spreadsheets produced by Morae to
further account for errors.
Analysis
Analysis of data was completed using SPSS 15.0 statistical package. First,
Descriptive statistics were run in order to profile Belgian and American participants.
Then each hypothesis was tested using t-tests in SPSS. Hypotheses were tested in the
order they were listed. For this research, an alpha level of 0.1 is utilized to test data
significance. There are several reasons for using 0.1 in this study, first and foremost is the

44
small sample size. Kline (2004) states that conventional levels of alpha in the social
sciences are generally .05 or .01, but the only reason for this is journal editorial policy.
When determining a proper alpha level, researchers must examine multiple factors and
decide what alpha level suits their type of experiment and data. In addition, Denonberg
(1976) makes the argument that in research foraying into new territory (such as that of
information searching on the Internet) studies may be able to use alpha levels higher than
.05 in order to make gains into new bodies of literature.
Assumptions
This thesis research operates on three key assumptions. First, in this research there
was no possibility of having a failed search while in real life situations information
searching could lead to no results. Second, researchers are assuming that Belgian students
in this study were proficient in reading and writing English. In an attempt to account for
this, all materials were first edited by a sample of Belgian students in order to eliminate
any language that could be difficult for Belgians to understand. Third, it is assumed that it
is possible to emulate a real life travel planning situation. While several elements of the
trip were pre-planned for participants, efforts were made to give as much freedom as
possible.
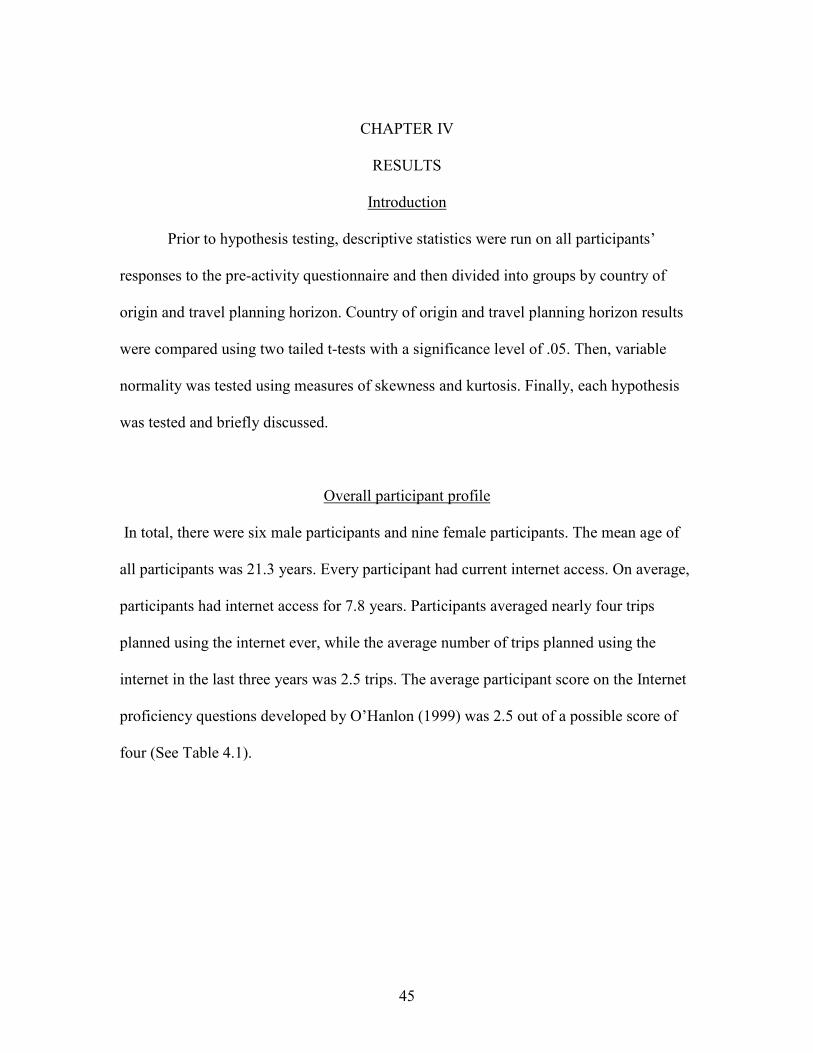
45
CHAPTER IV
RESULTS
Introduction
Prior to hypothesis testing, descriptive statistics were run on all participants’
responses to the pre-activity questionnaire and then divided into groups by country of
origin and travel planning horizon. Country of origin and travel planning horizon results
were compared using two tailed t-tests with a significance level of .05. Then, variable
normality was tested using measures of skewness and kurtosis. Finally, each hypothesis
was tested and briefly discussed.
Overall participant profile
In total, there were six male participants and nine female participants. The mean age of
all participants was 21.3 years. Every participant had current internet access. On average,
participants had internet access for 7.8 years. Participants averaged nearly four trips
planned using the internet ever, while the average number of trips planned using the
internet in the last three years was 2.5 trips. The average participant score on the Internet
proficiency questions developed by O’Hanlon (1999) was 2.5 out of a possible score of
four (See Table 4.1).
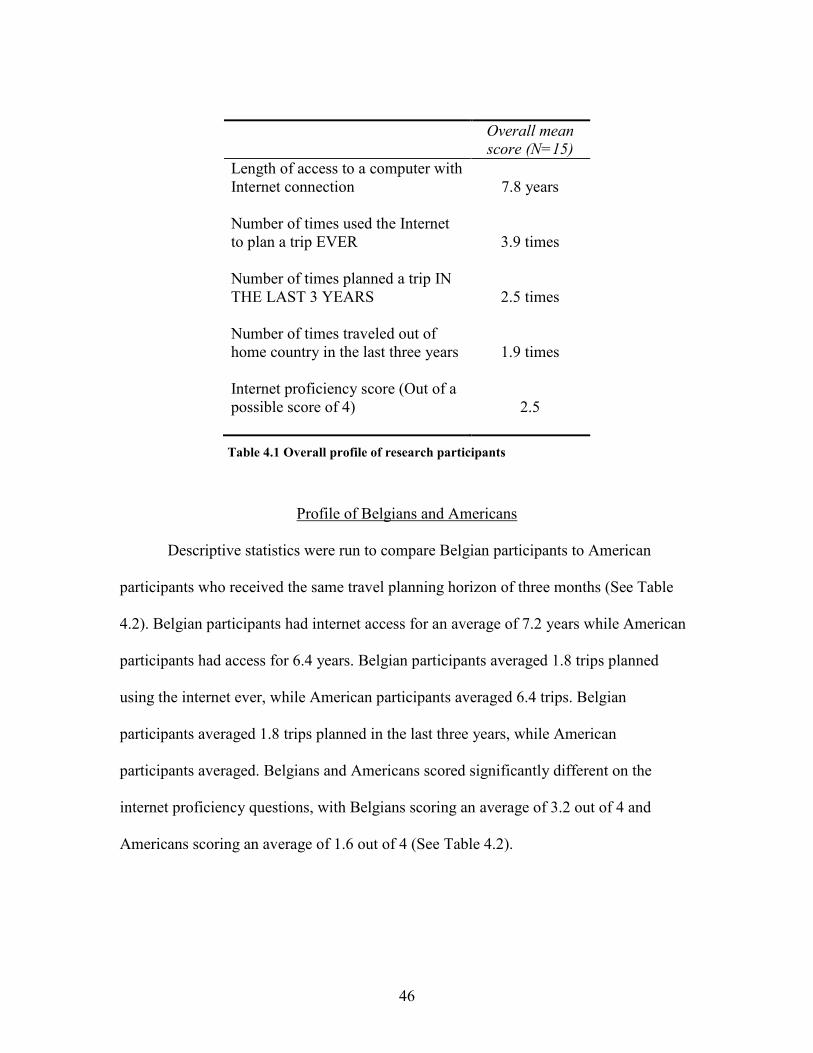
46
Overall mean
score (N=15)
Length of access to a computer with Internet connection
7.8 years
Number of times used the Internet to plan a trip EVER
3.9 times
Number of times planned a trip IN THE LAST 3 YEARS
2.5 times
Number of times traveled out of home country in the last three years
1.9 times
Internet proficiency score (Out of a possible score of 4)
2.5
Table 4.1 Overall profile of research participants
Profile of Belgians and Americans
Descriptive statistics were run to compare Belgian participants to American
participants who received the same travel planning horizon of three months (See Table
4.2). Belgian participants had internet access for an average of 7.2 years while American
participants had access for 6.4 years. Belgian participants averaged 1.8 trips planned
using the internet ever, while American participants averaged 6.4 trips. Belgian
participants averaged 1.8 trips planned in the last three years, while American
participants averaged. Belgians and Americans scored significantly different on the
internet proficiency questions, with Belgians scoring an average of 3.2 out of 4 and
Americans scoring an average of 1.6 out of 4 (See Table 4.2).

47
Belgian
mean score
(n=5)
U.S.A mean
score (n=5)
T-Score P-Value
Length of access to a computer with Internet connection
7.2 years (s.d.=1.92)
6.4 years (s.d.=3.21)
0.48 0.65
Number of times used the Internet to plan a trip EVER
1.8 times (s.d.=2.05)
6.4 times (s.d.=10.55)
-0.96 0.39
Number of times planed a trip IN THE LAST 3 YEARS
1.8 times (s.d.=1.10)
3.2 times (s.d.=1.10)
-2.02 0.08
Number of times traveled out of home country in the last three years
3.4 times (s.d.=1.67)
2.2 times (s.d.=4.38)
0.57 0.58
Internet proficiency score
(Out of a possible score of
four)
3.2
(s.d.=0.84) 1.6
(s.d.=1.14) 2.53 0.03
Table 4.2 Profile of Belgians and Americans
Profile of Americans with Different Travel Planning Horizons
Statistics were run to compare groups of American participants who received
different travel planning horizons (See Table 4.3). Participants with a one week travel
planning horizon had internet access for an average of 9.8 years while participants with a
three month travel planning horizon had access for 6.4 years. Participants with a one
week travel planning horizon averaged 3.6 trips planned using the internet ever, while
participants with a three month travel planning horizon averaged 6.4 trips. Participants
with a one week travel planning horizon averaged 2.4 trips planned in the last three years,

48
while participants with a three month travel planning horizon averaged 3.2. Participants
with a one week travel planning horizon scored an average 2.6 out of four on internet
proficiency, while those with a three month travel planning horizon scored an average of
1.6 out of four. As expected, none of these results were found to be significantly different
(See Table 4.3).
U.S.A
1 week
mean
score (n=5)
U.S.A.
3 months
mean score
(n=5)
T-Score P-Value
Length of access to a computer with Internet connection
9.8 years (s.d.=2.86)
6.4 years (s.d.=3.21)
1.77 0.12
Number of times used the Internet to plan a trip EVER
3.6 times (s.d.=3.05)
6.4 times (s.d.=10.55)
-0.57 0.58
Number of times planned a trip IN THE LAST 3 YEARS
2.4 times (s.d.=1.82)
3.2 times (s.d.=1.10)
-0.84 0.42
Number of times traveled out of home country in the last three years
0.2 times (s.d.=0.45)
2.2 times (s.d.=4.38)
-1.01 0.34
Internet proficiency score (Out of a possible score of 4)
2.6 (s.d.=1.14)
1.6 (s.d.=1.14)
1.39 0.20
Table 4.3 Profile of American participants receiving different travel planning horizons
Sample Distribution
As there was a concern over small sample size, tests of sample normality were
conducted on study variables. Tests of skewness and kurtosis were run (See Table 4.4)
using SPSS. According to SPSS, normally distributed data generally have low skewness

49
and kurtosis score. For this research a skewness score of greater than 2.5 and a kurtosis
score of greater than 6.5 were considered invalid. As can be seen, results of arrival from
site to site links and direct URLs have very high skewness and kurtosis scores. These
results indicate those two measures were not valid for this study.
Measure Mean Std. Deviation Skewness Kurtosis
Time 67.20 minutes 16.95 0.23 -0.30 Links clicked 17.60 10.76 0.88 0.77
Search Actions 90.40 32.88 0.94 0.58
Arrival search engine links 15.80 5.27 -1.61 2.11
Arrival site to
site links 0.40 1.12 2.91 8.39
Arrival direct
URLS 0.07 0.26 3.87 15.00
Total web pages viewed
160.33 71.58 1.31 2.87
Unique web pages viewd 16.20 8.53 0.36 -0.52
Search engines used 1.0 0.0 0.0 0.0
Search outputs 12.60 7.49 1.59 4.41
Table 4.4 Measures of skewness and kurtosis

50
Hypothesis Testing
Research question one was tested using frequencies of links clicked and search
engines used. Research question two was tested using frequencies and measurements of
skewness and kurtosis. Research questions two and three were tested by running a series
of t-tests. In this section, each hypothesis will be listed and analyzed as well as briefly
discussed. At the end of this section results will be condensed into tables for easier
viewing.
Research Question 1 Hypothesis Test
Research Question 1: Is information foraging theory applicable to an online travel and
tourism information search setting?
To test this research question two measures of information foraging were used. First,
environmental enrichment was measured by use of general search engines. Participants
were considered to be using environmental enrichment if they used at least one general
search engine. Second, scent following was measured by the use of clicking links.
Participants were considered to be using scent following clicked at least one link during
the online travel information search.
Hypothesis 1: Study participants will exhibit information foraging behavior by
using environmental enrichment and scent following.
Result: Accept

51
Each study participant used exactly one general search engine. The average
number of search outputs produced by each participant was 12.6. In addition, study
participants arrived at their final choice of travel information via search engines an
average of 15.8 times. Additionally, Study participants clicked an average of 17.6 links
during their online travel information search. However, only two people arrived at their
final choice of travel information via clicking site to site links.
These results reveal that not only did participants engage in environmental
enrichment activity, it was used successfully the vast majority of the time. These results
confirm that the environmental enrichment portion of information foraging theory applies
well to online travel information search. Findings are consistent with those of Pan and
Fesenmaier (2006), who found that their study participants did engage in information
foraging activities while searching for travel information on the Internet.
In addition, these results reveal that while participants did engage in scent
following activities, it very rarely led them to the information they were looking for. This
finding is confirmatory of the new model of online information foraging described in
chapter two, where online information searchers are unable to complete environmental
enrichment without the use of scent following. While participants often engaged in scent
following activities, it was frequently counted as arrival via search engine because of how
Hodkinson et al. defined their measurements.

52
Research Question 2 Hypotheses Tests
Research Question 2: Can measures developed by Hodkinson, Kiel & McColl-Kennedy
measure online travel information search behaviors?
In order to determine if measurements developed by Hodkinson, et al. were
applicable to online travel information searchers, frequencies, distributions and mean
scores were run using SPSS. It was determined that all measures except site arrival
method of site to site links and directly entered URLS as well as number of search
engines used were valid measurements of online travel information search behavior.
Results are presented in Table 4.5 for easier viewing.
Hypothesis 2a: Study participants will click multiple links
Result: Accept
All study participants clicked at least one link. The average number of links
clicked was 17.6. These results that not only did users click links, they clicked them
often. When mean time spent searching is taken into account (67.2 minutes per
participant) it is revealed that participants clicked a link, on average, once every four
minutes. This measurement shows that, for study participants, clicking links is a valid
way to search for travel information.
Hypothesis 2b: Study participants will complete multiple search actions
Result: Accept

53
Study participants completed an average of 90.4 search actions. This result is not
surprising considering the broad spectrum activities encompassed by the definition of
search actions. However, this finding does reveal that participants were very active in
their search for online travel information, completing an average of 1.3 search actions per
minute.
Hypothesis 2c: Study participants will arrive at their final site decision via multiple
search engine links
Result: Accept
Search engine links were the most popular method of final site arrival in this
study. Participants arrived at their final site choice an average of 15.8 times. Within the
measures developed by Hodkinson et al., search engine links proved to be the only valid
method of site arrival in this study. These results confirmed that environmental
enrichment was an integral part of online travel information search.
Hypothesis 2d: Study participants will arrive at their final site decision via multiple
site to site links
Result: Invalid
Measures of skewness and kurtosis revealed that this method of final site arrival
was an invalid measure of online travel information search behavior.

54
Hypothesis 2e: Study participants will arrive at their final site decision via multiple
directly entered URLs
Result: Invalid
Measures of skewness and kurtosis revealed that this method of final site arrival
was an invalid measure of online travel information search behavior.
Hypothesis 2f: Study participants will view multiple web pages
Result: Accept
Study participants viewed an average of 160.33 web pages during the course of
their online travel information searching. This result revealed that participants were
thorough in their online travel information search, with participants viewing greater than
two web pages per minute on average. When amount of unique web pages are taken into
account, it is obvious that participants went deeper than a simple surface search, viewing
nearly ten pages per unique site.
Hypothesis 2g: Study participants will view multiple unique web sites
Result: Accept
Participants viewed an average of 16.2 unique web sites during their online travel
information search. This result reveals that participants utilized a fairly large amount of
different unique sites during their online travel information search. However, this result

55
does not mean that participants made a travel decision based on each one of the sites they
browsed.
Hypothesis 2h: Study participants will use multiple general search engines
Result: Reject
Every single participant used only one general search engine during their online
travel information search. Upon further examination, it was found that 93.3% (14 out of
15) participants used the same search engine (www.google.com). The other search engine
used was www.ask.com. This finding reveals just how dominant a role Google plays in
today’s web search market.
Hypothesis 2i: Study participants will produce multiple general search engine
outputs
Result: Accept
While each study participant used only one search engine, they did however produce
multiple search outputs on their search engine of choice. Participants averaged 12.6
search outputs. This statistic is very revealing when coupled with the fact that each
participant averaged 15.8 final site arrivals via search engine links.

56
Hypothesis Measure Mean Std. Deviation Result
2a Links clicked 17.60 10.76 Accept
2b Search Actions 90.40 32.88 Accept
2c Arrival search engine links
15.80 5.27 Accept
2d Arrival site to site links
0.40 1.12 Not Valid
2e Arrival direct URLS
0.07 0.26 Not Valid
2f Total web pages viewed
160.33 71.58 Accept
2g Unique web pages viewd
16.20 8.53 Accept
2h Search engines used
1.0 0.0 Reject
2i Search outputs 12.60 7.49 Accept
Table 4.5 Established measures hypothesis test results
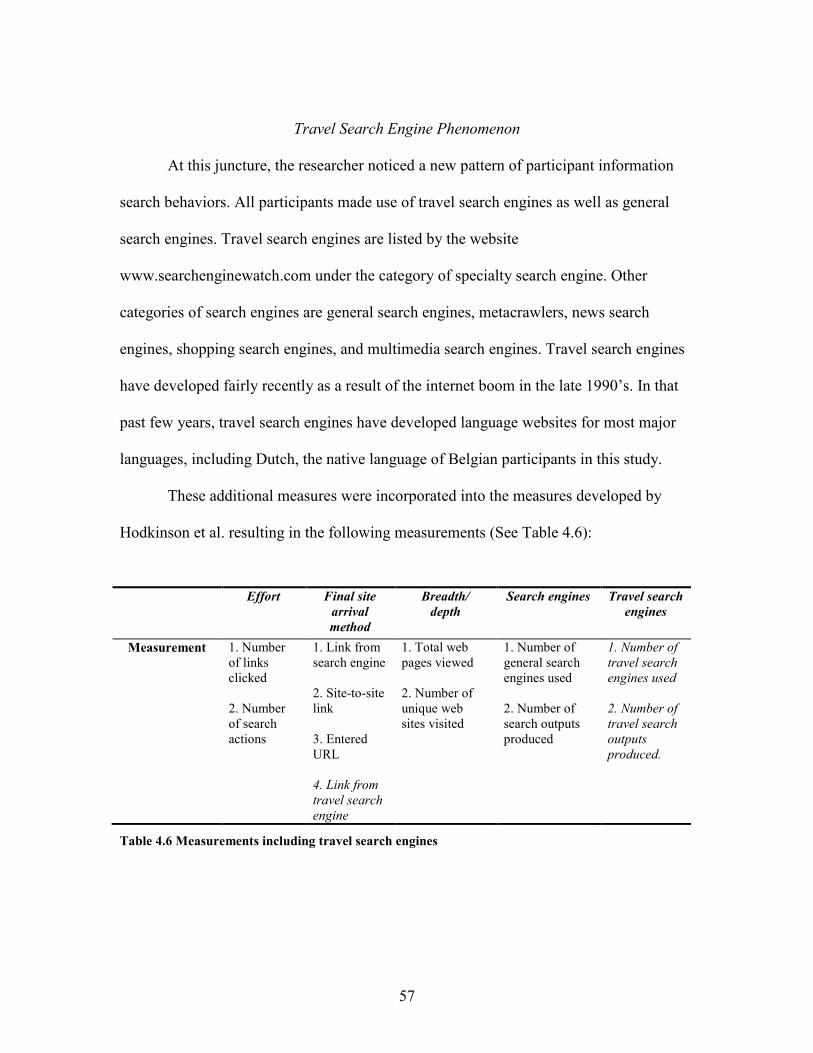
57
Travel Search Engine Phenomenon
At this juncture, the researcher noticed a new pattern of participant information
search behaviors. All participants made use of travel search engines as well as general
search engines. Travel search engines are listed by the website
www.searchenginewatch.com under the category of specialty search engine. Other
categories of search engines are general search engines, metacrawlers, news search
engines, shopping search engines, and multimedia search engines. Travel search engines
have developed fairly recently as a result of the internet boom in the late 1990’s. In that
past few years, travel search engines have developed language websites for most major
languages, including Dutch, the native language of Belgian participants in this study.
These additional measures were incorporated into the measures developed by
Hodkinson et al. resulting in the following measurements (See Table 4.6):
Table 4.6 Measurements including travel search engines
Effort Final site
arrival
method
Breadth/
depth
Search engines Travel search
engines
Measurement 1. Number of links clicked 2. Number of search actions
1. Link from search engine 2. Site-to-site link 3. Entered URL 4. Link from
travel search
engine
1. Total web pages viewed 2. Number of unique web sites visited
1. Number of general search engines used 2. Number of search outputs produced
1. Number of
travel search
engines used
2. Number of
travel search
outputs
produced.

58
Link from travel search engine – when a participant reached a trip selection as a
direct result of clicking on a link from a list of travel search engine results.
Number of travel search engines used – the total number of travel search
engines such as Orbitz, Expedia, Travelocity or any other search engine specifically
designed to search for more than one type of travel information (such as air transport, car
rental, accommodation, activities, cruises, etc.).
Number of travel search engine outputs produced – the total number of search
outputs produced by clicking the “search” or “book” button on a travel search engine
website
As a result of this phenomenon, additional hypotheses were written to be tested
along with those previously mentioned. It was determined because of American students’
greater experience planning trips online that they would be more familiar with, and
therefore use more travel search engines and produce more travel search engine outputs.
Hypothesis 3k: American students will arrive at more sites containing information they
wish to use via travel search engine links than Belgian students.
Hypothesis 3l: American students will use more travel search engines than Belgian
students.
Hypothesis 3m: American students will produce more travel search engine outputs than
Belgian students.

59
In addition, it was determined that because travelers with a short travel planning
horizon tend to use less information sources, they would be more likely to use travel
search engines because they offer a one stop shop for all travel elements.
Hypothesis 4k: Students with a one week travel planning horizon will arrive at more
sites containing information they wish to use via travel search engine
links than students with a three month travel planning horizon.
Hypothesis 4l: Students with a one week travel planning horizon will use more travel
search engines than students with a three month travel planning horizon.
Hypothesis 4m: Students with a one week travel planning horizon will produce more
travel search engine outputs than students with a three month travel
planning horizon.
Descriptive statistics and tests of skewness and kurtosis were run on these
additional variables (See Table 4.7) using SPSS.. Tests of skewness and kurtosis revealed
that number of all measures were valid for this study.

60
Table 4.7 Travel search engine measures of skewness and kurtosis
Research Question 3 Hypothesis tests
Research Question 3: Do Belgian students search differently for online travel
information than American students?
To test these hypotheses a series of one tailed t-tests were run. A significance level of 0.1
was used for these tests. Results are condensed in Table 4.8 for easier viewing.
Hypothesis 3a: Belgian students will spend more time searching than American
students.
Result: Accept
Belgians searched an average of 79.3 minutes while Americans took 64.8 minutes
on average (t = 1.64, p = 0.07). It had been outlined in the literature review that
Europeans tend to take a more longitudinal approach to searching and use a very non-
linear search path. During the viewing of search videos, the researcher noted that
Measure Mean Std. Deviation Skewness Kurtosis
Arrival travel search engin
5.73 5.42 1.65 2.35
Travel search engines used
1.87 1.69 2.10 6.12
Travel search outputs
6.93 5.57 0.71 -0.12

61
Belgians would often view several pages of information before making their decision.
These findings indicate uncertainty avoidance may have played a role, as Belgians
generally use expert sources of information and therefore tend to be more thorough when
searching on their own. Conversely, Americans tended to search more linearly and
efficiently and generally chose the first option they found. These findings are in
agreement with the findings of Hofstede, (2001), Litvin, et al. (2004) and Chen (2001).
Hypothesis 3b: Belgian students will click more links than American students
Result: Accept
Belgians clicked an average of 25.0 links while Americans only clicked 13.6 on
average (t = 1.63, p = 0.07). These findings are unsurprising as Belgians’ longitudinal
searching generally involves more site to site linking and exploring, while Americans’
linear paths rarely deviated from a page once it was reached. This result is consistent with
Brengman et al. (2005) in that Belgians are more explorative in their searches and tend to
be browsers, as browsing often includes clicking site to site links.
Hypothesis 3c: Belgian students will attempt more search actions than American
students
Result: Accept
Belgians attempted an average of 116.6 search actions while Americans attempted
an average of 79.6 search actions (t = 1.74, p = 0.06). Such findings are once again
consistent with the overall trend of Belgians exploring more than Americans. In addition,

62
this result indicates Belgian participants uncertainty led them to complete more search
actions in order to be sure they were finding what they were looking for. This result is
unsurprising considering Gursoy and Umbreit (2004) found that 0.66% of Belgians used
the Internet when searching for travel information.
Hypothesis 3d: American students will arrive at more sites containing information
they wish to use via search engine links than Belgian students
Result: Accept
Belgian searchers gained an average of 19.4 pieces of travel information as a
direct result of linking from a search engine while American searchers gained an average
of 13.4 pieces of travel information (t = 2.27, p = 0.025). As Gursoy and Umbreit (2004)
found, Belgians are extremely unfamiliar with using the Internet to plan trips. Findings in
this research confirm this trend, as Belgians tended to use general search engines to find
travel information, while Americans were less reliant on general search engines.
Hypothesis 3e: Belgian students will arrive at more sites containing information
they wish to use from site to site links than American students
Result: Invalid
Measurements of skewness and kurtosis showed this measurement to be invalid.
Hypothesis 3f: American students will arrive at more sites containing information
they wish to use from entering direct URLs than Belgian students

63
Result: Invalid
Measurements of skewness and kurtosis showed this measurement to be invalid.
Hypothesis 3k: American students will arrive at more sites containing information
they wish to use via travel search engine links than Belgian students.
Result: Accept
Belgian students gained an average of 1.8 pieces of useful travel information
while Americans gained 8.0 pieces of useful travel information via travel search engines
(t = -2.29, p = 0.025). In contrast to the results of general search engine use, where
Belgians gained more information, American students gained a vastly greater amount of
information via travel search engine. This result is unsurprising considering the greater
number of trips Americans students had planned themselves using the Internet.
Hypothesis 3g: Belgian students will view more total web pages than American
students
Result: Reject
The mean number of total web pages viewed by Belgians was 197.8, while
Americans’ averaged only 166.2 (t = 0.6, p = 0.28). While Belgians did, on average, view
more pages than American students, these results were not significantly different. A
possible explanation for this result could be the large amount of pages viewed by both
types of participants.

64
Hypothesis 3h: Belgian students will view more unique web sites than American
students
Result: Reject
Belgians averaged 21.2 unique web sites viewed per person while Americans
averaged 16.4 sites per person (t = 0.85, p = 0.21). This result is not surprising
considering the results of hypothesis 3g. While Belgians again averaged a greater number
of unique web sites, they were not significantly more. It is interesting to note that this
result reveals that Americans spent a larger amount of time per unique web site (3.95
minutes) than did their Belgian counter parts (3.74 minutes
Hypothesis 3i: Belgian students will use more search engines than American
students.
Result: Reject
Every study participant used only one general search engine during their search.
Nine students used only www.google.com, while one used www.ask.com.
Hypothesis 3j: Belgian students will produce more search outputs than American
students.
Result: Accept
Belgian students averaged 17.6 search engine outputs per person, while American
students averaged a meager 9.8 search outputs (t = 1.65, p = 0.07). Considering both
groups of participants used only one search engine, it would appear as though Belgians

65
had more trouble finding exactly what they were looking for. This finding is consistent
with Belgians’ inexperience searching for travel information online (Gursoy & Umbreit,
2004).
Hypothesis 3l: American students will use more travel search engines than Belgian
students.
Result: Accept
Belgians averaged only one travel search engine used, while Americans used two
travel search engines on average (t = -1.58, p = 0.08). Results are consistent with
Americans’ greater experience using the Internet as a travel information search tool. It
makes sense that they would be more aware of the array of travel search engines
available to them.
Hypothesis 3m: American students will produce more travel search engine outputs
than Belgian students.
Result: Reject
Belgian students produced an average of 4.6 travel search engine outputs, while
American students produced an average of 7.6 travel search engine outputs (t = -0.88, p =
0.20). These results are surprising in themselves, but less so when compared with the
results of hypothesis 6l. It was originally thought that using less search engines would
result in less search outputs, but it appears as though Belgians produce a greater amount
of search outputs per search engine, regardless of what type of search engine it is.

66
Hypothesis Belgian Mean American
Mean T-value P-value Result
3a. Time 79.3 minutes 64.8 minutes 1.64 0.07 Accept
3b. Links
clicked 25.0 13.6 1.63 0.07 Accept
3c. Search
Actions 116.6 79.6 1.74 0.06 Accept
3d. Arrival
search engine
links
19.4 13.4 2.27 0.025 Accept
3e.Arrival site to site links
0.8 0.4 0.45 0.33 Invalid
3f. Arrival direct URLS
0.0 0.2 -1.0 0.16 Invalid
3k. Arrival
travel search
engine links
1.8 8.0 -2.29 0.025 Accept
3g. Total web pages viewed
197.8 166.2 0.61 0.28 Reject
3h. Unique web sites viewd
21.2 16.4 0.85 0.21 Reject
3i. Search engines used
1.0 1.0 0.0 1.0 Reject
3j. Search
outputs 17.6 9.8 1.65 0.07 Accept
3l. Travel
search engines
used
1.0 2.0 -1.58 0.08 Accept
3m. Travel search outputs
4.6 7.6 -0.88 0.20 Reject
Table 4.8 Country of origin hypothesis test results

67
Research Question 4 Hypothesis Tests
Research Question 4: Does travel planning horizon make a difference in online
information search behaviors?
To test these hypotheses a series of one tailed t-tests were run. A significance level of 0.1
was used for these tests. Results are condensed in table 4.9 for easier viewing.
Hypothesis 4a: Students with a one week travel planning horizon will take less
time searching than students with a three month travel planning
horizon.
Result: Reject
American students with a one week travel planning horizon averaged 57.5
minutes searching while those with a three month travel planning horizon averaged 64.8
minutes (t = 0.71, p = .25). While results indicated that those with a one week travel
planning horizon did take less time, results were not significant. This may reveal that a
hypothetical time restraint was not as effective as anticipated.
Hypothesis 4b: Students with a one week travel planning horizon will click less links
than students with a three month travel planning horizon.
Result: Reject
American students with a one week travel planning horizon clicked an average of
14.2 links while students with a three month travel planning horizon clicked an average

68
of 13.6 links (t = 0.12, p = 0.45). The number of links clicked by both groups was very
similar. This could be a result of Americans general web searching behavior. Americans
tend to be very succinct and concise with their searching no matter how much time they
have. As a result, Americans just don’t click very many links in general.
Hypothesis 4c: Students with a one week travel planning horizon will attempt less
search actions than students with a three month travel planning
horizon.
Result: Reject
American students with a one week travel planning horizon completed 75.0
search actions on average, while students with a three month travel planning horizon
completed an average of 79.6 search actions (t = -0.30, p = 0.38). These results are
somewhat surprising considering the significantly greater number of sites used by
students with a three month travel planning horizon. Perhaps a larger sample size would
have revealed significant differences for this hypothesis.
Hypothesis 4d: Students with a one week travel planning horizon will arrive at
more sites containing information they wish to use via search engine
links than students with a three month travel planning horizon.
Result: Reject
American students with a one week travel planning horizon arrived at a useful
piece of information via search engine an average of 14.6 while students with a three
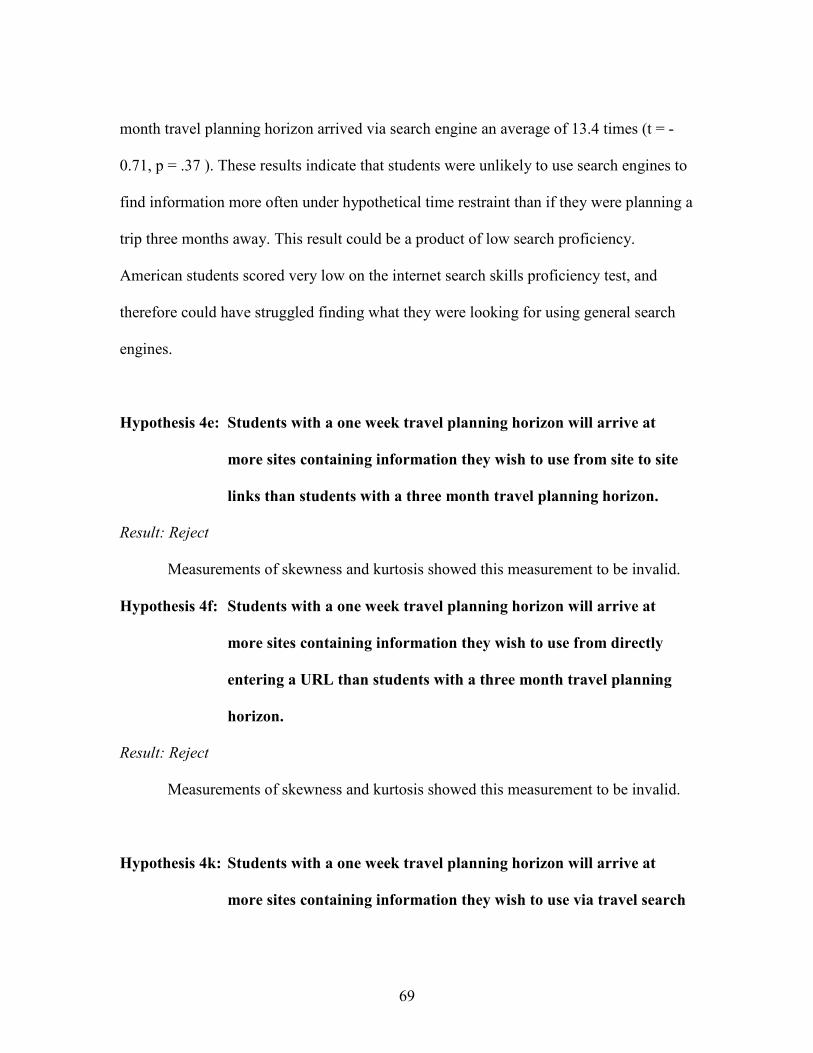
69
month travel planning horizon arrived via search engine an average of 13.4 times (t = -
0.71, p = .37 ). These results indicate that students were unlikely to use search engines to
find information more often under hypothetical time restraint than if they were planning a
trip three months away. This result could be a product of low search proficiency.
American students scored very low on the internet search skills proficiency test, and
therefore could have struggled finding what they were looking for using general search
engines.
Hypothesis 4e: Students with a one week travel planning horizon will arrive at
more sites containing information they wish to use from site to site
links than students with a three month travel planning horizon.
Result: Reject
Measurements of skewness and kurtosis showed this measurement to be invalid.
Hypothesis 4f: Students with a one week travel planning horizon will arrive at
more sites containing information they wish to use from directly
entering a URL than students with a three month travel planning
horizon.
Result: Reject
Measurements of skewness and kurtosis showed this measurement to be invalid.
Hypothesis 4k: Students with a one week travel planning horizon will arrive at
more sites containing information they wish to use via travel search

70
engine links than students with a three month travel planning
horizon.
Result: Reject
Students with one week travel planning horizon arrived at useful pieces of
information an average of 14.6 times, while students with a three month travel planning
horizon arrived in this manner an average of 13.4 times (t = -0.16, p = 0.44). These
results indicate students were once again, unaffected by the hypothetical time restraint of
having to plan a trip only one week in advance. This result could be a result of the
inexperience of this sample in planning trips on the Internet. Often, more experienced
online travel planners have a greater knowledge of travel search engines.
Hypothesis 4g: Students with a one week travel planning horizon will view less total
web pages than students with a three month travel planning
horizon.
Result: Accept
Students with a one week travel planning horizon viewed an average of 117.0 web
pages while students with a three month travel planning horizon viewed an average of
166.2 web pages (t = -1.12, p < .05). Results indicate that while other factors may not
have been affected by the time restraint of only one week until travel, web pages viewed
was. As a result, students with one week travel planning horizon were less thorough than
their counterparts with a longer travel planning horizon. This statistic is worth further

71
exploration, perhaps it is an indicator that a hypothetical time restraint was effective at
some level, however some elements of the time restraint may need to be changed.
Hypothesis 4h: Students with a one week travel planning horizon will view less
unique web sites than students with a three month travel planning
horizons
Result: Reject
Students with a one week travel planning horizon viewed an average of 11.0
unique web sites while students with a three month travel planning horizon viewed an
average of 16.4 unique web sites (t = -1.12, p = .15). These results indicate that while
students with a one week travel planning horizon viewed less pages overall, their unique
website visitation was not significantly affected.
Hypothesis 4i: Students with a one week travel planning horizon will use less
search engines than students with a three month travel planning
horizon.
Result: Reject
As previously mentioned, all survey participants used only one search engine.
Hypothesis 4j: Students with a one week travel planning horizon will produce less
search outputs than students with a three month travel planning
horizon.

72
Result: Reject
Students with a one week travel planning horizon produced an average of 10.4
search outputs while students with a three month travel planning horizon produced an
average of 9.8 search outputs (t = 0.18, p = 0.43). This result may be a product of this
sample’s poor score on the internet search proficiency test. Their low scores indicates
these students were unskilled in web searching, and therefore may not have been able to
find what they were looking for via search engine.
Hypothesis 4l: Students with a one week travel planning horizon will use more
travel search engines than students with a three month travel
planning horizon.
Result: Reject
Students with a one week travel planning horizon used an average of 2.6 travel search
engines while students with a three month travel planning horizon used an average of 2.0
travel search engines (t = 0.51, p = .31). This result may be because of such a
homogeneous group of American students. Perhaps if students had significantly different
levels of online travel planning experience, they would have been more familiar with a
greater variety of travel search engines.
Hypothesis 4m: Students with a one week travel planning horizon will produce
more travel search engine outputs than students with a three month
travel planning horizon.

73
Result: Reject
Students with a one week travel planning horizon produced an average of 8.6
travel search engine outputs while those with a three month travel planning horizon
produced an average of 7.6 travel search engine outputs (t = 0.28, p = 0.39). Once again
the homogeneity of the sample in this research could have contributed to this result. As
seen in popular media, several travel search engines are dedicated to last minute travel
planning and could have been used by travel planners had they been aware of such sites. .

74
Hypothesis One Week
Mean Three Month
Mean T-value P-value Result
4a. Time 57.5 minutes 64.8 minutes -0.71 0.25 Reject
4b. Links clicked 14.2 13.6 0.12 0.46 Reject
4c. Search Actions
75.0 79.6 -0.30 0.17 Reject
4d. Arrival search engine links
14.6 13.4 0.33 0.37 Reject
4e.Arrival site to site links
0.0 0.4 -1.0 0.17 Invalid
4f. Arrival direct URLS
0.0 0.2 -1.0 0.16 Invalid
4k. Arrival travel search engine links
7.4 8.0 -0.16 0.44 Reject
4g. Total web
pages viewed 117.0 166.2 -2.13 0.03 Accept
4h. Unique web sites viewd
11.0 16.4 -1.12 0.15 Reject
4i. Search engines used
1.0 1.0 0.0 1.0 Reject
4j. Search outputs
10.4 9.8 0.18 0.43 Reject
4l. Travel search engines used
2.6 2.0 0.51 0.31 Reject
4m. Travel search outputs
8.6 7.6 0.28 0.39 Reject
Table 4.9 Travel planning horizon hypothesis test results

75
CHAPTER FIVE
CONCLUSIONS AND IMPLICATIONS
Summary
The purpose of this thesis research was to build upon the framework of the online
travel information finding activity examined by Pan and Fesenmaier (2006) by using an
expanded search environment where participants are allowed to browse the Internet
freely while searching for online travel information of their choosing. This includes the
incorporation of information foraging theory, comparison of travel search behaviors
between two countries and examining behaviors over multiple travel planning horizons,
while using established measures previously used to evaluate online search behaviors.
It is believed that this empirical examination gives additional insight into how
potential travelers go about their task of information searching on the Internet. This
research also confirms that information foraging and some established measures can be
applied to an online travel searching environment, with the addition of several measures
specific to online travel information search. In addition, this research adds to the
relatively slim body of knowledge that currently exists on online travel information
search behaviors. Furthermore, the incorporation of country of origin and travel planning
horizon element provides a basis for future studies within these subjects.
Conclusions
This research was successful in determining the applicability of information
foraging theory and additional measures to online travel information search. Information

76
foraging behavior was observed in all study participants. Most additional measures tested
were applicable to this setting, while several new measures were discovered unique to
travel and tourism. Further research testing these new measures is needed.
In concurrence with information foraging theory, all users modified their
environment to garner the most information while using the least amount of time. How
users went about this, however, differed between cultures and, in one respect, travel
planning horizon. In general, American students were more efficient in applying the
principles of information foraging theory, this can be attributed to three factors
mentioned in previous literature. First, Americans are less risk adverse and more willing
to take chances in travel. Second, Americans are generally more experienced in using the
Internet to plan trips. Third, the search style of Americans fits better with the framework
of information foraging theory than the Belgians’ search style. What information foraging
doesn’t take into account is thoroughness of browsing. It seems that Belgians, in general,
take their time searching for information so as not to overlook any possibilities. The
additional measures used were useful in revealing this difference.
In the case of travel planning horizons, research results indicate that
hypothetical time restraints are not an effective way to stimulate travel searching
behavior. This result is perhaps a product of a homogeneous sample, such a group of
students could search for travel information the same no matter when they are traveling.
As a result, more studies need to be completed examining effects of time constraints on
travel information searchers using larger, more heterogeneous samples. Indeed, perhaps
there is no difference in travel information search behaviors between travel planning

77
horizons. It could be that users exhibit the same search behaviors regardless of when their
prospective trip is.
Theoretical Implications
The results of this research extend existing knowledge about how potential
travelers find information on the Internet. First and foremost, this study confirms that
information foraging theory can be applied to online travel searching. Second, this study
examined search behaviors using an established set of measures, something that had
previously not been done. Two additional measures unique to travel and tourism were
also discovered and should be confirmed by further testing in the future. It is important
the information searching body of literature continue with the use of established measures
so that similar works can be compared across industries.
In addition, this study extends past findings by Pan & Fesenmaier (2006). While
the Pan and Fesenmaier study was not replicated exactly, several key elements were
preserved. The information searching activity in this research was very similar to that of
Pan and Fesenmaier, as was the pre-activity questionnaire and elements of information
foraging theory (Pirolli & Card, 1999) in their study framework.
In the context of information foraging theory (Pirolli & Card, 1999), this research
made several interesting findings. While scent following and environmental enrichment
were unable to be directly measured because of the continual re-evaluation process used
by those searching for information on the Internet, several study findings point to a trend
toward environmental enrichment behaviors. The overwhelming use of search engines

78
and travel search engines in this study show that users preferred to mold their
environment so that it provided them the most valuable information at the least cost.
Scent following behaviors, however, were not widely successfully used to find pertinent
information, as can be seen by the very few participants who obtained useful information
by clicking site to site links.
Country of origin comparisons were perhaps the most interesting findings and
fruitful contributions of this research. Findings by this research were in agreement with
previous work started by Hofstede (2001). Several significant results were of note in the
country of origin hypothesis tests: Belgians took significantly more time, clicked more
links, completed more search actions, arrived at useful information more via search
engine and produced more search outputs than Americans did. Conversely, Americans
arrived at useful information via travel search engine significantly more, and used more
travel search engines. Such results are not only consistent with the body of work centered
around Hofstede, but also with the Brengeman et al (2005) study where Belgians tended
to be more of a browsing type of shopper while Americans took a very linear path.
Travel planning horizon results were less informative, however. The only
significant finding in this set of data was that of total web pages viewed. It would seem as
though the hypothetical time crunch that those with a one week travel planning horizon
were under, did little to affect their search behaviors. Other studies focused on limiting
time for online activity tended to limit the actual time users had to browse, not the time
until users would actually consume the product they were purchasing. In the online
79
context, at least, it seems as though a hypothetical time crunch did not turn searchers in to
the bargain hunters it was originally thought it would.
Implications for Industry and Consumers
This research is only the beginning in what should be along line of studies
evaluating travel search behaviors on the Internet. As such, it provides a basic concept of
how potential travelers may go about finding travel information online. For travel
organizations, this research has shown that search engines and travel search engines are
far and away the most common way potential travelers find their information. It would
appear as though the most effective way to reach the potential traveler would be search
engine optimization and effective marketing of travel search engine participation. For
Belgians sites, it would appear as though general search engines are more used than
travel search engines. Consumers also stand to benefit from the knowledge that use of
travel search engines could save them time over general search engines or longitudinal
browsing techniques.
Study Limitations
There were two major limitations of this study. First, small sample sizes makes
results hard to extrapolate over the general population of U.S. and Belgian students, this
however, was not the goal of the research. That said, small sample sizes make it difficult
to judge significant findings. Second, a hypothetical travel planning activity is perhaps

80
not the best way to get an accurate picture of real travel planning activities. This research
does, however, provide a starting point for such a body of literature.
Recommendations for Future Research
Eventually, it would be extremely beneficial to have a research project which
longitudinally examined actual travelers search behaviors over time. One such study was
completed fairly recently (Cothey, 2001), that study covered general online information
search, not travel and tourism information search. While this research provided a brief
look into how potential travelers find information online, a study using real travelers
would ultimately provide a more accurate picture of travel information search behaviors
online. Such a study may have more interesting findings based on travel planning
horizons when the time crunch is actual as opposed to hypothetical.

81
APPENDICES

82
Appendix A
Travel Information Searching Questionnaire
1. Do you (or did you) own or have regular access to a computer with an Internet
connection? Yes No (If no, please skip to question 3) 2. If yes, how long have you owned or had regular access to a computer with an
Internet connection? _____ Years 3. How often do you use the Internet?
a) Every day b) Several times per week c) Once a week d) Less than once a week
4. Have you used the Internet to plan a vacation before?
Yes No (If no, please skip to question 6) 5. If yes, how many times? _____ 6. How often do you use the Internet as an information search tool?
a) Every day b) Several times per week c) Once a week d) Less than once a week
7. How often do you use the Internet to search for TRAVEL information? a) Every day b) Several times per week c) Once a week d) Less than once a week
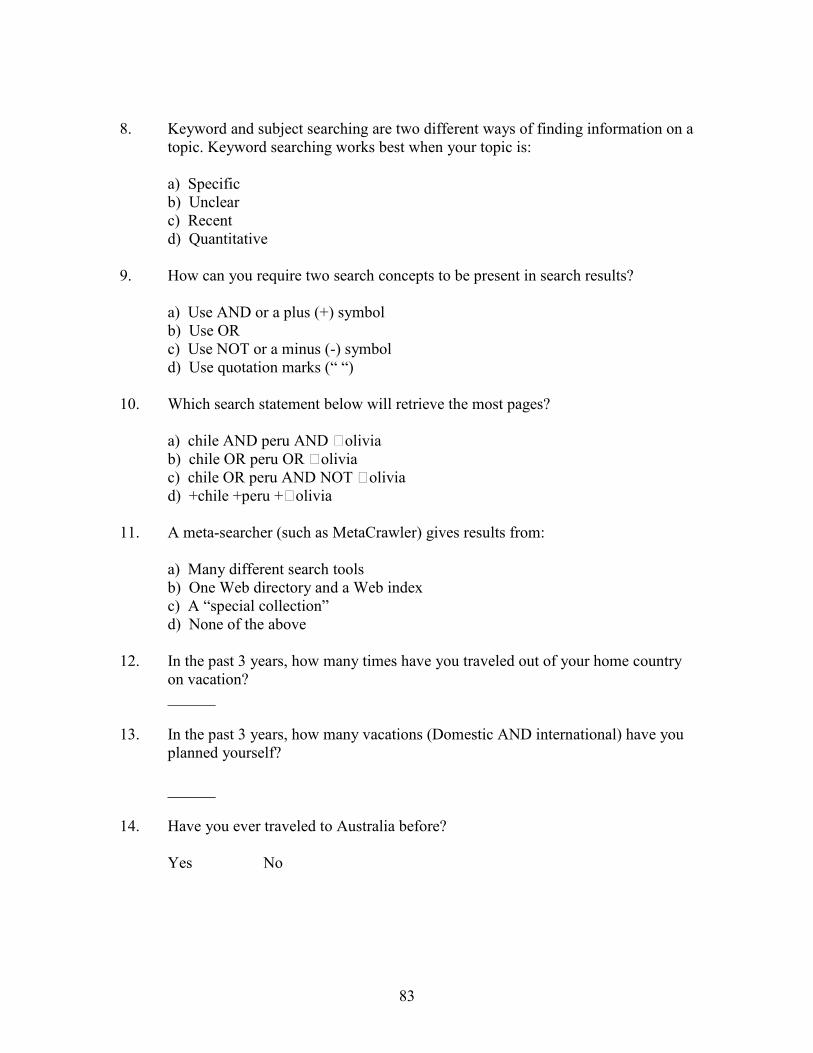
83
8. Keyword and subject searching are two different ways of finding information on a topic. Keyword searching works best when your topic is: a) Specific b) Unclear c) Recent d) Quantitative
9. How can you require two search concepts to be present in search results? a) Use AND or a plus (+) symbol b) Use OR c) Use NOT or a minus (-) symbol d) Use quotation marks (“ “)
10. Which search statement below will retrieve the most pages? a) chile AND peru AND Solivia b) chile OR peru OR Solivia c) chile OR peru AND NOT Solivia d) +chile +peru +Solivia
11. A meta-searcher (such as MetaCrawler) gives results from:
a) Many different search tools b) One Web directory and a Web index c) A “special collection” d) None of the above
12. In the past 3 years, how many times have you traveled out of your home country
on vacation? ______ 13. In the past 3 years, how many vacations (Domestic AND international) have you
planned yourself? ______ 14. Have you ever traveled to Australia before? Yes No

84
If yes, how many times
______ times 15. Please indicate the following: Age: ______ Years Sex: Male Female

85
Appendix B
Travel Information Searching Activity
For this activity, imagine that you are planning a trip to Australia. The basic framework of your vacation has been decided (5 days each in Darwin, Sydney and Cairns), but how you get there, where you stay, and what you do while you are there are completely up to you. Activities you choose may be anywhere in the general region of the destination (For example, if you were going to Clemson, an activity in Greenville would be acceptable because you can return to your accommodation in Clemson at night). Also, an activity doesn’t necessarily have to be something that costs money (For example, spending time at the beach), but if you do plan such an activity, please be sure to find and document which beach you will go to, etc. Due to the distances between destinations within Australia, an optional travel day between destinations may be used if necessary. This study aims to understand how a potential traveler searches for information on three major components of the travel process (transportation, accommodation, and activities) under several different scenarios. During the activity you are about to complete, please do your best to exhibit behavior that would be normal for you during your travel planning process. Please do all of your travel information searching using one of the web browsers provided on the desktop of the computer in front of you. Remember that you may use any type of website of your choosing, it is completely up to you. The order of you travels is also up to you, but be advised that you must find transportation between each destination as well as to and from Australia. There are only a few rules for this activity:
• You must arrive at your first destination on July 10, 2008
• Total costs are not to exceed $11,700 USD.
• In order to record a choice you must reach a web page with some type of “book” or “purchase” button. Certain activities that do not need reservations, like going to the beach, are exceptions.

86
• Please record your choices on the lines that follow. Simply write down the name and a few details (e.g. Flight number, type of room, etc.) of your selection as well as cost.
• You are finished with this activity when you have filled in each line on the following sheets of paper. The destinations are as follows:
Darwin, Northern Territory – 5 days
Date of Arrival: ___________ Date of Departure: ___________ Accommodation: ________________________________________Cost:_____________ Transportation (arrival): __________________________________Cost:_____________ Transportation (departure): ________________________________Cost:____________ Activity 1:______________________________________________Cost:_____________ Activity 2:______________________________________________Cost:_____________ Activity 3:______________________________________________Cost:_____________ Activity 4:______________________________________________Cost:_____________ Activity 5:______________________________________________Cost:_____________
Sydney, New South Wales – 5 days
Date of Arrival: ___________ Date of Departure: ___________ Accommodation: ________________________________________Cost:_____________ Transportation (arrival): __________________________________Cost:_____________

87
Transportation (departure): ________________________________Cost:____________ Activity 1:______________________________________________Cost:_____________ Activity 2:______________________________________________Cost:_____________ Activity 3:______________________________________________Cost:_____________ Activity 4:______________________________________________Cost:_____________ Activity 5:______________________________________________Cost:_____________
Cairns, Queensland – 5 days
Date of Arrival: ___________ Date of Departure: ___________ Accommodation: ________________________________________Cost:_____________ Transportation (arrival): __________________________________Cost:_____________ Transportation (departure): ________________________________Cost:____________ Activity 1:______________________________________________Cost:_____________ Activity 2:______________________________________________Cost:_____________ Activity 3:______________________________________________Cost:_____________ Activity 4:______________________________________________Cost:_____________ Activity 5:______________________________________________Cost:_____________
Thank you for participating!
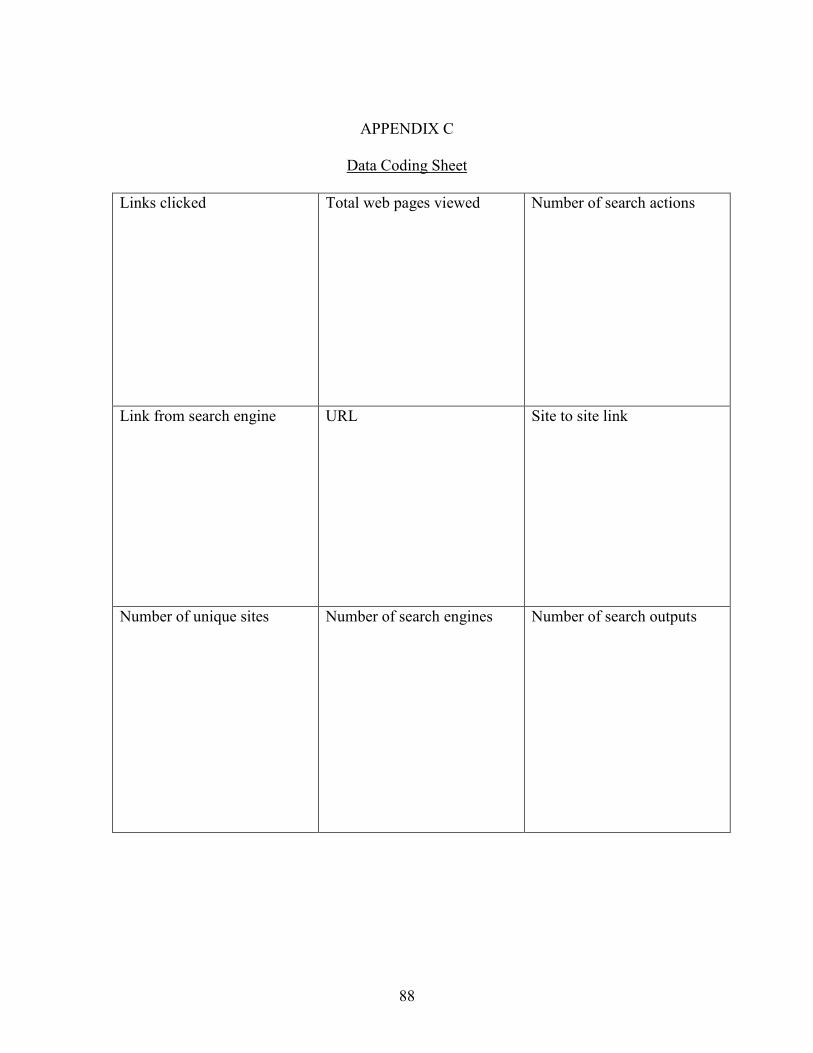
88
APPENDIX C
Data Coding Sheet
Links clicked Total web pages viewed Number of search actions
Link from search engine URL Site to site link
Number of unique sites Number of search engines Number of search outputs
89
REFERENCES
Babbie, E. (1992). The Practice of Social Research: Sixth Edition. Belmont, CA:
Wadsworth publishing company.
Boutell (2008). WWW FAQs: How many websites are there? Retrieved July 5, 2008
from: http://www.boutell.com/newfaq/misc/sizeofweb.html
Brengman, M., Geuens, M., Weijters, B., Smith, S.M., & Swinyard, W.R. (2005)
Segmenting Internet shoppers based on their Web-usage-related lifestyle:
a cross-cultural validation. Journal of Business Research, 58(1), 79-88.
Buhalis, D. (1998). Strategic use of information technologies in the tourism industry.
Tourism Management, 19(5), 409-421.
Chen, J.S. & Gursoy, D. (2000). Cross-cultural comparison of the information sources
used by first time and repeat travelers and its marketing implications. Hospitality
Management, 19, 191-203.
Claxton, J.D., Fry, J.N., & Portis, B. (1974). A taxonomy of prepurchase information
gathering patterns. Journal of Consumer Research, 1(3), 35.
Cothey, V. (2001). A longitudinal study of World Wide Web users’ information-
searching behavior. Journal of the American Society for Information Science and
Technology, 53(2), 67-78.
Denenberg, V.H. (1976) Statistics and Experimental Design for Behavioral and
Biological Researchers. Washington, DC: Hemisphere Publishing Corporation.
Fagan, J.C. (2006) Usability testing of a large, multidisciplinary library database: Basic
search and visual search. Information Technologies and Libraries, 24, 140-150

90
Fodness, D. & Murray, B. (1997). Tourist information search. Annals of Tourism
Research, 24(3), 503-523.
Fodness, D. & Murray, B. (1998) A typology of tourist information search strategies.
Journal of Travel Research, 37, 108-119.
Fodness, D. & Murray, B. (1999). A model of tourist information search behavior.
Journal of Travel Research, 37(3), 220-230.
Gitelson, R.J. & Crompton, J. (1983). The planning horizons and sources of information
used by pleasure vacationers. Journal of Travel Research, 21(3), 2-7.
Gitelson, R.J. & Perdue, R.R. (1987). Evaluating the role of state welcome centers in
disseminating travel related information in North Carolina. Journal of Travel
Research, 25, 15-19.
Gursoy, D. & McCleary, K.W. (2003). An integrative model of tourists’ information
search behavior. Annals of Tourism Research, 31(2), 353-373.
Gursoy, D. & Umbreit, W.T. (2004). Tourist information search behavior: Cross-cultural
comparison of European Union member states. Hospitality Management, 23, 55-
70.
Hodkinson, C., Kiel, G., & McColl-Kennedy, J.R. (2000). Consumer web search
behavior: Diagrammatic illustration of wayfinding on the web. International
Journal of Human-Computer Studies, 52, 805-830.
Hoffman, D.L. & Novak, T.P. (1997). A new marketing paradigm for electronic
commerce. The Information Society, 13(1), 43-54.

91
Hofstede, G. (1980). Culture’s Consequences: International differences in work-related
values. Beverly Hills, CA: SAGE Publications.
Hofstede, G. (2001). Culture’s Consequences: Comparing values, behaviors, institutions,
and organizations across nations. Thousand Oaks, CA: SAGE Publications.
Horrigan, J. (2008). Online shopping: Internet users like the convenience but worry
about the security of their financial information. Pew Internet and American Life
Project. Retrieved July 7, 2008 from,
http://www.pewinternet.org/pdfs/PIP_Online%20Shopping.pdf
Howard, D.R., Gitelson, R.J. (1989). An analysis of the differences between state
welcome center users and nonusers: A profile of Oregon vacationers. Journal of
Travel Research, 27, 38-40.
Howarth, J., Andre, T.S., & Hartson, R. (2007). A structured process for transforming
usability data into usability information. Journal of Usability Studies, 3(1), 7-23.
Hsieh-Yee, I. (2001). Research on web search behavior. Library & Information Science
Research, 23, 167-185.
Internet World Stats. (2008). The Internet big picture: world Internet users and population
statistics. Retrieved July 5, 2008 from:
http://www.internetworldstats.com/stats.htm
Jang, S. (2004). The past, present, and future research of online information search.
Journal of Travel & Tourism Marketing, 17(2/3), 41-47.

92
Jun, S.H., Vogt, C.A., & MacKay, K.J. (2007). Relationships between information search
and travel product purchase in pretrip contexts. Journal of Travel Research, 45(3),
266-274.
Kim, J., Lehto, X.Y., & Morrison, A.M. (2007). Gender differences in online travel
information search: Implications for marketing communications on the Internet.
Tourism Management, 28, 423-433.
Kline, R. B. (2004). Beyond Significance Testing: Reforming Data Analysis Methods in
Behavioral Research. Washington, DC: American Psychological Association.
Litvin, S.W., Crotts, J.C., & Hefner, F.L. (2004). Cross-cultural tourist behaviour: A
replication and extension involving Hofstede’s uncertainty avoidance dimension.
International Journal of Tourism Research, 6, 29-37.
Luo, M., Feng, R., Cai, L. A. (2004). Information search behavior and tourist
characteristics: The Internet vis-à-vis other information sources. Journal of Travel
and Tourism Marketing, 17(2), 15-25.
Moha, N., Gaffar, A., & Michel, G. (2007). Remote usability evaluation of web
interfaces. Human Computer Interaction in Web Design and Evaluation, 8, 273-
294.
Money, R.B. & Crotts, J.C. (2003). The effect of uncertainty avoidance on information
search, planning, and purchases international travel vacations. Tourism
Management, 24, 191-202.
Newman, J.W. (1977). Consumer and external search: Amounts and determinants. New
York, NY: North-Holland.

93
Netcraft, Ltd. (2008). Web server survey archives. Accessed July 5, 2008 from:
http://news.netcraft.com/archives/web_server_survey.html
O’Connor, P. (2008). Distribution channels and e-commerce. In H. Oh (ed.), Handbook
of Hospitality Marketing Management (53-71). New York, NY: Butterworth-
Heinemann.
O’Hanlon, N. (2002). Net knowledge: Performance of new college students on an
Internet skills proficiency test. Internet and Higher Education, 5(1), 55-66.
Palmer, A. & McCole, P. (2000). The role of electronic commerce in creating virtual
tourism destination marketing organizations. International Journal of
Contemporary Hospitality Management, 12(3), 198-204.
Pan, B. & Fesenmaier, D.R. (2006). Online information search: Vacation planning
process. Annals of Tourism Research, 33(3), 809-832.
Patkose, M., Stokes, A.M., Cook, S.D. (2004). Travelers use of the Internet: 2004
Edition. Travel Industry Association of America. Washington D.C.
Perdue, R.R. (1985). Segmenting state travel information inquirers by timing of the
destination decision and previous experience. Journal of Travel Research, 23, 6-
11.
Pirolli, P., & Card, S. (1999). Information foraging. Psychological Review, 106(4), 643-
675.
Snepenger, D., Meged, K., Snelling, K., & Worrall, K. (1990). Information search
strategies by destination-naive tourists. Journal of Travel Research, 29(1), 13-16.

94
Susskind, A.M., Bonn, M.A., & Dev, C.S. (2003). To look or book: An examination of
consumers’ apprehensiveness toward internet use. Journal of Travel Research,
41(3), 256-264.
Tews, J., Merritt, S. (2007). 2007 Independent travel web site satisfaction study. JD
Power and Associates. Retrieved July 3, 2008, from
http://www.jdpower.com/corporate/news/releases/pressrelease.aspx?ID=2007277.
U.S. Census Bureau. (2008). U.S. Census Bureau: E-stats. Retrieved July 7, 2008 from,
http://www.census.gov/estats.
Vogt, C. A., Fesenmaier, D. R. (1998). Expanding the functional information search
model. Annals of Tourism Research, 25(3), 551-578.
Wang, F., Head, M., & Arthur, N. (2002). E-tailing: An analysis of web impacts on the
retail market. Journal of Business Strategies, 19(1), 73-93.
Weber, K. & Roehl, W.S. (1999). Profiling people searching for and purchasing travel
products on the World Wide Web. Journal of Travel Research, 37(3), 291 – 298.