meghalaya state development report - Dr. Shreeranjan
572
-
Upload
khangminh22 -
Category
Documents
-
view
1 -
download
0
Transcript of meghalaya state development report - Dr. Shreeranjan


MEGHALAYA STATE DEVELOPMENT REPORT
2008 - 2009
Planning Department
Government of Meghalaya

HIS EXCELLENCYSHRI. R.S. MOOSHAHARYGOVERNOR OF MEGHALAYA.
May 8, 2009MESSAGE
The State Development Report of Meghalaya, prepared by thePlanning Department, Government of Meghalaya at the initiative taken bythe Planning Commission, New Delhi is the first report of its kind for theState. It has emerged at a critical moment when Meghalaya requiresrejuvenation of its energy and ideas, upgradation of the infrastructuraland human resource base and expansion of capacities. The Reportcomprehensively focuses on the vision of the desired developmentoutcomes while attempting an appraisal on the progress of implementationand achievement of the State.
It is my pleasure to acknowledge with great appreciation, theinitiative taken by the Planning Commission in having State DevelopmentReports of all States in the country. Such Reports tend to have a widerperspective and consistently stress on inter linkages of States in realizationof development goals and thereby strengthen the cause of nation building.
The present effort achieves this objective admirably and Icongratulate the Planning Department and the team of contributors forcarrying out this exercise with commendable enthusiasm and devotion.This experience has encouraged us to move to the next phase of preparing“District Development Reports” in the spirit of involving people’sparticipation in development at the grass roots level.
(R.S. MOOSHAHARY)

Dr. D. D. LAPANGChief MinisterMEGHALAYA
May 13, 2009
MESSAGE
The State Development Report of Meghalaya, prepared by the Planning Department,Government of Meghalaya at the initiative of the Planning Commission, New Delhi is an in-house endeavour and has come at the appropriate time. It is the first report of its kind forthe State for which all involved must be commended for their sincerity and dedication.TheReport comprehensively provides an appraisal on the progress of implementation andachievement of the State as well as on the development issues of the State in a purposefulmanner.
I hope that the Meghalaya State Development Report which has highlighted criticalissues will help the State Government take a close look at the problems which have hinderedthe realization of optimum growth and socio-economic development of the State. The Reportrightly underlines the urgent need for enhancing the State’s growth rate to bring it at parwith the national average. It also points out the emphasis required in addressing disparities.
The Report also provides a snapshot of people’s aspirations and gives a road mapwhich could be expanded and refined as the State’s vision for future.
I congratulate the Planning Department, the Chief Co-ordinator and the Co-ordinatorfor carrying this mission with exemplary zeal. I look forward to Meghalaya attaining thehigh level of prosperity and human welfare which will follow in the wake of its realizing itstrue potential.
(Dr. D.D. Lapang)

SHRI. RANJAN CHATTERJEE, IASCHIEF SECRETARY,MEGHALAYA.
May 8, 2009MESSAGE
The State Development Report of Meghalaya, prepared by the PlanningDepartment, Government of Meghalaya at the behest of the PlanningCommission, New Delhi is the first development report of the State reflectingan indicative status on development, infrastructure and socio-economicparameters. The Report is an attempt to set out the policy action that wouldbe essential to achieve the desired goals.
The Meghalaya State Development Report has highlighted critical issuesand recommendations for the State, which will help the State Government todesign the road map towards optimum growth and overall socio-economicdevelopment in the State. The Report highlights the immediate need ofimproving the growth rate of the State and of bridging the gaps and disparitiesthat exists in the State.
I congratulate the Planning Department, and in particular, Dr.Shreeranjan,IAS and Shri G. Mawrie for the painstaking and arduous effortsin finalization of the first ever State Development Report of Meghalaya. I amsure such a good beginning will further be improved upon when later reportscompare the situation at regular intervals. It is sincerely hoped that deficienciesin development would be overcome by honest actions. I look forward to abetter quality of life for the people of Meghalaya and dedicate this report tothe cause of Development in the State.
(R.CHATTERJEE)

SHRI. BARKOS WARJRI, IASPRINCIPAL SECRETARY,PLANNING DEPARTMENTMEGHALAYA.
May 8, 2009FOREWORD
In order to address the development concerns of the State Governments andto provide information on the current status of development and at the same timegiving possible options, the Planning Commission decided to have State DevelopmentReports prepared which would serve as credible documents to help set the agendafor planning, development and economic growth of States. This was aimed at fosteringa sense of partnership between the Centre and the States and to jointly assess thedevelopment strategies with the presently available financial, human, and materialresources. This exercise has also defined issues related to governance and policy optionstowards providing a better quality of life.
This Report is mainly an in-house effort of the Planning Department and otherdepartments of the State Government. The Report is largely based on secondaryresources, on received wisdom and on policy consultations/deliberations. It alsoreflects an observer’s macro-view on the state of development and has expressedopinion in a frank manner. I commend Dr. Shreeranjan and Shri. G. Mawrie in particularand all the principal contributors for their collective effort on this Report.
I hope that the Meghalaya State Development Report, which has highlightedcritical issues for the State, will not only encourage debate regarding the road mapfor the State but will also enable the State Government to take a closer look at theproblems facing it and to work towards optimum growth and socio-economicdevelopment.
I look forward to Meghalaya attaining a higher level of prosperity, justice andhuman welfare, which will follow in the wake of it realizing its true potential. Thisbeing the first in-house effort, further comments on its improvement is welcomed.

Chief Co-ordinator and Editor’s note
Dr. Shreeranjan, IASFormer-Commissioner & Secretary
Government of Meghalaya
Development is continuous and evolutionary process which aims at realising thefull potential of individuals in the context of a society, region or country. It encompassesand denotes the range and diversity of social, economic, cultural, political and eco-spatialdimensions with particular reference to meaning systems, symbols, and beliefs concerningthe ultimate meaning of life and history in the given context. In the pursuit of developmentalgoals, the social ingredients are measured as well-being in health, education, housing andemployment etc; the economic component deals with creation of wealth and improvedconditions of material life that are intertwined with equitable distribution and inclusive growth;the political dimension includes such values as human rights, political freedom,empowerment, and participation with some form of functional democracy and underlyingcommitment to ecological soundness and sustainability.
Problems in real life for the majority are the issues of food security and basicneeds, of poverty mitigation, shelter, health, true education, which enables decent livingconditions and livelihood options. For the vast majority of people in a rural setting, traditionalway of life is far from a commercialised approach in which the hill specificity and ethnicway of life is intricately linked to the local environment and context.
Thus, the role of government remains central for policy and enabling space for itspeople to grow in harmony in society and with nature. However, in the democratic set up,there are informal and formal interactions among institutions, pressure groups andorganisations forming an interactive and interesting matrix. Such a matrix at various levelscontributes to or constraints the dynamics of development.
Profiling the Status of development through the format of State Development Reportis aimed to indicate and understand the developmental efforts and direction of varioussectors over the years. The Meghalaya State Development Report is a uniqueexperiment of in-house and in-state resource persons with copious references from varioussecondary sources. The Report has also benefited from earlier efforts of the externalagency which could not match expectations and from comments and suggestions of many

illustrious academicians and administrators. Any developmental profile is never perfectand complete as it may miss-out on macro-, micro-issues.
The Report is a collective effort to provide a credible independent quality referencedocument on the developmental profile, limitations, and strategies for accelerating thegrowth rate of the State with an aim to lessen disparities and reduce poverty. This SDRhas also attempted to discuss the constraints and challenges faced by the State, providea snapshot of vision, blueprint or a roadmap for its socio-economic progress. This effort,the first of its kind for the state, may be seen from the perspective of scope for improvementin future efforts.
Development efforts call for a continued analysis, understanding and a continuedlearning as well as for taking corrective steps. ‘An intellectually alive, vibrant and vigilantsociety of which enlightened government machinery is a responsive and responsiblepart, can be an effective cushion to current developmental efforts and trends where therich and more powerful in society is not allowed to reallocate and usurp the natural andother resources in their favour and where modern technology does not become a tool tosub-serve disparity promoting processes’.
We dedicate this to the people of the state and the country.
(Shreeranjan)

ACKNOWLEDGEMENTS
The Planning Commission decided to prepare “State Development Report” (SDR)in respect of Meghalaya during 2003-04 to focus on the status of development and desiredoutcomes to have a medium term perspective for the State. The Report was to define notmerely inputs, physical or financial, but to set out the policy action that would be required toachieve the desired outcomes.
Initially, the task for preparation of the State Development Report for Meghalaya wasentrusted to the TATA Consultancy Services (TCS) Ltd., New Delhi by the PlanningCommission, Government of India. The active involvement of Former Chief Secretary,Shri P.J. Bazeley, IAS (Retd.) and Shri S.K. Tiwari, IAS (Retd.) and senior functionaries inGovernment as well as leadership such as Shri A.H. Scott Lyngdoh, (Late) Prof. B. DuttaRay and several others in public life whose names have not been mentioned individuallyhad contributed immensely in deliberations on draft reports. The meeting under theChairmanship of the Chief Minister, Dr. D.D. Lapang after due consultation decided to makeanother attempt on improvement of the report. But their presentations of the facts andfigures in the Draft SDR as well as the Revised Draft SDR during 2006 and 2007 respectivelywere not accepted by the State Government as it was not commensurate to the factualposition of the State. The draft report of TCS was found to have glaring inadequacies andincorrect representation of facts and figures. Besides, the TCS showed lack of interest inimproving the draft and carry it forward. In the compelling circumstances, the StateGovernment in the Planning Department had to take upon itself the task of preparing theSDR in-house.
As such, a chapterised report was circulated during September, 2008 to a panel ofexperts and academicians for pre-review and for inputs and suggestions toward finalizationof the SDR within November, 2008 as the target date. However, due to pre-occupations andother circumstances of the identified panel of experts and academicians, there have beenunavoidable delays in receiving the Inputs and comments.
The Meghalaya State Development Report would have not come out in this finalform without the constant encouragement of Shri Ranjan Chatterjee, IAS, Chief Secretary,Government of Meghalaya who has the best interest of development of the State in mindand heart. The constant guidance and involvement of Shri Barkos Warjri, IAS, PrincipalSecretary, Planning is gratefully acknowledged whose valuable insight and inputs were agreat support in the finalization of the Report. In this task of finalizing the State DevelopmentReport, guidance, encouragement and support of Planning Commission especially the StatePlan Adviser(NE), Smti. Jayati Chandra, IAS and Director, State Plan, Shri Sarvan Kumarhas been praise worthy.

The painstaking efforts, keen interest, and devotion of Dr. Shreeranjan, IAS towardscoordinating the finalization of the Report has been reflection of exceptional qualities ofleadership and coordination. He, being an acclaimed author and development administratorhimself, has provided significant inputs to several chapters and has also edited the entirereport. His contribution in the matter will always be remembered. Active support ofShri H.B. Dkhar, Secretary, Planning Department, Shri. Robert Lyngdoh, Research Officer,other Officers and Staffs of Planning Department also deserve special mention.
Academicians from the North Eastern Hill University (NEHU), Officials from variousDepartments concerned of the Government of Meghalaya, and others have provided usefulcomments and inputs in respect of different chapters. Their active cooperation in providingnecessary data and information is gratefully acknowledged.
The Planning Department, Directorate of Programme Implementation & Evaluationand the Directorate of Economics & Statistics provided efficient logistic and content support,as well as information and statistical database involved in preparation of the report. Thedeliberations of the Meghalaya State Planning Board and presentations of several otherDepartments in the Think-Tank sessions has also been incorporated in the Report.
G. MawrieCoordinator
Meghalaya State Development Report, 2008-09& on behalf of the Planning Department,
Government of Meghalaya.

Chief Coordinator & Editor : Dr. Shreeranjan,IAS
Coordinator : Shri G. MawriePrincipal Contributors:
Chapter -1: Introducti onDr. ShreeranjanShri. G.Mawrie
Chapter -2: Historical Perspecti ve Dr. ShreeranjanShri. G.MawrieSmti . Wanri Booth
Chapter – 3:Development and Management of Natural Re-sources
Dr. ShreeranjanDr. S.K. BarikShri. K.L.Tariang
Chapter – 4: Finances of the State Shri. G.Mawrie
Chapter – 5: Economic Growth and Structural Change
Shri. A. Marbaniang Shri. S.S. MawlongShri. L.M. SyiemliehShri. V. E. IawphniawShri. G.Mawrie
Chapter -6: Infrastructure Development Dr. Shreeranjan
Chapter – 7: Rural DevelopmentDr. ShreeranjanShri. S. LyngdohShri. G.Mawrie
Chapter – 8: Urban DevelopmentShri. B. Dutt aShri. B.K. Panda
Chapter – 9: Development of Agriculture & Allied SectorsDr. ShreeranjanDr. R. B. DympepDr. E. Bareh
Chapter – 10: Trade and Industrial Development
Dr. ShreeranjanShri D.K. ArengShri W. WarshnongShri. G.Mawrie
Chapter – 11: Social SectorDr. Veronica PalaDr. Shreeranjan
Chapter – 12: Labour and Employment Dr. Veronica Pala
Chapter – 13: Review and Looking Forward
Dr. ShreeranjanShri. Robert LyngdohShri. G. MawrieShri. Sarvan Kumar
Comments & Inputs: Shri H.B. Dkhar, Dr. Nageshwar Rao, Dr. Helen Giri, Prof. B.K. Tiwari, Prof. P. Naik, Shri. Daniel Ingty, Prof. Nikhilesh Kumar, Prof. L. Gassah, Dr. A.K. Nongkynrih, Dr. N. Srivastava, Shri. Toki Blah, Shri. R.G. Lyngdoh, Shri T. Basaiawmoit Shri P.S. Nianglang, Dr. S. Umdor, Dr. C.O. Rangad, Shri. R.R. Bang, Shri. B. Ch. Hajong, Meghalaya State Planning Board, Programme Implementati on and Evaluati on Department, Directorate of Mineral Resources, Directorate of Economics & Stati sti cs
Computer support & Layouts: Shri. G. Mawrie, Shri. B.D.G. Lyngdoh, Shri. A. Syiem
i

Background of Principal Contributors
Name Designati on
Dr. Shreeranjan, IAS Commissioner & Secretary to the Government of Meghalaya
Shri. G. Mawrie Planning Offi cer, Planning Department, Govt. of Meghalaya
Smti . Wanri BoothDeputy Secretary, Forest & Environment Department,
Govt. of Meghalaya
Dr. S.K. Barik Deptt . of Botany, NEHU.
Shri. K.L.Tariang, IASSecretary, Social Welfare &Mission Director, Rain Water Harvesti ng
Mission, Govt. of Meghalaya.
Shri. A. Marbaniang Director, Economic & Stati sti cs, Govt. of Meghalaya
Shri. S.S. Mawlong Joint Director, Economic & Stati sti cs, Govt. of Meghalaya
Shri. V. E. Iawphniaw Deputy Director, Economic & Stati sti cs, Govt. of Meghalaya
Shri. L.M. Syiemlieh Research Offi cer, Economic & Stati sti cs, Govt. of Meghalaya
Shri. S. LyngdohDeputy Director, Programme Implementati on & Evaluati on, Govt. of
Meghalaya
Shri. B. Dutt a Director, Urban Aff airs, Govt. of Meghalaya
Shri. B.K. PandaDirector, Meghalaya Urban Development Agency, Govt. of Megha-
laya
Dr. R. B. Dympep Joint Director (Planning), Agriculture, Govt. of Meghalaya.
Dr. E. BarehDeputy Director (Planning), Animal Husbandry & Veterinary, Govt. of
Meghalaya.
Shri D.K. Areng Director, Industries, Govt. of Meghalaya
Shri W. Warshnong Assistant Director, Industries, Govt. of Meghalaya
Dr. Veronica Pala Department of Basic Sciences & Social Sciences, NEHU.
Shri. Robert Lyngdoh Research Offi cer, Planning Department, Govt. of Meghalaya
Shri. Sarvan Kumar Director(SP), Planning Commission, Govt. of India
ii

Background of Principal Contributors
Name Designati on
Dr. Nageshwar Rao Director, NEISAC
Dr. Helen Giri Former Head, Centre for Cultural & Creati ve Studies, NEHU
Prof. B.K. Tiwari Dean, School of Human and Environmental Sciences, NEHU.
Prof. P. Naik Head, Deptt . of Economics, NEHU.
Shri. Daniel Ingty Project Director, Meghalaya Rural Development Society.
Prof. L. Gassah Deptt . of Politi cal Science, NEHU.
Dr. A.K. Nongkynrih Deptt . of Sociology, NEHU.
Dr. N. SrivastavaDean, School of Economics, Management & Informati on Sciences, NEHU.
Prof. Nikhilesh Kumar Deptt . of Sociology, NEHU.
Shri. Toki Blah Social Acti vist and President, Shillong ICare.
Shri. R.G. LyngdohFormer Minister & CEO, Social Venture Capital Company, Megha-laya Rural Development Society.
Dr. S. Umdor Deptt . of Economics, NEHU.
Dr. C.O. Rangad Director, Horti culture, Govt. of Meghalaya
Shri. R.R. Bang Joint Director, Sericulture, Govt. of Meghalaya
Shri. B. Ch. Hajong Joint Director, Weaving, Govt. of Meghalaya
Shri. H.B. Dkhar Secretary, Planning Department, Govt. of Meghalaya.
Smti . C. Langsti eh Deputy Secretary, Planning Department, Govt. of Meghalaya.
Shri. T. Basaiawmoit Planning Offi cer, Planning Department, Govt. of Meghalaya.
Shri. Robert Lyngdoh Research Offi cer, Planning Department, Govt. of Meghalaya.
Shri. P.S. Nianglang Research Offi cer, Planning Department, Govt. of Meghalaya.
iii

MEGHALAYA STATE DEVELOPMENT REPORTMEGHALAYA STATE DEVELOPMENT REPORT
TABLE OF CONTENTS
CHAPTER – I : INTRODUCTION Meghalaya – A Profi le
1.1. General Informati on On Locati on, Populati on, Politi cal Administrati on And Economy 1-4
1.2. Some Unique Socio Economic Features Of The North Eastern Region And Of Meghalaya 4-6
1.3. Perceived Problems By People In The Region/State 6-71.4. Problems: Other Added Dimensions In Meghalaya 7-81.5. Trends In Populati on Growth 8-91.6. Development Status 9-101.6.1. Growth Rate 91.6.2. Socio – Economic Indicators 9-101.6.3. Poverty Scenario 101.7 SUMMING UP 10
CHAPTER – II : A HISTORICAL PERSPECTIVE2.1. Historical Backdrop 11 (a) Khasi & Jainti a 11-12 (b) The Garos 122.2. Prelude to the State 12-142.2.1. Birth of a State 152.3. Traditi onal Socio- Politi cal Systems in Meghalaya 15-162.4. Land Tenure System in Meghalaya 162.4.1 In the Garo Hills area, 162.4.2 In the Khasi Hills area 16-172.4.3 In the Jainti a Hills 172.5 VIth Schedule of Consti tuti on and Autonomous District Council. 19-232.6 The Planning organizati on and machinery of the State 242.6.1 Block Development and Monitoring Committ ee (BDMC) 24-252.6.2. The Backward Regions Grant Fund 252.6.3 The Border Area Development Programme (BADP) 252.6.4. Planning in respect of Agricultural 25-262.7 Other master plans 26 (a) Agriculture Planning and Informati on Bank (APIB) 26-27 (b)Various Sectoral Meeti ng of NEC & DONER 27 Summary and Conclusion 27-28
CHAPTER – III : DEVELOPMENT AND MANAGEMENT OF NATURAL RESOURCES3.0. Natural Resources 293.1. Soils 29-303.2. Water Resources 303.3. Biodiversity 31
v

MEGHALAYA STATE DEVELOPMENT REPORTMEGHALAYA STATE DEVELOPMENT REPORT
3.3.1. Forests 313.3.2. Forest Types 323.3.3 Tropical Forests 323.3.4. Temperate Forests 333.3.5 Grasslands and Savannas 333.3.6. Sacred Groves 33-343.3.7. Recorded Forest Area 34-363.3.8. Forest and Tree Cover 373.3.9. Change in Forest Cover 37-383.3.10. Nati onal Parks and Wildlife Sanctuaries 38-393.3.11. Flora 403.3.12. Fauna 40-423.4 Medicinal Plants 42-433.5. Prioriti zed Medicinal Plants of Meghalaya 43-443.6. Developing Medicinal Plant Sector in the State 44-463.7. Major Threats to Biodiversity in Meghalaya 46-493.8. Mineral Resources 493.8.1. Introducti on 493.8.2. Mineral Resources Occurring in the State 49-543.9. Revenue Receipts from Major Minerals 54-553.10. Some Issues Related to Mining 55-563.11. Impediments to Development and Management of Mineral Resources 56-573.12. Role of Women in the Management of Natural Resources 583.12.1. Watershed Management 583.12.2. Forest Management 583.12.3. Non-renewable Resource Management 583.12.4. Organic Farming 58-593.12.5. Medicinal Plants 593.13. Conclusions and Recommendati ons 593.13.1. Minerals 59-603.13.2. Women’s role in Natural Resource Management 603.13.3. Water Resources 603.13.4. Biodiversity 603.13.5. Development of Medicinal Plants 61-653.13.6. Insti tuti onal linkages and technology input 65-663.13.7. An Integrated and Holisti c Framework of Natural Resource
Management in Meghalaya 66-67
CHAPTER – IV : FINANCES OF THE STATE GOVERNMENT4.1. Structure of Government Accounts 694.1.1. Summary of Receipts and Disbursements 69-704.1.2 . Fiscal Positi on by Key Indicators 714.2. Methodology adopted for assessment of Fiscal Positi on 71-724.2.1. The Fiscal Responsibility and Budget Management Act 72-734.2.1.1. Roadmap to Achieve the Fiscal Targets as laid down
in FRBM Act/Rules 73
vi

MEGHALAYA STATE DEVELOPMENT REPORTMEGHALAYA STATE DEVELOPMENT REPORT
4.2.1.2. Fiscal Performance 73-744.3. Trends and Compositi on of Aggregate Receipts 744.3.1. Revenue Receipt 74-774.3.2 . Revenue Arrears 784.4 . Applicati on of Resources 784.4.1. Growth of Expenditure 78-794.4.2. Trends in Total Expenditure by Acti viti es 79-804.4.3. Incidence of Revenue expenditure 80-814.4.4. Committ ed Expenditure on Salaries and Wages 814.4.5. Pension Payments 81-824.4.6. Interest Payments 82-834.4.7. Subsidies 834.5. Expenditure by Allocati ve Prioriti es 834.5.1. Quality of Expenditure 83-844.5.2. Expenditure on Social Services 84-864.5.3. Expenditure on Economic Services 86-884.5.4. Financial Assistance to Local Bodies and other Insti tuti ons 88-894.6. Assets and Liabiliti es 894.6.1. Financial Analysis of Government Investments 894.6.1.1. Incomplete Projects 894.6.1.2. Government Investments and Returns 89-904.6.1.3. Loans and Advances by State Government 90-914.6.2. Management of Cash Balances 914.7. Undischarged Liabiliti es 924.7.1. Fiscal Liabiliti es - Public Debt and Guarantees 92-934.7.2. Status of Guarantees - Conti ngent Liabiliti es 934.8. Debt Sustainability 93-944.8.1. Debt Stabilisati on 944.8.2. Suffi ciency of Non-debt Receipts 954.8.3. Net Availability of Borrowed Funds 95-964.9. Management of Defi cits 964.9.1. Trends in Defi cits 96-974.9.2. Quality of Defi cit/Surplus 984.10. Fiscal Rati os 98-1004.11. Conclusion 100-101
CHAPTER – V: ECONOMIC GROWTH & STRUCTURAL CHANGE5.1 Introducti on: 1035.2 Growth and Sectoral Distributi on of Net State Domesti c Product
(NSDP) and Gross State Domesti c Product (GSDP) 1045.2.1 Growth of NSDP 1045.2.2. Sector-wise distributi on NSDP 1045.2.3 Sectoral Compositi on of NSDP 105-1065.2.4 Growth of GSDP 106-1075.2.5 Sector-wise Distributi on of GSDP 107-1085.2.6 Poverty Scenario 108-110
i

MEGHALAYA STATE DEVELOPMENT REPORTMEGHALAYA STATE DEVELOPMENT REPORT
5.2.7 Per Capita NSDP 110-1115.3 Growth Prospects 111-1135.4 General Development Indicators. 1135.4.1 Food grain producti on 1135.4.2 Industrializati on 113-1145.4.3 Unemployment 1145.4.4 Investment of State PSUs by State 114-1155.4.5 Disbursement of Financial Assistance by all fi nancial insti tuti ons 1155.4.6 Administrati ve Overhead Costs. 1155.5 Investment Opportuniti es and Openings. 115-1165.5.1 Mineral Based Industry. 1165.5.2 Horti culture & Agro Based Industries. 116-1175.5.3 Power Generati on. 1175.5.4 Export Promoti on Industrial Park (EPIP) 1175.5.5 Synergy with Central Government Departments and Other Agencies. 1175.6 Guiding principles for public acti on 117-1205.7. Recommendati ons 120-1215.8 Conclusion 122
CHAPTER - VI : STATE OF INFRASTRUCTURE IN MEGHALAYA6.1 Introducti on 125-1266.2 Infrastructural faciliti es in Northeastern States and in Meghalaya 126-1276.3. Comparati ve Status of Meghalaya’s Infrastructure 127-1296.4 A brief write up on the important aspects of infrastructure is as below 1296.4.1. Power 1296.4.2 Generati on 129-1326.4.3 Transmission 132-1396.4.4 100% Village & Household Electrifi cati on by 2012 139-1426.4.5 T & D Losses and Road map Ahead 1426.4.6 New and Renewable Sources of Energy 142-1456.5 TRANSPORT 1456.5. a Roads And Bridges 145-1526.5. b Railways 152-1536.5. c Air Transport 1536.6 Tourism 153-1546.7 Social Infrastructure 154-1556.8 Border Trade Infrastructure 1566.8.1 Land Custom Stati ons (LCSs) in Meghalaya 156-1606.9 Communicati on 1606.9.a Telecommunicati on 160-1626.9.b IT Infrastructure 162-1646.9.c Postal Infrastructure 164-1656.10 Irrigati on 165-1666.11 Bio resources related Infrastructure 1666.12. BANKING 166-168
vii

MEGHALAYA STATE DEVELOPMENT REPORTMEGHALAYA STATE DEVELOPMENT REPORT
6.13. Status of rural infrastructure in Meghalaya - A fi eld survey 168-1696.14 Infrastructure Index 169-1716.15 Conclusion & Recommendati on 171
CHAPTER –VII: RURAL DEVELOPMENT IN MEGHALAYA7.0. Development in the Rural Sector 1737.1. Current level of development – some key indicators 1737.1.1 Agriculture 174-1757.1.2. Road Connecti vity 175-1787.1.3. Quality of housing 178-1817.1.4.A. Supply of drinking water by source and locati on 181-1827.1.4.B. Sustainability of drinking water supply sources and systems 182-1857.1.5. Availability of latrine faciliti es 186-1887.1.6 Electricity Connecti on 188-1927.2. Rural Income/Employment/ Livelihoods 193-2037.3. Livelihoods Improvement Project for the Himalayas (LIPH) 203-2047.4. Integrated Child Development Services (ICDS) 204-2057.5. Nutriti on and Health Educati on 2057.6. Nati onal Nutriti on Mission/Nutriti on Programme for
Adolescent Girls (NPAG) 205-2067.7 Border Areas of Meghalaya 206-2087.8. Conclusions and recommendati ons 208-210
CHAPTER VIII : URBAN DEVELOPMENT8.1 Introducti on 2118.2 Urban sett lement and its growth in the State 211-2128.3 Urban Populati on 212-2138.4 Urban Management and Service Delivery 2138.5 Urban Infrastructure 213-2188.6 Urban Poverty 2188.7 Programme and Plans 218-2218.8 Issues and Recommendati ons 221-2258.9 Annexure 225-230
CHAPTER – IX : DEVELOPMENT OF AGRICULTURE & ALLIED SECTORS9 Introducti on 231-2349.1 Climate 2349.2 Agro-climati c zones and sub-zones in the State 234-2359.3 Characteristi c features of agriculture in the State 2359.3.1 Low net cropped area 235-2369.3.2 Land holding patt ern and size of holdings 2369.3.3 Foodgrain Producti on 236-2389.4 Major crops in Meghalaya 2389.4.1 Food Grains 238-2399.4.2 Oilseeds 239-2409.4.3 Fibre Crops 240
viii

MEGHALAYA STATE DEVELOPMENT REPORTMEGHALAYA STATE DEVELOPMENT REPORT
9.4.4 Other crops 240-2429.5 Use of Agricultural Inputs 242-2439.6 Technology 243-2469.7 Constraints in agriculture development 246-2489.8 Agricultural Credit 248-2499.9 Agricultural Marketi ng 249-2519.9.1 Signifi cance of horti culture in the State 251-2529.9.2 Major horti culture crops in the State 252-2579.9.3 Infrastructure for processing and marketi ng 2579.9.4 Constraints in horti culture development 257-2589.10 Fisheries 2589.10.1 Background of fi sheries in the State 2599.10.2 Potenti al for growth of fi sheries in the State 2609.10.3 Fish producti on and demand in the State 260-2619.10.4 Demand and supply for fi sh seed in the State 2619.10.5 Infrastructure for Storage, Distributi on and Marketi ng of fi sh in the State 2619.10.6 Progress of programs and Schemes 261-2629.10.7 Constraints in fi shery development 262-2649.11 Animal Husbandry and Dairy Development 264-2659.11.1 Infrastructure for Animal health 2669.11.2 Catt le development – Dairy 266-2679.11.3 Catt le Livestock 267-2689.11.4 Milk producti on and trends in growth 2689.11.5 Dairy Development Programs in the State and their progress 2689.12 Problems in the Dairy Development Sector 268-2699.13 Catt le development for meat 2699.14 Piggery 2709.15 Livestock and meat producti on 2709.16 Infrastructure for piggery development 2709.16.1 Research and development eff orts 270-2719.16.2 Schemes for promoti on of Piggery 2719.17 Goat and Sheep rearing 2729.18 Poultry 272-2739.18.1 Research and development eff orts in poultry 273-2749.19 Support infrastructure 2749.19.1 Faciliti es for provision of animal nutriti on 2749.19.2 Government farms and other Infrastructure 2749.19.3 Vocati onal training and other programs 2749.20 Strategy 274-2759.21 Summary and Conclusions 275-2769.22. Co-operati ves in Meghalaya 276-2779.23. RASHTRIYA KRISHI VIKAS YOJANA (RKVY) 277-2789.24. Main suggesti ons on Agriculture and Allied Sectors in
the sectoral summit of NEC has been 278-2799.25 Building upon the strength 279-280
ix

MEGHALAYA STATE DEVELOPMENT REPORTMEGHALAYA STATE DEVELOPMENT REPORT
9.26 State Planning Board 2809.27 Summary & Conclusion 281
CHAPTER-X :INDUSTRIAL DEVELOPMENT10.1 Introducti on 28710.2. Resources of Meghalaya 287-28810.3.1 Status of Industrial development in the State 288-29110.3.2 Rural/Urban Distributi on of Enterprises in Industrial Sector 29110.3.3. Share of Industry in Net State Domesti c Product (NSDP) 292-29310.3.4 Growth of industrial sector 293-29410.4 Sector-wise Distributi on of Manufacturing Industry 295-29910.5 Small Scale Industries 299-30010.6. Promoti onal Policies of Government of India for Non-Farm Sector 30110.6.1 Industrializati on 30110.6.2 Rural Industrializati on 30110.6.3 Khadi and Village Industries 301-30210.7.1 Availability of Insti tuti onal Credit 30210.7.2. Micro Credit and SHGs 302-30410.8. Marketi ng 30410.9. Cluster Development and Growth Poles 304-30510.10. Self-Employment Programme 30510.11. Department of Industries and Status of Schemes 305-30610.12. Prime Minister’s Employment Generati on Programme 306-30810.13. Technology Mission for Integrated Development Of Horti culture 308-30910.14. State Government Corporati ons under Industry department 309-31110.15. Sericulture and Weaving 311-31510.16. Industrial Co-operati ves in Meghalaya 31510.16.1 Central Assistance to States for Developing Export
Infrastructure (ASIDE) 315-31610.17. Trade with Bangladesh 317-31910.18 Land Custom Stati ons (LCSs) 319-32010.19 Problems of the LCSs 32010.20. Reasons for Weak Resource Industry Linkage in the State 321-32310.21. Potenti al areas for investments 323-32410.22. Future Plan for Next 4 Years (11th Plan) 32410.23. Observati ons 324-327
CHAPTER-XI : SOCIAL SECTOR11.1 Introducti on 34711.2. Health 34711.2.1. Public Sector Health Infrastructure 347-34911.2.2 Private Sector Health Infrastructure 35011.2.3 Central Government Health Insti tuti ons 350-35111.2.4 Problems and constraints of health sector in Meghalaya 35111.2.5 Human Resources for Health Services 352
x

MEGHALAYA STATE DEVELOPMENT REPORTMEGHALAYA STATE DEVELOPMENT REPORT
11.2.6 Public Expenditure on Health Sector in Meghalaya 353-35411.2.7 Health Indicators in Meghalaya 354-35511.2.8 Health Programmes 355-35911.2.9 Looking Ahead 359-36011.2.10 Observati ons and Recommendati ons of the State Planning Board 36111.3. Educati on 36111.3.1 General Educati on 361-36811.4. Sports & Youth Services 36811.5. Arts & Culture 368-36911.6 Social Welfare 369-37411.7. Labour & Employment 374-37511.8 The Human Development Index 375-37911.8.1. Health 379-38311.8.2. Educati on 383-388 11.8.3 Poverty 389-39311.8.4 Gender Related Issues 393-39511.9 Conclusion 395-396
CHAPTER XII : LABOUR AND EMPLOYMENT
12.1 Work Force parti cipati on Rate 397-40312.2 Industrial classifi cati on of workers 403-40612.3 Child Labour 406-40812.4 Unemployment 408-41412.5 Summary and Some Suggesti ons for Employment Generati on 415-417
CHAPTER – XIII :REVIEW AND LOOKING FORWARD13.1 Tenth Plan Review 41913.2. Investment patt ern during the Tenth Plan 419-42013.3. Gross Domesti c Product/ Net State Domesti c Product 42013.4 420-42113.5. Socio Economic Indicators 42213.6. A. The Status of Human Development in Meghalaya 422-42313.6. B. The Status of Human Development in Meghalaya:
Inter District Variati ons 423-42413.7. Infrastructure 424-42613.8. Eleventh Five Year Plan (2007-2012) 426-42713.9. Performance in physical terms during the Tenth Plan and
targets for the Eleventh Plan 427-42913.10. Monitorable targets during the Eleventh Plan 42913.11. Annual Plan allocati ons 429-43013. 12. Leveraging funds from other sources 43013. 13. Flagship Programmes & Bharat Nirman 43013. 14. The Vision 2020 document of the NEC has identi fi ed fi ve basic defi cits 43113.15 431
xi
MEGHALAYA STATE DEVELOPMENT REPORTMEGHALAYA STATE DEVELOPMENT REPORT
13.16. Various study of IFIs projects in the NER indicate following concerns 43113.17. The 11th Plan document of the Planning Commission highlights the
following criti cal parameters for growth of the North Eastern Region 43213.18. A parti cipatory approach for Winds of change, hope for renewal 432-43713.19. Challenges, Strategies and Way Forward for Development 437-45913.20. Road-map of Development 459-46113.21. Policy cluster for public acti on 462-46313.22. Summary and Conclusion 463-46713.23. Appendix 468-472 MISSION FOR MEGHALAYA PROSPERITY (ADDRESS OF
HIS EXELENCY Dr. A.P.J. ABDUL KALAM AT THE MEMBERS OF THE MEGHALAYA LEGISLATIVE ASSEMBLY ON 16-03-2007) 473-492
BIBLIOGRAPHY 493-500
xii

MEGHALAYA STATE DEVELOPMENT REPORTMEGHALAYA STATE DEVELOPMENT REPORT
LIST OF TABLES
Table 1.1 Administrati ve Districts in Meghalaya
Table 1.2: Trends in Populati on Growth in Meghalaya
Table 3.1 Land Use Patt ern
Table 3.2 District Wise classifi cati on of forests
Table 3.3 Classifi cati on of Forest (Source: SFR 2005)
Table 3.4 Forest cover change matrix
Table 3.5 District Wise forest cover
Table 3.6 Change in forest cover
Table 3.7 Forest Cover 2001 Assessment (SFR 2005)
Table 3.8 Forest Cover Change – 1987-2005
Table 3.9 Producti on of Coal
Table 3.10 Export of Coal to Bangladesh
Table 3.11 Producti on of Limestone
Table 3.12 Export of Limestone to Bangladesh
Table 3.13 Clay and Sillimanite
Table 3.14 Revenue Receipts from Major Minerals
Table 4.1 Summary of Receipts and Disbursements for the year 2006-07
Table 4.2 Fiscal positi on
Table4.3 Trends in Growth of GSDP
Table 4.4 Trends in Growth and Compositi on of Aggregate
Table 4.5 Revenue Receipts-Basic Parameters
Table 4.6 Mobilisati on of State’s own resources
Table 4.7 Trend of tax revenue during 2001-07
Table 4.8 Grants-in-Aid from the GOI
Table 4.9 Total Expenditure - Basic Parameters
Table 4.10 Components of Expenditure-Relati ve Share
Table 4.11 Revenue Expenditure - Basic Parameters
Table 4.12 Non-Plan Revenue Expenditure: Actual vis-à-vis Normati ve
Table 4.13 Expenditure on Salaries and Wages
Table 4.14 Expenditure on Pension (including other reti rement benefi ts)
Table 4.15 Actual Pension Payments vis-à-vis Projecti on
Table 4.16 Interest Payments
Table 4.17 Subsidies
Table 4.18 Indicators of Quality of Expenditure
xv

MEGHALAYA STATE DEVELOPMENT REPORTMEGHALAYA STATE DEVELOPMENT REPORT
Table 4.19 Expenditure on Social Services
Table 4.20 Expenditure on Economic Services
Table 4.21 Financial Assistance
Table 4. 22 Return on Investment
Table 4.23 Details of loss making Government Companies
Table 4.24 Average Interest Received on Loans and Advances by the State Government
Table 4.25 Ways and Means Advances and Overdraft s of the State
Table 4.26 Fiscal Liabiliti es - Basic Parameters
Table 4..27: Guarantees given by the Government of Meghalaya
Table 4.28: Debt Sustainability - Interest Rate and GSDP Growth
Table 4.29 Incremental Revenue Receipts and Revenue Expenditure
Table 4.30 Net Availability of Borrowed Funds
Table 4.31 Fiscal Imbalances - Basic Parameters
Table 4.32 Primary Defi cit/Surplus - Bifurcati on of Factors
Table 4.33 Indicators of Fiscal Health
Table 5.1 ESTIMATES OF NSDP AT FACTOR COST
Table 5.2 NSDP By Main Sectors at Constant (1999-2000) Prices
Table 5.2.4 (i) GROWTH OF GSDP
Table5.2.4 (ii) GSDP at Constant (1999-2000) Prices
Table5.2.4 (iii) GSDP at Constant (1999-2000) prices
Table 5.2.5. Sector-Wise Distributi on of All India GDP and State GSDP
Table - 5.2.6 (i) District-wise Poverty Incidence in Meghalaya
Table5.2.6 (ii) Proporti on of Households Living Below the Poverty Line in Districts of
Meghalaya in 2002
Table5.2.7 (i) Per Capita NSDP
Table 6.1 Infrastructure Indices
TABLE-6.2 Key Indicators
Table 6.3 Per capita consumpti on of Electricity (in KwH)
Table 6.4 Villages electrifi ed in Northeast India
Table 6.5 Percentage of villages electrifi ed in Districts of Meghalaya
Table 6.6 Development of road network in Meghalaya
Table 6.7 Development of road network in Meghalaya
Table 6.8 Percentage of Unconnected Villages in Northeast India
Table 6.9 Road infrastructure in the Districts of Meghalaya
Table 6.10 Number of Unconnected Habitati ons in Meghalaya, 2008
Table 6.11 Railway infrastructure in Northeast India
xvi
MEGHALAYA STATE DEVELOPMENT REPORTMEGHALAYA STATE DEVELOPMENT REPORT
Table 6.12 Number of Telephone Connecti ons in Meghalaya, 2007
Table 6.13 Growth in postal & telecom sectors in Meghalaya
Table 6.14 Postal infrastructure in Northeast India
Table 6.15 Percentage of inhabited villages having post and telegraph offi ce in
Northeast India
Table 6.16 Post and telegraph infrastructure in Districts of Meghalaya Percentage of inhabited
villages having post and telegraph offi ce in Meghalaya
Table 6.17 Development of irrigati on infrastructure in Meghalaya
Table 6.18 Net and gross irrigated area and irrigated holdings
Table 6.19 Growth of bank offi ces in Meghalaya, 1983 to 2006
Table 6.20 Area wise distributi on of scheduled commercial bank branches in Northeastern
States
Table 6.21 Banking infrastructure in the Districts of Meghalaya, 2006
Table 6.22 Rural infrastructure in Meghalaya – Results from fi eld survey
Table 6.23 Infrastructure index and States Ranking
Table 6.24 Changes in availability of selected infrastructure in Meghalaya vis-a-vis India
Table 6.25 Twelft h Finance Commission Ranking of the Northeastern States by Infrastructure
Index
Table 7.1. Value of Agricultural product per Agricultural Worker
Table 7.2 Percentage of villages connected by road
Table 7.3. Progress of Achievement under Road Sector up to 2007-08
Table 7.4 Habitati ons coverage as on: 31st March, 2008
Table 7.5 Distributi on of rural household by type in percentage
Table 7.5(a) Distributi on of Rural Households by number of Dwelling Rooms (%) 2001
Table 7.6 Achievement Under Lay From 2003-04 To 2007-08 New Constructi on
Table 7.7 Achievement Under Lay From 2003-04 To 2007-08 Upgradati on
Table 7.8 Distributi on of rural households by source of drinking Water (%) 2001
Table 7.9 Distributi on of Rural Households by Locati on of Drinking Water (%) 2001
Table 7.1 0 NC/PC/FC Habitati ons
Table 7.11 Physical Target Vs Achievement during Tenth Plan on Coverage of habitati ons un-
der RWSP
Table 7.12 Year-wise Expenditure under ARWSP during Tenth Plan
Table 7.13 Year-wise sancti on and completi on of schemes under ARWSP
Table 7.14 Distributi on of rural households by availability of latrine facility (%) 2001
Table 7.15 Target & Achievement under TSC
Table 7.16 Target vis-à-vis achievements in constructi on of Toilet faciliti es in schools are as
xvii

MEGHALAYA STATE DEVELOPMENT REPORTMEGHALAYA STATE DEVELOPMENT REPORT
below
Table 7.17 Distributi on of Rural Households by Electricity Connecti on (%) 2001
Table 7.18 Status of RGGVY Scheme for11th PLAN
Table 7.19 Progress of Scheme during last fi ve years
Table 7.20 Financial & Physical Achievements during 2007-2008 upto March, 2008
Table 7.21 The break up proposed expenditures for the Annual Plan 2008-09
Table 7.22 Financial Progress for the year 2007-08
Table 7.23 Border Districts, Number of Villages and Border Length in the state
Table 8.1 List and Administrati ve Status of the Urban Centres in Meghalaya
Table 8.2 Distributi on of Households by Locati on of Drinking Water
Table 8.3 Distributi on of Households by Type of Latrine
Table 8.4 Distributi on of Households by Connecti vity of Drainage
Table 8.5 Esti mated Waste Generati on in major towns
Table 8.6 Growth of Towns and Populati on in Meghalaya
Table 8.7 District-Wise Distributi on of Urban Populati on
Table 8.8 Size Class Distributi on of Urban Populati on 2001
Table 8. 9 Distributi on of Households by Source of Drinking Water and Locati on
Table 8.10 Distributi on of Household by Availability of Bathroom and Type of Latrine within
the House
Table 8.11 Distributi on of Households by Type of Drainage Connecti vity
Table 8.12 Outlays and Expenditure in Urban Development Programmes
Table 9.1 Land Use Patt ern
Table 9.2 land holding and size of holding
Table 9.3 Fishery resources in Northeastern Region
Table 9.4. Fish seed producti on
Table 9.5 Water resources for Fisheries
Table 9.6 L ivestock and poultry 2002 & 2003
Table 9.7 Milk Producti on
Table 9.8 Growth of cooperati ves in Meghalaya
Table 9.9 Growth Rate of Agriculture in the North East 1993-94 to 2002-03
Table 9.10 Livestock populati on and output, 2003-04
Table 9.11 Rati o of Livestock to Populati on 2003-04
Table 9.12 Fish Producti on 2003-04
Table 9.13 RSI: Highest Comparati ve Advantage products for the Northeastern States
Table 9.14 NSI: Highest Comparati ve Advantage products for the Northeastern States
Table 9.15 Dependency Index (DI) for all products, 2003-04
xviii

MEGHALAYA STATE DEVELOPMENT REPORTMEGHALAYA STATE DEVELOPMENT REPORT
Table 9.16 Dependency Index (DI) for Milk, Meat, Eggs and Fish, 2003-04
Table 10.1 Esti mated Reserves of Minerals in Meghalaya
Table 10.2 MAJOR AGRO & HORTICULTURAL RESOURCES
Table. 10.3 Status of Large & Medium Industries in Meghalaya
Table 10.4 Status of Small Scale Industries
Table 10.5 District-wise distributi on of Registered Manufacturing Units and Workers in 2000
Table 10.6 Trend of SSI registrati on in the state
Table10.7 District Wise distributi on of SHGs in Meghalaya
Table 10.8 Year–Wise PMRY applicati ons sponsored, Sancti oned and Disbursed
Table 10.9 Status of PMRY
Table 10.10 District-Wise Performance
Table 10.11 Status of REGP
Table 10.12 S tatus of ASIDE Scheme in the State
Table 10.13 Export of Commoditi es for the Year 2005 – 2006
Table 10.14 Export of Commoditi es for the Year 2006 – 2007
Table 10.15 Export of Agriculture and Horti cultural Produce during 2007-08
Table 11.1 Status of Public Sector Health Insti tuti ons and Services
Table 11.2 Esti mated Number of Sub-Centres, PHCs and CHCs required by Meghalaya by
2020
Table 11.3 District-Wise Distributi on of Public Health Care Insti tuti ons in Meghalaya, 2008
Table 11.4 Some Other Indicators of Availability of Health Infrastructure in Meghalaya, 2007
Table 11.5 Bed Strength of Selected Private Hospitals in Meghalaya
Table 11.6 Existi ng and Additi onal Requirement of Manpower in Health Sector of Meghalaya
(2007)
Table 11.7 Expenditure on Health & Family Welfare in Meghalaya
Table 11.8 NRHM FINANCIAL STATEMENT FOR 2008-09
Table 11.8.1 Human Development Index of States in India – 2005
Table 11.8.2 Human Development Indices of Districts of Meghalaya
Table 11.8.3 District-Wise Literacy Rates in Meghalaya by Place of Residence
Table 11.8.4 District-Wise Literacy Rates in Meghalaya by Sex
Table 11.8.5 Gross Enrolment Rati o by Place of Residence and Sex (2004-05)
Table 11.8.6 Educati onal Infrastructure Gaps in Primary Schools of Meghalaya, 2005-06
Table 11.8.7 Poverty Incidence in C&RD Blocks of Meghalaya as per BPL Census, 2002
Table 11.8.8 Gender Related Development Index of Districts of Meghalaya
Table 12.1 Work Force Parti cipati on Rate in the Diff erent Districts of Meghalaya in 1981, 1991
and 2001
xix

MEGHALAYA STATE DEVELOPMENT REPORTMEGHALAYA STATE DEVELOPMENT REPORT
Table 12.2 Work Force Parti cipati on Rate in the North Eastern States of India in 2001
Table 12.3 Distributi on of Total workers into Main and Marginal Workers in Diff erent Districts
of Meghalaya in 2001
Table 12.4 Industrial classifi cati on of Main workers in 1981
Table 12.5 Industrial Classifi cati on of Main Workers
Table 12.6 Industrial Classifi cati on of Marginal Workers
Table 12.7 Percentage of Child Labourers in the Diff erent Districts of Meghalaya
Table 12.8 Proporti on of Child Laborers in 2001 in the North Eastern States of India by Sex and
Place of Residence
Table 12.9 Unemployment Rate in the North Eastern States of India in 1991
Table 12.10 Unemployment Rate in the North Eastern States of India in 2001
Table 12.11 Unemployment Rate in Meghalaya (NSSO)
Table 12.12 Unemployment Rate by Age Group in Meghalaya
Table 12.13 Unemployment Rate by Educati on in Meghalaya in 1983 and 1987-88
Table 12.14 Unemployment Rate by Educati on in Meghalaya in 1993-94, 1999-00 and 2004-
05
Table 12.15 Desired Type of Work by the Unemployed in Meghalaya, 2003
Table 13.1 Investment Patt ern during 10th Plan
Table 13.2 Tenth Plan Resources
Table 13.3 Tenth Plan distributi on patt ern
Table 13.4 GDP/NSDP
Table 13.5 Human Development Index of Districts of Meghalaya
Table 13.6 Gender Related Development Index of Districts of Meghalaya
Table 13.7 Criti cal Infrastructure Gaps.
Table 13.8 Infrastructure index and States Ranking
Table 13.9 Bott om 10 States in Descending Order
Table 13.10 11th Plan Approved Outlay
Table 13.11 10th Plan Physical Performance & 11th Plan targets
Table 13.12 Monitorable Indicators
Table 13.13 Annual Plan Allocati ons
Table 13.14 11th Plan Projected Outlay
Table 13.15 Leveraging funds from other sources
xx

MEGHALAYA STATE DEVELOPMENT REPORTMEGHALAYA STATE DEVELOPMENT REPORT
ABBREVIATIONS
ADCs Autonomous District Councils AIIMS All India Insti tute of Medical Sciences ANM Auxiliary Nurse MidwifeAPL Above Poverty Line ART Anti Retroviral TreatmentASHA Accredited Social Health Acti vistAWC Anganwadi CentreAWW Anganwadi WorkerBMI Body Mass Index BPL Below the Poverty LineBRGF Backward Region Grant Fund BSCs Block Selecti on Committ ees CEDAW Conventi on on the Eliminati on of all forms of Discriminati on Against WomenCHCs Community Health Centres DES Directorate of Economics and Stati sti csDMC Designated Microscopy Centres DONER Union Ministry of Development of North Eastern Region DPC District Planning Committ eesDPDC District Planning and Development Council DRDAs District Rural Development Agencies FDAs Forest Development AgenciesFRU First Referral UnitGDI Gender related Development Index GDP Gross Domesti c ProductGEI Gender Equality Index GEM Gender Empowerment Measure GKY Ganga Kalyan Yojana GNM General Nursing and MidwiferyGSDP Gross State Domesti c ProductHD Human DevelopmentHDI Human Development Index HDRs Human Development ReportsHPI Human Poverty Index IAY Indira Awaas Yojana ICT Informati on & Communicati on TechnologyIDSP Integrated Disease Surveillance Project IEC Informati on Educati on and Communicati on IFAD Internati onal Fund for Agricultural Development IIPS Internati onal Insti tute for Populati on SciencesIMCP Intensifi ed Malaria Control ProjectIMR Infant Mortality Rate INGON Impulse NGO Network
xxi

MEGHALAYA STATE DEVELOPMENT REPORTMEGHALAYA STATE DEVELOPMENT REPORT
ITBN Insecti cide Treatment of Bednets JAT Joint Appraisal Team JFM Joint Forest ManagementJGSY Jawahar Gram Samadhi Yojana LCU Leprosy Control Units LHV Lady Health VisitorLMPs Local Medical Practi ti oners MACS Meghalaya AIDS Control Society MDT Multi Drug Therapy MLAs Members of the Legislati ve AssemblyMLES Meghalaya Leprosy Eradicati on Society NACO Nati onal AIDS Control Organisati onNAMP Nati onal Anti Malaria ProgrammeNaRMG Natural Resource Management GroupNEC North Eastern Council NEDFi North Eastern Development Financial Corporati on LtdNEHU North Eastern Hill UniversityNEIGRIHMS North East Indira Gandhi Regional Insti tute of Health and Medical Sciences NERCORMP North Eastern Region Community Resource Management Project NESPYM North East Society for the Promoti on of Youth and MassesNFHS Nati onal Family Health Surveys NGOs Non–Governmental Organisati ons NHDR Nati onal Human Development ReportNIPFP Nati onal Insti tute of Public Finance and PolicyNLCPR Non Lapsable Central Pool of Resources NLEP Nati onal Leprosy Eradicati on Programmes NORAD Norwegian Agency for Internati onal Development NPCB Nati onal Programme for Control of Blindness NPSP Nati onal Polio Surveillance ProjectNREGA Nati onal Rural Employment Guarantee ActNREGS Nati onal Rural Employment Guarantee Scheme NRHM Nati onal Rural Health Mission NSAP Nati onal Social Assistance Programme NSDP Net State Domesti c Product NSSO Nati onal Sample Survey Organizati onPDS Public Distributi on SystemPFA Plan for Acti onPHCs Primary Health Centres PMRY Prime Minister Rozgar Yojana PPP Public Private PartnershipPQLI Physical Quality of Life Index PRA Parti cipatory Rural Approach PRAM Physician Responsible for AIDS Management PWD Public Works Department RCH Reproducti ve & Child Health
xxii

MEGHALAYA STATE DEVELOPMENT REPORTMEGHALAYA STATE DEVELOPMENT REPORT
RF Reserved ForestsRIDF Rural Infrastructure Development FundRNTCP Revised Nati onal TB Control Programme RPDCs Regional Planning and Development CouncilsSARDPNE Special Accelerated Road Development Programme for the North EastSET Survey Educati on Treatment Centres SGSY Swarna Jayanti Gram Swarozgar Yojana SHGs Self Help GroupsSITRA Supply of Improved Toolkits to Rural Arti sans SMO Surveillance Medical Offi cer SOE State of Environment Report SPIP State Project Implementati on Plan SRS Sample Registrati on System Surveys STCS State TB Control Society STD Sexually Transmitt ed DiseaseSTEPW Support to Training and Employment Programme for Women THW Temporary Hospitalisati on Ward TI Targeted Interventi on TOT Training of the Trainers TPDS Targeted Public Distributi on SystemTRYSEM Training of Rural Youth for Self Employment TU TB Units UHCs Urban Health CentresUIP Universal Immunisati on Programme ULC Urban Leprosy Centre UNDP United Nati ons Development ProgrammeVHAM Voluntary Health Associati on of MeghalayaVPDP Village Parti cipatory Development PlanningWHO World Health Organizati onWWH Working Women’s Hostel ZBTC Zonal Blood Testi ng Centre
xxiii

Birth Rate during a year is the rati o of the number of live births in that year to the populati on of that year expressed per 1000 populati on. i.e. Live Births Birth Rate =---------------------------x 1000 Population
Body Mass Index (BMI) is a measure of nutriti onal status. It is defi ned as weight in kilograms divided by height in metres (Kg/m2). A cut-off point of 18.5 is used to defi ne thinness or acute undernutriti on and a BMI of 25 or above indicates overweight or obesity.
Death Rate during a year is the rati o of the number of deaths in that year to the populati on of that year expressed per 1000 populati on. i.e.
Deaths Death Rate =---------------------------x 1000
Population
Gender related Development Index (GDI) is an adjustment of Human Development Index (HDI) for gender equity in health, educati onal att ainment and income. It measures achievements in the same dimensions using the same indicators as the HDI but captures inequaliti es in achievement between women and men. It is the HDI adjusted downward for gender inequality.
Gross Enrolment Rati o refers to the rati o of the populati on (not taking into considerati on the age factor) at parti cular levels of schooling to the populati on of children of the relevant age group.
Human Development Index (HDI) is a summary indicator of the level of achievement in human well-being. It measures achievements in the basic dimensions of human development – health, educati on and income. It is normalized to a scale of 0 to 1 where 1 implies that maximum human development is achieved as per the pre-defi ned norms and 0 implies no achievement at all.
Infant Mortality Rate (IMR) is the rati o of deaths of infants below one year to the total number of live births during the year expressed per 1000 live births.
Labour Force refers to the economically acti ve populati on. It includes both the workers and the persons who seek or are available for work. The labour force parti cipati on rate is calculated by dividing the total labour force by the populati on and expressed as a percentage.
Literacy Rate in India is defi ned as the percentage of literates aged 7 years and above out of the total populati on aged 7 years and above.
xxv

Maternal Mortality Rate (MM Rate) is calculated by dividing the number of maternal deaths (deaths of women while pregnant or within 42 days of terminati on of pregnancy from any cause related to pregnancy and child birth) of women aged 15-49 years by the number of living women aged 15-49 years expressed per 1,00,000 women.
Maternal Mortality Rati o (MMR) is calculated by dividing the number of maternal deaths of women aged 15-49 years by the number of live births to women aged 15-49 years expressed per 1,00,000 live births.
Natural Growth Rate is the diff erence between the Birth Rate and the Death Rate.
Net Enrolment Rati o refers to the rati o of the populati on of the expected age group at specifi ed level of schooling to the populati on of children of the relevant age group.
Workforce is the number of persons who are usually working. The work force parti cipati on rate is calculated by dividing the total number of workers by the populati on and expressed as a percentage.
Unemployment Rate gives the proporti on of the unuti lized labour force. It is calculated by dividing the number of persons who are seeking or available for work by the total labour force and expressed as a percentage.
xvi


MEGHALAYA STATE DEVELOPMENT REPORTMEGHALAYA STATE DEVELOPMENT REPORT
1
CHAPTER – I
INTRODUCTION
Meghalaya: A Profi le1
1.1 GENERAL INFORMATION ON LOCATION, POPULATION, POLITICAL ADMINISTRATION AND ECONOMY
Meghalaya emerged as a full-fl edged State within the Union of India on 21st January 1972. ‘Meghalaya’ (not an indigenous name) meaning ‘abode of clouds’ refl ects the salubrity of its climate. The wett est places in the world are also located here. The state has an area of 22429 sq. km. and is located between 24057’ North lati tudes and 26010’ North lati tudes and 89046’ and 92053’ East longitudes. The temperature varies from 2 degrees Celsius to 35 degrees Celsius depending upon the alti tude which varies in hillsfrom 300 metres to 2000 metres above mean sea level. It has predominantly hilly terrain with foothills as plains and fl ood-prone areas.
1 This section is adapted from Shreeranjan (2006), Chapter 2

MEGHALAYA STATE DEVELOPMENT REPORTMEGHALAYA STATE DEVELOPMENT REPORT
2
It is bounded by the Brahmaputra valley of Assam in the North and Northwest and Cachar area of Assam in the East; the Surma valley (Bangladesh) borders it in the South and partly in the Southwest. Meghalaya has about 443 Kms. of internati onal border with Bangladesh. The capital of Meghalaya, Shillong was also undivided Assam’s capital from 1874 ti ll January 1972. Shillong is located at an alti tude of 1496 metres above mean sea level.
The State has a populati on of 2318822 as per the 2001 census of which 80.4 percent live in the rural areas. The overall populati on density of 103 (324 all India) per sq. km. has shown increase as against 15 per sq. km. in 1901. The sex rati o conti nuously declined from 1036 in 1901 to 937 in 1961. Since then it shows an upward trend and stands at 972 in 2001.
Table 1.1 Administrati ve Districts in Meghalaya
Name of the District
Head quartersArea
(sq. km.)Populati on
(2001 census)
Density of populati on per sq. km.
Sex rati o
Jainti a Hills Jowai 3819 299108 78 996East Khasi Hills Shillong 2820 660923 241 981Ri Bhoi Nongpoh 2376 192790 79 941West Khasi Hills Nongstoin 5247 296049 56 968East Garo Hills Williamnagar 2603 250582 96 966West Garo Hills Tura 3715 518390 141 968South Garo Hills Baghmara 1849 100980 54 942Meghalaya Shillong 22429 2318822 103 972
Source: Census of India, 2001.
Principal languages are Khasi and Garo, with English as offi cial language in the State. With originally two districts and three subdivisions only, the State has now 7 administrati ve districts (Table 1.1). Besides these, in order to bring administrati on closer to the people, it has now 8 Subdivisions and 39 Blocks (7 new Blocks have been created in 2002, one in each district).
The State has a unicameral legislature, consisti ng of 60 members (29 Khasi Hills, 7 Jainti a Hills and 24 Garo Hills). In additi on, there are three Autonomous District Councils in the state, namely, Khasi Hills Autonomous District Council, Jainti a Hills Autonomous District Council and Garo Hills Autonomous District Council. These councils functi on in accordance with the provisions of the Sixth Schedule of the Consti tuti on of India. These councils have executi ve, legislati ve and judiciary wings and are under the control of the Governor of the State. The Autonomous District Councils are democrati c insti tuti ons which have powers to make laws mainly in respect of 1. land, other than reserved forests; 2. forests, other than reserved forests; 3. use of any land or water resources for agricultural purposes; 4. regulati on

MEGHALAYA STATE DEVELOPMENT REPORTMEGHALAYA STATE DEVELOPMENT REPORT
of Jhum or shift ing culti vati on; 5. town or village administrati on including village or town police, public health and sanitati on; 6. appointment and succession of chiefs and their powers; 7. laws relati ng to inheritance of properti es and their regulati on; 8. marriage; 9. social customs, traditi onal practi ces and customary laws.
There has been a growing debate over the relevance of Autonomous District Councils, which were created as an insti tuti on to allow management of natural resources and to protect, reform and pursue customary practi ces, when there was no separate state for hill regions of Assam. Even with the creati on of a full-fl edged State, the district council conti nues to functi on as a consti tuti onal enti ty and, for quite some ti me, has been treated as a State within the State. Though it might have served the initi al purpose, in respect of management of resources and codifying the customary laws, parti cularly in the wake of fast changes society is encountering, its record of accomplishment has given rise to certain misgivings in most quarters. However, it does provide a platf orm of politi cal training in the State. With the Panchayati Raj Act brought in as another consti tuti onal safeguard, and with devoluti on of power to the grassroots, an opportunity awaits to evolve a mechanism for correcti ng the imbalances in the power structure by incorporati ng mechanisms for more eff ecti ve decentralizati on of duti es and responsibiliti es as also for parti cipati on in policies and programmes.
Shillong has a bench of the High Court. The North Eastern Council (NEC) serving under the Union Ministry of Development of North Eastern Region (DONER), Government of India co-ordinates and accommodates infrastructure and producti on based schemes of intra-regional and inter-state interests. There is an earmarking of 10 percent of the budgetary allocati on of sectors in GOI for expenditure in NER. Shortf all on this count forms the Non Lapsable Central Pool of Resources (NLCPR) for high value projects of infrastructure and social development for the states in the region. NLCPR is coordinated by the ministry of DONER. Several Central Government, Military, Para-Military establishments are also located in the State.
The populati on of Meghalaya is predominantly tribal. The main tribes are Khasis, Jainti as and Garos, besides other plain tribes such as Koch, Rabhas, and Bodos, etc. The Khasis, (the Khynriams, Jainti as, the Bhois, the Wars someti mes are called the Hynniewtrep as a group) predominantly inhabit the districts towards Eastern part of Meghalaya, belong to the Proto Austroloid Monkhmer race and have been indigenous in these hills for a long ti me. The western part of the State, the Garo Hills, is predominantly inhabited by the Garos. The Garos belong to the Bodo family of the Tibeto-Burman race. They are also an indigenous populati on, said to have migrated from Tibet in its racial dispersal. The Garos are also called ‘A·chiks’. Garo and Khasi societi es have a matrilineal system prevailing.
81 percent of the populati on of the State live in rural areas and are largely dependent on agriculture for livelihood. The State has a total of 5782 inhabited villages (2001 census). Its populati on growth during the last decade (1981-1991) showed an increase of 31.80 percent. During 1991-2001 the annual growth of populati on is 2.29 percent against nati onal rate of 2.14 percent. However, decadal variati on in populati on of the State reveals an increase in the post-independence era which could be owing to a multi plicity of factors including infl ux, bett er health facility and reducti on in mortality, etc.
3

MEGHALAYA STATE DEVELOPMENT REPORTMEGHALAYA STATE DEVELOPMENT REPORT
The state has rich natural resources including diverse, dense, endemic, and culti vated exoti c fl ora, ranging from tropical and sub-tropical to temperate or near-temperate kind, sustained by heavy and long rains. Dense Forest cover is about 42 percent of the total area; however, much of it is private forest managed and controlled by the District Council. The State Government controls only the area under the reserved forest, which is about 4 percent of the forest areas. There have been reports of large felling of trees in the 80s and 90s leading to consequenti al problems of livelihood and environmental degradati on with consequenti al fall out on natural conservati on. Currently, under the directi ons of the Supreme Court of India, felling and movement of ti mber is restricted to the extent of fulfi llment of certain conditi ons. The State also has rich mineral resources; much of it is exploited unscienti fi cally as most of it is under private ownership.
The State receives the heaviest rainfall (varies from 2300mm to more than 14000mm; average annual rainfall is 12000mm) and has vast potenti al for exploiti ng water resources for irrigati on, hydropower and fi sheries; but its eff orts in this directi on have been inadequate and at best, can be regarded as moderate. Scienti fi c exploitati on of natural resources will require detailed resource inventory and heavy initi al investments. Responses in this directi on from Government have not been adequate to provide sti mulus for the growth and development of the State. The State could not att ract investment from outside as there is lack of conducive environment and a balanced approach towards the investment from outside the region, due to the historical and perceived reasons of fear, exploitati on. Besides rati onal protecti onism mixed with in various potenti al areas of development are needed.
Though there has been some improvement over the years, the State has a long way to go in respect of basic services to improve health, educati on and economy, when judged by the parameters of the Human Development Index and other socio-economic indicators. Among the States and UTs in the country, Meghalaya ranked 22nd in Human Development Index (HDI) in 2001, 21st in Index of social and economic infrastructure, 16th in per capita consumpti on of electricity, 25th in road density, 30th in per capita uti lizati on of credit, 19th in per capita income, 13th in Infant Mortality Rate and 24th in Literacy Rate.
As such, the State has to take appropriate steps to improve its positi on in all sectors. It is also ironical that motor vehicles per thousand populati on in the state is 40, whereas primary school per thousand is only 3 and hospital beds per lakh populati on is 137. Besides, there is astonishing disparity in rural and urban area parameters.
1.2 SOME UNIQUE SOCIO ECONOMIC FEATURES OF THE NORTH EASTERN REGION AND OF MEGHALAYA
In a region so diverse, yet interrelated in its characteristi cs, it will be dangerous to make generalizati ons. However, basic features of the region can be briefl y menti oned as below to get some perspecti ves on issues that apply to the region in general, and Meghalaya in parti cular.
4

MEGHALAYA STATE DEVELOPMENT REPORTMEGHALAYA STATE DEVELOPMENT REPORT
1) Diversity in geological, physiographic, agro-ecological and climati c variati ons: The region has six agro-climati c sub-zones (5 sub-zones in Meghalaya). Contrasti ng variati ons exist, for example in Khasi and Jainti a hills on one hand and Garo hills areas on the other in most of these respects.
2) Abundant water resources: The region has abundance of water resources, the potenti al is not fully harnessed for hydro-power, fi shery, ecotourism, adventure tourism and cave tourism. In Meghalaya, heaviest rainfall needs to be uti lized for harvesti ng and recharging its aquifers. Its perennial streams and swollen rivers are strong water resources begging for potenti al tapping. Its total ground water potenti al of 1226.44 million cubic meter (MCM) provide only 1041.99MCM as uti lizable for irrigati on and at around 3000 MW of which only 185.2 MW has been tapped so far.
3) Abode of Bio-Diversity: The NE region contains about 20-25 percent of the forest cover of the country; and is the richest for bio-diversity. It is an ecological `hot spot`-with 51 types of forest, 35 endemic plant genera, 2500 fl owering plant species, 600 varieti es of orchids out of 1500 present in India; also, out of the 500 diff erent species of mammals known in India at least 160 are from the region while around 65 percent of mammalian genera recorded in India, are found in the region (IFAD, 1995). The State of Meghalaya is home to nearly 300 orchid varieti es. The State also boasts of 450 species of birds and 110 species of mammals. The State also claims to be the abode of 700 odd varieti es of medicinal plants. In Meghalaya, 40 endemic species out of 115 plant species from 67 families are threatened with exti ncti on; and 6 species are endangered; 30 types of orchids are currently threatened with exti ncti on; and 6 species are endangered; 30 types of orchids are currently threatened (IFAD, 1995).The State is home to some of the rare varieti es of paddy, banana, and citrus plants, and is a storehouse of diverse germ-plasm reserve.
4) A predominantly agricultural economy with 80 percent populati on dependent on it and only about 11 percent of the land area being under culti vati on. The broad patt ern of rainfall varies from 2200 mm-14500 mm with varied temperature range of 2˚C to 38˚C.The low consumpti on of ferti lizer (NPK 27:12:1 as against 4:2:1) could become its strength by promoti ng organic and natural farming if well packaged and practi ced. Besides agriculture, the allied acti viti es of fi shery, livestock, piggery, poultry, and sericulture has immense potenti al strength. The region has good traditi on of handicraft s and weaving.
5) Rich in mineral resources: The State is rich in coal, limestone, clay and kaolin, uranium and silimanite, besides phospherite, glass sand, granite, quartz and feldspar. The esti mated reserve of coal and limestone is 640 million tones and 5000 million tones respecti vely. The producti on of coal in 2003-04 was about 5.4 million tones of which 0.88 million tones were exported to Bangladesh; producti on of limestone in the same year was 0.72 million tones of which 0.18 million tones were exported to Bangladesh. These fi gures may be a conservati ve esti mate (at least by 50 percent) owing to revenue leakages/implicati ons and underhand play in the sector including the transport business involved in the sector.
5

MEGHALAYA STATE DEVELOPMENT REPORTMEGHALAYA STATE DEVELOPMENT REPORT
6) The region has 98 percent of its borders as internati onal boundaries with China, Bhutan, Bangladesh, Myannar (IFAD, 1995). Hence, its sensiti viti es and vulnerability to external forces for the security and integrity of the country is understandable. Meghalaya has a long and extremely porous borders with Bangladesh and is used by forces inimical to the country and region as transit routes.
7) A mosaic of ethnic and cultural diversity presents a social landscape of Aryans, Dravidians, Indo-Burmese, Indo-Tibetan, Proto-Austroloid and other stocks. In NER, there are 217 recognizable tribes, more than 100 with signifi cant populati on (IFAD, 1995).There are more than 75 major populati on groups and subgroups speaking approximately 400 language and dialects (Madhav, 1998). Meghalaya has small percentages of about 5% of other tribes and communiti es such as Koch, Rabhas, Hajong, Baites, Lalungs, etc.
8) A high populati on growth mainly due to infl ux across the southern boundaries (also natural) straining demographic and social texture, and causing ‘fear of losing identi ty’ (Madhav, 1998) and livelihood among a considerable secti on of the indigenous/local populace.
9) Traditi onal trade linkage in the pre-independence era with East (Myanmar) and South (present day Bangladesh) and its severance subsequently has generated a demand and need to have access through Bangladesh to Calcutt a and other ports and the opening of border trade with neighboring countries.
10) The way of life and society is rooted in a traditi onal and customary approach in the hills. Traditi onal land tenure systems prevail without elaborate documentati on and survey in hills and in Meghalaya. System of Matrilineal society is prevalent among the Meghalaya’s chief tribes.
11) Feeling of isolati on and alienati on has persuaded the psyche owing to the Briti sh policies and subsequent politi cal interests and owing to slow pace of developmental eff orts.
12) Sparse populati on in hills and poor basic infrastructure, hill area specifi citi es of isolati on, marginality, ecological and ethnological vulnerability, and heterogeneity of socio-economic factors becomes ground realiti es.
13) A rapid spread of Christi anity, parti cularly among tribal communiti es in the hills.
14) Acti ve youth movement; and a disturbed law and order situati on. Mizoram and Meghalaya, however, are relati vely peaceful.
1.3. PERCEIVED PROBLEMS BY PEOPLE IN THE REGION/STATEIt may be desirable to appreciate and enlist what people, mostly educated and opinion
makers arti culate as the diffi culti es and problems faced by the populace in the region. Psychological (perhaps real) fear of losing identi ty due to infl ux and immigrati on; Disrupti on of law and order; insurgency, vicious circle of economic stagnati on and breeding of violence; realizati on of futi lity of an armed terrorist struggle and necessity of
6

MEGHALAYA STATE DEVELOPMENT REPORTMEGHALAYA STATE DEVELOPMENT REPORT
stable and secured environment is gaining ground to some extent and in some areas; Lack of an integrated vision for progress and development; Severance of its natural markets across eastern and southern, and to some extent, northern borders; the region was uniquely disadvantaged by parti ti on;Necessity to restructure the insti tuti onal arrangements and infrastructures associated with the policy-making decisions in the NER;Primiti ve agricultural economy, shift ing culti vati on in hills, low producti vity and lack of market linkages. ‘The producti ve sectors like agriculture is showing a negati ve trend’ (Madhav, 1998) in the region;Absence of genuine and fruitf ul producti ve exercise – a conditi on of inacti on or slow acti on or absence or work culture;Development agenda not in terms of social structure; lack of genuine parti cipati on in planning, policy and decision making; the linkages of people’s insti tuti ons with governance has been weak to adversarial, lack of meaningful relati onships;Lack of proper understanding of the society, culture and polity, and within that structure the problem of evolving locati on specifi c responses; and Absence of resources-management perspecti ve for ecological security and sustainable development.Absence or dysfuncti on of terti ary level insti tuti ons such as district councils, panchayats, village council and reluctance of states to share resources and functi ons has created disillusionment in the NER (Madhav, 1998).Faulty formulati on and implementati on of plans and programmes; sick public sector undertakings owing to mismanagement; absence of basic requirements, despite heavy assistance from the center, including justi ce; and ‘pervasive corrupti on’ (Madhav, 1998) are problems frequently menti oned seeking redressal.
1.4 PROBLEMS: OTHER ADDED DIMENSIONS IN MEGHALAYA
The issues and the process of accommodati on and consensus of diverse interest groups: such as absence of consensus on resource management and required approach towards land, forest and water management including desirable reforms in these areas for people centered and progress oriented policies.An environment of cauti ous approach of governance which may mean inacti on, or slow- acti on; or weighed acti on, someti mes vested or interested acti on or even inacti on.Non-insti tuti onal consultati ons, mainly personality-based consultati ons resulti ng in mushrooming of fl oati ng organisati ons and asserti ons, each trying to outdo or overdo others; alienati on of traditi onal systems from decision making and governance.Inadequate focus on development and poor community parti cipati on. Barring a few recently evolved NGOs there is a dearth of experienced and capable developmental NGO in the state. Poor organizati onal capaciti es of NGO sector including traditi onal organizati ons.Absence of eff ecti ve programmes to channel the energies of youth, towards adventuresome but socially fruitf ul politi cal, academic and economic pursuits.
7

MEGHALAYA STATE DEVELOPMENT REPORTMEGHALAYA STATE DEVELOPMENT REPORT
Dilemmas of development: ‘assimilati on versus asserti on’. “The old ways have been smashed; the new ways are not viable. People are caught in the deadlock of development……they are expatriates in their own country……forced to get by in the no man’s land between traditi on and modernity” (Sachs, 1992).Tokenism in development refl ected by o Absence of locati on specifi c soluti ons in view of diversity and lack of involvement
of people for mutual learning;o Mostly inappropriate techniques and technology;o Inadequate investment both by government and private organizati ons or in joint
sectors;o Poor extension support and backward and forward linkages in developmental
sectors;o Centralized planning; and lack of meaningful experimentati on; initi ati ng non
adapted programmes, slow to lack lustre implementati on, and abandoning programmes without meaningful impact studies (IRDP), pervasive adhocism.
o Insti tuti onal failures or inadequacy of safeguards for indigenous people.o ‘Blaming atti tude’ and ‘lack of commitment’ to serve the people in indigenous
middle class and elite.o New economic acti viti es, marginalizati on of rural populace; spread of more
western-consumerist life style and aspirati ons, increasing competi ti ons and usurpati on of resources and opportuniti es.
o Lack of reforms and eff orts to revise traditi onal laws for changing with ti mes. For example, in view of matrilineal system the status of male child and inheritance rights becomes a ti cklish issue of identi ty, etc. in Meghalaya. On the other hand, democrati c full parti cipati on of women in decision making in family and aff airs of village remains a challenging task. Further, land reforms, ceiling, individual and farming rights, etc. have hardly been att ended to for a meaningful resoluti on.
o Emergence of an exploitati ve and pervasive culture; intermediaries in power and market centres; quick money culture and extorti on.
o Lack of eff ecti ve decentralizati on and empowerment eff orts.
1.5 Trends in Populati on Growth
Meghalaya is predominantly a tribal state and a majority of its populati on resides in villages. Most of these villages are very small and widely scatt ered. As per 2001 census, the State had a populati on of 2.31 million, which was about 0.2% of the country’s total populati on at that ti me. The populati on density is 103 persons per square kilometre. Nearly 80.4% of the State’s populati on is rural whereas the remaining 19.6% is urban. The tribal populati on of the State is about 85.5%.
An analysis of the populati on trends in Meghalaya indicates that the decadal growth rate of populati on has been gradually increasing since 1951. Furthermore, the growth in Meghalaya has been higher the nati onal average since 1961. The highest growth rate (32.86%) was exhibited during 1991. Due to the increase in populati on, the density of populati on has gone up in Meghalaya from 15 persons per square kilometre in 1901 to 103 in 2001.
8

MEGHALAYA STATE DEVELOPMENT REPORTMEGHALAYA STATE DEVELOPMENT REPORT
Year Male Female Total Decadal Variati onMeghalaya India Meghalaya India
1901 167,256 173,268 340,524 238,396,327 - -1911 195,706 198,299 394,005 NA 15.71% -1921 211,216 211,187 422,403 251,321,213 7.21% -1931 243,993 236,844 480,837 278,977,238 13.83% 11.00%1941 282,666 273,154 555,820 318,660,580 15.59% 14.22%1951 310,706 294,968 605,674 361,088,090 8.97% 13.31%1961 397,288 372,092 769,380 439,234,771 27.03% 21.64%1971 520,967 490,732 1,011,699 548,159,652 31.50% 24.80%1981 683,710 652,109 1,335,819 683,329,097 32.04% 24.66%1991 907,687 867,091 1,774,778 846,387,888 32.86% 23.86%2001 1,176,087 1,142,735 2,306,069 1,028,830,774 29.94% 21.56%
Source: Stati sti cal Abstract India 2003Table 1.2: Trends in Populati on Growth in Meghalaya
1.6 DEVELOPMENT STATUS:
1.6.1. Growth Rate: Meghalaya’s growth rate during the 10th Plan at constant 1993-94 prices has been esti mated at 5.86 percent with growth of 3.09 percent, 7.90 percent and 6.15 percent in agriculture, industry and services respecti vely. The growth target of Gross State Domesti c Product (GSDP) in the case of Meghalaya is projected at 7.3 percent with Agricultural growth rate at 4.7 percent. The growth rate in respect of Industry and Services are projected at 8.00 percent and 7.9 percent respecti vely for Meghalaya.
1.6.2. Socio – economic indicators : The gross cropped area and the net area sown as in 2004-05 was 2.65 lakh hectares and 2.19 lakh hectares respecti vely, of which the area sown more than once is only 0.46 lakh hectares. The net irrigated area (2002-03) stands at 59,000 hectares. The total area of wastelands in the State is 3.41 lakh hectares which consti tutes 15.21 percent of the total geographical area of the State. The food grain and horti culture producti ons in the State during 2006-07 were 2.70 lakh M.T. and 3.97 lakh M.T. respecti vely. The State also produces three varieti es of silk – eri, muga and mulberry. The average producti on over the last fi ve years of cocoons is 260 M.T. of eri and 335 M.T. of muga while the 5-year average of yarn producti on is 2 M.T. of eri and 90 M.T. of muga. However, between 60 to 70 percent of the cocoons produced are transferred to Assam for conversion. As on 31-03-2008, 3428 villages have been electrifi ed consti tuti ng about 60 percent of the total number of villages in the State. The per capita consumpti on of electricity (2005-06) is 317.77 Kwh. The birth rate and death rate in 2005 was 25.1 and 7.5 per thousand respecti vely while the infant mortality rate was 49 per thousand. The Maternal Mortality Rate is 450 per lakh populati on and the Total Ferti lity Rate is 2.1. As in 2005-06, there were 568 doctors, 1232 nurses, 188 pharmacists, 687 ANMs and 172 lab technicians. There were 3166 beds (2004-05) available for medical care and the bed-pati ent rati o was 1:730. There are 4 primary health care centres per lakh of populati on. The literacy rate of Meghalaya as per 2001 census was 62.6 percent (male 65.4 percent and female 59.6 percent). The literacy rates for rural and urban areas are 56.3 and 86.3 percent respecti vely. As of 2005-06, there were 3 primary schools per thousand populati on, 8 middle schools per ten thousand populati on and 28 high and higher secondary
9

MEGHALAYA STATE DEVELOPMENT REPORTMEGHALAYA STATE DEVELOPMENT REPORT
schools per lakh of populati on. The teacher-pupil rati o stands at one teacher for every 34 students at the primary school level, 24 for middle school level and 25 for high/ higher secondary school level. There are 16 urban centres in the State with a populati on of 4.54 lakhs consti tuti ng over 19 percent of the State’s populati on. The decadal growth rate of urban populati on is 37.59 percent as against the State’s decadal populati on growth of 30.65 percent. Urban poor consti tutes about 22 percent of the total urban populati on. Out of the total habitati on of 9236 in the State, 4192 habitati ons have been fully covered consti tuti ng about 45 percent.
1.6.3. Poverty Scenario: According to the esti mate of Planning Commission, the populati on Below Poverty Line (BPL) during 2004-05 is 27.80% in the case of India. However, the household survey conducted by the State Government in 2002 fi nds that 48.9 % of the households in Meghalaya are Below Poverty Line families. Measurement of poverty criti cally depends on the poverty line and proper survey and there is need for appointi ng a panel of experts to devise a proper methodology to defi ne and determine the poverty line for Meghalaya. The Nati onal Insti tute of Rural Development (NIRD), Guwahati has att empted to conduct a study to fi nd out the root cause of poverty and to suggest soluti ons to this problem.
The major reasons for prevalence of poverty in Meghalaya are :-
(i) The operati onal land holding in Meghalaya is pre-dominantly small and marginal farmers with an area of below 2 hectares. Stagnati on of agricultural producti on, soil erosion and lack of new economic opportuniti es are deterrent factors that caused rural poor farmer in the State to languish in poverty.
(ii) Rural areas in Meghalaya are characterized by limited opportuniti es, low level of skill development, poor infrastructure, etc. There are also wide rural-urban dispariti es in terms of level of human development opportuniti es as viewed from access to ameniti es and other social services.
(iii) Major reasons contributi ng to poverty in the North East appears to be ignorance, inadequate core infrastructure, inadequate market openings, over dependence on agriculture, lack of skills, etc., which makes them apprehensive to face the challenges that emerge in the new economy.
1.7. SUMMING UP
The brief profi le of Meghalaya discussed in the foregoing subsecti ons serves as a background against which we evaluate achievements in aspects of development. The subsequent chapters of this Report portray the picture of the level of development in the state. The features and problems outlined above are a snapshot for quest of development. Meghalaya yearns to fi nd a place amongst developed states and achieve its potenti al. The rich natural resource and human endowment of the state craves for fuller and meaningful expression. Therefore, the challenge ahead is to harness the resources to the full potenti al and more importantly, to bring the fruits of development to the people, especially the poor and the less privileged.
10

A VIEW OF SHILLONG

LANDSCAPE OFCHERRAPUNJEE
AQUATIC ARTON LIMESTONE
TERRAIN OF KHASI HILLS

TURA PEAK
CANE SUSPENSION BRIDGE OVER SIMSANG RIVER

MEGHALAYA STATE DEVELOPMENT REPORTMEGHALAYA STATE DEVELOPMENT REPORT
CHAPTER – II
A HISTORICAL PERSPECTIVE
The Present day Meghalaya is geographically the outcome of Khasi & Jainti a Hills District, Khasi States and Garo Hills inhabited predominantly by the Khasi, the Jainti a and the Garo ethnic groups. It was part of Tribal areas defi ned under the Sixth Schedule of erstwhile Assam.
2.1. Historical Backdrop 1
(a) Khasi & Jainti a The ancestors of the present day Khasis were perhaps one of the immigrant tribes. Their physical features indicate they are Mongoloids. However their eyes do not possess the typical Mongoloid fold of the eyelid suggesti ng that they were admixture of other racial stocks. Perhaps, somewhere in the prehistoric period, the original Proto-Australoids of South-East Asia were admixture with the Mongoloid immigrants from the Western and South China. Khasi megaliths, stone tools, betel-nut chewing habit and the importance they att ach to betel-leaf and betel-nut are also indicati ve of their Proto-Australoid admixture. Their hoes, stone implements, besides, their language give strong indicati on of their immigrati on to the present site from South-East Asia. Their language, which is a variati on of Mon-Khmer’ dialects, is considered a branch of Austric languages. Austric languages are spoken in India by the Mundas, Santhals, Hos etc. The name of the Khasi language group, ‘Mon-Khmer’ is derived from the ‘Mons’ of South Burma and South-West Thailand, and the ‘Khmer’ of Cambodia. ‘Mon-Khmer’ languages include Khasi, Nicobarese, Palaung and Was in Burma and, Sakai and Samang in Malaya.
It is possible that the Khasis sett led in the Khasi and Jainti a Hills coming from the South-East Asia via Burma or straight from Burma. In Manipur also, Khasi Megaliths etc. were found. Some ethnologists believe that Manipur was on the route of the immigrant Khasis from Burma. In the absence of radiocarbon dati ng, nothing can be said of the historical period to which these stone evidences relate.
Alternati vely, they interbred with the Pro-Australoids in Assam or more probably in the hills of their present residence. In the absence of conclusive ethnological, anthropological, linguisti c
1 Meghalaya-Land and People (1991)
11

MEGHALAYA STATE DEVELOPMENT REPORTMEGHALAYA STATE DEVELOPMENT REPORT
evidences and scienti fi c analysis of archaeological fi nds nothing can be told for certain whether the Khasis were autochthons or immigrants. Their legends indicate both the possibiliti es. They were in Greater Assam at least prior to Ahoms and Tais as also long before the Aryan infi ltrati on in Assam in the 4th Century A.D. The names of the rivers, peaks and other landmarks invariably bear Khasi names. Monoliths and Cromlechs found at Noakhali, Demoria, Sonapur, Beltola, Rani-gudam, Palasbari etc. in the Assam Valley are said to be evidences of Khasi colonizati on. The Khasis seem to have possessed a fairly advanced material culture since ancient ti mes, perhaps even before the 4th Century A.D. They knew agriculture, metal works, weaving, and pott ery. This is obvious from the indigenous original Khasi words, such as nar (iron), rynnong (brass), ksiar (gold), tyrnem (Hammer), mohkhiew (hoe), wait (dao), sum (spear), rynti eh (bow), khnam (Arrow), shalyntem (wheel), jain (cloth), kynphad (cott on), ing (house), jingkhang (door), jingsop (roof), lyntang (plank), shang (basket), pdung (winnowing tray), kriah kynruh (sieve), thiar (granary), thied (to buy), die (to sell), iew (market), etc. Except horse, which was brought to India by the Aryans, they had all the domesti c animals of South East Asia.
(b) The Garos
According to a Garo legend which is remembered even today, they came to their present home in the Garo Hills directly from Tibet in the pre-historic past. Their legendary heroes, Japa Jalinpa and Sukpa Bongipa led their ancestors in this long march. Aft er crossing the Brahmaputra they moved to the Assam Valley. There they were resisted by the king of that region, but with the help of a prince who married a Garo maiden they could survive and stay there. The prince, however, subsequently for some reasons, turned against the Garos. Then the Garos had to leave the place and move to a place in the Kamrup District. Some sett led there and others went to the southern hills. Till this day, the Garos believe Tibet was their original home.
There is, of course, a good deal of resemblance of the Garo language with the language of the Tibetans. Like the Tibetans, the Garos revere the ‘gong’. They also att ach great value to the Yak’s tail. In fact, the Garos have their own word for the Yak, which is ‘Matchik’ or Tibotni matchu’, that is ‘Tibetan cow’. The Yak is not found in the Garo Hills or in any other part of Greater Assam. However their physical features bear litt le resemblance to the Tibetans. Their religions, beliefs, customs, birth, marriage and funeral practi ces greatly diff er from those of the Tibetans.
In the pre-historic ti mes, there was a great infl ux to Burma through Assam from Western China via Tibet. Perhaps the ancestors of Garos were in that conglomerati on. Then in about 400 A.D. or sti ll earlier, they had to leave the Irrawady and Chindwin Valleys in Burma for Assam, being driven out by some stronger tribes.
2.2 Prelude to the State2 : The Briti sh Cabinet Mission, which visited India prior to Independence, advocated the consti tuti on of an Advisory Committ ee for matt ers pertaining to the administrati on
2 Meghalaya-Land and People (1991)
12

MEGHALAYA STATE DEVELOPMENT REPORTMEGHALAYA STATE DEVELOPMENT REPORT
of the tribal areas of the country. In appreciati on of the recommendati ons and in considerati on of the aspirati ons of the tribal people, the Consti tuent Assembly of India resolved on 24th January, 1947, to consti tute an Advisory Committ ee. This Advisory Committ ee subsequently formed a Sub-Committ ee for the North Eastern Fronti er (Assam) Tribal and Excluded Areas. The Sub-Committ ee submitt ed its report to Sardar Vallabhbhai Patel, Chairman of the Advisory Committ ee envisaging a scheme for incorporati ng the Sixth Schedule to the Consti tuti on providing for Autonomous District Councils for the hills areas of Assam. The proposals were carried by the Consti tuent Assembly following prolonged debate amidst considerable oppositi on. Thus followed the birth of the Autonomous District Councils in the districts of Garo Hills, Khasi & Jainti a Hills, Mikir Hills, North Cachar Hills and Lushai Hills of the then composite State of Assam.
Prior to the Consti tuti on came into force there were 25 Khasi States ,which were under the Syiems and acceded to the Domain of India individually between 1947 and 1948 immediately before the commencement of the Consti tuti on of India by instrument of accession signed by the Syiems of the Khasi States and the then Governor General of India late C. Rajagopalachari.
The part of Tribal areas as per Sub-para 2 of para 20 of the Sixth Schedule to the Consti tuti on of India that comprises the territories of Meghalaya are United Khasi and Jainti a Hills District and the Khasi States and also the Garo Hills. Further, The Parliament by Act No.55 of 1969 enacted The Assam Re-organisati on (Meghalaya) Act,1969 to provide for the formati on within the State of Assam an Autonomous State to be known as Meghalaya. The said Act came into force with eff ect from 12th January,1970.Secti on 3 of the said Act provides (1) on and from the appointed day, there shall be formed within the State of Assam an Autonomous State to be known as Meghalaya which shall subject to the provisions of Sub-Secti on(2) comprise the following tribal areas namely:
(i) The United Khasi-Jainti a Hills District as described in Sub-Paragraph (2) of paragraph 20 of the Sixth Schedule to the Consti tuti on (exclusive of the proviso thereto) but excluding the areas transferred to the Mikir Hills autonomous district by the noti fi cati on of the Government of Assam No.TAD/R/31/50/149, dated the 13th April,1951 and Secti on 3 of the Assam Reorganisati on (Meghalaya) Act,1969 (The Act No.55 of 1969) provides formati on of the Autonomous State of Meghalaya.As per secti on 3, the Meghalaya Autonomous State shall comprise the tribal areas namely the United Khasi –Jainti a Hills District as described in sub-paragraph 2 of para 20 to the sixth schedule is unambiguous and the United Khasi-Jainti a Hills District was stated to comprise Khasi States as well as Khasi Jainti a Hills District. The Autonomous State of Meghalaya as per Act No.55 of 1969 formed consisti ng of Khasi and Jainti a Hills District as well as Khasi States and the Garo Hills District.
(ii) The Parliament by Act No.81 of 1971 enacted the North Eastern Areas (Re-Organisati on) Act, 1971 to provide for establishment of States of Meghalaya etc., by reorganisati on of the
13

MEGHALAYA STATE DEVELOPMENT REPORTMEGHALAYA STATE DEVELOPMENT REPORT
existi ng State of Assam. The said Act came into force with eff ect from 31st December, 1971.Secti on 5 of the said Act provides for formati on of the State of Meghalaya and reads as under. On and from the appointed day there shall be formed a new State to be known as the State of Meghalaya, comprising- (a) The territories which immediately before that day were comprised in the Autonomous State of Meghalaya formed under Secti on 3 of the Assam Reorganisati on (Meghalaya) Act, 1969 (55 of 1969) and(b) So much of the territories comprised within the Cantonement and Municipality of Shillong as did not formed part of the Autonomous State and thereupon the said territories shall cease to form part of the existi ng State of Assam
Secti on 9 of the said Act amended the fi rst schedule to the Consti tuti on of India and provides for territories of the State of Meghalaya as specifi ed in Secti on 5 of the Act No.81 of 1971. As per secti on 5 of the said Act aft er the formati on of the State of Meghalaya pursuant to the formati on of the Autonomous State of Meghalaya comprising the area as specifi ed in sub-para 2 of para 20 of the Sixth Schedule, Act No 55 of 1969 the said territories shall cease to form part of the existi ng Assam.
As per the consti tuti onal provisions as well as the Act No.55 of 1969 and Act No.81 of 1971 State of Meghalaya comprises the erstwhile twenty fi ve States as well as United Khasi and Jainti a Hills Districts and the territories shall cease to form part of the existi ng State of Assam.
Two years aft er the formati on of the Autonomous District Councils, the hill people felt that the provisions of the Sixth Schedule were not adequate to meet their aspirati ons and desire to manage their own aff airs and to safeguard their interests. During 1954 the leaders of the Autonomous District Councils of the Lushai Hills, the North Cachar Hills, Mikir Hills, the Garo Hills and the United Khasi Jainti a Hills, in their conference at Shillong raised the demand for a separate Hill State. In the general electi ons of 1957, the demand for a separate State for the Hills area of Assam became the major issue under the banner of the Eastern India Tribal Union.
On 24th December, 1969, the Meghalaya Autonomous State Bill was passed by both Houses of Parliament, on the same day. The Autonomous State of Meghalaya within Assam was inaugurated by the Prime Minister, Shrimati Indira Gandhi at Shillong 2nd April, 1970. It was, however, soon found that the functi oning of an autonomous State within Assam was not workable. The Meghalaya Legislati ve Assembly aft er long drawn deliberati on demanded full statehood. Thirteen years later this dream was met. On 10th November, 1970, Prime Minister, Shrimati Indira Gandhi made a historic statement in Parliament announcing that the Autonomous State of Meghalaya would be raised to a full State. Parliament passed the North Eastern Areas (Re-organisati on) Act, conferring full statehood on Meghalaya on 30th December, 1971.
14

MEGHALAYA STATE DEVELOPMENT REPORTMEGHALAYA STATE DEVELOPMENT REPORT
2.2.1 Birth of a State Prime Minister, Shrimati Indira Gandhi inaugurated the full State of Meghalaya on 21st
January, 1972 at Polo Ground, Shillong, thus fulfi lling the long cherished politi cal aspirati on of the Hills People of the Khasi, Jainti a and Garo Hills. The word ‘Meghalaya’ was loosely used for a ti tle of a book to indicate the hilly region in the North East. When the State was being considered for formati on, the word was adopted for naming the State, as the areas were proverbially associated with clouds and rain.
Meghalaya, which is a Sanskriti sed word, literally means the ‘Abode of the Clouds’. The capital of the State is Shillong, one of the loveliest all-ti me hill resort in the east, oft en known the world over as the ‘Scotland of the East’.
2.3 Traditi onal Socio- Politi cal Systems in Meghalaya3 : In the Khasi and Jainti a Hills the traditi onal chiefs are Syiems, Lyngdohs, Sirdars Wahadars, Dolloi, Pator and Rangbah Shnongs or Village Headman. They look aft er the administrati on of the syiemships, elaka and villages according to the customs and traditi ons. These traditi onal socio-politi cal systems, are self-governing insti tuti ons and by and large, functi on in a democrati c manner.
The organizati on of the Traditi onal Khasi Insti tuti ons is a four-ti er structure -i. Ka Dorbar ka Hima Pyllun (Full State Durbars). ii. Ka Dorbar ki Laiphew Shnongs (Durbars of the thirty States/villages coordinated the aff airs
of the consti tuent village. iii. Ka Dorbar ki Kyntoit or Ka Dorbar Pyllun is a small council .iv. Ka Dorbar Shnong (Village or local Dorbar, which is the smallest council of people at the
village level. It meets frequently, has administrati ve, fi nancial and judicial functi ons. However, certain excepti ons like the ‘Sanda Tynger’ is the Council comprising of the various neighbouring villagers in the War area of Meghalaya bordering Bangladesh.
In the Garo Hills, the insti tuti on of Nokma ship and the village council are the two traditi onal insti tuti ons. However the Nokma does not enjoy autocrati c power as all the decisions are taken at a joint assembly of the village elders. In the Garo Hills each household acts as a socio-economic unit in the absence of specialized politi cal and economic insti tuti ons. Traditi onally, the insti tuti on of Nokma used to be the pivot of the village organizati on around which the basic network of the enti re society was interwoven.The acti vity in the village was guided by this informal system and the success of any development strategy depended on how well it integrated with this informal
3 Dr.Shreeranjan, IAS-Credit related Issues in Meghalaya (2006)
15

MEGHALAYA STATE DEVELOPMENT REPORTMEGHALAYA STATE DEVELOPMENT REPORT
mechanism and organizati on of the village. However, with increased economic acti vity and private ownership, and the emerging alienati on of land against traditi onal system the village insti tuti on is now transformed toward empowerment by a suitable model of democrati c and traditi onal form of representati ve.
2.4. Land Tenure System in Meghalaya4 : The chief characteristi c of the society is matrilineal system. Property is inherited through the youngest daughter/female relati ve, and therefore, property ownership mostly vests with female members. Thus enforcement of security by lenders for loans given in the name of male borrowers leads to problems at ti mes. The three predominant hill tribe groups in Meghalaya, each administrated by a District Council, have diff erent land holding and tenure system which are based on traditi onal practi ces and rights. 2.4.1 In the Garo Hills area, the community of land ownership and enjoyment is in vogue. All the village inhabitants are enti tled to culti vate whatever land they require, but traditi onally no individual member enjoys absolute ownership rights over the land culti vated by him. As soon as he stops making eff ecti ve use of the land, his rights cease to exist and the land goes to the joint possession of the village community. However, aft er seeking no-objecti on from the clan/community, individual Patt as are issued by the District Council which have legal and permanent individual ownership rights.
2.4.2 In the Khasi Hills area, the majority of the land belong to people and not the rulers nor the Government. The land tenure and sharing patt ern is slightly elaborate and complex. The landed property is classifi ed under ‘Ri Raid’ (community owned land or ‘public land’) and ‘Ri kynti ’ (private land’)
Ri Raid : Ri Raid lands are community owned lands. No individual has any proprietary rights over such lands but can be allott ed right to use and occupancy. A person acquires heritable and transferable rights on the Ri Raid Land by way of constructi on of a permanent building or buildings, or culti vati on of permanent crops and plants like fruit trees or converti ng it into wet paddy culti vati on, fi sh ponds, etc. The clans then have proprietary, heritable and transferable rights to these lands. These may include Ri Raid lands that are given to clans for any services rendered by them to the community. Upon transfer, the transferee of these lands acquires the same rights over these lands as were held prior to the transfer. Any person, who has been given a porti on of the Ri Raid and has developed it, has the right to sell/reclaim the expenditure incurred on the development/structures made on land when it passes or is transferred to another person. He may sell the produce of land
4 Dr Shreeranjan IAS-Credit Related Issues in Meghalaya (2006)
16

MEGHALAYA STATE DEVELOPMENT REPORTMEGHALAYA STATE DEVELOPMENT REPORT
but cannot sell the land as such. The owner has the right to sell the house property att ached to the land. In any event ownership rights of Raid land reverts back to the community if unuti lized by its owner.
Ri Kynti : Ri Kynti lands are private lands. The diff erent classes of Ri Kynti lands are : Ri Kur, Ri Nongtymmen, Ri Maw, Ri Seng, Ri Khain, Ri Duwat, Ri Khurid, Ri Bitor Ri Dakhol, Ri Shyieng, Ri Phniang, Ri lapduh, Ri Lynter, Ri Spah, Ri Longdung, Ri Pud, Ri Kut and Ri Lyngdoh, Ri Syiem and Ri Khain Raibuh.
The Syiem, the Sordars/Sirdarsor Nongsynshar have no right to sell or mortgage or transfer to any land other than the Ri Kynti or land privately owned by them. In case the Syiem or Headman should decide to do any of the above he must do so with the explicit consent of the Shnong (community) or the raid who have authority and powers of management vested in them according to customary laws and practi ces.
2.4.3 In the Jainti a Hills, there are two classes of land, one, the Hali lands, literally meaning “Irrigated Paddy Lands” and the other High lands. These two main classes of land are further subdivided into many diff erent classes. The Hali lands comprise of the Raj lands, the Service lands, Village Puja lands, private lands and Patt a lands. The High lands are divided into private lands and the unclaimed lands or government wastelands. Raj lands were the property of the former Syiems of the Jainti a Hills. Aft er the aboliti on of the offi ce of the Syiem by the Briti sh, these land were taken over the Briti sh and assessed by them for land revenue. The customary procedures of the Jainti as provided for the granti ng of these lands on lease to individuals. The occupancy rights would cease if these lands were unatt ended for three years.
The Briti sh regularized these customary procedures and issued periodic leases of these lands oft en for a period of 10 years. Services lands were given to the Dolois, Pators and other chiefs and offi cials as remunerati on for their services to the administrati on of the area.
Private lands are held by individuals and are transferred at the will of the owner. These are not assessed for revenue. Patt a or lease lands were allott ed and sett led by the Briti sh during their regime. The power to allot these lands to individuals or insti tuti ons now rest with the Khasi Hills Autonomous District Council. This is, however, in respect of the paddy fi elds only because the sett lement of the building site has been disconti nued by the District Council.
The State has however not completed the land revenue survey. Paper evidence for the tribal property is issued from various sources like District Councils, Syiem, Village Headman etc. this multi plicity someti mes creates doubts and problem as to the authenti city of the ti tle deeds and their enforceability in the court of law. However, the customary noti on about usage, rightsand apporti onment is being contextualized to modern day developments and realiti es in order to facilitate credit, and other documentati on and registrati ons under schemati c, projecti sed or personalized needs.
17

MEGHALAYA STATE DEVELOPMENT REPORTMEGHALAYA STATE DEVELOPMENT REPORT
Government of Meghalaya enacted the Meghalaya Transfer of land (Regulati on) Act in 1971, (Meghalaya Act. 1 of 1072) which regulated the transfer of land from a tribal to non-tribal and from non-tribal to another non-tribal. Secti on 1 of the said Act also exempts any transfer of land as security for any loans given by banks including the Co-operati ve Societi es. Such banks/Co-operati ves is required to be noti fi ed under the Act subject to certain conditi ons. In view of all these any piece of land owned by private individuals can be mortgaged to banks by the owner.
In large areas of the State, however, the ownership of the land rests with the community/village authoriti es/clans.
The Meghalaya Credit Operati ons and Miscellaneous Provision Act 1976 has made adequate provision to facilitate credit fl ow for agricultural purposes. The following are some of the important provisions of the Act which provides for creati on of charge and mortgage by banks.
o It shall be lawful for agriculturist to alienate his land or any of his interest and execute charge or mortgage on such land or interest in favour of the banks a security for availing bank loan as per Secti on 3 of the Act.
o According to Secti on 4 (1), it shall be lawful for agriculturist to create a charge on immovable property owned by him or crops raised by him in favour of the bank not withstanding the fact that he may not be owner of the land.
o As per Secti on 5 (1), Charge a land can be mortgaged to a bank by a simple declarati on by the borrower.
o Where diff erent mortgages/charges have been created, mortgage or charge executed in favour of the bank will have priority over others, as per Secti on 6 (1),
o According to Secti on 7 (1) of the Act, Register of the charge/mortgage shall be deemed to have been done if the bank sends the documents to the Deputy Commissioner or Sub- Registrar. Deputy Commissioner/Sub Registrar will record the facts/declarati on in the register.
o As per Secti on 8 (1), the bank will also give inti mati on of the charge or mortgage to the District Council/Revenue Offi cer and the District Council/Revenue Offi cer shall make a note of the parti culars of mortgage in record of rights.
o The offi cer of the State Government can issue order for recovery of the loan on request made by the banks and such order shall be deemed to be a decree of a civil court and shall be executed in the same manner as decree of such court, as per Secti on 10(2) of the Act.
o As per Secti on 11 (1) of the Act, banks shall have power to dispose off the property through Public aucti on and in case no person has off ered to purchase, Banks can acquire the same.
18

MEGHALAYA STATE DEVELOPMENT REPORTMEGHALAYA STATE DEVELOPMENT REPORT
o Secti on 11 (4) of the Act imposes a restricti on on the purchase of land by a non agriculturist, or above the prescribed ceiling or acquisiti on of land by a person not belonging to a parti cular tribe or Scheduled Caste or for fragmentati on of land.
However, under Secti on 4A.(b) of the Meghalaya Transfer of land (Regulati on) Act, 1971, it has been clearly provided that in respect of the land that cannot be disposed off to a tribal, an applicati on may be forwarded to the Deputy Commissioner of the respecti ve District for acquisiti on of land by the Government, and the Deputy Commissioner, may, by order, take over the land on payment of compensati on as specifi ed in the Land Acquisiti on Act, 1894.
2.5 VIth Schedule of Consti tuti on and Autonomous District Council.
Shillong, which was the seat of the Government of the erstwhile composite State of Assam, is now the seat of the State of Meghalaya. Part X of the Consti tuti on of India provides for the administrati on of the Scheduled and Tribal Areas. Arti cle 244(2) provides that the Sixth Schedule shall apply to the administrati on of the Tribal Areas in the States of Assam, Meghalaya, Tripura and Mizoram. This means that the tribal areas in these states will be governed not by the order provisions of the Consti tuti on relati ng to the States and Union Territories of India but by the provisions of the Sixth Schedule. The Sixth Schedule contained a self contained Code for the governance of the tribal areas. Paragraph 21 of the Sixth Scheduled empowers Parliament to make any changes in the provisions of the Sixth Schedule without going through the procedure laid down in Arti cle 368 for the amendment of the Consti tuti on.
Autonomous District Council were created in tribal areas for protecti on of tribal identi ti es, customs and rights under the provisions of the Sixth Schedule to the Consti tuti on of India, there are three such Councils in the State of Meghalaya namely :
1. The Garo Hills Autonomous District Council seated at Tura covering the East Garo Hills Districts, West Garo Hills District and South Garo Hills District.
2. The Khasi Hills Autonomous District Council seated at Shillong covering the East Khasi Hills, Ri-Bhoi and the West Khasi Hills Districts.
3. The Jainti a Hills Autonomous District Council seated at Jowai covering the Jainti a Hills
Even aft er the State was created in 1972, these enti ti es conti nued to exist. Under the Sixth Schedule of the Consti tuti on, the District Councils enjoy Legislati ve, Executi ve and Judicial Powers mainly over the following items :
1. Land other than reserve forests. 2. Forests other than reserve forests. 3. Use of any land or water course for agricultural purposes. 4. Regulati on in the practi ce of Jhum or other forms of shift ing culti vati on.
19

MEGHALAYA STATE DEVELOPMENT REPORTMEGHALAYA STATE DEVELOPMENT REPORT
5. Establishment of village or town administrati on including village or town police and public health and sanitati on.
6. Appointment and Succession of Chiefs and their powers. 7. Establishment of village or town Committ ees or Councils and their powers. 8. Regulati on of laws on inheritance of property. 9. Marriages.10. Social customs.
Legal Enti ty of District Councils: The Rules of 1951 framed under paragraph 2 (7) of the Sixth Schedule provides for the transacti on of business pertaining to the administrati on of the autonomous district. These Rules were amended from ti me to ti me to meet the requirement of the respecti ve District Councils. The Rules stated that the District Council is a body corporate and shall have perpetual succession and a common seal, and shall sue be sued by name. The District Councils have three wings, the Legislati ve, the Executi ve and the Judiciary.
Role of Legislati ve Wing : Every member of the council shall before taking his seat, make and subscribe before the Judge of the Council or some person appointed on this behalf by the Governor, an oath of affi rmati on that that he will bear true faith and allegiance to the Consti tuti on of India as by law established and that he will faithfully discharged his duti es. This form of oath or affi rmati on is the same as that prescribed in the Third Schedule of the Consti tuti on for similar representati ves of the people.
All questi ons at any sitti ng of the council shall be determined by a majority of votes of the members present and voti ng, other than the Chairman or a person acti ng as such however shall not in the fi rst instance, but shall have and exercise a casti ng vote in case an equality of votes.
The Council shall have the power to act notwithstanding any vacancy in the membership, and any proceedings in the council shall be valid even if it is discovered subsequently that some persons not enti tled to sit as members did sat and voted or otherwise took part in the proceedings.
The quorum to consti tute a meeti ng of the district council shall be six members of one-third of the total members of such council, whichever is greater. If at any ti me during the meeti ng of the council there is no quorum the Chairman or the person acti ng as such shall either suspend or adjourn the meeti ng unti l there is a quorum.
Role of Executi ve Wing: There shall be an Executi ve Committ ee of the District Council, with the Chief Executi ve Member and other members, to exercise the executi ve functi ons of the Council. The executi ve functi ons of the council shall be vested in the Executi ve Committ ee. There shall be a Secretary to the Executi ve Committ ee who shall be appointed by the Chief Executi ve Member. He shall not be a member of the district council.
20

MEGHALAYA STATE DEVELOPMENT REPORTMEGHALAYA STATE DEVELOPMENT REPORT
The Chief Executi ve Member shall be elected by the District Council and the other members shall be appointed by the Governor on the advise of the Chief Executi ve Member from amongst the members of the district council. The Chairman and the Deputy Chairman are not eligible to hold the Executi ve Committ ee to hold offi ce either as Chief Executi ve Member or as Member of the Executi ve Committ ee.
The Executi ve Committ ee is in actual fact the Government in the autonomous district as far as the subjects, which are entrusted to the district council, are concerned. All orders of instruments made or executed by the Executi ve Committ ee shall be expressed to be made by or by order of the District Council. Every such order shall be signed by the Chief Executi ve Member or the other Executi ve Members authorized in writi ng by the Chief Executi ve Member.
The Executi ve Committ ee shall dispose of all matt ers falling within its purview. The Committ ee however has to obtain fi nal approval of the District Council on any matt er or cases involving any important change in the administrati ve system of the autonomous district or any important departure from accepted policy or practi ce. The Committ ee shall also refer to the Council all proposals for making regulati ons, rules or laws as authorized by the Sixth Schedule; cases seriously aff ecti ng the peace or good government of any autonomous district or likely to aff ect the relati onship with such area; cases aff ecti ng the relati ons of the government with the autonomous area, and also all correspondence of importance with the government and all important appointments. The Executi ve Committ ee has the power to take immediate acti on in case of an emergency in respect of any of these matt ers, except when the Council is in session. Every such case shall have to be laid before the Council in its next session.
Role of Judiciary Wing: Paragraph 4 and 5 of the Sixth Schedule provides for the administrati on of justi ce in the autonomous district. These provisions empowered the District Council to consti tute Village Courts or Courts for the trial of suits and cases between the parti es all of whom belong to scheduled tribes within the autonomous areas. In such cases other courts in the state have no jurisdicti on and are excluded. The District Councils are empowered to appoint suitable persons to be members of Village Council Courts and Presiding Offi cers of such Courts. The Council may also appoint offi cers required for the administrati on of laws enacted by the district councils. The Governor may confer, on the Courts consti tuted by the council or the offi cer appointed for such purposes, the power for trial of suits or cases arising out of any law in force in the autonomous district. The Governor may also confer on these Courts the power for trial of off ences punishable with death, transportati on for life, or imprisonment for a term not exceeding fi ve years, under the Indian Penal Code or any other law applicable in the autonomous district. The Governor may also confer such powers as he deemed appropriate to the District Councils and the courts consti tuted by them, under the provisions of the Code of Civil Procedure or the Code of Criminal Procedure. On such conferment of powers the Councils, the Courts, the Offi cers appointed, shall have jurisdicti on to try the suits, cases or off ences.
21

MEGHALAYA STATE DEVELOPMENT REPORTMEGHALAYA STATE DEVELOPMENT REPORT
The High Court shall have an exercise jurisdicti on over the suits and cases empowered under paragraph 4 and 5 of the schedule. Under these powers the District Councils enacted their own Rules for the administrati on of justi ce. The United Khasi Jainti a Hills Autonomous District (Administrati on of Justi ce) Rules 1953 were noti fi ed on 18.12.1953. the Jainti a Hills District Council adapted these Rules for Jainti a Hills autonomous areas on 16.8.1967. Similarly the Garo Hills District Council brought into force the Garo Hills Autonomous District (Administrati on of Justi ce) Rules 1953.
Under these Administrati on of Justi ce Rules three classes of Courts were consti tuted by the District Councils. (i) The Village Courts (ii) the Subordinate District Council Courts and Additi onal Subordinate District Council Courts and (iii) the District Council Court. The Compositi on of these Courts from the village level right up to the district level and also their powers and procedure have been prescribed in detail in these rules. Powers of Village Courts : At the village level the complexion of the court refl ects the tribal traditi ons of the tribes for whom the district council is meant. Accordingly in the Khasi & Jainti a Hills where the Khasis and the Jainti as are the common stock, the persons consti tuti ng the courts are the traditi onal village heads and functi onaries. Whereas in Garo Hills the matt er is slightly diff erent. In Khasi & Jainti a Hills the traditi onal Chiefs and Headman elected according to custom are eligible to be members of the village courts. These are the Dolloi, Sirdar Raid, Basan, Lyngdoh, Lyngskor or the Headman of the village. The Village Court shall consti tute of not less than two members and not more than six members. The Chief Executi ve Member or a member of the Executi ve Committ ee is barred from being members of the court. These traditi onal chiefs or heads functi on as the chairman of the village courts and one of the members elected as the vice-chairman. The jurisdicti on of the court extend to the hearing and trials of suits and cases arising within the territorial limits of the village. Cases of a civil nature in dispute for an immovable property, falls within the jurisdicti on of the village court only if its locati on is within the village. All other cases qualifi es only if the parti es reside or hold land in the village. The village court can try off ences of pett y nature, simple assault and hurt, aff ront and aff ray, pett y theft and pilfering, drunkenness or disorderly brawling, public nuisance and simple cases of wrongful restrain.
In Garo Hills the village court consist of the Lasker of the Village or in a non-Lasker village a member of the village council nominated by the District Council. A Lasker is a head of a village or a group of villages. Besides the Lasker the court consist of two members of the village council elected by the village council by a majority of votes. The District Council may whenever it deems necessary appoint three persons from amongst the members of the village council to sit as a bench for the trial of any parti cular class or classes of suits and cases. The Lasker or member nominated by the District Council in a non-Lasker village shall functi on as ex-offi cio president of
22

MEGHALAYA STATE DEVELOPMENT REPORTMEGHALAYA STATE DEVELOPMENT REPORT
the village court. The District Council may nominate other person as president in place of the lasker. The jurisdicti on of the village court extend to the hearing and trial of suits and cases arising within the territorial limits of the village. It can try suits and cases in which both parti es belong to a scheduled tribe or tribal resident within its jurisdicti on. It can try cases of civil and miscellaneous nature failing within the purview of village tribal laws and customs; Criminal cases falling with the purview of tribal laws and customs and off ences of pett y nature, simple assault and hurt, aff ront and aff ray of whatever kind, drunken or disorderly brawling, public nuisance, and simple cases of wrongful restraint.
Village Courts are not competent to try off ences in respect of which the punishment of imprisonment is obligatory under the Indian Penal Code. They are not competent to pass sentence of imprisonment in criminal cases. They have to power to impose a fi ne upto a limit of Rs. 50/-.
The leader of the largest party/group returned to the Council is appointed by the Governor as the Chief Executi ve Member. On the advice of such C.E.M., a number of Members are appointed by the Governor as Executi ve Members. The C.E.M. and the E.Ms consti tute the Executi ve Committ ee of the Autonomous District Councils and exercise its Executi ve Powers.
Role of District Council in development works: The District Councils of the United Khasi-Jainti a Hills and the Garo Hills were formed in 1952, and the Jainti a Hills District Council was carved out of the former in 1967. Through the years the District Councils has adopted a more populist outlook and this has diluted its role to protect promote and preserve tribal custom, usage and traditi on. On the other hand they take up development works without infrastructure, resources in men and money.
For the purpose of development the State government support the Councils with grant-in-aid to fi nance the Council’s own development schemes to a limited extent. Specifi c schemes are also entrusted to the Councils for implementati on by the Government. The schemes are mostly confi ne to Land reforms and constructi on of buildings for the Council own needs. Further, under Arti cle 275(1), the Ministry of Tribal Aff airs release developmental fund through the State Government of the Autonomous District Councils. This fund is routed through the State Plan allocati on under grant-in-aids to the 3 (three) Autonomous District Councils for implementati on of their own Development Schemes, under the heading Financing own Plan Schemes and Constructi on of Building respecti vely. The approval outlay for the year 2008-09 is fi xed at Rs. 575.00 lakhs as grant-in-aid under Arti cle 275(1) for the purpose of Welfare and Development of Scheduled Tribe. The management of primary educati on also, had to be taken over by the Government under sub-paragraph (2) of paragraph 16 of the Sixth Schedule from all the three District Councils.
With the Government implementi ng schemes through their own departments and the Block Development Offi cers, the Councils has very litt le role in development to avoid duplicati on, wastage and mis-uti lisati on of funds.
23

MEGHALAYA STATE DEVELOPMENT REPORTMEGHALAYA STATE DEVELOPMENT REPORT
2.6 The Planning organizati on and machinery of the State5 responsible for the formulati on of the Five Year Plans, Annual Plans and all allied matt ers in the State is represented by the Planning Department. It is a coordinati ng and directi ve body between the Planning Commission and the State Government on all matt ers relati ng to planning and development for the State of Meghalaya.
Planning as an organised endeavour aims at promoti ng development and encompasses a wide range of thrust in economic and social spheres. The main task of planning may be expressed by the concepts and strategies which contains the focus on what would benefi t the people.
The primary goals of planning are to achieve stakeholder consensus regarding the objecti ves for the developmental programmes and managing funds. Planning for rural development implies both the economic bett erment of people as well as greater social transformati on. In order to provide the rural people with bett er prospects for economic development, increased parti cipati on of people in the rural development programmes, decentralizati on of planning, bett er enforcement of land reforms and greater access to credit are envisaged. Current thought to untangle the legacies of past with modern economic society, perhaps suggest that the development be dovetailed with reformed from customary system of more democrati c acti on for a meaningful parti cipati on of deriving the desired benefi ts. The State needs to push this forward.
The Planning Department works out the mechanism by which the resources and development aspirati ons are balanced and achieved. As per the Rules of Executi ve Business of the Government of Meghalaya, the Role and Functi on of the State Planning Department and its various facets may be viewed at htt p://www.megplanning.gov.in. Various Committ ees have been set up for each sectoral planning and development matt ers.
2.6.1. For Rural Development Programme there now exist the Block Development and Monitoring Committ ee6 (BDMC) in all the Community and Rural Development Blocks, a broad based single compact committ ee which superceded the earlier guidelines by merging the Block Development Committ ee and the Block Selecti on Committ ee which shall meet at least once in every quarter to discuss the faciliti es being created under the basic Minimum Services, Centrally Sponsored Schemes or State Government Schemes7 . Problems of social security, social assurance, social policy in the broad sense, closely depend, in classical discussion, on the anti theti cal character of equality and effi ciency. Social equality should be one of the central proclaimed goals of planning to connect with vast redistributi on from producti ve social groups and a general levelling of society.
5 Dr Shreeranjan(2008): ‘Planning organisation and machinery in Meghalaya’ http://www.megplanning.gov.in/planning_machinaries.pdf 6 The Constitution and function of the Block Development and Monitoring Committee may seen at appendix 17 For more information on Rural Development Programmes in Meghalaya the suggested site is www.megcnrd.gov.in
24

MEGHALAYA STATE DEVELOPMENT REPORTMEGHALAYA STATE DEVELOPMENT REPORT
The task ahead is to address regional disparity within the state and disparity that exists in the society.
2.6.2.The Backward Regions Grant Fund8 is designed to redress regional imbalances in development. The fund will provide fi nancial resources for supplementi ng and converging existi ng developmental infl ows into 250 identi fi ed districts. Ribhoi District, West Garo Hills District and South Garo Hills Districts are implementi ng this programme in Meghalaya. The existi ng Rashtriya Sam Vikas Yojana (RSVY) has been subsumed into the BRGF Programme. The erstwhile districts under RSVY will receive their full allocati on of Rs. 45 crore per district as per norms of RSVY. Thereaft er, they will shift to the BRGF mode of funding. A village based, parti cipatory planning process is envisaged in the scheme.
2.6.3. The Planning Commission introduced The Border Area Development Programme9 (BADP) which was started during the Seventh Plan with the twin objecti ves of balanced development of sensiti ve internati onal border areas through adequate provision of infrastructural faciliti es and promoti on of a sense of security amongst the local populati on. The programme was revamped in the Eighth Plan (1993-94), and extended to States which have an internati onal border with Bangladesh. The nature of the programme was changed from a schemati c programme with emphasis on educati on to a State level Programme with emphasis on balanced development of border areas. Meghalaya is one of the seventeen States covered by this programme. The planning process for the preparati on of comprehensive perspecti ve and annual plans for Villages and the Blocks on parti cipatory basis are envisaged on the lines of the guidelines issued by Planning Commission and contained in the Report of the Expert group on the Planning at the Grass root Level (Ministry of Panchayati Raj,2006). Preparati on of these village and block plans should be completed at the earliest, so as to enable the State Governments to eff ect appropriate integrati on with District Plans and the Annual Plans of the State.
2.6.4. Planning in respect of Agricultural reliance is infl uenced by two major factors: populati on growth and income growth. The experience of the last 36 years shows that carefully planned and administered economic assistance, combined with the fundamental eff orts of the State and its people, will in the long run establish a dynamic, self-sustaining agricultural system. The Planning Commission brought out a manual for Comprehensive District Agriculture Plan (C-DAP) to facilitate States in preparati on of DAPs. The main features of C-DAP manual, inter-alia, are: bott om-up approach in planning; establishment of Agriculture. Planning unit at Village, Block and District level; integrati on of village Agriculture Plan into Block into District into State Agriculture Plan acti ve involvement of PRIs at all levels in preparati on and approval of the DAP; inter-linkage
8 Information on this programme may be viewed at http://brgf.gov.im9 Log on to www.megbad.gov.in for more information
25

MEGHALAYA STATE DEVELOPMENT REPORTMEGHALAYA STATE DEVELOPMENT REPORT
of DAP with SREP and PLP. C-DAP Manual have been made available to the States for RKVY and an amount of Rs.10 lakh per district for reparati on of DAPs has been released. A new programme, viz. Nati onal Agriculture Development Programme10 (NADP)/ Rashtriya Krishi VikasYojana (RKVY) for which funds would be provided to the State Government as 100 percent Central Assistance has been launched. The Programme aims at achieving 4% annual growth in the agriculture sector during the XI Plan period, by ensuring a holisti c development of Agriculture and allied sectors. The RKVY is applicable to the enti re State Plan for Agriculture and allied sectors and seeks to encourage convergence with schemes like NREGS, SGSY and BRGF, etc. The State Government is required to prepare a State Agriculture Plan and also each district of the State is required to prepare its own District Agriculture Plan. During 2007-08, the Government of India had released an amount of Rs. 5.67 crore under Stream I of RKVY and another amount of Rs. 0.70 crore for preparati on of District Agriculture Plans, at the rate of Rs.10 lakh for each of the seven districts of the State as Central Assistance.
2.7 Other Master Plans: (a) Agriculture Planning and Informati on Bank11 (APIB) is a joint project developed for the East Khasi Hills District of Meghalaya by the North Eastern Space Applicati ons Centre(NESAC) in collaborati on with the Department of Agriculture, Government of Meghalaya. It is a single window access to knowledge related to agriculture and allied sectors useful for the farmers, extension personnel and planners. A team of Scienti sts/Engineers from NESAC with the support of District Agriculture Offi cer (DAO), Agriculture Extension Offi cer (AEO) under the guidance of Project Director, APIB conducted a primary survey through a structured questi onnaire (designed in Khasi language) and got feedback from farmers and extension personnel in the district, and a comprehensive report on the informati on needs expressed by them was brought out. This report formed the basis for the subsequent development of the APIB. It contains informati on modules on natural resources, provides block-wise details of the Land resource Development Plan (LRDP), current Land Use Practi ces, Soil Type map , Ground Water Prospecti ve map and Watershed map. Following fi ve themes provide the Natural resources potenti al, development, appropriate land use planning for the District of East Khasi Hills block-wise:
• Land Resource Development Plan (LRDP)• Land use Land Cover (LU/LC)• Soil• Ground Water• Watershed
10 For more information log onto www.megplanning.gov.in For more information on this programme log onto http://agricoop.nic.in/Rkvy/agenda251108.pdf11 For more information log on to http://megapib.nic.in/ and http://megapib.nic.in/about_apib.htm
26

MEGHALAYA STATE DEVELOPMENT REPORTMEGHALAYA STATE DEVELOPMENT REPORT
The Agriculture Department was to work upon completi ng such APIB in collaborati on with NESAC and other districts also for rest of the district and state APIB.
(b)Various Sectoral Meeti ng of NEC & DONER 12 : Various Sectoral Summit Meeti ngs on Roads, Railways, Power, Tourism, Aviati on, Educati on, Agriculture and allied , Rural credit, Arts and Culture, Business Summits within and outside the country etc coordinated by NEC and Minister of DoNER brought to the fore need for perspecti ve plan and masterplans for concerned sectors. In parti cular, Infrastructure related masterplans was stressed for each State. The concerned Sectors must address these as a priority and without delays in the matt er.
Summary and Conclusion:
Meghalaya emerged from tribal areas of Assam as defi ned in the 6th Schedule of the Consti tuti on. Various ethnic systems, traditi ons and customs put identi ty as a quest with simultaneous approach to dream of modern developed norms of society.
Meghalaya, being one of the 6th Schedule Areas where the provisions of 73rd and 74th
Amendment of the Consti tuti on do not apply, follows a diff erent development and planning approach in formulati on of Annual and Five Year Plans. The present development planning structure consists of mainly the Planning Board at the State level and the District Planning and Development Council (DPDC) at the district level. In 2004, another level of planning organizati on was added namely the two Regional Planning and Development Councils (RPDCs) which are largely non functi onal. Presently the State Planning Board and the DPDC are getti ng more broad based but requires more reformed transiti on and transformati on towards a meaningful decentralisati on of authority and responsibility.
In the Panchayati Raj States (73rd and 74th amendment of the Consti tuti on States), besides, the organized structure, the provisions clearly spell out a direct role for the people through the Panchayats in planning, formulati on and implementati on of development projects, revenue generati on and devoluti on of Finances and power and responsibility for implementati on. This is
backed up by delegati on of powers to the Panchayats in monitoring of development schemes and in relati on to 29 subjects contained in the Eleventh Schedule.
The formulati on of district plan by the DPDCs in Meghalaya is largely based on departmental proposal submitt ed by the district offi ces with inputs from MLAS and MDCs etc. The district plans prepared by the DPDCs are essenti ally edited compilati on of departmental proposals to fi t in the cast of budget or noti onal fi nancial outlays. In the formulati on of the State plan, while theoreti cally
12 http://mdoner.gov.in/index1.asp?linkid=126
27

MEGHALAYA STATE DEVELOPMENT REPORTMEGHALAYA STATE DEVELOPMENT REPORT
the document should incorporate district plans forwarded by the DPDCs, oft en the plans are formulated and compiled by the various sectoral heads, deliberated with the Planning Board and fi ne tuned by the Planning Department from the sectoral proposals of various Government Departments in line with guidelines set out by the State Government and the Planning Commission. In doing so the essenti al advisory and feedbacks of State Planning Board, and other State level enti ti es are taken on board to the extent desirable and considered necessary.
There is an urgent need to redesign insti tuti ons to empower and ensure parti cipati on of people in Planning the development. The State needs to evolve such meaningful acti on frame for various sectors in parti cipatory and synergisti c manner to make inclusive growth and development a reality.
28

A GARO COUPLE A JAINTIA COUPLE
A KHASI COUPLE
LAND
AND
PEOPLE

MONOLITHS AT NARTIANG
U KIANG NONGBAH MEMORIAL, SYNTU KSIAR, JAINTIA HILLS

Nokrek Peak
Borang (Tree Top Watch Tower)

DOUBLE DECKERROOT BRIDGE(NONGRIAT)
VIEW OF FLOODEDSYLHET PLAINS
NOHKALIKAIWATERFALLS

MEGHALAYA STATE DEVELOPMENT REPORTMEGHALAYA STATE DEVELOPMENT REPORT
CHAPTER III
DEVELOPMENT AND MANAGEMENT OF NATURAL RESOURCES
Introducti on Meghalaya is one of the smaller States of the country. The man to land rati o is quite favourable as compared to some of the other States and the populati on density as per the 2001 census is approximately 103 persons per square kilometre. As per the land use stati sti cs for 2005, a large part of the geographical area of the state is under forests. The net sown area is about 230,000 hectares, which is only 10.33 percent of the total geographical area of the State. More than 7 percent of the area is fallow.
Table -3.1 Land Use Patt ern
Land Use Area in ‘000ha PercentageTotal geographical area 2,243Reporti ng area for land uti lisati on 2,227 100.00Forests 951 42.70Not available for culti vati on 223 10.01Permanent pastures and other grazing lands 0 0.00Land under misc. tree crops & groves 155 6.96Culturable wasteland 441 19.80Fallow lands other than current fallows 162 7.27Current Fallows 65 2.92Net area sown 230 10.33
Source: Land Use Stati sti cs, Ministry of Agriculture, GOI,2005
3.0 Natural Resources Meghalaya is a land of abundant natural resources. It is a storehouse of many important minerals of economic signifi cance including coal, limestone, clay and silimanite. Coal and limestone at present are the most widely exploited. These minerals are a source of signifi cant earnings for the State. Water resources in the State include its lakes, rivers, streams, bheels and ground water. Meghalaya has been endowed with lush green forests
3.1. Soils1 :- The soil formati on in the State (pedogenesis) has been infl uenced by the geology, relief and climati c conditi ons prevailing in the region. There are four disti nct categories of soil in the State. The red loamy soils are found in the central Garo Hills region and upland zones in the Khasi and the Jainti a hills. The laterite soils are found in a broad belt extending from west to east in the northern parts of the State. Red and yellow soils with a fi ne texture ranging from loam to silty loam are found in the foothill regions along the east-west belt. These type of soils are suitable for rice and fruit culti vati on. The northern, western and southern parts of the plateau feature
1 Source: Reference: Meghalaya Land and People, R. Gopalakrishanan
29

MEGHALAYA STATE DEVELOPMENT REPORTMEGHALAYA STATE DEVELOPMENT REPORT
alluvial soils. These soils vary from sandy to clayey loam with varying amount of nitrogen content.These are rich in potash but have low phosphate content. Soil erosion is a major problem in the State. An esti mated 120 tonnes of soil per hectare are eroded every year. The most prominent cause of soil erosion in the State is Jhum culti vati on and unscienti fi c quarrying and mining. Nearly 1.102 million hectares in Meghalaya have been categorized as problem areas in terms of risk of soil erosion.
3.2 Water Resources:- The State is among the wett est regions in the world and the water resources support a rich aquati c biodiversity and provide potable and irrigati on water to the inhabitants of the State. Some of these water bodies also represent potenti al resources for the development of inland fi sheries.
In the Garo Hills, the important rivers of the northern system from west to east are the Kalu, Ringgi, Chagua, Ajagar, Didram, Krishnai and Dudnai. The important rivers of the southern system are Daring, Sanda, Bandra, Bhogai, Dareng and Simsang. Other rivers are Nitai and the Bhupai.
In the central and eastern secti on of the plateau the important northward fl owing rivers are Umkhri, Digaru and Umiam and the south-fl owing rivers are Kynchiang (Jadukata), Mawpa, Umiew , Myngot and Myntdu2 .
The total ground water resource potenti al is esti mated to be of the order of 1226.44 Million Cubic Meters (MCM). Out of these, nearly 1041.99 MCM are esti mated to be uti lized for irrigati on. Another, 184.88 MCM is assessed to be suitable for drinking purposes3.
The water resources in the State are currently threatened with contaminati on, siltati on and polluti on. The most serious threat to the water resources in the State is from unscienti fi c coal mining. The acid mine drainage from mines and leaching of heavy metals have contaminated many water bodies in the vicinity of these coalmines. A study has been carried out by the Centre for Environmental Studies, North-Eastern Hill University, Shillong, on the eff ect of coal mining in the Jainti a Hills 4. The study revealed that the colour of the water in the rivers in the mining areas had turned brownish to yellowish orange. The water in these areas was found to be highly acidic, and silt and suspended solids were deposited at the bott om of these water bodies. A high concentrati on of sulphate (between 78 to 168 mg/L) was also reported. It may be concluded that the situati on of water bodies near mining sites in the other districts would be no bett er.
2 Source: WebIndia123.com3 Central Ground Water Report 1981 on the website of North East Data Bank.4 Sumarlin Swer and O. P. Singh5 Source: The Geospatial Resource Portal: (http://www.gisdevelopment.net/)
30

MEGHALAYA STATE DEVELOPMENT REPORTMEGHALAYA STATE DEVELOPMENT REPORT
3.3 Biodiversity: The Meghalayan subtropical forests form one of the wett est eco-regions of the world with rainfall in some areas measuring up to eleven meters. The region has been considered among the richest botanical habitats of Asia. Even today, the Meghalayan hills support a vast variety of plants, mammals, birds and insects. These hills house several primiti ve tree genera such as Magnolia and Michelia and for families such as Elaeocarpaceae and Elaeagnaceae. The most bio-rich sites identi fi ed in Meghalaya are the Nokrek biosphere reserve in Garo Hills and the Balaphakram Nati onal Park along with some other parts of the Khasi and Jainti a hills.
The Sacred Groves of Meghalaya are a unique feature of the State. They have been preserved by the communiti es through the ages due to their religious signifi cance. Apart from religious acti viti es or rituals any producti on extracti on is strictly prohibited. These forests are very rich in biodiversity and harbour many endangered plant species including rare herbs and medicinal plants, including the famous Himalayan Yew. A baseline fl oristi c survey revealed that at least 514 species representi ng 340 genera and 131 families were present in these sacred groves In Meghalaya, all the diff erent classes of plant life, namely Parasites and Epiphytes, Succulent Plants and Trees and Shrubs, are found to occur naturally. The insect eati ng pitcher plant or Nepenthes Khasiana, a botanical wonder, is also endemic to Meghalaya. Meghalaya is also the home to an amazing variety of fruits, vegetables, aromati c plants, medicinal plants and condiments and spices. Not surprisingly, Meghalaya is considered by many to be among the most species rich eco-region in the Indian subconti nent.
3.3.1 Forests:-. As per the State Forest Report 2005, the total forest cover of the State is 9496 square kilometers, which is over 70% of the total geographical area of the State. Of these, 6491 square kilometres represent dense and moderately dense forests while open forests cover 10,384 square kilometres. The forests types in Meghalaya are classifi ed under the tropical type and the temperate type, mainly based on the alti tude, rainfall and compositi on of the dominant species5. The tropical forests are further subdivided into evergreen, semi-evergreen and moist and dry deciduous forests. These forests are a source of many valuable products including some highly valued varieti es of ti mber like teak, sal, ti tachap hollock, bela, gobra, chaplash, birch, walnut and mahogany. The other forest products include bamboo, bay leaves, cinnamon, citronella, honey, wax and lac.
____________________
31

MEGHALAYA STATE DEVELOPMENT REPORTMEGHALAYA STATE DEVELOPMENT REPORT
3.3.2 Forest Types6
The Brahmaputra valley sandwiched between eastern Himalayas in the north and the Garo, Khasi, Jainti a hills of Meghalaya in the south is a meeti ng ground of the temperate east Himalayan fl ora and the wet evergreen and wet deciduous fl ora. The Khasi-Jainti a hills functi on as a corridor of the Southeast Asian fl ora into the Indian subconti nent through the Arakan arc. The variati on of alti tudes and rainfall patt erns with generally high precipitati on, have played a signifi cant role in defi ning the ecological diversity of this region. Meghalaya has forests of the tropical and temperate type, depending mainly on the alti tude, rainfall and compositi on of the dominant species.
3.3.3. Tropical Forests:Tropical forests in the State are found in areas with elevati ons of upto 1200m. These forests are characterized by warm, humid climates. The average rainfall ranges from 100-250 cm. The tropical forests in Meghalaya are further subdivided into many subtypes such as evergreen, semi-evergreen, moist and dry deciduous forest, etc. Tropical Evergreen Forests: These forests usually occur in high rainfall areas and near the catchment areas. They are generally fragmented and seldom occur as conti guous belts. These forests form a closed evergreen canopy and support dense and impenetrable herbaceous undergrowth. The tropical evergreen forests support much of the State’s immense biodiversity. Tropical Semi-evergreen Forests: The tropical semi-evergreen forests occur in the northern and North Eastern slopes of the state with elevati ons of upto 1200 meters. These areas feature an average annual rainfall of about 1.5 to 2 meters and experience a relati vely colder winter. These forests are characterized by lesser species diversity as compared to the evergreen forests. Tropical Moist and Dry Deciduous Forests: The tropical moist and dry deciduous forests do not naturally occur in the state but are mostly the sub-climax type or man-made forests. These forests occur mostly in areas with lower elevati ons and an average annual rainfall below 1.5 meters. These forests are characterized by profuse fl owering and seasonally shed their leaves. Forest fi res are common in these forests. The trees of the deciduous canopy are always tall and straight with a spreading crown. Deciduous forests cover 2459.55 square kilometers and are distributed through out the State. The largest concentrati on is in the West Khasi Hills where they covers 1568.67 square kilometers. These forests support many trees of economic signifi cance including: Shorea robusta (Sal), Tectona grandis (teak), Terminalia myriocarpa, Sterculia villosa, Logerstroemia fl os-reginae, L. Porvifl ora, Morus laevigatus, Artocarpus chaplasha, and Gmelina arborea both as natural and as plantati ons. Other species such as Schima wallichii, Artocarpus gameziana, Tetrameles mudifl ora, Lannea coromandelica, Salmalia malabarica, Erythrina stricta, Premna millifl ora, Vitex peduncularis, Albizia lebbeck. Lucida, Terminalia bellirica etc. are also found in abundance in these forests.
6 Source: Meghalaya offi cial state portal
32
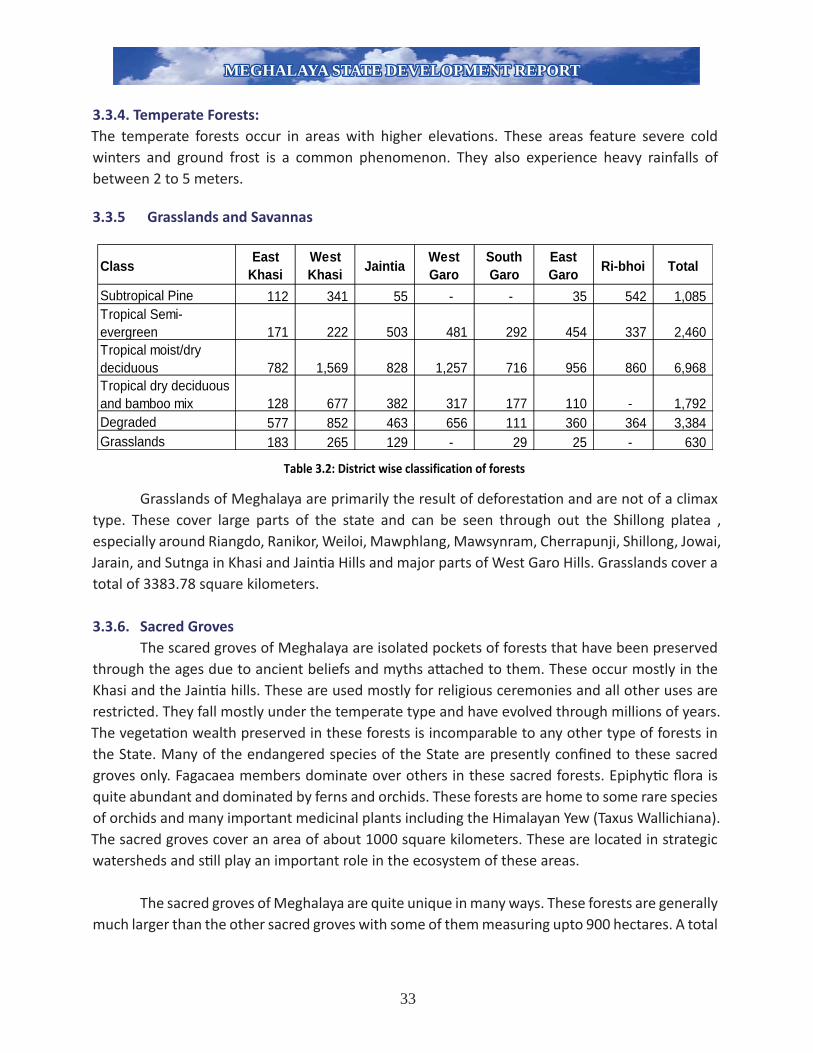
MEGHALAYA STATE DEVELOPMENT REPORTMEGHALAYA STATE DEVELOPMENT REPORT
3.3.4. Temperate Forests:The temperate forests occur in areas with higher elevati ons. These areas feature severe cold winters and ground frost is a common phenomenon. They also experience heavy rainfalls of between 2 to 5 meters.
3.3.5 Grasslands and Savannas
Class East Khasi
West Khasi Jaintia West
GaroSouth Garo
East Garo Ri-bhoi Total
Subtropical Pine 112 341 55 - - 35 542 1,085 Tropical Semi-evergreen 171 222 503 481 292 454 337 2,460 Tropical moist/dry deciduous 782 1,569 828 1,257 716 956 860 6,968 Tropical dry deciduous and bamboo mix 128 677 382 317 177 110 - 1,792 Degraded 577 852 463 656 111 360 364 3,384 Grasslands 183 265 129 - 29 25 - 630
Table 3.2: District wise classification of forests
Grasslands of Meghalaya are primarily the result of deforestati on and are not of a climax type. These cover large parts of the state and can be seen through out the Shillong platea , especially around Riangdo, Ranikor, Weiloi, Mawphlang, Mawsynram, Cherrapunji, Shillong, Jowai, Jarain, and Sutnga in Khasi and Jainti a Hills and major parts of West Garo Hills. Grasslands cover a total of 3383.78 square kilometers.
3.3.6. Sacred Groves The scared groves of Meghalaya are isolated pockets of forests that have been preserved through the ages due to ancient beliefs and myths att ached to them. These occur mostly in the Khasi and the Jainti a hills. These are used mostly for religious ceremonies and all other uses are restricted. They fall mostly under the temperate type and have evolved through millions of years. The vegetati on wealth preserved in these forests is incomparable to any other type of forests in the State. Many of the endangered species of the State are presently confi ned to these sacred groves only. Fagacaea members dominate over others in these sacred forests. Epiphyti c fl ora is quite abundant and dominated by ferns and orchids. These forests are home to some rare species of orchids and many important medicinal plants including the Himalayan Yew (Taxus Wallichiana). The sacred groves cover an area of about 1000 square kilometers. These are located in strategic watersheds and sti ll play an important role in the ecosystem of these areas.
The sacred groves of Meghalaya are quite unique in many ways. These forests are generally much larger than the other sacred groves with some of them measuring upto 900 hectares. A total
33

MEGHALAYA STATE DEVELOPMENT REPORTMEGHALAYA STATE DEVELOPMENT REPORT
of 79 sacred groves have been reported 7. These forests therefore perform a number of ecosystem services. Rodgers (1994) 8 has reported the following categorizati on of sacred groves in Meghalaya, which was formulated by Durbar of the Khasis in 1925:
• Ki Law Lyngdoh: forests under the control of the traditi onal religious leaders (now known as village councils). No public use of these forests is permitt ed.
• Ki Law Kyntang: forests of great sacred value. These are reserved for sacrifi cial and religious ceremonies.
• Ki Law Niam: religious forest (These may not be diff erent from the above).• Ki Law Adong: forest protected for non-commercial use, e.g. water.• Ki Law Shnong: forest resources for village use.
Brandis (1897)9 has reported the existence of Sacred Groves in the Garo Hills also. Bamboo reserves dedicated to deiti es have also been reported from the Garo Hills. The Garo people traditi onally perform ancestral worship in these sacred forest patches. During the last few decades, many of these forests have also been destroyed and put to agricultural and other uses. The degradati on of these forests have been att ributed primarily to the eroding social and religious values that had earlier helped in preserving these forests10 . At present, the Law Lyngdoh at Mawphlang and Mawsmai and The Law Kyntang in Jainti a Hills are perhaps the only sacred grooves in the state that are well preserved. While a number of other sacred groves in the state have been documented by the NAEB, Regional Center, Shillong, but so far litt le has been done to preserve them.
3.3.7. Recorded Forest Area: The state has a recorded forest area of 9,496 square kilometers, which is 42.3% of the state’s geographical area and 1.2% of the country’s forest area. Out of these, 6807 hectares are Reserved Forests and 1240 hectares are Protected Forests. While 1127.23 sq. km are classed forests, the remaining 850300 hectares are Un-classed Forests. The State Forest Department exercises control over merely 12% of the state’s Recorded Forest Area.
7 Tiwari, B.K., Barik, S.K. and Tripathi, R.S. 1999 Sacred Forests of Meghalaya.
8 Rodgers, W.A., 1994. The Sacred Grove of Meghalaya
9 Brandis, D. 1897. Indigenous Indian Forestry
10 Ritwick Dutta Community Managed Forests: Law, Problems and Alternatives
34

MEGHALAYA STATE DEVELOPMENT REPORTMEGHALAYA STATE DEVELOPMENT REPORT
Fig. 3.1 : Forest Cover Map of Meghalaya
Source: SFR 2005
The Reserved Forests are managed by the State Forest department under prescripti ons of the working plan prepared for such forests by the Working Plan Unit of the Department. The protected forests are managed for preserving the important catchments areas. Forests other than Reserved Forests are being managed by the respecti ve Autonomous District Councils. The Councils mainly manage three diff erent types of forests, namely: the old un-classed forests over which they exercise full control, the forests owned by clans or communiti es and the private forests. For the third category of forests, i.e. private forests, the role of the ADCs is limited to the collecti on of royalti es when ti mber from these forests is exported outside their own area.
Forest Class No. Area (sq. km)Reserved Forest 24 678.260Proposed Reserved Forest 1 2.400Nati onal parks 2 399.482Wildlife Sanctuaries 3 34.200Protected forests 4 12.180Green Blocks 1 0.210Parks and Gardens 0.500Total 1127.232
35

MEGHALAYA STATE DEVELOPMENT REPORTMEGHALAYA STATE DEVELOPMENT REPORT
Table 3.3 Classifi cati on of Forest (Source: SFR 2005)
Fig. 3.4 Forest Cover (Source: SFR 2005)(area in Km2)
2003 Assessment (Data of Nov. 2002 & Jan.-Feb. 2003)
2005 Assessment(Data of Nov.-Dec. 2004 & Jan. 2005) Total 2003
VDF MDF OF Scrub NF
Very Dense Forest 265 0 0 0 0 265
Modernity Dense Forest 8 6,778 0 0 0 6,786
Open Forest 65 30 9.706 41 32 9,874
Scrub 0 0 36 133 0 169
Non Forest 0 0 100 7 5,228 5,335
Total 2005 338 6,808 9,842 181 5,260 22,429
Net Change 73 22 -32 12 -75Table 3.5 : District-wise forest cover Number of Districts :7 (area in Km2)
2005 Assessment
District Geographic Area
VeryDenseForest
Mod.DenseForest
OpenForest Total Percent
Of G.A. Change Scrub
East Garo Hills TH 2,603 46 668 1,535 2,249 86.40 -8 14
East Khasi HillsTH 2,820 0 817 1,019 1,836 65.11 -2 80
Jainti a TH 3,819 101 973 1,152 2,226 58.29 42 11
Ri-Bhoi TH 2,376 128 773 1,098 1,999 84.13 30 1
South Garo HillsTH 1,849 25 731 919 1,675 90.59 20 0
West Garo Hills TH 3,715 0 884 2,090 2,974 80.05 -20 23
West Khasi HillsTH 5,247 38 1,962 2,029 4,029 76.79 1 52
Total 22,429 338 6,808 9,842 16,988 75.74 63 181
Source: SFR 2005
36

MEGHALAYA STATE DEVELOPMENT REPORTMEGHALAYA STATE DEVELOPMENT REPORT
3.3.8. Forest and Tree CoverAs per the State of Forest Report 2005, prepared by the Forest Survey of India, Meghalaya has a total forest cover of 16,988 square kilometers. This is 75.74% of the state’s total geographical area. Out of these 265 square kilometers (1.51% is of the state’s geographical area ) is very dense forest; 6786 square kilometers or 30.35% of the state’s geographical area represent moderately dense forests; open forests cover 9,874 square kilometers consti tuti ng 43.88% of the state’s geographical area. About 0.8 % area is scrub. The non forest area is about 5335 square kilometers or 23.45% of the state’s geographical area. Meghalaya has 2.3% of the country’s forest cover. In additi on, the state has another 405 square kilometers of tree cover. The total Culturable Non Forest Area (CNFA) is assessed to be 6,756 square kilometers. The CNFA has an average tree density of 15.1 trees per hectare.
Table 3.6 (‘000 Hectares)
YearReserved
ForestProtected
ForestNati onal Park Un-Classed Total
1 2 3 4 5 6
1994-1995 71.31 1.24 26.75 850.30 949.60
1995-1996 71.31 1.24 26.75 850.30 949.60
1996-1997 71.27 1.24 26.75 850.30 949.60
1997-1998 71. 27 1.24 26.75 850.30 949.56
1998-1999 71. 27 1.24 26.75 850.30 949.56
1999-2000 71. 27 1.24 26.75 850.30 949.56
2000-2001 71. 27 1.24 26.75 850.30 949.56
2001-2002 71. 27 1.24 26.75 850.30 949.56
2002-2003 71. 27 1.24 26.75 850.30 949.56
2003-2004 71. 27 1.24 26.75 850.30 949.56
Source : Principal Chief Conservator of Forest, Meghalaya
Dense Forest Open Forest Total PercentEast Garo 2,603 South Garo 1,849 East Khasi 2,820 997 1,557 2,550 90.43% 29Jaintia 3,819 890 1,047 1,937 50.72% 117Ri-bhoi 2,376 656 1,107 1,763 74.20% 68West Garo 3,715 1,002 1,590 2,592 69.77% 3West Khasi 5,247 1,098 1,869 2,967 56.55% 34Total 22,429 5,681 9,907 15,584 69.48% 259
8
(Area in Square Kilometers)
1,038 2,737 3,775 84.79%
Forest CoverDistrict Geographic Area Scrub
Table 3.7 : Forest Cover 2001 Assessment (SFR 2005)
37

MEGHALAYA STATE DEVELOPMENT REPORTMEGHALAYA STATE DEVELOPMENT REPORT
The highest forest cover in terms of percentage forest area exists in the East Khasi Hills District (90.57%), which accounts for nearly 16% of the total forest cover in the state. Jainti a Hills at 50.75% has the lowest forest cover in the state.
3.3.9. Change in Forest CoverThe forest cover change matrix indicates a net decrease of the forest cover of about 47 square kilometres between the assessment periods 1999 and 2001. While open forests increased by 197 square kilometres, dense forests decreased by 244 square kilometres. There has been 63 sq km additi on of forest cover over 2003 report in the SFR 2005.
Table 3.8 : Forest Cover Change – 1987-2005 (Area in Sq. km)
Assessment PeriodDense open Total
Forest cover change over 1987 (16466 sq Km)
1999 5925 9708 15633 - 8332001 5681 9903 15584 -10822005 7146 9842 16988 +522Change in 2001 0ver ‘99 -244 195 -49Change in 2005 0ver ‘01 1465 -61 1404
Source: SFR 2005 An analysis of the periods between 1987 and 2001 indicates that the forest cover in Meghalaya has been gradually decreasing since 1987. Except for the year 1991, which showed an increase of 231 square kilometres, all the other years’ assessments have indicated a decrease in the forest cover. The sharpest decline was recorded in 1989. However of late there has been some improvement which may be due to restricti ons and directi on of the Supreme court order.
3.3.10. Nati onal Parks and Wildlife Sanctuaries
Meghalaya has 2 Nati onal Parks, the Balpakram Nati onal Park and the Nokrek Nati onal Park. Meghalaya also has 3 Wildlife Sanctuaries namely, the Nongkhyllem Wildlife Sanctuary, the Siju Sanctuary and the Baghmara Sanctuary.
The Balpakram Nati onal Park was established in the West Garo Hills on 15 February 1987 and is spread over an area of more than 220 square kilometers. The vegetati on in this park consists primarily of tropical moist deciduous type with moist hill Sal as the dominant species. Mammals found in the Balpakram Nati onal Park are binturong, clouded leopard, leopard cat, wolf, sloth bear, elephant, loris and the serow. This park is also home to the python, the hornbill and the hoolock etc. During the month of April, the Balpakram plateau is covered with beauti ful wild fl owers and swarms of richly coloured butt erfl ies. The area is also one of the venues of man-elephant confl ict. Elephants commonly visit nearby villages and cause considerable damage to crops, parti cularly during the dry season, which oft en infuriates the local villages prompti ng them to att ack elephants11 .
11 Kumar, Y. and Rao, R.R. (1985). Studies on Balpakram Wildlife Sanctuary in Meghalaya
38

MEGHALAYA STATE DEVELOPMENT REPORTMEGHALAYA STATE DEVELOPMENT REPORT
The Nokrek Nati onal Park is also located in the West Garo Hills District, 60 kilometres from William Nagar and is spread over 68 square kilometers. The forests in this park are mainly tropical semi-evergreen and moist deciduous. This park is home to many mammals like the capped langoor, clouded leopard, leopard cat, fi shing cat, golden cat, Pangolin, wild buff alo, elephant, serow and the ti ger. The birds commonly found here are the hornbill, peacock, pheasant and hollock etc. This Nati onal Park is also home to the python. The mother germo plasm of Citrus-indica has also been discovered in Nokrek, which has resulted in the establishment of the Nati onal Citrus Gene Reserve here.
The Siju Wildlife Sanctuary was established on 30 March 1979 in the Garo Hills and covers an area of 518 hectares. The vegetati on consists mainly of hardwood species ranging to moist evergreen type. It is a haven for many rare and protected birds and animals including some rare species of bats. Important fauna include the Indian elephant (Elephas maximus), gaur (Bos gaurus), barking deer (Munti acus muntjak), sambar (Cervus unicolor), wild boar (Sus scrofa), common langur (Presbyti s entellus), white-browed gibbon (Hylobates hoolock), diff erent species of monkeys the ti ger (Panthera ti gris), and the leopard (Panthera pardus). The banks of the Simsang River is also the winter home to the Siberian ducks. The area has remained relati vely undisturbed due to its inaccessibility.
The Baghmara Sanctuary located in the South Garo Hills is the home of the famous Pitcher Plant (Nepenthes Khasiana).
Nongkhyllem Wildlife Sanctuary is located in the Ri-Bhoi district of Meghalaya and covers an area of 29 square kilometres. There are over 1000 taxa of vegetati on in the Sanctuary and surrounding forests. It is also a haven for nearly 30 species of mammals, birds, amphibians and repti les listed in schedule-1 of the Wildlife Protecti on Act. Globally endangered species found here are the Asian Elephant, Himalayan Black Bear, Royal Bengal Tiger, Clouded Leopard, Indian Bison, etc. There are about 400 species of birds in this area. Few endangered species of birds are the Swamp Partridge, Brown Hornbill, Rufous Necked Hornbill and Manipur Bush Quail. As per the offi cial website of the Ri-Bhoi district, the main problem faced by the sanctuary is poaching and hunti ng. Community hunters comprising large groups of villagers cause the most damage as they come fully armed and kill everything in sight. This practi ce is carried out as a yearly ritual12 .
The total area protected area under the protected area network is nearly 300 square kilometers. Meghalaya, incidentally, is among the states with the highest concentrati on of elephants in the country 13.
12 Source: http://ribhoi.nic.in/
13 Source: Forest Survey of India 1999 and webindia123.com
39

MEGHALAYA STATE DEVELOPMENT REPORTMEGHALAYA STATE DEVELOPMENT REPORT
3.3.11. FloraBecause of the diverse topography, abundant rainfall and varying climati c conditi ons, the state harbours diverse vegetati on types that range from tropical and sub-tropical forests to subtropical grasslands at higher elevati ons. Each of these vegetati on types contains wide variety of plant lives that include orchids, epiphytes, bamboos, ratt ans and a large number of trees, shrubs and herbs. A large variety of agricultural and horti cultural crops are also culti vated in Meghalaya. The fruits, vegetables, aromati c plants, medicinal plants and condiments and spices are grown at diff erent elevati ons and all these culti vated varieti es add to the state’s rich wild biodiversity. The total vascular plant diversity of the state described so far is 3331 14.
OrchidsMeghalaya is oft en called an orchid enthusiast’s paradise. The subtropical forests of Meghalaya are home to perhaps the richest variety of orchids. Of the 1250 orchid species found in India, Meghalayan forests are home to more than 300 species. The Khasi hills alone have about 250 species of orchids. The orchids of Meghalaya have distributi ons extending up to Sikkim, Bhutan, Nepal and China on one hand and Burma and Thailand on the other. Some orchid species however are found exclusively in Meghalaya. Many orchid varieti es are found in the sacred groves of Meghalaya. The important orchid species found in Meghalaya are Lady’s Slipper, Blue Vanda, Leopard Orchid, and Foxtail Orchid.
Ornamental PlantsMany Décor plants are found in Meghalaya including, Dahlia, Canna, Gladiolus, Begonia, Tropaeolum, Aster, Polargonium, Anti rrhinum, Crinum, Celosia, Kniphofi a, Impati ens, Chrysanthemum, Petunias, Pansy, Calendula, Sweet peas and Salvia. Many climbers like Bougainvillea, Rosa, Jasminum, etc are also commonly found.
3.3.12. FaunaMeghalaya is well known for its tremendous faunal wealth. It is considered by many biologists to have been the gateway through which many species of Indo-Chinese origin, parti cularly mammals migrated to Peninsular India. 50% of the total number of mammal genera found in the enti re Indian sub-conti nent can be seen in Meghalaya and its adjoining states in the Northeast. Out of these Meghalaya and some adjoining areas is the exclusive home to nine genera of mammals, such as Tupaia, Rhizomys, Cannomys, Chiropodomys, and Micromys etc. In all, about 450 species of birds and 110 species of mammals are found in Meghalaya
14 S.K. Barik, K. Haridasan, Dona M. Sangma, N.J. Lakadong and V. Manners (2007) Developing medicinal plant sector of Meghalaya: An action plan. Meghalaya State Medicinal Plant Board, Shillong and National Medicinal Plant Board, New Delhi.
40

MEGHALAYA STATE DEVELOPMENT REPORTMEGHALAYA STATE DEVELOPMENT REPORT
Mammals: Some species of diff erent families of mammals namely Primates, the Cats, Civets, Mongooses, Dogs, Bear, Weasels, Bats, Rodents, Elephants, Gaur, Wild Buff alo, Serow, Deer, Pigs and Pangolins are seen roaming in the forests of Meghalaya. In Meghalaya we come across apes as well as monkeys and lemurs. The only type of apes found in Meghalaya as also in India is Hoolock Gibbon. In Meghalaya, we have both macaques and langurs. Of the macaques, Rhesus Macaque and Assamese Macaque are found. The Golden Langur is a very rare species of Meghalaya and is on the verge of exti ncti on. They inhabit the evergreen forests of Meghalaya. Among lemurs, the Slow Loris is found in Meghalaya.
Birds: Magpie-Robin is a favourite bird to be seen in Meghalaya. The joyful notes and vivacity of the Red-vented Bulbul make it very popular in Meghalaya. The Hill Myna is usually found in pairs or in fl ocks in the hill forests of Meghalaya. In Meghalaya Sal forests, the Red Jungle Fowl is common but their populati on is dwindling fast. The Large Pied Hornbill and the Great Indian Hornbill are found in Meghalaya. The Great Indian Hornbill is in fact the largest bird in Meghalaya. The Peacock Pheasant can be seen in the forests of Garo and Jainti a Hills. In culti vati on fi elds and woodlands of Meghalaya, the Large Indian Parakeet is common. The Common Green Pigeon is found in fl ocks in woodlands of Meghalaya. The Black-necked Stork is a common bird on marshland, bheels, lakes and rivers in Meghalaya - usually found solitary, wading in shallow water. Blue Jay is a common bird, usually found around culti vati on fi elds near human habitati ons. The Kalij Pheasant is very fond of thick undergrowth in ravine forests, and frequents culti vati on around Hill villages in Garo Hills, Jainti a Hills and Khasi Hills. Among the Indian Great Horned Owls, the species found in Meghalaya is bengalensis.
Repti les and amphibians: The most commonly found amphibians in Meghalaya are frogs and toads. In Meghalaya four types of repti les are found - Lizards, Crocodiles, Tortoises and Snakes. Among the non-poisonous snakes found in Meghalaya, the following may be menti oned: Python, Blind snakes, Copper head, Green tree racer, Red necked Kulback. The poisonous snakes in Meghalaya include: Indian cobra, King cobra, Coral snake and Vipers. In Meghalaya, the fi sh species diversity is rich because of the presence of diverse waterbodies such as streams, rivers and bheels. Major carps such as Lobeo rohita, L. kalbasa, L. gonius, Katla-katla, Cirrhinus mrigala are the prized and most coveted fi sh species. Amongst the minor carps, Barbus, Sti gma, B. sarana, B. ti cto, B. conchonius, B. phutuna are also found. The jheels usually contained Joelfi shes like Channa striatus, C. punctatus, C. maruti us, Anabas spp., Clarias sp. Some of the species of fi shes in Meghalaya show cold hill stream adaptati on.
Butt erfl ies: Varied climate and multi ple plant life of near temperate to sub-tropical ones as also a richly diverse topography makes Meghalaya a natural storehouse of beauti ful butt erfl ies. About 250 species of butt erfl ies are found in Meghalaya, out of about 1,000 species seen in India. Some of the most exquisite varieti es of butt erfl ies of Meghalaya, which are admired all over the
41
MEGHALAYA STATE DEVELOPMENT REPORTMEGHALAYA STATE DEVELOPMENT REPORT
world are, Blue Peacock, the Kaiser-E-Hind, Leafs-Butt erfl y, the Dipper, and the Bhutan Glory. The Yellow Orange Tip has been recorded from Barapani during June. The Vagrant has been recorded from Nongpoh during February. The Common Blue Bott le has been recorded from Cherrapunjee, Mawphlang, Laitkor and Shillong during July to November. The Red-Breast Jazebel has been recorded from Nongpoh and Shillong during October.
3.4 Medicinal Plants15 The World Health Organisati on (WHO) esti mated that 80% of the populati on of developing countries relies on traditi onal medicines, mostly plant drugs, for their primary health care needs. However, plant based therapeuti cs are becoming popular in developed countries as well because of their lower cost and lesser side eff ects. In India they are used extensively in home remedies as well as in the Ayurveda, Siddha and Unani systems of medicine. Many substances used in the modern pharmaceuti cal industry are also of plant origin.
Internati onal market of medicinal plants is over US$60 billion per year, which is growing at the rate of 7%. India, at present, exports herbal material and medicines to the tune of Rs. 446.3 crores, which has the potenti al of being raised to Rs. 3000 crores in the next few years. China and India are two great producers of medicinal plants together having more than 40% of global biodiversity. With the revival of Indian traditi onal systems of medicine including Ayurveda in the recent years, there has been a growth in the domesti c demand for medicinal plants. The market of traditi onal medicines in India is esti mated to be nearly Rs. 4000 crores, out of which the Ayurvedic products market alone accounts for about Rs. 3500 crores. There are nearly 7800 manufacturing units in India producing traditi onal plant based medicines. The promoti on of medicinal plants can help achieve the three-fold objecti ve of economic progress, inexpensive health care and preservati on of biodiversity .
Meghalaya is known to be the home of 834 out of the 6000 medicinal plants found in India. There is an enormous scope for the state to emerge as a major supplier of medicinal plants to sati sfy domesti c as well as internati onal demand. Many of the herbal plants have great marketability in a semi-processed form and are currently a major item of illegal exports to other countries, routed mainly through Bangladesh. Their systemati c culti vati on and promoti on of drying/processing know-how has the potenti al of being developed into a promising rural industry and a tool of poverty alleviati on in the state. The State Industrial Policy has identi fi ed the promoti on of commercially viable medicinal plants as a thrust area. The descripti on of some important medicinal plants found in Meghalaya is given below.
15 S.K. Barik, K. Haridasan, Dona M. Sangma, N.J. Lakadong and V. Manners (2007) Developing medicinal plant sector of Meghalaya: An action plan. Meghalaya State Medicinal Plant Board, Shillong and National Medicinal Plant Board, New Delhi.
42

MEGHALAYA STATE DEVELOPMENT REPORTMEGHALAYA STATE DEVELOPMENT REPORT
Rauvolfi a serpenti na: Is also known as sarpagandha. It is the source of the alkaloid reserpine, which is considered a sympathomimeti c agent, one that targets thet sympatheti c nervous system. Reserpine has been found to lower blood pressure in very low doses. The esti mated domesti c demand is 588.7 tonnes per annum and the market price is esti mated to be Rs. 155 per kilogram. The natural reserves of this plant are declining and the plant is currently endangered. It is also listed in the Red Data Book.
Solanum Khasianum: Is commonly known as Ban-bhindi, Kandiari, Kantkari or Badi Kandiari is a rich source of splasodine used for the commercial producti on of steroidal drugs. It infl uences central nervous system.
Taxus wallichiana: Also known as Himalayan Yew. The bark, needles, leaves and twigs of Taxus baccata also known as yew are the source of a chemical compound that is used in the synthesis of taxol. Taxol has shown exciti ng potenti al as an anti -cancer drug parti cularly in the treatment of breast and ovarian cancers. This plant is in great demand in the internati onal market and fetches a very good price. The plant is endangered and is listed in the Red Data Book.
Swerti a chirata: Commonly known as chirayata is a bitt er tonic. It is useful in stomach ailments. The esti mated domesti c demand is 1284.7 tonnes per annum and esti mated market price is Rs. 280 per kilo. The plant is endangered and is listed in the Red Data Book.
Asparagus racemosa: Commonly known as Shatavar. The root of the plant is known to be useful as an anti septi c, diureti c and against dysentery. The esti mated market price is Rs. 30 per Kilogram and the esti mated domesti c demand is 16,658.5 tonnes per annum.
Berberis aristata: Common name Daruhaldi is anti pyreti c, anti periodic and diaphoreti c. The esti mated demand is 1829.4 tonnes per annum. The market price is about Rs. 10 per kilogram.
Nardostachys jatamansi: Known as Jatamansi is a very common ingredient in herbal medicines and cosmeti cs. The root and rhizome are the commonly used parts. It is a sti mulant, intesti nal tonic and useful in palpitati on of heart. The esti mated market price is Rs. 185 per kilogram. The plant is endangered and is listed in the red data book.
3.5. Prioriti zed Medicinal Plants of MeghalayaMeghalaya with its wide ranging alti tudes, forest types and resultant agroclimati c conditi ons off ers habitats for a very large number of medicinal plants. The richness is also the result of the people’s traditi onal knowledge on them. They diff er widely in their habit and habitat requirements. Though the fl ora is well known and many ethnobotanical publicati ons have been brought out, a consolidated account of the medicinal plant diversity is sti ll lacking. This is all the more essenti al when we consider diff erent tribes inhabiti ng diff erent districts with their diverse traditi onal practi ces. Altogether 834 medicinal plant species have so far been reported. The medicinal plant species of Meghalaya have been prioriti zed based on trade and high income, conservati on value
43

MEGHALAYA STATE DEVELOPMENT REPORTMEGHALAYA STATE DEVELOPMENT REPORT
and use in traditi onal systems of medicine. One hundred twenty one species were priority listed for trade and commercial purpose as follows: ten top priority species, twenty three Priority I species, thirty eight Priority II species, twenty three Priority III species and thirty seven Priority IV species. The medicinal plant species for insti tuti onal and home gardens were also identi fi ed. The top ten medicinal plants important from the trade point of view for Meghalaya are listed in Table.
List of Top Ten Prioriti zed Medicinal Plant Speciesfor Trade and High Income in Meghalaya.
Sl. No.
Botanical name Common name Areas of occurrence
1. Cinnamomum tamala Tejpat/bay leaf Sohra, West Khasi Hills, Ri-Bhoi and War areas of East Khasi Hills
2. Piper longum Pippali Throughout the state3. Aloe barbadensis Gheekwar Throughout the state4. Rauvolfi a serpenti ne Sarpagandha Garo Hills , Ri- Bhoi5. Symplocos racemosa Lodh/ lodh pathani Garo Hills , Ri- Bhoi, Grampanni6. Swerti a chirayita Chirayita Shillong, Jowai7. Acorus calamus Vaach Marsh, Tropical8. Homalomena aromati ca - Ri Bhoi, East Khasi Hills and Garo
Hills 9. Rosa damascena Gulab phool Shillong, Jowai10. Saraca asoca Ashoka Garo Hills , Ri- Bhoi
S.K. Barik, K. Haridasan, Dona M. Sangma, N.J. Lakadong and V. Manners (2007) Developing medicinal plant sector of Meghalaya: An acti on plan. Meghalaya State Medicinal Plant Board,
Shillong and Nati onal Medicinal Plant Board, New Delhi.
3.6 Developing Medicinal Plant Sector in the StateDespite the enormous potenti al of the medicinal plants, the producti on and marketi ng of medicinal plants is informal, ineffi cient and someti mes secreti ve. People are reluctant to take up large scale farming of medicinal plants. Some of the most important reasons preventi ng farmers to take up culti vati on of medicinal plants are as follows:
Research and development initi ati ves: The enti re process of collecti on and processing of medicinal plants is informal. There has been precious litt le research and development acti vity in this area. Systemati c culti vati on of medicinal plants has disti nct agronomical requirements. Research and development acti viti es are therefore required in the area of appropriate selecti on and identi fi cati on, propagati on methods, culti vati on techniques, harvesti ng, quality control, post-harvest treatment and storage. It is also important to focus the research on plants that are not already in abundant supply and for which the state does not have to compete with other states especially Utt aranchal and Himachal Pradesh.
44

MEGHALAYA STATE DEVELOPMENT REPORTMEGHALAYA STATE DEVELOPMENT REPORT
Training and disseminati on of know-how: Research and development acti vity must be followed up with training programs aimed at disseminati on of know-how among farmers in the state. Harvesti ng and processing of medicinal plants oft en requires “delicate labour” which women are capable of providing. Women as such must be specially targeted in such training programs. The fact that women contribute a large part of the labour in agricultural acti viti es in the State, especially in the Jhumia community, underscores the importance of women in such programs.
Quality control and internati onal standards: Indigenous materials are being used by societi es all over the world for health and beauty care. The worldwide acceptability depends upon the processes that are adopted in disti lling the acti ve ingredients. This has to be done in hygienic conditi ons without resorti ng to the use of such reagents in materials which themselves are either banned or not acceptable elsewhere in the world. There are internati onally accepted quality control processes and standards, which will fi rst have to be understood and applied.
Availability of quality planti ng material: Regular, consistent supply of good quality planti ng material and other essenti al inputs is criti cal to the success of medicinal plant culti vati on. This is a promising area to seek private sector involvement.
Food security issues: For long, the farmers in the state have been grappling with food security issues. Producing suffi cient good grain for the family is the farmer’s primary concern. The culti vati on of medicinal plants oft en involves long gestati on periods. It may therefore be diffi cult to persuade the farmers in the state to take up culti vati on of medicinal plants unless suffi cient support is provided to address the farmers’ food security concerns. In additi on, insti tuti onal measures such as crop insurance will also have to be introduced to miti gate the risks associated.
Supply chain management and marketi ng: Any eff ort aimed at promoti ng culti vati on of medicinal plants will invariably be counter producti ve if unless assured markets are made available to the farmers to dispose their produce. Currently there are no regular markets for medicinal plants in the state and farmers may initi ally require handholding through extension services to help them sell their produce.
A large proporti on of medicinal plants are collected largely from the wild. Non-sustainable harvesti ng of these plants has resulted in the depleti on of many of the species. Many of these plants e.g. the Swerti a chirata, Taxus Wallichiana and Nardostachys jatamansi are currently threatened and are listed in the Red Data Book. Some of these plants, such as the Taxus Wallichiana are also exported illegally to other states and to Bangladesh. Multi disciplinary interventi on needs have been emphasized for development of medicinal plant sector in Meghalaya.
In order to develop the medicinal plant sector, the coordinati on of all the agencies is criti cal, parti cularly the land-based departments, industries, research organizati ons and pharmaceuti cal companies. Besides, the interventi ons have to be multi dimensional, ranging from policy
45

MEGHALAYA STATE DEVELOPMENT REPORTMEGHALAYA STATE DEVELOPMENT REPORT
development to technology development and from extension to product marketi ng. Some of the acti ons required for the development of the sector have been classifi ed under short (0-3 years), medium (0-5 years) and long - term (0-10 years) plans and are listed in Box.
Box: Short, medium and long term plansShort-term plans• Market study on demand and supply of important commercial species.• Compilati on of existi ng agrotechnology (propagati on & culti vati on) in the form of a
manual.• A manual on post harvest technologies available and value additi on prospects of selected
species.• Creati ng Home and insti tuti onal garden packages.• Development of policies for medicinal plant conservati on.• Training and extension acti viti es such as awareness creati on, seminars, exhibiti ons,
workshops, exposure visits, fi eld tours, documentaries and videos and publicati ons.• Capacity building and human resource development in parti cipati ng insti tuti ons, drug
testi ng laboratories, folk healers, manufacturers, traders and culti vators.• Strengthening the existi ng labs and farms.Medium term plans• Documentati on of traditi onal health practi ces in the state.• Domesti cati on, nurseries and raising of quality planti ng stock.• Enumerati on of medicinal plants of the state.• Establishing demonstrati on farms and plantati ons in diff erent agroecosystems.• Preparati on of People’s Biodiversity Register for each village and networking.• Popularizing Herbal gardens.• Pilot projects on culti vati on practi ces (good agricultural Practi ces).• Pilot project on post harvest technology (Good manufacturing practi ces).• Pilot projects on value additi on (Good Manufacturing practi ces).Long term plans• Conservati on initi ati ves like establishment of MPCAs and Medicinal plant Reserves.• Establishment and maintenance of gene banks, medicinal plant gardens and germplasm
banks.• Strengthening network for trade and marketi ng of medicinal and aromati c plants and
products.• Linking and enforcing the internati onal policy and legal frameworks (CBD,WTO,FAO,
etc).• Establishment of value additi on centres and involving the self help groups in these
acti viti es• A dedicated Website for medicinal plants of Meghalaya.• Incorporati ng medicinal plants and traditi onal practi ces in the educati on curricula.• Introducti on of medicinal plants in working plans and PA management plans.
3.7. Major Threats to Biodiversity in MeghalayaThe forests of Meghalaya, which are home to rich biodiversity and are centres of origin of several crop species, are now facing threat of degradati on. A large secti on of the forests in the state have been cleared for shift ing culti vati on and for ti mber extracti on . Large scale unscienti fi c coal and
46

MEGHALAYA STATE DEVELOPMENT REPORTMEGHALAYA STATE DEVELOPMENT REPORT
limestone mining has also been a cause of concern for loss of biodiversity. Some of the major threats to biodiversity in the state are discussed in the following paragraphs.
Habitat Loss, Degradati on, and Fragmentati onHabitat loss, land degradati on, and fragmentati on are among the prime causes of loss of biodiversity in the state. Deforestati on due to Jhum culti vati on, mining and extracti on of ti mber have considerably altered the natural landscape of the state. There has been a signifi cant loss of forest cover in the past and many large conti nuous forests have been fragmented into smaller patches. This has caused the reducti on in populati on size of many species in the state. Many threatened categories of species such as Ilex khasiana are now facing the risk of exti ncti on.
Fragmentati on of the forests has the greatest impact on the elephant populati on. Meghalaya has the highest concentrati on of elephant populati on in the country and with the destructi on of their natural habitats and alterati on of their migratory tracts, the elephants are frequently straying into human sett lements causing increased man-animal confl ict. There have also been reports of elephants straying into Bangladesh from the Garo Hills and have caused damage to life and property in Bangladesh.
All species have specifi c food and habitat needs. The more specifi c these needs and localized the habitat, the greater the vulnerability of species to the loss of habitat to agricultural land, livestock, roads and citi es. In the future, the only species that survive are likely to be those whose habitats are highly protected, or whose habitat corresponds to the degraded state associated with human acti vity16.
Contaminati on and Silti ng of Water BodiesThe water bodies in Meghalaya are home to a large variety of fi shes, amphibians and invertebrate. The contaminati on of the water bodies due to Acid Mine Drainage originati ng from coalmines and leaching of heavy metals threatens to damage the fragile ecosystem existi ng in the state’s myriad water bodies. Amphibians such as frogs and toads with their porous skins are especially sensiti ve to human induced environmental changes. In additi on, silti ng of rivers, lakes and streams due to massive soil erosion is also a major cause of concern for aquati c biodiversity.
While uncontaminated water bodies in the state have a high diversity of aquati c life and insects, the same cannot be said of contaminated water bodies. Acid Mine Drainage threatens to eliminate
16 National Academics Press
47

MEGHALAYA STATE DEVELOPMENT REPORTMEGHALAYA STATE DEVELOPMENT REPORT
many aquati c insects such as Mayfl ies, Plecoptera and Caddis fl ies. Of these Mayfl ies are most sensiti ve 17 to these changes.
Smuggling of Timber and Other Forest Produce Biodiversity in the state is threatened due to smuggling of ti mber and other forest produce. Timber and other forest produce are illegally exported to other states as well as to Bangladesh. There are reports of spiralling illegal trade in the Himalayan Yew with Bangladesh. Unauthorized saw mills have come up in the neighbouring districts of Bangladesh. However, there has been a substanti al decrease in these acti viti es following the Supreme Court of India’s interventi on in 1996.
PoachingOn the basis of data collected by the Wildlife Protecti on Society of India, an NGO, poaching is being carried out on an increasingly organized scale in Meghalaya. The state’s border is a common poaching ground for elephants. The poachers hunt elephants from atop Machans 18. Other than the man-animal confl ict, elephants are poached for ivory, ribs and for meat. The other animals commonly poached include, small Indian civet, wild boars, barking deer, water monitor lizard, pangolin, common ott er, leopard, sambhar etc.
Mega Hydroelectric ProjectsThe state has a vast hydroelectric potenti al. Many mega hydroelectric projects are in the pipeline for constructi on to bring about development in the state by raising revenues through the sale of electricity. However, these mega projects would also threaten the rich biodiversity of the state if adequate conservati on and miti gati on eff orts are not launched with full seriousness.
Man-animal Confl ictDestructi on of the elephant’s natural habitat and migratory tracks, especially in the areas bordering Assam, coupled with a reported increase in the elephant populati on has resulted in elephant problem in many areas of the State. There are frequent reports of elephant intrusions resulti ng in the destructi on of fi elds and other property. This has aggravated the man-animal confrontati on, and villagers in those areas have become hosti le against elephants. There have also been reports of elephants from Meghalaya straying into Bangladesh from the Garo Hills. These animals had reportedly att acked people in Bangladesh. Due to this, Bangladesh had threatened to eliminate these animals, evoking vehement appeals from conservators in India and elsewhere.One of the most fundamental means to avoid man-animal confl ict is to protect existi ng elephant habitat from further degradati on and fragmentati on. Important elephant corridors should be
17 Sumarlin Swer and O. P. Singh18 The Assam Tribune, 29/01/2003
48

MEGHALAYA STATE DEVELOPMENT REPORTMEGHALAYA STATE DEVELOPMENT REPORT
identi fi ed and protected. In additi on, sensiti zati on of the local populati on must be done to avoid retaliatory att acks on elephants. Other means to avoid elephant intrusions may include, constructi on of elephant-proof barriers (trenches and electric fencings), deploying trained elephants (kunkis) and specially equipped squads 19, Seismic sensors and alarm systems may be deployed in frequently raided villages to track elephant movements. In additi onal to these traditi onal measures, some of the other measures that have been experimented elsewhere in the world include creati ng buff ers of “reduced att racti veness” around fi elds. These buff ers may contain rows of crops that the elephants fi nd unpalatable such as chillies and tobacco. Research has also been carried out to explore the possibiliti es for manipulati ng elephants’ behaviour using playback of vocalizati on. Experiments have also been carried out in Assam with some pungent varieti es of chilli to repulse elephants. Chilli smoke bombs and ropes smeared with chilli can also be used to keep the elephants away 20.
3.8. Mineral Resources 3.8.1 Introducti onMeghalaya has rich mineral deposits. The most important minerals found in the state are coal, limestone, clay and Kaolin and silimanite. Notwithstanding the controversies surrounding its reserves and extracti on, Uranium, of late has also assumed importance. Other minerals found in the state include phospherite, glass sand, granite, quartz and feldspar, gypsum, base metal, gold and iron ores. Coal and limestone are the only minerals being mined in the state at present. Mineral resources have a great bearing on the economy of the state and the life of its people. They have also aff ected the distributi on of populati on in the state.
3.8.2 Mineral Resources Occurring in the State21
Coal Meghalaya has rich deposits of coal that occur in every district of the state. The total esti mated inferred reserves of coal in the state are of the order of 640 million tonnes. Of these, Garo Hills alone has some 359 tonnes. The coal found in the state is mostly of sub-bituminous type and is commonly known as terti ary coal. It has low ash content and a very high calorifi c value, but suff ers from high sulphur content. It has a large number of uses including: power generati on, ferti lizer industries, smokeless coke, cement industries, texti le industries, paper industries, rubber industries and brick burning and pott ery industries.
19 Project Elephant - One Hundred-Twenty First Report on Action Taken by the Ministry of Environment & Forests presented to the Rajya Sabha on 4th February 2004.20 Source: “Chilli bombs to combat elephants” BBC News World Edition21 Source: Tables and Data – Directorate of Mineral Resources, Meghalaya
49

MEGHALAYA STATE DEVELOPMENT REPORTMEGHALAYA STATE DEVELOPMENT REPORT
Table – 3.9 Producti on of Coal
Period Jainti a Hills Garo Hills Khasi Hills Total2004-05 36,10,603 4,01,088 6,33,499 53,45,1902005-06 37,79,738 11,20,525 5,65,451 55,65,7142006-07 40,45,710 11,74,635 5,66,307 57,86,6522007-08 43,59,878 13,70,263 8,11,004 65,41,145
2008-09 (April – January) 23,86,242 10,90,170 7,58,496 42,34,908Source: DMR, GOM
The most prominent coalfi elds in the State are west Dadenggiri, Siju, Balpakram, Pyndengrei, Langrin, Mawlong-Shella, Laitryngew and Bapung. The total producti on of coal in the state was 5,439,268 tonnes during the year 2003-2004. Jainti a Hills is the largest producer of coal in the state. It produced 3,918,037 tonnes of coal in the same year accounti ng about 72% of the total producti on of coal in the state. Garo Hills produced 1,058,440 tonnes while Khasi Hills produced 462,791 tonnes of coal in that year.
Table 3.10 Export of Coal to Bangladesh
Period Jainti a Hills Garo Hils Khasi Hills Total2004-05 3,77,791 21,627 5,07,702 9,07,3002005-06 3,96,841 18,192 3,39,981 8,14,0142006-07 1,60,248 73,947 4,69,565 7,03,7602007-08 3,10,254 82,199 6,03,685 9,96,138
2008-09 (April – January) 1,31,917 52,447 5,52,177 7,36,541Source: DMR, GOM
Despite the large reserves of coal in the State, there is low domesti c consumpti on due to absence of industries. A large quanti ty of coal produced in the state is exported to other states and Bangladesh. The total export of coal to Bangladesh during the year 2003-2004 was 875,577 tonnes. The export of coal to Bangladesh has risen in the past few years. The state exported 767,637 tonnes and 755,032 tonnes of coal to Bangladesh in the years 2002-2003 and 2001-2002 respecti vely.
LimestoneThe state has very large deposits of limestone, especially along the southern border of Meghalaya. The total inferred reserve of Limestone in the state has been esti mated to be about 5,000 million tonnes. The limestone found in the state is of high quality and varies from cement grade to chemical grade. Chemical analyses have confi rmed its suitability for steel, ferti lizer and cement industries. In the chemical industries, it can be used in the producti on of precipitated calcium carbonate, calcium carbide, bleaching powder etc.
50

MEGHALAYA STATE DEVELOPMENT REPORTMEGHALAYA STATE DEVELOPMENT REPORT
Table 3.11 Producti on of Limestone (in Metric tonnes)
Period Jainti a Hills Garo Hils Khasi Hills Total2004-05 1,83,091 55,197 4,16,685 6,54,9732005-06 5,80,901 51,452 4,11,812 10,44,1652006-07 8,88,264 42,383 12,02,080 21,33,7272007-08 12,95,837 59,030 7,98,200 21,53,067
2008-09 (April – January) 12,62,957 52,751 16,97,843 30,13,551Source: DMR, GOM
Some important deposits are in Cherrapunjee, Mawlong-Ishamati , Komorrah, Shella, Borsora in Khasi Hills, Siju and Nangwalbibra in Garo Hills, Lumshnong, Sutnga, Nongkhlieh, Syndai and Lakadong in Jainti a Hills.
The ten functi onal cement plants in the State, 4 (four) in Jainti a Hills, 2(two) in East Khasi Hills, 2 (two) in East Garo Hills and 2 (two) in Ri-Bhoi Districts, having a total installed capacity of 6240 TPD, are the major in-house consumers of Meghalaya Limestone. Besides these, Limestone of Meghalaya is also expected to be uti lized in the 24 (twenty-four) numbers of cement Plants in the pipeline with total capacity of about 93590 TPD.
Table 3.12 Export of Limestone to Bangladesh ( in Metric Tonnes)
Period Jainti a Hills Garo Hils Khasi Hills Total2004-05 Nil Nil 1,72,760 1,72,7602005-06 Nil Nil 1,35,383 1,35,3832006-07 Nil Nil 5,92,859 5,92,8592007-08 Nil 5,37,696 5,49,957
2008-09 (April – January) Nil 14,55,506 15,16,683Source: DMR, GOM
The total producti on of Limestone in the State during 2003-2004 was 721,750 tonnes. The producti on of limestone in 2002-2003 was 640,992 tonnes and in 2001-2002 was 584,963 tonnes. While there has been a gradual increase in the producti on of limestone, the export of limestone to Bangladesh is gradually declining. The State exported 181,068 tonnes of limestone to Bangladesh in 2003-2004. The exports in the years 2002-2003 and 2001-2002 were 215,472 tonnes and 241,405 tonnes respecti vely.
Clay and Kaolin (China Clay)White Clay deposits are found to occur in various parts of the State. The sedimentary or Lithomargic clay occurs in the Terti ary Formati on, while Kaolin (China Clay) is associated with the Archaean gneissic rock. Physico-chemical tests have confi rmed the suitability of Meghalaya Kaolin for ceramic, paper and rubber industries. Fire Clay reserve of over 6 million tonnes with refractory characteristi cs is found to occur in Garo Hills. It is considered suitable for manufacture of Firebricks and Refractory industries.Sedimentary white Clay or Lithomargic Clay is found in Cherrapunji and Mahadek in Khasi Hills,
51

MEGHALAYA STATE DEVELOPMENT REPORTMEGHALAYA STATE DEVELOPMENT REPORT
Larnai and Tongseng in Jainti a Hills and Nangwalbibra and Rongrengiri in Garo Hills. The mineral may be used in whiteware industry. A probable reserve of about 90 million tonnes of this Clay has been esti mated.Kaolin or China Clay with total esti mated reserve of 4.5 million tonnes occurs around Mawphlang, Smit and Laitlyngkot in Khasi Hills, Thadlaskein, Shangpung, Mulieh and Mynsngat in Jainti a Hills and Darugiri in Garo Hills.
Table 3.13 Clay and Sillimanite
(In ‘000 Metric Tonnes)Period Clay Sillimanite
1970-71 16 31975-76 6 51980-81 16 4.41985-86 4 3.91990-91 NR* 3.11995-96 NR* Nil
NR – Not Reported.Source: DMR, GOM
There are no signifi cant mining acti viti es in respect of clay being reported aft er 1985-86. A small quanti ty of extracti on was reported before that.
Sillimanite
One of the best Sillimanite deposits of the world is found in the Sonapahar region of West Khasi Hills, where it is found in lensoid bands as well as fl oat ore. The fl oat ore is in the form of massive boulders up to 100 tonnes each.
The Sillimanite deposits occur in associati on with corundum, within the quartz- Sillimanite Schist, which forms a broad band that can be traced disconti nuously over the area. Black mica is also found present in the silimanite rock. The high alumina-content of the rock makes this mineral a natural refractory mineral of great commercial value.
The total inferred reserve of Sillimanite in Sonapahar is esti mated at 0.045 million tonnes. Small deposits in the form of fl oat boulders have also been found in Mawpomblang Village in the Khasi Hills. However no extracti on acti viti es are currently underway in respect of this mineral.
Phospherite
Phospherite is used mainly in ferti lizers. Nodules of Phospherite occur at the base of the Kopili Shale of Eocene age in Meghalaya. A phosphate deposit is located in the Sung Valley at the border of Khasi and Jainti a Hills Districts; besides, some Phosphati c nodules are also located in Rewak area of Garo Hills. The rock containing Phosphate in the Sung Valley is known as Apati te Magneti te rock, which has 15% to 30% of Phosphate-content. The reserves of Phosphati c rock as esti mated by Geological Survey of India is about 5 million tonnes.
52

MEGHALAYA STATE DEVELOPMENT REPORTMEGHALAYA STATE DEVELOPMENT REPORT
Glass-SandGlass-Sand or Silica-Sand occurs in the Khasi Hills and the Garo Hills. The biggest reserves of the mineral in the State are in Umstew, Khasi Hills, about 43 kilometers from Shillong along Shillong- Cherrapunjee road. Other minor reserves are in Kreit in the Khasi Hills and Tura in the Garo Hills. The total reserve of Glass-Sand in Meghalaya is of the order of 3 million tonnes.The sand contains a slightly high proporti on of iron, which is not suitable for the producti on of fi rst grade glassware. However bott les or sheet glasses may be manufactured from these sands where colour is not the sole considerati on. The Silica-Sand can also be uti lised in the manufacture of sodium silicate. The Assam Glass Factory at Guwahati uses this Glass-Sand and fi nds it suitable for the purpose.
Multi -coloured Granite and Black GraniteDeposits of multi -coloured Granite have been located in the area around Nongpoh, Mylliem and Mawkyrwat as well as in the area around Mendipathar - Songsak road. This granite is suitable for use as dimensional and decorati ve stones. The total reserves of granite are esti mated to be of the order of 25 million cubic meters. In additi on, Jenjal and Hallidayganj appear to have promising deposits of Black Granite, suitable for making polished blocks and slabs.
Quartz and FeldsparBoth Quartz & Feldspar are components of ceramic industry. These minerals are found to occur side by side in Pegmati te Veins in several localiti es of the Khasi and Garo Hills of Meghalaya. These minerals have been used in pott ery industries in Meghalaya and Assam. The total indicated reserves of Quartz & Feldspar deposits in Meghalaya are esti mated at 0.076 and 0.096 million tonnes respecti vely.
GypsumMinor deposits of Gypsum are reported to occur in Mohendraganj and Harigaon in West Garo Hills where it occurs as minute crystals in the gypsiferous shale. The concentrati on of Gypsum in shale is 0.07%. Due to the uneconomic concentrati on of gypsum in the host rock, this reserve has not been accorded much importance. There has not been much eff ort to esti mate the reserves of gypsum in the State.
GoldGold tenors were recorded in three boreholes of the twelve boreholes drilled for detailed investi gati on in Tyrsad, Khasi Hills. The maximum thickness of gold bearing rock was recorded at 2.90 meters. In the core samples, the gold-content is found of the order of 0.8 gram/tonne to 62 gram/tonne, which is economically unviable for extracti on. Traces of Gold have also been reported from rocks around Tyrsad in the Khasi Hills.
53

MEGHALAYA STATE DEVELOPMENT REPORTMEGHALAYA STATE DEVELOPMENT REPORT
UraniumIn 1984, India’s Atomic Minerals Division found huge uranium oxide deposits at Domiasiat and then at Wahkhen, both in the West Khasi Hills, close to the State’s border with Bangladesh. In 1992, the division completed its investi gati on and presented a fi nal assessment of the deposit.The total deposits of uranium in the State are esti mated to be about 13,500 tonnes and Meghalaya at present accounts for nearly 16% of India’s uranium reserves. The deposit at Domiasiat is esti mated to be about 9,500 tonnes while that at Wahkhen is esti mated to be about 4,000 tonnes. The quality of uranium ore at Domiasiat and Wahkhen is much bett er than at India’s other uranium mining area namely Jadugoda in the northern state of Jharkhand. While the recovery percentage at Jadugoda is about 0.02 to 0.06, the percentage is as high as 0.1 in Domiasiat. There could even be more uranium in Meghalaya but since mining operati ons have not commenced on the existi ng deposits, the Atomic Minerals Division has stopped exploring more reserves 22.
Base MetalGeological and Geophysical investi gati ons as carried out by the Geological Survey of India in a Shear Zone from Tyrsad to Barapani in the Khasi Hills have not indicated any rich zones of sulphide mineralisati on, but established the occurrence of copper, zinc, nickel and cobalt, in the Shillong group of rocks and metadolerite of the area. At Umpyrtha of Khasi Hills, the polymetallic base metal mineralisati on within the Archaean gneissic complex occurs disconti nuously for about 5/6 KMs zone form Umpyrtha to Patharkhmah.In the Umpyrtha block, the zones of polymetallic sulphide mineralisati on indicate the presence of copper (1% to 1.5%) and zinc (2.25%) along with traces of molybdenum and tungstenCopper, lead and zinc have been found to occur in the form of disseminated, specks rocks in Umpyrtha on the northern fringe of Khasi Hills, 60 km away from Guwahati . The probable reserve of these metals is esti mated to be about 180,000 tonnes.Banded-haemati te quartzites have been found in associati on with the gneissic complex at Aradonga, Athiabari and Nishangram areas of Meghalaya. However no major mining work has yet been undertaken.
3.9. Revenue Receipts from Major MineralsThe State generated Rs. 862,509,004 as revenues from the extracti on of major minerals in the year 2003-2004. A majority of these receipts came from royalti es on coal amounti ng to Rs. 844,283,333. Royalti es and dead rent on limestone fetched Rs. 10,862,059 in the same year and mineral cess amounted to Rs. 4,327,299. Revenues receipts from major minerals in the years 2001-2002 and 2002-2003 were Rs. 633,589,926 and Rs. 561,057,697 respecti vely.
22 A BBC News report quoting a senior UCIL offi cial
54

MEGHALAYA STATE DEVELOPMENT REPORTMEGHALAYA STATE DEVELOPMENT REPORT
Table 3.14 Revenue Receipts from Major Minerals.
Parti culars 2004-05 2005-06 2006-07 2007-082008-09
(April – Feb)Royalty on Coal 8878.02 9477.41 10158.90 11420.39 9213.87Royalty/Dead Rent on Limestone
113.56 234.18 644.66 827.56 812.18
Mineral Cess 33.62 43.97 98.54 116.55 590.90Mining Lease Fess 0.18 0.92 0.28 0.41 0.10Total 9025.38 9756.48 10902.38 12364.91 10617.05
Source: DMR, GOM3.10. Some Issues Related to MiningMeghalaya has tremendous mineral wealth. However the State has not been able to derive opti mum benefi t from this wealth. The level of mineral exploitati on is poor and the capti ve uti lizati on is low. Some of the major impediments to the growth of mining in the state are listed below.
Unscienti fi c Mining Methods
In Meghalaya, most of the coal reserves are on private lands. Private individuals therefore control most of the mining acti viti es in the state and government has litt le control over coal mining in the state except collecti on of royalti es from the sale of coal.
The mining method employed in Meghalaya is the age-old rat-hole method. In this method a narrow hole is made for the extracti on of coal and as coal is extracted, the hole gets deeper and deeper. Depending upon the availability of coal, long horizontal burrows are also dug up. Small handcarts are used to carry the coal to nearby dump from where it is transported on trucks. This method is very ineffi cient and perilous. The rate of recovery of coal in rat-hole mining is very low as compared to opencast mining.
Environmental Consequences
Unscienti fi c coal mining in the State has caused major damage to the environment. One of the most percepti ble damages caused by rat-hole mining is the degradati on of land. There are thousands of rat-hole pits abandoned aft er extracti on of coal in the State. These pits get fi lled up with water during rain. This water percolates into ground water or fl oods into rivers and streams and pollutes the water resources in the State. In additi on, the soil extracted from these mines washes away into nearby streams and lakes causing siltati on and increasing the risk of fl oods. The sulphur present in the coal makes the water acidic and has converted many agricultural fi elds in the state into unusable inferti le land. Besides, the tracks made near the coalmines to transport the coal to the nearby roads cover a much larger area and cause a lot more damage.
Socio-economic Consequences of MiningMining acti viti es have also caused migrati on from Nepal and Bangladesh into the State. These workers are employed with mine owners for paltry wages and with few faciliti es. These labourers
55

MEGHALAYA STATE DEVELOPMENT REPORTMEGHALAYA STATE DEVELOPMENT REPORT
work under very hazardous conditi ons and medical att enti on in case of ill health and accidents is diffi cult to fi nd.Since the mining operati on is concentrated with a few individuals, the benefi ts from the natural wealth of the state accrue to a select group of individuals and not to the public at large. Some mine owners in Jainti a hills have benefi ted from extensive coal mining on their lands but a large populati on is suff ering from the adverse consequences of the mining. Besides, there is a visible gap between the rich and the poor. This rich and poor divide has been att ributed to the unrest in some areas, especially among the youth. Damage to RoadsMiners oft en use old army disposed off Shakti man trucks to transport the coal. These four-wheel driven trucks have a greater tracti on and are oft en overloaded due to which they cause extensive damage to the roads in the areas where they ply. The PWD roads in and around Sutnga Village near Jowai suff er extensive damage due to the heavy traffi c movement. The Rat-holes dug very close to the roads also cause the roads to sink, causing extensive damage to the roads.Health HazardsBy contaminati ng rivers, streams, lakes and other sources of fresh water in the State, unscienti fi c mining acti viti es pose a serious threat to the health of local inhabitants. Mining also adds dust to the air thereby imperilling the health of the local inhabitants. Polluti on from increased vehicular traffi c due to mining acti viti es, suspended parti culate matt er and gaseous emissions make matt ers worse.
3.11. Impediments to Development and Management of Mineral ResourcesLand Tenure SystemDue to the prevailing land tenure system, the government owns very litt le land in the State. This makes it very diffi cult for the government to regularize mining in the State. This also hampers any real assessment of the adverse eff ects of unscienti fi c mining on private land or to take measures to miti gate these adverse eff ects. Controversies Surrounding Uranium MiningSizeable deposits of very high quality uranium have been found at Domiasiat and at Wahkhen in the West Khasi Hills near the border with Bangladesh. These deposits consti tute nearly one-sixth of India’s total uranium reserves. It is esti mated that there could be more reserves but no further explorati on is being carried out. Uranium Corporati on Of India Limited (UCIL)’s eff ort to mine uranium in the State have met with resistance over fears of radiati on related health hazards in the villages near the mining sites. Industry-environment Confl ictMeghalaya has some of the largest limestone deposits in the country. A signifi cant percentage of the limestone in the state lies in the state’s many limestone caves. These caves are extraordinary and have signifi cant aestheti c as well as environmental appeal. According to a survey by the ZSI,
56

MEGHALAYA STATE DEVELOPMENT REPORTMEGHALAYA STATE DEVELOPMENT REPORT
some of these caves are the only known home to some of the rare species of bats23 . These caves also provide signifi cant tourism potenti al and have elicited interest among cavers and adventurers across the world. The development of cement and other industries that use limestone may provide impetus to limestone mining in the State. However, it also threatens to damage the country’s largest limestone cave network, thereby eroding the state’s tourism potenti al and jeopardizing the biodiversity of the State. The proposed ACC cement plant near Balphakram Nati onal Park in the Garo Hills met with sti ff resistance from environmentalists as it threatened to disturb a crucial elephant corridor that passes through the Siju Sanctuary. The Indian Bureau of Mines, Nagpur (IBM) has been entrusted to fi nd out whether the two cement plants that have come up in Lumshnong in Meghalaya’s Jainti a Hills District are endangering Krem Kotsati , the country’s longest cave chain 24.Transport InfrastructureThe transport infrastructure in the State is poor. This hampers the movement of minerals within and outside the State and discourages the mineral based industry in the State. The State is landlocked and does not have a railhead either. The State has deposits of black and multi coloured granite. There is however litt le domesti c consumpti on of granite in the State as natural materials such as Bamboo and straw is the preferred material for constructi on in most areas. The mineral however cannot be exported to other states for want of infrastructure and connecti vity.Absence of Local Industries
23 Neeraj Vagholikar, Kalpvriksh in http://www.indiajungles.com/24 The Telegraph, February 6, 2005
• Equal participation of both the Gender from each household to form the group as village devel-opment committee
• Participation in decision, devel-opment, economic activity and environmental protection
• Increase in NTFP • Improved preservation and re-
generation of Flora and fauna• Improved biodiversity conserva-
tion• Improved volume and quality of
water;• Better access to the fruits of
development.
Natural Resource Management Groups (NaRM-Gs) of NERCORMP Project
Source: NERCORMP
While the State produces substanti al quanti ti es of coal and limestone, their capti ve consumpti on in the State is low. The State exports raw limestone to Bangladesh. The State could benefi t if the same limestone is processed in chemical, cement or other industries and value added products exported. The State currently has fi ve cement plants and two more are expected to come up. Similarly due to the low level of industrializati on in the State, the consumpti on of other minerals in the State is also low. Security Percepti onThe general security percepti on and fears of insurgency in the State are major hurdles for the growth of mining in the State. A lease granted to Coal India Limited recently for mining in the Garo Hills could not be operated amidst fear of insurgency. Offi cials of Coal India Limited, which is the largest public sector undertaking in the Garo Hills region, have been subjected to abducti on and extorti on.
67

MEGHALAYA STATE DEVELOPMENT REPORTMEGHALAYA STATE DEVELOPMENT REPORT
3.12. Role of Women in the Management of Natural Resources
Gender roles in Meghalaya, especially those emanati ng from the matrilineal structure of society, have put women in a stewardship role in relati on to natural resources - especially land, wildlife, forest and water resources. Women have to depend on natural resources for food and condiments, fuel, fodder, and water. Degradati on of these resources have an adverse impact on women’s lives as they fi nd it increasingly diffi cult to run their households. This is parti cularly true for the shift ing culti vator populati on of the State, wherein women have a much bigger role to play in feeding the families. Their survival and that of their families depend directly on their making use of the natural resources. Women therefore bett er understand the importance of natural resources and the need to preserve themThe role of women is therefore criti cal in promoti ng a sustainable use of the natural resources. Any program targeted at promoti ng sustainable use of natural resources must take into account the role of women as managers of natural resources and as agents of change. Women tend to be more recepti ve and capable of forming cohesive groups for managing natural resources. Some areas where women’s role must be considered are discussed hereunder:
3.12.1. Watershed ManagementWatershed development helps in sustainable development of natural resources and is therefore benefi cial to the community at large, especially women. It can enhance the producti vity of the land resources and thereby helps improve the economic conditi on of communiti es. Experience has proven that all-women watershed management committ ees have been extremely eff ecti ve.
3.12.2. Forest ManagementCollecti on, processing, storing and consumpti on of forests products is primarily the responsibility of women. They contribute a majority of the labour requirements in these acti viti es. The involvement of women is therefore instrumental for any program aimed at proper management of the extracti on of forest produce. Women’s involvement in Joint Forest Management Programme can substanti ally improve the effi ciency of the programme. Therefore, the Meghalaya Joint Forest Management Regulati on, 2003 prescribes adequate woman members in the Executi ve Committ ee of the Joint Forest Management Committ ees.
3.12.3. Non-renewable Resource ManagementWomen depend upon fuel wood gathered from the forests for their household energy requirements. Alternati ve sources of energy such as biogas, solar energy, small hydropower etc. can be explored to reduce the strain on forests. Women’s parti cipati on can help improve the eff ecti veness of these programmes.
3.12.4. Organic FarmingOrganic farming is growing in popularity the world over. All kinds of agricultural products are being produced organically, these include food grains, meat, dairy, eggs, fi bres and processed food products. Organic farming management relies on developing natural means to enhance plant
58

MEGHALAYA STATE DEVELOPMENT REPORTMEGHALAYA STATE DEVELOPMENT REPORT
producti vity and to disrupt habitat for pest organisms. It includes the purposeful maintenance and replenishment of soil ferti lity. The reduced use of syntheti c pesti cides or ferti lizers can avoid several problems associated with these products such as environmental polluti on. The State should work on introducing “Organic System Plans” in selecti ve pockets of the State. Women’s involvement in these plans can help to make their implementati on more eff ecti ve. Women can also be involved in acti viti es like vermiculture, which are complimentary to organic farming. The certi fi cati on process for shift ing culti vati on products, which are essenti ally organic would help the shift ing culti vators of the State.
3.12.5. Medicinal PlantsWomen are oft en engaged in the collecti on and processing of medicinal plants. Most of these plants require “delicate handling” which is oft en provided by women. The role played by women therefore has a greater bearing on sustained and profi table harvesti ng of these medicinal plants and must be taken into account for deriving a strategy for the extracti on and use of medicinal plants.
3.13 Conclusions and Recommendati ons3.13.1 MineralsKeeping in view the sub-opti mal exploitati on of minerals and the adverse eff ects of unscienti fi c mining on the environment of the state, there is a need to gradually regularize the mining acti viti es in the State. The ownership of land is at the heart of the bott leneck for effi cient exploitati on of this valuable resource. Currently, most minerals are being exploited privately by individual landowners. These private mine owners, are unable to deploy modern technology and tools for effi cient and cost eff ecti ve extracti on due to the want of scale and investment capability. The contradicti on between the ownership of land and the ownership of minerals contained inside the earth will require policy and legal interventi on wherein some clarity will have to be brought in to enable investors to invest and eff ecti vely exploit this resource.While that may take some ti me, landowners could be brought together in the form of cooperati ves on the line of any of the successful cooperati ve models in the country like Amul or sugar cooperati ves of Maharashtra. These cooperati ves could then opt for introducti on of new technology and methods to make exploitati on and marketi ng of minerals effi cient and cost eff ecti ve. Downstream operati ons like washing of coal produced to reduce ash content for which the market prospects are quite good, will happen only in the second phase which will have to wait ti ll the policy and legal issues are resolved or the cooperati ve movement is perceived to successfully work. In order to reduce the adverse ecological impact of mining, all mining acti viti es should gradually be brought under the purview of an Environment Management Plan duly approved by the Environment and Forest Departments on the lines of the rest of the country. This assumes greater signifi cance in light of the adverse eff ects of coal mining discussed earlier. Socio-economic and
59

MEGHALAYA STATE DEVELOPMENT REPORTMEGHALAYA STATE DEVELOPMENT REPORT
ecological impact analysis must precede all fresh mining initi ati ves in the state. This is necessitated due to the environmental concerns raised in relati on to the limestone quarrying in the State.
3.13.2 Women’s role in Natural Resource ManagementThe signifi cance of women’s parti cipati on in the management of natural resources is well understood. In order to moti vate and prepare the women of the state to play a more constructi ve role in the sustainable use of natural resources, workshops and training sessions can be organized for rural women. These training sessions and workshops should be aimed at acquainti ng women with new technologies. Women’s self-help groups should be promoted to facilitate eff ecti ve interacti on with women for this purpose. These self-help groups should be encouraged to create a formal database of their traditi onal knowledge, which can be uti lized to derive context specifi c strategies for conservati on of natural resources. This may also require providing micro credit faciliti es to take up specifi c projects. Women self-help groups of Meghalaya have successfully implemented several programs for conservati on of natural resources under such schemes as the Internati onal Fund for Agriculture (IFAD-NERCORMP & MRDS) and the Nati onal Aff orestati on Programme (NAP). Their success can be replicated by uti lizing experience and knowledge gained by these self-help groups. A platf orm may be created for promoti ng interacti on between members or representati ves from these self-help groups with other women groups in the State.
3.13.3 Water ResourcesThe Integrated watershed management exercise needs to be undertaken based on principles of size specifi c planning. The integrated watershed development guidelines as prepared by the Government of India, Ministry of Agriculture and Environment and Forests, could be taken as base documents, for creati ng Meghalaya specifi c watershed management guidelines. These could then be used by implementi ng agencies for implementati on and monitoring of watershed management programs. External experts should be engaged for preparing the guidelines and the guidelines should cover the full cycle of the program.
3.13.4 BiodiversityPlanning should be based on land capability. While land capability classifi cati on is a macro level exercise, site specifi c planning is a micro level. Both macro and micro level plans can be facilitated through the use of GIS and remote sensing systems. As far as possible, the existi ng forests should be preserved to prevent further loss of biodiversity. In biodiversity rich areas, habitat improvement works should be undertaken. These can be done in consultati on with the specialist insti tuti ons, like the Wildlife Insti tute of India.Planning for biodiversity conservati on should be done in a manner that assists endemic species proliferati on and conservati on of threatened categories of species.
60

MEGHALAYA STATE DEVELOPMENT REPORTMEGHALAYA STATE DEVELOPMENT REPORT
3.13.5 Development of Medicinal PlantsIndustry Linked Research and Patenti ngFurther research and development must be carried out in the processing of medicinal plants keeping in view the industrial use of such products. As part of the TRIPS agreement and its incorporati on in the WTO, protecti on against patenti ng indigenous knowledge by industry and multi nati onals has become weak and tenuous. It is therefore important that indigenous knowledge is protected through explicit agreements with downstream industry, which will use this know-how aft er conversion into either generic processes for drug manufacture or specifi c products. These in turn can be patented in a manner that will enable this knowledge to be protected, exploited and enhanced for the nati onal good. There should be an increased focus on exporti ng value added products like herbal medicines and drugs rather than raw material. The state must emerge as a supplier of important herbal medicines and drugs rather than being recognized as just another supplier of raw medicinal plants. This will help create a local industry for the treatment and processing of medicinal plants.
Stringent Quality ControlsAt present, there is too litt le control in the country over the quality and genuineness of the herbal drugs produced and sold. Unlike allopathic drugs, herbal products do not have to pass the scruti ny of the Drug Controller of India. As a result the medicines based on traditi onal systems are gradually loosing faith. Stories are afl oat of the spurious herbal medicines produced by some of the well-known herbal drug companies in India 25.It is therefore extremely essenti al that a policy should be introduced to test the quality, safety and eff ecti veness of the herbal medicines produced, if the state were to be recognized in the nati onal and internati onal market as a supplier of medicinal products.
Traditi onal Medicine Hospital Infrastructure At present, traditi onal knowledge is not available through formal channels. The State should initi ate steps to formally introduce this traditi onal knowledge aft er converti ng it into scienti fi c facts through the medical educati onal system and then making it available in State hospitals. Selected herbal medicines can be verifi ed for their eff ecti veness in certain ailments and can be prescribed either in place of or along with allopathic medicines.
Proposed Acti on Plan for developing Medicinal Plant sector26 A precise acti on plan as suggested in the “Developing Medicinal Plant Sector in Meghalaya:
25 Suman Sahai, Medicinal Plants for Modern Health Care26 Same as in 14 / 15
61
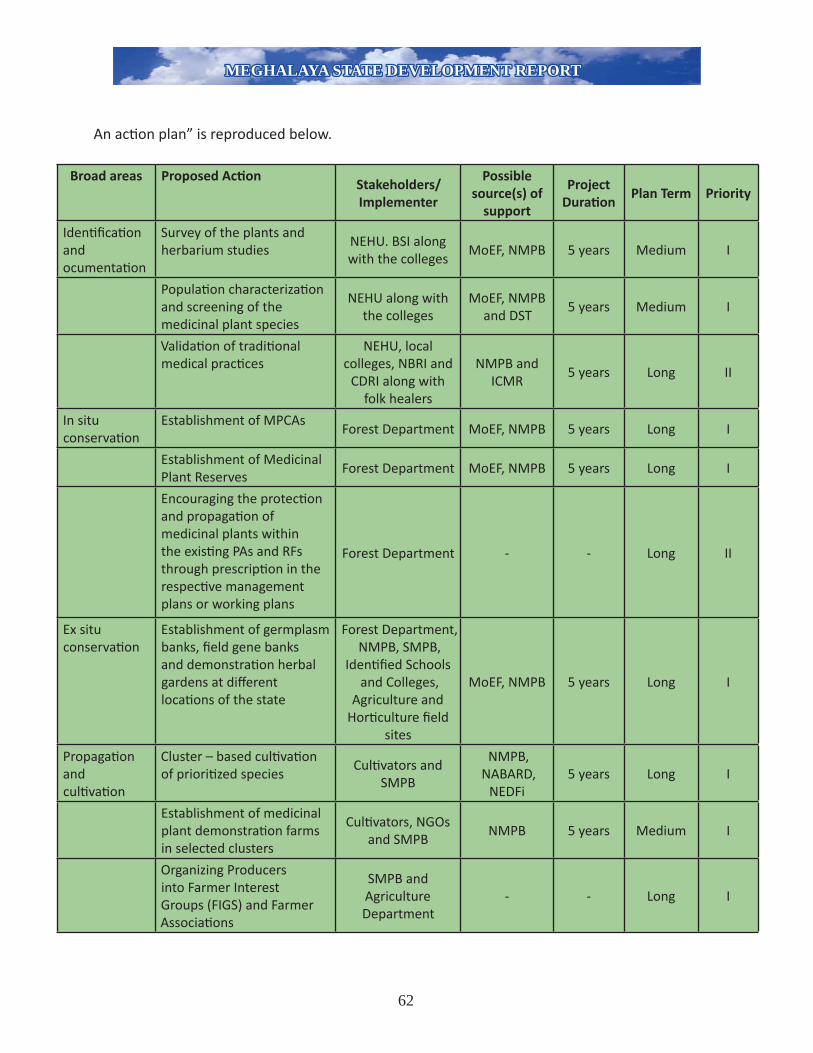
MEGHALAYA STATE DEVELOPMENT REPORTMEGHALAYA STATE DEVELOPMENT REPORT
An acti on plan” is reproduced below.
Broad areas Proposed Acti onStakeholders/ Implementer
Possible source(s) of
support
Project Durati on
Plan Term Priority
Identi fi cati on and ocumentati on
Survey of the plants and herbarium studies
NEHU. BSI along with the colleges
MoEF, NMPB 5 years Medium I
Populati on characterizati on and screening of the medicinal plant species
NEHU along with the colleges
MoEF, NMPB and DST
5 years Medium I
Validati on of traditi onal medical practi ces
NEHU, local colleges, NBRI and
CDRI along with folk healers
NMPB and ICMR
5 years Long II
In situ conservati on
Establishment of MPCAsForest Department MoEF, NMPB 5 years Long I
Establishment of Medicinal Plant Reserves
Forest Department MoEF, NMPB 5 years Long I
Encouraging the protecti on and propagati on of medicinal plants within the existi ng PAs and RFs through prescripti on in the respecti ve management plans or working plans
Forest Department - - Long II
Ex situ conservati on
Establishment of germplasm banks, fi eld gene banks and demonstrati on herbal gardens at diff erent locati ons of the state
Forest Department, NMPB, SMPB,
Identi fi ed Schools and Colleges,
Agriculture and Horti culture fi eld
sites
MoEF, NMPB 5 years Long I
Propagati on and culti vati on
Cluster – based culti vati on of prioriti zed species
Culti vators and SMPB
NMPB, NABARD,
NEDFi5 years Long I
Establishment of medicinal plant demonstrati on farms in selected clusters
Culti vators, NGOs and SMPB
NMPB 5 years Medium I
Organizing Producers into Farmer Interest Groups (FIGS) and Farmer Associati ons
SMPB and Agriculture Department
- - Long I
62
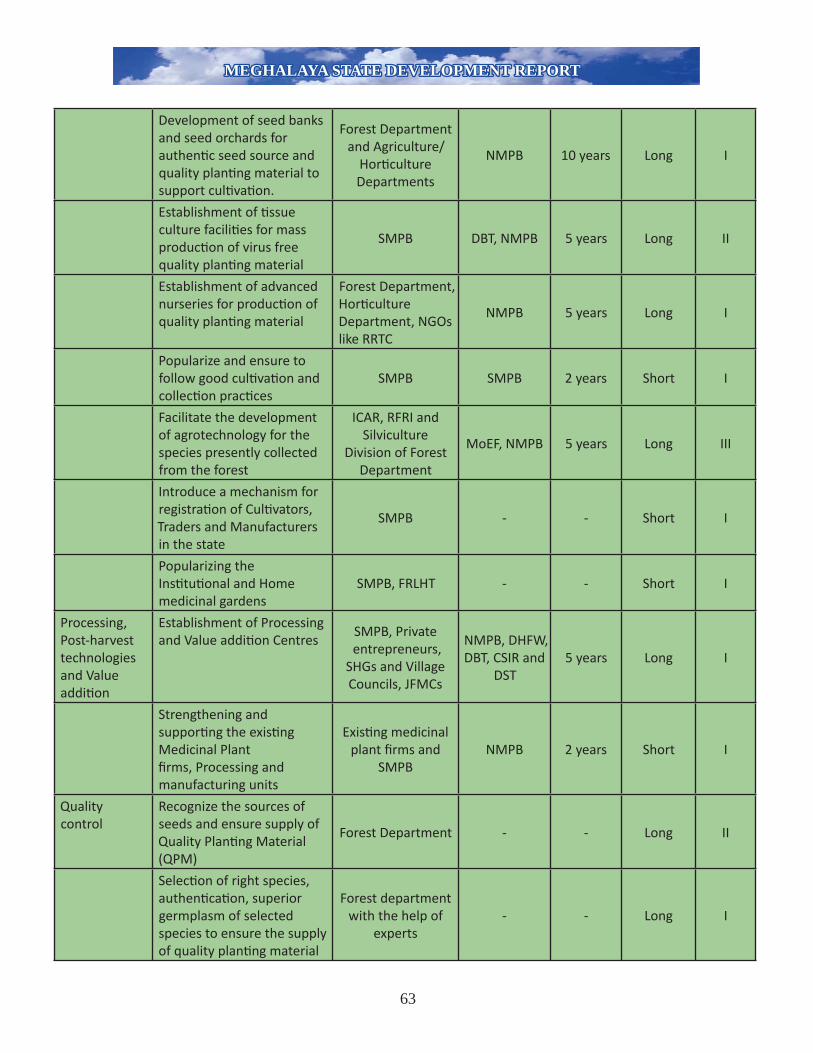
MEGHALAYA STATE DEVELOPMENT REPORTMEGHALAYA STATE DEVELOPMENT REPORT
Development of seed banks and seed orchards for authenti c seed source and quality planti ng material to support culti vati on.
Forest Department and Agriculture/
Horti culture Departments
NMPB 10 years Long I
Establishment of ti ssue culture faciliti es for mass producti on of virus free quality planti ng material
SMPB DBT, NMPB 5 years Long II
Establishment of advanced nurseries for producti on of quality planti ng material
Forest Department,Horti culture Department, NGOs like RRTC
NMPB 5 years Long I
Popularize and ensure to follow good culti vati on and collecti on practi ces
SMPB SMPB 2 years Short I
Facilitate the development of agrotechnology for the species presently collected from the forest
ICAR, RFRI and Silviculture
Division of Forest Department
MoEF, NMPB 5 years Long III
Introduce a mechanism for registrati on of Culti vators, Traders and Manufacturers in the state
SMPB - - Short I
Popularizing the Insti tuti onal and Home medicinal gardens
SMPB, FRLHT - - Short I
Processing, Post-harvest technologies and Value additi on
Establishment of Processing and Value additi on Centres
SMPB, Private entrepreneurs,
SHGs and Village Councils, JFMCs
NMPB, DHFW, DBT, CSIR and
DST5 years Long I
Strengthening and supporti ng the existi ng Medicinal Plant fi rms, Processing and manufacturing units
Existi ng medicinal plant fi rms and
SMPBNMPB 2 years Short I
Quality control
Recognize the sources of seeds and ensure supply of Quality Planti ng Material (QPM)
Forest Department - - Long II
Selecti on of right species, authenti cati on, superior germplasm of selected species to ensure the supply of quality planti ng material
Forest department with the help of
experts- - Long I
63

MEGHALAYA STATE DEVELOPMENT REPORTMEGHALAYA STATE DEVELOPMENT REPORT
Ensuring quality control at culti vati on stage
SMPB - - Long II
Ensuring quality control at value additi on stage
SMPB - - Short I
Establishing new labs and Strengthening of existi ng Drug Testi ng Laboratories (for determinati on of quality products at the propagati on (Quality Planti ng Material) and harvesti ng level or Commissioning an agency for quality testi ng
Health Department, NEHU
DBT, DST, CSIR
3 years Short I
Ensure internati onal quality of producti on, processing and value additi on and introduce certi fi cati on
SMPB SMPB 5 years Medium II
Marketi ng Assessing the Market Demand for Specifi c Medicinal plants
SMPB SMPB 1 year Short I
Addressing the legal and policy issues for smooth trading of medicinal plants
Forest Department - - Short I
Involving big Pharmaceuti cal houses by way of facilitati ng the establishment of processing and drug manufacturing units in the state
SMPB and NMPB - - Long I
Organizing Buyers and Sellers meet
SMPB SMPB/NMPB 5 years Medium II
Marketi ng linkage and Market intelligence
SMPB. APEDA, NERMAC
- - Long I
Linkages Linkage with the schemes of Ministry of Health
SMPB, Stakeholders and
MoH
Vanaspati van,
Renovati on of labs and Folk healers
training schemes of
MoH
5 years Medium I
Linkage with FDAs and JFMCs
SMPB, Stakeholders,
Forest Department and NAEB
NAEB 5 years Long I
64

MEGHALAYA STATE DEVELOPMENT REPORTMEGHALAYA STATE DEVELOPMENT REPORT
Linkage with R&D Insti tuti ons
SMPB, RRL, RFRI, CDRI, NBRI, NEHU,
ICAR, FRLHT- - Long I
Linkage with NGOs and private organizati ons
SMPB and Non Governmental Organizati ons
- - Long I
Linkage with Financial Insti tuti ons
SMPB, NABARD, NEDFi
- - Long I
Linking and enforcing the internati onal policy and legal frameworks (CBD, WTO, FAO etc.)
SMPB - - Long III
Income and employment generati on
Promoti ng medicinal plants as IGAs
FDAs, RD departments, Village level Insti tuti ons
NAP, EGS, RLEGP
5 years Long I
Capacity Development and Training
The insti tuti ons need to be identi fi ed for taking care of diff erent HRD aspects for various levels of stakeholders in the medicinal plant sector
SIRD, RRTC, ICAR, KVKs, NEHU,
Forest Department, Agriculture Department
DST, DBT, CSIR, NMPB
3 years Short I
Insti tuti onalizati on of training programmes
SMPB - - Short I
Organizing Folk healers into Associati on (s) and the capacity building of folk healers
SMPB MoH 3 years Medium II
3.13.6 Insti tuti onal linkages and technology inputOne common bott leneck in eff ecti ve management of natural resources of Meghalaya is the poor technological input. There is a need to uti lize the available technologies in an appropriate manner and eff orts must be initi ated to develop need-based technologies that are not available. For this the natural resource based research insti tuti ons located in Meghalaya such as ICAR, NEHU, BSI, CAU and BRDC should be entrusted with the task of developing the technologies and uti lizing them in the fi eld for eff ecti ve management of natural resources of the state. The Indian School of Mines, Dhanbad and IITs should be involved for developing technology packages for rehabilitati on of mined areas and technologies for value additi on of natural resource products. Further, a consistent policy for natural resource management must be adopted in the state so that the project approach hitherto followed is converted into a programme approach.
Carbon fi nance: Although the global carbon fi nance mechanism itself is sti ll in its infancy, there are promising opportuniti es for carbon fi nance in the northeast Indian natural resource sector. By converti ng low earning agricultural lands to forests, and also by redefi ning currently incorrectly registered forestlands as non forests, through the appropriate defi niti ons of eco-region this can be turned as an advantage. Insti tuti onal capacity, reducing the level of transacti on costs, and
65

MEGHALAYA STATE DEVELOPMENT REPORTMEGHALAYA STATE DEVELOPMENT REPORT
focusing on acti viti es that complement projects dealing with land degradati on, watershed issues, and biodiversity etc have to be achieved in the Natural resource management. This could generate benefi ts for local land users and owners as well for the local and global environment.
3.13.7 An Integrated and Holisti c Framework of Natural Resource Management in Meghalaya27:In general, resource management must be guided by a sensiti ve (responsive) and restorati ve approach. Eco-conservati on; people’s involvement; gendered planning; recharging traditi onal agro-eco-systems through traditi onal knowledge and appropriate technology; scienti fi c approach to agriculture, animal husbandry and horti culture in order to raise producti vity and diversifi cati on through ecologically sustainable industries and tourism are dimensions acknowledged by the Planning Commission of India for hill areas development. Natural resource management approach in Meghalaya must acknowledge and address such facets.
Break down of traditi onal resource management processes and changes lead to the process of marginalisati on and results in detaching people from the natural resource base. A similar potenti al predicament for Meghalaya exists as analysed by IFAD. Majority of people in Meghalaya live in rural areas and are dependent on nature and agriculture. The increasing trend in poverty, disparity and unemployment may form a breeding ground of violence. Meghalaya will have to be responsive to its hill specifi citi es taking the study by ICIMOD into account and proper analysis of resource producti vity linkages. The hill specifi citi es of Meghalaya and the richness of natural resources in its diverse agro-ecological setti ng demands integrated resource planning with a holisti c approach towards natural resource management. An approach that can harmonise the traditi onal ways of living with nature and improve the producti on base through resource-intensifi cati on-focussed strategies of livelihood with ecological security of sustainable development will be necessary for adopti on. This would require rati onalising and defi ning stakes; sincere eff orts towards capacity building and reforms and evolving local perspecti ves on development for in-tandem acti on. Towards this, an integrated and holisti c natural resources planning and management perspecti ve is necessary which takes local hill specifi citi es, sustainable agriculture and livelihoods into account. This also calls for 1. an insti tuti onalised local control and accountability for resource management and conservati on; 2. equitable distributi on for checking and reducing disparity and 3. holisti c strategies for enforcing the mutuality and linkages of components in the ecosystem.
27 Dr. Shreeranjan: ‘Perspectives of Development in Meghalaya’ (2001)
66

MEGHALAYA STATE DEVELOPMENT REPORTMEGHALAYA STATE DEVELOPMENT REPORT
Since the community and people are the owners of resources, the state has to ensure equitable development of regions and people by facilitati ng pro-poor policies, decentralisati on coupled with structural reforms linked empowerment and approach to good governance. This perhaps will allow the potenti al and promises to be realised in large measures in the state and will not result in the failures of development. 28
28 Dr. Shreeranjan: ‘Framework of Holistic and Integrated Natural Resource Management in Meghalaya’ (2005). NEICSSR symposium.
29 Report No. 36397-IN: India: Development and Growth in Northeast India. The Natural Resources, Water, and Environment Nexus: May 2007:South Asia Region India Country Management Unit, Socially Sustainable Development Department, Environment and Water Resources Unit.
Concerned and connected issues in NRM 29
67

RIVER SIMSANG
ORCHARD IN GARO HILLS

PITCHER PLANT
FOREST IN MEGHALAYA

RIVER CANYONING

MONSOON IN CHERRAPUNJEE


MEGHALAYA STATE DEVELOPMENT REPORTMEGHALAYA STATE DEVELOPMENT REPORT
CHAPTER IV
FINANCES OF THE STATE GOVERNMENT1
4.1 Structure of Government Accounts: The accounts of the State Government are kept in three parts (i) Consolidated Fund, (ii) Conti ngency Fund and (iii) Public Account.
Part I : Consolidated FundAll revenues received by the State Government, all loans raised by issue of treasury bills, internal and external loans and all moneys received by the Government in repayment of loans shall form one consolidated fund enti tled ‘The Consolidated Fund of State’ established under Arti cle 266(1) of the Consti tuti on of India.
Part II : Conti ngency FundConti ngency Fund of the State established under Arti cle 267(2) of the Consti tuti on is in the nature of an imprest placed at the disposal of the Governor to enable him to make advances to meet urgent unforeseen expenditure, pending authorizati on by the Legislature. Approval of the Legislature for such expenditure and for withdrawal of an equivalent amount from the Consolidated Fund is subsequently obtained, whereupon the advances from the Conti ngency Fund are recouped to the Fund.
Part III : Public AccountReceipts and disbursements in respect of certain transacti ons such as small savings, provident funds, reserve funds, deposits, suspense, remitt ances, etc. which do not form part of the Consolidated Fund, are kept in the Public Account set up under Arti cle 266(2) of the Consti tuti on and are not subject to vote by the State Legislature.
The Finance Accounts of the Government of Meghalaya are laid out in nineteen statements, presenti ng receipts and expenditure, revenue as well as capital, in the Consolidated Fund, Conti ngency Fund and the Public Account.
4.1.1 Summary of Receipts and Disbursements Table 4.1 summarises the fi nancial positi on of the State Government for the year 2006-07 covering revenue receipts and expenditure, capital receipts and expenditure and public accounts receipts/disbursements as emerging from the Statement of Finance Accounts and other detailed statements.
1 The chapter is largely based on inputs from CAG Reports & the Directorate of Economics & Statistics
69
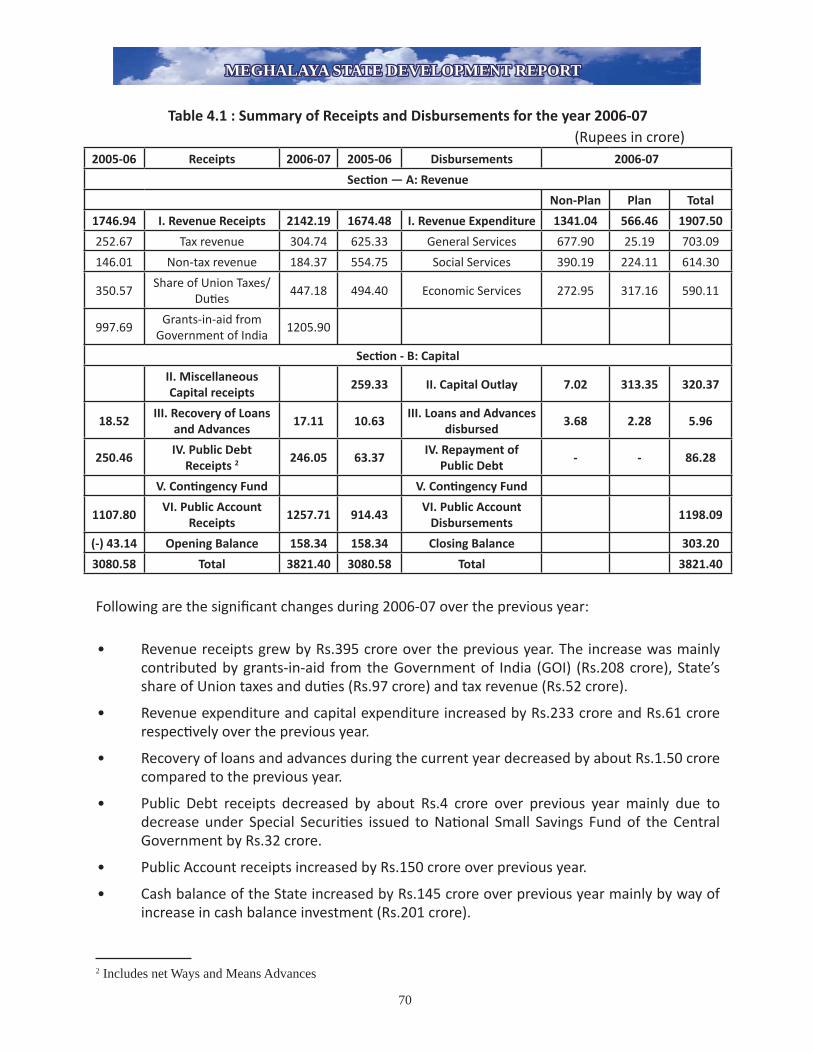
MEGHALAYA STATE DEVELOPMENT REPORTMEGHALAYA STATE DEVELOPMENT REPORT
Table 4.1 : Summary of Receipts and Disbursements for the year 2006-07 (Rupees in crore)
2005-06 Receipts 2006-07 2005-06 Disbursements 2006-07
Secti on — A: Revenue
Non-Plan Plan Total
1746.94 I. Revenue Receipts 2142.19 1674.48 I. Revenue Expenditure 1341.04 566.46 1907.50
252.67 Tax revenue 304.74 625.33 General Services 677.90 25.19 703.09
146.01 Non-tax revenue 184.37 554.75 Social Services 390.19 224.11 614.30
350.57Share of Union Taxes/
Duti es447.18 494.40 Economic Services 272.95 317.16 590.11
997.69Grants-in-aid from
Government of India1205.90
Secti on - B: Capital
II. Miscellaneous Capital receipts
259.33 II. Capital Outlay 7.02 313.35 320.37
18.52III. Recovery of Loans
and Advances17.11 10.63
III. Loans and Advances disbursed
3.68 2.28 5.96
250.46IV. Public Debt
Receipts 2 246.05 63.37IV. Repayment of
Public Debt- - 86.28
V. Conti ngency Fund V. Conti ngency Fund
1107.80VI. Public Account
Receipts1257.71 914.43
VI. Public Account Disbursements
1198.09
(-) 43.14 Opening Balance 158.34 158.34 Closing Balance 303.20
3080.58 Total 3821.40 3080.58 Total 3821.40
Following are the signifi cant changes during 2006-07 over the previous year:
• Revenue receipts grew by Rs.395 crore over the previous year. The increase was mainly contributed by grants-in-aid from the Government of India (GOI) (Rs.208 crore), State’s share of Union taxes and duti es (Rs.97 crore) and tax revenue (Rs.52 crore).
• Revenue expenditure and capital expenditure increased by Rs.233 crore and Rs.61 crore respecti vely over the previous year.
• Recovery of loans and advances during the current year decreased by about Rs.1.50 crore compared to the previous year.
• Public Debt receipts decreased by about Rs.4 crore over previous year mainly due to decrease under Special Securiti es issued to Nati onal Small Savings Fund of the Central Government by Rs.32 crore.
• Public Account receipts increased by Rs.150 crore over previous year.
• Cash balance of the State increased by Rs.145 crore over previous year mainly by way of increase in cash balance investment (Rs.201 crore).
2 Includes net Ways and Means Advances
70

MEGHALAYA STATE DEVELOPMENT REPORTMEGHALAYA STATE DEVELOPMENT REPORT
4.1.2 Fiscal Positi on by Key Indicators The fi scal positi on of the State Government as refl ected by the key fi scal indicators during the current year as compared to the previous year is given in Table 4.2.
Table 4.2 (Rupees in crore)
2005-06 Sl.No. Major Aggregates 2006-07
1,747 1. Revenue Receipts (2+3+4) 2,142
253 2. Tax Revenue 305
146 3. Non-Tax Revenue 184
1,348 4. Other Receipts 1,653
19 5. Non-Debt Capital Receipts 17
19 6. Of which Recovery of Loans 17
1,766 7. Total Receipts (1+5) 2,159
1,187 8. Non-Plan Expenditure (9+11+12) 1,352
1,183 9. On Revenue Account 1,341
191 10. Of which, Interest payments 203
1 11. On Capital Account 7
3 12. On Loans disbursed 4
757 13. Plan Expenditure (14+15+16) 881
491 14. On Revenue Account 566
258 15. On Capital Account 313
8 16. On Loans disbursed 2
1,944 17. Total Expenditure (8+13) 2,233
(-) 178 18. Fiscal Defi cit (-) (1+5-17) (-)74
(+)73 19. Revenue Surplus (+)/Defi cit(-) {1-(9+14)} (+) 235
(+)13 20. Primary Defi cit (-)/Surplus (+) {(1+5)-(17-10)} (+) 129
During 2006-07, revenue receipts increased by 23 per cent (Rs.395 crore) while revenue expenditure increased by 14 per cent (Rs.233 crore) over the previous year, resulti ng in increase in surplus of Rs.162 crore in revenue account. Given the increase in revenue surplus of Rs.162 crore and the marginal decrease of Rs.2 crore in non-debt capital receipts and the increase of Rs.56 crore on account of increase in capital expenditure (Rs.61 crore) and decrease in loans and advances disbursed (Rs.5 crore) during 2006-07 over the previous year, fi scal defi cit decreased by Rs.104 crore during the current year. The decrease in fi scal defi cit accompanied by an increase of Rs.12 crore in interest payments during 2006-07 over the previous year, led to a signifi cant improvement in primary surplus by Rs.116 crore.
4.2 Methodology adopted for assessment of Fiscal Positi on
The trends in the major fi scal aggregates of receipts and expenditure emerging from the Statements of Finance Accounts were analysed wherever necessary over the period from 2001-02 to 2006-07 and observati ons have been made on their behaviour. In its Restructuring Plan of State fi nances, the Twelft h Finance Commission (TFC) recommended the norms/ceiling for some fi scal aggregates and also made normati ve projecti ons for others. In additi on, TFC also recommended
71

MEGHALAYA STATE DEVELOPMENT REPORTMEGHALAYA STATE DEVELOPMENT REPORT
that all States enact the Fiscal Responsibility (FR) Act and draw their fi scal correcti on path
accordingly for the fi ve year period (2005-06 to 2009-10) so that fi scal positi on of the State could
be improved as committ ed in their respecti ve FR Acts/Rules during medium to long run. The norms/ceilings prescribed by the TFC as well as its projecti ons for fi scal aggregates along with the commitments/projecti ons made by the State Government in its FR Act and in other statements required to be laid in the Legislature under the Act were used to make qualitati ve assessment of the trends and patt ern of major fi scal aggregates during the current year. Assuming that Gross State Domesti c Product (GSDP) is a good indicator of the performance of the State’s economy, major fi scal aggregates like tax and non-tax revenue, revenue and capital expenditure, internal debt and revenue and fi scal defi cits have been presented as percentage to the GSDP at current prices. The buoyancy coeffi cients for tax revenues, non-tax revenues, revenue expenditure, etc. with reference to the base represented by GSDP have also been worked out to assess as to whether the mobilisati on of resources, patt ern of expenditure, etc. are keeping pace with the change in the base or these fi scal aggregates have also been aff ected by factors other than GSDP. The trends in growth and compositi on of GSDP for last six years are presented in Table 4.3.
Table 4.3: Trends in Growth of GSDPEsti mates 2001-02 2002-03 2003-04 2004-05 2005-06 2006-07
GSDP (Rupees in crore) 4,615 4,900 5,504 5,980 6,470 7,052
GSDP (Rate of Growth in
per cent)
13.98 6.18 12.33 8.65 8.19 9.00
Source: New GSDP Series furnished (October 2007) by the Directorate of Economics and Stati sti cs,
Government of Meghalaya.
The key fi scal aggregates for the purpose have been grouped under four major heads: (i) Trends and Compositi on of Aggregate Receipts, (ii) Applicati on of Resources, (iii) Assets and Liabiliti es and (iv) Management of Defi cits. The overall fi nancial performance of the State Government as a body corporate has been presented by applicati on of a set of rati os commonly adopted for the relati onal interpretati on of fi scal aggregates.
4.2.1 The Fiscal Responsibility and Budget Management Act The State Government has enacted the Meghalaya Fiscal Responsibility and Budget Management (MFRBM) Act, 2006 to (i) ensure fi scal prudence, stability and effi ciency, (ii) achieve fi scal consolidati on for facilitati ng the generati on of revenue surplus for enhancing the scope for improvement of investment in the social and economic sectors/infrastructure, (iii) ensure fi scal and debt sustainability through progressive reducti on of the fi scal defi cit and proper debt management system and (iv) provide a more transparent and accountable system of budgeti ng that will ensure an effi cient and eff ecti ve system of governance. The MFRBM Act, 2006 came into force on 6 November 2006. To give eff ect to the fi scal management principles as laid down in the Act and/or the rules framed thereunder, the Act prescribed the following targets:
• maintain revenue surplus at least at the same level as determined by theTFC for the base year 2003-04;
72

MEGHALAYA STATE DEVELOPMENT REPORTMEGHALAYA STATE DEVELOPMENT REPORT
• reduce fi scal defi cit in each of the fi nancial years beginning from 1st day of April 2006, in a manner that will enable the State to achieve fi scal defi cit of 3 per cent of GSDP by 2008-09;
• ensure that total outstanding liabiliti es on the Consolidated Fund are not more than 28 per cent of the GSDP;
• restrict issuing of guarantees except on selecti ve basis where the quality and viability of the scheme to be guaranteed is properly analysed;
• bring out an annual statement that gives a perspecti ve on the State’s economy and related fi scal strategy; and,
• bring a special report along with the budget giving details of the number of employees in the Government, Public Sector Undertakings and aided insti tuti ons and related salaries.
The Act also provides that above limits may exceed on account of unforeseen circumstances such as natural calamiti es, internal disturbances and shortf all in the transfer of fi nancial resources from the GOI.
4.2.1.1 Roadmap to Achieve the Fiscal Targets as laid down in FRBM Act/Rules The State Government has also developed its own Fiscal Correcti on Path (FCP) detailing the structural adjustments required for mobilising additi onal resources and identi fying areas where expenditure could be compressed, to achieve the targets set out in the MFRBM Act.
4.2.1.2 Fiscal Performance In terms of an incenti ve scheme of TFC, a reward for fi scal performance was built into the debt-write off package under Debt Consolidati on and Relief Facility (DCRF)3. According to the scheme, the quantum of write off of repayment of GOI loans aft er consolidati on and reschedulement will be linked to the absolute amount by which revenue defi cit is reduced in each successive year during the award period. In eff ect, if the revenue defi cit is brought to zero, the enti re repayment during the period will be writt en off . As a result of improved fi scal performance in terms of this criterion, Meghalaya Government received a debt waiver of Rs.14.90 crore from the GOI under DCRF during 2006-07.
3 In pursuance of the recommendations of the TFC for fi scal consolidation and elimination of revenue defi cit of the States, GOI formulated a scheme “The States’ Debt Consolidation and Relief Facility (DCRF) (2005-06 to 2009-10)” under which general debt relief is provided by consolidating and rescheduling the Central loans grabted to States at substantially reduced rates of interest on enacting the FRBM Act and debt waiver is granted on fi scal performance, linked to the reduction of revenue defi cits of States.
73

MEGHALAYA STATE DEVELOPMENT REPORTMEGHALAYA STATE DEVELOPMENT REPORT
The State, however, failed to achieve fi scal targets laid down in the FCP as well as in the Budget for the year 2006-07, as the year 2006-07 ended with a revenue surplus of Rs.235 crore against the target of Rs.340 crore. The outstanding fi scal liabiliti es at 39 per cent of the GSDP during the current year also exceeded the target of 28 per cent fi xed in the MFRBM Act, 2006. But, fi scal defi cit did not exceed 3 per cent of GSDP during the current year itself though as per the MFRBM Act it was to be achieved by 2008-09.
4.3 Trends and Compositi on of Aggregate Receipts Resources of the State Government consist of revenue receipts and capital receipts. Revenue receipts consist of tax revenue, non-tax revenue, State’s share of Union taxes and duti es and grants-in-aid from the GOI. Capital receipts comprise miscellaneous capital receipts such as proceeds from disinvestments, recoveries of loans and advances, debt receipts from internal sources (market loans, borrowings from fi nancial insti tuti ons/commercial banks) and loans and advances from the GOI as well as accruals from Public Account. Table 4.4 shows that the total receipts of the State Government for the year 2006-07 were Rs.3,663 crore. Of these, revenue receipts were Rs.2,142 crore only, consti tuti ng 58 per cent of the total receipts. The balance came mainly from borrowings and public account receipts.
Table 4.4 - Trends in Growth and Compositi on of Aggregate (Rupees in crore)Sources of State’s Receipts 2001-02 2002-03 2003-04 2004-05 2005-06 2006-07
I. Revenue Receipts 1,123 1,289 1,399 1,546 1,747 2,142
II. Capital Receipts 172 310 337 316 269 263
(a) Recovery of Loans and Advances 16 15 18 19 19 17
(b) Public Debt Receipts4 156 295 319 297 250 246
(c) Miscellaneous Capital Receipts
III. Conti ngency Fund Receipts
IV. Public Account Receipts 774 935 874 980 1,108 1,258
(a) Small Savings, Provident Fund, etc. 86 97 120 130 89 91
(b) Reserve Funds 8 9 10 18 20 21
(c) Deposits and Advances 179 252 154 165 343 342
(d) Suspense and Miscellaneous 11 48 -11 18 1,148 30
(e) Remitt ances 490 529 601 649 674 774
Total Receipts 2,069 2,534 2,610 2,842 3,124 3,663
Out of the total receipts under Public Account, remitt ances consti tuted about 62 per cent. While 68 per cent (Rs.525 crore) of the remitt ances have come from Public Works remitt ances, Cash remitt ances between treasury and currency chests and Forest remitt ances consti tuted 20 per cent (Rs.159 crore) and 12 per cent (Rs.90 crore) respecti vely.
4.3.1 Revenue Receipts The revenue receipts consist of its own tax and non-tax revenues, Central tax transfers and grants-in-aid from the GOI. Overall revenue receipts, their annual rate of growth, rati o of these receipts to the GSDP and its buoyancy are indicated in Table 4.5 . 4 Included net (NIL) Ways and Means Advances also.
74

MEGHALAYA STATE DEVELOPMENT REPORTMEGHALAYA STATE DEVELOPMENT REPORT
Table 4.5 - Revenue Receipts-Basic Parameters (Rupees in crore)2001-02 2002-03 2003-04 2004-05 2005-06 2006-07
Revenue Receipts (RR) (Rupees in crore) 1,123 1,289 1,399 1,546 1,747 2,142
Own Taxes (per cent) 136 (12.11)
145 (11.25)
178 (12.72)
208 (13.46)
253 (14.48)
305 (14.24)
Non-Tax Revenue (per cent) 94 (8.37)
93 (7.22)
129 (9.22)
133 (8.60)
146 (8.36)
184 (8.59)
Central Tax Transfers (per cent) 165 (14.69)
176 (13.65)
225 (16.08)
269 (17.40)
350 (20.03)
447 (20.87)
Grants-in-aid (per cent) 728 (64.83)
875 (67.88)
867 (61.98)
936 (60.54)
998(57.13)
1,206 (56.30)
Rate of Growth of RR (per cent) -0.80 14.78 8.53 10.51 13.00 22.61
Rate of Growth of Own Taxes (per cent) 14.29 6.62 22.76 16.85 21.63 20.55
RR/GSDP (per cent) 24.33 26.31 25.42 25.85 27.00 30.37
Buoyancy Rati o
Revenue Buoyancy Rati o - 0.057 2.394 0.692 1.215 1.587 2.514
State’s Own Taxes Buoyancy Rati o 1.022 1.072 1.846 1.949 2.640 2.285
Revenue Buoyancy Rati o with reference to State’s Own Taxes
- 0.056 2.233 0.375 0.624 0.601 1.100
GSDP Growth (per cent) 13.98 6.18 12.33 8.65 8.19 9.00
General Trends
The revenue receipts of the State increased from Rs.1,123 crore in 2001-02 to Rs.2,142 crore in 2006-07. There were, however, wide inter-year variati ons in the growth rates. From a negati ve 0.80 per cent in 2001-02, the growth rate of revenue receipts reached to a level of 22.61 per cent in 2006-07. The sharp increase in revenue receipts during 2006-07 over the previous year was mainly on account of increase in Central tax transfers (27.71 per cent) followed by non-tax revenue (26.03 per cent), grants-in-aid from the GOI (20.84 per cent) and tax revenue (20.55 per cent). Revenue buoyancy rati o with reference to GSDP has signifi cantly increased from 1.587 in 2005-06 to 2.514 in 2006-07. This buoyancy rati o with reference to the State’s own tax revenue has also increased sharply during the current year mainly on account of enhanced Central transfers. The mobilisati on of State’s own resources vis-à-vis assessments made by the TFC and State Government are given below:
Table 4.6 (Rupees in crore)
Assessments made by TFCAssessments made by State Government
in FCP and Budget-2006-07Actuals
Tax Revenue 276 268 305
Non-Tax Revenue 180 173 184
Tax revenue increased by 10.51 per cent and the non-tax revenue by 2.22 per cent over the assessments made by the TFC. The actual realisati on also exceeded the assessments made by the State Government.
75

MEGHALAYA STATE DEVELOPMENT REPORTMEGHALAYA STATE DEVELOPMENT REPORT
Chart 4.1
Revenue Receipts for 2006-07
((Rupees in crore)
Tax RevenueThe tax revenue has increased by 20.55 per cent during the 2006-07 (Rs.305 crore) over the previous year (Rs.253 crore). The revenue from sales taxes not only contributed major share of tax revenue (71 per cent) but also increased by 25 per cent over the previous year. State excise and taxes on vehicles remained other major contributors in the State’s tax revenue. Table 4.7 below shows the trend of tax revenue during 2001-07:
Table 4.7 (Rupees in crore)
2001-02 2002-03 2003-04 2004-05 2005-06 2006-07
Taxes on Sales, Trade, etc. 81 87 110 127 173 216State Excise 42 45 53 63 59 54Taxes on Vehicles 5 5 6 7 9 9Stamps and Registrati on Fees
3 3 3 5 6 6
Land Revenue 1 0.32 0.49 0.29 0.33 6Other Taxes 4 4.68 5.51 5.71 5.67 14Total 136 145 178 208 253 305
Non-Tax Revenue The non-tax revenue, which consti tuted 8.59 per cent of total revenue receipts, has increased by Rs.38 crore recording a growth rate of 26 per cent over previous year. The debt waiver (Rs.14.90 crore) given by the GOI under DCRF booked under the head ‘Miscellaneous General Services’ led to a sharp increase in non-tax revenue of the State. Non-ferrous mining and metallurgical industries (Rs.109.03 crore) and forestry and wild life (Rs.16.66 crore) were the other major contributors to the non-tax revenue. The TFC applied 12.5 per cent annual rate of growth for revenue receipts under General Services and 25 per cent for both Social and Economic Services in the forecast period (2005-10) refl ecti ng the need for the States to achieve a greater degree of cost recovery in these services
76
304.74184.37
447.181205.9
Own Taxes Non-Tax Central Tax Transfers Grants-in-aid

MEGHALAYA STATE DEVELOPMENT REPORTMEGHALAYA STATE DEVELOPMENT REPORT
while esti mati ng the State’s own revenues for the period to assess the non-plan revenue defi cit positi on of the State. While the growth of revenue receipts under General Services (107 per cent) during 2006-07 over that of previous year far surpassed the projected growth rate, the growth under Social Services (3 per cent) and Economic Services (11 per cent) was less than the projected rate by 22 and 14 per cent respecti vely. In absolute terms, revenue receipts under General, Social and Economic Services during 2006-07 increased by Rs. 18.56 crore, Rs.0.09 crore and Rs. 13.03 crore respecti vely over the previous year. The current levels of cost recovery (revenue receipts as a percentage of revenue expenditure) in supply of merit goods and services by Government were negligible (0.9 per cent for secondary educati on, 1.21 per cent for medical and public health and 0.75 per cent for water supply and sanitati on).
Central Tax Transfers
The Central Tax transfers increased by Rs.97 crore over the previous year and consti tuted 21 per cent of revenue receipts. The increase was mainly under corporati on tax (Rs.43 crore), taxes on income other than corporati on tax (Rs.17 crore) and customs (Rs.19 crore).
Grants-in-Aid
The Grants-in-aid from the GOI increased from Rs.998 crore in 2005-06 to Rs.1,206 crore in 2006-07. The increase was mainly under State Plan Schemes (Rs.124 crore), Non-plan grants (Rs.66 crore), Central Plan Schemes (Rs.8 crore) and Special Plan Schemes (Rs.22 crore), partly off set by decrease in Centrally Sponsored Plan Schemes (Rs.8 crore). As per the recommendati ons of the TFC, the GOI released Rs.359 crore during 2006-07 as grants to cover defi cit on non-plan revenue account. Other components of non-plan grants mainly included (i) maintenance of roads and bridges on the recommendati on of the TFC (Rs.22 crore), (ii) grants for local bodies (Rs.17 crore), (iii) grants for backward regions (Rs.15 crore), (iv) contributi on to calamity relief fund (Rs.13 crore) and (v) grants for State specifi c purpose (Rs.12 crore).
Details of Grants-in-aid from the GOI are given in Table 4.8
Table 4.8: Grants-in-Aid from the GOI (Rupees in crore)
2001-02 2002-03 2003-04 2004-05 2005-06 2006-07Grants for State Plan Schemes 332 373 462 460 445 569Non-Plan Grants 317 408 329 361 406 472Grants for Central Plan Schemes 2 (7) 1 4 3 11Grants for Centrally Sponsored Schemes
67 76 62 87 119 107
Grants for Special Plan Schemes 10 18 13 24 25 47Total 728 875 867 936 998 1,206Percentage of increase (+)/ decrease (-) over previous year
(-) 4.46 (+) 20.19 (-)0.91 (+)7.96 (+) 6.62 (+) 20.84
77

MEGHALAYA STATE DEVELOPMENT REPORTMEGHALAYA STATE DEVELOPMENT REPORT
4.3.2 Revenue Arrears Besides, the arrears of tax revenue at the end of March 2007 in respect of some principal heads of revenue were Rs.26.54 crore, which consti tuted 8.71 per cent of tax revenue of the State for the year 2006-07. Of these, Rs.19.67 crore (74.11 per cent) were more than fi ve years old. An analysis of revenue arrears revealed that 81 per cent of pending arrears related to sales tax followed by other taxes (10 per cent). Further, 80 per cent of sales tax arrears (Rs.17.29 crore), 88 per cent of arrears under other taxes (Rs.2.31 crore) and 23 per cent arrears under motor spirits (Rs.0.07 crore) were more than fi ve years old. As the pending revenue arrears consti tuted about 9 per cent of tax revenue of the State during 2006-07, appropriate steps need to be initi ated by the State Government for their recovery, which would in turn provide a cushion to reduce the burden of fi scal liabiliti es of the State.
4.4 Applicati on of Resources4.4.1 Growth of Expenditure States raise resources to perform their sovereign functi ons, maintain their existi ng nature of delivery of social and economic services, to extend the network of these services through capital expenditure and investments and to discharge their debt service obligati ons. Total expenditure, its annual growth rate and rati o of expenditure to the State GSDP and to revenue receipts and its buoyancy with respect to GSDP and revenue receipts are indicated in Table 4.9.
Table 4.9 - Total Expenditure - Basic Parameters
2001-02 2002-03 2003-04 2004-05 2005-06 2006-07Total Expenditure (TE) (Rupees in crore)
1,360 1,466 1,619 1,878 1,944 2,233
Rate of Growth (per cent) -2.44 7.79 10.44 16.00 3.51 14.87TE/GSDP Rati o (per cent) 29.47 29.92 29.41 31.40 30.05 31.66Revenue Receipts/TE Rati o (per cent)
82.57 87.93 86.41 82.32 89.87 95.92
Buoyancy Rati o of Total Expenditure with reference to:GSDP -0.174 1.262 0.847 1.850 0.429 1.653Revenue Receipts -3.068 0.527 1.223 1.522 0.270 0.658
The total expenditure during 2006-07 has increased by Rs.289 crore (14.87 per cent) over the previous year. Of the increase in total expenditure, revenue expenditure formed 81 per cent (Rs.233 crore) and capital expenditure component was 21 per cent (Rs.61 crore), while disbursement of loans and advances decreased by 2 per cent (Rs.5 crore). While the share of plan expenditure consti tuted 39 per cent (Rs.881 crore) of the total expenditure, the remaining 61 per cent was non-plan expenditure (Rs. 1,352 crore). The increase in revenue expenditure was mainly due to increased expenditure under Rural Development (Rs.33.12 crore), Water Supply, Sanitati on, Housing and Urban Development (Rs.24.91 crore), Transport (Rs.24.01 crore) and Energy (Rs.22.50 crore). Capital expenditure has increased mainly on account of increased expenditure under Transport (Rs.21.56 crore) and Special Areas Programme (Rs.20.50 crore).
78

MEGHALAYA STATE DEVELOPMENT REPORTMEGHALAYA STATE DEVELOPMENT REPORT
During 2006-07, 96 per cent (Rs.2,142 crore) of total expenditure was met from revenue receipts and the remaining (Rs.91 crore) from borrowed funds. The buoyancy of total expenditure to GSDP stood at 1.7 in 2006-07 indicati ng tendency to spend more than the increase in income and higher elasti city of total expenditure with respect to GSDP.
4.4.2 Trends in Total Expenditure by Acti viti es In terms of the acti viti es, total expenditure could be considered as being composed of expenditure on general services including interest payments, social and economic services, grants-in-aid and loans and advances. Relati ve share of these components in total expenditure is indicated in Table 4.10.
Table 4.10 - Components of Expenditure-Relati ve Share (In per cent)
2001-02 2002-03 2003-04 2004-05 2005-06 2006-07General Services 31.99 33.49 34.03 31.68 32.72 32.20Of which Interest Payments 9.49 10.30 10.50 9.42 9.83 9.09Social Services 36.84 33.70 34.78 35.52 34.41 33.18Economic Services 28.01 27.69 26.87 30.88 32.30 34.35Loans and Advances 3.16 5.12 4.32 1.92 0.57 0.27
Chart 1.2
Components of Expenditure during 2006-07 (in per cent)
The movement of the relati ve share of these components of expenditure indicated that all components of expenditure had inter-year variati ons. Of the total expenditure during 2006-07, expenditure on general services and interest payments, which is considered as non-developmental, together accounted for 32.2 per cent. On the other hand, expenditure on social and economic services together accounted for 67.53 per cent during 2006-07. The relati ve share of social services at 33.18 per cent in 2006-07 was less than the level of 2001-02. The relati ve share of economic services which ranged between 26.87 per cent and 32.3 per cent during the last fi ve year period
23
9
33
35
0
General ServiceInterest PaytmentsSocial ServicesEconomic ServicesLoans and Advances
79

MEGHALAYA STATE DEVELOPMENT REPORTMEGHALAYA STATE DEVELOPMENT REPORT
2001-06 has marginally increased to 34.35 per cent in 2006-07 while loans and advances revealed wide fl uctuati ons during the period 2001-06 and declined to 0.27 per cent during 2006-07.
4.4.3 Incidence of Revenue expenditureRevenue expenditure had the predominant share in the total expenditure. Revenue expenditure is incurred to maintain the current level of services and payment for the past obligati ons and as such does not result in any additi on to the State’s infrastructure and service network. The overall revenue expenditure, its rate of growth, rati o of revenue expenditure to GSDP and to revenue receipts and its buoyancy are indicated in Table 4.11.
Table 4.11 - Revenue Expenditure - Basic Parameters
(Rupees in crore)
2001-02 2002-03 2003-04 2004-05 2005-06 2006-07
Revenue Expenditure (RE) 1,157 1,205 1,314 1,596 1,674 1,907
Of which
Non-Plan Revenue Expenditure
(NPRE)
884 949 1,004 1,120 1,183 1,341
Plan Revenue Expenditure (PRE) 273 256 310 476 491 566
Rate of Growth of
RE (per cent) 7.23 4.15 9.05 21.46 4.89 13.92
NPRE (per cent) 9.81 7.35 5.80 11.55 5.62 13.36
PRE (per cent) -0.36 -6.23 21.09 53.55 3.15 15.27
Rati os (per cent)
RE/TE (per cent) 85.07 82.20 81.16 84.98 86.11 85.40
NPRE/GSDP (per cent) 19.15 19.37 18.24 18.73 18.28 19.02
NPRE as per cent of TE 65.00 64.73 62.01 59.64 60.85 60.05
NPRE as per cent of RR 78.72 73.62 71.77 72.45 67.72 62.60
Buoyancy Rati o of Revenue Expenditure with
GSDP 0.517 0.672 0.734 2.482 0.596 1.547
Revenue Receipts - 9.092 0.281 1.060 2.042 0.376 0.616
The revenue expenditure increased by 65 per cent from Rs.1,157 crore in 2001-02 to Rs.1,907 crore in 2006-07. The non-plan revenue expenditure during the same period increased from Rs.884 crore to Rs.1,341 crore, showing an increase of 52 per cent indicati ng that the share of NPRE in total revenue expenditure declined only marginally from 76 per cent in 2001-02 to 70 per cent in 2006-07. As a result, plan revenue expenditure, which normally covers the maintenance expenditure incurred on services, has only increased by Rs.293 crore during 2001-07 keeping its share in total revenue expenditure between 21 and 30 per cent during the period. The growth of PRE during 2006-07 signifi cantly improved to 15.27 per cent against 3.15 per cent during previous year mainly due to increase in expenditure on rural development by Rs.33.42 crore followed by Rs.8.65 crore under energy sector and Rs.5.68 crore under social welfare and nutriti on. Though the rate of growth of NPRE (13.36 per cent) in 2006-07 was less than that of the PRE, this expenditure at Rs.1,341 crore during the year was WAI per cent (Rs.138 crore) higher
80

MEGHALAYA STATE DEVELOPMENT REPORTMEGHALAYA STATE DEVELOPMENT REPORT
than the normati vely assessed level of Rs. 1,203 crore by the TFC and 4.6 per cent (Rs.59 crore) higher than the assessments made by the State Government in its FCP and Budget esti mate for the year (Table 4.12).
Table 4.12 : Non-Plan Revenue Expenditure: Actual vis-à-vis Normati veAssessment by TFC
(Rupees in crore)
Parti culars Assessed by the TFC
Assessments made by State Government in FCP and Budget -2006-07
Actual Diff erence with reference to{Excess (+)/ Less (-)}
Assessments made by the TFC
Assessments made in the FCP
Interest Payments 212 213 203 -9 -10Pension 97 95 118 + 21 + 23Other General Services
249 Details not available (NA)
357 + 108
NASocial Services 433 390 -43Economic Services 212 273 + 61
Total 1,203 1,282 1,341 + 138 + 59 Except for interest payments and expenditure on social services, the actual expenditure incurred on all other components of non-plan revenue expenditure was more than the assessments made by the TFC.
4.4.4 Committ ed Expenditure Expenditure on Salaries and WagesThe trends in expenditure on salaries and wages both under plan and non-plan heads are presented in Table 4.13.
Table 4.13 : Expenditure on Salaries and Wages (Rupees in crore)
Heads 2001-02 2002-03 2003-04 2004-05 2005-06 2006-07Expenditure on Salaries and Wages
536 576 622 553 602 659
Of whichNon-Plan Head Details not available 464 502 547Plan Head 89 100 112As percentage of GSDP 11.61 11.76 11.30 9.25 9.30 9.34As percentage of Revenue Receipts
47.73 44.69 44.46 35.77 34.46 30.77
4.4.5 Pension Payments The expenditure on pension (including other reti rement benefi ts) showed an increasing trend during the six year period 2001-07 (Table 4.14).
81
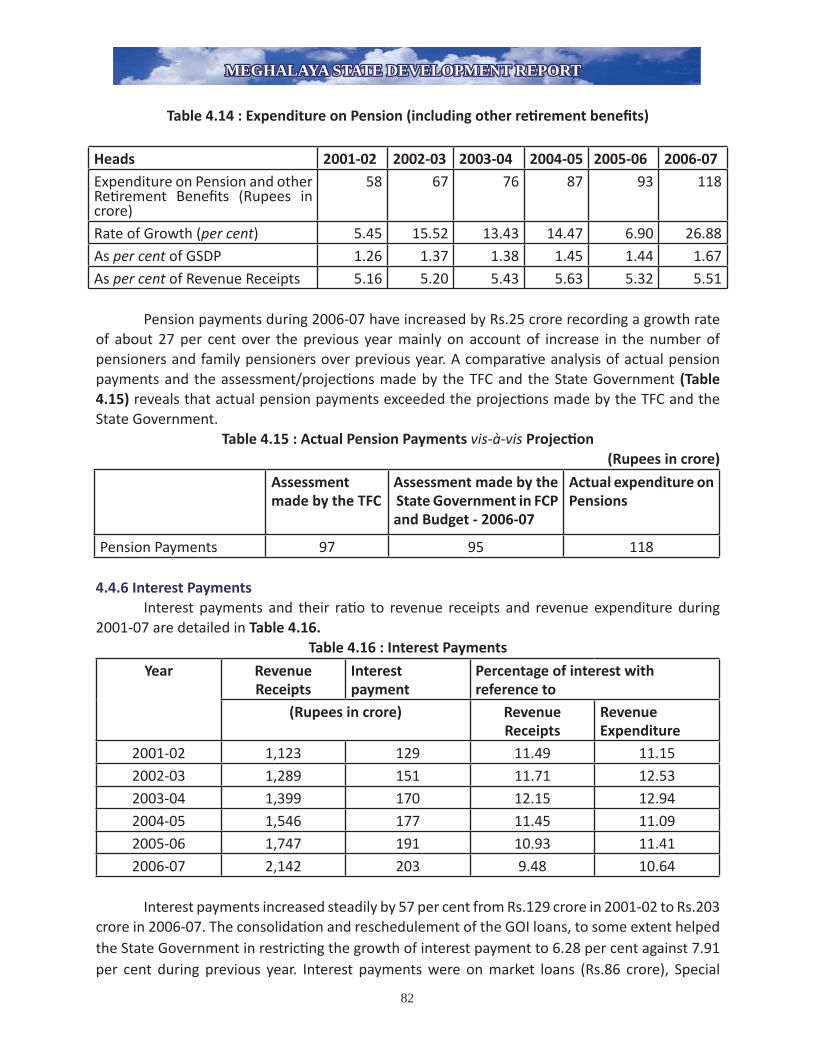
MEGHALAYA STATE DEVELOPMENT REPORTMEGHALAYA STATE DEVELOPMENT REPORT
Table 4.14 : Expenditure on Pension (including other reti rement benefi ts)
Heads 2001-02 2002-03 2003-04 2004-05 2005-06 2006-07Expenditure on Pension and other Reti rement Benefi ts (Rupees in crore)
58 67 76 87 93 118
Rate of Growth (per cent) 5.45 15.52 13.43 14.47 6.90 26.88As per cent of GSDP 1.26 1.37 1.38 1.45 1.44 1.67As per cent of Revenue Receipts 5.16 5.20 5.43 5.63 5.32 5.51
Pension payments during 2006-07 have increased by Rs.25 crore recording a growth rate of about 27 per cent over the previous year mainly on account of increase in the number of pensioners and family pensioners over previous year. A comparati ve analysis of actual pension payments and the assessment/projecti ons made by the TFC and the State Government (Table 4.15) reveals that actual pension payments exceeded the projecti ons made by the TFC and the State Government.
Table 4.15 : Actual Pension Payments vis-à-vis Projecti on(Rupees in crore)
Assessment made by the TFC
Assessment made by the State Government in FCP and Budget - 2006-07
Actual expenditure on Pensions
Pension Payments 97 95 118 4.4.6 Interest Payments Interest payments and their rati o to revenue receipts and revenue expenditure during 2001-07 are detailed in Table 4.16.
Table 4.16 : Interest Payments
Year Revenue Receipts
Interest payment
Percentage of interest with reference to
(Rupees in crore) Revenue Receipts
Revenue Expenditure
2001-02 1,123 129 11.49 11.152002-03 1,289 151 11.71 12.532003-04 1,399 170 12.15 12.942004-05 1,546 177 11.45 11.092005-06 1,747 191 10.93 11.412006-07 2,142 203 9.48 10.64
Interest payments increased steadily by 57 per cent from Rs.129 crore in 2001-02 to Rs.203 crore in 2006-07. The consolidati on and reschedulement of the GOI loans, to some extent helped the State Government in restricti ng the growth of interest payment to 6.28 per cent against 7.91 per cent during previous year. Interest payments were on market loans (Rs.86 crore), Special
82

MEGHALAYA STATE DEVELOPMENT REPORTMEGHALAYA STATE DEVELOPMENT REPORT
Securiti es issued to Nati onal Small Savings Fund of the Central Government (Rs.26 crore), other internal debt (Rs.20 crore), loans and advances received from Central Government (Rs.43 crore) and Small Savings, Provident Fund, etc. (Rs.28 crore). Of the total interest payments during the year, over 42 per cent (Rs.86 crore) was paid for market borrowings. The rate of growth of interest payments during 2006-07 over the previous year at 6.28 per cent was marginally lower than the average growth rate of 7.5 per cent assigned by the TFC while projecti ng the interest payments of Special Category States for the forecast period.4.4.7 Subsidies The trends in subsidies given by the State Government are given in Table 4.17. Though the subsidies are a drain on State fi nances, the State Government is extending subsidies to various sectors. Table 4.17: Subsidies
Year Amount (Rupees in crore)
Percentage increase (+)/ decrease (-) over
previous year
Percentage of subsidy in total expenditure
2001-02 24 - 14 1.822002-03 33 + 37 2.372003-04 30 - 9 1.942004-05 28 - 7 1.522005-06 20 -29 1.032006-07 34 + 70 1.52
(Total expenditure excludes Loans and Advances)Source: 2001-05: Informati on furnished by the Finance (Economic Aff airs) Department,
Government of Meghalaya; 2005-07: Finance Accounts - Government of Meghalaya.
During 2006-07 subsidies consti tuted 1.52 per cent of the total expenditure. Of this, 71 per cent (Rs.24.15 crore) was paid to the Meghalaya State Electricity Board (MeSEB), which was almost double the projecti on (Rs.12.50 crore) made in the FCP/Budget for the year 2006-07. The remaining amount of subsidies was paid for fi scal services, viz. under the head Taxes on Vehicles (Rs.3 crore), Fisheries (Rs.2.86 crore), Crop Husbandry (Rs.2.31 crore), Animal Husbandry (Rs.0.80 crore) and Civil Supplies (Rs.1.18 crore). Steep increase by 70 per cent over previous year was mainly due to increase in payment of subsidies to the MeSEB by Rs.14 crore and under Agriculture and Allied Services by Rs.5 crore.
4.5 Expenditure by Allocati ve Prioriti es4.5.1 Quality of Expenditure The availability of bett er social and physical infrastructure in the State refl ects its quality of expenditure. Therefore, rati o of capital expenditure to total expenditure as well as to GSDP and proporti on of revenue expenditure being spent on running the existi ng social and economic services effi ciently and eff ecti vely would determine the quality of expenditure. Higher the rati o of these components to total expenditure and GSDP, bett er is the quality of expenditure. Table 4.18 gives these rati os during 2001-07.
83

MEGHALAYA STATE DEVELOPMENT REPORTMEGHALAYA STATE DEVELOPMENT REPORT
Table 4.18 : Indicators of Quality of Expenditure (Rupees in crore)
2001-02 2002-03 2003-04 2004-05 2005-06 2006-07Capital Expenditure 160 186 235 246 259 320Revenue Expenditure
1,157 1,205 1,314 1,596 1,674 1,907
Of whichSocial and Economic Services with
728 721 788 1,009 1,049 1,204
(i) Salary & Wage Component Details not available
342 376 414
(ii) Non-Salary & Wage Component
667 673 790
As per cent of Total Expenditure (excluding loans and advances)Capital Expenditure 12.15 13.37 15.17 13.36 13.40 14.37Revenue Expenditure 87.85 86.63 84.83 86.64 86.60 85.63As per cent of GSDPCapital Expenditure 3.47 3.80 4.27 4.11 4.00 4.54Revenue Expenditure 25.07 24.59 23.87 26.69 25.87 27.04
Revenue expenditure consti tuted 85 per cent to 88 per cent of total expenditure during 2001-07 resulti ng in less expenditure in capital account ranging between 12 per cent and 15 per cent. During 2006-07, capital expenditure was also less than that projected (Rs.401 crore) in the FCP by Rs.81 crore. However, the rati o of capital expenditure to GSDP has increased from 3.47 per cent in 2001-02 to 4.54 per cent in 2006-07. The non-salary component consti tuted 66 per cent of revenue expenditure under social and economic services during 2006-07 and increased by 17.38 per cent over previous year, against 10.11 per cent on salary component. These trends indicated the improvement in the quality of expenditure and the impetus being given to asset formati on.
4.5.2 Expenditure on Social Services
Given the fact that the human development indicators such as access to basic educati on, health services and drinking water and sanitati on faciliti es, etc. have a strong linkage with eradicati on of poverty and economic progress, it would be prudent to make an assessment with regard to the expansion and effi cient provision of these services in the State. Table 4.19 summarises the expenditure incurred by the State Government in expanding and strengthening social services in the State during 2001-07.
84
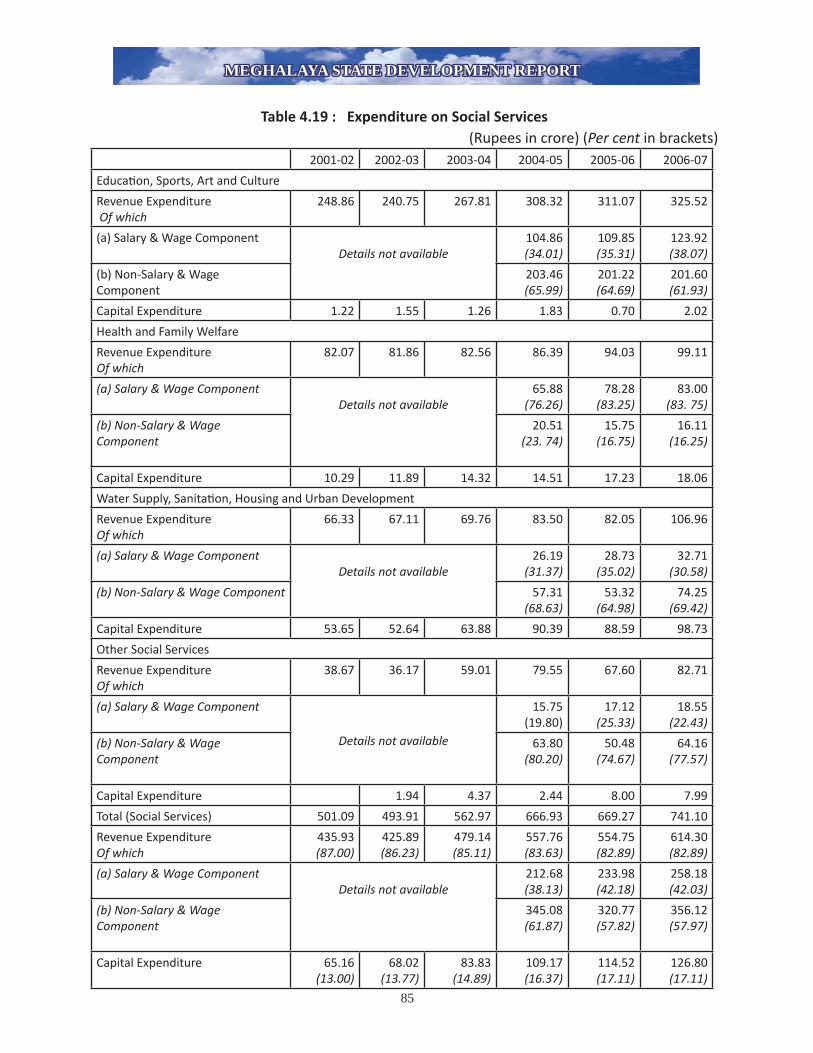
MEGHALAYA STATE DEVELOPMENT REPORTMEGHALAYA STATE DEVELOPMENT REPORT
Table 4.19 : Expenditure on Social Services (Rupees in crore) (Per cent in brackets)
2001-02 2002-03 2003-04 2004-05 2005-06 2006-07
Educati on, Sports, Art and Culture
Revenue Expenditure Of which
248.86 240.75 267.81 308.32 311.07 325.52
(a) Salary & Wage ComponentDetails not available
104.86 (34.01)
109.85 (35.31)
123.92 (38.07)
(b) Non-Salary & Wage Component
203.46 (65.99)
201.22 (64.69)
201.60 (61.93)
Capital Expenditure 1.22 1.55 1.26 1.83 0.70 2.02
Health and Family Welfare
Revenue Expenditure Of which
82.07 81.86 82.56 86.39 94.03 99.11
(a) Salary & Wage ComponentDetails not available
65.88 (76.26)
78.28 (83.25)
83.00 (83. 75)
(b) Non-Salary & Wage Component
20.51 (23. 74)
15.75 (16.75)
16.11 (16.25)
Capital Expenditure 10.29 11.89 14.32 14.51 17.23 18.06
Water Supply, Sanitati on, Housing and Urban Development
Revenue Expenditure Of which
66.33 67.11 69.76 83.50 82.05 106.96
(a) Salary & Wage ComponentDetails not available
26.19 (31.37)
28.73 (35.02)
32.71 (30.58)
(b) Non-Salary & Wage Component 57.31 (68.63)
53.32 (64.98)
74.25 (69.42)
Capital Expenditure 53.65 52.64 63.88 90.39 88.59 98.73
Other Social Services
Revenue Expenditure Of which
38.67 36.17 59.01 79.55 67.60 82.71
(a) Salary & Wage Component
Details not available
15.75 (19.80)
17.12 (25.33)
18.55(22.43)
(b) Non-Salary & Wage Component
63.80 (80.20)
50.48(74.67)
64.16(77.57)
Capital Expenditure 1.94 4.37 2.44 8.00 7.99
Total (Social Services) 501.09 493.91 562.97 666.93 669.27 741.10
Revenue ExpenditureOf which
435.93 (87.00)
425.89 (86.23)
479.14 (85.11)
557.76 (83.63)
554.75 (82.89)
614.30 (82.89)
(a) Salary & Wage ComponentDetails not available
212.68 (38.13)
233.98 (42.18)
258.18 (42.03)
(b) Non-Salary & Wage Component
345.08 (61.87)
320.77 (57.82)
356.12 (57.97)
Capital Expenditure 65.16 (13.00)
68.02(13.77)
83.83 (14.89)
109.17 (16.37)
114.52 (17.11)
126.80 (17.11)
85

MEGHALAYA STATE DEVELOPMENT REPORTMEGHALAYA STATE DEVELOPMENT REPORT
The allocati on to social sector increased from Rs.501 crore in 2001-02 to Rs.741 crore in 2006-07 indicati ng the Government’s commitment for improving social well being of the society. Expenditure on social sector during current year accounted for 33 per cent of total expenditure and 49 per cent of development expenditure. Expenditure on educati on, sports, art and culture, health and family welfare and water supply and sanitati on, housing and urban development consti tuted about 88 per cent of the expenditure on social sector.
The trends in revenue and capital expenditure on social services during 2001-07 reveal that the share of capital expenditure remained within the range of 13 to 17.11 per cent which indicated that the revenue expenditure was dominant. Of the revenue expenditure on social services, the share of salary and wage component has marginally decreased from 42.18 per cent in 2005-06 to 42.03 per cent in 2006-07 implying more expenditure on non-salary components including on their maintenance. The non-salary and wage expenditure on social services has increased by 3.2 per cent during 2004-07 from Rs.345.08 crore in 2004-05 to Rs.356.12 crore in 2006-07. Within the priority sector, non-salary and wage component conti nues to share dominantly under educati on, sports, art and culture and water supply, sanitati on, housing and urban development and high salary and wage expenditure during 2004-07 (76 per cent to about 84 per cent) under health and family welfare services.
Recognising the need to improve the quality of educati on and health services, TFC recommended that the non-plan salary expenditure under educati on, health and family welfare should increase only by 5 to 6 per cent, while non-salary expenditure under non-plan heads should increase by 30 per cent per annum during the award period. The trends in expenditure (taking expenditure under both plan and non-plan heads) reveal that the salary and wage component under educati on sector increased by 5 per cent in 2005-06 and 13 per cent in 2006-07 over the respecti ve previous years while non-salary and wage component decreased by 1 per cent in 2005-06 and increased by a nominal 0.19 per cent in 2006-07. Under health and family welfare sector, while there was signifi cant increase in salary and wage component by 19 per cent in 2005-06 over previous year, in 2006-07 the increase was 6 per cent under this component. Non-salary and wage component under this sector decreased by 23 per cent (Rs.4.76 crore) in 2005-06 and increased marginally by 2 per cent (Rs.0.36 crore) in 2006-07 over the previous years. Thus, expenditure patt ern under both these sectors needs correcti on in the ensuing years.
4.5.3 Expenditure on Economic Services The expenditure on economic services includes all such expenditure that promotes directly or indirectly, producti ve capacity within the States’ economy. Under economic services, the revenue expenditure increased from Rs.292.29 crore in 2001-02 to Rs.590.11 crore in 2006-07, while capital expenditure increased from Rs.88.88 crore to Rs.177.23 crore (Table 4.20).
86

MEGHALAYA STATE DEVELOPMENT REPORTMEGHALAYA STATE DEVELOPMENT REPORT
Table 4.20: Expenditure on Economic Services (Rupees in crore) (Per cent in brackets)
2001-02 2002-03 2003-04 2004-05 2005-06 2006-07
Agriculture and Allied Acti viti esRevenue ExpenditureOf which
124.34 116.94 121.97 139.62 163.07 176.28
(a) Salary & Wage Component Details not available
79.34 (56.83)
85.75 (52.58)
96.11(54.52)
(b) Non-Salary & Wage Component
60.28(43.17)
77.32 (47.42)
80.17(45.48)
Capital Expenditure 4.03 5.01 3.60 10.27 4.61 4.592001-02 2002-03 2003-04 2004-05 2005-06 2006-07
Irrigati on and Flood ControlRevenue ExpenditureOf which
9.03 9.01 9.53 10.82 12.65 13.76
(a) Salary & Wage Component Details not available
7.13 (65.90)
7.84 (61.98)
8.53 (61.99)
(b) Non-Salary & Wage Component
3.69 (34.10)
4.81 (38.02)
5.23 (38.01)
Capital Expenditure 10.54 6.61 6.17 5.19 7.58 5.61EnergyRevenue ExpenditureOf which
11.50 11.36 19.23 88.85 67.97 90.47
(a) Salary & Wage Component Details not available
Nil(12)
(b) Non-Salary & Wage Component
88.85 67.97 90.47
Capital ExpenditureTransportRevenue ExpenditureOf which
36.14 38.43 40.22 50.06 52.54 76.55
(a) Salary & Wage Component
Details not available
Nil
(b) Non-Salary & Wage Component
50.06 52.54 76.55
Capital Expenditure 50.15 87.40 91.85 90.18 86.03 107.59Other Economic Services
87
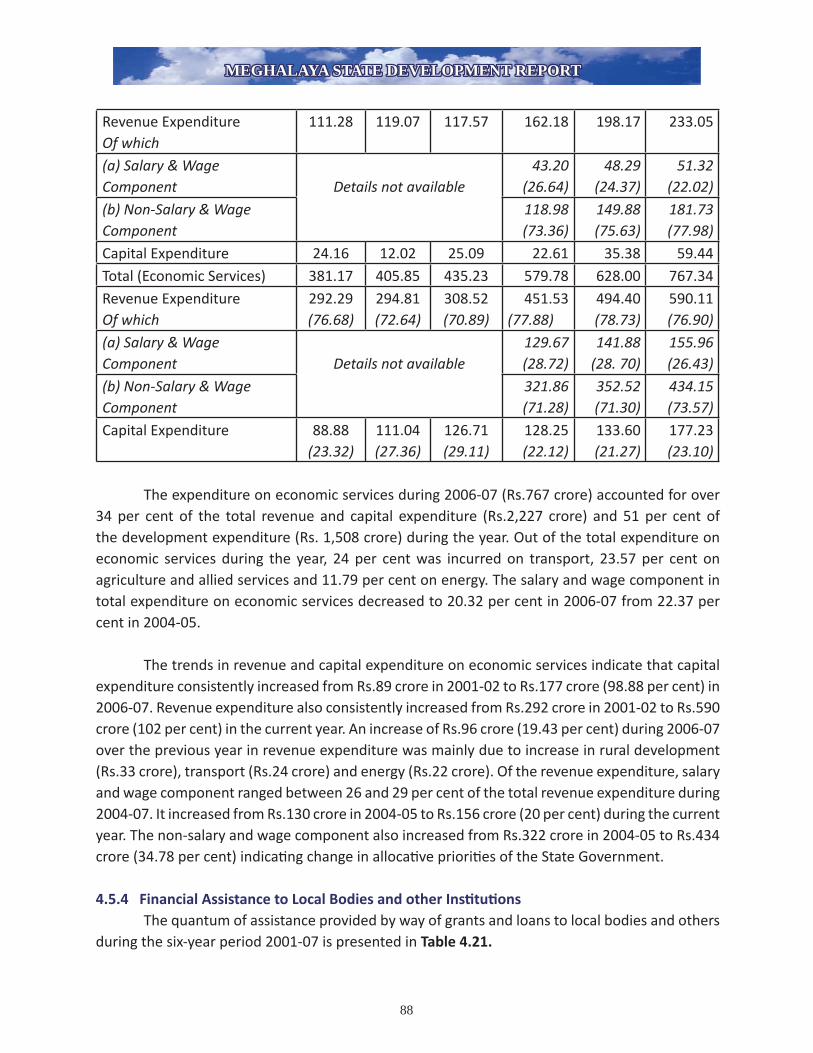
MEGHALAYA STATE DEVELOPMENT REPORTMEGHALAYA STATE DEVELOPMENT REPORT
Revenue ExpenditureOf which
111.28 119.07 117.57 162.18 198.17 233.05
(a) Salary & Wage Component Details not available
43.20 (26.64)
48.29 (24.37)
51.32 (22.02)
(b) Non-Salary & Wage Component
118.98 (73.36)
149.88 (75.63)
181.73 (77.98)
Capital Expenditure 24.16 12.02 25.09 22.61 35.38 59.44Total (Economic Services) 381.17 405.85 435.23 579.78 628.00 767.34Revenue ExpenditureOf which
292.29 (76.68)
294.81 (72.64)
308.52 (70.89)
451.53(77.88)
494.40(78.73)
590.11 (76.90)
(a) Salary & Wage Component Details not available
129.67 (28.72)
141.88 (28. 70)
155.96 (26.43)
(b) Non-Salary & Wage Component
321.86 (71.28)
352.52 (71.30)
434.15 (73.57)
Capital Expenditure 88.88 (23.32)
111.04 (27.36)
126.71 (29.11)
128.25 (22.12)
133.60(21.27)
177.23 (23.10)
The expenditure on economic services during 2006-07 (Rs.767 crore) accounted for over 34 per cent of the total revenue and capital expenditure (Rs.2,227 crore) and 51 per cent of the development expenditure (Rs. 1,508 crore) during the year. Out of the total expenditure on economic services during the year, 24 per cent was incurred on transport, 23.57 per cent on agriculture and allied services and 11.79 per cent on energy. The salary and wage component in total expenditure on economic services decreased to 20.32 per cent in 2006-07 from 22.37 per cent in 2004-05.
The trends in revenue and capital expenditure on economic services indicate that capital expenditure consistently increased from Rs.89 crore in 2001-02 to Rs.177 crore (98.88 per cent) in 2006-07. Revenue expenditure also consistently increased from Rs.292 crore in 2001-02 to Rs.590 crore (102 per cent) in the current year. An increase of Rs.96 crore (19.43 per cent) during 2006-07 over the previous year in revenue expenditure was mainly due to increase in rural development (Rs.33 crore), transport (Rs.24 crore) and energy (Rs.22 crore). Of the revenue expenditure, salary and wage component ranged between 26 and 29 per cent of the total revenue expenditure during 2004-07. It increased from Rs.130 crore in 2004-05 to Rs.156 crore (20 per cent) during the current year. The non-salary and wage component also increased from Rs.322 crore in 2004-05 to Rs.434 crore (34.78 per cent) indicati ng change in allocati ve prioriti es of the State Government.
4.5.4 Financial Assistance to Local Bodies and other Insti tuti ons The quantum of assistance provided by way of grants and loans to local bodies and others during the six-year period 2001-07 is presented in Table 4.21.
88

MEGHALAYA STATE DEVELOPMENT REPORTMEGHALAYA STATE DEVELOPMENT REPORT
Table 4.21: Financial Assistance (Rupees in crore)
2001-02 2002-03 2003-04 2004-05 2005-06 2006-07
University and Educati onal Insti tuti ons
128 130 129 150 151 164
Co-operati ve Societi es 3 2 2 2 2 5
District Councils 5 0.21 6 4 3 1
Municipaliti es 2 2 1 2 2 1
Meghalaya State Electricity Board 29 56 50 26 7 35
Other Insti tuti ons 27 11 10 5 2 2
Total 194 201 198 189 167 208
Assistance as percentage of Revenue Expenditure
16.77 16.68 15.07 11.84 9.98 10.91
The fi nancial assistance extended to local bodies and other insti tuti ons with inter-year variati ons increased by 25 per cent from Rs.167 crore in 2005-06 to Rs.208 crore in 2006-07. The share of fi nancial assistance in revenue expenditure in 2006-07 also increased from 9.98 per cent in 2005-06 to 10.91 per cent during the current year. Another important trend emerging from the above table is that share of Electricity Board has sharply increased by fi ve ti mes from Rs.7 crore in 2005-06 to Rs.35 crore in 2006-07 indicati ng that substanti al amount of fi nancial assistance is being given to the Public Sector Undertaking. University and Educati onal Insti tuti ons were the main benefi ciaries, who were provided with 79 per cent of the total fi nancial assistance during 2006-07. Of Rs.164 crore provided to the University and Educati onal Insti tuti ons, Rs.101 crore was paid to non-Government primary/secondary schools and colleges for non-plan revenue purposes indicati ng transfer of funds for current consumpti on.
4.6 Assets and Liabiliti es In the Government accounti ng system, comprehensive accounti ng of fi xed assets like land and buildings owned by the Government is not done. However, Government accounts do capture the fi nancial liabiliti es of the Government and the assets created out of the expenditure incurred. While the liabiliti es consist mainly of internal borrowings, loans and advances from the GOI, receipts from the Public Account and Reserve Funds, the assets comprise mainly the capital outlay and loans and advances given by the State Government and cash balances.
4.6.1 Financial Analysis of Government Investments4.6.1.1 Incomplete Projects As of March 2007, there were 282 ongoing projects under the Public Health Engineering Department. Of these, 43 projects, sti pulated for completi on on or before 31st March, 2007 at an esti mated cost of Rs.13.26 crore, remained incomplete with an expenditure of Rs. 11.76 crore ti ll 31st March, 2007. Out of 43 projects, 27 remained incomplete for less than one year and the remaining 16 projects for over one to three years.
89

MEGHALAYA STATE DEVELOPMENT REPORTMEGHALAYA STATE DEVELOPMENT REPORT
4.6.1.2 Government Investments and Returns As of 31st March, 2007, Government had invested Rs.183.16 crore in Statutory Corporati ons, Government Companies and Co-operati ve Societi es (Table 4.22). The return on this investment was less than one per cent during 2001-07 while the Government paid interest at an average rate of 7.62 to 9 per cent on its borrowings during the period.
Table 4.22: Return on InvestmentYear Investment
during the year
Investment at the end of the year
Return Percentage of return
Average rate of interest on Government borrowing
Diff erence between interest rate and return
(Rupees in crore) (Per cent)
2001-02 14.84 140.38 0.11 0.08 8.81 8.73
2002-03 11.93 152.32 0.01 0.00 8.98 8.98
2003-04 10.58 162.89 0.18 0.11 9.00 8.89
2004-05 7.53 170.42 0.18 0.11 8.58 8.47
2005-06 6.89 177.31 0.01 0.01 8.06 8.05
2006-07 5.85 183.16 0.01 0.01 7.62 7.61
As of March 2007, the State Government had invested Rs.40.19 crore in two Statutory Corporati ons, Rs.102.29 crore in eight Government Companies and Rs.40.68 crore in 1,438 Co-operati ve Societi es. Of the two Statutory Corporati ons, bulk of the investment (Rs.38.60 crore) was made to the Meghalaya Transport Corporati on Limited despite accumulated loss of Rs.50.64 crore sustained by the Corporati on up to 2000-01. Out of Rs.102.29 crore invested in Government Companies, Rs.18.92 crore was invested in fi ve loss making Companies, which had accumulated loss of Rs.22.87 crore as detailed in Table 4.23. Up-to-date working results of the Co-operati ve Societi es had not been inti mated (October 2007).
Table 4.23: Details of loss making Government Companies (Rupees in crore)
Sl. No.
Name of Companies Amount invested up to March 2007
Accumulated loss
Period upto
1. Meghalaya Government Constructi on Corporati on Limited
4.77 10.48 2004-05
2. Meghalaya Mineral Development Corporati on Limited
2.27 7.47 2005-06
3. Meghalaya Tourism Development Corporati on Limited
7.75 1.71 1991-92
4. Forest Development Corporati on of
Meghalaya Limited
1.56 1.74 1999-00
5. Meghalaya Handloom and Handicraft s
Development Corporati on Limited
2.57 1.47 2000-01
18.92 22.87
90

MEGHALAYA STATE DEVELOPMENT REPORTMEGHALAYA STATE DEVELOPMENT REPORT
4.6.1.3 Loans and Advances by State Government In additi on to investments in Co-operati ves, Corporati ons and Companies, Government has also been providing loans and advances to many of these insti tuti ons/organisati ons. Total outstanding loans and advances as on 31 March 2007 was Rs.469 crore (Table 4.24). Interest received against these loans and advances was meagre, which had decreased from 0.62 per cent in 2004-05 to 0.29 per cent in 2006-07.
Table 4.24 : Average Interest Received on Loans and Advances by the State Government(Rupees in crore)
2001-02 2002-03
2003-04 2004-05 2005-06 2006-07
Opening Balance 332 359 419 471 488 480
Amount advanced during the year 43 75 70 36 11 6
Amount repaid during the year 16 15 18 19 19 17
Closing Balance 359 419 471 488 480 469
Net Additi on 27 60 52 17 -8 - 11
Interest Received 0.49 0.46 0.72 2.99 1.48 1.36
Interest received as per cent to outstanding Loans and Advances
0.14 0.12 0.16 0.62 0.31 0.29
Average interest rate paid on borrowings by the State Government (per cent)
8.81 8.98 9.00 8.58 8.06 7.62
Diff erence between interest paid and received (per cent)
8.67 8.86 8.84 7.96 7.75 7.33
As the interest received as per cent to outstanding loans and advances was much lower than the cost at which the State Governments borrows, the TFC assumed a 7 per cent return on outstanding loans and advances to be achieved in a graded manner by the terminal year of the forecast period. Decreasing trend in return on outstanding loans and advances given by the State Government, which stands only at 0.29 per cent in 2006-07, indicates that the possibility of achieving 7 per cent return by the terminal year of the forecast period as assumed by the TFC is remote.
4.6.2 Management of Cash Balances It is generally desirable that the State’s fl ow of resources should match its expenditure obligati ons. However, to take care of any temporary mismatches in the fl ow of resources and expenditure obligati ons, a mechanism of Ways and Means Advances (WMA) - Ordinary and Special from Reserve Bank of India (RBI) has been put in place. The operati ng limit for Ordinary WMA is reckoned as the three year average of revenue receipts and the operati ve limit for Special WMA is fi xed by RBI from ti me to ti me depending on the holding of Government securiti es.
Under the agreement with the RBI, the Government of Meghalaya has to maintain an all ti me minimum balance of Rs.21 lakh with RBI. If the balance falls below the agreed minimum, the Government can take Ordinary WMA from the RBI up to a maximum of Rs.50.50 crore. In
91

MEGHALAYA STATE DEVELOPMENT REPORTMEGHALAYA STATE DEVELOPMENT REPORT
additi on, Special WMA not exceeding Rs.9.16 crore are made available against GOI securiti es held by the State Government. Overdraft s are given by the RBI if the State has a minus balance aft er availing of the maximum advance. There was, however, improvement in the management of cash balances as the Government did not have to resort to WMA for the current year (2006-07).
WMAs and Overdraft s availed, the number of occasions it was availed and interest paid by the State during 2001-07 is detailed in Table 4.25.
Table 4.25 : Ways and Means Advances and Overdraft s of the State(Rupees in crore)
2001-02 2002-03 2003-04 2004-05 2005-06 2006-07Ways and Means AdvancesAvailed in the Year 243.17 50.99 2.57 83.49Number of days 96 44 6 7Outstanding WMAs, if anyInterest Paid 0.23 0.24 0.08Overdraft Availed in the Year 0.46 8.85Number of days 1 1Outstanding Overdraft , if anyInterest Paid (18)
4.7 Undischarged Liabiliti es According to Meghalaya FRBM Act, 2006, the total liabiliti es means the liabiliti es under the Consolidated Fund of the State and the Public Account of the State and shall also include borrowings by the Public Sector Undertakings and Special Purpose Vehicles and other equivalent instruments including guarantees where principal and/or interest are to be serviced out of the State budget.
4.7.1 Fiscal Liabiliti es - Public Debt and Guarantees There are two sets of liabiliti es namely, public debt and other liabiliti es. Public Debt consists of internal debt of the State and is reported in the Annual Financial Statements under the Consolidated Fund - Capital Account. It includes market loans, special securiti es issued by RBI and loans and advances from the Central Government. The Consti tuti on of India provides that a State may borrow, within the territory of India, upon the security of its Consolidated Fund, within such limits, as may from ti me to ti me, be fi xed by the Act of its Legislature and give guarantees within such limits as may be fi xed. However, no law has been passed in the State to lay down any such limit. Other liabiliti es, which are a part of public account, include deposits under small savings scheme, provident funds and other deposits.
92
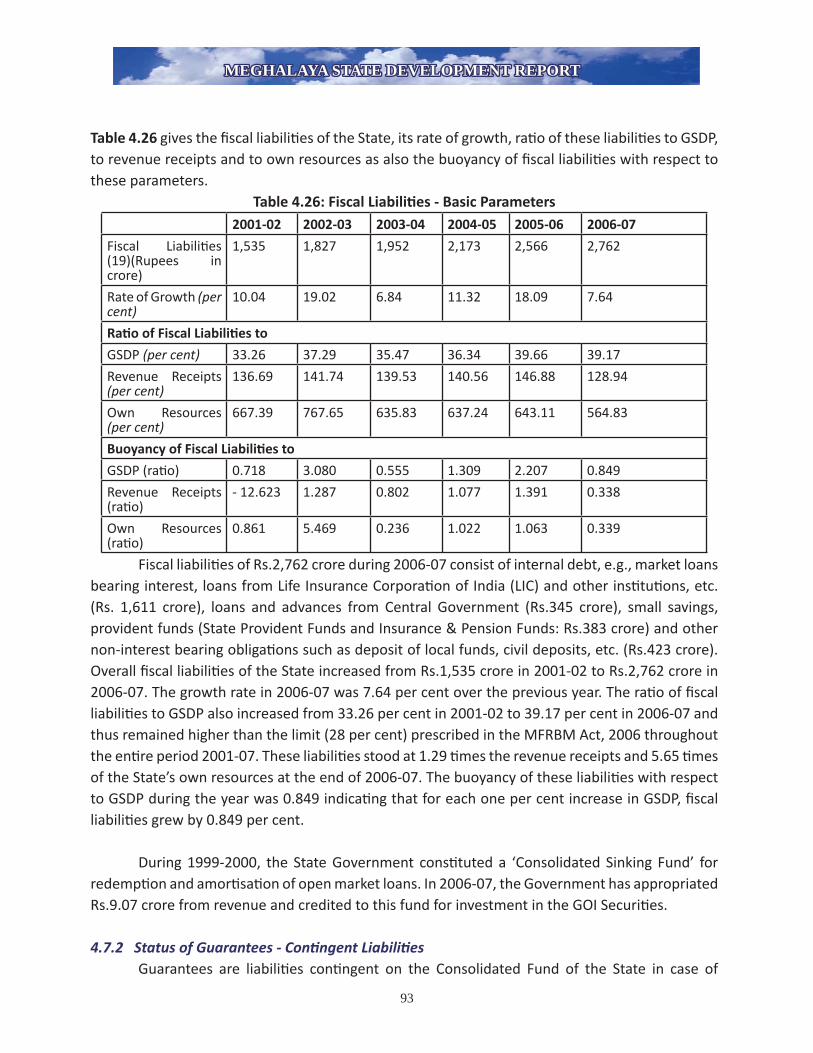
MEGHALAYA STATE DEVELOPMENT REPORTMEGHALAYA STATE DEVELOPMENT REPORT
Table 4.26 gives the fi scal liabiliti es of the State, its rate of growth, rati o of these liabiliti es to GSDP, to revenue receipts and to own resources as also the buoyancy of fi scal liabiliti es with respect to these parameters.
Table 4.26: Fiscal Liabiliti es - Basic Parameters2001-02 2002-03 2003-04 2004-05 2005-06 2006-07
Fiscal Liabiliti es (19)(Rupees in crore)
1,535 1,827 1,952 2,173 2,566 2,762
Rate of Growth (per cent)
10.04 19.02 6.84 11.32 18.09 7.64
Rati o of Fiscal Liabiliti es to
GSDP (per cent) 33.26 37.29 35.47 36.34 39.66 39.17
Revenue Receipts (per cent)
136.69 141.74 139.53 140.56 146.88 128.94
Own Resources (per cent)
667.39 767.65 635.83 637.24 643.11 564.83
Buoyancy of Fiscal Liabiliti es to
GSDP (rati o) 0.718 3.080 0.555 1.309 2.207 0.849
Revenue Receipts (rati o)
- 12.623 1.287 0.802 1.077 1.391 0.338
Own Resources (rati o)
0.861 5.469 0.236 1.022 1.063 0.339
Fiscal liabiliti es of Rs.2,762 crore during 2006-07 consist of internal debt, e.g., market loans bearing interest, loans from Life Insurance Corporati on of India (LIC) and other insti tuti ons, etc. (Rs. 1,611 crore), loans and advances from Central Government (Rs.345 crore), small savings, provident funds (State Provident Funds and Insurance & Pension Funds: Rs.383 crore) and other non-interest bearing obligati ons such as deposit of local funds, civil deposits, etc. (Rs.423 crore). Overall fi scal liabiliti es of the State increased from Rs.1,535 crore in 2001-02 to Rs.2,762 crore in 2006-07. The growth rate in 2006-07 was 7.64 per cent over the previous year. The rati o of fi scal liabiliti es to GSDP also increased from 33.26 per cent in 2001-02 to 39.17 per cent in 2006-07 and thus remained higher than the limit (28 per cent) prescribed in the MFRBM Act, 2006 throughout the enti re period 2001-07. These liabiliti es stood at 1.29 ti mes the revenue receipts and 5.65 ti mes of the State’s own resources at the end of 2006-07. The buoyancy of these liabiliti es with respect to GSDP during the year was 0.849 indicati ng that for each one per cent increase in GSDP, fi scal liabiliti es grew by 0.849 per cent.
During 1999-2000, the State Government consti tuted a ‘Consolidated Sinking Fund’ for redempti on and amorti sati on of open market loans. In 2006-07, the Government has appropriated Rs.9.07 crore from revenue and credited to this fund for investment in the GOI Securiti es.
4.7.2 Status of Guarantees - Conti ngent Liabiliti es Guarantees are liabiliti es conti ngent on the Consolidated Fund of the State in case of
93
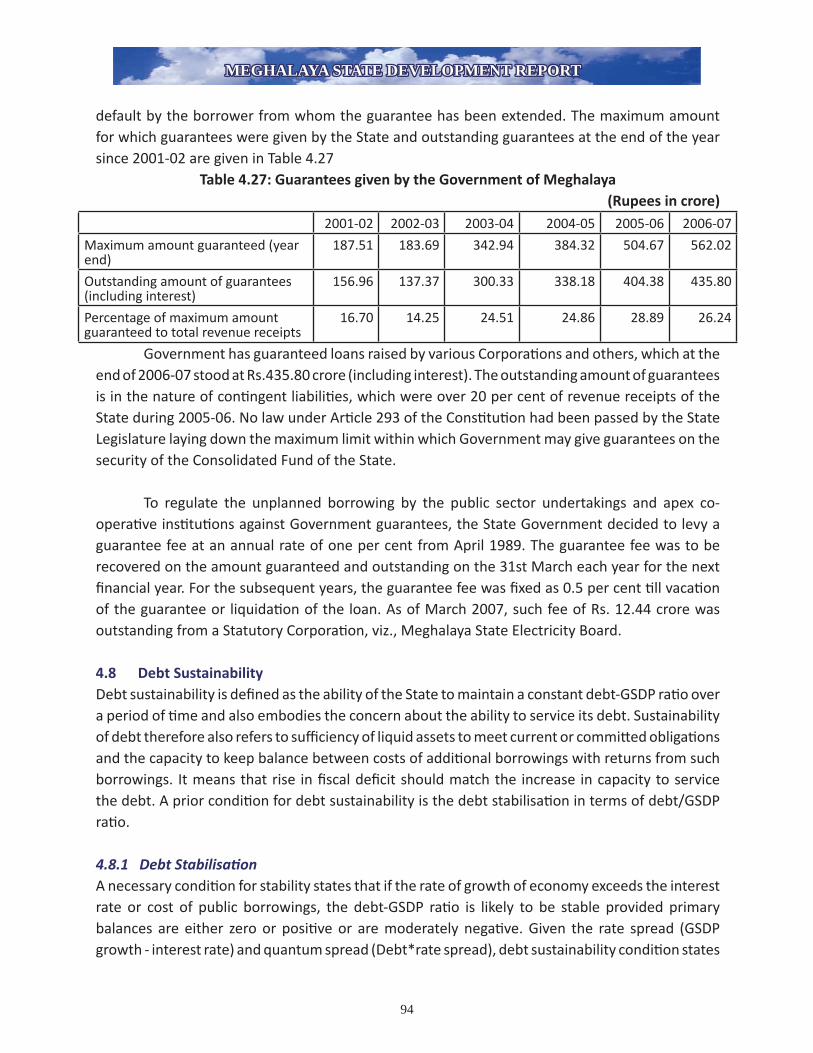
MEGHALAYA STATE DEVELOPMENT REPORTMEGHALAYA STATE DEVELOPMENT REPORT
default by the borrower from whom the guarantee has been extended. The maximum amount for which guarantees were given by the State and outstanding guarantees at the end of the year since 2001-02 are given in Table 4.27
Table 4.27: Guarantees given by the Government of Meghalaya(Rupees in crore)
2001-02 2002-03 2003-04 2004-05 2005-06 2006-07
Maximum amount guaranteed (year end)
187.51 183.69 342.94 384.32 504.67 562.02
Outstanding amount of guarantees (including interest)
156.96 137.37 300.33 338.18 404.38 435.80
Percentage of maximum amount guaranteed to total revenue receipts
16.70 14.25 24.51 24.86 28.89 26.24
Government has guaranteed loans raised by various Corporati ons and others, which at the end of 2006-07 stood at Rs.435.80 crore (including interest). The outstanding amount of guarantees is in the nature of conti ngent liabiliti es, which were over 20 per cent of revenue receipts of the State during 2005-06. No law under Arti cle 293 of the Consti tuti on had been passed by the State Legislature laying down the maximum limit within which Government may give guarantees on the security of the Consolidated Fund of the State.
To regulate the unplanned borrowing by the public sector undertakings and apex co-operati ve insti tuti ons against Government guarantees, the State Government decided to levy a guarantee fee at an annual rate of one per cent from April 1989. The guarantee fee was to be recovered on the amount guaranteed and outstanding on the 31st March each year for the next fi nancial year. For the subsequent years, the guarantee fee was fi xed as 0.5 per cent ti ll vacati on of the guarantee or liquidati on of the loan. As of March 2007, such fee of Rs. 12.44 crore was outstanding from a Statutory Corporati on, viz., Meghalaya State Electricity Board.
4.8 Debt SustainabilityDebt sustainability is defi ned as the ability of the State to maintain a constant debt-GSDP rati o over a period of ti me and also embodies the concern about the ability to service its debt. Sustainability of debt therefore also refers to suffi ciency of liquid assets to meet current or committ ed obligati ons and the capacity to keep balance between costs of additi onal borrowings with returns from such borrowings. It means that rise in fi scal defi cit should match the increase in capacity to service the debt. A prior conditi on for debt sustainability is the debt stabilisati on in terms of debt/GSDP rati o.
4.8.1 Debt Stabilisati onA necessary conditi on for stability states that if the rate of growth of economy exceeds the interest rate or cost of public borrowings, the debt-GSDP rati o is likely to be stable provided primary balances are either zero or positi ve or are moderately negati ve. Given the rate spread (GSDP growth - interest rate) and quantum spread (Debt*rate spread), debt sustainability conditi on states
94
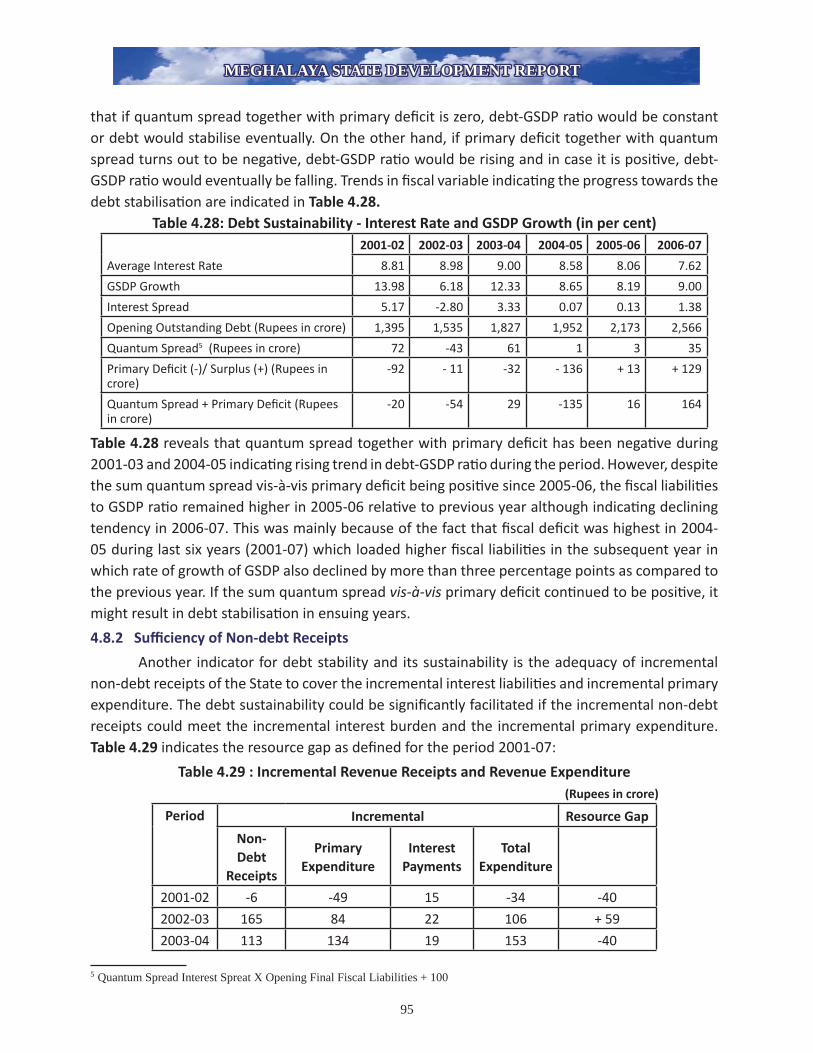
MEGHALAYA STATE DEVELOPMENT REPORTMEGHALAYA STATE DEVELOPMENT REPORT
that if quantum spread together with primary defi cit is zero, debt-GSDP rati o would be constant or debt would stabilise eventually. On the other hand, if primary defi cit together with quantum spread turns out to be negati ve, debt-GSDP rati o would be rising and in case it is positi ve, debt-GSDP rati o would eventually be falling. Trends in fi scal variable indicati ng the progress towards the debt stabilisati on are indicated in Table 4.28.
Table 4.28: Debt Sustainability - Interest Rate and GSDP Growth (in per cent)
Average Interest Rate
2001-02 2002-03 2003-04 2004-05 2005-06 2006-07
8.81 8.98 9.00 8.58 8.06 7.62
GSDP Growth 13.98 6.18 12.33 8.65 8.19 9.00
Interest Spread 5.17 -2.80 3.33 0.07 0.13 1.38
Opening Outstanding Debt (Rupees in crore) 1,395 1,535 1,827 1,952 2,173 2,566
Quantum Spread5 (Rupees in crore) 72 -43 61 1 3 35
Primary Defi cit (-)/ Surplus (+) (Rupees in crore)
-92 - 11 -32 - 136 + 13 + 129
Quantum Spread + Primary Defi cit (Rupees in crore)
-20 -54 29 -135 16 164
Table 4.28 reveals that quantum spread together with primary defi cit has been negati ve during 2001-03 and 2004-05 indicati ng rising trend in debt-GSDP rati o during the period. However, despite the sum quantum spread vis-à-vis primary defi cit being positi ve since 2005-06, the fi scal liabiliti es to GSDP rati o remained higher in 2005-06 relati ve to previous year although indicati ng declining tendency in 2006-07. This was mainly because of the fact that fi scal defi cit was highest in 2004-05 during last six years (2001-07) which loaded higher fi scal liabiliti es in the subsequent year in which rate of growth of GSDP also declined by more than three percentage points as compared to the previous year. If the sum quantum spread vis-à-vis primary defi cit conti nued to be positi ve, it might result in debt stabilisati on in ensuing years.
4.8.2 Suffi ciency of Non-debt Receipts
Another indicator for debt stability and its sustainability is the adequacy of incremental non-debt receipts of the State to cover the incremental interest liabiliti es and incremental primary expenditure. The debt sustainability could be signifi cantly facilitated if the incremental non-debt receipts could meet the incremental interest burden and the incremental primary expenditure. Table 4.29 indicates the resource gap as defi ned for the period 2001-07:
Table 4.29 : Incremental Revenue Receipts and Revenue Expenditure (Rupees in crore)
Period Incremental Resource Gap
Non-Debt
Receipts
Primary Expenditure
Interest Payments
Total Expenditure
2001-02 -6 -49 15 -34 -40
2002-03 165 84 22 106 + 59
2003-04 113 134 19 153 -40
5 Quantum Spread Interest Spreat X Opening Final Fiscal Liabilities + 100
95

MEGHALAYA STATE DEVELOPMENT REPORTMEGHALAYA STATE DEVELOPMENT REPORT
2004-05 148 252 7 259 - 111
2005-06 201 52 14 66 + 135
2006-07 393 277 12 289 + 104
The persistent negati ve resource gap indicates the non-sustainability of debt while the positi ve resource gap strengthens the capacity of the State to sustain the debt. During the period 2001-07, although three out of six years refl ects the negati ve gaps, the last two are the pointers towards the increasing capacity of the State to sustain the debt in the medium to long run.
4.8.3 Net Availability of Borrowed Funds
Debt sustainability of the State also depends on (i) the rati o of the debt redempti on (Principal + Interest Payment) to total debt receipts and (ii) applicati on of available borrowed funds. The rati o of debt redempti on to debt receipts indicates the extent to which the debt receipts are used in debt redempti on indicati ng the net availability of borrowed funds. The soluti on to the Government debt problem lies in applicati on of borrowed funds, i.e., they are (a) not being used for fi nancing revenue expenditure and (b) being used effi ciently and producti vely for capital expenditure which either provides returns directly or results in increased producti vity of the economy in general which may result in increase in Government revenue.
Table 4.30 gives the positi on of receipt and repayment of internal debt and other fi scal liabiliti es of the State as well as the net availability of the borrowed funds over the last six years.
Table 4.30 : Net Availability of Borrowed Funds (Rupees in crore)2001-02 2002-03 2003-04 2004-05 2005-06 2006-07
Internal Debt6
Receipts 110 401 287 188 340 243
Repayment (Principal + Interest) 81 343 183 194 258 188
Net Fund Available 29 58 104 -6 82 55
Net Fund Available (per cent) 26.36 14.46 36.24 24.12 22.63
Loans and Advances from GOI
Receipts 46 138 83 112 3 3
Repayment (Principal + Interest) 65 156 170 157 63 73
Net Fund Available -19 -18 -87 -45 -60 -70
Net Fund Available (per cent)
Other obligati ons
Receipts 241 329 255 281 410 413
Repayment (Principal + Interest) 239 228 318 186 228 406
Net Fund Available 2 101 -63 95 182 7
Net Fund Available (per cent) 0.83 30.70 33.81 44.39 1.69
Total Liabiliti es
Receipts 397 868 625 581 753 659
Repayments (Principal + Interest) 385 727 671 537 549 667
6 Includes Ways and Means Advances and Overdrafts
96

MEGHALAYA STATE DEVELOPMENT REPORTMEGHALAYA STATE DEVELOPMENT REPORT
Net Fund Available 12 141 -46 44 204 -8
Net Fund Available (per cent) 3.02 16.24 7.57 27.09
The net funds available on account of the internal debt, loans and advances from the GOI and other obligati ons aft er providing for the interest and repayments varied from minus during 2003-04 and 2006-07 to 27.09 per cent during 2005-06. During the current year, the Government repaid Rs.667 crore as principal and interest on internal debt (Rs.188 crore), loans and advances from the GOI (Rs.73 crore) and other obligati ons (Rs.406 crore), as a result of which payments exceeded the receipts (Rs.659 crore) by Rs.8 crore during the year. In view of substanti al cash balances during 2006-07, the focus of the Government seems to be on discharging the past debt obligati ons both on account of principal and interest payments on loans raised from the market as well as from the GOI.
4.9 Management of Defi cits4.9.1 Trends in Defi cits The defi cit in Government accounts represents the gap between its receipts and expenditure. The nature of defi cit is an indicator of the prudence of fi scal management of the Government. Further, the ways in which the defi cit is fi nanced and the resources raised are applied are important pointers to its fi scal health. The trends in fi scal parameters depicti ng the positi on of fi scal equilibrium in the State are presented in Table 4.31
Table 4.31 : Fiscal Imbalances - Basic ParametersParameters 2001-02 2002-03 2003-04 2004-05 2005-06 2006-07
Revenue Surplus (RS) (+)/
Revenue Defi cit (RD) (-)
(Rupees in crore)
-34 + 84 + 85 -50 + 73 + 235
Fiscal Defi cit (FD) (-)
(Rupees in crore)
-221 - 162 -202 -313 - 178 -74
Primary Defi cit (PD) (-)/
Surplus (+) (Rupees in crore)
-92 -11 -32 -136 + 13 + 129
RD/GSDP (per cent) -0.74 + 1.71 + 1.54 -0.84 + 3.33 + 3.33
FD/GSDP (per cent) -4.79 -3.31 -3.67 -5.23 -2.75 -1.05
PD/GSDP (per cent) -1.99 -0.22 -0.58 -2.27 + 0.20 + 1.83
RD/FD (per cent) 15.38 (23) 15.97 (23)
Table 4.31 reveals that the revenue account experienced a situati on of substanti al defi cit of Rs.34 crore during 2001-02. Though the State was successful in achieving revenue surplus during 2002-04, the year 2004-05 again experienced a revenue defi cit of Rs.50 crore. Since 2005-06, the revenue account turned into surplus which has steeply increased to Rs.235 crore during the current year. The signifi cant improvement during the current year was mainly on account of increase in revenue receipts by Rs.395 crore (22.61 per cent) against an increase of Rs.233 crore (13.92 per cent) in
97
MEGHALAYA STATE DEVELOPMENT REPORTMEGHALAYA STATE DEVELOPMENT REPORT
revenue expenditure over the previous year. The sharp increase in revenue receipts during 2006-07 was mainly on account of increase in Central tax transfers by Rs.97 crore (27.71 per cent) and grants-in-aid by Rs.208 crore (20.84 per cent).
The fi scal defi cit, which represents the total borrowings of the Government and its total resource gap, decreased from its peak of Rs.313 crore in 2004-05 to Rs.74 crore in 2006-07. Despite an increase of Rs.61 crore in capital expenditure and a decrease of Rs.5 crore in loans and advances disbursed during the current year over the previous year, fi scal defi cit was reduced signifi cantly by Rs.104 crore on account of the cushion of Rs.235 crore available from the revenue account.
The primary defi cit7 which persisted ti ll 2004-05, also took a turnaround and resulted in a primary surplus during 2005-06 and signifi cantly increased during the current year. A sharp decline of Rs.104 crore in fi scal defi cit together with a moderate increase of Rs.12 crore in interest payments resulted in a primary surplus of Rs.129 crore during the current year indicati ng the fact that fi scal defi cit was solely on account of payment obligati ons arising from the past fi scal operati ons of the Government.
4.9.2. Quality of Defi cit/Surplus The rati o of RD to FD and the decompositi on of Primary defi cit into primary revenue defi cit8 and capital expenditure (including loans and advances) would indicate the quality of defi cit in the States’ fi nances. The rati o of revenue defi cit to fi scal defi cit indicates the extent to which borrowed funds were used for current consumpti on. Out of six year period ending March 2007, the State experienced revenue defi cit during 2001-02 and 2004-05 and consequent rati o of RD to FD. Since 2005-06, RD was wiped out and turned into surplus which improved signifi cantly during the current year. This trajectory shows a consistent improvement in the quality of the defi cit.
The bifurcati on of the factors resulti ng into primary defi cit or surplus of the State during the period 2001-07 reveals (Table 4.32) that throughout this period, the primary defi cit was on account of capital expenditure incurred and loans and advances disbursed by the State Government. In other words, non-debt receipts of the State were enough to meet the primary expenditure9 requirements in the revenue account, rather left some receipts to meet the expenditure under the capital account. But the surplus non-debt receipts were not enough to meet the expenditure requirements under capital account resulti ng in primary defi cit during 2001-05. This indicates the extent to which the primary defi cit has been on account of enhancement in capital expenditure which may be desirable to improve the producti ve capacity of the State’s economy.
7 Primary defi cit defi ned as the fi scal defi cit net of interest payments indicates the extent of defi cit which is an out-come of the fi scal transactions of the States during the course of the year.8 Primary revenue defi cit defi ned as gap between non-interest revenue expenditure of the State and its non-debt receipts indicates the extent to which the non-debt receipts of the State are able to meet the primary expenditure incurred under revenue account.9 Primary expenditure of the State defi ned as the total expenditure net of the interest payments indicates the expendi-ture incurred on the transactions undertaken during the year.
98

MEGHALAYA STATE DEVELOPMENT REPORTMEGHALAYA STATE DEVELOPMENT REPORT
Table 4.32 : Primary Defi cit/Surplus - Bifurcati on of Factors (Rupees in crore)
Year Non-debt receipt
Primary Revenue Expen-diture
Capital Expen-diture
Loans and Advances
Primary Expenditure
Primary Revenue Defi cit (-)/ Surplus(+)
Primary Defi cit (-)/ Surplus (+)
1 2 3 4 5 6 (3 + 4 + 5) 7 (2 - 3) 8 (2 -6)
2001-02 1,139 1,028 160 43 1,231 + 111 - 92
2002-03 1,304 1,054 186 75 1,315 + 250 - 11
2003-04 1,417 1,144 235 70 1,449 + 273 - 32
2004-05 1,565 1,419 246 36 1,701 + 146 - 136
2005-06 1,766 1,483 259 11 1,753 + 283 + 13
2006-07 2,159 1,704 320 6 2,030 + 455 + 129
4.10. Fiscal Rati os:
The fi nances of a State should be sustainable, fl exible and non-vulnerable. Table 4.33 below presents a summarised positi on of Government fi nances over 2001-07, with reference to certain key indicators that help to assess the adequacy and eff ecti veness of available resources and their applicati ons, highlights areas of concern and captures its important facts.
Table 4.33: Indicators of Fiscal Health (inper cent)Fiscal Indicators 2001-02 2002-03 2003-04 2004-05 2005-06 2006-07
I. Resource Mobilisati on
Revenue Receipts (RR)/GSDP 24.33 26.31 25.42 25.85 27.00 30.37
Revenue Buoyancy Rati o - 0.057 2.394 0.692 1.215 1.587 2.514
Own tax/GSDP 2.95 2.96 3.23 3.48 3.91 4.33
Own Taxes Buoyancy Rati o 1.022 1.072 1.846 1.949 2.640 2.285
II. Expenditure Management
Total Expenditure (TE)/GSDP 29.47 29.92 29.41 31.40 30.05 31.66
RR/TE 82.57 87.93 86.41 82.32 89.87 95.92
Revenue Expenditure (RE)/TE 85.07 82.20 81.16 84.98 86.11 85.40
Plan Expenditure/Total Expenditure
31.69 30.15 33.66 38.18 38.53 39.36
Capital Expenditure/Total Expenditure 10
12.15 13.37 15.17 13.36 13.40 14.37
Development Expenditure/Total Expenditure
64.85 61.39 61.64 66.40 66.72 67.53
Buoyancy of TE with RR -3.068 0.527 1.223 1.522 0.270 0.658
Buoyancy of RE with RR - 9.092 0.281 1.060 2.042 0.376 0.616
III. Management of Fiscal Imbalances
Revenue Defi cit (-)/Surplus (+)
(Rupees in crore)
-34 + 84 + 85 -50 + 73 + 235
Fiscal Defi cit (-) (Rupees in crore) -221 - 162 -202 -313 - 178 -74
Primary Defi cit (-)/ Surplus (+)
(Rupees in crore)
-92 - 11 -32 -136 + 13 + 129
10 Total expenditure excludes Loans and Advances.
99

MEGHALAYA STATE DEVELOPMENT REPORTMEGHALAYA STATE DEVELOPMENT REPORT
Revenue Defi cit/Fiscal Defi cit 15.38 (10) (10) 15.97 (10) (10)
Fiscal Indicators 2001-02 2002-03 2003-04 2004-05 2005-06 2006-07
IV. Management of Fiscal Liabiliti es
Fiscal Liabiliti es (FL)/GSDP 33.26 37.29 35.47 36.34 39.66 39.17
FL/RR 136.69 141.74 139.53 140.56 146.88 128.94
Buoyancy of FL with RR
(rati o)
- 12.623 1.287 0.802 1.077 1.391 0.338
Buoyancy of FL with Own
Receipt (rati o)
0.861 5.469 0.236 1.022 1.063 0.339
Interest Spread 5.17 -2.80 3.33 0.07 0.13 1.38
Net Funds Available 3.02 16.24 7.57 27.09
V. Other Fiscal Health Indicators
Return on Investment 0.08 0.080 0.11 0.11 0.01 0.01
BCR (Rupees in crore) -168 - 123 -137 -142 - 19 77
Financial Assets/Liabiliti es (rati o) 1.57 1.55 1.55 1.47 1.43 1.48
The rati os of revenue receipts and State’s own taxes to GSDP indicate the adequacy of the resources. The buoyancy of the revenue receipts indicates the nature of the tax regime and the State’s increasing access to resources. Revenue receipts are comprised not only of the tax and non-tax resources of the State but also the transfers from Union Government. The rati o of revenue receipts to GSDP during the current year was 30.37 per cent, an increase of 3.37 percentage points over the previous year. During 2001-07, the rati o of own taxes to GSDP showed conti nued improvement.
Various rati os concerning expenditure indicate quality of expenditure and sustainability in relati on to resources. The revenue expenditure as a percentage to total expenditure remained over 81 per cent during 2001-07, indicati ng its dominant share in the total expenditure of the State leaving very litt le for capital formati on or asset creati on. The higher buoyancy rati o of total expenditure as compared to that of revenue expenditure with respect to revenue receipts during 2006-07 indicates the propensity of the State Government to create assets by resorti ng to capital expenditure. Increasing reliance on revenue receipts to fi nance the total expenditure, which amounts to 96 per cent during 2006-07, indicates decreasing dependence on borrowed funds. This is also refl ected by the decreasing rati o of fi nancial liabiliti es to revenue receipts. Increasing proporti on of plan expenditure and capital expenditure in the total expenditure also indicates improvement in both developmental and quality of expenditure.
Revenue surplus and signifi cant decline in fi scal defi cit during 2006-07 indicates an improvement in fi scal positi on of the State. The increasing revenue receipts have been able to bring an improvement in the fi scal imbalances of the State which is refl ected by the decreasing
100

MEGHALAYA STATE DEVELOPMENT REPORTMEGHALAYA STATE DEVELOPMENT REPORT
rati o of fi scal liabiliti es to revenue receipts as well as positi ve balance from the current revenues during the current year. Improvement in the fi scal imbalances of the State is also refl ected in the increasing assets to liabiliti es rati o during the current year.
4.11. Conclusion The fi scal positi on of the State viewed in terms of key fi scal parameters showed a signifi cant improvement as the State has been able to maintain revenue and primary surpluses and reduce fi scal defi cit during 2005-07. A steep increase in Central transfers to State, comprising tax transfers and grants-in-aid, has provided a cushion in revenue account which helped the State Government to increase revenue surplus and also to contain fi scal defi cit well within 3 per cent of GSDP ahead of two years than sti pulated in the MFRBM Act, 2006. Apart from the fact that around 77 per cent of States revenue receipts are being contributed by the Central transfers comprising of State’s share in Union pool of taxes and duti es and grants-in-aid from GOI during 2006-07, the expenditure patt ern of the State reveals that the revenue expenditure as a percentage of total expenditure consti tuted around 85 per cent during the period (2001-07) leaving inadequate resources for expansion of services and creati on of assets. Within revenue expenditure, NPRE at Rs. 1,341 crore in 2006-07 consti tuted around 70 per cent and remained signifi cantly higher than the normati vely assessed level of Rs. 1,203 crore by TFC for the year. Further, the salaries and wages, pensions, interest payments and subsidies conti nued to consume a major share of NPRE which was around 2/3rd during 2006-07. The conti nued prevalence of fi scal defi cit indicates increasing reliance of the State on borrowed funds, resulti ng in increasing fi scal liabiliti es of the State over this period, which stood at 39 per cent of the GSDP in 2006-07 and appears to be quite high especially if compared with the limit of 28 per cent prescribed in the MFRBM Act, 2006. The increasing fi scal liabiliti es accompanied by a negligible rate of return on Government investments and inadequate interest cost recovery on loans and advances might result in erosion of fi scal gains att ained so far in medium to long run, unless suitable measures are initi ated to compress the non-plan revenue expenditure and to mobilise the additi onal resources both through the tax and non tax sources in the ensuing years.
101


MEGHALAYA STATE DEVELOPMENT REPORTMEGHALAYA STATE DEVELOPMENT REPORT
CHAPTER – V
ECONOMIC GROWTH & STRUCTURAL CHANGE1
5.1. Introducti on: As a state, Meghalaya is yet to achieve the desired level of progress and prosperity in terms of infrastructure like communicati on, health care and educati on which is the main aspirati on of the people when it came into existence 37 years ago. Despite possessing a fairly rich resource base, which could provide a platf orm for adequate economic growth, Meghalaya is sti ll backward in terms of the presence of industries in the state. When it comes to the standard of living of the people as refl ected by the Per Capita Income of the state which stands at Rs.30204/= (Advanced Esti mates) at current prices during 2007-08 as against a nati onal Per Capita income of Rs.33131/= (Advanced Esti mates) during the same period. It shows that the level of income of the people is sti ll far below that of the nati onal level.
Meghalaya also witnessed high level of uneconomic and unscienti fi c exploitati on of natural and mineral resources by using age-old technique and exporti ng them to other states in the primary form has not only resulted in loss of forward and backward linkage benefi ts, value additi on benefi ts and extra earning of tax and no-tax revenue, but also has serious environmental consequences. It is very essenti al, therefore, to evolve an appropriate strategy and approach for tapping the resources scienti fi cally and economically with eff orts to be made for processing the resources within the state and export them as fi nished goods. This along with the improvement of various skills required for meeti ng the demands and challenges of the changing economic scenario will help improve the economy of the state and open up new employment opportuniti es for the people.
There are various economic indicators to measure the progress and development of the state over the diff erent periods. The esti mates of the State Domesti c Product (SDP) of the ‘State Income’ as commonly understood in common parlance along with Per Capita Income (PCI) are considered as the best Stati sti cal devices for assessing the growth of the economy as well as the living standard of the people.
The concept of Gross State Domesti c Product (GSDP) is more widely used in the analyti cal studies than the esti mates of Net State Domesti c Product (NSDP). However, in the present chapter, both the measures have been taken into considerati on to analyse the economic scenario of the state.
1 This chapter is largely the contribution from the Directorate of Economics & Statistics and fi gures quoted are from them.
103

MEGHALAYA STATE DEVELOPMENT REPORTMEGHALAYA STATE DEVELOPMENT REPORT
5.2. Growth and Sectoral Distributi on of Net State Domesti c Product (NSDP) and Gross State Domesti c Product (GSDP)5.2.1 Growth of NSDPThe NSDP of the state at current prices has been esti mated at Rs.3211.30 crore during 1999-2000. It increased to Rs.4722.58 crore in 2003-04 and increased further to Rs.6707.03 crore in 2007-08 (Adv). The average annual increase during the two periods between 1999-2000 and 2007-08 ranges from 6.23 p.c. to 12.90 p.c. The NSDP at constant (1999-2000) prices was Rs.3211.30 crore during 1999-2000 and went up to Rs.3993.01 crore during 2003-04. It went up further to Rs.5059.59 crore during 2007-08(Adv), thereby registering growths between 2.96 p.c. and 6.94 p.c. during the periods from 1999-2000 to 2007-08(Adv.).
Table 5.1 ESTIMATES OF NSDP AT FACTOR COST
Sl. No. Year NSDP at Current Prices (Crore)NSDP at Constant
(1999-2000) Prices (Crore)
1 2 3 4
1 1999-2000 3211.30 3211.30
2 2000-013593.25
(11.89)
3421.73
(6.55)
3 2001-024056.91
(12.90)
3651.31
(6.71)
4 2002-034309.78
(6.23)
3759.38
(2.96)
5 2003-044722.58
(9.58)
3993.01
(6.21)
6 2004-055137.90
(8.79)
4270.24
(6.94)
7 2005-065616.99
(9.32)
4547.56
(6.49)
8 2006-07(Q)6161.90
(9.70)
4799.75
(5.55)
92007-08
(Adv.)
6707.03
(8.85)
5059.59
(5.41)
Directorate of Economics & Stati sti cs, Meghalaya (Figures within brackets are percentage increase/growth over previous year)
5.2.2. Sector-wise distributi on NSDPThe economy of the state has been divided into three broad sectors, viz. Agriculture and Allied Acti viti es which include Agriculture proper, Livestock, fi shing acti viti es and forestry & logging; Industrial sector which includes Manufacturing, Mining and Quarrying, Constructi on; and Services sector. On analyzing the three sectors, though Meghalaya is primarily an agriculture economy with agricultural acti viti es engaging nearly 63 per cent of the total work force, yet the contributi on of this sector towards the economy of the state during 1999-2000 to 2007-08 is between 18.70 p.c. and 23.96 p.c. according to NSDP esti mates at current prices. The share of the Industrial sector
104

MEGHALAYA STATE DEVELOPMENT REPORTMEGHALAYA STATE DEVELOPMENT REPORT
being in the range of 21.09 p.c. to 26.42 p.c.. On the other hand, the share of Service sector in terms of percentage contributi on during the same periods, have been between 53.21 p.c. at the lowest and 54.95 p.c. at the highest.
5.2.3. Sectoral Compositi on of NSDPAs evident from the table below, the service sector conti nues to dominate the economy of the state by way of contributi ng the maximum share. Though its share in terms of percentage contributi on marginally declined from 54.95 p.c. in 1999-2000 to 53.54 p.c. in 2003-04 it further declined to 52.37 p.c. in 2007-08(Adv.). The Industrial sector shows an increasing trend in terms of percentage contributi on from 21.09 p.c. in 1999-2000. It went up to 23.73 p.c. in 2003-04 and rose further to 25.70 p.c. in 2007-08. On the other hand, the share of the Agriculture sector in the economy of the state shows a declining trend. The percentage contributi on has come down from 23.96 p.c. in 1999-2000 to 22.74 p.c. in 2003-04 and went down further to 21.94 p.c. in 2007-08(Adv.). But this trend in terms of percentage contributi on does not necessarily mean that the performance of Agriculture as an individual sector is going down. It only means that the Agriculture sector cannot compete with the other two sectors of the economy. On the whole, the patt ern of growth observed in the three main sectors of the economy viz-a-viz their percentage contributi on presents a healthy picture of the economy of the state which is in the stage of developing.
Table 5.2 NSDP By Main Sectors at Constant (1999-2000) PricesNSDP (Rs. In Crore)
Sl. No. YearAgriculture & Allied Acti viti es (Primary)
Industry (Secondary)
Services (Terti ary)
Total
1 2 3 4 5 6
1 1999-2000769.28(23.96)
677.36(21.09)
1764.66(54.95)
3211.30(100.00)
2 2000-01813.33(23.77)
775.87(22.67)
1832.53(53.56)
3421.73(100.00)
3 2001-02839.40(22.99)
865.18(23.70)
1946.73(53.32)
3651.31(100.00)
4 2002-03892.63(23.74)
845.67(22.49)
2021.08(53.76)
3759.38(100.00)
5 2003-04907.85(22.74)
947.38(23.73)
2137.78(53.54)
3993.01(100.00)
6 2004-05964.33(22.58)
1035.09(24.24)
2270.82(53.18)
4270.24(100.00)
7 2005-061011.16(22.24)
1129.17(24.83)
2407.23(52.93)
4547.56(100.00)
8 2006-07(Q)1059.35(22.07)
1229.94(25.63)
2510.46(52.30)
4799.75(100.00)
9 2007-08(Adv.)1109.83(21.94)
1300.09(25.70)
2649.67(52.37)
5059.59
(100.00)Directorate of Economics & Stati sti cs, Meghalaya
(Figures within brackets are percentage contributi on to the Total)
105

MEGHALAYA STATE DEVELOPMENT REPORTMEGHALAYA STATE DEVELOPMENT REPORT
5.2.4. Growth of GSDP The esti mates of GSDP at current prices, which recorded at Rs.3578.14 crore during 1999-2000 increased to Rs.5279.99 crore in 2003-04 and increased further to Rs.7605.28crore in 2007-08(Adv.), showing an annual percentage variance between 6.37 p.c. to 13.06 p.c. during the period 1999-2000 to 2007-08(Adv.). During the same periods, i.e. 1999-2000, 2003-04 and 2007-08(Adv.), the esti mates of GSDP at Constant (1999-2000) prices stood at Rs.3578.14 crore, Rs.4469.66 crore and Rs.5628.25 crore respecti vely, registering an annual growth range of 3.78 p.c. to 7.13 p.c.
5.2.4(i) GROWTH OF GSDP
Year GSDP at Current Prices (Rs. Crore)GSDP at Constant (1999-2000)
prices (Rs. Crore)1999-2000 3578.14 3578.14
2000-01 3960.94(10.70) 3773.37 (5.46)2001-02 4478.26(13.06) 4033.15 (6.88)2002-03 4763.42 (6.37) 4185.52 (3.78)2003-04 5279.99 (10.84) 4469.66 (6.79)2004-05 5805.50 (9.95) 4788.22 (7.13)2005-06 6318.85 (8.84) 5078.93 (6.07)
2006-07 (Q) 6959.29 (10.14) 5349.81 (5.33)2007-08(Adv.) 7605.28(9.28) 5628.25(5.20)
Directorate of Economics & Stati sti cs, Meghalaya
(Figures within brackets are percentage Variance/Growth over Previous Year)
NSDP By Main Sectors at Constant (1999-2000) Prices
0
50000
100000
150000
200000
250000
300000
1999-2000 2000-01 2001-02 2002-03 2003-04 2004-05 2005-06 2006-07(Q) 2007-08(Adv)
Year
Valu
e In
Lak
h
Agriculture Industry Services
106

MEGHALAYA STATE DEVELOPMENT REPORTMEGHALAYA STATE DEVELOPMENT REPORT
According to the esti mates of GSDP, there exists a huge gap in the district-wise distributi on of SDP in the state economy. The East Khasi Hills District has the highest DDP with more than 39.9 p.c. and South Garo Hills has the lowest at about 6 p.c. during the period from 1999-2000 to 2007-08 (Adv.). But in terms of Per Capita Income, the picture is diff erent, as South Garo Hills District registers the highest PCI with Rs.21300 during 1999-2000 and Rs.25786 during 2003-04, but in 2007-08 (Adv.) it was second with Rs. 28749 only to East Khasi Hills which has a PCI of Rs.31202 during the above period. The district with the lowest PCI being West Khasi Hills with Rs.9739, Rs.10632 and Rs.12592 during 1999-2000, 2003-04 and 2007-08(Adv.) respecti vely.
5.2.4(ii) GSDP at Constant (1999-2000) PricesDistrict-wise Contributi on (In Percentages)
YearJainti a Hills
East Khasi Hills
West Khasi Hills
Ri Bhoi East Garo Hills
West Garo Hills
South Garo Hills
Total
1999-2000 16.04 37.59 7.76 6.64 7.88 18.25 5.83 100.00
2000-01 15.69 38.16 8.00 6.83 7.47 17.76 6.10 100.00
2001-02 16.74 37.31 7.79 6.87 7.37 17.48 6.43 100.00
2002-03 9.50 49.57 6.55 6.49 7.14 17.75 3.00 100.00
2003-04 16.05 39.25 7.26 6.88 7.20 17.30 6.06 100.00
2004-05 15.47 39.96 7.12 7.08 7.29 17.16 5.92 100.00
2005-06 15.06 39.71 7.24 7.06 7.32 18.04 5.56 100.00
2006-07 (Q) 15.16 39.66 7.25 7.24 7.39 17.55 5.75 100.00
2007-08(Adv.) 14.98 39.81 7.18 7.39 7.44 17.57 5.63 100.00
Directorate of Economics & Stati sti cs, Meghalaya
5.2.4(iii) GSDP at Constant (1999-2000) pricesDistrict-Wise Per Capita Income (In Rupees)
YearJainti a Hills
East Khasi Hills
West Khasi Hills
Ri BhoiEast Garo Hills
West Garo Hills
South Garo Hills
STATE
1999-2000 19932 21084 9739 12775 11653 13060 21300 159952003-04 23246 25659 10632 15428 12408 14437 25786 18647
2007-08(Adv.) 26015 31202 12592 19866 15365 17566 28749 22352 Directorate of Economics & Stati sti cs, Meghalaya
5.2.5. Sector-wise Distributi on of GSDP Taking into considerati on the sector-wise performance of the economy by the three main sectors in terms of GSDP at Constant (1999-2000) prices, it is observed that the percentage contributi on of the Services sector was 53.76 p.c. during 1999-2000. It went down to 52.58 p.c. in 2003-04 and to 52.74 p.c. in 2007-08(Adv.), thus remaining almost at the same level. The
107

MEGHALAYA STATE DEVELOPMENT REPORTMEGHALAYA STATE DEVELOPMENT REPORT
share of Industrial Sector during the same periods have been 23.31 p.c., 25.69 p.c. and 26.13 p.c. respecti vely, thereby showing an increasing trend in terms of percentage contributi on. The Agricultural sector on the other hand is showing a decreasing trend with regard to percentage contributi on when it registered 22.93 p.c. in 1999-2000, it went down to 21.73 p.c. during 2003-04 and marginally again to 21.13 p.c. in 2007-08(Adv.).While at the nati onal level according to the esti mates of GDP, the contributi on of Services Sector have been recorded at 49.7 p.c. during 1999-2000, 52.7 p.c. in 2003-04 and 55.7 p.c. in 2007-08(Adv.). This shows an increasing trend during the three periods. On the contrary, the Agriculture sector has reduced in terms of contributi on from 25.0 p.c. to 21.7 p.c. and again to 17.5 p.c. during the above periods. There has been marginal increase in the contributi on of the Industries sector from 25.3 p.c. to 25.6 p.c. for the periods 1999-2000, 2003-04 and 26.8 p.c. during 2007-08(Adv.).
5.2.5. Sector-wise Distributi on of All India GDP and State GSDP
Percentage of GSDP at Constant (1999-2000) Prices
1999-2000 2003-042007-08
(Adv.)
Agriculture & Allied Acti viti es25.00
(22.93)21.70
(21.73)17.47
(21.13)
Industries25.30
(23.31)25.60
(25.69)26.79
(26.13)
Services49.7
(53.76)52.70
(52.58)55.74
(52.74)Total 100.00 100.00 100.00
(Figures in brackets are State fi gures)5.2.6 Poverty Scenario
The Nati onal Tenth Plan document prepared by the Planning Commission indicates that the percentage of populati on below the poverty line at the nati onal level has declined from 54.88 per cent in 1973-74 to 26.1 percent in 1999-2000 which is expected to decline further to 19.34 per cent in 2006-07. In respect of the State of Meghalaya, the fi gures of the Planning Commission indicate that the percentage of populati on below the poverty line was 50.20 per cent in 1973-74 and 33.87 per cent in 1999-2000 which is expected to decline further to 31.14 per cent in 2006-07 with a B.P.L populati on of 8.23 lakh. Among other states and UTs Meghalaya occupied 21st rank in the percentage of populati on below the poverty line. As per the esti mates, the state had 37.92 % of populati on of below the poverty line with the nati onal level fi gures at 35.97 % in 1993-94.
Since the poverty rati os used by the Planning Commission, GOI for Meghalaya are those of Assam, the incidence of poverty in Meghalaya in not very reliable.However, as advised by the Ministry of Rural Development, GOI all the states and Union Territories are to conduct the BPL Census for identi fying the households living below the poverty line at the
108

MEGHALAYA STATE DEVELOPMENT REPORTMEGHALAYA STATE DEVELOPMENT REPORT
beginning of every Five Year Plan and accordingly the Government of Meghalaya had conducted the BPL Census in 1997 and 2002.
Table - 5.2.6(i) District-wise Poverty Incidence in Meghalaya
C&RD Block/ District/State
Total Households BPL HouseholdsPercentage of BPL
HouseholdsRi Bhoi District 32590 16276 49.94
Jainti a Hills District 49771 19663 39.51West Khasi Hills
District63951 30480 47.66
East Khasi Hills District
109115 50997 46.74
West Garo Hills District
95699 51400 53.71
East Garo Hills District 50398 28192 55.94South Garo Hills
District18148 8226 45.33
Total State 419672 205234 48.90(Source – BPL Census, 2002)
Table - 5.2.6(i) shows that the proporti on of households living below the poverty line is a staggeringly huge fi gure at 48.9 percent. East Garo Hills District has the highest incidence of poverty at 56 percent followed by West Garo Hills District at 54 percent. Jainti a Hills District has the lowest proporti on of households below the poverty line at a litt le less than 40 percent. The incidence of poverty in the other districts is in the range of 45 – 50 percent.
109

MEGHALAYA STATE DEVELOPMENT REPORTMEGHALAYA STATE DEVELOPMENT REPORT
5.2.6(ii) Proporti on of Households Living Below the Poverty Line in Districts of Meghalaya in 2002
Source: BPL Census, 2002
However, the use of diff erent score limits for diff erent Blocks makes comparison impossible across the Blocks and districts except in cases where the poverty line (score limits) are the same. That is, two households which have more or less the same standard of living may be classifi ed as poor in case of one household and non poor in case of another if they happen to be in two diff erent Blocks with diff erent score limits.
Esti mati on of the incidence of poverty as measured by the proporti on of people living below the poverty line hinges crucially on the poverty line and how it is defi ned. There are several problems associated with the concept of poverty line, especially in Meghalaya and the other NE states. Nevertheless, poverty is pervasive and is evident to anyone who takes a look at the living conditi ons of the people of Meghalaya, especially those who reside in the remote rural areas of the state.
5.2.7 Per Capita NSDP – The PCI (NSDP) at current prices rose from Rs.14355 in 1999-2000 to Rs.19702 in 2003-04 and then to Rs.26636 during 2007-08(Adv.). While at constant (1999-2000) prices, the PCI was esti mated at Rs.14355 in 1999-2000. It increased to Rs.16658 during 2003-04 and increased further to Rs.20094 during 2007-08(Adv.). The PCI of Meghalaya fall below the nati onal level PCI which recorded Rs.15881, Rs.18317 and Rs.24256 respecti vely during the above periods at constant (1999-2000) prices.
110

MEGHALAYA STATE DEVELOPMENT REPORTMEGHALAYA STATE DEVELOPMENT REPORT
5.2.7(i) Per Capita NSDPYear 1999-00 2000-01 2001-02 2002-03 2003-04 2004-05 2005-06 2006-07 2007-08
Meghalaya 14355 14910 15518 15882 16658 17595 18501 19292 20094
All India 15886 16223 16910 17281 18517 19649 20813 22553 24256
(Source: Central Stati sti cal Organisati on & Directorate of Economics & Stati sti cs, Meghalaya)
5.3 Growth Prospects: In the beginning of the Tenth Five Year Plan, the Planning Commission while preparing the Plan document of the country had envisaged an average target growth of 8 p.c. of Gross Domesti c Product (GDP) of the nati on during the period. The target growth for the GSDP in the case of Meghalaya had been fi xed at 6.30 p.c. during the same period. Now, on analyzing the performance of the economy of the country at the nati onal level and that of Meghalaya at the regional level, it is observed that according to the GDP esti mates at constant (1999-2000) Prices, the country had achieved a growth of 8.74 p.c. which is 0.74 p.c. more than the target growth of 8.00 p.c. during the Tenth Five Year Plan. The state of Meghalaya on the other hand could somehow make it to the target of 6.3 p.c. growth of GSDP during the same period. The sector-wise performance by main sectors of the economy of the state shows an improvement in Agriculture and Industry by achieving growths of 4.43 p.c. and 8.67 p.c. respecti vely which are more than the target growths. The Services Sector, on the other hand could not reach the target and could achieve only 6.02 p.c. which is below the target of 7.5 p.c.
COMPARATIVE PER CAPITA INCOME OF MEGHALAYA AND ALL INDIA
14000
15000
16000
17000
18000
19000
20000
21000
22000
23000
24000
25000
1999-2000 2000-01 2001-02 2002-03 2003-04 2004-05 2005-06 2006-07(Q) 2007-08(Adv)
YEAR
PE
R C
AP
ITA
INC
OM
E (I
n R
upee
s)
Meghalaya All India
111

MEGHALAYA STATE DEVELOPMENT REPORTMEGHALAYA STATE DEVELOPMENT REPORT
The feasibility of att aining the targeted growth rate may be evaluated on the basis of past achievements. The growth rate of NSDP just before the preceding decade from the commencement of Tenth Plan was 6.6%. The growth rate for primary secondary and terti ary sectors for the same period have been calculated as 7.07, 7.2 and 6.3 percent respecti vely. Given this track record the state can expect to achieve the targeted growth rate. However given the high growth rate of populati on the growth of per capita NSDP during this period was only 4.5 %. Thus the states need to have a thorough revision in the development outlook of the implementi ng agencies to maintain parity between over all growth and per capita NSDP.
With regard to the projected growth in the Eleventh Plan, based on the trends observed in previous years’ performance of the state’s economy, the average growth during the period is expected to be 6.54 p.c. with Agriculture accounti ng for 5.20 p.c., Industry 7.82 p.c. and Service Sector 6.43 p.c. This will fall short of the target growth of 7.3 p.c. with sector-wise growth of 4.7 p.c. in Agriculture, 8.00 p.c. in Industry and 7.9 p.c. in Service Sector as fi xed by the Planning Commission for the state of Meghalaya in its approach paper. At the nati onal level, the Planning Commission of India has targeted a growth of 9.00 p.c. with sector-wise growth targets of 4.1 p.c., 10.5 p.c. and 9.9 p.c. in Agriculture, Industry and Service Sectors respecti vely. Considering the state of Meghalaya, the gap in the Quantum of growth in the Eleventh Plan, between the projected growth fi gures according to the state’s GSDP esti mates at constant (1999-2000) prices and the target growth as fi xed by the Planning Commission of India could be bridged depending on the volume of eff ort to be put in by the State Government which in turn will depend on the planning, executi ng and implementi ng agencies of the state. This is important in view of the fact that neither
ASSESMENT OF GROWTH DURING THE 10TH PLAN (2002-03 TO 2006-07
4.43
8.67
6.02
6.33
4.84
9.71
9.76
8.74
0
2
4
6
8
10
12
Agriculture Industry Service TotalSECTOR
GR
OW
TH R
ATE
Meghalaya All India
112
)

MEGHALAYA STATE DEVELOPMENT REPORTMEGHALAYA STATE DEVELOPMENT REPORT
the growth target nor the objecti ve indictors of well being of the people can be achieved simply by the Quantum of resources that we may mobilize but by effi ciency and eff ecti veness of our decisions, acti ons and implementati on of our policies and programmes, as emphasized by the Planning Commission it its ‘Tenth Five Year Plan’ document.
5.4 General Development Indicators.5.4.1 Food grain producti on The net sown area consti tutes 9.81 per cent of the total area of the State during 2001-02 and the double – cropped areas consti tute 16.85 per cent of the total area sown. Only 23.8 per cent of the total cropped area is under irrigati on as per 2001 -02 fi gures. Food grain producti on was 1.86 lakhs tones in 1998-99, which increased to 2.24 lakhs tones in 2001-2002 and 2.27 lakhs tones in 2003-04.
5.4.2 Industrializati on Though reasonable level of industrializati on is necessary for boosti ng up the economy of the State, yet this has to take place along with the opening up of employment opportuniti es and improving the State’s income by way of more revenue returns. Meghalaya has not witnessed the desired level of investment in this area primarily because of the lack of proper basic infrastructure, both in physical and fi nancial form. In recent years, due to the package of incenti ves off ered by the State Government combined with the att racti ve subsidies off ered by the
ASSESMENT OF GROWTH PROSPECTS DURING THE 11TH PLAN (2006-07 TO 2011-12)
4.70
8.00
7.90
7.304.
10
10.5
0
9.90 9.00
0
2
4
6
8
10
12
Agriculture Industry Service Total
SECTOR
TARG
ET G
ROW
TH
RATE
Meghalaya(Target) All India (Target)
113

MEGHALAYA STATE DEVELOPMENT REPORTMEGHALAYA STATE DEVELOPMENT REPORT
Central Government, a good number of industrial units have come up parti cularly at the EPIP at Byrnihat, Ri- Bhoi District and as a result, there has been tremendous pressure on the supply of power, thus making Meghalaya a power defi cit State. However, the real economic benefi ts being accrued to the State of Meghalaya as a consequence of these investments in industrial units are yet to be ascertained.
5.4.3 Unemployment The number of educated unemployed youth in the Live Register of Employment Exchanges in the State as on 2005 is 37,396. However, this fi gure does not fully refl ect the scale of unemployment in the State since it is most likely that a good number of the unemployed do not get registered themselves with the Employment Exchanges. This may be because the unemployed have litt le or no faith in the ability of these Exchanges to secure employment for them. The increase in the number of students in higher educati onal insti tuti ons has not been accompanied by a matching increase in the number of employment opportuniti es, in the organized sector of the economy. In spite of the massive expansion in administrati on, the organized sector has not been able to absorb fully the additi ons to the literate labour force. Large number of persons passing from School and college are unable to secure regular salaried employment. The potenti al for self- employment needs to be explored in private industry and trade. Rising numbers of educated unemployed have created frustrati on and anger among the youth, which has probably contributed to unrest and tension in the region. During the Ninth and Tenth Plan a number of industrial units have come up in the State especially at Byrnihat and Barapani in Ri Bhoi District as a consequence of the State’s incenti ves through its Industrial Policy of 1997, yet the level of employment of local people inmost of these units which is supposed to be 60 per cent is far from sati sfactory, perhaps due to lack of desired skill among the local youth or other unknown reasons. Development of local entrepreneurship and evoluti on of self- employment opportuniti es conti nue to stagnate. Diversifi ed skill development among the working populati on at the grass root level is almost non- existent. As such in spite of unemployment in the State, many of the skilled labour required for constructi on of roads, bridges, building etc. conti nue to come from outside the State. This problem needs to be addressed. One way of solving the problem of unemployment is by way of massive expansion of vocati onal training faciliti es in various trades at the grass root level with emphasis on the youth aft er the 10 or 10+2 levels of studies. Possession of the desired skill would help the youth in fi nding self – employment opportuniti es or even in public and private enterprises.
5.4.4 State of PSUs : Meghalaya ranks third from last (only before Nagaland and Sikkim) among other states in the Compounded Annual Rate of Growth (CARG) of Investment in state PSU’s. The Government hasn’t taken much initi ati ve to boost the investment in the state PSU’s. In 1990-91 the total investment of state PSU’s by state was Rs. 340.7 crores, which has increased to Rs. 451.4 crores in 1998-99 registering a CARG of 3.6 % only. This is signifi cantly below the nati onal CARG of 12.33 % during the same period. On the other hand, states like Assam, Himachal Pradesh, and Andhra Pradesh had invested at a CARG of 6.1 %, 10.8% and 18.4 % respecti vely.
114

MEGHALAYA STATE DEVELOPMENT REPORTMEGHALAYA STATE DEVELOPMENT REPORT
With the excepti on of a few State PSU’s, all the other units are loss making and can be considered as sick PSU’s. These PSU’s have acted as a drain on the resources of the State with their growing dependence on budgetary support of the State Government. One of the major reasons for the failure of the State PSU’s is the high level of employment that these have been saddled with, resulti ng in high spending on salaries and leaving lesser resources for producti ve investment. In order to tackle this problem, the State Government has implemented the Golden Handshake/Voluntary reti rement scheme for the employees of the State PSU’s. This is expected to restore the fi nancial health of these units to some extent.
No. Name of PSU Number of Employees taking VRS1. MECOFED 1142. MTC 2063. MGCC 764. MWL (Already wound up) 87
5.4.5 Disbursement of Financial Assistance by all fi nancial insti tuti onsThough the cumulati ve fi nancial assistance has increased from Rs. 30.9 crores in March 1986 to Rs. 243.90 crores in March 2003, but it is sti ll extremely low as compared to the nati onal level. The fi nancial insti tuti ons have provided an assistance aggregati ng to Rs. 600,133.30 cumulati ve up to end March 2003. In comparison Assam and Himachal Pradesh consti tute 0.4% and 0.9 % of the total cumulati ve fi nancial assistance. This has consequently resulted in poor growth and development of state as a whole.
5.4.6 Administrati ve Overhead Costs.Given the hilly terrain and low density of populati on, administrati ve overhead costs in Meghalaya are bound to be much higher than those in the rest of the country. With the emergence of the new State, there have been eff orts to bring the administrati on closer to the people by opening new districts, Sub- Division, Development Blocks, etc. All development agencies have by now positi oned their technical and administrati ve manpower. This process had resulted in a massive expansion in the number of Government employees both in the regulatory and development spheres. The administrati ve expansion was accompanied by a sustained rise in investments in Government buildings, both for residenti al and offi ce purposes. Building acti viti es have generated employment opportuniti es for contractors, masons, carpenters and unskilled workers in a signifi cant manner. The combined eff ect of the road building constructi on programmes on demand for labour and materials has been very substanti al.
5.5 Investment Opportuniti es and Openings.The State Government off ers subsidies such as, on cost of infrastructure, on Transport, on Training, on Power etc., the Central Government has since declared that new units in the North – Eastern Region will be eligible for exempti on from income tax for a period of fi ve years from the date
115

MEGHALAYA STATE DEVELOPMENT REPORTMEGHALAYA STATE DEVELOPMENT REPORT
of commercial producti on. There are a number of potenti al sectors that have been identi fi ed as Minerals Based Industry, Horti culture & Agro based Industry, Power, Tourism, Health care etc.
5.5.1 Mineral Based Industry.Meghalaya with its wealth of mineral deposits has tremendous industrial potenti al. There are extensive deposits of coal, limestone, granite, clay and other minerals. Coal deposits are available in all districts and parti cularly in the southern slopes of the State. The coal bears a low ash content and its calorifi c value ranges between 6500 to 7500 K.Cal/Kg. The total esti mated reserve of coal is in the region of 640 million tones. The coal is mainly of sub- bituminous type and can be uti lized in varied industries ranging from power, ferti lizer, cement and texti le to paper, rubber, brick burning and also pott ery based industries,. The coal that is found in the State can also be converted into coke to recover value added chemicals like light, medium and heavy oil, phenol and producer gas.Limestone is another mineral that occurs in an extensive belt (approx. 200 Km. Long) along the southern boarder of Meghalaya. The quality of limestone found here varies from cement grade to chemical grade having three brands. Total inferred reserve limestone within the State is about 5,000 million tones. The quality of limestone in the state has CaO content of 53 % and can be of use in steel, ferti lizer and chemical industries. Granite of excellent quality is at present being mined in the East and West districts of Khasi Hills. Sizeable deposits are esti mated and can be found in various shades and colours Clay of various types such as Kaolin (China clay), white clay and fi re clay are found in various parts of the states. This clay is suitable for the ceramic, paper, rubber and refractory industries. It has been esti mated that there are a few hundred million tones of clay reserved in the State. Beside the above, other economically viable minerals like gypsum, phosphorite, glass- sand, base metals, quartz and feldspar can be located in various parts of the state. More details about the occurrences of minerals is provided in the chapter of Natural Resources of the report. The state is also credited with having one of the most valuable silimanite deposits in the World.
5.5.2 Horti culture & Agro Based Industries.The potenti al for Agro- based industries in the state of Meghalaya is very high. The state produces substanti al quanti ti es of oranges, peaches, pineapples, pears, guavas, plums, and bananas. Potatoes, tapioca, bay leaves, ginger, maize and jackfruit are also grown in plenty in the region.Meghalaya’s turmeric, parti cularly the variety that is grown in Lakadong in the Jainti a Hills, is considered the best in the world and its curcumine content is as high as 7.5 %.It may be menti oned that there is enough potenti al for setti ng up a starch based processing unit in the State.Plantati on crops like coff ee, rubber, black pepper and arecanut are also becoming important products. A major breakthrough has been made in tea culti vati on and small tea gardens have come up in such parts of the State.
116
MEGHALAYA STATE DEVELOPMENT REPORTMEGHALAYA STATE DEVELOPMENT REPORT
One of the areas in which there is tremendous potenti al for investment and development is food processing. There is ample scope for setti ng up a medium scale fruit processing unit.
5.5.3 Power Generati on.Meghalaya has been one of the few states in the country with a history of surplus power generati on. Industrial units in Meghalaya had the unique privilege of uninterrupted power supply prior to 1998. The state possesses an assessed hydro-electricity potenti al of nearly 3000 MW. The state is a major benefi ciary of the South West Monsoon. The average annual rainfall is 11,000 mm. The Umiam – Umtru basins have only been partly developed during the past forty years. The power scenario in the state is discussed in detail in Chapter 15- Power Sector Reforms.The State is in the process of identi fying agencies including IPP that can invest in the development of Meghalaya’s considerable hydropower potenti al. The investors in Power Sector will fi nd a favourable atmosphere in the State of Meghalaya once it is rolled out.
5.5.4 Export Promoti on Industrial Park (EPIP)An Export Promoti on Industrial Park is set up at Byrnihat, nearer to Guwahati . It has an area of about 250 acres. The EPIP supported by the Government of India, Ministry of Commerce. The scheme is to encourage development of exports. The scheme required the State Government to provide infrastructure faciliti es like power, water, roads, sewage and drainage, telecommunicati on faciliti es and other faciliti es for the Park. Units that are establishment in the park should have to export not less than 25 % of their total product in value terms. There are proposals to expand this. There is also re – evaluati on of Industries & types as impact for local employment and economy.
5.5.5 Synergy with Central Government Departments and Other Agencies.Eff ort is being made through these proposals to dovetail various schemes to the extent possible with schemes proposed to DONER and NEC so that all round development is assured and that some schemes do not suff er in isolati on. The assistance of NESAC also is being acti vely sought and their interventi on in G.I.S. mapping for fi sheries and horti cultural development forms and important bulwark of the concerned sector. The assistance under the IFAD and other externally aided project has to be factored into for various proposals.
5.6. Guiding principles for public acti on2 :Addressing the problem of equitable access to opportuniti es remains a crucial issue in achieving the Millennium Developmental Goals (MDG). The policy challenge is to facilitate access to improved livelihood opportuniti es closely associated with poverty eradicati on strategies catering to the context, needs and potenti als of local communiti es in a sustainable manner. Breaking out
2 Dr. Shreeranjan (2006) Credit Related Issues in Meghalaya.
117

MEGHALAYA STATE DEVELOPMENT REPORTMEGHALAYA STATE DEVELOPMENT REPORT
of poverty traps and stagnant rural development would require a multi faceted approach revolving mainly upon Nine policy clusters as considered crucial in the context of Meghalaya:i. Investi ng in human development such as nutriti on, health (including reproducti ve health),
educati on, water and sanitati on etc. which foster a producti ve labour force;ii. In order to break out of subsistence farming and chronic hunger Helping small farmers
increase producti vity through investment, especially in rural areas; iii. Investi ng in infrastructure such as roads, communicati ons, power, etc in order to att ract new
investments in non-traditi onal areas;iv. evolving industrial development and investment policies that bolster non-traditi onal private
sector acti viti es, with special att enti on to small and medium-size enterprises. Such policies might include export processing zones, tax incenti ves and other initi ati ves to promote investment and public spending on research and development;
v. Building and Evolving development centric, accountable people’s insti tuti ons towards eff ecti ve parti cipati on and empowerment : this may involve restructuring and refashioning the Governmental set up, Traditi onal hierarchical and non hierarchical insti tuti ons, refashioned District councils and making them partners in governance and delivery of development with accountability. This should address role-ambiguity, overlaps, confusion and disputes in functi ons and aim at decentralisati on with empowerment;
vi. Building Capaciti es at various levels: This may involve organizati onal and insti tuti onal capaciti es; skills and experti se for employment, livelihoods and entrepreneurship; building capaciti es for newer economy with freedom of choice;
vii. A framework for integrated planning and development with insti tuti onal arrangements for spati al and locati on specifi c hill area perspecti ve for Meghalaya and att ending to the criti cal inter-sectoral gaps and linkages;
viii. Emphasizing human rights and social equity to promote the well-being of all secti ons of people who have the freedom and voice to infl uence decisions that aff ect their lives;
ix. Promoti ng environmental sustainability and improving urban management. There is a need to protect the biodiversity and ecosystems that support life (clean water and air, soil nutrients, forests, fi sheries, other key ecosystems) and ensure that natural resources are well managed to provide livelihoods and safe environments.
Access to credit, especially to poor and rural areas is essenti al element of harmonizing such aims of development as enunciated in the introducti on and chapter III. A diff erenti ated local context-specifi c approach is required in working the acti on plans for asset creati on. Given the broad range of assets and their interacti ons which matt ers a lot to the poor; access to potable water, basic health facility and educati on may be considered criti cal assets. But for hungry and poor, food security, access to land, energy requirements and rural road connecti vity would be more important in the rural areas. In urban areas, housing (shelter) and water and sanitati on services would assume greater importance. Besides, environmental protecti on and sustainability pose major challenge to a society where quick fi x soluti ons and quick bucks take precedence.
118

MEGHALAYA STATE DEVELOPMENT REPORTMEGHALAYA STATE DEVELOPMENT REPORT
For fi nancial sector focus, drawing upon “A holisti c natural resource based development paradigm’’ (suggested by the author in another work which indicated fi ve closely interrelated general guiding principles) with some additi ons, can be followed as generic prescripti on:
Prioriti se and reallocate public expenditures by making it pro-poor and be more proacti ve to • ensure that the resources are allocated to meet the diverse needs of the poor.Nati onal/state level acti ons towards Reforms, including land reforms and redistributi ng land • are given priority. Improving the legal, regulatory and enforcement environment in general. A system of • complementary insti tuti ons to tackle collateral laws, collateral registries, improving informati on about loanees in formal and informal sector through credit registries, use of computerised credit scoring models will enhance access to credit as menti oned in the WDR, 2002.Focus on building mechanisms at the local level that can hold Nati onal/State and local levels • accountable through eff ecti ve empowerment through decentralizati on and parti cipati on.Evolve closer working among six group of insti tuti ons government [(Central and State (including • local)], private sector, civil society, aid organisati ons and academic/ scienti fi c insti tuti ons working for the poor to work on the demand and supply sides of asset and economy buildup.Focusing on the demand side to ensure that supply-side interventi ons contribute to asset and • economy buildup at a matching rate.While working out rural and urban development strategies synergise and build on acti ons • taken for assets creati on for increased well-being of the poor.The above principles should take on board:• More proacti ve acti ons to address inequaliti es• of assets, across gender, rural urban and ethnic groups, etc. that impede poverty reducti on and growth
Realisti c and implementable land reform programs.• Removing gender bias in legislati on and • Improving and Operati onalisati on of rule of law and legal systems; • Accelerati ng skill acquisiti on process by the poor with demand- and supply-side • interventi ons.
Support for making insti tuti ons of /in the state (both local and nati onal) pro-poor and • accountable to the poor. Support for capacity building of pro-poor membership-based organizati ons ; scaling up CBO; • building alliances/cooperati ve federati ons; Initi ati ng creati on of qualitati ve and quanti tati ve informati on base detailing local- and • household-level knowledge on the nature and coping mechanism of risks in the life cycle of poor. Taking risk and vulnerability of the poor for further detailed analysis for its impact on poverty, effi ciency, and growth. Working on multi -pronged/-dimensional programmati c approach in development and credit • interventi ons to cushion the poor against shocks/ diff erent risks. Recogniti on of strong cross-sectoral linkages; of cross-cutti ng impacts on empowerment, •
119
MEGHALAYA STATE DEVELOPMENT REPORTMEGHALAYA STATE DEVELOPMENT REPORT
security, and opportunity; and of the importance of holding service delivery accountable to the poor. Formulati on of Perspecti ve Block/District Plan and Annual Acti on Plan for infrastructure • development and promoti on of core acti viti es; Linkage of the Perspecti ve/Annual Plan with Programmes, schemes that facilitate creati on of infrastructure and Capacity to improve effi ciency of extension and delivery systems.Taking local realiti es that matt er and catering to the conti ngent insti tuti on building. • Strengthening and evolving decentralised village or cluster level insti tuti ons in the state for bett er parti cipati on, delivery and impact. Promoti ng SHGs with the help of NGOs;Support for the provision of public goods from all over. • Innovati on and Proacti ve acti ons in development assistance, increasing the role of civil society • and the private sector in implementati ons, and turning leadership more responsible and responsive, enhancing ownerships.Intensive training of the Government Offi cials (DRDA, Block and Line Departments), Bank • Offi cials and NGOs as well as capacity building of the functi onaries of Grass root organisati ons/ traditi onal organisati ons/Local Bodies and Community Based Organizati on etc are desirable; andThere is a need for developing a strong net-work for eff ecti ve monitoring of the development • programmes in general and the Self-employment programmes, in parti cular. In this process, social auditi ng by the grass root organisati ons would become necessary.
5.7. Recommendati ons The study of economic growth is an abstracti on of the objecti ve performance of the various sector of the economy. Thus the study of economic growth of a state must be supplemented with the analysis of the various economic sectors that has been dealt in the other chapters such as fi nance, industry, agriculture, labour and employment etc. The recommendati ons of this chapter also take into account of the fi ndings and recommendati ons from the other chapters related to it.
Another point has to be taken into considerati on that the Tenth Plan emphasized that neither the growth target nor the objecti ve indicators of well being of the people can be achieved simply by the quantum of resources that is mobilized but by effi ciency and eff ecti veness of the decisions acti ons and implementati on of policies and programmes. Hence the recommendati ons of this chapter have been made in the light of these approaches.
• The high growth rate fi gures may be due to low initi al base; therefore these mere stati sti cal fi gures should not be treated as true refl ecti on of the reality. In fact the high growth of GSDP/NSDP is found to be dependent largely on the contributi on of terti ary sector that is backed by large proporti on of public sector employment in organized sector. It cannot be sustained unless and unti l a supporti ng growth rate is att ained by the industrial sector. Therefore, there is an urgent need for
120

MEGHALAYA STATE DEVELOPMENT REPORTMEGHALAYA STATE DEVELOPMENT REPORT
ensuring congenial environment for the sustained growth of terti ary sector. This can be ensured by the help of a host of factors such as faster growth of domesti c capital formati on, development of entrepreneurship, congenial environment to att ract investors from other states by opening up the state economy with more liberal policy.• Resource – industry linkage has to be strengthened for ensuring faster growth in the secondary sector that in turn would help to induce momentum of growth in the acti viti es forming backward linkage to it.• Scope for irrigati on and rural infrastructure has to be improved both in terms of quanti ty and quality. This will ensure food security and reducti on of rural poverty on the one hand and improving resource- industry linkage on the other hand.• Targets of rural development schemes have to be framed in terms of physical and social parameters, not merely in terms of fi nancial units. The Plan objecti ves in this regard must be followed in lett er and spirit.• A shift in the policy outlook is urgently needed to reduce the rural – urban gap in terms of economic growth. Industrial opportuniti es in the rural sector, considering the resource availability has to be identi fi ed and proper steps have to be taken for its implementati on.• Inter-sectoral balance has to be ensured with the direct interventi on of the state. Other wise the growth potenti al of Meghalaya cannot be sustained for a longer period of ti me.• The nature of employment and terrain in the state to some extent pushes up the overhead expenditure. Sti ll the other areas of possible leakages have to be identi fi ed to reduce the overhead expenditure of the Government that will help in ensuring greater government investment in physical terms.• There is an urgent need for eff ecti ve decentralizati on of the decision- making processes. Being formed under the provision of the Sixth Schedule of the Consti tuti on, the 73rd and 74th Amendments are not applicable in the State. Introducti on of reforms in this area may usher in the decentralized planning processes in the state that will help to a great extent to bring momentum in the economic growth in the state of Meghalaya.• Finally any assessment of economic growth and subsequent development plan requires substanti al reliable database. The enti re North East region is lagging behind in this respect and Meghalaya is no excepti on. Serious eff ort at par with the other states is needed to address this problem of data gap. The involvement of competent external agencies to formulate methodology and operati onal plan in this respect should be considered by the State Government.• Economic growth of the state will be conti ngent to it undertaking a reform programme which helps it to att ract entrepreneurs both from within and outside to make investments. This reform programme in the State could follow the export model of growth, which has been successfully implemented in small countries with limited domesti c market base.
121

MEGHALAYA STATE DEVELOPMENT REPORTMEGHALAYA STATE DEVELOPMENT REPORT
5.8. Conclusion In the economic scenario of the state it has been observed that both GSDP and NSDP have grown at a reasonable rate during the preceding ten year period of commencement of the Tenth Five Year Plan. However, the high rate of growth of populati on has somewhat undermined the rate of growth of per capita GSDP and NSDP.All three sectors of the economy maintained a growth rate above 6 %. This has strengthened the objecti ve basis of att aining various sectoral targets as envisaged in the Tenth Plan. Although, in spite of growth in diff erent the sectors of economy, there has been no change in the overall structure of the economy. The change in the occupati onal patt ern cannot be portrayed in detail due to the incomplete database in the workforce tables of the Census 2001.
There has been a percepti ble change in the patt ern in employment within the agricultural sector with decreasing proporti on of culti vators and increasing proporti on of agricultural labourers. There has been a substanti al fall in percentage share of agricultural workers (culti vators and agricultural labourers taken together), no signifi cant change in the proporti on of main workers in the secondary sectors and rise in employment in terti ary sector.
The growth of employment in the terti ary sector is expected to have been responsible for the expansion of informal sector.
There has been no defi nite database on poverty in Meghalaya and the poverty analysis of the State is based mainly on the apporti oned fi gures of the state of Assam at the nati onal level. However, the available esti mates point out high incidence of poverty in the rural areas of the state. Somewhat ineff ecti ve delivery system has led to the high incidence of poverty in rural areas in spite of substanti al increase in the investment in rural sector.
In spite of growth in urban organized sector the unemployment among the educated youth has registered a rising trend. The growth of employment opportuniti es in the state, it seems, did not maintain pace with the growth of white – collared labour force.
The state is defi cient in technically skilled labour force at present. Development of local entrepreneurship and evoluti on of self – employment opportuniti es conti nue to stagnate. Diversifi ed skill development among the working populati on at the grass root level is almost non- existent.
122

MEGHALAYA STATE DEVELOPMENT REPORTMEGHALAYA STATE DEVELOPMENT REPORT
5.9. AnnexureEsti mates of GSDP at Factor Cost
YEAR GSDP AT CURRRENT PRICES (Rupees in Crore)
GSDP AT CONSTANT (1999-2000) PRICES (Rupees in Crore)
1999-2000 3578.14 3578.142000-01 3960.94 3773.37 (5.46)2001-02 4478.26 4033.15 (6.88)2002-03 4763.42 4185.52 (3.78)2003-04 5279.99 4469.66 (6.79)2004-05 5805.50 4788.22 (7.13)2005-06 6318.85 5078.93 (6.07)
2006-07 (Q) 6959.29 5349.81 (5.33)2007-08 (Adv) 7605.28 5628.25 (5.20)
123


MEGHALAYA STATE DEVELOPMENT REPORTMEGHALAYA STATE DEVELOPMENT REPORT
CHAPTER - VI
STATE OF INFRASTRUCTURE IN MEGHALAYA
6.1 Introducti on1
The term infrastructure is of recent origin and does not have a rigid defi niti on of its own. Ever since its use in development economics in early 1950s, its scope has got expanded. It has been used interchangeably with ‘Social Overhead Capital’ (SOC) like educati on and health, Public uti liti es, ports, water supplies, electricity, transport, schools, hospitals including equipments, irrigati on modern machines and other capital assets required for promoti ng economic development are all getti ng tagged as infrastructure. Hirschman, who has given a very wide meaning to Social Overhead Capital or “Infrastructure”, includes, educati on, public health, law and order, transportati on, communicati ons, power, water supply, irrigati on and drainage. In the Sixti es, a number of studies brought out the importance of infrastructure in promoti ng agricultural growth. Recently, World Development Report of the World Bank, 1994, has explicitly defi ned economic infrastructure to consist of the following provisions:
(a) Public Uti liti es: Power, telecommunicati ons, piped water supply, sanitati on and sewerage, solid waste collecti on and disposal, piped gas (b) Public works: Roads, major dams, canal works for irrigati on and drainage(c) Other transport Sector: Urban and inter-urban roadways, urban transport, ports and waterways and airports.
The Tenth Plan document of India defi nes infrastructure as “physical framework of faciliti es through which goods and services are provided to the public. Its linkages to the economy are multi ple and complex, because it aff ects producti on and consumpti on directly, creates positi ve and negati ve spillover eff ects and involve large infl ow of expenditure. ……. Infrastructure also determines the eff ect of growth on poverty reducti on”.
From the forgoing discussion, it can be deduced that in a broad sense, infrastructure consists of all types of physical and social capitals (i) that are basic to economic acti vity (ii) generate external economies, (iii) lumpy in nature and provided ahead of demand or in response to excess of DPA (directly producti ve acti viti es), (iv) does not, by and large, vary with the magnitude of producti on unless the scale of producti on changes or the technology of producti on is altered.
Infrastructure can be broadly divided into two types: physical and social. The former consists of transport (roads, railways, aviati on, waterways and ports), electricity, irrigati on, telecommunicati on, housing and water supply.
1 Meghalaya Human Development Report – 2008, Dr. Shreeranjan, ed Govt. of Meghalaya
125

MEGHALAYA STATE DEVELOPMENT REPORTMEGHALAYA STATE DEVELOPMENT REPORT
The canvass being wide ranging, the chapter will largely cover those aspects not highlighted specifi cally in other chapters. A detailed treatment of this aspect is also provided in the Meghalaya Human Development Report, 2008.
6.2 Infrastructural faciliti es in Northeastern States and in Meghalaya
The people in the region envision having state-of-the-art infrastructure not only to enhance the quality of life but also to dictate the pace of economic acti vity, and the nature and quality of economic growth. The Vision NER 2020 document of the North Eastern Council had identi fi ed fi ve basic defi cits confronti ng the North Eastern Region viz. (i) a basic needs defi cit; (ii) an infrastructure defi cit; (iii) a resource defi cit; (iv) a two way defi cit of understanding with the rest of the country and (v) a governance defi cit. The infrastructure defi cit is a major defi cit in the region, and accelerati on in economic growth and the region’s emergence as a powerhouse depend on how fast this defi cit is overcome. The lack of connecti vity has virtually segregated and isolated the region not only from the rest of the country and the world, but also within itself. Poor density of road and rail transportati on within the region has not only hampered mobility but also hindered the development of markets. The traditi onal transportati on routes through land and inland waterways are virtually non-functi onal and inacti ve, more so aft er Parti ti on. The region is also poorly linked by air, and sea routes which have been blocked. Air inter-connecti vity between diff erent states in the region is extremely poor having enormous costs.
Provision of world-class infrastructure and connecti vity would require a signifi cant increase in public investment. In the initi al years, it is necessary also to expand the social infrastructure, parti cularly educati on including vocati onal educati on and skill development. Given the low level of entrepreneurial acti vity in the region, the government also has to take a proacti ve role and make investments in promoti onal areas as well. Thus, both Central and State Governments in the region will have to make large investments to overcome the infrastructural defi cit, parti cularly in the initi al years, though in course of ti me, it should be possible to involve the private sector in this task through Public-Private Partnerships (PPPs). In order to enable this, it is necessary to create a proper framework for PPPs in infrastructure investments. Budgetary support for public investment too needs to be augmented to provide the required volume of viability gap funding.
The strategy for infrastructure development in the Eleventh Plan refl ects the dominant role of the state in building infrastructure, also recognising that the resources required to meet the defi cit in infrastructure exceed the capacity of the state , need for more focused central Govt. investment and to att ract and acti vate private investment through appropriate policies and forms of public private partnerships are more acute. The relati ve role of the public and private sectors is bound to be varied such as irrigati on and water resources management, constructi on of rural roads, as well as in certain economically or situati onally disadvantaged places, the bulk of the investment in infrastructure would have to come from the public sector. In building infrastructure for the future, it is also necessary to develop capacity that comes up to world-class performance
126

MEGHALAYA STATE DEVELOPMENT REPORTMEGHALAYA STATE DEVELOPMENT REPORT
standards. Both the Centre and the States must keep their policies under close review to ensure that new infrastructure, whether built by the public sector or the private sector comes up to these standards. The infrastructure defi cit for the NER is indicated below:
6.3. Comparati ve Status of Meghalaya’s Infrastructure:
The biggest constraints on accelerated and inclusive growth is poor infrastructure aff ecti ng road connecti vity, rail connecti vity, air connecti vity, cyber and telecom connecti vity, power and inland waterways. The State’s att empts for Public Private Partnership (PPP) mode for creati on of infrastructure are limited to only a few sectors and locati ons. Therefore, the support for infrastructure development programmes for North Eastern Region should conti nue to be supported from resources by the Government of India for some more years to come. This can come as Special Packages; Special Plan Assistance and Additi onal Central Assistance.
127
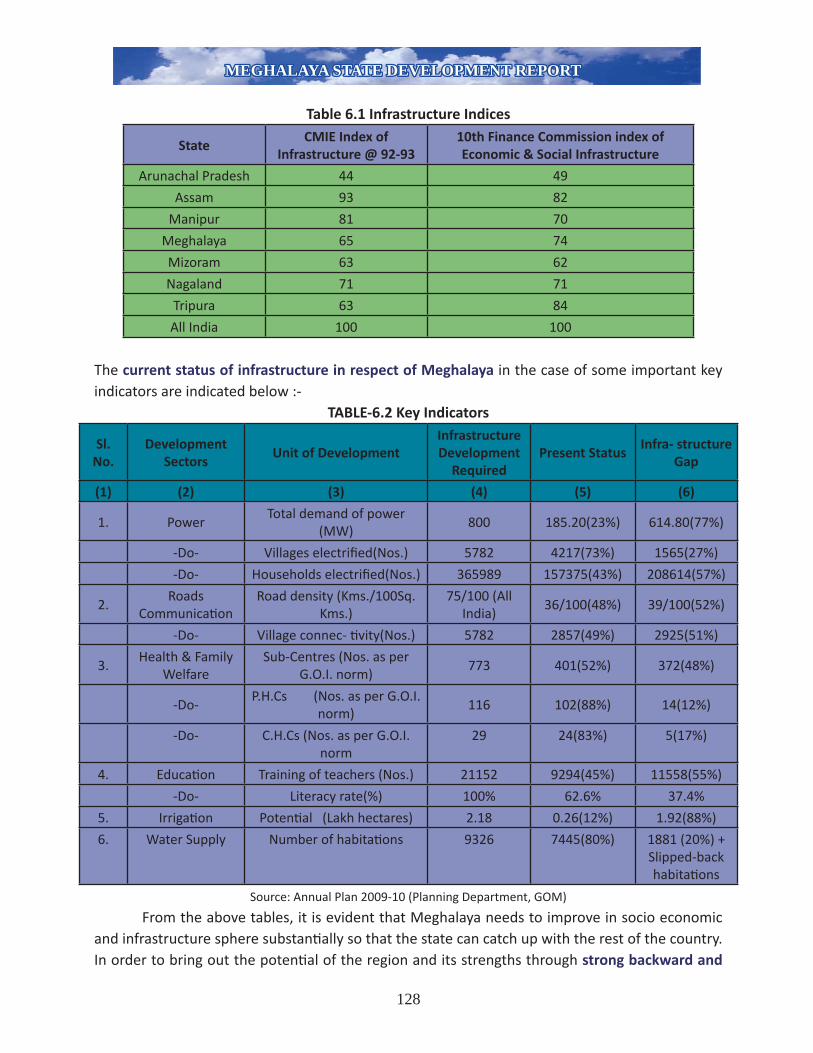
MEGHALAYA STATE DEVELOPMENT REPORTMEGHALAYA STATE DEVELOPMENT REPORT
Table 6.1 Infrastructure Indices
StateCMIE Index of
Infrastructure @ 92-9310th Finance Commission index of Economic & Social Infrastructure
Arunachal Pradesh 44 49
Assam 93 82
Manipur 81 70
Meghalaya 65 74
Mizoram 63 62
Nagaland 71 71
Tripura 63 84
All India 100 100
The current status of infrastructure in respect of Meghalaya in the case of some important key indicators are indicated below :-
TABLE-6.2 Key Indicators
Sl.No.
Development Sectors
Unit of DevelopmentInfrastructure Development
RequiredPresent Status
Infra- structure Gap
(1) (2) (3) (4) (5) (6)
1. PowerTotal demand of power
(MW)800 185.20(23%) 614.80(77%)
-Do- Villages electrifi ed(Nos.) 5782 4217(73%) 1565(27%)
-Do- Households electrifi ed(Nos.) 365989 157375(43%) 208614(57%)
2.Roads
Communicati onRoad density (Kms./100Sq.
Kms.)75/100 (All
India)36/100(48%) 39/100(52%)
-Do- Village connec- ti vity(Nos.) 5782 2857(49%) 2925(51%)
3.Health & Family
WelfareSub-Centres (Nos. as per
G.O.I. norm)773 401(52%) 372(48%)
-Do-P.H.Cs (Nos. as per G.O.I.
norm)116 102(88%) 14(12%)
-Do- C.H.Cs (Nos. as per G.O.I. norm
29 24(83%) 5(17%)
4. Educati on Training of teachers (Nos.) 21152 9294(45%) 11558(55%)
-Do- Literacy rate(%) 100% 62.6% 37.4%
5. Irrigati on Potenti al (Lakh hectares) 2.18 0.26(12%) 1.92(88%)
6. Water Supply Number of habitati ons 9326 7445(80%) 1881 (20%) + Slipped-back habitati ons
Source: Annual Plan 2009-10 (Planning Department, GOM)
From the above tables, it is evident that Meghalaya needs to improve in socio economic and infrastructure sphere substanti ally so that the state can catch up with the rest of the country. In order to bring out the potenti al of the region and its strengths through strong backward and
128

MEGHALAYA STATE DEVELOPMENT REPORTMEGHALAYA STATE DEVELOPMENT REPORT
forward linkages in farm and non-farm sectors calls for a concerted and meaningful acti on plan across socio-economic spheres. However, a major obstacle in the provision of these essenti al infrastructures is the lack of resources to fi nance these developmental programmes.
6.4 A brief write up on the important aspects of infrastructure is as below:-
6.4.1. Power: Power is a prime mover of economic development. The availability of cheap, abundant and regular power supply is an essenti al conditi on for development and also one of the important determinants of the quality of life. There is a direct relati onship between the growth of consumpti on of power and that of the economy. The state of Meghalaya has vast potenti al in generati on of hydel power. In fact the generati on of hydel power started in the early part of 20th century in the state. The installed capacity of power generati on remained stagnant since the eighti es. In terms of accessibility of power, about 40 per cent of the villages have not been electrifi ed as on 31-03-2008. This situati on has only slightly improved in the last twenty fi ve years.
Box 6.2: Power Demand Positi on in MeghalayaPRESENT UNRESTRICTED DEMAND 610 MWINDUSTRIES:
RELEASED LOAD 260 MW PENDING LOAD 220 MW
DOMESTIC: 130 MWDEMAND FORECAST END OF 11TH PLAN(2012) 796 MWEND OF 12TH PLAN(2017) 1281MW
Source: Government of Meghalaya, Power Department
The investi gated/ assessed potenti al for hydro power in Meghalaya is 3000 MW. The installed capacity in the State is 185.20 MW of Hydel Power. The requirement of power now stands at 610 MW and is likely to go up to about 800 MW by the end of 11th Plan and 1300 MW by the end of 12th plan. It is therefore imperati ve that the generati ng capacity in the State should be enhanced. At present the State share of Central Sector Generati on is 130 MW approximately. The peak power availability to the State including its generati on is only 240 MW during the monsoon and 200 MW during the rest of the year. More power has to be purchased through bilateral arrangements which is costly. The State Government is exploring the possibility of enhancing the power generati on by about 2000-2500 MW, of which 700-980 MW is thermal based while 1400-1520 MW will be hydro electricity. To this end, the State has a Power Policy in place which will enable the Government implement these projects under PPP mode subject to decisions in respect to investment by the State Government.
6.4.2 GENERATION: At present Myntdu Leshka Stage I HEP (2 x 42 + 1 x 42 MW) completi on is paramount for the state. The revised completi on cost of the Project is Rs 671.29 Crores, as per the 2006 price level.
129

MEGHALAYA STATE DEVELOPMENT REPORTMEGHALAYA STATE DEVELOPMENT REPORT
The cumulati ve expenditure as on 30th September, 2008 is Rs 508.37 Crores. During 2009-10, units I & II are expected to be commissioned; and with the coming up of Unit-III which is also expected to be completed by June, 2010. The new Umtru Hydel Power project with the capacity of 2x20 MW in Ri-Bhoi District is under implementati on requiring about Rs.240 crores and would be completed within the period of 30 months. The fi nancial support of the Government of India has also been sought and agreed to for equity etc during the 11th Plan. The Hydro Electric project at Ganol (2x12.5 MW) is also an approved project requiring about Rs.150 crores and is likely to be completed by 2011.
There is substanti al hydro-electric potenti al and the State Government proposes to take up 16 projects with total outlay of Rs. 64 crores for investi gati on and preparati on of DPR in the 11th Plan period. Some of the important ones are: 1) Umngot Stage-I HEP, 260 MW; 2) Myntdu Leshka Stage-II HEP, 60 MW; 3) Umiam Umtru Stage-V HEP, 30 MW; 4)Umngi Stage-I HEP (Storage), 54 MW;5). Umngi (Nongkohlait) Stage-III HEP, 120 MW; 6) Selim HEP (Storage), 120 MW; 7) Mawblei HEP, 140 MW. The State Government is seeking the assistance of DONER/ NEC in funding the investi gati ons. The new generati on projects proposed to be taken up during the 11th Plan include (i) Umngot Stage-I HEP, 260 MW; (ii) Myntdu Leshka Stage-II HEP, 60 MW; (iii) Umiam Umtru Stage-V HEP, 30 MW; (iv) Upper Khri HEP, 25 MW
ONGOING HEP:
Name of the project MW StatusMYNTDU LESHKA Stage-I HEP
84 M/c spinning expected by Dec2008 & actual generati on by Feb 2009
NEW UMTRU HEP 40 Civil and Hydro-mechanical works in progress. LOA for E/M package will be issued shortly. Target date of completi on is 2010-11.
SONAPANI MINI HEP 1.5 Target date of completi on is Oct 2008
LAKHROH MINI HEP 1.5 Target date of completi on is Dec 2010
GANOL HEP 22.5 Preliminary Civil works started. The Project is under tendering stage. Target date of completi on is 2010-11.
TOTAL 149.5
130

MEGHALAYA STATE DEVELOPMENT REPORTMEGHALAYA STATE DEVELOPMENT REPORT
Source: Power Department, GOM Presentati on
Source: Power Department, GOM Presentati on
The State Government also propose to implement some of these projects during the period of 11th Plan either through Private Sector Investment(IPP) or through the PPP Approach to ensure that these projects are implemented in the shortest possible ti me. This will add about 400 MW from these projects during the 11th Plan period at a total cost of about Rs.2400 crores, which is
1
Sl.No.
Name of the projects MW Status
1 Umngot Stage-I HEP 270 DPR will be completed by Dec., 2008.
2 Myntdu Leshka Stage-II HEP 280 S & I works is in the advanced stage.
3 Umngi Storage Stage – I HEP 54 S & I works is in the advanced stage.
4 Riangdo HEP 3 S & I works is in the advanced stage.
5 Selim (Myntdu Leshka Upper STAGE) HEP 170
S & I is in progress.6 Mawblei (Wahblei) HEP 140
7 Umngi stage - III (Nongkohlait) HEP 120
HYDRO ELECTRIC PROJECTS
17
Sl.No.
Name of the projects MW Status
8 Amkshar MHP Stage I 5
S & I is in progress.
9 Sanglet MHP 210 Simsang HEP 13511 Kynshi HEP 90012 Suchen HEP 50
Identified
13 Umkhen Stage – I 2014 Umngi Stage - V (Mawpat) HEP 8515 Umngot Stage - II 6016 Umlaphang HEP 5017 Upper Khri 2518 Umngi Stage - IV (Nongram) HEP 50
Total 2484 MW
HEP Contd….
131

MEGHALAYA STATE DEVELOPMENT REPORTMEGHALAYA STATE DEVELOPMENT REPORT
proposed to be met mostly by the private sector. The State Government has its power policy in order to ensure that the projects can be implemented under the PPP mode. Another project which the State Government is interested is the 720 MW coal based thermal power project in Nangalbibra in Garo Hills. It is proposed to set up the thermal power plant either by a Central Public Sector Unit or through the PPP model as per decisions.
Name of the projects MW Status
Nangalbibra area (Garo Hills) 3 projects
980
To be implemented by CPSUs, JVC, IPP.Langrin TPP (West Khasi Hills)
240
Total 1220 MW 6.4.3 Transmission The transmission system in the State also requires to be strengthened. Meghalaya could not draw its central sector power share from the N.E.R. grid due to transmission constraints. Presently state share from N.E.R. is 155.375 MW and from E.R. grid 21.076 MW. Additi onal Central power allocati on for Meghalaya by 2012 is esti mated at 656.1 MW. Therefore, 220 KV and 400 KV transmission projects are being proposed to strengthen the interstate network for future drawal of state share and trading of power.
Source: Power Department, GOM Presentati on
25
INTERSTATE NETWORK
Name of the SchemeCapacity
(MW)
EstimatedCost
(Rs. In Crore)
Remarks
132 KV D/C Agia – NangalbibraLine (110 Km) 80 43.32
Funded by NEC.Completion by 2010
220 KV D/C line from Misa (Assam) to Byrnihat (Meghalaya)(115Kms) along with 220/132 KV, 2 x 160 MVA Sub-station at Byrnihat
240 150.00Funded by DONER and ACA.Completion by 2010.
Construction of 400 KV D/C LILO of 400KV Pallatana - Bongaigaon line at Byrnihat.
243 150.00
400KV Palatana –Bongaigoan Line will connect with Thermal power stnsat both ends.Installation of 2 x 135 MVA, 400/220
KV transformer at Byrnihat Sub-station.
Total 343.32
132

MEGHALAYA STATE DEVELOPMENT REPORTMEGHALAYA STATE DEVELOPMENT REPORT
Source: Power Department, GOM Presentati on
Three ongoing transmission lines will require Rs.6.36 crores during the XIth plan. Twelve new transmission schemes are proposed to be taken up during the 11th Plan at a cost of Rs.476.15 crores during the 11th Plan.
Power Evacuati on (New initi ati ve)
Sl.No.
Name of schemeEsti mated
Cost (Rs. in Crore)
Remarks
1220 KV D/C line from Umngi Stage I to the 400/220 KV switching stati on at Mawngap. (36 Km)
42.00
Preliminary survey
initi ated
2132 KV S/C line from Umngi Stage-II (Rongmaw) HEP (65MW) to Umngi Stage-I HEP (20 Km)
8.00
3132 KV D/C line from Umngi Stage-III (Nongkohlait)HEP to Umngi Stage-I HEP (34 Km)
17.00
4 132 KV D/C from Umngi Stage IV to Umngi Stage I (58 Km). 26.10
5132 KV D/C line from Umngi Stage V to Umngi Stage I PS (78 Km)
35.10
6 132 KV D/C from Suchen HEP to Selim HEP 8.507 220 KV D/C line from MLHEP II to Amlarem.(15Kms) 12.00
8220 KV D/C line from Mawblei HEP to Nongstoin Sub-Stati on (60 Km)
48.00
Source: Power Deptt presentati on , August 2008.
26
Sl.No.
Name of schemeEstimated
Cost(Rs. In Crore)
Remarks
1132 KV D/C line from MyntduLeshka Stage I HEP to the 132 /33 KV Sub-station at Khliehriat(24 Km)
10.00Expected to be completed by Dec 2008.
2132 KV S/C line from New Umtrew HEP to Old Umtrewand to EPIP II (2 Km)
5.58 Expected to be completed by 2010.
3.132 KV S/C line from GanolHEP to Rongkhon Sub-station.(5 Km)
1.75 Expected to be completed by 2010.
POWER EVACUATION FROM PROPOSED HEP
(Ongoing)
133

MEGHALAYA STATE DEVELOPMENT REPORTMEGHALAYA STATE DEVELOPMENT REPORT
Proposed Strengthening of Intra- State Transmission Network:
Sl. No.
Name of the SchemeEsti mated Cost (Rs. In Crore)
1132 KV D/C from Umiam Stage-I Power Stati on to Mawngap Sub-stati on, along with the constructi on of the 132/33 KV, 2 x 20 MVA sub-stati on at Mawngap.(29.5 Km)( ongoing)
22.44
2220 KV line from Byrnihat Sub-stati on to Mawngap along with 220/132 KV S/S.(170 CKm)
196.00
3220 KV D/C from New Shillong/ Mawngap Sub-stati on to Khliehriat Sub-stati on along with associated bay and installati on of 220 KV, 2 x 100 MVA transformer and associated bay at Khliehriat S/S.(160 Km)
178.00
4132 KV S/C line from Nangalbibra S/S to Rongkhon S/S along with associated bays at Rongkhon S/S.(160 Km)
128.00
5132 D/C line from Rongkhon to Ampati along with 1 x 50 MVA, 132/33 KV S/S at Ampati .(80 Km)
44.00
6.132 KV D/C LILO on NEHU-Khliehriat line at Khliehtyrshi along with 1 x 50 MVA, 132/33 KV S/S at Khliehtyrshi.(20 Km)
17.00
7 Augmentati on of Cherra S/S from 12.5 to 50 MVA. 2.00
8132 KV D/C LILO on132 KV Umiam- Umtru HEP Stage III – Umtru PH D/C line at Nongpoh along with1 x 50 MVA S/S at Nongpoh.(20 Km)
17.00
9 Augmentati on of Nangalbibra S/S from 12.5 to 50 MVA. 2.0010 Augmentati on of Rongkhon S/S from 35 MVA to 70 MVA. 3.50
11132 KV D/C line from Ampati to Chokpot along with 50 MVA S/S at Chokpot.(80 Km)
44.00
12 2 nos. 132 KV D/C line from EPIP I & II to Killing S/S 10.8013 132 KV D/C Cherra-Ishamati with associated S/S 33.0514 400 KV D/C Killing to Nangalbibra 300.0015 LILO of Mawlai-Cherra-Nongstoin at Mawngap 15.00 Total 1012.79
Summary of Proposed G& T Projects
MW/Ckm Cost (Rs. In Crore)
Capacity Additi onHydro 2663.5 MW 15981.00
Thermal 1220 MW 4880.00
Transmission Lines(KV)400 570 CKM
2393.18220 781 CKM132 860 CKM
TOTAL 23254.18
134

MEGHALAYA STATE DEVELOPMENT REPORTMEGHALAYA STATE DEVELOPMENT REPORT
Distributi on Schemes: Sancti oned APDRP Schemes (Rs in Crores)
Sl. No
SchemesSancti oned Released
Financial Uti lisati on
Date Revised Date Amount Amount1 Shillong Circle 27-11-02 15.70
28.01.0323.10.0314.02.0531.03.0511.12.0628.09.07
6.5714.5624.34
12.90532.0746.49
16.142. Tura Circle 27-11-02 6.77 6.693. Jowai Circle 27-11-02 2.52 2.354. Western Circle (Byrnihat) 6.06.03 15.97 5.215. Central Circle 1-10-04 59.53 37.436. Garo Hills Circle 1-10-04 36.21 21.297. SCADA (Shillong) 1-10-04 21.12 5.868. SCADA (Byrnihat) 1-10-04 17.99 4.999. Jainti a Hills Circle 4-04-05 51.62 23.02
Total 227.44 136.93 132.98
Existi ng APDRP Scheme Physical Status(%)
Parameters Shillong Tura Jowai WC CCGaroHills
Jainti aSCADA
Metering Package-A 100 100 100 100 65 60 70
6033/11 KV S/S Package-B 100 100 100 100 95 70 6033 & 11 KV Lines Package-C 100 100 100 100 95 85 75DT Package-D 100 100 100 100 95 90 60
Proposed Phase-II APDRP Distributi on Schemes (Rs. in Lakhs):
Parameters ShillongGaro Hills
Jainti a Hills
WC CC TotalEsti mated
Cost33/11 KV S/S Package(MVA)
50 54 20 31 15 170 MVA 3342.00
Lines Package 33 KV 11KV(Km)
81 707 128 110 155 1181 KMS20728.00
60 260.5 87 164.3 645 1216 KMS
DT Package(KVA)
1138 2276 3083 1138 2768 10403 KVA 1917.00
Metering Package 2000 20000 18000 15000 17000 72000 Nos 1604.00Scada - 1400 700 - 700 - 2800.00Grand Total 30391.00
135

MEGHALAYA STATE DEVELOPMENT REPORTMEGHALAYA STATE DEVELOPMENT REPORT
Constructi on of the 220 kV D/C Transmission line between Misa (Assam) – Byrnihat (Meghalaya) is one of the most vital transmission project for Meghalaya State is set to be completed by March 2010. LOA was awarded to PGCIL on 17th December 2007 aft er signing the contract Agreement with PGCIL on 20th Sept 2007 which is scheduled to be completed by 30 (thirty ) months from the eff ecti ve date, which falls on March 2010. The work is in full progress. Constructi on of 132 kV 3 circuits on 4 circuit tower from Killing (Byrnihat) 220/132 KV Sub-stati on to EPIP I & 132 kV D/C Line from Killing Sub – stati on to EPIP II is also necessary to take up the constructi on as a conti nuati on of the Misa – Byrnihat project due to the fact that Meghalaya has its transmission net work at 132 KV and this line will interconnect the 220/132 KV Sub-Stati on to the existi ng system at 132 KV EPIP Sub-Stati ons. The lines are expected to transmit 320 MVA of power from the 220KV system to the 132KV system of MeSEB. In the event of surplus power, this line can also be uti lized for evacuati on of power generated in the state to other states.To meet the requirement of power of the State, it has to be purchased from the Central Power Sector uti liti es and other agencies outside the State. The PGCIL levies wheeling charge at 35 paise per unit. This is more than double the charge levied by PGCIL in other regions of the country which varies from 12 – 15 paisa per unit. This needs immediate remedy.
Other aspects: • Renovati on & Modernizati on Schemes of Umiam Stage-II Power Stati on(EAP):- To tap the
benefi ts from the old existi ng machines of Hydro Plants which have outlived their life span, an amount of Rs 49.81 Crores is proposed for taking up the R & M works of the Umiam Stage II (2 x 9 MW) under EAP during 2009-2010. The Project is proposed for renovati on and upgradati on by 2 MW and is targeted to be completed by the year 2010-11.
• Control of Siltati on & Polluti on of Umiam Reservoir: The Umiam Reservoir at Barapani has been built in the year 1965 with a projected lifespan of 400 years and the gross storage capacity of 1,47,000 Acre ft . The pace of developmental acti viti es in the catchment area of the upstream of the reservoir has led to considerable silt-load in the reservoir over the years. The study conducted by WAPCOS in 1990 had revealed that the sediment producti on in the catchment of the Umiam Reservoir is 8.65 Lakh Tonnes (approx.) annually and out of this, about 8.09 Lakh Tonnes annually gets deposited in the Umiam Lake. The dead storage capacity has already been silted up. This is a cause of great concern since the life of the Project, earlier esti mated at 400 years will be reduced to about 65 years only if the present rate of siltati on is not checked. Of the 65 years projected, 40 years have already elapsed. The proposal for ‘Catchment Area Treatment of Umiam Lake’, as a long-term measure, was proposed to NEC at a total esti mated cost of Rs.2861.26 lakhs. Power Department is to comply to the queries during EFC meeti ng and pursue the matt er.
• The progress of the state in pumpsets energisati on, another programme of rural electrifi cati on is also very tardy. As in May 2001 the total number of pumpsets energized was 100, which is only 0.7 per cent of its potenti al. This also partly explains the very low consumpti on of electricity by agriculture, which is around 1 Kwh as against an all India average of 89 Kwh.
136

MEGHALAYA STATE DEVELOPMENT REPORTMEGHALAYA STATE DEVELOPMENT REPORT
From 1986 to 1998 the sale of electricity to agriculture and irrigati on in Meghalaya increased marginally from 0.05 Kwh to 1.42 Kwh. The same conditi on prevails in the other states in the region where per capita consumpti on of electricity by agriculture is between 1 and 3 kwh, except for Tripura where it is 13 kwh. There has also not been much development in the setti ng up of infrastructure faciliti es for tapping of non-conventi onal energy sources in the region. Of the total installed capacity of 1656.2 Megawatt (State of the Indian Farmers, 2004) of non-conventi onal energy power projects in India, the share of the northeastern states, including Sikkim, at 33.8 Megawatt is only 2 per cent of the country’s total installed capacity. Of the 33.8 Megawatt , the share of Meghalaya is 4.4 per cent only.
• Corporati sati on of MESEB: It appears that corporati sati on of MeSEB has become unavoidable to be in line with the latest Nati onal Policy for which a number of States have already taken necessary steps. The PFC as the Consultants of MeSEB has made a number of suggesti ons, most important among them appears to be the Financial, Restructuring Plan (RNP). As on 31.03.2006, the MeSEB had a total capital liabiliti es of Rs. 1001.77 crore only which includes Rs. 630.91 crore towards the State Government, Rs. 150.18 crore towards REC, Rs. 74.70 crore towards Banks, Rs. 67.71 crore towards JBIC, Rs. 52.00 crore towards Bonds and Rs. 26.27 crore towards CSS. The suggesti on of the PFC is to provide capital support to the new Corporate Body during the 11th Plan period to the extent of Rs. 1900.00 crore of which Rs. 1710.00 crore would be grant and Rs. 190.00 crore would be loan. A Committ ee headed by Additi onal Chief Secretary is examining the matt er. The Committ ee felt that the above projecti on be realisti cally re-casted downwards. The State Government will have to consider ways and means to manage the issue where reevaluati on of books including assets may be explored. As per observati ons of the Chairman Meghalaya State Electricity Regulatory Commission on the 25th July, 2008, “The reform agenda set out in the Electricity Act, 2003 has moved forward only very fi tf ully. The most important insti tuti onal reforms that the Act mandates are yet to be implemented. The MeSEB remains in limbo. Its fi nancial health is alarming and the conti nuing uncertainty is sapping the initi ati ve of its personnel. The reform must not be delayed any further.
• The N.E.C’s First Sectoral Summit on Power Sector has suggested a two pronged strategy to be adopted for power generati on with focus on: [a] Small/Localised Hydel & Thermal and NRE projects for catering to local needs, [b] High capacity Hydel & Thermal Power Projects with associated Transmission lines for fi rst meeti ng the demand for power of the NER and thereaft er that of the rest of the country. This would also provide an ideal thermal - hydro mix at 60 : 40 rati o which will provide bett er stability and security in the power system of Meghalaya throughout the year.
• The Meghalaya Power Policy which was approved on the 9th August,2007 and amended on the 3rd December, 2007 ( noti fi ed on 10th December, 2007) is committ ed to meet the shortf all. 10 (ten) Power projects with a total capacity of 558.5 MW are expected to be commissioned during the 11th Plan. The required investment cost would be around Rs. 3909.50 crore [558.5 MW X Rs. 7.00 crore per MW]. 14 (fourteen) Power projects with a total capacity of 891.0 MW
137

MEGHALAYA STATE DEVELOPMENT REPORTMEGHALAYA STATE DEVELOPMENT REPORT
are expected to be commissioned during the 12th Plan. The required investment cost would be around Rs. 6237.00 crore [891.0 MW X Rs. 7.00 crore per MW]. Besides some identi fi ed projects are also possible under the IPP route. some power projects have been under process of approval / modifi ed MOA, etc under hydro / thermal by IPP route / PPP route.
• Some of the observati ons & suggesti ons of the Chairman Meghalaya State Electricity Regulatory Commission made on the 25th July, 2008, menti ons as below: –
o On the generati on front, thermal capacity is a crying need. Private ownership over mineral assets and its implicati on for establishing a coal linkage may require eff ecti ve consultati on at the grass root level so as to foster community involvement. The best way is to establish a generati on company in the public sector which will take over the generati on assets of the MeSEB when unbundling takes place.
o It should be possible to design a package which incenti ves mine owners to graduate to power generati on adding value to their coal.
o On the hydro-electric front investi gati ons have been done, sites have been identi fi ed but executi on has not progressed at all. The fastest way forward would be to allot unassigned projects to the State’s power generati on company.
o The power potenti al of the State is esti mated at 3000 MW of hydro-electricity capacity. Besides this Coal reserves of the order of 564 million tonnes is available. It is instructi ve to realize that a 500 MW coal fi red thermal unit consuming 1.5 million tonnes of coal per annum produces about 3500 million Kvh (units) of electricity – more than double the current consumpti on.
o The State must overcome the transmission bott leneck. The Misa-Byrnihat line currently under constructi on which is likely to relieve the situati on. Suggested that a formal reporti ng mechanism be set up which keeps the cabinet informed on a fortnightly basis about the progress made. Heading the monitoring cell and reporti ng to the cabinet should be a senior Principal Secretary.
• An important indicator of availability of power is the per capita consumpti on of power. The per capita consumpti on of power of the northeastern states is among the lowest in the country. Among the northeastern states, Meghalaya consumed power the most (318 KwH), this fi gure is however sti ll less than half compared to the all India average (373 KwH). Table 6.3 gives the per capita power consumpti on in the states along with the changes in power consumpti on in the region.
• In order to capture the development of power infrastructure in the states we also look at the percentage of villages electrifi ed. In the 1980s almost all the states had a very low percentage of villages electrifi ed (Table 6.10). However, in the last two decades, states like Nagaland, Manipur and Tripura have been able to provide electricity to more than 90 per cent of their
138

MEGHALAYA STATE DEVELOPMENT REPORTMEGHALAYA STATE DEVELOPMENT REPORT
villages. In case of Meghalaya, not much progress seems to have been made in this area as half of the total number of villages in the state do not have access to electricity.
Table 6.3: Per capita consumpti on of Electricity (in KwH)
States 1974-75 1981-82 1989-90 2004-05Arunachal Pradesh 3.4 7.9 56.6 85.56Assam 24.0 33.5 92.7 105.5*Manipur 7.7 7.9 79.5 71.58Meghalaya 31.3 31.0 106.4 317.77Mizoram 4.3 5.6 65.0 141.44Nagaland 27.2 34.2 58.6 84.7**Tripura 6.0 14.5 45.0 95.5**All India 174.9 120.5 236.0 373*
Note: * 2002-03, ** 1999-00Source: 10th Plan document (2002-2007) and “Where Do We Stand in 2006” published by the Directorate of Economics and Stati sti cs, Government of Meghalaya, Shillong.
6.4.4 100 % Villages & Household Electrifi cati on by 2012: It is important to note that in many of the states that have achieved very high percentage of village electrifi cati on; a vast majority of the households do not have access to electricity. In Meghalaya while the number of villages that have been electrifi ed has increased from 19 per cent in 1981 to 45 per cent in 2001, yet we fi nd that as many as 70 per cent of the rural households do not have access to electricity. This is due to the fact that a village is declared as electrifi ed if power reaches the village even though only a few of the houses may have connecti on.
Table 6.4: Villages electrifi ed in Northeast India
State Percentage of villages electrifi ed Percentage of rural households having
electricity (2001)1981 1991 2001
Arunachal Pradesh 9.9 - 60.45 44.53Assam 20.4 53.18 77.05 16.54Manipur 16.5 57.38 91.70 52.53Meghalaya 13.5 30.98 44.93 30.26Mizoram 11.8 - 99.00 44.14Nagaland 36 92.68 99.67 56.88Tripura 17 72.05 95.09 31.75All India 44.6 69.52 73.39 43.52
Source: Basics Stati sti cs of Northeastern Region, 1982, 2002
139

MEGHALAYA STATE DEVELOPMENT REPORTMEGHALAYA STATE DEVELOPMENT REPORT
Table 6.5: Percentage of villages electrifi ed in District of Meghalaya
Districts 1981 1991 2001East Khasi Hills 20.0 60.8 74.13
West Khasi Hills 4.2 21.7 35.28
East Garo Hills 7.2 18.0 33.22
West Garo Hills 1.7 18.3 36.49Ri Bhoi 18.7 53.00 66.11South Garo Hills 0.2 9.6 19.66Jainti a Hills 17.1 58.9 62.31Meghalaya 8.1 30.9 44.93
Sources: Column 2 and 3: District Census Handbook, 1981 and 1991;Column 4: Census of India, 2001
At the districts we fi nd that there is wide variati on in the percentage of villages electrifi ed. In East Khasi Hills 74 percent and in Ri Bhoi 66 percent of the villages are electrifi ed while in South Garo Hill the percentage of villages electrifi ed is only 20 per cent (table 6.5). Present Status of village electrifi cati on: Out of 5782 villages (2001 Census), electrifi ed Villages as on 31.03.08 are 3428 representi ng about 60%. Remaining 2354 villages would be as under (i) about 1945 villages will be electrifi ed under RGGVY; (ii) 158 villages under MNRE ; (iii) 148 villages will be declared electrifi ed and (iv) about 103 are PMGY (Spill over). The State Govt. with the approval of the Govt. of India has identi fi ed 158 Nos. of villages in the State as remote villages and these villages are to be electrifi ed through renewable source of energy. Out of these 158 Nos., 5 Nos. of villages are already completed and progress is on for another 74 Nos. of villages. The balance villages of 79 Nos. is to be taken up during 2009-10.
140
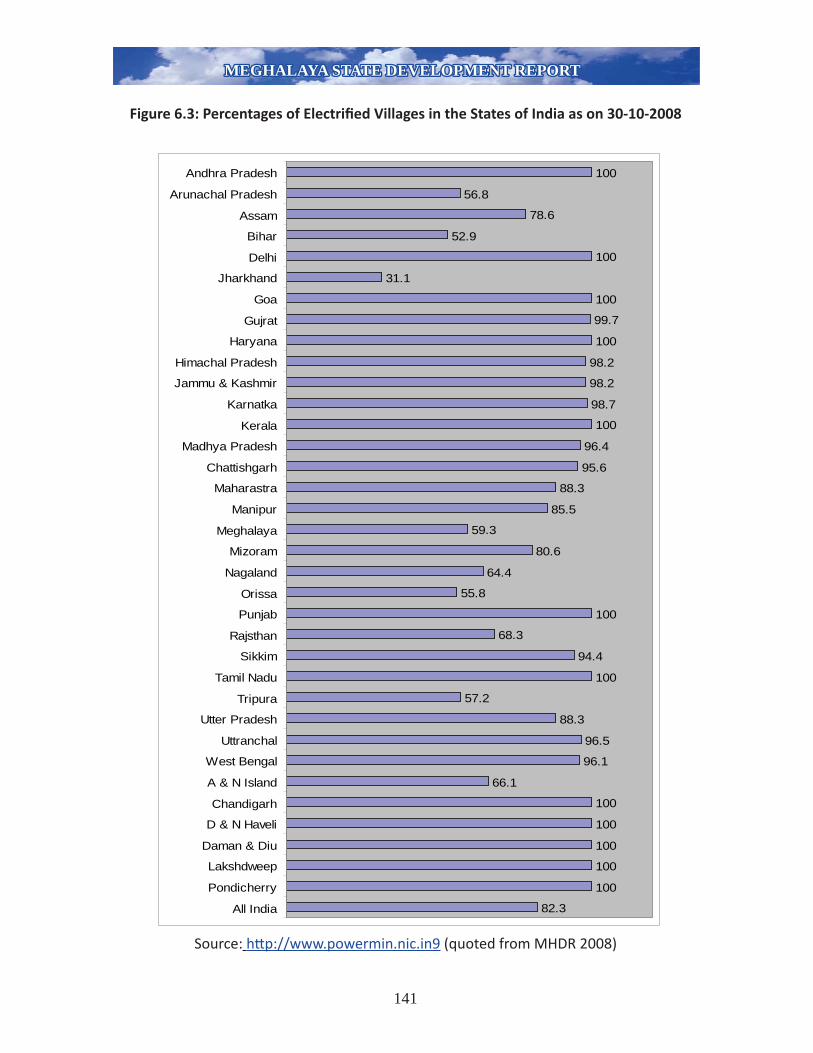
MEGHALAYA STATE DEVELOPMENT REPORTMEGHALAYA STATE DEVELOPMENT REPORT
Figure 6.3: Percentages of Electrifi ed Villages in the States of India as on 30-10-2008
Source: htt p://www.powermin.nic.in9 (quoted from MHDR 2008)
100
56.8
78.6
52.9
100
31.1
100
99.7
100
98.2
98.2
98.7
100
96.4
95.6
88.3
85.5
59.3
80.6
64.4
55.8
100
68.3
94.4
100
57.2
88.3
96.5
96.1
66.1
100
100
100
100
100
82.3
Andhra Pradesh
Arunachal Pradesh
Assam
Bihar
Delhi
Jharkhand
Goa
Gujrat
Haryana
Himachal Pradesh
Jammu & Kashmir
Karnatka
Kerala
Madhya Pradesh
Chattishgarh
Maharastra
Manipur
Meghalaya
Mizoram
Nagaland
Orissa
Punjab
Rajsthan
Sikkim
Tamil Nadu
Tripura
Utter Pradesh
Uttranchal
West Bengal
A & N Island
Chandigarh
D & N Haveli
Daman & Diu
Lakshdweep
Pondicherry
All India
141

MEGHALAYA STATE DEVELOPMENT REPORTMEGHALAYA STATE DEVELOPMENT REPORT
RGGVY SCHEME FOR 10th &11th PLAN:
Name
of the
District
Number
of Virgin
Villages
Number
of De-
electrifi ed
villages
Extension in
electrifi ed
villages.
Electrifi cati on
of BPL
households.
Sancti oned
cost (Rs. in
Crores).
STATUS
East Khasi
Hills.- 19 314 14193 16.63
Sancti oned on 11.03.08
and work is in progress
Jainti a
Hills 18 50 360 14029 26.11
Sancti oned on 21.11.06
and work is in progress
Ri Bhoi 72 34 84 9647 19.89Sancti oned on 26.09.06
and work is in progress
West
Khasi Hills 224 20 126 17592 34.67
Sancti oned on 11.03.08
and tender evaluati on is
in progress
East Garo
Hills 361 111 358 15059 61.95 STATUS
West Garo
Hills 534 123 861 40543 81.43
Sancti oned on 11.03.08
and work is in progress
South
Garo Hills 364 15 32 5384 49.74
Sancti oned on 21.11.06
and work is in progress
TOTAL 1573 372 2135 116447 290.42Sancti oned on 26.09.06
and work is in progress
Source: Power Department, GOM Presentati on
6.4.5 T&D losses and road map ahead: Year-wise loss fi gures for 2006-07 and 2007-08:
Year T&D loss % Collecti on effi ciency % AT&C loss %2005-06 (Act) 35.76 83.56 46.322006-07 (Act) 36.80 90.53 42.782007-08 (Prov) 33.34 95.99 36.00
Road map for reducti on of T&D and AT & C Losses:
Descripti on2006-07(actual)
2007-08( prov)
2008-09 2009-10 2010-11 2011-12
T&D Loss % 36.80 33.34 24.42 20.05 15.69 11.32AT&C Loss % 42.78 36.00 31.29 26.68 22.05 15.11
Source: Power Department, GOM Presentati on
6.4.6 New and renewable Sources of Energy: Energy crisis caused by dwindling resources of fossil fuel like petroleum and coal and their polluti on have compelled us to fi nd a safe and environmentally alternati ve sources of Energy. The alternati ve new sources of energy like Solar, Hydro, Wind and Bio-Energy have already demonstrated that it can fi t the bill even though it may be a small contributi on to our total energy requirements. The potenti al of these sources will grow
142

MEGHALAYA STATE DEVELOPMENT REPORTMEGHALAYA STATE DEVELOPMENT REPORT
as the technologies in this fi eld are improved year by year. The outlines of a successful climate sensiti ve energy strategy already existed. Schemes and projects under new and renewable sources of Energy though on a limited scale have been pursued with notable success in the State. The Objecti ves are:
To Formulate and Implement experimental promoti on and Extension Projects and programme in New and Renewable Sources of Energy.Renewable Sources of Energy are Solar Energy, Bio-Energy, Wind Energy & mix/Hybrid energy.To promote Energy Conservati on Projects and Programme. To impart Educati on in renewable energy through Exhibiti ons, Seminars, Training & Mass MediaTo generate Power through Grid-interacti ve SPV, Biomass Gassifacti on and through Hybridise System in a decentralise mode.To accessess wind potenti al availability in the State for Power Generati on.
Acti viti es Under Taken are:
1. Solar Photovoltaic :-(i) Solar lantern(ii) Domesti c home lighti ng
system(iii) Street lighti ng System(iv) Power Plants
2. Solar Thermal :-(i) Solar water Heati ng Systems(ii) Solar water Pump(iii) Solar Dryier
3. Bio-Energy :-(i) Biogas Plant(ii) Community/Night Soil
Biogas Plants(iii) Biomass Gassifi cati on
4. Micro Hydel : Hydel Power Projects.
5. Water Mill Programme. 6. Electrifi cati on of Remote unelectrifi ed villages and Hamlets of Electrifi ed Villages.
7. Energy Conservati on devices..
8. Power Generati on (i) Through Solar Photovolati c(ii) Through Biomass
Gassifi cati on(iii) Hybridise System
9. Wind Resources Assessment Programme.
Source: Power Department, GOM Presentati on
Progress of Schemes during last fi ve years:Sl.No
Item details 2004-05 2005-06 2006-07 2007-08 2008-09
1. Solar Photovoltaics(i) Solar lantern.(ii) Solar Domesti c Home
lighti ng System.(iii) Street lighti ng System(iv) SPV Power Plants
-1000 Nos.
-12 Nos.
20000 Nos.1500 Nos.
50 Nos.12 Nos.
-1700 Nos.
- -
--
100 Nos.-
1000 Nos.2000 Nos.
500 Nos.-
143

MEGHALAYA STATE DEVELOPMENT REPORTMEGHALAYA STATE DEVELOPMENT REPORT
2. Solar Thermal :-(i) Solar Water Heati ng
System(ii) Solar Water Pump(iii) Solar Dryier
10Nos/100LPD
14 Nos.-
---
30 Nos/100 LPD
--
3/4000 LPD--
5000 LPD-
1000 Sqm.
3. Bio Energy(i) Biogas Plant (2 Cum)(ii) Night Soil/ Community Biogas Plants (10 Cum)(iii) Biomass Gassifi cati on
200 Nos.-
-
50 Nos.2 Nos.
-
200 Nos.2 Nos.
1No./250 KW
200 Nos.2 Nos.
2Nos/50 KW
300 Nos.3 Nos.
10Nos/10 KW
4. Micro Hydel Project Survey Investi gati on
- - - 10 Nos. -
5. Water Mill Programme - - - 5 Nos. 5 Nos.
6. Remote Villages Electrifi cati on - 5 Nos. - 73 Nos. 80 Nos.
7. Energy Conservati on devices :-(i) Family Size Fixed Impd
Chullah(ii) Community Fixed Impd
Chullah(iii) Charcoal Briquetti ng
800 Nos.
900 Nos
-
500 Nos.
1000 Nos
.
-
200 Nos.
-
-
-
-
1000 Nos.
1000 Nos.
1000 Nos.
8. Hybrid Power Plant - - 2.5 KW 10 Nos / 5 KW
9. Wind Mapping Stati on - - - 3 Nos. 12 Nos.
Source: Power Department, GOM Presentati on
List of 10 Nos. of Micro Hydel Project where DPR completed:
Sl. No.
Name of Stream / Village
DistrictInstand Capacity
(KW)
No. of House-
hold
Type of Weir
Type of Turbine
Total Cost
(Lakhs)
Amount Working expenses (Rs.in lakhs)
Annual Generati on
(MU)
1. Rongmi S.G.H. 1 × 25 20 Trench Gross Flow 41.61 3.61 0.13
2. Rongrong E.G.H. 2 × 50 4 Trench Gross Flow 84.00 5.11 0.52
3. Kynrem E.K.H. 2 × 22Tourist Spot
Trench Gross Flow 42.96 3.68 0.23
4. Rongiip E.G.H. 1 × 15 24 Trench Gross Flow 44.98 3.63 0.08
5. Pynker ‘A’ Ri-Bhoi 2 × 50 21 Trench Gross Flow 86.07 5.19 0.53
6. Phudsohlang W.K.H. 2 × 22 65 Trench Gross Flow 58.12 4.47 0.26
7. Wahjyrhat W.K.H. 1× 3.7 50 Trench Gross Flow 52.09 3.91 0.038. Wahkyrtein W.K.H. 1× 3.7 20 Trench Gross Flow 50.76 3.87 0.03
9.Elephant’s
FallE.K.H. 1 × 10
Tourist Spot
Trench Gross Flow 37.71 3.74 0.05
10.Rongband
DareW.K.H. 2 × 45
Tourist Sport
Trench Gross Flow 91.30 5.48 0.47
Source: Power Department, GOM Presentati on
Status of Remote Village Electrifi cati on :- * 158 Nos. of Villages approved; * 5 Nos. of Villages Completed; * 73 Nos. of undergoing work; * 80 Nos of village to be taken
144

MEGHALAYA STATE DEVELOPMENT REPORTMEGHALAYA STATE DEVELOPMENT REPORT
Districtwise Status of Villages to Be Electrifi ed under Renewable Energy:
SL. No. DistrictTotal No. of
Villages
Villages to be Electrifi ed
through Remote
Villages already
Electrifi ed
Undergoing Work to be
Completed by Dec. 2008
1. East Khasi Hills 920 47 - 242. West Khasi Hills 924 44 02 163. Jainti a Hills 467 16 - 084. Ri-Bhoi 543 22 03 095. East Garo Hills 864 20 - 106. South Garo Hills 595 09 - 067. West Garo Hills 1469 - - - Total 5782 158 05 73
Source: Power Department, GOM Presentati on
6.5 TRANSPORT
Development of an effi cient transport network comprising of roads, railways and waterways is a prerequisite for any development acti vity in any state.
6.5. (a) Roads And Bridges: In Meghalaya road network2 is the only form of transportati on that connects the state with the rest of the country and also areas within the state to one another. The importance of developing an effi cient road network is paramount for linking the villages to markets in the state and outside. Not only is the developing of the road network a prerequisite for the development of the local economy, it is also necessary to give the people in the villages access to medical and higher educati on faciliti es that are available at the block and district headquarters. Improved connecti vity through roads and bridges is one of the important prioriti es of the State Government since this is the only mode of transportati on in the state at present. The road density per 100 square km in Meghalaya is 36.66 km on 1st April 2008 which is far below the nati onal average of 100 km per100 sqkm. About 60.10% of roads are surfaced and remaining 39.90 % are sti ll un-surfaced roads. 2578 Nos of habitati ons out of total 5782 habitati ons in the state are yet to be connected by motorable roads. There are semi-permanent bridges having a total length of 17.50 km in the state, which are required to be converted to permanent RCC bridges.
2 Discounting the fl edgling air transport network that caters to a few.
145

MEGHALAYA STATE DEVELOPMENT REPORTMEGHALAYA STATE DEVELOPMENT REPORT
Source: PWD Presentati on, August 2008.
PRESENT STATUS OF ROADS NETWORK
Category/ In Km. Surfaced Un-Surfaced Total Remarks
National Highway 603 - 603 1) 190 Kms under
BRO not
included
2) 1972 : total
roads – 2787
km; road
density – 12.42
km/100 sq. km.
3) Road density :
36.98 km/100
sq. km.
State Highway 1110 24 1134
Major District Road (MDR) 867 352 1219
Other District Road (ODR) 1614 1562 3165
Urban Road (UR) 194 - 194
Village Road (VR) 723 1055 1789
TOTAL 5112 2992 8104
AN OVERVIEW OF ROAD NETWORK
NH7%
SH13%
MDR15%
Urban2%
VR21%
ODR42%
NH SH MDR ODR VR Urban
District-wise distribution of roads of all types
East Garo7%
West Garo18%
South Garo6%
East Khasi22%
Ri-Bhoi11%
West Khasi17%
Jaintia Hills19%
East Garo West Garo South Garo East Khasi Ri-Bhoi West Khasi Jaintia Hills
146

MEGHALAYA STATE DEVELOPMENT REPORTMEGHALAYA STATE DEVELOPMENT REPORT
SL. NO.
DISTRICTNATIONAL HIGHWAY
IN KM
STATE HIGHWAY
IN KM
MAJOR DISTRICT ROAD IN
KM
OTHER DISTRICT ROAD IN
KM
VILLAGE ROAD IN KM
URBAN ROAD IN KM
TOTAL LENGTH IN KM
Road Density
(Per 100 Sq,Km)
1East Garo
Hills28.18 84.00 185.52 179.72 104.57 - 581.99 22.36
2West Garo
Hills104.28 318.47 175.11 527.35 295.66 - 1420.87 38.26
3South Garo
Hills104.00 82.40 - 85.18 192.63 - 464.21 25.09
4East Khasi
Hills157.92 163.80 284.64 847.94 439.66 194.10 1788.05 65.07
5 Ri-Bhoi 65.00 110.00 96.25 558.84 92.11 - 922.20 37.67
6West Khasi
Hills66.46 266.55 189.26 377.51 478.99 - 1378.77 26.28
7 Jainti a Hills 77.44 109.00 288.25 888.18 184.96 - 1547.84 40.53
8 Total 603.28 1134.22 1219.03 3164.72 1788.56 194.10 8103.93 36.46
The total length of Nati onal Highways in the state is only 793.044 km which comes to 3.54 km per 100 sq km only. Out of the total length of Nati onal Highways in the state 414.71 km is single lane and 41.28 km is intermediate lane which need improvement and widening to double lane standard. About 74% of the total road length consists of village roads, other district roads and major district roads, which are unable to cater to the present day traffi c. The 3 (three) district headquarters in Garo Hills are yet to be connected by double lane roads with the capital city Shillong. In absence of good road connecti vity with Garo Hills Districts, the people of the State sti ll have to travel via Assam and communicati ons get disrupted whenever there are bandhs and agitati ons in Assam. Constructi on of Shillong Bypass is the most important scheme and requires immediate implementati on by the Ministry of Road Transport and Highways to avoid traffi c congesti on and accidents in the Shillong City, due to plying of heavy commercial vehicles to Southern part of Assam, Tripura, Mizoram and Southern part of Manipur via the capital city of Shillong.The table below shows the development of the road infrastructure in Meghalaya.
Table 6.6: Development of road network in MeghalayaRoad infrastructure in Meghalaya Road density
Year Total length Kms Percentage of
surfaced roads
Per 100 sq. km Per lakh persons
1971 6668 12.85 29.65 658.89
1981 5211 52.95 23.17 329.39
1991 6481 42.35 28.90 360.10
2006 8165 60.10 36.40 NA
Decadal change in the road length: 1980s 1990s percentage increase 24.4 40.8
Source: Basics Road Stati sti cs in India, various issues.
147

MEGHALAYA STATE DEVELOPMENT REPORTMEGHALAYA STATE DEVELOPMENT REPORT
In the last 35 years the road mileage in the state has increased by 22 per cent between 1971 and 2006 as shown in table 6.6. Along with the growth in the road mileage the percentage of surfaced road has also increased to 60 per cent from 13 per cent in the same period of ti me. The road density in relati on to geographical area has also increased in the same ti me period. The road length maintained by the State Public Works Department (PWD) has more than doubled growing from 3315 Km in 1975-76 to 7978 Km in 2005-06. These developments in the road sector are given in tables 6.6 and 6.7.
Table 6.7: Development of road network in Meghalaya
Roads maintained by the PWD in Meghalaya (Km) Road densityYear Total length Percentage of Per 100 sq. km Per lakh Kms Surfaced persons*1971-72 2787 12.421975-76 3315 1028 (31.01) - -1980-81 3824 1405 (36.74) 17.05 286.31986-87 5219 2123 (40.67) - -1990-91 5687 2407 (42.32) 25.4 320.41996-97 6491 3355 (51.68) - -2000-01 7328 3413 (46.57) 32.8 317.82005-06 7978 4721 (59.17) 35.57 -2007-08 8294 5302(63.92) 36.98
*calculated against the 1981, 1991 and 2001 census.
Source: Directorate of Economics and Stati sti cs, Govt. of Meghalaya; PWD and Planning Department.
Connecti vity of villages: With about 80 per cent of the populati on residing in the villages connecti ng these villages to one another and to the nearest district roads, state roads, nati onal highways is a priority for developing the rural areas. Though the number of unconnected villages has come down signifi cantly as seen in table 6.8 in the NER, nevertheless, in Arunachal Pradesh and Meghalaya, close to 50 per cent of the villages sti ll remain unconnected by all weather roads. For Meghalaya the percentage of unconnected villages has decreased signifi cantly from 1971 but sti ll remains higher than the all India average.
Table 6.8: Percentage of Unconnected Villages in Northeast India
State 1971* 1991* 1997** 2001* As on 10-12-2008 #Arunachal Pradesh NA NA 59.44 NA 53.25Assam 80.45 74.07 25.44 40.21 35.88Manipur 86.70 77.31 54.04 47.80 38.34Meghalaya 92.71 83.66 54.67 51.99 47.02Mizoram NA NA 16.69 NA 29.69Nagaland 90.83 86.60 11.67 9.63 3.60Tripura 91.24 46.55 46.55 38.91 7.98All India 74.87 63.02 39.84 39.32 32.18
Source: *State of the Indian Farmers (2004), ** Directorate of Economics and Stati sti cs, Govt. of Meghalaya,
# htt p://omms.nic.in/aspnet/citi zens/NAT/01NCH/NCHStateWiseHab.aspx
148

MEGHALAYA STATE DEVELOPMENT REPORTMEGHALAYA STATE DEVELOPMENT REPORT
For the districts in Meghalaya, the percentage of villages connected by pucca roads have defi nitely increased since 1981. However, there is a wide variati on in the availability of road infrastructure among the districts. In 1991, 27 per cent of the villages in Jainti a Hills were connected by pucca roads followed by East Khasi Hills at 24 per cent. In the rest of the districts only about 12 per cent of the villages were connected by pucca roads. The other districts have a very low percentage of villages connected by all weather roads ranging from 10 per cent to 19 percent. This clearly shows the poor status of rural road infrastructure in the State. An important point that needs to be highlighted here is that majority of the villages that have not been connected by pucca roads are the small villages with populati on of less than 1000. With 56 per cent of the villages in the state having populati on less than 500, connecti ng all these villages that are located in the interior with all weather roads will need much resources. With the launch of the Prime Minister’s Gram Sadak Yojana (PMGSY) on 25th December 2000 which aimed to provide rural connecti vity in rural areas of the country; some progress has been made since 2000. The Programme envisages connecti ng all habitati ons with a populati on of 1000 persons and above (500 persons and above in respect of Hill States, Tribal and Desert areas). Table 6.10 shows that the number of habitati ons that are yet to be connected in all the districts of Meghalaya as in December, 2008.
Figure 6.4: Percentage of Unconnected Habitati ons in Districts of Meghalaya as on 10-12-2008
Table 6.9: Road infrastructure in the district of Meghalaya
State
Total length (in
Kms)
1987*
Percentage of
surfaced roads
Road density
Per 100 sq km
Percentage of village
connected by pucca road**
1981 1991
East Khasi Hills 1811 46.71 35.5 19.0 26.2
West Khasi Hills 728 36.26 13.9 7.61 11.9
East Garo Hills 557 55.30 21.4 7.62 12.7
West Garo Hills 1237 38.80 22.2 10.8 12.7
Ri Bhoi* NA NA NA 10.5 19.3
South Garo Hills* NA NA NA 9.1 10.1
Jainti a Hills 1066 42.87 28.0 11.88 27.1
Meghalaya 5399 42.50 24.1 11.1 16.4
Source: * Directorate of Economics and Stati sti cs, Govt. of Meghalaya and **District Census Handbook, Census
0
10
20
30
40
50
60
70
East Garo
Hills
East Khas
i Hills
Jaint
ia Hills
Ri Bhoi
South G
aro Hills
West Garo
Hills
West Kha
si Hills
Meghala
ya
149

MEGHALAYA STATE DEVELOPMENT REPORTMEGHALAYA STATE DEVELOPMENT REPORT
Table 6.10: Number of Unconnected Habitati ons in Meghalaya, 2008
District/ Habitati on Category 1000+ 500-999 250-499 < 250 Total
East Garo HillsEast Khasi HillsJainti a HillsRi BhoiSouth Garo HillsWest Garo HillsWest Khasi HillsMeghalaya
Total Number of Habitati ons5 88 254 559 90649 148 212 435 84456 93 100 103 35218 98 163 261 5401 11 87 528 62755 169 421 795 144028 106 214 298 646212 713 1451 2979 5355
East Garo HillsEast Khasi HillsJainti a HillsRi BhoiSouth Garo HillsWest Garo HillsWest Khasi HillsMeghalaya
Unconnected Habitati ons as on 01-04-20000 22 124 391 537 (59)5 31 62 238 336 (40)0 16 37 66 119 (34)0 17 68 189 274 (51)0 0 33 372 405 (65)3 46 205 536 790 (55)1 18 70 199 288 (45)9 150 599 1991 2749 (51)
East Garo HillsEast Khasi HillsJainti a HillsRi BhoiSouth Garo HillsWest Garo HillsWest Khasi HillsMeghalaya
Unconnected Habitati ons as on 10-12-20080 22 124 391 505 (56)5 31 62 238 295 (35)0 16 37 66 91 (26)0 17 68 189 251 (47)0 0 33 372 380 (61)3 46 205 536 741 (52)1 18 70 199 255 (40)9 150 599 1991 2518 (47)
Note: Figures in brackets are percentages of unconnected habitati ons out of the total number of habitati onsSource: htt p://omms.nic.in/citi zens/en/STL/06SCH/NCHDistrictWiseHabs.asp
TARGET FOR 11TH FIVE YEAR PLAN (2007-2012)
New constru-
cti on (Kms)
Upgrad-ati on (Km)
Bridges (Rm)
Village connec-ti vity (Nos)
Amount (Rs.in crore)
Amount required for Spill
over Schemes
Total Amount
(Rs.in crore)
State Plan 544.00 1319.00 3987 100 800.00 - 800.00PMGSY 600.00 500.00 370 140 450.00 - 450.00NEC 116.50 457.54 300 10 500.00 95.00 595.00
150

MEGHALAYA STATE DEVELOPMENT REPORTMEGHALAYA STATE DEVELOPMENT REPORT
NLCPR 20.00 400.00 1000 5 450.00 15.00 465.00CRF - 120.00 - - 60.00 - 60.00Inter State Connecti vity
- 38.00 - 38.00 - 38.00
Economic Importance - 26.00 - - 13.00 - 13.00Externally Aided Project (ADB)
- 212.80 80 - 185.20 - 185.20
Total 1280.50 3092.48 5737.00 255 2496.00 - 2606.00 Source: PWD, GOM
The target may appear to be high but it is achievable. The Government has drawn up a plan in this regard and with the acti ve support of the Central Government and the Ministry of DONER taking the role of a major player the State hope to reach this goal.
Total Achievement at the end of 11th Five Year Plan will be:Total road length = 9445.24 KmSurfaced = 8136.32 Km Out of which NH = 793.044 Km (Inclusive of 189.76 Km under BRO)Unsurfaced = 1308.92 KmNo of villages to be connected = 3459 Nos No of un-connected villages = 2323 Nos
Problems and Issues aff ecti ng the performance of PWD and Suggesti ons3 :1. Contractors Capacity: A serious problem ;Lack of incenti ve to modernize, professionalize2. System Of Award Of Contracts: Encourages small ti me contractors; Kills competi ti on ;
Sacrifi ces quality; Demoralisati on; Erosion Of Professional Pride; Status Quoism; 3. Huge bank of sancti on (BOS) unrelated to plan perspecti ve and master plans of road
development;4. Leads to ‘SYSTEMIC loss of CONTROL and ACCOUNTABILITY’.5. Immediate & Short Term acti on required:
a. Drasti cally reduce BOS and consolidate: weed out all except criti cal on going schemes; No new schemes; If a new scheme, then compensate by de-sancti on of 10 ti mes the amount of new scheme; Adopt transparent criteria for de-sancti on; Publish all on the web site.
b. Internalise work ethos to fully exploit the working season : this will be self reinforcing and will improve work culture.
c. Monitor Contractor performance and enforce contractual obligati ons: this will pay immediate dividends.
6. Encourage contractor professionalisati on; Prepare Contractor Profi le and use in Tender Committ ee to select contractors7. Proriti se Maintenance spending : Explore opti ons eg. Annual maintenance contracts etc.8. Explore ways to sett le all pending bills and start afresh
3 From PWD presentation, 2008.
151

MEGHALAYA STATE DEVELOPMENT REPORTMEGHALAYA STATE DEVELOPMENT REPORT
9. Reform work award system comprehensively: At par bids to be rejected and contractors black listed for a period; Emphasis on turn key bids with monitorable performance parameters, no scope for revised esti mates and penalti es ; Work packages to be rati onalised to encourage contractor capacity growth;Dismantling of law requiring bids at SOR to encourage serious competi ti on
10. Professionalize and Incenti vise The P.W.D11. Reform Procedural Regime Governing Budget, Sancti ons, Administrati ve Approval to Enforce
Strict Accountability of P.W.D.12. Improve Morale And Work Atmospherics through Upgradati on of Skills, Performance
Monitoring Etc.13. Concentrate On : Maintenance; Completi on of on Going Schemes, and Financial
Consolidati on 14. Maximize All other Sources of Funding for Constructi on, Improvement, Upgradati on of
Roads such as NH, PMGSY, ASIDE, RIDF and NEC,NLCPR. etc.15. Achieve This By Reforming and Upgrading and Professionalizing the Roads Sector Viz. P.W.D.
And Contractors.
In conclusion, Roads in Meghalaya has miles to go and bridges are too many and too far in this sector. Business as usual cannot sustain given P.W.D.’s size and complexiti es of issues as above, it can cause a crippling drain of the Govt’s budget and economy’s biggest handicap. Eff ecti ve CHANGE and bringing professionalism has to be the new Mantra for P.W.D. A professionally performing P.W.D. can unlock Meghalaya’s huge potenti al which can and must be enabled by the politi cal economy. Due to our dependence on roads, Ministry of Road Transport and Highways are required to be more proacti ve and take upon the task of completi ng long committ ed past projects on a war footi ng. SARDP NE phase A and B is required to be merged and implemented at the earliest. The state also needs to address the issue of cost norms for land acquisiti on which appears to be highly suspicious or infl ated given the state of current economic development and the benefi ts highways would bring. GOI is also required to adequately provide fund for the State for upgrading main arterial routes. A separate fi nancial arrangement for maintenance of roads menti oned in the Nati onal 11th Plan document should also be put into practi ce by appropriate arrangement, may be through Finance Commission awards.
6.5. (b) Railways: The discussions on transportati on system as a basic infrastructure that promotes growth of the economy will not be complete without taking into considerati on the other importance means of land transportati on viz. railways. In most of the states in India, railway is an important means for movements of people as well as commoditi es. However, in the hill states of India the railway network is not well developed. An indicator of the development of railway transport is the railway route density, which in the northeast is very low for all states except for Assam.
152

MEGHALAYA STATE DEVELOPMENT REPORTMEGHALAYA STATE DEVELOPMENT REPORT
Table 6.11: Railway infrastructure in Northeast India
StateRailway Route length (Km) Density of route length
(per ‘000 sq. km. of area)Arunachal Pradesh 1 0.01
Assam 2516 32.08Manipur 1 0.04Meghalaya 0 0Mizoram 2 0.09Nagaland 13 0.78Tripura 45 4.29All India 63140 19.21
Source: Background Paper Authors’ calculati on based on CMIE, March 2004 ( MHDR2008)
In the state of Meghalaya railway transportati on is yet to be established, while in Arunachal Pradesh, Manipur and Mizoram the railway route length is under 2 Kilometers. Almost 98 per cent of the railway route length in the North east is in Assam. At present, there is no railway line in Meghalaya. However, the Government of India is considering connecti ng all N.E. State capitals by railways and, in this context, the following projects are in the pipeline :-(i) The process of land acquisiti on for constructi on of a new railway line from Dudhnoi to Mendipathar is under considerati on (sancti oned project).(ii) Joint survey and land acquisiti on process is on for constructi on of a railway line from Azara to Byrnihat and survey to extend upto Shillong is being undertaken. (Azara to Byrnihat is a sancti oned project).(iii) Survey of railway line from Pancharatna (Jogighopa in Assam) to Silchar along the southern slopes of Meghalaya along Bangladesh border is in progress. (iv) Proposal for connecti ng of Jowai to Lamding/ Silchar has also been proposed .
6.5. (c). Air Transport :
The State has two airports viz Umroi Airport and Baljek Airport. The Baljek airport is yet to be made fully operati onal.Further, these airports needs to be upgraded to provide bett er air connecti vity to the State. The Planning Commission has assisted the State Government partly in respect of the cost of land acquisiti on for expansion of Umroi Airport. The Government of India in the ministry of Civil aviati on requires to take up the project for the upgradati on of the Baljek and Umroi Airport. The NEC’s sectoral summit’s recommendati ons of operati ng intra regional dedicated air services need serious att enti on and priorti sati on. Cargo faciliti es and other linkages for Horti culture produce evacuati on are also essenti al.
6.6 Tourism: Tourism is a multi faceted acti vity – an amalgamati on of transport, accommodati on, cuisine, entertainment and other related industries. Among the smallest states in the country, Meghalaya is blessed with picturesque landscapes, salubrious climate, sparkling waterfalls, rich traditi onal culture and warm and hospitable people. The State has a high tourism potenti al because
153

MEGHALAYA STATE DEVELOPMENT REPORTMEGHALAYA STATE DEVELOPMENT REPORT
of its geo-ecological and cultural setti ngs. Cherrapunjee is disti nct and renowned for receiving the highest rainfall in the world. Some of the wonderful and unexplored caves, rare plant species abound the state. The abundant natural beauty is a major asset which could be promoted with adequate provision for infrastructure.
Tourism in Meghalaya has gained momentum in recent years. The Government accords priority to Tourism infrastructure and Tourism Services. There has been a gradual increase in the arrival of foreign tourists in the State. About 12407 foreign and 4,33495 domesti c tourists visited the State during the year 2004. With the State having vast potenti als in eco- tourism, the endeavour of the State Govt. is to tap the abundant natural resources for tourism development with people’s parti cipati on. This would generate both income and employment to the people in the State. The State Govt. on its part has taken up a member of schemes for development of tourist spots for tourism promoti on. The support of the Ministry of DONER and N.E.C. is sought for to supplement the eff ort of the State Government for development of tourism in Meghalaya keeping into considerati on an integrated regional tourism policy. Promoti on of tourism by developing an integrated regional policy and acti on plan in consultati on, cooperati on and coordinati on with the Union Ministry of Tourism, ITDC and the State Governments of NE States would be necessary. Eco- tourism involving the local communiti es (e.g. in providing low cost faciliti es) with highlights of caves, rivers, bio-resources, and ethnic diversity has bright prospects. This will build capaciti es, improve livelihood and allow tourists to experience the North Eastern Region in an authenti c sense through mission – mode people’s parti cipati on approach.
6.7 Social Infrastructure: i). Health - At present, the state has 9 Government Hospitals, 28 CHCs, 104 PHCs and 404 Sub-Centres. The strategy of the Department during the Plan period is to upgrade the existi ng Hospitals by providing more beds and faciliti es with a view to improve pati ent – to – bed rati o (1:730) drasti cally. It will also focus on upgradati on of CHCs to Hospitals on case to case basis. Simultaneously, the Department will also set up new CHCs, PHCs and Sub-Centres to cover more populati on of the State as per the norms. The present set-up is well below the expected norms which should be 33 CHCs, 132 PHCs and 860 Sub-Centres. Fund fl ow and coordinated management plan to bridge the gap is desirable in this respect. Funds and shift in approach with innovati on are also required for upgradati on of existi ng hospitals and improving quality of service both in outreach and delivery. NEIGRIHMS should commence both the PG and UG classes simultaneously and the super-speciality hospital be made fully functi onal. Private sector also need to invest in world class infrastructure to tap medical tourism possibiliti es.ii). Educati on - The enrolment in Primary, Upper Primary and Secondary during 2006-07 was 4.88 lakhs, 2.12 lakhs and 1.15 lakhs respecti vely. During 2007-08, the enrolment had increased to 518000 in the Lower Primary and 232000 in the Upper Primary stage. With the launching of the SSA programme and its various interventi ons the Department is making an eff ort to provide educati on of sati sfactory quality, bridge the existi ng gaps in access, provision of infrastructure including educati onal curricula and teachers Training.
The number of Primary Upper, Primary and High & Higher Secondary schools as in 2005-06 were 5851, 1759 and 655 respecti vely. Cumulati vely, 75 nos. of Secondary Schools have been upgraded to Higher Secondary level up to 2005-06 and the no. of Govt. Aided Colleges has increased from 20 in 1996-97 to 36 in 2005-06.
154

MEGHALAYA STATE DEVELOPMENT REPORTMEGHALAYA STATE DEVELOPMENT REPORT
At present there are 8 Government Secondary, 19 Government Higher Secondary Schools and 3 Government Colleges in the State. The Government has also planned to provincialise 3 Colleges in the State soon. While the status of existi ng insti tuti ons shall have to be maintained, it is the vision of the Government to improve the quality of infrastructure in the educati onal insti tuti ons in the State. It may also be menti oned that many of the old existi ng insti tuti ons are badly in need of renovati on. Some of the Govt and private insti tuti ons in the state has received capital cost under the NEC and NLCPR schemes. One of the aims of the State is to once again make Shillong and Meghalaya as the educati onal hub of the NE Region. To this end following are the recent initi ati ves / fruiti on:• NEHU is now a centre of excellence; added technology insti tute and many new streams .
• an IIM (RGIIM) at Shillong has started functi oning .
• A Nati onal Insti tute of Fashion Technology(NIFT) has already commenced its session 2008-09.
• under NEIGRIHMS, MBBS has started and Post Graduate course should shortly commence from 2009-10. One B.Sc. nursing college is already functi onal under its umbrella.
• One BSc Nursing College under PPP is supported by NEC and ILFS.
• An MOU with Public Health Finance Insti tute for setti ng up of an Indian Insti tute of Public Health at Shillong has been entered into.
• A PG college under CAU has started functi oning near ICAR complex. Further, a Central Agri-Horti University and /or setti ng up of a Agricultural/ Horti cultural Insti tute is under contemplati on.
• An Indian Insti tute of Informati on Technology is under considerati on by the Ministry of HRD and Planning Commission.
• Private University such as MLCU, ICFAI and others as well as Technical insti tuti ons have been encouraged.
• There is land measuring about 100 acres available for setti ng up of an IT Estate in PPP mode.
• The State will encourage several PPP partnerships for setti ng up of ITIs, Polytechnics, technical insti tutes, etc. these needs to be worked upon with sincerity and dedicati on.
• Besides the above, the State Government would acti vely pursue the idea of constructi ng model schools under PPP mode or state mode at each Block level.
• The state will follow up on NIT; other technical insti tute etc.
• The state is pursuing a world class music university.
• State would also like to have a world class English and foreign language University
• The State would tap various progammes which are available under the diff erent ministries of the Government of India. For skill development, technical educati on, vocati onal educati on and IT educati on, partnership with private sector would be encouraged while also leveraging funds from the Government of India.
155

MEGHALAYA STATE DEVELOPMENT REPORTMEGHALAYA STATE DEVELOPMENT REPORT
6.8. Border Trade Infrastructure 6.8.1. The length of the internati onal border with Bangladesh is about 443 kms. Before independence, people living in the border areas of Bangladesh used to culti vate crops like oranges, bananas, betel nuts, betel leaves, black pepper, bay leaf, etc. These commoditi es had a ready market in the areas presently in Bangladesh. Similarly some essenti al commoditi es were imported to the bordering areas of the state from Bangladesh. The communicati on from these areas to the interior of the state was virtually non-existent.
Aft er the parti ti on of the country abrupt stoppage of trade with the bordering Shylet and Mymensing resulted into tremendous economic hardship to the people living in the bordering areas of the state. The people of this region were deprived of the traditi onal markets to sell their agro products. Moreover, the traditi onal supply lines for the supply of essenti al commoditi es were also severed. With a view to ameliorate the suff ering of the people inhabiti ng the area and to accommodate and improve their economy, the Border Areas Development Programme was initi ated as a special area programme during the Fourth Five Year Plan. The Border Areas Development Department was created in 1973 and the Directorate of Border Areas Development in 1975 to co-ordinate eff orts to undertake and implement schemes felt urgently needed to being about rapid development of the border areas. The schemes undertaken under the programme are supplemental in nature and are over and above the other developmental schemes undertaken by the diff erent development departments of the State Government in the enti re State, which also included the border areas.
6.8.1 Land Custom Stati ons (LCSs) in Meghalaya:
The State of Meghalaya has 10 (ten) Land Custom Stati ons which plays a signifi cant role in the economy of all the North Eastern states including the State of Meghalaya. This is because of the fact that in many cases, goods originati ng in one state fi nds its way to the neighbouring countries through another state. All these Land Custom Stati ons are along the Indo-Bangladesh border. These are:-
Sl. No. Name of LCS with locati onFuncti onal /
Non-Functi onalCounter part LCS in
Bangladesh
1. Borsora, West Khasi Hills Functi onal Borsora
2. Dawki, Jainti a Hills Functi onal Tamabil
3. Gasuapara, South Garo Hills Functi onal Karaituli, Gobrakura
4. Shella Bazar, East Khasi Hills Functi onal Chatak
5. Dalu, West Garo Hills Functi onal Nakugoan
6. Bholaganj, East Khasi Hills Functi onal Chatak
7. Mahendraganj, West Garo Hills Functi onal Dhanua Kamalpur
8. Baghmara, South Garo Hills Functi onal Bijoypur
9. Balat, East Khasi Hills Non-Functi onal Dalura
10. Ryngku, East Khasi Hills Non-Functi onal Sonamgunj
In additi on, The State has proposed for opening 3 (three) more LCSs with Bangladesh, viz., 1. Kuliang, Jainti a Hills, 2. Maheshkhola, South Garo Hills, and 3. Iew Thymmai, East Khasi Hills.
156

MEGHALAYA STATE DEVELOPMENT REPORTMEGHALAYA STATE DEVELOPMENT REPORT
6.8.2 As Meghalaya shares an internati onal boundary of 443 km with Bangladesh in the South and West, therefore improvement of the road network in the Border Areas is very important for trade and commerce and also from strategic point of view. Meghalaya has eight land custom stati ons exporti ng goods to Bangladesh. The Land Custom Stati ons at Mahendraganj, Gausapara, Baghmara, Borsora, Shella Bazar, Bholaganj, Dawki, Ryngku etc are not yet connected with double lane roads. The value of export from Meghalaya for the year 2005-06 is Rs.211.77 crores which is about 48.37% of the total exports from the North Eastern Region. However most of the exports are coal, limestone and boulders and some fruits. The State Government is therefore very keen to develop the infrastructure in the LCSs including road connecti vity. Except for Dawki there is absolutely no infrastructure in all the other LCSs.Even at Dawki the faciliti es are actually not commissurate to the volume of export.
Proper Phyto-Sanitary Laboratories, Plant Quaranti ne and Radiati on Free Certi fi cati on faciliti es need to be established at the major LCSs of Meghalaya and at the corresponding LCSs of Bangladesh to boost export of agricultural/horti cultural products. Guidelines for Inland Transport Assistance of APEDA may be suitably modifi ed. Ministry of Commerce may consider declaring Export Promoti on Councils/Commodity Boards having a presence in North East as Multi - Product Registering Authoriti es for issue of Registrati on cum membership certi fi cates. The State Govt. has requested Govt. of India to include Borsora and Gasuapara in the list of Integrated Check Posts as our exports from these two LCSs was worth Rs.84.63 crores and Rs.23.36 crores respecti vely during 2005-06. We realize that creati on of infrastructural faciliti es and improvement of road connecti vity to the ICPs and LCSs will facilitate export acti vity and act like a catalyst for the all round development of the whole State. Ministry of Commerce may create an Inter-Acti ve Website with all the relevant informati on that would facilitate trade from the region. This website will also ensure that the inter-acti on between the traders of NER and the traders of the neighbouring countries is producti ve and focused. For the development of professional manpower and creati on of entrepreneurship in the fi eld of Foreign Trade, Government may set up a branch of Indian Insti tute of Foreign Trade at Meghalaya.
6.8.3 Issues of Border Trade:
Bangladesh is the desti nati on for the majority of goods produced in the state. This is due to the complementary relati on between the resource-base of Meghalaya and the demand structure of Bangladesh. Following measures are suggested for the promoti on of the cross border trade between Meghalaya and Bangladesh:
a) Strengthening of Infrastructure
First, export of minerals like coal and limestone requires good quality all weather roads connecti ng the source and delivery points so that heavy vehicles can move with ease. Besides roads, other infrastructure faciliti es like communicati on network, banks, and electricity are also important for the smooth fl ow of goods across the border. However, in most of the border trade points, these
157

MEGHALAYA STATE DEVELOPMENT REPORTMEGHALAYA STATE DEVELOPMENT REPORT
services are in a poor conditi on, which requires urgent att enti on from the concerned authoriti es. Once these basic services are available, the other services like weight bridges, hotels, public telephone booths, Internet cafes, vehicle repairing faciliti es, etc., will be taken care of by the private service providers.
Besides the provision of infrastructure faciliti es at the border trade points, a wider multi -modal road and transportati on linkages across north eastern region and Bangladesh in general, and Meghalaya and Bangladesh in parti cular needs to be put in place for the promoti on of trade across these two regions. A Shillong-Dhaka bus service through Dawki on the lines of the Agartala-Dhaka bus service, will, no doubt, boost tourism in Meghalaya.
b) Addressing Security Concerns
Provision of secure environment at the border trade points is one of the most fundamental prerequisites of border trade. Strengthening of security arrangements in most of the border trade points will necessary to build confi dence among local exporters. It will also help to check the siphoning of a part of the trade surplus by the insurgent and extorti onist groups for non-producti ve anti -social purposes.
c) Industry Linked Research and Development
Presently Meghalaya’s exports base mainly consists of minerals like coal and limestone. This base needs to be widened. For this to happen, insti tuti onal support is needed in areas like market research, product development, and technology up gradati on, quality control and informati on disseminati on. Insti tuti ons providing these services at the nati onal level may be persuaded to cater the same through the establishment of their respecti ve branch offi ces in the region.
d) Cross-border Informati on Exchange
For the eff ecti ve promoti on of cross border trade, the exporters from the region need to have easy access to informati on relati ng to the demand structure across the border. This will be largely facilitated if arrangements could be worked out with the neighbouring countries to promote a greater exchange of trade informati on.
e) Resuming Border Haats
Apart from ostensible value of cross border trade in terms of economic benefi ts, it has intrinsic value as well in terms of improving the quality of life of the people living in the border areas. Realizati on of this intrinsic value, no doubt, raises the well being of the people in the fringe areas. Resuming the border haats, which had hitherto been operati ng along Meghalaya-Bangladesh border, may further augment this.
f) Policy Matt ers
In additi on, the central government needs to perceive border trade as a strategic tool for the development of the Border States and devolve them the necessary powers so that they can uti lize this tool to their benefi ts.The Border States also need to treat cross border trade as a separate sector and integrate its requirements into the state plan. So far, like other north eastern states, state plan in Meghalaya does not appear to have taken into account the needs and potenti als of cross border trade. Finally, a strong government-business partnership is needed for the promoti on
158

MEGHALAYA STATE DEVELOPMENT REPORTMEGHALAYA STATE DEVELOPMENT REPORT
of cross border trade. Unless this partnership develops, policy makers will be unable to understand the requirements of cross border trade and would not be able to reap its social benefi ts to the fullest extent. At the same ti me, the exporters will remain handicapped due to inadequate policy support. A strong partnership will enable the exporters to maximize their profi ts and the government to opti mise the social benefi ts. Border trade will additi onally have to be viewed in the context of emerging global paradigm post WTO set up.
6.8.4 Steps to Boost Trade from Meghalaya to Bangladesh:
1. Creati on of Proper Infrastructure: State is taking Steps to create the necessary infrastructure like roads, buildings, warehouse, cold storage, power supply, drinking water facility etc. through ASIDE
2. Telecom Facility: Special Mobile phones need to be expanded upto border since Bangladesh has mobile connecti vity up to border. This issue has already been taken up with Ministry of Communicati ons.
3. Proper Phyto-Sanitary Laboratories, Plant Quaranti ne and Radiati on Free Certi fi cati on faciliti es need to be established at the major LCSs of Meghalaya and at the corresponding LCSs of Bangladesh to boost export of agricultural/horti cultural products. This needs to be taken up with Bangladesh
4. Proper Banking faciliti es needs to be established at the LCS for quick transacti on and to prevent informal trade.
5. Transport Subsidy: Ministry of Commerce & Industry may consider Road Transport subsidy and Air Freight Subsidy @ 90% for all the items of export through L.C.S/Airport or nearest port of call located in the region since the exporters of the region have to pay double freight charge, as there is no or litt le import through various L.C.S of the Meghalaya. The transport subsidy given to tea, fruits and horti cultural products in North Eastern should also be given to other items like coal, limestone etc.
6. Ministry of Commerce may consider declaring one Export Promoti on Council based at North East as Multi - Product Registering Authority for issue of RCMC to facilitate all items of export from the region. Because except Commodity Board like APEDA, MPEDA, TEA BOARD, COFFEE BOARD, RUBBER BOARD & CAPEXIL no other export promoti on council have their presence in the North East Region.
7. Ministry of Commerce may pursue Nati onalised Bank to charge Rs 500/- for L/C advising instead of existi ng Rs.1,500/- considering L/C value less then US $5000 in general.
8. Ministry of Commerce may create an Inter-Acti ve Website with all the relevant informati on that would facilitate trade from the region. This website will also ensure that the inter-acti on between the traders of NER and the traders of the neighbouring countries is producti ve and focused.
9. Special MDA for North East Exporters: According to one of the clause, an exporter has to complete 12 months of membership with the concerned EPC in order to be eligible for MDA grants. This clause may be exempted for the exporters of North East. They may be allowed to avail MDA aft er taking the membership of the EPC/ commodity Board.
159

MEGHALAYA STATE DEVELOPMENT REPORTMEGHALAYA STATE DEVELOPMENT REPORT
10. Consulate: Ministry of Commerce may take up with the Ministry of External Aff airs of Bangladesh for Consulate offi ce at Shillong for issue of visa to exporters of the region. Govt. of Bangladesh may also be requested to issue multi ple entry visa upto one year to Meghalaya exporters since at present they have to obtain visa either from Kolkata or Agartala which is far off from Meghalaya.
11. Entrepreneurship Development: For the development of professional manpower and creati on of entrepreneurship in the fi eld of Foreign Trade, Government may set up a branch of Indian Insti tute of Foreign Trade at Meghalaya.12. To boost agro-exports from the state of Meghalaya, Guidelines for Inland Transport Assistance of APEDA may be suitably amended : • All applicati ons received will be granted transport assistance.• Applicati ons may be allowed to be submitt ed up to 180 days without any penalty. • Inland Transport Assistance on transportati on by road/rail @ Rs. 2 per kg for the products which can be taken by road/rail from North Eastern Region to any place in North East Region & West Bengal for processing and export. 13. Duty free imports from Bangladesh be allowed for ceramics, malamine, edible oils, texti les, leather goods etc. This will make such goods available at lower cost and lead to higher exports as Bangladesh may then take more products from us.14. Introducti on of regular bus service between Shillong –Sylhet- Dhaka and Chitt agong (Meghalaya & Bangladesh) would help boost tourism & improve bilateral relati on. 15. Govt. of Bangladesh may be requested to set up Weight Bridge at all the LCSs of Meghalaya to check leakage of revenue from both sides.16. Export Corridor: Government of Bangladesh may be requested to provide access to Chitt agong Port for exports/import from and to the Meghalaya to the outside world
6.9 Communicati on:
In the present knowledge economy informati on plays a very important role. However, the extent to which communicati on, more specifi cally telecommunicati on can promote economic growth depends on the availability and the quality of the infrastructure facility connected to this sector. As per the data reported by CMIE (2004), in March 2002 the number of cellular and fi xed line subscribers in the northeast was 743532, which is about 1.7 percent of the total number of cellular and fi xed line subscribers at all India level. There has been a phenomenal growth in the cellular scribers in the Northeast since this service was introduced in the late nineti es. Between 1999-00 to 2002-03 the num ber of cellular subscribers has increased almost 9 ti mes from 6545 to 56023.
6.9.a. Telecommunicati on:
Meghalaya has in 2007 117 telephone exchanges of which 97 are Rural and 20 Urban exchanges. The Total connecti ons in Meghalaya as on June 2007 were 150879 with Waiti ng List on demand and over all Tele-density of 6.51 %. The land line exchanges were 90 with STD/ISD facility and 66809 working connecti ons. Meghalaya also had 27 branch telephone stati ons(BTSs) with 11205 WLL connecti ons, and 62678 Mobile connecti ons as on 2007 March. The state had 3390 PCOs of which 225 were on highways, 2736 were with STD facility. The BTSs with GSM facilty were 103 with 72865 connecti ons (95046 equipped).
160

MEGHALAYA STATE DEVELOPMENT REPORTMEGHALAYA STATE DEVELOPMENT REPORT
Box 6.9.(i) Progress of telecommunicati on in Meghalaya:
Years Land Line WLL CMTS Total2004-05 52535 2603 10462 656002005-06 55222 2890 31572 896842006-07 53417 4830 50151 108398Villages with <100 & “0” populati on 948 Total number of Uncovered Villages as per
USO No: 30-130/2004-usf dt 10.11.041957
Villages provided with VPTs
2925 Covered 201
USO claim made on ( as on 31.12.06)
2309 No of Villages not existi ng 2
Balance to be covered* 1756 <100 populati on 239Source: BSNL Presentati on 2007
Table 6.12: Number of Telephone Connecti ons in Meghalaya, 2007
District Working Landline Connecti onsUrban Rural Total
East Khasi HillsWest Khasi HillsRi-Bhoi Jainti a HillsEast Garo HillsWest Garo HillsSouth Garo HillsTotal
27233 18315 455481430 739 2169456 2783 32392519 3648 61671211 501 17125979 3664 9643360 113 47339188 29763 68951
Total Note: Data pertain to BSNL faciliti es only.Source: BSNL, NE-I Telecom Circle, Shillong.
WLL connecti ons 10592
Mobile connecti ons 62678
Telephone Exchanges 114
It may be menti oned despite eff orts by 2007, only 6 out of 7 District, 13 out of 15 Sub-divisions and 25 out of 39 blocks were connected by telecom. Capital City Shillong is protected by 2 Rings with Guwahati ; Other DHQs on Ring are Nongpoh and Nongstoin; Ring for Tura, Jowai, Williamnagar and Baghmara were under executi on. About 1226 Km of telenetwork existed by mid 2007. BSNL, NE-I Circle has the following development plans in Meghalaya for 2006-07 & 2007-08.
161

MEGHALAYA STATE DEVELOPMENT REPORTMEGHALAYA STATE DEVELOPMENT REPORT
Box 6.9 (ii): BSNL Development Plan for Meghalaya, 2006-07& 2007-08
2006-07 2007-08New ExchangesNew WLL BTSProvision of Wired line
Provision of WLL Connecti on
Broadband port capacity
227
1000
10000
2194
WLL BTSGSM BTSNo of City/ to be overed Laying of OFC
11212
9
382.0 Kms by Circle & 690.0 Kms by NETF
102 towers sancti oned for strengthening mobile telephony in the State through the United Service Obligati on (USO Fund) has been sancti oned. Each tower will be shared by all the Service Providers, the progress is being monitored closely.
6.9.b. IT Infrastructure:The growth of the Informati on Science and Technology Industry or simply IT Industry in India since the mid 1980s has been phenomenal placing the country today as a global leader in this sector. While the southern states like Karnataka and Andhra Pradesh have made signifi cant contributi on to the growth of the IT industry, this industry is also recording a steady progress in other states in India. The North East has shown average e-readiness. In Northeast India, in the absence of industrial growth, the IT industry can play an important role in transforming the backwardness of the economy and generati ng producti ve employment and economic growth in the region. The region possesses certain conducti ve feature for the growth of this industry like pool of educated English speaking manpower and climate conducive to the industry. It is for this reasons that in recent ti mes considerable att enti on and focus has been given to facilitate the development of this sector in the region. However, the prospect for the growth of this industry in the region will depend upon many criti cal factors, among them being the availability of physical infrastructure and manpower. As on 2007, 7360 internet connecti ons were available in the state. The Broadband facility indicated 10 DSLAMs with 1621 Working broadband Connecti ons. There is one private Internet Service Provider, besides the PGCIL’s online monitoring control hub. Committ ed Connecivity 512 Kbps for all Citi zens by 2008 Stm-4 Connecti on Available Now To IT Park and 1 Lambda Connecti on By March 2009. By now, about 20000 Broadband Connecti ons in City is expected. VPN over Broad Band is available which can be exploited by IT enabled industries for higher B/W and their networking needs.
Box 6.9 (iii): Status of Transmission Media for connecti vity of Exchange / BTS,
Media Exch. WLL BTS GSM BTS OFC 74 20 69MW 11 7 26SAT 5 0 4
162

MEGHALAYA STATE DEVELOPMENT REPORTMEGHALAYA STATE DEVELOPMENT REPORT
Box 6.9 (iv): Broad Band Multi -play Roll Out Plan in Meghalaya, 2007Name of Stati on Capacity
ShillongJowaiNongpohNongstoinBaghmaraTuraWiliamnagarKhlieriat Byrnihat Phulbari
1872 Port384 Port168 Port168 Port60 Port324 Port120 Port108 port60 port60 port
Total 3324 ports
Source: BSNL, NE-I Telecom Circle
The Nati onal e-governance Programme which is under implementati on in the state will have: State wide Area Network (SWAN); Common Service Centre (CSC); State Data Centre and Several Central and State Mission mode applicati ons along with capacity building. The State e-Governance Mission Team (SeMT) has been formed to manage the enti re programme at the State level in a coherent manner. The State Wide Area Network (SWAN) to provide network architecture, communicati on infrastructure and internet connecti vity to connect the State capital with all Head Quarters up to Block level will have a total 55 PoPs across the State (1 SHQ + 7 DHQ + 8 SDHQ + 39 BHQ).The State Data Centre (SDC) is expected to be housed in a fl oor space of 2100 sq feet.The Common Service Centres (CSC) in Meghalaya will have 225 CSCs in all 7 districts which will be established in phases. The Existi ng CICs would be integrated to the CSCs. And it will be uti lized as effi cient distributi on channels to off er Government services, informati on and schemes etc. to citi zens in a cost eff ecti ve, sustainable and effi cient manner. The First CSC rolled out on 2nd October 2008 with VSAT Connecti vity.
BSNL has identi fi ed the following constraints in the development of Telecom and IT faciliti es in the NE-I Telecom Circle comprising Meghalaya, Mizoram and Tripura. • Law & Order problems: Restricted movements.• Delay in project executi on in the scenario of controlled environment of insecurity.• Delayed OFC ring formati ons due to terrain and other logisti c problems. In many cases, there
is no alternate road for OFC ring formati on. For example, Shillong-Silchar route.• OFC faults due to landslides and asynchronous developmental works by NHAI, PWD, PHE &
Municipal authoriti es.• LOS problems for MW media and prolonged executi on ti me of OFC schemes due to hilly
terrain.• Blockages in WLL/GSM coverage by hilly peaks. • Diffi culty in getti ng cable laying permissions from state government agencies. It is proposed
that a cable duct provision should be made while making any new road project ,the cost of this duct may apporti oned to BSNL It is also proposed that state can give laying permission in lieu of their B/W requirements.
• Unavailability of reliable power163

MEGHALAYA STATE DEVELOPMENT REPORTMEGHALAYA STATE DEVELOPMENT REPORT
6.9.c. Postal Infrastructure:
In northeast India, the positi on of Meghalaya in respect to availability of post offi ce in villages has increased from 3 percent to 8 percent from 1971 to 2000. In comparison to other states in the region, the availability of this facility in Meghalaya is very poor (table 6.15). Tripura with 81 per cent of villages having post offi ces has an excellent facility. Even states like Manipur and Nagaland have much bett er postal facility.
Tables 6.13 refl ect the growth in postal and telecommunicati on sector in Meghalaya.
Table 6.13: Growth in postal & telecom sectors in Meghalaya
YearGeneral
post offi ceHead post
offi ceSub post
offi ceBranch
post offi ceTelephoneexchange
Public call offi ce
Telephone connecti ons
1984-85 1 1 59 375 2 75 4707
1994-95 1 1 64 413 38 857 14558
1999-00 1 1 62 419 61 512 38146
2001-02 1 1 64 424 74 655 46283Source: Directorate of Economics and Stati sti cs, Govt. of Meghalaya
Table 6.14: Postal infrastructure in northeast IndiaState Populati on under one post
offi ceArea under one post offi ce
sq/km/post offi ce
1981 1991 2000 1981 1991 2000
Arunachal Pradesh 3292 3378 2856 435.2 329.69 278.07
Assam 5972 5925 5696 31.97 20.84 20.04
Manipur 2924 3020 2648 46.0 36.9 32.27
Meghalaya 3196 3862 3613 53.8 49.16 45.99
Mizoram 1968 2030 1724 84.01 62.37 52.74
Nagaland 3638 4537 3788 77.59 61.86 51.24
Tripura 3416 4122 3847 17.43 15.74 14.6
All India 4906 5675 5462 23.62 22.1 21.26
Source: 10th Plan document, Planning Commission, GOI.
Table 6.15: Percentage of inhabited villages having post and telegraph offi ce in Northeast India
State Post offi ces Post and telegraph offi ces
1971 1991 2000 1971 1991
Arunachal Pradesh NA NA NA NA NA
Assam 7.38 12.33 14.69 0.82 0.82
Manipur 8.73 13.02 29.19 0.10 NA
Meghalaya 2.57 5.38 8.22 0.24 0.62
Mizoram NA NA NA NA NA
Nagaland 6.87 12.83 26.44 0.21 0.16
Tripura 5.10 57.89 81.28 0.23 4.68
All India 14.36 22.48 23.36 0.92 2.38
Source: State of the Indian Farmers (2004).
164
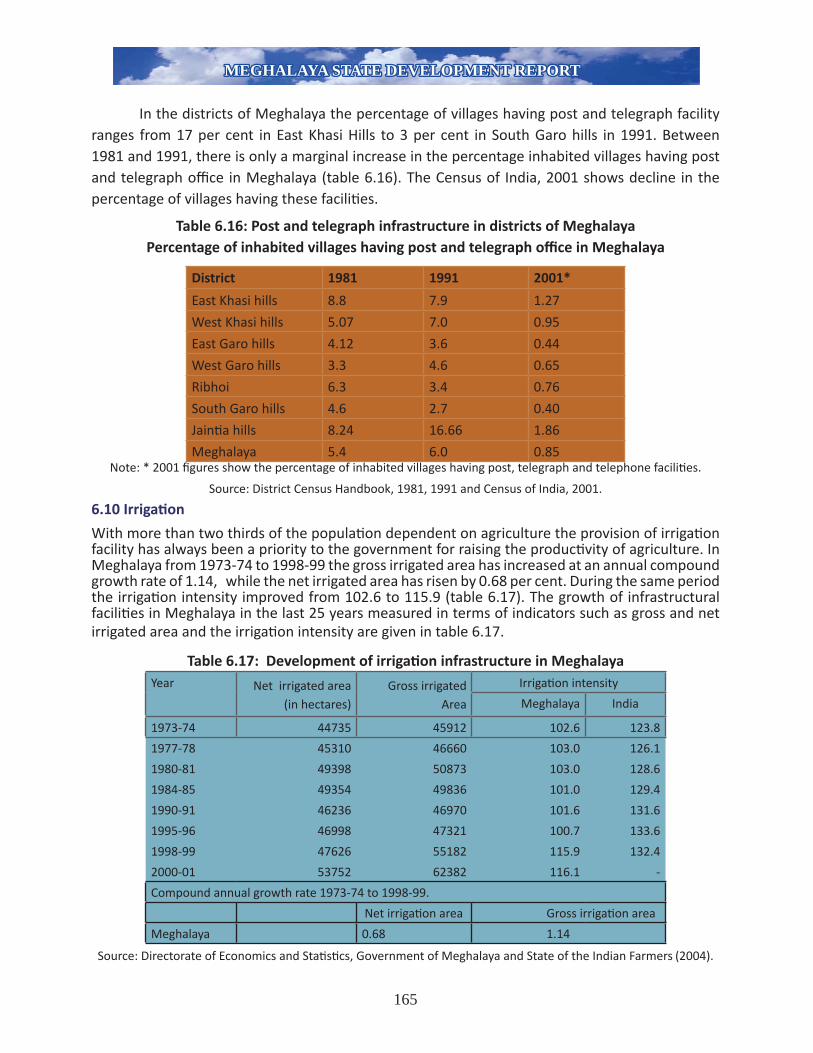
MEGHALAYA STATE DEVELOPMENT REPORTMEGHALAYA STATE DEVELOPMENT REPORT
In the districts of Meghalaya the percentage of villages having post and telegraph facility ranges from 17 per cent in East Khasi Hills to 3 per cent in South Garo hills in 1991. Between 1981 and 1991, there is only a marginal increase in the percentage inhabited villages having post and telegraph offi ce in Meghalaya (table 6.16). The Census of India, 2001 shows decline in the percentage of villages having these faciliti es.
Table 6.16: Post and telegraph infrastructure in districts of MeghalayaPercentage of inhabited villages having post and telegraph offi ce in Meghalaya
District 1981 1991 2001*
East Khasi hills 8.8 7.9 1.27
West Khasi hills 5.07 7.0 0.95
East Garo hills 4.12 3.6 0.44
West Garo hills 3.3 4.6 0.65
Ribhoi 6.3 3.4 0.76
South Garo hills 4.6 2.7 0.40
Jainti a hills 8.24 16.66 1.86
Meghalaya 5.4 6.0 0.85Note: * 2001 fi gures show the percentage of inhabited villages having post, telegraph and telephone faciliti es.
Source: District Census Handbook, 1981, 1991 and Census of India, 2001.
6.10 Irrigati on
With more than two thirds of the populati on dependent on agriculture the provision of irrigati on facility has always been a priority to the government for raising the producti vity of agriculture. In Meghalaya from 1973-74 to 1998-99 the gross irrigated area has increased at an annual compound growth rate of 1.14, while the net irrigated area has risen by 0.68 per cent. During the same period the irrigati on intensity improved from 102.6 to 115.9 (table 6.17). The growth of infrastructural faciliti es in Meghalaya in the last 25 years measured in terms of indicators such as gross and net irrigated area and the irrigati on intensity are given in table 6.17.
Table 6.17: Development of irrigati on infrastructure in MeghalayaYear Net irrigated area
(in hectares)Gross irrigated
Area
Irrigati on intensity
Meghalaya India
1973-74 44735 45912 102.6 123.8
1977-78 45310 46660 103.0 126.1
1980-81 49398 50873 103.0 128.6
1984-85 49354 49836 101.0 129.4
1990-91 46236 46970 101.6 131.6
1995-96 46998 47321 100.7 133.6
1998-99 47626 55182 115.9 132.4
2000-01 53752 62382 116.1 -
Compound annual growth rate 1973-74 to 1998-99.
Net irrigati on area Gross irrigati on area
Meghalaya 0.68 1.14
Source: Directorate of Economics and Stati sti cs, Government of Meghalaya and State of the Indian Farmers (2004).
165

MEGHALAYA STATE DEVELOPMENT REPORTMEGHALAYA STATE DEVELOPMENT REPORT
The percentage of gross irrigated area to gross sown area has improved for all the states in the region but there is considerably degree of variati on. In Mizoram the percentage of gross irrigated to gross sown area is 8 percent, while for Manipur it is 39 per cent. In Meghalaya only 18 per cent of gross sown area has irrigati on facility (Table 6.18). There is also vast potenti al in minor irrigati on in both surface and ground water in the region. However, very small percentage of the potenti al has been uti lized. The comparison of the irrigati on facility in the districts of Meghalaya has not been undertaken due to lack of data.
Table 6.18: Net and gross irrigated area and irrigated holdingsState Net irrigated are as
percentage of net sown area
1994-97
Gross irrigated are as percentage of gross
sown area 1994-97
Percentage of holdings receiving irrigati on.
1991
Arunachal Pradesh NA 14.8 NA
Assam 20.67 14.54 6.34
Manipur 46.43 39.28 45.77
Meghalaya 21.69 18.52 37.43
Mizoram NA 8.3 NA
Nagaland 29.01 30.22 18.31
Tripura 12.64 13.44 11.32
All India 37.74 38.16 46.52Source: State of the Indian Farmers (2004).
6.11 . Bio resources related Infrastructure: These needs to be strengthened. Government of India should facilitate the entry of established Lab/Commercial organisati on for the inventory, conservati on/management and resource based acti viti es. This could further be leveraged due to the presence of ICAR, NEHU,BSI, NBPGR, BRDC etc. in Shillong, ICAR or NEHU may be assigned the task of focusing on Bio resources development and investments in high and Research oriented infrastructure, Bioregulati ons and inventorisati on.
6.12. BANKING4
The existence of a well-developed banking infrastructure is essenti al for the growth of all sectors of the economy. Accessibility to fi nance is key to the growth of any economic acti vity, especially in the region where saving and thrift culture has not traditi onally been strong. The Shillong Cooperati ve Town Bank Ltd. was established as the fi rst credit cooperati ve society in the North Eastern Region on 03-09-1904. The banking industry started with the considerable presence of the State Bank of India and its branches, more for the State Government and its employees on behalf of the Reserve Bank of India, than for retail banking and the people in general. At present, Scheduled Commercial Banks (20 insti tuti ons), one Regional Rural Bank and one Cooperati ve Apex Bank besides 5 private banks provide formal credit in Meghalaya. The total number of branches or offi ces of scheduled commercial banks and of Regional Rural Bank has increased from 18 in 1974 to 189 in 2006. The Meghalaya State Co-operati ve Apex Bank Ltd. (MCAB) is the only State
4 Dr. Shreeranjan 2006: Credit Related Issues in Meghalaya
166

MEGHALAYA STATE DEVELOPMENT REPORTMEGHALAYA STATE DEVELOPMENT REPORT
Cooperati ve Bank of Meghalaya. The number of its branches has increased from 27 in 1991 to 40 as on 31-03-2005 (Shreeranjan, 2006).
Table 6.19: Growth of bank offi ces in Meghalaya, 1983 to 2006
YearsState Bank
of IndiaNati onalised
BanksRegional
Rural Bank
Other scheduled
commercial banks
Meghalaya State Co-
operati ve Apex Bank
Total
1983 48 29 11 3 - 911991 77 36 50 3 27 1932001 86 42 51 1 37 2172005 86 43 51 2 40 222
Source: Credit Related Issues in Meghalaya, Shreeranjan, 2006, p. 91.
The availability of banking facility in the northeast region shows that while there has been an increase in the number of bank branches in all the states, the average populati on served per bank branch has increased for some of the states. For Meghalaya the same has improved during the period 1981 to 2004 (Table 6.20). The average populati on per bank offi ce in the state in 2006 was 10342.
Table 6.20: Area wise distributi on of scheduled commercial bank branches in Northeastern States
StateTotal branches
Average populati on (in 000) per bank offi ce/branch
Credit-Deposit Rati o
1981 2004 1981 2004 March 2004Arunachal Pradesh - 67 21 16 25.4
Assam 507 1221 29 22 32.5Manipur 37 77 29 31 34.5
Meghalaya 59 180 17 13 30.6Mizoram 12 78 12 11 39.3Nagaland 40 69 13 28 17.9
Tripura 85 179 18 18 29.2Source: Basic Stati sti cs of NER (1982 & 2006), North Eastern Council, Shillong
Another indicator that is also linked to the development of banking infrastructure is the credit and deposit (C.D.) rati o. The northeastern region has the lowest credit deposit rati o in the country. For Meghalaya the C.D. rati o has decreased over the years. In 2002 the credit deposit rati o for the state was only 26 per cent, far below the nati onal average of 58 per cent. The aggregate C.D. rati o of Meghalaya has improved to 30.6 percent as on 31-03-2004.
Meghalaya has 0.27 percent of the total scheduled commercial banks in the country, which is indicati ve of the poor status of banking faciliti es. The Regional Rural Bank has its presence in three of the seven districts. On the other hand, the state Cooperati ve Bank has its presence in all the seven districts. During the decade 1994-2004, the number of branches of scheduled commercial banks increased by only 2.25 percent, which is too marginal to make any eff ecti ve dent in rural
167

MEGHALAYA STATE DEVELOPMENT REPORTMEGHALAYA STATE DEVELOPMENT REPORT
access to formal credit. However, during the same period, MCAB showed an increase of 21 percent in the number of its branches. Experience has shown that easy accessibility of banks to people can not only inculcate and improve banking habits but also substanti ally increase credit business. In Meghalaya, around the late 1970s, about 36 percent of the bank branches were located in the city of Shillong. However, by the end of March 2005, out of the total number of 222 branches of various banking insti tuti ons, 54 branches were serving the city of Shillong and the surrounding areas. This means that 25 percent of the bank branches in Meghalaya serve just one city. Moreover, East Khasi Hills is the well-banked district with 90 branches out of 223 in 2006. The regional spread of bank branches also appears to be skewed and lopsided. The Garo Hills region of the state having 37 percent of the populati on and 50 percent of the net sown area, has only 28 percent of the bank branches.
From the above analysis, it is clear that banks have functi onal and locati onal urban bias. Except for SBI, MCAB and to some extent RRB branches, all other banks have their presence only in East Khasi Hills, and that too, in Shillong Town (Shreeranjan, 2006, pp. 92-93).
Table 6.21: Banking infrastructure in the districts of Meghalaya, 2006
DistrictPercentage of
Populati onNumber of branches
Percentage of branches
Populati on coverage per
branchEast Khasi Hills 29 90 40 7344West Khasi Hills 13 23 10 12788Jainti a Hills 13 29 13 10200Ri Bhoi 8 18 8 10711East Garo Hills 11 18 8 13753West Garo Hills 22 38 17 13574South Garo Hills 4 7 3 14158Meghalaya 100 223 100 10342
Source: Credit Related Issues in Meghalaya, Shreeranjan, 2006, p. 93.
6.13. Status of rural infrastructure in Meghalaya - A fi eld survey 5
In 2001 a study funded by NCAER was undertaken to fi nd out the conditi on of infrastructural faciliti es in rural area of Meghalaya. For this purpose 81 villages were selected for the fi eld study from East Khasi Hills and Jainti a Hills. The study used PRA methods to get the people’s parti cipati on in rati ng the conditi ons of the roads, telephone, electricity, and water and sanitati on faciliti es and in suggesti ng measures for improvement. Summary of the results of the fi eld study are given below.
5 MHDR(2008): Govt of Meghalaya, Shreeranjan ed
168

MEGHALAYA STATE DEVELOPMENT REPORTMEGHALAYA STATE DEVELOPMENT REPORT
Table 6.22: Rural infrastructure in Meghalaya – Results from fi eld survey
Infrastructure Percentage Villages with tarred internal roads 11 %Villages with tarred external roads 51 %Villages with telephone connecti on 20 %Villages with electricity connecti on 74 %Villages with piped water supply 35 %Villages with drainage systems 38 %Villages with latrines 59 %
Source: MHDR 2008, NCAER Survey
The high percentage of villages having tarred external roads is because 16 of the 81 surveyed villages are from Mylliem block6 , which because of its proximity with the state Shillong have excellent roads. If we exclude this block, then the percentage of village shaving tarred external roads comes down to 17 per cent only. In many of the villages with tarred external roads, the conditi ons of these roads are found to be very bad. While the percentage of villages with telephone is only 20 per cent, in most cases the telephones at the villages are generally out of order for long periods of ti me. Public telephone offi ce or PCO that is a common sight in most part of the country can hardly be seen in the rural areas of Meghalaya. Just 4 out of the 81 villages had public telephone facility. Most of the villages did have telephone towers installed by the government for providing telephone connecti on. However, this project has been abandoned halfway in many of the surveyed villages. While the percentage of villages electrifi ed is 74 per cent, which is above the state average of 48 per cent, in most cases the villagers have reported not getti ng quality and regular power supply, especially during the monsoon. The provision of safe drinking water facility and sanitati ons are also grossly inadequate in the villages in the state (table 6.22).
6.14. Infrastructure Index 7:The MHDR 2008 had made assessment of Infrastructure Index as indicated below.
Table 6.23: Infrastructure index and States Ranking
States Index Value RankNagaland 0.39 1Tripura 0.37 2Manipur 0.35 3Mizoram 0.33 4Assam 0.30 5Meghalaya 0.23 6Arunachal Pradesh 0.22 7
Source: MHDR 2008 It is clear from this index that Meghalaya is lagging behind most of the other northeastern states on the indicators of infrastructural faciliti es used above. The above four infrastructure variables used in preparing the index represent four of the core economic infrastructures. However,
6 Mylliem block also includes large part of Shillong city itself.7 MHDR (2008): Govt of Meghalaya, Shreeranjan ed.
169

MEGHALAYA STATE DEVELOPMENT REPORTMEGHALAYA STATE DEVELOPMENT REPORT
this index has been prepared without taking in to considerati on Railway infrastructure, Water transport, posts and telegraphs faciliti es and telecommunicati on infrastructure. The ranking may change, if these infrastructural faciliti es are included in the constructi on of this index. The positi on of Assam will defi nitely improve if railway infrastructure is included.
Table 6.24: Changes in availability of selected infrastructure inMeghalaya vis-a-vis India
Infrastructural indicators Indicator value Indicator value
Year Meghalaya India Year Meghalaya India
Surfaced road per square km. 1982 12 22 1997 17 42
Villages electrifi ed (%) 1980 14 45 2001 46 73
Area under one post offi ce (sq Km) 1980 54 24 2000 46 21
Net irrigated are to net culti vated area (%)
1981 26 28 1994-97 22 38
Credit deposit rati o (%) 1981 20 68 1997 14 57Source: MHDR 2008
The above analysis shows that in respect of road, postal, irrigati on and banking infrastructures, the positi on of Meghalaya with respect to the Indian average has deteriorated in the last twenty years; which is a matt er of concern. The deteriorati on is very sharp in irrigati on sector. It is only in respect of the village electrifi cati on that the relati ve positi on has improved, although it is sti ll below the Indian average.
The study of the state of infrastructure in Meghalaya clearly refl ects the poor status of the economic infrastructure. While the infrastructure of the states in the northeast is generally poor compared to the rest of the country, that of Meghalaya is much worse compared to some of its neighboring states. According to the composite infrastructure index devised by the Eleventh Finance Commission for 1999, Meghalaya has been ranked fi ft h from the bott om in terms of the availability of physical, social and insti tuti onal infrastructure; with states like Manipur, Tripura, Jammu & Kashmir and Arunachal Pradesh ranked lower than Meghalaya. The Twelft h fi nance commission prepared an index of infrastructure for the purpose of allocati on of resources among states. In their exercise they focus on concerns relati ng to the eff ect of infrastructure on the cost and quality of governance and more specifi cally the provision of public services. It prepared this index taking in to considerati on three important dimensions: power, communicati ons and transportati on. On the basis of this index, the seven north eastern states are in descending order ranked as given in Table 6.25.
Table 6.25: Twelft h Finance Commission Ranking of the North Eastern States by Infrastructure Index
States Rank
Tripura 1
Assam 2
Nagaland 3
Meghalaya 4
Mizoram 5
Manipur 6
Arunachal Pradesh 7
Source: MHDR 2008
170

MEGHALAYA STATE DEVELOPMENT REPORTMEGHALAYA STATE DEVELOPMENT REPORT
Our analysis in MHDR 2008 placed Meghalaya at the 6th positi on in the ranking of 7 North Eastern states. Further, in the last twenty years the gap in the relati ve availability of some of key infrastructural faciliti es like road, postal, irrigati on and banking in Meghalaya compared to rest of the country has widened.
At the district level, the availability of infrastructure is skewed. East Khasi Hills and Jainti a Hills districts are comparati vely well off in terms of availability of both economic and social infrastructure. In case of the rural areas the fi eld study conducted in 2001 shows the poor state of rural infrastructure in Meghalaya. Key infrastructural faciliti es are not available in a large number of villages. Also, wherever these infrastructural faciliti es are available, their quality is poor. In Meghalaya, the private sector has played a pivotal role in the fi eld of health and educati on. Now, with the entry of private sector in the infrastructure sector being encouraged, the role played by the private sector in providing social infrastructural faciliti es in the state of Meghalaya needs to be analysed.
6.15 Conclusion & Recommendati on: The task of bridging the socio economic infrastructure gap in the North East in general and specifi c to Meghalaya, is a challenge. The suggesti ons have been incorporated while dealing issues relati ng to various infrastructures. In additi on, it is imperati ve that the following steps be taken into account to achieve this task:-
(i) Promoti onal policies in various sectors to create enabling environment for investment.
(ii) Project and locati on specifi c Acti on Plan both by Central Ministries and State Government with defi ned commitments and ti me frame.
(iii) A road map and acti on plan frame work for PPP in select sectors such as Power, Health, Educati on, Tourism, IT, etc. is required.
(iv) Proacti ve delivery set up and building capaciti es across sectors in government insti tuti ons.
(v) A large investment by central government with mission and task force/ dedicated agencies based acti on and implementati on frame work.
(vi) To facilitate faster infrastructure development – one common legislati on to facilitate infrastructure creati on of Public and Nati onal importance in NER–acquisiti on of land /clearances from a single window/incenti ve based contract and project completi on with PPP models and other modaliti es may be worked out.
171

MAIN DAM
GREATER SHILLONG WATER SUPPLY SCHEME
INTAKE POINT

STATE PWD ROAD
R.C.C Br. No. 3/5 ON N.E.C. BYE PASS ROAD
Steel works in Super-Structure

MYNTDU LESHKA HYDRO ELECTRIC
PROJECT(2 X 42 MW)

TUNNEL WORK UNDER CONSTRUCTION
PENSTOCK
POWER HOUSE
MEGHALAYA STATE DEVELOPMENT REPORTMEGHALAYA STATE DEVELOPMENT REPORT
CHAPTER –VII
RURAL DEVELOPMENT IN MEGHALAYA
7.0. Development in the Rural Sector: Meghalaya is predominantly a rural State. The rural populati on in Meghalaya is 1,864,711, thereby consti tuti ng about 80.4 percent of the total populati on of Meghalaya i.e. 2,318,822. This is higher than the all India fi gures of 72.2 percent. Rural development is probably the biggest challenge before planning and policy makers in India today. Rural Meghalaya is marked by high incidence of poverty, illiteracy, unemployment poor infrastructure and absence of basic faciliti es. Despite the eff orts made in the past few decades, rural poverty in Meghalaya conti nues to be an issue of great concern. The failure in improving the rural scenario is perhaps att ributable less to formulati on of appropriate polices and more to their implementati on. The present approach in rural development interventi on involves initi ati ves towards improving the lot of people through direct self-employment programmes on one hand and indirect wage employment and infrastructure development programme on the other. In additi on there are programmes for shelter, old age, desti tutes, watershed and wasteland development programme. The extent to which these programmes have contributed to poverty reducti on needs to be examined on the basis of analysis of actual implementati on of the programme and their impact in the specifi c locales.
Rural areas in Meghalaya are characterized by limited opportuniti es, low level of skill development, poor infrastructure base and ineff ecti ve decentralized decision-making capability, which in turn aff ects the quality of Governance. Moreover, the rugged terrain of the state, a low percentage of culti vable land, scatt ered nature of the sett lements have presented serious problems for necessary interventi ons in terms of infrastructure development. A refl ecti on of these can be seen in the incidence of poverty of the state esti mated by various agencies from ti me to ti me. As per the esti mate of Planning Commission, 33.9 percent of the total populati on of the state was below the poverty line in the year of 1999-2000, as against the nati onal fi gure of 26.1 percent. The department of Community and Rural Development (C&RD) on the instructi on of the Government of India (GOI) conducted the Below Poverty Line (BPL) survey in the state in 2002 and fi nalized it in 2008. The percentage of the rural BPL families of the state was 54 percent during the 9th Plan. During the 10th Plan (2002 survey fi nalized in 2008) the percentage of rural BPL families is 48.90 percent in the state.
7.1. Current level of development – some key indicators
The current level of development in the rural areas of the state can be viewed from a variety of indicators. The present secti on considers some of them such as food grain producti on, value of agricultural product per agricultural worker, rural road connecti vity, rural employment and ameniti es e.g. types of housing, electricity connecti on, availability of latrines, sources and locati on of drinking water etc.
173

MEGHALAYA STATE DEVELOPMENT REPORTMEGHALAYA STATE DEVELOPMENT REPORT
7.1.1 Agriculture:
The Meghalaya economy is basically agrarian whereby 70 percent of the populati on’s livelihood is dependent on agriculture. However, the contributi on of this sector to the economy of the state is around 22 percent of the NSDP. This refl ects that the majority of the people dependent on agriculture are living close to subsistence level and a large percentage of them are below the poverty line. As such, proper management for development of the crop husbandry / horti culture and allied sector is vital for the healthy growth of this primary sector. Enhancement of food grain producti on in the hill state of Meghalaya is constrained by its topography making only about 12 percent of its geographical area suitable for culti vati on of crops for food grain producti on. However, improvement of producti on to the extent possible by way of more coverage and improvement of irrigati on methods, use of HYV seeds, crop rotati on, judicious applicati on of ferti lizers and pest control taken up needs to be sustained in light of the fact that much of the paddy land is being degraded due to indiscriminate and unscienti fi c mining. The producti on of food grains during 2006-07 was 269.93 thousand tones and the anti cipated achievement for 2007-08 is 291.00 thousand tonnes By the end of the 11th Plan, the food grain producti on is expected to touch 379.00 thousand tonnes. The target during 2008-09 is to produce 291.00- thousand tonnes of food grains.
The goal for the 11th Plan was laid out to usher in a paradigm shift from the implementati on of omnibus schemes widely dispersed all over the seven districts with dissipati ng eff ect on scare resources, to a more focused approach based on cluster and backed by an integrated package of practi ces. The strategy would be to consolidate traditi onal strengths and past gains and at the same ti me capitalize on emerging opportuniti es.
Value of agricultural product per agricultural worker
The agricultural output in value terms per agricultural worker has been esti mated at Rs. 15752 for the state as a whole during 2005-06. However, there exists a wide inter-district variati on in the value of agricultural output. It is the highest in East Khasi Hills with Rs. 37,095 followed by South Garo Hills with Rs. 19,916 and West Garo Hills with Rs. 18,403. All the other districts are lying below the State’s average fi gure. It is found that the districts with a high proporti on of agricultural labourers to total workers have a lower value of agricultural product in per agricultural worker. This situati on clearly indicates the prevalence of pre-capitalist mode of producti on where agricultural labourers are less prominent in the contributi on to producti on.
174

MEGHALAYA STATE DEVELOPMENT REPORTMEGHALAYA STATE DEVELOPMENT REPORT
Table 7.1. Value of Agricultural product per Agricultural Worker
District
Value of agricultural
output (Rs. In lakh)**
Agricultural worker*
Value of output per agricultural
worker (Rs.)
Proporti on of agricultural
labourer to total worker
East Garo hills 9718 89519 10855 12.1East Khasi hills 28470 76748 37095 13.3Jainti a hills 9059 96402 9397 28.6Ri Bhoi 8040 68217 11785 18.4South Garo hills 6978 35037 19916 12.6West Garo hills 28067 152508 18403 16.4West Khasi hills 8935 111739 7996 23.3Meghalaya 15752 12.54
Source: Directorate of Economic and Stati sti cs, Meghalaya
*Sum total of culti vator and agricultural workers (2001 census). **At constant (1999-2000) prices
7.1.2. Road Connecti vity:
Good road connecti vity for habitati ons, parti cularly in rural areas with sub divisional towns and district headquarters, is oft en the primary means of enhancing the eff ecti veness of public eff ort directed at providing basic health and educati onal services as well as infrastructure support for producti on, trade and commerce at the village level. In many cases, parti cularly in sparsely populated areas and towns with large hinterland, good road connecti vity may help make these areas self suffi cient and altogether obviate the need for public provisioning of some of these services in each and every village. At the same ti me it will help forge durable economic linkage of such habitati ons with the rest of the economy. Road connecti vity is therefore a useful indicator of “inclusionary” aspect of development process and, accessibility, perhaps reach of the market as well. It is parti cularly relevant in the context of Meghalaya where over 80 percent of populati on conti nue to live in rural areas and in which over 55 percent of villages with populati on of less than 1000 are yet to be connected. This has a signifi cant bearing upon the state of rural development in Meghalaya, as the majority of villages have a populati on of less than 1000. The following table shows the positi on of the state in terms of road connecti vity.
Road coverage in the table refers to all categories of roads (both surfaced and un-surfaced) including NH, SH, Major district roads, other district roads and rural roads.
175

MEGHALAYA STATE DEVELOPMENT REPORTMEGHALAYA STATE DEVELOPMENT REPORT
Table 7.2 Percentage of villages connected by road
StatePopulati on less than 1000
Populati on between 1000 and 1500
Populati on above 1500
1991-92 1994-95 1996-97 1991-92 1994-95 1996-97 1991-92 1994-95 1996-97
Meghalaya 46.76 49.49 44.51 100 100 86.49 100 100 64.29
All India 36.52 37.45 49.18 72.32 76.54 74.58 89.82 91.72 78.04Source: Meghalaya Human Development Report (2008)
Inheriti ng a road length of 2786.68 kms with a road density of 12.42 km/100 sq. km from Assam in 1970, at the end of the 10th Plan period the state had achieved a total road length of 8221.68 kms with a road density of 36.66 km/100 sq. km. The road density is anti cipated to further improve to 36.93 km/100 sq. km with a total road length of 8919.68 kms by the end of 31st March 2008. The table below indicates the progress of achievement from the 8th plan period to the end of the 10th plan period with an anti cipated achievement by 31st March, 2008:
Table 7.3. Progress of Achievement under Road Sector up to 2007-08
Sl.No.
Plan Period endingTotal road
Length Achieved (cum.)
Of which Road Density (Km/100 Sq.
Km.)Blacktopped
RoadGravelled
Road1. Eight Plan (1192-1997) 6707 3004 3703 29.902. Ninth Plan (1997-2002) 7553 3571 3982 33.673. Tenth Plan (2002-07) 8221.68 5159 3062.03 36.664. Eleven Plan (2007-2011)
Anti cipated for 2007-088919.68 NA NA 36.93
Source: Meghalaya Plan Supplement, 2008-09
RURAL ROADS (PMGSY) UNDER BHARAT NIRMAN
The PMGSY was launched on 25th December 2000 as a fully funded Centrally Sponsored Scheme (CSS) of the Ministry of Rural Development which aimed to provide road connecti vity in rural areas of the country. The Programme envisages connecti ng all habitati ons with a populati on of 500 persons and above (250 persons and above in respect of Hill States, Tribal and Desert areas).
Physical and fi nancial progress under PMGSY
The total fund released by the Ministry of Rural Development up to 31st March 2008 was Rs. 123.17 crore against which, the expenditure was Rs. 125.74 crore. The expenditure includes Rs.6.26 crore against the sancti oned amount of Rs. 39.62 crore for Phase IV, which is yet to be released. The state PWD being the nodal department for PMGSY is sti ll working out 2004-05/-06 schemes. The State PWD needs to put itself in full gear to bridge its lags of 3-4 years. This would
176
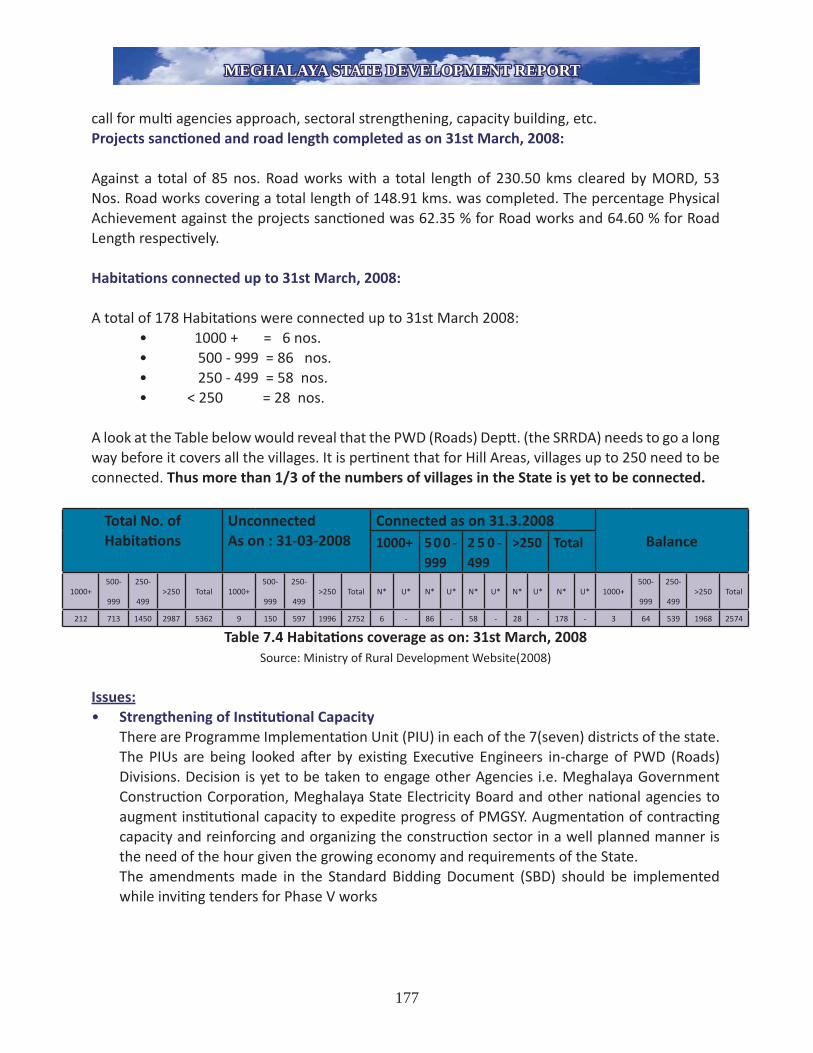
MEGHALAYA STATE DEVELOPMENT REPORTMEGHALAYA STATE DEVELOPMENT REPORT
call for multi agencies approach, sectoral strengthening, capacity building, etc. Projects sancti oned and road length completed as on 31st March, 2008:
Against a total of 85 nos. Road works with a total length of 230.50 kms cleared by MORD, 53 Nos. Road works covering a total length of 148.91 kms. was completed. The percentage Physical Achievement against the projects sancti oned was 62.35 % for Road works and 64.60 % for Road Length respecti vely.
Habitati ons connected up to 31st March, 2008:
A total of 178 Habitati ons were connected up to 31st March 2008: • 1000 + = 6 nos.• 500 - 999 = 86 nos.• 250 - 499 = 58 nos.• < 250 = 28 nos.
A look at the Table below would reveal that the PWD (Roads) Deptt . (the SRRDA) needs to go a long way before it covers all the villages. It is perti nent that for Hill Areas, villages up to 250 need to be connected. Thus more than 1/3 of the numbers of villages in the State is yet to be connected.
Total No. of Habitati ons
UnconnectedAs on : 31-03-2008
Connected as on 31.3.2008Balance1000+ 5 0 0 -
9992 5 0 -499
>250 Total
1000+500-
999
250-
499>250 Total 1000+
500-
999
250-
499>250 Total N* U* N* U* N* U* N* U* N* U* 1000+
500-
999
250-
499>250 Total
212 713 1450 2987 5362 9 150 597 1996 2752 6 - 86 - 58 - 28 - 178 - 3 64 539 1968 2574
Table 7.4 Habitati ons coverage as on: 31st March, 2008Source: Ministry of Rural Development Website(2008)
Issues:• Strengthening of Insti tuti onal Capacity There are Programme Implementati on Unit (PIU) in each of the 7(seven) districts of the state.
The PIUs are being looked aft er by existi ng Executi ve Engineers in-charge of PWD (Roads) Divisions. Decision is yet to be taken to engage other Agencies i.e. Meghalaya Government Constructi on Corporati on, Meghalaya State Electricity Board and other nati onal agencies to augment insti tuti onal capacity to expedite progress of PMGSY. Augmentati on of contracti ng capacity and reinforcing and organizing the constructi on sector in a well planned manner is the need of the hour given the growing economy and requirements of the State.
The amendments made in the Standard Bidding Document (SBD) should be implemented while inviti ng tenders for Phase V works
177

MEGHALAYA STATE DEVELOPMENT REPORTMEGHALAYA STATE DEVELOPMENT REPORT
• Forest and environmental clearance The State has not faced any problem related to forest and environmental clearance. Timely
acti on for forest clearance would be generally followed when the necessity arises.
• Availability of private land for road constructi onLand in Meghalaya is mostly privately owned and hence cooperati on of the land owners is very essenti al. The SRRDA is trying its best to obtain land free of cost.
• Availability of constructi on materials and high royalty chargesMost of the PMGSY works taken up so far are un-surfaced (without metalling and blacktopping) and hence requirement of stone aggregates is not much. The forest royalty is generally litt le higher than 2.5 percent. But considering all the items of works up to blacktopping stage, the proporti on of forest royalty may go as high as up to 9 percent. The rates of forest royalty in Meghalaya are as follows:-Stone aggregates. Rs. 80.00 /m3Sand / Blindage mmaterials Rs. 40.00 /m3
7.1.3. Quality of housing:
The quality of housing in the rural areas of Meghalaya indicates that majority of household live in kuccha houses and a substanti al proporti on reside in semi-pucca houses. However, only 14.3 percent of households live in pucca houses. The proporti on of pucca houses almost doubled in 2001 over 1991 and proporti on of kuccha houses decreased substanti ally during this period. However, this analysis in case of Meghalaya, has to be approached with cauti on as what Census defi niti ons, as Kuccha houses may actually be durable, eco-friendly houses made of natural material such as bamboo or its derivati ves.
Table 7.5 Distributi on of rural household by type in percentage
State Pucca Kuccha Semi-puccaYear 1981 1991 2001 1981 1991 2001 1981 1991 2001Meghalaya % 9.33 7.03 14.3 62.50 72.12 47.5 28.17 20.86 38.2
Source: Census of India
Distributi on of rural households by the number of dwelling rooms show that nearly 33 percent of rural households live in dwelling units with two rooms and another 25 percent in one room houses. Five percent of households do not have any exclusive room to live. Only 37 % of rural households live in dwelling units with more than two rooms. There are however inter-district variati ons as shown in the table below.
178

MEGHALAYA STATE DEVELOPMENT REPORTMEGHALAYA STATE DEVELOPMENT REPORT
Table 7.5(a) Distributi on of Rural Households by number of Dwelling Rooms (%) 2001
State/ District
No exclusive
room %
One room
%
Two rooms
%
Three rooms
%
Four rooms
%
Five rooms
%
Six rooms and
above
West Garo Hills 7 35 36 17 3 1 1East Garo Hills 3 31 43 17 4 1 1South Garo Hills 3 21 43 26 5 1 1West Khasi Hills 4 22 33 21 10 5 5Ri-Bhoi 4 17 32 26 11 5 5East Khasi Hills 7 23 30 20 11 5 4Jainti a Hills 3 15 24 19 16 11 13Meghalaya 5 25 33 20 9 4 4
Source: Table on Ameniti es; Census of India 2001
It may be menti oned that every year about Rs 6-7 crore worth of CGI sheets (3 bundle each) is given under the Rural Housing scheme of Housing department supplemented also by SRWP (by some of the MLAs).
Rural Housing Indira Awas Yojna (IAY)
The main aim of this scheme is to provide shelter to SC/ST and freed bonded labourers living below the poverty line free of cost. The assistance provides Rs. 27,500/- (now revised to Rs 38500) for constructi on of new houses and Rs.12,500/- (now revised to Rs 15000/-) for Upgradati on or conversion of unserviceable kutcha houses to pucca /semi pucca houses. Fund for the programme is shared by Central and State government in the rati o of 75:25. (now 90:10).
Cumulati ve fi nancial and physical achievement during the last 5 Years from 2003-04 to
2007-2008:
A. New constructi on:
• The cumulati ve availability of fund during this period was Rs. 5604.13 lakhs, against which the expenditure incurred was Rs. 4852.53 lakhs. • Percentage of achievement was 86.59 %.• The physical achievement during the period was a total of 21733 houses completed against the target of 31086 numbers of houses. • Percentage of achievement was 69.91 %.B. Upgradati on:• Total availability of Fund was Rs.1154.50 lakhs out of which Rs. 1026.00 was spent during the period.• The percentage of physical achievement was 88.91%.• Physical achievement during the period was 10165 houses upgraded against the target of 8126 Nos. of houses.• The percentage of achievement was 125 %.
179

MEGHALAYA STATE DEVELOPMENT REPORTMEGHALAYA STATE DEVELOPMENT REPORT
On the face of it, the progress appears sati sfactory. However, this hides the fact that many a ti mes most of the DRDAs have not been able to fully uti lise the allocated fund from the Govt. of India due to delay in submission of UCs. Many DRDAs have not claimed/ taken 2nd installments under the programme. There is also delay in selecti on of benefi ciaries and approvals or changes. The scheme also suff ers from its acceptance in the shape of cost norm, socio-customary requirements and local impediments.
The detailed year-wise progress of achievement of both schemes from 2003-04 to 2007-08 is indicated in the tables below:-
Table 7.6 ACHIEVEMENT UNDER lAY FROM 2003-04 TO 2007-08 NEW CONSTRUCTION
Sl. No. Year
Financial achievement(Rs. In lakhs )
Target (No. of houses)
Physical performance (No of houses constructed) Total fund available Fund uti lised
1 2003-04 1086.69 916.30 4821 43312 2004-05 1050.21 912.95 5076 43943 2005-06 1437.98 1265.55 3494 57754 2006-07 1153..22 1040.30 7467 40125 2007-08 876.03 717.43 10228 3221
TOTAL 5604.13 4852.53 31086 21733Source: Department of C. & R.D., Meghalaya.
Table 7.7 ACHIEVEMENT UNDER lAY FROM 2003-04 TO 2007-08 UPGRADATION
Sl. No. Year
Financial achievement(Rs. In lakhs ) Target
(No. of houses)
Physical performance (No of houses constructed)
Total fund available
Fund uti lised
1 2003-04 249.81 231.20 2651 24162 2004-05 195.82 168.02 2791 19023 2005-06 317.90 295.92 2684 26474 2006-07 246.62 211.05 - 20865 2007-08 144.35 119.81 - 1114TOTAL 1154.50 1026.00 8126 10165
Source: Department of C. & R.D., Meghalaya.
180

MEGHALAYA STATE DEVELOPMENT REPORTMEGHALAYA STATE DEVELOPMENT REPORT
Progress of implementati on:1) Physical achievement:
Hilly tracts of land, high rainfall and limited working season combined with late receipt of funds under IAY hinder the achievement of the targets set by the government under the scheme. The delay in submission of UCs and Audit Report by DRDAs made the Govt. of India to hold up sancti on for the Second Installment of the scheme to many DRDAs. Hence targets could not be achieved. DRDAs are instructed from ti me to ti me to improve performance under IAY so that the set targets could be achieved in full. It may be suggested here that funds under the scheme should be released in one installment only at the beginning of the fi nancial year instead of fragmented installments at the fag end of the year. This perhaps will facilitate speedy implementati on of the scheme and achievement of the target in full. This scheme also requires rigorous monitoring, social audit and eff ecti ve vigilance.
2) Status of Permanent IAY Wait Lists:In Meghalaya 5 districts namely, Jainti a Hills, East Khasi Hills, West Garo Hills, West Khasi Hills and South Garo Hills have completed preparati on of Permanent IAY Wait List based on the draft BPL List 2002.The other two districts i.e. East Garo Hills and Ri-Bhoi are yet to complete the same. It is expected to complete preparati on of the Waiti ng Lists shortly.
3). Constructi on of Sanitary latrines:It has been the traditi on and habit of the people in Meghalaya to construct toilets at some distance from the dwelling unit. As a result constructi on of sanitary latrines along with the IAY house is not so popular in the State. Total Sanitati on Campaign (TSC) as a separate scheme (implemented by the PHE department) which is not included in the IAY scheme. Therefore, no fi nancial assistance from Total Sanitati on Campaign is allott ed to the IAY benefi ciaries for constructi ng latrine along with IAY house. Eff orts are being made to co-ordinate it in Urban / Rural Areas of the state.
4). Homestead plots:In Meghalaya, land does not belong to the government and is privately owned. Site for constructi ng a house constructi on is provided free of cost to the people by the village authority. The site is selected by the people alongwith the Headman of the village anywhere according to their will. Hence, it may be said that the house site is not a problem. However, cluster formati on and other innovati ve models could only happen if done with greater involvement and consultati on with the community, hitherto missing in rural development eff orts.
5). Nati onal rural housing and habitat policy: The policy is under the considerati on of the government. However, a wider consultati on and consultancy would be required in the matt er.
7.1.4.A. Supply of drinking water by source and locati on:About 62% of the rural households in Meghalaya have access to safe drinking water. However,
181

MEGHALAYA STATE DEVELOPMENT REPORTMEGHALAYA STATE DEVELOPMENT REPORT
there exist large inter-district variati ons. Only 12% of the total rural households have the source located within the premises, and another 56% have the source near the premises. The following Tables show the inter-district variati ons.
Table 7.8 Distributi on of rural households by source of drinking Water (%) 2001
State/ District TapHand Pump
Tube Well
WellTank, Pond, Lake
River, Canal
SpringAny
other
West Garo Hills % 10 5 7 40 10 5 20 3East Garo Hills % 19 0 0 36 1 3 40 1South Garo Hills % 27 0 0 9 2 13 47 2West Khasi Hills% 24 1 3 32 8 5 26 1Ri-Bhoi % 36 1 2 18 6 7 28 2East Khasi Hills% 46 2 2 22 7 5 15 1Jainti a Hills% 13 1 2 46 4 4 27 3Meghalaya 24 2 3 33 6 5 25 2
Source: Table on Ameniti es; Census of India 2001.
Table 7.9 Distributi on of Rural Households by Locati on of Drinking Water (%) 2001
District Within Premises (%) Near Premises (%) Away(%)West Garo Hills % 19 54 27East Garo Hills % 19 57 24South Garo Hills% 8 59 33West Khasi Hills % 4 52 44Ri-Bhoi % 12 51 37East Khasi Hills % 10 62 28Jainti a Hills % 6 53 41Meghalaya 12 56 32
Source: Table on Ameniti es; Census of India 2001
7.1.4.B. Sustainability of drinking water supply sources and systems
Provision of drinking water supply to all the rural habitati ons has been included as one of the components under Bharat Nirman Programme launched by Govt. of India. All the Not Covered (NC), Parti ally Covered (PC) Habitati ons and Quality Aff ected Habitati ons (Iron in Meghalaya) are to be provided with adequate safe water supply by 2008-09.
As per the survey conducted during 2003-04 (based on 2001 census) at the behest of Govt. of India and subsequently validated by IIPA, New Delhi, the state has 9326 Nos. of habitati ons, of which 2285 habitati ons (25%) are Not Covered (NC), 2849 habitati ons (31%) are Parti ally Covered (PC) and the balance 4192 habitati ons (44%) are Fully Covered (FC) habitati ons.
Consequent to coverage since validati on, the status of NC, PC habitati ons in the state as on 1.4.07 was as below:-
182

MEGHALAYA STATE DEVELOPMENT REPORTMEGHALAYA STATE DEVELOPMENT REPORT
Table 7.10 NC/PC/FC Habitati ons
Sl No. Type Number of habitati ons1 Not Covered(NC) 13252 Parti ally Covered(PC) 18843 Fully Covered(FC) 6117TOTAL HABITATIONS NC/PC/FC 9326
Source: Department of PHED, Meghalaya
Thus, 3209 (1325+1884) nos. of habitati ons were yet to be provided with water supply as on 1.04.07. Out of these 3209 nos. of habitati ons, 45 nos. were CAP 99 category (i.e. habitati ons identi fi ed during 1991-94 Survey & remained uncovered/parti ally covered). Govt. of India desired that these left out CAP 99 Habitati ons were covered on a priority basis. Number of quality (Iron) aff ected habitati ons in Meghalaya as per survey was 160 numbers. Consequently upon subsequent coverage, left out Iron aff ected habitati ons in Meghalaya as on 1.04.07 was 45 nos.Progress of Accelerated Rural Water Supply Programme (RGARWSP)
• Under State Sector there was an achievement of 894 nos. of villages against the target of 776. Hence the percentage of achievement is 115.20 %.
• Under the Central Sector there was an achievement of 1887 no of villages against the target of 1540. The percentage of achievement is 122.53 %
Table 7.11Physical Target Vs Achievement during Tenth Plan on Coverage of habitati ons under RWSP
Year
State Sector
(% age ) Achievement
Central Sector
(% age ) Achievement
Total
(% age )AchievementTarget
Achievement (No. of
villages)Target
Achievement (No. of
villages)Target
Achievement(No. of
villages)
2002-03
152 131 86.18 % 258 244 94.57 % 410 375 91.46 %
2003-04
150 151 99.33 % 260 246 94.61% 410 397 96.82 %
2004-05
154 197 127.92 % 263 222 84.41 % 417 419 99.52 %
2005-06
150 192 128 % 229 280 122.27 % 379 472 124.53 %
2006-07
170 223 131.17% 530 895 168.86 % 700 1118 159.71 %
TOTAL 776 894 115.20 % 1540 1887 122.53 % 2316 2781 120 % Source: Department of PHED, Meghalaya
183

MEGHALAYA STATE DEVELOPMENT REPORTMEGHALAYA STATE DEVELOPMENT REPORT
Expenditure under ARWSP during the 10th Plan (2002-03 to 2006-07)• Out of a total available fund of Rs 19682.45 crores, the expenditure is Rs. 14388.27 crores
which is 73.10 %
Table 7.12 Year-wise Expenditure under ARWSP during Tenth Plan (Rs in crore)
Year Total available fund Expenditure % Achievement2002-03 3089.12 1663.69 53.84 %2003-04 3237.21 2138.55 66.06% 2004-05 3520.66 2739.83 77.82 %2005-06 4003.78 3276.69 81.83 %2006-07 5831.68 4569.51 78.35 %
Total 19682.45 14388.27 73.10% Source: Department of PHED, Meghalaya
Sancti on and completi on of schemes under ARWSP (2002-03 to 2006-07)• Out of a total 1201 nos. of schemes sancti oned, 672 schemes have been completed which
is 55.95% and out of the total amount sancti oned which is Rs. 21703.6 lakhs, Rs.5817.35 which is 26.80%
Table 7.13 Year-wise sancti on and completi on of schemes under ARWSP
Year Sancti oned Completed AchievementNo. of
schemesAmount
(Rs. in lakhs)No. of
SchemesAmount
(Rs. in lakhs)% of schemes
completed2002-03 97 1058.20 123 694.25 126.80 %2003-04 93 1973.30 102 1196.60 109.67 %2004-05 63 2949.50 112 1038.60 177.77 %2005-06 325 6798.20 176 1583.90 54.15 %2006-07 623 8924.40 159 1304.00 25.52 %
Total 1201 21703.60 672 5817.35 55.95 % Source: Department of PHED, Meghalaya
Achievement during Annual Plan 2007-08 under PHEDFinancial:
• Original Approved outlay during 2007-08 for the sector was Rs.4700.00 lakhs, which was subsequently revised to Rs.5334.00 lakhs. As against this, the expenditure was Rs.5124.00 lakhs (96.06% of the approved outlay).
• The expenditure under State Sector Rural Water Supply Programme was Rs. 3984.00 lakhs and another Rs. 290.00 lakhs made available as loan from RIDF, totaling to Rs.4274.00 lakhs.
• Under Central Sector, the total available fund under ARWSP was Rs.6791.17 lakhs for 2007-08. As against this, the expenditure was Rs. 5661.16 lakhs.
184

MEGHALAYA STATE DEVELOPMENT REPORTMEGHALAYA STATE DEVELOPMENT REPORT
Physical:• 1205 nos. of NC/PC/Quality aff ected habitati ons were provided with adequate safe
water supply against a target of 1500 nos. of habitati ons (196 nos. under MNP, 998 nos. under ARWSP, 8 nos. under NLCPR and 3 nos. under Swajaldhara).
• Against the total of 1950 nos. schools without water supply as on 1.04.06, 726 & 149 nos. were provided with water supply under ARWSP with 50:50 funding by Central 7 State Govt. during 2006-07 & 2007-08 respecti vely.
• Thus a total nos. of 1075 schools are without drinking water supply faciliti es as on 31.03.08. This however does not take into considerati on new schools that have come up newly under Sarva Siksha Abhiyan (SSA) or other programmes.
• As on 31st March 2008 a total of 1075 schools are without drinking water supply faciliti es. This does not include new schools that have come up under the Sarva Siksha Abhiyan (SSA) or other programmes.
• Remaining schools would be provided with water supply in the next two years with funds under ARWSP & SSA.
With the passage of ti me, the yield of existi ng sources reduces or the sources dry up completely, populati on increase, existi ng schemes becomes non functi onal on att ainment of the design, new habitati ons grow up, life style improves with more demand for water . This gives rise to slippage of habitati ons and in Meghalaya also, the slippage of habitati ons has taken place. The fi gures of left out habitati ons as indicated above do not include habitati ons slipped back between 2005-06 to 2007-08.
Sustainability of sources/schemes is a major challenge in order to reduce the occurrence of slippage and is given highest priority by the Department. For ensuring sustainability of surface sources, the Department is also taking up schemes like check dams, rain water harvesti ng etc. As regards ground water, the depleti on positi on is not alarming in the State, since the ground water has been explored in a limited way in selected areas only in the State. It has come to light that people’s sense of ownership of water supply scheme is lukewarm. Very oft en the community demand water supply as a matt er of right, but hardly involves themselves in facilitati ng, monitoring the progress of the scheme or take upon themselves the duty of maintenance. Besides, the community has a role in protecti ng the catchments and the source from polluti on and unsustainably. Moreover, impediments are created during the implementati on. This calls for a policy shift of principle of polluters to pay, social agreement concept, as well accepted in NERCORMP livelihoods project to be enforced. Besides, this vital natural resource has to be managed well and sustained with the involvement and ownership of the community.
Drinking water in all rural schools:
The number of schools without drinking water supply faciliti es as per the record available with PHED as on 1.4.06 is 1950 nos. During 2006-07 and 2007, 726 & 149 nos. of Schools were respecti vely provided with water supply faciliti es as on 1.4.08 = 1950-726-149 = 1075 nos. this however does not take into considerati on new schools that have come up new under Sarva Siksha Abhiyan (SSA) or other programs.
The fi gures of schools without drinking water supply needs to be reconciled with the informati on available with Elementary and Mass Educati on Department for which necessary acti on would be taken shortly. Remaining schools could be provided with water supply in the next two years with funds under ARWSP and SSA.
185

MEGHALAYA STATE DEVELOPMENT REPORTMEGHALAYA STATE DEVELOPMENT REPORT
Table 7.14 Distributi on of rural households by availability of latrine facility (%) 2001
State/ DistrictAvailability of latrine
(%)State/ District
Availability of latrine (%)
Meghalaya 30 West Khasi Hills 30West Garo Hills 16 Ri-Bhoi 38East Garo Hills 14 East Khasi Hills 57South Garo Hills 13 Jainti a Hills 34
Source: Table on Ameniti es; census of India 2001 Total Sanitati on campaign (TSC)
Ministry of Rural Development, Department of Drinking Water Supply, Govt. of India launched Total Sanitati on Campaign (TSC) in 1999-2000. TSC guidelines were revised and modifi ed in January 2004. In Meghalaya, in January 2004, TSC project for East Khasi Hills & West Garo Hills were sancti oned. Subsequently for other districts, TSC projects were sancti oned. The project for South Garo Hills district was last sancti oned on 15.1.2008. Summary of the cost of TSC projects for all the seven districts during the period 2003-04 to 2007-08 are as below:-
Details Amount (Rs. In Lakhs)Total cost 7186.05Central share 4530.95State share 1679.80Benefi ciary contributi on 975.30
Source: Department of PHE, Meghalaya
Implementati on of TSC is now picking up in the State. Till May, 2008, 13,265 nos. of Individual House Hold Latrines (BPL), 12,076 nos. of Individual House Hold Latrines (APL), 1261
Distribution of Rural Households by Availability of Latrine
51 47
75
49
30
5849
32
�
��
��
��
��
��
��
��
�
�
Meg
hala
ya
Wes
t Gar
oH
ills
East
Gar
oH
ills
Sout
hG
aro
Hills
Wes
tKh
asi H
ills
Ri-B
hoi
East
Kha
siH
ills
Jain
tia H
ills
Percent
Source: PHE Deptt. GOM
7.1.5. Availability of latrine faciliti es
Faciliti es for the safe disposal of night soil can have a great bearing on rural health. In the rural areas of Meghalaya only about 51% of the households have access to latrine faciliti es. The distributi on of latrine faciliti es is not uniform throughout the State, East Garo Hills with 75% has the highest percentage of latrine faciliti es. On the other hand, West Khasi Hills with 30% has the lowest availability of latrine faciliti es. Jainti a hills with only 32% is also among the lowest.
186
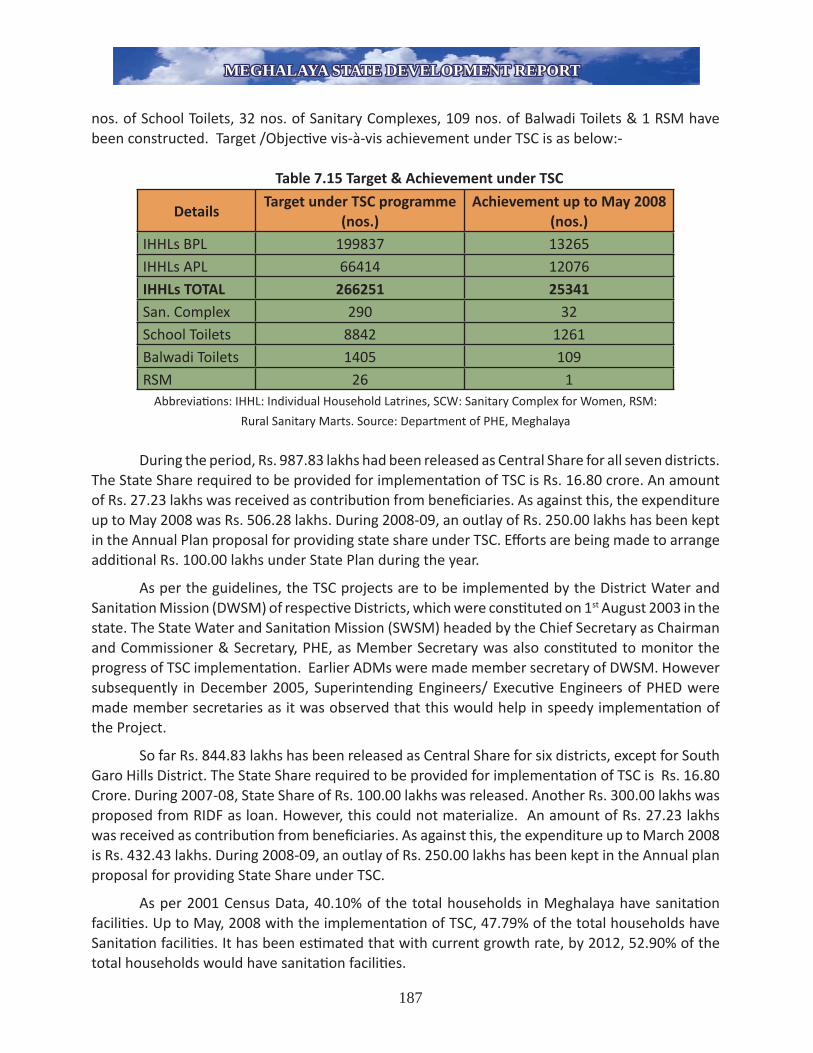
MEGHALAYA STATE DEVELOPMENT REPORTMEGHALAYA STATE DEVELOPMENT REPORT
nos. of School Toilets, 32 nos. of Sanitary Complexes, 109 nos. of Balwadi Toilets & 1 RSM have been constructed. Target /Objecti ve vis-à-vis achievement under TSC is as below:-
Table 7.15 Target & Achievement under TSC
DetailsTarget under TSC programme
(nos.)Achievement up to May 2008
(nos.)IHHLs BPL 199837 13265IHHLs APL 66414 12076IHHLs TOTAL 266251 25341San. Complex 290 32School Toilets 8842 1261Balwadi Toilets 1405 109RSM 26 1
Abbreviati ons: IHHL: Individual Household Latrines, SCW: Sanitary Complex for Women, RSM:
Rural Sanitary Marts. Source: Department of PHE, Meghalaya
During the period, Rs. 987.83 lakhs had been released as Central Share for all seven districts. The State Share required to be provided for implementati on of TSC is Rs. 16.80 crore. An amount of Rs. 27.23 lakhs was received as contributi on from benefi ciaries. As against this, the expenditure up to May 2008 was Rs. 506.28 lakhs. During 2008-09, an outlay of Rs. 250.00 lakhs has been kept in the Annual Plan proposal for providing state share under TSC. Eff orts are being made to arrange additi onal Rs. 100.00 lakhs under State Plan during the year.
As per the guidelines, the TSC projects are to be implemented by the District Water and Sanitati on Mission (DWSM) of respecti ve Districts, which were consti tuted on 1st August 2003 in the state. The State Water and Sanitati on Mission (SWSM) headed by the Chief Secretary as Chairman and Commissioner & Secretary, PHE, as Member Secretary was also consti tuted to monitor the progress of TSC implementati on. Earlier ADMs were made member secretary of DWSM. However subsequently in December 2005, Superintending Engineers/ Executi ve Engineers of PHED were made member secretaries as it was observed that this would help in speedy implementati on of the Project.
So far Rs. 844.83 lakhs has been released as Central Share for six districts, except for South Garo Hills District. The State Share required to be provided for implementati on of TSC is Rs. 16.80 Crore. During 2007-08, State Share of Rs. 100.00 lakhs was released. Another Rs. 300.00 lakhs was proposed from RIDF as loan. However, this could not materialize. An amount of Rs. 27.23 lakhs was received as contributi on from benefi ciaries. As against this, the expenditure up to March 2008 is Rs. 432.43 lakhs. During 2008-09, an outlay of Rs. 250.00 lakhs has been kept in the Annual plan proposal for providing State Share under TSC.
As per 2001 Census Data, 40.10% of the total households in Meghalaya have sanitati on faciliti es. Up to May, 2008 with the implementati on of TSC, 47.79% of the total households have Sanitati on faciliti es. It has been esti mated that with current growth rate, by 2012, 52.90% of the total households would have sanitati on faciliti es.
187

MEGHALAYA STATE DEVELOPMENT REPORTMEGHALAYA STATE DEVELOPMENT REPORT
January-2001(Census) March-2003 April-2008 March 2012Projected Growth Rate
Source: Department of PHE, Meghalaya
Sanitati on Faciliti es In All Rural Schools:Providing sanitati on faciliti es in school has also been included under Total Sanitati on Campaign (TSC).
Table 7.16 Target vis-à-vis achievements in constructi on of Toilet faciliti es in schools are as below
Sl.No.
Name of District Target for constructi on of School Toilets under TSC
Achievement on constructi on of School Toilets under TSC up to March 2008
1 EAST GARO HILLS 1294 2422 EAST KHASI HILLS 2148 1993 JAINTIA HILLS 595 04 RI BHOI 474 2095 SOUTH GARO HILLS 1074 06 WEST GARO HILLS 2244 4197 WEST KHASI HILLS 1013 0 GRAND TOTAL 8842 1069
Source: Department of PHE, Meghalaya
TSC Programme is now picking up in all the districts & thus 100% sanitati on faciliti es in all schools are likely to be achieved in the next two years.
7.1.6. Electricity Connecti on:
Rural Electrifi cati on in India has long been regarded as a vital programme for socio-economic development of rural areas. The access to electricity to rural households in the State is quite low as per 2001 census. The diffi cult terrain and scatt ered nature of the sett lements (48% villages less than 200 populati on, density of populati on in rural areas less than 80/ sq. km.) may parti ally explain this phenomenon. Moreover, high incidence of rural poverty might have also been acti ng as a constraint behind low access to electricity in rural areas. As per 2001 census about 30% of
( % ) Household Covered
40.10% 40.10%
47.33%
52.90%
188

MEGHALAYA STATE DEVELOPMENT REPORTMEGHALAYA STATE DEVELOPMENT REPORT
the rural households in the State have electricity connecti on though there are wide inter district variati ons in electricity connecti on. It is maximum in East Khasi Hills (57%) and minimum in South Garo Hills (13%).
Table 7.17 DISTRIBUTION OF RURAL HOUSEHOLDS BY ELECTRICITY CONNECTION (%) 2001
State/ District Electricity connecti on State/ District Electricity connecti onMeghalaya 30 West Khasi Hills 30West Garo Hills 16 Ri-Bhoi 38East Garo Hills 14 East Khasi Hills 57South Garo Hills 13 Jainti a Hills 34
Source: Table on Ameniti es; Census of India 2001
Present (March 2008) status of rural electrifi cati on is as below:• Total Number of Villages : 5782 (2001 Census)• Villages Electrifi ed As on 31.03.08: 3428 (60%)• No. of Villages to be electrifi ed under:
(i) RGGVY: 1945 (ii) MNRE: 158 (iii) To be declared Electrifi ed 148 (iv) PMGY (Spill over): 103 TOTAL 2354
Recognizing the need, the problems associated with rural electrifi cati on in India, to accelerate the pace of village electrifi cati on programme and its criti cal role in poverty alleviati on, the Government of India, in April 2005, launched the new scheme for att ainment of the Nati onal Common Minimum Programme (NCMP) goal of providing access of electricity to all households in fi ve years. The aim was to electrify over one lakh villages and release of electricity connecti ons to 2.34 crore rural households. The approval was given at that ti me for capital subsidy of Rs.5000 crore for remaining two years of the 10th Plan period. However, the situati on in the State of Meghalaya did not improve dramati cally in the State by the end of 10th plan. Only 43% of the household (157375) has been electrifi ed by the end of 10th plan.
Now, the Government has given the approval for conti nuati on of “Rajiv Gandhi Grameen Vidyuti karan Yojana - Scheme of Rural Electricity Infrastructure and Household Electrifi cati on”, Scheme in the 11th Plan for att aining the goal of providing access to electricity to all households, electrifi cati on of about 1.15 lakh un-electrifi ed villages and electricity connecti ons to 2.34 crore BPL households by 2009.The approval has been accorded for capital subsidy of Rs.28000 crore during the Eleventh Plan period, at this stage. Rural Electrifi cati on Corporati on (REC) would be the nodal agency for the scheme. In the State of Meghalaya MeSEB is the implementi ng agency.
Progress of Implementati on of RGGVY in the State
This is a programme related to rural electrifi cati on taken up by MeSEB covering all the seven (7) districts of the State. The programme aims at providing electricity in the rural villages. Under this programme the following schemes are included :-
189

MEGHALAYA STATE DEVELOPMENT REPORTMEGHALAYA STATE DEVELOPMENT REPORT
• No. of villages to be covered for electrifi cati on for two separate categories (a) Un-electrifi ed villages (b) De-electrifi ed villages.• No. of BPL Households to be covered for electrifi cati on.• No. of Households to be covered for electrifi cati on.• No. of electrifi ed villages covered under the scheme.
The report furnished by MeSEB highlighted the fact that the Board had just started the implementati on works in some districts of the State viz., Ri-Bhoi District, Jainti a Hills and East Khasi Hills District and that also Block-wise. As the schemes were sancti oned only in 2007 and 2008 the ti me frame for completi on of these schemes has been fi xed ti ll 2009. In the case of East Garo Hills, South Garo Hills, West Garo Hills and West Khasi Hills sancti ons of schemes are yet to be awarded. The total amount sancti oned under RGGVY is Rs. 29041.99 lakhs.
Table 7.18 Status of RGGVY SCHEME FOR 11th PLAN:
Name of
the District
Virgin Villages
(No.)
De-electrifi ed
villages
Extension in
electrifi ed villages
Electrifi cati on of BPL
households
Sancti oned cost (Rs. in
Crores)Status
Length of lines (Km.)
Sub-stati on (MVA)
33 KV
11 KV33/11
KV11/0.4
KV
East Khasi
Hills Dist.- 19 314 14193 16.63
Sancti oned 11.03.08 and
work is in progress
Nil 340.55 Nil 5.903
Jainti a Hills
Dist.18 50 360 14029 26.11
Sancti oned on 21.11.06
and work is in progress
Nil 673.78 Nil 13.750
Ri-Bhoi
Dist.72 34 84 9647 19.89
Sancti oned on 26.09.06
and work is in progress
Nil 303 Nil 4.337
West Khasi
Hills Dist.224 20 126 17592 34.67
Sancti oned 11.03.08
and tender evaluati on is in progress
Nil 513.9 Nil 4.262
West Garo
Hills Dist.534 123 861 40543 81.43 13 1374.85 1 x 1.6 11.242
South Garo
Hills Dist.364 15 32 5384 49.74 81 564.8 2 x 1.6 5.182
East Garo
Hills Dist.361 111 358 15059 61.95 38 1164.98 2 x 1.6 7.835
TOTAL 1573 372 2135 116447 290.42 132 4917.86 8.0 52.511
Source: Power Department GOM (2008)
The detailed sancti on and progress report of 7(Seven) Districts under RGGVY are as follows:-• Ri-Bhoi is Rs.1989.07 lakhs and the total number of households to be covered for electrifi cati on under this scheme is 9647. The no. of electrifi ed villages covered under the scheme is 423. The schemes awarded on the 28.09.07 and the target date for completi on is 27.09.2009.
190

MEGHALAYA STATE DEVELOPMENT REPORTMEGHALAYA STATE DEVELOPMENT REPORT
• Jainti a Hills is Rs.2610.73 lakhs and the total number of households to be covered for electrifi cati on under this scheme is 31848. The No. of electrifi ed villages covered under this scheme is 374 numbers. The schemes awarded on the 16.07.07 and the target date for completi on is 15.07.2009.
• East Khasi Hills is Rs.1662.51 lakhs and the total number of households to be covered for electrifi cati on under this scheme is 26169. The No. of electrifi ed villages covered under this scheme is 834. The schemes awarded on the 09.06.08 and the target date for completi on is 08.12.2009
• East Garo Hills is Rs.6195.43 lakhs and the total number of households to be covered for electrifi cati on under this scheme is 24353. The No. of electrifi ed villages covered under this scheme is 335. The schemes are yet to be awarded.
• South Garo Hills is Rs.4973.50 lakhs and the total number of households to be covered for electrifi cati on under this scheme is 15104. The No. of electrifi ed villages to be covered under this scheme is 248. The schemes are yet to be awarded.
• West Garo Hills is Rs.8143.42 lakhs and the total number of households to be covered for electrifi cati on under this scheme is 67026. The No. of electrifi ed villages covered under this scheme is 816. The schemes are yet to be awarded.
• West Khasi Hills is Rs.3467.33 lakhs and the total number of households to be covered for electrifi cati on under this scheme is 26477. The No. of electrifi ed villages covered under this scheme is 506. The schemes are yet to be awarded.
Acti viti es Under Taken By Meghalaya Non-Conventi onal & Rural Energy Development Agency (MNREDA):
MNREDA is the agency in the state which undertakes various non-conventi onal and renewable sources of energy. The details of items of acti viti es and progress in last 5 years are depicted below:
Table 7.19 Progress of Scheme during last fi ve years:Sl.
No.Item details 2004-05 2005-06 2006-07 2007-08 2008-09
1. Solar Photovoltaics(i) Solar lantern.(ii) Solar Domesti c
Home lighti ng System.
(iii) Street lighti ng System
(iv) SPV Power Plants
-1000 Nos.
-
12 Nos.
20000 Nos.1500 Nos.
50 Nos.
12 Nos.
-1700 Nos.
-
-
-
-
100
-
1000 Nos.2000 Nos.
500 Nos.
-
2. Solar Thermal :-(i) Solar Water Heati ng
System(ii) Solar Water Pump(iii) Solar Dryier
10Nos/100LPD
14 Nos.-
- --
30 Nos/100 LPD--
3/4000 LPD
--
5000 LPD
-1000 Sqm.
191

MEGHALAYA STATE DEVELOPMENT REPORTMEGHALAYA STATE DEVELOPMENT REPORT
3. Bio Energy(i) Biogas Plant (2 Cum)(ii) Night Soil/Community
Biogas Plants (10 Cum)(iii) Biomass Gassifi cati on
200 Nos.-
-
50 Nos.2 Nos.
-
200 Nos.2 Nos.
1 No./250 KW
200 Nos.2 Nos.
2Nos/50 KW
300 Nos.3 Nos.
10Nos/10KW
4. Micro Hydel Project Survey Investi gati on
- - - 10 Nos. -
5. Water Mill Programme - - - 5 Nos. 5 Nos.
6. Remote Villages Electrifi cati on
- 5 Nos. - 73 Nos. 80 Nos.
7. Energy Conservati on devices :(i) Family Size Fixed
Impd Chullah(ii) Community Fixed
Impd Chullah(iii) Charcoal Briquetti ng
800 Nos.
-
900 Nos.
500 Nos.
-
1000 Nos.
-
200 Nos.
-
-
-
-
1000 Nos.
1000 Nos.
1000 Nos.
8. Hybrid Power Plant - - - 2.5 KW 10 Nos / 5 KW
9. Wind Mapping Stati on - - - 3 Nos. 12 Nos.
Source: Power Department .GOM (2008)
Status of remote village electrifi cati on (March, 2008)
Source: Power Department .GOM (2008)
D. Remote Village Electrification :-* 158 Nos. of Villages approved* 5 Nos. of Villages Completed* 73 Nos. of undergoing work* 80 No.s of to be taken up.
DISTRICTWISE STATUS OF VILLAGES TO BE ELECTRIFIED UNDER RENEWABLE ENERGY
73051585782Total---1469West Garo Hills7.
06-09595South Garo Hills6.10-20864East Garo Hills5.090322543Ri-Bhoi4.08-16467Jaintia Hills3.
160244924West Khasi Hills2.
24-47920East Khasi Hills1.
Undergoing Work to be
Completed by Dec. 2008
Villages already
Electrified
Villages to be Electriofied
through Remote
Total No. of
Villages
DistrictSL. No.
192

MEGHALAYA STATE DEVELOPMENT REPORTMEGHALAYA STATE DEVELOPMENT REPORT
7.2. Rural Income/Employment/ Livelihoods:
Programmes initi ated by Central and State Government(I). Swarnjayanty Gram Swarozgar Yojna (SGSY)
Swarnjayanty Gram Swarozgar Yojna (SGSY) is a centrally sponsored scheme implemented on cost sharing basis between the centre and the state in the proporti on of 75:25 (now 90:10). The Programme was launched from the year 1999-2000 with the merger of all the earlier programmes of IRDP, TRYSEM, DWCRA, GKY, and MWS etc under this scheme. The Ninth Plan Outlay for SGSY was Rs. 25 crore. However during this period the total expenditure was only about Rs. 13.50 crore. Thus there has been a marked gap between plan outlay and actual expenditure during the Ninth Plan Period. Further actual deployment of state share to the programme has been less than 40%.The Projected Outlay for the Tenth Plan (2002-2007) was Rs. 25 crore. The expenditure during 2002-03 and 2003-04 was Rs. 1.742 crore and Rs. 2.75 crore respecti vely benefi ti ng 200 Self Help Groups and 524 individual self-employed (Swarozgaries) during 2002-03 and 485 Self Help Groups and 965 individual Swarozgaries during 2003-04. During 2004-05 and 2005-06, Rs. 2.79 crore and Rs. 2.99 crore was uti lized. The aims and objecti ves of the Programme are to bring the assisted poor families above the poverty line by providing them with income- generati ng assets through Government subsidies and bank credits. During 2004-05, 1014 Self-Help Groups and 709 Individual Swarozgaries were benefi ted. During the Tenth Plan, a total of 4413 Self-Help Groups and 2007 Individual Swarozgaries have benefi ted.
The implementati on of SGSY in the last few years appears to be moving with a slow pace in the State. The procedure of implementati on through Self Help Groups is new to the culture of the tribal people. As a result it needs a lot of persuasion, awareness and guidance to encourage the people to take up the schemes. The sparse locati on of households in rural areas, small size of villages and remoteness from the branches of the Banks are also other hurdles. However, in the last two years the implementati on has improved. During the year 2007-08, 1622 Nos of Swarozgaris were assisted, out of which 847 Nos. were Women Swarozgaris. The total Nos of SHGs formed during the period were 829 Nos. to whom income generati ng acti viti es provided during the year was 1570 Nos. During 2008-09 upto May, 2008, 50 Nos. of Swarozgaris were assisted, out of which 20 Nos. were Women Swarozgaris. The total nos. of SHGs formed upto May, 2008 was 273 nos. to whom income generati ng acti viti es provided during the period was 50 nos.
velihoods:
State Governnmentna (SGSY))
(SGSSY) is a centrallllyyn coost sharing baasishe prroporti on of 755:25unchhed from the yyearearlier programmees ofetc uunder this scheeme.Rs. 225 crore. Howeeverre wwas only about t Rs.rked gap between pplanthe Ninth Plan Period.are tto the programmme
n (2002-2007) was Rs.03 annd 2003-04 wass Rs.vely bbenefi ti ng 200 Self
mployyed (Swarozgarries)ups aand 965 individdualg 20004-05 and 20005-was uti lized. The aaims to bring the assiistedy providing them wwithernmment subsidies andf-Hellp Groups and 7709ed. During the Tentnths andd 2007 Individuall
the lastt few years appears to be moving with a slow paceentati on ththrorough Self Help Groups is new to the culture of a lot of persuasioionn, a awawarereneness and gguidance to encouraragegee sparse locati on of households in rural areas, small size of
Swarnjayanty Gram Swarozgar Yojna
SGSY is a subsidy driven programme, which is dependant on the existence suitable economic and technical infrastructure for its success. Unless there is substantial improvement it will not be possible for the benefi ciaries to enhance their income by traditional and conventional practices. Thus the Tenth Plan emphasized on infrastructure development on a priority basis. Creation of more facilities and services are necessary for the enhancement of the income related economic activities of the benefi ciaries.
193
MEGHALAYA STATE DEVELOPMENT REPORTMEGHALAYA STATE DEVELOPMENT REPORT
Issues in Implementati on of the Scheme
a. Strengthening of Implementati on of Delivery Mechanism - Implementati on of SGSY in the state is not up to the mark and needs improvement. The Scheme itself is quite a complex one. DRDAs are over burdened and stretched. The State therefore would suggest creati ng dedicated rural poverty alleviati on/ livelihoods machinery or strengthening of DRDA with suffi cient manpower, experti se and technical support with stability of tenure of key offi cial in the agency.
b. Convergence & co- ordinati on with other Agencies / Deptt s - Diff erent Departments have formed SHGs in the state. However, SHGs formed under SGSY have their own identi ty where the members of the groups are the persons living below the poverty line and are linked with the back ended subsidy. There are altogether 8022 number of SHGs formed so far (2008 July) from incepti on of SGSY, though some overlaps and adopti on of SHG appears to have crept in; nevertheless the performance of bank linkage and their impact appears somewhat lackluster.
The success of implementati on of SGSY varies from districts to districts within the State. This is due to the fact that in some Districts NGOs are being acti vely involving themselves as facilitators for formati on and development of SHGs. In some Districts like South Garo Hills, East Garo Hills & Jainti a Hills there is dearth of NGO venturing for development of SHGs. Involvement of SHGs with other implementi ng agencies for various other government programmes such as Mid-day Meal, Rural Health Mission is being initi ated by the Block offi cial.
c. Monitoring & Review mechanism - Monitoring of SGSY by diff erent committ ees such as State Level Co –ordinati on Committ ee (SLCC), District Level SGSY and the Block Level SGSY Committ ee has been hitherto tardy and ineff ecti ve. So has been the fate of online monitoring. Department needs to emphasize the matt er.
d. Awareness Generati on and Transparency – Though steps have been taken up by the Project Directors/ Block Development Offi cers to publicize the schemes, including in local languages; being a ti me taking process more involvement of grassroots are necessary in a sustained manner.
e. Low level of capacity Building and Training under SGSY - Basic orientati on programme and skill training were conducted by the DRDAs/ NGO and the Blocks meeti ng the cost of expenditure from 10% of the allocati on under SGSY for training and Capacity Building. Further revolving fund is also provided to the groups to augment the group corpus and embark on further capacity building of its enti re team. However, fund uti lizati on is low.
f. Special Projects under SGSY - Special Project on Disabled Persons. The project was approved by Government of India and implemented by the DRDA East Khasi Hills, Shillong. The project cost was Rs 116.16 Lakhs which is being sponsored by the Central & the State at 75:25. In this regard the Government of India has already released Rs 69.70 Lakh and the State share has also released Rs 11.62 lakh. The project is in progress.
g. Credit Disbursement - The issue of credit has been a cause of concern for the State. The major responsibility of implementati on of SGSY lies with Banks. The success of the scheme is
194

MEGHALAYA STATE DEVELOPMENT REPORTMEGHALAYA STATE DEVELOPMENT REPORT
therefore dependent on the Banks. Insistence for collateral from the SHGs under SGSY for a loan of just over Rs. 50,000/- only; slow and ti me consuming processing of loan applicati on by the Banks and long ti me gap between sancti on and disbursement; ineff ecti ve coordinati on between the Banks and the BDOs and poor parti cipati on by Banks especially at the Block level are some of major credit related bott lenecks . Besides, there are Community & Rural Development Blocks with no Banking faciliti es.
h. ‘State coordinator for SHG’ & RBI’s fi nancial inclusion: Some policy suggesti ons and focus on SHG has been given in the State by assigning a senior offi cial as the ‘State coordinator for SHG’ (megselfh elp.gov.in). The policy recommendati ons/ suggesti ons / coordinati on have been made and are also likely to emerge from the State coordinator for SHG. Besides, there has been focus on fi nancial inclusion by the RBI and business correspondence and business facilitator models are being experimented in close collaborati on of Banks, NABARD, RBI, State Coordinator for SHG and the Finance Department of the State Govt. [The Survey conducted by the State coordinator and the gist of analysis of SHG is referred at Chapter X on Industrial Development at 10.7.2.]
Thus, selecti on of benefi ciaries, credit related bott lenecks, poor mobilizati on, awareness, training, creati on of necessary infrastructure, inadequate linkage with marketi ng of products are some of the major problems encountered in the programme.
(II). Sampoorna Grameen Rozgar Yojna (SGRY)
Sampoorna Grameen Rozgar Yojna (SGRY) initi ated from the year 2002-03 aft er the merger of erstwhile JGSY and EAS for the generati on of rural employment. SGRY was self-targeti ng in nature and available to all rural poor (BPL/APL) who were in need of wage employment and willing to take up manual/unskilled work. Under SGRY, 5 kg of food grains was distributed as part of wage per man-day and the remaining wage is paid in cash to ensure the payment of “noti fi ed minimum wage” every week. The scheme was implemented on cost sharing basis between the Centre and State in the rati o of 75:25 of the cash component. The State Share when taken against the total allocati on including the value of food grains therefore came to only 12.5%. During the Tenth Plan (2002-07) State Plan outlay for this Programme was Rs. 3,500 lakhs, out of which the total expenditure was Rs. 3,310.66 lakhs. The Central Share released during the same period for the Programme was Rs. 10.050.17 lakhs and the amount was fully uti lised. The Programme aimed to provide additi onal wage employment in the rural areas and also food security combined with the creati on of durable community, social and economic assets as well as infrastructure development. For the Annual Plan 2007-2008, an outlay of Rs. 3 crore was proposed. This Programme, (SGRY) has been completely merged to Nati onal Rural Employment Guarantee Scheme (NREGS) from the year 2008-09.
(III). Nati onal Rural Employment Guarantee Act (NREGA)
The Meghalaya Rural Employment Guarantee Scheme (MREGS) is a Scheme formulated following the implementati on of NREG Act which gives a legal guarantee of 100 days of wage employment in a fi nancial year, to adult members of rural households who demand employment and are willing to do unskilled manual works. MREGS was noti fi ed by the Government on 28.07.2006. It is implemented through Local Employment Councils initi ally in South Garo Hills & West Garo
195

MEGHALAYA STATE DEVELOPMENT REPORTMEGHALAYA STATE DEVELOPMENT REPORT
Hills Districts. The Govt. of India extended the Scheme to Jainti a Hills, East Khasi Hills & Ri Bhoi Districts during 2007-08 and the remaining 2 Districts Viz. West Khasi Hills and East Garo Hills w.e.f. 01.04.2008. The scheme is being implemented as Centrally Sponsored Scheme on a cost-sharing basis between Centre and State in the rati o of 90:10 in all the districts in the state Financial Achievement during 2007-08: Against the total availability of Fund amounti ng Rs. 7700.72 lakhs, a total of Rs.5405.67 lakhs was spent during 2007-08. The percentage of achievement was 70.20 %. Physical Achievement: Job cards issued during 2007-08 were 166137 Nos out of which 127319 Nos of Households were provided employment. Person days generated during the year was 48.17 lakh person days.
The District-wise Financial and Physical achievements during 2007-08 are indicated in the Table below:
Table 7.20 Financial & Physical Achievements during 2007-2008 upto March, 2008 (Rs. in lakhs)
Sl.
No.
Name
of the
District
Opening
balance
as on
1.4.2007
Financial Achievement
Fund released during
2007-08 includes the
fund of
2006-07 and 2007-08
Total
availa-
bility of
Funds
Expen-
diture
Balance No. of
House-
holds
getti ng
employ-
ment
Achiev
-ment
(Lakh
No.
Person
days)
Centre State Others
1 2 3 4 5 6 7 8 9 10 11
1 Tura 411.54 3444.61 273.28 18.22 4147.65 3874.37 273.28 92486 36.07
2 Baghmara 390.21 879.98 52.00 11.03 1333.22 1086.98 246.24 17778 10.55
3 Shillong 0.00 900.91 95.15 66.35 1062.41 206.39 856.02 9000 0.11
4 Jowai 0.00 601.79 61.92 0.67 664.38 28.01 636.37 0 0.00
5 Nongpoh 6.63 440.43 43.22 2.78 493.06 209.92 283.14 8055 1.44
Total 808.38 6267.72 525.57 99.05 7700.72 5405.67 2295.05 127319 48.17
Source: Ministry of Rural Development Website
Financial & Physical Achievements during 2008-09 (upto May’08): Against the total availability of Fund which was Rs. 3955.95 lakhs, the expenditure was Rs. 1303.58 lakhs. Percentage of achievement was 32.95 %.The Nos of Households getti ng employment during this period, were 77416 Nos. 16.17 lakhs person days has been achieved.
a) Strengthening of Village Level Insti tuti ons & Delivery Mechanism - PRI does not exist in Meghalaya. However for NREGA, the State Govt has to adopt a new system for implementati on of the scheme by way of establishment of new insti tuti ons at the village level which are similar to Panchayats. Clearance from the Ministry was received in July 2006 with certain suggesti ons for amendment in our State Scheme. The scheme has been framed in consistent with the Act by involving traditi onal tribal authoriti es at the village level called Village Employment Council (VEC), at the cluster level comprising of 4/5 villages within a radius of 2.5 kms called Area Employment Council (AEC) and Block Employment Council at Block level and District
196

MEGHALAYA STATE DEVELOPMENT REPORTMEGHALAYA STATE DEVELOPMENT REPORT
Employment Council at the District level .These councils act in a similar way like the Gram Sabha and Gram Panchayat for purpose of NREGAS.
The existi ng man power of the DRDA at the District level, Block Development functi onaries at
the Block level are being uti lized for the purpose of NREGS implementati on. The additi onal personnel required such as APOs Asstt / Junior Engineers/ Computer Operators etc are appointed by the District programme Co-ordinator concerned aft er making an assessment of the requirements. However, it may be menti oned that the placement of Technical Assistants at AEC level could not be fully made due to shortage of technical manpower especially in Rural areas of the State.
b) Convergence & Co-ordinati on with others related agencies and departments -Convergence and Co-coordinati on with other Departments has been taken up in West Garo Hills to opti mize impact and quanti fy development interventi ons. In this connecti on the scheme is successfully converging with the Rural Health Mission, where a Village Health & Sanitati on Committ ee is consti tuted by the VEC to monitor and to ensure that all health relates interventi ons are eff ecti vely carried out under NRHM., Mid day meal Scheme and TLC are also converged with the scheme. In other districts, eff orts have been also made to follow the same example as carried out in the West Garo Hills by also converging with the livelihoods programmes of NERCORMP and The MRDS.
c) Vigilance & Monitoring Committ ee - The Vigilance & Monitoring Committ ee has been set up in West Garo Hills & South Garo Hills Districts. The Committ ee extended assistance to the VEC in implementi ng the schemes as well as to achieve targets within the planned budget. It is also extends help to NGO in conducti ng of Social Audit. Verifi cati on of Muster roll has been carried out by VMC.
d) Social Audit by Gram Sabhas - Social Audit is being conducted in West Garo Hills & South Garo Hills District in each VEC by the village monitoring committ ees which are facilitated by the NGOs. The reports are placed before the public at the Block Head Quarters where elected members like MLAs , MDCs and offi cers of all levels are invited.
e) State Employment Guarantee Council – Meghalaya State Employment Guarantee Council was consti tuted on 4.9.2006. The SEGC met on 6.8.2007 to review the performance of NREGS and to suggest policy recommendati ons for improvement of the scheme to GOI. The decisions of the meeti ng were endorsed to Government of India for considerati on especially on preferred works. The Annual report is under process and will be placed before Legislature with SEGC approval.
f) Awareness Generati on and transparency - IEC acti vity has already been done in Phase I & II Districts. Pamphlets/Booklets in both the local languages about NREGA, State Scheme, Dos and Don’ts for VECs/AECs, and RTI and Social Audit Concepts under NREGAs have been published by SIRD. The Districts are also distributi ng pamphlets on NREGAs in local language. Hoardings were erected at prominent places. Songs are composed in local lyrics and cassett es distributed to villagers so that those who cannot read will understand about the scheme.
197

MEGHALAYA STATE DEVELOPMENT REPORTMEGHALAYA STATE DEVELOPMENT REPORT
Problems faced by the Department1) There is no Panchayati Raj Insti tuti on at village level. Village Employment Council has been
created which is a ti me consuming process and would require ti me, energy anf capacity to build it up.
2) On line monitoring and entry of data for MIS at the Block Level is not feasible as many CICs including new CIC have not been operati onal. The quality of connecti vity at the Block level and at ti mes at the District level is poor due to various factors.
3) Non availability of Technical personnel at the village level.4). Administrati ve cost of 4% is not enough to meet conti ngencies especially in remote areas
(IV). Indira Gandhi Nati onal Old Age Pension Scheme (IGNOAPS)
NOAPS was implemented in the State since 1995. It aims at providing Rs 75 per month to the desti tutes of 65 years and above per benefi ciary per month. The scheme covered desti tute having litt le or no regular means of subsistence from his / her own sources of income or through fi nancial support from family members or other sources. However, the GOI has made slight modifi cati on of the guidelines under NOAPS in respect of the eligibility criteria for assistance under restructured Indira Gandhi Nati onal Old Age Pension Scheme (IGNOAPS).Under the Scheme, pension is granted to a person who is 65 years and belonging to a household below the poverty line according to the criteria prescribed by the Government of India. The scheme is formally launched on 19.11.2007. During the year 2007-08, 32883 benefi ciaries were assisted in the State of which 20127 were Women and Rs.530.92 lakhs was uti lized under the scheme. During the current year 2008-09, the total availability of fund under the Scheme is Rs. 969.18 lakhs out of which Rs. 811.84 lakhs has been spent upto September, 2008. The total number of benefi ciaries for the same period was 28886, including 16611 Women.
Implementati on of the Scheme
A. Identi fi cati on of additi onal benefi ciaries under IGNOAPS – Identi fi cati on of additi onal benefi ciaries is being undertaken by the Govt. However, provisional informati on has been sent to Govt.of India that 144834 number of additi onal IGNOAPS benefi ciaries in the state is based on the % of BPL families of the 9th Plan (2002 survey fi nalized in 2008).
B. Certi fi cate of full coverage :- So far the state has not yet identi fi ed all the eligible benefi ciaries under IGNOAPS as menti oned in ‘A’ above and hence the certi fi cate of full coverage could not be furnished at present.
C. Opening of Bank/Post Offi ce Account :- The present procedure adopted by the Govt in disbursement of pensions to the IGNOAPS is by cash. Disbursement of pension is carried out in market day at Block Development Block Offi ce. However, necessary steps are being considered for disbursement of pension through Post Offi ce, if it is convenient to the benefi ciaries depending on their opti on. The state would like to go for computerizati on of IGNOAPS if supported by the GOI.
D. Coverage under Nati onal Family Benefi t Scheme (NFBS) :-The State is implementi ng the scheme by providing a grant of Rs.10,000/- in case of death of the primary bread winner
198

MEGHALAYA STATE DEVELOPMENT REPORTMEGHALAYA STATE DEVELOPMENT REPORT
male or female between the age of 18 to 64 years to the bereaved BPL family. The primary breadwinner as specifi ed in the scheme, whether male or female, had to be a member of the household whose earning contributed substanti ally to the total household income. During the year 2007-08, 884 benefi ciaries were assisted in the State and Rs 88.40 lakh was uti lized under the scheme.
E. Monitoring & Verifi cati on :- Deputy Commissioners/BDOs have been directed to take necessary steps to safe guard that only the eligible benefi ciaries will be benefi ted from the scheme.
F. Transfer of funds from State to the District: - • All funds sancti oned are released immediately to the Districts. However, there is communicati on
gap between the GOI and the Nodal Department for release of ACA as copies of sancti on not available. It is therefore proposed that a copy of the release of ACA is also marked to the Nodal Department.
• Sancti on is not available with Nodal Department. Thus the process for release is slow due to communicati on gap.
(V). Rashtriya Sam Vikas Yojana (RSVY)
The Planning Commission in the Tenth Plan period launched the Backward Districts Initi ati ve under the Rashtriya Sam Vikas Yojana (RSVY). The primary objecti ve of RSVY is to address the problems of the pockets of high poverty, low growth and poor governance by putti ng in place programmes and policies which would remove barriers to growth, accelerate the development process and improve the quality of life of the people. The programme aims at focused development for backward areas that would help reduce imbalances and speed up development. Planning Commission selected the West Garo Hills District of Meghalaya as one of the Districts in the country to be covered under the Backward Districts Initi ati ve under the Rashtriya Sam Vikas Yojna (RSVY) from the year 2004-05. The Planning Commission will provide Rs. 15.00 crores annually for three years from the year 2004-05 as Additi onal Central Assistance for this programme. The District Administrati on has prepared a three-year Master Plan with nested Annual Acti on Plans for this programme. During Annual Plan 2005-06, an amount of Rs. 15 crore was approved for implementati on of RSVY. The expenditure during the Tenth Plan was Rs. 22.50 crore.
Release & Uti lisati on of Fund for RGVY:• 2003-04 to 2008-09 – Amount released was Rs. 37.50 crore against the total enti tlement of Rs.
45.00 crore, leaving a balance of Rs. 7.50 crore, out of which Rs. 22.50 crore was uti lised.• The percentage of uti lisati on against the total fund released was 60 %. Rashtriya Sam Vikas Yojana (RSVY) Scheme has been subsumed as Backward Regions Grant Fund (BRGF).
(VI). Backward Regions Grant Fund (BRGF)
The Backward Region Grant Fund (BRGF) is designed to redress regional imbalances in development. The Fund will provide fi nancial resources for supplementi ng and convergence existi ng developmental infl ows into identi fi ed districts, so as to:
199

MEGHALAYA STATE DEVELOPMENT REPORTMEGHALAYA STATE DEVELOPMENT REPORT
(a) Bridge criti cal gaps in local infrastructure and other development requirements that are not being adequately met through existi ng infl ows,
(b) Strengthen to this end Panchayat and Municipality level governance with more appropriate capacity building, to facilitate parti cipatory planning, decision making, implementati on and monitoring to refl ect local felt need,
(c) Provide professional support to local bodies for planning, implementati on and monitoring their plans,
(c) Improve the performance and delivery of criti cal functi ons assigned to Panchayats and counter possible effi ciency and equity losses on account of inadequate local capacity.
Implementati on of BRGF in the StateExisti ng RSVY has been subsumed into BRGF Programme. The erstwhile districts under RSVY will receive their full allocati on of Rs. 45.00 crore per district as per norms of RSVY. Thereaft er, they will shift to the BRGF mode of Funding. In Meghalaya, BRGF covers only 3 (three) Districts, viz. West Garo Hills District, which was earlier covered under RSVY, South Garo Hills District and Ri-Bhoi District.Release & Uti lisati on of Fund for BRGF:
• During 2007-08 an amount of Rs. 0.30 crore has been released against the total enti tlement of Rs. 37.01 crore.
• Of the Total Amount released, Rs.12.07 crore has been earmarked for Ri Bhoi District, Rs. 11.52 crore, for South Garo Hills District and Rs. 13.42 crore for West Garo Hills District. However no amount has been uti lised during the year.
• During 2008-09 against the total enti tlement of Rs. 37.01 crore an amount of Rs. 33.61 crore has been released and the amount is yet to be uti lised.
(VII). Community Development and Panchayats :
This is a State Plan Scheme and the enti re amount is borne by the State Government from the plan. The outlay during the Tenth Plan is Rs. 40 Crore. There are two schemes under this programme that are discussed below.
(i) Community Development and Panchayats (including up-gradati on of Standard of Administrati on and Special Problems for the seven new C & RD Blocks):
Under the scheme, emphasis has been made for increasing agricultural producti on. Roads, educati on and social educati on, safe drinking water, health and sanitati on, bett er staff accommodati on, good offi ce buildings, guest houses, renovati on of both offi ce buildings and staff quarters etc are the main components of this scheme. The 10th Plan (2002-07) outlay for this sector is Rs.4000.00Lakhs and the expenditure is Rs.3496.42 Lakhs. For the Eleventh Five Year Plan (2007-12), an outlay of Rs.12,000.00 lakhs, inclusive of Rs.300.00 Lakhs for Tribal Development Programmes under Arti cle 275, has been proposed. An outlay of Rs.650.00 Lakhs is anti cipated to be uti lized during 2007-08 while an amount of Rs.815.00 Lakhs is proposed for the Annual Plan 2008-09 inclusive of Rs.54.00 Lakhs for Tribal Development Programmes under Arti cle 275(1). Target could not be fi xed for the schemes as the items are heterogeneous in nature and are not uniform. The schemes/item of works are selected and approved by the Committ ee depending on the felt needs of the people/villages etc.
200

MEGHALAYA STATE DEVELOPMENT REPORTMEGHALAYA STATE DEVELOPMENT REPORT
(ii) Constructi on of Rural Roads Programme (CRRP):
Constructi on of Rural Roads is a programme being implemented by the Community and Rural Development Department as a part of poverty alleviati on measure by transferring certain funds from Roads & Bridges Sector to Community and Rural Development Sector. It envisages improvement of rural connecti vity by acti ve involvement of village community force for constructi on of village link roads to boost up rural economy. The scheme is implemented through village durbars under the close monitoring of the respecti ve Deputy Commissioners of the Districts. The expenditure for the 10th Plan is Rs.1,200.00 Lakhs. An outlay of Rs.1,200.00 lakhs was approved for 11th Plan. The agreed outlay for the year 2007-08 is Rs.240.00 Lakhs and the actual expenditure is Rs.240.00 Lakhs. Rs.280.00 Lakhs is proposed for the Annual Plan (2008-09). The allocati on is shown under the Roads & Bridges sector.
(VIII) Land Reforms
There is no systemati c and regular record of land in Meghalaya. Lands in the state have never been surveyed earlier. The absence of any kind of maps and records is detrimental to any kind of systemati c development planning. Moreover this is the cause of unnecessary liti gati on. The government enacted the Meghalaya Land Survey and Record Preparati on Act 1980 to implement land reforms and introduced the scheme of Cadastral Survey to have all lands to be surveyed and the preliminary records prepared with a view to identi fy the owner/user of the land. The management and control of land in the State is vested with the District Councils. In order to make this scheme successful and operati onal the Meghalaya Land Survey and Record Preparati on Act 1980 was amended in August 1991. Subsequently, the survey staff and the offi cers were placed at the disposal of the District Councils. The approved outlay for the 11th Plan (2007-12) is Rs.1,600.00 lakhs. The approved outlay of Rs.200.00 lakhs for 2007-2008 is expected to be uti lized in full. The proposed outlay for 2008-09 is Rs.250.00 lakhs
Achievements made during the Tenth Plan:
• During the 10th Plan, cadastral survey works were done in 100 villages and in 61 government lands. Computati on has covered 45 numbers of villages and 62 numbers of government lands. The 10th Plan (2002-07) outlay for Land Reforms Sector was Rs.1,030.00 lakhs and an expenditure of Rs 873.25 lakhs was incurred.
Annual Plan 2007-08 & 2008-09: The following schemes which are under implementati on during Annual Plan 2007-08 are also proposed to be implemented during 2008-09:-
201

MEGHALAYA STATE DEVELOPMENT REPORTMEGHALAYA STATE DEVELOPMENT REPORT
Table 7.21 The break up proposed expenditures for the Annual Plan 2008-09
Sl.No.
Name of Schemes11th Plan
projected outlay (2007-12)
Approved outlay 2007-08
Anti . Expn. 2007-08
Proposed outlay 2008-09
1. Cadastral Survey 676.27 92.20 92.20 101.422. Metric System 576.14 85.80 85.80 94.38
3.Enforcement
Branch44.25 6.60 6.60 7.26
4.Land Tenure Research Cell
22.10 3.30 3.30 3.63
5.Grants-in-aid to the District
Councils81.24 12.10 12.10 13.31
6.Procurement of
Survey Equipments200.00 - - 30.00
Total 1600.00 200.00 200.00 250.00Source: Meghalaya Plan Supplement, 2008-09
(IX). Special Rural Works Programme (SRWP)Under this programme schemes of varied nature, are selected by the MLAs and implemented through village durbars/ local committ ees under the supervision of respecti ve BDOs. Deputy Commissioners of the District sancti ons the projects. Presently Rs 100 lakh per MLA is allocated. The outlay for the 10th Plan (2002-07) was Rs.6812.50 lakhs and the expenditure was Rs.15061.50 Lakhs including Rs.2000.00 lakhs as CM’s Special Rural Development Fund. An outlay of Rs.28,500.00 lakhs has been proposed for the 11th Plan (2007-12). An outlay of Rs.5850.00 Lakhs is anti cipated to be uti lized during 2007-08, and Rs.5,850.00 lakhs is proposed for 2008-09 including Rs.400.00 lakhs for the CM’s Special Rural Development Fund during 2008-09.
Other Programmes of Rural Development in the State:
I. Livelihood Improvement Programmes:
A. The North Eastern Region Community Resource Management Project (NERCORMP) is funded by the Internati onal Fund for Agricultural Development (IFAD). The overall objecti ve of NERCORMP is to improve the livelihood of vulnerable groups in a sustainable manner through improved management of their resource base in a way that contributes to preservati on and restorati on of the environment. The NERCORMP is looking at parti cipatory, sustainable, and viable community based insti tuti ons that is expected to carry out a people driven mode of rural development. The project concentrated on building up Community based Insti tuti ons (CBIs) at the grassroots level called - Natural Resources Management Groups (NaRM-Gs) and Self Help Groups (SHG). One of the signifi cant achievements through the creati on of CBIs is the emergence of a bott oms-up planning approach by the village communiti es based and perceived on their felt needs.
A pilot project with IFAD support on parti cipatory development process is also under implementati on in the State under the (NERCORMP). The project is working for parti cipatory, sustainable, and viable community based insti tuti ons that are expected to carry out a people driven mode of rural
202

MEGHALAYA STATE DEVELOPMENT REPORTMEGHALAYA STATE DEVELOPMENT REPORT
development. The programme gives thrust upon increasing local capabiliti es, improving livelihood opportuniti es, enhancing saving habit and capacity and improving delivery systems through local parti cipati on, especially that of women. It has been concentrati ng on building up Community Based Insti tuti ons (CBIs) at the grassroot level, called Natural Resources Management Groups (NaRM-Gs) and Self Help Groups (SHG). In Meghalaya, West Garo Hills and West Khasi Hills are being covered. SHGs are supposed to play a crucial role in the success of the programme. 257 and 520 SHGs have been formed in West Khasi Hills (162 villages) and West Garo Hills (192 villages) respecti vely with the help of selected NGOs. Of these about 302 SHGs (April 2005) have been graded in West Garo Hills District, and have received 12.12 lakhs as loans and in additi on Rs. 24.80 lakh as loans for transport etc. The project cost In Meghalaya is about Rs 159.36 crore which has contributi ons from IFAD (Rs 109.92 cr- 68.9%), GOI (Rs. 26.88 Cr- 16.86%), benefi ciary (Rs.16.80 Crore-10.54%) and fi nancial insti tuti ons (Rs. 5.76 crore- 3.63%).
The project covered 162 villages, 6900households having 162 NARMGs and 454 SHgs in West Khasi Hills district. Simialarly the project covered 192 villages, 7070 households having 257 NARMGs and 852 SHGs in West Garo Hills district.
7.3. Livelihoods Improvement Project for the Himalayas (LIPH): Another IFAD project is being implemented by the Meghalaya Rural Development Society (MRDS) with planning department of the Govt. of Meghalaya as the nodal department. The project goal is to improve livelihood of vulnerable group in a sustainable manner through livelihood opportuniti es and strengthening local insti tuti ons that relate to livelihood development. The project component include Promoti on and capacity building of SHGs; Capacity building of SHGs promoters, grassroot trainers and formal fi nancial insti tuti ons; enabling networking of SHGs and capacity building of federati ons; revolving fund assistance to SHGs and federati ons; funding mobile banking facility; technical assistance to federati ons; need based studies and research. Approximately 29300 households in over 570 villages of 14 blocks covering about 30% of each block are likely to benefi t and is expected to cause ripple eff ect. The total project cost is around Rs 172.14 crore. The cost sharing is likely to be 48.34% by the IFAD, 27% by the banks in the form of credit, 10.63 % by the stakeholder i.e. poor people, 14 % by the state govt. Thus, the programme holds a good promise to enhance credit deployment and absorpti ve capaciti es in the State.
Important Project Milestones as of SEPTEMBER 2008:10th Jun 2004 Establishment of MRDS
22nd Jun 2004 Registrati on of MRDS under Society Registrati on Act 1860
14th Dec 2004 Financial & Administrati ve Rules 2005 approved
31st Oct 2005 Completi on of recruitment process of core staff
23rd to 25th Nov 2005 1st Review Mission by UNOPS
16th & 17th Mar 2006 State level Project Launch Workshop
12th May 2006 MoU signing with partner NGOs for 1st phase Blocks
27th Nov - 8th Dec ‘06 2nd Review Mission by UNOPS
27th & 28th Mar 2007 MoU signing with partner NGOs for 2nd phase Blocks
9th July 2007 Approval from BoD for formati on of Social Venture Capital Company (SVCC);
adverti sement for CEO fl oated, interview tentati vely scheduled in November 2007
May 2008 Joint Review Mission
September 2008 Mid Term Review
203
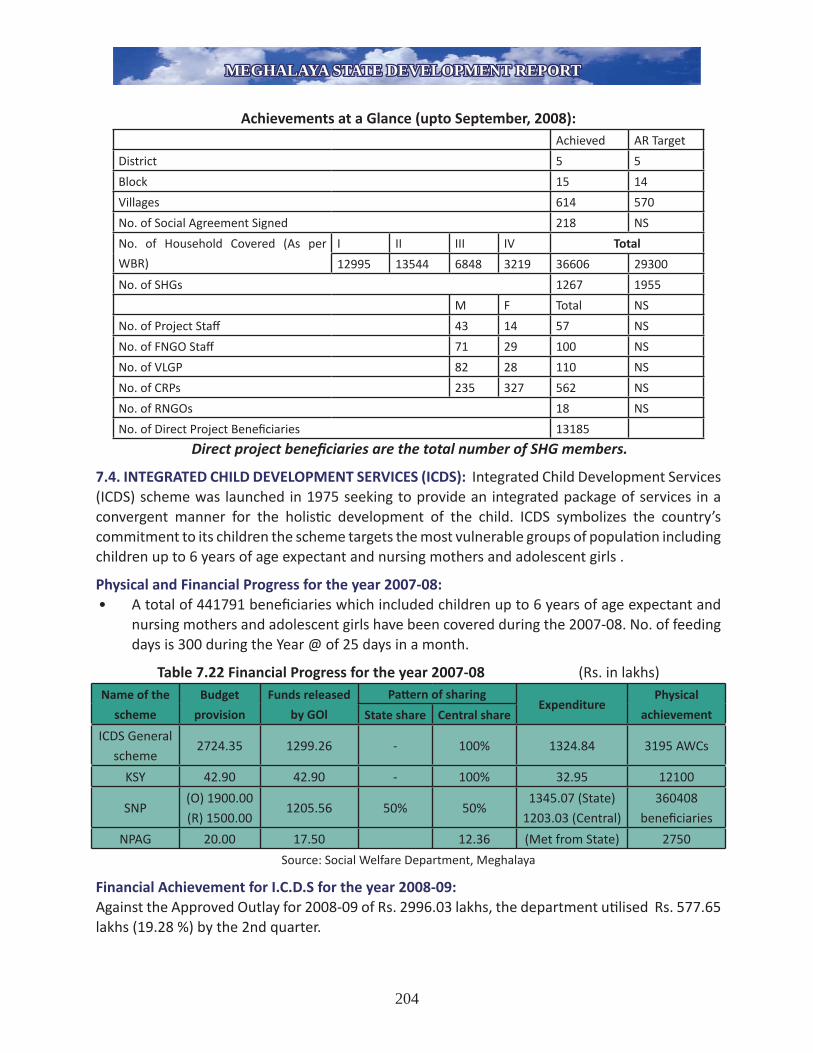
MEGHALAYA STATE DEVELOPMENT REPORTMEGHALAYA STATE DEVELOPMENT REPORT
Achievements at a Glance (upto September, 2008):Achieved AR Target
District 5 5
Block 15 14
Villages 614 570
No. of Social Agreement Signed 218 NS
No. of Household Covered (As per
WBR)
I II III IV Total
12995 13544 6848 3219 36606 29300
No. of SHGs 1267 1955
M F Total NS
No. of Project Staff 43 14 57 NS
No. of FNGO Staff 71 29 100 NS
No. of VLGP 82 28 110 NS
No. of CRPs 235 327 562 NS
No. of RNGOs 18 NS
No. of Direct Project Benefi ciaries 13185
Direct project benefi ciaries are the total number of SHG members.
7.4. INTEGRATED CHILD DEVELOPMENT SERVICES (ICDS): Integrated Child Development Services (ICDS) scheme was launched in 1975 seeking to provide an integrated package of services in a convergent manner for the holisti c development of the child. ICDS symbolizes the country’s commitment to its children the scheme targets the most vulnerable groups of populati on including children up to 6 years of age expectant and nursing mothers and adolescent girls .
Physical and Financial Progress for the year 2007-08: • A total of 441791 benefi ciaries which included children up to 6 years of age expectant and
nursing mothers and adolescent girls have been covered during the 2007-08. No. of feeding days is 300 during the Year @ of 25 days in a month.
Table 7.22 Financial Progress for the year 2007-08 (Rs. in lakhs) Name of the
scheme
Budget
provision
Funds released
by GOl
Patt ern of sharingExpenditure
Physical
achievementState share Central share
ICDS General scheme
2724.35 1299.26 - 100% 1324.84 3195 AWCs
KSY 42.90 42.90 - 100% 32.95 12100
SNP(O) 1900.00(R) 1500.00
1205.56 50% 50%1345.07 (State)
1203.03 (Central)360408
benefi ciaries
NPAG 20.00 17.50 12.36 (Met from State) 2750
Source: Social Welfare Department, Meghalaya
Financial Achievement for I.C.D.S for the year 2008-09:Against the Approved Outlay for 2008-09 of Rs. 2996.03 lakhs, the department uti lised Rs. 577.65 lakhs (19.28 %) by the 2nd quarter.
204

MEGHALAYA STATE DEVELOPMENT REPORTMEGHALAYA STATE DEVELOPMENT REPORT
Physical Achievements against the Physical Targets of Each Components under ICDS up to 30.9.08:
Component Target Cumulati ve Achievement In Nos. Up to 30.9.08 i) State Cell 1 1ii) DPOs 5 5iii) ICDS Projects 39 39iv) Urban ICDS Projects 2 2v) AWCs 3388 3325vi) Mini AWCs 1234 1214vii) Children covered 370962 366470viii) Moderate 15000 15533ix) Severe 295 295x) Rehabilitati on of handicapped 5 NGOs 5 NGOs with 799 benefi ciaries with 799 benefi ciaries
(Source Social welfare Department, Meghalaya) Selecti on of AWWs/AWHs to be recommended by the VLCC.
7.5. Nutriti on and Health Educati on
The Nutriti on and Health educati on component of the ICDS scheme aims, at eff ecti ve communicati on of certain basic health and nutriti on messages with a view to enhancing the mother’s awareness of the child’s needs and her capacity to look aft er these within the family environment.
The AWWs conducts regular home visits in all the AWCs. The AWW through home visit were able to discuss the problems and diffi culti es with regard to health and nutriti on problems of the family and necessary guidance and instructi ons are also given during the visit.
Non-formal Pre-school Educati on
Non-formal Pre-school educati on is one of the important components of the ICDS scheme which covers children in the age group of 3-6 years of age. Pre-school educati on is conducted in all the Anganwadi Centres with the help of pre-school kits supplied by the Department and the colourful wall painti ngs has helped the children enjoyed learning joyfully through play way methods.
Immunisati on and Health Check-up
Immunisati on and Health Check-up is conducted in all the Anganwadi Centres in close coordinati on with the Health functi onaries. Each Anganwadi Centre is provided with a weighing scale and growth cards are maintained by the Anganwadi Workers for all the children benefi ciaries below 6 years so that the workers can detect the growth faltering of the benefi ciaries and in turn can educate the mothers to take care the health and nutriti on aspects of their children.
205

MEGHALAYA STATE DEVELOPMENT REPORTMEGHALAYA STATE DEVELOPMENT REPORT
7.6. Nati onal Nutriti on Mission/Nutriti on Programme for Adolescent Girls (NPAG) Nati onal Nutriti on Mission a new scheme introduced by the Govt. of India during 2002-03 as a Pilot Project for East Khasi Hills District for implementati on of subsidized foodgrains to adolescent girls, expectant and nursing mothers belonging to Below Poverty Line families and undernourished.
The Nutriti on Surveillance System is implemented in all the ICDS projects to check and prevent malnutriti on through the monthly reports submitt ed by the AWWs. Through this system children with Grade Ill and IV are monitored and double rati on for such children have been provided. Through the survey conducted by the AWWs, the child populati on is also being monitored. Birth and deaths records is also maintained by the AWWs and the same was reported and discussed during the submission of the monthly report for further acti on to be taken if necessary. Food and Nutriti on Board also monitors the nutriti on growth of the children in the Centre.
Impact of the Scheme:- The most important impact of the scheme is refl ected in signifi cant decline in the level of Severely Malnourished Children and Malnourished Children and Infant Morality Rate in the State. The percentage of Children suff ering from Severely Malnourished have signifi cantly decline within a short gap from 0.2% during 2005-06 to 0.1% during 2006-07 % and Malnourished Children decline from 8.9% during 05-06 to 8.3% during 06-07. 7.7 Border Areas Development Programme: In 1969, Meghalaya was accorded the status of an autonomous (independent) region within Assam. Meghalaya was granted full statehood in 1972 and became the 21st State of Indian union. The state is bounded by the state of Assam on the north and east. The districts of Goalpara, Kamrup and Nowgong (of Assam) lie in the north and Karbi Anglong and North Cachar Hills districts lie in the east. It is bounded on the South and Southwest by Bangladesh. This internati onal border, which runs for about 443 kilometres, is of strategic and economic signifi cance to the state.
The Border Areas have been defi ned and demarcated as a territory to the distance of 10 Kilometres belt inside the state from the internati onal border with Bangladesh. The following criteria were taken into account:
• Distance from the internati onal boundary with Bangladesh (approximately 10 kilometres distance of crow’s fl ight),
• Degree of economic backwardness, and
• Dependence upon the traditi onal trade relati ons with areas that now fall into the present day Bangladesh
For the implementati on of integrated schemes under the Border Areas Development Programme (BADP) in 1974, the Government prepared a master list of border villages. This list was subsequently revised in 1982 and 1992. At present, there are 1,566 villages falling in the border areas, which cover an area of 4,430 square kilometres, running laterally about 443 kilometres from Dona-Malidor areas in Jainti a Hills District to Mahendraganj in the West Garo Hills District and for some distance towards Mankachar in the West Garo Hills District. The District-wise break up in respect of number of villages and length of area is as given below :
206

MEGHALAYA STATE DEVELOPMENT REPORTMEGHALAYA STATE DEVELOPMENT REPORT
Name of the District Number of villages Length of internati onal boundary (km)Jainti a Hills 152 107East Khasi Hills 383 101West Khasi Hills 208 53West Garo Hills 367 114South Garo Hills 456 68Total 1566 443
Source: Directorate of Border Area DevelopmentTable 7.23: Border Districts, Number of Villages and Border Length in the state
These 1,566 villages were divided into 12 areas. One Border Area Development Offi cer (BADO) has been appointed for each of these areas for administrati ve convenience and for the effi cient implementati on of schemes. Each of these noti fi ed areas fall either fully or partly under the 19 Blocks identi fi ed by the state government.
The length of the internati onal border with Bangladesh is about 443 kms. Before independence, people living in the border areas of Bangladesh used to culti vate crops like oranges, bananas, betel nuts, betel leaves, black pepper, bay leaf, etc. These commoditi es had a ready market in the areas presently in Bangladesh. Similarly some essenti al commoditi es were imported to the bordering areas of the state from Bangladesh. The communicati on from these areas to the interior of the state was virtually non-existent.
Aft er the parti ti on of the country abrupt stoppage of trade with the bordering Shylet and Mymensing resulted into tremendous economic hardship to the people living in the bordering areas of the state. The people of this region were deprived of the traditi onal markets to sell their agro products. Moreover, the traditi onal supply lines for the supply of essenti al commoditi es were also severed. With a view to ameliorate the suff ering of the people inhabiti ng the area and to accommodate and improve their economy, the Border Areas Development Programme was initi ated as a special area programme during the Fourth Five Year Plan. The Border Areas Development Department was created in 1973 and the Directorate of Border Areas Development in 1975 to co-ordinate eff orts to undertake and implement schemes felt urgently needed to being about rapid development of the border areas. The schemes undertaken under the programme are supplemental in nature and are over and above the other developmental schemes undertaken by the diff erent development departments of the State Government in the enti re State, which also included the border areas.
Over the years, various developmental schemes have been taken up under the Border Area Development Programme. However, executi on of these schemes have been entrusted to other development departments like P.W.D., Agriculture, Educati on, Soil Conservati on, Co-operati on, etc., as the Directorate of Border Area Development did not have any technical personnel of its own to enable it to undertake even minor constructi on works.
207

MEGHALAYA STATE DEVELOPMENT REPORTMEGHALAYA STATE DEVELOPMENT REPORT
The Border Area Development Program (BADP) is a 100% centrally funded Special Area Program, which also covers the Border Blocks of the North Eastern States having internati onal borders with Bangladesh, Myanmar, China and Bhutan. Ministry of Home Aff airs (Department of Border Management) administers the BADP programme in respect of the North Eastern states. The guidelines under BADP have been framed by the Empowered committ ee in the Planning Commission and now in the Ministry of Home Aff airs in consultati on with the Ministry of Finance and the State Governments implementi ng the BADP and the state level screening committ ee under the Chairmanship of the Chief Secretary approves the schemes. The main objecti ve of the programme is to meet the special needs of the people living in the remote and inaccessible areas near the internati onal border.
In Meghalaya, the Border Area Development Department is implementi ng the State Plan Schemes and also schemes of the Special Central Assistance under Border Area Development Programme which is 100% funded by the Central Government. Schemes of the Special Central Assistance under Border Area Development Programme are being implemented by the Local Committ ees formed by the concerned villages with technical supervision from the Department for (1) Generati ng Employment opportuniti es among the local people of the area (2) bett er quality and early completi on of the schemes, except those schemes which are highly technical in nature where implementati on has to be done through the Technical Wing of the Department.
The State Government has undertaken schemes mainly under the following acti viti es - Rural Electrifi cati on, Micro Hydel Projects, Ropeway Projects, Constructi on / extension of school buildings, Illuminati on of caves, Constructi on of footpath / footbridges, Constructi on of Community Halls, Constructi on of link roads, Constructi on of playground, Constructi on of market stalls, Constructi on of bus waiti ng sheds, Drinking water & sanitati on facility, and also Individual schemes under Agriculture, Horti culture, Industries, Veterinary, Fisheries, Handloom & Sericulture.
7.8. Conclusions and recommendati ons:
The State of Meghalaya has wide rural urban disparity in terms of level of development if viewed from access to ameniti es and other economic and social indicators of developments of the State. The widespread prevalence of common property resources as ensured by the Consti tuti onal provisions have not contributed to the desired level of change in terms of removal of wide spread inequality among the inhabitants.
The State, ti ll date, remain insular to the paradigm shift in the development policies in India during the last decade of the twenti eth century which took shape in the form of 73rd and 74th Amendment of the Consti tuti on. A considerable amount of debate persists on whether the absence of Panchayati Raj insti tuti on limits the level of eff ecti ve parti cipati on of the people in the development acti viti es at the grass root level. Moreover, it also limits the parti cipati on of women in the decision-making processes. It is nevertheless believed that a more enabled, empowered, eff ecti ve, accountable and parti cipatory governance is required at the grass root level.
208

MEGHALAYA STATE DEVELOPMENT REPORTMEGHALAYA STATE DEVELOPMENT REPORT
There has been a reducti on of poverty at the nati onal level in recent ti me, but the rural areas in Meghalaya conti nues to exhibit a high incidence of poverty. Though the general poverty scenario as menti oned in various reports has been acknowledged by the policy makers at diff erent level, there has been no detail database on this subject in Meghalaya so far. This has complicated the issues of objecti ve identi fi cati on of the poverty stricken areas and has limited the eff ecti veness of the required interventi ons. Moreover, there is no formal database on land use, which has further complicated the situati on.
The development acti viti es in the rural areas of the State show that there has been wide gap between targets and achievements. The schemes of employment generati on and self-employment have suff ered most in this respect. The low level of asset formati on is also evident from the small proporti on of capital expenditure to the total expenditure in the rural development in the State.
The level of access to ameniti es to rural households also point out very low level of penetrati on of various faciliti es. A lot of ground has to be covered in areas like rural sanitati on and water supply. The scatt ered nature and small size of the villages also pose a great problem in terms of connecti vity. The remoteness of sett lements on one hand is a major stumbling block for the government to provide social and economic infrastructure in a cost eff ecti ve manner and on the other hand limits the expansion of economic endeavours of the rural populati on. All these factors can be identi fi ed for the general economic backwardness in the backdrop of an otherwise socially progressive society in Meghalaya.
The recommendati ons of this secti on mainly points out the necessary measures in terms of the subjects discussed above. But these must be supplemented with those in agriculture and resource management that are dealt separately.
• The absence of decentralized governance at grass root level is the major concern. The Sixth Schedule has hardly helped as an instrument of self-management and social and economic changes. The 73rd Amendment on the other hand promises more democrati c way of land and community asset management for a bett er rural society of economic viability. It also provides for empowerment of the socially vulnerable secti ons in general and women in parti cular. There is enough scope within the provisions of 73rd amendments to accommodate the existi ng form of governance by State in transforming the Autonomous District Councils and role played by the traditi onal tribal councils. Thus the State must take initi ati ve to look into the prospect of introducing some form of decentralized governance. In the Northeast Arunachal Pradesh has gone ahead by accepti ng the 73rd consti tuti onal Amendment and consti tuted the Panchayat insti tuti ons. A close scruti ny of the Arunachal law on this subject should be taken up immediately involving all the concerned parti es of the state.
• There should be formal database on rural poverty. The proposed study of Human Poverty Index should be expedited. The result of the household survey of the BPL families should be
209

MEGHALAYA STATE DEVELOPMENT REPORTMEGHALAYA STATE DEVELOPMENT REPORT
consulted at every step of programme implementati on and necessary correcti ve measures should be taken up in the process without any prejudice if any discrepancy is noti ced.
• The fi nancial performance of various schemes of rural development though available its spati al coverage should be maintained and published. Moreover the physical achievements should be made accessible to all concerned. The methodology and format to generate data and informati on on physical achievements of various schemes and their special coverage should be prepared with the help of competent agencies. Special eff ort should be in place to identi fy and document the best practi ces in rural development acti viti es.
• The involvement of the NGOs, CBOs have been found to be very crucial as suggested by the bett er performance of Special Rural Works Programme (SRWP) where local communiti es parti cipated acti vely. The government should take up necessary steps to involve such organizati ons to improve the eff ecti veness of the programme implementati on. Conversely, hijacking or pocket boroughing Rural Development schemes should be fi rmly rejected and contained
• The share of capital expenditure in rural development works should increase to the desired level to sustain the development initi ati ves. Special care should be given to generate economic assets of the rural people.
• The rural populati on of Meghalaya is almost enti rely dependent upon agriculture and allied sectors. These sectors however are characterized with low input output rati o and poor producti vity. A development of agriculture, horti culture, animal husbandry and fi sheries etc. can help provide sustainable employment to many rural households and help alleviate rural poverty. Rural development, indeed any development is linked to shift ing an economy from primary producti on level to that producing value added products. This shift is facilitated by an effi cient knowledge creati on and disseminati on system. This system should in the interest of effi ciency be supported by government but managed by independent widely networked insti tuti ons with wide, effi cient and rapidly upgrading learning organizati on. Performance and support to this organizati on should be outcome achievement linked. Given the rather small size of the State such a model can be successfully implemented.
210

RAIN WATER HARVESTING
RURAL WATER SUPPLY SCHEME

IAY SCHEME
RURAL SANITATION

RURAL DEVELOPMENT IN WEST GARO HILLS


MEGHALAYA STATE DEVELOPMENT REPORTMEGHALAYA STATE DEVELOPMENT REPORT
CHAPTER VIII
URBAN DEVELOPMENT
8.1. Introducti on Urbanizati on in Meghalaya has maintained a steady growth. As per 2001 Census, the state has only 19.58% urban populati on, which is much lower than the nati onal average of 28%. Majority of people of the State conti nue to live in the rural areas and the same has also been highlighted in the previous chapter. As the urban scenario is a refl ecti on of the level of industrializati on, commercializati on, increase in producti vity, employment generati on, other infrastructure development of any state, this clearly refl ects that the economic development in the state as a whole has been rather poor. Though urbanizati on poses many challenges to the city dwellers and administrators, there is no denying the fact that the process of urbanizati on not only brings economic prosperity but also sets the way for a bett er quality of life. Urban areas are the nerve centres of growth and development and are important to their regions in more than one way. The current secti on presents an overview of the urban scenario of the state.
8.2. Urban sett lement and its growth in the state8.2. Urban sett lement and its growth in the statePresently the State has 16 (sixteen) urban centres, predominant being the Shillong Urban Agglomerati on (UA). The Shillong Urban Agglomerati on comprises of 7(seven) towns viz. Shillong Municipality, Shillong Cantonment and fi ve census towns of Mawlai, Nongthymmai, Pynthorumkhrah, Madanrti ng and Nongmynsong with the administrati on vested in a Municipal Board and a Cantonment Board in case of Shillong municipal and Shillong cantonment areas and Town Dorbars or local traditi onal Dorbars in case of the other towns of the agglomerati on. The enti re Shillong agglomerati on has been considered as a single unit in this chapter. Among the other nine urban sett lements eight are statutory towns with local administrati on in form of Town Committ ees or Municipal Boards, and one i.e. Sohra a census town. The following table shows the status of the urban centres in the State.
Table 8.1 List and Administrati ve Status of the Urban Centres in MeghalayaSl. No Name of Town District Administrati ve Status
01 Shillong Municipal Board
East Khasi Hills Municipality
02 Shillong Cantonment East Khasi Hills Cantonment Board
03 Mawlai East Khasi Hills Census Town
04 Madanrti ng East Khasi Hills Census Town
05 Nongthymmai East Khasi Hills Census Town
06 Nongmynsong East Khasi Hills Census Town
07 Pynthorumkhrah East Khasi Hills Census Town
08 Cherrapunjee East Khasi Hills Census Town
09 Nongstoin West Khasi Hills Town Committ ee/District Headquarter
10 Mairang West Khasi Hills Town Committ ee
11 Nongpoh Ri-Bhoi Town Committ ee/District Headquarter
211

MEGHALAYA STATE DEVELOPMENT REPORTMEGHALAYA STATE DEVELOPMENT REPORT
12 Jowai Jainti a Hills Municipality/District Headquarter
13 Tura West Garo Hills Municipality/District Headquarter
14 Williamnagar East Garo Hills Municipal Board/District Headquarter
15 Resubelpara East Garo Hills Municipal Board
16 Baghmara South Garo Hills Municipal Board
Source: Census of India, 2001
On the increase of sett lements, it has been found there has been nominal additi on in the number of urban areas in the state ever since its incepti on. There were only six towns from 1971 – 1981 namely Shillong Municipality, Shillong Cantonment, Mawlai and Nongthymmai within Shillong Urban Agglomerati on and Jowai and Tura. During 1981 census, six more towns were included namely Pynthorumkrah and Madanrti ng within Shillong Urban Agglomerati on and Sohra (Cherrapunjee), Nongstoin, Williamnagar and Baghmara taking the count to twelve. No new towns were included during 1991. However, in the last census of 2001 four more new towns came up, namely, Nongmynsong within Shillong Urban Agglomerati on and Mairang, Resubelpara and Nongpoh taking the number to sixteen altogether.
On the status of the urban centres, study indicates that there are eight towns of class IV size, fi ve towns of class III size and one town each of class I, II and V sizes. The distributi on of populati on class wise shows the towns of Shillong Urban Agglomerati on consti tutes about 59.2% of the total urban populati on. This indicates absolute primacy in the sett lement hierarchy of urban centres in the state. The other class II town consti tute only 12.9% of total urban populati on implying that there is a wide gap between the largest and second largest town in the State.
8.3. Urban Populati on
Growth Trend
The urban populati on in Meghalaya has grown from 147,150 in 1971 to 240,733 in 1981, 330,047 in 1991 and fi nally 454,111 in 2001. The decadal growth rate of urban populati on was 63.60% in 1971-81, 37.10% in 1981-91 and 37.59% in 1991-2001. For the country as a whole, the decadal growth of populati on in urban areas during 1991-2001 was 31.2%. Thus the growth rate has remained higher than the nati onal fi gure, which conforms to the general patt ern of the urban growth in India since 1950s. Further, the trend of concentrati on of urban populati on in the State conti nues to be in the urban agglomerati on of the capital city. Shillong and Tura accounts for 71.93% of the total urban populati on. It is expected that the increasing trend of urbanizati on will conti nue in
Distrubution of Population %
59%13%
10%
16% 2% I
II
III
IV
V
Figure 10.2 : Size Class Distributi on of UrbanPopulati on 2001 (Source : Census of India, 2001)
212

MEGHALAYA STATE DEVELOPMENT REPORTMEGHALAYA STATE DEVELOPMENT REPORT
the near future. The individual growth rate of Shillong Urban Agglomerati on has been 19.83% during the last census decade (1991-2001). Among the three other important towns, the growth rate for the same period has been 61.14% for Nongstoin, 21.63% for Jowai and 28.03 for Tura. If the towns within the Shillong UA are taken individually it is evident that the growth of populati on during 1991-2001 within the Shillong Municipality area has been nominal (less than 1%). However, the fi ve smaller census towns within the Shillong UA has grown considerably during this period which has actually contributed to the over all growth of Shillong UA.
District Wise Distributi on of Towns and Urban Populati onThe East Khasi Hills, West Khasi Hills and East Garo Hills district have two towns each while the other four districts have one town each. The contributi on of district to the total urban populati on also varies to a large extent. The highest contributi on is made by East Khasi Hills District, which accounts for 60% of the total urban populati on of the state. However, the lowest concentrati on of urban populati on is in the South Garo Hills district, which has only 2% of the total urban populati on. The populati on distributi on indicates that there are signifi cant inter district variati ons in the distributi on of urban populati on. The East Khasi Hills has the highest level of urbanizati on as nearly 42% of the total populati on of the district lives in the urban areas. Apart from the East Khasi Hills, all other districts have low level of urbanizati on ranging from 14.33% in East Garo Hills to 6.84% in Ri-Bhoi district. The level of urbanizati on in all the districts except East Khasi Hills is below the state average of 19.8%.
8.4. Urban Management and Service DeliveryA complex legal framework vis-à-vis the consti tuti onal status of the State dominates the urban governance and management in the State. Except for the Shillong Municipality, all the areas of the State are classifi ed as “Tribal Area” as per Arti cle 244 of the Consti tuti on of India whereby powers to make laws and rules on a number of subjects have been vested in the Autonomous District Councils. The Meghalaya Town and Country Planning Act, 1973 (The Assam Town and Country Planning Act, 1959 as adopted by Meghalaya) as well as the Meghalaya Municipal Act, 1973 (The Assam Municipal Act, 1956 as adopted by Meghalaya) are in force over the whole State. While Municipal Boards have been consti tuted in some towns under the provision of the Municipal Act, management of some towns are with the Town Committ ees consti tuted by the Autonomous District Councils. In some town like Sohra there is no urban local body. However, because of various underlying problems, these bodies are yet to establish themselves fi rmly and are mostly dependant on the government for most of their obligatory functi ons. In this scenario, government departments and parastatal agencies besides traditi onal village bodies have been involved in the civic management and service delivery in most of the towns.
8.5. Urban InfrastructureProcess of urbanizati on has created a huge gap between demand and supply of urban services and infrastructure. Under such a scenario, the supply of urban infrastructure to meet the existi ng demand and ever increasing demand is a huge task, which asks for bett er effi cient management
213

MEGHALAYA STATE DEVELOPMENT REPORTMEGHALAYA STATE DEVELOPMENT REPORT
to solve the problem of quality and availability of urban services and infrastructure. The style of urban infrastructure provision that encourages more effi cient patt ern of resource consumpti on is the basis for development of sustainable citi es. Therefore, the biggest challenge for the urban management agencies is to provide its citi zens with reliable services that are fi nancially and environmentally sustainable. This secti on details the quality of urban services off ered by various agencies in the state of Meghalaya.
Water SupplyThe PHED provides the bulk water supply in the urban areas of the state whereas the distributi on is vested either in the Department concerned or the Municipal Board as in case of Shillong and even to the Autonomous District Council as in the case of Tura. Besides village bodies are also involved in water supply management. They developed small water schemes supplying the water through stand posts. Small springs are also used by nearby residents to meet their water needs. As per the Census report almost 71% of the households in the urban areas receive drinking water from tap, though there are considerable inter-town variati ons. With populati on increasing, it is imperati ve that water demand would be a serious challenge in all the towns. Major issues of drinking water include improvement in distributi on system, inequitable distributi on, water resource management & treatment, rati onalizati on of water usage, insti tuti onal arrangements, besides capacity enhancement. The table below gives the distributi on of households by locati on of drinking water among the diff erent towns.
Table 8.2 Distributi on of Households by Locati on of Drinking Water (in %)
Within Premises Near Premises AwayTura (M) 54 32 14Resubelpara (MB) 45 43 12Williamnagar (MB) 40 51 9Baghmara (MB) 27 40 33Nongstoin (TC) 18 55 27Mairang (TC) 13 69 18Nongpoh (TC) 17 26 58Mawlai (CT) 28 51 21Shillong Cantt . (CB) 47 28 25Shillong (M) 73 20 7Pynthorumkhrah (CT) 33 47 19Nongmynsong (C) 7 29 64Nongthymmai (CT) 67 19 14Madanrti ng (CT) 23 35 42Cherrapunjee (CT) 31 51 18Jowai (M) 51 29 20
Source: Census, 2001
214

MEGHALAYA STATE DEVELOPMENT REPORTMEGHALAYA STATE DEVELOPMENT REPORT
Sanitati on
There is no sewerage system in any of the urban areas of the State. The domesti c wastewater,
comprising of sewage and sullage, is either disposed off into individual septi c tanks and soak pits
or fl ows into the primary, secondary and natural drains and fi nally to the nearby rivers. Based
on the Census Report 2001, coverage in the urban areas is about 91.58% of which 47.54% have
sanitary latrines and 52.46 % have pit and other types of latrines. About 8.41 % have no toilet
facility. Septi c tank systems are used by majority of the households. A major drawback of these
systems is the high potenti al for ground water polluti on. The other disadvantages of the septi c
tank systems are high capital cost per user and need for regular desludging. The table below gives
the distributi on of households by type of latrine facility among the diff erent towns.
Table 8.3 Distributi on of Households by Type of Latrine (in %)
Area NameType of Latrine within the housePit Latrine Water closet Other Latrine No Latrine
Tura Municipal Board 45 20 25 10Resubelpara Municipal Board 84 6 6 4Williamnagar Municipal Board 63 20 9 8Baghmara Municipal Board 41 15 20 24Nongstoin Town Committ ee 42 36 5 17Mairang Town Committ ee 67 8 4 21Nongpoh Town Committ ee 56 10 14 20Mawlai Census Town 52 32 14 2Shillong Cantt . Cantonment Board 14 31 32 23Shillong Municipal Board 14 66 15 5Pynthorumkhrah Census Town 44 39 17 0Nongmynsong Census Town 57 29 10 4Nongthymmai Census Town 11 67 16 6Madanrti ng Census Town 24 66 7 3Cherrapunjee Census Town 13 26 14 47
Source: Census, 2001
Storm Water DrainageA major problem in all the towns is absence of adequate drainage system which is posing problems of water logging and fl ooding, causing landslips and soil erosion. This situati on is aggravated by indiscriminate and uncontrolled developmental acti viti es add to the problem causing obstructi on of drains and encroachments on rain fl ow paths. The table below shows the distributi on of households by type of connecti vity of drainage facility revealing that almost all the urban areas are either connected to open drains or no drain at all.
215

MEGHALAYA STATE DEVELOPMENT REPORTMEGHALAYA STATE DEVELOPMENT REPORT
Table 8.4 Distributi on of Households by Connecti vity of Drainage (in %)
Area NameType of drainage connecti vityClosed drain Open drain No drain
Tura Municipal Board 9 34 57Resubelpara Municipal Board 2 19 79Williamnagar Municipal Board 7 29 64Baghmara Municipal Board 3 27 70Nongstoin Town Committ ee 10 27 63Mairang Town Committ ee 8 28 64Nongpoh Town Committ ee 4 54 42Mawlai Census Town 12 80 8Shillong Cantt . Cantonment Board 18 76 6Shillong Municipal Board 24 72 4Pynthorumkhrah Census Town 11 75 14Nongmynsong Census Town 5 79 16Nongthymmai Census Town 17 78 5Madanrti ng Census Town 6 89 5Cherrapunjee Census Town 6 68 26
Source: Census, 2001
Solid waste Management
Management of solid wastes is perceived as a crucial civic service with great environment implicati ons. In the Municipal areas collecti on of waste in the city is through primary collecti on from waste depots/garbage bins. There is also a system of street sweeping in all municipal towns. However, there are sti ll problems of collecti on, since not all garbage generated is removed leading to spill over to drains, streams and public places. In the non municipal towns, collecti on of garbage is not regular but managed on adhoc basis and operated through the system established by the local village bodies /community/NGO. Typically, residents bring their garbage to the collecti on trucks or drop it at a designated locati on, which may be just an open spot. This garbage is then loaded into the trucks manually, necessitati ng multi ple handling of waste. The esti mated waste generati on for the major towns is provided as follows:
Table 8.5 Esti mated Waste Generati on in major towns
Sl. No. Source of Data Esti mated Waste Generati on (MT)1. Shillong Urban Agglomerati on 1742. Tura Municpal Board 24.53. Jowai Municpal Board 224. Williamnagar Municipal Board 185. Baghmara Municipal Board 10
216

MEGHALAYA STATE DEVELOPMENT REPORTMEGHALAYA STATE DEVELOPMENT REPORT
6. Resubelpara Municipal Board 13.307. Nongstoin 8.158. Nongpoh 3.83
Source: DUA, Shillong, 2007
At present, Shillong is the only urban centre to boast of a centralised waste disposal and treatment facility. As part of that facility, a 100 TPD compost plant has been developed on a PPP mode. However the smooth operati on of the plant has been aff ected to a large extent by the absence of a landfi ll site to absorb the rejects from the composti ng process. A site for a sanitary landfi ll site has now been identi fi ed. An incinerator for bio-medical waste disposal is also operati ng in the same site. In Tura, a 40 TPD vermin-composti ng plant has been developed and the same is under operati on. Municipal Boards of Williamnagar, Baghmara and Resubelpara have already identi fi ed permanent sites for waste disposal and the same is under development. There is problem of a permanent disposal site for Jowai Municipal Board and the Board is presently using a site belonging to the Jainti a Hills Autonomous District Council. In the non-Municipal towns, there is no proper system of waste disposal and waste is generally dumped on any available site without any environmental considerati ons.
Quality of Housing
Housing conditi on in the towns is mainly characterized by medium density development, mostly either semi pucca or pucca structures with a substanti al number of kutcha houses. As per the Census, the conditi on of houses used for residence and other purposes in the urban areas shows that 60.8% are in good conditi on, 34.7% in liveable conditi on and 4.5% in a dilapidated conditi on. Moreover 87.7% of the households live in houses with pucca roof material. In 1988, the Government of Meghalaya evolved State Housing Policy which lays emphasis on increasing the housing stock and qualitati ve upgradati on of existi ng shelters by way of providing necessary constructi on material at subsidized rate and soft loan for the poorer secti on of the people. As regards other income group people it envisages to facilitate fl ow of insti tuti onal fi nance for constructi ng houses. The main emphasis of is to encourage private individuals and co-operati ve societi es for owning the houses.
Transportati on
Transport Infrastructure is one of the important needs of the people in order to facilitate various producti ve acti viti es in any area and general well being of the society at large. This sector of urban development seems to be enti rely neglected in most of the urban centers of the state. It has been assessed that except for Shillong, transportati on facility in the other areas is far from sati sfactory. Further the topographic and concentric development of most of the towns has aggravated the problem. Though most of the towns are very small but because of the narrow roads and yearly growth of vehicles, the signs of traffi c congesti on have already appeared in many of the town’s roads. In most cases the major highways passes through the city centre as a result of which
217

MEGHALAYA STATE DEVELOPMENT REPORTMEGHALAYA STATE DEVELOPMENT REPORT
regional traffi c comes in confl ict with the local traffi c. The role of public transport is also limited in most cases because of inadequate road network, poor infrastructure and scatt ered demand. Shared Taxi and other modes such as buses are plying in the city for intracity movement. Absence of suffi cient footpath network along the busy corridors of the roads also aff ects smooth movement of both vehicular and pedestrian traffi c. It is clear from the above that to address the various issues more innovati ve and calculati ve approach would be required to address the various issues. It is essenti al that besides improvement of the various intersecti ons and constructi on of off -street parking faciliti es, an effi cient system for the town can be achieved by evolving functi onally inter-related land use patt ern by opti mizing both travel ti me and travel costs.
8.6. Urban PovertySlums have emerged in the urban areas of the State purely due to lack of basic infrastructure in such areas. As per the provisions of Meghalaya Slum Areas (Improvement and Clearance) Act, 1973 (The Assam Slum Areas (Improvement and Clearance) Act, 1959 as adopted by Meghalaya), 45(forty fi ve) slums have been identi fi ed and noti fi ed and 5(fi ve) more have been identi fi ed but yet to be noti fi ed, in 6(six) towns in the State. Slum populati on consti tutes around 42 % of the populati on of these towns.
Most of the slum pockets are located in low lying and water logged areas and is in very poor sanitary conditi on and unhygienic surroundings. Most of them are temporary structures. Signifi cant percentage of people do not have access to basic services viz. water supply, electricity, toilets, sewerage, drainage, solid waste disposal faciliti es, health care faciliti es, schools paved streets etc. Poor civic ameniti es and inadequate sanitati on are widespread in slums thus increasing the vulnerability of the urban poor. The Urban Aff airs Department and the municipaliti es are the agencies taking up slum improvement works in the state.
The problem of poverty is complex and multi dimensional and its soluti on requires harnessing resources to tackle urban poverty in its numerous dimensions. The subject is complex due to the litt le insight available on the socio-economic characteristi cs of the State and inadequacy of reliable data. As a consequence, limited studies are available on this aspect and fewer sti ll are att empts to address the poverty reducti on. Based on the surveys conducted in the municipal towns of the State, over the period from 1990 ti ll 2000, as per the old guidelines of urban poverty alleviati on programmes, BPL populati on consti tuted around 22 % of the total populati on of these towns. A fresh survey for identi fi cati on of the BPL populati on as per new poverty line of Rs. 347.42 per capita/per person/per month as fi xed by the Planning Commission, is now under progress in all the municipal towns.
8.7. Programme and PlansOver the years government bodies has been putti ng constant eff orts to improve the urban development within the towns. Policies and programmes are being constantly implemented to achieve the desired goals. This is supplemented by Five Year Plans vis-a vis Annual Plans to project
218

MEGHALAYA STATE DEVELOPMENT REPORTMEGHALAYA STATE DEVELOPMENT REPORT
the fi nancial requirement and focus the strategies for development. Some of the important ongoing schemes are highlighted below:
Ongoing Schemes(i) Infrastructure Development (ID): The schemes aims for providing of basic infrastructure at town and locality level, like constructi on of roads, footpaths, community halls, parking lots, neighbourhood markets and land acquisiti on for infrastructure projects. The scheme is being implemented in all District Headquarter towns viz. Shillong, Tura, Jowai, Williamnagar, Baghmara, Nongstoin and Nongpoh.
(ii) Environmental Improvement of Urban Slum (EIUS): The EIUS schemes which are a part of 20 Point Programme are being implemented in the slum areas of Shillong, Tura, Jowai, Baghmara, Williamnagar & Nongstoin. The scheme has played a signifi cant and sati sfactory role in the improvement of slum environment and upgradati on of basic infrastructure in the slum areas of the above towns. Basic ameniti es like drains, footpaths, sanitati on faciliti es, drinking water supply etc., have been provided under the scheme. In all, improvement works have been taken up in 45 noti fi ed and 5 identi fi ed slums in the State over the years.
(iii) Special Urban Works Programme & Chief Minister’s Special Urban Development Fund (SUWP & CMSUDF): The Special Urban Works Programme (SUWP) also known as MLA scheme as well as Chief Minister’s Special Urban Development Fund (CMSUDF) is being funded by the State Government and implemented through the Municipal Boards and Urban Aff airs Department respecti vely in the Urban and Semi-Urban Consti tuency with an objecti ve to generate wage employment through creati on of useful public assets. Normally Rs 100.00 lakhs is provided to each MLA every year and the CM each year under SUWP and CMSUDF respecti vely.
(iv) Nati onal Urban Informati on System (NUIS)): This is a newly launched Centrally Sponsored Schemes with an objecti ve to create a comprehensive urban informati on system involving both att ribute and spati al data for various levels of urban planning and decision support. The schemes has two major components: - (i) Urban Spati al Informati on System (USIS) and (ii) Nati onal Urban Data Bank and Indicator (NUDB&I) with diff erent sub components like town mapping, data bank, systems, capacity building etc. The funding patt ern of the scheme is diff erent for diff erent components but works out overall in the rati o 70:30 between central and state Government.
(v) Swarna Jayanti Shahari Rozgar Yojana(SJSRY): This is a Centrally Sponsored Scheme under Urban Poverty Alleviati on Programme implemented through the Municipal Boards in Shillong, Tura, Jowai, Williamnagar, Baghmara and Resubelpara. This scheme has three major components viz., Self Employment, Wage Employment and Community Structure. Under Self Employment component, loan and subsidy is extended to urban poor benefi ciaries. Under Wage Employment, community assets are created by community-based organizati on through wage employment to poor benefi ciaries. Under Community Structure component, social inputs like health, nutriti on etc., are provided to poor benefi ciaries.
219

MEGHALAYA STATE DEVELOPMENT REPORTMEGHALAYA STATE DEVELOPMENT REPORT
(vi) New Shillong Township: As part of recommendati on of the Shillong Master Plan 1991-2011, a new township is proposed to be developed over 2030 hectares of land to accommodate the future populati on of Shillong. It is also proposed to acquire only 500 hectares of land which will come under direct Government interventi on. In this 500 hectares, apart from laying the enti re basic infrastructure, the administrati ve, insti tuti onal, general housing, commercial and community faciliti es will be established. In the remaining areas development through private sector interventi on is envisaged. Till date, 370.26 hectares have already been acquired at a total cost of Rs. 33.74 crores. Part of this expenditure has been met out of the State Plan Budget of Urban Aff airs Department and part from Additi onal central Assistance extended by Government of India from ti me to ti me. Land has been allott ed for establishment of various reputed nati onal insti tutes like Indian Insti tute of Management, Nati onal Insti tute of Fashion Technology. Informati on Technology Park etc. Detailed Project Report for diff erent sectors like road, water supply, sewerage drainage etc. has been fi nalized and eff orts are now being made to mobilize fund for laying the same.
(vii) Jawaharlal Nehru Nati onal Urban Renewal Mission(JNNURM): This is a major initi ati ve of Government of India started during 2005-2006 to revamp and upgrade infrastructure in major urban centres in the country. Assistance under the programme is linked to implementati on of reforms in the urban sector aimed towards bett er service delivery, transparency, accountability and people’s parti cipati on. While Shillong has been selected under the programme, the other towns are eligible to avail assistance under two omnibus schemes called Urban Infrastructure Development for Small and Medium Towns (UIDSMT) and Integrate Housing and Slum Development Programme (IHSDM). As a part of the programme, City Development Plan and Vision Statement has been prepared for Shillong as well as the other district headquarter and municipal towns. An agreement has also been signed with Government of India to implement the reforms within specifi ed ti meframe. Till date (September 2008) projects amounti ng to Rs. 27,022.04 lakhs have been sancti oned under the programme.
The Five Year PlansTenth Five Year Plan (2002-07): During the Tenth Plan, thrust was laid on the orderly growth and sustainability of urban centres and potenti al growth centres. With this objecti ve in mind, priority was accorded for enhancing the level of physical ameniti es and infrastructure, setti ng up of a new township near Shillong, strengthening of the local bodies in the urban centres, upgradati on and improvement of slum areas and poverty alleviati on programmes. The approved outlay for Urban Development during the Tenth Plan period was Rs. 10,650 lakhs against which expenditure incurred was Rs. 5930.53 lakhs.
Eleventh Five Year Plan (2008-12): During the Eleventh Five Year Plan, the strategy has largely remained the same as adopted in the tenth plan with a slight shift towards urban reforms to improve the urban governance, enhance quality of delivery of services and to ensure sustainable development of urban areas, to provide impetus to the economic growth and improve quality of life of citi zens. The objecti ve of the Eleventh Plan being;
220

MEGHALAYA STATE DEVELOPMENT REPORTMEGHALAYA STATE DEVELOPMENT REPORT
(i) Focused att enti on to integrated development of infrastructure services in urban areas in a mission mode keeping in mind the effi cient delivery and sustainability of services.
(ii) Focused att enti on to integrated development of basic services to the urban poor keeping in view the effi cient delivery and sustainability with emphasis on universal access to urban poor.
The proposed outlay for the Eleventh Plan is Rs 23,000.00 lakhs.
8.8. Issues and Recommendati onsIssues
• A low level of urbanizati on characterizes the state of Meghalaya, as only about 20% of the state’s populati on lives in urban areas. The urban scenario in Meghalaya is dominated by the overwhelming presence of only one town, i.e. Shillong. About 60% of the total urban populati on is concentrated in Shillong. The only signifi cant town aft er Shillong is Tura, which has a populati on of over fi ft y thousand. The distributi on of urban populati on suggests that apart from the East Khasi Hills, all other districts have a very low level of urbanizati on, much below the state average. Although there has been increase in the number of towns, second order towns with growth potenti al are yet to emerge as a favoured urban desti nati on in the State. As per projecti ons made by the Census of India, the State would achieve around 24.7% overall level of urbanizati on as against 34% nati onal average by 2016.
• Multi plicity of authoriti es and complex legal framework for urban development vis-à-vis the consti tuti onal status of the State is hampering urban development in the State.
• The capital city is increasingly becoming congested for want of space. The space constraint is most criti cally felt with respect to transportati on, parking, housing and development of commercial areas. Moreover the capital city is located in fragile environment prone to natural disasters like earthquakes and landslides. Planned development is therefore an absolute necessity. Under the provisions of The Meghalaya Town and Country Planning Act, 1973, Urban Aff airs Department have taken up the responsibility of preparati on of Master Plans of the urban areas of the State.
• Provision of basic urban infrastructure seems to be the main area of concern in the State. Although there are possibiliti es of investment in Shillong Urban Agglomerati on, the issue of insti tuti onal arrangement for Shillong Urban Agglomerati on has to be addressed. The state capital has seen rapid growth in its fringe area, which do not
221

MEGHALAYA STATE DEVELOPMENT REPORTMEGHALAYA STATE DEVELOPMENT REPORT
come directly under the jurisdicti on of Shillong Municipal Board, and provision of civic services are a matt er of concern in these areas. At present the other urban centres, although of smaller populati on size, have their own requirements of investment. As per an assessment made under JNNURM, the total investment required for creati on and augmentati on of the infrastructure in all the district headquarters towns and the municipal town of Resubelpara is over Rs. 4000.00 crores.
• Most towns in the State have evolved around the central business district. The terrain conditi on prohibits high density development. There are needs of decentralizati on of acti viti es. Setti ng up of Satellite townships for Shillong, Tura and Jowai requires explorati on.
• Urban governance structure and management is in a state of fl ux. Both urban development schemes as well as rural development schemes are in operati on in urban areas. Apart from municipal towns, Community and Rural Development Department is operati ng in the other towns.
• Financial resource mobilizati on and its augmentati on for the ULBs has been an area of concern. Financial dependence on the State has aff ected the infrastructure provision in urban areas. Although 74th CAA has introduced a system of smooth sharing of resources between State Government and ULBs on the one hand, and between diff erent municipal bodies on the other, by insti tuti on of State Finance Commission, yet the State remains outside the purview of 74th CAA. Most investment on development and upgradati on of urban infrastructure is made by the State Government through its Departments as per provisions in the State Plan budget. The investment is not commensurate with the proporti on of populati on residing in the urban areas. Only grant-in-aid assistance is extended to the ULBs to meet its resource gap.
Recommendati onsUrban development is not simply the improvement in physical infrastructure but also improvement of the economy as well as the capacity, transparency and accountability of the governing insti tuti ons in charge of the urban aff airs. Understanding the growth of urban development is essenti ally to understand the economy of the region, guide its expansion for the overall economic development and forecast future land use, suggest opti mum uti lizati on of space and to minimize adverse ecological impacts. Based on the above premises, the following recommendati ons are made for urban development in the State:
• There should be a shift from the existi ng physical planning approach to a regional economic development approach with an integrated urban-rural planning strategy.
• In the past urban development has focused only on the development of physical infrastructures including housing, roads, access to water, sanitati on electricity and
222

MEGHALAYA STATE DEVELOPMENT REPORTMEGHALAYA STATE DEVELOPMENT REPORT
other basic ameniti es. However there exist a need of change the focus to strengthen the governing insti tuti ons that are responsible for taking decisions concerning infrastructure and the services rendered. There arises a need for strategic planning to assist in developing stronger foundati on for eff ecti ve local government. In order to improve the performance of urban development the decision makers should be made more responsible and accountable for their decisions and acti ons. In additi on, a number of policy and regulatory instruments are needed to transform local governments from ‘implementi ng’ to ‘enabling’ environment.
• There is a need for increased investment for urban development which should be commensurate to the proporti on of populati on residing in these areas. There is also a need for enhancement of municipal revenue by restructuring the tariff structure to ensure cost recovery. Simultaneous improved fi nancial management in the ULBs is also called for.
• Urban poverty has largely remained a neglected sector. A strategy needs to be adopted to bring about urban poor mapping in all the towns followed by provision of basic services to the poor and creati on of employment opportuniti es.
• The state of Meghalaya is characterised by a disti nct ‘Urban Primacy’. There is a clear need for public interventi on to induce growth and development in other urban centres. As the scope for large amount of public investment is limited, suitable interventi ons in terms of favourable policy incenti ves for investments in other urban centres may be contemplated. This will not only relieve some pressure on the State capital of Shillong, but also contribute considerably to the over all growth of the economy and bett er distributi on of employment opportuniti es.
• Land is not a freely marketable resource in Meghalaya on account of the land tenures system and other land transfer laws. This, to some extent hampers a well-balanced urbanizati on process. There is a need to devise a mechanism for providing some limited relaxati on of rules and regulati ons in respect to land transfer in certain areas for encouraging bonafi de development acti viti es. This would defi nitely favour the growth of urbanizati on in the other parts of the state.
• Due to the historical signifi cance of Shillong, it is one of the best towns among the hill stati ons of the country and in the North Eastern region in parti cular. It is equipped with good quality infrastructure, especially the quality of road network. Necessary eff ort should be in place to maintain the standard of roads and improve the water supply, sanitati on and solid waste collecti on and disposal, which are presently areas of concern. There is a need for a satellite township to relieve the burden on the state capital as perceived by the government. The process must be expedited to avoid the cost overrun and att ract potenti al investors in real estate. In the backdrop of the recent policy initi ati ves of the government in the fi eld of industry, IT and tourism
223
MEGHALAYA STATE DEVELOPMENT REPORTMEGHALAYA STATE DEVELOPMENT REPORT
there is a need for the faster development of the proposed new satellite township. Public-Private partnership needs to be explored and experti se and investment from outside has to be promoted for the township development.
• The jurisdicti on of the Municipal authority should extend to the other areas within the Shillong Urban Agglomerati on. This will not only help to improve the physical infrastructure of these areas but also put a check on unplanned growth in the fringe areas of the town. As the State is looking for private investments in industry, infrastructure, IT and other basic services, the maintenance of high quality infrastructure of the State capital is necessary. A separate urban governance structure as well as a new insti tuti onal arrangement for Shillong Urban Agglomerati on will have to be evolved along with acti ve partnership of the local traditi onal insti tuti ons.
• Sites for sanitary landfi ll needs to identi fi ed and developed on priority in all towns as commercial exploitati on of municipal waste do not appear a viable opti on at this stage.
• There is a need to ensure that the impacts of any biospheric interventi ons (including policies and laws related to land use practi ces, infrastructure upgrading schemes etc.) are carefully considered. The unsustainability in the environment is refl ected in increased emission levels, increased atmospheric polluti on, polluti on of water and soil, disappearance of natural areas and degradati on of urban space. The cutti ng down of waste, conservati on of energy, and protecti on of natural spaces are other challenges to be overcome for a sustainable urban development.
• There is a need for clear policy for urban development and functi onal jurisdicti on in the state vis-à-vis the powers and functi ons of the Autonomous District Councils.
• The existi ng ULBs suff er from serious resource crunch due to its limited resource base leading to low levels of capacity. Reforms and capacity building are needed in ULBs to ensure that the city government transform from the current situati on of indiff erent service providers to a vibrant and responsive creator of high quality infrastructure, especially civic environmental infrastructure. The agenda for such a transformati on includes legal and insti tuti onal changes, fi nancial reforms, and a framework wherein the consent and parti cipati on of the citi zens is a routi ne and not the excepti on.
• With the rapid increase in the number of vehicles in the state, the problem of managing the traffi c will be another big challenge. There is not much space in the urban areas for expanding the road network and traffi c congesti ons in Shillong are already a common feature. As an immediate measure, comprehensive mobility plan where priority is more on movement of pedestrians than vehicles needs to be drawn up for the larger towns. A clear policy on public transport system vis-à-vis the private transport system needs to be adopted.
224

MEGHALAYA STATE DEVELOPMENT REPORTMEGHALAYA STATE DEVELOPMENT REPORT
• As more opportuniti es are available in the urban areas, people are relocati ng from rural to urban areas. More focus on development on rural areas will release the pressure of development in the urban areas. The initi ati ves for rural development are discussed in detail in the chapter on Rural Development of the report.
8.9. AnnexureTable 8.6: Growth of Towns and Populati on in Meghalaya
Towns Populati on
1971 1981Decadal growth (%)
1991Decadal Growth (%)
2001Decadal Growth (%)
1.Shillong Urban Agglomerati on
122732 174643 42.30 223366 27.90 267881 19.93
a. Shillong Municipality 87639 109244 24.65 131719 20.57 132876 0.88b. Shillong Cantonment 4730 6620 39.96 11076 67.31 12385 11.82c. Mawlai 14260 20405 43.04 30964 51.75 38241 23.50d. Nongthymmai 16103 21558 33.88 26938 24.96 34209 26.99e. Pynthorumkhrah 10711 13682 27.74 22108 61.58f. Madanrti ng 6165 8987 45.77 16700 85.82g. Nongmysong 113622.Cherrapunjee 6097 7777 27.55 10086 29.693. Nongstoin 3880 14339 269.56 22003 53.444. Mairang 115175. Jowai 8929 12323 38.01 20601 67.18 25023 21.466. Williamnagar 4290 12004 179.81 18251 52.047. Resubelpara 176528. Tura 15489 35257 127.63 46066 30.66 58391 26.769. Baghmara 4183 5894 40.90 8643 46.6410. Nongpoh 13165Total 147150 240733 63.60 330047 37.10 452612 37.14Source: Census of India,2001
Table 8.7: District Wise Distributi on of Urban Populati on
District Urban Populati on1991 2001 Decadal Growth (1991-01)
East Garo Hills 12004 (6.36) 35903 (14.33) 199.1West Garo Hills 46066 (11.43) 58978 (11.38) 28.3South Garo Hills 5894 (7.65) 8643 (8.56) 46.6
225

MEGHALAYA STATE DEVELOPMENT REPORTMEGHALAYA STATE DEVELOPMENT REPORT
West Khasi Hills 14339 (6.50) 34598 (11.69) 141.3Ri-Bhoi 0 13180 (6.84)East Khasi Hills 231143 (42.97) 277748 (42.02) 20.2Jainti a Hills 20601 (9.34) 25057 (8.38) 21.6Total 330047 (18.60) 454107 (19.58) 37.6
Source: Census of India,2001
Table 8.8: Size Class Distributi on of Urban Populati on 2001
Size Class Number of Towns Populati on Percent to totalI 1 267881 59.2II 1 58391 12.9III 2 47026 10.4IV 5 70761 15.6V 1 8643 1.9
Source: Census of India 2001
Table 8. 9 Distributi on of Households by Source of Drinking Water and Locati on
UrbanNo. of
HouseholdsWithin
PremisesNear Premises Away
State - MEGHALAYA 17 Total 90658 44609 30547 15502 Tura (M) Total 9719 5230 3127 1362 Resubelpara (MB) Total 2992 1355 1280 357 Williamnagar (MB) Total 3446 1387 1765 294 Baghmara (MB) Total 1609 442 643 524 Nongstoin (TC) Total 4248 762 2351 1135 Mairang (TC) Total 2003 269 1375 359 Nongpoh (TC) Total 2734 459 1574 701 Mawlai (CT) Total 7759 2208 3955 1596 Shillong Cantt . (CB) Total 2535 1187 706 642 Shillong (M) Total 28262 20676 5632 1954 Pynthorumkhrah (CT) Total 4628 1534 2195 899 Nongmynsong (C) Total 2996 223 865 1908 Nongthymmai (CT) Total 7675 5121 1480 1074 Madanrti ng (CT) Total 3332 763 1178 1391 Cherrapunjee (CT) Total 1857 579 947 331 Jowai (M) Total 4778 2419 1384 975
226

MEGHALAYA STATE DEVELOPMENT REPORTMEGHALAYA STATE DEVELOPMENT REPORT
Table 8.10: Distributi on of Household by Availability of Bathroom and Type of Latrine within the House
Area NameTotal/Rural/Urban
Total number of households
Number of households
having bathroom
facility within the house
Type of latrine within the house
Pit latrine
Water closet
Other latrine
No latrine
1 2 3 4 5 6 7
State-MEGHALAYA 17 Total 420,246 141,445 128,375 51,774 34,995 205,102
State-MEGHALAYA 17 Rural 329,678 78,216 98,370 12,339 21,490 197,479
State-MEGHALAYA 17 Urban 90,568 63,229 30,005 39,435 13,505 7,623
Tura (M) Total 9,719 3,565 4,338 1,899 2,462 1,020
Resubelpara (MB) Total 2,992 756 2,508 184 191 109
Williamnagar (MB) Total 3,446 789 2,191 683 310 262
Baghmara (MB) Total 1,609 316 664 242 320 383
Nongstoin (TC) Total 4,248 2,461 1,778 1,519 229 722
Mairang (TC) Total 2,003 1,671 1,334 160 82 427
Nongpoh (TC) Total 2,729 630 1,542 274 372 541
Mawlai (CT) Total 7,759 6,846 4,109 2,458 1,063 129
Shillong Cantt . (CB) Total 2,535 1,561 351 787 824 573
Shillong (M) Total 28,262 23,545 4,047 18,747 4,191 1,277
Pynthorumkhrah (CT) Total 4,628 3,468 2,014 1,807 794 13
Nongmynsong (C) Total 2,996 2,048 1,710 857 314 115
Nongthymmai (CT) Total 7,675 6,811 855 5,145 1,207 468
Madanrti ng (CT) Total 3,332 2,893 788 2,211 247 86
Cherrapunjee (CT) Total 1,857 1,305 233 480 263 881
Jowai (M) Total 4,778 4,564 1,543 1,982 636 617
Table 8.11. Distributi on of Household s by Type of Drainage Connecti vity
Area NameTotal/Rural/Urban
Total number of households
Type of latrine within the house
Closeddrainage
Opendrainage
No drainage
1 2 8 9 10State - MEGHALAYA 17 Total 420,246 21,580 134,569 264,097State - MEGHALAYA 17 Rural 329,678 7,983 78,740 242,955State - MEGHALAYA 17 Urban 90,568 13,597 55,829 21,142 Tura (M) Total 9,719 906 3,281 5,532 Resubelpara (MB) Total 2,992 60 565 2,367 Williamnagar (MB) Total 3,446 228 1,010 2,208 Baghmara (MB) Total 1,609 42 435 1,132
227
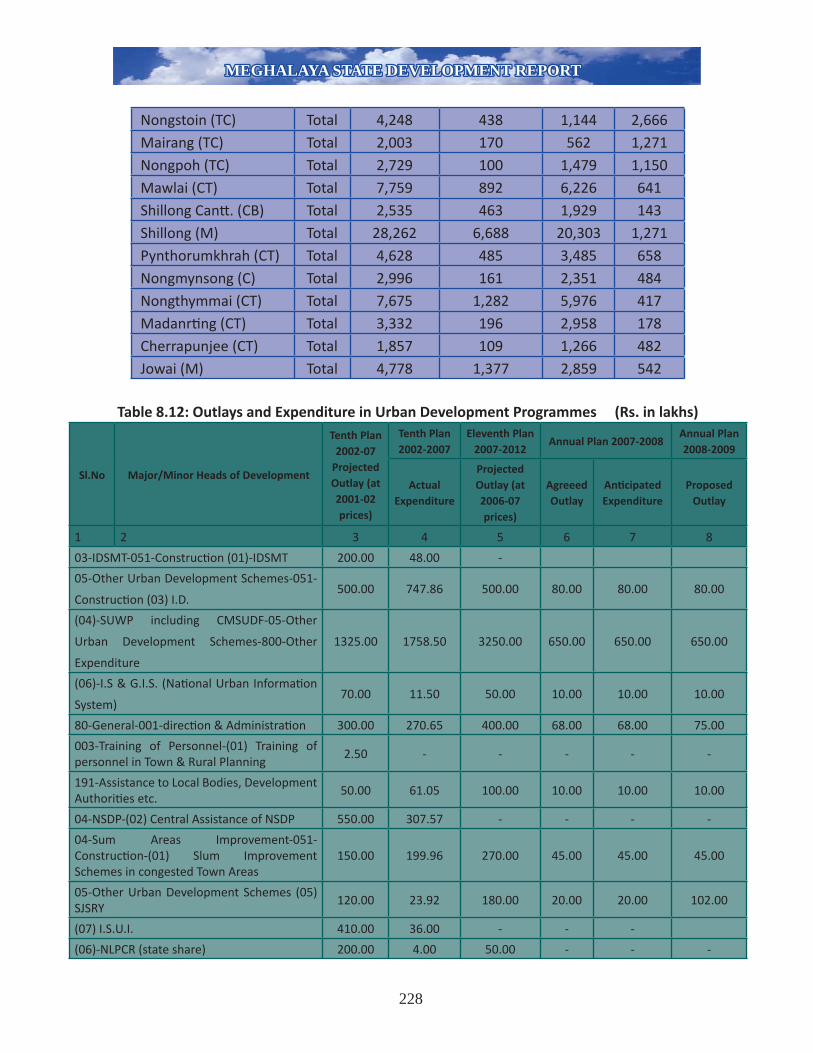
MEGHALAYA STATE DEVELOPMENT REPORTMEGHALAYA STATE DEVELOPMENT REPORT
Nongstoin (TC) Total 4,248 438 1,144 2,666 Mairang (TC) Total 2,003 170 562 1,271 Nongpoh (TC) Total 2,729 100 1,479 1,150 Mawlai (CT) Total 7,759 892 6,226 641 Shillong Cantt . (CB) Total 2,535 463 1,929 143 Shillong (M) Total 28,262 6,688 20,303 1,271 Pynthorumkhrah (CT) Total 4,628 485 3,485 658 Nongmynsong (C) Total 2,996 161 2,351 484 Nongthymmai (CT) Total 7,675 1,282 5,976 417 Madanrti ng (CT) Total 3,332 196 2,958 178 Cherrapunjee (CT) Total 1,857 109 1,266 482 Jowai (M) Total 4,778 1,377 2,859 542
Table 8.12: Outlays and Expenditure in Urban Development Programmes (Rs. in lakhs)
Sl.No Major/Minor Heads of Development
Tenth Plan 2002-07
Projected Outlay (at 2001-02 prices)
Tenth Plan 2002-2007
Eleventh Plan 2007-2012
Annual Plan 2007-2008Annual Plan 2008-2009
Actual Expenditure
Projected Outlay (at 2006-07 prices)
Agreeed Outlay
Anti cipated Expenditure
Proposed Outlay
1 2 3 4 5 6 7 8
03-IDSMT-051-Constructi on (01)-IDSMT 200.00 48.00 -
05-Other Urban Development Schemes-051-
Constructi on (03) I.D.500.00 747.86 500.00 80.00 80.00 80.00
(04)-SUWP including CMSUDF-05-Other
Urban Development Schemes-800-Other
Expenditure
1325.00 1758.50 3250.00 650.00 650.00 650.00
(06)-I.S & G.I.S. (Nati onal Urban Informati on
System)70.00 11.50 50.00 10.00 10.00 10.00
80-General-001-directi on & Administrati on 300.00 270.65 400.00 68.00 68.00 75.00
003-Training of Personnel-(01) Training of personnel in Town & Rural Planning
2.50 - - - - -
191-Assistance to Local Bodies, Development Authoriti es etc.
50.00 61.05 100.00 10.00 10.00 10.00
04-NSDP-(02) Central Assistance of NSDP 550.00 307.57 - - - -
04-Sum Areas Improvement-051-Constructi on-(01) Slum Improvement Schemes in congested Town Areas
150.00 199.96 270.00 45.00 45.00 45.00
05-Other Urban Development Schemes (05) SJSRY
120.00 23.92 180.00 20.00 20.00 102.00
(07) I.S.U.I. 410.00 36.00 - - -
(06)-NLPCR (state share) 200.00 4.00 50.00 - - -
228
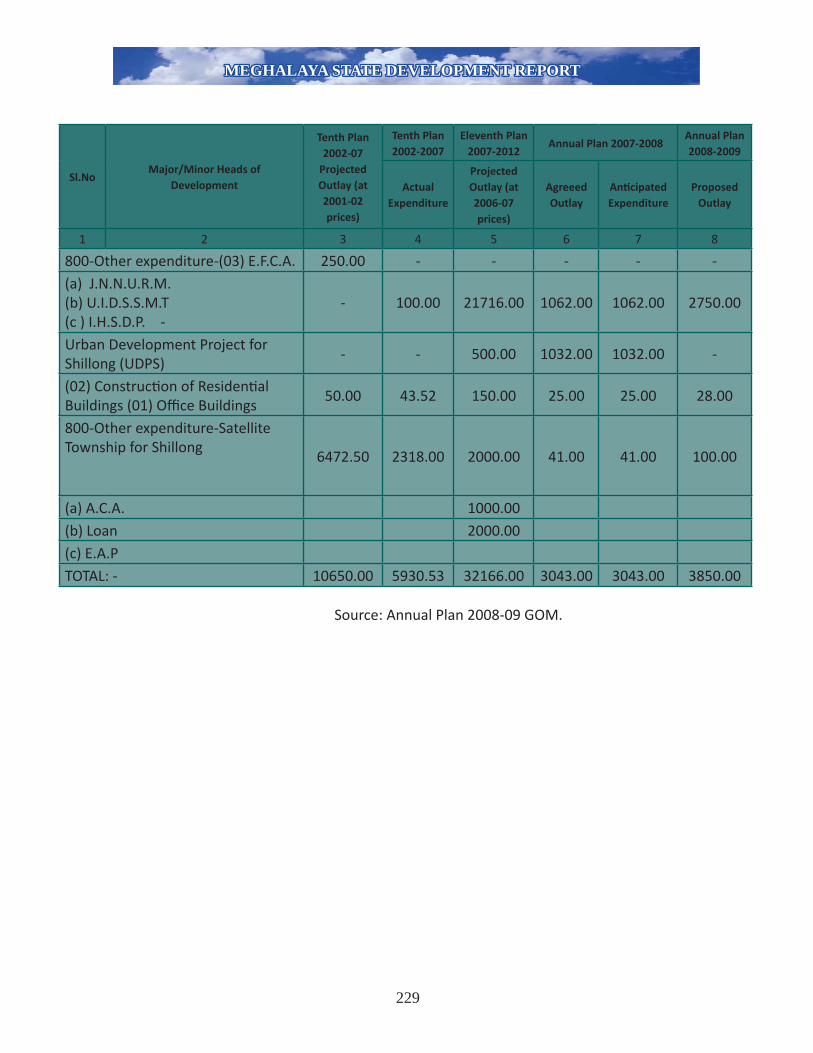
MEGHALAYA STATE DEVELOPMENT REPORTMEGHALAYA STATE DEVELOPMENT REPORT
Sl.NoMajor/Minor Heads of
Development
Tenth Plan 2002-07
Projected Outlay (at 2001-02 prices)
Tenth Plan 2002-2007
Eleventh Plan 2007-2012
Annual Plan 2007-2008Annual Plan 2008-2009
Actual Expenditure
Projected Outlay (at 2006-07 prices)
Agreeed Outlay
Anti cipated Expenditure
Proposed Outlay
1 2 3 4 5 6 7 8
800-Other expenditure-(03) E.F.C.A. 250.00 - - - - -(a) J.N.N.U.R.M.(b) U.I.D.S.S.M.T(c ) I.H.S.D.P. -
- 100.00 21716.00 1062.00 1062.00 2750.00
Urban Development Project for Shillong (UDPS)
- - 500.00 1032.00 1032.00 -
(02) Constructi on of Residenti al Buildings (01) Offi ce Buildings
50.00 43.52 150.00 25.00 25.00 28.00
800-Other expenditure-Satellite Township for Shillong
6472.50 2318.00 2000.00 41.00 41.00 100.00
(a) A.C.A. 1000.00(b) Loan 2000.00(c) E.A.PTOTAL: - 10650.00 5930.53 32166.00 3043.00 3043.00 3850.00
Source: Annual Plan 2008-09 GOM.
229

CENTRE OF SHILLONG


INNER VIEW - HEAVY VEAVY VEHICLES PARKINGKHLIEH IEWDUH, SHILLONG
SUPER MARKET, TURA

MEGHALAYA STATE DEVELOPMENT REPORTMEGHALAYA STATE DEVELOPMENT REPORT
CHAPTER – IX
DEVELOPMENT OF AGRICULTURE & ALLIED SECTORS
People of Meghalaya are predominantly dependent on agriculture. More than 70% of the State’s total populati on is engaged in agriculture and allied acti viti es, which also contributes around 22% of the State’s Gross Domesti c Product. The contributi on of the primary sector has declined from 33.15% in 1993-94 to 29.71% in 2000-01.The State has projected a growth rate of 4.7% during the 11th Five year Plan. Out of the total geographical area of 2249000 hectares, total cropped area is only 2.62 lakh hectares. Patt ern of land holdings and the myriad land tenure systems, extensive practi ce of ‘Jhum’ culti vati on (‘Shift ing’ Culti vati on), other traditi onal agricultural practi ces including aspects of producti on for consumpti on rather than creati ng marketable surpluses for profi table returns, high cost of inputs and producti on are some of the realisti c dimensions of agriculture in Meghalaya. The state’s net sown area of the total land area is only 9.8 %, and only 16.85 % of the net sown area is sown more than once with per capita sown area amounti ng to 0.12 ha. The annual shortf all of foodgrain is esti mated to be of the order of 122 thousand tonnes. Excluding imports, the per capita daily foodgrain availability in the State has declined from 321 gms to 264 gms from 1970-71 to 2003-04. It is therefore evident that the State is not self suffi cient in the producti on of food items. Att aining self-suffi ciency in the area of food items must therefore be the highest priority for the State. On account of the ready demand for most food items in the State and current shortf alls in the producti on thereof, agriculture and allied sectors can easily be identi fi ed as areas where every rupee invested can provide the maximum returns - both in terms of economic value generated and contributi on to the welfare of people in general. There is ample scope for creati on of self-employment opportuniti es in these sectors. The development of agriculture and allied sectors cannot only enhance food security for people in the State but help to improve the economic conditi ons of the people.
Though majority of the State’s populati on are non-vegetarian, yet the State does not produce enough meat to meet the local demand. Substanti al quanti ti es of meat and eggs are imported into the State from other states like Assam, Andhra Pradesh, West Bengal and Maharashtra. Milk producti on in the State is among the lowest in the country. The per-capita availability of milk in the State is nearly one-third of the nati onal average. It is a common belief that since there is not much preference for milk amongst the people, the State is considered self suffi cient in the producti on of milk with virtually no imports of milk into the State.
The level of industrializati on in the State is relati vely low; as such opportuniti es for employment outside the primary sector are currently limited. It is evident that agriculture and allied acti viti es have a much greater bearing on both the State’s economy as well as the lives of people in the State. The State is yet to be self suffi cient in the producti on of food grains due to topographical, agro-climati c factors, widespread jhum culti vati on, and low technology adopti on
231

MEGHALAYA STATE DEVELOPMENT REPORTMEGHALAYA STATE DEVELOPMENT REPORT
etc. The annual shortf all of food grains is esti mated to be of the order of 152 thousand tonnes during 2006-07. While the climati c conditi ons in the State favour a large array of vegetati on, including a large variety of horti culture crops like fruits, vegetables and spices, a major chunk of the culti vated area is dedicated to food grains of which, paddy is the most dominant crop. Thus, due emphasis is given on increasing food grains producti on and producti vity, improving food security for the people through the use of High Yielding crop varieti es, improved package of scienti fi c inputs along with suitable and appropriate technology measures. A series of interventi on like the Rastriya Krishi Vikaash Yojana (RKVY also known as NADP), Technology Mission on Horti culture and macro management scheme for agriculture, investments under BReGF and Special plan assistance for Post harvest management and other faciliti es are likely to give the eff orts the required impetus.
Decelerati ng Growth in the Agriculture sector1:
Despite having vast potenti al for a growth oriented economy, vast reservoirs of natural resources, conducive and varied agro-climati c conditi ons, etc. the region and the State has not been able to make much headway. “Most of the world‘s poor people earn their living from agriculture, so if we know economics of agriculture we would know much of the economics of being poor” (Theodore W. Schultz, 1980 quoted in WDR, 2002). Government of India (Planning Commission, 2002) also acknowledges that ‘Agriculture has a major role in alleviati ng rural poverty, and decelerati on in its growth in the NER has aff ected the income generati on of rural populati on’. According to Planning commission (2002, GOI) during the 1990s region-specifi c causes for the decelerati ng growth in the agriculture sector was due to: poor maintenance of rural infrastructure (canals and roads); low public investment in irrigati on; decline in investments in rural electrifi cati on and in its availability. Rising level of subsidies for power, water, ferti lisers and food are eati ng into public sector investments in agriculture. Inadequate credit support; imbalanced use of NP&K ferti lisers, (6.69:2.59:1.0 in 2001-02 as against the desirable norm of 4:2:1) and increasing defi ciency of micro nutrients in the soil; stringent controls on, movement, marketi ng, credit, stock and export of agricultural products and agro-processing industry are some of the factors listed to aff ect their profi tability, which can in the absence of speedy domesti c market reforms, turn opportuniti es into a threat for the future growth of agriculture.
Besides demand constraints (slow growth of the urban economy, restricti on on exports, lack of land reforms, failure of poverty alleviati on schemes, slow growth in rural wages) there is decline in the force of technology coupled with poor extension service. Further, non availability of credit from the organised sector, limits the credit fl ows to the unorganised sector and accordingly limits the producti vity improvement in this sector.
1 Dr. Shreeranjan (2006): Credit Related Issues in Meghalaya, NEICSSR.
232

MEGHALAYA STATE DEVELOPMENT REPORTMEGHALAYA STATE DEVELOPMENT REPORT
Over the years, reduced cropping intensity, reduced and disproporti onate involvement of people in agricultural operati ons, constraints on bringing more land under culti vati on, subsistence level of agricultural operati ons, lack of avenues for allied acti viti es to generate subsidiary income, etc. has made the agriculture a less and less att racti ve propositi on in spite of a large populati on involved and dependent on the same for their livelihood. This also explains reduced demand for credit for agricultural operati ons in the state. The Banking Organisati ons and development administrati on have a tough task on their hand to fi nd more agricultural borrowers for the overall improvement in the agriculture operati ons of the state.
Low producti on in sedentary agriculture causes a shift in occupati on and migrati on to nearby citi es and towns (Majumdar, 1979). Such scenario has been recognised as one of the factors underlying unemployment and youth restlessness as a potenti al source of vagrancy. This is becoming apparent as jobs in government become saturated and educati on is not geared towards livelihood issues. Many think, that in Meghalaya poverty is comparati vely less. But, almost 48.9% (Govt. of Meghalaya C&RD Deptt .2008) of its populati on are below the poverty line. The public sector as a whole provided majority of jobs whereas the private sector provided only 11.33% of total jobs provided by the public and private sector during 2000-2001. As per census of 2001 the number of workers has increased to 9,70,146; of which 85% are in rural areas; 78% of the total labour in the state consti tutes the main worker. The main workers consti tute 32.6 percent while the marginal workers consti tute 9.2 percent.The workers parti cipati on rate in the state consti tute 32.65% of total populati on of which culti vators consti tute 55% (1991) and 50.24 % in 2001, whereas agricultural labourers remained stagnant for more than a decade at only 12.5% (12.51 & 12.54% in 1991 & 2001 respecti vely); The share of culti vators and agricultural labourers taken together has declined from 79% in 1971 to 63% in 2001 in the State.
The State has witnessed an overall growth of 125.75% in 1990-91 from the level of 78.45% in 1980-81 whereas the primary and secondary sectors have hardly grown by an average of 25%. This steep rise in one (terti ary) sector has led to inequitable distributi on between urban and rural sectors. By the scenario of development in the State it is evident that the primary and secondary sectors which are rural based did not develop signifi cantly whereas the terti ary sector which is basically urban had the maximum growth rate. This has been further proved by the distributi on of Per Capita Worker Income. The Per Capita Worker Income showed an increase of 42.15% in 1992-93 from the level of Rs. 3096 in 1980-81 to Rs. 4358 in 1990-91, whereas the Per Capita Worker Income at 1980-81 price in rural areas increase to Rs.1647 in 1992-93 from Rs. 1546 in 1980-81. Similarly, the Per Capital Income at 1980-81 price in the urban areas increased to Rs.12280 in 1992-93 from Rs. 9055 in 1980-81. The reducti on of income of the rural worker has further marginalized him vis-à-vis the urban worker creati ng serious inequaliti es between the rural and urban workers. This has been further proved by the rati o of urban and rural workers. In 1980-81, 9.92% of the total workers numbering 587158 were agriculture labourers. The same is marginally increased to 12.51% of the total number of 715567 workers in 1990-91 and to 12.54% during 2001
233

MEGHALAYA STATE DEVELOPMENT REPORTMEGHALAYA STATE DEVELOPMENT REPORT
census. This is despite the fact that 38% of the plan outlay during the last 4-5 Five Year Plans was allocated for agriculture. In spite of the huge planned expenditure in primary sector there has been a progressive marginalisati on of the rural workers. In this directi on, it is observed that this anomaly calls for an eff ecti ve reshaping of the insti tuti onal set up to gear up agricultural and rural producti on output.
9.1 Climate :
There are wide variati ons in the climate in Meghalaya, ranging from temperate to the tropical type. Spring in Meghalaya lasts from March to April. Summer is for a period of about 5 months, from May to September with torrenti al rains caused by the South West Monsoon. Autumn months are October and November while the winter is from December to February. The State receives some of the heaviest rainfall in the world. Cherrapunjee and Mawsynram have the disti ncti on of being the wett est places on the earth. Rainfall in the last two decades has ranged from 11,995 mm to 14,189 mm in Cherrapunjee and between 10,689 mm to 13,802 mm in Mawsynram. Heavy rainfall causes fl ash fl oods in many parts of the state especially the low alti tude areas of the state bordering Assam and Bangladesh and these fl ash fl oods cause heavy damage to crops and other property every year. The average rainfall in the state in the year 2007 was recorded at 3795.85 mm.
9.2 Agro-climati c zones and sub-zones in the State: The enti re geographical area in the State can be classifi ed into fi ve agro-climati c zones, namely:
(a) Warm and humid with medium rainfall (1270-2032 mm): This zone occurs in the hills and northern slopes in the north and western parts of West Garo Hills, the Northern part of East and West Khasi Hills and the North Eastern parts of the Jainti a Hills. The zone features soil of light to medium texture with generally high depth. The important crops in this zone are: rice, wheat, jute and mesta, rapeseed, mustard, cott on and ginger.
(b) Humid and moderately cold in winter with high rainfall (2800-4000 mm): This zone occurs in the central plateau of the Garo Hills and a porti on of the Central Plateau of the West Khasi Hills. The soil is of light to medium texture and is generally very deep. Maize, ginger, cott on and tea are the principal crops in this zone.
(c) Humid with moderately warm summer and severe cold winter featuring high rainfall (2800-6000 mm): This zone comprises of the central plateau of East Khasi Hills, the West Khasi Hills and the Jainti a Hills. The soil is of light to medium texture and is generally very deep. This zone is suitable for vegetables, especially potato, upland rice, tea and ginger.
234

MEGHALAYA STATE DEVELOPMENT REPORTMEGHALAYA STATE DEVELOPMENT REPORT
(d) Humid and warm with very high rainfall (4000-10000 mm): This zone occurs in the Southern slope comprising of the eastern part of Jainti a Hills, the southern part of East Khasi Hills a porti on of the southern edge of the West Khasi Hills. The soil is of light to medium texture and deep to very deep. Important crops are: oranges, turmeric and soyabean.
(e) Humid and hot with high rainfall (2800-4000 mm): This zone comprises of the southern part of the West Garo Hills and a part of the southern porti on of the West Khasi Hills. The soil depth ranges from moderate to very deep and has a light to heavy texture. Rice, Jute and Mesta and Oilseeds are the important crops in this zone.
9.3 Characteristi c features of agriculture in the state
9.3.1 Low net cropped areaThe State has an undulati ng topography and a large forest cover. The area available for cropping in Meghalaya is only 9.87% of the total geographical area. This includes the area under traditi onal shift ing culti vati on (discussed later), which is generally characterized with a much lower producti vity compared to areas under modern culti vati on. Further, given the physiography of the state, there is litt le scope of bringing any more area under fi eld crops. The following table shows the basic land use patt ern of the state 2:
Table 9.1: Land Use Patt ern
Land use 2000-01 2001-02 2002-03 2003-04 2004-05Reporti ng Area 2,240,900 2,227,100 2,227,100 2,227,100 2,227,100Forest 950,575 950,533 947,038 947,219 941,786Not Available for Culti vati on
222,465 225,418 225,321 225,380 227,945
Other Unculti vated Land Excluding Fallow
617,865 606,393 600,824 599,589 607,717
Fallow Land 228,096 234,294 238,392 235,688 230,760Net Area Sown 221,899 210,462 215,525 219,224 218,892Area Sown More Than Once
45,386 46,649 46,597 46,650 46,680
Gross Cropped Area
267,285 257,111 262,122 265,874 265,572
2 Source: Directorate of Economics and Statistics, Meghalaya
235

MEGHALAYA STATE DEVELOPMENT REPORTMEGHALAYA STATE DEVELOPMENT REPORT
A general overview of the data reveals that litt le expansion of Net Area Sown over the years has taken place. Moreover cropping intensity has also not increased as revealed from the almost stati onary Gross Cropped Area. The factors behind this could be explained in terms of the observati ons of the subsequent secti ons.
9.3.2 Land holding patt ern and size of holdings
Meghalaya has a disti nct land tenure and land holding system. Land holdings in the state are mostly operati onal holdings as there is litt le concept of permanent ownership under the traditi onal land tenure system. The average size of the holding is very small. A large percentage of the state’s farmers have marginal or small holdings of less than one or two hectares. According to the Census 2001, the average size of the holding is 1.30 hectares and about 23% of the holdings are less than one hectare in size.
Table 9.2: land holding and size of holding:
Class size% of holdings area
Average holding size (ha)
Marginal (0.05-1.00 ha) 22.66 0.55Small (1.00 – 2.00 ha) 29.86 1.45Semi med. ( 2.00 – 4.00 ha) 32.73 2.58Medium (4.00 – 10.00 ha) 12.95 5.41Large ( above 10 ha ) 1.80 13.12Total/Average 100% 1.30
Other land issues that require to be addressed are: Reclamati on of culti vable wasteland (4.42 lakh Ha.); Uti lizati on of available fallow land ( 2.36 lakh Ha.); High rainfall during monsoons results in high run off s, erosion of ferti le soils and leaching of nutrients and Framing of Land use policy in the State through SLUB. Besides, land survey, allocati on and reforms and regulati on on usage are criti cal and urgent components. 9.3.3 Foodgrain Producti on:
The State is running a defi cit in foodgrain as it is diffi cult to increase foodgrain producti on because of the hilly terrain which is not suitable for this type of crop. Therefore, the eff ort is to bring more areas under Horti culture and plantati on crop which has tremendous potenti al for growth in the prevailing Agro-climati c conditi on envisaging the policy of shift ing the thrust from Foodgrains producti on to Food security. Amongst the foodgrains, rice is the major crop in the State followed by maize and wheat.
The Foodgrain producti on at the beginning of the Tenth Plan (2002-2003 ) was 2.26 lakh tonnes and the achievement at the end of the Plan period was 2.31 lakh tones against the
236

MEGHALAYA STATE DEVELOPMENT REPORTMEGHALAYA STATE DEVELOPMENT REPORT
anti cipated producti on of 2.33 lakh tonnes. The shortf all during the period was due to fl ash fl ood, at ti mes there was scanty rainfall in the later stage of crop season, limited use of HYV in upland areas, slow adopti on of scienti fi c farming practi ces by farmers, etc.
CropsArea( Lakh Ha )
Producti on( Lakh MT )
Yield( MT/Ha )
Autumn Winter Spring
0.330.620.10
0.451.160.40
1.371.874.05
Total Rice Maize
1.050.17
2.010.25
1.921.49
Total Foodgrain 1.28 2.32 1.81
9th PlanAchievement
10th Plan Achievement
11th Plan Target Anti cipated Achievement
in 2007-08
Target for 2008-09
214.96 269.93 379.00 291.00 336.00
Year Est. Populati on( In lakhs)
Foodgrains requirement(Lakhs MT)
Foodgrains producti on(Lakhs MT)
Foodgrains shortf all.
(Lakhs MT)2002-03 24.12 3.52 2.26 1.262003-04 24.65 3.60 2.33 1.272004-05 25.18 3.68 2.24 1.442005-06 25.71 3.75 2.59 1.162006-07 26.24 3.83 2.70 1.13
Year Esti mated Populati on( In lakhs)
Foodgrains requirement(Lakhs MT)
Foodgrains producti on(Lakhs MT)
Foodgrains shortf all(Lakhs MT)
2007-08 26.77 3.91 2.91 1.002008-09 27.30 3.99 3.36 0.632009-10 27.83 4.06 3.49 0.572010-11 28.36 4.14 3.61 0.532011-12 28.89 4.22 3.79 0.43
In order to realize the target of foodgrain producti on, the main strategies adopted by the State is to further develop the existi ng rice fi elds with Irrigati on faciliti es for multi ple cropping, raise the level of producti vity per unit area through increased use of ferti lizers, more area coverage
237

MEGHALAYA STATE DEVELOPMENT REPORTMEGHALAYA STATE DEVELOPMENT REPORT
under high yielding varieti es adequate and need based plant protecti on measures and adopti on of improved crop producti on technology. Eff orts are being made to popularize the culti vati on of high yielding varieti es of maize and pulses through demonstrati on and minikit programmes in the culti vator’s fi eld.
9.4 Major crops in Meghalaya:
9.4.1 Food GrainsFoodgrain consti tute the principal food item for the enti re populati on and it is also the most dominant crop group in the state. It is not surprising therefore that nearly 60% of the state’s total culti vated area is under foodgrains. The total area under culti vati on of foodgrain in the year 2005-06 was reported at 1,29,790 hectares and the producti on of food grains in the same year reported at 2,38,840 metric tonnes. The area under food grains has increased by 18% since 1970-71 (1,12,856 hectares) and the producti on of foodgrains has increased by nearly 96% since 1970-71 (1,18,585 metric tonnes). However a comparison between 1970-71 and 2003-04 shows that the per capita daily foodgrain availability (excluding imports) has actually decreased from 321 grams to 264 grams 3. In contrast, Punjab had per capita daily foodgrain availability (excluding exports) of nearly 2.84 kilograms 4. West Garo Hills District has the largest area under foodgrain crops and it is also the largest producer of foodgrains in the state. However, despite the enormous area under rice culti vati on, the state does not produce enough rice to sati sfy the total demand for rice in the state. The principal foodgrain crops grown in the state are as follows:
(a) Rice: Rice is by far the most widely grown crop in the enti re state. It occupies nearly 50% of the total culti vated area in the state and accounts for nearly 86% of the total producti on of foodgrains. The area under rice crop in the state in 2005-06 was reported at 1,06,070 hectares producing 2,08,270 metric tonnes of rice. Rice has always been the dominant crop in the state. There has not been a signifi cant increase in the area under paddy. It has only increased by about 15% from 95,576 hectares reported in 1970-71. Interesti ngly, most part of that increase was during the period 1970-71 and 1975-76 amounti ng to nearly 8,768 hectares aft er which, it has remained more or less constant with occasional peaks and troughs. The West Garo Hills District is the largest producer of rice in the state, accounti ng for nearly 39% of the total producti on of rice in the State.
3 Based on an estimated population of 2.4 million for 2004.4 Source: State Development Report, Punjab and Statistical Abstract India 2003 published by Central Statistical Organization.
238

MEGHALAYA STATE DEVELOPMENT REPORTMEGHALAYA STATE DEVELOPMENT REPORT
Enhancement of foodgrain producti on in the hill State of Meghalaya is constrained by its topography making available only about 12 percent of its geographical area suitable for culti vati on of crops for foodgrain producti on. However, improvement of producti on to the extent possible by way of more coverage and improvement of irrigati on faciliti es, use of HYV seeds, applicati on of ferti lizers and pest control are being taken up. The producti on of foodgrains as during 2007--08 is 291.03 thousand tonnes and the anti cipated achievement during 2008-09 is 336.00 thousand tonnes. By the end of the Eleventh Plan, the producti on is expected to touch 379.00 thousand tonnes. The target during 2009-10 is to produce 399.44- thousand tonnes of food grains.
(b) Maize: Maize is the second most important foodgrain crop in the State occupying nearly 16,890 hectares in the year 2005-06.The producti on of maize during the year was 24,420 metric tonnes. There has been no signifi cant increase in the area under maize since 1970-71 when the total area under maize was 14,068 hectares. The producti on of maize has increased by more than 3.4 ti mes from the 1970-71 level of 7,566 metric tonnes. West Khasi Hills District and West Garo Hills District are the largest producers of maize in the State.In 2003-04 the producti on was recorded at 6,539 and 6,532 metric tonnes respecti vely – together accounti ng for half of the total maize produced in the State in that year.
(c) Wheat: Although insignifi cant in comparison to rice and maize, wheat is gradually becoming unpopular in the State. The area under wheat has shown a spectacular decrease from the 2002-2003 level of 2710 hectares to only 670 hectares reported for the year 2005-06 signifying a 24.7 fold decrease. The producti on of wheat in the year 2005-06 was 1190 metric tonnes only. Wheat is grown mainly in the East and West Garo Hills districts.
(d) Other cereals and pulses: The producti on of other cereals and pulses in the State is insignifi cant compared to the other foodgrains. The major pulses grown in the State include cowpea, pea, lenti l, arhar, black gram, Bengal gram and rajma. The area under culti vati on of other cereals and pulses in the year 2005-06 was 2,670 hectares and 3,490 hectares respecti vely. The producti on of other cereals and pulses for the year 2005-06 was 2,270 metric tonnes and 2,670 metric tonnes respecti vely.
9.4.2 Oilseeds
The important oilseeds grown in the State include castor, sesame, rape and mustard, linseed, soyabean and sunfl ower. The total area under oilseeds was 9,975 hectares in the year 2005-06 and the producti on of oilseeds during the same year was 6,692 metric tonnes. Rape and mustard are the most dominant oilseeds occupying nearly 73% of the total area under culti vati on of oilseeds and accounti ng for nearly 71% of the producti on. Most of the producti on of oilseeds in the State comes from the Garo Hills region. Nearly 96% of the total area under oilseeds lies in the Garo Hills region and the region accounts for nearly 97% of the producti on of oilseeds in the State. While
239

MEGHALAYA STATE DEVELOPMENT REPORTMEGHALAYA STATE DEVELOPMENT REPORT
sunfl ower has been introduced recently in the State, the above producti on fi gures do not include sunfl ower producti on.
9.4.3 Fibre Crops
The State produces three main fi bre crops: cott on, jute and mesta. These have been the traditi onal cash crops of the Garo Hills Region, which is the exclusive producer of these crops in the state. Both the area under the culti vati on of fi bre crops and their producti on has shown a decreasing trend, which indicates that these crops are gradually loosing their popularity. This has been att ributed to the un-remunerati ve prices received by farmers for these crops and as such the farmers are culti vati ng these crops with minimum eff ort and inputs.
(a) Cott on: Cott on is the dominant fi bre crop in the State. The area under cott on crop in the year 2006-07 and its producti on was reported at 7,208 hectares and 7,738 bales (of 170 Kg each) respecti vely. The area under cott on has shown a sharp decline since the 1970-71 level of 10,164 hectares.
(b) Jute: Just like cott on, jute crop has also been loosing favour among farmers in the State. The area under jute crop in the year 1970-71 was reported at 10,210 hectares and has been declining constantly since then. The most dramati c change in the area under jute crop was between the period 1970 to 1976, which marked an almost 50% reducti on. The area under jute crop for the year 2006-07 was reported at 3967 hectares and the producti on of jute during that period was reported at 35,304 bales of 180 Kg each.
(c) Mesta: The area under mesta has decreased from 7,000 hectares in 1975-76 to 4,425 hectares in 2006-07. The producti on of mesta also decreased from 25,200 bales (180 Kg each) in 1975-76 to 20,178 in 2006-07. The decrease in the area under mesta and the producti on of mesta, though not as sharp as jute and cott on, is nevertheless visible.
9.4.4 Other crops
Other crops in the State include sugarcane and tobacco. These crops are however insignifi cant at this point in ti me. The area dedicated to sugarcane in the year 2006-07 was nearly 87 hectares and tobacco was grown on 709 hectares. The producti on of sugarcane and tobacco in the year 2006-07 was 239 metric tonnes and 468 metric tonnes respecti vely.
Performance, producti vity and comparati ve analysis
Majority of people in the State have been practi cing a very primiti ve form of agriculture. Agriculture is sti ll at the mercy of the weather in the State. The dependence on monsoons for supply of water to paddy and other wet culti vati on is sti ll signifi cant. In most areas, the interventi on from the farmers to improve farm producti vity is minimal. Although there is a reducti on in both the
240

MEGHALAYA STATE DEVELOPMENT REPORTMEGHALAYA STATE DEVELOPMENT REPORT
area under shift ing culti vati on as well as the people dependent thereon, it is yet to be controlled in full. Agriculture in several other parts of the country has risen from a subsistence level to large-scale commercial agriculture in the wake of the green revoluti on. Punjab for instance, has been able to use agriculture as the leading edge of growth. Meghalaya, however, has been trailing behind other states in this sector.
The consumpti on of NPK in agriculture is an interesti ng stage of development in NER. In per hectare counts of gross cropped area, it is somewhat signifi cant in Manipur with 130.5 kg per hectare. The consumpti on in Manipur is much higher than the all India level (89.8 kg/ha). In Assam, Tripura and Meghalaya, the consumpti on per hectare accounts for 46.6, 29.4 and 17 kg; while in the remaining four states, it ranges between 2.2 kg to 3.5 kg, the lowest being in Nagaland as recorded in the ferti lizer stati sti cs, 2003-04. The above indicate that except Manipur, the agricultural practi ce in northeast is primarily away from the use of chemical plant nutrients.
There is nevertheless hope, especially in the area of food grains producti vity, which has shown an encouraging growth in the last three decades. Notable improvement has been observed in the producti vity of most food grain crops in the state. Since 1970-71, the area under food grains has increased no more than 20% ti ll 2003-04, while the producti on of food grains has nearly doubled during the same period.
While the yield of rice has exhibited a consistent growth, the most spectacular improvement has been achieved in the yield of maize and wheat. The current yield of rice stands at 1,964 kilograms per hectare exhibiti ng about 60% growth since the 1970-71 level of 1,144 kilograms per hectare. The yield of maize rose from 538 kilograms in 1970-71 to 1,445 kilograms in 2005-06. Wheat yield was 1,788 kilograms per hectare in 2005-06 as compared to 744 kilograms in 1970-71, exhibiti ng an increase of approximately 140%. There however exist wide inter-district variati ons in the producti vity of food grains. For example, the Ri-Bhoi district produced 26.71 quintals of rice per hectare (highest) in the period 2006-2007, whereas, Jainti a Hills produced only 15.29 quintals (lowest) in the same period. Similarly, the yield of maize in Ri-Bhoi at 24.98 quintals was nearly 2.5 ti mes higher than the yield of maize in Jainti a Hills (11.77 quintals). Clearly therefore, special eff orts are required to increase the producti vity of food grains in all the three Garo Hills Districts and the Jainti a Hills District.
The improvement in producti vity of food grains can be att ributed to the introducti on of high yielding varieti es of seeds especially in the mid-seventi es. A signifi cant break through was achieved with the introducti on of High Yielding Varieti es of paddy such as Mahsuri, Ranjit, Bahadur and other improved varieti es series especially IR 36 which is suited for the Rabi season. Another major feat was achieved in 1990-91 with the introducti on of Megha I and Megha II - the cold tolerant rice varieti es, developed by the ICAR North East Region at Umroi for the higher alti tudes.
241

MEGHALAYA STATE DEVELOPMENT REPORTMEGHALAYA STATE DEVELOPMENT REPORT
At present about 61% of the area under rice or nearly 65,000 hectares, is under High Yielding Varieti es of seeds. Similarly, about 80 % of the area under maize is esti mated to be under High Yielding Varieti es while the coverage of H.Y.V in case of wheat is near 100%. Schemes /projects for the annual plan 2009-10, aims at (a) multi plicati on of quality seeds for distributi on to the farmers (b) taking up adapti ve trials for fi nding out suitability and adaptability of diff erent crop varieti es (released/ pre-released ) for taking up demonstrati on of such established varieti es in farmers fi elds for further extension and (c) to meet the demand of quality seeds of the farmers in the District (s) where Seed Farms are located.
9.5 Use of Agricultural Inputs: The means of agriculture employed by farmers in Meghalaya are largely primiti ve with very limited use of modern farm implements and farming techniques. The use of chemical ferti lizers, plant protecti on measures and the use of High Yielding Varieti es of seeds though steadily becoming popular is currently limited. However, some of the progressive farmers in the State have adopted modern farming techniques and have achieved signifi cant improvements in producti vity. The inputs are generally made available through the government machineries at the district, sub-divisional and Block levels and in some cases through other government agencies. Ferti lizers are channelised through the MECOFED, the government agency and other private wholesalers and ulti mately by the retailers. The problem here is that someti me the ferti lizers do not reach the State in ti me as they are procured from outside manufacturers owing to the non-payment of advances as required by certain ferti lizer manufacturer or due to delay in transportati on and since the agricultural crops are seasonal, it aff ects the producti on to a large extent. Shortage of ferti lizers during the peak planti ng season is another problem face by the farmers. Even when the delivery of the ferti lizers is on ti me, the delay may occur when the department fails to ti mely fi x the price of the ferti lizers.
• Seeds – Though the State has no Seed Corporati on of its own and has to depend on outside agencies for the supply of certi fi ed seeds, yet an att empt is made to supply breeder and foundati on seeds to the registered growers for multi plicati on and the certi fi cati on of such seeds has been taken up with the assistance of the Assam Seed Certi fi cati on Agency. The seeds thus produced are bought back by the Department for distributi on to other farmers in the State. To meet the demand of seed the State may not need a Seed Corporati on in the near future but the matt er of setti ng up a State Seed Certi fi cati on Agency is being taken up.
• Manures & Ferti lizers – Consumpti on of ferti lisers in the State during 2006-2007 was only 19 kg per hectare. This low ferti liser consumpti on is att ributed to various factors like practi ce of subsistence agriculture, small scale commercialisati on of agriculture which prove to be a positi ve trend as organic agriculture practi ces by default. It was reported that the consumpti on of ferti lizers
242

MEGHALAYA STATE DEVELOPMENT REPORTMEGHALAYA STATE DEVELOPMENT REPORT
in Punjab was 173.38 kilogram per hectare and 143.46 kilogram per hectare in Andhra Pradesh 5. Meghalaya consumed 1,832 tonnes of Nitrogenous ferti lizers in 2003-04 while the consumpti on of Phosphates and Potassic ferti lizers was 1,832 tonnes and 161 tonnes respecti vely. Practi ce of organic farming is by traditi on and the State encourages crop specifi c and locati on specifi c and the strategies for promoti on of use of ferti lisers consist of :
- publicity campaign along with fi eld demonstrati on, distributi on of pamphlets, use of print and electronic media.
- organisati on of intensive ferti liser promoti onal acti viti es in collaborati on with the ferti liser manufacturers.
- ensuring quality control of ferti lisers.- use of soil amendments to reduce soil toxicit.y- encouraging soil testi ng in a large scale to ensure balance use of ferti liser effi ciency.- maintaining soil health ferti lity through large scale use of organic manures, green
manuring and use of bio-ferti lisers.
• Plant Protecti on measures – The State does not have severe problem from pests and diseases and any such problem in epidemic scale is being controlled eff ecti vely. The use of integrated pest management is alive among the farmers though in small scale but to certain extent managing the pest problem in the fi eld. Pest control strategies are being made aware to the farmers of the State through organisati on of training programmes especially on IPM for various crops, practi ce of seed treatment either by chemicals or through discarding infected seeds from planti ng in the fi eld, judicious use of ferti lisers and water management, need-based use of environmental friendly pesti cides, maintaining suffi cient pesti cide stocks to counteract any unexpected and sudden incidence of pests and diseases, distributi on of plant protecti on chemicals and equipment to farmers at subsidised rates, producti on of biological agents and use of resistant varieti es of crops. The pesti cides and equipment are made available to the farmers through various sale points in the government, co-operati ve and private sectors.
9.6 Technology
Irrigati on Faciliti es – Though agriculture in the State is mostly rain-fed, irrigati on faciliti es are being provided to certain extent. The ulti mate irrigati on potenti al of the State is approximately 2.18 lakhs hectares. Out of the total potenti al created, 23351.72 hectares is under surface water and 1913.45 hectares under the ground water. In most of the irrigati on projects, the sense of ownership of the faciliti es by the users is not up to the mark and therefore, maintenance of the faciliti es created by the government is not sustaining for longer periods. Eff orts to organise users’ organisati on or groups are being taking up through parti cipatory involvement.
5 Source: http://agricoop.nic.in/
243

MEGHALAYA STATE DEVELOPMENT REPORTMEGHALAYA STATE DEVELOPMENT REPORT
Mechanizati on of agriculture - The extent of mechanizati on in the state is currently very low. Agriculture in the state is largely manual labour oriented. Furthermore considering the undulati ng topography of the state and the considerably small average size of holding, it may be very diffi cult to increase the mechanizati on of agriculture in the state on the lines of some of the other states in the country. However, selecti ve and eco-friendly mechanisati on is being given due emphasis with special reference to rain-fed farming so as to make Agriculture effi cient and competi ti ve, to increase producti vity by catching the right ti me of sowing / planti ng and to make farming acti vity more remunerati ve. Reclamati on of degraded and fallow lands is being given high priority to improve quality and maximise producti ve use.
The present mechanizati on in the State is perhaps one of the least in the country in which the per hectare availability of Mechanical Power is hardly 0.358 HP when compared to the All India average of 1.00 HP and the Assam state average of 0.40 HP. Therefore, to assist the farmers in getti ng maximum returns from their land, this fi gure is to be increased considerably with maximum funding. Government of India in its Draft Mechanizati on Policy proposes that this fi gure be raised to 2 HP per hectare by the year 2020 AD.
It has been observed that certain specifi c implements such as a mini transplanter for rice crop, small power ti llers and mini rice reapers may be especially suited for the nature of farming practi ced in the State.
Various plans and projects are being implemented in the State to achieve this aim and one such project is the Mechanizati on of Agriculture acti viti es through the following Farmers’ Friendly Schemes as follows :
Machineries viz. tractors and power ti llers are being run and maintained by the State which are hired-out to poor and landless farmers at 60% subsidy of the running/ maintenance cost. However this being a scheme under the Public Sector, its capacity uti lisati on could not therefore be maximised.
Loan Cum- Subsidy Scheme on purchase of power ti llers/ power pumps by which a subsidy of Rs. 45,000 per power ti ller of 12 HP and Rs. 10,000 for each Power pump of 8-10 HP is being granted to selected farmers, Farming Societi es, etc. for maximum benefi ts to the farming populati on in terms of number of machines. Under this scheme around 35-40 numbers of power ti llers are being distributed annually. In order to increase this number of machines as well as to att ract more farmers to come forward, the state is in the process of enhancing this fi gure by another 500 power ti llers during the current year with minimum investment from the farmers for their shares of the cost by reducing the Interest on Loans from Banks to 7% per annum as already agreed by some of the Banks.
244

MEGHALAYA STATE DEVELOPMENT REPORTMEGHALAYA STATE DEVELOPMENT REPORT
Micronutrients - The use of micronutrients in Meghalaya is negligible. Test reports have indicated defi ciency of zinc and copper in some areas while toxic levels of iron has been detected in some low lying areas in the state. A detailed study on promoti ng the use of micronutrients is yet to be conducted in the state.
Bio-ferti lizers - Bio-ferti lizers have the potenti al to transform agriculture. Azolla, or Mosquito Fern as it is commonly known, has tremendous nitrogen fi xing capabiliti es and can multi ply rapidly in water. Azolla can therefore greatly enhance nitrogen availability to paddy. Steps have been initi ated recently to promote organic farming in the state. With that end in view, the state has established one bio-ferti lizer producti on of Azolla unit at Sangsangre in West Garo Hills.
Organic Manure/Vermicompost - Considering the low use of chemical ferti lizers in the state, agriculture has a great potenti al for organic farming. It can also help in avoiding many of the adverse eff ects of the indiscriminate use of chemical ferti lizers suff ered by some of the other states like Punjab. There is some use of organic manure in the state, largely in the form of Farm Yard Manure. The Department of Agriculture has also procured and distributed other organic manures such as: Bio Plus, Celrich, Vikas Omm, Vikas Neem, Classic Organic Manure, Rallimeal, Adhar and Mahalaxmi. In additi on, Vermicompost units have been established in all seven districts of the state with a view to promote the use of vermicompost. The Department is providing fi nancial assistance of Rupees 10,350 for setti ng up vermicompost pit. In additi on, a fi nancial assistance of Rupees 35,000 is being provided to each benefi ciary under the Technology Mission for Development of Horti culture. Integrated Pest Management - The Agriculture Department is promoti ng the use of Integrated Pest Management techniques for certain crops like paddy and potato by organizing farmers’ fi eld schools. Demonstrati on programs have also been conducted on the use of Pheromone traps, Scirpophaga incertulas lures and Trichogramma to guard against stem borers etc.
Agricultural infrastructure in the State
Regulated markets - The State has two regulated markets. One in is Zone I comprising of East/West Khasi Hills and Ri-bhoi districts and the other one is in Zone II comprising of East, West and South Garo hills. The Jainti a Hills District comprised in Zone III, does not yet have a regulated market. In additi on, the State also has 108 weekly markets – 35 in Zone I, 57 in Zone II and 16 in Zone III.
Processing Centres - The state does not have any primary processing centre for processing of agricultural produce. There are however two secondary processing centres: one each in Zone I and Zone II.
245

MEGHALAYA STATE DEVELOPMENT REPORTMEGHALAYA STATE DEVELOPMENT REPORT
Storage faciliti es - The State has storage capaciti es of 250 MT each at Gakugiri, Kharkutt a and Mawiong. The State also has cold storage faciliti es of 1000 MT capacity each at Mawiong and Garobadha.
Soil testi ng laboratories - The State’s Agriculture Department is equipped with a total of three soil testi ng laboratories as on 2007-2008 with a capacity of analyzing 20,000 soil samples out of which 1000 soil samples are targeted for analysis through the only Mobile Testi ng laboratory. The stati c and mobile laboratories analysed 8,400 samples and 328 samples respecti vely in 2007-2008.
Agricultural Products Marketi ng - The Meghalaya Assembly passed the Agricultural Produce Market Act in 1980. Accordingly, The Meghalaya Agricultural Produce Market (General) Rules 1982 and the by-laws of the Meghalaya State Agricultural Marketi ng Board 1983 were implemented in the state. Two market committ ees have so far been consti tuted in the State.
9.7 Constraints in agriculture development
Water Resources & Rain-fed Agriculture - Agriculture in the State is mainly dependent on the monsoons in the kharif and culti vati on in the rabi is carried out with soil moisture retenti on. Due to the natural terrain, creati on of irrigati on potenti al is limited though irrigati on projects have been taken up parti cularly in low lying belts of the State. With the State experiencing heavy rainfall annually water availability is adequate for a few months but water retenti on capacity is less. Water harvesti ng structures and water pumps may help to make water available during the dry months.
Forest Degradati on - In Meghalaya, ownership of land lies with individuals, community and clans and the State have limited control over the private lands. This leads to unwanted destructi on and poor management of forest lands over the years but with the regulated ban of felling of ti mber by the Supreme court, there has been appreciable regenerati on of the forests with people switching over to other agriculture and non-agriculture acti viti es.
Land Degradati on & Shift ing Culti vati on - Acute soil erosion and ecosystem degradati on has taken place in the State, primarily due to deforestati on because of ‘slash and burn’ method of culti vati on ( jhumming ) as also ti mber felling coupled with high intensity rainfall and soil conditi ons. The low producti vity of Jhum culti vati on due to shortening of the jhum cycle with its impact on declining ferti lity has resulted in conti nued encroachment on the forest resources, stagnati on in the rural economy and progressive land degradati on. The environmental consequences in an area renowned for its rich bio-diversity are also severe. Most families recognize that Jhum culti vati on
246

MEGHALAYA STATE DEVELOPMENT REPORTMEGHALAYA STATE DEVELOPMENT REPORT
is no longer a sustainable livelihood system but because of lack of knowledge and convicti on to adopt producti ve alternati ve development opti ons the process of substi tuti ng the age-old practi ce takes considerable ti me.
The following approaches for Jhum culti vati on have been suggested:
- Adopti on of an inter- disciplinary, multi -sectoral approach
- Assisti ng farmers in the gradual conversion of their presently unsustainable farming systems into a more sustainable system though (i) increasing the producti vity of short fallow cycle Jhum plots through modifying the crop mix towards more producti ve and profi table crops, and introducing crops and agronomic practi ces which contribute to soil conservati on; and (ii) promoti on permanent plantati on crops in fallow Jhum fi eld
- Expansion of sett led culti vated land through constructi ng perennial irrigati on schemes in order to increase food producti on ;
- Building on the natural advantages of the area through greater emphasis on forestry and agro forestry as sources of livelihood as well as environmental protecti on;
- Adopti ng strategies suited to the remoteness of region through emphasis on low input technology and on high value/low volume, non perishable crops off ering windows of opportunity for marketi ng outside the region (e.g. tea, ti mber, forest products, cashew, arecanut, essenti al oil) or products for the local market (e.g. livestock products and fi sheries).
Sustainability of Crop Producti on - The instability in producti on may be att ributed to various factors such as unpredictable natural calamity like fl ash fl oods, high rainfall levels, inconsistent use of modern technology, etc. Eff ecti ve crop rotati on parti cularly with leguminous crops and crop diversifi cati on with proper applicati on of soil nutrients can help towards sustainability in crop producti on. High yielding and improved varieti es suitable to the specifi c alti tudinal zones along with opti mum nutrients increase crop producti on.
Livelihood Access - The State has abundant natural resources and the people are excessively dependent on these that leads to environmental imbalances. The excessive and unscienti fi c extracti on of coal have reduced the culti vable land to a great extent and destroying the water bodies which become unfi t for human consumpti on. The haphazard digging of stones and sand from hill slopes cause extensive soil erosion that bring about silti ng problems. There is a decline in provision of livelihoods from agricultural acti viti es but in some way this has come about through non-agricultural acti viti es during off -seasons. The causes of food insecurity may be the constraints
247

MEGHALAYA STATE DEVELOPMENT REPORTMEGHALAYA STATE DEVELOPMENT REPORT
in food producti on besides the structural problems relati ng to poverty and that the majority of the poor populati ons are concentrated in rural areas. These problems can perhaps be overcome by fostering social development, gender equity, income generati on, improved nutriti onal status, environmental sustainability, good governance and by enhancing their bargaining power in the marketplace which will improve the livelihood of the rural masses in a sustainable manner uti lizing their resource base. The traditi onal community based insti tuti ons can play acti ve role by looking at parti cipatory, sustainable and viable mode of rural development with governmental support at the grassroot level.
- To improve the livelihood of the people in a sustainable manner, the overall objecti ves are based on
- promoti on of more sensiti ve approach to the design and implementati on of development interventi ons
- enhancing the capabiliti es of local people to manage new technologies at the village level- increasing incomes through the development of more sustainable farming system and the
establishment of off -farm enterprises- making people more aware of the need to preserve and regenerate natural resources;- establishing eff ecti ve and appropriate delivery systems for input and for the maintenance of
assets and resources- enhancing savings capacity and establish the habit of thrift - increasing access to basic services and infrastructure faciliti es.
The approach may be more focussed to make the farmers more responsive to the various developmental programmes that suit their needs and prioriti es, to be more involved in decision making and planning, to be more responsible in the management of the development programmes for greater sense of ownership and to be more conscious of traditi onal values whose strength can be uti lised effi ciently for sustainable food producti on.
9.8 Agricultural Credit
The Agricultural Loan extended by the State fi nancial Insti tuti on i. e. Meghalaya Cooperati ve Apex Bank Ltd. (MCAB) has been in operati on in the State to assist farmers with agricultural fi nancial loan under (1) Short Term Loan (STL) (2) Medium Term Loan (MTL) (3) Long Term Loan (LTL). Short Term Loan (STL) are extended to the farmers through the Service Cooperati ve Societi es and the crops covered are Ahu paddy, Irri-paddy, Summer potato, Ginger, Tomato, Caulifl ower, Mustard seeds, Cott on, Soyabean etc. Medium Term Loan (MTL) are provided for Agriculture/ Allied sectors and acti viti es to individual/ group entrepreneur(s) / Farmer(s) and is meant for raising Broomsti ck, Pineapple, Banana etc. However, a major credit under MTL goes to the Allied
248

MEGHALAYA STATE DEVELOPMENT REPORTMEGHALAYA STATE DEVELOPMENT REPORT
sector (Veterinary & Animal Husbandry). Long Term Loan (LTL) under this scheme the MCAB provides agricultural credit for Horti culture plantati on, Arecanut Processing, Purchase of Tractors, Power ti llers, Pump sets etc.
MCAB has been exploring the possibiliti es and eff orts of increasing the fl ow of Agricultural Credit support to farmers – members of Service Cooperati ve Societi es, Individuals or group entrepreneur of the rural areas but various constraints are hindering the normal fl ow of credit. The fl ow of credit in agriculture are constrained due to following reasons:-
- The land tenure system acts as an impasse to the progress of agricultural sector in terms of mortgaging for procuring fi nancial assistance in the form of crop loans.
- About 80% of the farmers are small and marginal farmers who have an average size of operati onal holding not less than one hectare which is not perhaps viable for taking investment for culti vati on in the form of crop loans.
- Most of the farmers are not accessible to the insti tuti onal credit due to the absence of land ownership, land deed, culti vati on right, lease right, land records, etc.
- The credit programmes of most of the fi nancial insti tuti ons are held up due to shortcomings, inadequate, improper identi fi cati on of benefi ciaries, delay in formati on of groups and the failure of the insurance agencies to cover the investment risk, this thereby restrict the insti tuti onal fl ow of credit in the agricultural sector.
9.9 Agricultural Marketi ng
The State has an internati onal boundary of more than 423 kilometres along the Southern slopes towards Bangladesh and prior to Independence, the border area people of the then composite State of Assam used to have free trade with the people of erstwhile East Bengal (now Bangladesh). However aft er the parti ti on of the country, the normal trade which fl ourished earlier was badly aff ected due to the closure of the border hats and bazaars. The border areas of the State produce large quanti ty of citrus fruits mainly oranges, banana, pineapple, tezpatt a, arecanut, betel leaf, jackfruit and other subtropical fruits. Similarly, the higher alti tude region produce signifi cant quanti ty of table potato, ginger, turmeric, off -season vegetables and some temperate fruits. These produces are in great demand in the neighbouring countries.
Therefore, the reopening of these border trades through recognized trade routes for the export of these materials by relaxati on of the export procedures will go a long way to ease the problem of disposing the perishable produces and thereby helped to develop the economic conditi on of the people of the State.
249

MEGHALAYA STATE DEVELOPMENT REPORTMEGHALAYA STATE DEVELOPMENT REPORT
The enti re North-Eastern Region including Meghalaya is having enough potenti al and scope for agri-horti cultural development but the provision of faciliti es for trade of raw as well a processed produce is a pre-requisite for this development in the enti re region. Side by side a well-planned programme on processing, sorti ng and marketi ng of all these commoditi es either in the raw form or as fi nished produce is a must for the all-round economic development. In fact, almost all the hilly States of the region are producing similar type of agri-horti cultural produces and the surplus producti on of these commoditi es are disposed off to consumers in the metro citi es. However, the disposal of these surplus produce especially the perishable items is not always possible because of the distance, transport cost, transit damage and sti ff internal market competi ti on. Moreover, the perishable nature of these produces demands quicker and safe transportati on to avoid delay and damage. In this context, the accessibility and proximity with Bangladesh and other bordering countries of Bhutan and Myanmar appear to be an advantage to most of the North Eastern States and parti cularly the State of Meghalaya. With the “Look East Policy” of the Government, the avenues for marketi ng of farm produce will be enhanced.
It is a known fact that Agricultural Marketi ng is an adjunct to agricultural producti on and the producti on functi on is complete when marketi ng is so arranged that the producer is assured of a fair return for the investment made by him. Unless the farmers get a remunerati ve price for their produce, they will not go for increased producti on. Development of the effi cient disposal system of the farmers produce is therefore most vital and a must for increasing agricultural producti vity, farmers’ income and ulti mately the economic conditi on of the State as a whole.
The State Government is fully aware of the fact that the establishment of effi cient agricultural marketi ng system where the growers may obtain remunerati ve prices for their produce is essenti al and vital for accelerated development and commercializati on of Agriculture. An increased producti on for increased marketable produce calls for a rapid improvement in the existi ng agricultural marketi ng system in the State and for bett er regulati on of buying and selling of certain agricultural commoditi es, the Meghalaya Agricultural produce Market Act 1980 was enacted with the establishment of the regulated markets. Though their functi oning is presently very limited to certain areas of the State and confi ned to selected agricultural commoditi es, yet this will enhance the expectati on in the eradicati on of the functi on of intermediaries and various malpracti ces such as under-weighing of produce, unauthorized and unjust deducti on from prices off ered to producers, unfair price setti ng and other malpracti ces. Consequently, the farming community will be greatly benefi ted in obtaining remunerati ve prices for their produce and the trading community will also get a fair deal in trade.
Concerning other issues relati ng to the marketi ng of Agricultural Produce of the State, the following points may be menti oned:
250

MEGHALAYA STATE DEVELOPMENT REPORTMEGHALAYA STATE DEVELOPMENT REPORT
- At present, most of the markets dealing with Agricultural Produces are managed and controlled by diff erent agencies like the Autonomous District Councils, Autonomous Committ ees, Private personnels like the Syiems, the Dolois, the Nokmas, etc. without giving much importance on the developmental acti viti es. Perhaps, all the markets should be brought under the control of a single agency like the State Marketi ng Board to provide bett er faciliti es to the market users.
- At present, the sellers and the traders have to pay diff erent types of fees to diff erent agencies causing numerous inconveniences. A single point for collecti on of fees may be introduced through a single agency as indicated above.
- The District Council Market Act may be amended to allow the State Agricultural marketi ng Board to manage and control all the markets in the State.
- The new concept of agricultural marketi ng through Contract farming may be allowed without depriving the legiti mate revenue of the concerned authority.
- The producers may be allowed to go for direct marketi ng of agricultural produce to the consumers or the processing units.
- Parti cipati on of the private sectors in agricultural marketi ng within the framework of market regulati on may be considered.
Issues in research, extension and training: Adapti ve trials; Alti tude specifi c crop-wise experiments; setti ng up more KVKs for farmers training & fi eld demonstrati ons in each district; Training of Educated Rural youth for self-employment through farm-based acti viti es; Support in Extension Reforms through ATMA presently only in three districts to be expanded with adequate Capacity building.
Horti culture
Meghalaya is blessed with tropical, semi-tropical and temperate climates. This variati on in climate, along with the diverse relief and soil conditi ons in Meghalaya create the right environment for the culti vati on of a wide variety of horti cultural crops in the state. Traditi onally, a vast majority of the culti vated area has been dedicated to food grain crops, especially paddy. However, recently, there has been an increased focus on promoti ng of horti culture crops in the State.
9.9.1 Signifi cance of horti culture in the state
The hilly topography and land conditi ons of the State leave litt le scope to bring any more area under fi eld crops. Moreover, based on the land uti lizati on stati sti cs for the state for 2000-01, 20.63% of the total reporti ng area of the state, or nearly 462,278 hectares, is categorized as culti vable wasteland. Another 7.68% of the reporti ng area or 172,120 hectares are reportedly
251

MEGHALAYA STATE DEVELOPMENT REPORTMEGHALAYA STATE DEVELOPMENT REPORT
“fallow land other than current fallow”. The enti re such area (i.e. 634,398 hectares) can be eventually brought under horti culture crops. Clearly therefore, there is enormous potenti al for horti culture in the state. Horti culture crops generally command bett er economic value and have a greater export potenti al. It provides a viable alternati ve to shift ing culti vati on and can help bring culti vable wastelands under profi table uti lizati on. Furthermore, horti culture restores vegetati ve cover to soil, thereby preventi ng soil erosion.
9.9.2 Major horti culture crops in the state
The Geo-climati c conditi ons in Meghalaya are most suited for many diff erent types of horti cultural crops including fruits, vegetables, spices, aromati c and ornamental plants, medicinal plants and plantati on crops. Some of the important horti cultural crops in the state include:
FruitsThe important fruits currently being grown in the state include banana, oranges, pineapple, papaya, jackfruit, litchi, plum, peach, and pear, lemon, apricot, tamarind, mango local, pomegranate, mosambi, Valencia, chestnut, passion fruit, sohiong, sohphie, sohshang, sohkwit, sohmad, sohbrap, chinara and cambil. Of these, perhaps the four most important are Pineapple, Citrus (Mandarin Orange), Papaya and Banana. The major fruit groups in Meghalaya are as under:
(a) Citrus fruits: The most dominant citrus fruit group in the state is the Mandarin orange, which fi nds patronage both within and outside the state. These are considered to be very high quality and fi nd good acceptance among customers. The sub-mountainous tract along the Indo-Bangladesh border is the home of the citrus fruits. There has been a marginal increase in the area under citrus fruits during 1999-2000 to 2005-06 from 7,568 hectares to 8,871 hectares with occasional peaks and troughs in between. The producti on of citrus fruits also increased by nearly 7.2% during the same period from 34,173 metric tonnes to 36,893 metric tonnes.
(b) Pineapple: Pineapple is one of the most important horti culture fruit crops in the state. However, there has been no signifi cant increase in the area under pineapple in the state. The area under pineapple culti vati on during 2005-06 was reported at 10,135 hectares while in 1999-2000, pineapple crop covered 9,382 hectares. The producti on of pineapple during 2005-06 was reported at 93,625 metric tonnes – nearly 11% higher than the 1999-2000 level of 82,461 metric tonnes. Ri-Bhoi district is currently the largest producer of pineapples in the state. It produced 39,066 metric tonnes in 2003-04 accounti ng for a quarter of the total producti on of pineapple in the state during that year.
(c) Banana: Banana is another important fruit crop in the state and has been grown in the state for a very long ti me. It has considerable economic value and several varieti es of banana like Jahaji, Chenichampa, and Malbhog besides other indigenous varieti es of banana are grown in the state. The area under Banana has grown consistently in the last three decades. It increased from 2,130 hectares in 1970-71 to 6,426 hectares in 2005-06 indicati ng a 300% net increase. The producti on
252

MEGHALAYA STATE DEVELOPMENT REPORTMEGHALAYA STATE DEVELOPMENT REPORT
of banana however, has not grown in proporti on with the increase in the area. The producti on of banana in 2005-06 was reported at 71,695 metric tonnes, only about 28% higher than the 1970-71 level of 52,147 metric tonnes. There has been a signifi cant decrease in the yield of banana in the last three decades. While each hectare under banana crop yielded 24,482 kilograms in 1970-71, the yield of banana plummeted to 11,157 kilograms per hectare in 2005-06.
(d) Papaya: The share of papaya in the fruits grown in the state is meager both in terms of the area under its crop as well as its share in the fruit producti on. The producti on of papaya was 3,941 metric tonnes from 507 hectares in 1999-2000. The area under papaya grew to 584 hectares producing 4667 metric tonnes.(e) Temperate fruits: Plum, peaches, pears and apricots are some of the temperate fruits grown in the state. These are found mainly in the East and West Khasi Hills and the Jainti a hills. Their producti on is however currently insignifi cant.(f) Other fruits: Besides the major crops menti oned above, some other crops are also grown in the state. These include Strawberry, Guava, Mango, Litchi, Lime/Lemon and Sweet Orange. There is a limited coverage of these crops at present but are esti mated to have a great potenti al.
VegetablesVegetables grown in Meghalaya are of a very high quality and are considered to be among the best in Northeast. The agro-climati c conditi ons in Meghalaya favour the culti vati on of vegetables throughout the year. The off -season vegetables produced in the state are in great demand in the neighbouring states. The area, producti on and producti vity in the vegetable sector have been showing an increasing trend. Vegetables like Cabbage, Caulifl ower, Radish and Squash are regularly marketed outside the state. In fact, revenue returns from vegetables in Meghalaya tend to be higher than that from cereals. The other important vegetables of the State are beans, carrots, peas and tomatoes.
The Agriculture Department through its Directorate of Horti culture is taking steps to accelerate the growth of the vegetable sector by encouraging farmers to grow vegetables in poly-houses and providing them subsidy on the cost of such houses. Vegetable producti on in poly-houses is expected to double the producti vity. Steps are being taken to extend vegetable culti vati on in and around administrati ve headquarters to meet the increasing demand for vegetables in these centres. Quality seeds /seedlings, plant protecti on chemicals and garden tools are also being distributed at 50% subsidy to farmers.
Tuber CropsThe principal tuber crops grown in the state are potato, sweet potato and tapioca. The East Khasi Hills District is the largest producer of tuber crops in the state accounti ng for more than half of the area under tuber crops. West Khasi Hills is the second major producer of tuber crops. The total area under tuber crops in the state has decreased marginally from 29,892 hectares in 1995-96 to
253

MEGHALAYA STATE DEVELOPMENT REPORTMEGHALAYA STATE DEVELOPMENT REPORT
26,862 hectares in 2003-04. Out of three tuber crops grown in the state, Potato is by far the most dominant crop and is also the most important commercial crop of the Shillong Plateau. It accounts for almost two-thirds of the area under tuber crops. Culti vati on of potatoes in the region has a long history and dates back to Briti sh ti mes. The area under potato has decreased between the periods 1995-96 to 2005-2006. From 20,863 hectares in 1995-96 it reduced to 17,986 hectares in 2005-2006. The producti on of potatoes also decreased drasti cally from 208,630 metric tonnes in 1995-1996 to 167.030 metric tonnes in 2005-2006. A sharp decrease in the yield of potato was also recorded during the same period from 10,000 kilograms per hectare to 9287 kilograms. This possible reasons are many and most importantly because of the degenerated potato seed used by the farmers and the dwindling nutrient in the soil where potato has been grown traditi onally.
The period 1995-96 to 2005-06 has however, has not been very favourable for potato. During this period, there has been a decrease in both the area under potato culti vati on and the producti on of potatoes. The area under potato culti vati on dropped to 17,986 hectares and the producti on of potatoes decreased to 167,030 metric tonnes. The decrease in producti on of potatoes therefore, has been proporti onately higher compared to the reducti on in the area under potato culti vati on. This can be att ributed to the decline in potato yield to 9287 kilograms per hectare.
MushroomsMeghalaya has a great potenti al for producti on of mushrooms. Culti vati on of mushrooms in the state is increasingly becoming popular because of the high yield and remunerati ve prices. Meghalaya produces nearly fi ve metric tonnes of fresh mushrooms. While mushroom farmers in Meghalaya produce several varieti es of mushrooms, two varieti es have the highest market potenti al, namely the white butt on mushroom and the Dhingri/Oyster mushroom.
A Regional Centre for Training and Producti on of Mushrooms in the North Eastern Region, sponsored by the North Eastern Council has been set up at the Agricultural Complex in Upper Shillong with the objecti ve of promoti ng producti on of mushrooms. Some of the key objecti ves of the centre are to produce and supply quality spawn, provide training faciliti es to interested entrepreneurs, preparing sterilized compost and providing dehydrati ng and marketi ng faciliti es. The centre is currently promoti ng the Dhingri/oyster mushroom in preference to the butt on mushroom due to the amenability of the former to dehydrati on. Besides, the Dhingri mushroom has a higher preference in the internati onal market. The Mushroom Centre produces quality spawn (seed) for supply to farmers of the State at subsidized rates. It also meets the demand for spawn of the other North-Eastern States.
Spices Meghalaya is home to a wide variety of spices, of which the most important ones are: turmeric, ginger, chilly, black pepper and bay leaf. In additi on, large cardamom has also been introduced recently. Bay leaf is mainly a forest produce and is concentrated on the southern slopes on the
254

MEGHALAYA STATE DEVELOPMENT REPORTMEGHALAYA STATE DEVELOPMENT REPORT
border with Bangladesh. The other spices that are culti vated in the State are : (a) Ginger: Ginger is the most important spice grown in the state. While it is grown inalmost all parts of the State, East Garo hills is the largest producer of Ginger. The area under Ginger in the year 2005-06 was reported at 9,625 hectares. The producti on of ginger during that year was reported at 53,609 metric tonnes. (b) Turmeric: Meghalaya Turmeric, parti cularly the Lakadong variety produced in the Jainti a hills, is considered to be the world’s best turmeric with curcumin content as high as 7.5%. Meghalaya produced 10,508 metric tonnes of turmeric from 1,817 hectares in 2005-06. Turmeric is grown all over the state, but Jainti a Hills has the highest area under turmeric and contributed more than half of the turmeric produced in the state.
(c) Chillies: Chillies is the third most important spice in Meghalaya. The producti on of chillies in the year 2005-06 was recorded at 1,303 metric tonnes while the area under chilies was 1,844 hectares during that period.
(d) Black Pepper: Black pepper is mostly grown in the border areas of the State. High yielding variety like Panniyur-I has been successfully introduced and multi plied.
Plantati on CropsThe major plantati on crops culti vated in the state are tea, areca nut, cashew nut and rubber. The department of soil conservati on introduced tea, coff ee and cashew nut to att ract the Jhummias for permanent culti vati on. Coff ee in the state has failed to take off because of the complexiti es involved in the post harvest management acti viti es and for want of the requisite infrastructure. Cashew nut plantati ons have received relati vely bett er acceptance. The Horti culture Department has recently introduced coconut but the area under coconut and its producti on is currently too small. Some of the major plantati on crops that fall within the purview of the horti culture department are discussed hereunder:
(a) Arecanut: Betelnut has always been very popular in the state and a large majority of the populati on in the state chews the nut. Arecanut has therefore been grown in the state since ti mes immemorial as an important commercial crop. It is grown extensively all over the state. The area under Arecanut plantati on in the year 2005-06 was reported at 11,507 hectares and the producti on of Arecanut in the state in the same year was reported at 15,530 metric tonnes. Arecanut has been heavily infl icted with a disease called “Bud Rot” which is known to have aff ected the producti vity of areca nut in the past. The current trends in the yield of areca nut however reveal that the incidence of “Bud Rot” is decreasing. Considering the popularity of areca nut within the state and its demand outside the state as an ingredient for pan masala etc., the prospects for areca nut in the state appear to be bright.
(b) Tea: The agro climati c conditi ons in Meghalaya are considered suitable for tea plantati ons. Accordingly, in 1974, on the recommendati ons from the tea board, tea experimental stati ons were established in the districts of Ri-Bhoi, West Khasi Hills and the West Garo Hills. Encouraged by the
255

MEGHALAYA STATE DEVELOPMENT REPORTMEGHALAYA STATE DEVELOPMENT REPORT
success of these experimental stati ons, the department decided to encourage tea plantati ons all over the state. With that objecti ve, the departmental tea nurseries in some parts of the state were setup to supply good planti ng material to tea growers. A package incenti ve scheme for tea culti vati on with a cash subsidy of Rupees 15,000 per hectare has also been started. The state dedicated 1,320 hectares to tea plantati ons in 2005-06 and produced 5,610 metric tonnes of tea in that year.
(c) Cashew Nut: Culti vati on of cashew nut is being taken up extensively in the Garo Hills. The area under cashew plantati ons in 2005-06 was 6,785 hectares. The producti on of cashew in 2005-06 was 11,207 metric tonnes. The cashew plantati ons in the state are the result of Jhum control eff orts carried out by the directorate of soil conservati on. Most cashew plantati ons therefore occur on abandoned Jhum plots. The directorate of Horti culture is exploring more avenues for boosti ng up cashew nut culti vati on under diff erent ongoing schemes with a view to boost cashew nut producti on. A processing unit is also being envisaged at a later stage once the volumes warrant such a unit.
FlowersClimati c conditi ons in Meghalaya are highly suited for low cost culti vati on of a vast variety of fl owers including off -season fl owers such as orchids, bulbous plants, birds of paradise, chrysanthemum gerbera, gladiolus, marigold, carnati ons etc. However, commercial fl oriculture in the state is at its nascent state and therefore not much market potenti al for fl owers in Meghalaya currently exists. The State’s Horti culture Department is taking steps to promote fl oriculture in the state. Towards this end, they have set up Centres of Excellence for Rose in the Ri Bhoi District and for Anthurium in the East Garo Hills District. The Department has also engaged an outside consultant to seek advice on the fl oriculture and to help identi fy the potenti al markets.
With the coming up of new markets for fl owers, commercial fl oriculture is being encouraged under the Technology Mission of Horti culture. Under the mission, farmers were given fl ower seeds and poly houses. To site an example, an inhabitant of a Mawreng village who constructed a green house with the help of the Horti culture Department is now generati ng an income of Rupees 800 daily from the sale of fl owers. A number of fl oriculture nurseries are currently fl ourishing in and around Shillong. Medicinal PlantsMeghalaya has a large variety of medicinal plants and has had a long history of traditi onal system of medicine. More than 700 species of medicinal plants have been identi fi ed and listed in Meghalaya. The State Government however, is acti vely promoti ng a few important plants such as: Cinchona ledgeriana, Rauvolfi a serpenti na, Salanum Khasianum, Swerti a chirata, Taxus wallichiana. A detailed discussion on medicinal plants appears in Chapter 2 – Development and Management of Natural Resources.
256

MEGHALAYA STATE DEVELOPMENT REPORTMEGHALAYA STATE DEVELOPMENT REPORT
Indigenous PlantsMeghalaya also has several indigenous fruit plants, herbs and shrubs, which are found exclusively in the state. The Department of Agriculture has started exploiti ng some of these plants commercially in pickles, dyes, aromati cs etc. Some of these plants are: Myrica nagi, Prunus nepalensis, Eleagnus Khasianum, Flemingia vesti ta, Docynia indica Khasiana etc. 9.9.3 Infrastructure for processing and marketi ng
There are two fruit processing units in the state. One is at Shillong with an installed processing capacity of 60 metric tonnes and the other is at Dainadubi in East Garo Hills with an installed capacity of 40 metric tonnes. These processing plants produce squashes, canned fruits, juices, jams, jellies, marmalades and pickles. The Directorate of Horti culture has also set up 24 horti culture farms all over the State. These farms carry out a variety of acti viti es.
However, the state currently lacks a robust distributi on and marketi ng infrastructure for horti cultural produce. There is also a dearth of proper storage and processing faciliti es and organized markets for the disposal of horti cultural produce. The demand for horti culture products in the state currently far exceeds the producti on; as such most horti culture produces are consumed immediately. However, the horti culture products are relati vely more perishable and as the department’s eff orts to promote horti culture bear fruit, the State may require a well-established processing and marketi ng infrastructure to manage the horti cultural produce. Any eff orts to promote horti culture in the State in the absence of a proper processing and marketi ng infrastructure may actually prove to be counterproducti ve. The success of horti culture in other states like Himachal Pradesh is att ributable largely to an effi cient infrastructure for horti cultural processing and marketi ng.
9.9.4 Constraints in horti culture development
Horti culture is a complex discipline and requires specialized knowledge. It also demands a more acti ve post harvest management. Further, owing to the perishable nature of most horti cultural products, a very robust support infrastructure is also required for storage, processing and marketi ng of horti culture produce. Most farmers in the country practi ce subsistence farming and food security is sti ll the most important concern. If the area under food grains was any indicati on, it may be easily concluded that Meghalaya is no excepti on. It may indeed be counter producti ve therefore, to indiscriminately encourage horti culture in the absence of the necessary support infrastructure. Some of the most important impediments to the development of horti culture in the state are as follows:(a) Inadequate infrastructure for post harvest management: The state does not yet have a robust infrastructure for post harvest management making it diffi cult for farmers to process and market their produce. This is especially true for plantati on crops like tea, coff ee and rubber. This has caused lot of disillusionment among farmers in the past.
257

MEGHALAYA STATE DEVELOPMENT REPORTMEGHALAYA STATE DEVELOPMENT REPORT
(b) Irrigati on faciliti es: Horti culture demands assured irrigati on faciliti es. The coverage of irrigati on infrastructure in the state is currently limited. This poses a serious problem for promoti ng horti culture in the state.
(c) Land use and land tenure system: Land in certain areas is subjected to paddy and other forms of conventi onal agriculture even though it is considered unfi t for such form of agriculture. However, Meghalaya does not have a well-defi ned, scienti fi c land use policy and land use in the state is mostly arbitrary and is oft en detrimental to soil and the ecosystem. On account of the land tenure system in Meghalaya, The State Government exercises litt le control over land in the state and is therefore not in a positi on to enforce a land use policy.
(d) Inadequate Extension Services: There is a dearth of extension services in the State especially at the grass root level. This makes it diffi cult to encourage horti culture and to provide the necessary consultati on support services required by the farmers.
(e) Poor transport infrastructure: The transport infrastructure in the State is inadequate, making it diffi cult to quickly transport horti culture produce from diff erent parts of the state to the markets within and outside the state.
(f) Cost of produce: Horti culture in the State has not yet achieved the level of intensifi cati on and opti mizati on achieved by some of the other states. This results in a higher cost of producti on of most crops. It is however hoped that as the horti culture intensifi es, the cost of producti on would gradually reduce and this constraint will cease.
9.10 Fisheries
Aquaculture and fi sheries are emerging as the fastest growing sectors in global food producti on. It is esti mated that fi sheries provide nearly 16% of the worlds total protein requirements on an average. According to a report by the Food and Agriculture Organizati on, “fi sheries and aquaculture remain very important as a source of food, employment and revenue in many countries and communiti es”. The report ranks India as the second largest producer of inland fi sheries with 650,000 tonnes of producti on or nearly 8.1% of the total inland fi sh producti on in the world6. The areas under various sources indicate that there is vast scope for fi sh producti on in the region. Fishery resources in Northeastern Region can be seen from the table 9.3.
The producti on of fi sh in NER accounts 3.92 percent to the total volume that is produced at all India level. The share compared for three years i.e. 2002-03 to 2004-05 shows that there is marginal rise in the contributi on of NER to the producti on at all India level. Despite there is a great potenti al in the NER in the fi shery sector, due to various reasons currently there is low fi sh producti on in the NER. At present the NER imports around 90,000 tonnes of fi sh from outside the region. The available records show that fi sh seed producti on in NER stands at 5349.83 million fry during 2004-05 (table 9.4). Nearly half of the total, fi sh seed is produced in Assam. Producti on in Tripura and Manipur accounts for 402 and 118 million fry.
6 Source: The State of World Fisheries and Aquaculture – 2000 (FAO)
258

MEGHALAYA STATE DEVELOPMENT REPORTMEGHALAYA STATE DEVELOPMENT REPORT
Table 9.3: Fishery resources in Northeastern Region
State Rivers/ streams
(km)
Beels/ lakes(ha)
Tanks/ ponds(ha)
Paddy/fi elds(ha)
Other suitable
water (ha)1 2 3 4 5 6
Arunachal Pradesh
20002500+110
[Cold water]1000 2800 700
Assam 4820 100000 20000 20000 1517Manipur 2000 40000 5000 40000 10000Meghalaya 5600 394 1944 5000 3000Mizoram 1748 32 1800 1560 -Nagaland 1600 215 2000 10000 -Sikkim 900 - - - -Tripura 1200 240 11038 - -NER 19868 143381+110 42782 79360 15217
[Source: NEC –Ten Year Perspecti ve Plan]
9.4. Fish seed producti on (million fry)
Year A.Pradesh
Assam Manipur Meghalaya
Mizoram
Nagaland
Sikkim Tripura NETotal
2003-04 25 2228.41 117 0.96 13.2 40 2.5 272.26 4698.332004-05 26.1 2741.47 118 0.9 16 44 2.5 401.86 5349.83
Source: Ministry of Agriculture, DAHD
9.10.1 Background of fi sheries in the state
History of fi sheries in the state - Fishery has been practi ced in the state for a long ti me largely through the traditi onal methods. People have been using bamboo traps to catch fi sh from rivers and streams. They have even been using poisons of plant origin in shallow rivers to catch fi sh. However the concept of modern, scienti fi c fi sheries has only become popular in the last two decades. Originally, fi shery did not have a Department of its own and was a part of the Agriculture Department.
People’s preference for fi sh vis-à-vis other food items - While the people in the state are primarily meat eaters with pork and beef being the preferred food, there is an increasing demand for fi sh. This can be att ributed to the lower cost of fi sh compared to pork and other meat. While port sells at around Rupees 100 per kilogram, fi sh sells for around 50-60 per kilogram. Moreover, fi sh is considered to be more nutriti ous and easier on digesti on.
259

MEGHALAYA STATE DEVELOPMENT REPORTMEGHALAYA STATE DEVELOPMENT REPORT
9.10.2 Potenti al for growth of fi sheries in the state
Factors favouring development of fi sheries The State has a huge potenti al for growth of fi sheries. There is very large demand for fi sh, which is growing by the day. The State is however yet to att ain self-suffi ciency in fi sh producti on and it has to depend on imports from other states viz., West Bengal, Assam, Maharashtra and Andhra Pradesh for meeti ng its demand for fi sh for human consumpti on as well as for use in animal feed. The conditi ons in the state are highly suited for producti on of fi sh on account of abundant water resources and a moderate climate, which is most suited for producti on of many types of fi sh.
(a) Inland water resources
The State is endowed with abundant water resources including rivers, streams, lakes and reservoirs. However, most of these water resources are under the control of the District Councils and other local authoriti es. The state has 3,734 hectare as Ponds and tanks, 3,300km length of Rivers, 8,400 ha of Reservoirs and 390 ha of Swamps.
(b) Esti mated Maximum Producti on at full exploitati on
Despite the vast potenti al of inland fi sh producti on in the State, the fi sh producti on in the last few years has stagnated. Fish producti on in the last few years has hovered around 5000 metric tonnes. This is largely due to the unscienti fi c fi sh farming methods in the state. Considering the massive potenti al of fi sheries, the state can easily gain self-suffi ciency in fi sh producti on. While, it is diffi cult to accurately esti mate the total potenti al at full exploitati on, it is esti mated that if all the water resources in the State, especially the rivers were to be judicially exploited, the producti on could increase by nearly 5 folds annually and reach nearly 25,000 metric tonnes. If that situati on is reached, the State will not only be self-suffi cient but would also have surplus producti on of fi sh for export to other states and for consumpti on of fi sh for other uses locally such as in animal feed for poultry and piggery.
9.10.3 Fish producti on and demand in the state
(a)Major types of fi sh produced in the stateThe state produces several types of fi sh. The major types of fi sh produced in the state include Catla, Rohu, Mrigal, Calbasu, Exoti c Carps, Major Carps, Common Carps and the Silver Carps. (b)Producti on for fi sh and demandThe state produced 5,147 metric tonnes of fi sh during the year 2003-2004, a bulk of which came from captured fi sh. It is esti mated that nearly 80% of the fi sh producti on during that year was
260

MEGHALAYA STATE DEVELOPMENT REPORTMEGHALAYA STATE DEVELOPMENT REPORT
from captured fi sheries and the remaining 20% from the cultured fi sheries. The current esti mated demand for fi sh in the state is more than 11,000 metric tonnes and the state imported 5952 metric tonnes of fi sh from other states, accounti ng for more than half of the total consumpti on of fi sh in the state. There is also demand for consumpti on of fi sh for fi sh feed as well as for use in other sectors like animal husbandry and poultry, which is also met by importi ng dried fi sh from other states.
9.10.4 Demand and supply for fi sh seed in the state
The state has 14 fi sh seed farms producing and distributi ng nearly 1 million fi sh seed. The demand for fi sh seed in the state, however, is nearly 2.5 million thereby resulti ng into a shortf all of 1.5 million fi sh seed, which has to be imported from other states. The fi sheries department has not assigned any priority to att aining self-suffi ciency in the area of fi sh seed producti on so far. However, the Department had setup two Chinese hatcheries – one each at the regional fi sh seed farm, Jamge and Digrichiring fi sh farm at Tura with the objecti ve of increasing local fi sh seed producti on. However, both the hatcheries are currently non-operati onal for want of requisite know-how and thus have not served their purpose.
Currently, the diff erence in the cost of fi sh seed produced locally and the fi sh seed imported from other states is not very signifi cant having regard to the current demand for fi sh seed. However, if the department were to initi ate steps to increase the producti on of fi sh in the state, it may be desirable to att ain self-suffi ciency in the area of fi sh seed producti on, both for achieving economic viability as well as strengthening the supply chain for fi sh seed. The Department has esti mated that in order to become self suffi cient in fi sh seed producti on, there is a need to setup one more carp hatchery at Ri-Bhoi district with a producti on capacity of 4 million annually.
9.10.5 Infrastructure for Storage, Distributi on and Marketi ng of fi sh in the state
Currently the state has no faciliti es for the storage and transport of fi sh. This is currently not an issue as there is a huge gap between the producti on and demand for fi sh in the state and all fi sh produced locally is immediately consumed. However, the need for a robust storage and transport infrastructure may arise as the fi sh producti on in the state grows and as the state emerges as a major producer and exporter of fi sh in the North Eastern region.
9.10.6 Progress of programs and schemes
(a)Development of Freshwater Aquaculture (Fish Farmers’ Development Agencies) The scheme was implemented during 1994-95 in order to bring all the fallow culturable fi shery resources under fi sh producti on to train and popularise new method of fi sh culture and strengthening the rural economy. But the scheme could not be implemented from 1999-2000 due
261

MEGHALAYA STATE DEVELOPMENT REPORTMEGHALAYA STATE DEVELOPMENT REPORT
to the non-release of central share from the Government of India, as the scheme is a centrally sponsored scheme.
(b)Centrally Sponsored Scheme on Fisheries Training & Extension
This centrally sponsored scheme was implemented since 1994-95 in order to educate the private fi sh farmers on the modern fi sh culture methods and also to impart training to the interested fi sh farmers by providing fi eld training within and outside the state. Till date around 2000 trainees have imparted the training.
(c) Integrated fi sh farming
In order to enhance the producti on of fi sh in the state and to generate employment among the rural poor, the fi shery department has implemented an Integrated Fish Farming Scheme, which has proved very successful. The scheme envisages combining piggery or poultry with fi sh farming wherein the night soil generated by the pig farm or the poultry farm becomes the fi shes’ food and this is proving to be a profi table venture as the fi sh producti on comes to the farmers at minimal cost. It is esti mated that those farmers who have implemented the scheme earn and average revenue of Rupees 70,000 to Rupees 1,00,000 per annum from a medium sized pond of 0.25 hectares.
(d)“The 147 Ponds scheme”
This scheme that originally envisaged the creati on of 1000 ponds was subsequently revised and currently envisages the creati on of 147 ponds of one acre each in the seven districts of Meghalaya within the period of two years. The scheme also envisages a subsidy component of 75% the remaining 25% to be contributed by the farmers.
It is esti mated that if all 147 ponds become operati onal, then with the esti mated average fi sh producti on of 800 kilos per acre, the combined fi sh producti on from the scheme would be approximately 117.6 MT per annum.
The total projected outlay of the scheme is Rupees 21.168 million. This is based on the model scheme of a one-hectare water area approved by NABARD.
During the Eleventh Plan, it is proposed to cover 70.00 hectare water areas with an anti cipated fi sh producti on of 140 MT (approximately). Awareness programme is also proposed to organize to check and combat unwanted destructi on of fi shes in collaborati on with the NGO’s/Village Headmen/Sardars etc. to declare fi sh sanctuary in some selected rivers/ streams.
9.10.7 Constraints in fi shery development
(a)The land ownership patt ern in the state
The land tenure system in the state has been stated as the major hurdle in the growth of fi sheries. The inland water resources especially the rivers have a great potenti al. The Umiam Lake as an example has vast potenti al for organized fi shing.
262

MEGHALAYA STATE DEVELOPMENT REPORTMEGHALAYA STATE DEVELOPMENT REPORT
The Umiam Reservoir (Bara Pani) in the Ri-Bhoi district is at an elevati on of 1,020 meters and measures 500 hectares in total water spread area. Although it is considered as a cool water area, because of the depth there is a balancing aff ect and fi sh thriving in warmer waters can be cultured here. The reservoir is currently under the Meghalaya State Electricity Board (MeSEB) and the Khasi Hills Autonomous District Council has exclusive fi shing rights over the lake. The Department is of the opinion that the reservoir is not being opti mally uti lized and the producti on of fi sh in the reservoir is very low in comparison to the all India level. Accordingly, the Fisheries Department had earlier sought an arrangement with the KHADC for a joint fi shery project with 60-40 profi t sharing arrangement. The agreement however could not be worked out. The State’s Fisheries Department is of the view that coming into aff ect of such an arrangement, would have given rise to certain restricti ons over fi shing which may not have been welcome by the local community. Incidentally, there are three categories of people dependent on the fi sh producti on in Umiam. These are: the local fi shermen who primarily catch the fi sh; the local transporters who transport the fi sh into the nearby markets followed by the local fi sh sellers who fi nally dispose the fi sh. However, in the year 1999-2000, the Department introduced 1,50,000 fi ngerlings of a high yielding variety in the reservoir. It was observed that aft er a period of 1 year of stocking, the fi sh producti on increased drasti cally. Moreover, the average weight of the fi sh harvested was nearly 1.5 kilos, which was much larger than the nati ve fi sh. It could therefore be very benefi cial if some type of arrangement could be worked out between the Fisheries Department and the ADCs, with due regard to the local communiti es, to carry out fi shing in an organized manner. This acti vity could well be carried out on a completely self-sustainable basis. It may however be menti oned that the Umiam Lake is only one small example. The state has much more unexploited potenti al in the form of rivers and streams, especially on the areas bordering Bangladesh.
(b) Economic Conditi ons of farmers
The second most important reason for poor growth of fi sheries in the state is the economic conditi on of the people. Most farmers in the state live in abject poverty. While a subsidy of 25% is available for setti ng up the fi sh farm, it is diffi cult for the farmers to gather the remaining 75%. The esti mated cost of setti ng up a one-hectare fi shpond is around Rupees 3,00,000. The annual recurring cost of labour and inputs is about Rupees 60,000. The payback period is esti mated to be between two to three years.
(c) Availability of fi nances
The availability of fi nance is another major problem in the development of fi sheries. The banks are reluctant to advance loans for fi sheries, as they have earlier suff ered losses on account of failed fi sh farms. The banks claim that their recovery rate for loans advanced for fi sheries is low. The Department is however of the view that the major reason for failure of fi shery enterprises is the lack of training. Fish culture is a complex discipline requiring adequate training and careful management. The department is of the opinion that in case of fi sh farmers trained and supported by the Directorate, the success rate is much higher and is esti mated to be nearly 80%.
263

MEGHALAYA STATE DEVELOPMENT REPORTMEGHALAYA STATE DEVELOPMENT REPORT
(d) Vagaries of weather
The weather conditi ons also pose a big impediment to the success of fi sheries in the state. The state experiences heavy rains during the monsoons, which cause fl ash fl oods in several areas. Oft en the fi shponds are fl ooded with runaway rainwater and fi sh seed is washed away. This causes huge losses to the fi sh farmers and as a result the fi sh farmers are disillusioned from fi sh farming.
(e) Lack of adequate training
Many fi sh farmers in the state take up fi sh farming without adequate training. This leads to too many novice farmers burning their hands in the process. There are no training insti tutes in the state for imparti ng training in the area of fi sheries. It may be menti oned that owing to the complexiti es involved in fi sheries, taking up fi sh farming without adequate training can only increase the chances of failure.
(f) Availability of fi sh feed
Availability of fi sh feed is another problem and the cost of nearly Rupees 10 per kilo of fi sh feed is beyond the reach of most farmers. There is a local manufacturer, which manufactures fi sh feed only on order. Most ingredients required for fi sh feed producti on e.g. Soyabeans, rice bran, oil cake, maize, grams, fi shmeal, vitamins and minerals are not readily available in the state.
(g) Lack of research faciliti es
The Department does not currently have a fully equipped research laboratory. This hampers research and development acti viti es in the area of fi sheries in the state.
(h) Lack of requisite infrastructure for storage, distributi on and marketi ng
The state lacks a robust infrastructure for storage and distributi on of fi sh. It also does not have any organized markets for fi sh. These may not be of much concern at this stage. The current demand for fi sh far exceeds the producti on and the need to store the fi sh for future consumpti on therefore, does not arise. However, as the State progresses to become a major producer of fi sh in the region, the storage, distributi on and marketi ng infrastructure may become necessary.
9.11 Animal Husbandry and Dairy Development
Majority of people in the State of Meghalaya are non-vegetarian and there are hardly any taboos associated with the producti on and consumpti on of meat. The State however, has not made much progress in animal husbandry sector as huge gaps currently exist in the demand and supply. The extent of piggery, poultry or dairy as a large-scale commercial acti vity is currently limited and the State currently runs a shortf all in most food items of animal origin. There is a tremendous scope for generati on of stable employment within the animal husbandry sector. The development of animal husbandry, therefore, can have a great bearing on the economy of the State and can also go a long way in enhancing the food security for the people in the State.
The Department of Animal Husbandry Meghalaya has to devote on development of infrastructure and create conditi on to increase producti on of animal origin foods like milk, meat and eggs as well as to generate self employment to the people. As per Stati sti cal data (2007-08),
264

MEGHALAYA STATE DEVELOPMENT REPORTMEGHALAYA STATE DEVELOPMENT REPORT
the per capita availability/head/day of Milk in the State is 76gms against the per capita requirement esti mated at 100gms (All India requirement 220gms/head/day). The per capita availability of meat is 26.56gms during 2007-08 against the requirement esti mated at 37.08gms/head/day. The per capita availability of egg is 36 nos./head/day against the requirement of 49 nos./head/day during 2007-08. This indicates that the State is yet to att ain self-suffi ciency which, therefore, begs for more investment including the Private Sectors investment in the fi eld of Livestock and Poultry Producti on.
The approach to the 11th Plan for achieving the objecti ves and targets is indicated below:-
1. Enhancing and sustaining producti vity of Livestock and Poultry.
2. Upgrading and improving local livestock and poultry and to make available improved variety of livestock and poultry to the farmers.
3. Providing protecti on to the livestock and poultry populati on against contagious and non-contagious diseases through treatment and preventi ve measures.
4. Building up adequate technical and training faciliti es.
5. To generate additi onal employment opportuniti es to the Educated Un-employed Youth and farmers to increase producti on.
6. Focusing on cluster approach and involvement of SHGs and cooperati ves or federati ons.
The stock domesti cated in NER include catt le, goat, pig, buff alo, sheep, horses / ponies, yak and poultry / birds accounti ng 11488, 4366, 3816, 840, 227, 28 and 16 thousand respecti vely in the year 2002-03 as per table below:
Table 9.6 Livestock and poultry 2002 & 2003 (In 000)
Sl.No.
Parti culars
Aru
nach
alPr
ades
h
Ass
am
Man
ipur
Meg
hala
ya
Miz
oram
Nag
alan
d
Sikk
im
Trip
ura
NE
Tota
l
All
Indi
a
1 Buff alo 11 678 77 18 6 34 2 14 840 97922
2 Catt le 458 8440 418 767 36 451 159 759 11488 185181
3 Pig 330 1543 415 419 218 644 38 209 3816 13519
4 Goat 231 2987 33 327 17 175 124 472 4366 124358
5 Sheep 19 170 6 18 1 4 6 3 227 61469
6 Horses &ponies
7 12 2 2 2 1 2 NA 28 751
7 Yaks 9 0 0 0 0 0 7 0 16 65
Total poultry 1743 21664 2941 2821 1125 2789 332 3057 36472 489012
Source: Basic Stati sti cs of NER, 2006
265
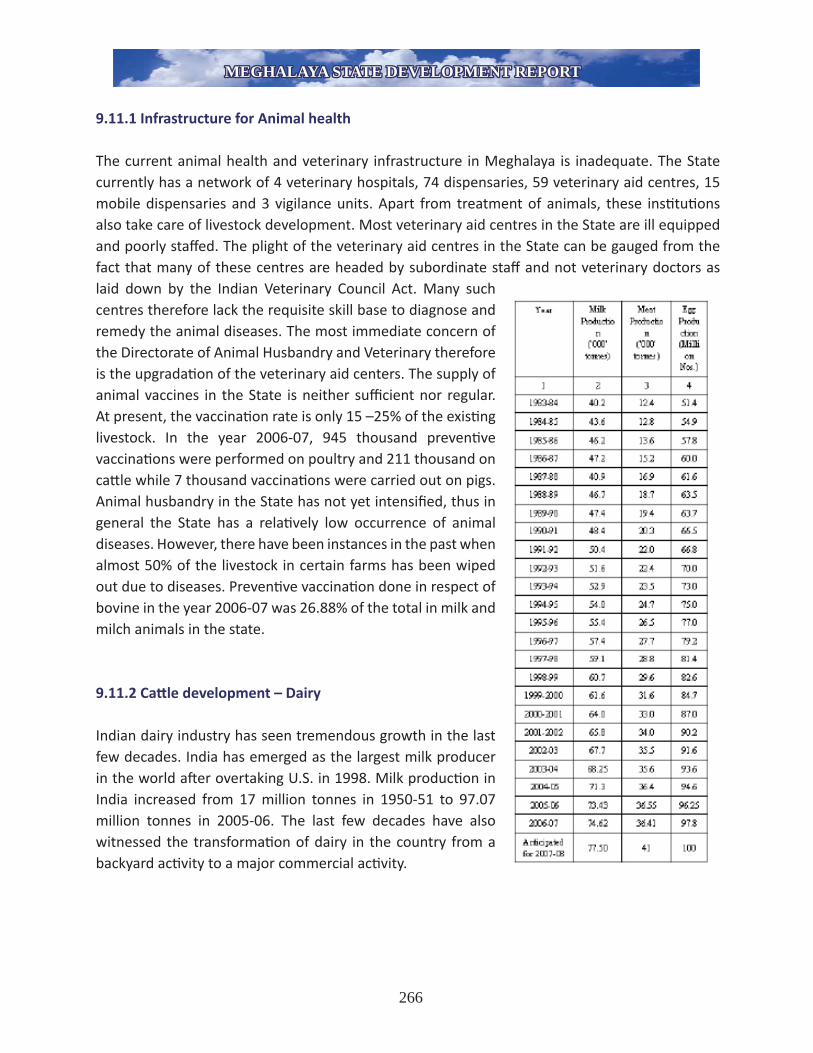
MEGHALAYA STATE DEVELOPMENT REPORTMEGHALAYA STATE DEVELOPMENT REPORT
9.11.1 Infrastructure for Animal health
The current animal health and veterinary infrastructure in Meghalaya is inadequate. The State currently has a network of 4 veterinary hospitals, 74 dispensaries, 59 veterinary aid centres, 15 mobile dispensaries and 3 vigilance units. Apart from treatment of animals, these insti tuti ons also take care of livestock development. Most veterinary aid centres in the State are ill equipped and poorly staff ed. The plight of the veterinary aid centres in the State can be gauged from the fact that many of these centres are headed by subordinate staff and not veterinary doctors as laid down by the Indian Veterinary Council Act. Many such centres therefore lack the requisite skill base to diagnose and remedy the animal diseases. The most immediate concern of the Directorate of Animal Husbandry and Veterinary therefore is the upgradati on of the veterinary aid centers. The supply of animal vaccines in the State is neither suffi cient nor regular. At present, the vaccinati on rate is only 15 –25% of the existi ng livestock. In the year 2006-07, 945 thousand preventi ve vaccinati ons were performed on poultry and 211 thousand on catt le while 7 thousand vaccinati ons were carried out on pigs. Animal husbandry in the State has not yet intensifi ed, thus in general the State has a relati vely low occurrence of animal diseases. However, there have been instances in the past when almost 50% of the livestock in certain farms has been wiped out due to diseases. Preventi ve vaccinati on done in respect of bovine in the year 2006-07 was 26.88% of the total in milk and milch animals in the state.
9.11.2 Catt le development – Dairy Indian dairy industry has seen tremendous growth in the last few decades. India has emerged as the largest milk producer in the world aft er overtaking U.S. in 1998. Milk producti on in India increased from 17 million tonnes in 1950-51 to 97.07 million tonnes in 2005-06. The last few decades have also witnessed the transformati on of dairy in the country from a backyard acti vity to a major commercial acti vity.
266

MEGHALAYA STATE DEVELOPMENT REPORTMEGHALAYA STATE DEVELOPMENT REPORT
Catt le Development: Meghalaya on the other hand has been largely unaff ected by the dairy revoluti on in other parts of the country. The State conti nues to be among the lowest producers of milk in the country. The per capita milk availability in the state is about 76 grams as per 2006-2007 esti mates. If this is compared to some of the States with the best per capita availability of milk, substanti al gaps are evident. Punjab and Haryana for example, had an esti mated per capital milk availability of 926 grams and 666 grams respecti vely in the same year. Clearly, there is a signifi cant potenti al for improvement in the dairy sector in the State 7.
9.11.3 Catt le Livestock
The esti mated number of in-milk and milch animals in the State has increased by 23% from 298,900 in 1990-91 to 368,100 in 2006-07. The preference for crossbred catt le in the State is gradually increasing. The rati o of crossbred catt le to total catt le in the State had increased from 5.8% in 1990-91 to 8.4% in 2006-07. However, the percentage of crossbred catt le is sti ll relati vely low. There is a substanti al gap in the average milk yield per animal of crossbred variety in comparison with indigenous milch cows. The crossbred breeds in the state yield an average of 7.30 Kilograms of milk per animal per day. In contrast the indigenous breed yields merely 0.33 Kilograms of milk per animal per day in the State in 2006-07.The crossbred cows are mainly concentrated in East Khasi Hills and Ri Bhoi districts. As a result, these two districts alone account for more than half of the total milk producti on in the State. Around 85% of the total bovine in the state are grazed fed and only 2-5% are stall-fed. The crossbred cows are fed 3-4 kilograms of concentrate feed per day.
Improvement of non-descript indigenous Catt le by Cross Breeding Programme with exoti c breed by means of arti fi cial inseminati on using frozen semen technology will conti nue. The numbers of Cross Bred Catt le populati on of the state consti tute only 3.00% of the total Catt le populati on. It is proposed to increase the number of cross bred populati on to be achieved by increasing the coverage of Arti fi cial Inseminati on by 20% per year.
The Existi ng Catt le Farms in the State will be strengthened to be able to supply good quality inputs (breeding animal of high quality) to the farmers & to contribute enhancement of milk producti on in the State.
Further, with the objecti ve to att ain self suffi ciency in meat, milk & eggs a new policy to invite Private Sectors investment in the fi elds of Livestock & Poultry is proposed to be adopted by setti ng up of Livestock Development Board in the State. To ensure supply of good quality breeding
7 Source: Website of the Ministry of Agriculture – Department of Animal Husbandry and Dairying
267

MEGHALAYA STATE DEVELOPMENT REPORTMEGHALAYA STATE DEVELOPMENT REPORT
stock of high quality in East Garo Hills, it is proposed to set up a new catt le farm at Samgong in East Garo Hills during 2009 - 2010. An amount of Rs. 90.00 lakhs is proposed for 2009 – 2010.
9.11.4 Milk producti on and trends in growth
The producti on of milk in Meghalaya is among the lowest in the country. Moreover, no signifi cant increase has been seen in milk producti on in the last two decades. The producti on of milk increased marginally from 67.7 thousand tonnes in the year 2002-03 to 74.62 thousand tonnes in 2006-07. On the other hand, milk producti on in Punjab for the same period has increased by more than 60%. As per Sample Survey for esti mati on conducted in 2006-07, 94.17% of the total milk is sold as fl uid milk, 2.46% is converted into milk products and 3.37% is consumed as fl uid milk in households.
9.11.5 Dairy Development Programs in the State and their progress
The Department of Animal Husbandry and Veterinary has initi ated several programs in the past for catt le development to increase the producti on of milk in the State by adopti ng improved breeding practi ces. Four catt le breeding farms have been established in the State under this initi ati ve with exoti c breeds like Jersey and Holstein-Friesian. During 2006-2007, the total plan allocati on for the catt le development programmes was 67.03 lakhs as per the Revised Outlay. The programs are discussed briefl y hereunder:
(a)Intensive Catt le Development Project
Under the Intensive Catt le Development Project (ICDP) at Shillong and Tura, the Department carried out 21,760 arti fi cial inseminati ons and produced 17,310 calves of improved varieti es during the year 2006-07.
(b)Distributi on of Bull/Calves/Cows Grant-in-Aid
The objecti ve of this scheme is to encourage farmers to take up dairy farming to generate self-employment and increase the producti on of milk in the State. During 2006-2007, 54 units with 4 crossbred cows per unit were distributed to the benefi ciaries at 50% subsidy.Dairy farming subsidy schemes are also being provided for enhancement of milk producti on. At the end of year 2007 the department was operati ng three dairy plants in the State; one each in the districts of East Khasi Hills, Jainti a Hills and West Garo Hills. The dairy plant in East Khasi Hills had a processing capacity of 10,000 litres while the other two have a capacity of 8,000 litres each. The department is also operati ng three milk chilling centres in the State; one each in West Khasi Hills, Jainti a Hills and the East Garo Hills. These centres have a chilling capacity of 2,000 litres each.
9.12 Problems in the Dairy Development Sector
As menti oned earlier, there is very litt le preference for milk in the State; so much so that even the tea that people consume locally is generally without milk. This is in stark contrast with some other
268

MEGHALAYA STATE DEVELOPMENT REPORTMEGHALAYA STATE DEVELOPMENT REPORT
States especially Punjab and Haryana where milk forms an indispensable component of the daily diets of people. This affi nity for milk in these States has made milk a highly valued commodity, which in turn has powered the growth of the dairy sector in these States. Besides the preference issue, the following reasons inter alia, may be att ributed to the poor growth of dairy in the State:
a) Poor animal health infrastructure: As stated earlier, the State has a poor animal health and veterinary infrastructure. The supply of vaccines is also very poor and inconsistent; therefore the State has a low vaccinati on rate.
b) Old Livestock: The parent stock acquired by the department for multi plicati on of high quality breeds in the State has not been replaced since 1992. As a result the quality of breed is gradually diminishing.
c) Inadequate availability of Feed: Availability of feed is another problem in the State. The feed available is also not of good quality and is relati vely very expensive. Most of the ingredients of feed are exported from other parts of country that raises the cost of feed. The principal ingredient in animal feed is maize, which accounts for a major part of the cost of the feed.
9.13 Catt le development for meat
Beef, besides pork is savoured with great delight by a large percentage of people in the State. As per Sample Survey for esti mati on about 236,000 catt le were slaughtered in 2006-07 for meat producti on. There is a very high demand for beef in the State. The per capita availability of beef is 21.80 grams per day, which is much lower than the per-capital availability of pork. However, producti on of beef within the State has declined marginally from 12,855 tonnes in 2005-06 to 11,730 tonnes in 2006-07, while at the same ti me the consumpti on of beef has increased by nearly 4%. In order to make good the shortf all, the State imported 9,670 thousand tonnes of beef in 2006-07 making about 6% increase in beef imports from the 2005-06 level of 8,570 tonnes.
It may be menti oned here that unlike most other parts of the country, the nati ve populati on in Meghalaya does not att ach any taboo to the consumpti on of beef. However, at the same ti me, the nati ve populati on has not had much traditi on of raising catt le for milk or for meat. Majority of cows in the State are raised by communiti es who have migrated into the State from neighbouring States as well as from Nepal. These communiti es raise cows mainly for milk and are generally averse to producti on or consumpti on of beef. Interesti ngly however, considering the high costs of feed, it is economically unproducti ve to rear the male calves, except a small percentage for farm work and multi plicati on of stock. Most male calves are therefore completely ignored and wasted off by allowing them to starve. Considering the huge demand for beef in the State and the volume of imports, the Department of Animal Husbandry is keen to start beef farm to increase the producti on of beef in the State. The Department envisages that the stock for these farms would be acquired from catt le farmer and would be raised for beef purpose.
269

MEGHALAYA STATE DEVELOPMENT REPORTMEGHALAYA STATE DEVELOPMENT REPORT
9.14 Piggery Pork is very popular in the State and enjoys more or less the status of staple food alongside rice. Pigs are highly prolifi c and very effi cient biological feed converters. Their meat is also generally considered healthier than red meat. Rearing pigs can therefore be a highly lucrati ve acti vity. In order to be fi t for human consumpti on, pigs must be given proper hygienic food and due medical att enti on to prevent any diseases.
Pig rearing is common in the plain areas of Garo Hills and in the Hills of Khasi and Jainti a Hills. It is esti mated that nearly 60% of the households in the State rear pigs. However, these are generally kept in small bamboo enclosures in unhygienic conditi ons. These animals are fed mostly household waste. Their meat is therefore oft en unsafe for human consumpti on. Moreover, the species of livestock are inferior, non-descript local breeds. Piggery in the State however, has to come a long way from its current status as a backyard acti vity to a major commercial acti vity.
9.15 Livestock and meat producti on
The populati on of pigs was recorded at 418,980 in 2003. Out of these 390,689 were indigenous and 28,291 were crossbred pigs. Thus, 93.25% of the total pigs reared are of local breeds and 6.75% are crossbred pig. As per the Integrated Sample Survey report for the year 2006-07, an esti mated 238.35 thousand pigs were slaughtered. The total pork producti on during 2006-07 was 9,996 tonnes of which 8,543 tonnes was produced within the State. Thus 85.46% of the demand for pork was met by producti on within the State.
9.16 Infrastructure for piggery development
Under the piggery development, there are 10 (ten) District pig farms and 1(one) Regional Pig Breeding Farm established in the State. These farms maintained exoti c breeds of pig, namely, Hampshire and Saddle-back breeds having superior germ-plasm for breeding purpose and to produce bett er piglets for supply to the farmers. At the end of year 2007 the total number of stock raised in these farms was 912. Number of piglets produced was 2433, where the total pigs sold during the year was 2440 Nos. The pigs produced by these farms are in great demand within Meghalaya as well as in the neighbouring States. The Directorate however is unable to fulfi ll the total demand for piglets through these farms as the demand far exceeds the supply.
9.16.1 Research and development eff orts
The Department of animal husbandry and veterinary has taken up schemes to introduce improved breeds of pigs. Regional Pig Breeding Farm is operati ng at Kyrdemkulai. This farm is one of the best pig farms maintained by the Directorate of Animal Husbandry. The farm is maintaining Hampshire
270
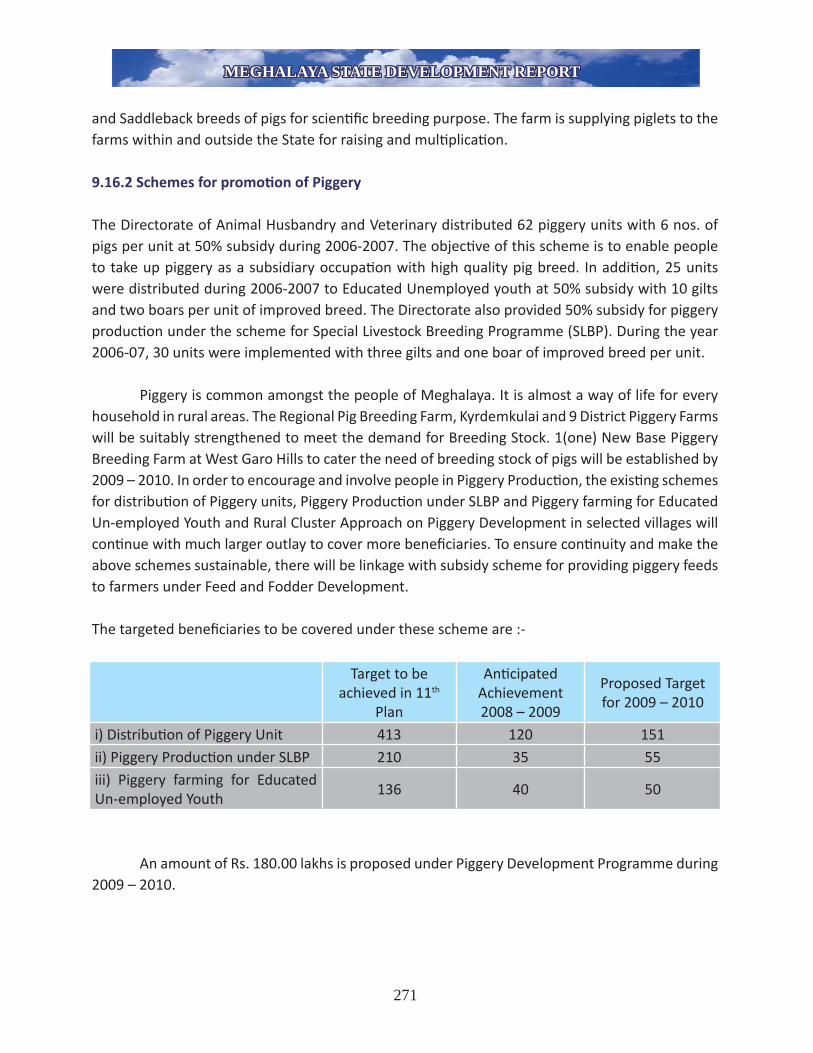
MEGHALAYA STATE DEVELOPMENT REPORTMEGHALAYA STATE DEVELOPMENT REPORT
and Saddleback breeds of pigs for scienti fi c breeding purpose. The farm is supplying piglets to the farms within and outside the State for raising and multi plicati on.
9.16.2 Schemes for promoti on of Piggery
The Directorate of Animal Husbandry and Veterinary distributed 62 piggery units with 6 nos. of pigs per unit at 50% subsidy during 2006-2007. The objecti ve of this scheme is to enable people to take up piggery as a subsidiary occupati on with high quality pig breed. In additi on, 25 units were distributed during 2006-2007 to Educated Unemployed youth at 50% subsidy with 10 gilts and two boars per unit of improved breed. The Directorate also provided 50% subsidy for piggery producti on under the scheme for Special Livestock Breeding Programme (SLBP). During the year 2006-07, 30 units were implemented with three gilts and one boar of improved breed per unit.
Piggery is common amongst the people of Meghalaya. It is almost a way of life for every household in rural areas. The Regional Pig Breeding Farm, Kyrdemkulai and 9 District Piggery Farms will be suitably strengthened to meet the demand for Breeding Stock. 1(one) New Base Piggery Breeding Farm at West Garo Hills to cater the need of breeding stock of pigs will be established by 2009 – 2010. In order to encourage and involve people in Piggery Producti on, the existi ng schemes for distributi on of Piggery units, Piggery Producti on under SLBP and Piggery farming for Educated Un-employed Youth and Rural Cluster Approach on Piggery Development in selected villages will conti nue with much larger outlay to cover more benefi ciaries. To ensure conti nuity and make the above schemes sustainable, there will be linkage with subsidy scheme for providing piggery feeds to farmers under Feed and Fodder Development.
The targeted benefi ciaries to be covered under these scheme are :-
Target to be achieved in 11th
Plan
Anti cipated Achievement 2008 – 2009
Proposed Target for 2009 – 2010
i) Distributi on of Piggery Unit 413 120 151ii) Piggery Producti on under SLBP 210 35 55iii) Piggery farming for Educated Un-employed Youth
136 40 50
An amount of Rs. 180.00 lakhs is proposed under Piggery Development Programme during 2009 – 2010.
271

MEGHALAYA STATE DEVELOPMENT REPORTMEGHALAYA STATE DEVELOPMENT REPORT
9.17 Goat and Sheep rearing
As per the 2002 census the total number of goats in the State was reported at 327,232. About 25% of the total households are rearing goats for milk and meat purposes. The populati on of sheep was reported at 18,203 out of which 631 were crossbred and 17,572 were indigenous sheep.
In the year 2006-07, 1030 tonnes of goat and sheep meat was consumed in the State out of which, 1001 tonnes was produced within the State. The consumpti on of mutt on has increased by nearly 0.78% from 1022 tonnes in 2005-06 to 1030 tonnes in 2006-07. As per Sample Survey for esti mati on 2006-07 around 113,910 sheep and goat were slaughtered for meat producti on.
The Department has initi ated a scheme to improve the quality of the local goats by introducing superior germ plasm. The goat farm at Nongshillong reared 10 bucks and 55 does, with the producti on of 45 kids. The sheep and goat farm at Saitsama has 7 ram and 14 ewes with the producti on of 7 lambs. The Department also runs a scheme for the distributi on of Goatery Distributi on Unit for promoti ng producti on of improved bucks. During 2006-2007, 32 units were distributed to benefi ciaries at 50% subsidy.
9.18 Poultry
The total populati on of fowls in the State as per 2003 census is 27.62 lakhs out of which 26.25 lakhs were of a desi variety and 1.37 lakhs were of improved variety. The total populati on of ducks was reported at 0.59 lakhs, of which 0.56 lakhs were desi ducks and 0.03 lakhs were of improved varieti es. The populati on of fowls and ducks is concentrated in West Garo Hills, but the improved breed is more common in the East Khasi Hills and Ri Bhoi districts. It indicates that the reach of the government poultry farms is limited and needs to expand so that the improved breeds are available in all districts of the State. The number of layers including fowls and ducks has increased by 48.78% from 5.72 lakhs in 1990-91 to 8.51 lakhs in 2006-07. The total egg producti on in the State has increased by 47% from 1990-91 to 2006-07. However the overall esti mated yield has remained in the range of 112 to 116 eggs per annum from 1990-91 to 2006-07. As per Sample Survey for esti mati on conducted in 2006-07, 52.24% of the total eggs produced are sold directly into the market and only 14.55% are set for hatching. This indicates immediate demand of the consumpti on for the eggs. The per capita availability of eggs is 36 per year. Almost 35% of the demand of egg is met by importi ng from other states of country.
The demand of chicken has remained at the same level in the last three years. The demand of eggs in the State is however very huge. As per Sample Survey for esti mati on 2006-07 around 36.78 lakhs poultry was slaughtered in the State for meat producti on and the per capita availability of chicken is 4.05 grams per day.
272

MEGHALAYA STATE DEVELOPMENT REPORTMEGHALAYA STATE DEVELOPMENT REPORT
9.18.1 Research and development eff orts in poultry
The Department of Animal Husbandry and Veterinary has introduced a low input breed bird known as the Kuroiler at the Central Hatchery-cum-Poultry Farm, Umsning. The Kuroiler is a low input and medium yielding bird that can be used for eggs as well as for meat. These birds can thrive on easily available food material including kitchen waste and left overs, vegetables and insects. These breeds are becoming very popular among local farmers since they do not require the high cost feed required by the other breeds. These birds can lay between 130-150 eggs per year while the high yielding varieti es can lay up to 180-200 eggs. However owing to the lower cost of inputs, the net returns from these birds are reasonably high. Moreover, these birds are much more resistant to common poultry diseases. Most farmers in the State are disillusioned from the high cost and irregular supply of poultry feed required for the other breeds of chickens. This initi ati ve is therefore a signifi cant one and can provide impetus to the development of poultry in the State. The department is also extending training faciliti es to the farmers for rearing these birds. Four districts of the State i.e. Ri-Bhoi, East Khasi Hills, West Khasi Hills and Jainti a Hills are being served through the Umsning Poultry Breeding Farm.
Eggs producti on in the State is far below its requirements. In order to ensure targeted producti on of eggs, att empts have been made by the Department to re-orient its Poultry Breeding Farms, Broiler Farms and Duck Farms to meet the demand for chicks, eggs and broiler meat. The proposed re-orientati on is focused on producti on of Layers Chicks, Broiler Chicks and Eggs producti on.
Further, in order to encourage and involve people in Poultry producti on, the existi ng schemes for distributi on of Poultry Unit, Piggery producti on under SLBP and Poultry/Broiler Producti on schemes for educated un-employed youth will conti nue with larger outlay to cover more benefi ciaries during 2008-09. The targeted benefi ciaries to be covered under this scheme are :-
Target to be achieved in 11th Plan
Anti cipated Achievement 2008 - 2009
Proposed Target for 2009 – 2010
i) Distributi on of Poultry Unit 833 250 366ii) Poultry Producti on under SLBP
200 38 58
iii) Poultry/Broiler Producti on of Educated Un-employed Youth
240 40 55
Past experienced shows that due to high cost of feed, many benefi ciaries were unable to conti nue the schemes without support from Government. To overcome this constraint and make
273

MEGHALAYA STATE DEVELOPMENT REPORTMEGHALAYA STATE DEVELOPMENT REPORT
it sustainable it is proposed to ensure linkage with the subsidy schemes for supply of Poultry feeds to farmers under Feed and Fodder Development.
Rural Cluster Approach on Poultry Development in selected villages to increase meat & eggs producti on is proposed to conti nue during 2008 - 2009. An amount of Rs. 197.00 lakhs is proposed for the year 2009-2010 under Poultry Development Programme.
9.19 Support infrastructure9.19.1 Faciliti es for provision of animal nutriti on
Four fodder demonstrati on farms including a seed producti on farm have been established in the State to meet the requirement of fodder and fodder seeds. These farms cover an area of 262.04 hectares for fodder and 28.68 hectares for seed producti on. During the year 2006-07, 12,182 tonnes of fodder was produced. The livestock and poultry feed are distributed to the farmers through registered livestock and poultry co-operati ve societi es.
9.19.2 Government farms and other Infrastructure
The Department is maintaining several farms and other veterinary dispensaries and aid centres, spread in all the seven districts of the State to promote and support animal husbandry. Four catt le breeding farms, one buff alo farm, ten poultry farms and ten piggery farms supply improved breeding stock to the people to take up livestock, poultry and piggery farming to augment their income and boost the producti on of milk, meat and eggs in the State.
9.19.3 Vocati onal training and other programs
Two vocati onal training centres have been established in the State; one at Kyrdemkulai, Ri-Bhoi district and the other at Tura in West Garo Hills. The objecti ve is to impart training to the farmers for proper management, feeding and health care of livestock and poultry. During the year 2006-07, 1321 farmers have undertaken training in piggery, poultry, dairy and goat rearing.
9.20 Strategy
In order to increase producti on, the existi ng livestock and poultry farms have to be strengthened and also to set up more number of farms in the districts and subdivisions. Besides, replacement of old stock with superior germplasm is necessary for improvement of geneti c make up and to supply quality inputs to the farmers.
Policy shift for encouraging more private investment or entrepreneurs to undertake breeding, producti on and establishment of base farms are required .
274
MEGHALAYA STATE DEVELOPMENT REPORTMEGHALAYA STATE DEVELOPMENT REPORT
To increase the number of veterinary dispensaries in rural areas for providing health service to
all livestock and poultry and for other extension works. Greater involvement of community and
grassroot organizati ons in management, health care and producti on system would be necessary
Community livestock and poultry farming should be encouraged for enhancement of producti on
of milk, meat and eggs. Shift ing approach of farming involving Self Help Group/Co-operati ve
Societi es/private entrepreneur including marketi ng of livestock products.
Training of educated unemployed youth as private veterinary workers on livestock management,
animal healthcare and extension work for collecti on of fi eld data on veterinary and animal
husbandry acti viti es.
Establishment of veterinary clinical laboratory in each district headquarter for immediate diagnosis
of diseases. To increase the coverage of vaccinati on of animal against bacterial and viral diseases.
9.21 Summary and Conclusions
The animal husbandry sector has a tremendous potenti al for growth in the State. Most food items of animal origin, e.g. eggs and meat are in great demand. The State imports substanti al quanti ti es of eggs and meat from other States to plug the shortf all. There is ample scope to expand the sector to meet the full demand from within the State. This can also be a great employment generator for the rural poor.
The Department has provided subsidies to farmers in the State to encourage them to take up occupati ons in animal husbandry. However, the rate of growth of animal husbandry in the State has not been encouraging. The State will therefore have to focus on extensive capacity building among the farmers so that they can make the best of these subsidies. A robust market infrastructure will also have to be created to ensure quick disposal of the produce at remunerati ve prices. It will also be desirable for the State to become self suffi cient in the producti on of animal feed. This will help in ensuring a smooth supply of animal feed to farmers. It may also help in reducing the cost of the animal feed, thereby making this sector commercially more viable.
The animal health infrastructure in the State is at present weak. As the animal husbandry sector grows, the State will require a well-oiled animal health infrastructure to support this growth and check any outbreaks of animal diseases. The State should also focus on setti ng up of modern slaughterhouses to ensure hygiene in meat producti on.
The State must also gradually shift the focus from subsidizing inputs to bett er management of
outputs. The State must endeavour to create propiti ous market conditi ons to make the sector
275

MEGHALAYA STATE DEVELOPMENT REPORTMEGHALAYA STATE DEVELOPMENT REPORT
highly lucrati ve. This will automati cally encourage farmers to take up animal husbandry. Even if
exports to other States are not considered initi ally, there is enough local demand to support a
large growth of animal husbandry in the State.
9.22. Co-operati ves in Meghalaya:
Cooperati ve Movement is a people’s Movement. Cooperati ve Organizati ons are democrati c, autonomous and voluntary organizati ons with principle of equity being paramount, where people join hands together for socio-economic growth and uplift ment by initi ati ng various economic acti viti es by honest means. The contributi on of Cooperati ve Sector in the economy of the country as well as in the State of Meghalaya though marginal is important from the perspecti ve of rural areas and the powerless. The role of Co-operati on Department in this respect is largely promoti onal, catalyti c and regulatory. Cooperati ve Societi es are required to be registered with the Registrar of Cooperati ve Societi es as per the Meghalaya Cooperati ve Societi es Acts & Rules 1950 in Meghalaya. Eff orts to transform diff erent types of Cooperati ve Societi es as an eff ecti ve instrument of growth centre as well as the nucleus of rural development and employment generati on has yielded some good results. So far, Rs. 3,47,749 as dividend has been paid to State Government by the profi t earning societi es which is likely to increase. The Co-operati on Department is providing fi nancial assistance in the shape of Share Capital Contributi on and Managerial Subsidy to the Cooperati ve Societi es to enable them to conti nue their economic acti viti es for income and employment generati on. Financial assistance under the Centrally Sponsored Schemes (Govt. of India) and Central Sector Schemes (NCDC) are being chanelized to the cooperati ves. Under Macro Management Schemes of Government of India a total amount of Rs. 30.00 lakhs was sancti oned only during 2002-2003 and 2003-2004 ti ll date. Under Minor Forest Produce Operati on Scheme of Government of India, a total amount of Rs. 289.00 lakhs was sancti oned to Meghalaya State Co-operati ve Marketi ng & Consumers’ Federati on Ltd. (MECOFED) under the scheme ti ll 2006-2007. Under the Central Sector Scheme (NCDC) 2 (two) types of fi nancial assistance was availed by the State Government i.e. (i) Normal Schemes and (ii) Integrated Cooperati ve Development Project (ICDP). Under the normal scheme a total amount of Rs. 109.028 lakhs was sancti oned to 21 (twenty one) numbers of benefi ciary cooperati ve societi es ti ll 2005-2006.
Under the NCDC (ICDP Scheme) a total amount of Rs. 1222.58 lakhs was sancti oned against 7 (seven) numbers of Integrated Cooperati ve Development Projects for 7 (seven) Districts for implementati on. Out of which 5 (fi ve) numbers of Integrated Cooperati ve Development Projects had already been implemented by Project Implementati on Agency (MCAB Ltd.) and the other 2 (two) are sti ll under implementati on by the Project Implementati on Agency. The Integrated Cooperati ve Development Projects are normally of 4 – 5 years durati on.
276

MEGHALAYA STATE DEVELOPMENT REPORTMEGHALAYA STATE DEVELOPMENT REPORT
277
The state has signed MOU with NABARD for the revitalizati on of Rural credit structure and reforms in the sector.
Table 9.8 Growth of cooperati ves in Meghalaya:
Year No. of Societi es
Membership in lakh
Share capital in lakh
Working capital in lakh
2003-04 1024 1.50 4610.30 49407.972004-05 1093 1.52 4954.82 5660.272005-06 1153 1.66 4943.93 5660.672006-07 1192 1.73 4947.83 56674.372007-08 1240 1.77 5063.15 59221.23
Some of the success Stories: Mendipathar MPCS; Upper new Nongstoin Tailoring, weaving and handloom Coop society;Women’s Group handicraft MPCS, Mookyndeng; SBI offi cer’s cooperati ve credit society; Shillong marketi ng cooperati ve society; Kasharipara SCS ltd., Transport cooperati ve society are some of the successful society in the state.
9.23. RASHTRIYA KRISHI VIKAS YOJANA (RKVY) :The objecti ves of RKVY are ;i) to incenti vize the States to increase their investment in Agriculture and allied sectors, ii) to provide fl exibility and autonomy to the States in planning and executi ng programmes for Agriculture, iii) to ensure the preparati on of Agriculture plans for the Districts and the States, iv) to achieve the goal of reducing the yield gaps in important crops, v) to maximize returns to the farmers, vi) to address the agriculture and allied sectors in an integrated manner.
The distributi on of funds under RKVY are in two streams viz stream 1 and stream 2. Under stream 1 at least 75% of the allocated amount will be distributed to the States and approved by the State Level Sancti oning Committ ee headed by the Chief secretary. Under stream 2, existi ng schemes that require strengthening can be covered under this stream for such schemes that have a resource gap. Not more than 25% allocated funds can be used for this stream and the sancti oned procedure will be as in the case of other plan schemes. The Meghalaya Small Farmers Agri Business Consorti um (SFAC) has been noti fi ed as the State Nodal Agency to release RKVY funds. The state is fi nalizing its district and state agricultural plan. During 2007-08 , Government of India released an amount of Rs 637.00 lakhs ACA i.e. Rs 567.00 lakhs under Stream I and Rs70.00 lakhs as one ti me grant for preparati on of DAPs for the 7 (seven ) Districts of the State @ Rs10.00 lakhs for each District. Out of this Rs 341.88 lakhs was uti lized for implementati on of projects under Stream I and Rs 56.00 lakhs for preparati on of DAPs.
In consistent with the recommendati ons of the Planning Commission , in this year the focus will substanti ally be on the Animal Husbandry &Veterinary and Fisheries Sectors. The SLSC in its meeti ng on 19th September 2008 approved the proposals from the concerned Departments

MEGHALAYA STATE DEVELOPMENT REPORTMEGHALAYA STATE DEVELOPMENT REPORT
278
under Stream I&II as: Animal Husbandry-Rs.10.53 crore; Fisheries-Rs. 2.50 crore; Capacity Building -Rs. 0.50 crore. During 2008-09 , Government of India have released an amount of Rs. 1.99 crores for projects under Stream I and Stream II.
9.24. Main suggesti ons on Agriculture and Allied Sectors in the sectoral summit of NEC has been:• Objecti ve is to make region marginally surplus in food producti on by introducing integrated modern agricultural methods and develop agriculture horizontally and verti cally.• Create effi cient service centers for farming.• Land reforms.• Promote horti culture on massive scale, increase area under horti culture.• Create effi cient market infrastructure through a regional master plan.• Use self-help groups as tools of change in the sector.• By 2020 the producti on of meat, milk and egg should be raised to 2.26 lakh MT, 2 MT and 3,500 million, respecti vely.• Fisheries1. Raise producti on of fi sh to 12.14 lakh MT to ensure a per capita availability of 21kg/person/year by 2020.2. Increase the area of water under fi sheries to 11.53 ha by 2020.3. Use the maximum area of reservoir and unregistered beels and swamps for fi sheries.4. Promote the culture of mahseer for in situ conservati on and increased producti on.5. Exploit the riverine stretch (of about 2,000 km) for fi sheries.6. Establish eco-hatcheries at district level.7. Establish fi sh producers’ co-operati ve societi es and farmers’ clubs to increase producti on and expand marketi ng.8. Double the area under forest fi shery by 2020.• Sericulture1. Bring 2.35 lakh hectares of wasteland suitable for sericulture under it.2. Set up clusters of 200 ha. with 300 m farmers in each district by 2020.3. Establish a sericulture development mission with special central grant.4. Raise producti on level of sericulture to 5,063 MT.5. Increase the generati on of family income to Rs. 580 crore per annum under Eri and about Rs.1,100 crore under Muga by 2020.
• Mission Mode1. Immediately launch the Northeastern Regional Bamboo Mission and Northeastern Regional Internati onal Trade Mission. The Bamboo Mission will create one lakh jobs, lead to double digit rise in economic growth and enhance community and family income.2. Expand the global export network for bamboo products especially to South East Asian markets.

MEGHALAYA STATE DEVELOPMENT REPORTMEGHALAYA STATE DEVELOPMENT REPORT
279
3. Develop border trade infrastructure and roads to connect the 17 functi onal land customs stati ons in the region.4. Open a functi onal air cargo complex in LGB airport with domesti c transshipment arrangements in Kolkata and Delhi.5. Set up three product-specifi c SEZs in the NER.6. Ensure that NERITraM and the concerned states jointly take up a programme for creati ng minimum infrastructure faciliti es in all the states to support a sound base for small enterprises to produce exportable goods.7. Introduce a new transport subsidy package for items exported from the NER which provides air, rail and inland transport subsidies from any part of the NE up to the port of transshipment.8. Provide incenti ves to local entrepreneurs for setti ng up agro-horti cultural processing units with export potenti al.9. Waive excise and import duti es on capital goods imports, especially agricultural tools and machinery, and food and bamboo processing machinery.10. Develop two more agri-export zones in the NER into comprehensive free enclaves.11. Create a Northeastern regional export development fund under NERETraM for border trade and related infrastructure.
9.25 Building upon the strength
Various tables in the annexure taken from the NER Vision 2020 document indicate the following: • Meghalaya has a producti on advantage in maize, small millet, sesamum, coff ee, natural rubber, bananas, potatoes, chillies, ginger and turmeric. However, ginger has shown the greatest revealed producti on advantage for Meghalaya as indicated by an RSI value of 5.27.• Meghalaya has revealed a comparati ve advantage in rice, maize, small millet, wheat, coff ee, natural rubber, bananas, potatoes, chillies, ginger and turmeric. However, pineapple has shown greatest revealed comparati ve advantage for Meghalaya as indicated by NSI value of 22.15.• The demand preferences of all the states in the NER are similar: rice, cereals (except Meghalaya and Mizoram), meat, fi sh, eggs and vegetables (except for Arunachal, Manipur and Meghalaya). This data can be used to infer possible trade especially among the states with exports of items where demand intensity is low relati ve to nati onal average and imports in the other items.• The demand side of the sector is given by the Demand Intensity Measure (DIM). In general, for any state demand is more diversifi ed than producti on with the excess demand consti tuti ng import and the excess supply export. Inspecti on of the DIM reveals the extent to which demand preferences in the NER states diverges from the nati onal average.• The same informati on is obtained more directly by calculati on of the Dependency Index for states which is defi ned as the rati o of consumpti on share to producti on share. The DI indices shown above indicate that the NER is highly dependent on imports for almost all the commoditi es for which we could get data. The only excepti on is spices. However, there are variati ons across states which indicate that there is a reasonable scope for trade among the states of the NER. For

MEGHALAYA STATE DEVELOPMENT REPORTMEGHALAYA STATE DEVELOPMENT REPORT
280
example, while the NER has high dependency on maize this is not true for states like Arunachal, Assam, Manipur and Meghalaya which could profi tably export maize to the other states. Similarly, Assam, Manipur and Meghalaya could be net exporters of fruits to the other states.
9.26: The State Planning Board in October 2008 and January 2009 stressed upon focused intensifi cati on of programmes for strengthening the agriculture sector and improving the overall sown area and producti vity coupled with programmes for fullest exploitati on of the horti cultural potenti al of the State, parti cularly High-Value Horti culture. Besides, it also recommended intensifi ed macro and micro water-shed management programmes to ensure the sustainability of tapped as well as untapped water-sheds. These measures will include aff orestati on of barren waste lands on the southern slopes of the State which are reported to be conti nuously loosing over 22000 metric tonnes of surface soil, per square kilometer, per year. Further, the area of herbal and medicinal products be looked into along with organic certi fi cati on of six major crops. The major problem in agriculture/ horti culture is marketi ng for which the Japanese Bank of Internati onal Cooperati on for assistance may be approached. It was suggested Suggesti on to invite companies for food and fruit processing faciliti es in the State for value additi on and local people benefi t through employment. Israel is acti vely involved in introducing new crops such as a high yielding and in-demand citrus fruit, Jaff a and others. For marketi ng of fl owers ti e up from high end market such as Bangalore, Kolkata with public listed companies and arrangement with airline companies to carry some of the high return agricultural products of the State like broccoli and green capsicum to Delhi where the retail price of these vegetables is very good may be att empted. Distributi on of planti ng materials to farmers should be conti nued. For training offi cers and staff in horti culture/agriculture, the European Economic Commission (EEC) and others may be approached. Bett er packaging and post harvest methods linked to exports should be resorted to avoid a high proporti on of post-harvest losses, by training people. A study should be made to improve the soil quality because conti nuous rain has depleted the soil of both its top surface and its nutrients which take years to regenerate. Steps be initi ated to increases the producti vity per hectare in the State which is low. Though Meghalaya is blessed with bounti ful rainfall yet rain water has not been harvested. The experts suggested the need to tap rain water through eff ecti ve methods of harvesti ng. When constructi ng water harvesti ng structures to provide irrigati on canals, geology should be applied. The department has to concentrate on bett er uti lizati on and bett er producti vity as also to increase the crop intensity which is also quite low. It was suggested that one of the citi es/towns of Meghalaya could be developed into a fl oral garden-city/town. The experts enquired into the feasibility of opening a Horti culture and Forestry University at Williamnagar, East Garo Hills with a view of strengthening capacity building insti tuti ons in Agriculture. It was menti oned that Farmers are forced to conti nue with jhum culti vati on as alternati ve practi ces are minimal where the use of appropriate and meaningful technology for mountain agriculture could bring in the desired change.

MEGHALAYA STATE DEVELOPMENT REPORTMEGHALAYA STATE DEVELOPMENT REPORT
281
9.27: Summary and conclusion: Producti on of large basket of food crops, sericulture and livestock including fi sheries meeti ng the requirement of food and nutriti on, cloth and shelter etc. is a traditi onal ways of the farming system of northeast. The overriding psyche of the farmers is to ensure food security. The harsh geographic locati ons. Low producti vity, lack of inputs and aff ordable price, poor linkages and inaccessibility together have forced the farmers in the past to practi ce a highly diversifi ed and integrated producti on system. The nature off ering enormous opportuniti es to grow diverse crop, trees and livestock over a wide range of agro-climati c conditi ons made agricultural diversifi cati on a need and a reality in the farming system. The recent environmental degradati on and lopsided land ownership has put strains on the agriculture. Reinforcing Agri-horti -silvi based micro eco-system in farming through raising diverse range of agricultural crops, sericulture, animal husbandry fi shery etc in an integrated patt ern has to be the core ethics; ensuring environmental sustainability. The ecological value att ached to the practi ce is an onus given the growing concern on global warming. Introducti on of Land Saving technology and commercial mode of producti on into the diversifi ed and integrated farming system with enhanced producti vity and value additi ons at all levels. There is a need to eliminate number of hindering factors like lack of proper extension guidance for improved technology, adequate physical faciliti es such as irrigati on, proper mechanizati on and ti mely supply of quality seeds, access to informati on etc. Provision of assured irrigati on faciliti es which is a weak link needs addressing on a war footi ng. A mere 10% of the gross cropped area having irrigati on as against 31 per cent at all-India level should give a wake up call for sincere and directed eff orts. Arrangement of informati on in the Six broad areas will help farmers, entrepreneurs and educated youth in a big way. Informati on requirement is conceived in six broad areas namely:1)Awareness Database- those that facilitate proper understanding of the implicati ons of the WTO on Indian Agriculture, 2)Decision support system- agro-climati c informati on bank that facilitates farmers to make a proper SWOT analysis to take appropriate decision such as that menti oned in Chapter II, APIB in Meghalaya, 3)Systems that facilitate Indian farmers to forge appropriate alliances for collecti ve benefi t, 4)Informati on on new opportuniti es,5)Monitoring systems for correcti ve measures and 6) intensifying use of ICT such as, village resource centre (VRC) in some selected villages in collaborati on with NEISAC; preparing APIB and GIS based land use and NRM plans are necessary. Strengthening eff orts of germ-plasm and bioresources development would be required for a comprehensive strategy towards natural resources management.

MEGHALAYA STATE DEVELOPMENT REPORTMEGHALAYA STATE DEVELOPMENT REPORT
282
Table 9.9 : Growth Rates of Agriculture in the Northeast, 1993-94 to 2002-03 : At constantbase 1993-94
Courtesy : Quoted from NER Vision 2020 Vol. III
(percent)
State 1993-94 to 1997-98 1998-99 to 2002-03 1993-94 to 2002-03Arunachal Pradesh -3.3 0.8 -1.3Assam 1.6 2.5 1.0Manipur 2.9 3.0 3.4Meghalaya 6.9 5.7 6.1Nagaland 6.6 20 12.9Sikkim 3.7 6.0 4.6Tripura 3.4 3.2 3.9Mizoram 4.3 7.6 4.4NER 3.3 6.1 3.8India 2.6 -3.4 0.6
Table 9.10 : Livestock Populati on and Output, 2003-04Courtesy : Quoted from NER Vision 2020 Vol. III
States
Tota
l Liv
e St
ock
(000
Num
ber)
Poul
try
(000
Num
ber)
Tota
l Milk
(0
00 N
umbe
r)
Eggs
(C
rore
Num
ber)
Catt
le (0
00 N
umbe
r)
Buff a
loes
(0
00 N
umbe
r)
Shee
p (0
00 N
umbe
r)
Goa
ts (0
00 N
umbe
r)
Poul
try
(000
Num
ber)
Mea
t(5
+6+7
+8+9
)(0
00 N
umbe
r)1 2 3 4 5 6 7 8 9 10
Arunachal Pradesh
1257 1743 46 0.9 458 11 19 231 1743 2462
Assam 13829 21664 727 51.4 8440 678 170 2987 21664 33939
Manipur 971 2941 71 7.9 418 77 6 33 2941 3475
Meghalaya 1551 2821 69 9.4 767 18 18 327 2821 3951
Mizoram 280 1125 15 3.1 36 6 1 17 1125 1185
Nagaland 1349 2789 63 6.8 451 34 4 175 2789 3453
Sikkim 337 322 48 1.3 159 2 6 124 322 613
Tripura 1458 3057 84 10.1 759 14 3 472 3057 4305
North-East 21032 36462 1123 90.9 11488 840 227 4366 36462 53383
India 485002 489012 88082 4040.3 185181 97922 61469 124358 489012 957942

MEGHALAYA STATE DEVELOPMENT REPORTMEGHALAYA STATE DEVELOPMENT REPORT
283
Table 9.11 : Rati o of Livestock to populati on, 2003-04St
ates
Tota
l Liv
e St
ock
(Num
ber)
Poul
try
(Num
ber)
Tota
l Milk
(N
umbe
r)
Eggs
(N
umbe
r)
Catt
le (N
umbe
r)
Buff
aloe
s
(Num
ber)
Shee
p (N
umbe
r)
Goa
ts (N
umbe
r)
Poul
try
(Num
ber)
Mea
t(5
+6+7
+8+9
) (N
umbe
r)
1 2 3 4 5 6 7 8 9 10
Arunachal Pradesh
1.145 1.587 0.042 8.197 0.417 0.010 0.017 0.210 1.587 2.242
Assam 0.519 0.813 0.027 19.283 0.317 0.025 0.006 0.112 0.813 1.273
Manipur 0.423 1.282 0.031 34.439 0.182 0.034 0.003 0.014 1.282 1.515
Meghalaya 0.669 1.217 0.030 40.538 0.331 0.008 0.008 0.141 1.217 1.704
Mizoram 0.315 1.266 0.017 34.887 0.041 0.007 0.001 0.019 1.266 1.334
Nagaland 0.678 1.401 0.032 34.170 0.227 0.017 0.002 0.088 1.401 1.735
Sikkim 0.623 0.595 0.089 24.036 0.294 0.004 0.011 0.229 0.595 1.133
Tripura 0.456 0.956 0.026 31.570 0.237 0.004 0.001 0.148 0.956 1.346
North-East 0.539 0.935 0.029 23.317 0.295 0.022 0.006 0.112 0.935 1.369
India 0.471 0.475 0.086 39.274 0.180 0.095 0.060 0.121 0.475 0.931
Table 9.12 : Fish Producti on, 2003-04 Courtesy : Quoted from NER Vision 2020 Vol. III
StatesTotal Producti on Per Capita Output
(Million Tonnes) (Kg per head)
Arunachal Pradesh 2,650 2.41
Assam 180.945 6.79
Meghalaya 6,179 2.68
Mizoram 3,380 3.8
Tripura 17,980 5,62
NER 231,847 5.95
India 6,399,390 6.22

MEGHALAYA STATE DEVELOPMENT REPORTMEGHALAYA STATE DEVELOPMENT REPORT
284
Table 9.13 : RSI:HIghest Comparati ve Advantage for products of the North Eastern States
Courtesy : Quoted from NER Vision 2020 Vol. III
States ProductsArunachal Pradesh Small millet, maize, GingerAssam Tea, rapeseed and mustard, sugurcaneManipur Chillies, rice, gingerMeghalaya Ginger, potatoes and sesamumMizoram Ginger, maize and sesamumNagaland Coff ee, small millet and maizeSikkim Maize, ginger, potatoesTripura Natural rubber, coconut, bananas
Table 9.14 : NSI:HIghest Comparati ve Advantage of products of the North Eastern States
States ProductsArunachal Pradesh Ginger, banana, small milletAssam Tea, banana, turmericManipur Pineapple, ginger, chilliesMeghalaya Pineapple, ginger, potatoesMizoram Ginger, pineapple, sesamumNagaland Pineapple, small millet, turmericSikkim Ginger, potatoes, maizeTripura Natural rubber, pineapple, bananas

MEGHALAYA STATE DEVELOPMENT REPORTMEGHALAYA STATE DEVELOPMENT REPORT
285
TABLE 9.15 : Dependency Index (DI) for All Products, 2003-04Courtesy : Quoted from NER Vision 2020 Vol. III
Crop
Aru
nach
al P
rade
sh
Ass
am
Man
ipur
Meg
hala
ya
Miz
oram
Trip
ura
Nag
alan
d
Rice 67.55 129.58 90.73 100.37 83.66 136.36 165
Wheat 126.61 793.91 - 1,715.11 - 832.10 670
Maize 86.34 54.18 - 18.61 9.27 - 343
Total cereals 69.62 186.94 122.69 134.52 107.19 191.80 228
Total pulses 79.80 455.70 438.04 260.38 152.60 770.66 476
Total oilseeds 23.71 398.02 2187.18 529.34 222.93 2,081.85 415
Fruits 49.00 69.52 46.25 44.65 126.20 152.75 95
Sugarcane 441.11 484.92 595.72 - 3,126.27 1,022.00 618
Spices 1.21 183.48 16.82 2.02 1.15 76.77 27
Total foodgrains 45.98 144.64 70.67 146.28 106.34 167.31 182
Milk 28.35 135.98 - 82.74 180.11 197.41 168
Meat 5.68 16.96 - 11.15 16.80 28.09 23
Egg 262.14 188.92 - 79.07 108.31 201.98 283
Fish 123.38 74.38 - 166.71 137.68 157.24 127
Table 9.16 : Dependency Index for Milk, Meat, Eggs and Fish, 2003-04Courtesy : Quoted from NER Vision 2020 Vol. III
AP Assam Meghalaya Mizoram Tripura NER
Milk 28.35 135.98 82.74 180.11 197.41 168.72
Meat 5.68 8.48 5.58 16.80 28.09 23.59
Weights Assigned 0.10 0.05 0.05 0.10 0.10 0.10
Eggs 131.07 118.08 108.72 108.31 201.98 141.83
Weights Assigned 0.20 0.25 0.55 0.40 0.40 0.20
Fish 172.74 104.13 133.37 137.68 157.24 177.80
Weights Assigned 0.70 0.70 0.40 0.50 0.50 0.70

PADDY HARVESTING
‘JHUM’ CROP FIELD

GINGER MARKET, GARO HILLS
GARO WOMAN WITH HER MAIZE CROPS

COMMUNITY FISHING
Woman Drying Fish

ONE DAY OLD CHICK
MEGHALAYA CONTAINED BIRD FLUESPREAD EFFECTIVELY
INDO DANISH PROJECT ATUPPER SHILLONG PRIVATE FARMER
CO-OPERATIVE

DAIRY DEVELOPMENT
PIGERY DEVELOPMENT
POULTRY DEVELOPMENT

MAIZE RICE CULTIVATION
FLORICULTURE

MEGHALAYA STATE DEVELOPMENT REPORTMEGHALAYA STATE DEVELOPMENT REPORTMEGHALAYA STATE DEVELOPMENT REPORT
CHAPTER-X
TRADE AND INDUSTRIAL DEVELOPMENT
10.1 Introducti on
The State of Meghalaya is predominantly an agricultural state and the level of industrializati on
is low. There is decreasing trend in availability of land for agricultural purposes, while the incidence
of landless labour and the resultant poverty has risen substanti ally (48.9 percent).
The State has suffi cient hydel power potenti al and large reserves of coal, but the industrial
sector has registered a low rate of development in comparison with the nati onal level. Meghalaya
has not witnessed the desired level of investment and industrial growth mainly because of lack
of basic infrastructure. For a state with a small populati on, internal demand hardly favours the
development of large-scale manufacturing. Moreover many manufacturing units driven by the
market potenti al of the North Eastern region is yet to take off . Other factors indicate gaps in linkages
and value additi on, besides other economic infrastructure and distances from ports etc. The vast
natural endowment and human resource capital have remained by and large untapped and a non-
performing asset. Inadequate infrastructural faciliti es, poor road communicati on, hilly terrain and
unemployment have been the major constraints of economic growth in general and industrial
development in parti cular.
The overall positi on on the infrastructural development of State has been elaborately dealt
in the concerned chapter which clearly indicates the distances required to be covered for the
desired level that could ensure rapid socio-economic growth. At present there are 6 (six) Industrial
Estates, 1 (one) Growth Centre, 1 (one) Industrial Area and 1 (one) Export Promoti on Industrial
Park. In the light of this the present chapter looks into some of the characteristi cs of the present
industrial scenario of the State.
10.2. Resources of Meghalaya
Meghalaya is considered to have a rich base of natural resources as detailed in the chapter on
natural resources. These include minerals such as coal, limestone, silimanite, Kaolin and granite
among others. Meghalaya also has a large forest cover, rich biodiversity and numerous water
bodies. However, the low level of industrializati on and the relati vely poor infrastructure base in
the state acts as an impediment to the exploitati on of these natural resources in the interest of the
state’s economy.
287

MEGHALAYA STATE DEVELOPMENT REPORTMEGHALAYA STATE DEVELOPMENT REPORTMEGHALAYA STATE DEVELOPMENT REPORT
Table 10.1 Esti mated Reserves of Minerals in Meghalaya Mineral Reserves (In million Tonnes)
Coal 563.5
Limestone 4147.0
Kaolin 4.5
Clay 81.0
Sillimanite 0.05
Glass Sand 2.54
Quartz 0.08
Feldspar 0.06
Iron 4.0
Fire Clay 12.0
Source: Directorate of Economic & Stati sti c, Government of Meghalaya
Table 10.2 MAJOR AGRO & HORTICULTURAL RESOURCES (fi gure in MT)Agro-Horti cultural Products (in tones)
Maize 24051
Soya Bean 959
Short staple Cott on 7829
Ginger 46731
Banana 65639
Pineapple 83333
Chillies 1150
Turmeric 8640
Areca nut 14167
Citrus 33006
Cashew nut 6730
Tea leaf 3059
Rapeseed/ Mustard 4670
Sources : Directorate of Economic & Stati sti c, Government of Meghalaya
10.3.1 Status of Industrial development in the state
Despite having enormous potenti al in power generati on, surplus Agro-Horti culture produces large reserve of coal, limestone and other mineral resources, Meghalaya has made litt le progress in the fi eld of industrializati on. The reason being, the state of Meghalaya is a landlocked territory with hilly terrain connected only by serpenti ne roads to various villages, making transportati on costlier when compared with other states. Moreover, absence of railhead in the state, besides distance from the port is another factor hindering movement of goods and materials in and out of the state. This acts as an impediment for the development of large manufacturing units with large marketi ng hinterland. Present status of large & medium enterprises along with small sector enterprises are as follows:
288

MEGHALAYA STATE DEVELOPMENT REPORTMEGHALAYA STATE DEVELOPMENT REPORTMEGHALAYA STATE DEVELOPMENT REPORT
Table. 10.3 Status of Large & Medium Industries in Meghalaya
Sl. No. Type of Industries Nos. Investment made (Rs in lakhs) Employment Generated1 Cements 10 36067.45 13112 Steel Units 48 15073.84 1925
3
Limestone
Mining &
Crushing Plant
4 1796 336
4 Foods 12 3831.48 3735 IMFL 3 489.94 996 Coke 2 756 70
7Informati on
Technology2 283 85
8 HDPE Bags 4 1373.4 1359 Others 31 13361.09 1083
Total : 116 73032.2 5417
Nos. of Large & Medium Units
10
48
4
12
3
2
2
4
31
CementsSteel UnitsLimestone Mining & Crushing PlantFoodsIMFLCokeInformation TechnologyHDPE BagsOthers
289

MEGHALAYA STATE DEVELOPMENT REPORTMEGHALAYA STATE DEVELOPMENT REPORTMEGHALAYA STATE DEVELOPMENT REPORT
Investment made (Rs in lakhs)
36067.45
15073.84
1796
3831.48
489.94
756
283
1373.4
13361.09
CementsSteel UnitsLimestone Mining & Crushing PlantFoodsIMFLCokeInformation TechnologyHDPE BagsOthers
Employment Generated
1311
1925
336
373
99
70
85
135
1083
CementsSteel UnitsLimestone Mining & Crushing PlantFoodsIMFLCokeInformation TechnologyHDPE BagsOthers
290

MEGHALAYA STATE DEVELOPMENT REPORTMEGHALAYA STATE DEVELOPMENT REPORTMEGHALAYA STATE DEVELOPMENT REPORT
Table 10.4 Status of Small Scale Industries
Sl.No Name of District
Manufacturing,
Assembling &
Processing
Repairing &
MaintenanceServicing
Employment
Generated
1 2 3 4 5 61 East Khasi Hills 1127 41 94 65362 East Garo Hills 343 - 9 18083 West Khasi Hills 214 27 86 13074 West Garo Hills 100 11 75 9595 Jainti a Hills 219 14 63 29026 Ri Bhoi 147 8 24 16147 South Garo Hills 53 12 23 294 TOTAL 2203 113 374 15420Provisional report of the Directorate of industries as per the census 2008
10.3.2 Rural/Urban Distributi on of Enterprises in Industrial Sector
Majority of the populati on is involved in the unorganised sector of the industry. In additi on to
agriculture and allied sectors, small-scale unregistered units play an important role in providing
employment opportuniti es. All the 116 large & medium manufacturing enterprises are located in
rural sector. And out of the 2653 small scale manufacturing enterprises operati ng in the state, 1902
are located in rural areas and 751 in urban areas. Similarly for constructi on related enterprises,
971 are located in rural areas and 635 in urban areas. The share of manufacturing sector in the
industrial enterprises is relati vely greater for both rural and urban sector when compared with the
constructi on units. Manufacturing sector accounts to nearly 80% of the total industrial enterprise
sector in the state. For both manufacturing and constructi on related industrial enterprises,
‘Establishments’ have a greater percentage share both in rural and urban areas of the state. Nearly
80% of the manufacturing units and 66.8% of the constructi on units come under the category of
‘Establishments’. The greater share of ‘Establishments’ compared to the ‘Own Account Enterprises’
implies increasing trend of hired employment both in rural and urban sector.
291

MEGHALAYA STATE DEVELOPMENT REPORTMEGHALAYA STATE DEVELOPMENT REPORTMEGHALAYA STATE DEVELOPMENT REPORT
10.3.3. Share of Industry in Net State Domesti c Product (NSDP)
The Industrial Sector in the state comprises of units engaged in manufacturing,
Mining and Quarrying, Constructi on and Electricity, Gas and Water Supply. As per the New Series
of the esti mates of State Domesti c Product, the Industrial sector contributes about 21% to 26%
of the Net State Domesti c Product (NSDP) between the period from 1999-2000 to 2007-08(Adv.).
The contributi on of constructi on was in the range of 10.08% to 13.08% during the same period.
The manufacturing acti viti es which contributed only 1.56% in 1999-2000 had increased its share
to 3.53% of NSDP during the year 2007-08(Adv.). The fi gures relati ng to Mining & Quarrying vary
from 7.38% at the lowest to 9.58% at the highest in terms of percentage contributi on towards
NSDP of the state. Electricity, Gas & Water Supply, on the other hand contribute only about 1.7%
on the average for the period of 9 years. The industrial sector as a whole has achieved marginal
increase in its share towards the NSDP of the state and this can be att ributed to the performance of
Constructi on and Mining & Quarrying acti viti es which are the main contributors towards the NSDP
from amongst the acti viti es comprised in the Industrial Sector. The contributi on of the industrial
sector shows an increasing trend from 21.09% in 1999-2000, it went up to 23.83% in 2003-04 and
rose further to 26.39% during 2007-08(Adv.).
Going by the Link Series for the years 1993-94 to 1998-99, the same trend was
observed in terms of Percentage contributi on of the Industrial Sector. Its share was 15.28% in
1993-94. It was almost at the same level up to 1997-98 and went marginally up to 17.61% in
1998-99. The percentage share in 2007-08 (Adv) at 26.39% was higher than that of 1993-94. The
contributi on of the Manufacturing Sector shows a declining trend from 1994-95 (3.19%) ti ll 2001-02
(1.28%). It somehow recovered and the percentage contributi on stood at 3.53% in 2007-08 (Adv.).
The other two sectors viz. Mining & Quarrying and Constructi on have increased their contributi ons
from 3.38% and 7.55% respecti vely in 1993-94 to 8.44% and 13.08% in 2007-08 (Adv.) towards
the NSDP at Current Prices, though there are fl uctuati ons in their contributi ons from one year to
another. Similar is the case with Electricity, Gas and Water Supply.
292

MEGHALAYA STATE DEVELOPMENT REPORTMEGHALAYA STATE DEVELOPMENT REPORTMEGHALAYA STATE DEVELOPMENT REPORT
Source: Directorate of Economics & Stati sti cs, GOM
10.3.4 Growth of industrial sector
The industrial sector has shown a declining trend in terms of percentage growth over previous
years for the period 1999-2000 to 2007-08(Adv.) according to the esti mates of Net State Domesti c
Product(NSDP) at constant(1999-2000) prices in the New Series. The highest growth was recorded
in the year 2000-01 at 14.54%. It was lowest in 2002-03 when it registered a negati ve growth of
-2.26%. The growth rate remained more or less steady at about 9% during a three year period of
2004-05, 2005-06 and 2006-07(Q) but it declined to 5.70% during 2007-08(Adv.). The growth of the
manufacturing sector presents a rather inconsistent picture during the above period (1999-2000
to 2007-08) in terms of percentage growth. Aft er registering a negati ve growth of -1.74% during
2001-02, it went up to as much as 62.93% in 2002-03. The growth rate came down to 12.46% in
Share of Industrial Sector Towards NSDP
-10000-5000
05000
100001500020000250003000035000400004500050000550006000065000700007500080000850009000095000
100000105000110000115000120000125000130000135000140000
1993-94 1994-95 1995-96 1996-97 1997-98 1998-99 1999-2000
2000-01 2001-02 2002-03 2003-04 2004-05 2005-06 2006-07(Q)
2007-08(Adv)
Y e a r
In L
ak
h R
up
ee
s
Manufacturing Mining & Quarrying Construction Electricity, Gas & Water Supply Total
293

MEGHALAYA STATE DEVELOPMENT REPORTMEGHALAYA STATE DEVELOPMENT REPORTMEGHALAYA STATE DEVELOPMENT REPORT
2003-04. It again registered a low percentage growth of 7.27% in 2005-06. It somehow recovered
and the growth rate stood at 15.09% in 2007-083(Adv.) which is far bett er than what it was at the
beginning of the period. The same picture was also observed in respect of Constructi on which
registered a lowest growth rate of 1.00% in 2001-02 and a highest of 20.35 in 2000-01. The growth
rate stood at 2.17% in 2007-08(Adv.). Mining & Quarrying also registered an inconsistent growth.
It was highest in 2001-02 with 31.01%. It registered a negati ve growth of -24.00% in 2002-03. The
growth rate stood at 7.49% in 2007-08(Adv.).
Taking into considerati on the Old Series in the esti mates of Net State Domesti c
Product (NSDP) by linking the 1993-94 Series with the new base period (1999-2000), the same
trend was observed for the period from 1993-94 to 1998-99. The quantum of growth as refl ected
by the percentage growths over previous years could not be maintained. It was 11.99% in 1994-
95. It came down to only 3.75% in 1997-98. There were instances when the growth was negati ve,
such as 1999-2000 over 1998-99 when it was -9.44% and also 2002-03 with -2.26%. It should
be noted that the percentage growth in 2007-08 (Adv.) was 5.70% which is far lower than that
of 1994-95. The individual sectors within the Industrial Sector present very inconsistent growths.
Manufacturing with a growth of 39.99% in 1994-95 over 1993-94, registered negati ve growth for
four consecuti ve years from 1996-97 to 1999-2000 and the growth in 2007-08 (Adv.) at 15.09% was
below that of 1994-95. Mining and Quarrying registered a highest growth in 1998-99 over 1997-
98 with 72.33%, but the growth was only 7.49% in 2007-08 (Adv.) which is below that of 1994-95
with 38.76%. The other two Sectors viz. Constructi on and Electricity etc. are at a bett er positi on in
2007-08(Adv.) when compared to 1994-95 in terms of percentage growth. They, however, could
not maintain the higher growths they achieved during some years during the period (1993-94 to
2007-08(Adv.).
However, the overall performance of the Industrial Sector, considering the whole
period from 1993-94 to 2007-08(Adv.) is increasing as evident from the graph below.
294

MEGHALAYA STATE DEVELOPMENT REPORTMEGHALAYA STATE DEVELOPMENT REPORTMEGHALAYA STATE DEVELOPMENT REPORT
Source: Directorate of Economics & Stati sti cs, GOM
10.4. Sector-wise Distributi on of Manufacturing Industry
The manufacturing Industries can be grouped, according to size, into two classes: Large and medium
industries, which are registered under Factories Act, 1948 and Small Scale units oft en referred to as
unregistered units but generally registered with Directorate of Industries.
A. Large and Medium
The factories in manufacturing sector can be classifi ed broadly into two categories - Registered and
unregistered manufacturing units.
Registered manufacturing industries can be identi fi ed as the organized manufacturing enterprise.
It includes those industrial units registered under Secti ons 2m (i) and 2m (ii) of Factories Act, 1948.
Registered manufacturing includes those industrial units with 10 or more workers engaged and
using power and 20 or more workers working without power.
Under the large & medium industries, the manufacturing units are mostly engaged in Cement,
Ferro-alloy, Cokes, Food items, HDPE bags etc. The registered small scale manufacturing units are
mostly engaged in economic acti viti es like food products, wood, furniture, printi ng press, non-
metallic industries, repair & services etc.
Growth of Industrial Sector
0
10000
20000
30000
40000
50000
60000
70000
80000
90000
100000
110000
120000
130000
140000
1993-94 1994-95 1995-96 1996-97 1997-98 1998-99 1999-2000
2000-01 2001-02 2002-03 2003-04 2004-05 2005-06 2006-07 2007-08
Y e a r s
In L
akh
Rup
ees
Manufacturing Mining & Quarrying Construction Electricity, Gas & Water Supply Total
295

MEGHALAYA STATE DEVELOPMENT REPORTMEGHALAYA STATE DEVELOPMENT REPORTMEGHALAYA STATE DEVELOPMENT REPORT
The average number of worker per registered manufacturing unit has steadily declined during the period of discussion. Secondly average value added per worker has increased from Rs.55 thousand in 1995 to Rs.65 thousand in 19993. A tentati ve hypothesis may be formed that the capital intensity of the registered manufacturing units has increased during this period. Analysis of district wise distributi on of registered manufacturing units and workers highlights that the degree of industrializati on is low and spati ally skewed in its distributi on. Baring East Khasi Hills, Small Scale Industries are evenly poised. In SSI sector the East Khasi Hills alone is having almost half of the total number of industries with one third of employment of the total in the state fi gure.
B. Small Scale IndustriesRole of Small Scale Industry (SSI) in the State EconomyIn order to improve the economic conditi on of the people, the development of small-scale industries in unregistered manufacturing sector has to be taken up and encouraged earnestly. The unregistered manufacturing sector covers all those industrial units engaged in manufacturing, processing, repairs and maintenance services that are not covered under the Factories Act. Thus, units or enterprises, employing less than 20 workers and not using power are covered under unregistered manufacturing sector. Moreover, own-account enterprises engaged in manufacturing are also included in the unregistered manufacturing sector. However, acti viti es of manufacturing, processing etc. that are included in agriculture and allied acti viti es are excluded from the purview of the unregistered manufacturing sector.Government sector is already a major provider of employment in the organised sector. The present scope of employment in government services has reached a saturati on point and educated youth may fi nd it diffi cult to fi nd employment in the government sector in the near future. In order to alleviate this problem, development of small-scale industries is essenti al. Setti ng up of small-scale industries especially in the rural area, with locally available resources would not only lessen the burden of unemployment but may also check the infl ux of people living in rural areas to the urban areas of the state.
Growth of Small Scale Industry (SSI)In spite of hurdles like inadequate capital investment, shortage of technical skills etc, the progress of small-scale industries appears to be encouraging. As per the data available for the last 05 years,
the performance of the small-scale industries has been quite sati sfactory.
Table 10.5: District-wise distribution of Registered Manufacturing Units and Workers in 2000
Districts No. of Units No. of workers Jaintia Hills 2 (6.5) 85 (5.6)East Khasi Hills 16 (51.6) 643 (42.7)West Khasi Hills Nil NilRi-Bhoi 11 (35.4) 488 (32.4)East Garo Hills 2 (6.5) 291 (19.3)West Garo Hills Nil NilSouth Garo Hills Nil Nil
Total 31 1507
Source: Directorate of Economics and Statistics; Govt. of MeghalayaFigures in () are the percentage share
296

MEGHALAYA STATE DEVELOPMENT REPORTMEGHALAYA STATE DEVELOPMENT REPORTMEGHALAYA STATE DEVELOPMENT REPORT
In absolute terms the employment in the S.S.I. units has increased considerably, registering
an annual compound growth rate though not very sati sfactory. There were 2653 SSI units in the
state in 2007-08.The steady growth of small-scale industries over the years reveals the scope of
development of this sector. Moreover, in the view of increasing populati on in the state, the creati on
of employment opportuniti es in the small-scale sector is essenti al.
However, unlike the registered manufacturing industries, the average number of workers
per unit in SSI did not show any change over the ti me. Average net value of output generated per
worker recorded a steady decline.
District wise Distributi on of SSIs and their contributi on to economy
Growth os SSI
0
5001000
1500
2000
25003000
3500
1995
-96
1997
-98
1999
-2000
2001
-02
2003
-04
2005
-2006
No. of SSINo. of people Employed
No. of small scale industries
40%
5%13%
20%
11%
9% 2%East Khasi Hills
Ri-Bhoi
Jaintia Hills
West Khasi Hills
East Garo Hills
West Garo Hills
South Garo Hills
297
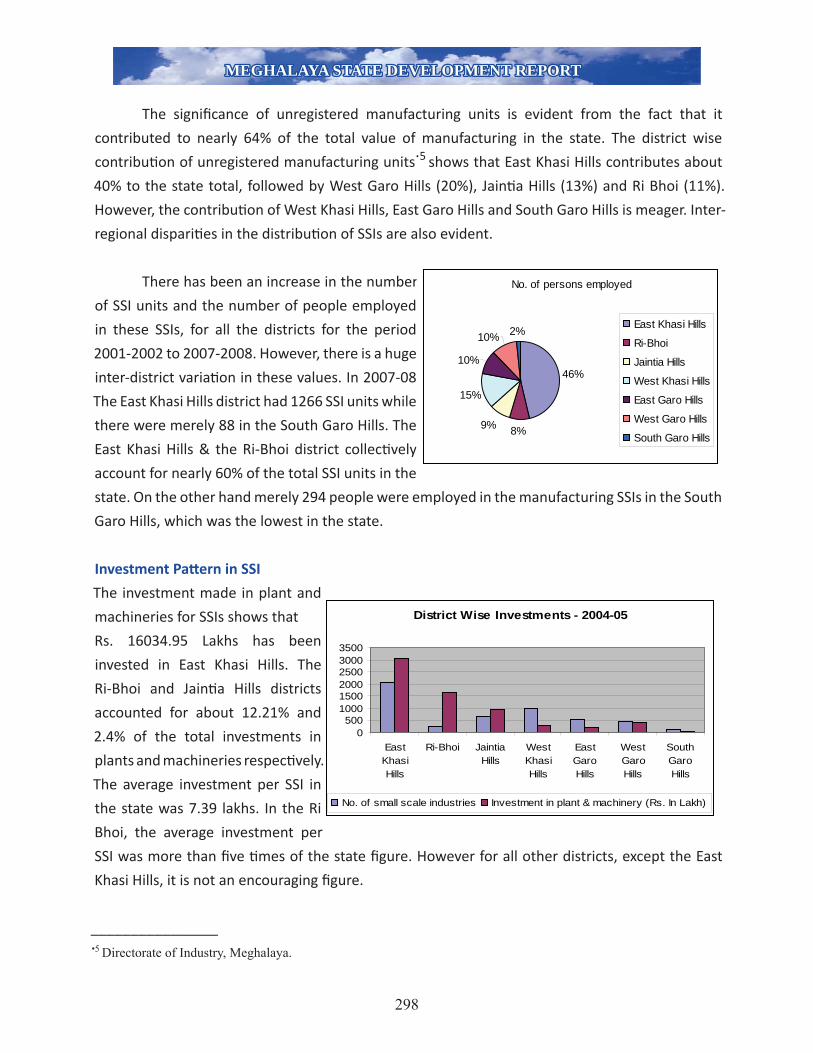
MEGHALAYA STATE DEVELOPMENT REPORTMEGHALAYA STATE DEVELOPMENT REPORTMEGHALAYA STATE DEVELOPMENT REPORT
The signifi cance of unregistered manufacturing units is evident from the fact that it
contributed to nearly 64% of the total value of manufacturing in the state. The district wise
contributi on of unregistered manufacturing units.5 shows that East Khasi Hills contributes about
40% to the state total, followed by West Garo Hills (20%), Jainti a Hills (13%) and Ri Bhoi (11%).
However, the contributi on of West Khasi Hills, East Garo Hills and South Garo Hills is meager. Inter-
regional dispariti es in the distributi on of SSIs are also evident.
There has been an increase in the number
of SSI units and the number of people employed
in these SSIs, for all the districts for the period
2001-2002 to 2007-2008. However, there is a huge
inter-district variati on in these values. In 2007-08
The East Khasi Hills district had 1266 SSI units while
there were merely 88 in the South Garo Hills. The
East Khasi Hills & the Ri-Bhoi district collecti vely
account for nearly 60% of the total SSI units in the
state. On the other hand merely 294 people were employed in the manufacturing SSIs in the South
Garo Hills, which was the lowest in the state.
Investment Patt ern in SSI
The investment made in plant and
machineries for SSIs shows that
Rs. 16034.95 Lakhs has been
invested in East Khasi Hills. The
Ri-Bhoi and Jainti a Hills districts
accounted for about 12.21% and
2.4% of the total investments in
plants and machineries respecti vely.
The average investment per SSI in
the state was 7.39 lakhs. In the Ri
Bhoi, the average investment per
SSI was more than fi ve ti mes of the state fi gure. However for all other districts, except the East
Khasi Hills, it is not an encouraging fi gure.
________________•5 Directorate of Industry, Meghalaya.
No. of persons employed
46%
8%9%
15%
10%
10% 2% East Khasi Hills
Ri-Bhoi
Jaintia Hills
West Khasi Hills
East Garo Hills
West Garo Hills
South Garo Hills
District Wise Investments - 2004-05
0500
100015002000250030003500
EastKhasiHills
Ri-Bhoi JaintiaHills
WestKhasiHills
EastGaroHills
WestGaroHills
SouthGaroHills
No. of small scale industries Investment in plant & machinery (Rs. In Lakh)
298

MEGHALAYA STATE DEVELOPMENT REPORTMEGHALAYA STATE DEVELOPMENT REPORTMEGHALAYA STATE DEVELOPMENT REPORT
Resource Industry Linkage in the State
Registered factories
The number of registered units has increased from 45 in 1974 to 72 in 1999 and then jumped to
266 in 2000-2001. The employment increased by 9.7% during 1974-99 and then declined by 55%
during 1999-2001. The marked decline can be att ributed to the Supreme Court’s order in respect
to the tree cutti ng and subsequent closure of the industries based on wood and wood products.
However, due to absence of category-wise distributi on of registered units, the trend in respect of
industry-resource linkage cannot be examined.
Prior to the Supreme Court ruling there have been four broad categories of registered factories by
type:
• Forest Based such as Plywood manufacturing, Saw mills and Furniture and Fixture;
• Agro-Horti culture based such as Canning and Preservati on and Rice & Flour Milling;
• Demand Based such as Printi ng Press and Motor Vehicle Repairs and
• Others such as Cement, motor assembling, pumping, cott on gunning, mineral
processing etc.
Prior to year 2000 Forest based industries consti tuted about 30-35 percent of the registered
units of the state. However aft er the closure of these units, mineral based units (in the other
category) became prominent among all other categories.
10.5 Small Scale Industries
Industries under this category have
shown a phenomenal increase during
1976-1977 to 2000-01. The 1990s
witnessed a prodigious growth rate.
During this period the increase in the
number of units was more than 20%.
The employment in SSI increased from
a meagre 109 in 1976-77 to 15420 in
2007-08.
�
���
���
����
����
����
�� �� � ��� � �� � ��� � ����� ���
���������
�� ��
1999-2000 2000-2001
Growth in the number of SSI units under different categories
299
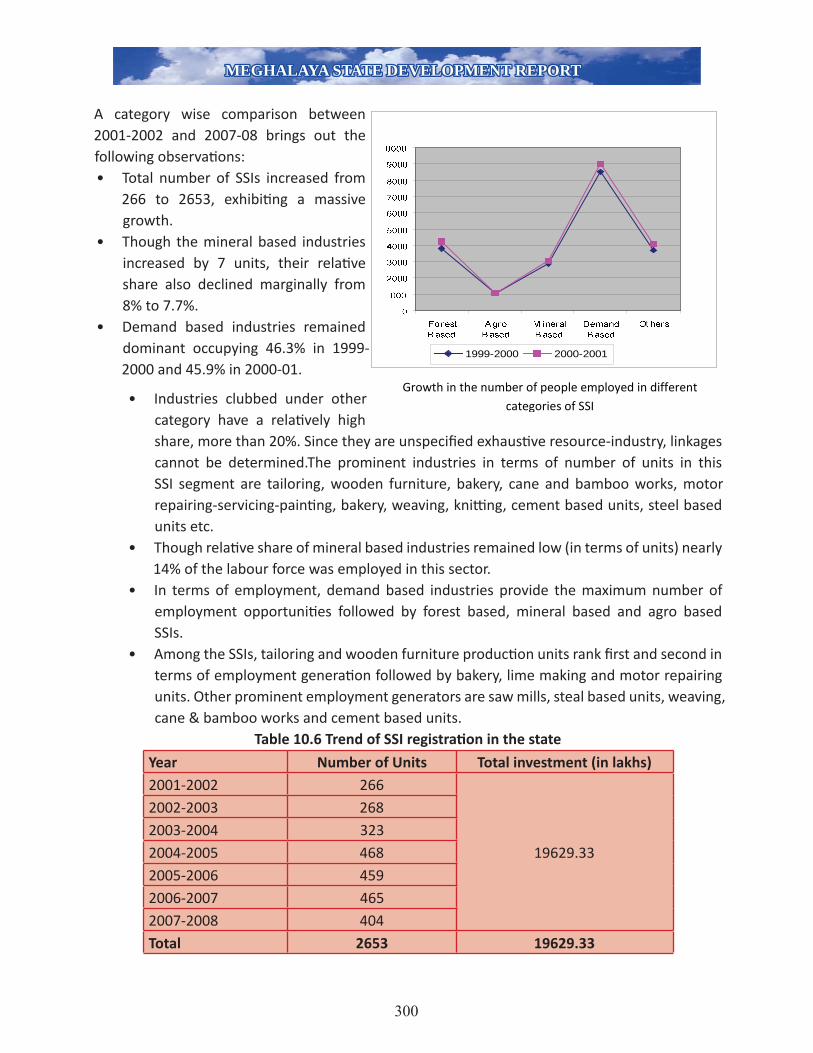
MEGHALAYA STATE DEVELOPMENT REPORTMEGHALAYA STATE DEVELOPMENT REPORTMEGHALAYA STATE DEVELOPMENT REPORT
A category wise comparison between 2001-2002 and 2007-08 brings out the following observati ons:• Total number of SSIs increased from
266 to 2653, exhibiti ng a massive growth.
• Though the mineral based industries increased by 7 units, their relati ve share also declined marginally from 8% to 7.7%.
• Demand based industries remained dominant occupying 46.3% in 1999-2000 and 45.9% in 2000-01.
• Industries clubbed under other category have a relati vely high share, more than 20%. Since they are unspecifi ed exhausti ve resource-industry, linkages cannot be determined.The prominent industries in terms of number of units in this SSI segment are tailoring, wooden furniture, bakery, cane and bamboo works, motor repairing-servicing-painti ng, bakery, weaving, knitti ng, cement based units, steel based units etc.
• Though relati ve share of mineral based industries remained low (in terms of units) nearly 14% of the labour force was employed in this sector.
• In terms of employment, demand based industries provide the maximum number of employment opportuniti es followed by forest based, mineral based and agro based SSIs.
• Among the SSIs, tailoring and wooden furniture producti on units rank fi rst and second in terms of employment generati on followed by bakery, lime making and motor repairing units. Other prominent employment generators are saw mills, steal based units, weaving, cane & bamboo works and cement based units.
Table 10.6 Trend of SSI registrati on in the state
Year Number of Units Total investment (in lakhs)2001-2002 266
19629.33
2002-2003 2682003-2004 3232004-2005 4682005-2006 4592006-2007 4652007-2008 404Total 2653 19629.33
�
����
����
����
����
����
����
����
���
���
�����
�� ���������
�� ������
� ��� �������
�����������
�� �� �
1999-2000 2000-2001
Growth in the number of people employed in different categories of SSI
300

MEGHALAYA STATE DEVELOPMENT REPORTMEGHALAYA STATE DEVELOPMENT REPORTMEGHALAYA STATE DEVELOPMENT REPORT
10.6. Promoti onal Policies of Government of India for Non-Farm Sector
10.6.1 Since independence, policies in India emphasized accelerated industrial growth and other
important goals such as achieving self-reliance, reducti on in dispariti es across regions in the
country and preventi ng concentrati on of economic power in private hands. These goals implied
that other objecti ves such as creati on of employment opportuniti es, assisti ng the development of
small-scale and village and household industries, and protecti ng the consumer from the private
sector monopolies were also to be addressed.
10.6.2 Rural industrializati on and growth were seen to have major potenti al for producti on of goods
and services and for the generati on of employment of skilled, semi-skilled and unskilled labour.
The Industrial Policy Resoluti on of 1948 assigned this important role to the cott age and small scale
industries. In the Second Plan, the Mahalonobis strategy called for the rapid development of small
scale and cott age industries to meet the demand for consumer goods. Industrial Policy Resoluti on,
1956, also assigned a key role to the cott age, village and small scale industries for their disti nct
advantage in generati ng large scale employment and eff ecti ve mobilizati on of resources, capital
and skills.
10.6.3 Khadi and Village Industries Commission were set up in 1955 by an Act of Parliament. In
1978 the Districts Industries Centres were set up to provide services and support required by the
small and village entrepreneurs under a single roof. These services were to extend the provision
of raw material, supply of machinery and equipment, arrangement of credit faciliti es and helping
to set up marketi ng linkages.
The nomenclature used to address the smallest segments of industries in India has been varied,
namely, village and small industries, khadi and village industries, ti ny enterprises, micro-enterprises
etc. At the base are the rural manufacturing household enterprises – usually subsumed in the KVI
segment. The other units are disti nguishable in terms of their size of investment. It is to be noted
that the factories Act employs the use of power and the size of employment as defi ning criteria.
But India is again perhaps unique in defi ning its small scale industries (SSI) using investment
ceilings which have changed with ti me. The Micro, Small and Medium Enterprises Act, 2006 has
classifi ed the enterprises in the manufacturing and service sectors into three categories. The micro
enterprises in manufacturing are those having investment in plant and machinery of less than
Rs.25 lakhs and in services less than Rs.10 lakhs. Small scale industries are those with investments
between Rs.25 lakhs and Rs.500 lakhs in manufacturing and Rs.10 lakhs to 2 crorers in services. The
positi ve feature of this Act is that it recognizes a micro enterprise sector, but by clubbing it with the
small as well as the medium enterprises the chances of the benefi ts fl owing into the micro sector
301

MEGHALAYA STATE DEVELOPMENT REPORTMEGHALAYA STATE DEVELOPMENT REPORTMEGHALAYA STATE DEVELOPMENT REPORT
may be greatly reduced. The diff erence between cott age and village industries and SSI is in terms
of their absolute size and technological characteristi cs. However, a major diff erence between the
two is their links with the rest of the economy. The SSI industries are generally connected with the
large scale industries in terms of technical and input-output linkages.
10.6.4 The main advantages in favour of the unorganized manufacturing enterprises were
considered to be their labour intensive character, decentralized locati on and the ability to provide
varied products/services on a dispersed basis.
10.7. Availability of Insti tuti onal Credit
10.7.1 One of the key policy instruments to provide access to credit to the small industries was
the RBI directi ons on “priority sector” lending. The commercial banks were asked to advance 40
percent of their net bank credit to the priority sector. This included the small and ti ny enterprises
for which, however, no separate targets were specifi ed. In the case of co-operati ve banks the
priority sector lending was to be 60 percent. A large insti tuti onal structure was also created to
facilitate the fl ow of credit to this sector. There has clearly been a decline in the credit fl ow from
public sector banks and commercial banks to the SSI sector and to the ti ny enterprises, parti cularly
since the mid 1990s.
10.7.2. Micro Credit and SHGs
The potenti al of SHGs to develop as local fi nancial intermediaries to reach the poor has gained
recogniti on in India due to their community based parti cipatory approach and sustainability.
Recovery rates in micro-credit programmes have been signifi cantly higher than those achieved
by commercial banks in spite of loans going to poor, unorganized individuals without security or
collateral. At the all India level, the number of SHGs has increased from about 110 thousand in
1999-00 to over 2.2 million by the end of March,2006 and the volume of micro credit has increased
from Rs.1.9 billion to over Rs.114 billion during the same period. By March 2006, about 1.6 million
SHGs were formed under the SHG-Bank Linkage Programme. SHGs however, have shown uneven
regional growth. Till March, 2001, over 70 percent of SHGs were concentrated in the Southern
states.
The Government of India has four major public micro – credit programmes: Swayamsidha,
Swashakti , Rashtriya Mahila Kosh and SGSY. The Nati onal Bank for Agriculture and Rural
Development (NABARD) launched a scheme, linking the SHGs with banks, to augment the
resources of micro fi nance insti tuti ons. All the major categories of the banks, viz. commercial
banks, cooperati ve banks and regional rural banks are parti cipati ng in delivery of micro fi nance
services. Three disti nct linkage models are being followed. Under Model I, bank provide micro
fi nance to non-governmental organizati on for on-lending to the SHGs and ulti mately to the micro
302

MEGHALAYA STATE DEVELOPMENT REPORTMEGHALAYA STATE DEVELOPMENT REPORTMEGHALAYA STATE DEVELOPMENT REPORT
entrepreneurs. Under Model II, banks provide direct fi nancing directly to SHGs for on-lending to the micro entrepreneurs. Under Model III, banks fi nance directly to SHGs, for on-lending to micro entrepreneurs, with the interventi on of NGOs as social mobilisers and facilitators.
SHG MOVEMENT IN MEGHALAYAΩ
The seed for the self-help groups was sown since 1980, and it has grown. Presently there are more than 9000 SHGs in the state under various programmes and projects of the government and NGOs. Of these, 4644 SHGs have been linked to credit to banks as on March 2007. Out of the total 9395 SHGs formed in the State ti ll 2007-2008, (47.45 percent) were formed in West Garo Hills followed by East Khasi Hills with (12.65 percent), East Garo Hills with (13.51 percent) and the four other districts i.e. West Khasi Hills with (7.78 percent), Jainti a Hills with (7.42 percent), Ri Bhoi with(7.04 percent) and South Garo Hills with (4.16 percent) together consti tute 26.4 percent of the SHGs formed in the State (Table10.7).
Table10.7 District wise distributi on of SHGs in Meghalaya
District No (N) Percent (% to total)1 East Khasi Hills 1188 12.652 West Khasi Hills 731 7.783 Jainti a Hills 697 7.424 Ri Bhoi 661 7.045 West Garo Hills 4458 47.456 East Garo Hills 1269 13.517 South Garo Hills 391 4.16
Total 9395 100.00
A detailed survey8 fi ndings are under publicati on by the state Coordinator Dr. Shreeranjan, Smt. A.P Jyrwa and the team for the SHG which may be referred to for interested persons. The survey revealed that the enterprise profi le of the SHG members under survey showed that animal husbandry based acti viti es dominated the scene at (24.70 percent) at the overall level in all the seven districts followed by Trade and pett y business acti viti es which included grocery shops, tea shops, vegetable and food vendors stood at (19.73 percent), and thirdly by horti culture based acti viti es at (16.26 percent) and fourthly by agriculture based acti viti es consti tuted (14.68 percent) of the income generati ng acti viti es at the individual and group level. The skill oriented acti viti es such as weaving, craft s, pott ery tailoring embroidery was (10.81 percent) while the service based acti viti es like transport, repairs shops, schools, labour works, barbers, restaurants consti tuted (9.31 percent)
___________________
Ω Survey Report on SHG in Meghalaya: Shreeranjan & Smt. A.P. Jyrwa (2008)
303

MEGHALAYA STATE DEVELOPMENT REPORTMEGHALAYA STATE DEVELOPMENT REPORTMEGHALAYA STATE DEVELOPMENT REPORT
Summary of Tiny, SSI and ME enterprises in the state as on Dec. 2008 indicate 3925, 961
and 4 accounts respecti vely amounti ng Rs 145 crore, Rs 68 crore and Rs 9 crore disbursal of loans
in all.
10.8. Marketi ng
1.9 a major constraint faced by the unorganized enterprises is marketi ng of their products. The
lack of marketi ng faciliti es was identi fi ed as a major problem by a large proporti on of unorganized
enterprises, parti cularly so in rural areas. Marketi ng constraints arise from a number of inter-related
factors like lack of informati on about markets for products, capacity to exploit the existi ng markets
or to reach new markets, the scale of operati on or volume of producti on, and cost of undertaking
these operati ons. In the liberalized era, competi ti on from larger units is a major constraint and
this was noted parti cularly by the larger establishments in the urban areas. The Government has a
number of schemes to support marketi ng linkages for the small enterprises.
10.9. Cluster Development and Growth Poles
10.9.0 The experience of cluster approach has been found to be encouraging and successful in many
countries. The clusters are defi ned as a sectoral and geographical concentrati on of enterprises,
insti tuti ons, service providers and related regulatory bodies, engaged in the producti on of
homogeneous or inter-related products and faced with common opportuniti es and threats.
10.9.1 At a conceptual level, there are three kinds of clusters that one can visualize-relati vely
modern, small fi rm dominated industrial clusters that off er tend to be located in urban areas;
arti san and rural industry based clusters; and clusters that are based on the agro-economy. The
last two, parti cularly the last, tend to be natural resource-based. Most policy interventi ons have
focused on the fi rst of the three, rather than the last two.
10.9.2 There have been many att empts to identi fy industrial and service clusters following diff erent
approaches. UNIDO has compiled a list of 388 clusters of modern small industries. The Development
Commissioner, Small Scale Industries, has fi gure of 2042 clusters of small-scale industries. The
Entrepreneurship Development Insti tute (EDI), Ahmedabad, esti mates 3511 clusters, 1422 urban
and 1820 rural. Besides these SME (small and medium enterprise) clusters, there are 3332 arti san
clusters and 372 handloom clusters. The Department of Industrial Policy and Promoti on has a list
of 100 clusters identi fi ed for development. Several other ministries/departments including Small
Scale Industries, Agro & Rural Industries, Rural Development, Panchayati Raj, Commerce, Food
304

MEGHALAYA STATE DEVELOPMENT REPORTMEGHALAYA STATE DEVELOPMENT REPORTMEGHALAYA STATE DEVELOPMENT REPORT
Processing Industries, Texti les, Informati on Technology, as well as Science and Technology have their own cluster development programmes. Cluster development is also supported by a number of other agencies including the Small Industries Development Bank of India (SIDBI), Commissioner of Handlooms, Coir Board, Department of Science and Technology, State Bank of India, as well as numerous state governments.
At present the state of Meghalaya is having cluster on Eri-weaving at Ri Bhoi and Cane & Bamboo at Jainti a Hills.
10.10. Self-Employment Programme
Strategies, which promote self-employment and income growth of the self-employed, are important component of a pro-poor development strategy in India. Four major schemes launched by the Central Government to facilitate self-employed enterprise development through easing credit fl ow and other assistance are the Prime Minister’s Rojgar Yojana (PMRY)started in 1993, Rural Employment Generati on Programme (REGP) of the KVIC started in 1995, Swaranjayanti Gram Swarozgar Yojana (SGSY) of the Ministries of Rural Development started in 1999 and the Swaranjaynati Shahari Swarozgar Yojana (SSSY) of the Ministries of Urban Employment and Poverty Alleviati on since 1997, the later two being integrated to the previously existi ng self-employment schemes. PMRY and REGP has been subsumed under Prime Minister Employment Generati on Programme (PMEGP) from 15th of August, 2008. These programme are mainly in the nature of poverty alleviati on schemes, with the highest average investment of Rs.1 lakh-Rs.10 lakhs per enterprise being available in the PMRY. Some of them follow a group enterprise or the Self-Help Group formati on approach to enterprise development. These programme have made a signifi cant contributi on in not only enhancing income levels of the poor but have been helpful in stemming the rural and urban migrati on of the poor also. During the 10th Plan approximately 1.2 million projects were set up under PMRY and REGP programmes resulti ng in an additi onal employment of approximately 41 lakhs person years at present.
10.11. Department of Industries and Status of Schemes: The State Directorate of Industries caters to bring about a change in the industrial development of the state through following approach: 1. to create an “Industrial Atmosphere”; 2.To develop First Generati on Entrepreneurs; 3.To use Man & Material resources for the economic advantage of the State; 4. To create more job avenues and 5. for Balanced Industrial growth of the State.
Organisati onal Structure of the Industries Department is at the three levels. The secretariat level is for policy and programmes. Implementati on of policies and programmes are through the Directorate of Industries which is headed by the Director of Industries and at the district level district is looked aft er by the District Industries Centre under the leadership of the General Manager.
305

MEGHALAYA STATE DEVELOPMENT REPORTMEGHALAYA STATE DEVELOPMENT REPORTMEGHALAYA STATE DEVELOPMENT REPORT
The fi rst Industrial Policy of the State of Meghalaya was framed in 1988 and subsequently the second policy framework were under taken in 1997 in which the State Government off ered 30% Capital Investment Subsidy 4 % interest subsidy on term loan and power subsidy etc. The core aim of the State Industrial Policy is to ensure minimum of 60 % employment to local youths. Any unit not abiding by this 60% employment norm is not given any incenti ves from the State .This policy has been supplemented by the Govt. of India North Eastern Industrial Policy in 1997 which in fact has kick - started the rapid Industrial acti viti es in the State. The following fi gures will show the progress of Industrializati on before 1997 and aft er 1997.
Before 1997,
(A) SMALL SCALE SECTOR :: the Department has registered 2672 Nos of small scale units with an investment of Rs 1991.43 lakhs creati ng an employment opportuniti es to about 16933 persons.(B). Large and Medium : the State had only 1. M/S Mawmluh Cherra Cements Ltd inherited from the State of Assam. 2. Virgo Cements Ltd, Damas, East Garo Hills District and 3. M/S Jainti a Cements Ltd, Sutnga, Jainti a Hills District.
However aft er 1997 :
(A) SMALL SCALE SECTOR :: Aft er 1997 the Department has registered 3812 Nos of small scale units with an investment of Rs 7735.13 lakhs creati ng an employment opportuniti es to about 19815 persons.(B). Large and Medium : However in the Large and Medium Sector , I may inform the House that presently 116 nos of Industrial Units has been registered with an investment of Rs 73032.20 lakhs creati ng employment opportuniti es to about 5417 persons approximately.
During the period from 1997 to 2007 a large number of Industries decided to set up their Industries in the State of Meghalaya because of proacti ve administrati ve and excellent escort services provided by the State machinery. As a result of which Meghalaya became the second largest Industrialized State amongst the 8 (eight) North Eastern States. The multi nati onal company like Lafarge (India)
Cements Ltd has made Meghalaya as their investment desti nati on.
10.12. Prime Minister’s Employment Generati on Programme
Government of India has approved the introducti on of a new credit linked subsidy programme
called Prime Minister’s Employment Generati on Programme (PMEGP) by merging the two
schemes that were in operati on ti ll 31.03.2008 namely Prime Minister’s Rojgar Yojana (PMRY) and
Rural Employment Generati on Programme (REGP) for generati on of employment opportuniti es
306

MEGHALAYA STATE DEVELOPMENT REPORTMEGHALAYA STATE DEVELOPMENT REPORTMEGHALAYA STATE DEVELOPMENT REPORT
through establishment of micro enterprises in rural as well as urban areas. PMEGP will be a
central sector scheme to be administered by the Ministry of Micro, Small and Medium Enterprises
(MoMSME). At the State level, the Scheme will be implemented through State KVIC Directorates,
State Khadi and Village Industries Boards (KVIBs) and District Industries Centres (DICs) and banks.
The Government subsidy under the Scheme will be routed by KVIC through the identi fi ed Banks for
eventual distributi on to the benefi ciaries / entrepreneurs in their Bank accounts.
Objecti ves:
• To generate employment opportuniti es in rural as well as urban areas through setti ng up of
new self-employment ventures/projects/micro enterprises.
• To bring together widely dispersed traditi onal arti sans/ rural and urban unemployed youth and
give them self-employment opportuniti es to the extent possible, at their place.
• To provide conti nuous and sustainable employment to a large segment of traditi onal and
prospecti ve arti sans and rural and urban unemployed youth in the country, so as to help arrest
migrati on of rural youth to urban areas.
• To increase the wage earning capacity of arti sans and contribute to increase in the growth rate
of rural and urban employment.
Table 10.8 Year–Wise PMRY applicati ons sponsored, Sancti oned and Disbursed
Year Targets
Applicati ons
Sponsored Sancti oned Disbursed
Nos. Nos. Nos.
1 2 3 4 5
(93-94) 200 199 139 135
(94-95) 300 428 307 288
(95-96) 550 592 513 477
(96-97) 550 635 553 497
(97-98) 550 588 524 464
(98-99) 550 583 463 396
(99-00) 550 609 477 290
(00-01) 600 640 417 179
(01-02) 2000 1920 1466 1195
(02-03) 400 337 251 206
(03-04) 1350 1167 999 750
(04-05) 1400 1394 968 584
05-06) 1400 1484 1107 853
307

MEGHALAYA STATE DEVELOPMENT REPORTMEGHALAYA STATE DEVELOPMENT REPORTMEGHALAYA STATE DEVELOPMENT REPORT
(06-07) 800 821 627 475
(07-08) 400 446 283 209
Total 11500 11356 9094 6998
Source: Directorate of Industries, GOM
Table 10.9 STATUS OF PMRYYear Targets Applicati ons
Sponsored Sancti oned Disbursed
Nos.% sancti oned cases to cases
sponsoredNos.
% disbursed cased to cases
sancti oned
1 2 3 4 5 6 7
1.(03-04) 1350 1167 840 71.98 633 75.36
2.(04-05) 1400 1394 693 49.71 244 29.05
3.(05-06) 1400 1473 1107 72.57 1049 10.97
4.(06-07) 800 821 627 68.80 475 61.79
5.(07-08) 400 455 283 18.51 209 47.42
Total 5350 5444 3309 60.78 1936 58.51
Source: Directorate of Industries, GOM
Table 10.10 DISTRICT-WISE PERFORMANCE
Sl.No. Name of District Investment in Plant & Machinery( Lakhs) Employment(Nos)
1 East Khasi Hills 16034.95 6536
2 East Garo Hills 235.51 1808
3 West Khasi Hills 186.54 1307
4 West Garo Hills 262.68 959
5 Jainti a Hills 480.32 2902
6 Ri Bhoi 2396.84 1614
7 South Garo Hills 32.49 294
TOTAL 19629.33 15420
Source: Directorate of Industries, GOM
10.13. Technology Mission for Integrated Development Of Horti culture :The horti culture sector, which includes fruits, vegetables, spices, plantati on crops, fl oriculture, medicinal and aromati c plants, cashew nut, etc., has ample potenti al for development, as compared to other crops, in the the state in view of the diverse agro-climati c conditi ons, varied soil types and abundance of rainfall, which has remained unexploited.
The development of NE region examined by various Commissions and Committ ees recommended for integrated development of horti culture in a mission mode to foster rapid growth of the region. Based on these recommendati ons a Centrally Sponsored Scheme on Technology Mission for Integrated Development of Horti culture in North Eastern region including Sikkim, was approved
308

MEGHALAYA STATE DEVELOPMENT REPORTMEGHALAYA STATE DEVELOPMENT REPORTMEGHALAYA STATE DEVELOPMENT REPORT
by EFC and CCEA, has been launched from 2001-02. The Goals of the Mission are to establish convergence and synergy among numerous ongoing governmental programmes in the fi eld of horti culture development to achieve horizontal and verti cal integrati on of these programmes to ensure adequate, appropriate, ti mely and concurrent att enti on to all the links in the producti on, post-harvest management and consumpti on chain, maximise economic, ecological and social benefi ts from the existi ng investments and infrastructure created for horti culture development, promote ecologically sustainable intensifi cati on, economically desirable diversifi cati on and skilled employment to generate value additi on, promote the development and disseminati on of eco- technologies based on the blending of the traditi onal wisdom and technology with fronti er knowledge such as bio-technology, informati on technology and space technology; and to provide the missing links in ongoing horti culture development projects.
The Technology Mission has four Mini MissionsMini Mission - I Research: Coordinated and implemented by ICAR,.Mini Mission - II Producti on and Producti vity: Coordinated by DAC and implemented by the Agriculture / Horti culture Departments of the States.Mini Mission - III Post-harvest management, marketi ng and export: Coordinated by DAC and implemented by NHB, DMI, NCDC, NAFED and APEDA.Mini Mission - IV Processing: Coordinated and implemented by MFPI
The status of mini Mission IV has not been so encouraging in the past. There are only a few units under this mission.
10.14. State Government Corporati ons under Industry department: The Department of Industries headed by the Director of Industries in the State level and District Industries Centre at the District level. Apart from this the department is ably supported by State Corporati on and subsidiaries.
10.14.1 Meghalaya Industrial Development Corporati on Ltd.
Meghalaya Industrial Development Corporati on Ltd was incorporated under the Companies
Act 1956 in 1971. It is an agency for promoti on and developing industries in the state is performing
the dual task as
Industrial Development Corporati on (IDC)
State Financial Corporati on (SFC)
Apart from the loaning operati on and equity parti cipati on, the Corporati on has developed;
Industrial Areas, Industrial Estates, Export Promoti on Industrial Park (EPIP) and Industrial Growth
Centre in the state.
309

MEGHALAYA STATE DEVELOPMENT REPORTMEGHALAYA STATE DEVELOPMENT REPORTMEGHALAYA STATE DEVELOPMENT REPORT
10.14.2 Meghalaya Bamboo Chips Limited
Meghalaya Bamboo Chips Ltd was incorporated in 1979. The whole purpose was to make use
of the bamboo available in the region and thereby create Job Avenue in the state. Meghalaya
Bamboo Chips had to be closed in want of market in 1987. The Company was re-commissioned as
ceiling ti les manufacturing unit in the year 1992. The unit run for three years and had to shut down
in May1995 due to machine breakdown. It was re-started in 1999 aft er repairing of machine. The
unit produces ceiling ti les of various sizes and decorati on. Installed Capacity of the plant is 1000
pieces of ti les per day. There is huge demand of ceiling ti les in the enti re country. Producti on
started falling from 2005 onwards due to errati c power supply and age old machineries. The unit
is virtually closed and has applied for modernisati on support under NLCPR.
10.14. 3 Mawmluh Cherra Cement Limited (MCCL)
Mawmluh Cherra Cement Limited (MCCL) was incorporated in 1955.
The Plant was commissioned way back in November, 1966. Initi ally it started with one
kiln of 250 TPD. Presently the plant is in the process of expansion & modernisati on with
capacity to 930 TPD.
Presently the MCCL is undergoing modernizati on with considerable investment of more than Rs
85 crore.
10.14.4 Meghalaya Khadi & Village Industries Board
The Khadi & Village Industries Board in Meghalaya was established in the year 1975 under
the enabling clauses of the Meghalaya Khadi & Village Industries Board Act (last amended 1980). As
stated in the Act, the Board is “to provide for the bett er organizati on, development and regulati on
of Khadi and Village Industries in the State”.
The objecti ves of the Board are:
To encourage development of Khadi & Village Industries in the State.
To conduct training with a view to equipping them with the necessary knowledge for
starti ng their own village industry.
The Meghalaya Khadi & Village Industries Board (MKVIB), through the Rural Employment
Generati on Programme (REGP) extends fi scal benefi ts as Margin Money to the extent of
30 % of the Project Cost.
Table 10.11 Status of REGP
Project Finance (Nos) Project Cost (in crores) Employment Generated946 1065.36 7460
Informati on furnished by KVIB, Shillong
310
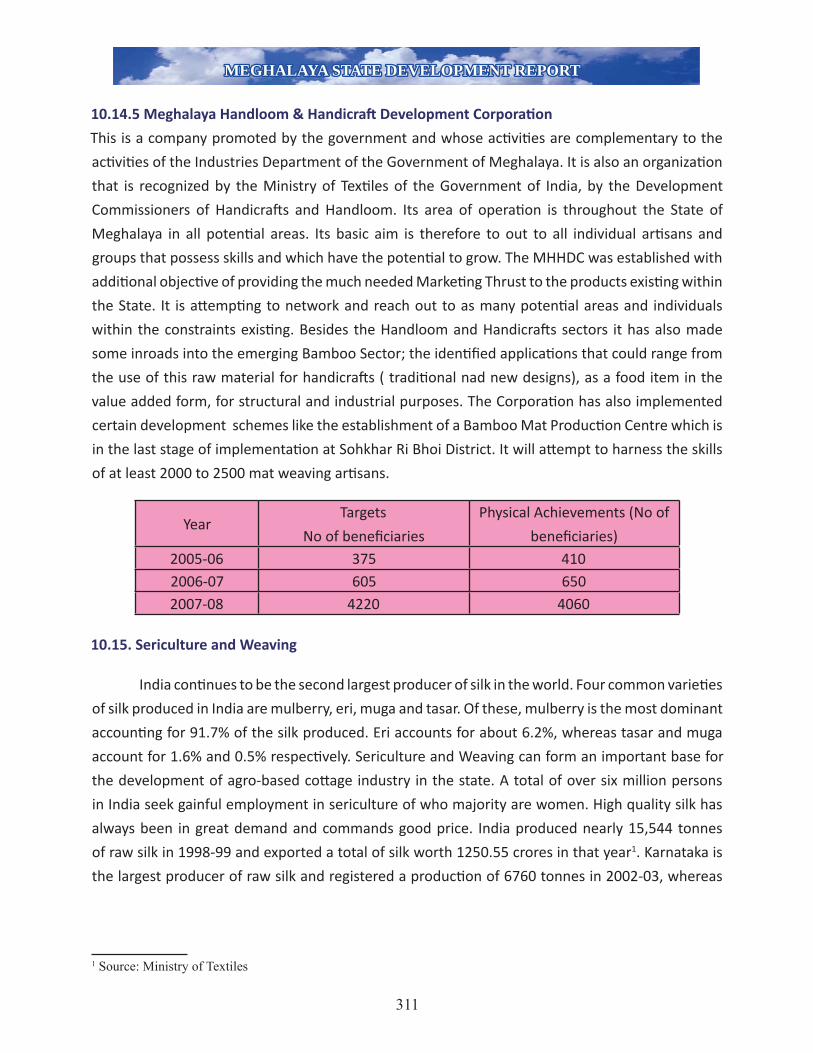
MEGHALAYA STATE DEVELOPMENT REPORTMEGHALAYA STATE DEVELOPMENT REPORTMEGHALAYA STATE DEVELOPMENT REPORT
10.14.5 Meghalaya Handloom & Handicraft Development Corporati on
This is a company promoted by the government and whose acti viti es are complementary to the
acti viti es of the Industries Department of the Government of Meghalaya. It is also an organizati on
that is recognized by the Ministry of Texti les of the Government of India, by the Development
Commissioners of Handicraft s and Handloom. Its area of operati on is throughout the State of
Meghalaya in all potenti al areas. Its basic aim is therefore to out to all individual arti sans and
groups that possess skills and which have the potenti al to grow. The MHHDC was established with
additi onal objecti ve of providing the much needed Marketi ng Thrust to the products existi ng within
the State. It is att empti ng to network and reach out to as many potenti al areas and individuals
within the constraints existi ng. Besides the Handloom and Handicraft s sectors it has also made
some inroads into the emerging Bamboo Sector; the identi fi ed applicati ons that could range from
the use of this raw material for handicraft s ( traditi onal nad new designs), as a food item in the
value added form, for structural and industrial purposes. The Corporati on has also implemented
certain development schemes like the establishment of a Bamboo Mat Producti on Centre which is
in the last stage of implementati on at Sohkhar Ri Bhoi District. It will att empt to harness the skills
of at least 2000 to 2500 mat weaving arti sans.
YearTargets
No of benefi ciaries
Physical Achievements (No of
benefi ciaries) 2005-06 375 4102006-07 605 6502007-08 4220 4060
10.15. Sericulture and Weaving
India conti nues to be the second largest producer of silk in the world. Four common varieti es
of silk produced in India are mulberry, eri, muga and tasar. Of these, mulberry is the most dominant
accounti ng for 91.7% of the silk produced. Eri accounts for about 6.2%, whereas tasar and muga
account for 1.6% and 0.5% respecti vely. Sericulture and Weaving can form an important base for
the development of agro-based cott age industry in the state. A total of over six million persons
in India seek gainful employment in sericulture of who majority are women. High quality silk has
always been in great demand and commands good price. India produced nearly 15,544 tonnes
of raw silk in 1998-99 and exported a total of silk worth 1250.55 crores in that year1. Karnataka is
the largest producer of raw silk and registered a producti on of 6760 tonnes in 2002-03, whereas
1 Source: Ministry of Textiles
311
MEGHALAYA STATE DEVELOPMENT REPORTMEGHALAYA STATE DEVELOPMENT REPORTMEGHALAYA STATE DEVELOPMENT REPORT
Andhra Pradesh with a producti on of 5650 tonnes was the second largest producer of raw silk in
India. In the North East however, Assam with a producti on of 574 tonnes is the largest producer 2.
Sericulture & Handloom Weaving are the two most important rural cott age based Industries
in the State. The sector is basically women oriented acti vity for providing self employment in the
rural areas. Rearing of Eri, Mulberry and Muga is traditi onally practi ced in the past and presently
by the rural people as a subsidiary Cott age Industry. The main programme in respect of Sericulture
Industry is to identi fy, increase and expand the plantati on areas of the existi ng Eri, Mulberry and
Muga in the individual holdings or community lands through development of systemati c and
economic plantati on of silkworm food plants with emphasis to enhance the producti vity per
unit area. It is also proposed to improve and strengthen the Departmental Farms and Centres
for suffi cient producti on of quality silkworm seeds for increasing the producti on of raw silk and
introducti on of scienti fi c rearing method of silkworms. Producti on of raw silk is anti cipated to be
increased from the present level of 339.50 MT to 394.13 MT.
Sericulture Farm:
The state inherited 6 sericulture farms from the eastwhile state of Assam. These included a
sericulture farm each at Shillong, Ummulong and Tura; a foreign race seed stati on at Moodymmai;
an Eri seed grainage at Nongpoh; a Muga seed farm at Resubelpara. In additi on it also inherited silk
reeling units at Shillong and Gangdubi. In 1984-85, the number of sericulture farms was reported
at 7 and covered an area of 37 hectares only. In 1985-86, the number increased to 8, the total
No. of farm as on 1993-94 stands at 25 nos. Although, the area covered by these farms grew
substanti ally to 172.96 hectares. There had been no change in the number of sericulture farms
or the area covered ti ll 1999-2000. In 2003-04, the area covered by the farms dropped to 130
hectares even though the number of farms has remained constant at 22 out of 25 nos.
Inadequate infrastructure with poor maintenance having under-developed and ageing
farms with technologically defi cient situati on has been accentuated by the fact that no new assets
of infrastructure has been created during the last 10 years in the state. Present infrastructure
in sericulture with the govt are: 9 Nurseries, 6 mulberry farms, 4 eri farms, 2 muga farms,88
Sericulture Extension Centres, and 1 State Level Sericulture Training Insti tute at Ummulong.
2Source: Statistical Abstract India 2003, Central Statistical Organisation, Ministry of Statistics and Program Implementation
312
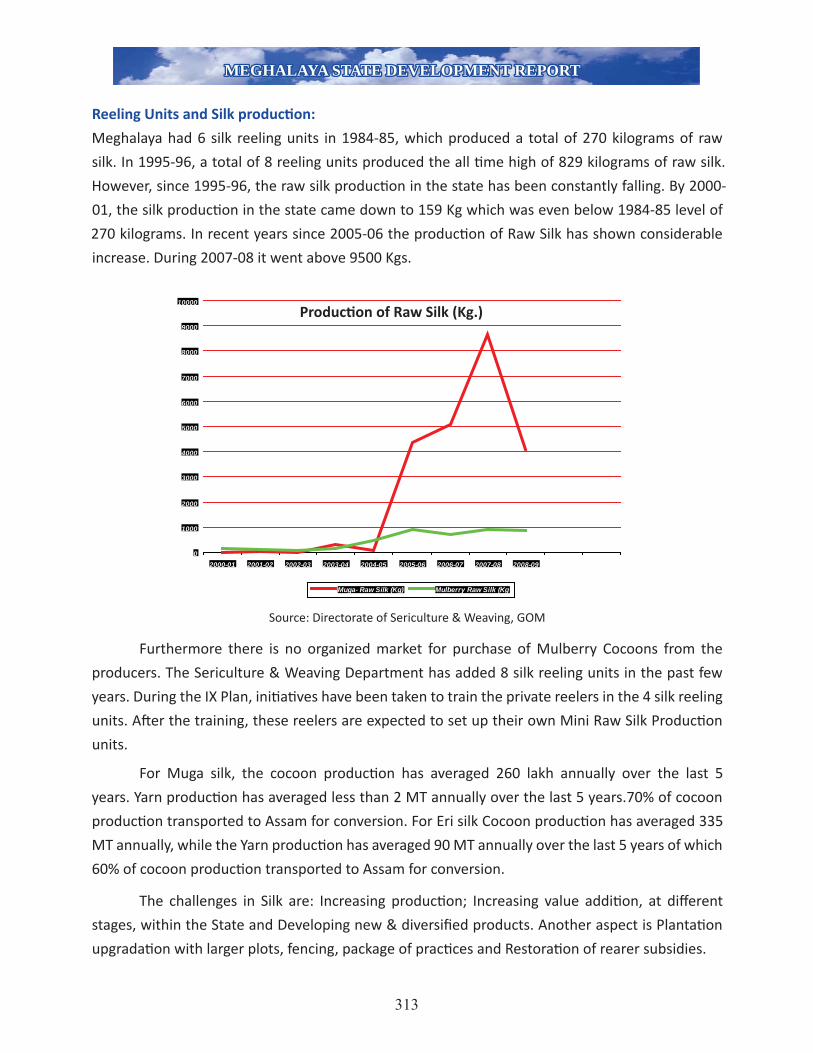
MEGHALAYA STATE DEVELOPMENT REPORTMEGHALAYA STATE DEVELOPMENT REPORTMEGHALAYA STATE DEVELOPMENT REPORT
Reeling Units and Silk producti on:
Meghalaya had 6 silk reeling units in 1984-85, which produced a total of 270 kilograms of raw
silk. In 1995-96, a total of 8 reeling units produced the all ti me high of 829 kilograms of raw silk.
However, since 1995-96, the raw silk producti on in the state has been constantly falling. By 2000-
01, the silk producti on in the state came down to 159 Kg which was even below 1984-85 level of
270 kilograms. In recent years since 2005-06 the producti on of Raw Silk has shown considerable
increase. During 2007-08 it went above 9500 Kgs.
Source: Directorate of Sericulture & Weaving, GOM
Furthermore there is no organized market for purchase of Mulberry Cocoons from the
producers. The Sericulture & Weaving Department has added 8 silk reeling units in the past few
years. During the IX Plan, initi ati ves have been taken to train the private reelers in the 4 silk reeling
units. Aft er the training, these reelers are expected to set up their own Mini Raw Silk Producti on
units.
For Muga silk, the cocoon producti on has averaged 260 lakh annually over the last 5
years. Yarn producti on has averaged less than 2 MT annually over the last 5 years.70% of cocoon
producti on transported to Assam for conversion. For Eri silk Cocoon producti on has averaged 335
MT annually, while the Yarn producti on has averaged 90 MT annually over the last 5 years of which
60% of cocoon producti on transported to Assam for conversion.
The challenges in Silk are: Increasing producti on; Increasing value additi on, at diff erent
stages, within the State and Developing new & diversifi ed products. Another aspect is Plantati on
upgradati on with larger plots, fencing, package of practi ces and Restorati on of rearer subsidies.
0
1000
2000
3000
4000
5000
6000
7000
8000
9000
10000
2000-01 2001-02 2002-03 2003-04 2004-05 2005-06 2006-07 2007-08 2008-09
Muga- Raw Silk (Kg) Mulberry Raw Silk (Kg
313
Producti on of Raw Silk (Kg.)

MEGHALAYA STATE DEVELOPMENT REPORTMEGHALAYA STATE DEVELOPMENT REPORTMEGHALAYA STATE DEVELOPMENT REPORT
Developing producti on, processing & market infrastructure; addressing the absence
of organized markets; disposal of cocoons in villages at price of traders; Dearth of technical
manpower (Only 35 PG diploma holders in Sericulture serving in the Department) with Enhancing
the managerial skills are some of the prioriti es requiring att enti on.
Sericulture Villages:
The current demand for raw silk exceeds its producti on. India imports large quanti ti es of silk for
manufacturing value added products to cater to export demand. Encouragement of sericulture
in the state can therefore provide gainful employment to thousands of people. However, the
state would also have to setup mechanism to assist the silk producers to lucrati vely dispose their
produce. Tourists oft en like to take back souvenirs from the places they visit. Tourism in the state
is all set to grow in the coming years. Setti ng up fair price shops in Shillong and other important
towns to showcase and sell the silk products can be of great help the silk-based cott age industry
in the state. This will however require training and capacity building to enable the weavers to
produce high quality silk products.
Handloom and weaving:
Meghalaya has established traditi ons of weaving with highly skill based and good workmanship.
There is strong traditi ons of cott on weaving, largely with traded yarn as there is low base of local
yarn, except in silk.
The State of Meghalaya has 25,000 weaver households, substanti ally working with
traditi onal looms & designs and catering to household and vicinity markets. Of these, 60% of
weaver households are in the Garo Hills and 90% of weavers are women. There are 8 producti on
centres, 32 demonstrati on-cum-producti on centres, 10 weaving training centres and 1 State
Level Handloom training Insti tute (Mendipathar, East Garo Hills).
The proposed programme for Handloom Weaving Industry is to intensify and step-up
producti on of quality handloom fabrics. The producti on is also sought to be increase by introducing
and supplying modern improved looms/accessories to weavers which would result in the increased
of producti on of Handloom Fabrics from the present level of 108.00 lakhs sq.mtrs in 2008-09 to
128.00 lakh sq. mtrs during 2009-10.
Additi onal training, demonstrati on & producti on centres ; Renovati on and replacement of
dilapidated and non-functi onal infrastructure; Strengthening of HTI Mendipathar with machinery
& equipment, improved looms, power looms, jacquards, CAD etc are urgent felt need.
314

MEGHALAYA STATE DEVELOPMENT REPORTMEGHALAYA STATE DEVELOPMENT REPORTMEGHALAYA STATE DEVELOPMENT REPORT
Local traditi ons of usage of indigenous & natural dyes need to be strengthened, and process
improvements are also required to be done. For this, training required on working with commercial
natural dyes and Specifi c designer support for natural dyes needs to be ti ed up.
Documentati on of traditi onal handlooms and Preparati on and disseminati on of extension
material are urgent felt need for the weavers.Dependence on Government supplies for yarn; Usage
of traditi onal looms, which need to be replaced by improved looms. and lack of opportunity of
exposure and study tours for weavers are some of the issues. Event based marketi ng opportuniti es
and Two handloom haats (State Government able to provide land) are some of the requirements.
Local lack of trained designers; arranging for Designer workshops; Short durati on att achment
of designers to State Level Insti tute; Projecti sed support from NID/ NIFT and Deputati on of
Departmental design staff to design insti tuti ons are also needed for giving boost to the sector.
10.16. Industrial Co-operati ves in Meghalaya:
Co-operati ves societi es are the insti tuti on, which makes it possible to organize resources on the
basis of mutual help and share benefi ts rather than exploiti ng one another.
The cooperati ve organizati on, which emerges as a result of voluntary associati on of individuals, in
terms of resources, is able to stand up to big private insti tuti ons for the furtherance of economic
and non-economic objecti ves. Cooperati on is therefore, conveniently suited to bring about the
desired socio-economic changes in the context of existi ng rural conditi on in the country.
This insti tuti on helps in eliminati ng un-wanted delay generally government procedure takes a lot
of ti me from fi lling, graft , administrati ve approval etc, which adversely aff ect the enterprising spirit
and enthusiasm of the people. As a result, there is litt le desire and will left with people to work
hard, to save and to invest.
In Meghalaya there are 39 Village Industrial Cooperati ve Societi es which are serving the commoners
in the society. They are engaged in various types of acti viti es with the Paid up share capital, volume
of business and working results shown at Appendix-VI.
10.16.1 Central Assistance to States for Developing Export Infrastructure (ASIDE)
Exports have come to be regarded as an engine of economic growth in the wake of
liberalizati on and structural reforms in the economy. A sustained growth in exports is, however,
not possible in the absence of proper and adequate infrastructure as adequate and reliable infrastructure is essenti al to facilitate unhindered producti on, cut down the cost of producti on and make our exports internati onally competi ti ve.
315

MEGHALAYA STATE DEVELOPMENT REPORTMEGHALAYA STATE DEVELOPMENT REPORTMEGHALAYA STATE DEVELOPMENT REPORT
While the responsibility for promoti on of exports and creati ng the necessary specialised infrastructure has largely been undertaken by the Central Government so far, it is increasingly felt that the States have to play an equally important role in this endeavour. The role of the State Governments is criti cal from the point of view of boosti ng producti on of exportable surplus, providing the infrastructural faciliti es such as land, power, water, roads, connecti vity, polluti on control measures and a conducive regulatory environment for producti on of goods and services. It is, therefore, felt that coordinated eff orts by the Central Government in cooperati on with the State Governments are necessary for development of infrastructure for exports promoti on. Department of Commerce currently implements, through its agencies, schemes for promoti on and facilitati on of export commoditi es and creati on of infrastructure att endant thereto. The Export Promoti on Industrial Parks Scheme (EPIP), Export Promoti on Zones scheme (EPZ), and the Criti cal Infrastructure Balancing Scheme (CIB) are also implemented to help create infrastructure for exports in specifi c locati ons and to meet specifi c objecti ves. However, the general needs of infrastructure improvement for exports are not met by such schemes. With a view, therefore, to opti mizing the uti lizati on of resources and to achieve the objecti ves of export growth through a coordinated eff ort of the Central Government and the States this scheme has been drawn up. The features of the Scheme and the Guidelines for considerati on of proposals in respect of the Scheme are given below:
Objecti ve
• The objecti ve of the scheme is to involve the states in the export eff ort by providing
assistance to the State Governments for creati ng appropriate infrastructure for the
development and growth of exports.
• States do not perceive direct gains from the growth in exports from the State. Moreover,
the States do not oft en have adequate resources to parti cipate in funding of infrastructure
for exports. The proposed scheme, therefore, intends to establish a mechanism for seeking
the involvement of the State Governments in such eff orts through assistance linked to
export performance.
Table 10.12 STATUS OF ASIDE SCHEME IN THE STATE
PARTICULARS PROJECTS TOTAL COST (in lakhs)Number of Projects Approved 29 NosTotal Project Costs Rs.9708.38Fund Received from Ministry of Commerce
Rs.3072.00
Fund Released to Implementi ng Agencies
Rs.2880.67
Amount required to complete the projects
Rs.6827.71
Source: Directorate of Industries, GOM
316

MEGHALAYA STATE DEVELOPMENT REPORTMEGHALAYA STATE DEVELOPMENT REPORTMEGHALAYA STATE DEVELOPMENT REPORT
10.17. Trade with Bangladesh The parti ti on of the country undoubtedly disrupted the age-old trade and communicati on within the state of Meghalaya. It abruptly stopped the free open trade with the districts of Sylhet and Mymensingh which became part of Bangladesh. In fact, the length of the internati onal boundary with Bangladesh is about 443 km. naturally; in order to ameliorate the conditi on of the people in the border areas and to rejuvenate the once prosperous economy special steps have been undertaken. Several old roads have been made functi onal to revive border trade. The land borders with Bangladesh are not only more accessible but also cost eff ecti ve from the point of view of internati onal trade. The importance and effi cacy of the land-routes have been recognized both by the Central and State Governments. Several of the land border points have been converted into Land Custom Stati ons along the internati onal borders between Meghalaya and Bangladesh. These Stati ons are not only used for trade but also act as custom check posts. According to the informati on provided by the offi ce of the Commissioner of Customs, Shillong, currently 17 Land Customs Stati ons (LCS) have been used for export and import purposes in the North Eastern Region. Out of these 17, as many as 8 LCSs are located in Meghalaya, 4 each in the Khasi-Jainti a Hills and the Garo Hills.
Nonetheless it may be noted here that the nature and extent of border trade cannot be properly ascertained for want of authenti c data either from offi cial or non-offi cial sources. The problem is essenti ally rooted in ways through which trades are carried on in diff erent parts of the region. The trade between the North Eastern Region and the neighbouring countries is broadly divided into two types-offi cial and unoffi cial. While the trading acti viti es through the offi cial channels are recorded at diff erent points, the unoffi cial trade is more oft en designated as illegal trade or simply trans-border smuggling. In view of this, it is convenient to ascertain the nature of commodity structure of export and import and the volume of offi cial trade being presently carried on in the state. There is another dimension to this problem. Although the land custom stati ons located in Meghalaya are mainly used for the export of raw materials and locally produced perishable items, it is diffi cult to esti mate how much of these commoditi es are exclusively produced within the state and then being exported to Bangladesh. Despite the diffi cult tasks involved in making a realisti c assessment about Meghalaya’s share in export trade of the country in general
and North East in parti cular.
Table 10.13 Export of Commoditi es for The Year 2005 – 2006
L.C.S. Commodity Quanti ty ValueDawki Coal 292313.6 Mt. 476211782.00Borsora 461026 Mt. 828959408.00Mahendraganj 5176 Mt. 9979032.00Ghasuapara 118080.8 Mt. 233616121.00Dalu 46399 Mt. 114263305.00
317

MEGHALAYA STATE DEVELOPMENT REPORTMEGHALAYA STATE DEVELOPMENT REPORTMEGHALAYA STATE DEVELOPMENT REPORT
Dawki Lime Stone 552 Mt. 140637.00Borsora 29475.26 Mt. 17371971.00Shella Bazar 110491 Mt. 28144829.00Bholaganj 221643.5 Mt. 74620658.00Dalu 504.7 Mt. 132980.00Shella Bazar Boulder Stone 8200 Mt. 2060455.20Mahendraganj Crushed Stone 5023 Mt. 3088745.00Mahendraganj Ginger 617 Mt. 4145566.00Dawki Orange 2246980 Nos. 2145691.00Dalu 20 Mt. 188580.00
Table 10.14 Export of Commoditi es for The Year 2006 - 2007
L.C.S. Commodity Quanti ty ValueDawki Coal 239138.584 Mt. 471834816.00Borsora 473528.85 Mt. 924223201.00Mahendraganj 3309 Mt. 6822234.00Ghasuapara 231499.4 Mt. 472683846.00Dalu 53363.4 Mt. 108107840.00Baghmara 2055.5 Mt. 3678777.00Dawki Lime Stone 6322.4 Mt. 1635279.00Borsora 125408.7 Mt. 32670466.00Shella Bazar 600975 Mt. 170551740.00Bholaganj 402961 Mt. 112958849.00Dalu 235.5 Mt. 63466.00Dawki Boulder Stone 531.9 Mt. 193507.00Bholaganj 530 Mt. 113585.00Mahendraganj 2000 Mt. 867583.00Dalu 200 Mt. 71840.00Mahendraganj Crushed Stone 1472 Mt. 1002849.00Mahendraganj Ginger 415 Mt. 2917209.00Gasuapara 21.126 Mt. 158202.00Dawki Tomato 6000 Kgs. 78000.00
DawkiRaw Hides And
Skins57 Mt. 1029360.00
318

MEGHALAYA STATE DEVELOPMENT REPORTMEGHALAYA STATE DEVELOPMENT REPORTMEGHALAYA STATE DEVELOPMENT REPORT
Table 10.15 Export of Agriculture and Horti cultural Produce during 2007-08 (Up to January)
( Value In Rupees )Dawki
1 Orange 2576530 Nos
1922395.102 Citrus Fruit 49080 Nos 71955.00Mahendraganj 1 Bamboo 177 Mt 126765.002 Ginger 155 Mt. 1120224.003 Tamarind 80 Mt. 267304.00 Total 3508643.10
Source: Commissioner, Customs, Government of Meghalaya
The present data reveals that items exported to Bangladesh from Meghalaya are mainly those which are available in the hills of the state. However, contrary to the general impression, the volume of export of horti cultural produce appears to be very limited. People living in border areas have been traditi onally culti vati ng crops such as oranges, bananas, betel nuts, betel-leaves, bay-leaf and selling them in border hats. The system was almost insti tuti onalized but as a result of numerous barriers and formaliti es imposed by the Governments on both sides of the border, these culti vators have their horti cultural crops but are deprived of smooth traditi onal markets. Under the conditi on, a sizeable secti on of these culti vators are using unoffi cial channels to export their products. Meghalaya thus primarily exports mineral and horti cultural products to Bangladesh which consti tute almost 90 percent of the total exports from North Eastern Region of the country. Coal and limestone, two major mineral products are found in southern belt of Meghalaya and conveniently exported through the land custom stati ons located at Dawki, Borsora, Mahendragang, Baghmara, Gasuapara, Dalu, and Mankachar along Meghalaya-Bangladesh border. In fact there exists a complementarily between the resource base of the hills of Meghalaya and the nearby plains of Bangladesh. A cement factory at Chhatak in Bangladesh, for instance, fully depends on Meghalaya for limestone. Likewise, the tea gardens, jute mills and brick-manufacturing units in Bangladesh largely depend on coal mined in Meghalaya.
10.18 Land Custom Stati ons (LCSs) in Meghalaya:
The State of Meghalaya has 10 (ten) Land Custom Stati ons which plays a signifi cant role
in the economy of all the North Eastern states including the state of Meghalaya. This is because
of the fact that in many cases, goods originati ng in one state fi nds its way to the neighbouring
countries through another state. All these Land Custom Stati ons are along the Indo-Bangladesh
border. These are:-
319

MEGHALAYA STATE DEVELOPMENT REPORTMEGHALAYA STATE DEVELOPMENT REPORTMEGHALAYA STATE DEVELOPMENT REPORT
Sl. No. Name of LCS with locati onFuncti onal
/Non-Functi onal
Counter part LCS in
Bangladesh1. Borsora, West Khasi Hills Functi onal Borsora2. Dawki, Jainti a Hills Functi onal Tamabil3. Gasuapara, South Garo Hills Functi onal Karaituli, Gobrakura4. Shella Bazar, East Khasi Hills Functi onal Chatak5. Dalu, West Garo Hills Functi onal Nakugoan6. Bholaganj, East Khasi Hills Functi onal Chatak7. Mahendraganj, West Garo Hills Functi onal Dhanua Kamalpur8. Baghmara, South Garo Hills Functi onal Bijoypur9. Balat, East Khasi Hills Non-Functi onal Dalura10. Ryngku, East Khasi Hills Non-Functi onal Sonamgunj
In additi on, The State has proposed for opening 3 (three) more LCSs with Bangladesh, viz.,
1. Kuliang, Jainti a Hills, 2. Maheshkhola, South Garo Hills, and 3. Iew Thymmai, East Khasi Hills.
10.19. Problems of the LCSs in Meghalaya: The common major problems faced by the LCSs in
Meghalaya are as highlighted below:-
320

MEGHALAYA STATE DEVELOPMENT REPORTMEGHALAYA STATE DEVELOPMENT REPORTMEGHALAYA STATE DEVELOPMENT REPORT
10.20. Reasons for Weak Resource Industry Linkage in the State
a. Brief Overview of Resource Base
In the absence of steady growth in the manufacturing sector, questi on of sustainability of overall
growth appears to be a major concern for the economic policy makers in the state. Meghalaya have
highlighted the weak industrial base and its nuances from the perspecti ve of the North Eastern
Region. The state has a strong resource base including land, forest, water and mineral resources
(coal, lime-stone, clay etc).
It receives the highest rainfall in the world. The average annual rainfall in the state is about
2050 mm with 200 rainy days in a year. The physical feature of the state causes high surface runoff .
There are a number of waterfalls and rivers fl owing in the state. As a result, Meghalaya has a large
hydro electricity potenti al, esti mated to be about 3000 MW. Currently only 186.71 MW is being
tapped, which accounts for nearly 6% of the total potenti al. Per capita consumpti on of electricity
of the state is as low as 192.81 KWH.
The state also has sizeable deposits of many important minerals. Uranium and other
radioacti ve minerals are found in various parts of the state with esti mated reserves of around
13.5 million tones. The Uranium deposits at Domiasiat in West Khasi Hills are of a higher grade
than some of the best grade uranium currently being exploited in the country. Though exploratory
mining of this strategic mineral was carried out, mining acti viti es could not commence amidst
protests by the local over environmental and health concerns. Meghalaya has substanti al reserves
of coal having low ash content and a very high calorifi c value. The producti on of coal in the last 25
years has shown a tremendous growth from 59 thousand tones in 1975-76 to 4060 thousand tones
in 1999-2000. But most of the extracted coal is being exported without any value additi on.
b. Weak Resource Industry Linkage
Even though the resource base of the state provides immense potenti al for setti ng up of wide range
of industries and manufacturing units, the level of industrializati on is low when compared with
the nati onal level. Three decades of planning has led to some improvements in the basic physical
infrastructure of the State, but not adequate enough to usher a structural change in the economy.
The physical achievements have fallen short of goals. Investments for industrial development have
been almost non-existent. As a consequence the contributi on of industry to the NSDP has remained
virtually stagnant.
The low credit-deposit rati o of Commercial Banks (39%) and Regional Rural Banks (36.94%)
at the end of June 2006 has also contributed to the slow pace of development in the State.
321

MEGHALAYA STATE DEVELOPMENT REPORTMEGHALAYA STATE DEVELOPMENT REPORTMEGHALAYA STATE DEVELOPMENT REPORT
Market imperfecti ons such as lack of informati on regarding the availability of products, available technologies, size of market, etc. has produced undesirable results. Ignorance has been a major hindrance in the economic growth. People with surplus capital prefer to invest in property and vehicles and shy away from risky ventures. Spirit of entrepreneurship is very low in the state. Moreover, complex land tenure system has hampered the infl ow of private investments from other parts of the country.
c. Politi cal Economy of Weak Resource Industry Linkages The industrial backwardness can also be traced from the peripheral locati on of this region in relati on to nati onal market. Moreover, the parti ti on of the country has made the region land locked and deprived it of the traditi onal channels of communicati on and positi oned. This has raised the transportati on cost substanti ally, which in turn has made most of the producti on acti viti es in the state non competi ti ve. The region’s loss of market in the erstwhile East Bengal, now Bangladesh, has not been compensated in terms of either the growth of a regional market within the region or a strong integrati on with the nati onal market. The region is exposed to the backwash eff ects of nati onal development and hence been experiencing some form of de-industrializati on in the post independence era. This lack of access to market has been one of the main causes for under uti lizati on of the available resources as well as weak resource-industry linkages in the region. In this regard, the development of border trade may provide encouragement to the industry in the state. (A detailed discussion on the potenti al of border trade appears in Chapter 12 – Border Area Development).
Apart from the economic factors some socio politi cal factors also act as reagent in the transformati on of trade capital to industrial capital. One such factor is the politi cal environment both internal and external. The internal politi cal stability in the state is oft en threatened by the subversive group of people. Anti investment climate is oft en accentuated by the lack of confi dence of the locals toward outsiders and a sense of uncertainty in the minds of potenti al investors. Further, illegal trading of mineral and forest produce to the neighbouring Bangladesh being more lucrati ve from the short run perspecti ve, acts as a deterrent to investment in the organized industrial sector.
d. Lack of Entrepreneurship “Entrepreneurial orientati on to rural development, contrary to development based on bringing in human capital and investment from outside, is based on sti mulati ng local entrepreneurial talent and subsequent growth of indigenous companies. This in turn would create jobs and adds economic value to a region and community and at the same ti me keeps scarce resources within the community. To accelerate economic development in rural areas, it is necessary to increase the supply of entrepreneurs, thus building up the criti cal mass of fi rst generati on entrepreneurs (Petrin, 1992)”.
322

MEGHALAYA STATE DEVELOPMENT REPORTMEGHALAYA STATE DEVELOPMENT REPORTMEGHALAYA STATE DEVELOPMENT REPORT
Entrepreneurship is not a new concept; today it is considered to be a prime mover in development.
That is why nati ons, regions and communiti es that acti vely promotes entrepreneurship development;
demonstrate much higher growth rates and consequently higher levels of development than
nati ons, regions and communiti es whose insti tuti ons, politi cs and culture hinder entrepreneurship.
An entrepreneurial economy, whether on the nati onal, regional or community level, diff ers
signifi cantly from a non-entrepreneurial economy in many respects, not only by its economic
structure and its economic vigorousness, but also by the social vitality and quality of life which it
off ers with a consequent att racti veness to people.
In Meghalaya Entrepreneurship Development is much more important as because the
law of the land demand so. Land is not easily transferable in the state. There are also certain
restricti ons in granti ng licenses or permits to the outsiders. Therefore, non-resident entrepreneurs
tend to enter into partnerships with locals. While the outside entrepreneur is in de-facto control of
the aff airs of the enterprise by making all the investment, the local partner’s contributi on is limited
to the off ering of premises and obtaining necessary licenses and permits. This kind of arrangement
inhibits the development of entrepreneur skills among the local populati on. Furthermore, even
the outside entrepreneurs view such arrangements as fraught with risk and thus siphon out of the
state any profi t and surplus from such enterprise.
10.21. Potenti al areas for investments
• Knowledge Outsourcing Opportuniti es – the youth from Meghalaya has proved its worth
in the IT/ITES industry in places like Bangalore and other IT based desti nati ons, Meghalaya
can pitch for investments in this area.
• Travel and Tourism in NE India - the most undiscovered place on planet earth is ripe
from eco and cultural tourism from foreign tourists. With increase in propensity to spend
domesti c tourism requires greater att enti on.
• Export Texti le and Craft Opportuniti es - the opportunity is big but global markets are
unaware of what is available. Furthermore most products need to be adjusted to meet the
tastes of foreign markets.
• Outsource of Natural Talents - Music, graphic arts, fi lm, animati on and English writi ng
are a few of the strengths of the people of NE India. Once this talent to global standards
they can provide these services to customer anywhere. This will create jobs and allow this
talent to be the best they can be while living with their family in Meghalaya, India.
• Horti cultural Ideas - This is the land of milk and honey where anything grows including
fl owers, spices, fruits, tea, coff ee, exoti c seed and medicinal plants. Organic farming, ti ssue
culture and other opportuniti es exist.
323

MEGHALAYA STATE DEVELOPMENT REPORTMEGHALAYA STATE DEVELOPMENT REPORTMEGHALAYA STATE DEVELOPMENT REPORT
• Mineral base- Systemati c exploitati on of mineral resources and converti ng into value
added product should be thought about instead of sending it as a raw material.
A liberalized State Industrial policy with att racti ve fi scal incenti ves and subsidies along
with the NEIIPP 07 has made investment in the State a high yielding propositi on. Meghalaya
has declared a comprehensive IT Policy, Tourism Policy and Power policy off ering opportuniti es
for new business ventures. The State has bright prospects for agro-processing and horti culture,
mineral based industry, power, tourism and health care, medicinal plants, pharma etc. In order
to boost exports, the Government provides industrial infrastructure and special export incenti ves
to industrial units. Meghalaya with its wealth of mineral deposits is a storehouse of industrial
potenti al. There are extensive deposits of coal, limestone, granite, clay, quartz, uranium and other
minerals.
10.22. Future Plan for Next 4 Years (11th Plan)
The Department of Industries, Government of Meghalaya, desires to focus on the following to
achieve during the current 11th fi ve year plan.
Industrial Policy being review
Entrepreneurship Development Programme
Strengthening of MIDC / MKVIB / MHHDC
Cluster Approach
Food Park
Creati on of New Industrial Estates
Expansion of Growth Centre by 146 Hectares
Development of Extended Export Promoti on Industrial Park (EPIP)
All weather roads to LCS
Promoti on of SEZ
The thrust areas are: Agro- Horti based ; Bio-resource and technology based such as Tissue culture,
Medicinal plant & other essenti al oils; Pharmaceuti cals;Mineral based ; Electronics, IT and IT
related acti vity; processing- tea, rubber, Meat ;and Other non polluti ng industry
10.23. Observati ons
A state like Meghalaya, with its rich resources has unlimited potenti al to att ract investment, but needs
able hand to do the aggressive marketi ng. The state in itself is small both in size and populati on and
has limited local market for goods and services produced by industry, will need to be innovati ve to
develop industry. Various global models of industrial and manufacturing development have been
att empted; some of these have been parti cularly successful. The successful examples are found in
324

MEGHALAYA STATE DEVELOPMENT REPORTMEGHALAYA STATE DEVELOPMENT REPORTMEGHALAYA STATE DEVELOPMENT REPORT
the East Asian countries namely- Korea, Malaysia, Japan, Taiwan, Thailand, Chile and in some other countries. The success has been possible mainly due to the adopti on of the following policies:
• Development Bank support was acti vely provided to local entrepreneurs at concessional rates.
• Development Bank support was not unconditi onal but was ti ed up to the entrepreneur following a re-structuring, technology up-gradati on, fi nancial and organizati on management plan. Funds were released in installments and only when agreed milestones had been achieved by the industry.
• Financial assistance was ti ed to export of goods and services produced. In order to make the industry fi nancially viable, government support was provided through well thought and industry specifi c subsidies, which could be either in the form of concessional fi nance, tax holidays or direct cash doles.
The state government, aft er a detailed analysis of potenti al industries could adopt some of the successful models in the world. It is a fact that fi nancial constraints, lack of data and poor surveys of the region are some of the inhibiti ng factors that eff ect the industrial growth in the state. Meghalaya is pivoti ng its E-Governance and industrial development around the web portals at state, district and block level but, the irony is that these portals have outdated data. Industry and minerals were given a back seat in budget allocati ons in the state. This is because of no proper ground work and research work done on the industrial front; no concrete industrial policy is available. The prospect of industrializati on depends to a large extent on the availability of raw materials, skilled personnel, unskilled labour, easy communicati on and other infrastructural faciliti es. It is for these reasons that industrializati on of the state is sti ll at nascent stage with few sprinkling of mineral based industries. Planning for development requires more precise knowledge about quality and quanti ty of available resources. The transiti on from resource potenti al to uti lizati on of reserves is aff ected through a sequence of explorati on and probing. In Meghalaya, only a small fracti on of mineral resources of the region have been probed so far. It must be understood that private capital plays a criti cal role for progress in the state. Although private capital is no panacea it is a criti cal component for economic progress and dynamism. Higher levels of private investment are essenti al to generate producti ve employment, raise producti vity and improve technology and the work culture. Despite announcements of several policy statement, the Centre is less likely, or has been less able to increase public expenditure in order to remove infrastructural bott lenecks. The bulk of capital that will be required to improve supply responses in the region will ulti mately have to come from private rather than government sources. Private investment has powered the growth of Industry in the last few years in other parts of the country. The recent announcement of North East Industrial & Investment Promoti on Policy (NEIIPP) 2007 and the state’s industrial policy (1997* under revision) alone will not prompt private investment to pour in. What is more urgently required is an enabling environment so that investments become lucrati ve and returns become assured. Once appropriate market conditi ons are created, private investment will automati cally rush in. Therefore, att racti ng private capital should be given the highest priority.
If the correct policies are pursued, the region will be able to improve its economy. Under a new economic strategy, private investment should be viewed as the criti cal component. But, fi rst of all, the state has to become investor-friendly. To encourage private investment, policy makers
325

MEGHALAYA STATE DEVELOPMENT REPORTMEGHALAYA STATE DEVELOPMENT REPORTMEGHALAYA STATE DEVELOPMENT REPORT
have to focus on infrastructure (both hard and soft ), land and labor policies and substanti al improvements in the law and order situati on. Secondly, the geographical proximity of the region to the dynamic Southeast Asian economies can be uti lized if bold policies are initi ated both by the State governments as well as by the Centre.
Suggesti on 1: Accountability• Set up monitoring units resourced with adequate budgetary allocati ons to periodically
hold review meeti ngs and annually convene. Members should consist of representati ves from government and civil society.
• Allocate resources for social monitoring of all schemes and for building the capacity of the monitoring team.
Suggesti on 2: Infrastructure: • State should have more funds for infrastructure development.• Conti nuous up gradati on of human resource development & conti nuous fl ow of technical
experti se support system.• Road communicati on should be upgraded as per All India level.• Proposed power generati on should be implemented at the earliest.
Suggesti on 3: State Support Services:• State to provide access to credit faciliti es• Post harvest technology should be passed on to down stream level.• State to undertake responsibility in marketi ng products by SHGs• More Urban Hut should be constructed for marketi ng rural products.• In view of the focus given to border trade with neighboring countries, special economic
Zone(SEZ) should be created in all states of NE Region
Suggesti on 4: Development & Environment: • Consti tute a people’s Committ ee of repute to monitor and guide ongoing implementati on
and interventi ons in other developmental works where needed.• Consti tute a policy to protect Common Property Rights to Resources like water, land &
forests. • Protect existi ng forests and promote micro hydro electricity projects.
Suggesti on 5: Entrepreneurship: • In present scenario entrepreneurs play a vital role in insti gati ng social and economic change,
hence there is an urgent need of planned and systemati c eff ort to promote and develop entrepreneurship. Technocrats, Graduates, Women, Business-man should be encouraged to take up entrepreneurship. For that matt er state should have Entrepreneurship Development Insti tute (EDI).
• “Entrepreneurship” should be introduced as one of the compulsory subject in X-plus two.• Special emphasis should be given to generate women entrepreneurs.Suggesti on 6: Poverty/Employment/Infrastructure and Social Security • Term BPL should be Redefi ned to suit today’s context• Provide identi ty cards for all workers in unorganized sector. • Establish a single window informati on system
326

MEGHALAYA STATE DEVELOPMENT REPORTMEGHALAYA STATE DEVELOPMENT REPORTMEGHALAYA STATE DEVELOPMENT REPORT
Some other Key Recommendati ons include: • Make women more visible in agricultural policy, as they are the majority workers. Support
them with policy and programme support, focusing on their access to land, decision-making and property rights
• Implement a need-based minimum wage • Frame comprehensive labour policy legislati on for the unorganized Sector
Appendix-I List of Large & Medium Industries in the State
Sl.No
Name of Unit Items of ManufactureInvestment
made (Rs in lakhs)
Employment Generated
1 M/s Greystone Ispat Ltd Torsteel 180 47
2 M/s Maithan Smelters Ltd Ferro Alloys 935 81
3 M/s Byrnihat Ispat (P) Ltd Integrated Steel Plant, Ferro Alloys 117 23
4 M/s Gita Ferro Alloys (P) Ltd Ferro Alloys 249 0
5 M/s Shyam Century Ferro Alloys Ltd Ferro Alloys 976 43
6M/s Meghalaya Carbide & Chemicals (P) Ltd
Calcium Carbide, Ferro Alloys 323 27
7 M/s Adhunik Meghalaya Steels (P) Ltd Ferro Alloys 1182 58
8 M/s Commercial Iron & Steel (P) Ltd M.S. Ingots 139 28
9 M/s Bharm India (P) Ltd C.I. Mould, M.S. Ingots, Sponge Iron 147 30
10 M/s Meghalaya Steels LtdM.S. Ingots, Re-Rolling and Ferro Alloys
214 47
11 M/s Trishul Hitech Industries TMT Bars & Coil, M.S. Ingots 232 25
12 M/s Anirudha Steel (P) LtdM.S. Ingots, Ferrous & Non Ferrous Casti ng
113 23
13 M/s Nalari Ferro Alloys (P) Ltd Ferro Alloys 395 42
14 M/s Meghalaya Sova Ispat Alloys Ltd Ferro Alloys 496 0
15 M/s Trikuta Ferro Alloys (P) LtdFerro Alloys, M.S. Ingots, Re-Rolling Mill
500 62
16 M/s Meghalaya Alloys Ltd Integrated Steel Plant, Ferro Alloys 194 25
17 M/s Nezones Industries Ltd G.I. Pipes 283 28
18 M/s Nezones Alloys Ltd Ferro Silicon 450 40
19 M/s Greystone Smelters Ltd Steel melt unit 235 35
20 M/s Meghalaya Mineral Product Re-Rolling Mill 259 30
21 M/s Khasi Alloy Ltd Ferro Alloys 330 26
22 M/S Purbanchal Alloys Ltd Ferro Alloys 990 45
23 M/S Kamakshi Ispat (P) Ltd M.S Ingots 139 28
24M/s R.N.B. Minerals & Chemicals (P) Ltd
Alum, Ferrous, Non ferrous 146.22 30
327

MEGHALAYA STATE DEVELOPMENT REPORTMEGHALAYA STATE DEVELOPMENT REPORTMEGHALAYA STATE DEVELOPMENT REPORT
25M/s R.N.B. Carbides & Ferro Alloys (P) Ltd
Carbides, Ferro Alloys 101.43 40
26 M/s Sesami Chemicals (P) Ltd Carbide & Ferro Alloys 126.57 20
27 M/S Riangdo Veneer (P)Ltd Steel Tubular Poles 125.49 30
28 M/s Jainti a Ferro Alloys (P) Ltd M.S. Ingots, Ferro Silicon 147.02 77
29 M/s Megha Ispat (P) Ltd M.S. Ingots, Ferro Silicon 372.96 75
30 M/s Jainti a Alloys (P) Ltd M.S. Ingots 117.15 48
31 M/s Satyam Steel (P) Ltd M.S. Ingots 120 50
32 M/s Shivam Ispat & Alloys (P) Ltd M.S. Ingots 130.5 35
33 M/s Shivani Ispat (P) Ltd M.S. D. Bars, Flats etc 137.5 32
34 M/s Bimla Ispat (P) Ltd M.S. Ingots 129 30
35 M/s Pawan Ispat (Meghalaya) (P) Ltd M.S. Ingots 132.64 60
36 M/s Shree Ganapati Rolling Mills Rolling of Missroll & S.D. Bar 159 71
37 M/s Meghalaya Cast & Alloys (P) Ltd M.S. Ingots, Runner Risers 140 60
38 M/s Pioneer Carbide (P) Ltd Ferro Silicon, Calcium Carbide 174 40
39 M/s Shree Sai Rolling Mills (P) Ltd Rolling of M.S. Bar, Flats, Angles 259.19 44
40 M/s Shree Sai Smelters (P) Ltd M.S. Ingots, M.S Runners, 199.17 50
41 M/s Shree Sai Megha Alloy (P) Ltd M.S. Ingots, M.S Runners, Risers 225 45
42 M/S Shillong Ispat & Rolling Mill (P) Integrated Steel Plant (M.S. Re-rolled Products/M.S Ingots)/Ferro Alloys
249 40
43M/s Pawan Casti ngs (Meghalaya) Pvt. Ltd, Harlibagan, Byrnihat, Ri Bhoi.
M.S Re-Rolling Mill 276 40
44M/S Sai Prakash Alloys (P) Ltd,13th Mile, Byrnihat, Ri Bhoi.
Ferro Alloys 175 50
45 M/S Jai Kamakhya Alloys (P) Ltd Integrated Steel Plant 249 40
46 M/S Satyam Alloys (P) Ltd Ferro Alloys 864 40
47 M/S Satya Megha Ispat (P) Ltd Ferro Alloys & M.S Ingots 964 45
48 M/S Kushi Metals (P) Ltd M.S Re-Rolling Mill 276 40
Total 15073.84 1925
Lime Stone Mining/Crushing Plant: 4 Nos
1M/S Megha Technical & Engineers (P) Ltd, Lumshnong, Khliehriat, Jainti a Hills.
Lime Stone Mining/Crushing Plant 500 40
2M/S Meghalaya Minerals & Mines Ltd, Lumshnong, Jainti a Hills District.
Limestone Mining & Crushing 236 21
3M/S Lummawshun Minerals (P) Ltd, Shella, East Khasi Hills
Limestone Mining 560 55
4M/S Komorrah Limestone Mining Co. Ltd, Shella, East Khasi HIlls, Meghalaya
Limestone Mining 500 220
Total 1796 336
328

MEGHALAYA STATE DEVELOPMENT REPORTMEGHALAYA STATE DEVELOPMENT REPORTMEGHALAYA STATE DEVELOPMENT REPORT
Foods : 12 Nos
1 M/s J. G. Spices (P) Ltd Oil Oleoresins 239 38
2 M/s NERAMAC Ginger Oil 110 0
3 M/s Regett a Food Products Meat Processing 110 15
4 M/s N.R. Roller Mills Att a, Suji Flour, Brand 100.48 19
5 M/s Hindustan Coca Cola (P) Ltd Soft drinks 2058 181
6 M/s K.K. Beverages (P) LtdPackaged Drinking Water & Carbonated Drinks
150 22
7M/S Shree Sarvamayee Products (P) Ltd, Baridua, Amerigog, Ri Bhoi.
Food Grain Processing, Grading and Nutri Food Unit.
158 20
8M/S Megha Agro Industries, Byrnihat, Ri Bhoi.
Ginger Oil & Tumeric Powder 450 30
9M/S Mahabir Foods Ltd, Byrnihat, Ri Bhoi District
Biscuit Plant 366 28
10 M/S Shiromoni Foods Products (P)Ltd Food Grain Grading 90 20
11M/s N.R. Foods, Them Marwet, Khanapara, Ri Bhoi District.
Manufacture of Bakery Products 80 30
12M/S A.A. Nutriti on’s, Baridua, Ri Bhoi District.
Noodles 147 27
Total 3831.48 373
IMFL : 3 Nos
1 M/S MDH Beverages (P) Ltd IMFL Bott ling Plant 150 45
2 M/s North East Bott ling (P) Ltd Rum, Whisky, Brandy. 140 19
3M/S Milestone Beverages (P) Ltd, 13th Mile, G. S. Road, Byrnihat, Ri Bhoi.
IMFL Bott ling Plant 199.94 35
Total 489.94 99
Coke : 2 Nos
1M/S Abhi Coke (P) Ltd, Ladrymbai, Jainti a Hills District.
Low Ash Metallurgical Coke 310 30
2M/S Jainti a Coke (P) Ltd, Khalaria Hat, Jainti a Hills District.
Low Ash Metallurgical Coke 446 40
Total 756 70
Informati on Technology : 2 Nos
1 M/S S.S. Netcom (P) Ltd ISP 133 50
2M/S Anderson Computers (P) Ltd, Lachumiere, Shillong, East Khasi Hills.
Computer Soft ware & Services Export Business.
150 35
Total 283 85
HDPE Bags : 4 Nos
1M/S Seven Sisters Plasti cs (P) Ltd, Amjok, Umtru Road, Byrnihat.
HDPE /PP Woven Bags 457.5 25
329

MEGHALAYA STATE DEVELOPMENT REPORTMEGHALAYA STATE DEVELOPMENT REPORTMEGHALAYA STATE DEVELOPMENT REPORT
2M/S Umadutt Industries Ltd, Amjok, Byrnihat, Ri Bhoi.
Manufacture of H.D.P.E. Bags (Polymer Woven Sacks)
681.9 30
3 M/s Marak Plasti c (P) LtdPPH woven Sacks, PPH woven Fabrics
106 45
4M/S Megha Plast (P) Ltd, Byrnihat, Ri Bhoi.
HDPE Bags 128 35
Total 1373.4 135
Others : 31 Nos
1Anderson Biotech (P) Ltd, Mawlai Mawiong, Shillong
Organic Manure 128 26
2 M/s Mati z Metals (P) Ltd Copper rods 106 0
3 M/s Byrnihat Oxygen (P) Ltd Industrial Oxygen Gas 105 20
4M/s Kakarania Innovati ves Systems (P) Ltd
PackagingPolythene Items 331.5 15
5 M/s Forbes Aqua Mall Water Purifi er Aquaguard 110 30
6 M/s North East Power Line (P) Ltd D.G. Sets, Pump Sets 145 25
7 M/s Foto Industry Camera Photographic 120 25
8 M/S Synergy Composites (P) Ltd Saw & Bamboo Dust Pannels 120.6 48
9 M/s Omni Agate System (P) LtdEnergy Meters, Electrical Components
270 40
10 M/s Colortek Meghalaya (P) Ltd Cosmeti cs 104.8 30
11 M/S Meghalaya Ispat Ltd G.C. Sheet, G.P. Sheet, G.P. Coil 416.5 80
12 M/s Timpack (P) LtdBamboo Mat Boards Corrugated Sheet & Parti cle Board
116.1 85
13 M/s York PrintPrinted Cartons Corrugated boxes Leafl ets Packing Materials
388.09 46
14M/s Godrej Saralee Ltd Mosquito Repellent Coils ,Mats
Refi lls149.92 64
15M/S Utkarsh Trexim (P) Ltd, 15th Mile G.S. Road, Ri-Bhoi.
KitchenShutt ers/Panel Doors/Laminated Lumber Board/Wooden Floorings/Allied Products
479 25
16M/S Jai Plastech (P) Ltd, Rajabagan, Byrnihat, Ri-Bhoi.
Plasti c Disposable Glass Cups & Plates
138 20
17 M/S Dynaroof (P) Ltd, Byrnihat, Ri -hoi.Colour Coated Cold Forming Profi le Sheets
144.02 30
18M/S Meghalaya Bitchem (P) Ltd, Byrnihat, Ri-Bhoi.
Cati onic Bitumen Emulsion for Roads 112 25
19M/S Oxford Packaging (P) Ltd, 9th Mile Baridua, Ri -Bhoi District.
Corrugated Boxes and Packaging Materials
65 45
20M/S Umadutt Industries, Amjok, Umtru Road, Byrnihat, Ri-Bhoi.
Foam Manufacturing Unit 228 40
330

MEGHALAYA STATE DEVELOPMENT REPORTMEGHALAYA STATE DEVELOPMENT REPORTMEGHALAYA STATE DEVELOPMENT REPORT
21M/S G.R. Industries, 10th Mile, Village Mawsmai, Ri Bhoi District.
Manufacture of Plasti c Ropes, Plasti c Sulti
531 25
22M/S Anabond Limited 9th Mile, G.S Road, Baridua, Ri-Bhoi District.
Adhesive and Sealants 160 30
23M/S Surya Alloys Industries (P) Ltd, Tamulkuchi, Byrnihat, Ri-Bhoi
Railway track Materials and Wagon Components
278 35
24M/S Brahmaputra Wire Products (P) Ltd
Wire Drawing 130 25
25 M/S Byrni Steels (P) LtdM.S. Black Wire & GI Wire, Steel fabricati on & Transformer Assembling & repairing
120 20
26 M/S Ishan Technologies (P) Ltd Machines Mosquito coils & Mats 1700 30
27 M/S Meghalaya Feed Products Animal Feed 120 26
28M/S Byrnihat Springs Ltd, Byrnihat, Ri-Bhoi.
Railway Track Fitti ngs 439 30
29M/S Milestone Concrete (P) Ltd, Kharkutt a, Bajengdoba, East Garo Hills.
Stone Crushing 144.02 50
30M/S Simsang Lime Products (P) Ltd, Mendipathar, East Garo Hills.
Lime & Allied Products 6320.51 45
31M/S Capricon Stone Products, Dainadubi/Resubelpara.
Stone Crushing 141.03 48
Total 13861.09 1083
Appendix-II Status of Large & Medium Industries
Sl.No. Year Number of Unit (s)Investment made
(Rs in lakhs)
Employment
Generated1 1966-1967 1 2500 6622 1972-1973 1 500 2203 1997-1978 1 225 454 1998-1999 4 2430.5 2355 1999-2000 3 513 1376 2001-2002 10 5086.65 4967 2002-2003 19 4534.95 7468 2003-2004 16 5136.06 6269 2004-2005 16 24571.9 689
10 2005-2006 18 4239.97 65611 2006-2007 10 12750.6 45412 2007-2008 14 10254 43313 2008-2009 3 1016.5 75 Total : 116 73759.13 5474
331

MEGHALAYA STATE DEVELOPMENT REPORTMEGHALAYA STATE DEVELOPMENT REPORTMEGHALAYA STATE DEVELOPMENT REPORT
Appendix-III Status of District wise Industries from 2001-2008
Sl.No Name of District
Manufacturing,
Assembling &
Processing
Repairing &
MaintenanceServicing
Total
investment
1 2 3 4 5
19629.33
1 East Khasi Hills 1127 41 942 East Garo Hills 343 - 93 West Khasi Hills 214 27 864 West Garo Hills 100 11 755 Jainti a Hills 219 14 636 Ri Bhoi 147 8 247 South Garo Hills 53 12 23 TOTAL 2203 113 374 19629.33
Sl.No Name of District Proprietory Partnership Pvt.Comp1 2 3 4 51 East Khasi Hills 1266 - -2 East Garo Hills 352 - -3 West Khasi Hills 325 4 West Garo Hills 150 - -5 Jainti a Hills 290 6 Ri-Bhoi 140 2 377 South Garo Hills 88 TOTAL 2611 2 37
Sl.No Name of District SSI SSSBE Ancillary1 2 3 4 51 East Khasi Hills 1067 197 -2 East Garo Hills 327 25 -3 West Khasi Hills 210 117 -4 West Garo Hills 98 52 -5 Jainti a Hills 237 59 -6 Ri-Bhoi 119 41 17 South Garo Hills 67 27 - TOTAL 2125 518 1
332

MEGHALAYA STATE DEVELOPMENT REPORTMEGHALAYA STATE DEVELOPMENT REPORTMEGHALAYA STATE DEVELOPMENT REPORT
Appendix-IV Employment Generated by the SSI Units
Sl.NO Name of the DistrictInvestment in Plant &
Machinery (in lakhs)Employment (in Nos)
1 East Khasi Hills 16034.95 65362 East Garo Hills 235.51 18083 West Khasi Hills 186.54 13074 West Garo Hills 262.68 9595 Jainti a Hills 480.32 29026 Ri-Bhoi 2396.84 16147 South Garo Hills 32.49 294
Total 19629.33 15420
Appendix-V Trend of SSI unit in the State
Year Number of Unit set up2001-2002 2662002-2003 2682003-2004 3232004-2005 4682005-2006 4592006-2007 4652007-2008 404
Total 2653
Appendix-VI SERICULTURE RESOURCES
Sl. NO Parti culars Meghalaya 1 Mulberry reeling cocoons in (`000 Kg) 21.43 2 Tasar reeling cocoons in lakh NA 3 Eri cut cocoons (`000 Kg) 422.54 4 Muga reeling Cocoons in lakhs 289.91
Source – Director of Stati sti cs & Economics, Meghalaya 2005
333

MEGHALAYA STATE DEVELOPMENT REPORTMEGHALAYA STATE DEVELOPMENT REPORTMEGHALAYA STATE DEVELOPMENT REPORT
ANNEXURE VII
LIST OF FOREST BASED UNITS : UMIAM INDUSTRIAL AREA, RI-BHOI DISTRICT
UNITS EXISTING AND FUNCTIONING : 12 NOS
Sl.
No.Name of the Unit
Area
(in Acres)
Nature of Industrial
Acti viti es
Installed
Capacity
(p.a)
Investment
on Plant &
Macineries
(Rs in Lakhs)1. M/s Saini Timber Industries 0.37 Saw Mills 9000 CUM 15.002. M/s Vishal Industries 0.98 Saw cum Veneer Mills 8400 CUM 8.003. M/s Riangdo Veneer (P) Ltd 0.75 Saw cum Veneer Mills 7500 CUM 27.00
4.M/s Shillong Veneer Products
cum Saw Mills1.20 Saw cum Veneer Mills 8400 CUM 25.00
5.M/s M.N. Saw cum Veneer
Mills0.74 Saw cum Veneer Mills 8500 CUM 25.00
6. M/s Eastern Saw Mills 0.75 Saw cum Veneer Mills 8500 CUM 25.007. M/S Domina Pathaw Saw Mill 0.45 Saw Mills 8000 CUM 20.00
8.M/S Vikash Saw Cum Veneer
Mill0.74 Saw cum Veneer Mill 8500 CUM 25.00
9. M/s S.K. Dewsaw Saw Mills 0.37 Saw Mills 8000 CUM 20.0010. M/s Marbaniang Saw Mills 0.37 Saw Mills 8500 CUM 25.0011. M/s Timber Craft s 1.48 Saw cum Veneer Mills 12000 CUM 51.3512. M/s Meghalaya Forest Product 0.74 Saw Mills 8500 CUM 25.00
ANNEXURE VIII INDUSTRIAL ESTATE , KHLIEHTYRSHI, JAINTIA HILLS DISTRICT.SL.
NO.
Name & Address of the Entrepreneurs
allott ed Shed/LandActi vity Shed/Plot No.
Area Allott ed
(in Sqm)
Present Status
of the Unit
1 2 3 4 5 6
1. Shri W. Passah, New Hill, Jowai. Saw Mill Plot No 3 3880.74 Functi oning
2.Shri Monis Lyngdoh, Ladthalaboh,
Jowai.Saw Mill Plot No 1 1498.01 Not yet started
3.Shri T. Shangpung, Wahsynnah,
Ummulong.Saw Mill Plot No 2 1503.06 Not yet started
4.Shri Johnti ng Dhar, Khliehkhum,
Narti angSaw Mill Plot No 4 1676.36 Functi oning
5.Shri Niece N.Nongrum M/S Priyang
Saw Cum Veneer Mill
Saw Cum
Veneer
Mill
Plot yet to be
identi fi ed3000.00 Functi oning
334

MEGHALAYA STATE DEVELOPMENT REPORTMEGHALAYA STATE DEVELOPMENT REPORTMEGHALAYA STATE DEVELOPMENT REPORT
ANNEXURE IX DETAILS OF INDUSTRIAL ESTATE AT MAWIABAN, NONGSTOIN.
(Year of Establishment 1989)
Total Area : 12 acres.
Sl. No Name of the Industrial Units. Shed/Area
occupiedNature of Industrial
Act.Installed
Capacity (P.A.)
Investment on plant and machineries
(in Lakhs)
1. M/s Santi na Sohshang, Saw cum Veneer Mill. 3000 Sqm Saw cum Veneer Mill. 8400 CUM Rs.9,50,000/-
2. M/s Krosswell Marngar, Saw cum Veneer Mill & Plywood Mill. -do- Saw cum Veneer Mill &
Plywood Mill. 9000 CUM Rs.9,00,000/-
3. M/s Shally Lyngdoh Saw Mill. 1500 Sqm Saw Mill. 8500 CUM Rs.8,90,000/-
4. M/s Dadak Shyrkon, Saw & Veneer Mill. 3000 Sqm Saw & Veneer Mill. 8000 CUM Rs.9,50,000/-
5. M/s Mawshynrut Saw cum Veneer Mill. -do- Saw cum Veneer Mill. 9000 CUM Rs.9,60,000/-
6. M/S T.S. Nongkynrih Saw Mill -do- Saw cum Veneer Mill. Yet to be implemented -
7. M/S Sohpdang Saw Mill -do- Saw cum Veneer Mill. Yet to be implemented -
8. M/S Nongrum Timber Mill -do- Saw cum Veneer Mill. Yet to be implemented -
9. M/S Riang Saw Cum Veneer Mill -do- Saw cum Veneer Mill. Yet to be implemented -
Appendix X Status of Land Custom Stati ons in the State
DATA OF EXPORT / IMPORT UPTO THE MONTH OF MARCH,2008DIVISION : SHILLONG ( EXPORT )
( VALUE IN RUPEES )L.C.S. : DAWKI ( EXPORT )
1 COAL 331855.060MT 599993713.992 LIME STONE 5922.000 MT 1308622.713 RAW HIDES AND SKINS 423.000 MT 6577002.004 QUICK LIME 44MT 113997.005 QARTZ STONE 20.000 KGS 11002.006 ORANGE 3008230 NOS 2254035.107 CITRUS FRUIT 51120 NOS 74327.00 TOTAL 610332699.80
L.C.S. : BORSORA ( EXPORT )1 COAL 582248.25MT 1077833971.402 LIME STONE 61685 MT 15870724.14 TOTAL 1093704695.54
335

MEGHALAYA STATE DEVELOPMENT REPORTMEGHALAYA STATE DEVELOPMENT REPORTMEGHALAYA STATE DEVELOPMENT REPORT
L.C.S. : SHELLA BAZAR ( EXPORT )1 LIME STONE 564006 MT 166134853.372 SHALE 83341MT 12777499.90 TOTAL 178912353.27
L.C.S. : BHOLAGANJ ( EXPORT )1 LIME STONE 341125 MT 96804991.01 TOTAL 96804991.01
DIVISION : DHUBRI ( EXPORT )L.C.S. : MAHENDRAGANJ ( EXPORT )
1 COAL 1040 MT 1819475.002 BAMBOO 191 MT 136007.003 BROKEN OR CRUSHED STONE 328 MT. 198854.004 GINGER 155 MT. 1120224.005 TAMARIND 80 MT. 267304.006 BOULDER STONE 229 MT. 103584.00 TOTAL 3645448.00
L.C.S. : GASUAPARA ( EXPORT )1 COAL 186233.3MT 356768995.00 TOTAL 356768995.00
L.C.S. : DALU ( EXPORT )1 COAL 50718.505 MT 116500621.80 TOTAL 116500621.80
L.C.S. : BAGHMARA ( EXPORT )1 COAL 5863.030 MT 9936988.98 TOTAL 9936988.98
DAWKI(IMPORT)1 FOOD/ EDIBLE ITEMS 149764 TOTAL 149764.00
L.C.S. MAHENDRAGANJ ( IMPORT )1 SYNTHETIC NET FABRICS 406.548 MT 39109324.002 COTTON WASTE 793.500 MT 4481345.003 READYMADE GARMENTS 9205 PCS 123247.004 FLOAT GLASS 145969.952 SQMT. 13643484.00 TOTAL 57357400.00
L.C.S. DALU ( IMPORT )1 READYMADE GARMENTS 167394 PCS 2664825.002 BLEACHING POWDER 31 MT. 157352.00
336

MEGHALAYA STATE DEVELOPMENT REPORTMEGHALAYA STATE DEVELOPMENT REPORTMEGHALAYA STATE DEVELOPMENT REPORT
3 SYNTHETIC NET FABRICS 28780KGS 2496665.00 TOTAL 5318842.00
EXPORT / IMPORT DIVISION - WISE ( Value in Rupees )
SL.
NO
DIVISIONEXPORT IMPORT
1 SHILLONG 1979754739.62 149764.00
Sources: Commissioner Customs, Meghalaya, Shilong
APPENDIX XI
337
Items exported from Meghalaya (India )to Bangladesh
through the Land Customs Stations of Meghalaya :Value in Rs. Crore
180.06180.06190.42190.42240.01 240.01 202.704 202.704 185.89185.89151.24 151.24 Total Total
0.410.411.06 1.06 0.60 0.60 0.14 0.14 0.96 0.96 Other miscellaneous Other miscellaneous goods goods
.41.413.383.381.88 1.88 3.52 3.52 1.73 1.73 1.19 1.19 Agricultural and Forest Agricultural and Forest produce produce
.23.231.251.251.31 1.31 1.19 1.19 1.37 1.37 0.96 0.96 FruitsFruits
0.350.350.18 0.18 0.004 0.004 0.16 0.16 0.11 0.11 Fish/Dry fish/ other Fish/Dry fish/ other animal products like animal products like raw hides skin/ poultry raw hides skin/ poultry feed etc. feed etc.
171.41171.41185.03185.03235.58 235.58 197.39 197.39 182.49 182.49 148.01 148.01 Mineral productsMineral products(Coal, Limestone)(Coal, Limestone)
20052005--060620042004--050520032003--040420022002--030320012001--020220002000--0101

MEGHALAYA STATE DEVELOPMENT REPORTMEGHALAYA STATE DEVELOPMENT REPORTMEGHALAYA STATE DEVELOPMENT REPORT
APPENDIX XII
APPENDIX XIII
Ex port V olume from M eghalaya to Export V olume from M eghalaya to B angladesh B angladesh visvis--aa--visvis N ER Export:N ER Export:
0.0050.00
100.00150.00200.00250.00300.00350.00400.00450.00500.00
2000-01 2001-02 2002-03 2003-04 2004-05 2005-06
Rup
ees
in C
rore
s
E ntire Nort h E as t Region Ex port F rom M eghalay a
Exports (Rs. Crore):
Year wise Export from the LCS of Meghalaya
020406080
100
Dawki
Borsora
Shella
Baz
ar
Bholag
anj
Mahen
dragan
j
Ghasu
apara Dalu
Bagmara
LCS
Valu
e in
Rs.
Cro
res
2000--01 2001-02 2002-03 2003-04 2004-05 2005-06
338

MEGHALAYA STATE DEVELOPMENT REPORTMEGHALAYA STATE DEVELOPMENT REPORTMEGHALAYA STATE DEVELOPMENT REPORT
339
ME
GH
AL
AYA
STA
TE
DE
VE
LO
PME
NT
RE
POR
TM
EG
HA
LAY
A S
TAT
E D
EV
EL
OPM
EN
T R
EPO
RT

App
endi
x-XI
VSt
atus
of C
oope
rati v
e So
ciet
y of
Meg
hala
ya
STAT
EMEN
T SH
OW
ING
TH
E LI
ST O
F V
ILLA
GE
IND
UST
RIA
L CO
OPE
RATI
VE
SOCI
ETIE
S
Sl.
No.
Nam
e O
f The
Coo
perati
ve
Soci
ety
Regi
strati
on N
o. &
Dat
ePa
id U
p Sh
are
Capi
tal
Busi
ness
Tur
n O
ver
Dur
ing
The
Last
3 Y
ears
Wor
king
Res
ults
Dur
ing
The
Last
3 Y
ears
Indi
vidu
alG
ovt.
Tota
l20
05-0
620
06-0
720
07-0
820
05-0
620
06-0
7
12
34
56
78
910
11
Wes
t Kha
si H
ills
Dis
tric
t1
New
Non
gsto
in W
omen
Bo
ok D
epot
Cum
Typ
ing
Shor
than
d Sc
hool
Indu
s-tr
ial C
oop.
Soci
ety
Ltd.
Non
g.2
of 1
998,
Dt 2
7.8.
1998
1,32
,450
2,70
,000
4,02
,450
8,15
,629
5,34
,032
6,25
,517
(+)
11,4
50.0
0(+
) 9,
784.
00
2N
ongs
toin
Tai
lori
ng In
dus-
tria
l Coo
p.So
ciet
y Lt
d.N
ong.
19 o
f 198
2,D
t 15.
9.19
821,
32,3
2183
,500
2,15
,821
333,
745
5,90
.830
1,98
,009
(+)
8568
.87
(+) 8
446
3N
ongs
iejli
eh S
awm
ill C
oop.
So
ciet
y ;L
td.
Shill
.17
of 1
978,
D
t 5.8
.197
813
,560
50,0
0063
,560
67,7
094,
27,8
106,
65,2
20(+
) 578
(+)
29,8
16.0
04
Maw
iong
Wom
en T
ailo
ring
In
dust
rial
Coo
p. S
ocie
ty
Ltd.
No.
Non
g.1/
93,
Dt.
15.4
.93
16,3
202,
77,0
002,
93,3
20-
1,82
,000
2,00
,000
(+) 5
8,12
0(+
) 844
5
5Ph
lang
kyns
hi C
arpe
ntry
In-
dust
rial
Coo
p.So
ciet
y Lt
d.N
o.N
ong.
2 of
199
0,
Dt.
18.
2.19
9010
,900
1,30
,000
1,40
,900
94,9
6096
,735
1,40
,000
(+) 2
,708
(+) 2
516
6D
ofei
Com
pute
r Ce
ntre
A
nd In
dust
rial
Coo
p.So
ci-
ety
Ltd.
No.
Non
g.1/
2005
/24,
Dt.
7.4.
2005
18,0
001,
40,0
001,
58,0
00-
1,26
,100
1,69
,300
(+) 7
5,65
0(+
) 19,
372
ME
GH
AL
AYA
STA
TE
DE
VE
LO
PME
NT
RE
POR
TM
EG
HA
LAY
A S
TAT
E D
EV
EL
OPM
EN
T R
EPO
RT
340
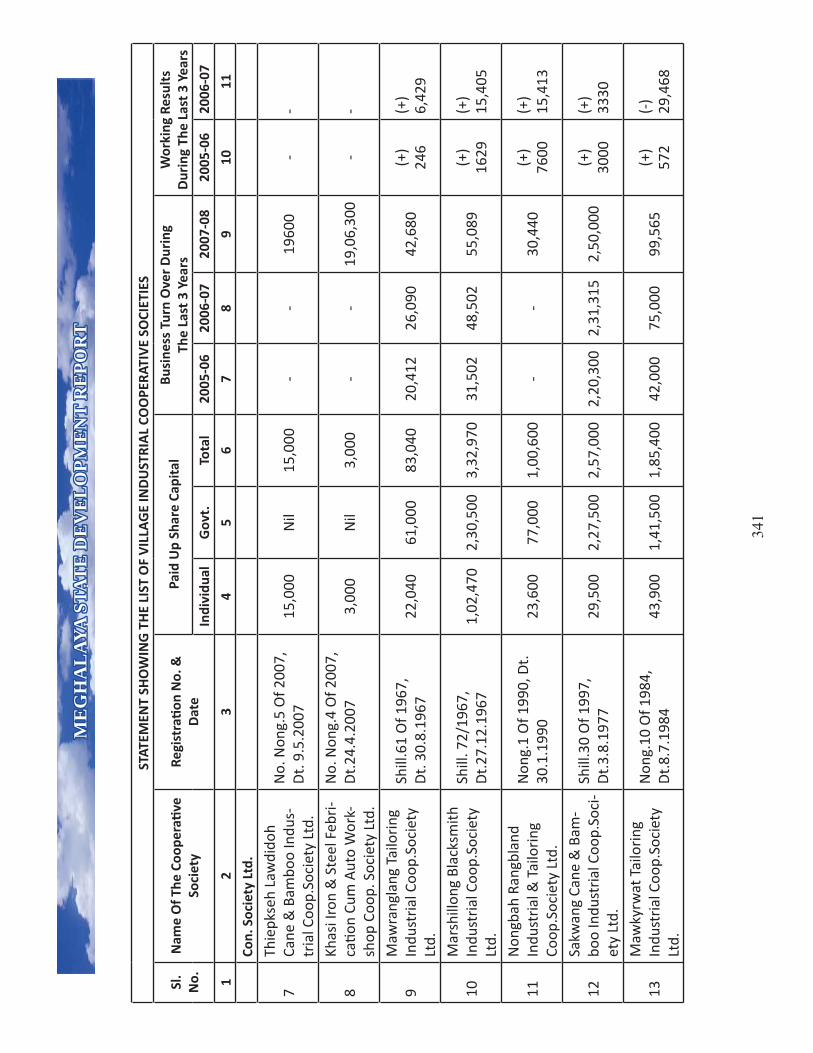
ME
GH
AL
AYA
STA
TE
DE
VE
LO
PME
NT
RE
POR
TM
EG
HA
LAY
A S
TAT
E D
EV
EL
OPM
EN
T R
EPO
RT
341
STAT
EMEN
T SH
OW
ING
TH
E LI
ST O
F V
ILLA
GE
IND
UST
RIA
L CO
OPE
RATI
VE
SOCI
ETIE
S
Sl.
No.
Nam
e O
f The
Coo
perati
ve
Soci
ety
Regi
strati
on N
o. &
Dat
ePa
id U
p Sh
are
Capi
tal
Busi
ness
Tur
n O
ver
Dur
ing
The
Last
3 Y
ears
Wor
king
Res
ults
Dur
ing
The
Last
3 Y
ears
Indi
vidu
alG
ovt.
Tota
l20
05-0
620
06-0
720
07-0
820
05-0
620
06-0
7
12
34
56
78
910
11
Con.
Soc
iety
Ltd
.
7Th
iepk
seh
Law
dido
h Ca
ne &
Bam
boo
Indu
s-tr
ial C
oop.
Soci
ety
Ltd.
No.
Non
g.5
Of 2
007,
D
t. 9
.5.2
007
15,0
00N
il15
,000
--
1960
0-
-
8Kh
asi I
ron
& S
teel
Feb
ri-
cati o
n Cu
m A
uto
Wor
k-sh
op C
oop.
Soc
iety
Ltd
.
No.
Non
g.4
Of 2
007,
D
t.24
.4.2
007
3,00
0N
il3,
000
--
19,0
6,30
0-
-
9M
awra
ngla
ng T
ailo
ring
In
dust
rial
Coo
p.So
ciet
y Lt
d.
Shill
.61
Of 1
967,
Dt.
30.
8.19
6722
,040
61,0
0083
,040
20,4
1226
,090
42,6
80(+
)24
6(+
)6,
429
10M
arsh
illon
g Bl
acks
mith
In
dust
rial
Coo
p.So
ciet
y Lt
d.
Shill
. 72/
1967
, D
t.27
.12.
1967
1,02
,470
2,30
,500
3,32
,970
31,5
0248
,502
55,0
89(+
)16
29(+
)15
,405
11N
ongb
ah R
angb
land
In
dust
rial
& T
ailo
ring
Co
op.S
ocie
ty L
td.
Non
g.1
Of 1
990,
Dt.
30
.1.1
990
23,6
0077
,000
1,00
,600
--
30,4
40(+
) 76
00(+
)15
,413
12Sa
kwan
g Ca
ne &
Bam
-bo
o In
dust
rial
Coo
p.So
ci-
ety
Ltd.
Shill
.30
Of 1
997,
D
t.3.
8.19
7729
,500
2,27
,500
2,57
,000
2,20
,300
2,31
,315
2,50
,000
(+)
3000
(+)
3330
13M
awky
rwat
Tai
lori
ng
Indu
stri
al C
oop.
Soci
ety
Ltd.
Non
g.10
Of 1
984,
D
t.8.
7.19
8443
,900
1,41
,500
1,85
,400
42,0
0075
,000
99,5
65(+
)57
2(-
)29
,468

ME
GH
AL
AYA
STA
TE
DE
VE
LO
PME
NT
RE
POR
TM
EG
HA
LAY
A S
TAT
E D
EV
EL
OPM
EN
T R
EPO
RT
342
Sl.
No.
Nam
e O
f The
Coo
perati
ve
Soci
ety
Regi
strati
on N
o. &
Dat
ePa
id U
p Sh
are
Capi
tal
Busi
ness
Tur
n O
ver
Dur
ing
The
Last
3 Y
ears
Wor
king
Res
ults
Dur
ing
The
Last
3 Y
ears
Indi
vidu
alG
ovt.
Tota
l20
05-0
620
06-0
720
07-0
820
05-0
620
06-0
7
12
34
56
78
910
11
14Ra
ngth
ong
Bete
lnut
Pro
-ce
ssin
g In
dust
rial
Coo
p.So
ciet
y Lt
d.
Non
g 9
Of 1
987,
D
t.4.
11.1
987
64,5
001,
72,5
002,
37,0
00-
-3,
68,5
55(+
) 18
00(+
) 20
00
15M
awri
Can
e &
Bam
boo
Indu
stri
al C
oop.
Soci
ety
Ltd
Non
g. 1
2 O
f 198
7,D
t. 1
9.11
.198
733
,380
1,62
,000
1,95
,380
1,25
,444
1,95
,000
1,88
,300
(+)
3559
(+)
4185
16
Non
glan
g Fu
rnitu
re C
um
Hol
low
Blo
ck M
akin
g In
dust
rial
Coo
p. S
ocie
ty
Ltd.
Shill
. 180
Of 1
974,
Dt.
12.1
2.19
7425
,000
84,9
001,
09,9
001,
02,1
001,
96,0
001,
25,3
00(+
)42
80(+
)50
00
17M
aiaw
an N
ongl
ang
Tailo
ring
Indu
stri
al C
oop.
Soci
ety
Ltd.
Non
g. 1
0f 1
992,
D
t.29
.5.1
992
20,0
001,
26,5
001,
46,5
0052
,000
1,96
,000
-(+
)60
0(+
)50
00
18M
aira
ng In
dust
rial
Coo
p.
Soci
ety
Ltd.
Non
g.1/
2003
, D
t. 1
2.2.
2003
17,0
0098
,000
1,55
,000
5,52
,285
3,09
,000
--
(+)
31,5
46
19N
ongb
ahri
m R
angb
lang
A
reas
Indu
stri
al C
oop.
Soci
ety
Ltd.
Non
g.1
Of 1
990,
D
t.31
.1.1
990
21,6
0035
,000
56,6
002,
03,0
902,
16,8
70-
(+)
3887
(+)
4070
20Ja
shia
r Ta
ilori
ng In
dus-
tria
l Coo
p.So
ciet
y Lt
d.N
ong.
14 O
f 198
4, D
t.
11.1
.198
470
,800
1,97
,000
2,67
,820
58,8
0074
,770
-(+
)120
0(+
)165
0
Tota
l :-
4481
0048
9400
221,
200
701,
128
321,
097
2473
74
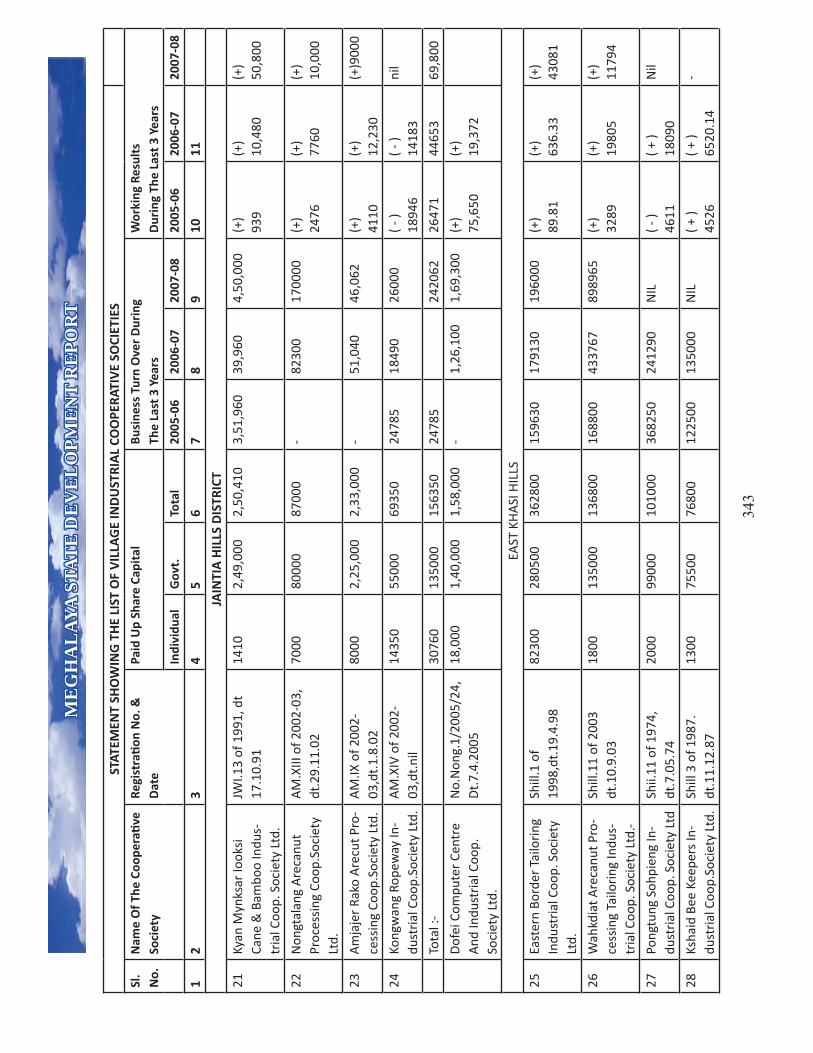
ME
GH
AL
AYA
STA
TE
DE
VE
LO
PME
NT
RE
POR
TM
EG
HA
LAY
A S
TAT
E D
EV
EL
OPM
EN
T R
EPO
RT
343
STAT
EMEN
T SH
OW
ING
TH
E LI
ST O
F V
ILLA
GE
IND
UST
RIA
L CO
OPE
RATI
VE
SOCI
ETIE
S
Sl.
No.
Nam
e O
f The
Coo
perati
ve
Soci
ety
Regi
strati
on N
o. &
Dat
ePa
id U
p Sh
are
Capi
tal
Busi
ness
Tur
n O
ver
Dur
ing
The
Last
3 Y
ears
Wor
king
Res
ults
Dur
ing
The
Last
3 Y
ears
Indi
vidu
alG
ovt.
Tota
l20
05-0
620
06-0
720
07-0
820
05-0
620
06-0
720
07-0
8
12
34
56
78
910
11
JAIN
TIA
HIL
LS D
ISTR
ICT
21Ky
an M
ynks
ar Io
oksi
Ca
ne &
Bam
boo
Indu
s-tr
ial C
oop.
Soc
iety
Ltd
.
JWI.1
3 of
199
1, d
t 17
.10.
9114
102,
49,0
002,
50,4
103,
51,9
6039
,960
4,50
,000
(+)
939
(+)
10,4
80(+
)50
,800
22N
ongt
alan
g A
reca
nut
Proc
essi
ng C
oop.
Soci
ety
Ltd.
AM
.XIII
of 2
002-
03,
dt.2
9.11
.02
7000
8000
087
000
-82
300
1700
00(+
)24
76(+
)77
60(+
)10
,000
23A
mja
jer
Rako
Are
cut P
ro-
cess
ing
Coop
.Soc
iety
Ltd
.A
M.IX
of 2
002-
03,d
t.1.
8.02
8000
2,25
,000
2,33
,000
-51
,040
46,0
62(+
)41
10(+
)12
,230
(+)9
000
24Ko
ngw
ang
Rope
way
In-
dust
rial
Coo
p.So
ciet
y Lt
d.A
M.X
IV o
f 200
2-03
,dt.
nil
1435
055
000
6935
024
785
1849
026
000
( - )
1894
6( -
)14
183
nil
Tota
l :-
3076
013
5000
1563
5024
785
2420
6226
471
4465
369
,800
Dof
ei C
ompu
ter
Cent
re
And
Indu
stri
al C
oop.
Soci
ety
Ltd.
No.
Non
g.1/
2005
/24,
Dt.
7.4.
2005
18,0
001,
40,0
001,
58,0
00-
1,26
,100
1,69
,300
(+)
75,6
50(+
) 19
,372
EAST
KH
ASI
HIL
LS
25Ea
ster
n Bo
rder
Tai
lori
ng
Indu
stri
al C
oop.
Soc
iety
Lt
d.
Shill
.1 o
f 19
98,d
t.19
.4.9
882
300
2805
0036
2800
1596
3017
9130
1960
00(+
)89
.81
(+)
636.
33(+
)43
081
26W
ahkd
iat A
reca
nut P
ro-
cess
ing
Tailo
ring
Indu
s-tr
ial C
oop.
Soc
iety
Ltd
.-
Shill
.11
of 2
003
dt.1
0.9.
0318
0013
5000
1368
0016
8800
4337
6789
8965
(+)
3289
(+)
1980
5(+
)11
794
27Po
ngtu
ng S
ohpi
eng
In-
dust
rial
Coo
p. S
ocie
ty L
tdSh
ii.11
of 1
974,
dt
.7.0
5.74
2000
9900
010
1000
3682
5024
1290
NIL
( - )
4611
( + )
1809
0N
il
28Ks
haid
Bee
Kee
pers
In-
dust
rial
Coo
p.So
ciet
y Lt
d.Sh
ill 3
of 1
987.
dt
.11.
12.8
713
0075
500
7680
012
2500
1350
00N
IL( +
)45
26( +
)65
20.1
4-

ME
GH
AL
AYA
STA
TE
DE
VE
LO
PME
NT
RE
POR
TM
EG
HA
LAY
A S
TAT
E D
EV
EL
OPM
EN
T R
EPO
RT
344
Sl.
No.
Nam
e O
f The
Coo
perati
ve
Soci
ety
Regi
strati
on N
o. &
Dat
e
Paid
Up
Shar
e Ca
pita
lBu
sine
ss T
urn
Ove
r D
urin
gTh
e La
st 3
Yea
rsW
orki
ng R
esul
tsD
urin
g Th
e La
st 3
Yea
rs
Indi
vid-
ual
Gov
t.To
tal
2005
-06
2006
-07
2007
-08
2005
-06
2006
-07
2007
-08
12
34
56
78
910
11
Indu
stri
al C
oop.
Soc
iety
Lt
d.dt
.11.
12.8
745
2665
20.1
4
29W
omen
Net
mak
ing
&
Cane
mak
ing
Indu
stri
al
Coop
.Soc
iety
Ltd
.
Shill
.145
of 1
975,
dt.5
.8.7
558
3527
9500
2853
3514
6360
1520
00-
( + )
726.
94( +
)32
44.7
30N
ongk
yrso
i Ind
ustr
ial
Coop
Soc
iety
Ltd
.So
hra
7 of
200
7.dt
.23.
2.07
2500
0ni
l25
000
--
1296
38-
-( +
)22
56
31Ra
ngka
tdor
Indu
stri
al
Coop
Soc
iety
Ltd
.So
hra
6 of
200
6.dt
.21.
8.06
1950
090
000
1095
00-
-26
6450
--
( + )
2000
32Sk
hem
Tri
ang
Indu
stri
al
Coop
.Soc
iety
Ltd
.Sh
ill. 3
of 2
003.
dt
.21.
3.03
4800
3000
034
800
-36
462
3301
5( -
)15
169
( + )
4122
33La
itt yr
a A
reca
nut P
ro-
cess
ing
Indu
stri
al C
oop.
Soci
ety
Ltd.
Shill
5 o
f 197
9.dt
. 2.3
.79
2189
011
7000
1388
90-
2810
064
750
-( +
)16
5066
TOTA
L :-
1644
2511
0650
012
7092
596
5540
1E+0
615
8881
813
242.
7522
8531
.263
253
RI B
HO
I DIS
TRIC
T
34Ty
llila
ng H
andi
craft
Ind
us-
tria
l & A
llied
Coo
p. S
ocie
ty
Ltd.
NPH
1 o
f 20
06,d
t.10
.8.0
645
0030
000
3450
0-
1570
018
300
-( +
)75
00( +
)15
75
35Ri
lang
Bee
Kee
ping
& In
-du
stri
al C
oop.
Soc
iety
Ltd
NPH
4 o
f 20
03,d
t.1.
11.0
315
450
2500
040
450
1188
010
000
-( +
)10
686
( + )
5441
TOTA
L19
950
5500
074
950
1188
025
700
1830
010
686
1294
115
75

ME
GH
AL
AYA
STA
TE
DE
VE
LO
PME
NT
RE
POR
TM
EG
HA
LAY
A S
TAT
E D
EV
EL
OPM
EN
T R
EPO
RT
345
WES
T G
ARO
HIL
LS D
ISTR
ICT
36J.P
.Spi
ce A
gro
Indu
stri
al
Coop
. Soc
iety
Ltd
.N
o.T-
30 o
f 200
1-02
, dt
.115
.1.0
228
028
7500
2877
8032
5000
1236
5939
5620
( +
)104
81( +
)12
70( +
)15
690
TOTA
L28
028
7500
2877
8012
3659
3956
2010
481
1270
1569
0
EAST
GA
RO H
ILLS
DIS
TRIC
T
37M
anig
anj s
ilk re
elin
g an
d Sp
inni
ng C
oop.
Soc
iety
Ltd
.W
.2 o
f 199
9-00
,dt.
1.3.
2000
1500
010
000
2500
0ni
lni
lni
l( -
)193
8ni
l-
38W
illia
mna
gar
Leat
her
Craft
Co
op S
ocie
ty L
tdW
.reg
d.19
99-2
000,
dt
.nil
2400
7000
072
400
3000
--
(+)1
,000
-
TOTA
L17
400
8000
097
400
3000
2938
SOU
TH G
ARO
HIL
LS D
ISTR
ICT
39D
ondi
me
Mom
in's
Tai
lori
ng
Coop
Soc
iety
Ltd
No.
B-3
of 2
007-
08,
dt.3
1.1.
0875
0ni
l75
0-
-20
45-
-(+
)212
TOTA
L75
075
020
4521
2
EPIP BYRNIHAT

UMIAM INDUSTRIAL AREA
SERICULTURE AND WEAVING

MEGHALAYA STATE DEVELOPMENT REPORTMEGHALAYA STATE DEVELOPMENT REPORT
CHAPTER XI
SOCIAL SECTOR1
11.1. The importance of Social sector, mainly health, educati on and welfare are undeniable and intricately linked to the developmental eff orts in other sector and also becomes the push or pull factor in the process of development. Human potenti al cannot be expressed and achieved fully unless well being, capabiliti es and capaciti es are enhanced conti nuously.
11.2. Health :11.2.1.Public Sector Health Infrastructure: The 3-ti er health delivery system is as follows:
1) A Community Health Centre (CHC) for a populati on of approximately 80,000 serves as a referral centre for PHCs. It should be manned by four Medical Specialists; a surgeon, a physician, a gynaecologist and a paediatrician. It has 30 beds for indoor pati ents with an operati on theatre, X-ray, labour room and laboratory faciliti es.
2) A Primary Health Centre (PHC) for populati on of 20,000 serves as the fi rst contact point between the village community and a medical offi cer. It acts as a referral unit for 6 or so Sub-centers. It has 10 beds for indoor pati ents.
3) A Sub-Centre for a populati on of 3,000 is the most peripheral contact point between the Primary Health Care system and the community. It is manned by one Multi -Purpose Worker (Male) and one ANM.
Public sector health care infrastructure as it existed in 1972 and its growth since then is shown in Table 11.1. At present there are 7 Districts with 9 hospitals (beside one MIMHANS and 2 TB hospitals, and one 100 bedded insti tuti on), 28 CHCs, 104 PHCs, 405 Sub-Centres, 9 Dispensaries and 12 urban health centres. Besides, there are in-house hospitals for the police (2) and jails (1) with emergency bed facility. Further, development and improvement in health care services are seen not only in curati ve services but also in preventi ve and promoti ve health care services in the state.
Table 11.1: Status of Public Sector Health Insti tuti ons and Services (1972-2007)
Items 1972 1981 1991 2001 2007Number of Hospitals 7 9 9 6 9 Number of Dispensaries 57 58 23 20 14Number of CHCs 12-17 28Number of PHCs 9 23 63 85-88 104Number of sub-centres 93 272 401 405Number of Beds 781 1264 1811 2735 3166Number of indoor pati ents 3385 40260 342740 97000 158000Number of outdoor pati ents 90788 2039973 1915790 1511000 1923000No. of IUCD inserted 485 284 1789 2407 2646No.of sterilizati ons 582 257 612 2294 2264
1 For details on various aspects of Social Sector, please see the Meghalaya Human Development Report, 2008.
347

MEGHALAYA STATE DEVELOPMENT REPORTMEGHALAYA STATE DEVELOPMENT REPORT
Doctors 113 189 335 389 568Nurses 117 305 318 384 862Health visitors 8 30 45 59 71ANMs 82 227 450 594 687Pharmacists 137 92 188Lab. Technicians 45 100 172Vaccinators 148 106Birth rate 28.3 25.1Death rate 9 7.5 IMR 58 53 56 49Note: There is variati on in the number of Hospitals, CHCs, PHCs and Sub-centres due to defi niti onal problems, and someti mes due to the exclusion of non-functi onal enti ti es and insti tuti ons such as the Insti tute of Mental Health and Neurological Sciences.Source: Compiled from handbooks of stati sti cs (Directorate of Economic and Stati sti cs- htt p://www.megplanning.gov.in/handbook.htm)
Based on the current populati on of around 27.25 lakh vis-à-vis the norms indicated above, the State would require setti ng-up of SC/PHC/CHC as follows:
Table 11.2: Esti mated Number of Sub-Centres, PHCs and CHCs required by Meghalaya by 2020
Insti tuti ons Presently
Required
Available Shortf all Availability
by 11th Plan
Availability
by 12th Plan
Requirement
by 2020
Additi onal
requirement
Sub Centres 817 405 412 551 801 1021 220PHCs 122 104 18 119 144 153 9CHCs 31 28 3 31 36 38 2
Source: MHDR, 2008
Urban Health Centres (UHCs) were introduced in 2005-06. At present, there are 9 UHCs in Shillong, 2 UHCs in Tura and 1 UHC in Jowai. There are also fi rst referral units (FRUs), to provide 24 - hour emergency referral services, parti cularly in maternal and child health care. At present, 12 insti tuti ons have been identi fi ed to functi on as FRUs. Of these only 3 are functi onal, these are (1) Ganesh Das Hospital, Shillong (2) Civil Hospital Tura and (3) Civil Hospital, Jowai.
Out of the 28 Community Health Centres (CHCs) in the state, 12 are fully equipped, eight do not have OTs and 7 have OTs that are not fully equipped. 6 CHCs have non-functi oning Labour Rooms. Almost all CHCs are without the required specialist doctors.
Out of the 104 Primary Health Centres (PHCs) in Meghalaya, 82 have no OTs. Of the remaining PHCs only eleven have fully equipped OTs. 22 PHCs do not have Labour Rooms. 12 of the PHCs do not have fully equipped Labour Rooms. 17 PHCs need repairs of the main buildings and quarters. Many PHCs are without vehicles.
348
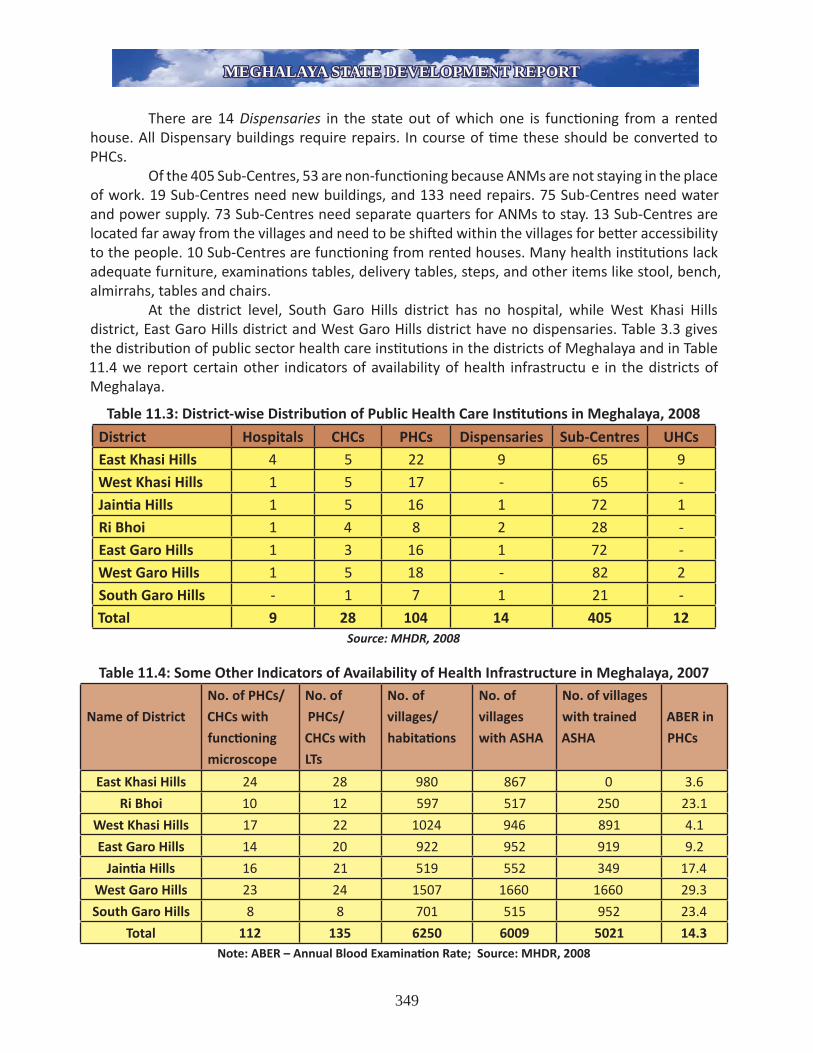
MEGHALAYA STATE DEVELOPMENT REPORTMEGHALAYA STATE DEVELOPMENT REPORT
There are 14 Dispensaries in the state out of which one is functi oning from a rented house. All Dispensary buildings require repairs. In course of ti me these should be converted to PHCs. Of the 405 Sub-Centres, 53 are non-functi oning because ANMs are not staying in the place of work. 19 Sub-Centres need new buildings, and 133 need repairs. 75 Sub-Centres need water and power supply. 73 Sub-Centres need separate quarters for ANMs to stay. 13 Sub-Centres are located far away from the villages and need to be shift ed within the villages for bett er accessibility to the people. 10 Sub-Centres are functi oning from rented houses. Many health insti tuti ons lack adequate furniture, examinati ons tables, delivery tables, steps, and other items like stool, bench, almirrahs, tables and chairs. At the district level, South Garo Hills district has no hospital, while West Khasi Hills district, East Garo Hills district and West Garo Hills district have no dispensaries. Table 3.3 gives the distributi on of public sector health care insti tuti ons in the districts of Meghalaya and in Table 11.4 we report certain other indicators of availability of health infrastructure in the districts of Meghalaya.
Table 11.3: District-wise Distributi on of Public Health Care Insti tuti ons in Meghalaya, 2008
District Hospitals CHCs PHCs Dispensaries Sub-Centres UHCsEast Khasi Hills 4 5 22 9 65 9West Khasi Hills 1 5 17 - 65 -Jainti a Hills 1 5 16 1 72 1Ri Bhoi 1 4 8 2 28 -East Garo Hills 1 3 16 1 72 -West Garo Hills 1 5 18 - 82 2South Garo Hills - 1 7 1 21 -Total 9 28 104 14 405 12
Source: MHDR, 2008
Table 11.4: Some Other Indicators of Availability of Health Infrastructure in Meghalaya, 2007
Name of District
No. of PHCs/
CHCs with
functi oning
microscope
No. of
PHCs/
CHCs with
LTs
No. of
villages/
habitati ons
No. of
villages
with ASHA
No. of villages
with trained
ASHA
ABER in
PHCs
East Khasi Hills 24 28 980 867 0 3.6
Ri Bhoi 10 12 597 517 250 23.1
West Khasi Hills 17 22 1024 946 891 4.1
East Garo Hills 14 20 922 952 919 9.2
Jainti a Hills 16 21 519 552 349 17.4
West Garo Hills 23 24 1507 1660 1660 29.3
South Garo Hills 8 8 701 515 952 23.4
Total 112 135 6250 6009 5021 14.3Note: ABER – Annual Blood Examinati on Rate; Source: MHDR, 2008
349

MEGHALAYA STATE DEVELOPMENT REPORTMEGHALAYA STATE DEVELOPMENT REPORT
11.2.2 Private Sector Health Infrastructure Table 11.5 shows the names and bed-strength of the well known private hospitals in Meghalaya. In additi on to the Private Hospitals listed in Table 3.5, there are also a few other private insti tuti ons, which provide only outdoor services or deal with specialized subjects only. The two of the bett er known are:
1) Ramakrishna Mission Dispensary, Shillong, for outdoor services only.2) Sanker Nursing Home, Shillong, for Mental Health Care Services. It is having both
Indoor and Outdoor faciliti es.
Besides, there are a number of dispensaries in the rural areas, mainly run by Christi an missionaries.
NGOs in health care: There is no mother NGO working in the State. However, there are a few acti ve NGOs like Bosco-Reach out, Impulse NGO Network, Lions Club, Rotary Club, Inner Wheel Club, VHAM (Voluntary Health Associati on of Meghalaya), World Vision, Ka Lympung ki Seng Kynthei, Ka Synjuk ki Rangbah Shnongs and YMCA, that are involved in health care in various ways. Besides, there is a Livelihood Improvement programme implemented by the MRDS (IFAD and GOI funded programme) which has a small health component.
Table 11.5: Bed Strength of Selected Private Hospitals in Meghalaya
Name of Private HospitalsNo of Beds
Name of Private Hospitals
No of Beds
K.J.P. Hospital, Shillong 600 K.J.P. Hospital, Jowai 100Nazareth Hospital, Shillong 500 Mission Hospital, Tura 60Bethesda Hospital, Shillong 40 Holy Cross Hospital,
Tura50
Woodland Hospital, Shillong 150 Holy Cross Hospital, Mairang
50
Indian Red Cross Society, Shillong
10 Bethany Hospital, Shillong
90
10 Hospitals-----1650 bedsSource: MHDR, 2008
11.2.3 Central Government Health Insti tuti ons
The North East Indira Gandhi Regional Insti tute of Health and Medical Sciences (NEIGRIHMS), which is now commissioned and where the fi rst batch of MBBS students have been enrolled, will have a 500 bedded Super-Speciality Hospital. However, there are a number of vacancies in the faculty in various departments. This Insti tute when fully functi onal can be uti lized for giving 6 months training of Medical Offi cers on Obstetrics and Gynaecology, Paediatrics and Anaesthesiology. The Union Ministry of Health is likely to set up an Insti tute of AYUSH (Ayurveda Unani Siddha & Homeopathy) within the campus. Military and Paramilitary Health Insti tuti ons:- There are a number of military and paramilitary hospitals and dispensaries around Shillong. Some of the main such insti tuti ons are: (1) Military
350
MEGHALAYA STATE DEVELOPMENT REPORTMEGHALAYA STATE DEVELOPMENT REPORT
Hospital, Shillong (2) BSF Hospital, Shillong (3) Assam Rifl e Hospital, Shillong and (4) Air Force Hospital, Shillong. These hospitals also coordinate with the state health authoriti es on preventi ve and promoti ve health care services such as immunizati on and other RCH services, besides organizing health camps for the community.
CGHS and ESI: Meghalaya also has Central Government Health Scheme (CGHS) and Employees’ State Insurance (ESI) services at a very modest level.
Regional Directorate of Health Services, Ministry of Health, GOI, Shillong: This Regional Directorate also has an important role in health care services for Meghalaya parti cularly in connecti on with Nati onal Anti -Malaria Programme and RCH Programme. Some of the important and essenti al acti viti es are the verifi cati on and confi rmati on of the correctness of positi ve and negati ve blood-slide smears in diagnosis of malaria parasites, the training of Microscopists for correct diagnosis of malaria parasites, and the quality control of some contracepti ves.
11.2.4. Problems and constraints of health sector in Meghalaya
Current problems faced by the health care services in Meghalaya include:
1. Persistent gaps in manpower and infrastructure especially at the secondary and terti ary health care levels and poor referral services.
2. Sub-opti mal /improper uti lizati on of the infrastructure and resources including manpower resources.
3. Various health insti tuti ons (Government, voluntary and private) do not have appropriate manpower, diagnosti c and therapeuti c services and drugs.
4. Low absorpti on capacity for programme funds.
5. Massive intra state diff erences in performance as assessed by health and demographic indices; availability and uti lisati on of services being poorest in the most needy areas.
6. Sub-opti mal inter-sectoral coordinati on; poor coordinati on among various services provided by directorates.
7. Lack of innovati on and adaptati on.
8. Poor capacity of personnel and poor exposure to technological advances.
9. Growing dual burden of communicable and non-communicable diseases because of demographic, lifestyle and environmental transiti ons.
10. Increasing awareness and expectati ons of the populati on regarding health care services.
11. Lopsided emphasis on short term, quick fi x soluti ons; lack of long term planning and delivery of services.
12. Escalati ng costs of health care, ever widening gap between what is possible and what the individual or the state can aff ord.
13. Lack of an adequate management informati on system for planning, monitoring and evaluati on.
351

MEGHALAYA STATE DEVELOPMENT REPORTMEGHALAYA STATE DEVELOPMENT REPORT
11.2.5. Human Resources for Health Services
The selecti on by the World Health Organisati on (WHO) of the theme “Human Resource for Health” for observati on of the World Health Day, 2006 is parti cularly relevant for Meghalaya. Most of the CHCs in Meghalaya functi on without specialists. At the village level, the curati ve, preventi ve and promoti ve health care services are provided and looked aft er by Sub-Centres through the Female Health Workers (ANMs) and Male Health Workers, by working in close co-ordinati on with the community mainly through the help of the recognized workers like ASHAs, AWW, Trained Birth Att endants (Traditi onal Dais), FTDs (Fever Treatment Depots), DTCs (Disease Treatment Centres) and Village Health Committ ees.
Meghalaya has no Medical College. However, a welcome development is the setti ng up of NEIGRIHMS with under graduate and post graduate study faciliti es as noted in secti on 3.2.5 above. In Meghalaya there is an acute shortage of specialized manpower (Doctors) in Obstetrics & Gynaecology, Paediatrics, General Surgery and Anaesthesia. The Government of Meghalaya has requested the Government of India to allot more seats for MBBS Course and Post-Graduate Courses in various Medical Colleges in the Country. Under RCH - II, a proposal was incorporated in the State Programme Implementati on Plan to undertake supplementary training of six months durati on for selected Medical Offi cers of the state in urgently needed specialized subjects for proper functi oning of CHCs and FRUs. These are yet to fructi fy.
For requirement of nursing staff , etc. there are 5 training centres in the public sector which include: 1 Regional Health and Family Welfare Training Centre, 2 GNM training centres, and 2 Nursing Training Schools and 1 ANM training school. The State Government had also submitt ed its requirement of 2 additi onal GNM Training Schools to be set up at Tura Civil Hospital and Jowai Civil Hospital. The proposal of setti ng up of a paramedical training insti tute and for strengthening of the existi ng Government Nursing Schools and ANM Training Centres should be given priority. In order to build capacity in the health sector the Government of Meghalaya has provided land for setti ng up of Indian Insti tute of Public Health. Emphasis is also being given to the development of trained manpower to cope with the increasing demand of increasing strength of manpower vis-à-vis the increasing bed strength in the State. The present Doctors: Pati ent rati o is 1: 5000 and the Nurse: Pati ent rati o is 1: 1700.
352

MEGHALAYA STATE DEVELOPMENT REPORTMEGHALAYA STATE DEVELOPMENT REPORT
Table 11.6: Existi ng and Additi onal Requirement of Manpower in Health Sector of Meghalaya (2007)
Manpower Existi ng Additi onal Requirement
Specialist Doctors 78 200General Duty Stream 471 200Dental Surgeons 36 25Nursing Professional (GNM and ANM) 1232 500Allied Health Professional(Para-medical staff )
350 200
Source: MHDR, 2008
11.2.6. Public Expenditure on Health Sector in Meghalaya
Public investment has been recognized as an indicator of planning prioriti es. But investment in public health in the country as a whole – and in Meghalaya – does not show that health care has been given due importance. In Meghalaya, the Government funding and Plan expenditure had increased from Rs.16.65 crore in the Seventh Plan to Rs.54.72 crore during the Eighth Plan. Further in the Ninth Plan the expenditure was more than Rs 150 crore which again saw an increase of expenditure to the extent of Rs. 205 crore during the Tenth Plan. These fi gures do not include the annual expenditure of about Rs 50 crore under non- plan and expenditure in cash and kind under various Central and Centrally Sponsored health sector programmes including that of the NRHM which if absorbed well can exceed more than Rs 100 crore annually. The proposed state Plan outlay during the 11th plan is more than Rs 600 crore.
Table 3.7 shows at a glance, the year wise percentage of expenditures on Health & Family Welfare from the consolidated fund of the Government of Meghalaya. However, as menti oned above the table does not take into account the expenditure under various nati onal health programmes, funds for which are directly received in various health programme societi es, including the State Committ ee on Voluntary Acti on (SCOVA) and State Health Society implementi ng RCH and NRHM programmes. The assessment of such funds has not been done so far.
Table 11.7: Expenditure on Health & Family Welfare in Meghalaya
(Source: MHDR, 2008)
Year
State Total Revenue and Capital expenditure
(Rs. lakh)
State Revenue and Capital expenditure
for H & FW(Rs. lakh)
Expenditure for H & FW as percentage of
total1999-2000 85864.37 6368.00 7.4 percent2000-2001 103697.08 7050.59 6.8 percent2001-2002 102447.99 8206.93 8.0 percent2002-2003 109579.18 8186.40 7.5 percent2003-2004 182084.77 8256.43 4.5 percent
353

MEGHALAYA STATE DEVELOPMENT REPORTMEGHALAYA STATE DEVELOPMENT REPORT
2004-2005 207234.21 9194.87 4.4 percent2005-2006 200709.28 9602.81 4.8 percent2006-2007 232010.25 9910.97 4.3 percent2007-2008 (R.E.)
344846.82 12742.89 3.7 percent
2008-2009 (B.E.)
397322.38 15484.94 3.9 percent
Note: (a) Does not include direct programmati c fund and material fl ow from GOI.; (b) R.E. – Revised
Esti mates, B.E. – Budget Esti mates;Source: Government of Meghalaya “Budget at a Glance”, various issues.
As per esti mates during the 11th Plan following fund is likely to fl ow to the sector: (a) State Plan - Rs. 450 - 500 crore; (b) Funding under NRHM and other Centrally Sponsored Schemes - Rs 450 crore (approx.); (c) from NEC, NLCPR and other agencies of GOI - Rs 150 crore. (d) Non-Plan fund - Rs. 500 crore. Thus, about Rs 1400-1500 crore may be available if programmes are managed well. The central resources to the overall public health funding have been limited to about 15 percent only. There is also inherent problem of absorpti on of programmati c fund due to various factors. The current annual per capita public health expenditure is no more than Rs 200. But with the launching of NRHM by the Government of India, it is expected that things will greatly improve. This expectati on is mainly because the NRHM also aims at commitment of the Government of India to increase public spending on health form 0.9 percent of GDP to 2 - 3 percent of GDP, during the Mission period from 2005 to 2012. It remains to be seen how well the enti re health sector absorbs the fund and the managers in the state leverage and perform under NRHM. The initi al years show somewhat tardy progress in the matt er in the state which requires concerted and expediti ous mode of acti on. It is a matt er of record that the health sector failed to uti lize a possible expenditure of Rs 22.0 crore, which was slashed down to Rs. 6 crore, which ulti mately was uti lised for a paltry sum of about Rs 50 lakh or so for similar mission mode programme under the European Commission Programme during 2000-2005.
11.2.7 Health Indicators in Meghalaya
With diffi cult hilly terrain and poor road connecti vity in the rural areas, the shortage of proper health infrastructure, manpower, and the trend of fi nancial investment/ absorpti ve capacity on health by the State Government etc. as discussed earlier, we cannot expect much about the improvement of health conditi ons of the people and about the accessibility of health care services to the people, parti cularly the remote vulnerable secti ons of the rural populati on of Meghalaya. Poor human-resources management and poor work culture of the service providers at diff erent levels of the health systems, have further worsened the situati on. This is evident from some of the recent available health indicators for Meghalaya that are menti oned below.
354
MEGHALAYA STATE DEVELOPMENT REPORTMEGHALAYA STATE DEVELOPMENT REPORT
The health indicators given below are based on the following sources:
1) The Nati onal Family Health Surveys (NFHS-1, NFHS-2, NFHS-3)
2) The Sample Registrati on System Surveys (SRS, Monthly Surveys)
3) The Rapid Household Surveys for RCH Services (1998-99 & 2002-2004)
4) Monthly/ Quarterly reports of Health & Family Welfare Department
(Management Informati on System Reports)
5) The Birth and Mortality Survey, 2007
The health indicators from the fi rst three services of the independent agencies above are not for the whole State or for every part of the State of Meghalaya. They only show the status of health conditi ons and health services provided for a few selected villages and urban areas and a few households of Meghalaya. For example, the NFHS-2 covered only about 1250 households (out of about 3 lakh households of Meghalaya), and about 1000 couples (out of more than 2 lakh couples). Therefore, the fi gures may be taken to be indicati ve only.
The health indicators from the monthly reports of the Health and Family Welfare Department are oft en considered unreliable, because they are given and reported by the service providers themselves, though they cover more than 60 percent of the villages of the State. However, those reports are also important because it is also their objecti ve to invite correcti ve measures by the higher level authoriti es of the health system.
11.2.8 Health Programmes: Like other states in India, the health department of the Government of Meghalaya, caters for implementati on of diff erent Nati onal Health Programmes of the Government of India. All the diff erent verti cal Health programmes of the Government of India are integrated under the Multi purpose Health programme at all levels in the State. The earlier Family Planning programme was renamed as Family Welfare programme and later modifi ed as Reproducti ve and Child Health (RCH) programme. All the diff erent Nati onal Health programmes are being implemented as per guidelines of the Government of India. At present, the welcome development is that the hitherto unreached rural populati on is att empted to be reached out through the Nati onal Rural Health Mission (NRHM), though it needs a focused and dedicated eff ort.
The Programmes of the Department aims at a rapid transiti on and transformati on in which effi cient health systems will improve quality of life well being of the people and reduce burden of diseases which in turn will increase economic producti vity and growth. This is to be achieved through (i) various health programme and parameters under NRHM (ii) Strengthen Public health infrastructure (iii) Improve professionalisati on of health service delivery (iv) Improve convergence of health related acti viti es of various sectors of Government (v) Increase Public Private Partnership (vi) Improve monitoring, accountability and transparency of the system (vii) Popularizati on of alternati ve medicine systems like AYUSH and (viii) Ensuring access to essenti al drugs in public health system.
355

MEGHALAYA STATE DEVELOPMENT REPORTMEGHALAYA STATE DEVELOPMENT REPORT
Nati onal Rural Health Mission (NRHM):-
The NRHM was launched in April 2005 in the State with a view to bring about marked improvement in the health System and health Status of the people. The Mission seeks to provide universal access to equitable, aff ordable and quality health care to the people and especially the poor and vulnerable secti on of community residing in the rural areas through out the country . The durati on of the mission is 7 years (2005-2012). The state and the District Health Missions and Societi es are consti tuted for eff ecti ve implementati on of the goals of the Mission.
Components of NRHM:The Nati onal Rural Health Mission seeks to adopt a sector wide approach and subsumes key nati onal programme, such as RCH-II Programme, the Nati onal disease Control Programme and Inti grated Diseases Surveilance, Universal Immunizati on Programme (UIP) and The Intersectoral convergences are 5 important parts of the eff orts
The current Health Status in the State is as follows:-IMR-49(SRS-2006); BR-25,1(SRS-2006); DR-7.5(SRS-2006); TFR-3.8(NFHS-3);MMR-450(State Records)Physical targets under NRHM :In line with the goals of the Mission the State expects the outcome of NRHM by 2012 will be as follows :
a. IMR to be reduced to 30/1000 live births.
b. MMR to be reduced to 100/1000,000.
c. TFR to be brought to 2.1.
d. Malaria mortality reducti on rate – 50% upto 2012.
e. Cataract Operati on : increasing to 1000 cases per year unti l 2012.
f. Leprosy prevalence rate : to be brought to less than 1/10.000.
g. Tuberculosis DOTS Services : from the current rate of 1.8/10,000,85% cure rate to be maintained through the enti re Mission period.
h. 34 Community Health Centres to be upgraded to Indian Public Health Standards.
i. Uti lisati on of First Referral Units to be increased from less than 20% to 75%.
j. Link Workers (ASHA) will be engaged in all the Villages of the State (5438 ASHAs in place against a total of 6180 is required).
Acti viti es And Performances Under NRHM upto 2008-09:-
JSY Benefi ciaries–Total target (2006-07) – 4000 : Total achieved (Sept 2007) – 1500.Procurement of Drug, Kits under NRHM have already been supplied and distributed to all districts. 7 Nos. Mobile Medical Units, one for each district has been approved by Government of India; 2 Health Meals are being held annually.
356

MEGHALAYA STATE DEVELOPMENT REPORTMEGHALAYA STATE DEVELOPMENT REPORT
Table 11.8 NRHM FINANCIAL STATEMENT FOR 2008-09 (Rs. in lakhs)
Sl.
No
Name Of
Scheme
(Ongoing/
New)
Approved
Outlay For
the
Scheme
During
2007-2008
Actual
Expenditure
up to 31st
March, 2008.
Approved
Outlay
for the
Scheme
During
2008-09
Cumulati ve
Achievement
up to
Sept, 2008.
Percentage
of
Achievement
%
1 2 3 4 5 6 7
1. RCH -II 1174.86 407.14 1377.04 225.80 16.39
2. NRHM 4849.25 3234.91 4332.73 529.36 12.21
3. UIP 167.00 87.67 191.21 16.56 8.67
4. IPPI 66.15 59.59 86.00 6.62 7.69
TOTAL 6257.26 3789.31 5986.98 778.34 13.00 %
Progress of physical and fi nancial achievement under NRHM.
Achievement for 2007-08 & 2008-09:
• The Approved Outlay for 2007-2008 was Rs. 6257.26 lakhs against which an amount of Rs.3789.31 lakhs has been uti lized. The percentage of uti lizati on is 60 %.
• Of the Approved Outlay for 2008-2009 amounti ng Rs. 5986.98 lakhs an amount of Rs. 778.34 lakhs has been uti lized up to 30.9.08. The percentage of uti lizati on is 13 %.
Cumulati ve Achievement ti ll Sept 2008:
RCH- II – Maternal Health• 30 Nos of ANMs have been recruited against the Target of 50 Nos.• 3 Nos of Staff Nurse/PHN for 24X7 PHCs have been recruited against the Target of 42 • 15 AYUSH doctors have been recruited against the Target of 15 Nos.
Training:• Training of on skill birth att endance(SBA) - 31 against the target of 120 SNs/PHN.• Multi skilling training of Mos from CHC - 2 Nos. against the target of 20 Nos.• Training on RTI/STI - 41 MOs. against the target of 75 MOs.• Training of MOs on mini laparoscope or conventi onal tubectomy - 2 MOs against the
target of 21 MOs• Training of MOs on ARSH - 41 MOs against the target of 75. • Training of ASHA - 3197 Nos. of ASHA against the target of 6180 Nos.
357
MEGHALAYA STATE DEVELOPMENT REPORTMEGHALAYA STATE DEVELOPMENT REPORT
NRHM• 7 CHCs have been Upgraded and 17 are near completi on.• 1 Store Keeper has been appointed.• 2 Assistants have been appointed.• 4 Helpers have been appointed. • 7 Nos of MMU have been released to all Districts against the target of 7 Nos MMUs.• Outsourcing of 14 PHCs to NGOs is under progress.• 15 AYUSH Doctors have been recruited in 10 PHCs & 5 CHCs against the target of 15
Nos.• 63 Nos. of PHC Accountant have been appointed of accountant against the target of 104 Nos.• 1 Accounts Manager has been appointed 1 Offi ce assistant has been appointed
Development of Infrastructure:-
A. Medical Insti tuti ons :-• At present, the Department has 9 Hospitals, 28 CHCs, 104 PHCs and 405 Sub-Centres. The
strategy of the Department during the Plan period is to upgrade the existi ng Hospitals by providing more beds and faciliti es with a view to improve pati ent – to – bed rati o (1:730) drasti cally. It will also focus on upgradati on of CHCs to Hospitals on case to case basis. Simultaneously, the Department will also set up new CHCs, PHCs and Sub-Centres to cover more populati on of the State as per the norms.
• The Department would achieve the goal to set up additi onal 10 CHCs, 20 PHCs and 200 Sub-Centres during the Plan period.
• Accident and Trauma Centres at Tura, Williamnagar and Jowai will be set up.• Constructi on of Warehouses at all the District Head Quarters would be initi ated.• Training Centre for Male Health Workers will be set up for both in-service and newly
recruited workers.• Female Health Workers Training Insti tutes at Shillong and Rongkhon will be upgraded.• The Department will also set up Training Insti tute on Para-Medical Workers.• The Regional Family Welfare Training Insti tute at Shillong will also be upgraded to meet
the requirement of in-service staff at various levels.• Blood Bank Unit at all District Hospitals with 24 hours delivery services would be set up.
B. Equipments :-• Pasteur Insti tute, Shillong would endeavour to set up the New Tissue Culture (NTCARV)
for preparati on of anti -rabbies vaccines.• Major Hospitals and CHCs are required to maintain standards in terms of waste disposal
systems. All Hospitals and CHCs would be equipped with Waste Disposal Units.• District Hospitals would be provided with Laparoscopic and Endoscopic machines.• 18 ECG machines would also be provided at all District Hospitals and CHCs located at the
District and Sub-Divisional Headquarters.
358

MEGHALAYA STATE DEVELOPMENT REPORTMEGHALAYA STATE DEVELOPMENT REPORT
• 18 X-Ray machines would also be provided at all major Hospitals/CHCs. 25 Portable X-Ray machines would also be provided and att ached at all District Hospitals. Accidents and Trauma Centres and for the purpose of Post Mortem Operati ons.
• 25 Dental Chairs would be provided at all Hospitals and CHCs.• Defi ciency in criti cal equipments may also be ameliorated through Public-Private
Partnership and outsourcing mode.
Material And Child Health & Family Welfare Programmes:-
MCH & FW Programme is taking a shift from normati ve to a need-based Client oriented programme with twin objecti ves of (i) Maternal and Child Health and (ii) Family Welfare Programme on the one hand to seek stabilizati on of populati on in the shortest ti me and on the other hand to seek improvement in the reproducti ve and child health status.To meet these objecti ves, a number if interventi ons are being att empted through various programmes including NRHM. Some of the main interventi on under MCH & FW Programme are (i) Reproducti ve and Child Health Programme (under NRHM) (ii) Training acti viti es taken by Health & Family Welfare Training Center, Shillong is an ongoing acti vity conducted in all the seven District of the State (iii) Civil Registrati on System of Births and Deaths and Vital Stati sti cs (iv) Iodine defi ciency Disorder (IDD) Control Programme (v) Universal Polio Immunizati on Programme (UPIP).
11.2.9. Looking Ahead: The plan document menti ons following desirables for its future plans:
Professionalisati on of Health Service Delivery:-This include• Further specializati on of Doctors, Nurses, Para Medical Staff and Multi purpose• Health Workers in Training Insti tutes both outside and inside the State.• Extensive use of Computers in offi ce management, hospital management, inventory • control, monitoring, date collecti on and reporti ng of faciliti es.To provide with Telemedicine 3 Hospitals and to cover District and Sub Divisional Hospitals • during the 11th Five Year Plan.Restructuring of locati on of health faciliti es as per need and functi onal uti lity by GIS • mapping of all faciliti es.To counter distance factor and to bridge this ti me divide, a public policy would be worked • out to establish Call Centers on Health Informati on and advice on minor ailments etc.
Convergence of Acti viti es: • To achieve the goals of convergence, high level Co-Ordinati on Committ ee are set up at State and District levels involving all concerned sectors to ensure best possible result during the Plan period.
Monitoring, Accountability and Transparency: • Monitoring is done at various levels. Regular audit is done by Accountant General and by the Chartered Accountants. It is proposed to improve monitoring by use of Informati on Technology and increased performance based accountability by decentralizati on and improving monitoring through concurrent sample surveys, social audit and insti tuti onalizing community management at all levels through the committ ee in the Sub- Centers, PHC, CHC and Hospital levels.
359

MEGHALAYA STATE DEVELOPMENT REPORTMEGHALAYA STATE DEVELOPMENT REPORT
Public Private Partnership (PPP):•
PPP exists in the form of recogniti on of specially hospital both within and outside the State • for treatment for certain category of persons. The Department proposes to extend such facility to more specialty hospitals during the Plan period.Hospital Management Societi es will be set up in all hospitals, CHCs and PHCs involving • NGOs under NRHM during the Plan period.The issue of handing over and manage some public infrastructure, like sub- centers, • PHCs, CHCs and Hospitals for private joint management would be considered by the Department.The implementati on of a comprehensive Health Insurance Policy for the people of the • State is a key area where PPP is envisaged under the Plan period.Training on Professional course for all categories of Doctors and Staff is under considerati on • on a ti e up with medical Insti tuti on of repute.
Popularisati on of Alternati ve Medicine System like AYUSH:-• • AYUSH will be established as a insti tuti on in all District Hospitals and CHCs.• Medicines and treatment as a supporti ng base will be provided to supplement other
treatment.• All CHCs and Hospitals will be provided with at least 1 (one) Ayurvedic /Homoeopathic
Physician.
• Access to Essenti al Drugs:-• All District Hospitals, CHCs and PHCs will support the need of common ailments with
essenti al drugs.• Essenti al drugs will be provided through these Medical Insti tuti ons free of cost. The budget
provision will be doubled for this purpose.
• Focussed and integrated approach to Nati onal programmes of disease control-The Nati onal Programmes on control of Communicable Diseases will also be conti nued,where special att enti on will be given to control of Malaria and Tuberculosis diseases to reduce the menace of the diseases. An Integrated Disease Surveillance Programmes has already been initi ated and will be carried on. The same will be followed with respect to Scheme such as Establishment of Ayurvedic / Homoeopathic Wing in all the Districts.
Integrati on Of NRHM with Nati onal Health Programmes:• All nati onal and state health programmes would be integrated with NRHM in order to enhance delivery of Health Services. This will be att empted to be done in a seamless manner by integrati ng structures, insti tuti ons, establishments and plans and programmes. Ayush would also be mainstreamed. A focused eff ort would be made for convergence with Water Supply Sanitati on, Nutriti on, and Welfare Programmes such a mental health, drug abuse, persons with disabiliti es etc.
360

MEGHALAYA STATE DEVELOPMENT REPORTMEGHALAYA STATE DEVELOPMENT REPORT
11.2.10. Observati ons and Recommendati ons of the State Planning Board:
• There is no document pertaining to the maternal mortality rate (MMR). There is need
to gather correct informati on on the MMR in the State.
• Recogniti on of the traditi onal system of medicine was stressed upon.
• Physically challenged persons need to be given proper health care.
• Awareness programmes on sanitati on and health need to be undertaken.
• Potability of water used in CHCs and PHCs needs to be addressed.
• As far as health is concerned data could be collected family wise.
• Greater sensiti vity to be shown to women when addressing health issues.
• Increase the number of maternity beds in health centres.
• Health is to be identi fi ed as the primary concern.
11.3. Educati on:
11.3.1 General Educati on
A. Elementary Educati on: The vision of the State is for Universalisati on of Elementary Educati on
along with universal access to schools and constantly improving quality of teaching and learning
process. The aims and objecti ve is for att aining total enrolment and retenti on of children in schools
by the year 2010.The level of enrolment at the end of the 10th Plan is 488000 in the Lower Primary
and 212000 in the Upper Primary stage. During 2007-08, the enrolment had increased to 518000
in the Lower Primary and 232000 in the Upper Primary stage. The physical target fi xed for 2009-10
is 550000 in the Lower Primary and 265000 in the Upper Primary stage. The Sarva Shiksha
Abhiyan (SSA) is a Programme for universalizati on of Elementary Educati on for providing quality
educati on to the primary students.With the launching of the SSA programme and its various
interventi ons the Department is making an eff ort to provide educati on of sati sfactory quality,
bridge the existi ng gaps in access, provision of infrastructure including educati onal curricula and
teachers Training.
Financial Status of SSA from 2000-01 to 2007-08 :• Allocati on approved by the Project Approval
Board according to the AWP&B was Rs.262.08 crore. Fund received against the allocati on -
Rs. 261.32 crore; Expenditure incurred - Rs. 200.08 crore; Unspent balance at the end of
2007-08 - Rs. 61.24 crore.
Financial Progress of Implementati on during 2007-08: • Approved Outlay = Rs. 14007.306
lakhs; Expenditures = Rs. 9735.19 lakhs; Percentage of Achievement - 69.50 %.
361
MEGHALAYA STATE DEVELOPMENT REPORTMEGHALAYA STATE DEVELOPMENT REPORT
Physical Achievement during 2007-08:• The status is as shown below:Sl.
No
Achievements :- Completed/ Achievement
1. No. of EGS Centres 1197 Nos
2. Nos. of New L.P. Schools opened
(including upgradati on of EGS)
1604 Nos. (including 267 upgraded EGS)
3. Nos. of LPS upgraded to Upper Primary
Schools
1223 Nos
4. TLE provided for LPS 1604
5. TLE provided for UPS 1223
6. School Grant Rs. 2000/- per School released to all existi ng
LPS and UPS
7. Teacher Grant Rs. 500/- per Teacher released to all existi ng
LPS and UPS Teacher
8. Text Books & Exercise Books Provided to all children
9. Teachers’ Training A. 7495 Teachers – 20 days, In-service
Training;
B. 534 Teacher – 30 days, Inducti on Training;
C.3612 Teachers- Deputed to CPE against
Target of 4400
10. No. of BRCs/CRCs functi oning A. 39 BRCs functi oning
B. 437 CRCs “ “
11. Nos. of School given access to Computer
Aided Learning.
132 UPSs
LPS- Lower Primary School; UPS – Upper Primary School; TLE – Teaching Learning Equipment;BRC – Block Resource Centre; CRC – Cluster Resource Centre; Dropouts -The total number of dropouts during the period are 27028 children. Implementati on in progress.
Progress of Implementati on during 2008-09: • The Physical achievement up to September 2008 under the Scheme is shown below:Sl.
No
Items of Works/Programmes Completed/
Achievement
Target
1. No. of EGS Centres 33022 Nos. 33022 Nos.
2. New Primary Schools Nil 497 Nos.
3. Appointment of Teachers 3208 Nos. 4202 Nos
4.
Interventi ons for Disabled Children
(i) Total CWSN enrolled
(ii)CSWN provided assisti ve devices
(iii) Teacher’s Training
(iv) Barrier Free Access
3408 Nos.
32 Nos.
347 Nos.
272 Nos
3630 Nos
1300 Nos.
780 Nos.
272 Nos
5. TLE provided for New Primary Nil 497
362

MEGHALAYA STATE DEVELOPMENT REPORTMEGHALAYA STATE DEVELOPMENT REPORT
6. TLE provided for New Upper Primary Nil 298
7.School Grant (i) Lower Primary (LPs))
(ii) Upper Primary (Ups)
Being collected
-- do --
6618
2259
8.Teacher Grant (i) Lower Primary
(ii) Upper Primary
Being collected
-- do --
16273
10599
9.Text Books & Exercise Books Nil
Nil
410520 LPS
175525 UPs
10.Teachers’ Training (UPs)
Training for untrained Teachers
4716 Nos.
918 Nos.
7023 Nos
1500 Nos.
11.
Block Resource Centres
(i) Appointment of Resource Persons
(ii) Conti ngency Grant
(iii) Meeti ng, T.A.
(iv) TLN Grant
234 Nos.
39 Nos
39 Nos.
39 Nos
234 Nos.
39 Nos.
39 Nos.
39 Nos.
12.
Cluster Resource Centres
(i) Appointment of Resource Persons
(ii) Furniture Grant
(iii) Conti ngency Grant
(iv) Meeti ng, T.A.
(v) TLN Grant
438 Nos.
111 Nos.
438 Nos
438 Nos.
438 Nos.
438 Nos.
111 Nos.
438 Nos
438 Nos.
438 Nos.
13. Civil Works Nil 85201 Nos.LPS- Lower Primary School; UPS – Upper Primary School; TLE – Teaching Learning Equipment; BRC
– Block Resource Centre; CRC – Cluster Resource Centre
Financial Achievement 2008-09 upto september: • Approved Outlay for SSA + NPEGL + KGVB during 2008-09 = Rs. 16613.492 lakhs ; Expenditure up to 1st Quarter = Rs. 1201.99 lakhs; Cumulati ve Expenditure up to the 2nd Quarter ending 30.9.08 for SSA+NPEGL+KGVB =Rs. 4359.44 lakhs; The percentage achievement was 26.24 %.
Statement of Expenditure up to September, 2008 • (Rs. in lakhs)
SI.
No
Name of Scheme (On -Going/ New) (CSS/
State Plan)
Approved outlay
for the scheme
during 2008-09
Achievement up to
September, 2008
1 2 3 4
1 New Primary School 2815.560 157005
2 New Upper Primary School
3 Block Resource Centre 97.500 68.76
4 Cluster Resource Centre 191.068 70.15
5 Civil Works 8335.960 1505.10
6 Toilets, Drinking Water
363
}
}

MEGHALAYA STATE DEVELOPMENT REPORTMEGHALAYA STATE DEVELOPMENT REPORT
7 Interventi ons for Out of School Children 1337.549 138.84
8 Interventi ons for Girls Children
9 Innovati ve Acti viti es 347.000 134.73
10 Interventi ons for Disabled Children 70.736 18.06
11 Maintenance Grants 227.000 -
12 Managements & MIS 731.360 108.97
13 Research & Evaluati on 79.893 1.86
14 School Grants 489.030 205.02
15 Teacher Grants 134.360 103.93
16 TLE 248.400 8.70
17 TLM 13.520
18 Teacher Training 219.376 33.16
19 Community Mobilisati on 25.124 13.27
20 SIEMAT -
21 Free Text Books 1054.593 327.22
22 State Component 131.508 23.79
23 Others
Grand Total Under SSA 16536.017 4345.11
24 NPEGEL 1.20.
25 KGVB 77.475 13.13
GrandTotal (SSA+NPEGEL+KGVB) 16613.492 4359.44 NPEGEL=Nati onal Programme for Educati on of Girls at Elementary Level; KGVB = Kasturba Gandhi Balika Vidyalaya. Source: Educati on Department, Meghalaya
Mid Day Meal (MDM): The Nati onal Programme for Nutriti onal Support to Primary Educati on (NPNSPE) known as Mid Day Meal Scheme is being implemented in the State for providing cooked meals for every child in Govt. and Govt. Aided Primary Schools & EGS Centres and Upper Primary Schools. The cost for conversion of foodgrains has to be met jointly by the Govt. of India @ Rs. 1.80 per child per day and the State Govt. @ Rs. 0.20p per child per day for Primary level and Rs. 2.30 per child per day and Rs. 0.20p by Govt. of India and State Govt. respecti vely at the Upper Primary level. Kitchen devices are being provided by the Govt. of India @ Rs. 2500/- per school and Rs. 2000/- per EGS Centre. Govt. of India has provided fund also for Monitoring, Management and Evaluati on (MME) of the Scheme. Constructi on of Kitchen sheds @ Rs. 60,000/- per school for 2539 Govt. LP Schools has been provided by the Govt. of India. An amount of Rs. 500.00 is proposed for State Share for Mid Day Meal Schemes.
Status of implementati on: The Mid Day Meal Scheme is a Nati onal Programme started in the year 2005. The scheme is related with free distributi on of food grains by Govt. of India through FCI where the transportati on cost incurred by the DRDAs of the respecti ve districts is to be reimbursed by the Govt. of India. Meghalaya as one of the special category state receive the maximum transport subsidy of Rs. 125 per quintal. Initi ally the scheme was implemented by free distributi on of food grains to the children @ 3 Kg per child per month as dry rati on. However, as per Supreme Court order in 2001 all the State Governments are directed to provide cooked Mid Day Meal containing
364

MEGHALAYA STATE DEVELOPMENT REPORTMEGHALAYA STATE DEVELOPMENT REPORT
450 calories and 8-12 grams of protein per child per day.In Meghalaya, Mid Day Meal is given for 210 days in a year to all Governments and Government Aided Primary Schools and EGS Centre. In 2008-09 Upper Primary Schools are also included under the schemes both Government and Government Aided.
Mid Day Meal Schemes during 2007-08:• Total fund received -Rs. 3003.79 lakhs; Expenditure incurred-Rs. 2979.23 lakhs; Unspent Balance- Rs. 33.26 lakhs .Financial Achievement for Upper Primary Schools in Educati onally Backward Blocks for Year • 2007-08: Amount received-Rs. 434 lakhs; Expenditure-Rs. 4,04 lakhs; Total unspent Balance is Rs 7 lakhs. Progress of Implementati on during 2008-09:• Approved Outlay -Rs. 1907.65 lakhs; Expenditure up to the 2nd Quarter ending 30.9.08 = Rs. 1498.70 lakhs.The percentage achievement was 78.56 %. Physical Achievement up to September, 2008: LP Schools-6618; UP Schools-2259; EGS-1197; Total-10074, against the target of 10,074 Schools.
Enrollment up to September, 2008: Total achievement= 675512 against the target of 637266 ; The achievement is based on the release made as per sancti oned of the Government of India for 2007-08. In order to clear the backlog of untrained teachers 2 year diploma course are being conducted by the DIETs. Further, teachers are being deputed in two cycles within a year for the certi fi cate course for Primary Educati on (CPE) being conducted by IGNOU. There are also various short term training being conducted by DERT, DIET and at the Block Resource Centres. Maintenance of Govt. Schools and Govt. Offi ce buildings and also for replacement of dilapidated Govt. schools.Maintenance of Non Formal Educati on Centres now EGS Centres under SSA is also done.
Adult Educati on: Adult Educati on programmes are also undertaken by the department which includes maintenance of staff under DAEO/DSEO, meeti ng the conti ngency, strengthening the Total Literacy Campaign(TLC), Post Literacy Project (PLP) and Conti nuing Educati on Programme (CEP) to remove illiteracy in the adults.
B. Secondary & Higher Educati on: Salaries to Govt. Establishment and recurring maintenance grant to Non-Govt. Insti tuti ons are being given by the Govt. Other programmes include provision of basic faciliti es like school buildings, furniture, Science equipments and Co-curricular acti viti es like Science Seminar and exhibiti on etc. Besides maintaining the existi ng 74 Higher Secondary Schools, (18 Govt. and 56 Non-Govt.) there is a need to set up more Govt. Higher Secondary Schools through out the State in order to cater to the need of transferring the Plus two stage from the college to the school level. There is also a need for assistance for building, equipments etc. enhancement to Non-Govt. Higher Secondary School teachers. These would require considerable investment. There is a need to rati onalise the grant in aid systems and reduce the burden on Govt. mainly in urban centres and to such insti tuti ons which have received aid for considerable conti nued period.
Creati on of essenti al infrastructure for Higher & Secondary Educati on : With the att ainment of statehood in 1972 many of the existi ng educati onal insti tuti ons were inherited from the Govt. of Assam. At present there are 8 Government Secondary, 19 Government Higher Secondary Schools and 3 Government Colleges in the State. The Government has also planned to provincialise 3 Colleges in the State soon. While the status of existi ng insti tuti ons shall have to be maintained, it is the vision of the Government to improve the quality of infrastructure in the educati onal
365

MEGHALAYA STATE DEVELOPMENT REPORTMEGHALAYA STATE DEVELOPMENT REPORT
insti tuti ons in the State. It may also be menti oned that many of the old existi ng insti tuti ons are badly in need of renovati on. However, during the past few years the Govt. has not been able to strengthen infrastructure due to fund constraint. Since good infrastructure is the key to quality educati on, there is an urgent need to strengthen infrastructure in Secondary and Higher educati onal insti tuti ons by upgradati on and modernizati on of existi ng faciliti es, provision of well lit and well maintained school rooms in schools with provision of basic faciliti es like clean toilet, drink clean water and have good play faciliti es, many of which are lacking in schools in the State. Hostels faciliti es for students coming from the villages are urgently required.
The medium-term goal is to ensure these schools have enough classrooms, basic necessiti es such as water and toilets and faciliti es such as sports equipments, libraries, laboratories, hostels etc. Schools are ideal nurturing ground for insti lling in children clean and healthy habits, but this is possible only when water and faciliti es exist.
College & Higher Educati on : According to UGC norms there shall be 5(fi ve) Lecturer per subject in Government and Defi cit grant-in-aid colleges, at present many colleges under defi cit grant-in-aid are having only 2(two) Lecturers per subject. The state proposes to increase the strength of lecturers to 3(three) nos. per subject, subject to fund availability.
Language Development: The recogniti on of Khasi and Garo languages by the Sahitya Academy will depend on the enrichment of these languages in various fi eld likes science, classics, folktales, cultural heritage. The promoti on of language will be done through assistance to authors, translati on and publicati on.
Youth Welfare Programme For Students (NCC & NSS): This programme is partly operated by the DHTE and major share opted by Director of Sports & Youth Services. The Nati onal Service Scheme covers students of College and University level. At present there are approximately 3000 NCC cadets which are not even 10% of the College/University student populati on. Eff orts to increase the NCC, Scouts & Guides & Jr. Red Cross acti viti es in the State to cover all the Districts / Sub-Divisions within the next fi ve year plan and target at least 20 % of the student populati on are necessary to inculcate disciplined and strong youth force.The Ministry of Culture, Youth & Sports Department has approved the establishment of a State level NSS cell to be fi nanced by the Govt. of India in order to increase the acti viti es under the Nati onal Service Scheme.
Vocati onal Educati on / Skill Development : It is necessary to implement Vocati onal Educati on in right earnest so as to divert at least 25% of students completi ng 10 years educati on to the vocati onal stream, reducing the pressure on the universiti es and also preparing students for gainful employment. This would enhance individual employability, reduce the mismatch between demand and supply of skilled manpower and provide an alternati ve for those pursuing higher educati on thus ulti mately diversify educati onal opportuniti es and bring about a change in the structure of the working populati on from the present rate of 2%-3% who are engaged in the industrial sector. The Government is encouraging the Private organizati on to establish Vocati onal insti tuti ons for off ering short term courses on vocati onal educati on. At least 2 vocati onal insti tutes will be established in each district and 3 Secondary/Higher Secondary insti tuti ons will be identi fi ed for running courses in vocati onal educati on. At present Govt. is giving grant for vocati onal educati on to Don Bosco Technical School, Shillong.
C. Training : The programmes under the sector are being administered by the Directorate of Educati onal Research & Training (DERT). These comprises improvement of the quality of educati on through training of teachers, research and innovati on including the development of curricula etc.
366

MEGHALAYA STATE DEVELOPMENT REPORTMEGHALAYA STATE DEVELOPMENT REPORT
The Directorate of Educati onal Research and Training (DERT) is primarily involved in the task of improving and promoti ng the standard and quality of School Educati on and Teacher Educati on in the State through provision of In-service Trainings, holding of Seminars and Conferences, Workshops and undertaking Research Studies, Surveys and Innovati ve Programmes.
Long –term training: To help clear the backlog of In-service untrained Teachers at the Elementary stage, Long-term In-service Trainings for primary teachers are being conducted at the Government Basic Training Centres (BTCs) located at Shillong, Thadlaskein, Resubelpara and Tura as well as at the Non-Govt. Cherra Teachers Training Centre, Sohra. The durati on of the training programmme is two year. Long-term In-service Trainings for Upper Primary Teachers are being conducted at the Government Normal Training Schools (NTSs) located at Sohra and Tura as well as at the District Insti tutes of Educati on and Training (DIETs) located at Sohra, Thadlaskein, Resubelpara, Nongpoh, Nongstoin, Tura and Baghmara. Untrained Primary Teachers are also provided training at the above DIETs during 2008-2009. As per the directi on of the Nati onal Council of Teacher Educati on (NCTE) the durati on of the Training Course is two years.
Basic Computer Training for U.P. School Teachers: 140 Upper Primary Teachers were provided training in Computer Awareness at the Computer Cell of the DERT, Shillong. This scheme will conti nue.
Other Schemes: State Level Screening Test for Nati onal Talent Search Examinati ons & State Talent Search Examinati ons; Intelligence Test for Talented Children from Rural Areas for award of Nati onal Scholarships at the Secondary Stage; Evening Coaching Classes for Tribal Students in Science, Mathemati cs & English in 92 (ninety two) Coaching Centres located in diff erent districts; Grants-in-Aid to Meghalaya Board of School Educati on (MBOSE) and Training of Lower Primary School Teachers on foundati on course for children with disabiliti es in Distance mode are some of the other schemes of the department.
EDUSAT: The uplinking Hub of the Educati onal Satellite has been installed and constructi on of sound proof studio and air conditi oning of rooms is being made.
D. Technical Educati on: The Shillong Polytechnic falls under Technical Educati on with four (4) Streams namely, Civil, Mechanical, Electrical and Electronics besides sponsoring students for various technical courses outside the State. Technical Educati on is being augmented through introducti on of additi onal courses in Shillong Polytechnic, namely, 3years Diploma in Computer Science and Engineering and 2 years post Diploma in Informati on Technology. Under the World Bank Assisted Tech Ed-III Project, two new polytechnics in Jowai and Tura respecti vely have been set up and the matt er of taking over the management of two Polytechnics by the Government or a Society is under considerati on. The new courses introduced are (1) Tura Polytechnic – Food Processing and Preservati on (b) Computer Applicati on (c) Medical Electronics and (2) Jowai Polytechnic
– (a) Architectural Assistantship (b) Costume Design and Garment Technology (c) Automobile Engineering. Community Polytechnic Scheme sponsored by Govt. of India for training of school drop out, women and other disadvantaged groups in technical skills for gainful employment and transfer of technology for improving the local producti on and for generally improving the quality of life of the rural populati on is being implemented through Shillong Polytechnic. The various trades are motor driving and auto mechanic, welding and fabricati on, plumbing and sanitati on,
367

MEGHALAYA STATE DEVELOPMENT REPORTMEGHALAYA STATE DEVELOPMENT REPORT
cutti ng and tailoring, house wiring. The state is likely to upgrade the Shillong Polytechnic to a Degree level Insti tuti on/Engineering College either on its own or in PPP mode. Besides the state permitt ed technical insti tutes, and private universiti es to functi on and hope to make the state a place of learning and educati onal hub (details in the infrastructure chapter).The state is committ ed to exploring the possibility of setti ng up more Technical Professional and Vocati onal Insti tuti ons under PPP Mode.
I.T. Educati on : A strategic IT vision for the State ti tled “IT Vision 2020” has been drawn up by the State Government to cover various aspects of ICT development for the State as well as for promoti ng IT educati on. The overriding focus of the vision is the creati on of jobs through ICT within the State. Human Resource and Skill Development besides facilitati ng placements to youth and student will be the prime focus. The Government envisages reaping the benefi ts of ICT revoluti on in terms of jobs for local youths which will eventually increase the State GDP, socio-economic uplift ment and improvement of human development indices. As of now, youth from the State are forced to migrate to other parts of the country to fi nd jobs in IT/ITeS industries and soft ware companies.IT Department has envisaged the need to have a fi nishing school in IT Sector. The school will provide training, experti se to students and youth and also create a talent pool to make them employable in the rapidly growing ICT sector and local needs of NeGP. The Government intends to train 2000 students over a period of 2(two) years thereby making them IT professional ready for the job market. It may be menti oned that NASSCOM (An autonomous body under Ministry of Communicati on & Informati on Technology) are scouti ng for 2000 students during 2007-08 for employment in the IT Sector but has not been able to reach the target.
11.4. Sports & Youth Services: Development of sports and games and also to take up relevant, youth welfare acti viti es is important aspect of development facet. Necessary infrastructure and faciliti es right from the village and block levels to the District and State Level to promote physical fi tness , discipline, and excellence in sports and all round development are important. More tournaments in various disciplines, creati on of various state Sports Associati ons, parti cipati on in the Regional, Nati onal and Internati onal sports events, regular coaching and training faciliti es are some of the aspects needing att enti on.
11.5. Arts & Culture: Intensive Arts & Culture Dev. Programme and Development of Traditi onal & Folk Music and maintenance of Heritage Conservati on are some of the programmes undertaken under this sector. Performing Arts: Promoti on of Arts & Culture, Fine Arts and Literature is a vital fi eld of acti vity of the Department. The Department is regularly imparti ng lessons free of charge in folk songs and dances and also in Western Music such as guitar and piano playing. Apart from parti cipati on in all major nati onal festi val, the department regularly associated with and sponsored arti stes to parti cipate in the Cultural Programme organized by the North East Zone Cultural Centre, Dimapur at various places with a view to promote cultural exchange between Meghalaya and the rest of the Country. Research and Documentati on: Publicati on of the State Gazett eers, fi nancial assistance to the budding authors to develop and promote literary works, and for producti on of folk literature, promoti on of Garo and Khasi Languages, Museum acti viti es such as collecti on of exhibits and arti facts , promoti on of Traditi onal musical instruments and art and craft galleries. The Development of Traditi onal Folk Music and for Intensive Arts & Culture Development Programme respecti vely are schemes implemented by the choice of MLAs. Hence the sector has
368
MEGHALAYA STATE DEVELOPMENT REPORTMEGHALAYA STATE DEVELOPMENT REPORT
hardly adequate allocati on for the NGOs and associati ons. Archaeology: The preservati on and protecti on of ancient monuments and historical sites in the States also could not make much progress due to shortage of fund. There are ancient and mid age archaeological sites which has not been developed owing to lopsides approach in the matt er. Library Services: The State Central Library, Shillong and four District Libraries at Jowai, Tura, Williamnagar and Nongstoin, at Nongpoh, Sohra and Baghmara have been set up. The library services should be made available in all the District Headquarters of the State. Archives: The State Archives is sti ll in the nascent stage. Only limited numbers of public records, etc. are available at present. Collecti on of old and valuable manuscripts. Documents, fi les from diff erent district headquarters of the State and also from various States in India could not be done for want of space and accommodati on. Further the services of trained personnel and bett er infrastructure are also required for the purpose. State Museum: The State Museum is considered as one of the centre of studies into the history and culture.
11.6. Social Welfare:A. Welfare Programmes: The Department have undertaken a number of major initi ati ves in the Social Welfare Sector, such achievements are vocati onal training programmes, rehabilitati on services to the disabled, training and capacity building for self employment. Schemes are implemented according to the type of disability, environment and social life of the disabled persons. In pursuance with the Disability Act, 1995 several programmes were incorporated towards the welfare and rehabilitati on of the Disabled and Handicapped persons according to availability of funds. NGOs and Voluntary Organisati ons play a vital role in the development of the society and most of the schemes are implemented through NGOs/Voluntary Organisati ons by providing training and fi nancial assistance to the NGOs and Voluntary Organisati ons. Eff ort is being made to mobilize the Non- Governmental Organisati ons to take up schemes of Central as well as State Sector.
B. Nati onal Social Assistance Programme: i) Nati onal Old Age Pension Scheme:- The Programme envisages payment of fi nancial assistance to old age persons of the age from 65 years and above residing in the villages and urban areas who live below the BPL who are desti tutes. The state pay @ Rs 200 pm at present to eligible old persons. (ii) Nati onal Family Benefi t Scheme:- The Programme provides lump sum assistance of Rs 10,000/- to the households living below poverty line on the death of a primary bread winner in the age of 18 to 64 years to help to the immediate need of the family.
C. WELFARE OF HANDICAPPED : i) Scholarship to Physically Handicapped Students : The rate of scholarship for the physically handicapped is too meagre. During 2008-09, 592 students were covered. Such benefi ts should cover all the handicapped persons. ii) Grant in aid to Voluntary Organisati ons :Financial assistance is given to Voluntary Organisati ons for maintenance of special school, vocati onal training etc for the physically challenged person. The allocati on is quite meagre.
369

MEGHALAYA STATE DEVELOPMENT REPORTMEGHALAYA STATE DEVELOPMENT REPORT
iii) Assistance to Physically Handicapped Persons for Vocati onal Training/ for Self Employment: One year Vocati onal training is imparted to physically handicapped persons in carpentry, handicraft , knitti ng, tailoring etc. During the training period they are given a sti pend of Rs.500/- per month each and an honorarium of Rs.800/- per month is given to the instructors. Here also the allocati on is paltry. iv) Implementati on of the Disability Act, 1995 : In pursuance of the Disability Act, 1995 disabled students are given fi nancial assistance in the form of uniform grant, book grant, conveyance allowance, and unemployment allowance to the disabled persons. During 2008-09, 600 disabled students is covered under the Scheme.v) Rehabilitati on Treatment for the Disabled :The main objecti ve of the scheme is to rehabilitate the persons with disability as normal citi zen which also include treatment of all types of disabiliti es. Under the Scheme, fi nancial assistance for a maximum amount of Rs.25000/- for treatment outside the State is provided to the family whose income does not exceed Rs.3000/- per month based on the recommendati on of the Government Medical Offi cer. vi) NPRPD – Nati onal Programme for Rehabilitati on of Persons with Disabiliti es : The NPRPD started as a Central Sector Scheme with the basic objecti ve of providing comprehensive rehabilitati on services to persons with disabiliti es, especially in rural areas closer to their doorstep through a four-ti er delivery system established at Community, Block, District and State levels. There is a provision for two Community Based Rehabilitati on Workers (CBRWs) at the Community and two Multi purpose Rehabilitati on Workers (MRWs) in districts covered under the scheme. A District Resource Centre have been set up at Shillong and Tura and also State Resource Centre was established at Shillong during 2002-03. The scheme has been made a State Scheme under which provision to maintain the CBRW/ SRC Shillong, Tura etc are required. vii) Implementati on of PWD Act, 1995 – Appointment of Commissioner of Disabiliti es : In pursuance of Secti on 60 of the Disability Act, 1995, the full fl edged Commissioner for Persons with Disabiliti es have been appointed .
D. Field Survey of Social Problems: Conducti ng the survey on problems of sexual abuse and traffi cking of women and children; conducti ng survey to ascertain the deprivati on of children in need of care and protecti on and other such requirements are also made.
E. Contributi on to Meghalaya State Social Welfare Advisory Board is also made by the government.
F. Welfare Of Aged, Infi rm And Desti tutes: i) Nati onal Plan Of Acti on For Women Grant In Aids For Voluntary Organisati on For Care Of Desti tute, Widows, Aged And Infi rm Women: Financial assistance is given to Voluntary Organisati ons working for the welfare of desti tutes, widows, aged and infi rm women are given under the scheme. However, the allocati on are paltry. ii) Medical Treatment for the Aged: Enhanced rate proposed of Rs 2000/- per benefi ciary are given to more than 170 aged persons. iii) Nati onal Plan of Acti on for Older Persons : In pursuance of the Nati onal Policy for Older Persons and Plan of Acti on of the Government of India to strengthen the legiti mate place of the elderly in the society, advocacy meet/ sensiti zati on programme for strengthening the integrati on and bond between the young and the old are conducted. iv) Internati onal Day for Older Persons are celebrated on October 1st .
370

MEGHALAYA STATE DEVELOPMENT REPORTMEGHALAYA STATE DEVELOPMENT REPORT
G. Constructi on of Probati onary Hostel and Reformatory School: The three homes set up under the Juvenile Justi ce Act 2000, are being housed in rented building with insuffi cient faciliti es and space. It is therefore necessary to construct own buildings/homes.
H. Women and Child Development: Women and Children are the most important secti on in our society more so where the society is matrilineal. Programmes for their welfare. Orphans, desti tutes, children and deserted women require Government interventi on to overcome their problems. Educati ng and raising women’s economic status means educati ng and improving the economic conditi on of a family are most important. Children being vulnerable and helpless require a greater social, governmental and NGOs support in order to bring about a healthy environment amongst women and children in the State. i) Grant-in-aid to Voluntary Organisati ons Working in the Field of Child Welfare to voluntary organisati ons working for the welfare and development of children in rural areas like creches, orphanages etc. are given by the state Government. Moti vati on of the non-governmental organisati ons to take up other schemes such as foster care, adopti on services, welfare services for street children and working children (Child Labour) are also stressed. ii) Only 1 (one) Creche is run for the benefi t of the State Govt. Employee’s Children at Shillong. iii) Correcti onal Services: i) Implementati on of Children Act. Establishment of Juvenile Guidance Centre: The Juvenile Justi ce Care and Protecti on of Children Act, 2000 which replace the Juvenile Justi ce Act 1986, clearly defi ne that 2 ( two) separate home should be set up for the delinquent juvenile i.e. Observati on and Special Home and a separate Home for the neglected children known as Childrens’ Home which may be run by NGOs with fi nancial assistance 50:50 basis between the Central and State Government. ii) Children’s Home for the recepti on and rehabilitati on of child in need of care and protecti on pending enquiry report if any and subsequently for their care, treatment, educati on, training development and rehabilitati on separately for boys and girls with 25 inmates and also to set up one Shelter Home for the children in the urgent need of care and protecti on such as desti tute, street children and runaway children, requiring immediate shelter such as victi m of domesti c violence and traffi cking etc . iii) Grant in aid to Voluntary Organisati ons for Protecti ve Homes and Anti Drug Campaign and support the NGOs working in the fi eld of women’s issues for setti ng up of temporary shelter/protecti ve homes for women who are victi m of domesti c violence and to organise sensiti zati on programme for the police, judiciary, health personnel and N.G.Os. are also being done, iv) Celebrati on of Anti Drug Day: June 26th is observed as an Internati onal Day for Drug Abuse. The Department in collaborati on with NGOs observes the Day in all the seven District Headquarters to highlighti ng the problems faced by the Drug users and preventi on on Drug Abuse. v) Interventi on Programmes for Drug Abuse: The problem of drug addicti on is one of the main issues in the present day context and fi rm and rati onal measures are essenti al to combat this menace in the State.
I. Women Welfare: i) Training Centre for Self Employment for Women in Need of Care and Protecti on: At present, the State Govt. is running 3 (three) training centres for 105 desti tutes women. The training centres
371

MEGHALAYA STATE DEVELOPMENT REPORTMEGHALAYA STATE DEVELOPMENT REPORT
impart training in tailoring, knitti ng, embroidery and weaving for a period of one year. During the training period a sti pend of Rs. 500/- per month per trainee is given. Aft er successful completi on of the training, they are given a token grant of Rs. 5000/-, Rs. 4000/- and Rs. 3500/- respecti vely according to the grade they secured to enable them to start their own self employment. At present the above 3 training centres are located at Shillong, Jowai and Tura only with a capacity of 40, 25 and 40 respecti vely. It is felt necessary to diversify and upgrade the training in few more trades such as leather works, toy making etc in the training centre at Shillong since these trades have more employment/ income avenues. ii) Assistance to Voluntary Organisati ons for Setti ng up Training Centres for women and care of their children : Financial assistance is given to voluntary organisati ons working for the welfare of women in diff erent acti viti es such as handicraft s, training centres. iii) Nati onal Plan of Acti on on Women’s Policy and Empowerment: The Department had initi ated preparati on of the State Plan of Acti on on Women’s Policy and Empowerment. The Plan of Acti on incorporated programme acti on oriented on women’s component and other related women’s acti viti es of allied Department. Eff ort is also being made for convergence and networking of women’s development programmes at diff erent level with NGOs which have strong presence at the community level for the empowerment of women. iv) Meghalaya State Commission for Women: The State Commission for Women was set up in the State during 2004-05 on the line of the Nati onal Commission. v) Setti ng Up Employment -cum-Income Generati ng Units For Women (NORAD) : The scheme to train women folks in diff erent income generati ng trades so as to enable them to earn their livelihood and improve their economic status in the Training Centres for Self Employment for Women in need of Care and Protecti on. The objecti ve of the scheme is to train women, preferably in the non-traditi onal areas and to ensure their employment.
J) SWARADHAR: The Government of India has designed a scheme known as ‘Swardhar’ with a more fl exible and innovati ve approach to cater to the requirement of various types of women in distress in diverse situati ons under diff erent conditi ons. The objecti ve of the scheme is to provide primary need of shelter, food clothing and care to the marginalized women/girls living in diffi cult circumstances who are without any social and economic support and to rehabilitate them socially and economically through educati on.
K. Centrally Sponsored Schemes: The following Centrally Sponsored Schemes are being implemented by the Department : i) Integrated Child Development Services Scheme: 1 (one) State ICDS Cell att ached to the Directorate of Social Welfare; 5 (fi ve) District ICDS Cells with Head Quarter at Shillong, Tura, Nongstoin, Jowai and Williamnagar. 39 (thirty nine) ICDS Projects offi ces at Block Level Head Quarter(s); 2 Urban ICDS Project in Shillong and Tura with 190 AWCs. 3388 Anganwadi Centres and 1234 Mini Anganwadi Centres. Government of India has sancti oned so far 1725 anganwadi buildings. Each building has one room att ached with kitchen, store room, water tank and toilet faciliti es @ of Rs.1.25 lakhs/ Rs.1.75 lakhs. 700 anganwadi buildings have been completed and constructi on of 457 Anganwadi buildings is under progress during 2008-09. Status of the programme has been menti oned under Rural development ( chapter-7) ii) Training Programme of the Anganwadi Workers under the ICDS Scheme: Meghalaya has 2 (two) AWTCs, one at Shillong which caters to the ICDS functi onaries from Khasi and Jainti a Hills Districts, the other at Tura covering Garo Hills Districts. Government of India has also sancti oned one MLTC
372
MEGHALAYA STATE DEVELOPMENT REPORTMEGHALAYA STATE DEVELOPMENT REPORT
located in the State Headquater Shillong which conducted all training programmes of middle level fi eld functi onaries, and the lady supervisors. The MLTC also conduct the innovati ve training programme to in collaborati on with SIRD and allied Department.The MLTC has also brought out publicati ons and pamphlets, posters and have translated the materials in local languages (Khasi and Garo) to disseminate informati on on Nutriti on, Health and Educati on etc. iii Nutriti on Surveillance System (NSS) :The project is implemented through Nati onal Insti tute of Nutriti on (NIN) Hyderabad in collaborati ve exercise between Department of Women and Child Development, NIN and the State Govt. The project involves training/ reviewing/ monitoring on the implementati on of ICDS Programme at the district level and project levels and also involving anganwadi workers. iv) Balika Samridhi Yojana (BSY) : Balika Samriddhi Yojana (BSY) was introduced during 1997-98 and was implemented in the State covering 12357 benefi ciaries. The Scheme aims at giving prime importance to a girl child to ensure populati on stabilizati on with gender equity and sustain socio-economic development. The benefi ts under (BSY) is restricted to two girl child. The BSY is part of the long term strategy to change social atti tude and behavioural practi ces towards the girl child. v) Kishori Shakti Yojana – KSY (Adolescent Girls Scheme) :The scheme Kishori Shakti Yojana, a component of ICDS scheme aims to improve the nutriti onal health of the adolescent girls, promote awareness of health, hygiene, nutriti onal and family care, link them for learning life skill and take steps to become producti ve member. The scheme is in operati on in all the 39 ICDS Projects as per the guidelines of Govt. of India. vi) Integrated Women’s Empowerment Programme (IWEP): The objecti ves of the Scheme is establishment of self reliant women Self Help Groups (SHGs), creati on of confi dence and awareness among members of Self Help Groups, social, economic and politi cal issues. Integrated Women Empowerment Programme is implemented in the 5 (fi ve) Community and Rural Development Blocks viz; Betasing in West Garo Hills, Mawshynrut in West Khasi Hills, Resubelpara in East Garo Hills, Umling in Ri Bhoi District and Mylliem in East Khasi Hills. The fi rst phase is over in 2006-07 and it has been extended to 2007-08. The second phase is to start from 2008. During the 2nd Phase, 6 Community and Rural Development Blocks is likely to be recommended for implementati on of the scheme. vii) Integrated Child Protecti on Services: Under the Juvenile Justi ce ( care and protecti on of children’s) Amendment Act, 2006 it is mandatory to set up the child protecti on units as provided under secti on 62 A. Child Protecti on Unit for State and such Units for every District consisti ng of such offi cers and other employees as may be appointed by the Government, to take up matt ers relati ng to children in need of care and protecti on and juveniles in confl ict with a view to ensure the implementati on of this Act including the establishment and maintenance of homes, noti fi cati on of competent authoriti es in relati on to these children and their rehabilitati on and co-ordinati on with various offi cial and non-offi cial agencies concerned. In Writ Peti ti on (civil) No.473 of 2005 Sampurna Behrua Vrs Union of India & others, the department have given some kind of commitment/assurance that the consti tuti on of the Child Protecti on Units would be taken up.
L). Nutriti on: Schemes implemented under nutriti on are as follows: i) Supplementary Nutriti on in Urban Areas : S.N.P. in Urban Areas is provided to malnourished children below 6 years of age, expectant and nursing mothers of low income group in all the Districts headquarters. The programme is run by the District Social Welfare Offi cers through the non-governmental organisati ons and communiti es in 63 centres covering 13200 benefi ciaries i.e. East Khasi Hills - 12 centres, West Garo
373

MEGHALAYA STATE DEVELOPMENT REPORTMEGHALAYA STATE DEVELOPMENT REPORT
Hills - 10 centres, Jainti a Hills - 9 centres, East Garo Hills, South Garo Hills, Ri Bhoi District and West Khasi Hills District - 8 centres each. The cost of foodstuff given to each benefi ciaries is @ Rs.1.20/- for children and @ Rs.1.50/- for pregnant and nursing mothers for 300 days in a year i.e. 25 days in a month. Foodstuff such as bengal gram, groundnut, soyabean, suji, dried peas are provided to the benefi ciaries at the rate menti oned above. ii) Nati onal Nutriti on Mission : Nati onal Nutriti on Mission was introduced by the Government of India during the year 2002-03 for implementi ng subsidized foodgrains to adolescent girls, expectant and nursing mothers belonging to Below Poverty Line families and undernourished. In Meghalaya, East Khasi Hills District has been selected for covering seven ICDS Projects. The programme is to be implemented in the lines of weighing and identi fi cati on of undernourished, distributi on of 6 kgs of foodgrains (wheat/ rice) based on local habitual through Public Distributi on System. Training in weighing, health and nutriti on educati on, health check up, referral services, to conduct IEC programme and purchase of weighing scales. The programme is to be implemented through a network with the Department of Food and Civil Supplies and Deputy Commissioner of the concerned district for necessary arrangement of foodgrains and distributi on through Public Distributi on System. iii) Supplementary Nutriti onProgramme for ICDS Scheme : The Social Welfare is the Nodal Department in the implementati on of Supplementary Nutriti on Programme in the State i.e. by providing supplementary nutriti on to children below 6 years, pregnant and nursing mothers and adolescent girls to improve the health and nutriti onal status of women and children in rural areas. In the implementati on of SNP Scheme food stuff i.e. Bengal gram, Ground nut, Soya bean, Dried peas, Suji, Rice fl akes, Green peas, Sugar, Onion, Mustard oil, and Iodised salt are being distributed to the benefi ciaries through AWCs in the 39 ICDS. The present unit cost under S.N.P. per benefi ciary per day is @ Rs.2.00p for 0 - 6 years children, @Rs.2.70p for severely malnourished children, @ Rs.2.30p for pregnant mother, nursing mother and adolescent girls. The number of feeding days in a year is 300 days i.e. 25 days in a month . During 2008-09 , 589975 benefi ciaries were covered under the Scheme.
M) Welfare of Scheduled Castes/Scheduled Tribes/ Other Backward Classes: The All India pre-Examinati on Training Centre (AIPETC) is meant for meeti ng the need for imparti ng Coaching Classes to SC/ST candidates who intended to appear at the Civil Services Examinati on conducted by UPSC every year.
11.7. Labour & Employment: i) Strengthening of the machinery such as Directorate, District Labour Offi ces and opening of Sub-Divisional Labour Offi ce,for proper implementati on of Labour Laws such as (i) Minimum Wages (ii) Child Labour Act and Rules (iii) Contract Labour Act and Rules (iv) Shop and Establishment Act and Rules (v) Motor Transport Act and Rules (vi) Inter State Migrant Act and Rules etc. ii)Establishment of Labour Welfare Centres : Labour Welfare Centres at Mendipathar, Byrnihat, Umiam and Khliehriat for providing free training in sewing, knitti ng and embroidery to the workers and their family members are done in the state. iii) The Inspectorate of Boilers and Factories: It has only a Skeleton Staff ’s since the date of its inspecti on in 1973. With the present trend of development in the fi eld of Technology and the expansion of Industrial sector, where many industries have been set up in the state especially in the Medium Scale Sector, registrati on
374

MEGHALAYA STATE DEVELOPMENT REPORTMEGHALAYA STATE DEVELOPMENT REPORT
and inspecti on of these factories and boilers are numerous and cannot be taken up only with the existi ng manpower. iv)Employment & Training: a)Employment Services :The Employment Wing is responsible for administrati on, control and supervision of the Employment Exchanges in the State. The main acti viti es of Employment Exchanges include placement of registered unemployed youth against vacancies noti fi ed by Employers, Employment Market Informati on(EMI), for collecti on of employment and unemployment data and conducti ng Vocati onal Guidance Programmes to educated unemployed youth. The present system does have some constraints to take up such task. (b) Craft smen Training : The Training Wing is responsible for implementi ng the Craft smen Training Schemes(CTS) and Apprenti ceship Training Schemes(ATS) at the Certi fi cate level. The Craft smen Training Schemes being implemented through a network of ITIs/ ITCs is the core Scheme for Vocati onal Training. Its objecti ves are to inculcate and nurture a technical and industrial atti tude in the minds of the younger generati on and reduce unemployment among the educated youth by providing them employable training.
With globalizati on, liberalizati on and entry of multi nati onal Companies, the industrial sector has taken a new shape. The employment growth in the organised sector is on the decline. Vocati onal Training thus needs re-orientati on so as to meet the requirement of the changing scenario which is envisaged to be achieved. Running of Short Term Employment Oriented Course outside Nati onal Council of Vocati onal Training (NCVT) patt ern and taking the skill development and mini ITIs and more ITIS in PPP mode or by govt. is essenti al. – At a ti me when our youths are facing un-employment problem it is desirable to include new training programmes in the existi ng ITIs by running Short Term Employment Oriented Course as per the local requirement.
11.8 The Human Development Index 2: This secti on provides a comparati ve analysis of the level of human development in terms of the Human Development Index (HDI) and Gender related Development Index (GDI) among the states in India and among the districts in Meghalaya.
Human development is the combinati on of people’s enti tlements and att ainments relati ng to educati on, health and livelihood. These three areas, taken together, form the everyday experience of ‘development’ for the people as individuals and as members of a community, state or nati on. The concept of human development is a people-centred approach to development where the primary concern is enhancement of human well-being. Human development therefore corresponds to a holisti c approach in the process of development.
The term human development denotes both the process of widening people’s choices and the level of their achieved well-being. It also helps to disti nguish clearly between two sides of human development. One is the formati on of human capabiliti es, such as improved health and knowledge. The other is the use that people make of their acquired human capabiliti es, for leisure, producti ve purposes or being acti ve in cultural, social and politi cal aff airs. If the scales of human development do not fi nely balance the two sides, considerable human frustrati on may result.
2 Meghalaya Human Development Report, 2008.
375

MEGHALAYA STATE DEVELOPMENT REPORTMEGHALAYA STATE DEVELOPMENT REPORT
Beginning with the fi rst HDR of 1990 the UNDP has developed a summary indicator for the level of achievement in human well-being, called the Human Development Index (HDI). It measures achievements in the basic dimensions of human development – health, educati on and income. It is normalized to a scale of 0 to 1 where 1 implies that maximum human development is achieved as per the pre-defi ned norms and 0 implies no achievement at all.
The MHDR, 2008 have constructed the HDI for each district with the following key components. For the fi rst component – a long and healthy life –the Infant Mortality Rate (IMR) has been used. For the second component – knowledge –two indicators, the literacy rate with two-thirds weight and the combined gross enrolment rati o (primary to higher secondary level) with one-third weight have been used. For the third component – a decent standard of living – is measured with per capita income.
Meghalaya ranks poorly in level of Human Development. Meghalaya ranked 24th in HDI in 1991. Its positi on has deteriorated from a rank of 21 in 1981. The HDI value of 0.365 is also lower than the All-India average of 0.381. This is the case when we take the combined HDI of rural and urban sectors. It refl ects the situati on in the rural areas due to the populati on weightage of the rural sector.
The picture in the urban sector, however, is diff erent. The HDI has improved from a value of 0.442 in 1981, which incidentally is exactly equal to the All India average, to 0.624 in 1991, which is higher than the All India average of 0.511. The rank of urban Meghalaya in HDI over the same period improved from 21st to 10th. Obviously, this is a big leap forward 3.
Among the North Eastern States, Meghalaya showed bett er performance than Assam and Arunachal Pradesh only. The other states of the region, namely, Manipur, Mizoram, Nagaland, Sikkim and Tripura showed higher achievements in human development in 1991.
The situati on has further deteriorated in 2005. Although the HDI values are not directly comparable with those of the Nati onal Human Development Report, 2001; the ranking of the states may be compared. Out of the 35 states and Union Territories, Meghalaya ranks 26th in human development (Table 11.1) slipping two places down the ranking in 1991. The HDI rank for the rural areas of the state is 24th, same rank as in 1991; and for the urban areas, it is 22nd in 2005 down from a rank of 10th in 1991.
A closer look at some of the components of the HDI suggests that there has been stagnati on or no development in Meghalaya in some areas. For instance, the IMR of Meghalaya has remained more or less constant in the recent years. In the spheres of educati on and income in Meghalaya, available data show that that there has been improvement and growth during the 25 year period of 1981 to 2005. However, the deteriorati on in the ranking of Meghalaya in HDI implies that the rate of development is slower than the rate in most of the states and hence many states have improved their ranking while Meghalaya has lagged behind. 3 The HDI values of different States for 1981 are taken from the National Human Development Report, 2001.
376
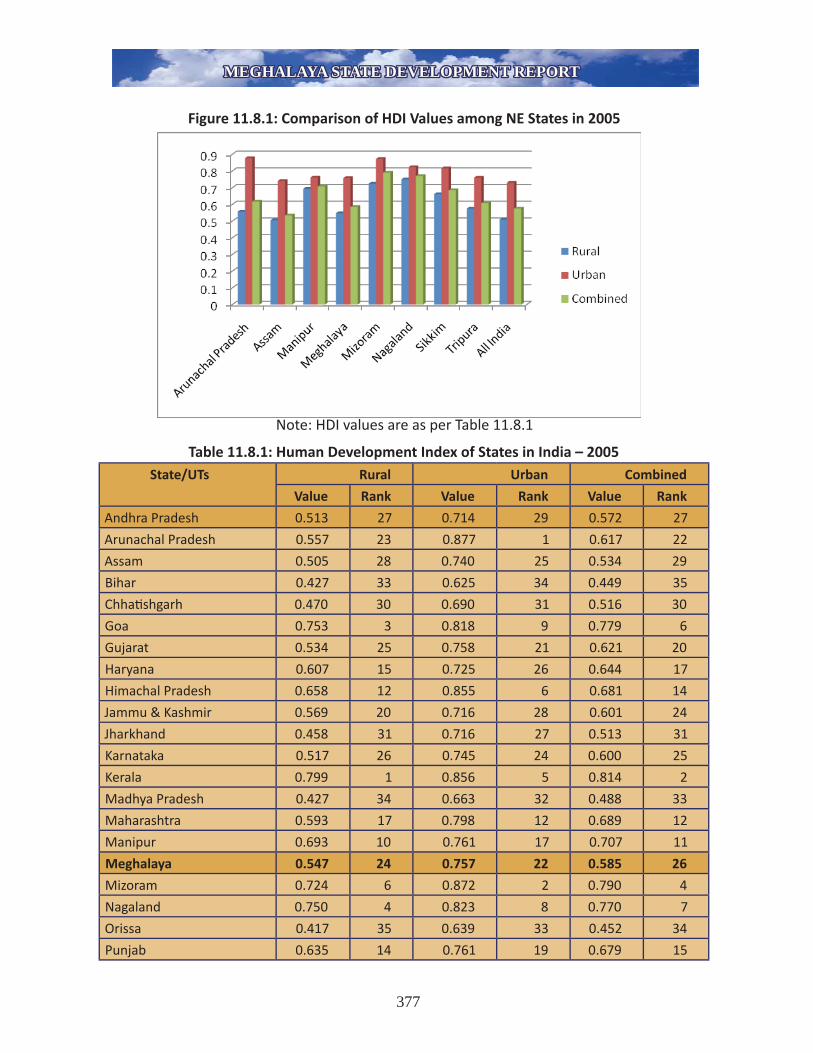
MEGHALAYA STATE DEVELOPMENT REPORTMEGHALAYA STATE DEVELOPMENT REPORT
Figure 11.8.1: Comparison of HDI Values among NE States in 2005
Note: HDI values are as per Table 11.8.1
Table 11.8.1: Human Development Index of States in India – 2005State/UTs Rural Urban Combined
Value Rank Value Rank Value Rank
Andhra Pradesh 0.513 27 0.714 29 0.572 27
Arunachal Pradesh 0.557 23 0.877 1 0.617 22
Assam 0.505 28 0.740 25 0.534 29
Bihar 0.427 33 0.625 34 0.449 35
Chhati shgarh 0.470 30 0.690 31 0.516 30
Goa 0.753 3 0.818 9 0.779 6
Gujarat 0.534 25 0.758 21 0.621 20
Haryana 0.607 15 0.725 26 0.644 17
Himachal Pradesh 0.658 12 0.855 6 0.681 14
Jammu & Kashmir 0.569 20 0.716 28 0.601 24
Jharkhand 0.458 31 0.716 27 0.513 31
Karnataka 0.517 26 0.745 24 0.600 25
Kerala 0.799 1 0.856 5 0.814 2
Madhya Pradesh 0.427 34 0.663 32 0.488 33
Maharashtra 0.593 17 0.798 12 0.689 12
Manipur 0.693 10 0.761 17 0.707 11
Meghalaya 0.547 24 0.757 22 0.585 26
Mizoram 0.724 6 0.872 2 0.790 4
Nagaland 0.750 4 0.823 8 0.770 7
Orissa 0.417 35 0.639 33 0.452 34
Punjab 0.635 14 0.761 19 0.679 15
377

MEGHALAYA STATE DEVELOPMENT REPORTMEGHALAYA STATE DEVELOPMENT REPORT
Rajasthan 0.485 29 0.691 30 0.537 28
Sikkim 0.661 11 0.816 10 0.684 13
Tamil Nadu 0.598 16 0.766 16 0.675 16
Tripura 0.575 19 0.760 20 0.608 23
Utt ar Pradesh 0.454 32 0.618 35 0.490 32
Utt arakhand 0.585 18 0.761 18 0.628 18
West Bengal 0.567 21 0.757 23 0.625 19
Andaman & Nicobar Is. 0.707 9 0.864 4 0.766 8
Chandigarh 0.717 7 0.872 3 0.860 1
Dadra & Nagar Haveli 0.563 22 0.833 7 0.618 21
Daman & Diu 0.729 5 0.783 15 0.754 9
Delhi 0.712 8 0.796 13 0.789 5
Lakshadweep 0.783 2 0.805 11 0.796 3
Puducherry 0.654 13 0.791 14 0.748 10
All India 0.509 0.730 0.575Source: Special Calculati ons for the Meghalaya State Human Development Report by Veronica Pala.
For details of data and methodology used please see the Report(MHDR2008).
The district with the highest HDI is East Khasi Hills district followed by West Garo Hills district. The two major towns of the state namely, Shillong and Tura, are in these two districts and the relati vely higher HDIs of these districts seem to suggest that human development in Meghalaya has been urban-centric. The other fi ve districts exhibit HDIs that are lower than the state average. Table 11.8.2: Human Development Indices of Districts of Meghalaya
DistrictInfant
Mortality Rate
Literacy
Combined Gross
Enrolment Rati o
NSDP Per Capita at current
prices (Rs.)
HDIHDI
Rank
East Khasi Hills 34.51 76.98 63.10 24793 0.676 1West Garo Hills 18.13 51.03 65.99 13782 0.571 2Ri Bhoi 60.63 66.07 50.47 14752 0.496 3South Garo Hills 102.01 55.82 85.52 23321 0.484 4Jainti a Hills 77.34 53.00 43.31 20405 0.469 5West Khasi Hills 86.17 65.64 79.13 9926 0.405 6East Garo Hills 90.60 61.70 60.91 12047 0.396 7Meghalaya 52.28 63.31 62.87 17595 0.550
Notes and data sources: (i) Infant Mortality Rates are as per the esti mates obtained from the Birth & Mortality Survey, 2007(ii) Literacy rates are as per the Census of India, 2001 (iii) The gross enrolment rati o is obtained by dividing the combined enrolment numbers by the populati on aged 5 - 19 years in 2001. The combined enrolment numbers are for Classes I - XII as per the All India Seventh Educati onal Survey, 2002.(iv) Net State Domesti c Product Per Capita at current prices are for the year 2004-05 provided by Directorate of Economics & Stati sti cs, Government of Meghalaya.
378

MEGHALAYA STATE DEVELOPMENT REPORTMEGHALAYA STATE DEVELOPMENT REPORT
The most backward district of the state as per our calculati ons is East Garo Hills. However, fi ve districts out of seven have HDIs value that are lower than 0.5. The HDI scale is a 0 to 1 scale and if we take 0.5 as the half way mark of development, then all districts of Meghalaya except East Khasi Hills and West Garo Hills fall short of that mark. Put another way, they have not achieved even half of what is supposed to be done in the basic areas of human development. South Garo Hills has the highest IMR among all the districts, but because of highest enrolment rati o, it manages to claim positi on No. 4 in the HDI ranking.
Summing up it may be noted that the concept of human development is much broader and more complex than any summary measure can capture. The HDI is not a comprehensive measure. It does not include important aspects of human development, notably the ability to parti cipate in the decisions that aff ect one’s life and to enjoy the respect of others in the community. The indices give an overview of some basic dimensions of human development, but they must be complemented by looking at the underlying data and other indicators.
11.8.1. Health
The key indicators of the status of health of the people of Meghalaya do not show a happy picture. For instance, in 2002-04, full Immunisati on Coverage for Children 12 - 35 months of age was only 14 percent, Coverage of Full Ante-Natal Care for Pregnant Mothers was only 12 percent and only 35 percent of deliveries are att ended by skilled persons. The same indicators for the other North Eastern States are much bett er. Signifi cant inter district variati ons are also observed. Full Immunisati on Coverage for Children 12 - 35 months of age and Coverage of Full Ante-Natal Care for Pregnant Mothers are very low in the three districts of Garo Hills (Source: Rapid Household Surveys for RCH Services).
The IMR is one of the most important indicators of the health status because of its correlati on with a number of health and economic characteristi cs like poverty, illiteracy, health and educati on of the mother, access to health care faciliti es and so on. The IMR in Meghalaya in 2007 is 52.28 per 1000 live births. South Garo Hills is observed to have the highest IMR (102) among all the districts. Other districts with IMR above the state average are East Garo Hills, West Khasi Hills, Ri Bhoi, and Jainti a Hills. In other words, the moderate IMR of the state is because of low IMR in East Khasi Hills and West Garo Hills only.
As per SRS survey, the IMR for Meghalaya in 2006 was 53. It is lower than the nati onal average of 57. The rural IMR was 54 for Meghalaya, 62 for all India; urban IMR was 43 for Meghalaya and 39 for all India. Among the states in the North Eastern Region, Assam had the highest IMR of 67. The rest of the NE states showed IMRs that were lower than Meghalaya. Among the NE states, however, Meghalaya has the highest birth rate (24.7) and also the highest death rate (8.0) except Assam with death rate of 8.7 (SRS Bulleti n, October 2007).
379

MEGHALAYA STATE DEVELOPMENT REPORTMEGHALAYA STATE DEVELOPMENT REPORT
Figure 11.8.2: Birth Rate, Death Rate and Infant Mortality Rate in Districts of Meghalaya, 2007
Source: Birth and Mortality Survey, 2007
As per NFHS-34 (2005-06), the total ferti lity rate or number of children per woman in Meghalaya was 3.8. It has declined from 4.57 in 1998-99. However, this is much above the nati onal average of 2.7. Other states with total ferti lity rate of 3 and above are Utt ar Pradesh, Rajasthan, Madhya Pradesh, Jharkhand, Arunachal Pradesh and Nagaland. The contracepti ve prevalence rate for currently married women is the lowest at 24 percent in Meghalaya among all the states in India. The nati onal average is 56 percent. It is highest in Himachal Pradesh at 73 percent followed by West Bengal at 71 percent. A state closer to Meghalaya’s performance in this regard is Nagaland at 30 percent.
Unmet need for family planning among currently married women is 13 percent for the country as a whole. Among the states, the lowest is 5 percent in Andhra Pradesh and the highest is Meghalaya with 35 percent. In additi on to Meghalaya, more than 20 percent of women have an unmet need for contracepti on in Nagaland, Jharkhand, Bihar and Utt ar Pradesh.
At the all India level, as per NFHS-3, 52 percent of mothers had three or more antenatal care (ANC) visits. Meghalaya’s fi gure is slightly above the nati onal average at 53.4 percent. However, other indicators are below the nati onal level. The percentage of births assisted by doctors/ nurses/ LHV/ ANM or other health personnel is 31.7 percent in Meghalaya; 47 percent for all India. The percentage of insti tuti onal births is 29.7 percent in Meghalaya; 39 percent for all India. The percentage of mothers who receive post natal care from doctors/ nurses/ LHV/ ANM or other health personnel is 28.8 percent in Meghalaya; 42 percent for all India. Besides, Meghalaya is among the states where the provision of IFA (iron and folic acid) supplements was far below the nati onal average.
4 Available at http://www.nfhsindia.org
380

MEGHALAYA STATE DEVELOPMENT REPORTMEGHALAYA STATE DEVELOPMENT REPORT
Figure 11.8.3: Infant Mortality Rates of the States/UTs of India, 2007
Source: IMRs for bigger states are for the year 2007; for smaller states and Union Territories they are based on three year period 2005-2007 (SRS Bulleti n, Vol 43, No. 1, October 2008).
381

MEGHALAYA STATE DEVELOPMENT REPORTMEGHALAYA STATE DEVELOPMENT REPORT
At the all India level 48 percent of children under 5 years of age are stunted and 43 percent are underweight. Wasti ng is quite as serious problem in India, aff ecti ng 20 percent of children. In Meghalaya, 42 percent are stunted, 46 percent are underweight and 28 percent are wasted. These fi gures point to a very sad state of Undernutriti on.
Anaemia is a very common problem in India. 79 percent of children aged 6-35 months are anaemic in the country as a whole. In Meghalaya, the fi gure stands at 68.7 percent. NFHS-3 reports that although state diff erenti als in the prevalence of anaemia are marked, a high prevalence of anaemia is found in every state.
Meghalaya, however, shows signifi cantly lower levels of Undernutriti on and Obesity among adult men and women. In Meghalaya 14 percent (36 percent in all India) of ever married women have BMI below normal. 8 percent (34 percent in all India) of ever married men have BMI below normal. In India, 15 percent of ever married women are overweight and obese. The fi gure is less than half of the all India average in Meghalaya at 7 percent.
Anaemia is a major health problem for adults as well as in children. It aff ects 55 percent of women and 24 percent of men in India. In Meghalaya too the problem is serious with signifi cantly less gender diff erenti al. It aff ects 45.4 percent of ever married women aged 15-49 and 34.2 percent of ever married men aged 15-49 in Meghalaya. 56 percent of pregnant women in Meghalaya are anaemic. This leads to high prevalence of anaemia among children.
The key indicators of the status of health of the people of Meghalaya are worrisome, to say the least. Much more needs to be done to improve the health care services and health of the people of Meghalaya.
The state has acute shortage of specialized manpower and proper basic health care faciliti es especially in the rural areas. Most of the CHCs in Meghalaya functi on without specialists. For providing quality health care services and for making these services more accessible to the rural poor populati on of Meghalaya, the provision of quality manpower is equally important. Presently for Meghalaya, quality manpower especially in respect of responsibility and dedicati on is of more urgent need in additi on to the number of medical and paramedical personnel. In this connecti on the focus on monitoring and supporti ve supervision is the need of the day to day acti viti es. Further, there are concerns about the quality of service being provided to the people.
Meghalaya has no Medical College; the North East Indira Gandhi Regional Insti tute of Health and Medical Sciences (NEIGRIHMS), which is now commissioned and where the fi rst batch of MBBS students have been enrolled, will have a 500 bedded Super-Speciality Hospital. However, there are a number of vacancies in the faculty in various departments.
For requirement of nursing staff , etc. there are 5 training centres in the public sector which include: 1 Regional Health and Family Welfare Training Centre, 2 GNM training centres, and 2 Nursing Training Schools and 1 ANM training school. The State Government had also submitt ed its requirement of 2 additi onal GNM Training Schools to be set up at Tura Civil Hospital and Jowai Civil Hospital.
382

MEGHALAYA STATE DEVELOPMENT REPORTMEGHALAYA STATE DEVELOPMENT REPORT
Public investment has been recognized as an indicator of planning prioriti es. But investment in public health in the country as a whole – and in Meghalaya – does not show that health care has been given due importance.
The central resources to the overall public health funding have been limited to about 15 percent only. There is also inherent problem of absorpti on of programmati c fund due to various factors. The current annual per capita public health expenditure is no more than Rs 200. But with the launching of NRHM by the Government of India, it is expected that things will greatly improve. It remains to be seen how well the enti re health sector absorbs the fund and the managers in the state leverage and perform under NRHM.
11.8.2. Educati on
The literacy rate of Meghalaya in 2001 is slightly lower than the nati onal literacy rate. Rural literacy rates conti nue to be low. The total literacy rate in Meghalaya mainly is a refl ecti on of the situati on prevailing in the rural sector. The urban literacy rate in Meghalaya is in fact about 7 percentage points higher than the nati onal literacy rate.
Table 11.8.3: District Wise Literacy Rates in Meghalaya by Place of ResidenceDistricts 1981 1991 2001
Rural Urban Total Rural Urban Total Rural Urban Total
Jainti a Hills 20.77 66.01 24.51 30.35 81.37 35.32 48.97 91.14 52.79
East Khasi Hills 31.95 65.25 43.73 46.36 83.68 60.04 63.72 88.65 74.74
West Khasi Hills 31.47 52.35 31.97 49.06 71.82 50.52 63.13 83.83 65.50
East Garo Hills 33.05 47.41 33.51 46.99 68.79 48.38 57.97 82.15 61.57
West Garo Hills 21.69 61.25 25.91 34.34 78.29 39.32 46.09 85.17 50.78
South Garo Hills NA NA NA NA NA NA 62.66 77.10 63.67
Ri Bhoi NA NA NA NA NA NA 52.28 83.96 55.21
Meghalaya 27.45 64.12 34.08 41.05 81.74 49.10 57.00 87.12 63.31
All India 29.65 57.40 36.23 44.70 73.10 52.20 59.40 80.30 65.38
Source: Census of India, 1981, 1991, 2001
There are wide intra state variati ons in educati onal achievement. West Garo Hills has the lowest literacy rate followed by Jainti a Hills District. In the state as a whole, we note that the female literacy rate is lower than male literacy rates in all the three years. This is more like what can be seen at the all India level except that the quantum of gender gap is much smaller (about 7 percentage points) in Meghalaya than all India (more than 20 percentage points). We observe a similar gender gap in the literacy between males and females among the districts in Meghalaya except for the Jainti a Hills District where the female literacy rate is higher than their male counterparts.
383

MEGHALAYA STATE DEVELOPMENT REPORTMEGHALAYA STATE DEVELOPMENT REPORT
Table 11.8.4: District Wise Literacy Rates in Meghalaya by Sex
Districts1981 1991 2001
Male Female Persons Male Female Persons Male Female Persons
Jainti a Hills 24.63 24.38 24.51 34.37 36.31 35.32 50.52 55.54 53.00
East Khasi Hills 46.96 40.30 43.73 62.86 57.04 60.04 78.12 75.82 76.98
West Khasi Hills 34.08 29.75 31.97 52.98 47.94 50.52 67.02 64.21 65.64
East Garo Hills 39.01 27.66 33.51 54.70 41.70 48.38 67.39 55.74 61.70
West Garo Hills 32.04 19.55 25.91 46.93 31.32 39.32 57.51 44.51 51.03
South Garo Hills NA NA NA NA NA NA 62.60 48.61 55.82
Ri Bhoi NA NA NA NA NA NA 69.22 62.67 66.07
Meghalaya 37.89 30.08 34.08 53.12 44.88 49.10 66.14 60.41 63.31
All India 46.89 24.82 36.23 64.13 39.29 52.21 75.85 54.16 65.38
Source: Census of India, 1981, 1991 and 2001.
Meghalaya is located in the northeastern region in arguably the most backward region of India. Here we have compared the literacy rates in other six states, namely, Arunachal Pradesh, Assam, Manipur, Mizoram, Nagaland and Tripura with that of Meghalaya. Meghalaya ranks second from the bott om aft er Arunachal Pradesh as per 2001 Census, though the literacy rate has increased considerably over the years. However, the situati on in the rural sector of the state appears to be worse compared to the other states in the Northeastern Region. In 1981 about 28 percent of the rural populati on of Meghalaya was literate. This is the second lowest literacy rate in the region aft er Arunachal Pradesh (19 percent). Rural Meghalaya conti nued to be second ranked from bott om in 1991 as well as in 2001. The Urban sector of the state has done relati vely bett er than the rural sector within the state though in terms of ranking, Meghalaya ranks fourth out of seven states in the region.
384

MEGHALAYA STATE DEVELOPMENT REPORTMEGHALAYA STATE DEVELOPMENT REPORT
Figure 11.8.4: Literacy Rate in NE State (2001 Census)
The combined enrolment rati os of Meghalaya indicate that the state is at a low level of achievement in this respect. A combined GER of 74.18 percent in 2004-05 as per NSSO esti mates (see Figure 11.5) is lower than the all India average of 76.84 percent. The state ranks fi ft h from the bott om in enrolment among the 35 states and Union Territories in the country. Meghalaya is ahead of only Bihar (66.87 percent), Orissa (70.60 percent), Jharkhand (71.09 percent) and Madhya Pradesh (74.08 percent) in the combined gross enrolment of Classes I – XII in 2004-05. There are signifi cant intra state variati ons in enrolment as seen in Figure 11.6. Highest enrolment rate is observed in South Garo Hills with 85.5 percent and the lowest in Jainti a Hills with 43.31 percent. Female enrolment rates are higher in East Khasi Hills, Ri Bhoi, Jainti a Hills and West Khasi Hills. It appears that the noti on that educati on for boys is not considered important since they will leave their parental homes for their wives’ homes is sti ll prevalent to some extent in the matrilineal societi es of Khasi-Jainti a Hills. The gender gap in enrolment in the three districts of Garo Hills is negligible.
The GDI for Meghalaya is higher than most states in India. The reverse or negligible gender gap in enrolment in the menti oned districts is one of the main factors that lead to higher GDI.
385

MEGHALAYA STATE DEVELOPMENT REPORTMEGHALAYA STATE DEVELOPMENT REPORT
Figure 11.8.5: Combined Gross Enrolment Rati os of the States/UTs in 2004-05
Note: Gross Enrolment in Classes I – XII in the age group of 6 - 18 years is taken into considerati on.Source: Special tabulati on by Veronica Pala using unit record data of the Nati onal Sample Survey on Employment and
Unemployment, 61st round.
386

MEGHALAYA STATE DEVELOPMENT REPORTMEGHALAYA STATE DEVELOPMENT REPORT
Figure 11.8.6: Gross Enrolment Rates in Districts of Meghalaya by Sex in 2002
Note & Source: (a) The gross enrolment rati o is obtained by dividing the combined enrolment numbers by the populati on aged 5 - 19 years in 2001. The combined enrolment numbers are for Classes I - XII as per the All
India Seventh Educati onal Survey, 2002.
Table 11.8.5: Gross Enrolment Rati o by Place of Residence and Sex (2004-05)(in %)
Standard
Rural Urban
Boys Girls All Boys Girls All
Meghalaya
Primary 117.22 118.12 117.63 105.97 96.62 101.58
Middle 51.96 66.69 58.87 110.17 72.42 88.52
Secondary/Higher
Secondary
44.29 48.46 46.28 91.47 93.76 92.66
Graduate and Above 1.29 3.32 2.36 16.91 12.67 14.53
All India
Primary 112.05 106.86 109.63 105.92 100.10 103.09
Middle 80.96 69.44 75.57 85.35 82.71 84.07
Secondary/Higher
Secondary
57.30 41.52 50.05 72.19 72.54 72.35
Graduate and Above 7.73 4.49 6.08 18.42 15.99 17.29Source: Special Tabulati on by Veronica Pala using NSS 61st round Employment and
Unemployment Data.
The educati onal infrastructure leaves much to be desired especially in the rural areas. Indicator of ‘quality school’ is much more than just constructi on of pucca building. Other infrastructural faciliti es like drinking water faciliti es, proper toilet faciliti es including the provisioning of separate toilets for girls, etc. are very important to assess the quality of educati onal infrastructure.
Table 11.8.6 reveals that 18.3 percent of Lower Primary (LP) schools and 24 percent of Upper Primary (UP) schools do not have buildings of their own. 25 percent of LP schools and 20 percent of UP schools are in dilapidated conditi on. 60 percent of LP schools and 91 percent of UP
387

MEGHALAYA STATE DEVELOPMENT REPORTMEGHALAYA STATE DEVELOPMENT REPORT
schools need additi onal classrooms. Only 22 percent of LP schools have drinking water facility. 57 percent of LP schools and 73 percent of UP schools are without toilet faciliti es and only 5 percent and 11 percent of LP and UP schools respecti vely have separate toilet for girls. Only about a quarter of the schools have playgrounds and 99 percent do not have kitchens for midday meals.
Table 11.8.6: Educati onal Infrastructure Gaps in Primary Schools of Meghalaya, 2005-06
Stage
Total Schools
Schools without
Own Building
Schools in dilapi-dated
Conditi on
Schools requiring
Additi onal Classrooms
Schools withoutdrinking water facility
Schools without
Toiletfaciliti es
Schools with Girls’ Toilet
Schools with play-
ground
Schools without kitchen
for midday meals
Number
LP 5851 1070 1488 3532 1336 3363 298 1354 5820
UP 1759 423 347 1599 NA 1286 190 492 1742
Total 7610 1493 1835 5131 1336 4649 488 1846 7562
Percentage
LP 100.00 18.29 25.43 60.37 22.83 57.48 5.09 23.14 99.47
UP 100.00 24.05 19.73 90.90 NA 73.11 10.80 27.97 99.03
Total 100.00 19.62 24.11 67.42 NA 61.09 6.41 24.26 99.37Source: Directorate of Elementary and Mass Educati on, Government of Meghalaya, Shillong.
Thus educati onal infrastructure gaps in Meghalaya gravely indicate the sorry state in which many of the schools are provision, extension and maintenance of the school buildings along with the basic faciliti es like drinking water and toilets should be given utmost importance and priority.
Over the years Meghalaya has made considerable progress as far as literacy and educati on is concerned. Besides, literates in Meghalaya are more evenly distributed across households in both rural and urban sector than all India. Further, though there are some indicati ons of gender gap and rural-urban gap prevailing in the state it is much lower than that for the country as a whole. However, there exists intra-state disparity in literacy rates and distributi on of schooling faciliti es in Meghalaya. There is also a lack of access to schools beyond primary level and higher educati onal insti tuti ons especially in the rural areas that adversely aff ects school parti cipati on and literacy in the state.
A lot needs to be done to improve the access to basic infrastructure including increasing the number of teachers especially trained teachers thereby improving the quality of teaching. In additi on, there is a need to construct more schools and higher educati onal insti tuti ons, evenly distributed across the state. This will contribute positi vely towards school att endance and enrolment.
11.8.3 Poverty The offi cial poverty rati os (as reported by the Planning Commission) are reported separately only for Assam from among the states in the NER. For remaining seven states in the region, i.e. including Meghalaya, the poverty rati os of Assam have been assigned. Since the poverty rati os
388

MEGHALAYA STATE DEVELOPMENT REPORTMEGHALAYA STATE DEVELOPMENT REPORT
used by the Planning Commission, GOI for Meghalaya are those of Assam, we have no reliable data on the incidence of poverty in Meghalaya.
The Ministry of Rural Development, GOI advised all the States and Union Territories to conduct the BPL Census for identi fying the households living below the poverty line at the beginning of every Five Year Plan. The Government of Meghalaya conducted the BPL Census in 1997 and 2002.
Table 11.8.7: Poverty Incidence in C&RD Blocks of Meghalaya as per BPL Census, 2002C&RD Block/ District/State
Total Households
BPL Households Percentage of BPL Households
Jirang 5078 3551 69.93
Umling 11065 4390 39.67
Umsning 16447 8335 50.68
Ri Bhoi District 32590 16276 49.94
Amlarem 7185 3735 51.98
Khliehriat 10759 3390 31.51
Laskein 10931 3364 30.77
Saipung 5155 2780 53.93
Thadlaskein 15741 6394 40.62
Jainti a Hills District 49771 19663 39.51
Mairang 15533 7089 45.64
Mawkyrwat 10203 5046 49.46
Mawshynrut 9623 4968 51.63
Mawthadraishan 8532 3698 43.34
Nongstoin 10279 4672 45.45
Ranikor 9781 5007 51.19
West Khasi Hills District 63951 30480 47.66
Khadarshnong Laitkroh 6307 3355 53.19
Mawkynrew 8594 3976 46.26
Mawphlang 14492 9594 66.20
Mawryngkneng 10960 5236 47.77
Mawsynram 11941 6615 55.40
Mylliem 35540 10936 30.77
Pynursla 12278 6986 56.90
Shella Bholaganj 9003 4299 47.75
East Khasi Hills District 109115 50997 46.74
Betasing 13094 7391 56.45
Dadenggre 7893 4354 55.16
Dalu 8827 4417 50.04
389

MEGHALAYA STATE DEVELOPMENT REPORTMEGHALAYA STATE DEVELOPMENT REPORT
C&RD Block/ District/State
Total Households
BPL HouseholdsPercentage of
BPL HouseholdsGambegre 7469 4208 56.34Rongram 9628 5370 55.77Selsella 23355 12252 52.46Tikrikilla 10544 5790 54.91Zikzak 14889 7618 51.17West Garo Hills District 95699 51400 53.71Dambo Rongjeng 8830 4208 47.66Kharkutt a 9229 5201 56.35Resubelpara 15400 10582 68.71Samanda 6151 3566 57.97Songsak 10788 4635 42.96East Garo Hills District 50398 28192 55.94Baghmara 5428 1931 35.57Chokpot 5286 2778 52.55Gasuapara 4136 2481 59.99Ronggara 3298 1036 31.41South Garo Hills District 18148 8226 45.33Total State 419672 205234 48.90Source: Community & Rural Development Department, Government of Meghalaya.
Table 11.8.7 shows that the proporti on of households living below the poverty line is a staggeringly huge fi gure at 48.9 percent. East Garo Hills district has the highest incidence of poverty at 56 percent followed by West Garo Hills district at 54 percent. Jainti a Hills district has the lowest proporti on of households below the poverty line at a litt le less than 40 percent. The incidence of poverty in the other districts is in the range of 45 – 50 percent.
However, the use of diff erent score limits for diff erent Blocks makes comparison impossible across the Blocks and districts except in cases where the poverty line (score limits) are the same. That is, two households which have more or less the same standard of living may be classifi ed as poor in case of one household and non poor in case of another if they happen to be in two diff erent Blocks with diff erent score limits.
Esti mati on of the incidence of poverty as measured by the proporti on of people living below the poverty line hinges crucially on the poverty line and how it is defi ned. There are several problems associated with the concept of poverty line, especially in Meghalaya and the other NE states as highlighted in this chapter. Nevertheless, poverty is pervasive and is evident to anyone who takes a look at the living conditi ons of the people of Meghalaya, especially those who reside in the remote rural areas of the state.
390

MEGHALAYA STATE DEVELOPMENT REPORTMEGHALAYA STATE DEVELOPMENT REPORT
Figure 11.8.7: Proporti on of Households Living Below the Poverty Line in Districts of Meghalaya in 2002
Source: BPL Census, 2002
The BPL Census, by using the score based ranking method, provides us with very important insights into the living conditi ons of the people of Meghalaya. The 13 indicators shed light, among others, on the adequacy of food, clothing and shelter; educati onal status and the assets that the people possess; the important means of livelihood and the type of assistance that the people prefer. In the enti re state of Meghalaya, 31.9 percent of households score 0 in indicator 1. In eff ect, this gives the percentage of households with no operati onal size of landholding, while 44.3 percent have less than 1 hectare of un-irrigated land or less than half a hectare of irrigated land. 63.7 percent live in kutcha houses and 22 percent live in semi-pucca houses. More than half, i.e. 58.2 percent have only 2-3 pieces of clothing per person. In respect of food, we note that 50 percent of households have two square meals a day with occasional shortage (score 3) and 18 percent of households have adequate food throughout the year. 5 percent of households suff er from acute hunger getti ng less than one square meal a day for major part of the year. 65 percent score 0 in sanitati on. In other words, 65 percent of households resort to open defecati on. 45 percent of households score 0 in literacy status of the highest literate adult. This means that 45 percent of households had no literate adult in 2002. A large proporti on of households (39.4 percent) reported that their highest literate adult studied upto primary level only.
Rural indebtedness is a problem for many households of Meghalaya. 35.7 percent reported that they borrowed for daily consumpti on purposes from informal sources, i.e. friends, relati ves and moneylenders. 16 percent borrowed for producti on purposes but from informal sources. We note that insti tuti onal credit is not signifi cant at all in the rural areas. Only 2.5 percent of households borrowed from insti tuti onal sources. 32 percent of households reported no indebtedness.
391

MEGHALAYA STATE DEVELOPMENT REPORTMEGHALAYA STATE DEVELOPMENT REPORT
Figure 11.8.8: Selected Indicators of Poverty, 2002
Note: The fi gure shows percentages of households in each category out of the total households in each district.
Source: BPL Census, 2002.
Coming to the status of households in labour force, we observe that 54.4 percent reported that only adult males work, while 11.7 percent reported that only adult females work and there is no child labour. 8 percent of households had to send their females and children to work. Most of the households derive their livelihood from vulnerable sources. We observe that 41.9 percent reported subsistence culti vati on as their means of livelihood while 36 percent of households get their livelihood from casual labour. 3.5 percent of households were arti san households. Child labour is common in Meghalaya. 26.8 percent of households have at least one child who works and does not go to school at all. 25 percent of households have at least one child who goes to school and works at the same ti me. Only 27.6 percent of households send all their children to school.
Most of the rural households (63.6 percent) were non-migrant households. 14.3 percent migrated for casual work, 10.9 percent migrated for seasonal employment and 6.1 percent migrated for other forms of livelihood. Coming to preference for assistance from the Government, 44 percent of households would like to get help in starti ng their own enterprises. 20.4 percent would like to get wage employment or Targeted Public Distributi on system and 20.1 percent would like assistance for housing. Only 4.1 percent wished to have training or skill upgradati on assistance. Ownership of consumer durables is another important indicator of the standard of living. 77.6 percent of households did not own any consumer durables like TV, radio or modern kitchen appliances.
Measurement of poverty criti cally depends on the poverty line defi niti ons which should be current or access to goods and services besides assets on the score card or other socio-economic parameters that captures real situati on and proper survey. The chapter suggests appointi ng a panel
392

MEGHALAYA STATE DEVELOPMENT REPORTMEGHALAYA STATE DEVELOPMENT REPORT
of experts to assess and devise a proper methodology and course of acti on to defi ne and determine the people below poverty line at current level for Meghalaya. To address the multi faceted face and challenge of poverty and deprivati on we require a multi faceted approach involving policy and acti on.
Stagnant agriculture, low producti vity, and lack of backward and forward linkages need to be addressed upfront. Helping small farmers and to increase producti vity through investment, subsidy and appropriate linkages should be our focus. Stress on non-farm acti vity that bolster traditi onal and private sector acti viti es, with special att enti on to micro enterprises would also be needed in the rural areas.
Many well-conceived poverty alleviati on programmes seeking to empower rural poor through group eff orts supplemented by agriculture and allied acti viti es and social services like educati on, health and social welfare, water and sanitati on, and labour welfare measures already exist. All that is required is eff ecti ve delivery mechanisms and instruments so that these reach the intended benefi ciaries.
11.8.4 Gender Related IssuesGender issues assume special signifi cance since the major tribes of Meghalaya follow a unique system of matriliny. As far as the Gender-related Development Index (GDI) is concerned, Meghalaya is in a bett er positi on compared to most of the states in India. The GDI rank of Meghalaya was 12th
in 1981 and improved to 7th in 1991 5. However, the GDI could not be calculated in 2005 due to lack of data.
Table 11.8.8: Gender Related Development Index of Districts of Meghalaya
District Sex
Popu
lati
on
IMR
Lite
racy
Combined
gross enrolm
ent rati o
Share in econo-mically acti ve popu-lati on
Rati o of female
to male rural
labour wage
NSDP at
current prices(Rs in lakh)
GDI GDI Rank
East Khasi Hills M 333187 27.26 78.12 60.67 63.03 0.679 171616 0.640 1
F 327807 41.43 75.82 65.55 36.95
West Garo Hills M 259440 18.96 57.51 66.42 59.82 0.825 74764 0.550 2
F 256373 17.32 44.51 65.54 39.99
Ri Bhoi M 99315 53.09 69.22 48.64 57.52 0.729 29769 0.478 3
F 93480 68.28 62.67 52.39 42.47
South Garo Hills M 51051 88.08 62.60 85.74 55.38 0.813 24796 0.477 4
F 48054 114.99 48.61 85.30 44.63
Jainti a Hills M 149376 97.64 50.52 37.94 57.10 0.683 63756 0.437 5
F 146316 55.80 55.54 48.71 43.00
East Garo Hills M 126312 96.75 67.39 61.46 54.77 0.846 31630 0.392 6
F 121243 84.83 55.74 60.36 45.26
5 Please refer the National Human Development Report, 2001
393

MEGHALAYA STATE DEVELOPMENT REPORTMEGHALAYA STATE DEVELOPMENT REPORT
West Khasi Hills M 149159 91.51 67.02 75.91 53.91 0.544 30692 0.321 7
F 144956 81.14 64.21 82.53 46.06
Meghalaya M 1167840 51.55 66.14 61.12 58.51 0.742 427024 0.534
F 1138229 52.99 60.41 64.67 41.47
Notes and data sources: As in Table 11.2
The gender-related development index (GDI), measures achievements in the same dimensions using the same indicators as the HDI but captures inequaliti es in achievement between women and men. It is simply the HDI adjusted downward for gender inequality. The ranking of the districts by GDI is exactly the same as the ranking by HDI with one excepti on. West Khasi Hills replaces East Garo Hills at the bott om of the GDI ranking.
The GDI values show the existence of gender inequality in all districts. However, it may be said that in the spheres of health (as captured by the Infant Mortality rate), educati on (as captured by the literacy rate and enrolment rate) and income, gender imbalance in Meghalaya is prevalent at a lower degree compared with most other states in India. This is because of lower gender gap in literacy and enrolment as well as higher female labour force parti cipati on. In four districts of East and West Khasi Hills, Ri Bhoi and Jainti a Hills, we observe a reverse gender gap in enrolment, i.e. female enrolment rates are higher than male enrolment rates. In the three districts of Garo Hills, on the other hand, the gender gap in enrolment is negligible.
West Khasi Hills has the lowest GDI among all the districts. The reason lies in the disparity of wages between men and women. As per the data on Rural Labour Wages collected by the Directorate of Economics and Stati sti cs, Government of Meghalaya in 2005, the rati o of female to male wages is 54 percent in West Khasi Hills. The rati o is 68 percent in East Khasi Hills and Jainti a Hills, 81 percent in South Garo Hills, 83 percent in West Garo Hills, 85 percent in East Garo Hills and 73 percent in Ri Bhoi.
The GDI of Meghalaya, as discussed earlier, is higher than most of the states in India. This is because of high workforce parti cipati on of women and negligible gender gap in school enrolment. Female literacy rates in Meghalaya are lower compared to males, although with a signifi cantly lower gender gap. However, the indicators of women’s health show that there are serious inadequacies in maternal health care, use of family planning methods and nutriti on.
It may be noted here that higher parti cipati on of women in the labour force may be looked at from two aspects and the work parti cipati on rate itself will not convey whether women’s welfare is improved or not with high parti cipati on. For poor and uneducated women, working or not working is not a choice. They have to work to support their families and their burden is actually more, since generally they have to att end to domesti c chores as well. With high level of ferti lity, this burden is compounded along with the psychological burden of seeing their children work and not att ending schools. On the other hand, being a worker increases the independence and decision making power of the women within their respecti ve households. For educated women who can command higher wages in the labour market, higher parti cipati on in the labour force defi nitely increases their welfare and has a direct relati on with women empowerment.
394

MEGHALAYA STATE DEVELOPMENT REPORTMEGHALAYA STATE DEVELOPMENT REPORT
Women in Meghalaya have a higher status compared to their counterparts in the patrilineal societi es. Women inherit the parents’ property - acquired and ancestral. Women get the bett er share as the custodian of the property and the keeper of the home and hearth. For women coming from poor or landless families these property rights are meaningless. However, their responsibiliti es are no less than their landed counterparts.
When it comes to public life, the mindset and long-held views and atti tude against women sti ll pose a major obstacle for women to enter electoral politi cs. Authority in its real sense is the exclusive preserves of men. Local administrati on is completely under the domain of men.
Women in Meghalaya suff er from problems of illiteracy, poverty and malnutriti on, male drunkenness and family discord. Cases of domesti c violence and sexual crimes also are not unheard of. These problems are universal and the prevalence of matrilineal system does not guarantee gender equality and absence of gender related discriminati on.
Chapter 8 of the Meghalaya State Human Development Report also outlines some of the programmes undertaken to promote women’s empowerment in the state. The achievement of these programmes has been minimal in terms of the number of benefi ciaries. Much more needs to be done for uplift ment of women, especially women belonging to the poor and vulnerable secti ons of the society.
11.9 ConclusionMeghalaya may be considered to be a case of unfulfi lled potenti al in many ways. The rich natural resource base of the state has been sub-opti mally uti lised. Therefore, the challenge ahead is to harness the resources to the full potenti al and more importantly, to bring the fruits of development to the people, especially the poor and the powerless.
Achievements in the sphere of human development have been mainly urban centric. The rural and remote areas remain under developed and large numbers of people in these areas sti ll do not have access to basic health care faciliti es and proper schools. Lack of rural infrastructure development limits the opportuniti es for bett er livelihood. Further the existi ng system of governance needs reforms to improve the delivery mechanism.
In the struggle for enhancement of human welfare the challenges ahead are many. Provision of social services like educati on, health, water supply and nutriti on should be given topmost priority. The state should strive for enhancement of the level of human well being through creati on of essenti al infrastructures, provision of educati onal avenues including diversifi ed training for skill development, generati on of employment opportuniti es, extensive health care, adequate att enti on for women and children welfare, improvement of environment, and provision of safe drinking water supply and sanitati on.
Generati on of employment, parti cularly in the rural areas should be one of the state’s top prioriti es. For Meghalaya, we see great potenti al for creati on of jobs in the rural areas in the fi eld of post harvest management, agro processing and tourism. There is a need to increase
395

MEGHALAYA STATE DEVELOPMENT REPORTMEGHALAYA STATE DEVELOPMENT REPORT
employment in non-agricultural sector and rural non-farm sector with development of clusters around towns/market centres. Learning from experiences gained from the implementati on of the Self Help Groups (SHGs) and watershed based approach on livelihoods under North Eastern Region Community Resource Management Programme and Livelihoods Improvement Programme assisted by Internati onal Fund for Agriculture Development (IFAD), it is important to cover all areas of the State under livelihood improvement programme with adequate investment and appropriate insti tuti onal mechanisms. Reforms of planning and development structure by converging programmes may see bett er outcomes. There is an urgent need to upgrade skills of our youth to enable them to stand on their own feet. A skill development mission for the rural areas may be evolved and supported.
Parti cipati on of the people at the grassroot level in planning process has made a beginning through the implementati on of the Nati onal Rural Employment Guarantee Act (NREGA) in the state. The government of Meghalaya has evolved a system of village employment councils consisti ng of both elected representati ves at the village level and the traditi onal heads of village and tribal insti tuti ons in these councils. This will ensure the parti cipati on of village people in the formulati on, executi on and monitoring of plans locally, in a democrati c manner. The government may plan to expand the concept for people’s parti cipati on in planning and development as envisaged in this Report. Both for addressing the issue of poverty and for addressing the demand side of agriculture, all districts of Meghalaya have been now covered under Nati onal Rural Employment Guarantee Act (NREGA).
The augmentati on of the standards of public services like educati on, healthcare, water supply, sanitati on, housing, etc. requires signifi cant commitment of additi onal resources by the government. Branches of good quality schools should spread to our blocks and villages. Good quality model schools need to be established in each Block of Meghalaya. One Central school/Navodaya Vidyalaya or equivalent with hostel faciliti es should be set up in each Block for tapping and promoti ng available rural talent in Meghalaya. Further, we need more specialized seats for our in-service doctors who will provide bett er health service.
Summing up, improvement of health care services; increasing the number of quality schools and skill development centres; developing alternati ve and sustainable models and means of livelihood; and parti cipatory development strategy are major areas that should be given top priority and utmost importance for promoti ng human development in Meghalaya. The real challenge, however, is to bring the benefi ts of development to the backward and poor secti ons of the society, especially in the remote rural areas. Reforms in governance are a must to enable and ensure the parti cipati on of the poor to enhance quality of life and to derive the fruits of development in the State.
396

MEGHALAYA STATE DEVELOPMENT REPORTMEGHALAYA STATE DEVELOPMENT REPORT
CHAPTER XII
LABOUR AND EMPLOYMENT
12.0. Labour being a primary factor of producti on, the size of the labour force is of great importance in determining the level of economic acti vity in any country. The level of employment, its compositi on and the growth in employment opportuniti es is a criti cal indicator of the process of development in any economy. It is also an indicator that, in most cases, directly captures the economic att ainments and hence the level of well being of individuals (Nati onal Human Development Report, 2001).
Economic backwardness is the leading problem of the state as majority of the populati on is below the poverty line. Although the state is rich in mineral resources, the industrial linkages are virtually absent and government is the major source of employment in the organized sector. Acti viti es like animal husbandry, fi shery, poultry and horti culture have not been targeted as a major source of employment. Therefore, agriculture forms the only opti on for the people to seek gainful employment. This too is infl uenced by impediments such as shift ing agriculture, poor producti vity, land tenure system and traditi onal methods of culti vati on. All these factors have resulted in poor land and labour producti vity.
As unemployment and poverty are correlated, it becomes necessary to understand the occupati onal patt ern of labour force and status of employment to analyse the development in the state. The data pertaining to social, economic, demographic, and labour force conditi ons helps in understanding the demand and supply of labour in the market.
12.1 Work Force parti cipati on RateThe 1981 census defi ned worker as a person whose main acti vity is parti cipati on in any economically producti ve work by his physical or mental acti vity. Work involves not only actual work but also eff ecti ve supervision and directi on of work. The census classifi es workers into main and marginal workers. Main workers are those who work for major part of the year, i.e. 6 months or more, while marginal workers are as those who do not work for major part of the year i.e. they work for less than 6 months. Here we have considered the total workers including main and marginal workers.
The term labour force or ‘economically acti ve’ populati on refers to the populati on, which supplies or seeks to supply labour for producti on and therefore, includes both employed and unemployed. Work Parti cipati on rate refers to the number of persons usually employed. Unemployment rate on the other hand refers to the number of persons who are seeking or are available for work out of the total labour force.
397

MEGHALAYA STATE DEVELOPMENT REPORTMEGHALAYA STATE DEVELOPMENT REPORT
The adopti on in 1991 and 2001 census of almost the same defi niti on and concept of workers (main and marginal) of 1981 census has rendered the direct comparison of the results possible. Table 12.1 reports the work force parti cipati on rate in the diff erent districts of Meghalaya in 1981, 1991 and 2001.
Table 12.1: Work Force Parti cipati on Rate in the Diff erent Districts of Meghalaya in 1981, 1991 and 2001
(in percent)
YearDistricts Total Rural Urban
Persons Males Females Persons Males Females Persons Males Females
1981
Jainti a Hills 49.36 55.90 42.67 50.61 56.76 44.31 35.49 46.30 24.60
East Khasi Hills 41.62 52.44 30.17 46.41 54.88 37.66 32.85 48.11 16.04
West Khasi Hills 51.24 54.05 48.28 51.48 54.05 48.79 41.55 54.23 25.60
East Garo Hills 45.59 52.36 38.40 45.94 52.50 39.02 34.76 48.37 17.12
West Garo Hills 48.21 55.85 40.29 50.44 57.25 43.44 29.55 44.62 12.56
Meghalaya 45.92 54.12 37.49 48.85 55.09 42.05 32.63 61.66 16.12
1991
Jainti a Hills 46.44 52.65 40.05 47.66 53.64 41.50 34.62 43.04 25.98
East Khasi Hills 39.20 49.70 28.11 42.43 50.63 33.97 33.14 48.03 16.70
West Khasi Hills 43.82 47.46 40.00 44.67 47.93 41.23 31.70 40.68 22.15
East Garo Hills 44.09 48.66 39.32 44.97 49.19 40.60 31.17 41.32 19.57
West Garo Hills 44.66 51.15 37.90 46.68 52.46 40.70 28.04 40.72 14.00
Meghalaya 43.06 49.09 36.69 45.95 50.63 41.07 30.47 42.59 17.06
2001
Jainti a Hills 42.42 47.95 36.86 43.56 49.01 38.06 29.95 36.00 24.16
East Khasi Hills 38.82 48.54 28.92 43.15 50.56 35.53 32.85 45.71 19.88
West Khasi Hills 43.61 46.36 40.76 44.96 47.33 42.50 33.39 38.96 27.73
East Garo Hills 44.69 47.97 41.30 46.19 48.74 43.55 35.77 43.44 27.73
West Garo Hills 40.19 47.80 32.34 41.78 48.77 34.57 27.86 40.27 14.83
South Garo Hills 47.38 50.94 43.61 48.27 51.07 45.32 37.90 49.57 24.58
Ri Bhoi 46.38 51.79 40.62 47.12 52.31 41.60 36.21 44.63 27.35
Meghalaya 41.84 48.34 35.15 44.11 49.43 38.62 32.51 43.82 20.98
Source: Census of India, 1981, 1991 and 2001.
In 1981 the total work force parti cipati on rate in the rural and urban areas was 54.12 percent for men and 37.49 percent for women, respecti vely. The female parti cipati on rate was relati vely less than the male parti cipati on rate. Again, we observe that the rural work force parti cipati on was higher in relati on to the urban work force parti cipati on. For instance the rural work force parti cipati on in Meghalaya in 1981 was 48.85 percent and urban work force parti cipati on was 32.63 percent. The female workers in the urban sector were lower than the female workers in the rural sector i.e. 16.12 percent of the women in the urban areas were in the workforce while 42.05 percent of the women in the rural areas were in the work force.
This picture is seen in all the districts of Meghalaya. West Khasi Hills with the highest rate of work force parti cipati on of about 51.24 percent also shows the similar diff erence in men and
398

MEGHALAYA STATE DEVELOPMENT REPORTMEGHALAYA STATE DEVELOPMENT REPORT
women parti cipati on in the work force. The male work force parti cipati on in this district was 54.05 percent and female work force parti cipati on was 48.79 percent i.e. a diff erence of 3 percentage points. However, the diff erence is seen to be the least in West Khasi Hills. The other districts had a diff erence of about 14-15 percentage points in male and female parti cipati on in the work force.
We also observe here that the Work Force Parti cipati on Rates of the rural women were higher than that of the urban women. This gap is wider in East Khasi Hills, East Garo Hills and West Garo Hills. The diff erence in these districts in the women parti cipati on in the rural and urban areas was that of 29-30 percentage points. The diff erence exists in the other districts like Jainti a Hills and West Khasi Hills also but the urban parti cipati on in these two districts is marginally higher. In Jainti a Hills the diff erence in women parti cipati on in the rural and urban areas was that of 20-percentage points while in West Khasi Hills it was 23 percentage points. In 1991 the work force parti cipati on rate in Meghalaya was 42.67 percent, with 50.07 percent of males and 34.93 percent of females being in the work force. Accordingly, the rural parti cipati on in the workforce was 45.04 percent and urban parti cipati on was 32.3 percent for both males and females taken together. A diff erence in male and female work parti cipati on as well as rural and urban work parti cipati on rate is apparent in this period as well. This diff erence between male and female parti cipati on in the work force is evident in all the districts of Meghalaya, which we have noti ced in 1981 as well. The diff erence is, however, wider in districts like East Khasi Hills and West Garo Hills.
In 2001, 41.8 percent of the populati on was reported as workers, 48.3 percent being male workers and 35.1 percent being female workers, i.e., a diff erence of 13 percentage points. In 1981 there was a diff erence of 16 percentage points. This implies that the gender disparity conti nued even in 2001 but it narrowed down signifi cantly. Similarly, the rural and urban diff erence that we have seen earlier has also narrowed down in 2001. For instance, 44.1 percent of the populati on in the rural areas and 32.5 percent of the populati on in the urban areas was in the work force, i.e., a diff erence of 11 percentage points as against a diff erence of 13 percentage points in 1981.
Among the districts, South Garo Hills had the largest work force parti cipati on rate with 47.4 percent workers. The male parti cipati on in the workforce was 50.9 percent and female parti cipati on in the workforce was 43.6 percent. The gender disparity and the diff erence in rural and urban parti cipati on in all the districts of Meghalaya are clearly evident.
Comparati ve analysis of the three census periods i.e., 1981, 1991 and 2001 shows a declining trend in the work force parti cipati on rate. The work force parti cipati on rate was 45.92 percent in 1981and it declined to 41.8 percent in 2001. The decline in the work force parti cipati on rate is more percepti ble in the rural areas where it declined from 48.85 percent in 1981 to 44.1 percent in 2001. The urban work force parti cipati on hovered around 32 percent. In case of male parti cipati on in the work force there has been a consistent decline from 54.35 percent in 1981 to 50.07 in 1991 and fi nally to 48.3 percent in 2001. The fall during this period is conspicuous both in the rural areas as well as in the urban areas. In the rural areas the male work force parti cipati on
399

MEGHALAYA STATE DEVELOPMENT REPORTMEGHALAYA STATE DEVELOPMENT REPORT
declined from 55.65 percent in 1981 to 50.6 percent in 2001 while in the urban areas it declined from 49.14 percent in 1981 to 45.7 percent in 2001.The work force parti cipati on rate for females showed an increasing trend in the urban areas. During 1981-2001 the female work parti cipati on rate increased from 16.12 percent in 1981 to 21.2 percent in 2001 while in the rural areas there has been a slight decline from 42.05 percent to 38.6. This explains narrowing down the disparity among male and female parti cipati on in the work force.
Similar trend is pictured in all the districts of Meghalaya. The decline in work force parti cipati on is more obvious in the rural areas than in the urban areas. In Jainti a Hills there is a signifi cant the decline in work force parti cipati on rate from 49.36 in 1981 to 42.4 percent in 2001. This decline in work parti cipati on rate is evident for both males and females. For example, there is a decline of 7 percentage points in case of males and 6 percentage points in case of females during the same period. Similarly, there is a decline of about 2 percentage points in rural and urban work parti cipati on.
In East Khasi Hills there is a decline in the work force parti cipati on rate of males by one percentage point but there is a signifi cant increase in the female workforce parti cipati on rate by about 10 percentage points in the period 1981-2001. Again, in this district there has been a decline in the rural parti cipati on rate from 46.41 percent in 1981 to 43.1 percent in 2001. However the urban parti cipati on remained constant at around 32.85 percent in 1981 to 32.8 percent in 2001.
In West Khasi Hills the work force parti cipati on of both males and females declined by about 8-9 percentage points in the same period. The decline is evident in both the rural and urban sector. In the rural sector it declined from 51.48 in 1981 to 45 percent in 2001 and in the urban sector it declined from 41.55 in 1981 to 33.4 in 2001.
In East Garo Hills we fi nd that the male work force parti cipati on rate declined by 4 percentage points. However, the female workforce parti cipati on rate increased by 2 percentage points. There has also been an increase in the work force parti cipati on in both the rural and urban sector from 45.59 and 34.76 percent respecti vely in 1981 to 46.2 and 35.8 in 2001. Similarly, in West Garo Hills the work force parti cipati on of both males and females declined by 4-5 percentage points. The work force parti cipati on in the rural and urban sector declined from 50.44 and 29.55 percent respecti vely in 1981 to 41.8 and 27.9 percent in 2001.
Thus, we fi nd that the workforce parti cipati on rate declined for most of the districts. The decline in work force parti cipati on is more percepti ble in case of males. The female parti cipati on rate has also declined barring few districts like East Khasi Hills and East Garo Hills. Therefore, the gender disparity in work parti cipati on, which we have noti ced in all the three periods, has narrowed down gradually in 2001.
400

MEGHALAYA STATE DEVELOPMENT REPORTMEGHALAYA STATE DEVELOPMENT REPORT
Table 12.2 reports the work force parti cipati on rate in all the northeastern states of India and the whole of India according to the 2001 census. Interesti ngly most of the northeastern states, barring Assam and Tripura have a much higher work force parti cipati on rate than the all India work force parti cipati on rate. Mizoram have the highest work force parti cipati on rate (52.57 percent) of all the northeastern states in India. About 57 percent of the men and 47 percent of the women are in the work force. Similarly Arunachal Pradesh and Nagaland also have a very high work force parti cipati on rate. The work force parti cipati on rate in Meghalaya is around 42 percent which is litt le lower than the above menti oned states but much higher than that of the all India work fore parti cipati on rate (39.10 percent). A noteworthy feature of the northeastern states is that the female work force parti cipati on in this region is very high. Compared to 26 percent of the female work force parti cipati on rate in India most of the Northeastern States have higher than 35 percent female parti cipati on in the work force. However, Assam and Tripura stand much below the average where the work force parti cipati on rate is only 21 percent.
Table 12.2: Work Force Parti cipati on Rate in the North Eastern States of India in 2001 States Total Rural Urban
Person Male Female Person Male Female Person Male Female
Arunachal Pradesh 43.98 50.63 36.54 46.20 50.66 41.33 35.50 50.53 17.15
Assam 35.78 49.87 20.71 36.17 49.41 22.15 33.20 52.90 10.61
Manipur 43.62 48.12 39.02 45.45 49.25 41.53 38.57 44.94 32.25
Meghalaya 41.84 48.34 35.15 44.11 49.43 38.62 32.51 43.82 20.98
Mizoram 52.57 57.29 47.54 57.21 59.66 54.55 47.87 54.84 40.52
Nagaland 42.60 46.70 38.06 45.01 47.32 42.48 31.03 43.81 15.61
Sikkim 48.64 57.44 38.57 49.69 57.69 40.60 40.16 55.51 21.67
Tripura 36.25 50.62 21.08 37.03 50.42 22.87 32.45 51.64 12.45
All India 39.10 51.68 25.63 41.75 52.11 30.79 32.25 50.60 11.88
Source: Census of India, 2001
Sectoral classifi cati on of the workforce parti cipati on rate shows that the rural work force parti cipati on for both males and females is signifi cantly higher. For instance, in Meghalaya, the rural work force parti cipati on rate is 44 percent as against 42 percent in rural India. All the tribal dominated NE states exhibit higher rural work parti cipati on rates. Further, the diff erence in the work force parti cipati on rate in these states compared to the all India fi gures is mainly evident in the female work force parti cipati on rate. For instance the female work force parti cipati on rate in the rural India is only 31 percent while in rural Meghalaya it is about 39 percent.
On the other hand, the urban work force parti cipati on rates are lower. Mizoram with 48 percent has the highest urban workforce parti cipati on rate. In Meghalaya it is 32.5, more or less at the same level with the all India rate. However, female parti cipati on in the workforce in the urban areas of Meghalaya is signifi cantly higher than the all India level.
401

MEGHALAYA STATE DEVELOPMENT REPORTMEGHALAYA STATE DEVELOPMENT REPORT
As already menti oned, the Census classifi ed workers as main and marginal workers. Main workers are those who had worked for the major part of the year i.e. 6 months or more while marginal workers are those who had not worked for major part of the year i.e. less than 6 months. Table 12.3 reports the distributi on of main and marginal workers in the diff erent districts of Meghalaya by gender and place of residence for the year 2001.
In 2001, out of the total working populati on, 78.03 percent of the workers were main workers while 21.97 percent were marginal workers. The proporti on of marginal workers in the rural and urban sector was 23.83 percent and 11.61 percent respecti vely. Also the female marginal workers were found to be more than the male marginal workers. For example, 34.21 and 19.22 percent females in the rural and urban sectors, respecti vely, were marginal workers while the corresponding proporti on for male marginal workers was 15.96 and 8.03 percent, respecti vely. Interesti ngly, the percentage of main workers out of the total working populati on has declined signifi cantly since 1981. In 1981, 94.58 and 5.42 percent of the workers were main and marginal workers respecti vely while in 2001 the proporti on of main workers declined to 78.03 percent and the proporti on of marginal workers increased to 21.97 percent. This is apparent in all the districts in Meghalaya. This implies that underemployment is on the rise.
Table 12.3: Distributi on of Total workers into Main and Marginal Workers in Diff erent Districts of Meghalaya in 2001
(in percent)
District SectorMain Workers Marginal Workers
Person Male Female Person Male Female
Jainti a Hills Total 75.38 82.67 65.84 24.62 17.33 34.16
Rural 74.16 81.89 64.12 25.84 18.11 35.88
Urban 94.68 94.61 94.79 5.32 5.39 5.21
East Khasi Hills Total 85.43 89.93 77.74 14.57 10.07 22.26
Rural 80.77 86.45 72.47 19.23 13.55 27.53
Urban 93.88 95.30 90.60 6.12 4.70 9.40
West Khasi Hills Total 75.75 80.08 70.65 24.25 19.92 29.35
Rural 76.47 80.40 71.93 23.53 19.60 28.07
Urban 68.40 77.08 56.02 31.60 22.92 43.98
East Garo Hills Total 70.37 82.09 56.26 29.63 17.91 43.74
Rural 70.56 82.31 56.98 29.44 17.69 43.02
Urban 68.83 80.64 49.41 31.17 19.36 50.59
West Garo Hills Total 78.23 86.68 65.34 21.77 13.32 34.66
Rural 77.21 86.02 64.39 22.79 13.98 35.61
Urban 90.21 92.85 82.68 9.79 7.15 17.32
South Garo Hills Total 65.52 77.21 51.03 34.48 22.79 48.97
Rural 65.25 76.92 51.39 34.75 23.08 48.61
Urban 69.17 80.30 43.55 30.83 19.70 56.45
Ri Bhoi Total 79.68 87.57 68.99 20.32 12.43 31.01
402

MEGHALAYA STATE DEVELOPMENT REPORTMEGHALAYA STATE DEVELOPMENT REPORT
District SectorMain Workers Marginal Workers
Person Male Female Person Male Female
Rural 79.58 87.64 68.81 20.42 12.36 31.19
Urban 81.33 86.40 72.62 18.67 13.60 27.38
Meghalaya Total 78.03 85.44 67.55 21.97 14.56 32.45
Rural 76.17 84.04 65.79 23.83 15.96 34.21
Urban 88.39 91.97 80.78 11.61 8.03 19.22
Source: Census of India, 2001
12.2 Industrial classifi cati on of workers The occupati onal structure of a country refers to the distributi on or division of its populati on according to diff erent occupati ons. Economic development is closely associated with the change in the occupati onal structure of a country.
The Census classifi ed the main and marginal workers into four broad categories. For purposes of the census a person is classifi ed as culti vator if he or she is engaged in culti vati on of land owned or held from Government or held from private persons or insti tuti ons for payment in money, kind or share. A person who works on another person’s land for wages in money or kind or share is regarded as agricultural labourers. Household Industry is defi ned as an industry conducted by one or more members of the household at home or within the village in rural areas and only within the precincts of the house where the household lives in urban areas. The type of workers that come under this category of ‘OW’ include all government servants, municipal employees, teachers, factory workers, plantati on workers, those engaged in trade, commerce, business, transport banking, mining, constructi on, politi cal or social work, priests, entertainment arti sts, etc.
Table 12.4 reports the industrial classifi cati on of the main workers into the above-menti oned four broad categories according to the 1981 census. Meghalaya being an agrarian economy majority of the main and marginal workers are seen to be culti vators. According to the 1981 census, 62.57 percent of the main workers in Meghalaya were culti vators. In the rural sector 71.8 percent of the workers were culti vators. In the urban areas the dominant group was ‘other workers’ where 9.7 percent of working populati on were categorized in this group. Women in the rural areas work mainly as culti vators and their proporti on is higher than that of men. For instance in 1981, 76.34 percent of the females in the rural sector were culti vator as against 68.82 percent of males. The proporti on of culti vators in the rural sector was highest in West Khasi Hills with 90.12 percent of the workers working as culti vators. East Garo Hills and West Garo Hills followed West Khasi Hills with 81.57 percent and 80.98 percent of the workers being culti vators. The proporti on of agricultural labourers in East Khasi Hills was the highest (11.89 percent) followed by Jainti a Hills (11.47 percent). The proporti on of workers in the household industry was very low for all the districts in Meghalaya. In the urban areas workers were mostly categorized as ‘other workers’.
403

MEGHALAYA STATE DEVELOPMENT REPORTMEGHALAYA STATE DEVELOPMENT REPORT
Table 12.5 pictures a similar industrial classifi cati on of main workers into four broad categories according to the 2001 census. In 2001 the proporti on of culti vator declined to 50.24 percent from 62.57 percent in 1981. The shift has been mainly towards the ‘other workers’ where the proporti on of workers has increased signifi cantly from 26.62 percent in 1981 to 35.38 percent in 2001. In the rural areas a very high proporti on of the workers are culti vators while in the urban areas the workers are mainly classifi ed as ‘other workers’. In the rural sector 60.03 percent of the workers were culti vators while in the urban sector 92.8 percent of the workers were categorized as ‘other workers’. The proporti on of culti vators has declined notably for all the districts in Meghalaya while the proporti on of agricultural labourers has increased signifi cantly.
Table 12.4: Industrial classifi cati on of Main workers in 1981
Districts SectorCulti vators Agricultural Labourers
Household industry-manufacturing, processing,
servicing & repairsOther workers
Person Male Female Person Male Female Person Male Female Person Male Female
Jainti a Hills Total 66.33 64.15 69.32 11.47 9.28 14.47 0.62 0.56 0.71 21.57 26.01 15.50
Rural 70.51 68.75 72.86 12.15 9.89 15.18 0.45 0.36 0.59 16.89 21.01 11.38
Urban 1.00 1.13 0.76 0.89 1.00 0.70 3.25 3.33 3.10 94.85 94.53 95.45
East Khasi Hills Total 35.85 31.55 44.11 11.89 11.04 13.51 1.36 0.99 2.07 50.90 56.41 40.31
Rural 49.39 46.56 53.88 15.74 15.58 15.99 1.31 0.79 2.12 33.57 37.08 28.02
Urban 1.45 1.29 2.00 2.12 1.90 2.85 1.51 1.40 1.85 94.92 95.40 93.30
West Khasi Hills Total 88.92 85.54 93.03 5.22 5.75 4.57 0.15 0.16 0.14 5.71 8.55 2.26
Rural 90.12 87.33 93.47 5.23 5.76 4.56 0.09 0.07 0.11 4.57 6.84 1.85
Urban 29.96 20.05 56.52 4.91 4.78 5.26 3.23 3.58 2.29 61.90 71.59 35.93
East Garo Hills Total 81.57 78.00 88.11 7.07 6.60 7.92 0.56 0.46 0.73 10.81 14.93 3.24
Rural 83.39 80.33 88.90 6.82 6.45 7.48 0.51 0.39 0.72 9.28 12.83 2.89
Urban 14.75 9.31 36.43 16.13 11.03 36.43 2.34 2.59 1.37 66.78 77.07 25.77
West Garo Hills Total 75.65 71.24 83.47 10.19 9.88 10.73 0.70 0.82 0.51 13.46 18.07 5.29
Rural 80.98 77.89 86.15 10.67 10.54 10.89 0.67 0.79 0.48 7.68 10.78 2.49
Urban 6.43 4.44 15.16 3.95 3.31 6.81 1.08 1.04 1.26 88.53 91.21 76.77
Meghalaya Total 62.57 57.83 70.49 9.98 9.42 10.91 0.84 0.74 1.01 26.62 32.01 17.59
Rural 71.80 68.82 76.34 11.12 10.83 11.55 0.72 0.58 0.93 16.36 19.77 11.18
Urban 3.00 2.29 5.36 2.64 2.31 3.74 1.60 1.51 1.89 92.77 93.89 89.02
Source: Census of India, 1981
The proporti on of culti vators is highest in East Garo Hills with 66.79 percent of males and 77.52 percent of females being culti vators. West Khasi Hills is next in the row with 62.51 percent and 73.11 percent of males and females of the total workers being culti vators. The proporti on of agricultural labourers is again higher in Jainti a Hills with 16.39 percent of the males and 20.23 percent of females being agricultural labourers. In the urban sector, in all the districts of Meghalaya, the major proporti on of the workers is ‘other workers’.
Table 12.6 shows the industrial classifi cati on of marginal workers into four broad categories according to the 2001 census. A signifi cant proporti on of the marginal workers are
404

MEGHALAYA STATE DEVELOPMENT REPORTMEGHALAYA STATE DEVELOPMENT REPORT
seen as agricultural labourers and culti vators. In 2001, 40.67 percent of the marginal workers were culti vators and 36.01 percent of the workers are agricultural labourers. In all the districts majority of the marginal workers in the rural areas work as agricultural labourers while in the urban areas majority of them are ‘other workers’. A very small proporti on of the marginal workers are engaged in the household industry. However, the proporti on of marginal workers in this category is higher than that of the main workers. Thus, we see that a very large proporti on of the marginal workers working as agricultural labourers indicates prevalence of large-scale under unemployment in agriculture and consequently of low per capita labour producti vity and prevalence of widespread poverty. There is no signifi cant change in the occupati onal structure in the state since 1981. The Culti vators conti nue to dominate the rural structure while in the urban sector the major proporti ons of the workers are classifi ed as ‘other workers’.
Table 12.5: Industrial Classifi cati on of Main Workers (2001 census)
District
Sect
or Culti vators Agricultural Labourers
Household industry-
manufacturing, processing,
servicing & repairs
Other workers
Person Male Female Person Male Female Person Male Female Person Male Female
Jainti a Hills
T 54.62 56.41 51.69 17.85 16.39 20.23 1.99 1.82 2.27 25.54 25.37 25.81
R 58.97 60.65 56.19 19.27 17.62 22.00 2.11 1.91 2.43 19.65 19.82 19.38
U 0.42 0.38 0.48 0.14 0.14 0.14 0.56 0.60 0.51 98.87 98.87 98.87
East Khasi Hills
T 24.14 20.89 30.57 10.24 10.10 10.53 1.41 1.26 1.70 64.21 67.76 57.20
R 39.44 35.66 46.02 16.53 17.06 15.62 1.44 1.14 1.96 42.59 46.15 36.40
U 0.29 0.26 0.37 0.43 0.37 0.57 1.36 1.43 1.20 97.92 97.94 97.86
West Khasi Hills
T 67.06 62.51 73.11 15.49 16.02 14.79 1.42 1.44 1.39 16.03 20.03 10.70
R 71.81 67.78 77.01 15.74 16.52 14.74 1.37 1.33 1.42 11.07 14.37 6.83
U 12.97 11.57 15.72 12.63 11.12 15.60 1.99 2.52 0.94 72.41 74.79 67.74
South Garo Hills
T 63.07 56.03 76.27 9.17 9.06 9.39 1.81 1.94 1.58 25.95 32.97 12.76
R 67.87 61.41 79.36 9.79 9.84 9.68 1.80 1.91 1.60 20.55 26.83 9.36
U 1.41 1.42 1.39 1.32 1.09 2.31 1.99 2.18 1.16 95.28 95.31 95.14
Ri Bhoi
T 59.23 54.45 67.45 14.82 14.73 14.96 1.36 1.41 1.27 24.59 29.40 16.31
R 61.17 56.38 69.33 14.40 14.33 14.53 1.37 1.41 1.30 23.06 27.88 14.83
U 25.53 22.96 30.80 22.00 21.34 23.35 1.24 1.54 0.63 51.22 54.17 45.22
East Garo Hills
T 70.69 66.79 77.52 8.81 9.14 8.24 1.86 1.27 2.90 18.64 22.80 11.33
R 77.29 74.33 82.23 8.65 9.18 7.77 1.78 1.18 2.79 12.28 15.31 7.21
U 18.44 15.56 26.16 10.08 8.84 13.41 2.49 1.86 4.16 69.00 73.74 56.27
West Garo Hills
T 56.39 51.49 66.34 12.21 12.58 11.46 2.78 1.92 4.54 28.62 34.02 17.67
R 61.86 57.25 70.83 13.33 13.94 12.14 2.92 2.03 4.65 21.89 26.78 12.38
U 1.73 1.58 2.24 0.96 0.75 1.64 1.39 0.90 2.95 95.91 96.77 93.17
Meghalaya
T 50.24 46.23 57.41 12.54 12.39 12.81 1.84 1.54 2.37 35.38 39.84 27.41
R 60.03 56.43 66.11 14.63 14.78 14.37 1.92 1.56 2.52 23.42 27.23 17.00
U 3.23 2.80 4.27 2.52 2.21 3.28 1.44 1.44 1.46 92.80 93.55 90.99
Source: Census of India, 2001
405

MEGHALAYA STATE DEVELOPMENT REPORTMEGHALAYA STATE DEVELOPMENT REPORT
Table 12.6: Industrial Classifi cati on of Marginal Workers (2001 census)
District
Sect
or Culti vators Agricultural Labourers
Household industry-
manufacturing, processing,
servicing & repairs
Other workers
Person Male Female Person Male Female Person Male Female Person Male Female
Jainti a Hills
T 24.14 18.71 27.74 61.54 62.59 60.84 2.41 1.69 2.89 11.91 17.00 8.53
R 24.45 19.07 27.98 62.31 63.76 61.36 2.39 1.64 2.88 10.85 15.53 7.78
U 0.25 0.42 0.00 1.75 2.52 0.62 4.26 4.62 3.73 93.73 92.44 95.65
East Khasi Hills
T 19.59 16.58 21.91 33.71 33.43 33.93 2.98 1.40 4.20 43.72 48.59 39.95
R 22.91 20.21 24.85 39.32 40.63 38.37 2.67 0.91 3.94 35.10 38.25 32.83
U 0.66 0.47 0.89 1.77 1.47 2.13 4.73 3.57 6.08 92.83 94.49 90.91
West Khasi Hills
T 38.83 36.80 40.44 47.85 49.91 46.21 1.97 1.89 2.04 11.35 11.40 11.31
R 41.95 40.22 43.34 46.46 47.55 45.59 2.12 2.04 2.19 9.46 10.19 8.88
U 15.15 9.70 19.21 58.38 68.59 50.79 0.85 0.77 0.91 25.62 20.94 29.10
South Garo Hills
T 57.58 51.62 61.02 19.09 19.63 18.79 2.24 2.10 2.32 21.08 26.65 17.87
R 61.10 55.31 64.36 20.28 21.05 19.84 2.34 2.22 2.41 16.28 21.42 13.39
U 3.66 5.78 1.96 0.99 2.00 0.18 0.69 0.67 0.71 94.65 91.56 97.14
Ri Bhoi
T 46.55 45.37 47.20 32.48 32.49 32.48 3.63 3.08 3.93 17.33 19.06 16.39
R 47.31 46.59 47.68 32.12 31.99 32.19 3.73 3.09 4.06 16.85 18.33 16.06
U 31.99 27.56 35.76 39.51 39.76 39.29 1.80 2.93 0.83 26.71 29.76 24.12
East Garo Hills
T 61.27 60.23 61.78 20.01 21.43 19.31 5.22 2.95 6.34 13.50 15.39 12.57
R 65.15 64.77 65.33 18.84 20.98 17.82 5.13 2.74 6.27 10.88 11.51 10.58
U 32.94 32.60 33.16 28.55 24.19 31.29 5.89 4.20 6.96 32.62 39.00 28.60
West Garo Hills
T 47.13 45.96 47.83 31.43 29.30 32.68 4.54 3.18 5.34 16.90 21.57 14.16
R 48.78 48.37 49.01 32.49 30.86 33.43 4.60 3.24 5.37 14.13 17.52 12.18
U 2.36 1.72 3.11 2.49 0.80 4.47 2.86 1.95 3.92 92.29 95.52 88.50
Meghalaya T 40.67 36.80 43.14 36.01 37.08 35.34 3.43 2.27 4.16 19.89 23.85 17.37
R 43.07 39.67 45.17 37.23 38.84 36.24 3.41 2.21 4.15 16.28 19.27 14.44
U 13.24 10.22 15.93 22.06 20.72 23.26 3.60 2.81 4.30 61.10 66.25 56.51
Source: Census of India, 2001
12.3 Child Labour
A child is classifi ed as labourer if the child is in the age group 5-14 years and is ‘economically acti ve’. In India, despite acceptance of internati onal standards and commitments on restricti ng the use of child labour, the existence of a nati onal child labour policy, wide-spread nati onal and state level laws and regulati ons, millions of children are engaged in work, oft en under hardship or hazardous conditi ons. It deprives them of their childhood and their dignity and is detrimental to their health, educati on, and more importantly, in developing capabiliti es and availing opportuniti es as normal individuals in the society.
The problem of child labour is also widespread in Meghalaya. The stati sti cs on child labourers in Meghalaya shows that the problem of child labour in Meghalaya cannot be ignored. Table 12.7 reports the proporti on of children working in Meghalaya as well as in the seven districts by gender and place of residence in 1991.
406

MEGHALAYA STATE DEVELOPMENT REPORTMEGHALAYA STATE DEVELOPMENT REPORT
Table 12.7: Percentage of Child Labourers in the Diff erent Districts of Meghalaya in 1991
Districts Total Rural UrbanPerson Male Female Person Male Female Person Male Female
Jainti a Hills 10.48 12.88 8.12 11.21 13.92 8.53 2.89 2.00 3.77
East Khasi Hills 4.80 5.46 4.13 6.37 7.32 5.40 1.33 1.32 1.34
West Khasi Hills 8.36 9.12 7.59 8.84 9.63 8.02 1.66 1.65 1.67
East Garo Hills 8.52 9.15 7.90 9.03 9.69 8.37 0.84 0.91 0.76
West Garo Hills 8.52 9.00 8.02 9.33 9.84 8.81 1.59 1.69 1.50
Meghalaya 7.39 8.23 6.54 8.59 9.59 7.57 1.48 1.43 1.52
Source: Census of India, 1991
Clearly, the proporti on of children working in the rural areas was more than that in the urban areas. According to the 1991 census 8.59 percent of the children in rural sector were working. The proporti on of male child labourers was again higher than the female child labourers. This is because a signifi cant proporti on of the girl child is found to be ‘no-where’ child, i.e. they neither go to school nor seen in the labour market as they are more engaged in the household duty or in other words engaged in non-wage work.
The proporti on of child labourers in Jainti a Hills was high in comparison to the other districts of Meghalaya. In 1991 the percentage of child labourers in Jainti a Hills was 10.48 percent with 12.88 percent being male children and 8.12 percent being female children. This is followed by West Garo Hills and East Garo Hills with 8.52 percent child labourers in both the district. The proporti on of boy and girl child labourers in West Garo Hills was 9 and 8.02 percent, respecti vely. The corresponding proporti on in East Garo Hills was 9.69 and 8.37 percent, respecti vely. In West Khasi Hills, 8.36 percent of the children were labourers with 9.12 percent being boys and 7.59 percent being girls. The proporti on of child labourers is least in East Khasi Hills, i.e., 4.8 percent out of which 5.46 percent were boys and 4.13 percent were girls. The proporti on of child labour was high in the rural sector in all the districts of Meghalaya. Jainti a Hills reports the largest proporti on of child labour both in the rural as well as in the urban sector. In the rural sector 13.92 percent of boys and 8.53 percent of girls were reportedly child labourers. In the urban sector 2 percent and 3.77 percent of girls and boys respecti vely were workers in the district. East Khasi Hills reports the lowest proporti on of child labourers in the rural sector. Similarly, in the urban sector the proporti on of child labour was very low in East Garo Hills where only 0.84 percent of the children were workers, 0.91 percent of them being boys and 0.76 percent being girls.
The Insti tute of Applied Manpower Research (IAMR), New Delhi conducted a survey in the enti re NE region in 2003. The study enti tled “Benchmarking Human Development in North Eastern Region of India” aimed at building a database at the sub-state level related to employment and unemployment, human development and development opti ons for the state. The survey found that 4 percent of workers in the rural areas of Meghalaya are below 15 years. The corresponding fi gure in the urban areas (Shillong and Nongstoin) is 1.1 percent. In rural areas, highest incidence of child labour is found in West Khasi Hills (9.14 percent) followed by Jainti a Hills (7.6 percent). The other districts of East Khasi Hills (2.9 percent), West Garo Hills (2.8 percent), Ri Bhoi (2.6 percent),
407

MEGHALAYA STATE DEVELOPMENT REPORTMEGHALAYA STATE DEVELOPMENT REPORT
East Garo Hills (0.4 percent) and South Garo Hills (0.4 percent) show lower proporti ons of children among workers in 2003.
Table 12.8: Proporti on of Child Laborers in 2001 in the North Eastern States of India by Sex and Place of Residence
StatesTotal Rural Urban
Person Male Female Person Male Female Person Male Female
Arunachal Pradesh 6.06 5.22 6.94 6.80 5.95 7.69 3.04 2.19 3.90
Assam 5.07 6.03 4.06 5.30 6.37 4.17 3.03 3.00 3.06
Manipur 5.75 5.57 5.94 6.73 6.50 6.96 2.72 2.64 2.80
Meghalaya 8.22 8.64 7.79 9.36 9.86 8.84 2.75 2.68 2.82
Mizoram 12.34 11.86 12.83 16.52 15.63 17.45 7.42 7.37 7.47
Nagaland 8.48 8.25 8.73 9.44 9.14 9.76 3.58 3.68 3.47
Tripura 2.79 2.85 2.72 2.91 3.05 2.77 1.94 1.52 2.37
India 5.00 5.14 4.85 5.94 5.94 5.95 2.12 2.69 1.49Source: Census of India, 2001
Table 12.8 reveals that among all the north eastern states Mizoram and Meghalaya have the highest proporti on of child labourers. For instance in Meghalaya and Mizoram about 8 percent and 12 percent of the children respecti vely are in the work force. The proporti on in these two states is also higher than that of the all India rate, which is only 5 percent. Again the proporti on of both boys and girls in the labour force in Meghalaya is exceedingly high. The proporti on of child labourers in the rural sector of Meghalaya is much higher than that of enti re rural India. Among the north eastern states the proporti on of child labourers in the urban sector of Meghalaya is the third lowest next to Tripura and Manipur, while in the rural sector it is second only to Mizoram.
12.4 Unemployment Unemployment refers to the unuti lized labour force that is willing to or available for work. Unemployment arises when there is inadequate producti ve capacity to create enough jobs for all those able and willing to work. In this secti on we att empt to explain the magnitude of unemployment in Meghalaya and compare with the rest of the NE states and the all India level.
Table 12.9: Unemployment Rate in the North Eastern States of India in 1991 (in percent)
StatesTotal Rural Urban
Person Male Female Person Male Female Person Male Female
Arunachal Pradesh 0.61 0.53 0.74 0.57 0.49 0.69 0.93 0.72 2.25
Assam 4.50 3.74 6.34 3.86 3.29 5.13 10.20 6.95 29.86
Manipur 2.03 1.84 2.26 1.60 1.50 1.72 3.49 2.90 4.36
Mizoram 0.80 0.69 0.95 0.58 0.50 0.68 1.08 0.92 1.32
Nagaland 1.53 1.58 1.47 1.15 1.13 1.18 3.97 3.44 6.71
Tripura 11.21 6.70 24.54 10.09 6.06 21.72 17.42 10.12 22.49
Meghalaya 0.54 0.39 0.76 0.43 0.32 0.56 1.21 0.67 2.75
India 3.24 2.43 5.22 2.46 1.87 3.66 6.14 4.08 16.80Source: Census of India, 1991.
In 1991, among the northeastern states of India, Tripura has a very high unemployment
408

MEGHALAYA STATE DEVELOPMENT REPORTMEGHALAYA STATE DEVELOPMENT REPORT
rate followed by Assam (Table 12.9). Meghalaya has the lowest unemployment rate among all the states in the northeast. The unemployment rate of Meghalaya in both rural and urban sector for both males and females is much lower compared to the other north eastern states. Further the unemployment rate of Meghalaya in the rural sector is less than 1 percent as against 2 percent in the rural India. Similarly in the urban sector the unemployment rate of Meghalaya is around 1 percent while in the urban India it is 6 percent.
Table 12.10: Unemployment Rate in the North Eastern States of India in 2001 (in percent)
States Unemployment Rate Adjusted Unemployment Rate
Person Male Female Person Male Female
Arunachal Pradesh 10.78 8.57 14.02 7.53 5.69 10.24
Assam 23.00 16.59 36.31 16.42 10.81 28.06
Manipur 22.20 18.94 26.16 14.15 12.57 16.06
Meghalaya 12.57 9.55 16.62 7.68 5.56 10.52
Mizoram 7.05 6.27 8.05 3.81 3.19 4.60
Nagaland 16.31 14.93 18.14 12.43 11.24 14.01
Sikkim 8.83 6.22 13.01 6.37 4.22 9.81
Tripura 30.15 19.02 49.62 23.08 13.34 40.13
India 15.86 12.64 22.12 10.22 7.32 15.86Note: The unemployed are those who are seeking work or available for work. The unemployment rate is calculated
by dividing the Number of Unemployed by the total Labour Force (i.e. working + unemployed). The adjusted unemployment rate excludes the marginal workers who are seeking/ available for work from the numerator.
Source: Calculated for the Report based on Census Reference Tables, B Series, Census of India, 2001.
Table 12.10 reveals that unemployment has increased substanti ally during the period 1991 to 2001 for all the NE states as well as for the country as a whole. Unemployment in Meghalaya is however, slightly lower than the all India level. Arunachal Pradesh, Mizoram and Sikkim exhibit unemployment rates that are lower than Meghalaya. The situati on in Tripura is alarming, to say the least. The tremendous economic growth of India aft er 1991 seems to be a jobless growth. This is a matt er of grave concern.
The NSSO uses four concepts to esti mate the unemployment in the country. The Usual Status Approach measures chronic or long-term unemployment during the reference year. However, some people who are reported to be unemployed on the basis of the usual status might be working in a subsidiary capacity during the reference period. Therefore, in order to capture the exact degree of unemployment prevailing in the state, we have excluded those working in a subsidiary capacity from the usually unemployed. This approach is also called the Usual Status Adjusted Approach.
Table 12.11 shows the unemployment rate in Meghalaya in the most recent fi ve rounds of NSS survey. We observe that the unemployment rate has decreased from 1.42 percent in 1983 to 0.18 percent in 1987-88. However, the unemployment rate increased marginally from
409

MEGHALAYA STATE DEVELOPMENT REPORTMEGHALAYA STATE DEVELOPMENT REPORT
0.18 percent in 1987-88 to 0.21 percent in 1993-94 and further to 0.83 percent in 1999-00. The decline in unemployment rate was percepti ble both in the rural and urban areas. In the urban sector the unemployment rate declined from 8.50 percent in 1983 to 1.42 percent in 1987-88 and then increased to 1.68 in 1993-94. It further increased to 4.35 percent in 1999-00. Similarly, in the rural sector there was a decline from 0.42 percent in 1983 to 0.01 percent in 1987-88. Thereaft er, it increased to 0.06 percent in 1993-94 and further to 0.37 percent in 1999-00. The urban unemployment rate in all the rounds of survey was higher than the rural unemployment rate. A possible explanati on for this might be the people migrati ng from rural areas to urban areas in search of work and also due to the presence of large-scale disguised unemployment in the rural areas. The prevalence of unemployment among the educated youth also leads to higher unemployment rate in the urban sector.
Table 12.11: Unemployment Rate in Meghalaya (NSSO) (in percent)
Year Sector Male Female Person1983 Rural 0.65 0.09 0.42
Urban 8.32 8.98 8.50Total 1.83 0.81 1.42
1987-88 Rural 0.02 0.00 0.01Urban 1.63 1.09 1.42Total 0.23 0.11 0.18
1993-94 Rural 0.10 0.00 0.06Urban 1.05 3.37 1.68Total 0.21 0.20 0.21
1999-00 Rural 0.31 0.44 0.37Urban 3.60 5.86 4.35Total 0.76 0.93 0.83
2004-05 Rural 0.07 0.54 0.28Urban 3.53 3.43 3.49Total 0.45 0.84 0.62
Source: Special tabulati on by Minakshi Chakraborty and Veronica Pala using unit record data on Employment and
Unemployment conducted by the Nati onal Sample Survey Organisati on.
Again, we fi nd that in the rural as well as the urban sector the unemployment rate of the females was higher than that of the males. For instance in 1999-00, 5.86 percent of the females were unemployed as against 3.6 percent of males. In the rural sector, on the other hand, 0.44 percent of females were unemployed as against 0.31 percent of males.
410
MEGHALAYA STATE DEVELOPMENT REPORTMEGHALAYA STATE DEVELOPMENT REPORT
Coming to youth unemployment, the unemployment rate in Meghalaya as per the 1991 census was relati vely high at 4.4 percent in the age group 15-19 with 3.14 percent of males and 7.74 percent of females being unemployed. The unemployment rate of the female youth was also high in the age group 20-24 with 3.5 percent being unemployed. In Table 12.12 we report the unemployment rate of the youth as per esti mates based on the NSS data in 1983, 1987-88, 1993-94, 1999-00 and 2004-05.
The NSSO fi gures also show high unemployment rate in the age group 15-19 and 20-24. In 1983 the unemployment rate in the age group 15-19 years and 20-24 years was 1.90 percent and 3.98 percent respecti vely. The unemployment rate was mainly high in the urban sector in this age group. During the same period 26.06 percent of the urban populati on in the age group 15-19 years was unemployed. The female unemployment rate was high in the age group 15-19 years with 43.13 percent of females being unemployed as against 18.97 percent males. The unemployment rate was also high in the age group 25-29 years with 20.38 percent of the urban populati on being unemployed. The proporti on of unemployed males in this age group was 21.49 percent as against 16.97 percent of females. In 1987 the unemployment rate in the age group 15-19 years declined signifi cantly to 2.49 percent in the urban sector. The female unemployment rate in the urban sector, which was very high in 1983, declined to 2.77 percent for the age group 15-19 years. Similarly, there was a decline in the unemployment rate of males in the age group 15-19 years from 18.97 percent in 1983 to 2.20 percent in 1987-88 in the urban sector. In 1993-94, the unemployment rate in the urban sector increased to 6.64 percent for the age group 15-19 years. We observe a similar increase in the unemployment rate in the urban sector in the age group 20-24 years from 6.18 percent in 1987-88 to 10.53 percent in 1999-93. In 1999-00 the urban unemployment rate further increased to 8.56 percent for the age group 15-19 years and 11.58 percent for the age group 20-24.The unemployment rates in the urban sector for the age group 25-29 years was also signifi cant at 14.73 percent in 1999-00. This undoubtedly refl ects the existence of youth unemployment in the urban sector of Meghalaya.
411

MEGHALAYA STATE DEVELOPMENT REPORTMEGHALAYA STATE DEVELOPMENT REPORT
Table 12.12: Unemployment Rate by Age Group in Meghalaya
Age Group
Rural Urban TotalMale Female Person Male Female Person Male Female Person
198315-19 0.00 0.00 0.00 18.97 43.13 26.06 1.64 2.29 1.9020-24 1.32 0.61 0.96 0.00 0.00 0.00 5.92 1.89 3.9825-29 1.38 0.00 0.77 21.49 16.97 20.38 2.81 0.89 2.01
1987-88 15-19 0.04 0.00 0.02 2.20 2.77 2.49 0.26 0.28 0.2720-24 0.00 0.00 0.00 11.49 1.42 6.18 1.12 0.16 0.6625-29 0.00 0.00 0.00 1.21 4.19 2.42 0.17 0.39 0.28
1993-94 15-19 0.05 0.00 0.03 9.71 0.00 6.64 0.53 0.00 0.3320-24 0.65 0.00 0.30 6.70 16.10 10.53 0.98 0.50 0.7225-29 0.00 0.00 0.00 0.84 11.41 3.66 0.08 0.56 0.28
1999-00 15-19 1.23 0.00 0.69 3.25 16.19 8.56 1.34 0.76 1.0920-24 1.00 2.30 1.62 13.28 8.83 11.58 2.87 3.00 2.9325-29 0.00 0.53 0.26 11.40 18.75 14.73 1.17 2.20 1.67
2004-0515-19 0.00 0.00 0.00 29.41 3.01 14.33 1.55 0.35 1.1020-24 0.42 2.49 1.48 2.56 14.86 8.08 0.61 3.38 2.0225-29 0.06 1.08 0.53 11.12 10.36 10.75 1.27 2.14 1.68
Source: As in Table 12.11
Therefore, we fi nd that the urban unemployment rate, which showed a decline in the period 1983 to 1987-88 reversed in the period 1993-94 to 1999-00. The rural unemployment rate has been insignifi cant, as we have observed in the four rounds of survey. The unemployment rate of the youth is increasing. Therefore the unemployment rate of the youth is a matt er of serious concern. Unemployment rate and Educati on: Tables 12.13 and 12.14 show the unemployment rate at diff erent levels of educati onal att ainment. In 1983 and 1987-88 we fi nd that with the increase in the level of educati onal att ainment the unemployment rate increases. The unemployment rate of the educated tends to be high. We observe that the unemployment rate of the illiterate is almost negligible while the unemployment rates of the graduates are relati vely very high. In 1983 the unemployment rate of the illiterates was 0.06 percent while that of the graduates was 4.19 percent. Unemployment rate was observed to be very high among the people with secondary level of educati onal att ainment with 12.15 percent of them being unemployed in 1983. In 1987-88 the unemployment rate of the graduates declined to 2.75 percent. The unemployment rate in this period was high for the graduates in professional subjects at 4.21 percent. In 1993-94 the unemployment rate of the graduates increased to 4.48 percent and in 1999-00 it increased further to 12.89 percent.
412

MEGHALAYA STATE DEVELOPMENT REPORTMEGHALAYA STATE DEVELOPMENT REPORT
Table 12.13: Unemployment Rate by Educati on in Meghalaya in 1983 and 1987-88
Educati on Code
Rural Urban Total
Male Female Person Male Female Person Male Female Person
1983
1 0.00 0.00 0.00 3.86 0.00 1.97 0.10 0.00 0.05
2 0.00 0.00 0.00 0.00 0.00 0.00 0.00 0.00 0.00
3 0.81 0.00 0.51 4.12 24.54 9.84 1.18 1.87 1.43
4 1.40 1.24 1.35 7.17 19.84 8.82 3.27 3.78 3.40
5 2.15 0.00 1.49 21.21 14.64 20.10 12.72 5.32 10.97
6 0.00 0.00 0.00 0.00 7.39 1.91 0.00 3.32 1.17
7 0.00 0.00 0.00 3.87 4.26 3.99 3.37 3.42 3.39
Total 0.42 0.10 0.29 8.57 10.06 8.93 1.73 0.86 1.38
1987-88
1 0.01 0.00 0.00 2.55 0.00 1.28 0.06 0.00 0.03
2 0.00 0.00 0.00 0.00 0.00 0.00 0.00 0.00 0.00
3 0.00 0.00 0.00 0.00 0.00 0.00 0.00 0.00 0.00
4 0.00 0.00 0.00 2.64 3.81 3.02 0.63 0.90 0.72
5 0.00 0.00 0.00 1.48 0.00 0.90 0.77 0.00 0.50
6 12.83 0.00 10.33 0.00 0.00 0.00 5.10 0.00 3.65
7 0.00 0.00 0.00 2.77 3.58 3.00 2.47 2.72 2.55
Total 0.03 0.00 0.01 1.75 1.23 1.55 0.27 0.13 0.21Note: (i) 1-illiterate, 2-literate below primary, 3-primary, 4-middle, 5-secondary, 6-graduate and above in professional subjects, 7- graduate and above in general subjects (ii) The Unemployment rate is calculated for the age group 15 and above.
Source: As in Table 12.11
Table 12.14: Unemployment Rate by Educati on in Meghalaya in 1993-94, 1999-00 and 2004-05
Educati on Code
Rural Urban Total
Male Female Person Male Female Person Male Female Person
1993-94
1 0.00 0.00 0.00 0.00 0.00 0.00 0.00 0.00 0.00
2 0.03 0.00 0.02 0.00 0.00 0.00 0.03 0.00 0.02
3 0.00 0.00 0.00 1.47 0.00 1.06 0.12 0.00 0.08
4 0.00 0.00 0.00 1.01 0.00 0.79 0.22 0.00 0.16
5 0.00 0.00 0.00 0.00 14.46 4.95 0.00 5.85 1.60
6 0.00 0.00 0.00 0.73 0.00 0.57 0.43 0.00 0.33
7 0.00 0.00 0.00 0.00 0.00 0.00 0.00 0.00 0.00
8 12.00 0.00 7.15 2.27 6.72 3.39 4.66 4.05 4.48
Total 0.10 0.00 0.06 1.05 3.38 1.68 0.21 0.20 0.21
1999-00
1 0.11 0.00 0.06 0.00 0.00 0.00 0.10 0.00 0.06
2 0.65 0.00 0.38 0.00 2.11 0.94 0.63 0.08 0.40
3 0.00 0.00 0.00 4.09 3.15 3.80 0.21 0.10 0.16
413

MEGHALAYA STATE DEVELOPMENT REPORTMEGHALAYA STATE DEVELOPMENT REPORT
4 0.00 0.00 0.00 2.32 1.06 1.93 0.70 0.21 0.50
5 0.00 8.84 5.00 0.00 0.00 0.00 0.00 7.39 2.75
6 4.03 0.00 2.86 3.46 8.04 4.79 3.68 4.94 4.05
7 0.00 0.00 0.00 0.00 0.00 0.00 0.00 0.00 0.00
8 5.29 32.29 16.31 11.16 13.86 12.33 10.31 16.33 12.89
Total 0.32 0.44 0.37 3.60 5.95 4.37 0.78 0.94 0.85
2004-05
1 0.00 0.00 0.00 0.00 0.00 0.00 0.00 0.00 0.00
2 0.00 0.00 0.00 0.28 4.45 1.72 0.01 0.09 0.05
3 0.00 0.00 0.00 0.00 0.00 0.00 0.00 0.00 0.00
4 0.00 1.75 0.62 5.32 6.10 5.54 0.71 2.18 1.22
5* 0.78 1.36 0.96 3.97 0.00 2.42 2.00 0.73 1.56
7 0.00 0.00 0.00 0.00 0.00 0.00 0.00 0.00 0.00
8 1.87 22.26 13.86 4.34 7.43 6.06 3.76 11.29 8.01
Total 0.07 0.55 0.29 3.57 3.62 3.59 0.46 0.85 0.64Note: (i) 1-illiterate, 2-literate below primary, 3-primary, 4-middle, 5-secondary, 6-higher secondary, 7-graduate and above in professional subjects, 8- graduate and above in general subjects
* includes higher secondary(ii) The Unemployment rate is calculated for the age group 15 and above
Source: As in Table 12.11
This shows the prevalence of unemployment of the educated in the urban sector of Meghalaya. With the growing number of educated people in the labour force there is a need to increase the employment opportuniti es in the state so that the human capital can be uti lized. This will be possible by increasing the growth rate of the economy, which will in turn increase the employment opportuniti es of the state.
The prevailing employment market scenario and the relati ve status of various occupati ons in the society greatly infl uence the job aspirati ons of the persons entering the acti ve working life. The IAMR has found that regular salaried job in government is the most sought aft er work by the unemployed, followed by self employment in business or trade.
Table 12.15: Desired Type of Work by the Unemployed in Meghalaya, 2003
Type of work desired Rural Urban
Male Female Total Male Female Total
Self-employment in business/trade 30.1 14.0 22.6 11.8 7.7 9.5
Self-employment in agriculture 8.3 12.5 10.2 0.8 0.7 0.7
Regular salaried job in govt sector 46.3 63.2 54.2 71.4 77.4 74.8
Regular salaried job in pvt sector 4.6 2.6 3.7 4.2 7.1 5.8
Agricultural wage labour 3.8 3.8 3.8 NA NA NA
Non-agricultural wage labour 4.6 2.6 3.7 0.8 0.0 0.4
Any other 2.3 1.3 1.8 10.9 7.1 8.8
Total 100 100 100 100 100 100
Source: Insti tute of Applied Manpower Research, New Delhi, IAMR Report No. 8/2006.
414

MEGHALAYA STATE DEVELOPMENT REPORTMEGHALAYA STATE DEVELOPMENT REPORT
12.5 Summary and Some Suggesti ons for Employment Generati on
• The work parti cipati on rate in the three census period i.e.1981, 1991 and 2001 shows a declining trend in both the rural and urban sector. The male work parti cipati on rate declined while that of the female parti cipati on rate increased in some of the districts in Meghalaya.
• Work Parti cipati on Rate of females in Meghalaya is much higher than the all India level.
• The proporti on of marginal workers increased in the period 1981 to 2001 while the proporti on of main workers declined. This implies that underemployment is on the rise.
• The occupati onal structure of the labour force shows that in the rural sector majority of the main workers were culti vators while in the urban sector major proporti on of the workers are categorized as ‘other workers’. The marginal workers in the rural areas mainly work as agricultural labourers.
• There has not been a signifi cant change in the occupati onal structure of the labour force since 1981 to 2001 as the agriculture is the dominant group in the rural sector and in the urban sector the ‘other workers’ consti tute the dominant group.
• We observe a high incidence of child labour in the rural sector in all the districts of Meghalaya. There is high prevalence of youth unemployment in the state. Unemployment of the educated in Meghalaya as a whole has increased in the recent years.
• Various economic acti viti es in the service sector are urban based. One measure to increase economic growth and producti vity is decentralized urbanizati on or rather Providing Urban ameniti es and services in the Rural Areas (PURA).
• The type of employment that is desired by most youth is in the government sector and the rate of unemployment is highest among general graduates. Therefore, there is a need to give high priority to vocati onal and technical educati on including professional courses in the state so that people have bett er scope and wider choices to exercise. This is an imperati ve since there is a serious shortage of skilled professionals amongst the people of Meghalaya working in diff erent fi elds.
• A strategy for employment generati on for the state has to be in line with the strengths of the state and its resource base. Majority of the populati on in the state is engaged in agriculture and allied acti viti es. There is tremendous scope of improvement in these sectors. Training can be imparted in areas like Seed producti on technology, Plantati on and management of crops, fl oriculture, crop culti vati on, plant protecti on etc.
• Fisheries also have a huge potenti al in generati ng employment opportuniti es in the state. Fish processing, inland fi sheries, fi sh seed producti on and fi shing technology are some areas where greater employment opportuniti es can be explored.
• As most of the people are non-vegetarian there is a lot of scope in sheep, pig and goat rearing, dairying, poultry producti on, veterinary pharmacist-cum-Arti fi cial inseminati on assistant, etc.
415

MEGHALAYA STATE DEVELOPMENT REPORTMEGHALAYA STATE DEVELOPMENT REPORT
• Other than the above menti oned, agro-based industries, sericulture, apiculture, repair and maintenance of power driven farm machinery, medicinal and aromati c plant industry and soil conservati on are some other areas that can be focused to generate employment opportuniti es in the state.
• Even though Meghalaya is not an industrial state, areas like travel, banking, marketi ng and salesmanship, export-import practi ces and documentati on, and purchasing and store keeping can be focused and training can be provided to those seeking jobs but do not have the requisite skills.
• The insti tutes providing vocati onal training can include courses like civil constructi on and maintenance, mechanical servicing, audio-visual technician, maintenance and repair of Electrical Domesti c Appliances and road constructi on. Candidates who pass out from these insti tutes can then be moti vated to form groups like ‘Dial-a-service’. This may help in addressing the problem of unemployment persisti ng in the state.
• People can be moti vated to take up courses like Medical Laboratory/Technology Assistant, Health Worker, Nursing, Health Sanitary Inspector/Surveyor, Hospital Documentati on, Hospital Housekeeping, X-ray Technician, Bio Medical Equipment and Technician, Multi Purpose Health Worker, Auxiliary Nurse and Mid Wives, Primary Health Worker. This will not only provide job opportuniti es to the needy but will also help in the development of bett er medical infrastructure in the state.
• A revoluti on has been brought about in the banking and telecom sectors by private sector parti cipati on in these sectors. Growth of these sectors has created a large demand for IT-Enabled services in the areas of back-offi ce processing, collecti ons, customer care and call services, etc. This is a major opportunity for Meghalaya to emerge as a hub for the delivery of these services to the enti re region. This will however require the creati on of necessary infrastructure and an enabling environment for encouraging private sector investment in the IT-Enabled Services.
• The state has immense tourism potenti al most of which is at present unexploited. There has been a tremendous spurt in the travel and tourism industry around the world. India is among the fastest growing travel and tourism economies in the world. The “Incredible !ndia” campaign has brought a lot of recogniti on to the country among internati onal holiday seekers. The state can capitalize on this recogniti on to promote itself as a favoured ecotourism desti nati on. Tourism industry is also known to generate the highest employment per rupee of investment. As the state’s eff ort to promote tourism bears fruit, a large number of jobs are expected to be created in the hospitality industry. This will however require the creati on of requisite infrastructure for capacity building to serve the tourism industry.
• The state has very rich mineral resources, especially coal, limestone, granite, silimanite, clay, kaolin and uranium. However, coal and limestone are the only minerals that are being widely exploited. Even for these two minerals the mining practi ces are largely unscienti fi c and sub-
416
MEGHALAYA STATE DEVELOPMENT REPORTMEGHALAYA STATE DEVELOPMENT REPORT
opti mal. The mining operati ons are concentrated in a few hands preventi ng the benefi ts of the state’s mineral resources to fl ow to the masses. Regularizati on and modernizati on of mining practi ces in the state can provide a large number of employment opportuniti es in the state. This is a must since the present mining practi ces are unatt racti ve to the residents of the state leading to infl ux and change in the demographic patt ern of the mining areas.
• As a conclusion, the above suggesti ons in creati ng employment opportuniti es can be implemented only if the infrastructure base of the state is strengthened. Therefore, development of basic ameniti es and infrastructure especially in the rural areas has to be accorded high priority.


MEGHALAYA STATE DEVELOPMENT REPORTMEGHALAYA STATE DEVELOPMENT REPORTMEGHALAYA STATE DEVELOPMENT REPORT
CHAPTER – XIII
REVIEW AND LOOKING FORWARD
13.1 Tenth Plan Review:- During the Tenth Plan period, the State Plan investment was Rs. 2922.77 Crores as against the approved projected plan size of Rs. 3009.00 crores and cumulati ve approved annual plans of Rs. 3516.34 crores. The implementati on of the Tenth Plan of Meghalaya faced serious handicaps due to a number of factors, parti cularly resource constraints. The poor resource-base compelled the State to be largely dependent on Central Assistance sancti oned by the Planning Commission and the decision of the Central Government to provide only 90 percent grant while asking the State Governments to raise the 10 percent loan component had put further strain on the fi nancial resources of the State.
13.2. Investment patt ern during the Tenth Plan:- During the Tenth Plan, investment in respect of the State Plan are as indicated below:-
Table 13.1 Investment Patt ern during 10th Plan [Rs. crores]
Year Approved Outlay Revised Outlay Actual Expenditure2002-03 545.00 480.43 400.042003-04 555.00 536.00 486.162004-05 716.34 679.00 590.172005-06 800.00 718.00 687.782006-07 900.00 810.50 758.62
Total 3516.34 3223.93 2922.77
The resources available during the Tenth Plan period for Meghalaya in respect of the State Plan as indicated in the table below indicates that the Plan resources suff ered due to less availability of funds under EAP and Loans :-
Table 13.2 Tenth Plan Resources [Rs. crores]
Items10th Plan approved
2002-03 2003-04 2004-05 2005-06 2006-07 TotalExcess (+)/ Shortf all (-)
1. Central Assistance
2323.15 414.14 483.99 494.59 433.72 553.96 2380.40 57.25
i. NCA 1505.52 290.28 324.02 296.90 328.62 400.42 1640.24 134.72
ii. Others 680.13 115.75 149.69 181.64 91.77 144.48 683.33 3.20
iii. EAP 137.50 8.11 10.28 16.05 13.33 9.06 56.83 - 80.67
2. Loans 594.78 67.56 53.00 41.79 31.03 26.25 219.63 - 375.15
Total - CA & Loans 2917.93 481.70 536.99 536.38 464.75 580.21 2600.03 - 317.90
The broad sectoral distributi on patt ern of investment during the Tenth Plan period in the State of Meghalaya may be seen below :-
419

MEGHALAYA STATE DEVELOPMENT REPORTMEGHALAYA STATE DEVELOPMENT REPORTMEGHALAYA STATE DEVELOPMENT REPORT
Table 13.3 Tenth Plan distributi on patt ern (Rs. in lakhs)
Sectoral Groups10th Plan
Approved Outlay10th Plan Outlay based on
Annual Plan allocati ons10th Plan 2002-2007
Total Expenditure
I. Agriculture & Allied Services29960.00 29272.00 24585.94
[9.96] [8.32] [8.02]
II. Rural Development19768.00 27141.00 28420.38
[6.57] [7.72] [9.28]
III. Special Area Programme4470.00 3984.00 4415.66
[1.49] [1.13] [1.44]
IV. Irrigati on & Flood Control9740.00 5987.00 4776.08
[3.24] [1.70] [1.56]
V. Energy
51627.00 86000.00 53725.33
[17.16] [24.46] [17.53]
VI. Industry & Minerals14400.00 11828.00 10903.56
[4.79] [3.36] [3.56]
VII. Transport
54030.00 49181.00 50486.99
[17.96] [13.99] [16.48]
VIII. S & T & Environment 790.00 770.00 732.17
[0.26] [0.22] [0.24]
IX. General Economic Services 5970.00 9223.00 5104.02
[1.98] [2.62] [1.67]
X. Social Services 103435.00 119073.00 104031.30
[34.38] [33.86] [33.95]
XI. General Services6710.00 9175.00 5086.38
[2.23] [2.61] [1.66]
Total
300900.00 351634.00 292277.81
[100.00] [100.00] [100.00]
N.B. Figures in brackets indicate percentage to total.
13.3. Gross Domesti c Product/ Net State Domesti c Product :- The State has witnessed a steady increase in income during the Tenth Plan period. The table below indicates the level of Gross Domesti c Product and Net State Domesti c Product (at current and constant prices) including the per capita income in the fi rst year and the last year of the Tenth Plan, i.e. 2002-03 and 2006-07 respecti vely :-
Table 13.4 GDP/NSDPSl. No.
Income 2002-03 2006-07
Total (Rs. Cr) Per capita income (Rs)
Total (Rs. Cr) Per capita income (Rs)
1. GDP at current prices 4900.10 20702 7051.65 28343
2. GDP at constant (1999-2000) prices 4240.26 17914 5396.04 21688
3. NSDP at current prices 4439.58 18756 6254.96 25141
4. NSDP at constant (1999-2000) prices 3829.08 16177 4713.33 18944
13.4. The growth rate for Meghalaya has been 6.33 percent in the Tenth Plan as compared to 7.8 percent in the Ninth Plan. This is mainly due to the inability of infrastructure, parti cularly
420

MEGHALAYA STATE DEVELOPMENT REPORTMEGHALAYA STATE DEVELOPMENT REPORTMEGHALAYA STATE DEVELOPMENT REPORT
power, to sustain and support a high level of growth. There is need for accelerated investment in infrastructure. A graphical representati on of the sectoral esti mates of Gross Domesti c Product and Net State Domesti c Product at current prices and at constant prices during the Tenth Plan period is indicated below :-
Sectoral esti mates of Gross Domesti c Product at Current Prices
Sectoral esti mates of Gross Domesti c Product at Constant (1999-2000) Prices
Sectoral esti mates of Net State Domesti c Product at Current Prices
Sectoral esti mates of Net State Domesti c Product at Constant (1999-2000) Prices
2002-0322.06
26.28
51.66
2006-07 (Adv)19.16
28.30
52.54
2002-0322.49
25.92
51.58
2006-07 (Adv)20.88
28.36
50.77
2002-0322.81
24.52
52.67
2006-07 (Adv)20.20
27.13
52.67
2002-0323.28
24.08
52.63
2006-07 (Adv)
26.72
52.1
21.17
Agriculture Industry Services
421

MEGHALAYA STATE DEVELOPMENT REPORTMEGHALAYA STATE DEVELOPMENT REPORTMEGHALAYA STATE DEVELOPMENT REPORT
During the Tenth Plan, the growth rate achieved in agriculture was 4.43 percent, industry was 8.67 percent and services 6.02 percent as against the overall growth of 6.33 percent.
13.5. Socio Economic Indicators:- Some of the socio economic indicators of Meghalaya are indicated in the Appendix. The table and the foregoing chapters clearly depicted the developmental lag, especially in the socio-economic sphere. These would require policy and reforms interventi ons.
13.6. A. The Status of Human Development in Meghalaya: As per the Nati onal Human Development Report 2001, among the 32 states in India (data on the three newly created states of Chhatti shgarh, Jharkhand and Utt arakhand were not available), Meghalaya ranks poorly in level of Human Development. Meghalaya ranked 24th in HDI in 1991. Its positi on has deteriorated from a rank of 21 in 1981. The HDI value of 0.365 is also lower than the all-India average of 0.381. This is the case when we take the combined HDI of rural and urban sectors. It refl ects the situati on in the rural areas due to the populati on weightage of the rural sector.
The picture in the urban sector, however, is diff erent. The HDI has improved from a value of 0.442 in 1981, which incidentally is exactly equal to the All India average, to 0.624 in 1991, which is higher than the All India average of 0.511. The rank of urban Meghalaya in HDI over the same period improved from 21st to 10th. Obviously, this is a big leap forward. Looking at the per capita income of the state, it emerges that in 1990-91 Meghalaya ranked 18th among all the states (Economic Survey 2000-01, p. S-12). The HDI rank of Meghalaya at 24th in 1991 raises questi ons that the resources have not been eff ecti vely put to use for the well-being of the people, especially the rural people.
Among the North Eastern States, Meghalaya fares bett er than Assam and Arunachal Pradesh. The other states of the region, namely, Manipur, Mizoram, Nagaland, Sikkim and Tripura show higher achievements in human development.
The situati on in 2001 is almost the same. Although the HDI values are not directly comparable with those of the NHDR, 2001; the ranking of the states may be compared. Out of the 35 states and Union Territories, Meghalaya ranked 22nd in human development. The HDI rank for the rural areas of the state is 21st and for the urban areas, it is 15th. Thus it is apparent that human development in the three basic dimensions of health, educati on and income in Meghalaya during the 20 year period of 1981 to 2001 has been stagnant vis-à-vis most of the states in India. It also appears that the improvement in the spheres of human development has been achieved only in the urban areas.
As far as the Gender-related Development Index (GDI) is concerned, Meghalaya is in a bett er positi on compared to most of the states in India. The GDI rank of Meghalaya was 12th in 1981 and improved to 7th in 1991. However, the GDI could not be calculated in 2001 due to lack of data.
422

MEGHALAYA STATE DEVELOPMENT REPORTMEGHALAYA STATE DEVELOPMENT REPORTMEGHALAYA STATE DEVELOPMENT REPORT
Details regarding the above aspects of socio-economic development, Gender - related issues and other aspects of human development are presented in the Meghalaya Human Development Report, 2008.
13.6. B. The Status of Human Development in Meghalaya: Inter District Variati onsThe district with the highest HDI is East Khasi Hills district followed by West Garo Hills district. The two major towns of the state namely, Shillong and Tura, are in these two districts and the relati vely higher HDIs of these districts seem to reiterate that human development in Meghalaya has been urban-centric. The other fi ve districts exhibit HDIs that are lower than the state average.
Economic development measured in terms of Domesti c Product does not necessarily refl ect the actual well-being of the people. It is observed that the ranking of the seven districts by the Per Capita Net State Domesti c Product (NSDP) does not have a one-to-one correspondence with the ranking by HDI. The most backward district of the state as per calculati ons is East Garo Hills. However, fi ve districts out of seven have HDIs value that are lower than 0.5. The HDI scale is a 0 to 1 scale and if we take 0.5 as the half way mark of development, then all districts of Meghalaya except East Khasi Hills and West Garo Hills fall short of that mark. Put another way, they have not achieved even half of what is supposed to be done in the basic areas of human development.
The gender-related development index (GDI), measures achievements in the same dimensions using the same indicators as the HDI but captures inequaliti es in achievement between women and men. It is simply the HDI adjusted downward for gender inequality.
MHDR 2008 reported the GDI for each district. The GDI values show the existence of gender inequality in all districts. The ranking of the districts by GDI is exactly the same as the ranking by HDI with two excepti ons. West Khasi Hills replaces East Garo Hills at the bott om of the GDI ranking, although the GDI values of the two districts are more or less the same; and South Garo Hills replaces Ri Bhoi at No. 3.
Table 13.5: Human Development Index of Districts of Meghalaya
DistrictInfant
Mortality Rate
Literacy
Combined Gross
Enrolment Rati o
NSDP Per Capita at current
prices (Rs.)
HDI HDI Rank
East Khasi Hills 34.51 76.98 63.10 17264 0.684 1West Garo Hills 18.13 51.03 65.99 10654 0.597 2Ri Bhoi 60.63 66.07 50.47 9798 0.499 3South Garo Hills 102.01 55.82 85.52 16847 0.498 4Jainti a Hills 77.34 53.00 43.31 15095 0.487 5West Khasi Hills 86.17 65.64 79.13 9345 0.462 6East Garo Hills 90.60 61.70 60.91 9928 0.432 7Meghalaya 52.28 63.31 62.87 13082 0.570
Notes and data sources: MHDR 2008 (under print)
423

MEGHALAYA STATE DEVELOPMENT REPORTMEGHALAYA STATE DEVELOPMENT REPORTMEGHALAYA STATE DEVELOPMENT REPORT
(i) Infant Mortality Rates are as per the esti mates obtained from the Birth & Mortality Survey, 2007.
(ii) Literacy rates are as per the Census of India, 2001 (iii) The gross enrolment rati o is obtained by dividing the combined enrolment numbers by the
populati on aged 5 - 19 years in 2001. The combined enrolment numbers are for Classes I - XII as per the All India Seventh Educati onal Survey, 2002.
(iv) Net State Domesti c Product Per Capita at current prices are for the year 1999-2000 as per the Meghalaya District Gross Domesti c Product 1993-94 to 1999-2000, Directorate of Economics & Stati sti cs, Government of Meghalaya.
Table 13.6: Gender Related Development Index of Districts of Meghalaya
District Sex Populati on IMR Literacy
Combined gross
enrolment rati o
Share in econo-mically acti ve popu-lati on
Rati o of female to male rural
labour wage
NSDP at current prices (Rs in lakh)
GDIGDI
Rank
East Khasi Hills M 333187 27.26 78.12 60.67 63.030.679 125313 0.659 1
F 41.43 75.82 65.55 36.95
West Garo Hills M 259440 18.96 57.51 66.42 59.820.825 57479 0.580 2
F 256373 17.32 44.51 65.54 39.99
South Garo Hills M 51051 88.08 62.60 85.74 55.380.813 18717 0.498 3
F 48054 114.99 48.61 85.30 44.63
Ri Bhoi M 99315 53.09 69.22 48.64 57.520.729 20840 0.491 4
F 93480 68.28 62.67 52.39 42.47
Jainti a Hills M 149376 97.64 50.52 37.94 57.100.683 52227 0.474 5
F 146316 55.80 55.54 48.71 43.00
East Garo Hills M 126312 96.75 67.39 61.46 54.770.846 25743 0.428 6
F 121243 84.83 55.74 60.36 45.26
West Khasi Hills M 149159 91.51 67.02 75.91 53.910.544 28817 0.426 7
F 144956 81.14 64.21 82.53 46.06
Meghalaya M 1167840 51.55 66.14 61.12 58.510.742 329136 0.562
F 1138229 52.99 60.41 64.67 41.47
Notes and data sources: As in Table 2.4: MHDR 2008 (under print)
Meghalaya exhibits lower achievement in the sphere of human development compared to most of the states in India. Further, there seems to be no substanti al improvement especially in the rural areas. There are wide variati ons across the districts within Meghalaya with fi ve out of seven districts showing lower HDI values than the state average. Three districts have HDIs that are below the half-way mark of 0.5.
The concept of human development is much broader and more complex than any summary measure can capture. The HDI is not a comprehensive measure. It does not include important aspects of human development, notably the ability to parti cipate in the decisions that aff ect one’s life and to enjoy the respect of others in the community. The indices give an overview of some basic dimensions of human development, but they must be complemented by looking at the underlying data and other indicators.
424

MEGHALAYA STATE DEVELOPMENT REPORTMEGHALAYA STATE DEVELOPMENT REPORTMEGHALAYA STATE DEVELOPMENT REPORT
13.7. Infrastructure - There exists a substanti al gap between the infrastructure required and that in place at present. Some of the gaps in criti cal infrastructure are:
Table 13.7 Criti cal Infrastructure Gaps.Sl.No. Development Sectors Unit of Development Infrastructure Dev. Required Present Status Infrastructure Gap
1. Power Total demand of power (MW) 610185.20 (30%)
424.80 (70%)
-Do- Villages electrifi ed(Nos.) 57824217(73%)
1565(27%)
-Do- Households electrifi ed(Nos.) 365989135416(37%)
230573(63%)
2. Roads Communicati on Road density (Kms./Sq.Kms.) 75/100(All India)36/100(48%)
39/100(52%)
-Do- Village connecti vity (Nos.) 57822857(49%)
2925(51%)
3. Health & Family WelfareSub-Centres (Nos. as per G.O.I.
norm)773
401(52%)
372(48%)
-Do- P.H.Cs (Nos. as per G.O.I. norm) 116102
(88%)14
(12%)
-Do- C.H.Cs(Nos. as per G.O.I. norm) 2924
(83%)5
(17%)
4. Educati on Training of teachers (Nos.) 211529294(45%)
11558(55%)
-Do- Literacy rate (%) 100% 62.6% 37.4%
5. Irrigati on Potenti al (Lakh hectares) 2.180.26
(12%)1.92
(88%)
7. Water Supply Number of habitati ons 86368389(97%)
247(3%)+ Slipped-back
habitati ons
8. Infrastructure
CMIE Index of infrastructure (92-93)
10065
(100)35
10th Finance Commission index of Economic & Social Infrastructure
10070
(100)
30 [Massive investment
in infrastructure required]
A calculati on of the infrastructure Index for all the North Eastern States in a scale of 0-1 indicate that within the region itself Meghalaya stands at the lower rung of the ladder.
(Source: MHDR 2008– Paper by Dr. S. Umdor & Dr. B. Panda, NEHU)
Table 13.8 Infrastructure index and States RankingStates Index Value Rank
Nagaland 0.39 1
Tripura 0.37 2
Manipur 0.35 3
Mizoram 0.33 4
Assam 0.30 5
Meghalaya 0.23 6
Arunachal Pradesh 0.22 7
425

MEGHALAYA STATE DEVELOPMENT REPORTMEGHALAYA STATE DEVELOPMENT REPORTMEGHALAYA STATE DEVELOPMENT REPORT
Table 13.9 Bott om 10 States in Descending Order
1971-72 1981-82 1991-92 1994-95 Arunachal Pradesh Arunachal Pradesh Arunachal Pradesh Arunachal PradeshMizoram Tripura Tripura TripuraTripura Mizoram Mizoram MizoramNagaland Sikkim Nagaland NagalandSikkim Meghalaya Sikkim MeghalayaMeghalaya Nagaland Meghalaya SikkimAssam Manipur Assam AssamManipur Assam Manipur ManipurUtt ar Pradesh Utt ar Pradesh Orissa OrissaOrissa Orissa Utt ar Pradesh Utt ar Pradesh
Source: Strategic Analysis: What Ails The Northeast: An Enquiry Into The Economic Factors By Sreeradha Datt a * A
Monthly Journal of the IDSA April 2001 (Vol. XXV No. 1)
From the above it is clear that infrastructure defi ciency is in acute form in the state and the region. Hence, there is a need for adequate investment in infrastructure. Further, since the scope of PPP mode is limited in the North Eastern Region, such investment is largely dependent from agencies of the Government of India.
13.8. Eleventh Five Year Plan (2007-2012):-
Prioriti es of the 11th Plan :- While taking into considerati on the approach and the nati onal prioriti es as decided by the Government of India, the State Government has accorded the following prioriti es during the Eleventh Five Year Plan :-
• Power generati on, transmission, grid connecti vity and rural electrifi cati on.
• Agriculture and allied sectors with strong emphasis on horti culture including post harvesti ng management and processing.
• Roads and Bridges for ensuring bett er connecti vity.
• Sericulture & Weaving for generati on of income and employment to the women folk.
• Tourism infrastructure and tourism services.
• Trade with Bangladesh and creati on of infrastructure for the same.
• Decentralizati on of planning and involvement of the people in the development process.
• Social Services like educati on, health, water supply and nutriti on.
• Poverty alleviati on and employment generati on in rural areas through Rural Development Programmes.
426

MEGHALAYA STATE DEVELOPMENT REPORTMEGHALAYA STATE DEVELOPMENT REPORTMEGHALAYA STATE DEVELOPMENT REPORT
During the deliberati ons in the planning Board in January 2009, Human Resource Development, Crop Husbandry, Horti culture, Industries, Minerals, Tourism, Health Care, Water Supply and Sanitati on was taken as focus area.(b). Meghalaya had proposed a Plan allocati on of Rs. 8695.00 Crore for the Eleventh Plan period as against the approved allocati on of Rs. 3009.00 crore during the Tenth Plan period which was a step up of over 188 percent. However, the Plan size during the Eleventh Plan for Meghalaya was approved at Rs. 9185.00 crore and the broad sector-wise allocati ons are indicated below:-
Table 13.10 11th Plan Approved Outlay
Sl. No.
Sectoral Groups Eleventh Plan (2007-2012)Proposed outlay [Rs. lakhs]
%tage to total
I. Agriculture& Allied Services (excluding Forestry & Wildlife)
73,522.00 8.00
II. Rural Development 80,230.00 8.73III. Special Area Programme 18,909.00 2.06IV. Irrigati on & Flood Control 21,972.00 2.40V. Energy 1,08,488.00 11.81VI. Industry& Minerals 29,050.00 3.16VII. Transport 1,62,362.00 17.68VIII. Science, Technology & Environment
(including Forestry & Wildlife)24,507.00 2.67
IX. General Economic Services 25,300.00 2.75X. Social Services (including Educati on) 3,48,174.00 37.91XI. General Services 25,986.00 2.83Total 9,18,500.00 100.00
There have been suggesti ons that allocati on for Energy, Road is most consuming of plan resources. The normal individualized priority to a sector should be between 10-15% as a cap, and this may go up to a maximum of 20%. However, given the lopsided emphasis and wastage of resources and allocati ons in the past, the desired shift and focus appeared ti mely and needs further fi ne tuning. Also total investment in Public sector should be seen holisti cally taking into account Plan, Non Plan, all fi nd fl ow from Government of India. If taken comprehensively, the picture would be diff erent and someti mes revealing.
13.9. Performance in physical terms during the Tenth Plan and targets for the Eleventh Plan:- The table below indicates the physical performance during the Tenth Plan period as well as the targets for the Eleventh Plan.
427

MEGHALAYA STATE DEVELOPMENT REPORTMEGHALAYA STATE DEVELOPMENT REPORTMEGHALAYA STATE DEVELOPMENT REPORT
Table 13.11. 10th Plan Physical Performance & 11th Plan targets
Items
Units10th Plan
Achievement 11th Plan Target
Annual Plan
2007-08
Target
Food Grains ‘000 tonnes 269.93 379.00 291.00
Oil Seeds ‘000 tonnes 14.53 26.18 22.17
Potatoes ‘000 tonnes 203.04 246.69 225.10
Horti culture ‘000 tonnes 245.57 291.98 288.64
Crop Area:
Cross area ‘000 ha 320.00 330.00 325.00
Net sown area ‘000 ha 250.00 265.00 260.50
Area covered under
Irrigati on‘000 ha (cum) 28.69 45.19 30.69
Producti on of Eggs Million Nos. 98.00 110.00 100.00
Producti on of Meat ‘000 tonnes 37.00 42.00 38.00
Milk ‘000 tonnes 76.00 95.00 77.20
Fish Producti on ‘000 tonnes 5.50 6.50 5.50
Fish Seed Producti on Million Nos. 1.15 3.00 2.00
SGSY SHG’s Assisted 4313 7000 (cum) 1200
SGRY employment Lakh mandays 175.41 (cum) 251.50 (cum) 29.62
IAY No. 19736 (cum) 45222 (cum) 5352
Installed Capacity MW (cum) 185.20 313.00 185.20
Rural Electrifi cati onNo. of villages 5062
Complete full
electrifi cati on5951
Road Length Kms. (Cum) 8254.00 9013.00 8354.00
Surface Roads Kms. (Cum) 5073.00 6567.00 5253.00
Road Density Kms./ 100 sq. Km. 36.79 40.18 37.25
Primary Enrolment ‘000 nos. 444.4 500 480
Upper Primary
Enrolment‘000 nos. 178.4 250 200
Secondary Enrolment ‘000 nos. 115 120 116
Higher Secondary
Enrolment‘000 nos. 6 7 6.2
College Enrolment ‘000 nos. 40 45 41
Training of elementary
school teachersNos. (cum) 13962 21152 4799
Sub Centres Nos. (cum) 419 431 425
PHCs Nos. (cum) 110 115 112
428

MEGHALAYA STATE DEVELOPMENT REPORTMEGHALAYA STATE DEVELOPMENT REPORTMEGHALAYA STATE DEVELOPMENT REPORT
Items Units 10th Plan Achievement 11th Plan Target
Annual Plan 2007-08 Target
CHCs Nos. (cum) 32 36 34
Doctors Nos. (cum) 542 804 584Nurses Nos. (addl) 1655 1847 1735
13.10. Monitorable targets during the Eleventh Plan :-
During the 11th Plan period, the target growth rate fi xed for the State is 7.2 percent, comprising of growth rates of 4.7 percent in agriculture, 8.0 percent in industry and 7.9 percent in services sectors. Besides the above, the monitorable targets as agreed and projected by the State Government are as indicated below:-
Table 13.12 Monitorable IndicatorsMonitorable indicators India Meghalaya
Current level 11th Plan Goal Current level 11th Plan Goal
Infant Mortality Rate (IMR) 58.0 28.0 54.0 26.0
Maternal Mortality Rate (MMR) 301.0* 100.0 450.0$ 100.0
Total Ferti lity Rate (TFR) 3.0 2.1 4.6# 2.6
Malnutriti on amongst children (0-3 years) 47.0 23.5 37.9 19.0
Anemia among women (15-49 years) 56.5 28.3 63.3 31.7
Sex rati o (0-6 years) 927.0 935.0 973.0 981.0
Drop out rates in Elementary Educati on 42.69^ 20.00^ 62.26 31.63
Literacy Rate :-
Male 75.26 89.80 65.43 87.87
Female 53.67 79.80 59.61 87.35
Total 64.59 85.00 62.56 87.61
Gender gap in literacy rate 21.6 10.0 5.8 0.5N.B. * 2001-03 fi gures $ State report survey # Nati onal Family Health Survey (1998-99) ^ Projected for 2006-07 It was agreed to bring down the level of poverty by 10% from the Household Survey 2002 level which stands at 48.9 percent. It was also planned to generate additi onal work opportuniti es to 1.50 lakh people and facilitate employment generati on.
13.11. Annual Plan allocati ons – The Annual Plan allocati ons during the 11th Plan are indicated as below:-
Table 13.13 Annual Plan Allocati ons [Rs. crores]
Annual Plan Approved Outlay Expenditure2007-08 1120.00 984.062008-09 1500.00 1450.00(Anti )Total 2620.00 2484.06
429

MEGHALAYA STATE DEVELOPMENT REPORTMEGHALAYA STATE DEVELOPMENT REPORTMEGHALAYA STATE DEVELOPMENT REPORT
Further, in order to achieve the 11th Plan approved outlay of Rs. 9185.00 crores, the Annual Plan allocati ons for the next three years, i.e. 2009-2012 should increase at the annual rate of about 20 percent, as indicated below :-
Table 13.14 11th Plan Projected Outlay [Rs. crores]
Annual Plan Projected Outlay2007-2008 984.06 (Actual)2008-2009 1400.00 - 1500.002009-2010 2000.00 -2050.002010-2011 2400.00 -2600.002011-2012 3000.00 -3100.00
Objecti ve : To achieve/overachieve allocati on of Rs. 9185.00 Crore
13. 12. Leveraging funds from other sources :- The State Government also receives substanti al funds from other sources like the Centrally Sponsored & Central Sector Schemes, funds under the Non Lapsable Central Pool of Resources (NLCPR), North Eastern Council (NEC) and also from 10 percent Gross Budgetary support of Ministries.
The table below indicates the funds leveraged from such sources during the last few years:-
Table 13.15 Leveraging funds from other sources [Rs. crore]
Year NEC NLCPR Centrally Sponsored Schemes Central Sector Schemes2004-05 19.59 21.702005-06 26.76 27.502006-07 56.41 38.58 239.12* 32.02*2007-08 75.73 60.86 405.69* 29.94*
* Direct funds to DRDAs/ SRRDA (PMGSY), RGGVY, MNREDA and other agencies are not included here as it would require some research in the matt er.
13.13. Flagship Programmes & Bharat Nirman – The State Government is giving due importance to the implementati on of the Flagship Programmes including Bharat Nirman. These programmes includes the Nati onal Rural Employment Guarantee Act (NREGA), Indira Awaas Yojana (IAY), Sarva Shiksha Abhiyan (SSA), Mid Day Meal, Nati onal Rural Health Mission (NRHM), etc. and Bharat Nirman Programmes.
The implementati on of some programmes like the IAY, PMGSY, NRHM, Total Sanitati on Programme (TSP), Minor Irrigati on, JNNURM, etc. have been below par. The implementati on of the ICDS, NREGA, Mid Day Meal, Accelerated Rural Water Supply Programme (ARWSP), RGGVY, etc. have been slightly bett er but issues of quality and bett er performance remains. Monitoring mechanism has been put in place which requires the rigour of analysis, proper monitoring and documentati on.
In most of these programmes the failure is largely of the delivery machinery which requires restructuring, reform and resurrecti on.
430

MEGHALAYA STATE DEVELOPMENT REPORTMEGHALAYA STATE DEVELOPMENT REPORTMEGHALAYA STATE DEVELOPMENT REPORT
13.14. The Vision 2020 document of the NEC has identi fi ed fi ve basic defi cits confronti ng the North Eastern Region which includes (i) a basic needs defi cit; (ii) an infrastructure defi cit; (iii) a resource defi cit; (iv) a two-way defi cit of understanding with the rest of the country; and (v) a governance defi cit. To overcome these defi cits, the document stressed on the need for a complete change in the planning process and has suggested the following strategies – (i) parti cipatory development strategy; (ii) capacity development strategy; (iii) augmentati on of infrastructure, parti cularly connecti vity and transport infrastructure including intra-region connecti vity; (iv) signifi cant increase in the Central Government’s allocati on for infrastructure in the region including effi cient use of funds; (v) transforming of governance by providing a secure, responsive and market friendly environment.
Besides the above, the issue of ‘knowledge defi cit’ which should address the aspects of informati on, technologies and experti se availability which would bring the Human development aspects, in parti cular in the service sector to enhance capabiliti es are also palpable.
These aspects beg for mission mode fi nancial, technical and administrati ve support to ameliorate and address these defi cits during the 11th Plan.
13.15. According to Dutt a, S. (2001), over the years, three main features of nati onal policy relati ng to the northeast have crystallized:
1. A higher allocati on of resources is made to the states and union territories, 2. The infrastructural development in the region has been accorded high priority with
major changes in railways, roads, power generati on, and telephone services in the next two decades or so.
3. The central government, the NEC and the respecti ve state governments are moving in the directi on of expanding industry and a network of industries connected with oil refi neries, petro chemicals, ferti lisers, cement, pulp and paper, have been planned and are being set up in the region. But such policies, evolved at three diff erent levels, should be integrated with each other and have a clear-cut focus to make any worthwhile impact on the society and politi cs in the northeast.
13.16. Various study of IFIs projects in the NER indicate following concerns (which are generic to developmental constraints as indicated/ refl ected in chapter I):
1. litt le or no parti cipati on of local people; disempowerment in the process;2. lack of accountability mechanisms, transparency and disclosure policies;3. patheti c commitment to public parti cipati on;4. impositi on of WTO rules by IFIs as framework of development; emphasis on privati zati on,
poverty reducti on and private parti cipati on;5. adverse impact on local and tribal people;6. violati on of IFIs internal policies;7. environmental and social concerns not guiding the decision making;8. compartmentalizati on of the development process;9. failure to adhere with human rights and environmental legislati ons;10. centrality of natural resources exploitati on for development;
431

MEGHALAYA STATE DEVELOPMENT REPORTMEGHALAYA STATE DEVELOPMENT REPORTMEGHALAYA STATE DEVELOPMENT REPORT
13.17. The 11th Plan document of the Planning Commission highlights the following criti cal parameters for growth of the North Eastern Region:-
• Two pronged growth strategy: creati on of criti cal infrastructure and creati on of employment opportuniti es;
• Improvement in the security, law & order and governance.• Capacity building of implementi ng machinery (Government functi onary) – Technical assistance
programmes for capacity building.• Thrust on major sectors of connecti vity (Road, Rail, Air, Inland Waterways, telecommunicati on)
and Power with major step-up in investment in these sectors;• Thrust on major social infrastructure- Health, Educati on (upgradati on of quality), and Tourism,
clearly identi fying gaps therein and Skill development.• Emphasis on Primary Sector of economy to substanti ally step up producti vity in food grains
within a period of fi ve years. Emphasis on agriculture extension services, irrigati on.• Farm based economic acti viti es – Horti culture, Animal Husbandry, Fisheries, Poultry, etc.• Post harvest management and marketi ng infrastructure.• Synergy and dovetailing of programmes/ schemes between Central Ministries and the State
Governments for fi lling up gaps in infrastructure.• Building capacity and bringing professionalism in NEC as Regional Planning Body.• Acti ve Involvement of Autonomous District Councils, Panchayati Raj and local Self Government
insti tuti ons, Communiti es and Self Help Groups in various development welfare schemes.• Making the region att racti ve desti nati on for private sector investment and PPP.• State-specifi c approach for creati on of opportuniti es for employment generati on.• Development of the region linked to look east policy of the government and development of
relati onship with the neighbouring countries of the enti re region• Development of LCS to make internati onal trade att racti ve through North East• Systemati c approach to infrastructure development (road/rail/power/IWT/Airports) in the
Region. Resources requirement for development is huge. Many of these roads or airports cannot be justi fi ed on economic viability basis. But these are vital for opening up the region and bett er integrati on.
• Maintenance of roads is an important aspect and needs a separate fi nancial arrangement.• Setti ng up of an interdisciplinary body for overseeing the planning and ti mely executi on of
communicati on projects undertaken, including inter alia the absorpti on capabiliti es and their augmentati on.
13.18. A parti cipatory approach for Winds of change, hope for renewal (through Listening, learning and implementi ng): A large survey by the Centre for North East Studies and Policy Research, Guwahati , which reached out to some 40,000 households in eight states as preparatory to NER Vision 2020 (Peoples Plan) indicates the concerns and prioriti es of people at the grass roots and refl ects desire for changes.
432

MEGHALAYA STATE DEVELOPMENT REPORTMEGHALAYA STATE DEVELOPMENT REPORTMEGHALAYA STATE DEVELOPMENT REPORT
A. The following recommendati ons are across-the-board views which are relevant for a regional approach to planning and development and are generic for the region:
1. Agriculture (including horti culture, animal husbandry etc.)• A land use policy to enable conservati on of biodiversity and adequate forest cover• Establish Agriculture Universiti es where there are none and agricultural colleges in
diff erent districts to upgrade farmers’ training, knowledge and livelihoods using best and most appropriate technologies
• Chains of cold storage networks in every block which could store vegetables, fruits and meats; these to be linked to processing and packaging units for value additi on and then connected through good roads and a network of trucks/transportati on to nearby and distant markets thus ensuring quick market access and longer shelf life for the products.
• Horti culture and fl oriculture to become major export earners• Jhum farmers, who are among the most marginal of agriculturists, to receive access to
micro-credit and improved seeds and other farm technologies which will strength incomes and broaden livelihood opti ons
• Dairying to be seen as an opti on to on-land farming: milk products to meet local needs and also for export
• Competent and relevant extension programs• Bett er veterinary faciliti es and training of educated rural youth as para-vets, to take
knowledge and skills across the countryside• Encourage fi sheries, especially in upland areas• Increased, bett er bamboo producti on and products for nati onal and internati onal
competi ti on;• Organic farming to drive agriculture: value additi on, export oriented;• Support to traditi onal medicinal plant users, giving them access to technology
Educati on• A fully literate society by 2020• All children to complete primary and elementary levels• Proper infrastructure for schools including permanent buildings, computers, libraries,
desks and chairs for students• Teacher: student rati o to be less than the recommended norm of 1:40• Separate toilets for boys and girls• Qualifi ed teachers on staff and regular retraining • Gender sensiti zati on and Health counseling (including sex educati on)• More scholarships for higher educati on outside of the state• Well-staff ed and equipped vocati onal training centres, for basic skills but also for new
livelihoods such as tourism
433

MEGHALAYA STATE DEVELOPMENT REPORTMEGHALAYA STATE DEVELOPMENT REPORTMEGHALAYA STATE DEVELOPMENT REPORT
• Privati zati on of primary schools where possible and under norms• Networks of training Centres in every state to learn languages, cultures and issues of South-
east Asia and China and also to teach languages of the region to scholars and visitors from other countries
Health• Piped drinking water to all homesteads by 2020• Management of distributi on of water and eff ecti ve control of its quality by local
communiti es. • Pit toilet and sewage pit for every household (to avoid worm infestati on etc.)• PHCs to have adequate medicine stocks (including life-saving drugs), to be staff ed regularly
and provide infrastructure support (e.g. adequate housing and communicati ons faciliti es) for medical personnel
• Ambulances at every PHC and basic lab testi ng equipment • Functi onal dispensary in every village• HIV/AIDS awareness campaign and medicines to ensure public understanding, monitoring
and treatment• Traditi onal health system to become part of overall health process, including dais and
traditi onal knowledge systems (forest based) strengthened as also herbal/indigenous systems of treatment
• Coverage of health care and especially reproducti ve health care for all • Super specializati on insti tuti ons (cardiac etc.) which would give top of the line treatment to
pati ents• Improved infrastructure faciliti es, schooling, training and health care for the physically and
mentally challenged, including access to buildings and public transportCommunicati ons
• Transformati on of the North-east into a major gateway between South Asia and South-east Asia/South-west China, in pursuit of the ‘Look East’ policy
• Upgrade and integrate existi ng networks into the Asian Highway and East-West Corridor• Good road connecti vity to all villages located off highways• Open up Inland Waterways and railway transit routes into Bangladesh, Myanmar and to
West Bengal, connecti ng to Sitwel port on the Arakan and Chitt agong as well as to Haldia • Flood-resistant technology for roads in valley regions of Brahmaputra and Barak and
skyways where possible in hill areas.• CICs/CSCS and ICT will develop the routes for the future, e.choupals etc. to transfer
informati on, technology etc. to farmers and rural communiti es on markets, products, prices and weather conditi ons
• Telephone connecti vity and functi oning post offi ce for every village• Air connecti vity to improve local travel, tourism and business: small airports for small
aircraft in as many districts as possible
434

MEGHALAYA STATE DEVELOPMENT REPORTMEGHALAYA STATE DEVELOPMENT REPORTMEGHALAYA STATE DEVELOPMENT REPORT
Development Programs• villagers and communiti es to be involved in design, review and implementati on of rural
development plans through SHGs and other representati ve groups in additi on to PRIs and district council/village councils
• Tap hydro-power potenti al in additi on to promoti on of wind and solar energy • Include Northeast in projected supply of gas from Rakhine coast (Myanmar) by ONGC and
GAIL via pipeline• Improved Bamboo technology and products to compete in internati onal market with China
and South-east Asia• Bamboo plantati ons to be major employer and livelihoods generator but these also to be
not mono-species but also species endemic to the regionGovernance
• Downsized governments• Bett er coordinati on between government departments and end to program duplicati on by
diff erent departments• PRIs and local elected insti tuti ons to be core planning and delivery mechanisms for projects
with local review committ ees to keep a watch for transparency• Also the Right to Informati on Act, 2005 will ensure transparency, bett er governance and
improved public parti cipati on • Bett er trained panchayat members (read grassroot planning and development organizati on)
to enable them to break free of control of politi cal bosses; training esp. in use of funds• Need to • NEC, M. Doner and Planning Commission to make it mandatory to involve the public,
stakeholders and benefi ciaries apprised through a public process and review of projects involving them
• Strengthening Traditi onal Insti tuti ons (TIs) in resource management and fi nance• Bett er co-ordinati on with district and block level offi cers• Recogniti on to TIs which refl ect gender representati on as well as other ethnic groups • Codifi cati on of TIs, customary laws and usages• Key to good governance is quality of delivery
PeacePeace is seen in the region as the key to change and progress. Development work must conti nue but for it to be truly eff ecti ve, there must be a sustainable and stable peace in the region, which involves ethnic groups and peoples, going beyond dialogue to negoti ated sett lements, the cessati on of bloodshed and the reducti on of suspicion as well as the growth of trust.B. The needs expressed/ as revealed specifi c to Meghalaya:(i) Tura (Garo Hills):Educati on
Bett er trained Teachers Bigger Class Rooms
435

MEGHALAYA STATE DEVELOPMENT REPORTMEGHALAYA STATE DEVELOPMENT REPORTMEGHALAYA STATE DEVELOPMENT REPORT
Fundamental science studies in schools and science streams in Colleges Knowledge of Basic Computer Operati ons
Communicati onsSub-Surfaced Roads from villages to nearest market place to be surfaced Power towers to be installed for uninterrupted power supply Extensive tapping of solar and non-conventi on energy sources
Health• life saving medicines to be available free of cost at PHCs/CHCs and dispensaries • Health Camps at regular intervals with specialized doctors• R&D to set up infrastructure for processing of medicinal plants
Agriculture, horti culture and allied acti viti esCooperati ves in place to purchase Dairy Products at the Village level Horti culture Centers at Village level Incenti ves and funds to establish village and cott age industries, e.g. Bamboo and Pulp based Industries
GovernanceStronger traditi onal forms of governance including Garo Hills Autonomous District Council Poverty alleviati on with special focus on rural poverty
(ii) Shillong (Khasi and Jainti a Hills)Educati on
• More high schools and colleges at Block level with hostel faciliti es• Curriculum to be need based and to be reviewed regularly for relevance• School management committ ees to be accountable and transparent and to be registered• Appointment of teachers to be based on merit (not politi cal, religion, gender)• Subsidy to purchase of school books to conti nue• Strengthen and promote AWCs (anganwadi centres for informal educati on) in interior
villages• Performance-based assessment of teachers for promoti on• Trained counselors in communiti es and educati onal insti tuti ons addressing substance
abuse and sex health issuesCommunicati ons
• Community parti cipati on in identi fying and preparing plans for roads, ropeways and other communicati on faciliti es with assistance of technical experts
• Conti nue installati on of community TV and radio sets in villages • Network of community radio stati ons for rural connecti vity
Health• Improved transportati on links between health centres and villages • Medical Advisory Council at District level comprising of members from Dorbar, social
organizati ons, health acti vists and professionals
436
MEGHALAYA STATE DEVELOPMENT REPORTMEGHALAYA STATE DEVELOPMENT REPORTMEGHALAYA STATE DEVELOPMENT REPORT
• Recogniti on of and strengthening of traditi onal herbal healing systems and inclusion of the same in the AYUSH system of GOI
• Rotati on of tenures for doctors in rural areas• Trained teams of rural paramedics • Regular review of health status in every district by District Medical Advisory Board • In-service training for medical staff • ANMs to be trained regularly and provided with delivery kits• Emergency services to be available at all PHC and CHCs
Agriculture etc.• Organic farming to drive agriculture: value additi on, export oriented• Horti culture and fl oriculture to become major export earners• Network of women markets as at Ima Market in Imphal (Manipur) and Iewduh in Shillong• NEC to link funding to research insti tuti ons to adapti ve research linked to peoples needs
and livelihoodsDevelopment
• Network of micro-hydel projects for cheap energy • Completi on of rural electrifi cati on • No smoke-stack industries and energy-guzzling industries which have adverse impact on
the environment• Rural land, where possible, to be made available for investment in developmental projects• Informati on about fl exibility in Land Transfer Act to be disseminated to industrial centres of
India e.g. Mumbai and Pune to att ract investment• NEC to supplement capital investment of the State to help Meghalaya complete the “last
mile” with regard to projects implementati onGovernance
• Strengthening Traditi onal Insti tuti ons (TIs) in resource management and fi nance• Bett er co-ordinati on with district and block level offi cers• Offi cial recogniti on to TIs which refl ect gender representati on and other ethnic groups • Direct funds to TIs with ADC as nodal agency (?)• Codifi cati on of TIs, customary laws and usages
13.19. Challenges, Strategies and Way Forward for Development :- The Salubrious climate with rich biodiversity and unique socio-economic and tribal culture of Meghalaya is striking. However, its geographical locati on with poor accessibility to major markets; hilly terrain, small geographical area and ubiquitous poverty; poor or absent rail, air connecti vity and inadequate road infrastructure; weak power infrastructure; limited voice, data and video network and unregulated exploitati on of natural resources sans value based acti on and value additi on are major concerns for backwardness.
437

MEGHALAYA STATE DEVELOPMENT REPORTMEGHALAYA STATE DEVELOPMENT REPORTMEGHALAYA STATE DEVELOPMENT REPORT
There is high dependency on Central government resources and at the same ti me there is limited ability or will to generate local resources. The percepti on of both local people and from outside perspecti ve is that the impact on people’s lives is not commensurate to the investments made with implicit concerns on proper uti lizati on of central assistance. There is a sense of getti ng a raw deal from the rest the country by the local communiti es, while the outside percepti on is that there is anti pathy, lethargy and cornering of benefi ts by vested interests within and without. Low levels of industrializati on along with limited att racti on to outside investors demand an innovati ve and enterprising means of achieving the goals. Lack of eff ecti ve decentralizati on begs for strategic shift in existi ng development planning and executi on.
In the light of descripti ons above and in the previous chapters, various suggesti ons in reiterati on or additi on are fl agged or detailed below:
(a) The State must focus on the ‘outcome oriented’ approach and move away from the ‘expenditure incurred’ approach which is expected to lead to improvement in the quality of implementati on of plans and programmes. The Government should support the training of the cadre of stati sti cians and offi cials of PIED for eff ecti ve monitoring and building up proper stati sti cal data base. A task force for this has been consti tuted which requires meaningful carry forward.
(b) Priority should be given to completi on of ongoing projects. Rati onalisati on of existi ng shelf of schemes parti cularly in works sector must be undertaken to ensure proper and producti ve deployment of resources.
(c) Development of basic Infrastructure parti cularly in the road and power sectors:
• Road connecti vity needs to be augmented to support development. Suggesti ons in the chapter are quite in detail and those should be resorted to.
• Innovati ve soluti ons like ropeways will need to be planned and executed to support traditi onal transportati on schemes
• Power is criti cal infrastructure for E society based programs; environment friendly power infrastructure- (gas, nuclear and hydel) will be required to be built
• Quantum of additi onal funds required for this infrastructure will need to be esti mated by experts and Enhanced state/nati onal funding is highly recommended for this sector with ti me bound acti on with multi agency involvement.
(d) Catching up with the rest of the country :–
(i) The Shukla Commission (1997) esti mated Rs. 27000 crore for immediate infrastructure development and as a measure suggested earmarking 10 % GBS by Ministries of the Government of India and the creati on of the Non Lapsable Central Pool of Resources (NLCPR)out of the failure of the diff erent Central Ministries to achieve the same for investment in infrastructure.
(ii) The Task Force for Accelerated Development of the North Eastern States of the Planning Commission headed by Shri B.N. Yugandhar, Member, Planning Commission had recommended increased investment and esti mated about Rs. 42000 crore as the required additi onal investment during the 11th Plan for the region.
(iii) In order to catch up with the per capita GDP of the country by the year 2020, the Vision NER 2020 prepared by NIPFP, New Delhi esti mated that the region needs to grow at an average of 10 percent in terms of its GSDP and 9 percent in terms of its per capita GSDP during the period from 2007 to 2020. In the case of Meghalaya, the State has to grow at 10.96 percent in terms of its GSDP and 9.72 percent in terms of per capita GSDP during 2007-2020. It has been assessed by the
438

MEGHALAYA STATE DEVELOPMENT REPORTMEGHALAYA STATE DEVELOPMENT REPORTMEGHALAYA STATE DEVELOPMENT REPORT
NIPFP, New Delhi in the Vision document for NER that to achieve the aforesaid level of growth, an investment of about Rs. 13.29 lakh crore over the next 12 years is required for the purpose from both public and private sources. With the economic slow down eff orts are requires fi scal, other policy and implementati on level to keep the economy going ahead.
(iv) While rapid growth is essenti al, it needs to be ensured that it does not lead to further deepening of the divide that exists between States. Meghalaya’s economy is projected to grow at 7.2 percent while its populati on has been increasing at a higher rate than the nati onal average. The nati onal target to double the real income of the average citi zen in ten years is achievable for Meghalaya with proper strategies towards much higher public and private sector investment in the region and the state duing the Eleventh Plan and Twelft h Plan.
(v) If the above calculati on is taken in considerati on and taking approximately 10-12 percent of share of above assessed investment for the growth as indicated at (iii) above, Meghalaya would require an investment of Rs. 1.33 lakh crore to Rs. 1.60 lakh crore by 2020. The state’s own resources are very limited. The State’s Own Resources excluding Central Assistance as per preliminary assessment of the State Finance Department is Rs. 1118.94 lakh for the Annual Plan 2008-09.Since the NER in general and hill States in parti cular have less possibility of PPP, the resources must come largely from public sources.
(vi) Presently, the State is able to achieve an annual level of investment of about Rs. 1495 to Rs. 2500 crores consisti ng of Rs. 1500 crore of State Plan, Rs. 65 crore under Non Lapsable Central Pool of Resources, Rs. 60 crore under North Eastern Council and Rs. 500 crore under Centrally Sponsored & Central Sector Schemes. At present rate of annual growth in investment from public sources will be about Rs. 25000 to Rs. 30000 crores over the next 12 years. Approximately, similar amount may be invested by private sector locally. This sti ll leaves requirement of about Rs 70000
-1.0 lakh crore.
(vii) Possible PPP if criti cal policy, land tenure and investment climate is invigorated in :Power- likelihood of Rs 20000 crore (3000 MW); Health- Rs 10000 crore ; Educati on- Rs 15000 crore; Tourism- Rs 15000 crore; IT - Rs 10000 crore; others Rs 15000 crore. Additi onal Public sources required is Rs.15000 crore. This requires to be detailed out and concerted acti on plans initi ated by respecti ve sectors.
(d) Inclusive growth & intra State disparity :-The State Government would have to aim for a more broad based and inclusive growth that addresses intra State disparity in infrastructure and human development index across districts and communiti es. Selected data are provided as appendix. Details are also available in MHDR 2008.
(e) Agriculture & Horti culture - Meghalaya is rich in the producti on of certain horti culture crops like potato, ginger, pineapples, banana, oranges and turmeric besides being a substanti al producer of cashew nut, arecanut, tea and rubber. Certain high-value low-volume non traditi onal crops such as strawberry, rose and anthurium are fast establishing themselves as revenue spinners. The State would be adopti ng a cluster approach to achieve the desired results and also focus on post harvest management like cold chains for perishables, marketi ng and fruit processing.
• Amongst other things related to improvement of farm incomes, the importance of organic farming in Meghalaya cannot be over emphasized. Because of lack of technological guidance, poor knowledge of and access to aff ordable certi fi cati on faciliti es and eff ecti ve market support, organizing organic farming also requires greater scienti fi c and technical inputs than chemical
439
MEGHALAYA STATE DEVELOPMENT REPORTMEGHALAYA STATE DEVELOPMENT REPORTMEGHALAYA STATE DEVELOPMENT REPORT
farming calling for a high level of multi disciplinary att enti on. Post harvest management and other forward linkages such as processing, value additi on and marketi ng requires to be given emphasis. The RKVY and BRGF schemes should be focusing on these issues.
• There is need for an integrated and intensive development of agriculture and allied acti viti es through a cluster approach. This will ensure the creati on of jobs and employment especially in the farm sector by increased investment in irrigati on, watershed development, wasteland development, land reclamati on, etc. Further, there is a need to increase employment in non-agricultural sector and rural non-farm sector with development of clusters around towns/ market centres. • Understanding the vulnerabiliti es of farmers a social security system for the farmer is necessary. The Co-operati ve Credit structure will have to be revived with a sense of urgency aft er the Vaidyanathan Committ ee report as applicable for the North Eastern States and other tribal areas. • SHG movement needs to be given prime place in all development strategies. Micro Finance Insti tuti ons, micro insurance and other fi nancial services needs to be expanded. A specialized and focused external support programme need to be worked upon for related aspects. (A Survey Report and Directory of SHG is now available on the website htt p://megselfh elp.gov.in)
(f) Poverty Alleviati on -. A survey conducted by the State Government in 2002 and approved by the Cabinet aft er due process fi nds that 48.09 percent of the households are BPL families (The full report is available at htt p://megcnrd.gov.in)
Much more involvement for livelihoods and poverty alleviati on programmes would be required with multi faceted approach in designing the plans, programmes, strategies, policy implementati on shift s, and insti tuti onal arrangements.
The State Government should tackle the problem of poverty in the following ways – (i) a more focused, grass root driven, crop and alti tude specifi c holisti c cluster approach to agricultural & horti cultural development with total integrati on of all required components and packages of practi ces from the primary producti on level to the points of sale is now being att empted; (ii) Helping small farmers increase producti vity through investment, subsidy and appropriate linkages and a programme to include asset distributi on and asset creati on ; (iii) Stress on non –farm acti vity that bolster traditi onal as well as non-traditi onal and private sector acti viti es, with special att enti on to micro enterprises in the rural areas; (iv) More investment and Government’s involvement for livelihoods improvement, micro-enterprise and poverty alleviati on programmes; (v) Eff ecti ve delivery mechanism and instrument in respect of poverty alleviati on programmes like SGSY, IWEP, IWDP, etc. including Nati onal Social Assistance Programme (NSAP), Nati onal Rural Employment Guarantee Scheme (NREGS) and Backward Region Grant Fund (BRGF) to ensure the benefi ts of such programmes reaches the intended benefi ciaries in ti me; (vi) Empowerment of the people with capabiliti es to ensure adequate food, clothing, shelter so that every family gains freedom from hunger and lead a healthy life and parti cipate producti vely in the growth process should be our major commitment.
440

MEGHALAYA STATE DEVELOPMENT REPORTMEGHALAYA STATE DEVELOPMENT REPORTMEGHALAYA STATE DEVELOPMENT REPORT
To address the multi faceted challenge of poverty and deprivati on, the State Government should adopt a multi pronged approach which calls for the following ‘policy and acti on cluster’ considered crucial in the context of Meghalaya:
i. Pro-poor Growth that sti mulates labour intensive works through acti ons such as NREGA and expanding it to cover all districts; launching rural works programmes and food for works programme that focuses on locati ons and sectors that have the maximum impact on poverty.
ii. More investment in human development such as nutriti on, health (including reproducti ve health), educati on, water and sanitati on etc. which foster a producti ve labour force and addressing the gaps that exists in these sectors.
iii. Investi ng in rural infrastructure such as roads, communicati ons, energy, with insti tuti onal arrangements for att ending to the criti cal inter-sectoral gaps and linkages for establishing input supply infrastructure, processing, post harvest and market centres.
iv. Employment generati on programmes: Employment and improved livelihoods programmes such as Livelihoods Improvement Programme (LIPH) or proposed NERLP of ministry of DoNER should cover poor people in all areas of my state. There is need to expand successful experiments done in the past under the North Eastern Community resources management (NERCORMP) as well as other employment generati on programs to consolidate micro credit and micro enterprise eff orts.
v. Ensuring a bett er targeti ng of programmes such as NREGA, IAY, SGSY, nutriti on programs and subsidized access to PDS, TPDS, old age, widow pension schemes, accident and maternity benefi ts and mid day meal programmes.
vi. Rural resource centre and Skill development mission: Skills, Assets and Opportuniti es for Remunerati ve Jobs/Livelihoods can ABOLISH Poverty and Hunger. There is an urgent need for ICT-SHG led programme - Rural resource centre initi ated with the help of NABARD, NEISAC, and under NEGP or BRGF. The Nati onal Alliance for Rural Knowledge Centres and the North Eastern Space Applicati ons Centre should work out a strategy for establishing Rural Knowledge Centres. Simultaneously job-led growth strategies and for a paradigm shift from unskilled to skilled work with Launching of Skill development Mission is necessary for the region.A skill development mission for the rural areas and parti cularly for the North East may be evolved and supported. The ‘Rural Business Hubs’ approach recommended by the Nati onal Commission on Farmers should be implemented to improve livelihood opportuniti es in rural areas. Micro-credit programme and Self Help Groups to be made the key instrument of poverty eradicati on and Social Empowerment programmes for the poor.
vii. Social Security programmes: There is need to understand the vulnerabiliti es of farmers and a social security system for the farmer needs to be evolved. User- friendly insurance instruments
441

MEGHALAYA STATE DEVELOPMENT REPORTMEGHALAYA STATE DEVELOPMENT REPORTMEGHALAYA STATE DEVELOPMENT REPORT
covering producti on and marketi ng for all crops as suggested in the 5th Report of the Nati onal Commission on farmers is important and should be launched. There is a need to bring all kind of insurance schemes for rural areas under one umbrella scheme, where all tribals in rural areas be covered for health, life , assets and emergencies and accidents. An expert group could work out the modaliti es of its implementati on in the NER by redesigning and scruti nizing existi ng programmes with additi onal help if required from the Government of India. A mission for this may be launched for the tribal areas of NER and others.
viii. Governance and insti tuti onal framework: Creati on of an appropriate governance and insti tuti onal framework for parti cipati on in poverty reducti on and human development eff orts has to be a signifi cant area in which building Capaciti es at various levels should be focussed. A framework for integrated planning and development by refashioning the existi ng governmental set up, traditi onal hierarchical and non-hierarchical insti tuti ons towards making them partners in governance and delivery of development should be seriously att empted and facilitated.
ix. Regional and state level Consultati ve, Convergence and Monitoring bodies: a. Council for ensuring Sustainable Food Security b. Council for Enti tlements, Convergence for eliminati on of Hunger and Poverty comprising representati ves of governments, civil society organizati ons, women’s associati ons, farmers’ associati ons, youth organizati ons, business and industry, academia and mass media. This would ensure proper targeti ng and reaching the enti tlements of the poor ti ll the door step.
x. Foster a decentralized, pro-nature, pro-poor, pro-women and pro-livelihood patt ern of enhancing human well being: Supporti ng the poor to use and improve existi ng village insti tuti ons in ways that they make decisions and choices are criti cal. Capacity building of village insti tuti ons and individuals; capacity building and outcome linked assistance to traditi onal insti tuti ons. Gradually bringing full democrati c spirit and under developmental structure and governance fold.Bringing the Village council under NREGA and block council etc. in governance fold in gradual manner And evolve eff ecti ve delivery system.
Many of the Suggesti ons above and suggesti ons such as: Improving Agriculture (accelerated progress in enhancing the producti vity, profi tability, stability, and sustainability of the major farming systems is the best safety net against hunger and poverty); Improve Rural connecti vity and infrastructure - road, energy (renewable energy) essenti al for enhancing livelihood security in uti lizing the funds provided by Govt. of India and more fund for Power; water and sanitati on, health and educati on with vocati onalisati on would fi nd popping up in generic terms everywhere when we talk of development in the region and the state.
(g) NREGA - All districts of Meghalaya are now covered under NREGA. Besides the above, the enti tlement of the poor under various programmes needs to be well directed and strictly monitored. (h) An integrated approach to livelihood development in the villages in the State is essenti al. As such, a suitable mechanism needs to be established to integrate the acti viti es of
442

MEGHALAYA STATE DEVELOPMENT REPORTMEGHALAYA STATE DEVELOPMENT REPORTMEGHALAYA STATE DEVELOPMENT REPORT
various agencies, both Central and State, concerned with the development of agriculture, animal husbandry, fi shery, sericulture and weaving, plantati on crops, forestry, medicinal herbs, etc. so that opti mum uti lisati on of available resources can be achieved through convergence and cluster approach. Karki, M.(2001 ) menti oned that in order to reduce the poverty and underdevelopment in the Northeastern States, the goal of sustainably managing NTFPs may need to be changed to give a strategically balanced focus on both livelihood improvement and biodiversity conservati on. The robust model of involvement of SHGs such as in NERCORMP and MLIPH (MRDS) projects of IFAD needs to be mainstreamed in various developmental sector programmes.
(i) Further, the norms under TPDS need to be liberalised and pulses should be added to the basket of commoditi es supplied through TPDS. The Mid-day Meal Programme should be extended to cover private schools in tribal areas and be extended up to secondary level given a very high drop-out situati on.
(j) Inspite of heavy rainfall, Meghalaya sti ll faces scarcity of water especially in dry seasons. The State had experienced a near drought situati on during 2005 and 2006 which had aff ected power generati on, agriculture, etc. Further, deforestati on has also added to the problem of water scarcity. In view of the above, the State Government decision to create a Water Harvesti ng Mission and authority with the necessary technological support to harvest the available water through ponds, check dams and other water harvesti ng structures with the direct involvement of the communiti es on a large scale is ti mely. The Mission needs to work fast to cover most of the villages in the State for drinking water, irrigati on and other purposes. The State Government should also seek the assistance from the Government of India in this endeavor, besides leveraging the Nati onal Rural Employment Guarantee Programme.
(k) Forest and Environment: In the North East, land, water and forest are the three basic producti ve resources which have been indiscriminately uti lized to meet the increasing requirement of diverse demand. Degradati on of natural resources especially land, water and forest are mutually reinforcing factor hence, it becomes necessary that the development programmes are to be designed and implemented in such a manner that can minimize the process of natural resources degradati on and also help in improving their producti on capacity. Besides, development programme should create suffi cient employment opportuniti es in the agriculture and allied sector for the rural masses, as it has not been able to generate adequate employment in rural areas. This will require state funding to help them shift to sedentary environmentally sustainable agro-forestry practi ces and strengthening existi ng forest department to enable it to provide adequate forest management support to ADC controlled forests.
Technology and entrepreneurship for quality applicati on of bamboo needs to be leveraged from the Nati onal Mission on Bamboo Applicati on (DST) and Cane & Bamboo Technology Centre, Guwahati .
Increased bioti c pressure on forests and other natural resources; Ecosystem destructi on by Jhum culti vati on; Large chunks of forests under ADC management which are under inadequate scienti fi c management support; unchecked, unscienti fi c and unsafe coal mining etc. requires an environmentally conscious mining policy keeping the sustainability and labour safety in mind.
443

MEGHALAYA STATE DEVELOPMENT REPORTMEGHALAYA STATE DEVELOPMENT REPORTMEGHALAYA STATE DEVELOPMENT REPORT
(l) The State should have a multi -sectoral strategy for conservati on and environmental restorati on in Cherrapunjee through soil and water conservati on and developmental programmes for protecti on of environment. Initi ati on of a project under Nati onal Lake Conservati on Plan (NLCP) for preventi ng polluti on of the Umiam Lake may also be considered.
(m) The State is endowed with rich natural resources with large reserves of coal, limestone, industrial clay, kaolin, feldspar, glass and uranium. During the 11th Plan, the rapid growth of the manufacturing sector is essenti al to ensure that the State far exceeds the targeted growth rate of 7.2 percent. In fact, it can go up to 12 percent. The state Industrial policy needs to be reformulated with evaluati on of past policy impact and current and future requirements.
There is considerable scope for the development of the manufacturing sector in Meghalaya, based on the State’s mineral and horti cultural resources. However, power is a crucial constraint. Large investment from Central Govt. would be required in power generati on, transmission and grid connecti vity to improve the prospects of manufacturing in Meghalaya.
(n) Trade with Bangladesh, both formal and informal, has traditi onally been an important component of the State’s economy. The State Government requires the assistance of the Government of India in the form of policy initi ati ve and infrastructure building to develop trade with Bangladesh which has been stagnati ng for many years. With the erecti on of fence on the Indo-Bangla border in Meghalaya, informal trade will dry up causing distress to people living in more than 1500 villages. The Government of India will have to help the State Government relieve the anti cipated distress in the border areas of the State. An integrated Border Area Development Plan is necessary from BAD Department as required by the Planning Commission and Government of India.
(o) Generati on of employment, parti cularly in the rural areas is one of the State’s top prioriti es. In Meghalaya, there is great potenti al for creati on of jobs in the rural areas in the fi eld of post harvest management, agro processing, industry, tourism and other services.
(p) Educati onal hub of the NE Region - One of the aims of the State is to once again make Shillong the educati onal hub of the N.E. Region. To this end, the State has taken various initi ati ves as enunciated in the Chapter VI on Infrastructure. The state has given clearances for universiti es and insti tuti ons also.
(q) Skill Development & Vocati onal training to make the people employable is also being given adequate importance during the 11th Plan. The trades selected would be based on the demand for such skills in the local markets. The other important factor in this regard is that adequate insti tuti ons should be built to provide training to the trainers of various trades, so that the trainers are equipped with the latest knowledge and the latest equipments should be provided to the vocati onal training centres. Same will apply to polytechnics also.
(r) There is a good prospect in IT and IT enabled services which can transform the State given its salubrious weather and the availability of English educated youths by appropriate strategies
444

MEGHALAYA STATE DEVELOPMENT REPORTMEGHALAYA STATE DEVELOPMENT REPORTMEGHALAYA STATE DEVELOPMENT REPORT
such as inviti ng investment in the State, establishing of I.T. Estate and implementati on of SWAN, Data Centre, Common Services Centre, etc. under NEGAP. There is land of 100 acres available in the New Shillong Township for the I.T. Estate for which suitable promoters are required.
ICT based development planning:
• The challenge of geographical isolati on can be also be largely overcome by building a strong voice, data and video infrastructure in the State.
• Introduce ICT supported social development program planning, informati on extension and management. Focus sectors- educati on, health, and agriculture group, besides, the non-farm sector.
• Appoint credible/class professional insti tuti ons to develop E-society transformati on plans, design networks, insti tuti onal changes and esti mati ng costs
• E-Society social development planning will require bringing in professional management run and managed on business lines; at the same ti me locally based resource and technology centers would be necessary requirement.
• Content creati on should be an integral part of the E-society plan
• This will require a massive re-skilling and change management of existi ng development insti tuti ons;
• Will require professional support from Indian technology sector, educati on, social sector research and management insti tuti ons ;
• Will require highest level acti ve supervision, guidance and support.
• The E-society development planning will need special additi onal government funds.
ITES based industrial development
• Meghalaya is at a major locati on disadvantage for manufacturing based industrial development ti ll the acess to the nearest port through Bangladesh is allowed to operate;
• Current incenti ve regime is not giving adequate dividends and need to be innovati vely built to generate local employment and revenue
• Voice, video and data network based business services are alternate good opti on for Meghalaya.
• Serious e-business players are facing land and space constraints in the country. If land tenure regulati on is given legal sancti on and single window hassle free clearances provided some pioneering groups could try Meghalaya as a producti on desti nati on for their services.
• Professional marketi ng agencies can help run a focused campaign to att ract entrepreneurs. However success will need to be backed by demonstrated government commitment
• A serious E society social development plan should help convince industry of genuineness of Meghalaya as a good place for business
445

MEGHALAYA STATE DEVELOPMENT REPORTMEGHALAYA STATE DEVELOPMENT REPORTMEGHALAYA STATE DEVELOPMENT REPORT
• Backend Voice, video and data infrastructure built for social development can double up for industry. No additi onal fund package for this segment recommended.
s.) Improving delivery – There is a felt need to restructure and reform Government delivery system and manpower strength in development departments for which a separate commission may be set up.
t.) Decentralised & Parti cipatory Planning and Development –
Governance confl icts between tribal self governance insti tuti ons, Autonomous District Councils and nati onal style governance insti tuti ons at the state level need resoluti on taking the grassroots and the people at the core and nucleus of governance, planning and development. The implementati on of development programs is largely through government departments which are hardly accountable to the grass root communiti es whom they are (theoreti cally) required to serve. Strong public percepti on that there has, over a period of ti me, emerged an unholy nexus of the powerful leading to usurpati on and corrupti on mainly in government programs needs urgent redressal and att enti on.
Since the 73rd Amendment of the Consti tuti on does not apply to Meghalaya, the State Government will evolving a model of development which will be a combinati on of the traditi onal tribal insti tuti ons and elected representati ves at the village level for ensuring the parti cipati on of the people at the grassroot level in planning process. This model would address the issue of poverty and the demand side of agriculture and other sectors. A concept of Village Employment Council becoming Village planning and Development Council should be worked out.
Building politi cal consensus to introduce insti tuti onalized grass root governance in a defi ned ti me frame as a framework of Decentralizing governance would be a defi nite pre-requisite of change. In doing so offi cial insti tuti ons need to be made directly accountable to grass root insti tuti ons. The opti ons could be:
1. Insti tuti onalize and legalize traditi onal Syiems / Sirdars, Rangbahshnong, Nokma and Doloi based system and strengthen these by encouraging reforms that will make them more inclusive e.g. insti tuti onalize women’s parti cipati on; documenti ng land and tenure rights,
2. Strengthen, empower, build administrati ve and development capability by assigning increased roles, responsibiliti es, making govt. departments accountable and channeling development assistance through DPDCs. This will call for re-aligning roles, responsibiliti es and mechanisms of interacti on between various elected insti tuti ons including the ADCs.
3. Insti tuti onalize and legalize the NREGA’s Village Employment Council(VEC) as village planning and development councils and have a mix of higher traditi onal authoriti es and representati ves of Villages and areas in the Block and District planning and development councils.
4. Segregate the customary functi ons and codify the same within the ambit of the ADCs; while the modern three ti er of governance, planning and development structure be kept separate with democrati cally elected representati ves at three ti er basis.
446

MEGHALAYA STATE DEVELOPMENT REPORTMEGHALAYA STATE DEVELOPMENT REPORTMEGHALAYA STATE DEVELOPMENT REPORT
Thus, the Nati onal style development planning and executi on system which may be unsuited to Meghalaya’s unique setti ngs, calls for a more decentralizing grassroots governance model. In this connecti on, a beginning has been made with the implementati on of the Nati onal Rural Employment Guarantee Act (NREGA). Similar models of decentralizati on will be used for other developmental programmes of the State. Further, the involvement of traditi onal insti tuti ons, community based organizati ons, self help groups in various developmental and welfare programmes would be ensured. The State Government will undertake capacity building programmes of stakeholders to achieve the above.
Two approaches as core:
1. One is, the acceptance, relevance and validati on of traditi onal insti tuti ons in the policy framework itself in order that it becomes possible to think in terms of traditi onal insti tuti ons as representati ve bodies, able and competent to undertake various planned developmental acti viti es. The policy goal or expectati on in this approach would be a gradual move by the traditi onal insti tuti ons themselves, over a period of ti me, towards adopti ng modern electoral systems, under pressure generated from the forces released as the benefi ts of development create public awareness and demand for public accountability, democrati zati on and parti cipati on. 2. Two, a more direct approach, insisti ng upon holding of electi ons to urban local bodies and rural analogous panchayats, and some basic reforms, as preconditi ons for release of funds for the various developmental programmes and schemes such as the JNNURM. This would have to rely on the ability to generate public awareness of the benefi ts of joining the mainstream, in the face of oppositi on from a traditi onal society that is at fi rst likely to intensify.
A mix of two approaches may be the most preferred path if only because it would have perhaps the best chance of achieving the policy goal of att aining basis reforms without posing the “all or nothing” kind of choice upon a traditi onal society.The underlying theme in each of the approaches enunciated above is that Government has to Act with far more understanding and pati ence, in the same spirit in which it is espousing the cause of local Governments and decentralized governance. Tribal and traditi onal societi es are in any case, likely to change gradually, in a natural evoluti on mode in response to the demonstrable fruits of modern social and economic systems. Att empts to impose reforms from the top may not succeed. (Excerpts from the Chief Minister’s speech).
For instance, funds under JNNURM may fl ow on the assurance given by the Government of Meghalaya that it is committ ed to holding civic electi ons but at a ti me deemed appropriate by it. This may or may not coincide with the ti me frame set by the Government of India. The expectati on in this approach would be that while the State Government would undertake all that is necessary to achieve the policy goal, it would not operate under the threat of Damocles’s sword hanging over its developmental aspirati ons. As the benefi ts of major projects begin to fl ow, the promise of even more such projects would positi vely infl uence minds and souls and steer public opinion towards modern insti tuti ons, without threatening the existence and rati onale of the traditi onal insti tuti ons.
447
MEGHALAYA STATE DEVELOPMENT REPORTMEGHALAYA STATE DEVELOPMENT REPORTMEGHALAYA STATE DEVELOPMENT REPORT
The underlying theme in each of the approaches enunciated above is common viz. the Centre has to act with far more understanding and pati ence than has been the case hitherto, in the same spirit in which it is espousing the cause of local governments and decentralized governance. Tribal and traditi onal societi es are likely to change gradually, in a natural evoluti on mode in response to the demonstrable fruits of modern social and economic systems. Any att empt to impose reforms from top is not likely to succeed.
With the onset of NREGA under which Village Employment Council (VEC); Block Employment Council has been formed and in Districts like West Garo Hills has matured with convergence, a window opportunity awaits the State to convert the VEC (as Gram Sabha) as village Planning & Development Council and work upon representati ve council at the area (Gram Sevak Circle Level) and Block Level Planning & Development Council.
The functi on of such representati on of Block at District Level Planning & Development Council be aligned with DPO & DRDA brought under its umbrella under the executi ve leadership of the Deputy Commissioner and Parti cipatory ambit of the people representati ve for development.
The history of this Hill State has received scholarly att enti on in the recent decade that it is ti me to take stock of what has been established, in order to discern aspects of Planning and development. To date, the main lines of planning have been dedicated to the origins, culture, growth, and topography, of Meghalaya, as well as to newer topics such as the gendered nature of the tribes in Meghalaya. At the incepti on of the State the new plans proposed a new perspecti ve on the study of the new State, one which began to investi gate the transformati ons of Meghalaya aft er it was established. Taking the enti re era from the mid-nineteenth century through to the late twenti eth century as a whole, it was proposed that investi gati on of these ‘transiti ons’ should be undertaken in parallel with the changes that occur in the life-cycles of the tribes that inhabit these hills.
u) Reforms in the Land tenure system: Traditi onal Tribal land tenure system structured largely as common property resources is misunderstood as confusing to outside planners and entrepreneurs resulti ng in lack of outside entrepreneur interest; but it remains an area which requires serious policy att enti on. Absence of legally accepted common property resource management framework and absence of community based projects are reasons of failures of grass root insti tuti ons impacti ng development projects needing common property land. There is an urgent need for documentati on, demarcati on of ownership and tenure rights coupled with land reforms. The issue of Land survey, sett lement based on allocati on and usage, defi ning stakes and enti tlements; defi ning the common property based land management systems that empowers communiti es and gives them combined bargaining power and Providing legal structure and clear operati ng guidelines to existi ng land tenure system with reforms to address landlessness and to bring in uniformity in structure are a desired necessity.
v) Resource mobilizati on – To realise shortf all in Plan resources, the following steps are suggested :-• The suggesti on to set up Todi Committ ee and its recommendati ons given in 2006 may be
quickly put in acti on as there is a commitment for Additi onal Resource Mobilisati on of Rs. 20.00 crores in 2008-09 and the State Plan would require substanti al improvement in resource mopping and generati on.
448

MEGHALAYA STATE DEVELOPMENT REPORTMEGHALAYA STATE DEVELOPMENT REPORTMEGHALAYA STATE DEVELOPMENT REPORT
• Emphasis on Centrally Sponsored/ Central Sector schemes/ Flagship programmes and funds from diff erent Ministries and Agencies must be given and leveraged by development departments.
• Environment and policy facilitati on for private investment safeguarding local interests and cross funding the socially important programmes are needed.
• The growth of Meghalaya’s tax revenue as a percentage of the State’s Gross State Domesti c Product (GSDP) is about 4.4%, which should be around 7-8%. Thereby possibility of collecti ng taxes much more than presently being done does exist.
In the preceding year 2008-2009, grants from the centre accounted for almost 60% of the State’s receipts. The State’s own sources of income include tax revenue (from sales tax, VAT and excise duti es) and non-tax revenue (cess and royalty on minerals such as coal, limestone etc.). The revenue expenditure of the State is very high accounti ng for almost 80% while capital expenditure accounts for only 20%. Moreover, the State has not spent much on infrastructure development and this need to be corrected. Following suggesti ons emanated from the deliberati ons in the Planning Board in January 2009:
• Increasing the producti vity of the State’s work force, and the austerity measures already being undertaken have to be reinforced by plugging the leakages of funds which occurs in various ways
• Innovati ve funding process needs to be undertaken. Setti ng up of integrated check gates could be considered to increase revenues,
• Increase VAT revenues by plugging loopholes and leakage of funds,
• Proper screening and computerizati on of operati ng systems, and integrati on of various departments,
• Raising of bonds and similar funding patt erns to fi nance projects,
• Citi zens’ contributi ons in some form could be considered to meet shortf all in revenue generati on.
The deliberati ons in the Planning Board in January, 2009, further indicated that:
• There is need to look at plan revenue expenditure vis-à-vis capital revenue expenditure. The cost of delivery is extremely on the higher end where in 2006-2007 the State was spending Rs. 2.35 to implement a plan scheme of Re. 1. Measures need to be found to reduce the cost of delivery at about 50% of the scheme. As we add more and more plan schemes we need to divert existi ng manpower and machinery from plans which have been completed to new plans.
• The revenue expenditure of the State has grown at an alarming rate of almost 100%. The two major components of revenue expenditure are salaries and interest payments. Eff orts must be made to bring down the increase in revenue expenditure. We need to take a look at our manpower and services in the fi eld as we proliferate into new areas.
449

MEGHALAYA STATE DEVELOPMENT REPORTMEGHALAYA STATE DEVELOPMENT REPORTMEGHALAYA STATE DEVELOPMENT REPORT
• The tempo of the 11th Plan may suff er and this shortf all in tax revenues may conti nue for a year or so. The State may face problems in harnessing these revenues next year when the kind of tax revenue growth experienced by the centre (which amply helps Meghalaya) may not be there. There is need to reduce revenue expenditure on the non-plan segment which is currently very high.
• Uti lizati on of plan funds in the region and in the State is abysmally low. There were also suggesti ons in the Planning Board to address this concern by setti ng up an agency/ mechanism such as a State Development Consorti um. Such an agency can overcome many of the hurdles presently faced, tap insti tuti onal funding into it and make funds available for cost eff ecti ve investment insuring that investments will give greater returns. Such an initi ati ve will enable the government to pay back the consorti um and the consorti um to service the loans. The sti pulati on is our plan eff orts will be in a bett er positi on tomorrow than they are today if implemented as above. However, given the non-accountable and non-transparent systems that furthers vested interest, this would require serious examinati on.
• We can look at insti tuti onal funding and to other means outside the Plan for meeti ng the shortf all in the two sectors.
w) Based on issues raised by the State Planning Board and Planning Commission during the Working Group discussions and the meeti ngs between the Deputy Chairman, Planning Commission and the Chief Minister while fi nalizati on of Annual Plans in recent past and Gist from the Public Hearing vision 2020 in Shillong following concerns and recommendati on has emanated in reiterati on or in additi on:
Agriculture
The problem of stagnati on in agriculture needs urgent att enti on.
• The State Government needs to come up with a clear road map for increasing producti vity and producti on. It is necessary for the State Government to work out area wise producti on and producti vity of paddy in order to fi nalise the strategy by identi fi cati on of areas where potenti al is higher.
• Att enti on on the producti on of quality seeds needs to be taken.• Focus on enhancing the producti vity of food grains• Research work to-i)develop specialized varieti es of HYV seeds and ii)develop modern farm
implements• To fi nd out the defi ciency of micro nutrients in the soil, detailed micro mapping of the soil
should be adopted. • Retenti on of traditi onal cropping system and promoti on of eco-friendly regime.• Provision for micro or fi eld level irrigati on projects.
• Vigourous implementati on of Rashtriya Krishi Vikash Yojna (RKVY)• Protecti on of indigenous crops. • Micro propagati on facility- to allocate more funds for food processing.
450

MEGHALAYA STATE DEVELOPMENT REPORTMEGHALAYA STATE DEVELOPMENT REPORTMEGHALAYA STATE DEVELOPMENT REPORT
• Sensiti ze and enlighten farmers about seed banks.• Adopt System of Rice Intensifi cati on (SRI) especially in rice producti on as these systems
require less water.• The State does not have a seed certi fi cati on agency. There is only one seed farm in the
State which is inadequate.• Wasteland and not ferti le culti vable land should be allott ed for the brick industry. • Loss of culti vable land due to coal mining should be checked.• Addressing food security issue is mandatory.• Need for a systemati c study on the loss of paddy due to climate change and unti mely
rainfall.• Irrigati on facility for winter paddy.• Bio diversity of the area should be kept in mind for long gestati on plantati ons. • stress on high-value crops which can have 2 or 3 croppings based on organic farming in a
year• The traditi onal Jhum culti vati on of the tribes should not be ignored and producti vity of
traditi onal methods of agricultural farming system be improved. • Agricultural marketi ng strategy should benefi t the farmers. • The farmers needs to be made self suffi cient in seeds, seedlings, nurturing and packaging.• Development and producti on of citrus and other horti culture crops should be supported.• Lab-to-land transfer by the ICAR has not been very successful and needs further
development.• There should be proper authority for certi fi cati on of organic products.
Horti culture• Floriculture is a promising area.• Eff orts of PPP will need to be intensifi ed, especially in horti culture.• Appropriate use of wastelands for growing horti cultural crops • Developing a robust processing, storage and marketi ng infrastructure• Extensive use of ICT supported systems • Need for additi onal funding for horti culture.• Extensive use of Informati on Communicati on Technology based systems.• Creati on of adequate market especially for horti culture. • Need for an independent audit.• Food processing and storage faciliti es should be provided.• The proposals for contract farming should be examined in the light of distributi ve income
and employment; internalizing the technology leading to maximizing the benefi ts locally. Initi al pilots in collaborati on with SHG groups in cluster/ SHG federati on etc .
• Boost culti vati on of Valencia orange.• Road networks to be made feasible for transportati on of produce.• Horti culture should be brought under Agriculture Crop Insurance. • Creati on of nursery hubs in each district to facilitate marketi ng and training of farmers.
451

MEGHALAYA STATE DEVELOPMENT REPORTMEGHALAYA STATE DEVELOPMENT REPORTMEGHALAYA STATE DEVELOPMENT REPORT
Minor irrigati on• A Minor Irrigati on Master Plan needs to be prepared with the aim of tapping the vast irrigati on potenti al in the State.• The completed MI schemes should be handed over to the WUA’s.Fisheries• Large scale Capacity Building• Bett er extension services• Bett er infrastructure for fi sh seed producti on and distributi onAnimal Husbandry • Bett er extension services• Capacity building and community/grassroots involvement• Robust animal nutriti on and health infrastructure • Eff orts of PPP will need to be intensifi ed, especially in horti culture and animal husbandry.• There is need for strengthening of veterinary aid services for training of community
veterinary workers and provision of veterinary fi rst aid kits to each worker along with a motorcycle and mobile set. The State Government may also procure a mobile veterinary dispensary van for emergency calls and att ending treatment in rural market places.
Rural Development, Poverty Alleviati on, Housing, Labour and Employment • Since only 37% of the households in the State have access to electricity, there is need to
concentrate on building micro hydro power projects to meet the requirement.• The State Government needs to identi ty viable diverse economic acti viti es taking into
considerati on the local resource base and to encourage SHGs to take up such programmes, parti cularly for uplift ment of the economic status of women.
• Poverty alleviati on strategy on creati ng self employment opportuniti es in the medicinal plant development, agriculture, animal husbandry, fi sheries and other allied acti viti es
• Rural-urban migrati on should be addressed by creati ng opportuniti es for rural people such as road linkages, health care in the rural areas, and so on.
• Diversifi cati on of agriculture into horti culture • Robust market infrastructure• Non-farm acti viti es• Livelihoods based approachHousing: • Provision of credit, interest subsidy, etc. need to form part of constructi on of new houses
or upgradati on/ reconstructi on with emphasis on EWS.LIG.Labour, Employment & Manpower: • Conduct of survey in all districts of the State to collect data on working and living conditi ons
of diff erent categories of workers as also implementati on of various labour laws and child labour. Technical guidance of Labour Bureau, Ministry of Labour & Employment may be taken.
• State should encourage the development of manufacturing and the services sector to generate higher rate of employment.
452

MEGHALAYA STATE DEVELOPMENT REPORTMEGHALAYA STATE DEVELOPMENT REPORTMEGHALAYA STATE DEVELOPMENT REPORT
• Computerisati on of all employment exchanges in the State with facility of net working and development of website to facilitate job seekers.
• Reorientati on of schemes by merging of schemes with similar objecti ves for bett er monitoring and fl exibility in expenditure, etc.
• Convergence with diff erent central programmes to tackle problems of child labour.• The vocati onal training system should be improved qualitati vely by including more region
specifi c, market driven trades in the syllabus and for multi -skilling of the candidates.Educati on and culture• Reducti on of drop out rates of children in elementary schools• Develop minimum standards of educati on att ainment and elementary schools and regular
monitoring, eff ecti veness of educati on to ensure quality.• Increase literacy rate for persons of age 7 years or more to 85%.• Lower gender gap in literacy to 10%.• Increase the percentage of each cohort going to higher educati on from the present 10% to
15% by the end of the 11th Plan.• During the 11th Plan, the State should strive to achieve 45% trained teachers at the primary
level and 36% in the middle/ higher secondary level.• It is recommended that there should be 3 teachers per subject in each college while striving
to achieve the UGC norm of 5 teachers per subject.• Promoti on of literacy in the rural areas• Teachers’ training and infrastructure development should get due emphasis in the educati on
system. • Conversion of Meghalaya into an e-society • A common schooling system as highlighted in the Nati onal Policy for Educati on needs to be
translated into acti on.• increase in opportuniti es for imparti ng professional educati on in the state to stop the
outf low of meritorious students from the region. • The educati on system should compulsorily include vocati onal training courses. • Development should not deal only with materialisti c development. Simultaneously, human
values related to peace, etc., should be discussed. Value educati on to be addressed right at the school level. The issue of development of children should be addressed.
• The need for a proper development of culture and literature of the state should be addressed.
• The linguisti c and cultural heritage of the tribes of the region may be documented. The Central Board of Languages may be invited to prepare a document highlighti ng the linguisti c and cultural heritage of people of the region.
• The total number of communiti es and their names should be menti oned. Vernaculars should also be taught.
Health & Family Welfare• Focus on Women and child health Women’s health has not been taken into considerati on
at all. MMR (the Maternal Mortality Rate) is very high amongst the tribes.
453

MEGHALAYA STATE DEVELOPMENT REPORTMEGHALAYA STATE DEVELOPMENT REPORTMEGHALAYA STATE DEVELOPMENT REPORT
• Massive and coordinated awareness programmes on sanitati on and health need to be undertaken.
• As far as health is concerned data could be collected family wise.• Greater sensiti vity to be shown to women when addressing health issues.• There is need to gather correct informati on on the MMR in the State. • Recogniti on of the traditi onal system of medicine • Physically challenged persons need to be given proper health care, support.• Potability and availability of water used in CHCs and PHCs needs to be addressed.• Increase the number of maternity beds in health insti tuti ons/ centres.• Health is to be identi fi ed as the primary concern.• The shortage of manpower especially of specialist needs to be addressed.• The State should arrange vibrant and dynamic training of ASHAs under NRHM.• The State has to prepare innovati ve and locati on specifi c Integrated District Acti on under NRHM.• There is need to address the problems of under weight children and increase of anemia among children between the age of 6 to 35 months.Water and sanitati on• There is need for formulati on of a Water Policy in the State. • GIS mapping of all water sources including catchment areas should be undertaken. • It is need to make fl ood control measures like constructi on of embankments more
comprehensive and eff ecti ve.• Ground water schemes are more cost eff ecti ve as compared to surface water schemes. The
State Government should undertake schemes for tapping of the ground water potenti al and to revive defunct schemes. However, contaminati on such as arsenic and others be checked before acti on.
• People/community based organizati on to be trained in water treatment and quality monitoring in the state, district and village level.
• Rati onal user charges to be adopted and revised for households • Capacity building in the Department for leak detecti on starti ng for Shillong and Tura. • Sewerage of Shillong city needs to be taken care of on warfooti ng and sewerage schemes
for other towns of the State should be taken up with central support. • Sustainability of water sources is a major challenge which needs to be accorded highest
priority. Social agreement with the villages for protecti on of source, catchment and polluti on control measures. Villagers should be encouraged to come forward and take over the responsibility of maintaining these schemes.
• Polluters to pay principle to be adopted parti cularly in coal mining and along highways where the orblem is acute.
• There is a need to construct rain water harvesti ng structures at both the community and individual household level. A Rain Water Harvesti ng Mission has been launched in the State with the Chief Secretary as the Chairman.
454

MEGHALAYA STATE DEVELOPMENT REPORTMEGHALAYA STATE DEVELOPMENT REPORTMEGHALAYA STATE DEVELOPMENT REPORT
• Therefore, there is a need for a proper study of the geology of the State, parti cularly Cherrapunjee.
• Pumping water supply schemes should be discouraged and gravity feed schemes should be promoted.
• Involve local community from the initi al stages of water supply scheme. In this aspect Cherrapunjee should be taken up as a challenge.
• Coverage of school buildings and anganwadis should be taken up on priority basis.• There is need to accelerate the implementati on of projects under ARWSP, Swajaldhara and
Total Sanitati on Campaign.Infrastructure• The East West Corridor and all roads programme be developed urgently and linked with
other important roads of the region.• There is a need to take up new generati ng units to meet the shortf all in demand for power
which is esti mated at about 200 MW.• There is need to reduce T&D losses.• Meghalaya has the capacity to develop micro hydel of about 4,000 to 5,000 MW of power
but only 4 to 5 MW is generated. The NE should announce an acti ve programme in this regard. Power so developed may be contributed to the Nati onal Grid and a Nati onal Highway for Power formed.
• Rural electrifi cati on needs priority. • A horti cultural link road may also be developed.Industries and Border trade• The State Government needs to take eff ecti ve steps for reducti on of losses in State PSEs
such as the MCCL, MESEB etc.• A self sustaining model for maintenance of existi ng infrastructure in the EPIP needs to be
formulated so as to reduce on dependence on Plan funds.• In view of the shortage of power, there is need to promote on setti ng up of units where
requirement of power is lesser such as agricultural processing units.• For promoti on of handlooms, there is need to focus on product design diversifi cati on,
providing credit faciliti es, enhancing weavers’ producti vity through skill upgradati on, replacement/ upgradati on of traditi onal looms, etc. The State Government may avail the benefi ts of central schemes.
• The State Government should make eff orts to dovetail with programmes of other Departments like Rural Development, Social Welfare, Backward Classes Welfare, Minority Development, etc. and also programmes like SGRY, RSVY, etc.
• Educated youth are not getti ng gainful employment. A regional training insti tute may be established by a reputed autonomous body to equip unemployed youth. A training insti tute could be set up to train unemployed youth in diff erent industrial acti viti es ti ll they establish their own enterprises. During the training period they would receive a sti pend for sustenance. This type of insti tute exists in the University of Pune and youths have benefi ted from this.
• Since the state has substanti al reserve of natural resources, relevant industries should be
455

MEGHALAYA STATE DEVELOPMENT REPORTMEGHALAYA STATE DEVELOPMENT REPORTMEGHALAYA STATE DEVELOPMENT REPORT
set up in the state itself and instead of exporti ng raw materials; fi nished products should be exported.
• The problems of manufacturing industry and small village enterprises have not been addressed.
• The region possesses tremendous potenti al to earn foreign exchange – this should be harnessed.
• Border trade should be given due importance. To give a boost to trade and commerce, the Dawki LCS should be speedily implemented and more such LCSs be set up.
• For Meghalaya, the Look East should mean Look South as well.• Meghalaya should develop SEZs to promote trade.• Communicati on through Bangladesh for North East should be emphasized. Internati onal
trade routes should be legalized and opened. The Chitt agong port should be opened for trade.
Minerals and Mineral Based Industry• Development of minerals on a scienti fi c bases with minimal impact on ecology• Emphasis on environment regulati on and scienti fi c mining• Plan for tapping the uranium reserves• Focus on greater interacti on with the private sector players • Environmental polluti on should be addressed.Research and Development• Research on developing specially suited seed varieti es of important crops• Developing the capability for processing of medicine plants• Research in animal husbandry • Development of aquaculture and fi sheries• Downstream processing and value additi on of minerals• Development of non conventi onal resources of energy• Research and development in promoti ng the use of Bamboo• Research on development of bio-diesel from Jatropha.• The research fi ndings of Several central government research organizati ons in Shillong
as relevant to the development of the state should be collated. Perhaps, a co-ordinati on committ ee of these research organisati ons should be consti tuted.
Planning• The procedure of a successful planning process should incorporate lessons from the past,
understand the present and plan the future. • An overview of all approved projects should be put on the website for public knowledge.• A Human Development Index should be developed to indicate availability of manpower in
diff erent services and categories.• Planning is important, but follow-up of approved and implemented projects is even more
so. Ideas are good but implementati on of the same has to be ensured.• Communiti es are the real custodians of natural resources, and hence should be the direct
benefi ciaries of projects. The parti cipatory role of the common people in implementati on of projects has been eff ecti vely highlighted by the NERCRMP.
• Capacity building should get adequate importance.
456
MEGHALAYA STATE DEVELOPMENT REPORTMEGHALAYA STATE DEVELOPMENT REPORTMEGHALAYA STATE DEVELOPMENT REPORT
• Planning should be done from the grassroots level. Communiti es are ill prepared to take part in the developing process, and they need some platf orm. Traditi onal vibrant insti tuti ons and acti ve organisati ons should be involved in the planning process. Traditi onal insti tutes existi ng in Meghalaya should get the status of Village Panchayats and should be involved in the developmental process. Traditi onal platf orms like local durbars in Meghalaya can perform the task. Women do not have any role in the village durbars in Meghalaya except in a few very special cases. The rights of women have to be ensured. People need dedicati on. There should be a mandatory social audit of all the projects for accountability.
• There should be a policy for women in the state. Problems of women could be solved only through imparti ng educati on. NEHU can start a department in the form of a Women’s Study Centre and the NEC could provide fi nancial support towards infrastructure development.
• The parti cipati on of females in the planning process. Gender inequality should not be promoted.
• To address the problem of poverty alleviati on, instead of popularizing family planning, planned family should be the focus. That is, only those who can aff ord may go in for expanding family size.
Tourism• To develop tourism along circuits (say, from Cherrapunji to Tawang). • Rural tourism to be stressed – the informati on and support to rural households and villages
needs to be addressed. The sensibility of a community for developing rural tourism is very important and should be encouraged and developed.
• Diff erent festi viti es of the state could be the nodal points for tourism promoti on. Capacity development in tourism industry should be focused.
• The cluster development approach may be deployed for popularising rural tourism. • For popularising tourism, the involvement of people’s insti tuti ons is extremely important. • Linkages and transport faciliti es between tourism desti nati ons are extremely poor, and
small aircraft s could help. • While addressing eco-tourism, it is important to study mechanisms to restore eco-fragile
environments to their original shape.• Heritage sites in the state are not maintained properly, and this should be focused on.
Conclusions• Introduce decentralized governance and decision making through politi cal consensus
amongst various interest groups of the State.• Shift focus of government machinery from implementati on of government schemes to
regulati on, facilitati on and governance.• Simplify administrati ve procedures and creati ng an enabling environment where industry
and private sector can fl ourish.• Increased focus and development funding on social sector and transport infrastructure.
457

MEGHALAYA STATE DEVELOPMENT REPORTMEGHALAYA STATE DEVELOPMENT REPORTMEGHALAYA STATE DEVELOPMENT REPORT
• Bridge geographical remoteness by innovati vely using IT based tools and techniques.• Transform Meghalaya society by adopti ng ICT in an extensive manner.
x) The Indian Science Congress, 2009 has recommended (from Meghalaya State Planning Board, January 2009): Establishment of a Nati onal Indigenous (or local) Knowledge Commission (NIKC) and in line a Meghalaya Indigenous (or local) Knowledge Commission (MIKC) may be established in the State. It strongly recommended restructuring, revamping and improvement of Science Educati on. In the case of Meghalaya it was suggested that:
1. Meghalaya should immediately set up a State Scienti fi c Advisory Council.2. Capacity building programmes in Science Educati on should be strengthened. 3. Strengthening the foundati on of students in the core disciplines of Mathemati cs, Science
and English comprehension is to receive priority in the Educati on Policy of the State Government.
4. Basic guidelines based on qualifi cati on and merit for recruitment of teachers, should be framed in the Educati on Policy.
5. Contract basis for recruitment of best available teachers should be implemented, especially in core disciplines where there is dearth of local man power.
6. In service training for all local teachers, to strengthen profi ciency in core disciplines menti oned above, to be rigorously implemented.
7. Science Educati on Fund can be raised from government offi cials and employees according to their grade. Money will be deducted from the source with missionary funding.
y) Applicati on of space technology/NESAC inputs specifi c to Meghalaya state (inputs from Dr. Nageshwar Rao, Director NEISAC):
• Land use patt ern: Based on coarse resoluti on satellite image interpretati on, the land use patt ern of Meghalaya was studied. The state has about 45.54% of its geographical area under forests, 11% under crop land, 2.5% under grass lands, 15% under wastelands and rest under various other land use practi ces. Further refi nement of the land use patt ern is in progress using high resoluti on satellite imagery.
• Water budget of Meghalaya: NESAC made an assessment of water resources supply and demand components of enti re Meghalaya at sub catchments level. It is found that approximately 45.7% of total rainfall i.e. 50,02,224 Ha-m water fl ows as surface run-off and 6% i.e. 650341 Ha-m water loss as evapo-transpirati on per year. Out of 5002423 ha-m run-off , 1632786 ha-m fl ows to Brahmaputra basin and 3369438 ha-m fl ows to Surma basin (Bangladesh). The study indicates that of the eight sub-catchments in the state of Meghalaya, two sub-catchments 3B1C (covering parti ally the districts of west Khasi hills and Ri-Bhoi) & 3B1A (covering parti ally the district of west Garo Hills) have defi ciency in soil moisture storage during month of November December, January, February, March and April. The sub-catchments 3B1C and 3B1A, therefore, require using the water resources judiciously. Except sub-catchment 3B1C
458

MEGHALAYA STATE DEVELOPMENT REPORTMEGHALAYA STATE DEVELOPMENT REPORTMEGHALAYA STATE DEVELOPMENT REPORT
(part of West Khasi Hills and part of Ri-Bhoi district), all other sub-catchments have high percentage of run-off (45% to 49%). As the topography is hilly, most of the area of the state have higher slope. So, the surface run-off att ains high kineti c energy during its course of fl ow. In such cases soil erosion is most expected without appropriate watershed management program.
• Prioriti zati on of Watersheds in Meghalaya: NESAC developed an integrated approach of remote sensing and GIS, based on the surface factors mainly responsible for soil erosion. These factors include soil type, vegetati on and slope. It is found that the state of Meghalaya has 35 watersheds which are further divided into 179 sub watersheds. Satellite data were used to evaluate the soil and vegetati on conditi on, while a G1S was used to evaluate the slope conditi ons. The integrated eff ect of all the parameters was evaluated to fi nd diff erent areas vulnerable to soil erosion. The GIS analysis show that 1427.31 sq.km areas are very highly and 8891.86 sq.km area highly vulnerable to soil erosion. The state has 10993 sq.km areas which is moderately vulnerable to soil erosion. Based on vulnerability to soil erosion, a priority rati ng of sub watersheds for soil conservati on planning is recommended. The study shows that 30 sub watersheds have very high priority, 29 sub watersheds have high priority for conservati on measures. The state has 77 medium priority sub watersheds. 43 number of sub watersheds deserve low or very low priority for any conservati on measure. Jainti a Hills, East Khasi Hills and West Khasi Hills districts have maximum number of sub watersheds which need very high priority. These maps could be uti lized for formulati on of proper watershed management programmes for sustainable development so that the limited fi nancial resources are prudenti ally allocated.
• Land degradati on/wastelands: The State of Meghalaya has 15.2% of its total geographical area, i.e., 3,41,141 ha of wastelands, of which 97% can be brought under vegetati ve cover with reasonable eff ort. This esti mate was based on satellite-based inventory of 2003. These lands can be converted to producti ve horti culture, sericulture, agro-horti culture and silviculture. Integrated Farming Systems evolved by ICAR Regional Complex for North East Hill Areas could be adopted in these lands. The database and maps are available with NESAC and can be supplied on request by any development agency.
• Infrastructure Planning: NESAC has carried out a pilot study for RiBhoi district of Meghalaya which covers a total geographic area of 2448 Sq.Km using. IRS PAN + LISS III merged data along with other existi ng PWD road maps, land record maps etc. Extensive fi eld survey with GPS has been carried out. Query based services like rural road connecti vity, distance and accessibility (of various ameniti es from a given place), informati on bank based on buff ering and proximity analysis, informati on like shortest route, alternate route etc. in a given area during emergency situati on have been incorporated. Such studies can be carried out for all the districts of Meghalaya and infrastructure planning can be done.
• Health Care: NESAC is implementi ng ISRO-NEC sponsored Telemedicine Project. The Telemedicine System consists of a video conferencing facility, medical soft ware and medical diagnosti c instruments connected to a very small aperture terminal (VSAT). Currently this facility is available at Civil Hospital, Shillong, and similar faciliti es will be available at each district headquarter.
459

MEGHALAYA STATE DEVELOPMENT REPORTMEGHALAYA STATE DEVELOPMENT REPORTMEGHALAYA STATE DEVELOPMENT REPORT
• Educati on: Under the EDUSAT uti lizati on programme, NESAC is facilitati ng installati on of a state of the art, studio with a hub at SCERT, Shillong and 50 satellite interacti ve terminals (SIT). The SITs are located at various higher secondary schools, high schools, teachers training insti tuti ons in the state. This network is ready for operati onal use and can be used for imparti ng quality educati on, teachers training and distance educati on. This network bridges the gap between urban and rural system of educati on.
13.20. Road-map of Development:- During his visit to Shillong on 16-03-2007 while he was the President of India, Dr APJ Abdul Kalam presented a road map of development for Meghalaya to the people of the State through the MLAs in the Legislati ve Assembly ( A full content of the address as available on the website is appended). A seven-point mission to transform the State into an economically prosperous State before 2017 was presented by Dr. Kalam. The seven priority areas are (i) agriculture, horti culture and fl oriculture, (ii) educati on and healthcare, (iii) water management, (iv) bamboo mission, (v) tourism, (vi) establishment of Providing Urban Ameniti es in Rural Areas (PURA) for rural prosperity and (vii) special economic zones. It was esti mated that:• The mission in agriculture, horti culture and fl oriculture can double the income of two lakh
families and provide employment for 42,500 youths. It will also generate export revenue of Rs 500 crore.
• The second mission to improve educati on and healthcare should aim at achieving 85 per cent literacy by 2012, 100 per cent literacy by 2017, reducti on of drop out rates before secondary school to less than 30 per cent and increase yearly enrolment in college to 32,000.
• To mission to improve health care should aim at providing quality healthcare to all the citi zens of the State for a small fee of Rs. 10 per month per individual for people living above poverty line.
• The water management mission would provide 350 kms of waterways, irrigati on for 35 lakh acres, generate 1500 megawatt s of power and provide drinking water for 60 per cent people in the State. Water harvesti ng will ensure adequate availability of water during the non-rainy seasons for all the citi zens for agriculture and drinking water.
• The bamboo mission should aim at creati on of handicraft s and cott age industries to provide jobs for 40,000 youths and generate revenue of over Rs 100 crore.
• The tourism mission should aim at increasing the fl ow of domesti c tourists from the present 3,75,000 to one million and foreign tourists from 5,000 to 50,000. This will create 2.5 lakh additi onal jobs for the youth.
• Creati on of ten Providing Urban Ameniti es in Rural Areas (PURA) clusters spread throughout the State which will bridge the rural-urban divide and increase the economic prosperity of 80 per cent of rural Meghalaya.
• The establishment of three economic zones will enable additi onal revenue of Rs. 2,500 crore and employment for 25,000 people. The three economic zones may include one at Shillong for herbal, aromati c, ginger varieti es farming, leading to producti on of drugs, aromati c and ginger products for export. Another economic zone can be located in such a way that
460

MEGHALAYA STATE DEVELOPMENT REPORTMEGHALAYA STATE DEVELOPMENT REPORTMEGHALAYA STATE DEVELOPMENT REPORT
it att racts tourists in a place surrounded by waterfalls, with an open museum of all tribal cultures, something similar to what has been done in Chhatti sgarh, orchid fl oriculture farms and also a science and technology park. The third economic zone can be centered around mining of special materials and associated products. To cater to the three Special Economic Zones suggested for Meghalaya, it was important to establish full-fl edged airports for landing of modern jet aircraft in Meghalaya.
The State Planning Board under the chairmanship of Shri P.A. Sangma, taking note of the above, reiterated the same in October 2008 and menti oned that the State Development Road Map be marked, apart from all other areas covered in these recommendati ons (refl ected earlier in para 20 and elsewhere), by the under menti oned important milestones to be achieved over the remaining years of the Eleventh Plan and the following Twelft h Plan periods :-
1. Launching a State Mission to double the overall producti vity and producti on of the agricultural, horti cultural and fl oricultural sectors, and in doing so to generate avenues for accelerated employment including self-employment of the Youth, besides causing exponenti al growth of the State’s revenue resource’s.
2. Launching a State Mission to generate and sustain a holisti c tourism environment, parti cularly eco-tourism and adventure tourism, with a view to att ract at least one million domesti c tourists and fi ft y thousand foreign tourists, per year, to the State.
3. Launching a State Mission for exponenti al improvement in the quality of educati on to ensure reducti on of secondary school drop out rates total to below nati onal levels, and to obtain total literacy of the State populati on and to improve and amplify vocati onal and professional educati on to cater to the employment-needs of emerging sectors.
4. Launching a State Mission to improve accessibility to quality healthcare services to the common man, parti cularly to the BPL families. Health services may also need to be provided through a PPP mode to supplement the State initi ati ve.
5. Launching a State Mission to upgrade Urban Ameniti es & Services in Rural Area Clusters so as to bridge the rural-urban divide and increase the prosperity of rural Meghalaya.
6. Launching a State Level Bamboo Mission to facilitate sustained producti on of raw materials for cott age level and handicraft industries, with a view to generate employment to fi ft y-thousand youth, besides resulti ng in One Hundred Crores rupees as State Revenue.
7. Launching a State Mission for Water Management in an integrated manner, for opti mum exploitati on of waterways, increased irrigati on faciliti es, generati on of hydel power and provision of potable drinking water to the populati on of the State.
8. Launching a State Mission for establishing Economic Zones specifi cally aimed at creati on of accelerated employment, including self employment and opti mum generati on of internal revenue.
461

MEGHALAYA STATE DEVELOPMENT REPORTMEGHALAYA STATE DEVELOPMENT REPORTMEGHALAYA STATE DEVELOPMENT REPORT
13.21. Policy cluster for public acti on*:Addressing the problem of equitable Development and access to opportuniti es remains a crucial issue in achieving the goals of inclusiveness of growth and Developmental Goals. The policy challenge is to facilitate access to improved livelihood opportuniti es closely associated with poverty eradicati on strategies catering to the context, needs and potenti als of local communiti es in a sustainable manner. Breaking out of poverty traps and stagnant rural development would require a multi faceted / Policy approach revolving mainly upon Nine policy clusters* as considered crucial in the context of Meghalaya:
i. Investi ng in human development such as nutriti on, health (including reproducti ve health), educati on, water and sanitati on etc. which foster a producti ve labour force;
ii. In order to break out of subsistence farming and chronic hunger Helping small farmers increase producti vity through investment, especially in rural areas and providing adequate risk miti gati ve & social security measures;
iii. Investi ng in infrastructure such as roads, communicati ons, power, etc in order to att ract new investments in non-traditi onal areas;
iv. Evolving industrial development and investment policies that bolster non-traditi onal private sector acti viti es, with special att enti on to small and medium-size enterprises. Such policies might include export processing zones, tax incenti ves and other initi ati ves to promote investment and public spending on research and development;
v. Building and Evolving development centric, accountable people’s insti tuti ons towards eff ecti ve parti cipati on and empowerment : this may involve restructuring and refashioning the Governmental set up, Traditi onal hierarchical and non hierarchical insti tuti ons, refashioned District councils and making them partners in governance and delivery of development with accountability. This should address role-ambiguity, overlaps, confusion and disputes in functi ons and aim at decentralisati on with empowerment;
vi. Building Capaciti es at various levels: This may involve organizati onal and insti tuti onal capaciti es; skills and experti se for employment, livelihoods and entrepreneurship; building capaciti es for newer economy with freedom of choice;
vii. A framework for integrated planning and development with insti tuti onal arrangements for spati al and locati on specifi c hill area perspecti ve for Meghalaya and att ending to the criti cal inter-sectoral gaps and linkages;
viii. Emphasizing human rights and social equity to promote the well-being of all secti ons of people who have the freedom and voice to infl uence decisions that aff ect their lives;
ix. Promoti ng environmental sustainability and improving urban management. There is a need to protect the biodiversity and ecosystems that support life (clean water and air, soil nutrients, forests, fi sheries, other key ecosystems) and ensure that natural resources are well managed to provide livelihoods and safe environments.
Underlying all the above recommendati ons fi ve closely interrelated general guiding principles* with some additi ons, can be followed as generic prescripti on:
____________________________
462
*Shreeranjan (2006)- Credit related Issue in Meghalaya, NEICSSR, Shillong.

MEGHALAYA STATE DEVELOPMENT REPORTMEGHALAYA STATE DEVELOPMENT REPORTMEGHALAYA STATE DEVELOPMENT REPORT
Prioriti se and reallocate public expenditures by making it pro-poor• and be more proacti ve to ensure that the resources are allocated to meet the diverse needs of the poor.Evolve closer working among • six group of insti tuti ons government [(central and state (including local/ traditi onal)], private sector, civil society, aid organisati ons and academic/ scienti fi c insti tuti ons working for the poor to work on the demand and supply sides of asset and economy buildup.Improving the legal, regulatory and enforcement environment in general; • making rule of law and governance eff ecti ve and effi cient. focus on building mechanisms and insti tuti ons at the local level • that can hold nati onal/state and local levels accountable through eff ecti ve empowerment through decentralizati on and parti cipati on.Nati onal/state level acti ons towards governance and Reforms• , including land reforms should be given priority.
13.22. Summary and Conclusion: In the collapsed era of free market, the state of Meghalaya need to address, stress and assess on the aspects which forms the basis of social, economic and human development. Social development or real development encompasses the sum total of economic growth, human development and other aspects of social life which increase the welfare and happiness of people. This would also mean realizati on of full potenti al of its resources such as human and natural leading to capital formati on.
The task of bridging the socio economic infrastructure gap in the North East in general and Meghalaya in parti cular is awesome. It is imperati ve that the following steps be taken into account to achieve this task:-
(i) Promoti onal policies in various sectors to create enabling environment for investment.
(ii) State and locati on specifi c Acti on Plan both by Central Ministries and State Government.
(iii) A road map and acti on plan frame work for PPP in select sectors such as Power, Health, Educati on, Tourism, IT, etc. is required.
(iv) Politi cal will, supplemented by proacti ve delivery set up made accountable by people and their insti tuti ons.
(v) Grass root insti tuti on building and accommodati ng traditi onal systems in governance and parti cipatory development through restructuring the VIth Schedule.
(vi) building capaciti es across sectors in government and local insti tuti ons.
(vii) A large investment by central government with mission and task force/ dedicated agencies based acti on and implementati on frame work.
463

MEGHALAYA STATE DEVELOPMENT REPORTMEGHALAYA STATE DEVELOPMENT REPORTMEGHALAYA STATE DEVELOPMENT REPORT
The above should take on board•:More proacti ve acti ons to address inequaliti es• of assets, across gender, rural urban and ethnic groups, intrastate dispariti es etc. that impede poverty reducti on and growth.Human Development with a focus on social equity and parti cularly gender Equity, Capacity & • Insti tuti on Building and Research & Development.Poverty reducti on and employment generati on along with a focus on the goal of maximum • social and economic growth by adopti ng strategies which are harmonious with ground situati on and which are sensiti ve to the social requirements. Focus upon an all inclusive, parti cipati ve and de-segregated gender approach.• Holisti c approach to development by converging eff orts of various agencies and departments • of the Government and eff orts of voluntary agencies where existi ng.Realisti c and implementable land reform programs.• Removing gender bias in legislati on and acti ons.• Improving and Operati onalisati on of rule of law and legal systems. • Accelerati ng skill acquisiti on process by the poor and unemployed youth with demand- and • supply-side interventi ons. Support for making insti tuti ons of /in the state (both local and nati onal) pro-poor and • accountable to the poor. Support for capacity building of pro-poor membership-based organizati ons; scaling up CBO; • building alliances/cooperati ve federati ons/ SHG federati ons; Promoti ng SHGs with the help of NGOs; strengthening SHG movement etcTaking risk and vulnerability of the poor for further detailed analysis for its impact on poverty, • effi ciency, and growth. Initi ati ng creati on of qualitati ve and quanti tati ve informati on base detailing local- and household-level knowledge on the nature and coping mechanism of risks in the life cycle of people parti cularly the poorer secti on. Working on multi -pronged/-dimensional programmati c approach in development and credit • interventi ons to cushion the poor/people against shocks/ diff erent risks. Recogniti on of strong cross-sectoral linkages; of cross-cutti ng impacts on empowerment, • security, and opportunity; and of the importance of holding service delivery accountable to the poor. Formulati on of Perspecti ve Block/District Plan and Annual Acti on Plan for infrastructure • development and promoti on of core acti viti es; Linkage of the Perspecti ve/Annual Plan with Programmes, schemes that facilitate creati on of infrastructure and Capacity to improve effi ciency of extension and delivery systems. Taking local realiti es that matt er and catering to the conti ngent insti tuti on building. • Strengthening and evolving decentralised village or cluster level insti tuti ons in the state for bett er parti cipati on, delivery and impact. Support for the provision of public goods from all over. Innovati on and Proacti ve acti ons • in development assistance, increasing the role of civil society and the private sector in implementati ons, and turning leadership more responsible and responsive, enhancing ownerships.
464
____________________•Party form Shreeranjan (2006) - Credit related Issue in Meghalaya, NEICSSR, Shillong.

MEGHALAYA STATE DEVELOPMENT REPORTMEGHALAYA STATE DEVELOPMENT REPORTMEGHALAYA STATE DEVELOPMENT REPORT
Intensive training of the Government Offi cials (DRDA, Block and Line Departments), • Bank Offi cials and NGOs as well as capacity building of the functi onaries of Grass root organizati ons / traditi onal organizati ons /Local Bodies and Community Based Organizati on etc are desirable; and There is a need for developing a strong net-work for eff ecti ve monitoring of the development • programmes in general and the Self-employment programmes, in parti cular. Use of and setti ng up of MIS-aided mechanisms to review and monitor implementati on of schemes. In this process, social auditi ng by the grass root organisati ons would become necessary. Periodical auditi ng of the performance under major plan programmes preferably by neutral agencies, to enable ti mely mid-course correcti on, if necessary.Proper deployment and re-deployment of manpower, cost eff ecti ve control of maintenance • expenditure, management of the State’s Plan loan portf olios and consequenti al debt service burden.Implementati on of suitable innovati ve measures for adequate Additi onal Resource • Mobilisati on through power generati on, opti mum harnessing of minerals & other natural resources, holisti c tourism programmes under PPP mode, Government and private sector and appropriate projects for Carbon Trading benefi ts.Comprehensive measures for human resource development through diversifi ed insti tuti ons • of higher, technical and professional educati on, with emphasis on the teaching of science and mathemati cs at the secondary and higher levels. Focused intensifi cati on of programmes for strengthening the agriculture sector and • improving the overall sown area and producti vity; Programmes for fullest exploitati on of the horti cultural potenti al of the State, parti cularly • High-Value Horti culture; Intensifi ed macro and micro water-shed management programmes• to ensure the sustainability of tapped as well as untapped water-sheds. These measures will include aff orestati on of barren waste lands on the southern slopes of the State which are reported to be conti nuously loosing over 22000 metric tonnes of surface soil, per square kilometer, per year; Opti mum exploitati on of Hydel and Thermal Power potenti al• , inclusive of required level of transmission and distributi on network with linkage to the Regional Grid, and their effi cient uti lizati on. In additi on, intensifi ed programmes for opti mum harnessing of renewable energy sources to be taken.; Comprehensive Tourism (Eco-Tourism, Adventure Tourism, Ancillary Tourism based • Acti viti es); Opti mum Uti lizati on of Mineral Resources, parti cularly coal and limestone, including • realisti c assessment of the mineable reserves of the State as of now; Fullest exploitati on of the potenti al of Informati on Technology in all areas of development • acti vity and delivery of public services; Intensifi ed programs for Empowerment of Women in all spheres of development acti vity; • Proacti ve measures for harnessing and channelizing youth-energy for accelerated •
465

MEGHALAYA STATE DEVELOPMENT REPORTMEGHALAYA STATE DEVELOPMENT REPORTMEGHALAYA STATE DEVELOPMENT REPORT
development, inclusive of qualitati ve and quanti tati ve promoti on of games and sports; Measures for addressing global warming and climate change concerns. • Measures to facilitate executi on of all programmes of the government in an open, • informati ve, qualitati ve, accountable, ti me-bound and transparent manner. Promoti on of the State’s potenti al for indigenous and traditi onal knowledge. • A well focused Vision with a clear Mission to enable Meghalaya to develop, progress • and compete on an even footi ng with the rest of the country, and to imbibe the spirit of competi ti on, an improved work culture (for there is no substi tute to hard work), so as to confi dently surge on the path of self-reliance. Launching of coordinated and insti tuti onalized eff orts by setti ng up missions where needed • to* – (i) double the overall producti vity and producti on of the agricultural, horti cultural and fl oricultural sectors, and in doing so to generate avenues for accelerated employment including self-employment of the Youth, besides causing exponenti al growth of the State’s revenue resources; (ii) generate and sustain a holisti c tourism environment, parti cularly eco-tourism and adventure tourism, with a view to att ract at least one million domesti c tourists and fi ft y thousand foreign tourists, per year, to the State; (iii) improve the quality of educati on to ensure reducti on of secondary school drop out rates total to below nati onal levels, and to obtain total literacy of the State populati on and to improve and amplify vocati onal and professional educati on to cater to the employment-needs of emerging sectors; (iv) improve accessibility to quality healthcare services to the common man, parti cularly to the BPL families. Health services may also need to be provided through a PPP mode to supplement the State initi ati ve; (v) upgrade Urban Ameniti es & Services in Rural Area Clusters so as to bridge the rural-urban divide and increase the prosperity of rural Meghalaya; (vi) facilitate sustained producti on of raw materials for cott age level and handicraft industries, with a view to generate employment and improve State Revenues; (vii) bring about Water Management in an integrated manner, for opti mum exploitati on of waterways, increased irrigati on faciliti es, generati on of hydel power and provision of potable drinking water to the populati on of the State; (viii) establish Economic Zones specifi cally aimed at creati on of accelerated employment, including self employment and opti mum generati on of internal revenue.
To overcome the constraints to development, the state must adopt the following strategies - (i) parti cipatory development strategy; (ii) capacity development strategy; (iii) augmentati on of infrastructure, parti cularly connecti vity and transport infrastructure including intra-State connecti vity; (iv) signifi cant and increased leveraging of the Central Government’s allocati on for infrastructure in the region including effi cient use of funds; (v) transforming of governance by providing a secure, responsive and market friendly environment; (vi) improving living conditi ons of the large concentrati on of people living in rural areas through increased agricultural producti vity
466
____________________•State Planning Board 2009 – Minutes
MEGHALAYA STATE DEVELOPMENT REPORTMEGHALAYA STATE DEVELOPMENT REPORTMEGHALAYA STATE DEVELOPMENT REPORT
and diversifi ed non-farm employment opportuniti es in the rural areas; (vii) focusing on sectors with comparati ve advantage based on value chain analysis and creati ng enabling conditi ons for investment promoti on in these sectors.
The focus should be on agro-processing industries; modernizati on and development of sericulture; investments in manufacturing units based on the resources available in the State; harnessing the large hydroelectric power generati on potenti al; developing services such as tourism; extensive use of ICT and on augmenti ng infrastructure, including rail and road. There is a need to increase employment in non-agricultural sector and rural non-farm sector with development of clusters round towns/ market centres. There is a great potenti al in Meghalaya for creati on of jobs in the rural areas in the fi elds of post harvest management, agro processing and tourism.
Learning from the experiences gained from the implementati on of the watershed based and Self Help Group (SHG) based approach on livelihoods under North Eastern Region Community Resource Management Programme and Livelihoods Improvement Programme assisted by Internati onal Fund for Agriculture Development (IFAD), the State Government should focus on integrated and convergence based programmati c implementati on in Mission mode. Eff ecti ve implementati on of these missions as per former president, Dr. Kalam, will lead to the following societal transformati on leading to: (a) increase the per-capita income of the State; (b) Improvement in the Human Development Index ranking of Meghalaya;(c) Realize the goal of total literacy before 2020 by giving highest thrust to women’s educati on, parti cularly in the tribal populati on;(d) Progressively reduce the number of people living below the poverty line.
The state must think diff erently and innovati vely towards such policy and acti on measures which remove the pain and suff erings and are seen as bold and imaginati ve measures to reach the un-reached. It must take recourse to courageous steps to combat the problems and overcome constraints in order to succeed with committ ed deeds of development so that its enti re populace can have fullest joy of fruits of development and governance. Meghalaya would realize its full potenti al, marching as a confi dent member and a shining example of this great Nati on by addressing issues fl agged and suggested and taking acti ons for removing dispariti es, enhancing outreach and improving services and delivery.
467
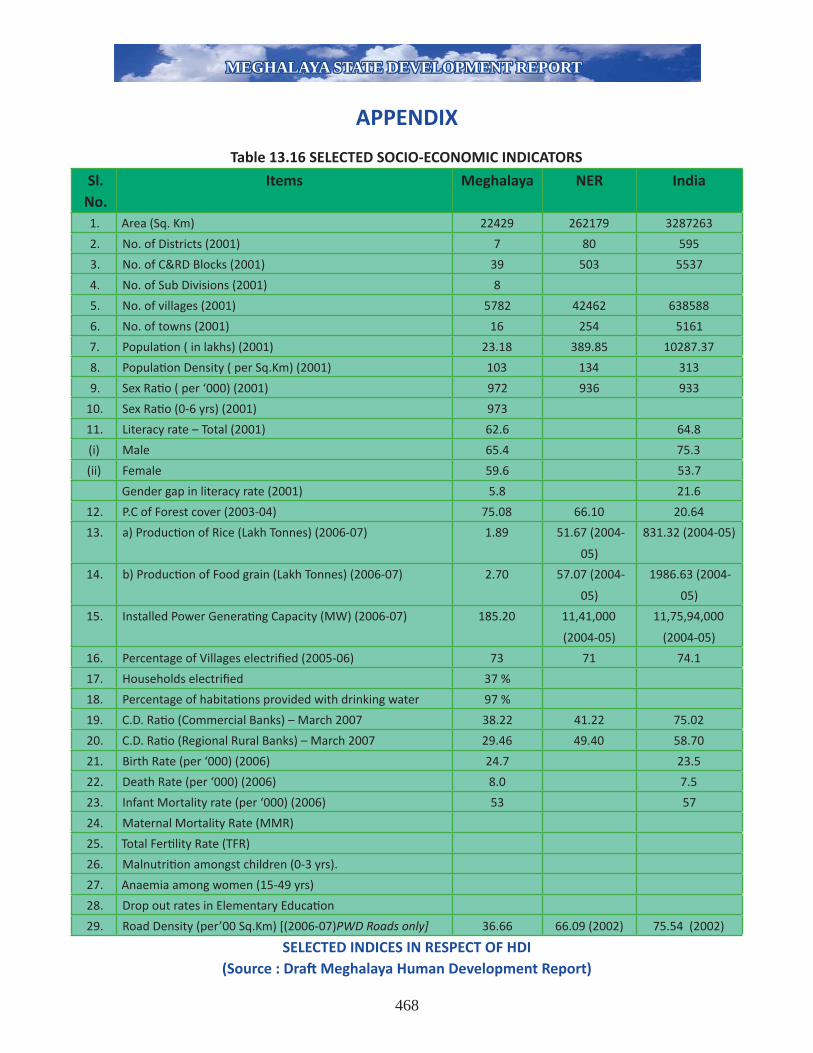
MEGHALAYA STATE DEVELOPMENT REPORTMEGHALAYA STATE DEVELOPMENT REPORTMEGHALAYA STATE DEVELOPMENT REPORT
APPENDIX
Table 13.16 SELECTED SOCIO-ECONOMIC INDICATORS
Sl. No.
Items Meghalaya NER India
1. Area (Sq. Km) 22429 262179 3287263
2. No. of Districts (2001) 7 80 595
3. No. of C&RD Blocks (2001) 39 503 5537
4. No. of Sub Divisions (2001) 8
5. No. of villages (2001) 5782 42462 638588
6. No. of towns (2001) 16 254 5161
7. Populati on ( in lakhs) (2001) 23.18 389.85 10287.37
8. Populati on Density ( per Sq.Km) (2001) 103 134 313
9. Sex Rati o ( per ‘000) (2001) 972 936 933
10. Sex Rati o (0-6 yrs) (2001) 973
11. Literacy rate – Total (2001) 62.6 64.8
(i) Male 65.4 75.3
(ii) Female 59.6 53.7
Gender gap in literacy rate (2001) 5.8 21.6
12. P.C of Forest cover (2003-04) 75.08 66.10 20.64
13. a) Producti on of Rice (Lakh Tonnes) (2006-07) 1.89 51.67 (2004-
05)
831.32 (2004-05)
14. b) Producti on of Food grain (Lakh Tonnes) (2006-07) 2.70 57.07 (2004-
05)
1986.63 (2004-
05)
15. Installed Power Generati ng Capacity (MW) (2006-07) 185.20 11,41,000
(2004-05)
11,75,94,000
(2004-05)
16. Percentage of Villages electrifi ed (2005-06) 73 71 74.1
17. Households electrifi ed 37 %
18. Percentage of habitati ons provided with drinking water 97 %
19. C.D. Rati o (Commercial Banks) – March 2007 38.22 41.22 75.02
20. C.D. Rati o (Regional Rural Banks) – March 2007 29.46 49.40 58.70
21. Birth Rate (per ‘000) (2006) 24.7 23.5
22. Death Rate (per ‘000) (2006) 8.0 7.5
23. Infant Mortality rate (per ‘000) (2006) 53 57
24. Maternal Mortality Rate (MMR)
25. Total Ferti lity Rate (TFR)
26. Malnutriti on amongst children (0-3 yrs).
27. Anaemia among women (15-49 yrs)
28. Drop out rates in Elementary Educati on
29. Road Density (per’00 Sq.Km) [(2006-07)PWD Roads only] 36.66 66.09 (2002) 75.54 (2002)
SELECTED INDICES IN RESPECT OF HDI(Source : Draft Meghalaya Human Development Report)
468

MEGHALAYA STATE DEVELOPMENT REPORTMEGHALAYA STATE DEVELOPMENT REPORTMEGHALAYA STATE DEVELOPMENT REPORT
Table 13.17: Human Development Index of Districts of Meghalaya
DistrictInfant Mortality Rate
LiteracyCombined Gross Enrolment Rati o
NSDP Per Capita at current prices (Rs.)
HDI HDI Rank
East Khasi Hills 34.51 76.98 63.10 17264 0.684 1West Garo Hills 18.13 51.03 65.99 10654 0.597 2Ri Bhoi 60.63 66.07 50.47 9798 0.499 3South Garo Hills 102.01 55.82 85.52 16847 0.498 4Jainti a Hills 77.34 53.00 43.31 15095 0.487 5West Khasi Hills 86.17 65.64 79.13 9345 0.462 6East Garo Hills 90.60 61.70 60.91 9928 0.432 7Meghalaya 52.28 63.31 62.87 13082 0.570
Table 13.18: Sectoral Growth Rate of the Economy in Diff erent Districts of Meghalaya for the Period 1993-94 to 1999-00 at Constant 1993-94 Prices
(in percent)
Industry
Jainti a
Hills
East
Khasi
Hills
West
Khasi
Hills
Ri
Bhoi
East
Garo
Hills
West
Garo
Hills
South
Garo
Hills
Meghalaya
Agriculture 7.12 5.79 6.25 12.47 10.32 7.82 9.32 7.80
Forestry & Logging 1.19 0.96 1.22 1.14 1.15 1.26 1.19 1.17
Fishing 32.95 -4.94 3.48 -1.56 3.55 3.46 3.58 3.45
Mining& Quarrying 11.32 -1.78 37.76 23.34 18.05 20.59 26.50 12.64
Primary 8.73 4.87 7.47 10.43 9.41 7.42 13.32 7.92
Manufacturing 5.04 3.80 4.75 10.03 8.24 4.01 4.69 4.42
Constructi on 10.33 13.65 12.09 8.73 10.40 10.73 10.05 11.65
Electricity, Gas & Water Supply 2.22 2.08 2.29 2.02 2.04 2.24 2.62 2.04
Secondary 7.48 7.39 10.00 4.87 6.32 7.25 8.18 7.23
Transport, Storage &
Communicati on
7.08 3.86 11.31 24.97 15.98 12.72 48.37 6.84
Trade, Hotel & Restaurant 7.83 7.83 7.83 7.87 7.81 7.83 7.84 7.83
Banking & Insurance 12.27 13.30 12.16 11.49 11.61 12.64 4.70 12.52
Real Estate, Ownership of
dwelling & Business Services
2.58 3.08 2.64 2.53 2.71 2.64 2.59 2.80
Public Administrati on 5.87 6.03 5.75 5.59 5.79 5.95 9.91 5.98
Other Services 9.09 8.78 8.28 8.40 8.42 8.73 8.39 8.71
Terti ary 6.57 6.24 6.23 7.03 6.31 6.45 6.69 6.37
NSDP of District 9.27 6.46 7.20 7.78 7.61 6.94 10.70 7.37
469

MEGHALAYA STATE DEVELOPMENT REPORTMEGHALAYA STATE DEVELOPMENT REPORTMEGHALAYA STATE DEVELOPMENT REPORT
Table 13.19: Road infrastructure in the district of Meghalaya
StateTotal length
(in Kms)1987*
Percentageof
surfaced roads
Road density Per 100 sq km
Percentage of village connected by pucca
road**
1981 1991East Khasi hills 1811 46.71 35.5 19.0 26.2West Khasi hills 728 36.26 13.9 7.61 11.90East Garo hills 557 55.30 21.4 7.62 12.71West Garo hills 1237 38.80 22.2 10.8 12.7Ri Bhoi* NA NA NA 10.5 19.3South Garo hills* NA NA NA 9.1 10.1Jainti a hills 1066 42.87 28.0 11.88 27.11Meghalaya 5399 42.50 24.1 11.1 16.4
Table 13.20: Percentage of villages electrifi ed in District of MeghalayaDistricts 1981 1991 2001East Khasi hills 20.0 60.8 74.13West Khasi hills 4.2 21.7 35.28East Garo hills 7.2 18.0 33.22West Garo hills 1.7 18.3 36.49Ri bhoi 18.7 53.00 66.11South Garo hills 0.2 9.6 19.66Jainti a hills 17.1 58.9 62.31Meghalaya 8.1 30.9 44.93
Table 13.21 Socio Economic Indicators (NER) Sl.
No.Items
ReferenceYear
Meghalaya AssamArunachal
PradeshManipur Mizoram Nagaland Tripura
1. 2. 3. 4. 5. 6. 7. 8. 9. 10. 11.
1. Area (Sq. Km) 2001 22429 78438 83743 22327 21081 16579 10486 3287240
2. No. of Districts 2004 7 23 13 9 8 8 4 593
3. No. of C&RD Blocks 2004 39 214 54 34 30 52 38 5537
4. No. of villages 2001 5782 25,124 4,065 2,391 817 1,317 858 6,34,321
5.Populati on
( in lakhs)2001 23.18 266.55 10.97 23.89 8.88 19.88 31.99 10288.31
6.Populati on
Density ( per Sq.Km)2001 103.38 339.83 13.11 97.05 42.15 236.37 305.07 324.85
7.Sex Rati o
( per ‘000)2001 972 935 893 978 935 909 948 933
470

MEGHALAYA STATE DEVELOPMENT REPORTMEGHALAYA STATE DEVELOPMENT REPORTMEGHALAYA STATE DEVELOPMENT REPORT
8. Literacy rate 2001 62.6 63.3 54.3 70.5 88.8 66.6 73.2 64.8
9.Gross enrolment rati o
(Class I-VIII) 6-14 yrs 2001-02 94.26 99.54 98.82 91.65 105.21 89.72 89.83 82.35
10. Drop-out rati o(LP)2007-08
30.5069.21 60.02 37.75 59.89 53.36 69.02 54.65
11. Drop-out rati o (UP) 9.54
12. P.C of Forest cover 200175.74(2005)
35.3382.33
(2001-05)75.81 82.98 80.49 67.38 20.55
13.
a) Producti on of Rice
(Lakh Tonnes)2002-03
2.45(2007-08)
37.381.34
(2004-05)3.78 1.09 2.25 5.43 726.53
b) Producti on of Food
grain (Lakh Tonnes)2002 -03
2.70(2006-07)
38.952.27
(2004-05)3.92 1.29 3.89 5.58 1741.88
14.Installed Power
Generati ng Capacity
(MW)
2002-03185.20
(2007-08)621.81
49.47( MU)
48.61 60.15 30.20 127.30 107877
15.Percentage of Villages
electrifi ed 2002-2003
60(2008)
(2008) 64 92 99 96 96 83.8
16.Households
electrifi edDec, 08 51 %
17.C.D. Rati o
(Commercial Banks)30.09.2008 43.17 42.80 29.08 54.98 55.89 27.06 31.40 70.89
18.C.D. Rati o (Regional
Rural Banks)30.09.2008 33.31 46.47 56.36 87.18 62.67 42.86 39.80 57.87
19 Birth Rate (per ‘000) 2004 25.1 25.0 23.3 14.7 18.8 16.4 16.0 23.0
20.Death Rate
(per ‘000)2004 7.5 8.7 5.0 4.1 5.1 3.8 5.7 7.6
21.Infant Mortality rate
(per ‘000)2004 49 68 37 13 20 18 31 58
22.Road Density
(per’00 Sq.Km)1999
36.98(2007-
08) PWD Roads only
109.36All
categories of roads
21.82All
categories of roads
51.21All
categories of roads
51.21All
categories of roads
122.67All
categories of roads
148.36All
categories of roads
76.84All
categories of roads
Nati onal Eleventh Five Year Plan: Box 13.1:
A Thirteen Point Acti on Plan suggested by the NCEUS for Employment in the Unorganised Sector: A. Protecti ve Measures for Workers
1. Ensuring Minimum Conditi ons of Work in the Non-agricultural and Agricultural Sectors;Two bills, for agricultural workers and non-agricultural workers, that specify minimum conditi ons of work, including a statutory nati onal minimum wage for all workers.
2. Minimum Level of Social Security:A universal nati onal minimum social security scheme, as a part of a comprehensive legislati on, covering life, health and disability, maternity and old age pension to protect the workers in the unorganized sectors.B. Package of Measures for the Marginal and Small Farmers;
3. Special Programme for Marginal and Small Farmer;Revival of the targeted programme focusing on small and minor farmers, with an initi al thrust in the areas wherein the existi ng yield gap is also considered high. A special agency or a coordinati ng
471

MEGHALAYA STATE DEVELOPMENT REPORTMEGHALAYA STATE DEVELOPMENT REPORTMEGHALAYA STATE DEVELOPMENT REPORT
mechanism should be set up if required.
4. Emphasis on Accelerated Land and Water Management;Immediate priority to, and signifi cant upscaling of programmes for land and water management. Revision of the priority sector landing policy to provide a quota for the micro and small enterprises.
5. Credit for Marginal-Small Farmers;RBI to monitor, separately, credit to this segment, expansion in outreach of credit insti tuti ons in rural areas and a credit guarantee fund to obviate the need for collateral by the marginal-small farmers in accessing the insti tuti onal credits. A 10% share for small and marginal farmers in the priority sector credit
6. Farmers’ Debt Relief Commission:Central government to lay guidelines and provide 75:25 assistance for setti ng up State level Farmers’ Debt Relief Commissions, in the states experiencing agrarian distress, natural or market related.C. Measures to Improve Growth of the Non-agricultural Sector
7. Improve Credit Flow to the Non-agricultural SectorPercent Sector & Sub-Sector/Purpose18 10% Small & marginal farmers & 8% Other farmers10 4% for micro enterprises with capital investment (other than land and building) upto Rs.5 lakh & 6% other micro and small Enterprises12 12% Loans upto Rs. 5 lakh to the socio-economically weaker secti ons for housing, educati on, professions etc.40 Total priority sectors lending
8. Encouraging SHGs and MFIs for Livelihood Promoti on;Measures to encourage growth of micro fi nance and SHGs in poor states and in the backward areas
9. Creati on of a Nati onal Fund (NAFUS);Rs. 5000 crore initi al corpus for an exclusive statutory agency to take care of requirements of micro and small enterprises in agriculture and non-agriculture sector that are presently not reach by SIDBI and NABARD.
10. Up scaling Cluster Development through Growth Poles;Twenty fi ve growth poles in the traditi onal industries clusters with incenti ves at par with SEZsD. Measures to Expand Employment and Improve Employability
11. Expand Employment through Strengthening Self-employment Programmes;Rati onalizati on and strengthening of the four major self employment generati on programmes with 50 lakh annual employment generati on target
12. Universalise and Strengthen NREGA;Extension of NREG Programme to all districts
13. Increasing the Employability through Skill Development;On-job-training cum employment-assurance programme to provide Rs.5000 per person incenti ve to any employer willing to provide one year on-job skill enhancement training.
472


MEGHALAYA STATE DEVELOPMENT REPORTMEGHALAYA STATE DEVELOPMENT REPORT
ADDRESS AT THE MEMBERS OF THE MEGHALAYA LEGISLATIVE ASSEMBLY
16-03-2007 : Meghalaya
Missions for Meghalaya Prosperity“Great missions born out of great minds”
I am delighted to be in this beautiful environment of Meghalaya and also to get this opportunity to address the Hon’ble Members of the Legislative Assembly of Meghalaya. I am very happy to be here in the Meghalaya Legislative Assembly which is an institution that gives vision to the state, evolves the legal frame-work for the policies and programmes of the state and gives shape to the aspirations of the people of this state, 80% of whom live in rural areas. I have visited Meghalaya fi ve times. Every time I visit, I get a feeling of happiness looking at the nature bestowed on Meghalaya. It is indeed a land of rainy clouds. Above all, I feel there is no reason for poverty to affl ict the people of Meghalaya since they are in the midst of rich bio-diversity, mineral deposits, raw material availability, plenty of water and above all people with unique tribal culture. When I was preparing the lecture for the Assembly I was always thinking what I can give to the people of Meghalaya. Last few weeks my team and myself worked and evolved a road map for transforming Meghalaya into a economically prosperous state before 2017.
Every time I meet students both from high school and university and teachers of Meghalaya and also the tribal community particularly farmers in the herbal and aromatic area, I see in their eyes an urge to transform Meghalaya into a beautiful, happy, safe and prosperous state in India. Who can make realization of this dream possible? Only you the Members of Legislative Assembly can make the dream into a reality.
The political history and economic growth of Meghalaya are seen to be rhythmic and closely interwoven with that of our nation as a whole. Legislative Assembly of Meghalaya has witnessed and wisely guided several important
473

MEGHALAYA STATE DEVELOPMENT REPORTMEGHALAYA STATE DEVELOPMENT REPORT
phases of the State’s growth since its formation in the year 1972. In the face of many challenges, various governments have placed Meghalaya on a positive-growth track. I would like to discuss with the Hon’ble Members of Meghalaya Legislative Assembly: “Missions for Meghalaya’s Prosperity”.
Our National Mission – Challenges
Our nation is going through a major challenge of uplifting of 220 million people who are below the poverty line. They need habitat, they need food, they need health care, and they need education and employment fi nally resulting in a good life. Our GDP is growing at more than 8% per annum. Whereas, the economists suggest that to uplift the people who are below poverty line, our economy has to grow at the rate of 10% per annum consistently, for over a decade.
Integrated Action for Development
Our mission of transforming India into a Developed Nation is to meet the needs of all the billion people. We have identifi ed fi ve areas where India has core competencies for integrated action:
1. Agriculture and Food processing 2. Education and Healthcare 3. Information and Communication Technology 4. Infrastructure: Reliable and Quality Electric power, Transportation system and related Infrastructure for
all parts of the country including creation of PURA clusters5. Self Reliance in Critical technologies in Strategic sectors. These fi ve areas are closely inter-related and
when effectively addressed, would lead to food, economic, energy and national security. There should be all around growth in the all the fi ve areas in the seven districts of the state to provide a balanced development both in rural and urban areas.
474

MEGHALAYA STATE DEVELOPMENT REPORTMEGHALAYA STATE DEVELOPMENT REPORT
Engines for Growth
Emphasis should be on full utilization of natural and human resources of the region to meet the demands of modern society. We should also remember that about 50 percent of our population consists of young people, with aspirations for a better life. This is also true in the case of Meghalaya. The development process has to bring hope, opportunity and happiness to these aspiring youngsters. It should expeditiously address the challenges for leap frogging through conventional and technological means. Value addition to horticulture and fl oriculture, enhancing tourism potential, cottage industries, handicrafts, wool and sericulture on the State’s core competencies and technologies, will lead to higher incomes and employment opportunities and therefore higher growth rates. The engines for growth will be the launching of the fi ve national missions viz. water, energy, education and skills, infrastructure and employment generation. Developed Meghalaya will result in a developed India. Now, I would like to discuss the core competence of Meghalaya.
475

MEGHALAYA STATE DEVELOPMENT REPORTMEGHALAYA STATE DEVELOPMENT REPORT
Core competence of Meghalaya
As you know Meghalaya is spread over a geographical area of 22,429 sq km. with a border area of 443 km with Bangladesh. Meghalaya has many rivers such as Daring, Sanda, Umkhri, Digaru in different regions. These rivers have created deep gorges and some of the most beautiful waterfalls. Most of these are rain fed and are therefore seasonal. Meghalaya has rich deposits of valuable minerals like coal, limestone, uranium and silimanite. With average annual rainfall as high as 1200 cm in some areas, Meghalaya is the wettest state of India. It is also a home for many rare species of birds, fl ora and fauna etc. Meghalaya is rich in forest and agriculture and horticulture produce.
With all these favourable factors, what can be the missions for Meghalaya? There cannot be any other mission, other than removing the poverty of the 45% people who are living below the poverty line as per the results of the survey conducted by the State Government. At this stage, let me share with you a Development Radar brought out by the Planning Commission for various states. The boundary of octagon projected in the development radar indicates the maximum achievements of various indicators of development. The smaller octagon represents the national average. While we appreciate you for reduced poverty, illiteracy, enhanced formal education and enhanced life expectancy in urban areas, the Hon’ble Members must realize that Meghalaya has got the potential to remove poverty altogether, increase the per capita expenditure, reduce the infant mortality rate, provide safe water, improve literacy and provide pucca houses with sanitation facility to each family in the rural areas.
476

MEGHALAYA STATE DEVELOPMENT REPORTMEGHALAYA STATE DEVELOPMENT REPORT
Focus Meghalaya
My presentation to the Meghalaya Legislative Assembly is based on the following principles:-
(a) Method of increasing the per-capita income of the State to Rs. 60,000 from the existing Rs. 23,381 in fi ve years.
(b) Improving the Human Development ranking of Meghalaya from the present 24 to less than fi ve.(c) Realizing the goal of total literacy before 2017 by giving highest priority to women’s education, particularly
the tribal population.(d) Progressively reducing the number of people living below the poverty line from the existing 45 percent to
near zero by 2017.(e) In Meghalaya, it is possible to increase the revenue generation of the state and earning capacity of the
citizens through creating market avenues with its neighbouring country in Bangladesh in addition to meeting the local requirement. Of course, I can see the political environment, you have to continuously improve the relations with the neighbouring countries, so that Meghalaya can benefi t in the business at the same time keeping security as a primary need in the mind.
Missions for Meghalaya
Let us study what are the missions which Meghalaya can undertake using the core competence of the state. The following are the missions for Meghalaya’s Prosperity for the period 2007 to 2017:
1. Agriculture, Horticulture and Floriculture 2. Education and healthcare3. Water Management 4. Bamboo mission5. Tourism 6. Establishment of PURA for Rural prosperity7. Special Economic Zone
Let me now discuss each missions in some detail.
477

MEGHALAYA STATE DEVELOPMENT REPORTMEGHALAYA STATE DEVELOPMENT REPORT
Mission 1: Agriculture, Horticulture and Floriculture
a. Agriculture: Meghalaya is using around 1,10,000 hectares for cultivating paddy crop. However, I fi nd that the average productivity is around 1700 kg per hectare. This is much lower than the national average. With the availability of plenty of water and good soil, we have to fi nd the problem areas which restrict the productivity of the land. The fi rst aspect we have to concentrate is on the selection of quality seeds of the rice variety which are liked by the tribal and produce hybrid and high yield variety seeds which can tolerate both fl ood and drought. Simultaneously, the Government has to assist in the creation of large number of ponds in the village so that water can be stored and also prevent fl ooding of the rice crop. This availability of stored water can be pumped at will by the use of small ground water pumps including solar powered pumps. The farmers can be trained on the improved practices for cultivating rice and also enhancing rice production through multi-cropping during the year. In this connection, I would like to discuss the Bihar model which has been successfully implemented and is being practiced by the farmers.
Food grains productivity: An experiment has been carried out by the TIFAC team in Bihar, in the RP Channel 5 and Majholi distributory and later extended to Paliganj and other 5 distributaries on the request of farmers. The productivity of paddy has increased in these villages from 2 tons per hectare to 5.8 tons per hectare. Presently, paddy crops are spread in an area greater than 3000 hectares involving 3500 farmers. This project has been carried out by the TIFAC, in collaboration with a farmer’s co-operative society, Indian Agricultural Research Institute (IARI) and the Agricultural University in Pusa, Bihar. Using scientifi c method of farming involving soil characterization, matching the right seed to soil, seeding in time, fertilizer and pesticide selection, water management, pre and post harvesting methodology, productivity has been more than doubled. Imagine the impact if all the farmers in Meghalaya apply appropriate technology in the 1.1 lakh hectares of land presently being sown. The yield will go up from the present 1.7
478

MEGHALAYA STATE DEVELOPMENT REPORTMEGHALAYA STATE DEVELOPMENT REPORT
tonnes per hectare to at least 3.4 tonnes p/h within a period of three years. Simultaneously, by using the technology, the input cost can also be brought down. The revenue of the farmer will be minimum doubled resulting in direct benefi t to one lakh farmer families holding around one acre per family. This approach will enable availability of adequate rice for the State. The surplus rice, beyond the consumption of the people of Meghalaya, could be converted as ready made variety rice dishes and packaged for long term storage and export. This type of food processing and value addition will bring additional 10,000 jobs to the youth in the food processing units and also enhance the revenue to the farmer. The same technique could also be utilized for enhancing the productivity of maize, cotton and oil seeds.
b. Horticulture
Meghalaya has the potential for cultivation of Cash crops like pineapple, potato, ginger, turmeric, banana, papaya and several off-season vegetables. Emphasis is needed in the development of water harvesting and distribution infrastructure. Also, there is a need for increasing the level of mechanization to reduce the cost of cultivation in horticultural estates wherever it is possible based on terrain conditions. Research is required for developing high-yield low gestation period crops which will be suitable for use by the food processing industry. These activities have to be taken up in a mission mode leading to setting up of fruit and vegetable processing plants aimed at the export market. This will facilitate distant marketing of horticulture produce of Meghalaya and provide lucrative revenue
479

MEGHALAYA STATE DEVELOPMENT REPORTMEGHALAYA STATE DEVELOPMENT REPORT
for the Meghalaya farmers. The target for horticultural products should be set at around Rs. 250 Crore, from the present level of Rs.125 Crores. A very good infusion of advanced agricultural research, good water management and bio-technology are important ingredients for achieving this target. The 50% of the fruits and vegetables should be available for sale within Meghalaya. The residual 50% should be converted into processed fruits and vegetables. The value addition can lead to revenue of Rs. 1000 Crore to the farmers of Meghalaya which is eight times that of the cost of the raw vegetables and fruits. Agro processing should be done through a cooperative system so that the benefi ts go to the farmers directly. Meghalaya with its core competence in this area should be able achieve this target by the year 2012 if it commits itself to a mission mode approach with total cooperation from the farmers, the R&D community educational institutions and the government. This will be a wealth generator-cum-employment provider mission for the farmers of the state. The Meghalaya Government can take advantage of the National Horticultural Mission for technical, managerial and fi nancial support for creating infrastructure and market for horticulture produce. These missions will double the revenue of over one lakh families who are presently deployed in horticulture. In addition, it will also provide additional employment in fruit and vegetable processing industries to over 10,000 youth. The State can lay emphasis on production of traditional cashew, khasi mandarin (orange), strawberry besides pineapple, turmeric, other medicinal plants and off-season vegetables.
c. Floriculture and Aromatic Plants
Meghalaya has all the potential for development of a successful orchid industry on scientifi c basis. It has varied and suitable climate and almost important commercial varieties of orchid including those of Cattleya, Scented Rose, Anthurium, Lilies etc., which can be grown for cut fl ower production. With this strength, Meghalaya should work on a mission of capturing at least $ 50 million of export business of orchids and other cut-fl owers. This is defi nitely possible due to our diversifi ed climate, low cost of labour and progressive farming technology. We have to only get suitable planting material for large scale cultivation and also acquire the technology for commercial multiplication. We should
480

MEGHALAYA STATE DEVELOPMENT REPORTMEGHALAYA STATE DEVELOPMENT REPORT
also master the post-harvest handling, storage and transportation technology for cut-fl ower production based on the experience of Thailand and Singapore who are major exporters of orchids. Singapore exports nearly 25 million dollars of orchids. Meghalaya teams in partnership with National Research Centre for Orchids (NRCO), Sikkim can defi nitely acquire the competence through a national and international connectivity and achieve the mission of exporting at least Rs.Two hundred and fi fty crore of Orchids within the next fi ve years. This mission will also provide productive employment for over 7500 youth of the State. Hon’ble Members, Govt. of Meghalaya and Central Government should ensure effective assured transportation of cut-fl owers and other perishable commodities using North East Council as Coordinating agency to achieve the above target.
A mechanism is required for making central storage and testing facilities for the farmers in the key locations so that they can export their fl oriculture and herbal produce directly to the purchaser instead of handing over to middlemen at an uneconomic price. The Meghalaya government can invite pharma industries to set up a processing plant for producing value added herbal products such as herbal soap, herbal cosmetics and neutraceuticals. The State should aim for Rupees two hundred and fi fty crore of herbal products to be produced and sold in the national and international market. This will provide value added employment to nearly fi fteen thousand people from plantation to herbal products. It will be possible by creating affordable transportation of perishable commodities from diffi cult, distant and dangerous terrains of Meghalaya through air connectivity.
Mission 2: Education and Health Carea. Education
I am happy to note that the literacy of Meghalaya at present is 62.5% which has to be increased to above 85% by 2012 and to 100% by 2017.
481`

MEGHALAYA STATE DEVELOPMENT REPORTMEGHALAYA STATE DEVELOPMENT REPORT
This can be achieved if each of the 16,000 college students and 44,000 high school students reach out during holidays to train and educate the people who cannot read and write. Then, we shall witness a unique experiment where nearly 60,000 educated population reaching out to around 5 lakhs people who today do not know how to read and write. Each student will have to provide literacy to only 3 or 4 persons during a year. This will ensure removal of illiteracy within the next three to four years. This will be complementary to the other adult literacy programmes organised by the State and Centre. The results will be excellent leading to prosperity and happiness of Meghalaya.
Skills Development: While literacy is essential for every citizen, they are insuffi cient to acquire gainful employment. Having the right and economically relevant skills, becomes critical for those who only have education up to the levels of 8th std/10th std/12th standard pass. A large percentage of our young people belong to this category. They need to be trained to get into an employment or self employment. Skills can be in construction, repair, hotel work, hospital related paramedical work or retailing or as electrician or carpenter. There are several kinds of work. Modern competitive economy demands correct and quality skills. It is our duty to empower the citizen with such skills.
Value based creative and accelerated education: Our aim is to develop human resources with value system and entrepreneurial focus, leading to arresting the tendency of school dropouts which at present at the primary level is over 62% in Meghalaya. We have to create a mechanism for the children to learn and become creative through love and affection, hygienic practices and nutrition in the pre-primary stage. It is essential to identify the average and below average students and impart accelerated learning process with the help of computer-based creative content from 1st to 10th standard. Children should learn by themselves using computers. Teachers, Parents, School Committee members
482

MEGHALAYA STATE DEVELOPMENT REPORTMEGHALAYA STATE DEVELOPMENT REPORT
become accountable for ensuring prevention of dropouts. Meghalaya can adopt the methods suggested above (M.R. Raju model and Azim Premji model) for reducing drop outs from rural schools. Apart from preventing the dropout, there is a need to qualitatively and quantitatively improve the output of education system from the primary, secondary and college education. The target should be to increase the enrolment to university education to 12,000 from the existing 6,000 by the year 2015. The entire education system has to work in a mission mode to achieve this target and provide quality education to the youth of Meghalaya through enhancement of educational institutions, laboratories, tools and also through tele-education system within the State and also in partnership with other State universities and schools.
b. Healthcare:I have found that the main problem of provision of health service is the availability of the doctor, Para-medics and the necessary infrastructure. This has been a problem area in many of our primary health centers and even in district hospitals. To overcome the above, I would recommend an out-sourcing model of medical cover in which all the citizens of the State whose income is above the poverty line will make a monthly contribution of Rs. 10 for each member of the family. The revenue arising out of this fee in a year will be around Rs. 15.6 crore (13 lakh members above poverty line). Presently, the Government is spending around Rs. 60 crore for primary health in Meghalaya. The total Rs. 75.6 Crore can be considered as a yearly health fund. This fund can be utilized to provide premium for the outsourced medical cover to all the 23 lakh citizens of Meghalaya by having a public-private partnership who will be entrusted with the task of upgrading all the primary health care facilities manning them with qualifi ed doctors, nurses and para-medics and also running mobile clinics and telemedicine system to remote areas. They will also have the responsibility of providing speciality and super-speciality healthcare to the needy in the nominated hospitals. The advantage of the system is provision of quality health care to all the citizens of the State at an affordable cost without undue pressure on State fi nances.
483

MEGHALAYA STATE DEVELOPMENT REPORTMEGHALAYA STATE DEVELOPMENT REPORT
Mission 3: Water ManagementMeghalaya State is blessed with water abundantly. It has several rain based rivers and some places in Meghalaya receives on an average 1200 cms. of rain every year. The rain pours continuously for eight months from April leaving four months almost dry in Meghalaya. It is essential to make use of this vital resource for the development of the State. The State has nearly 50% hilly terrain. The balance land is fi t for cultivation provided proper water management and drainage is planned.
Meghalaya Water ways: To make the best use of the water available in plenty and to improve the living standard of the people in Meghalaya, there is a need for creating a waterway for proper storage for the water and making it useful for Agriculture, Drinking Water, Power Generation and Navigation. This will go a long way to create employment opportunity and poverty alleviation for the people of the State. The Meghalaya Waterways may have a length of about 350km as a contour canal at 500 m above Mean Sea Level (MSL). It can irrigate 35 lakh acres, generate 1500 MW of power, provide drinking water for 60% of the population throughout the year, have a navigation route for 350 km thus increasing the connectivity and also provide employment for large number of youth of the state. The waterways will also give enough protection from fl ash fl oods and from fl ood damage. It will also attract tourists.
Water harvesting: In the interim period when the Meghalaya water ways programme is in progress, I would recommend large scale water harvesting in the State by desilting the existing ponds and creation of large number of artifi cial lakes
484

MEGHALAYA STATE DEVELOPMENT REPORTMEGHALAYA STATE DEVELOPMENT REPORT
in all the villages of the State. This will enable conservation of the fl ood water, prevent water logging of the crops and provide adequate water during non-rainy days. Since pure natural water is available in the State, this resource can be utilized for producing mineral water and supplying to different parts of the country. To enable the farmers to use the water for irrigation, the government can think in terms of providing them with solar panel based water pumps in all the villages.
Mission 4: Bamboo Mission
This mission envisages an integrated programme of expansion of plantations of Bamboo species, the scientifi c management, and promotion of community level value addition and entrepreneurship. This will enable presenting the raw material for the industries and the industry to access and apply modern technology for producing globally competitive new generation bamboo products. This includes setting up of clusters of small value addition processing units, near the resource for employment generation and benefi t to the local small entrepreneur. Processed raw material suitable for ultimate use in industry/handicraft sector will be required, for economizing handling cost of raw material to the location of industry proposed to be set up in different parts of the State. However to prevent the effects of Bamboo
485

MEGHALAYA STATE DEVELOPMENT REPORTMEGHALAYA STATE DEVELOPMENT REPORT
fl owering, Meghalaya can consider maintaining a year wise census of the Bamboo farms so that the plants which have exceeded the life of 20 years or more are uprooted and systematic re-plantation is done.
The programme should envisage the cultivation of bamboo over ten thousand hectares of forest land in addition to the existing bamboo cultivation. The economic and social benefi t from these activities, will lead to the creation of forty thousand jobs and the market opportunities worth over Rs. 100 crores with an investment of Rs. 25 crore. The value addition for the bamboo results into lifestyle articles, and handicrafts for export market. This value addition and marketing can be done in partnership with JETRO of JAPAN, North Eastern Hill University, National Institute of Design, Ahmedabad, Institutes of Management in Meghalaya entrepreneurs and Meghalaya Government. Bamboo enterprises can become part of PURA Clusters.
Mission 5 : Tourism
There are number of places of interest in Meghalaya which will be an attraction for the tourists. Meghalaya is blessed with picturesque landscape, conducive geo-ecological settings, salubrious climate, sparkling waterfalls, cascades, legendry & mythological sites, rich traditional culture and warm and hospitable people. The century old lake known as Polok lake is an important & beautiful tourist spot. Khasi and Garo tribes are popularly known for their traditional healing practices. The state has a strong base of traditional medicine, utilizing different types of locally available medicinal plants and herbs. The government and corporate hospitals should facilitate the traditional medical practioners to practice along with the other systems of medical practioners for providing an integrated healthcare to the people as well as tourists. The state offers some of the fi nest routes for trekking in both mild and diffi cult terrain. The southern
486

MEGHALAYA STATE DEVELOPMENT REPORTMEGHALAYA STATE DEVELOPMENT REPORT
slopes with high rocky cliffs have ample scope for the development and promotion of outdoor sports like climbing and abseiling. Majority of places in the rural areas of Meghalaya are associated with myths and legends. Training the local youth in the fi eld of folklore for reciting legend, myths, and folktales during important events would help in promoting tourism.
The state government should enter into a public-private partnership agreement with tourism based institutions and industries who can create the total infrastructure from hotels, roads, water system, power systems, drainage system, medical cover, banking, wayside amenities, tourism spots on a build, own, operate and transfer model. The state government must provide land, infrastructural support, hassle free permission, license to operate for a minimum period to make the proposition profi table.
This will ensure large scale employment opportunities, since each tourist generates fi ve jobs in the hotel, transportation, guiding and services sector. As per 2005, statistics Meghalaya received 3,75,000 national tourists and 5000 foreign tourists. You should aim at generating minimum 1 million national tourists and 50,000 foreign tourists by the year 2012. The required infrastructure in the form of roads, civic amenities, hotels, healthcare facilities have to be built on a mission mode. This will enable generation of over 2.5 lakh jobs for the youth in the tourism sector.
487

MEGHALAYA STATE DEVELOPMENT REPORTMEGHALAYA STATE DEVELOPMENT REPORT
Mission 6 : Establishment of Providing Urban Amenities in Rural Areas (PURA) for Rural prosperity
I have studied about Meghalaya terrain and the number of districts, towns and villages. Meghalaya and its regions require a unique Forest PURA due to the existence of varying terrain and forest conditions. I would recommend establishment of 10 PURA clusters for Meghalaya. This will provide four critical connectivities between villages located in different geographic locations enabling accelerated economic growth: physical, electronic and knowledge connectivity, leading to economic connectivity. The fund for the implementation of PURA has to come from annual budget of the State and the Bharat Nirman Programme of the Central Government. Let us study those connectivities.
Essential Connectivities: These are: physical connectivity of village clusters through quality roads and transport and waterways so that the villages will be connected by the road and water system and in turn into the high ways. Electronic connectivity through tele-communication with satellite, high bandwidth fi ber optic cables, wireless reaching the rural areas from cities and through internet kiosks. This will enable the urban facilities like super speciality hospitals, educational institutions to provide value added services to rural areas. Knowledge connectivity provides education, skills training for farmers, artisans and craftsmen and entrepreneurship programmes. These three connectives will lead to Economic connectivity so that employment potential will increase through starting of small scale industries, food processing industries coming in a big way with the help of banks, educational institutions and micro credits. The
488

MEGHALAYA STATE DEVELOPMENT REPORTMEGHALAYA STATE DEVELOPMENT REPORT
The Hon’ble Members of Meghalaya Assembly may like to see operational PURAs located in Aarang in Chhattisgarh, Periyar PURA in Tamil Nadu and Byrraju PURA in Andhra Pradesh.
Mission 7: Special Economic ZoneIn addition to the above six missions, I suggest establishment of three economic zones in Meghalaya. One at Shillong for herbal, aromatic, ginger varieties farming, leading to production of drugs, aromatic and ginger products for export. Another Economic Zone can be located in such a way that it attracts tourists in a place surrounded by water falls, with an open museum of all tribal culture something similar to what has been done in Chhatisgarh, orchid fl oriculture farms and also a science and technology park. Third economic zone can be centred around mining of special material and associated products. In view of the three Special Economic Zones suggested for Meghalaya, it is important to establish a full fl edged airport for landing of modern jet aircrafts in Meghalaya. With the growth of technology in instrument landing system it should be possible to create an all weather air port in Meghalaya. These economic zones are defi nitely possible in Meghalaya where peace is prevailing and people are tourist friendly. SEZs will attract industries of pharmacy, biotechnology and hotel industries. These economic zones will create additional revenue of RS. 2,500 crore to the State with an employment potential of over 25,000 people.
EntrepreneurshipThese 7 missions which I have discussed, will require generation of large number of entrepreneurs in the State through entrepreneurship programmes. The academic institutions in Meghalaya generate about 3000 graduates per year and the 10th class and 10+2 students will be around 10,000. All of them will seek employment either within Meghalaya, outside the state or abroad. Now the school syllabus and university syllabus have to be integrated with entrepreneurship
489

MEGHALAYA STATE DEVELOPMENT REPORTMEGHALAYA STATE DEVELOPMENT REPORT
courses. The students at the end of the course should get a certifi cate or a diploma. This will enable students qualifi ed in these schools and colleges, to have the confi dence that they can start the small enterprises in agriculture, manufacturing or services especially in the areas of agro-processing products, life style products from bamboo, managing tourism, small scale industries for handloom, handicraft products and creation of forest PURAs. Banks have to be entrepreneur friendly and should give them venture capital and support the young entrepreneurs and their creative ideas. This system will change the situation in all the states, particularly in Meghalaya by generating large number of employment providers rather than employment seekers.
Results of the missionDear Hon’ble Members, may I now summarize the seven important missions for your consideration and implementation for sustained prosperity and empowerment of Meghalaya:
1. Agriculture, Horticulture and Floriculture: Enabling doubling of the income of 2 lakh families, provide employment for 42,500 youth. It will also generate export revenue of Rs. 500 Crore.
2. Education and healthcare: Achieving 85% literacy by 2012 and 100% literacy by 2017. Reduce dropout before secondary to less than 30%. Increase yearly enrolment in college to 32,000. Realising provision of quality healthcare to all the citizens of the State for a small fee of Rs. 10 per month per individual for people living above poverty line.
3. Water management: Water management will provide 350 kms of waterways, irrigation for 35 lakh acres, generate 1500 megawatts of power and provide drinking water for 60% people. Water harvesting (Similar to Malse Lake type) will ensure adequate availability of water during the non-rainy season for all the citizens for agriculture and drinking water.
4. Bamboo mission: Create handicrafts and cottage industries jobs for 40,000 youth and generate the revenue of over Rs. 100 crore.
490

MEGHALAYA STATE DEVELOPMENT REPORTMEGHALAYA STATE DEVELOPMENT REPORT
5. Tourism: Increase the domestic tourist from 3,75,000 to one million and foreign tourist from 5,000 to 50,000. This will create 2.5 lakh additional jobs for the youth.
6. Establishment of PURA: Enable creation of ten PURA clusters spread through out the State which will bridge the rural-urban divide and increase the economic prosperity of 80% rural Meghalaya.
5.
7. Special Economic Zone: Establishment of three economic zones will enable additional revenue of Rs.2500 crores and employment for 25,000 people.
Conclusion
I would like the Meghalaya Legislative Assembly to discuss all the seven missions and lead to progressive implementation, so that Meghalaya will become an economically developed state well before 2017. Great missions have to be born out of the great minds of Meghalaya Legislative Assembly. What is important at this point is political vision and convergence of all political parties to the mission of tranforming Meghalaya into a developed state. Meghalaya needs
491

MEGHALAYA STATE DEVELOPMENT REPORTMEGHALAYA STATE DEVELOPMENT REPORT
now creative leaders. What is the defi nition of creative leaders. Creative leadership means exercising the vision to change the traditional role from the commander to the coach, manager to mentor, from director to delegator and from one who demands respect to one who facilitates self-respect. I am sure the Members of Legislative Assembly will create creative leaders including the rural areas.
I convey my best wishes to all the Hon’ble Members of Meghalaya Assembly and through them to all the people of Meghalaya success in their mission of transforming Meghalaya into an economically prosperous, happy, peaceful and safe State.
May God bless you.
492


MEGHALAYA STATE DEVELOPMENT REPORTMEGHALAYA STATE DEVELOPMENT REPORT
BIBLIOGRAPHY
Ahluwalia, M. S. (1978), “Rural Poverty and Agricultural Performance in India”, Journal of Development Studies, 14, 298-323.
Aschauer, D. A. (1990), ‘Why is infrastructure Important?’ in Alicia Munnel (ed.) Isn’t there a shortfall in Public Capital Investment?
Balakrishnan, N.P. (1981), Flora of Jowai and vicinity, Meghalaya. Vol. I-II. BSI, Howrah.
Blair, H. (2000), “Participation and Accountability at the Periphery: Democratic Local Governance in Six Countries”, World Development, 28(1), 21-39.
Burling, R. (1997). Rengsanggri, Tura Book Room, Tura.
Cantles, K. (…..), Notes on Khasi Laws, Ri Khasi Press, Shillong.
Centre for Monitoring Indian Economy (2004), Infrastructure, March.
Centre for Monitoring Indian Economy (2000), Profi le of Districts, October.
Cohen, J. and N. Uphoff (1999), Rural Development Participation: Concepts and Measures for Project Design, Implementation and Evaluation, Ithaka, Cornell University.
Das Gupta, P.K. (1984), Life and Culture of Matrilineal Tribes of Meghalaya, Inter India Publications, New Delhi.
Deolalikar, A. B. (1993), “Gender Differences in Return to Schooling and School Enrolment in Indonesia”, The Journal of Human Resources, 28, 899-932.
De Varies, E. (1960), “Finance for Development”, in Proceedings of the International Conference of Agricultural Economists, Oxford University Press, London.
Dutta, P.N. (1982), Impact of the West on the Khasis and Jaintias: Survey of Political, Economic and Social Changes, Cosmo Publications, New Delhi.
Dutt, G. (1998), “Poverty in India and Indian States: An Update”, Indian Journal of Labour Economics, 41, 191-211.
Gassah, L.S, et al. (eds). (1988), Power to People in Meghalaya. Regency Publications, New Delhi.
493

MEGHALAYA STATE DEVELOPMENT REPORTMEGHALAYA STATE DEVELOPMENT REPORT
Gassah, L.S.(1992), “Status of Women in Jaintia culture”, in Soumen Sen (ed.), Women in Meghalaya, Daya Publishing House, Delhi.
Gassah, L.S. (ed), (1997), Autonomous District Councils, Omsons Publications, New Delhi.
Gaventa, J. (1998), “The Scaling Up and Institutionalization of P.R.A: Lessons and Challenges”, in Blackburn, J and J. Holland (eds.), Who Changes? Institutionalizing Participation in Development, IT Publications, London.
Giri, H. (1998), The Khasis under British Rule (1824 – 1947), Regency Publications, New Delhi.
Giri, V.M. (1998), Emancipation and Empowerment of Women, Gyan Publishing House, New Delhi.
Government of Assam (2003), Assam Human Development Report, Planning and Development Department.
Government of India (1969), Tables with Notes on Consumption Expenditure, National Sample Survey Organisation, New Delhi.
Government of India (1983), Census of India 1981, Primary Census Abstract.
Government of India (1993), Report of the Expert Group on Estimation of Proportion and Number of Poor, Planning Commission, Perspective Planning Division, July.
Government of India (1994), Census of India 1991, Primary Census Abstract.
Government of India (1997), “Estimates of Poverty”, Press Information Bureau, March 11.
Government of India (2001), National Policy for the Empowerment of Women, Department of Women & Child Development, Ministry of HRD, New Delhi.
Government of India (2001a), Employment and Unemployment Situation in India 1999-2000, National Sample Survey Organisation, Ministry of Statistics and Programme Implementation.
Government of India (2002), National Human Development Report of India, 2001, Planning Commission, New Delhi.
Government of India (2003), Census of India 2001, Primary Census Abstract.
Government of India (2003a), National Accounts Statistics, Central Statistical Organisation, Ministry of Statistics and Programme Implementation.
494
MEGHALAYA STATE DEVELOPMENT REPORTMEGHALAYA STATE DEVELOPMENT REPORT
Government of India, Economic Survey, Ministry of Finance, New Delhi, various issues.
Government of India, Five Year Plan Documents, Planning Commission, various issues.
Government of India, Basic Statistics of North Eastern Region, North Eastern Council, Ministry of Home Affairs, Shillong , various issues.
Government of India, Basic Road Statistics in India, Ministry of Transport and Communication, various issues.
Government of India, District Census Handbook (1981, 1991), Census of India.
Government of India, Census of India, 2001, [Online], http://www.censusindia.gov.in.
Government of India, Planning Commission (2006), Task Force on Connectivity and Promotion of Trade & Investment in NER.
Government of Meghalaya (2003), Meghalaya District Net Domestic Product 1993-94 to 1999-00, Directorate of Economics and Statistics, Shillong.
Government of Meghalaya (2003a), Target & Achievement of Immunization and family Welfare Programme for the year 2002 –03, Annex – I, Directorate of Health Services, Shillong.
Government of Meghalaya (2003b), Socio-Economic Review, Directorate of Economics & Statistics, Shillong.
Government of Meghalaya (2004), Selected Educational Statistics of Meghalaya, 2003 – 04 Directorate of Elementary & Mass Education, Shillong.
Government of Meghalaya (2005), Status of ICDS Projects as on March, 2005, Social Welfare Department, Shillong.
Government of Meghalaya (2006), Statistical Abstract of Meghalaya, Directorate of Economics and Statistics, Shillong.
Government of Meghalaya (2008), State Development Report Discussion paper, Labour Department, Shillong.
Government of Meghalaya, Pocket Statistical Handbook, Meghalaya, Directorate of Economics & Statistics, Shillong, various issues.
Government of Meghalaya, Annual Plan – Draft Proposals, Planning Department, Shillong, various issues.
495

MEGHALAYA STATE DEVELOPMENT REPORTMEGHALAYA STATE DEVELOPMENT REPORT
Government of Meghalaya, Statistical Handbook of Meghalaya, Directorate of Economics and Statistics, Shillong, various issues.
Government of Meghalaya, District level Statistics, Directorate of Economics and Statistics, Shillong, various issues.
Government of Meghalaya (…), State Action Plan on National Policy for Empowerment of Women, Department of Social Welfare in Collaboration with Women’s Core Advocacy Group.
Government of Meghalaya, Civil Services Day – a Report, (2007)
Government of Meghalaya (2005), Directorate of Economic & Statistics, Fifth Economic Census
Government of West Bengal (2004), West Bengal Human Development Report, Development and Planning Department.
Gurdon, P.R.T. (1907), The Khasis, Cosmo Publications, New Delhi.
Haridasan, K. and Rao, R.R. (1985-87), Forest Flora of Meghalaya, Vols. I-II. Bishen Singh Mahendra Pal Singh, Dehra Dun, India.
Hashim, S. R. (1999), “Employment and Poverty: Some Emerging Policy Issues”, Indian Journal of Labour Economics, 42, 21-30.
Hirschman, A.O. (1958), The Strategy of Economic Development, Yale University Press, New Haven, Connecticut.
Indira Gandhi Institute of Development Research (2002), India Development Report 2002, Oxford University Press, New Delhi.
Institute of Applied Manpower Research (2006), Benchmarking Human Development in North Eastern Region of India: Employment and Unemployment Situation in Meghalaya.
International Institute of Population Studies, National Family Health Surveys, Mumbai.
International Labour Organisation (1999), Key Indicators of the Labour Market, Geneva.
Ishikawa, M. and D. Rayn (2002), “Schooling, basic skills and economic outcomes”, Economics of Education Review, 21, 231-243.
Ishikawa, S. (1967), Economic Development in Asian Perspective, Kinokuniya Bookstore Co., Tokyo.
496

MEGHALAYA STATE DEVELOPMENT REPORTMEGHALAYA STATE DEVELOPMENT REPORT
Jain, L.R. and S.D. Tendulkar (1995), “Economic Reforms and Poverty”, Economic and Political Weekly, 10th June, 1373-1377.
Jamir, S.A. and H.N. Pandey (2003), “Vascular plant diversity in sacred groves of Jaintia Hills in North-East India”, Biodiversity and Conservation, 12, 1497-1510.
Jamir, A. and A.K. Nongkynrih (2002), Report of the Study on Land Ownership and Management in Khasi-Jaintia and Garo Hills of Meghalaya, International Fund for Agricultural Development, Rome.
Khan, M.L., S. Menon, and K.S. Bawa, (1997), “Effectiveness of protected area network in biodiversity conservation – A case study of Meghalaya state”, Biodiversity and Conservation, 6, 853-868.
Khonglah, C. (1998), “Women in the Khasi Society Traditions and Change”, a paper presented at the Seminar on The Position and Power of Women in Urban and Rural Matriliny Society of Meghalaya organized by the Tribal Research Institute, Directorate of Arts and Culture, Government of Meghalaya.
Khonglah, C. (2004), Working Women in Meghalaya with Special reference to Shillong – A Project Report, Indian Council of Social Science Research, New Delhi.
Kumar, Y. and Rao, R.R. (1985). Studies on Balpakram Wildlife Sanctuary in Meghalaya.
Laskar, N.K. (2001), Provisional population total papers I & II of 2001, Census of India 2001, Series 18, Meghalaya.
Leonetti, D.L., D.C. Nath, N.S. Hemam and D.B. Neil (2005), “Kinship Organisation and the Impact of Grandmothers on Reproductive Success among the Matrilineal Khasi and Patrilineal Bengali of Northeast India”, in Voland, E., A. Chatiosis and W. Schiefenhoevel (eds.), Grandmotherhood: The Evolutionary Signifi cance of the second Half of Female Life, Rutgers University Press, New Brunswick, 194-214.
Lyngdoh, C. (1938), “The Rudiments of the Khasi Laws of Inheritance” in Ka Syngkhong Jingtip (The Khasi Cultural journal), 2 (1), April.
Lyngdoh, M.P.R. (1994), The Festivals in the History and Culture of the Khasi, Anand Publications, New Delhi.
Lyngdoh, M.P.R. (1998), “Women in Meghalaya and the Constitution 73rd Amendment Act, 1992: Problem and Expectations”, in Karna, M. N. (ed.), Power to the People of Meghalaya, Regency Publications, New Delhi.
Mehta, A. C. (2003), Elementary Education in India, National Institute of Educational Planning and Administration, New Delhi.
497

MEGHALAYA STATE DEVELOPMENT REPORTMEGHALAYA STATE DEVELOPMENT REPORT
Nongkynrih, A. K. (2000), Human Development in Khatar Shnong, F.Nongkynrih, Shillong.
Nongkynrih, A. K. (2002), A Sociological Understanding of Khasi Society, Indus Publishing Company, New Delhi.
Nongkynrih, A. K. (2005), “Advocating women’s Empowerment in the Hindu-Kush Himalaya: A Sociological Perspective”, keynote address presented in Regional Workshop on case study sharing in Advocacy strategies for community Based Organisations in the Hindu-Kush Himalayas, organised by the International Centre for Integrated Mountain Development, Kathmandu, Nepal, 18- 22 April.
North Eastern Development Finance Corporation Ltd. (2004), NEDFi Databank Quarterly, Guwahati.
North Eastern Region Community Resource Management Project for Upland Areas (2004), Status Report, Shillong
Parikh, K. S. (1999), India Development Report 1999-2000, Oxford University Press, New Delhi.
Passah, P. (1998), “Changes in the Matrilineal System of the Khasi – Jaintia Family”, in Chacko, P.M. (ed.), “Matriliny in Meghalaya: Tradition and change”, Regency Publication, New Delhi.
Paul, S. (1987), “Community Participation in Development Projects”, World Bank Discussion Paper 6, The World Bank, Washington DC.
Playfair, M. A. (1975), The Garos, United Publishers, Guwahati.
Pradhan, B. K., P. K. Roy and A. Subramaniam (1999), “Micro Impact of Adjustment Policy: Survey Evidence from Poor Households in India”, NCAER, New Delhi, (Mimeo.).
R. Gopalakrishanan, Meghalaya Land and People.
Rao, V.K.R.V. (1980), “Infrastructure and Economic Development”, Commerce, Annual Number.
Ritwick Dutta Community Managed Forest: Law Problems and Alternatives.
Brandis, D.(1897). Indigenous Indian Forestry.
Rodgers, W.A., (1994). The Sacred Groves of Meghalaya.
Saxena, N. C. (2002), Rural Poverty in Meghalaya: Its Nature, Dimensions and Possible Options. Planning Commission of India, New Delhi.
498

MEGHALAYA STATE DEVELOPMENT REPORTMEGHALAYA STATE DEVELOPMENT REPORT
Shreeranjan (2001), Perspectives on Development in Meghalaya, State Institute of Rural Development, Shillong.
Shreeranjan (2005), Dimension in Development: Topical Discussions, NEICSSR, Shillong.
Shreeranjan (2006), Credit Related Issues in Meghalaya, North-East India Council for Social Sciences Research, Shillong.
Shreeranjan (2008), Planning Organisation and Machinery in Meghalaya. http://www.megplanning.gov.in/planning_machinaries.pdf
Shreeranjan, A.P. Jyrwa (2008), Survey and Assessment of Self Help Groups (SHGs) in Meghalaya (under print)
S.K. Barik, K. Haridasan, Dona M. Sangma, N.J. Lakadong and V. Manners (2007) Developing medicinal plant sector of Meghalaya: An action plan. Meghalaya State Medicinal Plant Board, Shillong and National Medicinal Plant Board, New Delhi.
Sreeradha Datta April 2001 (Vol. XXV No. 1) Strategic Analysis: What Ails The Northeast: An Enquiry Into The Economic Factors By A Monthly Journal of the IDSA
Thorat S. and S. Sirohi (2004), State of the Indian Farmer, Academic Foundation, New Delhi.
Tiwari, B.K., S.K. Barik and R.S. Tripathi (1998), “Biodiversity Value, Status and Strategies for the Conservation of Sacred Groves of Meghalaya, India”, Ecosystem Health.
Tiwari, B.K., S.K. Barik and R.S. Tripathi (1999), “Sacred Forest of Meghalaya”.
United Nations Development Programme, Human Development Report, Oxford University Press, New York, various issues.
United Nations Development Programme (2003), Gender Mainstreaming, Oxford University Press, New York.
Upadhaya, K., H.N. Pandey, P.S. Law and R. S. Tripathi (2003), “Tree diversity in sacred groves of the Jaintia Hills in Meghalaya, Northeast India”, Biodiversity and Conservation, 12, 583-597.
World Bank, World Development Report, Oxford University Press, various issues.
World Bank (2004), Attaining the Millennium Development Goals in India: Role of Public Policy & Service Delivery, The World Bank, Washington DC.
Other Sources:
499

MEGHALAYA STATE DEVELOPMENT REPORTMEGHALAYA STATE DEVELOPMENT REPORT
Think Tank Presentations of Power / PWD / Health Departments, Government of Meghalaya.
Speeches of Chief Ministers at the National Development Councils / North Eastern Councils / Planning Commission Meetings during 2006, 2007 & 2008.
Deliberations of the Meghalaya State Planning Board Meetings, 2008
Planning Department’s State Plan Documents 2005-06 / 2006-07 / 2007-08 / 2008-09 and 2009-2010
CAG’s Report, Meghalaya, 2001-02 / 2002-03 / 2003-04 /2004-05 / 2006-07.
Planning Commission: 10th and 11th Plan Documents; Approach to 11th Plan; Task Force on Trade & Investment.
NER Vision 2020 Document
NIRD: Finalised Poverty Report submitted to the M/O DoNER.
500