MEETING OF THE TRUST BOARD
271
TB April 15 (Public) 1 MEETING OF THE TRUST BOARD 30 April 2015, 13.00 – 17.00hrs H2.5 Board Room, 2 nd Floor, Hunter Wing In accordance with the Public Bodies (Admission to Meetings) 1960 Act, the Board resolves to consider other matters in private after this meeting, as publicity would be prejudicial to the public interest by reason of the confidential nature of the business. Christopher Smallwood, Chair Presented by 1. Chair’s opening remarks 13.00 2. Apologies for absence and introductions Peter Kopelman, Judith Hulf 3. Declarations of interest For Members to declare if they have any interests as individuals or members of other organisations that might relate to Trust business or items on the agenda. C Smallwood 4. Minutes of the previous Meeting To receive and approve the minutes of the meeting held March 2015 TB (M) 5. Schedule of Matters Arising To review the outstanding items from previous minutes TB (MA) April 15 6. Chief Executive’s Report To receive a report from the Chief Executive, updating on key developments M Scott TB April 15-01 7. Quality and Performance 13.30 7.1 Quality and Performance Report To receive assurance regarding actions being taken to improve the quality of care for patients and to review the Trust’s operational performance report for Month 12 J Hall/S Bolam TB April 15-02a,b To receive a verbal report from the Quality & Risk Committee seminar held on 25 April 2015 Sarah Wilton 7.2 Finance Report To receive a verbal report from the Finance & Performance Committee meetings held on 14 th and 25 th April S Bolam TB April 15-03 7.3 7.4 Workforce Performance Report To receive a verbal report from the workforce committee meeting April 15 Quarter 4 Submission to Monitor for approval W Brewer TB April 15-04a,b,c,d S Pantelides S Bolam TB April 15-05 BREAK 15.00 8. Strategy 15.10 8.1 Monitoring Corporate Objectives – Q4 2014/15 update To receive the progress report R Elek TB April 15-06a,b
-
Upload
khangminh22 -
Category
Documents
-
view
0 -
download
0
Transcript of MEETING OF THE TRUST BOARD
TB April 15 (Public)
1
MEETING OF THE TRUST BOARD
30 April 2015, 13.00 – 17.00hrs H2.5 Board Room, 2nd Floor, Hunter Wing
In accordance with the Public Bodies (Admission to Meetings) 1960 Act, the Board resolves to consider other matters in private after this meeting, as publicity would be prejudicial to the public interest by reason of the confidential nature of the business. Christopher Smallwood, Chair
Presented by 1. Chair’s opening remarks 13.00
2. Apologies for absence and introductions
Peter Kopelman, Judith Hulf
3. Declarations of interest For Members to declare if they have any interests as individuals or members of other organisations that might relate to Trust business or items on the agenda.
C Smallwood
4. Minutes of the previous Meeting
To receive and approve the minutes of the meeting held March 2015
TB (M)
5. Schedule of Matters Arising
To review the outstanding items from previous minutes
TB (MA) April 15
6. Chief Executive’s Report
To receive a report from the Chief Executive, updating on key developments M Scott TB April 15-01
7. Quality and Performance 13.30
7.1 Quality and Performance Report
To receive assurance regarding actions being taken to improve the quality of care for patients and to review the Trust’s operational performance report for Month 12
J Hall/S Bolam TB April 15-02a,b
To receive a verbal report from the Quality & Risk Committee seminar held on 25 April 2015 Sarah Wilton
7.2 Finance Report To receive a verbal report from the Finance & Performance Committee meetings held on 14
th
and 25th April
S Bolam TB April 15-03
7.3
7.4
Workforce Performance Report To receive a verbal report from the workforce committee meeting April 15
Quarter 4 Submission to Monitor for approval
W Brewer TB April 15-04a,b,c,d S Pantelides S Bolam TB April 15-05
BREAK 15.00
8. Strategy 15.10
8.1
Monitoring Corporate Objectives – Q4 2014/15 update To receive the progress report
R Elek TB April 15-06a,b

TB April 15 (Public)
2
8.2
Annual Plan 2015/16 for approval, including:
Narrative
Corporate Objectives
R Elek TB April 15-07
8.3
Communications Plan 2015/16 To approve the annual communications plan
P Jenkinson TB April 15-08a,b
8.4
Divisional Presentation – Surgery, Theatre, Neurosciences & Cancer Division (focus on Cancer)
C Cox TB April 15-09
9. Governance 16.15
9.1 Risk and Compliance Report To review the Trust’s most significant risks and external assurances received
P Jenkinson TB April 15-10
9.2 Audit Committee – Annual report 2014/15 and work plan 2015/16 M Rappolt
To receive the committee annual report and approve the work plan for 2015/16 TB April 15-11a,b,c,d
10. General Items for Information 16.40
10.2 Use of the Trust Seal To note use of the Trust’s seal during the period (April 2015)
10.3 Questions from the Public Members of the public present are invited to ask questions relating to business on the agenda. Priority will be given to written questions received in advance of the meeting.
11.
11. Meeting evaluation 11.
12. Date of the next meeting - The next meeting of the Trust Board will be held on 28 May at 9.00am H2.6.

TB (M) 26.03.15 (Public)
1
MINUTES OF THE TRUST BOARD
26 March 2015 H2.5 Board Room, 2nd Floor, Hunter Wing, St George’s Hospital
Present: Mr Christopher Smallwood Chair Mr Miles Scott Chief Executive Mr Steve Bolam Director of Finance, Performance and
Informatics Mrs Wendy Brewer
Director of Human Resources and Organisational Development
Ms Jennie Hall Chief Nurse Dr Judith Hulf Non-Executive Director Mr Peter Jenkinson Director of Corporate Affairs Professor Peter Kopelman Non-Executive Director Mrs Kate Leach Associate Non-Executive Director Dr Simon Mackenzie Medical Director Mr Eric Munro Director of Estates and Facilities Ms Stella Pantelides Non-Executive Director Mr Martin Wilson Director of Improvement and Delivery Mr Rob Elek Director of Strategy Ms Sarah Wilton Non-Executive Director In attendance: Apologies: Mr Mike Rappolt Non-Executive Director
01. Opening remarks
Mr Smallwood also welcomed the governors and members of public present. He reminded all present that this was a meeting of the Board in public rather than a public meeting. However members of the public present would be given the opportunity to raise questions at the end of the meeting.
02. Declarations of interest No declarations of interest were noted in relation to this meeting’s agenda.
03. Minutes of the previous meeting The minutes of the meeting held on 26 March 2015 were approved as an accurate record.
04. Schedule of Matters Arising Branding Mr Jenkinson confirmed that the branding workshop had resulted in a final ‘house-style’ for the trust, which had been launched at the foundation trust event on 10th March. The design for the joint branding with St. George’s, University of London had been signed off and would be launched from 1st May. The next Joint Implementation Board meeting would consider the communications plan for this launch. Workforce report It was noted that Mrs Brewer would provide a more detailed report on staff turnover for the April board meeting. The board would also receive a recruitment plan in April.
W Brewer April 15
TB (M) 26.03.15 (Public)
2
Mrs Brewer also confirmed that all those staff who received annual increments had had an appraisal. Nelson risk assessment Mr Jenkinson reported that the risk assessment of the Nelson, including any risk of opportunity cost from not using the full capacity, would be included in the risk assessment of annual objectives.
05. Chief Executive Report The Board received and noted the chief executive’s report. The Board noted the feedback from the DH major trauma peer review. Mr Scott confirmed that feedback had been very positive and assured the board that the two ‘serious’ concerns related to national issues and were being addressed, but did not represent ‘immediate’ concerns. Mr Smallwood welcomed the LiAISE staff support service initiative and asked what issues had been identified in the A&E department. Mr Scott advised that it showed a proactive promotion of such a support service encourages staff to raise concerns. The concerns raised through this initiative covered a broad spectrum of issues, including suggestions as to improve care, but did not included any major patient safety concerns. The departmental management team were taking the feedback received and using it to inform an improvement plan. Dr Hulf endorsed the initiative and encouraged the development of a structure to sustain the culture of openness and the ability of staff to raise concerns.
06. Quality and performance report Performance report Mr Bolam presented the performance report for month 11, highlighting areas of concern including compliance with RTT, cancer standards and ED waiting time standards. The Board noted that this resulted in a rating of 3 in the Monitor risk ratings, and would have resulted in a 4 were the trust not allowed to breach the RTT target. The board noted that the trust expected to continue to breach the RTT target until June 2015. Mr Bolam reported on the ongoing ‘joint investigation’ with commissioners, with a view to agreeing a joint action plan to address underperformance. In addition, the trust’s capacity planning was ongoing to ensure sufficient capacity to meet requirements.
The Board therefore noted that challenges in achieving compliance continued in RTT and ED, and therefore the need to achieve all other standards. The finance and performance committee would review recent performance in cancer in detail, to ensure that compliance would be sustained in future. Mrs Pantelides asked whether the trust was escalating potential cancer breaches with other trusts where a delay in referring the patient caused the trust to face the risk of breaching the standard. Mr Wilson confirmed that appropriate escalation processes were in place, including a weekly review by the management team and chief operating officer to chief operating officer discussions when required. Mrs Pantelides referred to the ED performance, noting that a more detailed action plan had been reviewed by the finance and performance committee; she asked
TB (M) 26.03.15 (Public)
3
what assurance the board could take regarding future compliance when the original plan had been to achieve compliance by the end of March. Mr Wilson reported that the trust had been facing increasing demand in recent months and therefore there was a need for a model of care to meet that demand. The focus was therefore on patient flow, including admission and discharge. Mr Bolam added that a similar ‘joint investigation’ was ongoing with commissioners in ED. The Emergency Care Intensive Support Team (ECIST) had reviewed the ED and had provided positive assurance about the department; therefore the focus needed to be on the patient flow through the trust. The board received the discharge paper presented by Ms Hall, which set out the approach and phasing of the discharge workstream. This approach included the implementation of the ‘Breaking the cycle’ initiative, running over the Easter week; this national initiative was designed to focus on the flow of patients, with objectives of the initiative agreed with commissioners. Mr Smallwood endorsed the comprehensive approach to improving patient flow, but questioned whether there was evidence of improvement. The board noted the use of several metrics to measure improvement: the use of the discharge lounge, which had seen a small increase; the number of discharges prior to 11.00hrs in pilot wards, which had seen good improvement and was now being rolled out across the trust. In addition the long—stay patient profile was being monitored and metrics for the acute medical unit were being developed. Prof Kopelman asked whether there were training and opportunities for rotation of AMU staff. Ms Wilton asked for assurance that the quality of discharges would be maintained and Dr Hulf asked for assurance that the transport services were prepared to support. Hs Hall assured the board that there was a focus on AMU and its status as a short-stay area. Opportunities for rotation were being explored and escalation processes put in place to alert other areas of the trust when specific areas were busy. She assured the board that discharges were being expedited but would not compromise quality; there was no indication of such adverse impact. Ms Hall added that improvements were being made to the timing of requests and demand for transport services, which would improve the effectiveness of the service to support improved discharge. Mr Smallwood asked how many of the ‘blocked’ beds was as a result local authority capacity constraints. Ms Hall referred to a recent audit which presented a snap shot of bed capacity issues on one day. That audit suggested that between 10 and 20 patients were waiting for external care packages. In addition to this there were also patients waiting to return to their local hospital. In total these two categories of patients waiting for discharge represented about one and a half wards. Mr Wilson reported that the trust was implementing a technical solution which would enable management to track patients and their pathway towards discharge. Ms Wilton asked what action was being taken to address the deterioration in performance in relation to notes availability in clinics. Ms Hall acknowledged the deterioration and explained that it was due to the transfer of medical records to an archive store. This process had overrun which had led to a backlog of records waiting to be transferred. Remedial action had been implemented and the backlog was now reducing. Quality report
TB (M) 26.03.15 (Public)
4
Effectiveness domain The board noted the updates, with no significant issues to note. Safety domain Ms Hall highlighted key issues, including:
Pressure ulcers, remaining a concern in terms of number reported and severity;
VTE profile remaining largely unchanged, but with focussed support now in place for those areas with iClip;
Infection control, with a fifth case of MRSA having been reported. This case, as with another reported case, was related to external wound management and there was therefore a focus on surgical site infections, with external support from Public Health England. The results of this review would be presented to the next board meeting.
Mr Smallwood asked for comment on the increasing rate of serious incidents. Ms Hall advised that an increased number of LAS breaches had been included. Other incidents reflected current themes and concerns, including never events in maternity and dermatology and HMP Wandsworth. Ms Hall welcomed the culture of openness in place which led to good levels of reporting. The board acknowledged the importance of this indicator as an indicator of impact of operational and financial pressures on quality. Experience domain The board noted the updates, and welcomed the encouraging signs of improvement in complaints performance. Ms Hall confirmed that three of the four divisions were on track to achieve the target by year-end. Well-led domain The board noted the updates, and welcomed the improved fill-rate. Ward heat-map The board noted the current heat-map showing ward-level quality indicators. Mr Smallwood expressed his concern that the various indicators painted a picture of pressure on staffing levels across the trust, especially in senior clinical staff. Ms Hall advised that there was a need to train junior staff to ensure that the fill-rate was sustained; it was recognised that specific areas faced pressures and the leadership in those areas were being supported in addressing those issues. For example the divisional director of nursing was providing support in the Gwyn Holford ward. The board acknowledged that the quality inspection programme had been paused temporarily due to the run-rate expenditure controls, but agreed that these should be reinstated as soon as possible. The board agreed that there needed to be very robust governance processes around the cost savings and run-rate schemes, including staffing indicators and assurance mechanisms such as quality inspections, the heat-map and a dashboard of other quality indicators which was being developed, to ensure a focus on quality. It was understood that the level of financial challenge faced would have an impact on quality and that the risk appetite would increase, but this needed to be minimised. Ms Hall reported that she would be discussing with senior nurses in the following week how they support front-line staff and Dr Mackenzie confirmed that job planning for medical staff would commence the
J Hall April 15
J Hall April 15
TB (M) 26.03.15 (Public)
5
following week and this would be used to ensure best use of medical staff and a reduction in the use of locums. It was agreed that the final judgement on risks must rest with the medical director and chief nurse. Report from quality and risk committee Ms Wilton presented a summary of key points raised at the last quality and risk committee, including a refocusing of the committee in the light of forecast pressures to ensure that risk and assurance relating to quality was a key driver for the agenda of the committee. This would include the role of the clinical governance group in monitoring risks in CIPs and run-rate schemes. Ms Wilton summarised other discussions, including assurance received relating to the ongoing process to ensure quality assurance of external providers, a review of recent never events in maternity and the ongoing process to ensure follow-up of diagnostic tests.
07 Finance report Mr Bolam presented the month 11 finance report, highlighting that the trust was £9.5m adverse to plan, with a £3m adverse position in-month. This was due to a smaller than planned increase in income which was insufficient to off-set expenditure. In particular elective income was £1m adverse to plan; this meant that the additional activity had been emergency work which had an impact on financial position as it was only paid at 30% of tariff. Other causes included continued overspend against budget, particularly on staff, and underperformance against CIP targets. Mr Bolam advised that this performance had a significant adverse effect on the trust’s cash position. The year-end cash balance would remain at £20m but this would include drawn down loans. He reported that overspend in capital projects such as IM&T had been addressed. Mrs Pantelides asked why the trust had not been able to forecast such a significant deterioration in performance. Mr Bolam advised that it was not a surprise as the trend over the past few months had been one of continued deterioration and the revised year-end forecast had indicated such. There was a discussion regarding the trust response to such a position, in particular to protect income. It was recognised that capacity and patient flow issues were having an adverse impact on income and therefore the use of existing capacity needed to be maximised. The board welcomed the work being done by Mr Wilson to introduce systems to monitor and manage activity on a more real-time basis. The board also noted that there were ongoing discussions with commissioners, including negotiation of a year-end settlement. Report from the finance and performance committee Mr Smallwood highlighted key points of discussion at the last committee meeting, including the need to revise and agree the capital investment plan due to the change in the financial position. It had been agreed that an extra-ordinary meeting of the committee would be arranged to consider the revised plan ahead of presentation at the next board meeting for approval. Mr Smallwood advised that it would be important for the board to understand the impact of the planned change in capital investment and to understand the risks. Mr Smallwood reported that the committee had discussed whether further financial support would be required in terms of loans or working capital facility, to
S Bolam April 15

TB (M) 26.03.15 (Public)
6
support the trust’s cash position. It had been agreed that Mr Bolam and Mr Scott would be reviewing the need. The committee had also considered the draft programme to review the long-term financial model and clinical services model, being initiated as a response to the forecast financial challenges. This programme would include a service line level review of all services, clinical and non-clinical, to ensure long-term sustainability. It was anticipated that the outcome of this programme would be published in September 2015. Mrs Pantelides endorsed the approach being taken to review services for long-term sustainability but questioned whether the process should be expedited in light of the current position. Mr Scott agreed that the process needed to be completed as soon as possible, but advised that this needed to be balanced against the need to manage the immediate ‘business as usual’ issues. He confirmed that some of the programme was being expedited, including the run-rate schemes and downside mitigations, but that a service-line level review of all services would take time. However the programme would be continually reviewed and certain workstreams would be accelerated if necessary. Mr Smallwood added that it would be important to test any assumptions made very carefully. The board endorsed the approach being taken to address the short-term issues and the long-term sustainability. It recognised that the trust’s position was not dissimilar to other large teaching trusts in London and that nationally the health service was under considerable pressure, but it also recognised the responsibility for the trust to address its own performance.
08. Approval of additional LEEF loan The board reviewed the proposal to take an additional LEEF loan to extend the scope of the planned refurbishment, recognising that the proposal had been discussed in detail at the finance and performance committee. The board agreed to the recommendation from the committee and approved the proposal.
09. Workforce performance report Mrs Brewer presented the workforce report for month 11, highlighting that sickness absence rates had reduced back to pre-winter levels and a reduction in usage of agency staff. The board noted the report and agreed that an update against the recruitment plan would be presented for the May meeting. The next report would also include a trajectory for the planned reduction in turnover.
10. Annual staff survey results Mrs Brewer presented a summary of the results of the annual staff survey, noting a small increase in the response rate and highlighting an above average overall engagement score and a positive response from staff regarding their ability and willingness to raise concerns. The board noted the trust had retained a steady position compared with the previous year and that other trusts had deteriorated so that the trust’s position had improved slightly when compared nationally. The board however also noted that the trust remained in the bottom 20% nationally for bullying and harassment. It was noted that the survey results would be used to inform the workforce action plan.
TB (M) 26.03.15 (Public)
7
Ms Wilton highlighted the discrimination results as being disappointing and stressed the need to raise the profile of equality. The board referenced the Workforce Race Equality Scheme (WRES) data in a subsequent paper. Mrs Brewer acknowledged that there was more to do but reported that some targeted work had been done in maternity and a series of unconscious bias workshops had been run for senior managers. In addition the ‘St. Georges as one’ group had now been established. The board acknowledged that there had been insufficient focus and engagement on equality over the recent past which would need to be addressed. Dr Hulf highlighted the bullying and harassment as a specific area of focus and asked whether there were any examples of good practice which could be disseminated, as well as taking a zero tolerance approach to cases of bullying. Mrs Brewer confirmed that specific actions had been taken following the last CQC inspection and that the board commitments to bullying and harassment had been reinforced. Mrs Pantelides suggested that the Board treats bullying and harassment as a safety issue given the evidence of harm that staff using the Staff Support Service are reporting. Mrs Leach highlighted the level of staff suffering violence or abuse from other staff and therefore welcomed the approach being taken. Mr Smallwood suggested a more robust approach where examples of bullying and harassment are identified. Mrs Brewer confirmed that action was being taken, including senior members of staff, but advised that some cases were very complicated. The board endorsed the approach, noting that Guys and St. Thomas had reduced their bullying and harassment scores by 20% over the past ten years and therefore improvement could be made. It was agreed that two board development sessions would be arranged – one on embedding the values (to cover bullying and discrimination) and one on developing leaders. Report from the workforce committee The board received and noted the report from the last workforce committee meeting.
W Brewer / P Jenkinson
May 15
11. Report from the audit committee Ms Wilton gave an oral summary of key points raised at the last meeting; it was agreed that the written report would be circulated to the board separately. Ms Wilton highlighted particular concern of the committee – continued concerns regarding compliance with fire safety and a lack of progress made in implementing the agreed action plan, which presented a significant potential risk to patient safety. Mr Munro reported that fire risk assessments had been completed by all areas and 33% of those had been issued as signed off assessments. The gap was therefore in issuing the completed assessments to local areas. He acknowledged a lack of progress in implementing the action plan but confirmed that fire safety and estates compliance roles had now been recruited to and therefore expected all actions to be completed within the next period. Mr Scott accepted responsibility for resolving this issue on behalf of the whole executive team. Ms Wilton also highlighted issues with ongoing salary overpayments. Mr Bolam

TB (M) 26.03.15 (Public)
8
confirmed that systems were in place to prevent salary overpayments but that it was the responsibility of individual managers to notify payroll of leavers. He also confirmed that all not overpayments were written off.
12. Equality Delivery System (EDS) annual report The board received and noted the annual report, including the results of the annual self-assessment against the EDS standards and the setting of objectives for 2015/16. The board reiterated its commitment to equality and approved the objectives as presented. Mrs Pantelides stressed the need to support the launch of the ‘St. Georges as one’ initiative. The board also noted the outcome of the review of the governance arrangements for equality, agreeing to the proposal that the trust’s equality and human rights committee report to the executive management team, but with appropriate reporting to the workforce committee and quality and risk committee.
13. Risk and compliance report The board received and noted the risk report, noting the most significant risks from the board assurance framework and noting that the controls for the most significant risks had been picked up in discussions through the agenda. Mr Jenkinson outlined the approach to reviewing the risks on the framework, agreed by quality and risk committee, which would enable a ‘deep dive’ review of individual risks and assurances and therefore provide the board with greater assurance around the management of risks.
14. South West London Pathology update The board received and noted the update report, outlining progress within the programme. The board noted that an assessment of the specific impact of the programme on the trust should be considered by the finance and performance committee.
S Bolam April 15
15. Questions from the public Mrs Ingram raised a concern about waiting times for triage in the emergency department, citing a 30 minute wait over the previous weekend. Ms Hall agreed to follow up – it would be unacceptable to have such waiting times but would also be very unusual. Mr Wilson assured the board that the triage process in ED had been validated by commissioners, and Mr Munro added that the current triage area would be extended to provide a better waiting area. Mrs Ingram also raised concern that, according to the staff survey results, 89% of staff had witnessed an adverse incident. The board noted that adverse incidents included a variety of severity and nature. Mr Crocker referred to previous discussions with the council of governors regarding governor attendance at board sub-committees and asked the board for its thoughts. Mr Smallwood confirmed that there would be a board discussion later that day and this would be fed back to the council at its next meeting on 2 April. Mrs Washington asked whether the trust had cash reserves. Mr Bolam confirmed that the trust had £20m in reserves but that this was not earning much interest.

TB (M) 26.03.15 (Public)
9
The trust had also secured a working capital facility in case of future liquidity problems. He advised that these cash reserves were not as large as other trusts due to previous historic debt issues.
16. Meeting evaluation The board endorsed the timing of the meeting, however Mrs Pantelides highlighted that improvements needed to be made in the timing of circulation of papers and the quality of papers. The board reinforced the need for a technical solution to help manage the use of electronic papers Mrs Pantelides also suggested that the order of agenda items be reviewed so important agenda items are placed first.
17. Any other business There was no other business.
18. Date of the next meeting The next meeting of the Trust Board will be held on 30 April 2015 at 9.00am.
TB(MA) 30.04.15 (Public)
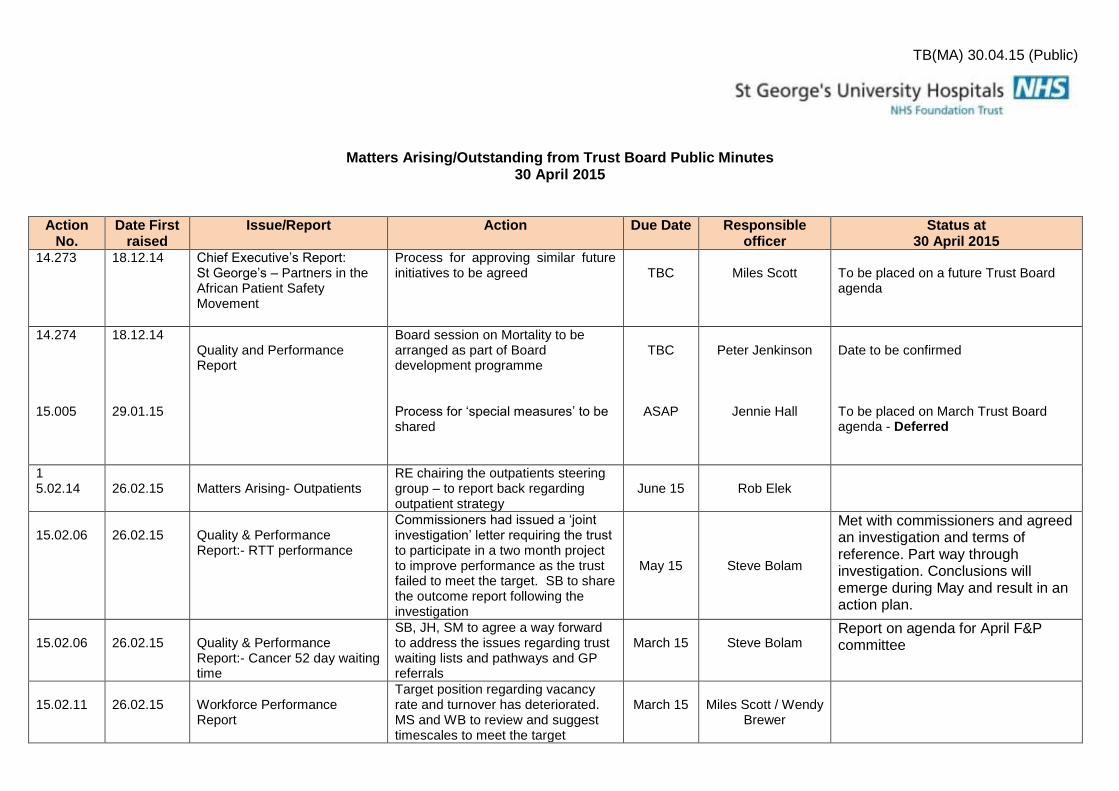
Matters Arising/Outstanding from Trust Board Public Minutes 30 April 2015
Action No.
Date First raised
Issue/Report Action Due Date Responsible officer
Status at 30 April 2015
14.273 18.12.14 Chief Executive’s Report: St George’s – Partners in the African Patient Safety Movement
Process for approving similar future initiatives to be agreed
TBC
Miles Scott
To be placed on a future Trust Board agenda
14.274 15.005
18.12.14 29.01.15
Quality and Performance Report
Board session on Mortality to be arranged as part of Board development programme Process for ‘special measures’ to be shared
TBC
ASAP
Peter Jenkinson
Jennie Hall
Date to be confirmed To be placed on March Trust Board agenda - Deferred
1 5.02.14
26.02.15
Matters Arising- Outpatients
RE chairing the outpatients steering group – to report back regarding outpatient strategy
June 15
Rob Elek
15.02.06
26.02.15
Quality & Performance Report:- RTT performance
Commissioners had issued a ‘joint investigation’ letter requiring the trust to participate in a two month project to improve performance as the trust failed to meet the target. SB to share the outcome report following the investigation
May 15
Steve Bolam
Met with commissioners and agreed an investigation and terms of reference. Part way through investigation. Conclusions will emerge during May and result in an action plan.
15.02.06
26.02.15
Quality & Performance Report:- Cancer 52 day waiting time
SB, JH, SM to agree a way forward to address the issues regarding trust waiting lists and pathways and GP referrals
March 15
Steve Bolam
Report on agenda for April F&P committee
15.02.11
26.02.15
Workforce Performance Report
Target position regarding vacancy rate and turnover has deteriorated. MS and WB to review and suggest timescales to meet the target
March 15
Miles Scott / Wendy
Brewer

15.03.04
26.03.15
Workforce Report
To provide a detailed report on staff turnover and a recruitment plan.
April 15
Wendy Brewer
ON AGENDA
15.03.04
26.03.15
Workforce Report
It was agreed to have two board development sessions – one on embedding the values (to cover bullying and discrimination) and one on developing leaders.
TBC
Wendy Brewer
15.03.06
26.03.15
Quality Report – Safety Domain
Infection control /MRSA – results of review supported by Public Health England to be presented at the next board meeting.
April 15
Jennie Hall
ON AGENDA
15.03.06
26.03.15
Quality Report – Ward Heat Map
Quality inspection programme paused due to run rate expenditure controls – to be reinstated as soon as possible
April 15
Jennie Hall
ON AGENDA
15.03.06
26.03.15
Report from Finance & Performance committee
Extraordinary meeting to be arranged to consider revised capital investment plan for approval.
April 15
Steve Bolam
ON AGENDA
14.03.14
26.03.15
South West London Pathology update
The assessment of the specific impact of the programme to be considered by the finance and performance committee
April 15
Steve Bolam
Complete
26.03.15
Annual Staff Survey Results
It was agreed that two board development sessions would be arranged – one on embedding the values (to cover bullying and discrimination) and one on developing leaders. .
May 15
W Brewer / P
Jenkinson

TB April 15-01
1
REPORT TO THE TRUST BOARD – APRIL 2015
Paper Title: Chief Executive’s Report
Sponsoring Director: Miles Scott, Chief Executive
Author: Peter Jenkinson, Director of Corporate Affairs
Purpose:
The purpose of bringing the report to the
board
To update the Board on key developments in the last
period
Action required by the board:
For information
Document previously considered by:
Name of the committee which has
previously considered this paper /
proposals
N/A
Executive summary
1. Key messages The paper sets out the recent progress in a number of key areas:
Quality & Safety
Strategic developments
Management arrangements
2. Recommendation The Board is asked to note the update and receive assurance that key elements of the trust’s
strategic development are being progressed by the executive management team.
Key risks identified:
Are there any risks identified in the paper (impact on achieving corporate objectives) – e.g. quality,
financial performance, compliance with legislation or regulatory requirements?
Risks are detailed in the report under each section.
Related Corporate Objective:
Reference to corporate objective that this
All corporate objectives
TB April 15-01
2
paper refers to.
Related CQC Standard:
Reference to CQC standard that this paper
refers to.
N/A
Equality Impact Assessment (EIA): Has an EIA been carried out? Yes
If yes, please provide a summary of the key findings
No specific groups of patients or community will be affected by the initiatives detailed in the report.
Where there may be an impact on patients then consultation will be managed as part of that specific
programme.
If no, please explain your reasons for not undertaking an EIA.
TB April 15-01
3
1. Quality and Patient Safety
1.1 Breaking the Cycle This month the trust participated in the national NHS Breaking the Cycle initiative. From 7th –
15th April there was a focused effort to deliver objectives which would improve the flow of
patients through the hospital.
The Objectives:
1) Information to support decision making
IClip was updated to enable clinical teams to capture: the correct consultant for every patient
in the hospital; the reason for admission; expected discharge date/time. This information
was used to support decisions about individual patients.
2) Site management & escalation
New approaches were piloted to support effective daily capacity planning, with site
management, clinical and operational teams.
3) Board rounds & pharmacy
Audits were run on medical and surgical wards to assess and measure the impact of a
patient prioritisation model (SHOP model) on consultant board rounds; and the presence of
a prescribing pharmacist on the timely discharge of patients.
4) Increasing pre-11am discharges
A further 9 wards were to go live with pre-11am scorecards and we began embedding the
new processes for AMU bed management and board rounds.
Key headlines from Breaking the Cycle:
• After the roll out of the daily review of potential discharges using iClip, 52.5% of current inpatients (on surgical/medical wards participating in the initiative) now have their iClip 5 a day details recorded. This is fantastic progress.
• A new “Patient Flow” approach for the site management meeting has been agreed and implemented. Going forward we will continue to develop this approach using the information we now have available regarding discharges for the next 5 days using the iClip data.
• Board and ward round observations have been conducted across 7 wards, supporting the implementation of a structured approach to both board and ward rounds across the trust. Engagement and feedback from consultant colleagues are key to the success of this phase. We have also tested the impact of involving prescribing pharmacists in ward rounds.
• The redesign of the flow of patients through AMU beds has been embedded and continues to progress. We had a consistent picture of the number of empty beds each morning which was a key objective. The highest number of empty beds on one day was 23.

TB April 15-01
4
• Progress continues to be made regarding pre-11am discharge with 81 pre-11am discharges achieved during the week of the 30th March (across the medical and surgical wards). We have exceeded our original aim of 75 discharges and have set a new target of 106 increasing to 200 by the end of June for these areas. Achieving this level of discharge will have a significant impact on flow for both elective and non-elective pathways.
Our focus is now to use the successes from the past two weeks to further enhance Phase 2 of the trust-wide Flow Programme. We plan to realign the existing programme to include the outcomes and lessons from each of the objectives and we will be engaging with clinical and operational teams from across the organisation to help us in planning the next phase.
2. Strategy 2.1 Council of Governors
The Council of Governors met on 2nd April. Key points from that meeting that the Board
should be aware of include:
Establishment of initial remuneration for chairman and non-executive directors
The Council approved the initial remuneration and terms and conditions for chairman and
non-executive directors, in accordance with their statutory duty.
Draft annual business plan
The Council considered the trust’s draft objectives for 2015/16. The Council felt that there
should be more objectives relating to quality and in particular relating to improving patient
experience, given patient feedback received. As part of this, there should be a focus on
customer care for front line staff. The Council also discussed the objective relating to the
development of a private patient unit (PPU). It was noted that the intention to generate
additional income to support the trust’s financial position was important, but cautioned that
the trust must also retain a focus on the basic NHS services. The Council noted the plans
around the PPU and the provision of additional income to support the provision of other NHS
services, and that the development of the unit would also enable the development of
additional capacity for NHS activity. It was agreed that there would be a more detailed
discussion regarding the PPU at a later date.
Trust performance
The Council reviewed the financial, operational, quality and workforce performance reports.
The Council expressed their concern over the financial position and the significant
deterioration in the last quarter, noting the trust’s position in the context of significant
financial pressures nationally. The Council noted the explanation for the deterioration, the
potential impact of current performance and the controls being put in place to address the
position in the short-term and longer-term.
Staff survey
The Council received a summary of the latest staff survey results and agreed with the trust’s
focus on bullying and harassment and turnover. The Council recommended that the
TB April 15-01
5
categorisation of staff should be more granular in terms of ethnicity. It was agreed that this
would be the topic of more detailed discussion at a forthcoming Board / Council workshop.
Quality account indicators
The Council selected one voluntary indicator from the quality account to be audited by the
trust’s external auditor, in line with requirements. They agreed that the indicator ‘clinical
outcome measures in community’ would be most useful to audit, given the importance of
data for community services and the quality of that data.
Council and Board engagement
The Council reviewed the recommendations from the recent Board development session
regarding the development of the relationship between board and council. A draft
programme of joint workshops and council sessions was agreed, along with a process for
governors to also attend board and board sub-committee meetings.
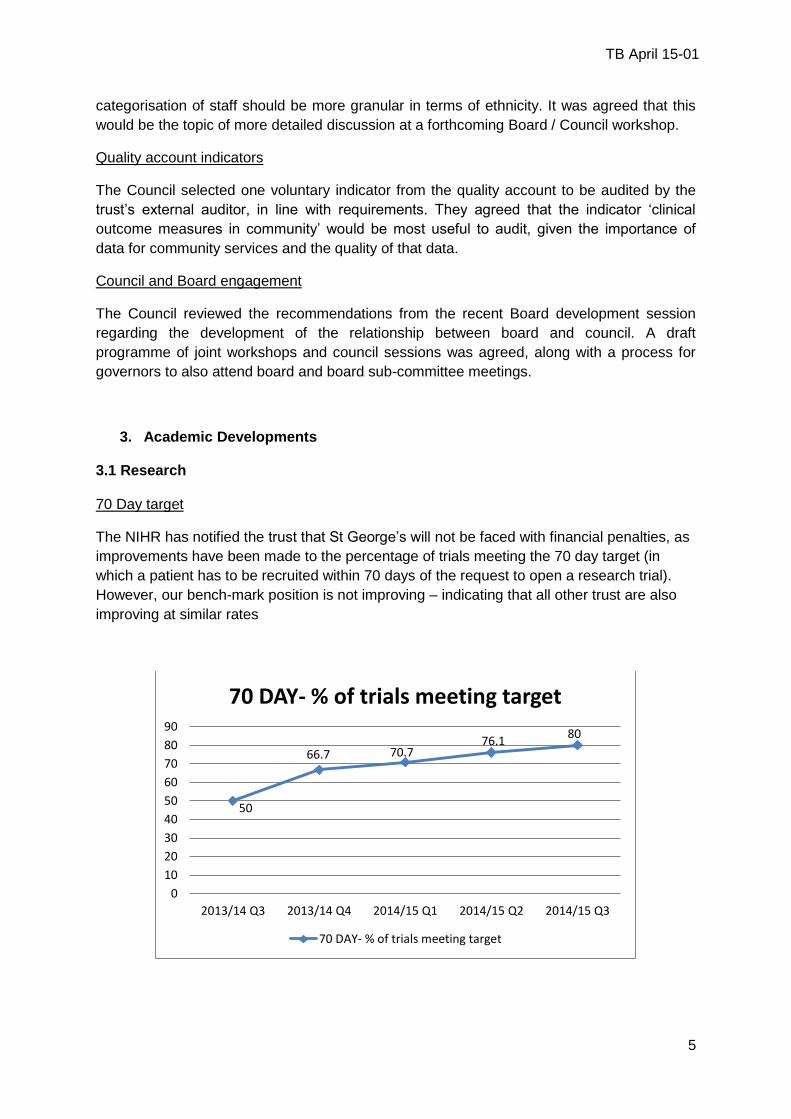
3. Academic Developments 3.1 Research 70 Day target
The NIHR has notified the trust that St George’s will not be faced with financial penalties, as
improvements have been made to the percentage of trials meeting the 70 day target (in
which a patient has to be recruited within 70 days of the request to open a research trial).
However, our bench-mark position is not improving – indicating that all other trust are also
improving at similar rates
50
66.7 70.7 76.1
80
0
10
20
30
40
50
60
70
80
90
2013/14 Q3 2013/14 Q4 2014/15 Q1 2014/15 Q2 2014/15 Q3
70 DAY- % of trials meeting target
70 DAY- % of trials meeting target
TB April 15-01
6
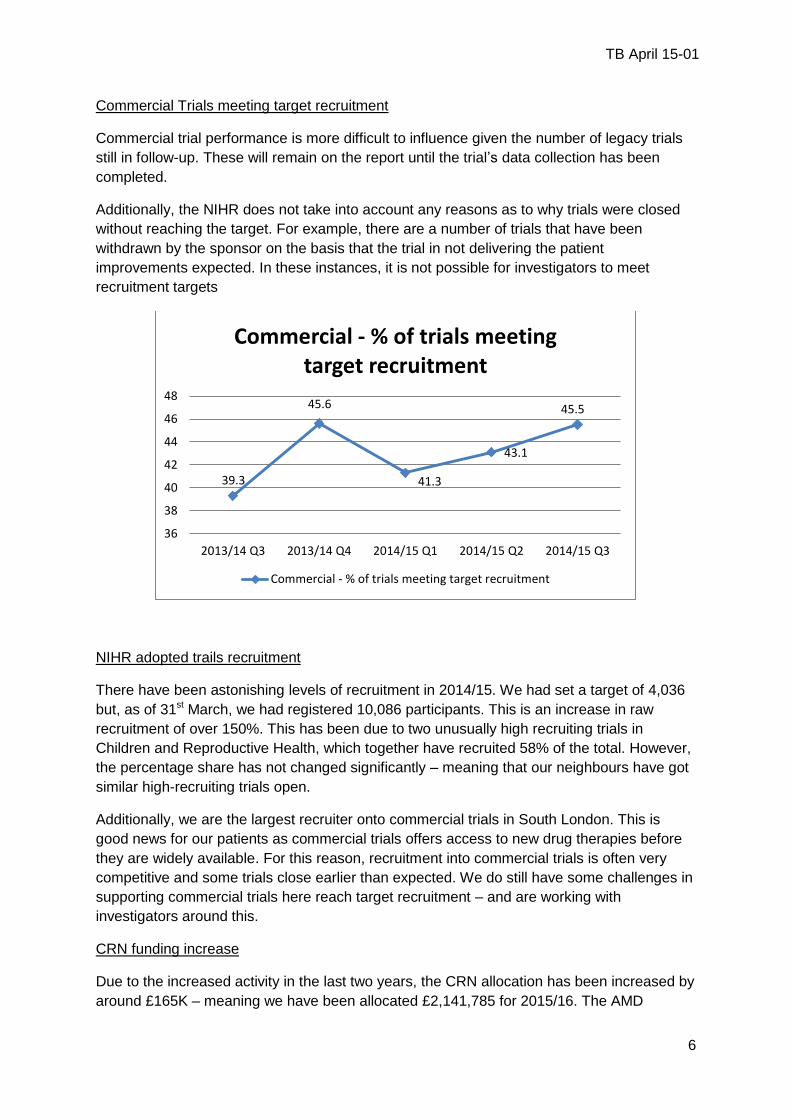
Commercial Trials meeting target recruitment
Commercial trial performance is more difficult to influence given the number of legacy trials
still in follow-up. These will remain on the report until the trial’s data collection has been
completed.
Additionally, the NIHR does not take into account any reasons as to why trials were closed
without reaching the target. For example, there are a number of trials that have been
withdrawn by the sponsor on the basis that the trial in not delivering the patient
improvements expected. In these instances, it is not possible for investigators to meet
recruitment targets
NIHR adopted trails recruitment
There have been astonishing levels of recruitment in 2014/15. We had set a target of 4,036
but, as of 31st March, we had registered 10,086 participants. This is an increase in raw
recruitment of over 150%. This has been due to two unusually high recruiting trials in
Children and Reproductive Health, which together have recruited 58% of the total. However,
the percentage share has not changed significantly – meaning that our neighbours have got
similar high-recruiting trials open.
Additionally, we are the largest recruiter onto commercial trials in South London. This is
good news for our patients as commercial trials offers access to new drug therapies before
they are widely available. For this reason, recruitment into commercial trials is often very
competitive and some trials close earlier than expected. We do still have some challenges in
supporting commercial trials here reach target recruitment – and are working with
investigators around this.
CRN funding increase
Due to the increased activity in the last two years, the CRN allocation has been increased by
around £165K – meaning we have been allocated £2,141,785 for 2015/16. The AMD
39.3
45.6
41.3
43.1
45.5
36
38
40
42
44
46
48
2013/14 Q3 2013/14 Q4 2014/15 Q1 2014/15 Q2 2014/15 Q3
Commercial - % of trials meeting target recruitment
Commercial - % of trials meeting target recruitment

TB April 15-01
7
Research is looking at plans and requests submitted by research active consultants from all
divisions to strengthen research support available to teams.
4. Workforce
4.1 Listening into Action
LIAiSE - The listening service for all staff
So far this year, we have held Big Conversations with volunteers, and about pressure ulcers,
nurses induction and medical devices. The feedback gathered from each of these is now
collated and action plans have been devised to take forward what staff have told us. The
Conversation with Volunteers was particularly fruitful, producing a range of suggestions on
the ways in which the trust could improve patient experience, based on the observations of
those people who volunteer their time for St George’s (patient representatives, Governors,
volunteers from Voluntary Services).
One of the teams we are working with this year is the team of Physician Associates. This is
an innovative and relatively new health professional role, supporting doctors in the diagnosis
and management of patients. They are trained to perform a number of roles including taking
medical histories, performing examinations, diagnosing illnesses, analysing test results,
developing management plans. Training is provided at just 8 institutions in England, of which
St George’s University of London is one. The team are very enthusiastic and we hope to
build on this to help develop this pioneering role.
4.2 Excellence in Education
An Excellence in Education event was held on the evening of 25th March. Clinical educators from all disciplines were encouraged to submit poster presentations summarising their programmes and the outputs. The event enabled good practice to be shared, and the teaching component of the roles of Doctors, Nurses, Physician Associates, and Therapists to be celebrated. 4.3 Nursing Times Award The Trust has been shortlisted for the Nursing Times Award for excellent student placements in the Emergency Department. Winners will be announced on May 7th. 4.4 Totara Totara - our new learning management system - goes live during April, giving staff easy access to the training directory and the ability to book places on-line. 4.5 Health Care Support Workers We are launching the Care Certificate for all new Health Care Support Workers, the first cohort have started on Induction this month. We have also completed a promotional film on Health Care Support Workers to be shown on the intranet and at assessment centres.
TB April 15-01
8
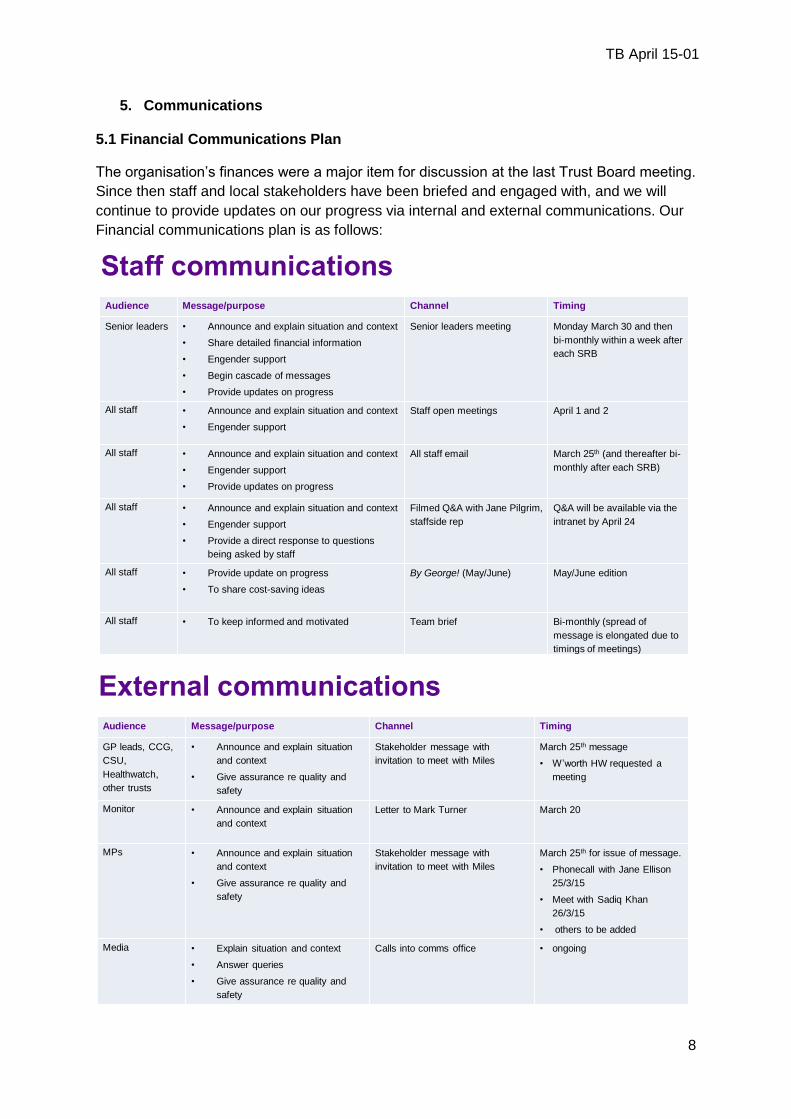
5. Communications 5.1 Financial Communications Plan
The organisation’s finances were a major item for discussion at the last Trust Board meeting.
Since then staff and local stakeholders have been briefed and engaged with, and we will
continue to provide updates on our progress via internal and external communications. Our
Financial communications plan is as follows:
Staff communications
Audience Message/purpose Channel Timing
Senior leaders • Announce and explain situation and context
• Share detailed financial information
• Engender support
• Begin cascade of messages
• Provide updates on progress
Senior leaders meeting Monday March 30 and then
bi-monthly within a week after
each SRB
All staff • Announce and explain situation and context
• Engender support
Staff open meetings April 1 and 2
All staff • Announce and explain situation and context
• Engender support
• Provide updates on progress
All staff email March 25th (and thereafter bi-
monthly after each SRB)
All staff • Announce and explain situation and context
• Engender support
• Provide a direct response to questions
being asked by staff
Filmed Q&A with Jane Pilgrim,
staffside rep
Q&A will be available via the
intranet by April 24
All staff • Provide update on progress
• To share cost-saving ideas
By George! (May/June) May/June edition
All staff • To keep informed and motivated Team brief Bi-monthly (spread of
message is elongated due to
timings of meetings)
SRB(15)07A
External communications
Audience Message/purpose Channel Timing
GP leads, CCG,
CSU,
Healthwatch,
other trusts
• Announce and explain situation
and context
• Give assurance re quality and
safety
Stakeholder message with
invitation to meet with Miles
March 25th message
• W’worth HW requested a
meeting
Monitor • Announce and explain situation
and context
Letter to Mark Turner March 20
MPs • Announce and explain situation
and context
• Give assurance re quality and
safety
Stakeholder message with
invitation to meet with Miles
March 25th for issue of message.
• Phonecall with Jane Ellison
25/3/15
• Meet with Sadiq Khan
26/3/15
• others to be added
Media • Explain situation and context
• Answer queries
• Give assurance re quality and
safety
Calls into comms office • ongoing
SRB(15)07A
TB April 15-01
9
5.2 Nutrition and Hydration Week (16th – 22nd March)
We supported the international campaign with a series of nutrition and hydration events for staff and visitors to take part in throughout the week across both the St George’s and Queen Mary’s sites. Trust employees also had the chance to take part in webinars and workshops covering health topics such as nasogastric feeding tubes and keeping kidneys healthy. The week was a great success on social media too as we shared photos and updates from our events. Our Facebook posts reached 9351 people, while on Twitter we had 302 interactions.
5.3 24 hours in A&E will be filmed again St George’s
Since last October, Channel 4 have aired 22 episodes of ’24 Hours in A&E’ filmed at St
George’s. Eight more will be shown later this year.
After a series of consultations with staff in the emergency department, the trust has
confirmed with the makers of the show - The Garden Productions – that we are very happy
to host them once again to film the next 34 episodes. Those staff affected by the show will
be asked again if they would like to consent to take part.
The show has had a very positive impact on staff and has been used to raise the profile of
the trust for recruitment and public health messaging purposes. We have seen a significant
increase in our social media activity.
55,000 average facebook reaches per week
15% facebook users actively engaged with trust content
60% increase in twitter followers over the past 12 months
500 twitter interactions per each 1hr episode of 24hrs in A&E
5.4 St George’s Day 23rd April 2015
Thursday 23rd April was St George’s Day and we asked patients to help us mark the day by
telling us why St George’s Hospital is special to them. This also put them in the running to
win a trip to the Helipad.
The competition launched at 9am on 17th April and closed at 5pm on St George’s Day.
Within the first two hours of launching, we received 15 tweets or Facebook posts with
pictures of children born at the trust and images and comments about family members
whose lives our staff have saved.
https://www.stgeorges.nhs.uk/
5.5 The Nelson Health Centre The trust has been appointed by Merton Clinical Commissioning Group (CCG) to provide a range of specialist consultation and diagnostic services at the Nelson Local Care Centre in Merton. The Centre opened on 1st April 2015 and has started providing services. Additionally the trust is working in partnership with Moorfields Eye Hospital NHS Foundation Trust to provide ophthalmology services. The contract runs for 5 years.
TB April 15-01
10
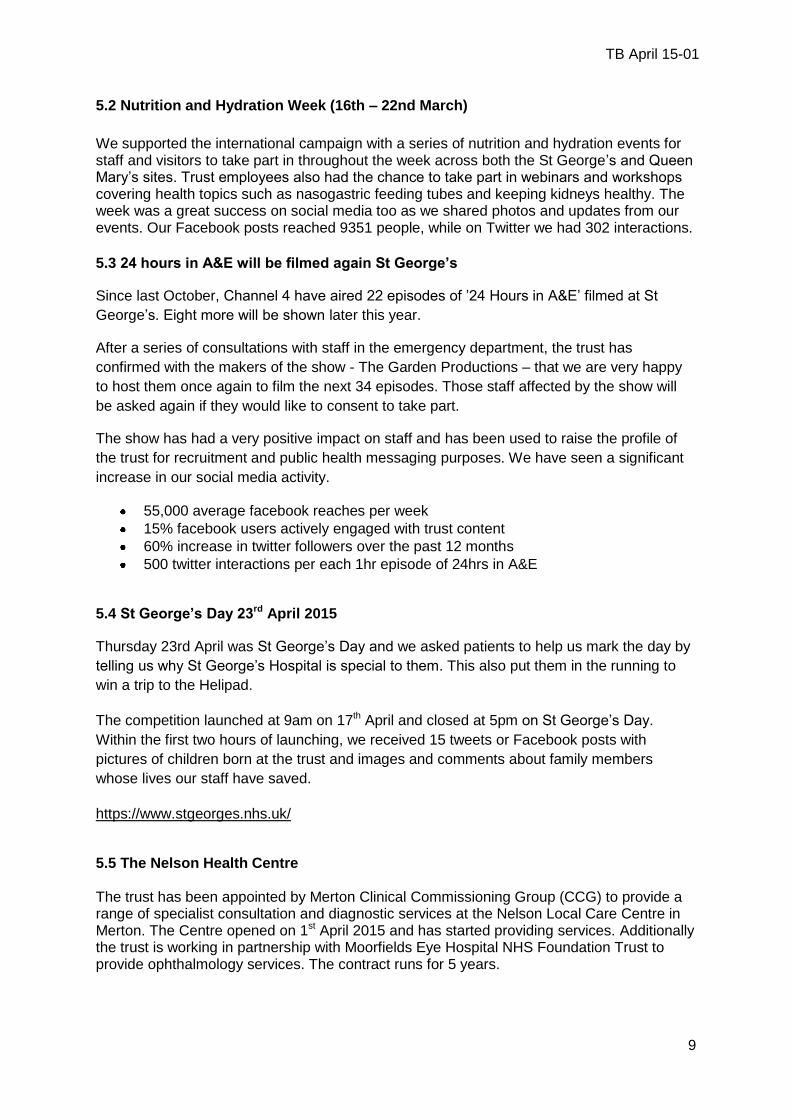
5.6 News and media
ED consultant Will Glazebrook was interviewed by a BBC documentary filming crew
about his role in Mark McQuoid’s treatment. Mark was the patient who was brought
to St George’s after suffering an angle-grinder injury to his chest. Will’s interview will
feature in BBC’s ‘Rapid Response’ this summer.
Henry Marsh was interviewed about his book ‘Do No Harm’ which is being published
in Germany. The filming crew interviewed Henry at home and at St George’s in order
to get an insight into the man behind the job. It will be shown on German national
news.
MacMillan were on site to filming a national advert about putting charity donations in
one’s will. They will be crediting the hospital in this video and we will share it when it
becomes available.
‘Britain’s Got More Talent’ released their rap advertisement which was partly filmed
on St George’s helipad. We shared this on social media and were interviewed about
it for the South West Londoner.
We published an article about the new anti-gravity treadmill we purchased after
raising money through the Sky1 ‘Critical’ workshop. This story has been picked up by
the local press and will be published shortly.
We published an article about the first ever stroke patient transferred to us via air
ambulance. The speed of transfer is thought to have saved the quality of the patient’s
life. This story was picked up and published by our local press.
We announced our partnership with Premaitha Health, which will make us a centre of
excellence for non-invasive prenatal screening. This was picked up by industrial
press as well as the Mail and Evening Standard.
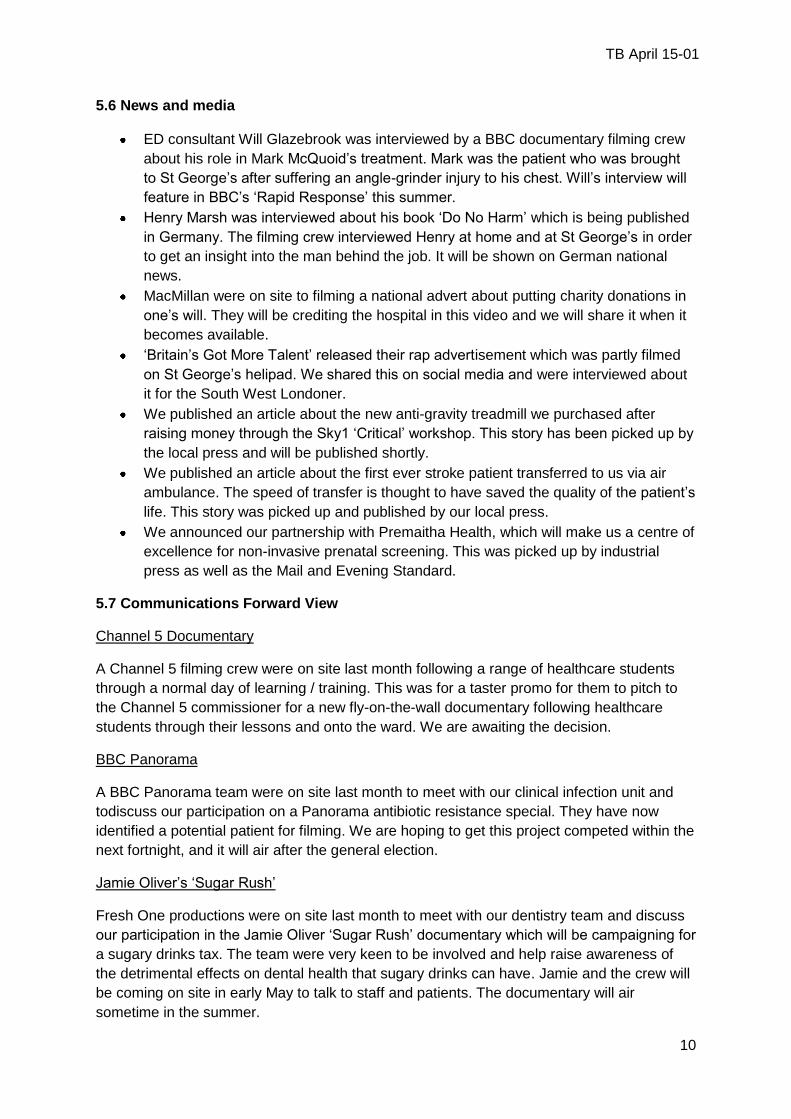
5.7 Communications Forward View
Channel 5 Documentary
A Channel 5 filming crew were on site last month following a range of healthcare students
through a normal day of learning / training. This was for a taster promo for them to pitch to
the Channel 5 commissioner for a new fly-on-the-wall documentary following healthcare
students through their lessons and onto the ward. We are awaiting the decision.
BBC Panorama
A BBC Panorama team were on site last month to meet with our clinical infection unit and
todiscuss our participation on a Panorama antibiotic resistance special. They have now
identified a potential patient for filming. We are hoping to get this project competed within the
next fortnight, and it will air after the general election.
Jamie Oliver’s ‘Sugar Rush’
Fresh One productions were on site last month to meet with our dentistry team and discuss
our participation in the Jamie Oliver ‘Sugar Rush’ documentary which will be campaigning for
a sugary drinks tax. The team were very keen to be involved and help raise awareness of
the detrimental effects on dental health that sugary drinks can have. Jamie and the crew will
be coming on site in early May to talk to staff and patients. The documentary will air
sometime in the summer.

TB April 15-02a
REPORT TO THE TRUST BOARD Paper Title: Quality and performance Report to the Board for
Month 12- March 2015
Sponsoring Director:
Jennie Hall- Chief Nurse/ Director Infection Prevention and Control Simon MacKenzie- Medical Director Steve Bolam- Director Finance/ Performance and Informatics/ Deputy CEO
Authors: Jennie Hall- Chief Nurse/ DIPC Simon Mackenzie- Medical Director Matt Laundy- Infection Control Lead Corporate Nursing Team Divisional Directors Nursing/ Governance Trust Safeguarding Leads Steve Bolam- Director Finance/ Performance and Informatics/ Deputy CEO
Purpose:
To inform the Board about Quality and Operational Performance for Month 10.
Action required by the board:
To note the report and key areas of risk noted.
Document previously considered by:
Finance and Performance Committee Quality and Risk Committee
Executive summary Performance Performance is reported through a number of key performance indicators (KPIs) as per Monitor Risk Assessment Framework and to maintain consistency for 2014/15 reporting to year end the TDA Accountability Framework. The trust is performing positively against these frameworks. The trust shows a quality governance score against Monitor risk assessment framework of 3 which is ‘Amber-Red’ and a self-assessment shows a quality score of 4 against NTDA accountability framework which signifies that no intervention is required and The report lists by exception those indicators that are being underachieved and provides reasons why target have not been met, remedial actions being taken and forecasted dates for
when performance is expected to be back on target. Key Points of Note for the Board in relation to March Quality Performance: The Overall position in March indicates that some progress has been made against some Quality Metrics but that there are some early trends in relation to the Mortality profile and Serious Incident numbers which need to be closely monitored alongside other metrics. The Quality report format is being reviewed to ensure that the report supports clear identification of trends and issues and that there is ability to benchmark against national/ international peers going forward. Effectiveness Domain:
Mortality and SHMI performance remains statistically better than expected for the Trust. Despite this position we continue to proactively investigate mortality signals at procedure

TB April 15-02a
and diagnosis level. From March Dr Foster have changed the platform to support different profiles for the data, within the Quality report there is an annual and monthly figure which is now available. Both these figures indicate a slight increase which is not a significant concern but does support the requirement to proactively review signals and review the mortality trend alongside other Quality Indicators.
There are a range of Audits within the Report. These include a National audit regarding intermediate care services at Wandsworth. The findings indicate that the Service compared favourably with the majority of indicators but in relation to involvement of patients in decisions regarding their care there is room for improvement. Local Audits in relation to pressure Ulcer Prevention, Venous Access Device and Intravenous Drug Administration are included. The local audits demonstrate progress across a number of areas but also indicate there is further work to progress in imbedding consistent standards across the Trust. All audits have action plans which will be monitored by the appropriate forum. For a number of the local audits this will be the Nursing and Midwifery Board.
The report indicates the position with compliance with NICE guidance and the action being taken to decrease the number of outstanding items.
Safety Domain:
The number of general reported incidents in March indicates a similar profile to previous months with a similar trend in terms of numbers and level of harm. The Board should note that the trend for Serious Incidents indicates an on-going increase. Of the 18 declared the Board will note that the timeline of when the incident occurred ranges between November and March. The issues are across a range of clinical issues, some are mandatory in terms of reporting. A further never event has been reported this month regarding wrong site surgery; the Trust has concluded a panel review of previous incidents with recommendations for further work. Progress against the recommendations is being overseen by the Chief Nurse/ Medical Director.
Safety Thermometer performance decreased slightly from February performance. There was an increase in patients with old pressure ulcers within this month and slight increase in new pressure ulcers. This is the second consecutive month that this has occurred. Focussed work streams will continue to support improved performance i.e. pressure ulcers, falls and VTE assessment.
The pressure ulcer profile for March reduced slightly from the February position in terms of grade 3 and 4 ulcers with an increase in grade 2 ulcers. As previously reported to the board a deep dive review has already been completed within both the Surgical and Community Divisions where a number of the Ulcers occurred and actions are being taken forward. The actions include training, use of safety approaches such as “hotspots” to raise awareness and roll out of preventative strategies. The RCA analysis has yet to be completed to understand if the ulcers were avoidable or unavoidable.
The VTE profile is largely unchanged. However the Trust has experienced issues with the recording of VTE risk assessments in areas where the roll out of ICLip has occurred. This adversely impacted on performance but importantly there is a need to ensure patients are appropriately screened. Actions are in place to address this issue, the board will note that the Risk Assessment levels have increased for the last 2 months which is positive.
The Trust has now reported 6 MRSA bacteraemia cases and 38 C-Difficile to the end of March. The most recent MRSA case related to a patient who had a sternal wound infection. The RCA is currently being undertaken. Focus is being placed on existing actions within the Trust i.e. hand hygiene compliance, antibiotic prescribing and prompt isolation. The profile will continue to be closely monitored.
Safeguarding Adults activity across Paediatrics and Adults is significant. The Training profile for Safeguarding Children remains a risk given the activity profile, and number of SCR cases that the Trust is involved with across a number of boroughs. Focus is being placed on further action to improve training compliance particularly at level 3.
Experience Domain:
TB April 15-02a
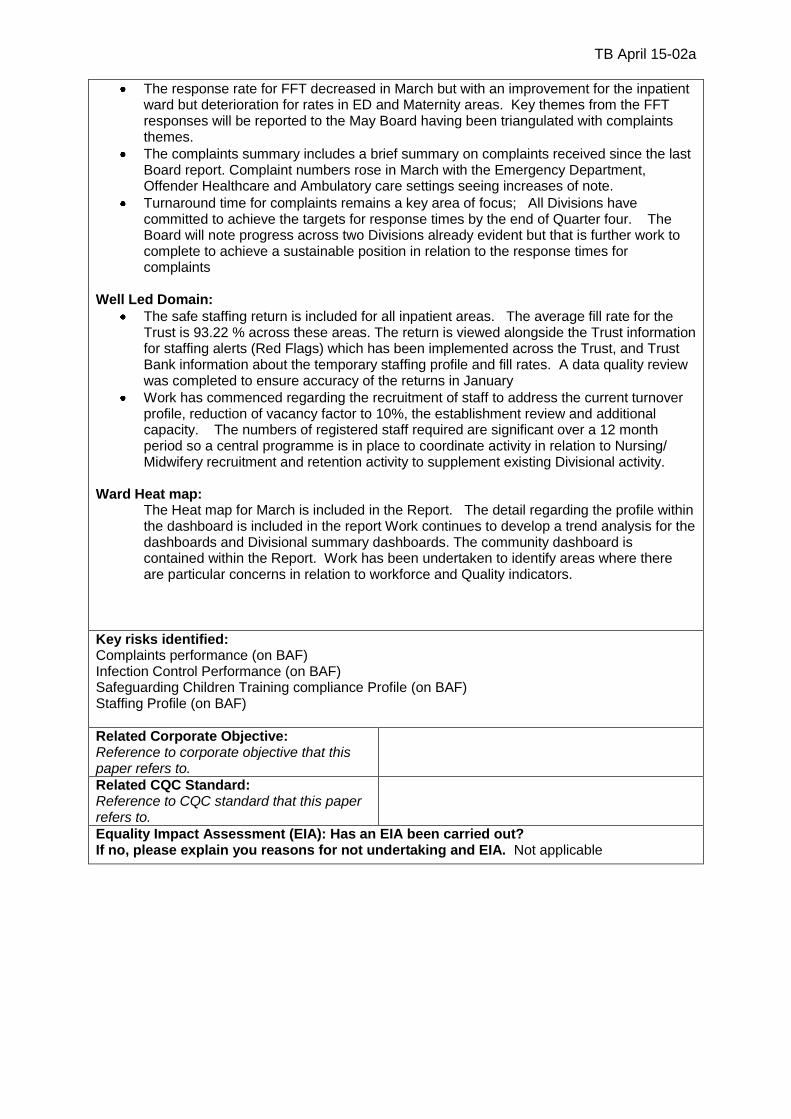
The response rate for FFT decreased in March but with an improvement for the inpatient ward but deterioration for rates in ED and Maternity areas. Key themes from the FFT responses will be reported to the May Board having been triangulated with complaints themes.
The complaints summary includes a brief summary on complaints received since the last Board report. Complaint numbers rose in March with the Emergency Department, Offender Healthcare and Ambulatory care settings seeing increases of note.
Turnaround time for complaints remains a key area of focus; All Divisions have committed to achieve the targets for response times by the end of Quarter four. The Board will note progress across two Divisions already evident but that is further work to complete to achieve a sustainable position in relation to the response times for complaints
Well Led Domain:
The safe staffing return is included for all inpatient areas. The average fill rate for the Trust is 93.22 % across these areas. The return is viewed alongside the Trust information for staffing alerts (Red Flags) which has been implemented across the Trust, and Trust Bank information about the temporary staffing profile and fill rates. A data quality review was completed to ensure accuracy of the returns in January
Work has commenced regarding the recruitment of staff to address the current turnover profile, reduction of vacancy factor to 10%, the establishment review and additional capacity. The numbers of registered staff required are significant over a 12 month period so a central programme is in place to coordinate activity in relation to Nursing/ Midwifery recruitment and retention activity to supplement existing Divisional activity.
Ward Heat map:
The Heat map for March is included in the Report. The detail regarding the profile within the dashboard is included in the report Work continues to develop a trend analysis for the dashboards and Divisional summary dashboards. The community dashboard is contained within the Report. Work has been undertaken to identify areas where there are particular concerns in relation to workforce and Quality indicators.
Key risks identified: Complaints performance (on BAF) Infection Control Performance (on BAF) Safeguarding Children Training compliance Profile (on BAF) Staffing Profile (on BAF)
Related Corporate Objective: Reference to corporate objective that this paper refers to.
Related CQC Standard: Reference to CQC standard that this paper refers to.
Equality Impact Assessment (EIA): Has an EIA been carried out? If no, please explain you reasons for not undertaking and EIA. Not applicable

Performance & Quality Report
Trust Board Month 12 – March 2015
1

2
SECTION CONTENT PAGE
1 Executive Summary 3
2 Performance against Frameworks
Monitor Risk Assessment Overview 5
TDA Accountability Framework Overview
6
3 Performance – Areas of Escalation
A&E : 4 Hour Standard 8
RTT : Incomplete 52+ Week Waiters 9
Cancer Waits- 62 Day Standard 10
Cancelled Operations 11
4 Divisional KPIs 13
5 Corporate Outpatient Performance 14
Performance Overview Dashboard 15
Key Messages 16
6 Clinical Audit and Effectiveness
Mortality 18
Clinical Audits 19
CONTENTS
SECTION CONTENT PAGE
7 Patient Safety
Incident Profile – Sis 26
Safety Thermometer 27
Incident Profile – Pressure Ulcers 28
Infection Control 29
Incident Profile - Falls 30
VTE 31
Safeguarding: Children 32
Safeguarding: Adults 33
8 Patient Experience
Friends and Family Test 35
Complaints 36
9 Workforce
Safe Staffing profile for inpatient areas 40
Safe Staffing Alerts 41
10 Heatmap Dashboard
Ward Heatmaps 44
11 Community Services Scorecard 48
3
Responsiveness
RTT
A&E
Cancer Targets
Cancelled Ops
Learning Disabilities
Safe
IC: MRSA & C-Diff
VTE
Harm CAS Alerts
Never Events
SIs
Caring
FFT
Inpatients
Complaints Same Sex
Compliance
FFT
A&E
Effectiveness
Mortality
HSMR
Mortality HSMR
Weekend
Weekday Re-admissions
Mortality
SHMI
Well Led
Staff turnover
Staff Sickness
Vacancy Rate Staff
Appraisals
Agency and Bank
Usage
FFT
Response rates
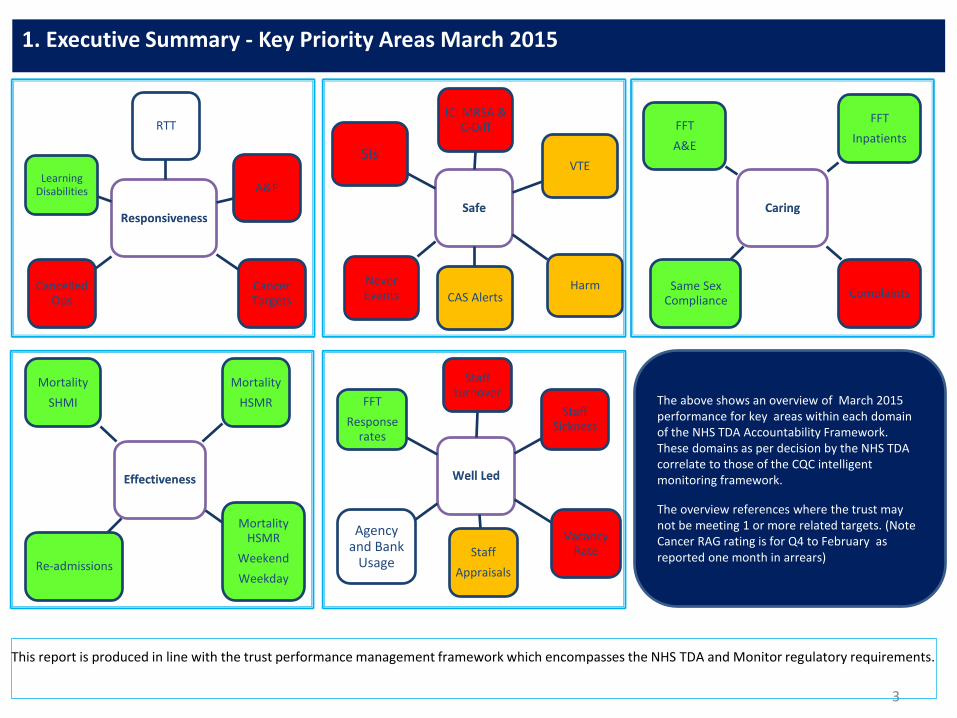
1. Executive Summary - Key Priority Areas March 2015
This report is produced in line with the trust performance management framework which encompasses the NHS TDA and Monitor regulatory requirements.
The above shows an overview of March 2015 performance for key areas within each domain of the NHS TDA Accountability Framework. These domains as per decision by the NHS TDA correlate to those of the CQC intelligent monitoring framework.
The overview references where the trust may not be meeting 1 or more related targets. (Note Cancer RAG rating is for Q4 to February as reported one month in arrears)
Performance against Frameworks
5
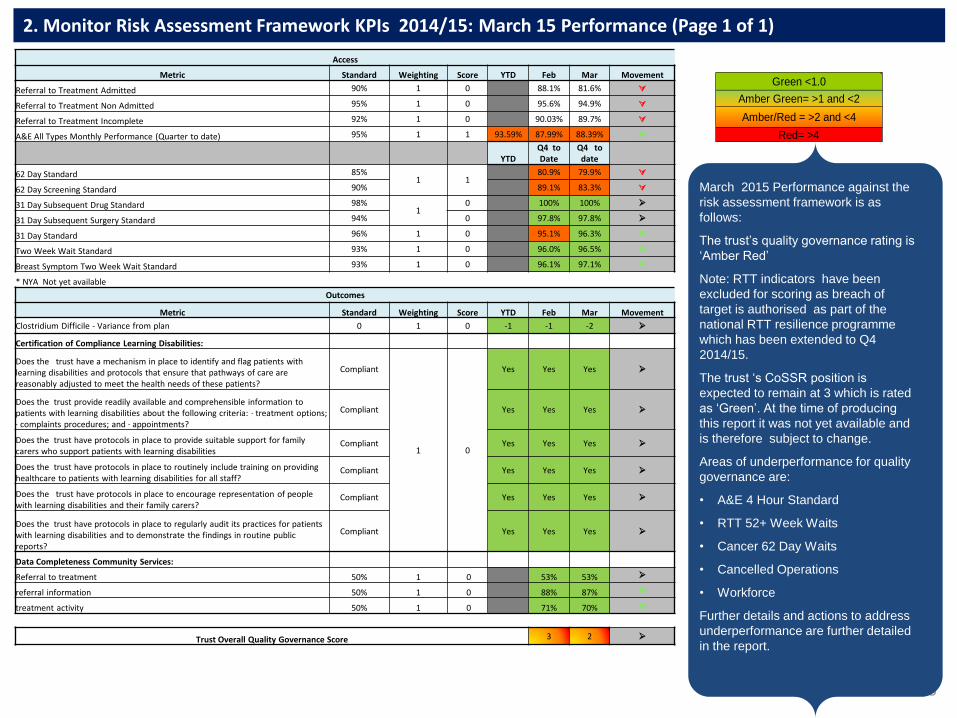
2. Monitor Risk Assessment Framework KPIs 2014/15: March 15 Performance (Page 1 of 1)
March 2015 Performance against the
risk assessment framework is as
follows:
The trust’s quality governance rating is
‘Amber Red’
Note: RTT indicators have been
excluded for scoring as breach of
target is authorised as part of the
national RTT resilience programme
which has been extended to Q4
2014/15.
The trust ‘s CoSSR position is
expected to remain at 3 which is rated
as ‘Green’. At the time of producing
this report it was not yet available and
is therefore subject to change.
Areas of underperformance for quality
governance are:
• A&E 4 Hour Standard
• RTT 52+ Week Waits
• Cancer 62 Day Waits
• Cancelled Operations
• Workforce
Further details and actions to address
underperformance are further detailed
in the report.
Green <1.0
Amber Green= >1 and <2
Amber/Red = >2 and <4
Red= >4
Access
Metric Standard Weighting Score YTD Feb Mar Movement
Referral to Treatment Admitted 90% 1 0 88.1% 81.6%
Referral to Treatment Non Admitted 95% 1 0 95.6% 94.9%
Referral to Treatment Incomplete 92% 1 0 90.03% 89.7%
A&E All Types Monthly Performance (Quarter to date) 95% 1 1 93.59% 87.99% 88.39%
YTD Q4 to Date
Q4 to date
62 Day Standard 85% 1 1
80.9% 79.9%
62 Day Screening Standard 90% 89.1% 83.3%
31 Day Subsequent Drug Standard 98% 1
0 100% 100%
31 Day Subsequent Surgery Standard 94% 0 97.8% 97.8%
31 Day Standard 96% 1 0 95.1% 96.3%
Two Week Wait Standard 93% 1 0 96.0% 96.5%
Breast Symptom Two Week Wait Standard 93% 1 0 96.1% 97.1%
* NYA Not yet available
Outcomes
Metric Standard Weighting Score YTD Feb Mar Movement
Clostridium Difficile - Variance from plan 0 1 0 -1 -1 -2
Certification of Compliance Learning Disabilities:
Does the trust have a mechanism in place to identify and flag patients with learning disabilities and protocols that ensure that pathways of care are reasonably adjusted to meet the health needs of these patients?
Compliant
1 0
Yes Yes Yes
Does the trust provide readily available and comprehensible information to patients with learning disabilities about the following criteria: · treatment options; · complaints procedures; and · appointments?
Compliant Yes Yes Yes
Does the trust have protocols in place to provide suitable support for family carers who support patients with learning disabilities
Compliant Yes Yes Yes
Does the trust have protocols in place to routinely include training on providing healthcare to patients with learning disabilities for all staff?
Compliant Yes Yes Yes
Does the trust have protocols in place to encourage representation of people with learning disabilities and their family carers?
Compliant Yes Yes Yes
Does the trust have protocols in place to regularly audit its practices for patients with learning disabilities and to demonstrate the findings in routine public reports?
Compliant Yes Yes Yes
Data Completeness Community Services:
Referral to treatment 50% 1 0 53% 53%
referral information 50% 1 0 88% 87%
treatment activity 50% 1 0 71% 70%
Trust Overall Quality Governance Score 3 2
6
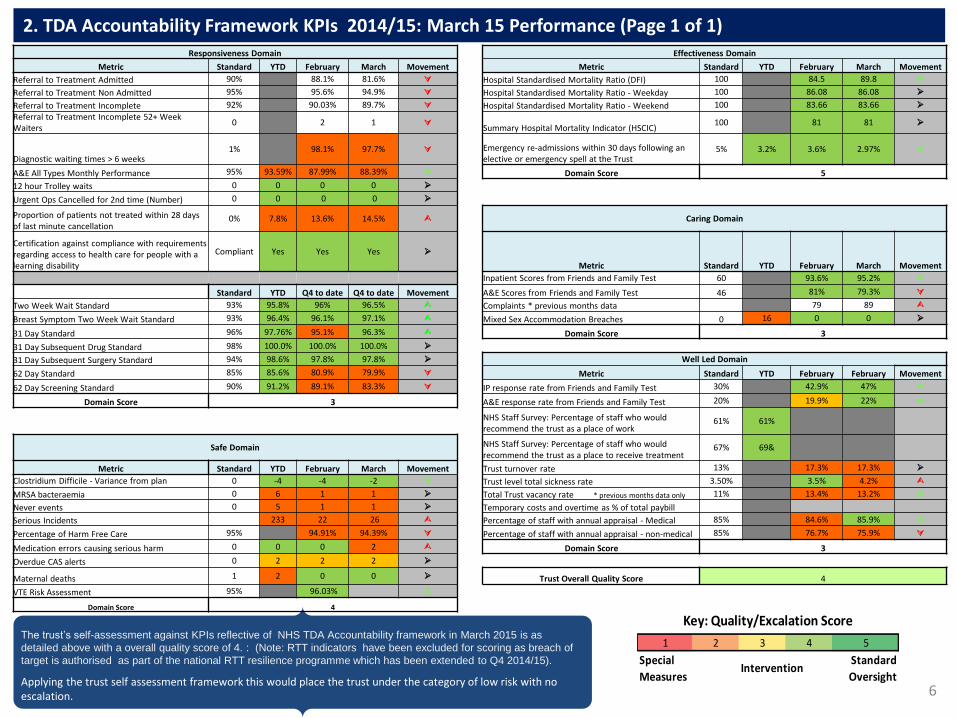
2. TDA Accountability Framework KPIs 2014/15: March 15 Performance (Page 1 of 1)
The trust’s self-assessment against KPIs reflective of NHS TDA Accountability framework in March 2015 is as
detailed above with a overall quality score of 4. : (Note: RTT indicators have been excluded for scoring as breach of
target is authorised as part of the national RTT resilience programme which has been extended to Q4 2014/15).
Applying the trust self assessment framework this would place the trust under the category of low risk with no escalation. .
1 2 3 4 5
Special
MeasuresIntervention
Standard
Oversight
Key: Quality/Excalation Score
Responsiveness Domain Effectiveness Domain
Metric Standard YTD February March Movement Metric Standard YTD February March Movement
Referral to Treatment Admitted 90% 88.1% 81.6% Hospital Standardised Mortality Ratio (DFI) 100 84.5 89.8
Referral to Treatment Non Admitted 95% 95.6% 94.9% Hospital Standardised Mortality Ratio - Weekday 100 86.08 86.08
Referral to Treatment Incomplete 92% 90.03% 89.7% Hospital Standardised Mortality Ratio - Weekend 100 83.66 83.66
Referral to Treatment Incomplete 52+ Week Waiters
0 2 1 Summary Hospital Mortality Indicator (HSCIC)
100 81 81
Diagnostic waiting times > 6 weeks 1% 98.1% 97.7% Emergency re-admissions within 30 days following an
elective or emergency spell at the Trust 5% 3.2% 3.6% 2.97%
A&E All Types Monthly Performance 95% 93.59% 87.99% 88.39% Domain Score 5
12 hour Trolley waits 0 0 0 0
Urgent Ops Cancelled for 2nd time (Number) 0 0 0 0
Proportion of patients not treated within 28 days of last minute cancellation
0% 7.8% 13.6% 14.5% Caring Domain
Certification against compliance with requirements regarding access to health care for people with a learning disability
Compliant Yes Yes Yes
Metric Standard YTD February March Movement
Inpatient Scores from Friends and Family Test 60 93.6% 95.2%
Standard YTD Q4 to date Q4 to date Movement A&E Scores from Friends and Family Test 46 81% 79.3%
Two Week Wait Standard 93% 95.8% 96% 96.5% Complaints * previous months data 79 89
Breast Symptom Two Week Wait Standard 93% 96.4% 96.1% 97.1% Mixed Sex Accommodation Breaches 0 16 0 0
31 Day Standard 96% 97.76% 95.1% 96.3% Domain Score 3
31 Day Subsequent Drug Standard 98% 100.0% 100.0% 100.0%
31 Day Subsequent Surgery Standard 94% 98.6% 97.8% 97.8% Well Led Domain
62 Day Standard 85% 85.6% 80.9% 79.9% Metric Standard YTD February February Movement
62 Day Screening Standard 90% 91.2% 89.1% 83.3% IP response rate from Friends and Family Test 30% 42.9% 47%
Domain Score 3 A&E response rate from Friends and Family Test 20% 19.9% 22%
NHS Staff Survey: Percentage of staff who would recommend the trust as a place of work
61% 61%
Safe Domain NHS Staff Survey: Percentage of staff who would recommend the trust as a place to receive treatment
67% 69&
Metric Standard YTD February March Movement Trust turnover rate 13% 17.3% 17.3%
Clostridium Difficile - Variance from plan 0 -4 -4 -2 Trust level total sickness rate 3.50% 3.5% 4.2%
MRSA bacteraemia 0 6 1 1 Total Trust vacancy rate * previous months data only 11% 13.4% 13.2%
Never events 0 5 1 1 Temporary costs and overtime as % of total paybill
Serious Incidents 233 22 26 Percentage of staff with annual appraisal - Medical 85% 84.6% 85.9%
Percentage of Harm Free Care 95% 94.91% 94.39% Percentage of staff with annual appraisal - non-medical 85% 76.7% 75.9%
Medication errors causing serious harm 0 0 0 2 Domain Score 3
Overdue CAS alerts 0 2 2 2
Maternal deaths 1 2 0 0 Trust Overall Quality Score 4
VTE Risk Assessment 95% 96.03%
Domain Score 4

Performance – areas of escalation
8
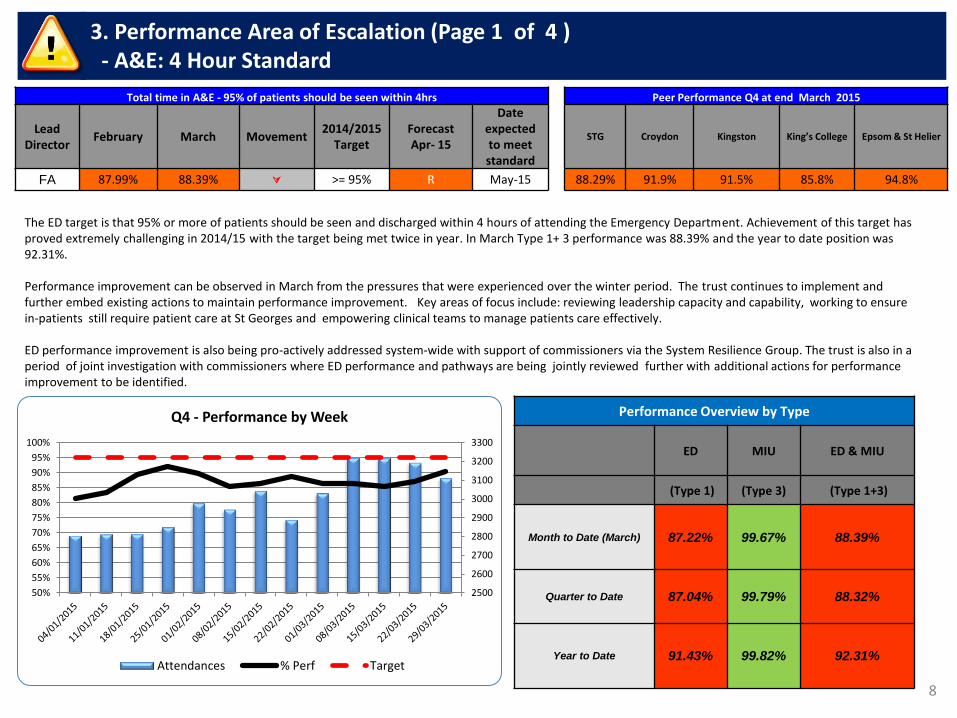
3. Performance Area of Escalation (Page 1 of 4 ) - A&E: 4 Hour Standard
Total time in A&E - 95% of patients should be seen within 4hrs Peer Performance Q4 at end March 2015
Lead
Director February March Movement
2014/2015 Target
Forecast Apr- 15
Date expected to meet standard
STG Croydon Kingston King’s College Epsom & St Helier
FA 87.99% 88.39% >= 95% R May-15 88.29% 91.9% 91.5% 85.8% 94.8%
The ED target is that 95% or more of patients should be seen and discharged within 4 hours of attending the Emergency Department. Achievement of this target has proved extremely challenging in 2014/15 with the target being met twice in year. In March Type 1+ 3 performance was 88.39% and the year to date position was 92.31%. Performance improvement can be observed in March from the pressures that were experienced over the winter period. The trust continues to implement and further embed existing actions to maintain performance improvement. Key areas of focus include: reviewing leadership capacity and capability, working to ensure in-patients still require patient care at St Georges and empowering clinical teams to manage patients care effectively. ED performance improvement is also being pro-actively addressed system-wide with support of commissioners via the System Resilience Group. The trust is also in a period of joint investigation with commissioners where ED performance and pathways are being jointly reviewed further with additional actions for performance improvement to be identified.
Performance Overview by Type
ED MIU ED & MIU
(Type 1) (Type 3) (Type 1+3)
Month to Date (March) 87.22% 99.67% 88.39%
Quarter to Date 87.04% 99.79% 88.32%
Year to Date 91.43% 99.82% 92.31%
2500
2600
2700
2800
2900
3000
3100
3200
3300
50%
55%
60%
65%
70%
75%
80%
85%
90%
95%
100%
Q4 - Performance by Week
Attendances % Perf Target
9
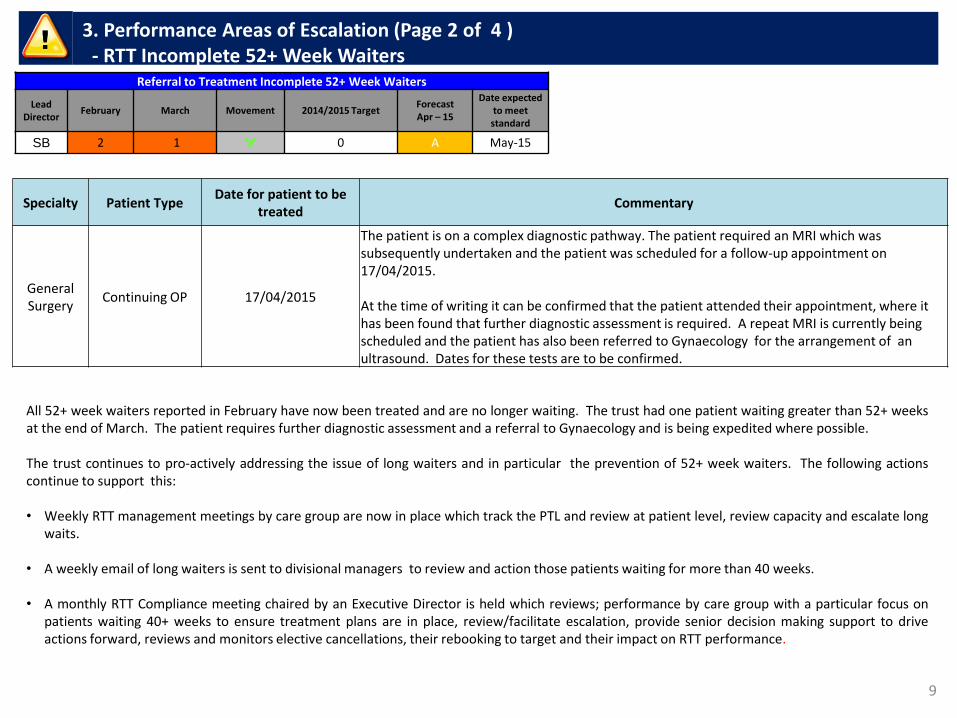
3. Performance Areas of Escalation (Page 2 of 4 ) - RTT Incomplete 52+ Week Waiters
Referral to Treatment Incomplete 52+ Week Waiters
Lead
Director February March Movement 2014/2015 Target
Forecast Apr – 15
Date expected to meet standard
SB 2 1 0 A May-15
All 52+ week waiters reported in February have now been treated and are no longer waiting. The trust had one patient waiting greater than 52+ weeks at the end of March. The patient requires further diagnostic assessment and a referral to Gynaecology and is being expedited where possible. The trust continues to pro-actively addressing the issue of long waiters and in particular the prevention of 52+ week waiters. The following actions continue to support this:
• Weekly RTT management meetings by care group are now in place which track the PTL and review at patient level, review capacity and escalate long
waits.
• A weekly email of long waiters is sent to divisional managers to review and action those patients waiting for more than 40 weeks.
• A monthly RTT Compliance meeting chaired by an Executive Director is held which reviews; performance by care group with a particular focus on patients waiting 40+ weeks to ensure treatment plans are in place, review/facilitate escalation, provide senior decision making support to drive actions forward, reviews and monitors elective cancellations, their rebooking to target and their impact on RTT performance.
Specialty Patient Type Date for patient to be
treated Commentary
General Surgery
Continuing OP 17/04/2015
The patient is on a complex diagnostic pathway. The patient required an MRI which was subsequently undertaken and the patient was scheduled for a follow-up appointment on 17/04/2015. At the time of writing it can be confirmed that the patient attended their appointment, where it has been found that further diagnostic assessment is required. A repeat MRI is currently being scheduled and the patient has also been referred to Gynaecology for the arrangement of an ultrasound. Dates for these tests are to be confirmed.
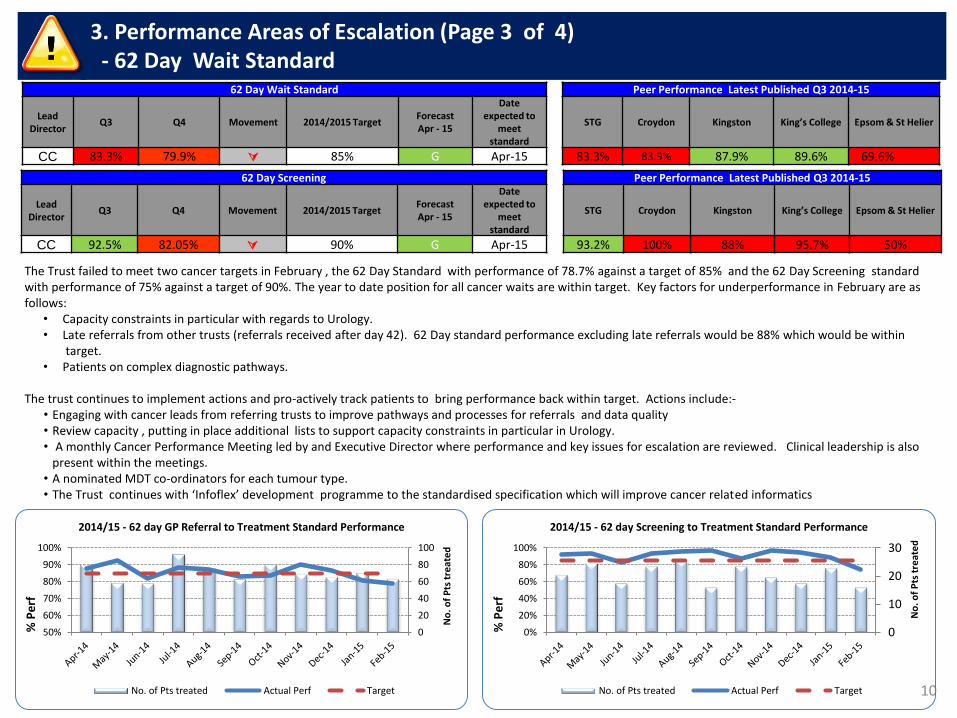
The Trust failed to meet two cancer targets in February , the 62 Day Standard with performance of 78.7% against a target of 85% and the 62 Day Screening standard with performance of 75% against a target of 90%. The year to date position for all cancer waits are within target. Key factors for underperformance in February are as follows:
• Capacity constraints in particular with regards to Urology. • Late referrals from other trusts (referrals received after day 42). 62 Day standard performance excluding late referrals would be 88% which would be within
target. • Patients on complex diagnostic pathways.
The trust continues to implement actions and pro-actively track patients to bring performance back within target. Actions include:-
• Engaging with cancer leads from referring trusts to improve pathways and processes for referrals and data quality • Review capacity , putting in place additional lists to support capacity constraints in particular in Urology. • A monthly Cancer Performance Meeting led by and Executive Director where performance and key issues for escalation are reviewed. Clinical leadership is also
present within the meetings. • A nominated MDT co-ordinators for each tumour type. • The Trust continues with ‘Infoflex’ development programme to the standardised specification which will improve cancer related informatics
10
3. Performance Areas of Escalation (Page 3 of 4) - 62 Day Wait Standard
62 Day Wait Standard Peer Performance Latest Published Q3 2014-15
Lead
Director Q3 Q4 Movement 2014/2015 Target
Forecast Apr - 15
Date expected to
meet standard
STG Croydon Kingston King’s College Epsom & St Helier
CC 83.3% 79.9% 85% G Apr-15 83.3% 83.9% 87.9% 89.6% 69.6%69.9%
62 Day Screening Peer Performance Latest Published Q3 2014-15
Lead
Director Q3 Q4 Movement 2014/2015 Target
Forecast Apr - 15
Date expected to
meet standard
STG Croydon Kingston King’s College Epsom & St Helier
CC 92.5% 82.05% 90% G Apr-15 93.2% 100% 88% 95.7% 50%
0
20
40
60
80
100
50%
60%
70%
80%
90%
100%
No
. of
Pts
tre
ate
d
% P
erf
2014/15 - 62 day GP Referral to Treatment Standard Performance
No. of Pts treated Actual Perf Target
0
10
20
30
0%
20%
40%
60%
80%
100%
No
. of
Pts
tre
ate
d
% P
erf
2014/15 - 62 day Screening to Treatment Standard Performance
No. of Pts treated Actual Perf Target
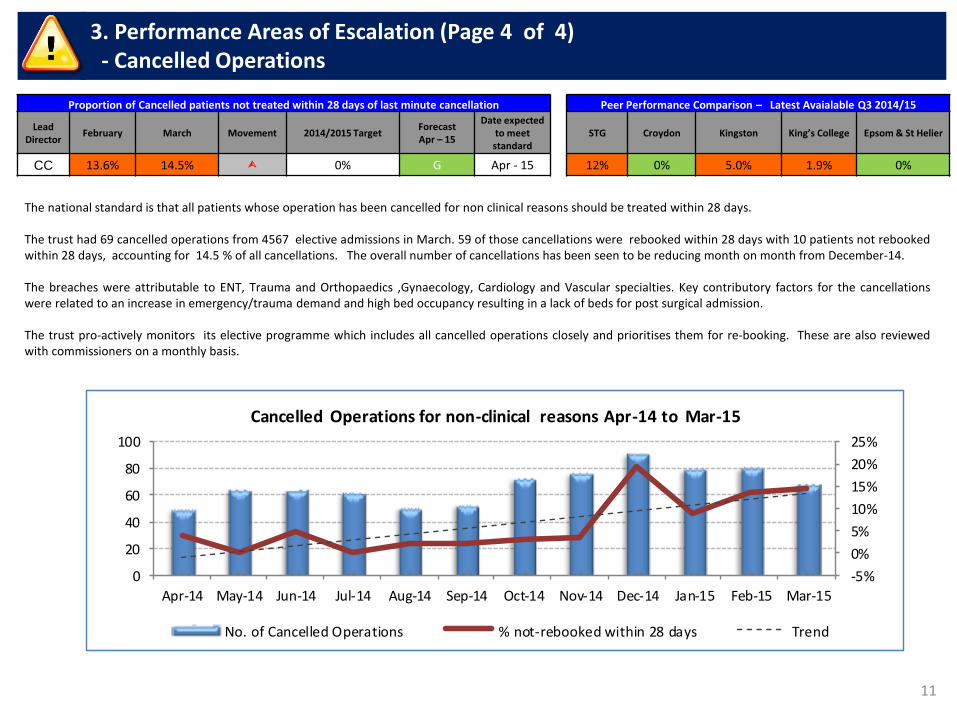
11
3. Performance Areas of Escalation (Page 4 of 4) - Cancelled Operations
Proportion of Cancelled patients not treated within 28 days of last minute cancellation Peer Performance Comparison – Latest Avaialable Q3 2014/15
Lead
Director February March Movement 2014/2015 Target
Forecast Apr – 15
Date expected to meet standard
STG Croydon Kingston King’s College Epsom & St Helier
CC 13.6% 14.5% 0% G Apr - 15 12% 0% 5.0% 1.9% 0%
The national standard is that all patients whose operation has been cancelled for non clinical reasons should be treated within 28 days. The trust had 69 cancelled operations from 4567 elective admissions in March. 59 of those cancellations were rebooked within 28 days with 10 patients not rebooked within 28 days, accounting for 14.5 % of all cancellations. The overall number of cancellations has been seen to be reducing month on month from December-14. The breaches were attributable to ENT, Trauma and Orthopaedics ,Gynaecology, Cardiology and Vascular specialties. Key contributory factors for the cancellations were related to an increase in emergency/trauma demand and high bed occupancy resulting in a lack of beds for post surgical admission. The trust pro-actively monitors its elective programme which includes all cancelled operations closely and prioritises them for re-booking. These are also reviewed with commissioners on a monthly basis.
-5%
0%
5%
10%
15%
20%
25%
0
20
40
60
80
100
Apr-14 May-14 Jun-14 Jul-14 Aug-14 Sep-14 Oct-14 Nov-14 Dec-14 Jan-15 Feb-15 Mar-15
Cancelled Operations for non-clinical reasons Apr-14 to Mar-15
No. of Cancelled Operations % not-rebooked within 28 days Trend
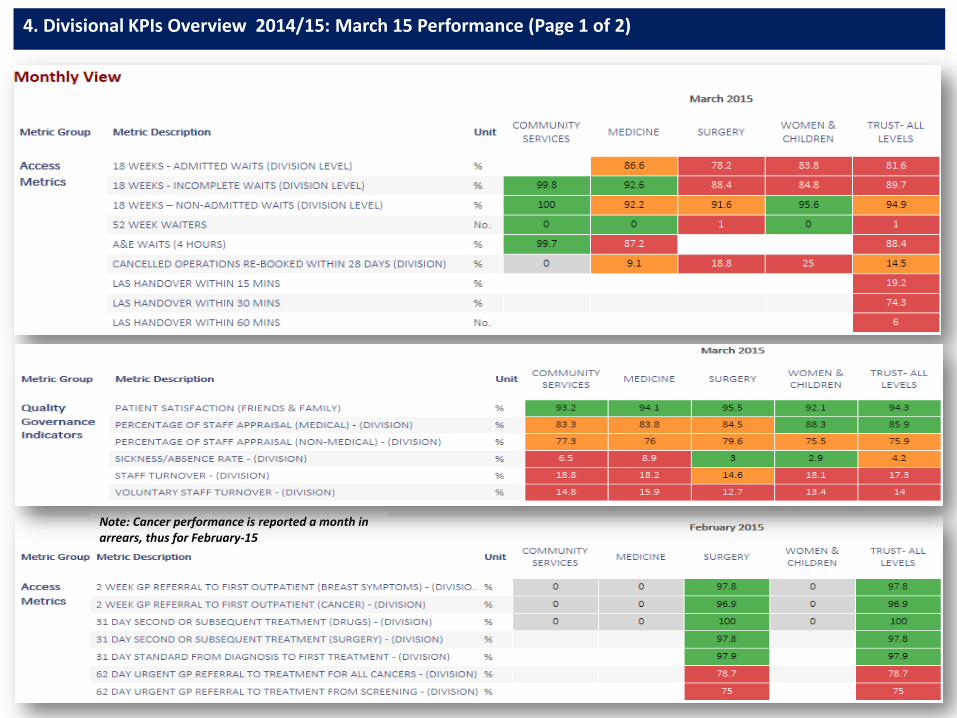
4. Divisional KPIs Overview 2014/15: March 15 Performance (Page 1 of 2)
Note: Cancer performance is reported a month in arrears, thus for February-15
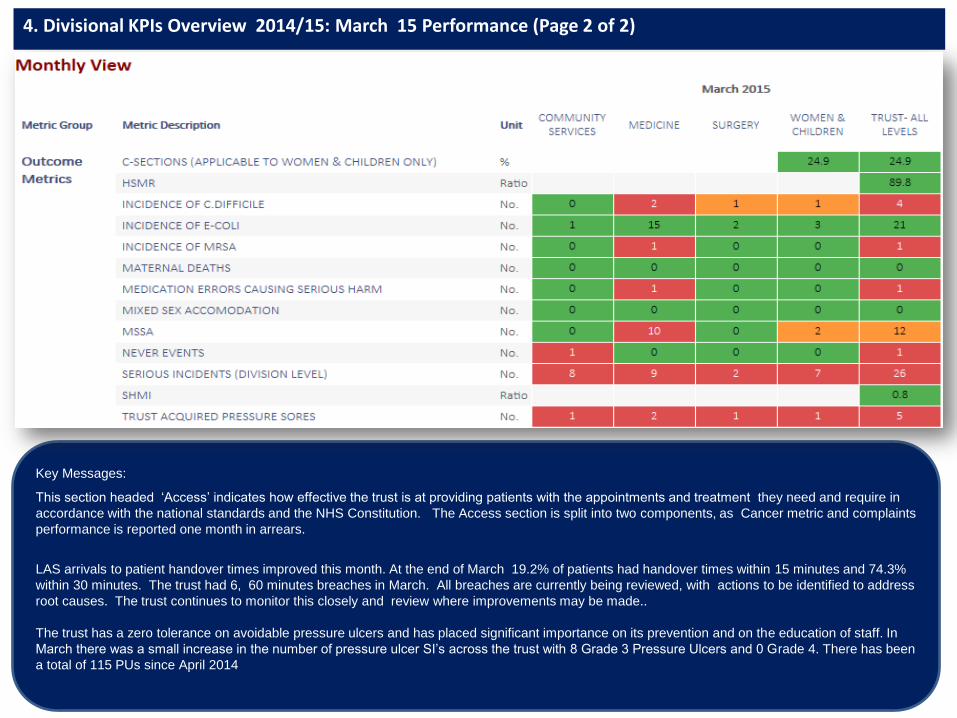
4. Divisional KPIs Overview 2014/15: March 15 Performance (Page 2 of 2)
Key Messages:
This section headed ‘Access’ indicates how effective the trust is at providing patients with the appointments and treatment they need and require in
accordance with the national standards and the NHS Constitution. The Access section is split into two components, as Cancer metric and complaints
performance is reported one month in arrears.
LAS arrivals to patient handover times improved this month. At the end of March 19.2% of patients had handover times within 15 minutes and 74.3%
within 30 minutes. The trust had 6, 60 minutes breaches in March. All breaches are currently being reviewed, with actions to be identified to address
root causes. The trust continues to monitor this closely and review where improvements may be made..
The trust has a zero tolerance on avoidable pressure ulcers and has placed significant importance on its prevention and on the education of staff. In
March there was a small increase in the number of pressure ulcer SI’s across the trust with 8 Grade 3 Pressure Ulcers and 0 Grade 4. There has been
a total of 115 PUs since April 2014
Corporate Outpatient Services Performance

15
5. Corporate Outpatient Services (1 of 2) - Performance Overview
0%
5%
10%
15%
0
20000
40000
60000
80000
Activity - OP Attendances and DNA's
Total attendances DNA DNA Target
0.0%
0.2%
0.4%
0.6%
0.8%
1.0%Outpatients - Hospital Cancellations < 6 Weeks
Hospital cancellations <6 weeks
70%
80%
90%
100%
OP Department Performance - Permanent notes to clinic
Permanent notes to clinic Target
94%
96%
98%
100%
OP Department Performance - Cashing up Clinics Current Month Performance
Cashing up - Current month Target
96%
98%
100%
102%
OP Department Performance - Cashing up Clinics Previous Month
Cashing up - Previous month Target
00:00
04:48
09:36
14:24
19:12
00:00
0
10000
20000
30000
40000
50000
Re
spo
nse
Tim
e (
min
)
Tota
l Cal
ls
Call Centre Performance
Total calls Abandoned calls Average response time
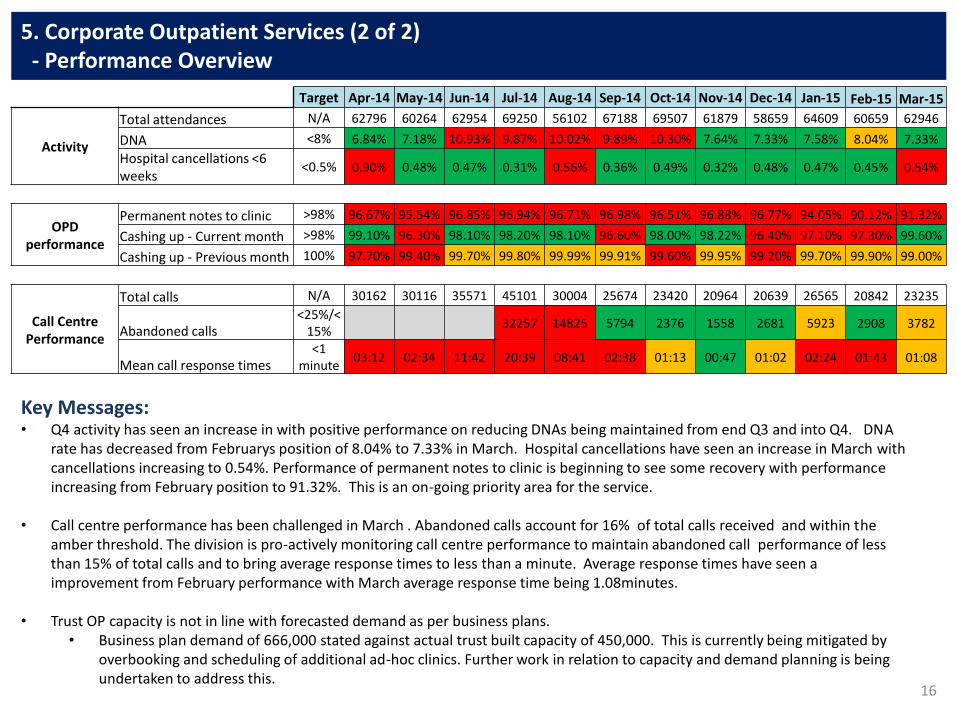
16
5. Corporate Outpatient Services (2 of 2) - Performance Overview
Key Messages: • Q4 activity has seen an increase in with positive performance on reducing DNAs being maintained from end Q3 and into Q4. DNA
rate has decreased from Februarys position of 8.04% to 7.33% in March. Hospital cancellations have seen an increase in March with cancellations increasing to 0.54%. Performance of permanent notes to clinic is beginning to see some recovery with performance increasing from February position to 91.32%. This is an on-going priority area for the service.
• Call centre performance has been challenged in March . Abandoned calls account for 16% of total calls received and within the amber threshold. The division is pro-actively monitoring call centre performance to maintain abandoned call performance of less than 15% of total calls and to bring average response times to less than a minute. Average response times have seen a improvement from February performance with March average response time being 1.08minutes.
• Trust OP capacity is not in line with forecasted demand as per business plans. • Business plan demand of 666,000 stated against actual trust built capacity of 450,000. This is currently being mitigated by
overbooking and scheduling of additional ad-hoc clinics. Further work in relation to capacity and demand planning is being undertaken to address this.
Target Apr-14 May-14 Jun-14 Jul-14 Aug-14 Sep-14 Oct-14 Nov-14 Dec-14 Jan-15 Feb-15 Mar-15
Activity
Total attendances N/A 62796 60264 62954 69250 56102 67188 69507 61879 58659 64609 60659 62946
DNA <8% 6.84% 7.18% 10.93% 9.87% 10.02% 9.89% 10.30% 7.64% 7.33% 7.58% 8.04% 7.33%
Hospital cancellations <6 weeks
<0.5% 0.90% 0.48% 0.47% 0.31% 0.56% 0.36% 0.49% 0.32% 0.48% 0.47% 0.45% 0.54%
OPD performance
Permanent notes to clinic >98% 96.67% 95.54% 96.85% 96.94% 96.71% 96.98% 96.51% 96.88% 96.77% 94.05% 90.12% 91.32%
Cashing up - Current month >98% 99.10% 96.30% 98.10% 98.20% 98.10% 96.60% 98.00% 98.22% 96.40% 97.10% 97.30% 99.60%
Cashing up - Previous month 100% 97.70% 99.40% 99.70% 99.80% 99.99% 99.91% 99.60% 99.95% 99.20% 99.70% 99.90% 99.00%
Call Centre Performance
Total calls N/A 30162 30116 35571 45101 30004 25674 23420 20964 20639 26565 20842 23235
Abandoned calls <25%/<
15% 32257 14825 5794 2376 1558 2681 5923 2908 3782
Mean call response times <1
minute 03:12 02:34 11:42 20:39 08:41 02:38 01:13 00:47 01:02 02:24 01:43 01:08
Clinical Audit and Effectiveness
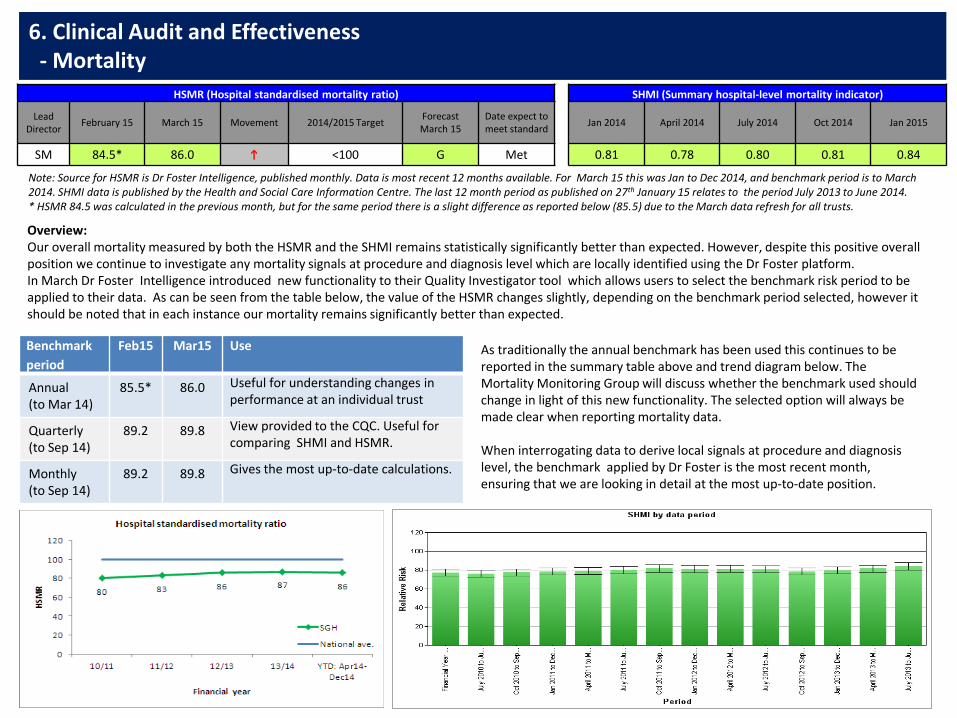
6. Clinical Audit and Effectiveness - Mortality
HSMR (Hospital standardised mortality ratio) SHMI (Summary hospital-level mortality indicator)
Lead
Director February 15 March 15 Movement 2014/2015 Target
Forecast March 15
Date expect to meet standard
Jan 2014 April 2014 July 2014 Oct 2014 Jan 2015
SM 84.5* 86.0 h <100 G Met 0.81 0.78 0.80 0.81 0.84
Overview: Our overall mortality measured by both the HSMR and the SHMI remains statistically significantly better than expected. However, despite this positive overall position we continue to investigate any mortality signals at procedure and diagnosis level which are locally identified using the Dr Foster platform. In March Dr Foster Intelligence introduced new functionality to their Quality Investigator tool which allows users to select the benchmark risk period to be applied to their data. As can be seen from the table below, the value of the HSMR changes slightly, depending on the benchmark period selected, however it should be noted that in each instance our mortality remains significantly better than expected.
Note: Source for HSMR is Dr Foster Intelligence, published monthly. Data is most recent 12 months available. For March 15 this was Jan to Dec 2014, and benchmark period is to March 2014. SHMI data is published by the Health and Social Care Information Centre. The last 12 month period as published on 27th January 15 relates to the period July 2013 to June 2014. * HSMR 84.5 was calculated in the previous month, but for the same period there is a slight difference as reported below (85.5) due to the March data refresh for all trusts.
Benchmark
period
Feb15 Mar15 Use
Annual (to Mar 14)
85.5* 86.0 Useful for understanding changes in performance at an individual trust
Quarterly (to Sep 14)
89.2 89.8 View provided to the CQC. Useful for comparing SHMI and HSMR.
Monthly (to Sep 14)
89.2 89.8 Gives the most up-to-date calculations.
As traditionally the annual benchmark has been used this continues to be reported in the summary table above and trend diagram below. The Mortality Monitoring Group will discuss whether the benchmark used should change in light of this new functionality. The selected option will always be made clear when reporting mortality data. When interrogating data to derive local signals at procedure and diagnosis level, the benchmark applied by Dr Foster is the most recent month, ensuring that we are looking in detail at the most up-to-date position.
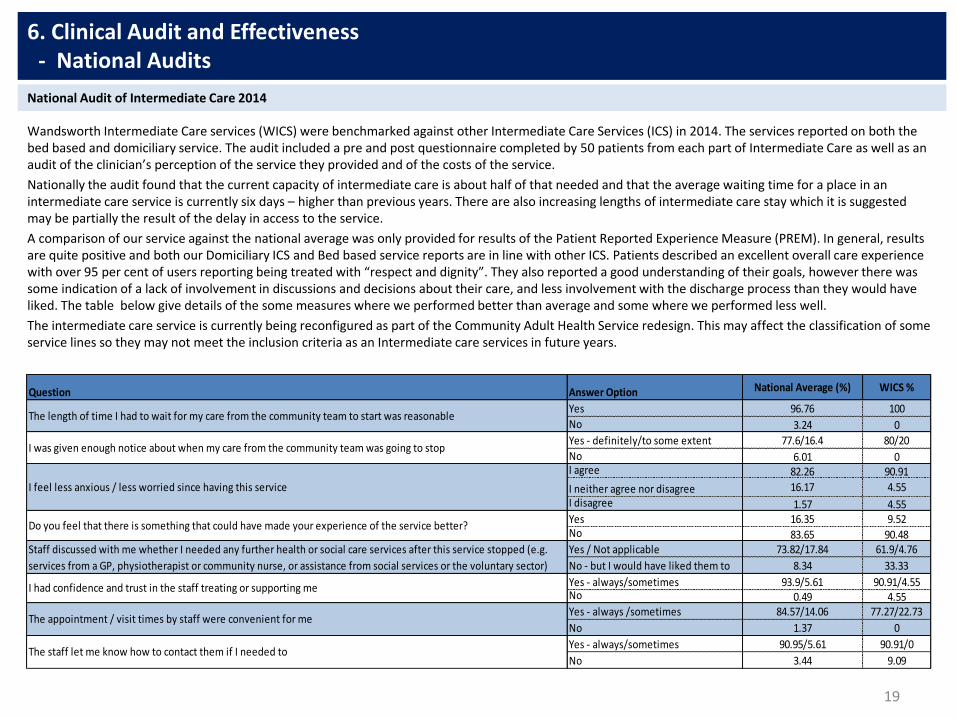
Wandsworth Intermediate Care services (WICS) were benchmarked against other Intermediate Care Services (ICS) in 2014. The services reported on both the bed based and domiciliary service. The audit included a pre and post questionnaire completed by 50 patients from each part of Intermediate Care as well as an audit of the clinician’s perception of the service they provided and of the costs of the service.
Nationally the audit found that the current capacity of intermediate care is about half of that needed and that the average waiting time for a place in an intermediate care service is currently six days – higher than previous years. There are also increasing lengths of intermediate care stay which it is suggested may be partially the result of the delay in access to the service.
A comparison of our service against the national average was only provided for results of the Patient Reported Experience Measure (PREM). In general, results are quite positive and both our Domiciliary ICS and Bed based service reports are in line with other ICS. Patients described an excellent overall care experience with over 95 per cent of users reporting being treated with “respect and dignity”. They also reported a good understanding of their goals, however there was some indication of a lack of involvement in discussions and decisions about their care, and less involvement with the discharge process than they would have liked. The table below give details of the some measures where we performed better than average and some where we performed less well.
The intermediate care service is currently being reconfigured as part of the Community Adult Health Service redesign. This may affect the classification of some service lines so they may not meet the inclusion criteria as an Intermediate care services in future years.
19
6. Clinical Audit and Effectiveness - National Audits
National Audit of Intermediate Care 2014
Question Answer Option National Average (%) WICS %
Yes 96.76 100
No 3.24 0
Yes - definitely/to some extent 77.6/16.4 80/20
No 6.01 0I agree 82.26 90.91
I neither agree nor disagree 16.17 4.55
I disagree 1.57 4.55Yes 16.35 9.52No 83.65 90.48Yes / Not applicable 73.82/17.84 61.9/4.76
No - but I would have liked them to 8.34 33.33
Yes - always/sometimes 93.9/5.61 90.91/4.55No 0.49 4.55Yes - always /sometimes 84.57/14.06 77.27/22.73
No 1.37 0
Yes - always/sometimes 90.95/5.61 90.91/0
No 3.44 9.09The staff let me know how to contact them if I needed to
The appointment / visit times by staff were convenient for me
The length of time I had to wait for my care from the community team to start was reasonable
I was given enough notice about when my care from the community team was going to stop
I feel less anxious / less worried since having this service
Do you feel that there is something that could have made your experience of the service better?
Staff discussed with me whether I needed any further health or social care services after this service stopped (e.g.
services from a GP, physiotherapist or community nurse, or assistance from social services or the voluntary sector)
I had confidence and trust in the staff treating or supporting me

20
6. Clinical Audit and Effectiveness - National Audits
Overview The National Prostate Cancer Audit (NPCA) First Year Annual Report – Organisation of Services and Analysis of Existing Clinical Data was published on the 10th November 2014.
The audit is based at the Clinical Effectiveness Unit (CEU) at the Royal College of Surgeons of England and is managed in partnership with the British Association of Urological Surgeons (BAUS), the British Uro-Oncology Group (BUG) and the National Cancer Registration Service (NCRS). The first annual report covers the work undertaken since April 2013 and outlines what is planned over a minimum of five years. It includes a preliminary analysis of the NPCA’s organisational audit, an analysis of existing data sets including patients with prostate cancer in England, and the design of the NPCA’s prospective audit dataset.
National Prostate Cancer Audit Report 2014
The audit aims to determine the availability of essential diagnostic, staging and therapeutic facilities, how prostate cancer services are organised and delivered, and the functioning of local and specialist multidisciplinary teams (MDTs). The result is presented by Cancer Network , with St George’s included in the South West London network. Key Findings: Data completeness - South West London network has shown significant improvement, scoring 77% for 2012 compared to 44% in 2006-2008. The national score is 71% in 2012 and 53% in 2006-2008. The report provided national level analysis of HES (hospital episode statistics) data for treatment delivered between 2006 and 2008 and from this drew six key performance indicators. Based on a comparison of national performance against these measures, six recommendations were then made. The trust has carried out a self assessment of current performance against these, as summarised in table 1. Locally we met five of these recommendations. High-dose brachytherapy is not available in this Trust, however if this is needed, patients are either referred to Royal Marsden or University College Hospital. The NPCA prospective audit has started to collect the data on men who were diagnosed with prostate cancer from 1st April 2014. We have assurance from the Prostate Cancer Tumour Group that data for this period has been submitted and it is 100%. For full audit report please download from the following link: http://www.npca.org.uk/
Tabloe 1: Recommendations Trust compliant
1. Multi parametric MRI is widely available to decrease likelihood of
unnecessary re-biopsy and to improve staging and treatment decision
making.
Met
2. Availability of high-dose rate brachytherapy should be increased for men
with intermediate and high-risk localised or locally advanced prostate
cancer.
Not applicable
Radiotherapy provided by RMH. We
can refer to UCH if appropriate.
3. Availability of personal support services including cancer advisory
centres, sexual function and continence advice, and psychological
counselling.
Met
4. Access to CNS with appropriate background in uro-oncology. Met
5. Access to joint clinic with a surgeon, an oncologist and a CNS to discuss
their treatment options.Met
6. Complete and accurate data can be submitted to the NPCA for every patient
with newly diagnosed prostate cancer, including data on cancer stage and
tumour grade.
Met

Previous PUP audits found that use of the PUP documentation had become increasingly embedded into the admission procedure and that where patients had been identified as having (or being at risk of developing) a PU, most had a pressure relieving mattress but only 58% had fully completed repositioning charts. The focus of this latest audit was therefore centred on the repositioning and management of at risk patients.
Data collection was carried out by nursing and audit staff across all areas of the hospital including ICU’s and paediatrics. Auditors were asked to collect detailed information on patients who were being nursed on a pressure relieving mattress from either paper assessment forms or from iClip. This included completeness of the assessment and details of PUP care for the last 48 hours.
In total, 334 patients were audited across the trust. Assessment documentation was checked for 329 of these patients and 73.6% of these had an up to date assessment form, this represents a small decrease from the previous audits (see Chart 1). All patients audited were on a pressure relieving mattress, 87% had a repositioning chart, and this was fully completed in (an average of) 71% of cases, which is an increase from previous audits (Chart 2). Communication sheets (giving ongoing information) were in progress for 35.25% of patients but only 19 (6%) had been given a patient information leaflet.
Overall the audit showed that there are pockets of excellent care but also areas where improvements are required. The patients audited were already at risk and on pressure relieving mattresses, but we did not check if all assessments were accurate or if any at risk patients had been missed, Therefore , the results were considered alongside details of PU incidents and PU training. Planned actions to facilitate improvements include targeted reviews of the wards where there appears to be most problems and a recheck of some wards where there may be some lesser issues These will be undertaken over the next few months by clinical members of the Pressure Ulcer Prevention Group.
21
6. Clinical Audit and Effectiveness - Local Audits
Pressure Ulcer Prevention (PUP) Audit
72% 77% 77% 80% 81% 79% 74%
0%
20%
40%
60%
80%
Jun 12 Sept 12 Dec 12 Mar 13 Sep 13 Mar-14 Nov-14
Chart 1: Completed & up to date risk assessment
39%46%
51% 55%
70%65%
71%
0%
20%
40%
60%
80%
Jun 12 Sept12
Dec 12 Mar 13 Sep 13 Mar-14Nov-14
Chart 2: Repositioning
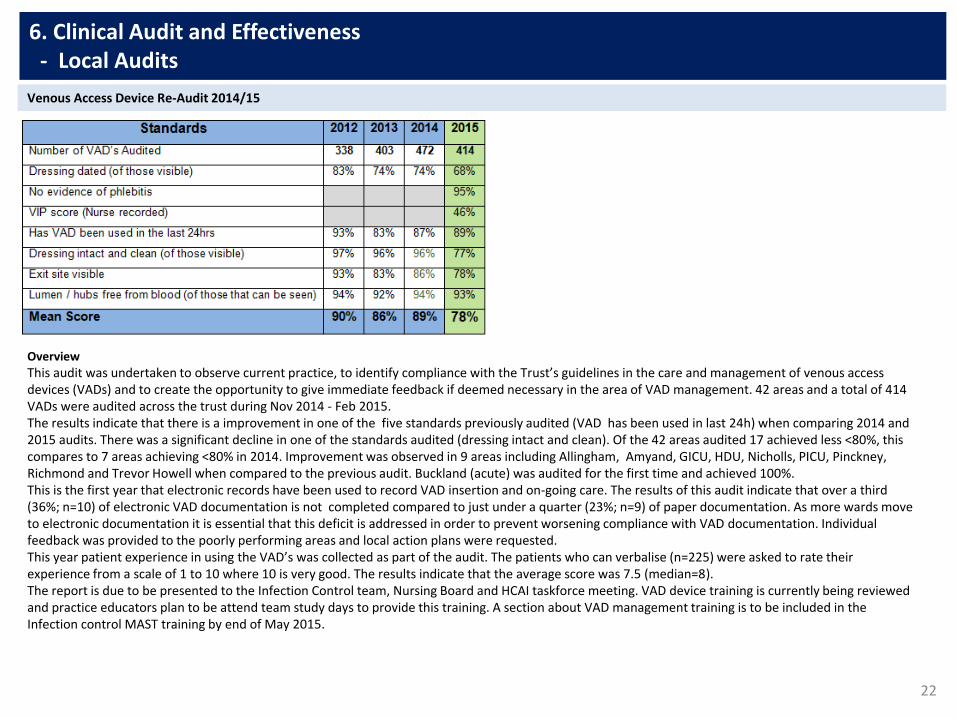
22
6. Clinical Audit and Effectiveness - Local Audits
Overview
This audit was undertaken to observe current practice, to identify compliance with the Trust’s guidelines in the care and management of venous access devices (VADs) and to create the opportunity to give immediate feedback if deemed necessary in the area of VAD management. 42 areas and a total of 414 VADs were audited across the trust during Nov 2014 - Feb 2015. The results indicate that there is a improvement in one of the five standards previously audited (VAD has been used in last 24h) when comparing 2014 and 2015 audits. There was a significant decline in one of the standards audited (dressing intact and clean). Of the 42 areas audited 17 achieved less <80%, this compares to 7 areas achieving <80% in 2014. Improvement was observed in 9 areas including Allingham, Amyand, GICU, HDU, Nicholls, PICU, Pinckney, Richmond and Trevor Howell when compared to the previous audit. Buckland (acute) was audited for the first time and achieved 100%. This is the first year that electronic records have been used to record VAD insertion and on-going care. The results of this audit indicate that over a third (36%; n=10) of electronic VAD documentation is not completed compared to just under a quarter (23%; n=9) of paper documentation. As more wards move to electronic documentation it is essential that this deficit is addressed in order to prevent worsening compliance with VAD documentation. Individual feedback was provided to the poorly performing areas and local action plans were requested. This year patient experience in using the VAD’s was collected as part of the audit. The patients who can verbalise (n=225) were asked to rate their experience from a scale of 1 to 10 where 10 is very good. The results indicate that the average score was 7.5 (median=8). The report is due to be presented to the Infection Control team, Nursing Board and HCAI taskforce meeting. VAD device training is currently being reviewed and practice educators plan to be attend team study days to provide this training. A section about VAD management training is to be included in the Infection control MAST training by end of May 2015.
Venous Access Device Re-Audit 2014/15
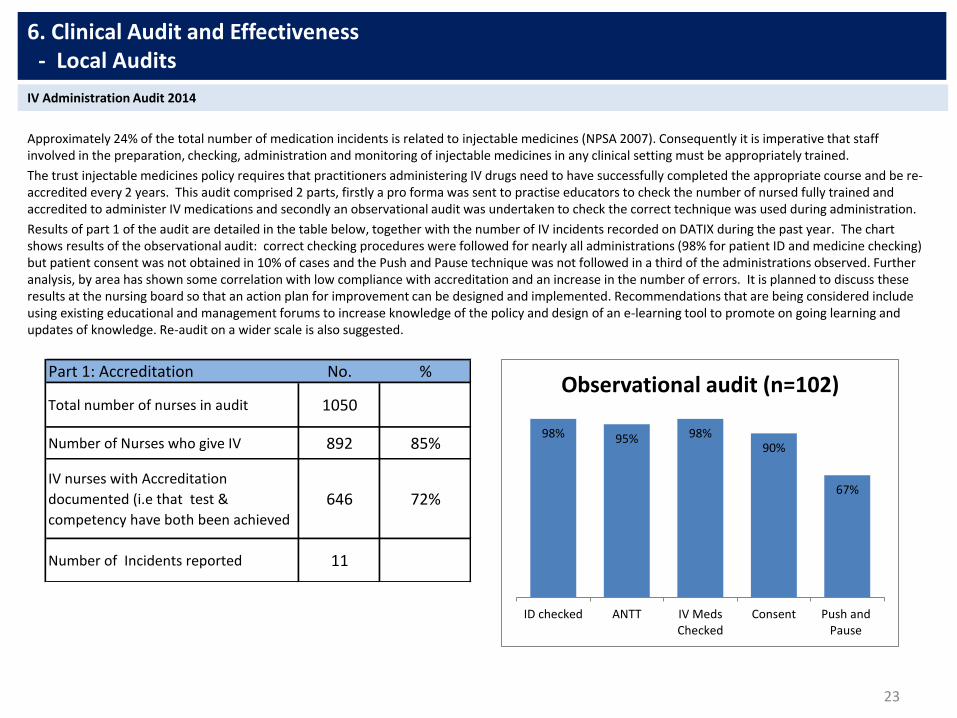
Approximately 24% of the total number of medication incidents is related to injectable medicines (NPSA 2007). Consequently it is imperative that staff involved in the preparation, checking, administration and monitoring of injectable medicines in any clinical setting must be appropriately trained.
The trust injectable medicines policy requires that practitioners administering IV drugs need to have successfully completed the appropriate course and be re-accredited every 2 years. This audit comprised 2 parts, firstly a pro forma was sent to practise educators to check the number of nursed fully trained and accredited to administer IV medications and secondly an observational audit was undertaken to check the correct technique was used during administration.
Results of part 1 of the audit are detailed in the table below, together with the number of IV incidents recorded on DATIX during the past year. The chart shows results of the observational audit: correct checking procedures were followed for nearly all administrations (98% for patient ID and medicine checking) but patient consent was not obtained in 10% of cases and the Push and Pause technique was not followed in a third of the administrations observed. Further analysis, by area has shown some correlation with low compliance with accreditation and an increase in the number of errors. It is planned to discuss these results at the nursing board so that an action plan for improvement can be designed and implemented. Recommendations that are being considered include using existing educational and management forums to increase knowledge of the policy and design of an e-learning tool to promote on going learning and updates of knowledge. Re-audit on a wider scale is also suggested.
23
6. Clinical Audit and Effectiveness - Local Audits
IV Administration Audit 2014
98% 95% 98%90%
67%
ID checked ANTT IV MedsChecked
Consent Push andPause
Observational audit (n=102)Part 1: Accreditation No. %
Total number of nurses in audit 1050
Number of Nurses who give IV 892 85%
IV nurses with Accreditation
documented (i.e that test &
competency have both been achieved
646 72%
Number of Incidents reported 11
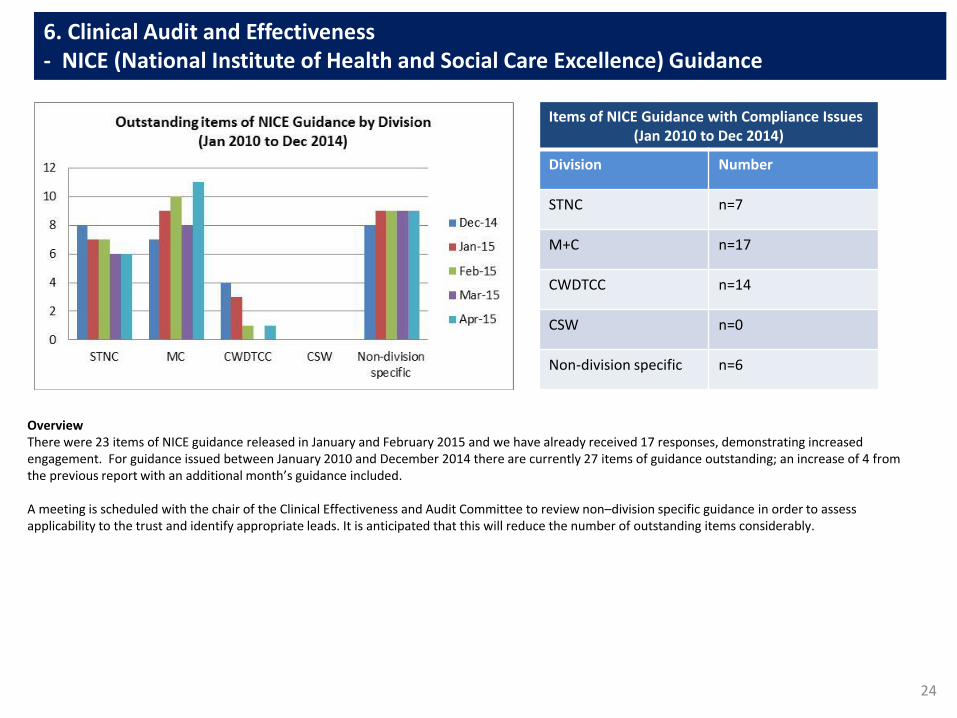
24
6. Clinical Audit and Effectiveness - NICE (National Institute of Health and Social Care Excellence) Guidance
Overview There were 23 items of NICE guidance released in January and February 2015 and we have already received 17 responses, demonstrating increased engagement. For guidance issued between January 2010 and December 2014 there are currently 27 items of guidance outstanding; an increase of 4 from the previous report with an additional month’s guidance included. A meeting is scheduled with the chair of the Clinical Effectiveness and Audit Committee to review non–division specific guidance in order to assess applicability to the trust and identify appropriate leads. It is anticipated that this will reduce the number of outstanding items considerably.
Items of NICE Guidance with Compliance Issues (Jan 2010 to Dec 2014)
Division Number
STNC n=7
M+C n=17
CWDTCC n=14
CSW n=0
Non-division specific n=6

Patient Safety

26
7. Patient Safety March 2015 - Incident Profile: Serious Incidents and Adverse Events
Closed Serious Incidents (not PUs)
Type Dec Jan Feb March
Movement
Total 10 8 3 10
No Harm 6 8 1 6
Harm 4 0 2 4
•6 maternity issues •3 related to medication errors •2 appointment delays •3 failure to monitor or follow up •Wrong site surgery •Breach in patient confidentiality •Misdiagnosis •Unexpected death
Analysis of incidents against safe staffing levels is being included in the SI Thematic Report which is currently being complied.
S Q1 SIs Declared by Division (Inc. Pus)
Med & Card Surgery &
Neuro Community
Children’s and Womens
Corporate
Dec 1 5 5 4 0
Jan 20 8 3 8 0
Feb 9 1 6 8 0
March 9 2 8 + 1 never 7 0
Table 1 Table 2
Overview: The numbers of general reported incidents in Table 1 show a similar profile to previous three months. This trend should be observed carefully as high reporting of lover level incidents is seen to denote a good reporting culture. The annual trend for new serious incidents excluding pressure ulcers shown in Table 2 above continues to increase. There were 18 SIs reported in March. 14 of these actually occurred in February and March with the remainder occurring between November and January. They related to the following issues:

27
% Harm Free Care
Lead Director
January 2015 February 2015 March 2015 Movement 2014/2015 Target National Average
March 2015 Date expected to meet
standard
J Hall 94.45% 94.91% 94.39% i 95.00% 93.96% March 15
This point prevalence audit shows that in March 2015 the proportion of our patients that received harm free care was 94.39%, which is very similar to the levels reported in recent months and is slightly better than the national average for March of 93.96%. Our mean level of harm free care for the reported period (March 14 to March 15) is 94.47%, which is higher than the corresponding national average of 93.79%, but slightly below our target for year end.
This month we reported 82 harms to 76 patients; 70 patients experienced one harm and 6 patients had 2 harms. 38 harms are categorised as new, meaning that they either developed or treatment began whilst under our care. 44 harms were old. Details of harms are provided above.
The level of harms related to catheter associated urinary tract infections fell once again this month, however there was an increase in harms reported for each of the remaining categories. For pressure ulcers our rate of harm grew, and although the majority of harms are old there was a slight increase in the number of new pressure ulcers reported this month.
Once again there were a number of areas that submitted data beyond the agreed deadline , which resulted in a number of harms not being validated. This may adversely affect our data and result in an inaccurate profile for the organisation. This issue continues to be flagged and we are working on tightening the escalation of data quality concerns.
7. Patient Safety March 2015 - Safety Thermometer
Pressure ulcers
• 36 grade 2 (21 new, 15 old)
• 25 grade 3 (4 new, 21 old)
• 4 grade 4 (0 new, 4 old)
CAUTI
• 5 new
• 4 old
Falls
• 1 low harm fall
• 3 moderate harm fall
VTE
• 1 new PE
• 3 new other
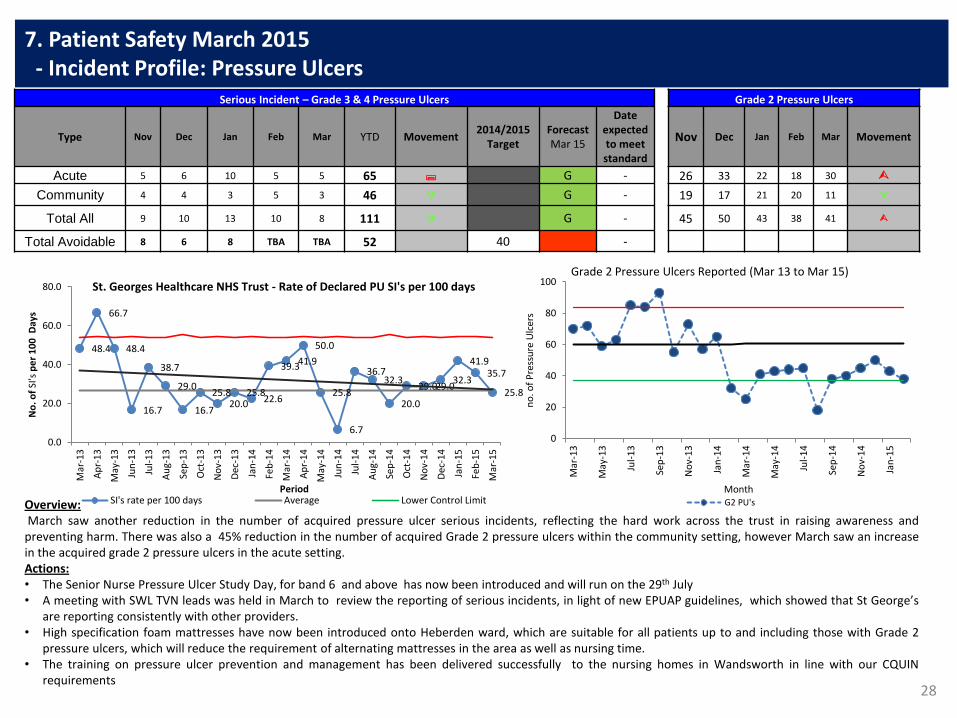
28
7. Patient Safety March 2015 - Incident Profile: Pressure Ulcers
Serious Incident – Grade 3 & 4 Pressure Ulcers Grade 2 Pressure Ulcers
Type Nov Dec Jan Feb Mar YTD Movement 2014/2015
Target Forecast Mar 15
Date expected to meet standard
Nov Dec Jan Feb Mar Movement
Acute 5 6 10 5 5 65 ; G - 26 33 22 18 30
Community 4 4 3 5 3 46 G - 19 17 21 20 11
Total All 9 10 13 10 8 111 G - 45 50 43 38 41
Total Avoidable 8 6 8 TBA TBA 52 40 -
Overview: March saw another reduction in the number of acquired pressure ulcer serious incidents, reflecting the hard work across the trust in raising awareness and preventing harm. There was also a 45% reduction in the number of acquired Grade 2 pressure ulcers within the community setting, however March saw an increase in the acquired grade 2 pressure ulcers in the acute setting. Actions: • The Senior Nurse Pressure Ulcer Study Day, for band 6 and above has now been introduced and will run on the 29th July • A meeting with SWL TVN leads was held in March to review the reporting of serious incidents, in light of new EPUAP guidelines, which showed that St George’s
are reporting consistently with other providers. • High specification foam mattresses have now been introduced onto Heberden ward, which are suitable for all patients up to and including those with Grade 2
pressure ulcers, which will reduce the requirement of alternating mattresses in the area as well as nursing time. • The training on pressure ulcer prevention and management has been delivered successfully to the nursing homes in Wandsworth in line with our CQUIN
requirements
48.4
66.7
48.4
16.7
38.7
29.0
16.7
25.8 20.0
25.8 22.6
39.3 41.9
50.0
25.8
6.7
36.7 32.3
20.0
29.0 29.0 32.3
41.9 35.7
25.8
0.0
20.0
40.0
60.0
80.0
Mar
-13
Ap
r-1
3
May
-13
Jun
-13
Jul-
13
Au
g-1
3
Sep
-13
Oct
-13
No
v-1
3
Dec
-13
Jan
-14
Feb
-14
Mar
-14
Ap
r-1
4
May
-14
Jun
-14
Jul-
14
Au
g-1
4
Sep
-14
Oct
-14
No
v-1
4
Dec
-14
Jan
-15
Feb
-15
Mar
-15
No
. of
SI's
pe
r 1
00
Day
s
Period
St. Georges Healthcare NHS Trust - Rate of Declared PU SI's per 100 days
SI's rate per 100 days Average Lower Control Limit
0
20
40
60
80
100
Mar
-13
May
-13
Jul-
13
Sep
-13
No
v-1
3
Jan
-14
Mar
-14
May
-14
Jul-
14
Sep
-14
No
v-1
4
Jan
-15
no
. of
Pre
ssu
re U
lcer
s
Month
Grade 2 Pressure Ulcers Reported (Mar 13 to Mar 15)
G2 PU's
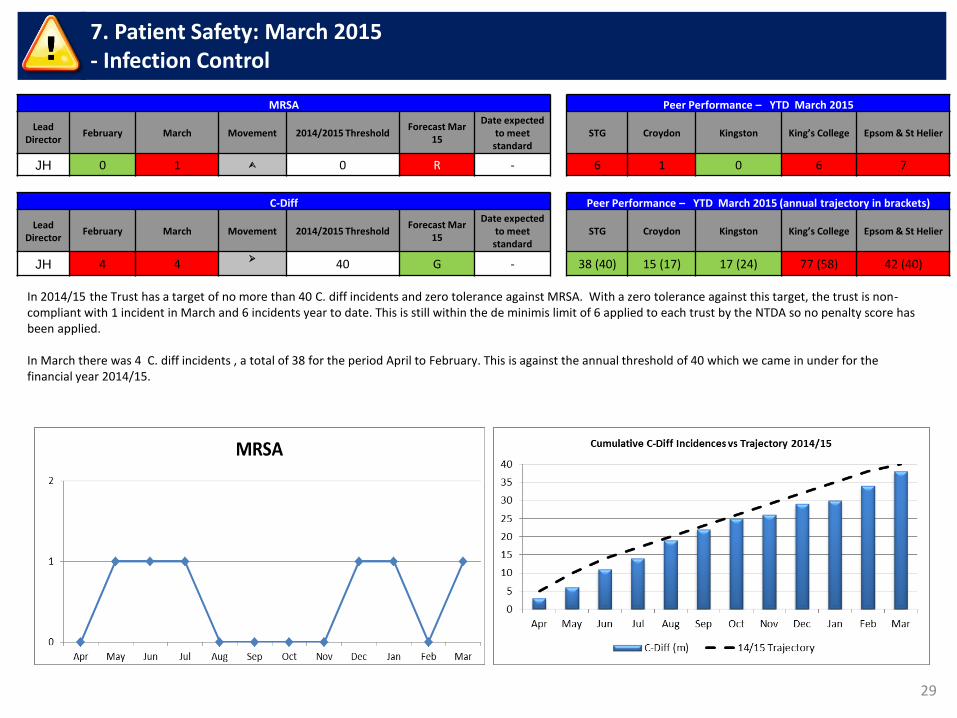
29
7. Patient Safety: March 2015 - Infection Control
MRSA Peer Performance – YTD March 2015
Lead
Director February March Movement 2014/2015 Threshold
Forecast Mar 15
Date expected to meet standard
STG Croydon Kingston King’s College Epsom & St Helier
JH 0 1 0 R - 6 1 0 6 7
In 2014/15 the Trust has a target of no more than 40 C. diff incidents and zero tolerance against MRSA. With a zero tolerance against this target, the trust is non-compliant with 1 incident in March and 6 incidents year to date. This is still within the de minimis limit of 6 applied to each trust by the NTDA so no penalty score has been applied. In March there was 4 C. diff incidents , a total of 38 for the period April to February. This is against the annual threshold of 40 which we came in under for the financial year 2014/15.
C-Diff Peer Performance – YTD March 2015 (annual trajectory in brackets)
Lead
Director February March Movement 2014/2015 Threshold
Forecast Mar 15
Date expected to meet standard
STG Croydon Kingston King’s College Epsom & St Helier
JH 4 4
40 G - 38 (40) 15 (17) 17 (24) 77 (58) 42 (40)
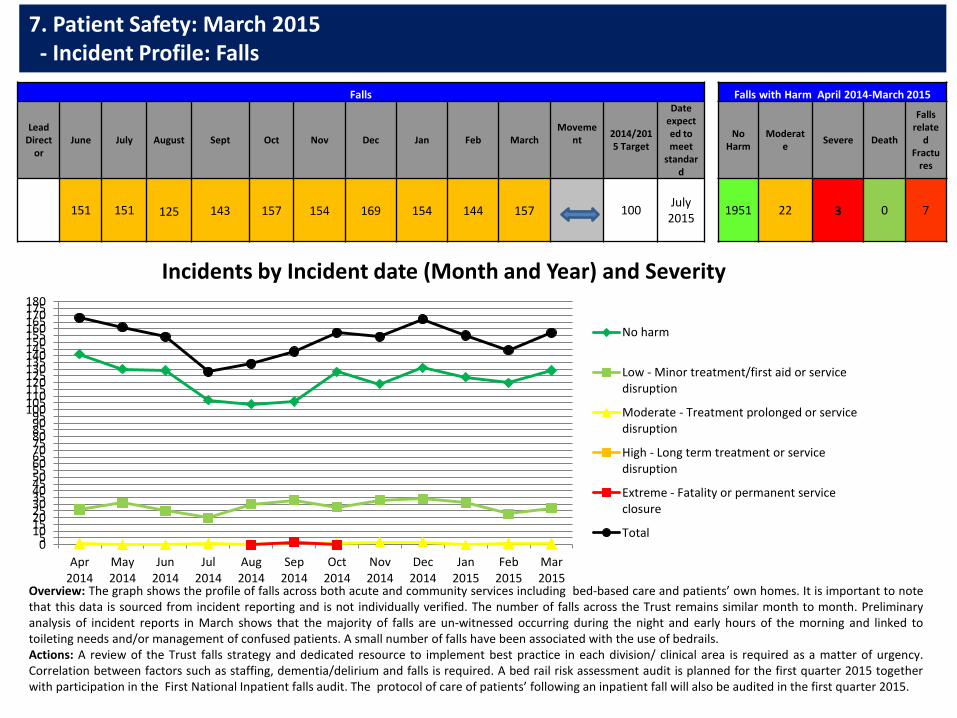
7. Patient Safety: March 2015 - Incident Profile: Falls
Falls Falls with Harm April 2014-March 2015
Lead Direct
or June July August Sept Oct Nov Dec Jan Feb March
Movement
2014/2015 Target
Date expected to meet
standard
No Harm
Moderate
Severe Death
Falls relate
d Fractu
res
151 151
125
143 157 154 169 154 144 157
100
July 2015
1951 22 3 0 7
Overview: The graph shows the profile of falls across both acute and community services including bed-based care and patients’ own homes. It is important to note that this data is sourced from incident reporting and is not individually verified. The number of falls across the Trust remains similar month to month. Preliminary analysis of incident reports in March shows that the majority of falls are un-witnessed occurring during the night and early hours of the morning and linked to toileting needs and/or management of confused patients. A small number of falls have been associated with the use of bedrails. Actions: A review of the Trust falls strategy and dedicated resource to implement best practice in each division/ clinical area is required as a matter of urgency. Correlation between factors such as staffing, dementia/delirium and falls is required. A bed rail risk assessment audit is planned for the first quarter 2015 together with participation in the First National Inpatient falls audit. The protocol of care of patients’ following an inpatient fall will also be audited in the first quarter 2015.
05
101520253035404550556065707580859095
100105110115120125130135140145150155160165170175180
Apr2014
May2014
Jun2014
Jul2014
Aug2014
Sep2014
Oct2014
Nov2014
Dec2014
Jan2015
Feb2015
Mar2015
Incidents by Incident date (Month and Year) and Severity
No harm
Low - Minor treatment/first aid or servicedisruption
Moderate - Treatment prolonged or servicedisruption
High - Long term treatment or servicedisruption
Extreme - Fatality or permanent serviceclosure
Total
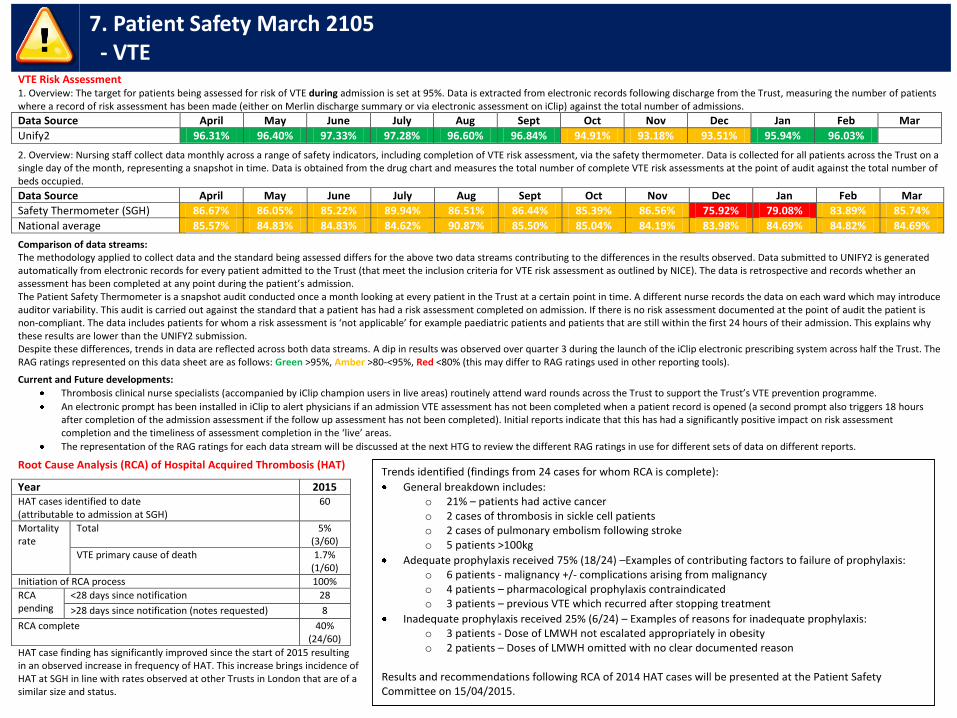
7. Patient Safety March 2105 - VTE
VTE Risk Assessment 1. Overview: The target for patients being assessed for risk of VTE during admission is set at 95%. Data is extracted from electronic records following discharge from the Trust, measuring the number of patients where a record of risk assessment has been made (either on Merlin discharge summary or via electronic assessment on iClip) against the total number of admissions.
Data Source April May June July Aug Sept Oct Nov Dec Jan Feb Mar
Unify2 96.31% 96.40% 97.33% 97.28% 96.60% 96.84% 94.91% 93.18% 93.51% 95.94% 96.03%
2. Overview: Nursing staff collect data monthly across a range of safety indicators, including completion of VTE risk assessment, via the safety thermometer. Data is collected for all patients across the Trust on a single day of the month, representing a snapshot in time. Data is obtained from the drug chart and measures the total number of complete VTE risk assessments at the point of audit against the total number of beds occupied.
Data Source April May June July Aug Sept Oct Nov Dec Jan Feb Mar
Safety Thermometer (SGH) 86.67% 86.05% 85.22% 89.94% 86.51% 86.44% 85.39% 86.56% 75.92% 79.08% 83.89% 85.74%
National average 85.57% 84.83% 84.83% 84.62% 90.87% 85.50% 85.04% 84.19% 83.98% 84.69% 84.82% 84.69%
Comparison of data streams: The methodology applied to collect data and the standard being assessed differs for the above two data streams contributing to the differences in the results observed. Data submitted to UNIFY2 is generated automatically from electronic records for every patient admitted to the Trust (that meet the inclusion criteria for VTE risk assessment as outlined by NICE). The data is retrospective and records whether an assessment has been completed at any point during the patient’s admission. The Patient Safety Thermometer is a snapshot audit conducted once a month looking at every patient in the Trust at a certain point in time. A different nurse records the data on each ward which may introduce auditor variability. This audit is carried out against the standard that a patient has had a risk assessment completed on admission. If there is no risk assessment documented at the point of audit the patient is non-compliant. The data includes patients for whom a risk assessment is ‘not applicable’ for example paediatric patients and patients that are still within the first 24 hours of their admission. This explains why these results are lower than the UNIFY2 submission. Despite these differences, trends in data are reflected across both data streams. A dip in results was observed over quarter 3 during the launch of the iClip electronic prescribing system across half the Trust. The RAG ratings represented on this data sheet are as follows: Green >95%, Amber >80-<95%, Red <80% (this may differ to RAG ratings used in other reporting tools).
Current and Future developments:
Thrombosis clinical nurse specialists (accompanied by iClip champion users in live areas) routinely attend ward rounds across the Trust to support the Trust’s VTE prevention programme.
An electronic prompt has been installed in iClip to alert physicians if an admission VTE assessment has not been completed when a patient record is opened (a second prompt also triggers 18 hours after completion of the admission assessment if the follow up assessment has not been completed). Initial reports indicate that this has had a significantly positive impact on risk assessment completion and the timeliness of assessment completion in the ‘live’ areas.
The representation of the RAG ratings for each data stream will be discussed at the next HTG to review the different RAG ratings in use for different sets of data on different reports.
Root Cause Analysis (RCA) of Hospital Acquired Thrombosis (HAT)
Year 2015 HAT cases identified to date (attributable to admission at SGH)
60
Mortality rate
Total 5% (3/60)
VTE primary cause of death 1.7% (1/60)
Initiation of RCA process 100%
RCA pending
<28 days since notification 28
>28 days since notification (notes requested) 8
RCA complete 40% (24/60)
HAT case finding has significantly improved since the start of 2015 resulting in an observed increase in frequency of HAT. This increase brings incidence of HAT at SGH in line with rates observed at other Trusts in London that are of a similar size and status.
Trends identified (findings from 24 cases for whom RCA is complete):
General breakdown includes: o 21% – patients had active cancer o 2 cases of thrombosis in sickle cell patients o 2 cases of pulmonary embolism following stroke o 5 patients >100kg
Adequate prophylaxis received 75% (18/24) –Examples of contributing factors to failure of prophylaxis: o 6 patients - malignancy +/- complications arising from malignancy o 4 patients – pharmacological prophylaxis contraindicated o 3 patients – previous VTE which recurred after stopping treatment
Inadequate prophylaxis received 25% (6/24) – Examples of reasons for inadequate prophylaxis: o 3 patients - Dose of LMWH not escalated appropriately in obesity o 2 patients – Doses of LMWH omitted with no clear documented reason
Results and recommendations following RCA of 2014 HAT cases will be presented at the Patient Safety Committee on 15/04/2015.

32
7. Patient Safety March 2015 - Safeguarding Children
Target areas: The Wandsworth Safeguarding Children Board require all agencies to provide evidence of compliance with Section 11 of the Children Act on a regular basis. This year the format for this important multi-agency monitoring exercise has been the completion of a questionnaire which is designed to assess the staff in the understanding of their responsibilities and knowledge in relation to child safeguarding. The Trust was tasked with analysing completed questionnaires from 10% of the workforce. The safeguarding team has worker tirelessly since January. The task has been concluded and will be reported in May, but early review of the outcome is encouraging . The findings from the review of compliance will be used to identify areas that the safeguarding team will target. The attainment of 80% compliance for the three levels of safeguarding training is only demonstrated at level 1. The Chief Nurse is clear that this is unacceptable and she has asked the safeguarding team to produce a revised action plan and to prioritise achieving compliance. The safeguarding team are setting up a series of meetings (to include the whole team) in order to address this. Monitor has requested that Organisations provide reassurance that the recommendations following Savile have been implemented. All organisations including St George’s are required to respond by 15.06.15. The Chief Nurse has asked that the various departments who have responsibilities in relation to the recommendations, to report back to her by early May. A grid detailing what is required for each recommendation has been prepared by the safeguarding team. Serious Case Reviews and Internal Management Reviews: The draft of the SCR health report (StGH) for family C (produced by the independent author), is under consultation – the date for the final overview report completion by the KSCB and possible publication is the end of June. There are action plans produced by the St George’s safeguarding team for IMR child A, SCR family N and SCR child F. There most recent SCR for Croydon child V is underway and the named nurse for the community has prepared an IMR. A number of other cases that the Trust has contributed towards have not identified actions for the Trust & thus can be signed off. .
0%
50%
100%
Q3 13/14 Q4 13/14 Q1 13/14
Safeguarding Children Training Compliance Q3 2013/14 to Q1 2014/15
Level 1 Level 2 Level 3
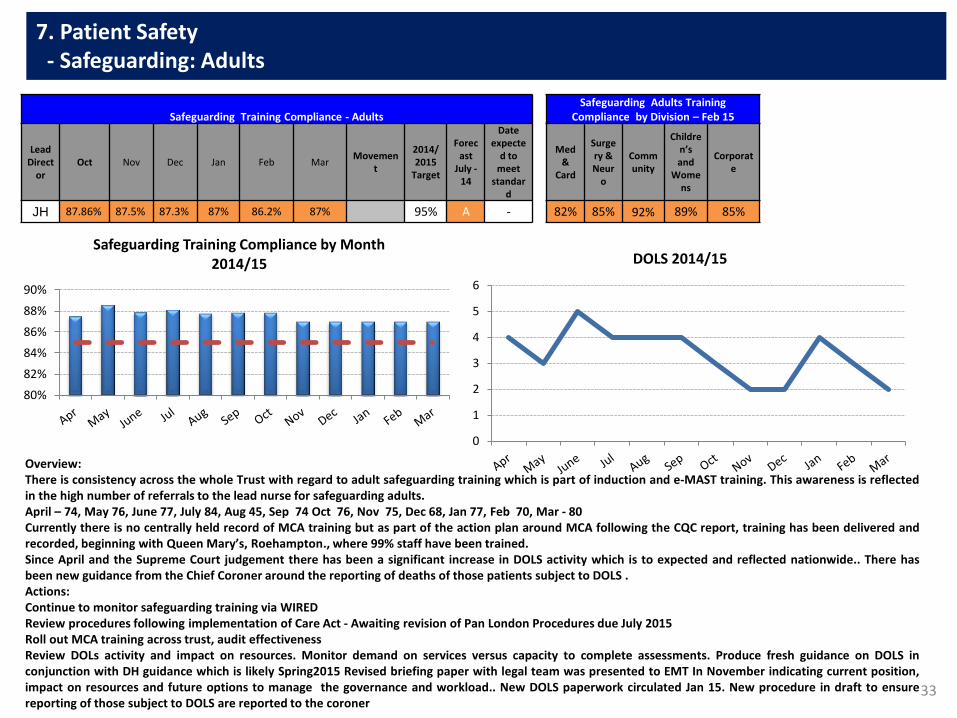
33
7. Patient Safety - Safeguarding: Adults
Safeguarding Training Compliance - Adults Safeguarding Adults Training
Compliance by Division – Feb 15
Lead Direct
or Oct Nov Dec Jan Feb Mar
Movement
2014/2015
Target
Forecast
July - 14
Date expecte
d to meet
standard
Med &
Card
Surgery & Neur
o
Community
Children’s and
Womens
Corporate
JH 87.86% 87.5% 87.3% 87% 86.2% 87% 95% A - 82% 85% 92% 89% 85%
Overview: There is consistency across the whole Trust with regard to adult safeguarding training which is part of induction and e-MAST training. This awareness is reflected in the high number of referrals to the lead nurse for safeguarding adults. April – 74, May 76, June 77, July 84, Aug 45, Sep 74 Oct 76, Nov 75, Dec 68, Jan 77, Feb 70, Mar - 80 Currently there is no centrally held record of MCA training but as part of the action plan around MCA following the CQC report, training has been delivered and recorded, beginning with Queen Mary’s, Roehampton., where 99% staff have been trained. Since April and the Supreme Court judgement there has been a significant increase in DOLS activity which is to expected and reflected nationwide.. There has been new guidance from the Chief Coroner around the reporting of deaths of those patients subject to DOLS . Actions: Continue to monitor safeguarding training via WIRED Review procedures following implementation of Care Act - Awaiting revision of Pan London Procedures due July 2015 Roll out MCA training across trust, audit effectiveness Review DOLs activity and impact on resources. Monitor demand on services versus capacity to complete assessments. Produce fresh guidance on DOLS in conjunction with DH guidance which is likely Spring2015 Revised briefing paper with legal team was presented to EMT In November indicating current position, impact on resources and future options to manage the governance and workload.. New DOLS paperwork circulated Jan 15. New procedure in draft to ensure reporting of those subject to DOLS are reported to the coroner
0
1
2
3
4
5
6
DOLS 2014/15
80%
82%
84%
86%
88%
90%
Safeguarding Training Compliance by Month 2014/15
Patient Experience
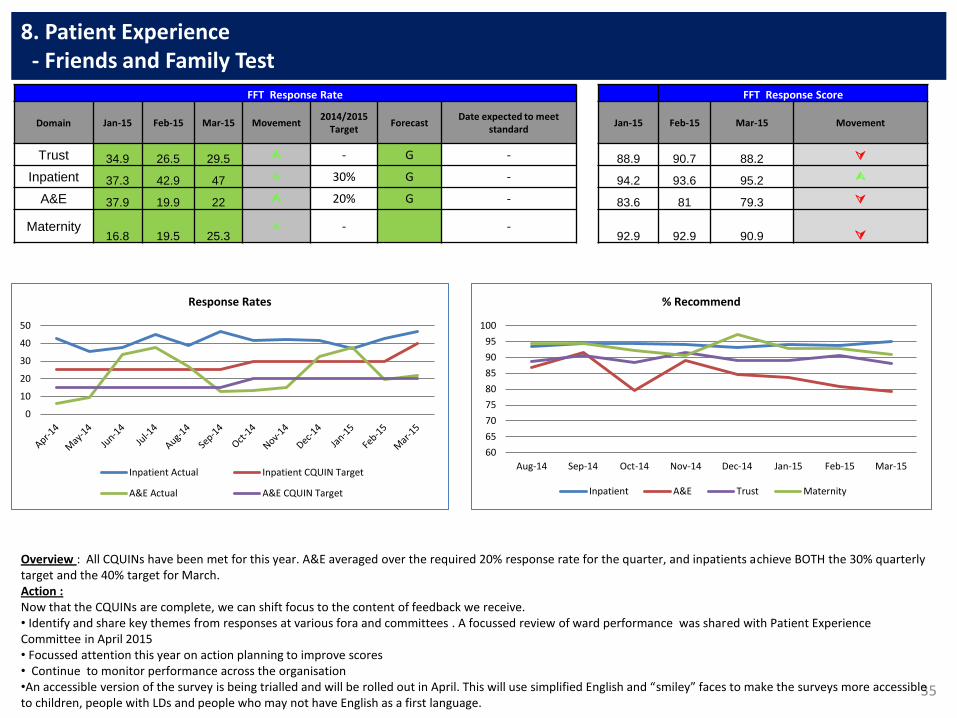
35
8. Patient Experience - Friends and Family Test
FFT Response Rate FFT Response Score
Domain Jan-15 Feb-15 Mar-15 Movement 2014/2015
Target Forecast
Date expected to meet standard
Jan-15 Feb-15 Mar-15 Movement
Trust 34.9 26.5 29.5 - G - 88.9 90.7 88.2
Inpatient 37.3 42.9 47 30% G - 94.2 93.6 95.2
A&E 37.9 19.9 22 20% G - 83.6 81 79.3
Maternity 16.8 19.5 25.3
- - 92.9 92.9 90.9
Overview : All CQUINs have been met for this year. A&E averaged over the required 20% response rate for the quarter, and inpatients achieve BOTH the 30% quarterly target and the 40% target for March. Action : Now that the CQUINs are complete, we can shift focus to the content of feedback we receive. • Identify and share key themes from responses at various fora and committees . A focussed review of ward performance was shared with Patient Experience Committee in April 2015 • Focussed attention this year on action planning to improve scores • Continue to monitor performance across the organisation •An accessible version of the survey is being trialled and will be rolled out in April. This will use simplified English and “smiley” faces to make the surveys more accessible to children, people with LDs and people who may not have English as a first language.
0
10
20
30
40
50
Response Rates
Inpatient Actual Inpatient CQUIN Target
A&E Actual A&E CQUIN Target
60
65
70
75
80
85
90
95
100
Aug-14 Sep-14 Oct-14 Nov-14 Dec-14 Jan-15 Feb-15 Mar-15
% Recommend
Inpatient A&E Trust Maternity
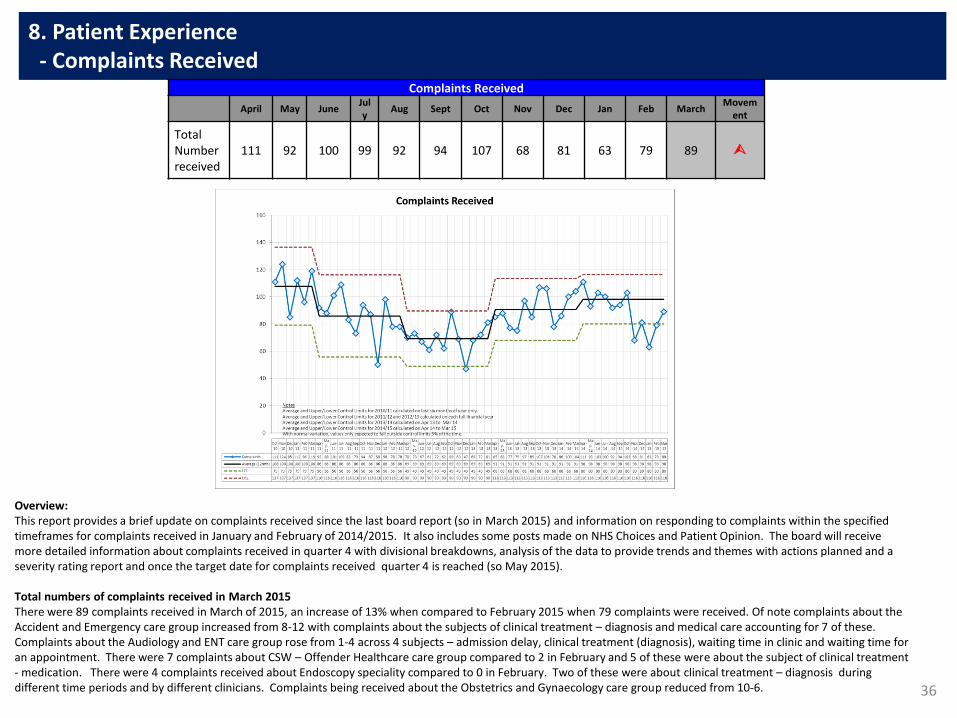
36
8. Patient Experience - Complaints Received
Overview: This report provides a brief update on complaints received since the last board report (so in March 2015) and information on responding to complaints within the specified timeframes for complaints received in January and February of 2014/2015. It also includes some posts made on NHS Choices and Patient Opinion. The board will receive more detailed information about complaints received in quarter 4 with divisional breakdowns, analysis of the data to provide trends and themes with actions planned and a severity rating report and once the target date for complaints received quarter 4 is reached (so May 2015). Total numbers of complaints received in March 2015 There were 89 complaints received in March of 2015, an increase of 13% when compared to February 2015 when 79 complaints were received. Of note complaints about the Accident and Emergency care group increased from 8-12 with complaints about the subjects of clinical treatment – diagnosis and medical care accounting for 7 of these. Complaints about the Audiology and ENT care group rose from 1-4 across 4 subjects – admission delay, clinical treatment (diagnosis), waiting time in clinic and waiting time for an appointment. There were 7 complaints about CSW – Offender Healthcare care group compared to 2 in February and 5 of these were about the subject of clinical treatment - medication. There were 4 complaints received about Endoscopy speciality compared to 0 in February. Two of these were about clinical treatment – diagnosis during different time periods and by different clinicians. Complaints being received about the Obstetrics and Gynaecology care group reduced from 10-6.
Complaints Received
April May June July
Aug Sept Oct Nov Dec Jan Feb March Movem
ent
Total Number received
111 92 100 99 92 94 107 68 81 63 79 89
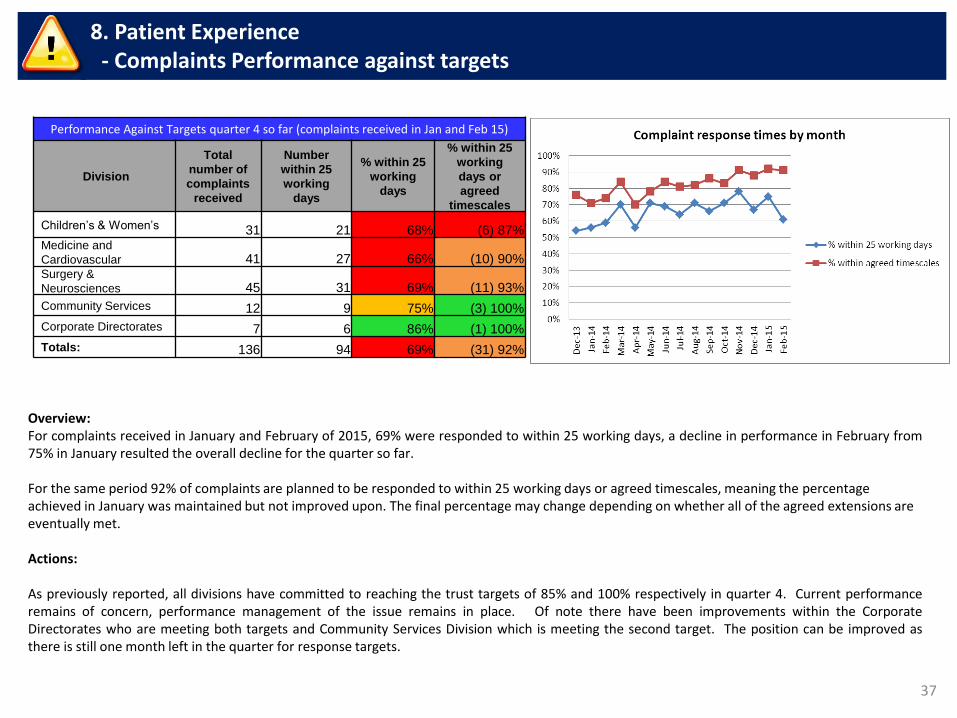
37
8. Patient Experience - Complaints Performance against targets
Overview: For complaints received in January and February of 2015, 69% were responded to within 25 working days, a decline in performance in February from 75% in January resulted the overall decline for the quarter so far. For the same period 92% of complaints are planned to be responded to within 25 working days or agreed timescales, meaning the percentage achieved in January was maintained but not improved upon. The final percentage may change depending on whether all of the agreed extensions are eventually met. Actions: As previously reported, all divisions have committed to reaching the trust targets of 85% and 100% respectively in quarter 4. Current performance remains of concern, performance management of the issue remains in place. Of note there have been improvements within the Corporate Directorates who are meeting both targets and Community Services Division which is meeting the second target. The position can be improved as there is still one month left in the quarter for response targets.
Performance Against Targets quarter 4 so far (complaints received in Jan and Feb 15)
Division
Total
number of
complaints
received
Number
within 25
working
days
% within 25
working
days
% within 25
working
days or
agreed
timescales
Children’s & Women’s 31 21 68% (6) 87% Medicine and
Cardiovascular 41 27 66% (10) 90% Surgery &
Neurosciences 45 31 69% (11) 93%
Community Services 12 9 75% (3) 100%
Corporate Directorates 7 6 86% (1) 100%
Totals: 136 94 69% (31) 92%
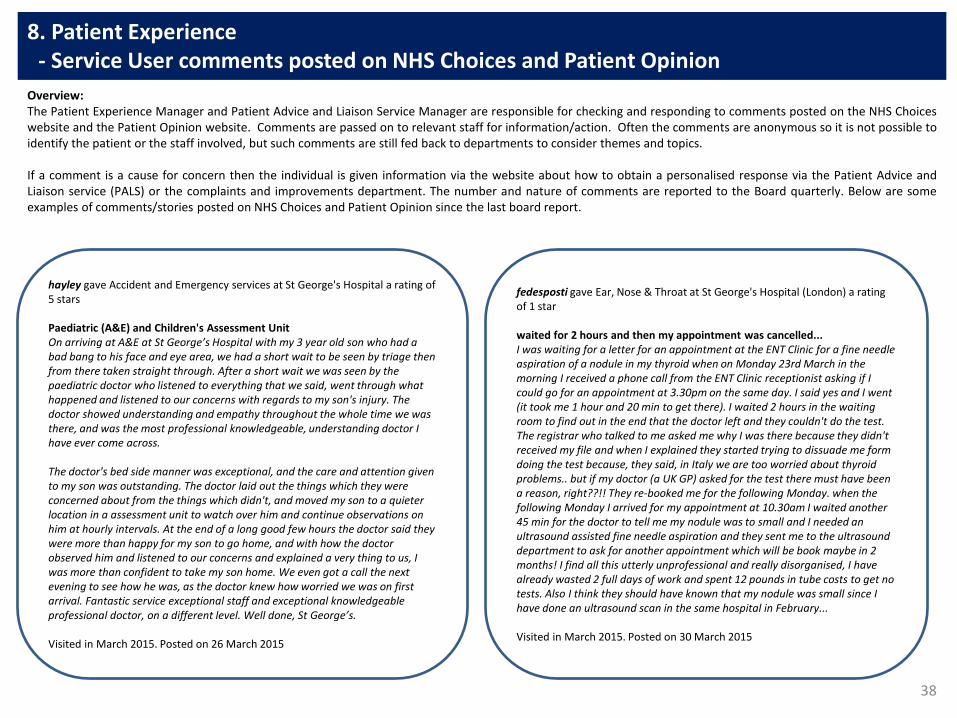
38
8. Patient Experience - Service User comments posted on NHS Choices and Patient Opinion Overview: The Patient Experience Manager and Patient Advice and Liaison Service Manager are responsible for checking and responding to comments posted on the NHS Choices website and the Patient Opinion website. Comments are passed on to relevant staff for information/action. Often the comments are anonymous so it is not possible to identify the patient or the staff involved, but such comments are still fed back to departments to consider themes and topics. If a comment is a cause for concern then the individual is given information via the website about how to obtain a personalised response via the Patient Advice and Liaison service (PALS) or the complaints and improvements department. The number and nature of comments are reported to the Board quarterly. Below are some examples of comments/stories posted on NHS Choices and Patient Opinion since the last board report.
hayley gave Accident and Emergency services at St George's Hospital a rating of 5 stars Paediatric (A&E) and Children's Assessment Unit On arriving at A&E at St George’s Hospital with my 3 year old son who had a bad bang to his face and eye area, we had a short wait to be seen by triage then from there taken straight through. After a short wait we was seen by the paediatric doctor who listened to everything that we said, went through what happened and listened to our concerns with regards to my son's injury. The doctor showed understanding and empathy throughout the whole time we was there, and was the most professional knowledgeable, understanding doctor I have ever come across. The doctor's bed side manner was exceptional, and the care and attention given to my son was outstanding. The doctor laid out the things which they were concerned about from the things which didn't, and moved my son to a quieter location in a assessment unit to watch over him and continue observations on him at hourly intervals. At the end of a long good few hours the doctor said they were more than happy for my son to go home, and with how the doctor observed him and listened to our concerns and explained a very thing to us, I was more than confident to take my son home. We even got a call the next evening to see how he was, as the doctor knew how worried we was on first arrival. Fantastic service exceptional staff and exceptional knowledgeable professional doctor, on a different level. Well done, St George’s. Visited in March 2015. Posted on 26 March 2015
fedesposti gave Ear, Nose & Throat at St George's Hospital (London) a rating of 1 star waited for 2 hours and then my appointment was cancelled... I was waiting for a letter for an appointment at the ENT Clinic for a fine needle aspiration of a nodule in my thyroid when on Monday 23rd March in the morning I received a phone call from the ENT Clinic receptionist asking if I could go for an appointment at 3.30pm on the same day. I said yes and I went (it took me 1 hour and 20 min to get there). I waited 2 hours in the waiting room to find out in the end that the doctor left and they couldn't do the test. The registrar who talked to me asked me why I was there because they didn't received my file and when I explained they started trying to dissuade me form doing the test because, they said, in Italy we are too worried about thyroid problems.. but if my doctor (a UK GP) asked for the test there must have been a reason, right??!! They re-booked me for the following Monday. when the following Monday I arrived for my appointment at 10.30am I waited another 45 min for the doctor to tell me my nodule was to small and I needed an ultrasound assisted fine needle aspiration and they sent me to the ultrasound department to ask for another appointment which will be book maybe in 2 months! I find all this utterly unprofessional and really disorganised, I have already wasted 2 full days of work and spent 12 pounds in tube costs to get no tests. Also I think they should have known that my nodule was small since I have done an ultrasound scan in the same hospital in February... Visited in March 2015. Posted on 30 March 2015

Workforce
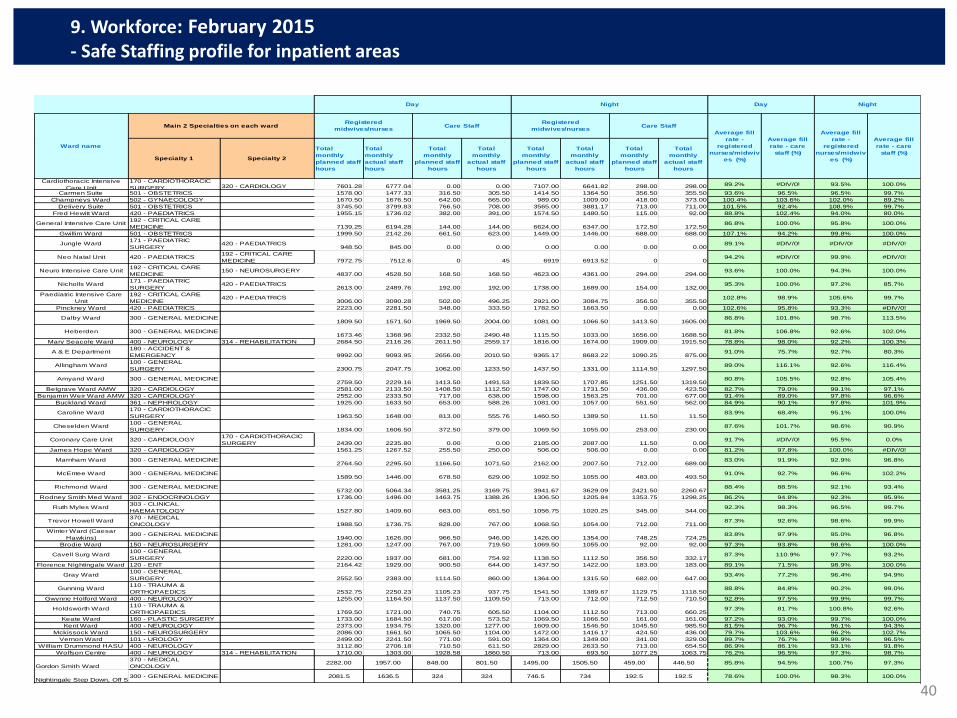
40
9. Workforce: February 2015 - Safe Staffing profile for inpatient areas
Specialty 1 Specialty 2
Total
monthly
planned staff
hours
Total
monthly
actual staff
hours
Total
monthly
planned staff
hours
Total
monthly
actual staff
hours
Total
monthly
planned staff
hours
Total
monthly
actual staff
hours
Total
monthly
planned staff
hours
Total
monthly
actual staff
hours
Cardiothoracic Intensive
Care Unit
170 - CARDIOTHORACIC
SURGERY 320 - CARDIOLOGY 7601.28 6777.04 0.00 0.00 7107.00 6641.82 298.00 298.00 89.2% #DIV/0! 93.5% 100.0%
Carmen Suite 501 - OBSTETRICS 1578.00 1477.33 316.50 305.50 1414.50 1364.50 356.50 355.50 93.6% 96.5% 96.5% 99.7%
Champneys Ward 502 - GYNAECOLOGY 1670.50 1676.50 642.00 665.00 989.00 1009.00 418.00 373.00 100.4% 103.6% 102.0% 89.2%
Delivery Suite 501 - OBSTETRICS 3745.50 3799.83 766.50 708.00 3565.00 3881.17 713.00 711.00 101.5% 92.4% 108.9% 99.7%
Fred Hewitt Ward 420 - PAEDIATRICS 1955.15 1736.02 382.00 391.00 1574.50 1480.50 115.00 92.00 88.8% 102.4% 94.0% 80.0%
General Intensive Care Unit192 - CRITICAL CARE
MEDICINE 7139.25 6194.28 144.00 144.00 6624.00 6347.00 172.50 172.5086.8% 100.0% 95.8% 100.0%
Gwillim Ward 501 - OBSTETRICS 1999.50 2142.26 661.50 623.00 1449.00 1446.00 688.00 688.00 107.1% 94.2% 99.8% 100.0%
Jungle Ward171 - PAEDIATRIC
SURGERY420 - PAEDIATRICS
948.50 845.00 0.00 0.00 0.00 0.00 0.00 0.0089.1% #DIV/0! #DIV/0! #DIV/0!
Neo Natal Unit 420 - PAEDIATRICS192 - CRITICAL CARE
MEDICINE 7972.75 7512.6 0 45 6919 6913.52 0 094.2% #DIV/0! 99.9% #DIV/0!
Neuro Intensive Care Unit192 - CRITICAL CARE
MEDICINE150 - NEUROSURGERY
4837.00 4528.50 168.50 168.50 4623.00 4361.00 294.00 294.0093.6% 100.0% 94.3% 100.0%
Nicholls Ward171 - PAEDIATRIC
SURGERY420 - PAEDIATRICS
2613.00 2489.76 192.00 192.00 1738.00 1689.00 154.00 132.0095.3% 100.0% 97.2% 85.7%
Paediatric Intensive Care
Unit
192 - CRITICAL CARE
MEDICINE420 - PAEDIATRICS
3006.00 3090.28 502.00 496.25 2921.00 3084.75 356.50 355.50102.8% 98.9% 105.6% 99.7%
Pinckney Ward 420 - PAEDIATRICS 2223.00 2281.50 348.00 333.50 1782.50 1663.50 0.00 0.00 102.6% 95.8% 93.3% #DIV/0!
Dalby Ward 300 - GENERAL MEDICINE1809.50 1571.50 1969.50 2004.00 1081.00 1066.50 1413.50 1605.00
86.8% 101.8% 98.7% 113.5%
Heberden 300 - GENERAL MEDICINE1673.46 1368.96 2332.50 2490.48 1115.50 1033.00 1656.00 1688.50
81.8% 106.8% 92.6% 102.0%
Mary Seacole Ward 400 - NEUROLOGY 314 - REHABILITATION 2684.50 2116.26 2611.50 2559.17 1816.00 1674.00 1909.00 1915.50 78.8% 98.0% 92.2% 100.3%
A & E Department180 - ACCIDENT &
EMERGENCY 9992.00 9093.95 2656.00 2010.50 9365.17 8683.22 1090.25 875.0091.0% 75.7% 92.7% 80.3%
Allingham Ward100 - GENERAL
SURGERY 2300.75 2047.75 1062.00 1233.50 1437.50 1331.00 1114.50 1297.5089.0% 116.1% 92.6% 116.4%
Amyand Ward 300 - GENERAL MEDICINE2759.50 2229.16 1413.50 1491.53 1839.50 1707.85 1251.50 1319.50
80.8% 105.5% 92.8% 105.4%
Belgrave Ward AMW 320 - CARDIOLOGY 2581.00 2133.50 1408.50 1112.50 1747.00 1731.50 436.00 423.50 82.7% 79.0% 99.1% 97.1%
Benjamin Weir Ward AMW 320 - CARDIOLOGY 2552.00 2333.50 717.00 638.00 1598.00 1563.25 701.00 677.00 91.4% 89.0% 97.8% 96.6%
Buckland Ward 361 - NEPHROLOGY 1925.00 1633.50 653.00 588.26 1081.00 1057.00 551.50 562.00 84.9% 90.1% 97.8% 101.9%
Caroline Ward170 - CARDIOTHORACIC
SURGERY 1963.50 1648.00 813.00 555.76 1460.50 1389.50 11.50 11.5083.9% 68.4% 95.1% 100.0%
Cheselden Ward100 - GENERAL
SURGERY 1834.00 1606.50 372.50 379.00 1069.50 1055.00 253.00 230.0087.6% 101.7% 98.6% 90.9%
Coronary Care Unit 320 - CARDIOLOGY170 - CARDIOTHORACIC
SURGERY 2439.00 2235.80 0.00 0.00 2185.00 2087.00 11.50 0.0091.7% #DIV/0! 95.5% 0.0%
James Hope Ward 320 - CARDIOLOGY 1561.25 1267.52 255.50 250.00 506.00 506.00 0.00 0.00 81.2% 97.8% 100.0% #DIV/0!
Marnham Ward 300 - GENERAL MEDICINE2764.50 2295.50 1166.50 1071.50 2162.00 2007.50 712.00 689.00
83.0% 91.9% 92.9% 96.8%
McEntee Ward 300 - GENERAL MEDICINE1589.50 1446.00 678.50 629.00 1092.50 1055.00 483.00 493.50
91.0% 92.7% 96.6% 102.2%
Richmond Ward 300 - GENERAL MEDICINE5732.00 5064.34 3581.25 3169.75 3941.67 3629.09 2421.50 2260.67
88.4% 88.5% 92.1% 93.4%
Rodney Smith Med Ward 302 - ENDOCRINOLOGY 1736.00 1496.00 1463.75 1388.26 1306.50 1205.84 1353.75 1298.25 86.2% 94.8% 92.3% 95.9%
Ruth Myles Ward303 - CLINICAL
HAEMATOLOGY 1527.80 1409.60 663.00 651.50 1056.75 1020.25 345.00 344.0092.3% 98.3% 96.5% 99.7%
Trevor Howell Ward370 - MEDICAL
ONCOLOGY 1988.50 1736.75 828.00 767.00 1068.50 1054.00 712.00 711.0087.3% 92.6% 98.6% 99.9%
Winter Ward (Caesar
Hawkins)300 - GENERAL MEDICINE
1940.00 1626.00 966.50 946.00 1426.00 1354.00 748.25 724.2583.8% 97.9% 95.0% 96.8%
Brodie Ward 150 - NEUROSURGERY 1281.00 1247.00 767.00 719.50 1069.50 1055.00 92.00 92.00 97.3% 93.8% 98.6% 100.0%
Cavell Surg Ward100 - GENERAL
SURGERY 2220.00 1937.00 681.00 754.92 1138.50 1112.50 356.50 332.1787.3% 110.9% 97.7% 93.2%
Florence Nightingale Ward 120 - ENT 2164.42 1929.00 900.50 644.00 1437.50 1422.00 183.00 183.00 89.1% 71.5% 98.9% 100.0%
Gray Ward100 - GENERAL
SURGERY 2552.50 2383.00 1114.50 860.00 1364.00 1315.50 682.00 647.0093.4% 77.2% 96.4% 94.9%
Gunning Ward110 - TRAUMA &
ORTHOPAEDICS 2532.75 2250.23 1105.23 937.75 1541.50 1389.67 1129.75 1118.5088.8% 84.8% 90.2% 99.0%
Gwynne Holford Ward 400 - NEUROLOGY 1255.00 1164.50 1137.50 1109.50 713.00 712.00 712.50 710.50 92.8% 97.5% 99.9% 99.7%
Holdsworth Ward110 - TRAUMA &
ORTHOPAEDICS 1769.50 1721.00 740.75 605.50 1104.00 1112.50 713.00 660.2597.3% 81.7% 100.8% 92.6%
Keate Ward 160 - PLASTIC SURGERY 1733.00 1684.50 617.00 573.52 1069.50 1066.50 161.00 161.00 97.2% 93.0% 99.7% 100.0%
Kent Ward 400 - NEUROLOGY 2373.00 1934.75 1320.00 1277.00 1609.00 1546.50 1045.50 985.50 81.5% 96.7% 96.1% 94.3%
Mckissock Ward 150 - NEUROSURGERY 2086.00 1661.50 1065.50 1104.00 1472.00 1416.17 424.50 436.00 79.7% 103.6% 96.2% 102.7%
Vernon Ward 101 - UROLOGY 2499.00 2241.50 771.00 591.00 1364.00 1349.00 341.00 329.00 89.7% 76.7% 98.9% 96.5%
William Drummond HASU 400 - NEUROLOGY 3112.80 2706.18 710.50 611.50 2829.00 2633.50 713.00 654.50 86.9% 86.1% 93.1% 91.8%
Wolfson Centre 400 - NEUROLOGY 314 - REHABILITATION 1710.00 1303.00 1928.58 1860.50 713.00 693.50 1077.25 1063.75 76.2% 96.5% 97.3% 98.7%
Gordon Smith Ward
370 - MEDICAL
ONCOLOGY2282.00 1957.00 848.00 801.50 1495.00 1505.50 459.00 446.50 85.8% 94.5% 100.7% 97.3%
Nightingale Step Down, Off Site Facility300 - GENERAL MEDICINE 2081.5 1636.5 324 324 746.5 734 192.5 192.5 78.6% 100.0% 98.3% 100.0%
Ward name
Registered
midwives/nurses
Registered
midwives/nursesCare Staff
Day
Care StaffMain 2 Specialties on each ward
Night Day Night
Average fill
rate - care
staff (%)
Average fill
rate -
registered
nurses/midwiv
es (%)
Average fill
rate - care
staff (%)
Average fill
rate -
registered
nurses/midwiv
es (%)
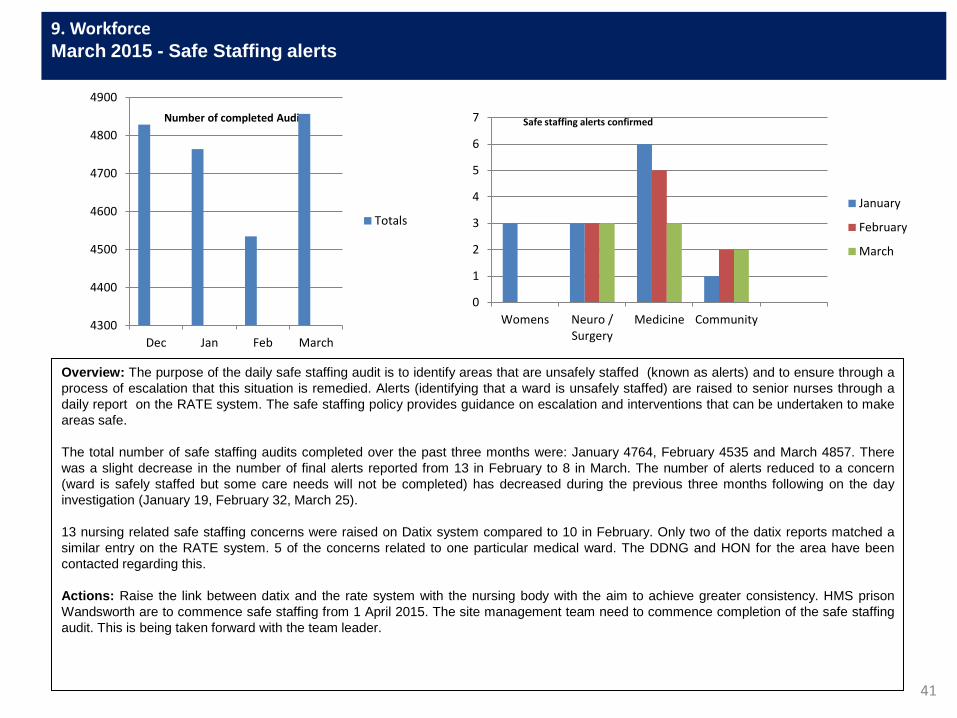
41
9. Workforce
March 2015 - Safe Staffing alerts
Overview: The purpose of the daily safe staffing audit is to identify areas that are unsafely staffed (known as alerts) and to ensure through a
process of escalation that this situation is remedied. Alerts (identifying that a ward is unsafely staffed) are raised to senior nurses through a
daily report on the RATE system. The safe staffing policy provides guidance on escalation and interventions that can be undertaken to make
areas safe.
The total number of safe staffing audits completed over the past three months were: January 4764, February 4535 and March 4857. There
was a slight decrease in the number of final alerts reported from 13 in February to 8 in March. The number of alerts reduced to a concern
(ward is safely staffed but some care needs will not be completed) has decreased during the previous three months following on the day
investigation (January 19, February 32, March 25).
13 nursing related safe staffing concerns were raised on Datix system compared to 10 in February. Only two of the datix reports matched a
similar entry on the RATE system. 5 of the concerns related to one particular medical ward. The DDNG and HON for the area have been
contacted regarding this.
Actions: Raise the link between datix and the rate system with the nursing body with the aim to achieve greater consistency. HMS prison
Wandsworth are to commence safe staffing from 1 April 2015. The site management team need to commence completion of the safe staffing
audit. This is being taken forward with the team leader.
Number of completed Audits
0
1
2
3
4
5
6
7
Womens Neuro /Surgery
Medicine Community
January
February
March
Safe staffing alerts confirmed
4300
4400
4500
4600
4700
4800
4900
Dec Jan Feb March
Totals

42
9. Workforce: March 2015 - Safe Staffing profile for inpatient areas
Overview The information provided on the table above relate to staffing numbers at ward/department level submitted nationally on Unify for March 2015. In line with new national guidance this table shows the number of filled shifts for registered and unregistered staff during day and night shifts. In March the trust achieved an average fill rate of 93.22%, a slight decrease from 94.1% submitted in February. Data cleansing continues to ensure that the report is being run consistently and only relevant front line nursing roles are included. An additional column has now be added to highlight and RAG rate wards with fill rates lower than 85% as red and under 90% as amber. Although some of our wards are operating below 100% the data does not indicate if a ward is unsafe. Safe staffing is much more complex than an observation of percentages and takes in to account many key aspects such as: Nurses, midwives and care staff work as part of a wider multidisciplinary ward team. The demand on wards can change quickly and it will always be a clinical judgement as to whether to bring more staff in or reduce the amount the staff as per requirement. • The data does not take into account the on-going considerations for ward managers in ensuring that on each shift there is the right level of experience and
expertise in the ward team. • The nature of each ward varies. The number and type of patients seen on some wards will be relatively consistent. The number and type of patients seen on other
wards will vary more dramatically, meaning that there could be greater change from the planned level and the average will be somewhere in the middle of the highs and lows of this variation.
• There needs to be the operational context of the reasons for staffing levels month on month, for example reduced demand. • Higher than 100% fill rates relate to areas which require more staff than they are profiled for. This could be because the patients the team are looking after are
exceptionally unwell or require one to one nursing or supervision called specialling. This is an anomaly in the data which is to be reviewed. • St George’s Healthcare NHS Trust has a safe staffing policy and a system in place for monitoring staffing levels on a daily basis. Nursing and midwifery clinical
leaders visit their clinical areas across the trust at least once a day to ensure safe staffing and staff are encouraged to escalate any concerns they have to the chief nurse on duty. The acuity/dependency of patients (how sick or dependent they are) is also monitored closely as this ultimately affects the type and amount of care patients need. If concerns are raised about staffing levels, the clinical leaders may make the decision move members of staff across the trust so that the area is safely staffed. This ensures that our patients are well cared for.
Actions • The Trust wide Nursing/ Midwifery Workforce programme, chaired by the Chief Nurse continues including work-streams for recruitment, retention, temporary
staffing, marketing and forward planning. Colleagues from HR, Finance and Divisional representation support the delivery of the programmes of work. the progress of this programme of work is reported to the Workforce and Education committee.
• The Deputy Chief Nurse is to set up a task force to review the way data is collected, validated and reported.

Heatmap Dashboard Ward view
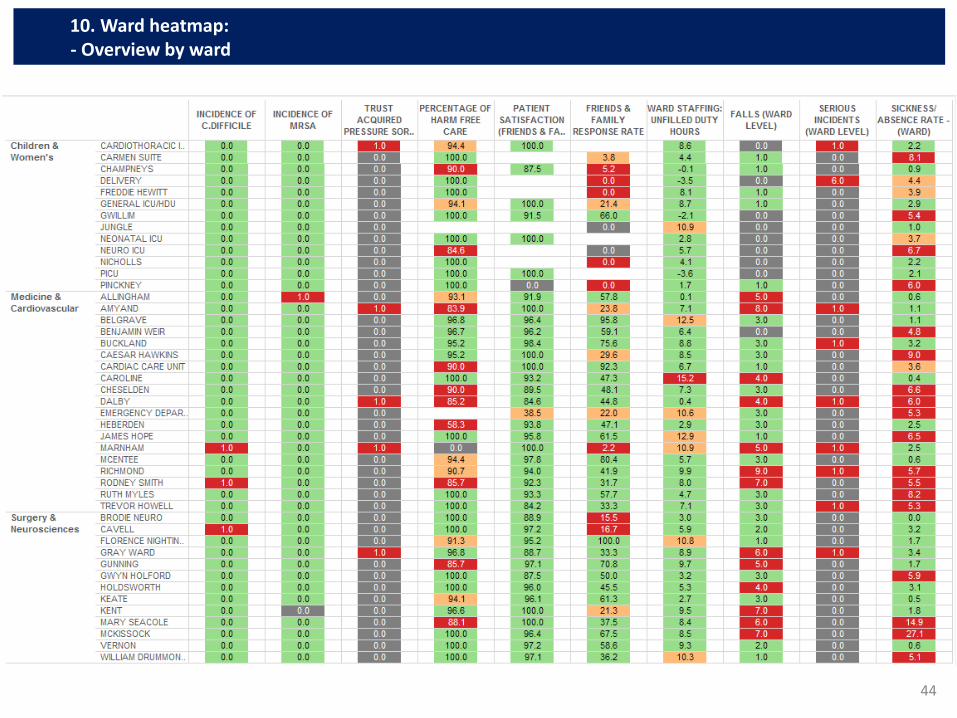
44
10. Ward heatmap: - Overview by ward
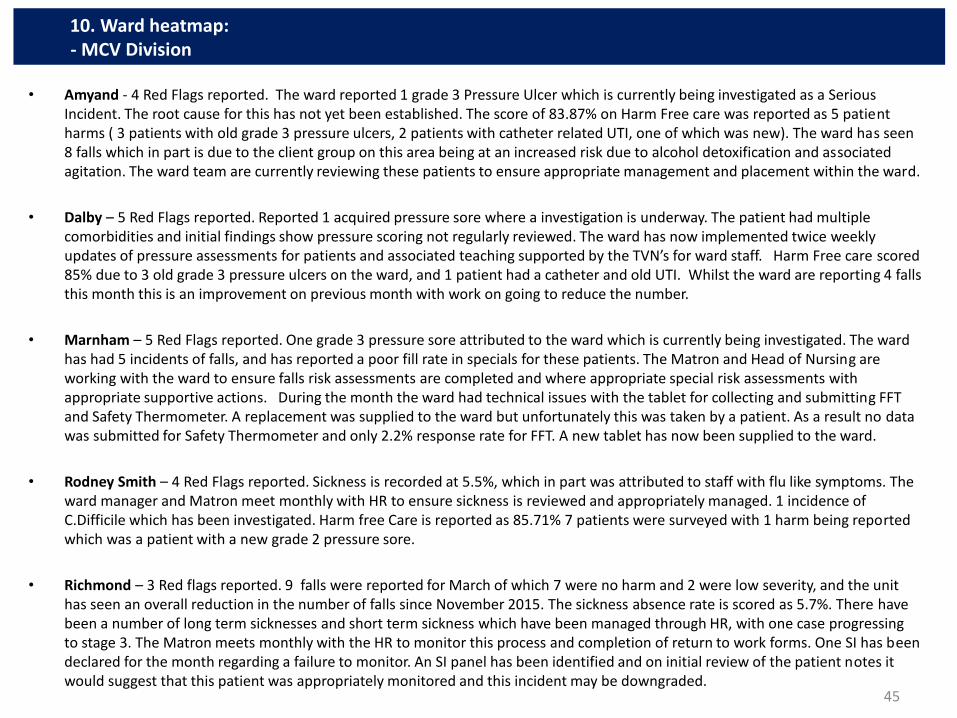
• Amyand - 4 Red Flags reported. The ward reported 1 grade 3 Pressure Ulcer which is currently being investigated as a Serious Incident. The root cause for this has not yet been established. The score of 83.87% on Harm Free care was reported as 5 patient harms ( 3 patients with old grade 3 pressure ulcers, 2 patients with catheter related UTI, one of which was new). The ward has seen 8 falls which in part is due to the client group on this area being at an increased risk due to alcohol detoxification and associated agitation. The ward team are currently reviewing these patients to ensure appropriate management and placement within the ward.
• Dalby – 5 Red Flags reported. Reported 1 acquired pressure sore where a investigation is underway. The patient had multiple comorbidities and initial findings show pressure scoring not regularly reviewed. The ward has now implemented twice weekly updates of pressure assessments for patients and associated teaching supported by the TVN’s for ward staff. Harm Free care scored 85% due to 3 old grade 3 pressure ulcers on the ward, and 1 patient had a catheter and old UTI. Whilst the ward are reporting 4 falls this month this is an improvement on previous month with work on going to reduce the number.
• Marnham – 5 Red Flags reported. One grade 3 pressure sore attributed to the ward which is currently being investigated. The ward has had 5 incidents of falls, and has reported a poor fill rate in specials for these patients. The Matron and Head of Nursing are working with the ward to ensure falls risk assessments are completed and where appropriate special risk assessments with appropriate supportive actions. During the month the ward had technical issues with the tablet for collecting and submitting FFT and Safety Thermometer. A replacement was supplied to the ward but unfortunately this was taken by a patient. As a result no data was submitted for Safety Thermometer and only 2.2% response rate for FFT. A new tablet has now been supplied to the ward.
• Rodney Smith – 4 Red Flags reported. Sickness is recorded at 5.5%, which in part was attributed to staff with flu like symptoms. The ward manager and Matron meet monthly with HR to ensure sickness is reviewed and appropriately managed. 1 incidence of C.Difficile which has been investigated. Harm free Care is reported as 85.71% 7 patients were surveyed with 1 harm being reported which was a patient with a new grade 2 pressure sore.
• Richmond – 3 Red flags reported. 9 falls were reported for March of which 7 were no harm and 2 were low severity, and the unit has seen an overall reduction in the number of falls since November 2015. The sickness absence rate is scored as 5.7%. There have been a number of long term sicknesses and short term sickness which have been managed through HR, with one case progressing to stage 3. The Matron meets monthly with the HR to monitor this process and completion of return to work forms. One SI has been declared for the month regarding a failure to monitor. An SI panel has been identified and on initial review of the patient notes it would suggest that this patient was appropriately monitored and this incident may be downgraded.
45
10. Ward heatmap: - MCV Division
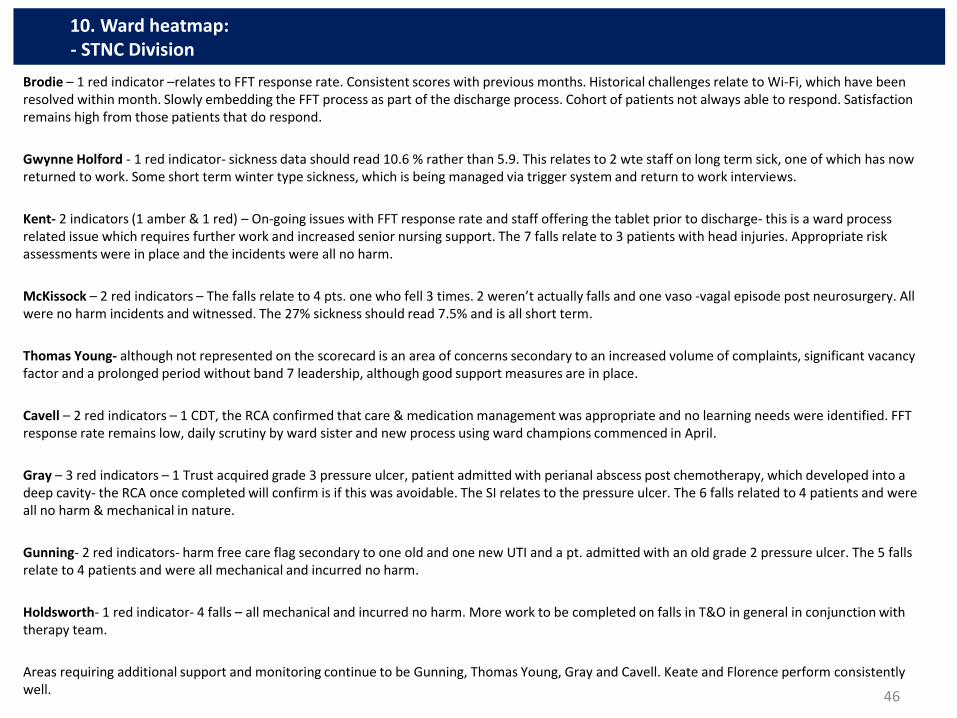
Brodie – 1 red indicator –relates to FFT response rate. Consistent scores with previous months. Historical challenges relate to Wi-Fi, which have been resolved within month. Slowly embedding the FFT process as part of the discharge process. Cohort of patients not always able to respond. Satisfaction remains high from those patients that do respond.
Gwynne Holford - 1 red indicator- sickness data should read 10.6 % rather than 5.9. This relates to 2 wte staff on long term sick, one of which has now returned to work. Some short term winter type sickness, which is being managed via trigger system and return to work interviews.
Kent- 2 indicators (1 amber & 1 red) – On-going issues with FFT response rate and staff offering the tablet prior to discharge- this is a ward process related issue which requires further work and increased senior nursing support. The 7 falls relate to 3 patients with head injuries. Appropriate risk assessments were in place and the incidents were all no harm.
McKissock – 2 red indicators – The falls relate to 4 pts. one who fell 3 times. 2 weren’t actually falls and one vaso -vagal episode post neurosurgery. All were no harm incidents and witnessed. The 27% sickness should read 7.5% and is all short term.
Thomas Young- although not represented on the scorecard is an area of concerns secondary to an increased volume of complaints, significant vacancy factor and a prolonged period without band 7 leadership, although good support measures are in place.
Cavell – 2 red indicators – 1 CDT, the RCA confirmed that care & medication management was appropriate and no learning needs were identified. FFT response rate remains low, daily scrutiny by ward sister and new process using ward champions commenced in April.
Gray – 3 red indicators – 1 Trust acquired grade 3 pressure ulcer, patient admitted with perianal abscess post chemotherapy, which developed into a deep cavity- the RCA once completed will confirm is if this was avoidable. The SI relates to the pressure ulcer. The 6 falls related to 4 patients and were all no harm & mechanical in nature.
Gunning- 2 red indicators- harm free care flag secondary to one old and one new UTI and a pt. admitted with an old grade 2 pressure ulcer. The 5 falls relate to 4 patients and were all mechanical and incurred no harm.
Holdsworth- 1 red indicator- 4 falls – all mechanical and incurred no harm. More work to be completed on falls in T&O in general in conjunction with therapy team.
Areas requiring additional support and monitoring continue to be Gunning, Thomas Young, Gray and Cavell. Keate and Florence perform consistently well.
46
10. Ward heatmap: - STNC Division

Cardiothoracic Intensive Care Unit - 1 pressure ulcer reported in month, this is also reflected as a serious incident on the heat map. The root cause analysis is currently being completed for this. The unit reported 94.4% for harm free care in March 2015; this relates to 1 patient with a new grade 2 pressure ulcer out of a total of 18 patients surveyed.
Champneys - A score of 90% was recorded for harm free care in month; this related to 1 new grade 2 pressure ulcer from a total of 15 patients surveyed. The friends and family response rate, continue to be low at 5.2%, this is being addressed with the senior nursing team responsible for the ward as part of a wider action plan to address key issues on the ward.
Delivery Suite - 6 serious incidents were reported; four of these relate to unexpected admissions to NNU, which is a mandated reporting category. There was also an unexpected neonatal death, and a case of Post partum haemorrhage. All of these serious incidents are currently being investigated.
Freddie Hewitt, Nicholls and Pinckney ward - The above wards reported 0% against the Friends and Family Response rate on the heat map. This is accurate as this initiative is planned to roll out in the paediatric wards in April 2015 and reporting had not started in March 2015.
General Intensive Care Unit - The unit reported 94.1 % for harm free care. This represents 1 patient with a catheter and new UTI, out of a total of 17 patients surveyed.
Neuro Intensive Care Unit - The unit reported 84.6% for harm free care. This represents 2 old grade 2 pressure ulcers out of a total of 13 patients surveyed.
Sickness - Several areas across the division are reporting sickness greater than the Trusts 3% target. Rota management meetings continue across the division to ensure robust management of sickness.
47
10. Ward heatmap: - WCDOP Division
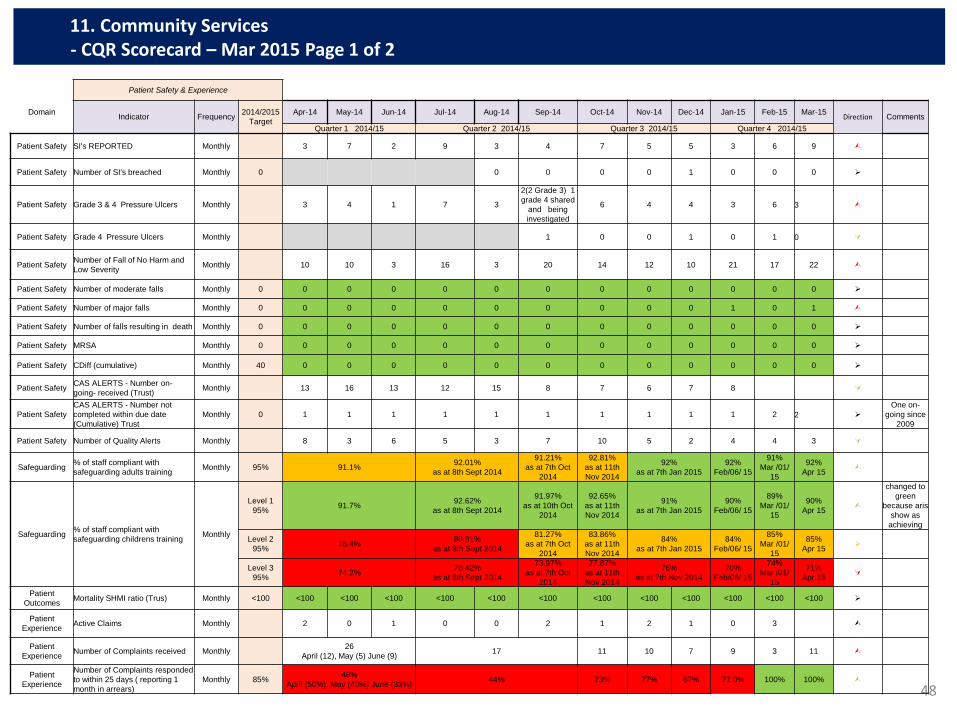
48
11. Community Services - CQR Scorecard – Mar 2015 Page 1 of 2
Patient Safety & Experience
Domain Indicator Frequency
2014/2015
Target
Apr-14 May-14 Jun-14 Jul-14 Aug-14 Sep-14 Oct-14 Nov-14 Dec-14 Jan-15 Feb-15 Mar-15 Direction Comments
Quarter 1 2014/15 Quarter 2 2014/15 Quarter 3 2014/15 Quarter 4 2014/15
Patient Safety SI's REPORTED Monthly 3 7 2 9 3 4 7 5 5 3 6 9
Patient Safety Number of SI's breached Monthly 0 0 0 0 0 1 0 0 0
Patient Safety Grade 3 & 4 Pressure Ulcers Monthly 3 4 1 7 3
2(2 Grade 3) 1
grade 4 shared
and being
investigated
6 4 4 3 6 3
Patient Safety Grade 4 Pressure Ulcers Monthly 1 0 0 1 0 1 0
Patient Safety Number of Fall of No Harm and
Low Severity Monthly 10 10 3 16 3 20 14 12 10 21 17 22
Patient Safety Number of moderate falls Monthly 0 0 0 0 0 0 0 0 0 0 0 0 0
Patient Safety Number of major falls Monthly 0 0 0 0 0 0 0 0 0 0 1 0 1
Patient Safety Number of falls resulting in death Monthly 0 0 0 0 0 0 0 0 0 0 0 0 0
Patient Safety MRSA Monthly 0 0 0 0 0 0 0 0 0 0 0 0 0
Patient Safety CDiff (cumulative) Monthly 40 0 0 0 0 0 0 0 0 0 0 0 0
Patient Safety CAS ALERTS - Number on-
going- received (Trust) Monthly 13 16 13 12 15 8 7 6 7 8
Patient Safety
CAS ALERTS - Number not
completed within due date
(Cumulative) Trust
Monthly 0 1 1 1 1 1 1 1 1 1 1 2 2
One on-
going since
2009
Patient Safety Number of Quality Alerts Monthly 8 3 6 5 3 7 10 5 2 4 4 3
Safeguarding % of staff compliant with
safeguarding adults training Monthly 95% 91.1%
92.01%
as at 8th Sept 2014
91.21%
as at 7th Oct
2014
92.81%
as at 11th
Nov 2014
92%
as at 7th Jan 2015
92%
Feb/06/ 15
91%
Mar /01/
15
92%
Apr 15
Safeguarding % of staff compliant with
safeguarding childrens training Monthly
Level 1
95% 91.7%
92.62%
as at 8th Sept 2014
91.97%
as at 10th Oct
2014
92.65%
as at 11th
Nov 2014
91%
as at 7th Jan 2015
90%
Feb/06/ 15
89%
Mar /01/
15
90%
Apr 15
changed to
green
because aris
show as
achieving
Level 2
95% 78.4%
80.91%
as at 8th Sept 2014
81.27%
as at 7th Oct
2014
83.86%
as at 11th
Nov 2014
84%
as at 7th Jan 2015
84%
Feb/06/ 15
85%
Mar /01/
15
85%
Apr 15
Level 3
95% 74.2%
78.42%
as at 8th Sept 2014
73.97%
as at 7th Oct
2014
77.87%
as at 11th
Nov 2014
76%
as at 7th Nov 2014
70%
Feb/06/ 15
74%
Mar /01/
15
71%
Apr 15
Patient
Outcomes Mortality SHMI ratio (Trus) Monthly <100 <100 <100 <100 <100 <100 <100 <100 <100 <100 <100 <100 <100
Patient
Experience Active Claims Monthly 2 0 1 0 0 2 1 2 1 0 3
Patient
Experience Number of Complaints received Monthly
26
April (12), May (5) June (9) 17 11 10 7 9 3 11
Patient
Experience
Number of Complaints responded
to within 25 days ( reporting 1
month in arrears)
Monthly 85% 46%
April (50%), May (40%) June (33%) 44% 73% 77% 67% 77.0% 100% 100%
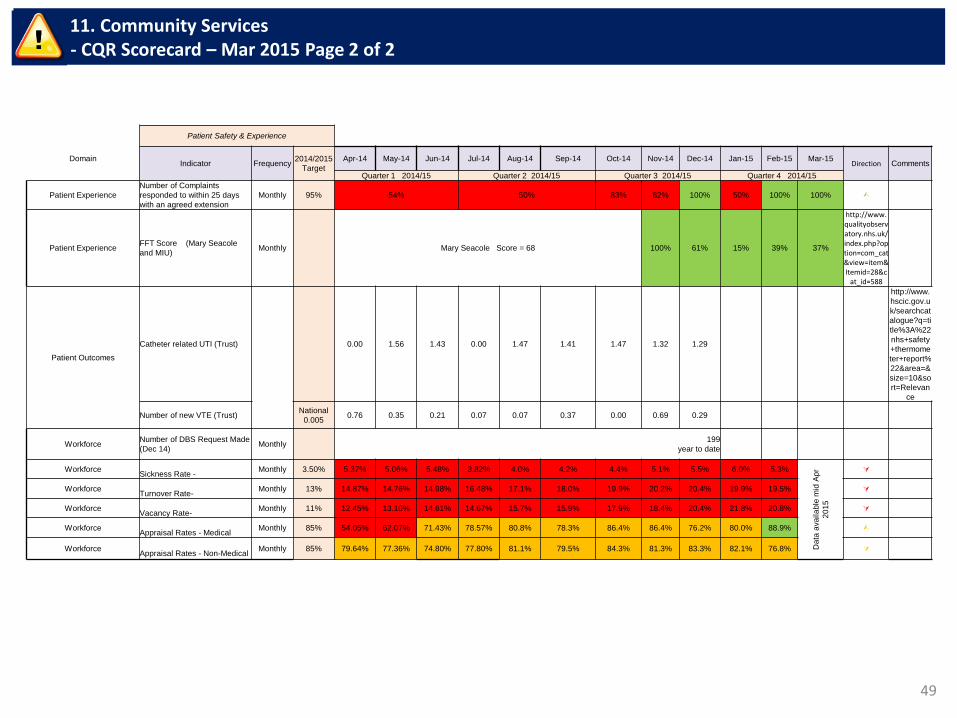
49
11. Community Services - CQR Scorecard – Mar 2015 Page 2 of 2
Patient Safety & Experience
Domain Indicator Frequency
2014/2015
Target
Apr-14 May-14 Jun-14 Jul-14 Aug-14 Sep-14 Oct-14 Nov-14 Dec-14 Jan-15 Feb-15 Mar-15 Direction Comments
Quarter 1 2014/15 Quarter 2 2014/15 Quarter 3 2014/15 Quarter 4 2014/15
Patient Experience
Number of Complaints
responded to within 25 days
with an agreed extension
Monthly 95% 54% 50% 83% 82% 100% 50% 100% 100%
Patient Experience FFT Score (Mary Seacole
and MIU) Monthly Mary Seacole Score = 68 100% 61% 15% 39% 37%
http://www.qualityobservatory.nhs.uk/index.php?option=com_cat&view=item&Itemid=28&c
at_id=588
Patient Outcomes
Catheter related UTI (Trust) 0.00 1.56 1.43 0.00 1.47 1.41 1.47 1.32 1.29
http://www.
hscic.gov.u
k/searchcat
alogue?q=ti
tle%3A%22
nhs+safety
+thermome
ter+report%
22&area=&
size=10&so
rt=Relevan
ce
Number of new VTE (Trust) National
0.005 0.76 0.35 0.21 0.07 0.07 0.37 0.00 0.69 0.29
Workforce Number of DBS Request Made
(Dec 14) Monthly
199
year to date
Workforce
Sickness Rate - Monthly 3.50% 5.37% 5.06% 5.48% 3.82% 4.0% 4.2% 4.4% 5.1% 5.5% 6.0% 5.3%
Data
ava
ila
ble
mid
Ap
r
20
15
Workforce
Turnover Rate- Monthly 13% 14.87% 14.76% 14.98% 16.48% 17.1% 18.0% 19.9% 20.2% 20.4% 19.9% 19.5%
Workforce
Vacancy Rate- Monthly 11% 12.45% 13.10% 14.61% 14.67% 15.7% 15.9% 17.9% 18.4% 20.4% 21.8% 20.8%
Workforce
Appraisal Rates - Medical Monthly 85% 54.05% 62.07% 71.43% 78.57% 80.8% 78.3% 86.4% 86.4% 76.2% 80.0% 88.9% Ù
Workforce
Appraisal Rates - Non-Medical Monthly 85% 79.64% 77.36% 74.80% 77.80% 81.1% 79.5% 84.3% 81.3% 83.3% 82.1% 76.8%
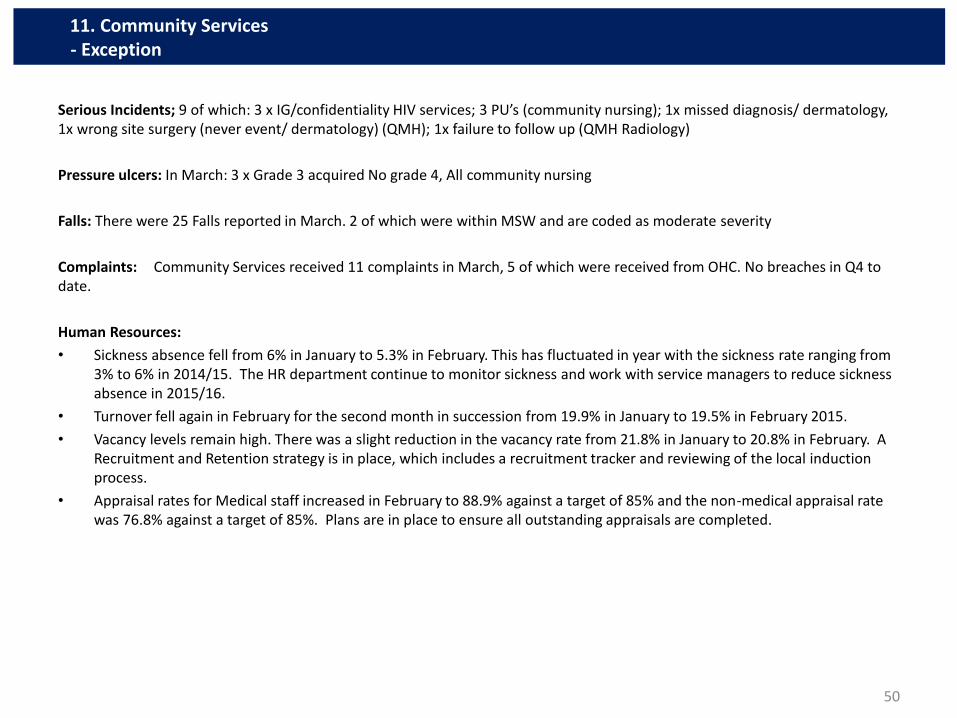
Serious Incidents; 9 of which: 3 x IG/confidentiality HIV services; 3 PU’s (community nursing); 1x missed diagnosis/ dermatology, 1x wrong site surgery (never event/ dermatology) (QMH); 1x failure to follow up (QMH Radiology)
Pressure ulcers: In March: 3 x Grade 3 acquired No grade 4, All community nursing
Falls: There were 25 Falls reported in March. 2 of which were within MSW and are coded as moderate severity
Complaints: Community Services received 11 complaints in March, 5 of which were received from OHC. No breaches in Q4 to date.
Human Resources:
• Sickness absence fell from 6% in January to 5.3% in February. This has fluctuated in year with the sickness rate ranging from 3% to 6% in 2014/15. The HR department continue to monitor sickness and work with service managers to reduce sickness absence in 2015/16.
• Turnover fell again in February for the second month in succession from 19.9% in January to 19.5% in February 2015.
• Vacancy levels remain high. There was a slight reduction in the vacancy rate from 21.8% in January to 20.8% in February. A Recruitment and Retention strategy is in place, which includes a recruitment tracker and reviewing of the local induction process.
• Appraisal rates for Medical staff increased in February to 88.9% against a target of 85% and the non-medical appraisal rate was 76.8% against a target of 85%. Plans are in place to ensure all outstanding appraisals are completed.
50
11. Community Services - Exception
TB April 15-03
1
Finance Report
March 2015 results – Month 12
Trust Board (30th
April 2015)

TB April 15-03
2
THIS PAGE INTENTIONALLY BLANK
TB April 15-03
3
CONTENTS
FINANCE AND ACTIVITY SUMMARY.............................................................................................................. 4
SECTION 1: OVERALL INCOME AND EXPENDITURE ................................................................................... 7
SECTION 2: DIVISIONAL POSITION ............................................................................................................. 10
SECTION 3: INCOME & ACTIVITY ................................................................................................................. 23
SECTION 4: PAY COSTS ............................................................................................................................. 277
SECTION 5: NON-PAY ................................................................................................................................. 299
SECTION 6: CONTINGENCY & RESERVES .............................................................................................. 300
SECTION 7: DIVISIONAL FORECAST ......................................................................................................... 311
SECTION 8: COST REDUCTION PROGRAMME ......................................................................................... 322
SECTION 9: STATEMENT OF FINANCIAL POSITION ................................................................................ 333
SECTION 10 : CASH POSITION ..................................................................................................................... 34
SECTION 11 : BETTER PAYMENT PRACTICE ............................................................................................. 37
SECTION 12: CAPITAL .................................................................................................................................. 38
SECTION 13: CONTINUITY OF SERVICE RISK RATING (CoSRR) ............................................................ 392
APPENDIX 1- AGED DEBT REPORT .......................................................................................................... 433
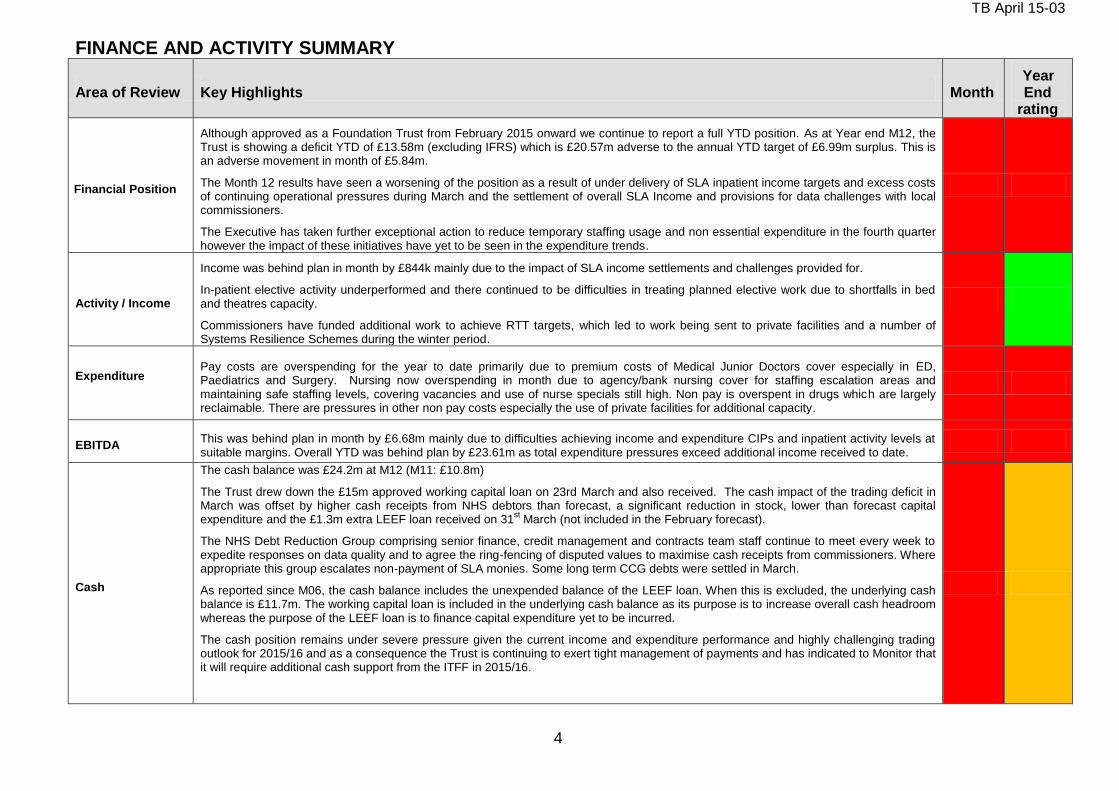
TB April 15-03
4
FINANCE AND ACTIVITY SUMMARY
Area of Review Key Highlights Month Year End
rating
Financial Position
Although approved as a Foundation Trust from February 2015 onward we continue to report a full YTD position. As at Year end M12, the Trust is showing a deficit YTD of £13.58m (excluding IFRS) which is £20.57m adverse to the annual YTD target of £6.99m surplus. This is an adverse movement in month of £5.84m.
The Month 12 results have seen a worsening of the position as a result of under delivery of SLA inpatient income targets and excess costs of continuing operational pressures during March and the settlement of overall SLA Income and provisions for data challenges with local commissioners.
The Executive has taken further exceptional action to reduce temporary staffing usage and non essential expenditure in the fourth quarter however the impact of these initiatives have yet to be seen in the expenditure trends.
Activity / Income
Income was behind plan in month by £844k mainly due to the impact of SLA income settlements and challenges provided for.
In-patient elective activity underperformed and there continued to be difficulties in treating planned elective work due to shortfalls in bed and theatres capacity.
Commissioners have funded additional work to achieve RTT targets, which led to work being sent to private facilities and a number of Systems Resilience Schemes during the winter period.
Expenditure
Pay costs are overspending for the year to date primarily due to premium costs of Medical Junior Doctors cover especially in ED, Paediatrics and Surgery. Nursing now overspending in month due to agency/bank nursing cover for staffing escalation areas and maintaining safe staffing levels, covering vacancies and use of nurse specials still high. Non pay is overspent in drugs which are largely reclaimable. There are pressures in other non pay costs especially the use of private facilities for additional capacity.
EBITDA This was behind plan in month by £6.68m mainly due to difficulties achieving income and expenditure CIPs and inpatient activity levels at suitable margins. Overall YTD was behind plan by £23.61m as total expenditure pressures exceed additional income received to date.
Cash
The cash balance was £24.2m at M12 (M11: £10.8m)
The Trust drew down the £15m approved working capital loan on 23rd March and also received. The cash impact of the trading deficit in March was offset by higher cash receipts from NHS debtors than forecast, a significant reduction in stock, lower than forecast capital expenditure and the £1.3m extra LEEF loan received on 31
st March (not included in the February forecast).
The NHS Debt Reduction Group comprising senior finance, credit management and contracts team staff continue to meet every week to expedite responses on data quality and to agree the ring-fencing of disputed values to maximise cash receipts from commissioners. Where appropriate this group escalates non-payment of SLA monies. Some long term CCG debts were settled in March.
As reported since M06, the cash balance includes the unexpended balance of the LEEF loan. When this is excluded, the underlying cash balance is £11.7m. The working capital loan is included in the underlying cash balance as its purpose is to increase overall cash headroom whereas the purpose of the LEEF loan is to finance capital expenditure yet to be incurred.
The cash position remains under severe pressure given the current income and expenditure performance and highly challenging trading outlook for 2015/16 and as a consequence the Trust is continuing to exert tight management of payments and has indicated to Monitor that it will require additional cash support from the ITFF in 2015/16.
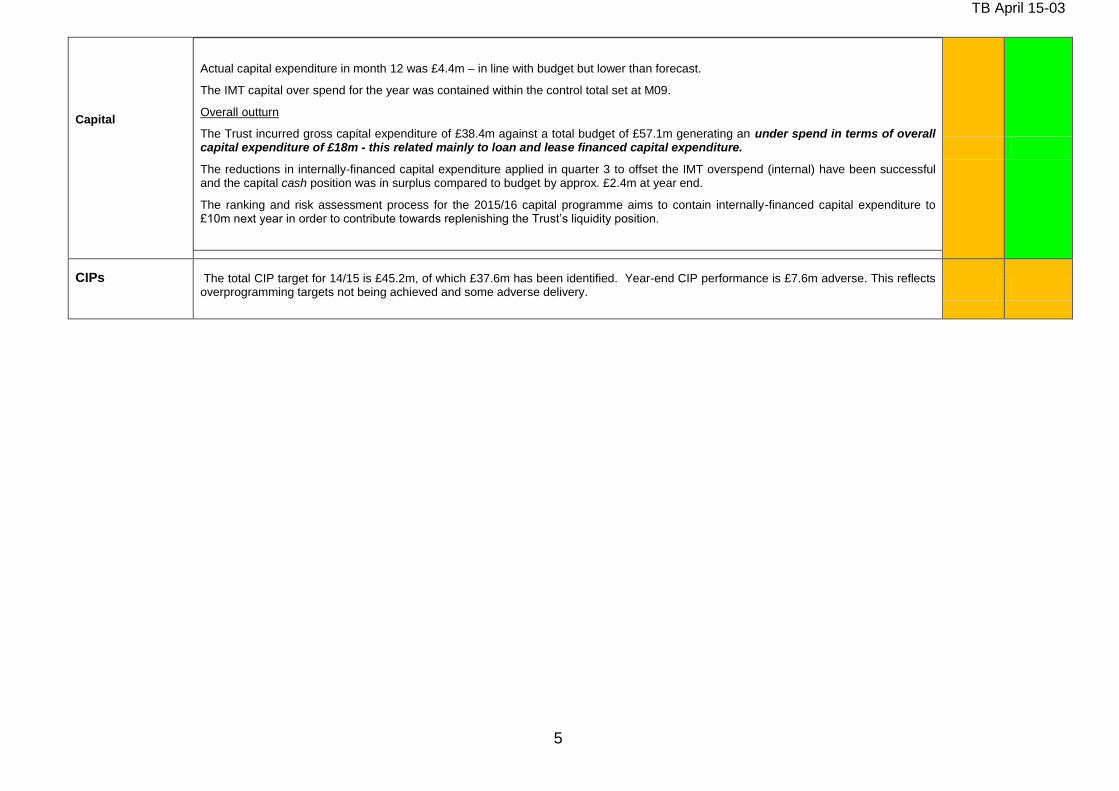
TB April 15-03
5
Capital
Actual capital expenditure in month 12 was £4.4m – in line with budget but lower than forecast.
The IMT capital over spend for the year was contained within the control total set at M09.
Overall outturn
The Trust incurred gross capital expenditure of £38.4m against a total budget of £57.1m generating an under spend in terms of overall capital expenditure of £18m - this related mainly to loan and lease financed capital expenditure.
The reductions in internally-financed capital expenditure applied in quarter 3 to offset the IMT overspend (internal) have been successful and the capital cash position was in surplus compared to budget by approx. £2.4m at year end.
The ranking and risk assessment process for the 2015/16 capital programme aims to contain internally-financed capital expenditure to £10m next year in order to contribute towards replenishing the Trust’s liquidity position.
CIPs
The total CIP target for 14/15 is £45.2m, of which £37.6m has been identified. Year-end CIP performance is £7.6m adverse. This reflects overprogramming targets not being achieved and some adverse delivery.
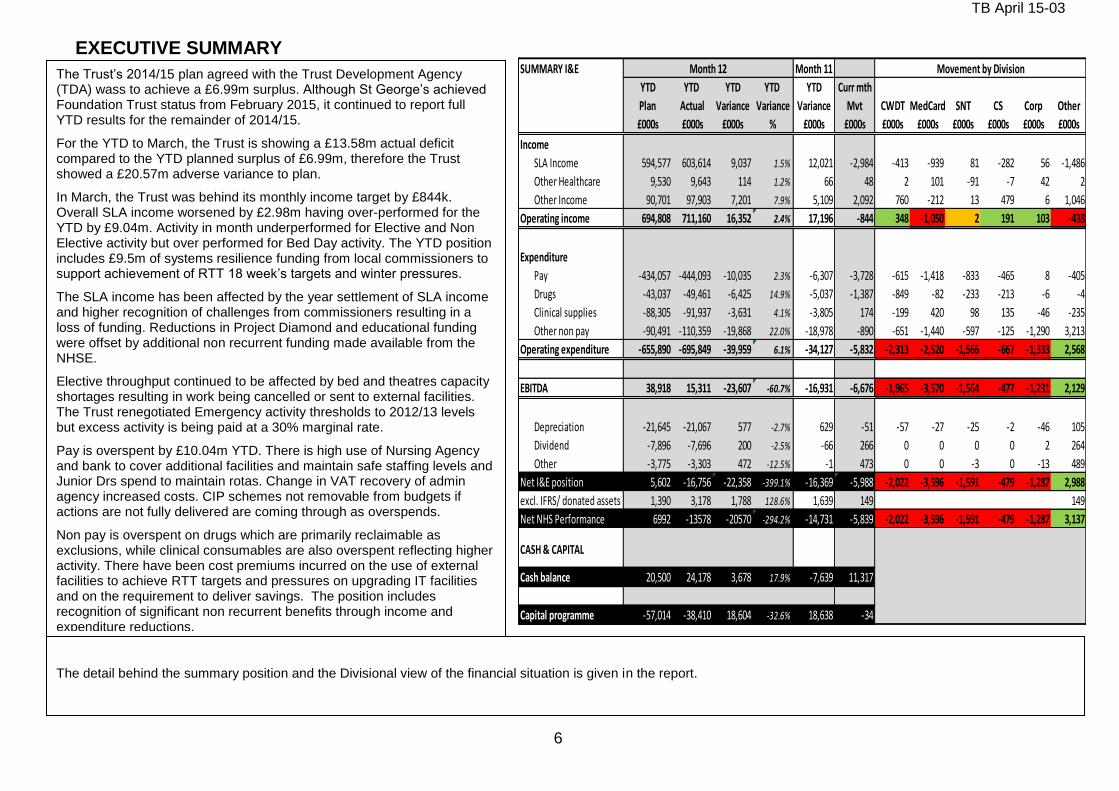
TB April 15-03
6
EXECUTIVE SUMMARY SUMMARY I&E Month 11
YTD YTD YTD YTD YTD Curr mth
Plan Actual Variance Variance Variance Mvt CWDT MedCard SNT CS Corp Other
£000s £000s £000s % £000s £000s £000s £000s £000s £000s £000s £000s
Income
SLA Income 594,577 603,614 9,037 1.5% 12,021 -2,984 -413 -939 81 -282 56 -1,486
Other Healthcare 9,530 9,643 114 1.2% 66 48 2 101 -91 -7 42 2
Other Income 90,701 97,903 7,201 7.9% 5,109 2,092 760 -212 13 479 6 1,046
Operating income 694,808 711,160 16,352 2.4% 17,196 -844 348 -1,050 2 191 103 -438
Expenditure
Pay -434,057 -444,093 -10,035 2.3% -6,307 -3,728 -615 -1,418 -833 -465 8 -405
Drugs -43,037 -49,461 -6,425 14.9% -5,037 -1,387 -849 -82 -233 -213 -6 -4
Clinical supplies -88,305 -91,937 -3,631 4.1% -3,805 174 -199 420 98 135 -46 -235
Other non pay -90,491 -110,359 -19,868 22.0% -18,978 -890 -651 -1,440 -597 -125 -1,290 3,213
Operating expenditure -655,890 -695,849 -39,959 6.1% -34,127 -5,832 -2,313 -2,520 -1,566 -667 -1,333 2,568
EBITDA 38,918 15,311 -23,607 -60.7% -16,931 -6,676 -1,965 -3,570 -1,564 -477 -1,231 2,129
Depreciation -21,645 -21,067 577 -2.7% 629 -51 -57 -27 -25 -2 -46 105
Dividend -7,896 -7,696 200 -2.5% -66 266 0 0 0 0 2 264
Other -3,775 -3,303 472 -12.5% -1 473 0 0 -3 0 -13 489
Net I&E position 5,602 -16,756 -22,358 -399.1% -16,369 -5,988 -2,022 -3,596 -1,591 -479 -1,287 2,988
excl. IFRS/ donated assets 1,390 3,178 1,788 128.6% 1,639 149 149
Net NHS Performance 6992 -13578 -20570 -294.2% -14,731 -5,839 -2,022 -3,596 -1,591 -479 -1,287 3,137
CASH & CAPITAL
Cash balance 20,500 24,178 3,678 17.9% -7,639 11,317
Capital programme -57,014 -38,410 18,604 -32.6% 18,638 -34
Month 12 Movement by Division
The detail behind the summary position and the Divisional view of the financial situation is given in the report.
The Trust’s 2014/15 plan agreed with the Trust Development Agency (TDA) wass to achieve a £6.99m surplus. Although St George’s achieved Foundation Trust status from February 2015, it continued to report full YTD results for the remainder of 2014/15.
For the YTD to March, the Trust is showing a £13.58m actual deficit compared to the YTD planned surplus of £6.99m, therefore the Trust showed a £20.57m adverse variance to plan.
In March, the Trust was behind its monthly income target by £844k. Overall SLA income worsened by £2.98m having over-performed for the YTD by £9.04m. Activity in month underperformed for Elective and Non Elective activity but over performed for Bed Day activity. The YTD position includes £9.5m of systems resilience funding from local commissioners to support achievement of RTT 18 week’s targets and winter pressures.
The SLA income has been affected by the year settlement of SLA income and higher recognition of challenges from commissioners resulting in a loss of funding. Reductions in Project Diamond and educational funding were offset by additional non recurrent funding made available from the NHSE.
Elective throughput continued to be affected by bed and theatres capacity shortages resulting in work being cancelled or sent to external facilities. The Trust renegotiated Emergency activity thresholds to 2012/13 levels but excess activity is being paid at a 30% marginal rate.
Pay is overspent by £10.04m YTD. There is high use of Nursing Agency and bank to cover additional facilities and maintain safe staffing levels and Junior Drs spend to maintain rotas. Change in VAT recovery of admin agency increased costs. CIP schemes not removable from budgets if actions are not fully delivered are coming through as overspends.
Non pay is overspent on drugs which are primarily reclaimable as exclusions, while clinical consumables are also overspent reflecting higher activity. There have been cost premiums incurred on the use of external facilities to achieve RTT targets and pressures on upgrading IT facilities and on the requirement to deliver savings. The position includes recognition of significant non recurrent benefits through income and expenditure reductions.
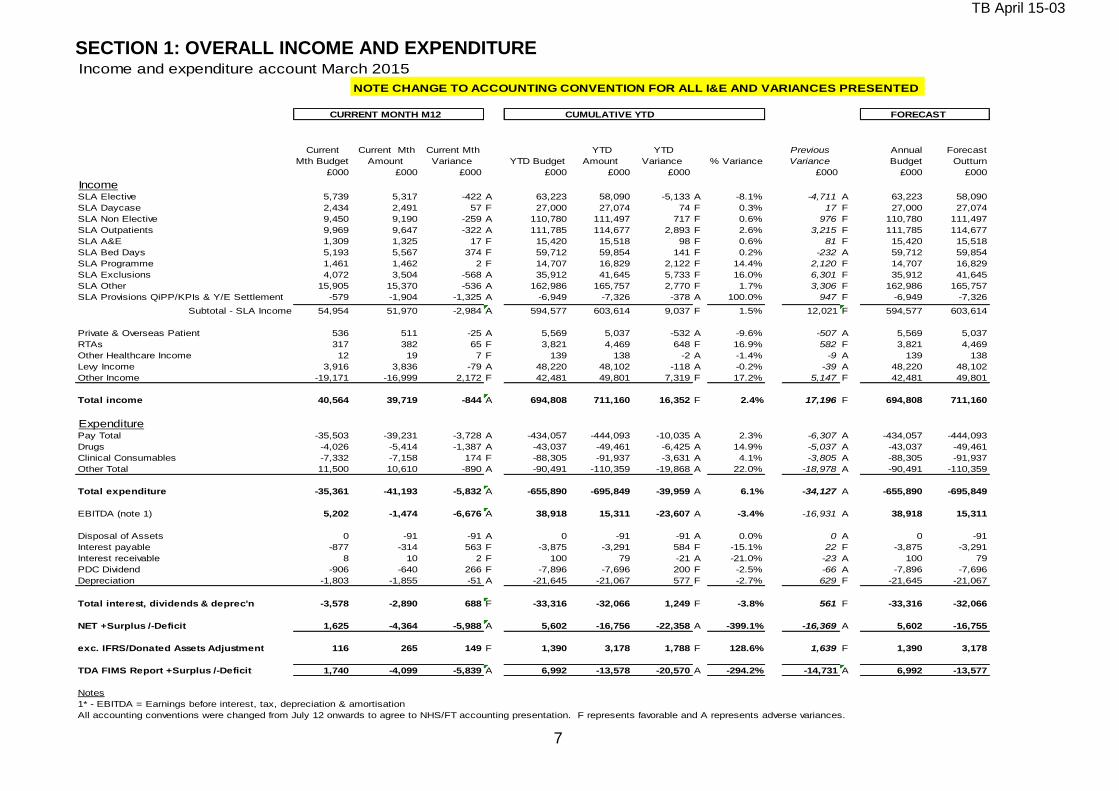
TB April 15-03
7
SECTION 1: OVERALL INCOME AND EXPENDITURE Income and expenditure account March 2015
NOTE CHANGE TO ACCOUNTING CONVENTION FOR ALL I&E AND VARIANCES PRESENTED
CURRENT MONTH M12 CUMULATIVE YTD FORECAST
Current
Mth Budget
Current Mth
Amount
Current Mth
Variance YTD Budget
YTD
Amount
YTD
Variance % Variance
Previous
Variance
Annual
Budget
Forecast
Outturn
£000 £000 £000 £000 £000 £000 £000 £000 £000
IncomeSLA Elective 5,739 5,317 -422 A 63,223 58,090 -5,133 A -8.1% -4,711 A 63,223 58,090
SLA Daycase 2,434 2,491 57 F 27,000 27,074 74 F 0.3% 17 F 27,000 27,074
SLA Non Elective 9,450 9,190 -259 A 110,780 111,497 717 F 0.6% 976 F 110,780 111,497
SLA Outpatients 9,969 9,647 -322 A 111,785 114,677 2,893 F 2.6% 3,215 F 111,785 114,677
SLA A&E 1,309 1,325 17 F 15,420 15,518 98 F 0.6% 81 F 15,420 15,518
SLA Bed Days 5,193 5,567 374 F 59,712 59,854 141 F 0.2% -232 A 59,712 59,854
SLA Programme 1,461 1,462 2 F 14,707 16,829 2,122 F 14.4% 2,120 F 14,707 16,829
SLA Exclusions 4,072 3,504 -568 A 35,912 41,645 5,733 F 16.0% 6,301 F 35,912 41,645
SLA Other 15,905 15,370 -536 A 162,986 165,757 2,770 F 1.7% 3,306 F 162,986 165,757
SLA Provisions QiPP/KPIs & Y/E Settlement -579 -1,904 -1,325 A -6,949 -7,326 -378 A 100.0% 947 F -6,949 -7,326
Subtotal - SLA Income 54,954 51,970 -2,984 A 594,577 603,614 9,037 F 1.5% 12,021 F 594,577 603,614
Private & Overseas Patient 536 511 -25 A 5,569 5,037 -532 A -9.6% -507 A 5,569 5,037
RTAs 317 382 65 F 3,821 4,469 648 F 16.9% 582 F 3,821 4,469
Other Healthcare Income 12 19 7 F 139 138 -2 A -1.4% -9 A 139 138
Levy Income 3,916 3,836 -79 A 48,220 48,102 -118 A -0.2% -39 A 48,220 48,102
Other Income -19,171 -16,999 2,172 F 42,481 49,801 7,319 F 17.2% 5,147 F 42,481 49,801
Total income 40,564 39,719 -844 A 694,808 711,160 16,352 F 2.4% 17,196 F 694,808 711,160
ExpenditurePay Total -35,503 -39,231 -3,728 A -434,057 -444,093 -10,035 A 2.3% -6,307 A -434,057 -444,093
Drugs -4,026 -5,414 -1,387 A -43,037 -49,461 -6,425 A 14.9% -5,037 A -43,037 -49,461
Clinical Consumables -7,332 -7,158 174 F -88,305 -91,937 -3,631 A 4.1% -3,805 A -88,305 -91,937
Other Total 11,500 10,610 -890 A -90,491 -110,359 -19,868 A 22.0% -18,978 A -90,491 -110,359
Total expenditure -35,361 -41,193 -5,832 A -655,890 -695,849 -39,959 A 6.1% -34,127 A -655,890 -695,849
EBITDA (note 1) 5,202 -1,474 -6,676 A 38,918 15,311 -23,607 A -3.4% -16,931 A 38,918 15,311
Disposal of Assets 0 -91 -91 A 0 -91 -91 A 0.0% 0 A 0 -91
Interest payable -877 -314 563 F -3,875 -3,291 584 F -15.1% 22 F -3,875 -3,291
Interest receivable 8 10 2 F 100 79 -21 A -21.0% -23 A 100 79
PDC Dividend -906 -640 266 F -7,896 -7,696 200 F -2.5% -66 A -7,896 -7,696
Depreciation -1,803 -1,855 -51 A -21,645 -21,067 577 F -2.7% 629 F -21,645 -21,067
Total interest, dividends & deprec'n -3,578 -2,890 688 F -33,316 -32,066 1,249 F -3.8% 561 F -33,316 -32,066
NET +Surplus /-Deficit 1,625 -4,364 -5,988 A 5,602 -16,756 -22,358 A -399.1% -16,369 A 5,602 -16,755
exc. IFRS/Donated Assets Adjustment 116 265 149 F 1,390 3,178 1,788 F 128.6% 1,639 F 1,390 3,178
TDA FIMS Report +Surplus /-Deficit 1,740 -4,099 -5,839 A 6,992 -13,578 -20,570 A -294.2% -14,731 A 6,992 -13,577
Notes
1* - EBITDA = Earnings before interest, tax, depreciation & amortisation
All accounting conventions were changed from July 12 onwards to agree to NHS/FT accounting presentation. F represents favorable and A represents adverse variances.
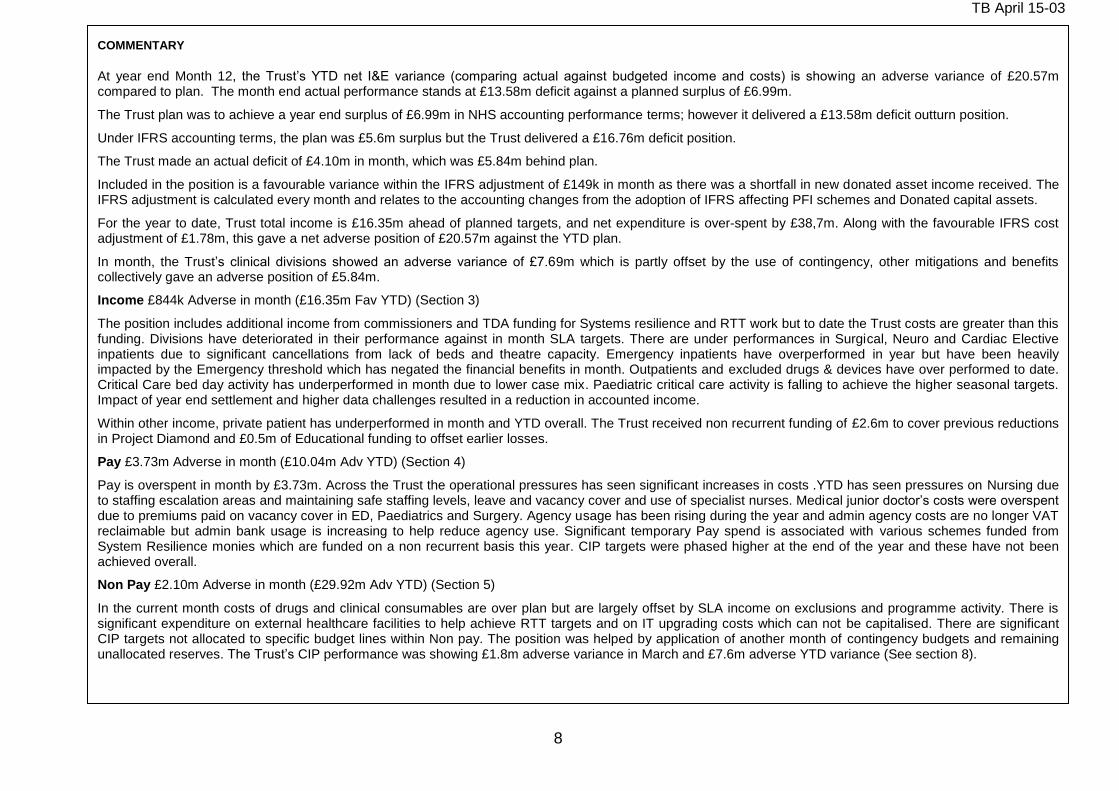
TB April 15-03
8
COMMENTARY
At year end Month 12, the Trust’s YTD net I&E variance (comparing actual against budgeted income and costs) is showing an adverse variance of £20.57m compared to plan. The month end actual performance stands at £13.58m deficit against a planned surplus of £6.99m.
The Trust plan was to achieve a year end surplus of £6.99m in NHS accounting performance terms; however it delivered a £13.58m deficit outturn position.
Under IFRS accounting terms, the plan was £5.6m surplus but the Trust delivered a £16.76m deficit position.
The Trust made an actual deficit of £4.10m in month, which was £5.84m behind plan.
Included in the position is a favourable variance within the IFRS adjustment of £149k in month as there was a shortfall in new donated asset income received. The IFRS adjustment is calculated every month and relates to the accounting changes from the adoption of IFRS affecting PFI schemes and Donated capital assets.
For the year to date, Trust total income is £16.35m ahead of planned targets, and net expenditure is over-spent by £38,7m. Along with the favourable IFRS cost adjustment of £1.78m, this gave a net adverse position of £20.57m against the YTD plan.
In month, the Trust’s clinical divisions showed an adverse variance of £7.69m which is partly offset by the use of contingency, other mitigations and benefits collectively gave an adverse position of £5.84m.
Income £844k Adverse in month (£16.35m Fav YTD) (Section 3)
The position includes additional income from commissioners and TDA funding for Systems resilience and RTT work but to date the Trust costs are greater than this funding. Divisions have deteriorated in their performance against in month SLA targets. There are under performances in Surgical, Neuro and Cardiac Elective inpatients due to significant cancellations from lack of beds and theatre capacity. Emergency inpatients have overperformed in year but have been heavily impacted by the Emergency threshold which has negated the financial benefits in month. Outpatients and excluded drugs & devices have over performed to date. Critical Care bed day activity has underperformed in month due to lower case mix. Paediatric critical care activity is falling to achieve the higher seasonal targets. Impact of year end settlement and higher data challenges resulted in a reduction in accounted income.
Within other income, private patient has underperformed in month and YTD overall. The Trust received non recurrent funding of £2.6m to cover previous reductions in Project Diamond and £0.5m of Educational funding to offset earlier losses.
Pay £3.73m Adverse in month (£10.04m Adv YTD) (Section 4)
Pay is overspent in month by £3.73m. Across the Trust the operational pressures has seen significant increases in costs .YTD has seen pressures on Nursing due to staffing escalation areas and maintaining safe staffing levels, leave and vacancy cover and use of specialist nurses. Medical junior doctor’s costs were overspent due to premiums paid on vacancy cover in ED, Paediatrics and Surgery. Agency usage has been rising during the year and admin agency costs are no longer VAT reclaimable but admin bank usage is increasing to help reduce agency use. Significant temporary Pay spend is associated with various schemes funded from System Resilience monies which are funded on a non recurrent basis this year. CIP targets were phased higher at the end of the year and these have not been achieved overall.
Non Pay £2.10m Adverse in month (£29.92m Adv YTD) (Section 5)
In the current month costs of drugs and clinical consumables are over plan but are largely offset by SLA income on exclusions and programme activity. There is significant expenditure on external healthcare facilities to help achieve RTT targets and on IT upgrading costs which can not be capitalised. There are significant CIP targets not allocated to specific budget lines within Non pay. The position was helped by application of another month of contingency budgets and remaining unallocated reserves. The Trust’s CIP performance was showing £1.8m adverse variance in March and £7.6m adverse YTD variance (See section 8).

TB April 15-03
9
Charts showing in month and cumulative position against plan
-8,000
-6,000
-4,000
-2,000
0
2,000
4,000
M1 M2 M3 M4 M5 M6 M7 M8 M9 M10 M11 M12
-De
fici
t/+
Surp
lus
£0
00
'sMonthly I&E
Plan Actual Variance
-15,000
-10,000
-5,000
0
5,000
10,000
M1 M2 M3 M4 M5 M6 M7 M8 M9 M10 M11 M12
-Def
ict/
+Sur
plus
(£0
00s)
I&E Trajectory
NTDA PlanYTD
Actual YTD
Forecast YTD

TB April 15-03
10
SECTION 2: DIVISIONAL POSITION
SUMMARY OF DIRECTORATE PERFORMANCE NOTE CHANGE TO ACCOUNTING CONVENTION FOR ALL I&E AND VARIANCES PRESENTED
As at March 2015
CURRENT MONTH M12 CUMULATIVE YTD
Responsible Directorate
Current
Month
Budget
Current
Month
Amount
Current
Month
Variance
YTD
Budget
YTD
Amount
YTD
Variance
%
Variance
Previous
Variance
Annual
Budget
£000's £000's £000's £000's £000's £000's £000's
Director of Operations C&W, Diagnostics, Therapies
Childrens Services 791 816 25 F 5,843 2,185 -3,658 A -62.6% -3,683 5,843
Womens Services 1,466 608 -858 A 15,991 14,117 -1,874 A -11.7% -1,015 15,991
Diagnostics -1,268 -2,469 -1,201 A -15,724 -18,995 -3,271 A 20.8% -2,069 -15,724
Critical Care 757 905 148 F 6,074 4,570 -1,504 A -24.8% -1,652 6,074
Outpatients -856 -866 -10 A -10,331 -10,745 -413 A 4.0% -404 -10,331
Therapies -682 -844 -162 A -8,491 -8,960 -469 A 5.5% -307 -8,491
CWDT Division Management -190 -112 78 F -2,274 -1,174 1,100 F -48.4% 1,022 -2,274
Pharmacy -437 -480 -43 A -5,365 -5,640 -275 A 5.1% -233 -5,365
Total - Division -420 -2,443 -2,022 A -14,277 -24,641 -10,364 A 72.6% -8,341 -14,277
Southwest London Pathology 252 252 0 A 0 0 0 A 0.0% 0 0
Medicine and Cardiac
Acute Medicine 766 -1,087 -1,854 A 7,703 5,768 -1,935 A -25.1% -81 7,703
Emergency Department 587 538 -49 A 5,940 4,984 -956 A -16.1% -907 5,940
Cardiothoracic & Vascular Services 2,530 2,375 -156 A 25,633 21,927 -3,706 A -14.5% -3,550 25,633
Specialist Medicine 1,318 840 -478 A 11,521 11,895 374 F 3.2% 852 11,521
Renal & Oncology 1,573 513 -1,060 A 10,698 8,062 -2,635 A -24.6% -1,576 10,698
Total - Division 6,775 3,178 -3,596 A 61,495 52,637 -8,858 A -14.4% -5,261 61,495
Surgery, Neuro, Theatres and Anaes
Surgery 4,702 3,625 -1,077 A 49,434 39,681 -9,753 A -19.7% -8,676 49,434
Neuro 2,748 2,340 -408 A 27,683 22,313 -5,370 A -19.4% -4,962 27,683
Theatres and Anaesthetics -2,949 -3,032 -83 A -35,023 -35,097 -74 A 0.2% 10 -35,023
Cancer -39 -61 -23 A -501 -696 -195 A 39.0% -173 -501
Total - Division 4,463 2,871 -1,591 A 41,593 26,201 -15,392 A -37.0% -13,801 41,593
Community COO Community Services
Adult + Diagnostic Srvcs 1,880 1,505 -376 A 21,103 17,314 -3,789 A -18% -3,413 21,103
Provider Management 6 -25 -31 A -770 -1,207 -437 A 57% -406 -770
Children+FamilyServices 369 724 355 F 4,408 5,407 999 F 23% 644 4,408
Community PLD 48 77 29 F 579 816 236 F 41% 207 579
GU Medicine 573 618 45 F 6,419 8,182 1,763 F 27% 1,718 6,419
Provider Older Services -194 -679 -485 A 174 -2,340 -2,514 A -1447% -2,029 174
Prison Services -68 30 97 F 1,138 507 -631 A -55% -728 1,138
Senior Health (See* Note 1 below) 0 0 0 A 0 0 0 A 0 0
Provider Overheads -1,120 -1,234 -114 A -13,594 -13,858 -263 A 2% -150 -13,594
Total - Division 1,493 1,014 -479 A 19,457 14,821 -4,635 A -24% -4,156 19,457
Total - Clinical Directorates 12,562 4,873 -7,689 A 108,267 69,018 -39,249 A -36.3% -31,560 108,267
Overheads
Chief Executive Chief Executive, Governance -1,100 -1,067 33 F -12,073 -12,078 -5 A 0.0% -38 -12,073
Director of Finance Finance, Info, Procurement, Computing -1,764 -2,109 -345 A -21,611 -24,150 -2,539 A 11.7% -2,194 -21,611
Director of Operations Operations & Service Improvement -370 -323 46 F -4,424 -3,926 498 F -11.3% 452 -4,424
Director of Nursing Nursing Directorate -239 -189 49 F -2,901 -2,698 203 F -7.0% 153 -2,901
Director of HR HR, Ed & Training -385 -350 35 F -4,686 -4,417 270 F -5.8% 234 -4,686
Other Other -1 -8 -7 A -17 -87 -70 A 407.0% -63 -17
Director of Estates Estates & Facilities -3,121 -4,222 -1,102 A -41,152 -44,228 -3,076 A 7.5% -1,975 -41,152
Director of R&D Research & Development Total -52 -24 28 F -263 -235 28 F -10.7% 0 -263
Others Trust Income 2,154 770 -1,384 A -316 6,999 7,315 F -2314.1% 8,699 -316
Disposal of Assets - Central 0 -91 -91 A 0 -91 -91 A 0.0% 0 0
Central Budgets -4,412 -1,167 3,245 F -4,978 5,029 10,007 F -201.1% 6,762 -4,968
Contingency Funds -240 0 240 F -2,990 0 2,990 F 0.0% 2,750 -3,000
Interest Payable Loans -606 -28 579 F -631 -83 548 F 0.0% -30 -631
Interest Receivable 8 10 2 F 100 79 -21 A -21.0% -23 100
Central Capital Charges (PDC/Deprc'n) -809 -437 371 F -6,723 -5,889 834 F 0.0% 463 -6,723
Total - Non Clinical -10,938 -9,237 1,701 F -102,665 -85,774 16,891 F -16.5% 15,190 -102,665
NET +Surplus / -Deficit 1,625 -4,364 -5,988 A 5,602 -16,756 -22,358 A -399.1% -16,369 5,602
exc. IFRS Adjustment 116 265 149 F 1,390 3,178 1,788 F 128.6% 1,639 1,390
TDA FIMS Report +Surplus / -Deficit 1,740 -4,099 -5,839 A 6,992 -13,578 -20,570 A -294.2% -14,731 6,992
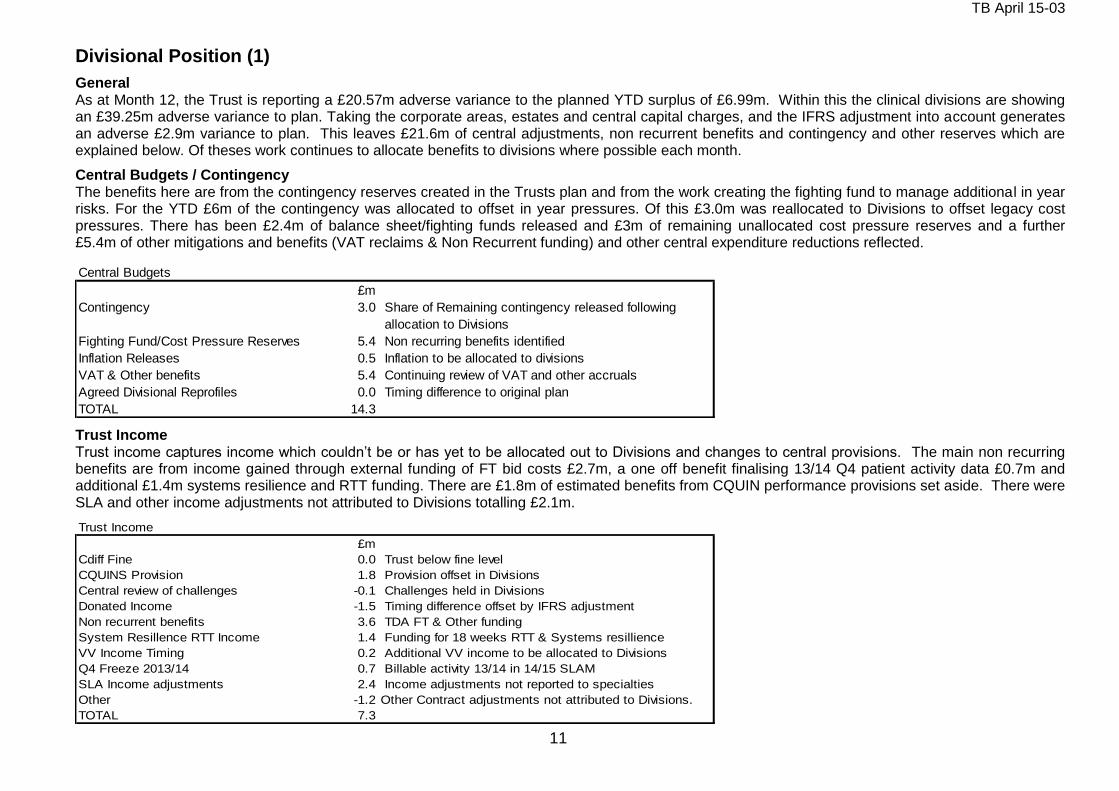
TB April 15-03
11
Divisional Position (1)
General As at Month 12, the Trust is reporting a £20.57m adverse variance to the planned YTD surplus of £6.99m. Within this the clinical divisions are showing an £39.25m adverse variance to plan. Taking the corporate areas, estates and central capital charges, and the IFRS adjustment into account generates an adverse £2.9m variance to plan. This leaves £21.6m of central adjustments, non recurrent benefits and contingency and other reserves which are explained below. Of theses work continues to allocate benefits to divisions where possible each month.
Central Budgets / Contingency The benefits here are from the contingency reserves created in the Trusts plan and from the work creating the fighting fund to manage additional in year risks. For the YTD £6m of the contingency was allocated to offset in year pressures. Of this £3.0m was reallocated to Divisions to offset legacy cost pressures. There has been £2.4m of balance sheet/fighting funds released and £3m of remaining unallocated cost pressure reserves and a further £5.4m of other mitigations and benefits (VAT reclaims & Non Recurrent funding) and other central expenditure reductions reflected.
Central Budgets
£m
Contingency 3.0 Share of Remaining contingency released following
allocation to Divisions
Fighting Fund/Cost Pressure Reserves 5.4 Non recurring benefits identified
Inflation Releases 0.5 Inflation to be allocated to divisions
VAT & Other benefits 5.4 Continuing review of VAT and other accruals
Agreed Divisional Reprofiles 0.0 Timing difference to original plan
TOTAL 14.3
Trust Income Trust income captures income which couldn’t be or has yet to be allocated out to Divisions and changes to central provisions. The main non recurring benefits are from income gained through external funding of FT bid costs £2.7m, a one off benefit finalising 13/14 Q4 patient activity data £0.7m and additional £1.4m systems resilience and RTT funding. There are £1.8m of estimated benefits from CQUIN performance provisions set aside. There were SLA and other income adjustments not attributed to Divisions totalling £2.1m.
Trust Income
£m
Cdiff Fine 0.0 Trust below fine level
CQUINS Provision 1.8 Provision offset in Divisions
Central review of challenges -0.1 Challenges held in Divisions
Donated Income -1.5 Timing difference offset by IFRS adjustment
Non recurrent benefits 3.6 TDA FT & Other funding
System Resillence RTT Income 1.4 Funding for 18 weeks RTT & Systems resillience
VV Income Timing 0.2 Additional VV income to be allocated to Divisions
Q4 Freeze 2013/14 0.7 Billable activity 13/14 in 14/15 SLAM
SLA Income adjustments 2.4 Income adjustments not reported to specialties
Other -1.2 Other Contract adjustments not attributed to Divisions.
TOTAL 7.3
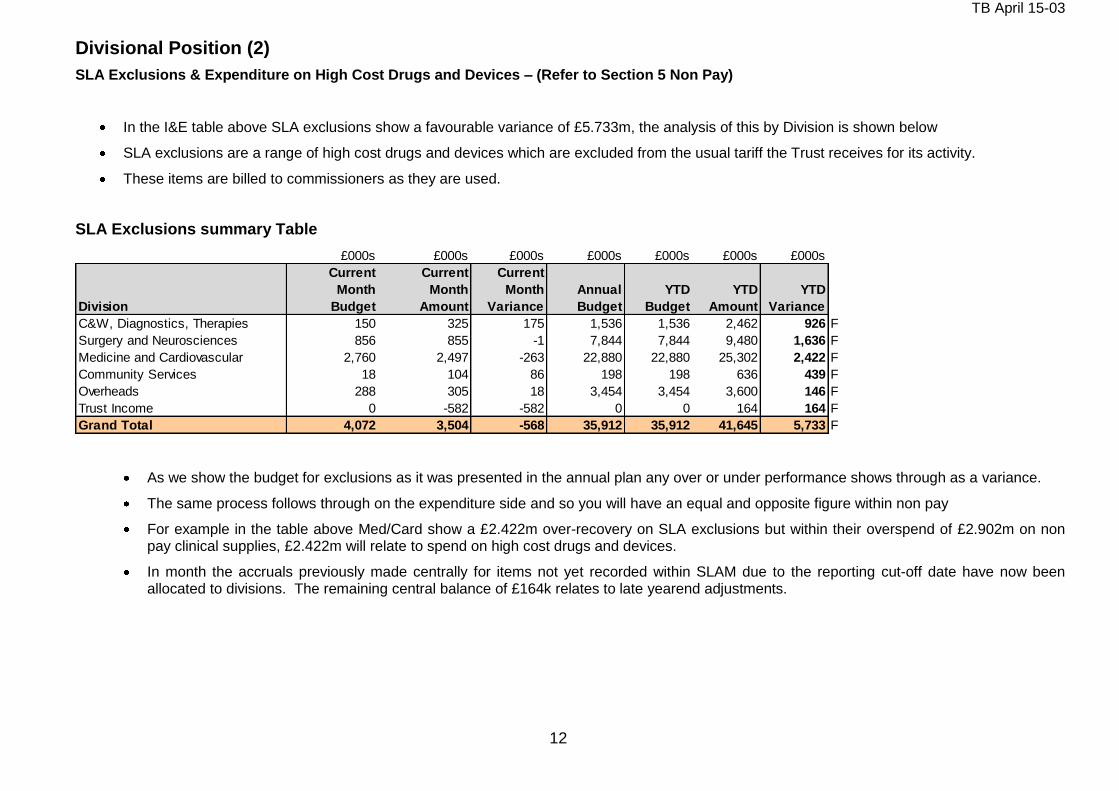
TB April 15-03
12
Divisional Position (2)
SLA Exclusions & Expenditure on High Cost Drugs and Devices – (Refer to Section 5 Non Pay)
In the I&E table above SLA exclusions show a favourable variance of £5.733m, the analysis of this by Division is shown below
SLA exclusions are a range of high cost drugs and devices which are excluded from the usual tariff the Trust receives for its activity.
These items are billed to commissioners as they are used.
SLA Exclusions summary Table
£000s £000s £000s £000s £000s £000s £000s
Division
Current
Month
Budget
Current
Month
Amount
Current
Month
Variance
Annual
Budget
YTD
Budget
YTD
Amount
YTD
Variance
C&W, Diagnostics, Therapies 150 325 175 1,536 1,536 2,462 926 F
Surgery and Neurosciences 856 855 -1 7,844 7,844 9,480 1,636 F
Medicine and Cardiovascular 2,760 2,497 -263 22,880 22,880 25,302 2,422 F
Community Services 18 104 86 198 198 636 439 F
Overheads 288 305 18 3,454 3,454 3,600 146 F
Trust Income 0 -582 -582 0 0 164 164 F
Grand Total 4,072 3,504 -568 35,912 35,912 41,645 5,733 F
As we show the budget for exclusions as it was presented in the annual plan any over or under performance shows through as a variance.
The same process follows through on the expenditure side and so you will have an equal and opposite figure within non pay
For example in the table above Med/Card show a £2.422m over-recovery on SLA exclusions but within their overspend of £2.902m on non pay clinical supplies, £2.422m will relate to spend on high cost drugs and devices.
In month the accruals previously made centrally for items not yet recorded within SLAM due to the reporting cut-off date have now been allocated to divisions. The remaining central balance of £164k relates to late yearend adjustments.
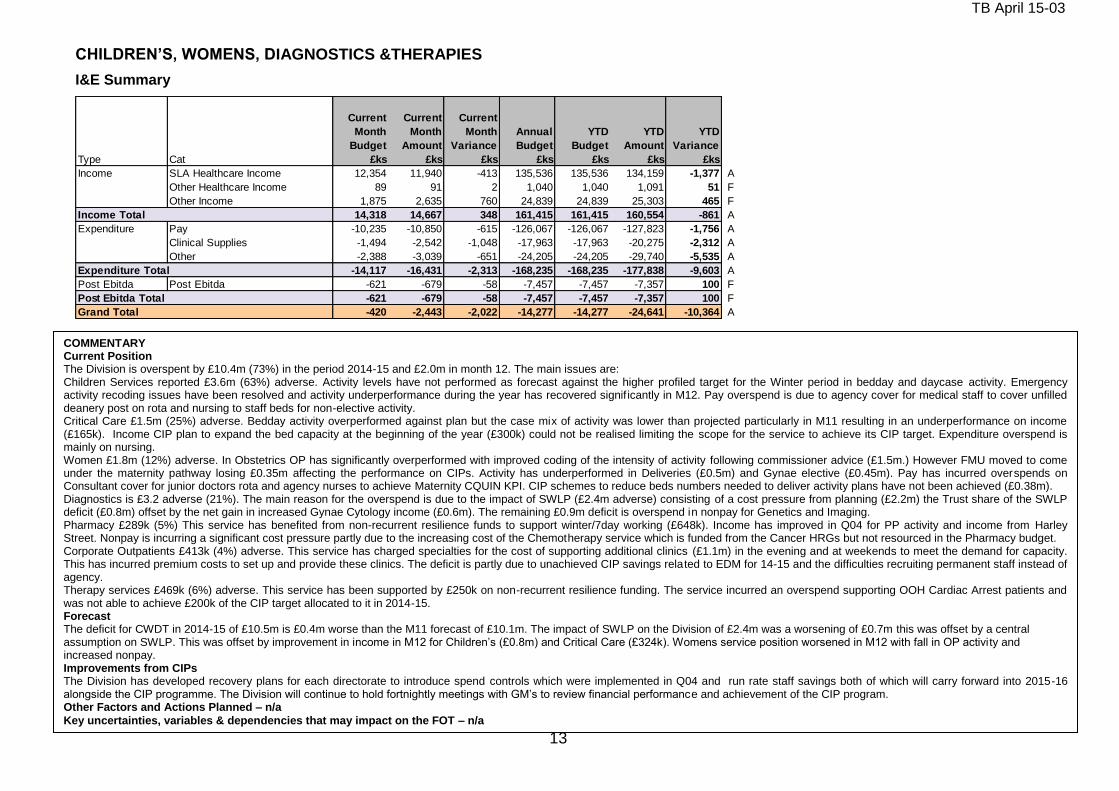
TB April 15-03
13
CHILDREN’S, WOMENS, DIAGNOSTICS &THERAPIES
I&E Summary
Type Cat
Current
Month
Budget
£ks
Current
Month
Amount
£ks
Current
Month
Variance
£ks
Annual
Budget
£ks
YTD
Budget
£ks
YTD
Amount
£ks
YTD
Variance
£ks
Income SLA Healthcare Income 12,354 11,940 -413 135,536 135,536 134,159 -1,377 A
Other Healthcare Income 89 91 2 1,040 1,040 1,091 51 F
Other Income 1,875 2,635 760 24,839 24,839 25,303 465 F
Income Total 14,318 14,667 348 161,415 161,415 160,554 -861 A
Expenditure Pay -10,235 -10,850 -615 -126,067 -126,067 -127,823 -1,756 A
Clinical Supplies -1,494 -2,542 -1,048 -17,963 -17,963 -20,275 -2,312 A
Other -2,388 -3,039 -651 -24,205 -24,205 -29,740 -5,535 A
Expenditure Total -14,117 -16,431 -2,313 -168,235 -168,235 -177,838 -9,603 A
Post Ebitda Post Ebitda -621 -679 -58 -7,457 -7,457 -7,357 100 F
Post Ebitda Total -621 -679 -58 -7,457 -7,457 -7,357 100 F
Grand Total -420 -2,443 -2,022 -14,277 -14,277 -24,641 -10,364 A
COMMENTARY Current Position The Division is overspent by £10.4m (73%) in the period 2014-15 and £2.0m in month 12. The main issues are: Children Services reported £3.6m (63%) adverse. Activity levels have not performed as forecast against the higher profiled target for the Winter period in bedday and daycase activity. Emergency activity recoding issues have been resolved and activity underperformance during the year has recovered signif icantly in M12. Pay overspend is due to agency cover for medical staff to cover unfilled deanery post on rota and nursing to staff beds for non-elective activity. Critical Care £1.5m (25%) adverse. Bedday activity overperformed against plan but the case mix of activity was lower than projected particularly in M11 resulting in an underperformance on income (£165k). Income CIP plan to expand the bed capacity at the beginning of the year (£300k) could not be realised limiting the scope for the service to achieve its CIP target. Expenditure overspend is mainly on nursing. Women £1.8m (12%) adverse. In Obstetrics OP has significantly overperformed with improved coding of the intensity of activity following commissioner advice (£1.5m.) However FMU moved to come under the maternity pathway losing £0.35m affecting the performance on CIPs. Activity has underperformed in Deliveries (£0.5m) and Gynae elective (£0.45m). Pay has incurred overspends on Consultant cover for junior doctors rota and agency nurses to achieve Maternity CQUIN KPI. CIP schemes to reduce beds numbers needed to deliver activity plans have not been achieved (£0.38m). Diagnostics is £3.2 adverse (21%). The main reason for the overspend is due to the impact of SWLP (£2.4m adverse) consisting of a cost pressure from planning (£2.2m) the Trust share of the SWLP deficit (£0.8m) offset by the net gain in increased Gynae Cytology income (£0.6m). The remaining £0.9m deficit is overspend in nonpay for Genetics and Imaging. Pharmacy £289k (5%) This service has benefited from non-recurrent resilience funds to support winter/7day working (£648k). Income has improved in Q04 for PP activity and income from Harley Street. Nonpay is incurring a significant cost pressure partly due to the increasing cost of the Chemotherapy service which is funded from the Cancer HRGs but not resourced in the Pharmacy budget. Corporate Outpatients £413k (4%) adverse. This service has charged specialties for the cost of supporting additional clinics (£1.1m) in the evening and at weekends to meet the demand for capacity. This has incurred premium costs to set up and provide these clinics. The deficit is partly due to unachieved CIP savings related to EDM for 14-15 and the difficulties recruiting permanent staff instead of agency. Therapy services £469k (6%) adverse. This service has been supported by £250k on non-recurrent resilience funding. The service incurred an overspend supporting OOH Cardiac Arrest patients and was not able to achieve £200k of the CIP target allocated to it in 2014-15. Forecast The deficit for CWDT in 2014-15 of £10.5m is £0.4m worse than the M11 forecast of £10.1m. The impact of SWLP on the Division of £2.4m was a worsening of £0.7m this was offset by a central assumption on SWLP. This was offset by improvement in income in M12 for Children’s (£0.8m) and Critical Care (£324k). Womens service position worsened in M12 with fall in OP activi ty and increased nonpay. Improvements from CIPs The Division has developed recovery plans for each directorate to introduce spend controls which were implemented in Q04 and run rate staff savings both of which will carry forward into 2015-16 alongside the CIP programme. The Division will continue to hold fortnightly meetings with GM’s to review financial performance and achievement of the CIP program. Other Factors and Actions Planned – n/a
Key uncertainties, variables & dependencies that may impact on the FOT – n/a

TB April 15-03
14
CHILDREN’S, WOMENS, DIAGNOSTICS &THERAPIES - CIP Summary
ANALYSIS OF ACTUAL
TARGET INCOME EXPENSE TOTAL
CWDT TABLES RED AMBER GREEN TOTAL RED AMBER GREEN TOTAL RED AMBER GREEN TOTAL RED AMBER GREEN TOTAL
CHILDRENS 2,866 252 335 587 2,279 0 20 232 252 0 0 0 50 20 187 257 23 13 42 78
CRITICAL CARE 1,111 255 628 883 228 0 0 210 210 0 0 45 45 117 17 297 431 2 42 153 197
DIAGNOSTICS 1,601 445 198 643 958 0 109 300 409 10 17 9 36 0 34 8 42 74 7 75 156
OUTPATIENTS 552 0 714 714 -162 0 0 0 0 0 119 291 289 699 0 0 14 14
PHARMACY 709 332 52 384 325 0 41 41 15 30 246 291 0 51 0 51 0 0 2 2
THERAPIES 1,015 162 574 735 280 0 100 30 130 0 0 32 32 0 388 145 533 0 0 41 41
WOMENS 2,386 767 696 1,463 923 108 634 0 742 0 0 25 25 240 418 0 658 23 0 15 38
C&W OVERHEADS 0 0 0 0 0 0 0 0 0 0 0 0 0 0
Grand Total 10,240 2,213 3,197 5,409 4,831 108 863 814 1,785 25 47 356 428 526 1,220 925 2,671 122 61 342 526
OF WHICH RECURRENT:
TARGET INCOME EXPENSE TOTAL
CWDT TABLES RED AMBER GREEN TOTAL RED AMBER GREEN TOTAL RED AMBER GREEN TOTAL RED AMBER GREEN TOTAL
CHILDRENS 2,866 252 165 417 2,449 0 20 232 252 0 0 0 20 67 87 23 13 42 78
CRITICAL CARE 1,111 255 591 846 265 0 0 210 210 0 0 45 45 117 17 260 394 2 42 153 197
DIAGNOSTICS 1,601 436 198 634 967 0 109 300 409 10 17 27 0 34 8 42 74 7 75 156
OUTPATIENTS 552 0 552 552 -0 0 0 100 291 147 538 0 0 14 14
PHARMACY 709 332 52 384 325 41 41 15 30 246 291 0 51 0 51 0 0 2 2
THERAPIES 1,015 162 544 705 310 100 30 130 0 0 32 32 0 388 145 533 0 0 11 11
WOMENS 2,386 767 618 1,385 1,001 108 634 0 742 0 0 25 25 240 340 0 580 23 0 15 38
C&W OVERHEADS 0 0 0 0 0 0 0 0 0 0 0 0 0 0
Grand Total 10,240 2,204 2,720 4,924 5,316 108 863 814 1,785 25 47 347 419 457 1,141 626 2,225 122 61 312 495
SHORT
FALL SLA NON-SLA PAY NON-PAY
NON-SLA PAY NON-PAYSLA
ACTUAL SHORT
FALL
CWDT are reporting a CIP achievement of £5.4m (£4.9m recurrent). This is mainly in SLA income achievement and Pay. £2.5m actuals reported are against schemes rag rated by the PMO as Green. Childrens have the most significant shortfall against CIP target of £2.2m. Schemes which are reported as achieved are mainly SLA schemes - £100k of improved coding as the directorate focussed additional resources into training of the coding requirements at source, £132k of additional unplanned income in the Paediatric Ketogenic service. Childrens were adverse on Income by £2.2m meaning other factors will have negated the overall impact of these specific schemes on the directorate’s performance. Critical Care are reporting £883k of CIP schemes, mainly with Green rag ratings. £180k of the achieved pay schemes relates to the Flexible summer staffing scheme where less staff were required following careful summer scheduling. Further staffing reductions of specific posts were achieved. £134k of actual Coding Improvements and £54k of Outreach income have been reported as achieved. Critical care was however £1m overspent on expenditure and £06.m under achieved on income. The benefits achieved by the CIP schemes were outweighed by the adverse impact of other spend requirements over budget. Diagnostics are reporting £643k of CIP achieved – a shortfall of £1m against target. Green schemes are mainly within SLA income with £200k overperformance on Breast screening scheme as well as a further £62k benefit from the Spect CT business case. Diagnostics overall have overperformed on income by £200k. Expenditure CIPs reported as achieved total c£200k. These are mainly from the Procurement price changes achieved. The £3.4m adverse expenditure overall in diagnostics shows the limited impact of the actuals achieved. Outpatients, Pharmacy and Therapies jointly delivered £1.7m. Pharmacy schemes to deliver non-sla pharmacy services to other trusts have delivered £246k. Outpatients have reported £714k of expense savings mainly in pay, mainly from health records staff savings of £242k. Therapies reported delivery of £100k AQP income, admin review and restructure of £145k and a further £140k of run rate savings on pay. Therapies are overspent on expenditure by £660k, partly due to their £280k CIP shortfall but other budget control issues will have offset the benefits seen from the CIPs reported as achieved. Women’s have reported delivery of £1.4m CIP. These are all mainly Amber and Red. SLA includes £634k of Coding improvements achieved. Income is slightly above target for Women’s. The £700k of expense CIPs reported by Women’s include various staffing reduction schemes. Expenditure in Women’s is overspent by £1.9m. £1m of this will be the CIP shortfall reported but the remainder will have been expenditure issues offsetting the benefits seen from the reported expense CIPs achieved.
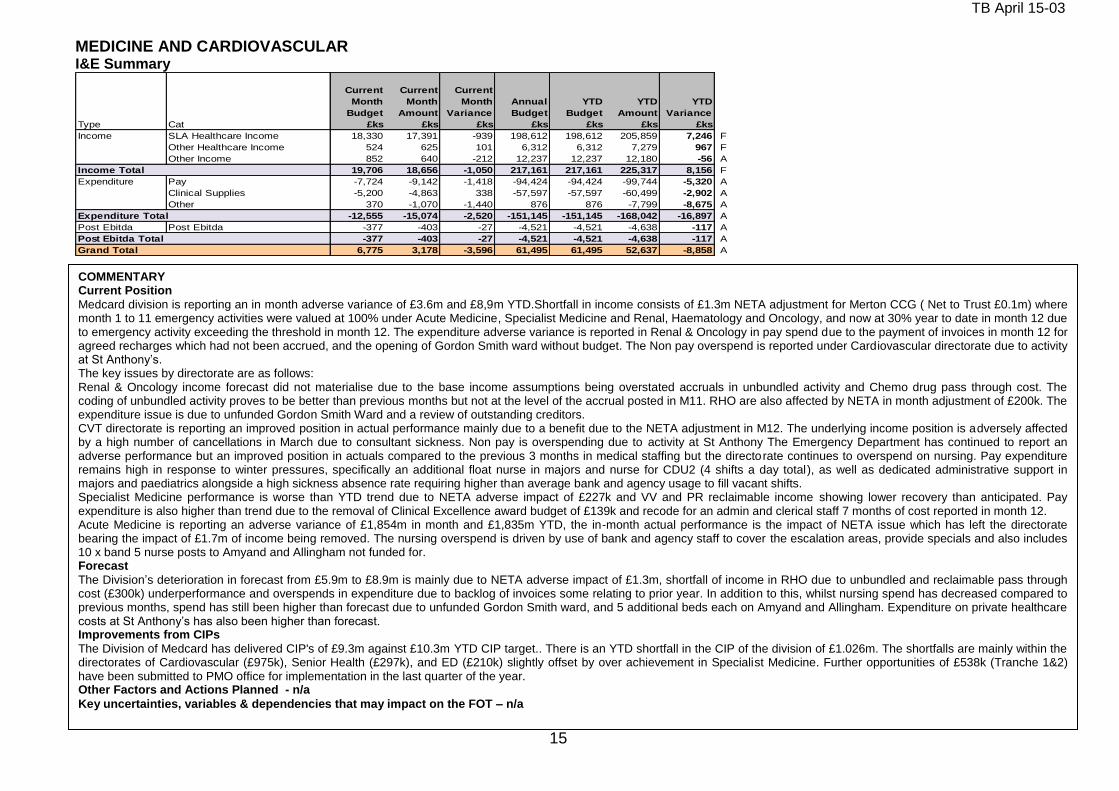
TB April 15-03
15
COMMENTARY Current Position
Medcard division is reporting an in month adverse variance of £3.6m and £8,9m YTD.Shortfall in income consists of £1.3m NETA adjustment for Merton CCG ( Net to Trust £0.1m) where month 1 to 11 emergency activities were valued at 100% under Acute Medicine, Specialist Medicine and Renal, Haematology and Oncology, and now at 30% year to date in month 12 due to emergency activity exceeding the threshold in month 12. The expenditure adverse variance is reported in Renal & Oncology in pay spend due to the payment of invoices in month 12 for agreed recharges which had not been accrued, and the opening of Gordon Smith ward without budget. The Non pay overspend is reported under Cardiovascular directorate due to activity at St Anthony’s. The key issues by directorate are as follows: Renal & Oncology income forecast did not materialise due to the base income assumptions being overstated accruals in unbundled activity and Chemo drug pass through cost. The coding of unbundled activity proves to be better than previous months but not at the level of the accrual posted in M11. RHO are also affected by NETA in month adjustment of £200k. The expenditure issue is due to unfunded Gordon Smith Ward and a review of outstanding creditors. CVT directorate is reporting an improved position in actual performance mainly due to a benefit due to the NETA adjustment in M12. The underlying income position is adversely affected by a high number of cancellations in March due to consultant sickness. Non pay is overspending due to activity at St Anthony The Emergency Department has continued to report an adverse performance but an improved position in actuals compared to the previous 3 months in medical staffing but the directorate continues to overspend on nursing. Pay expenditure remains high in response to winter pressures, specifically an additional float nurse in majors and nurse for CDU2 (4 shifts a day total), as well as dedicated administrative support in majors and paediatrics alongside a high sickness absence rate requiring higher than average bank and agency usage to fill vacant shifts. Specialist Medicine performance is worse than YTD trend due to NETA adverse impact of £227k and VV and PR reclaimable income showing lower recovery than anticipated. Pay expenditure is also higher than trend due to the removal of Clinical Excellence award budget of £139k and recode for an admin and clerical staff 7 months of cost reported in month 12. Acute Medicine is reporting an adverse variance of £1,854m in month and £1,835m YTD, the in-month actual performance is the impact of NETA issue which has left the directorate bearing the impact of £1.7m of income being removed. The nursing overspend is driven by use of bank and agency staff to cover the escalation areas, provide specials and also includes 10 x band 5 nurse posts to Amyand and Allingham not funded for. Forecast
The Division’s deterioration in forecast from £5.9m to £8.9m is mainly due to NETA adverse impact of £1.3m, shortfall of income in RHO due to unbundled and reclaimable pass through cost (£300k) underperformance and overspends in expenditure due to backlog of invoices some relating to prior year. In addition to this, whilst nursing spend has decreased compared to previous months, spend has still been higher than forecast due to unfunded Gordon Smith ward, and 5 additional beds each on Amyand and Allingham. Expenditure on private healthcare costs at St Anthony’s has also been higher than forecast. Improvements from CIPs
The Division of Medcard has delivered CIP's of £9.3m against £10.3m YTD CIP target.. There is an YTD shortfall in the CIP of the division of £1.026m. The shortfalls are mainly within the directorates of Cardiovascular (£975k), Senior Health (£297k), and ED (£210k) slightly offset by over achievement in Specialist Medicine. Further opportunities of £538k (Tranche 1&2) have been submitted to PMO office for implementation in the last quarter of the year. Other Factors and Actions Planned - n/a
Key uncertainties, variables & dependencies that may impact on the FOT – n/a
MEDICINE AND CARDIOVASCULAR I&E Summary
Type Cat
Current
Month
Budget
£ks
Current
Month
Amount
£ks
Current
Month
Variance
£ks
Annual
Budget
£ks
YTD
Budget
£ks
YTD
Amount
£ks
YTD
Variance
£ks
Income SLA Healthcare Income 18,330 17,391 -939 198,612 198,612 205,859 7,246 F
Other Healthcare Income 524 625 101 6,312 6,312 7,279 967 F
Other Income 852 640 -212 12,237 12,237 12,180 -56 A
Income Total 19,706 18,656 -1,050 217,161 217,161 225,317 8,156 F
Expenditure Pay -7,724 -9,142 -1,418 -94,424 -94,424 -99,744 -5,320 A
Clinical Supplies -5,200 -4,863 338 -57,597 -57,597 -60,499 -2,902 A
Other 370 -1,070 -1,440 876 876 -7,799 -8,675 A
Expenditure Total -12,555 -15,074 -2,520 -151,145 -151,145 -168,042 -16,897 A
Post Ebitda Post Ebitda -377 -403 -27 -4,521 -4,521 -4,638 -117 A
Post Ebitda Total -377 -403 -27 -4,521 -4,521 -4,638 -117 A
Grand Total 6,775 3,178 -3,596 61,495 61,495 52,637 -8,858 A
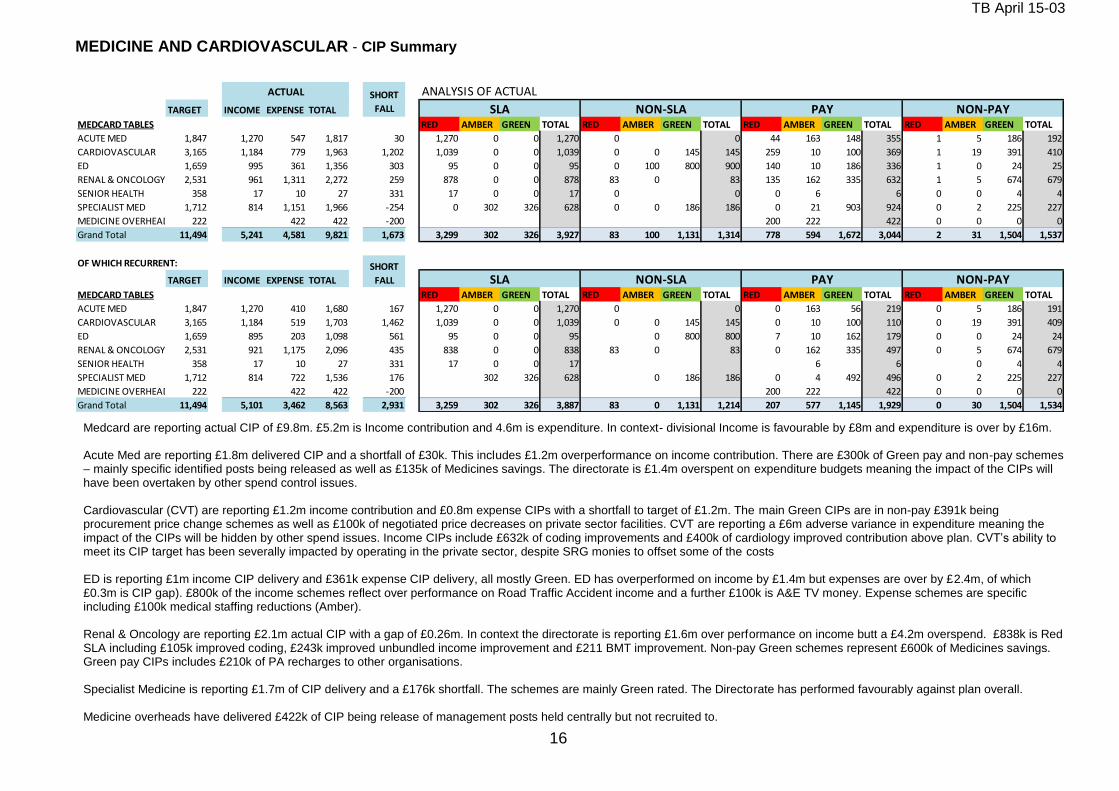
TB April 15-03
16
MEDICINE AND CARDIOVASCULAR - CIP Summary
ANALYSIS OF ACTUAL
TARGET INCOME EXPENSE TOTAL
MEDCARD TABLES RED AMBER GREEN TOTAL RED AMBER GREEN TOTAL RED AMBER GREEN TOTAL RED AMBER GREEN TOTAL
ACUTE MED 1,847 1,270 547 1,817 30 1,270 0 0 1,270 0 0 44 163 148 355 1 5 186 192
CARDIOVASCULAR 3,165 1,184 779 1,963 1,202 1,039 0 0 1,039 0 0 145 145 259 10 100 369 1 19 391 410
ED 1,659 995 361 1,356 303 95 0 0 95 0 100 800 900 140 10 186 336 1 0 24 25
RENAL & ONCOLOGY 2,531 961 1,311 2,272 259 878 0 0 878 83 0 83 135 162 335 632 1 5 674 679
SENIOR HEALTH 358 17 10 27 331 17 0 0 17 0 0 0 6 6 0 0 4 4
SPECIALIST MED 1,712 814 1,151 1,966 -254 0 302 326 628 0 0 186 186 0 21 903 924 0 2 225 227
MEDICINE OVERHEADS 222 422 422 -200 200 222 422 0 0 0 0
Grand Total 11,494 5,241 4,581 9,821 1,673 3,299 302 326 3,927 83 100 1,131 1,314 778 594 1,672 3,044 2 31 1,504 1,537
OF WHICH RECURRENT:
TARGET INCOME EXPENSE TOTAL
MEDCARD TABLES RED AMBER GREEN TOTAL RED AMBER GREEN TOTAL RED AMBER GREEN TOTAL RED AMBER GREEN TOTAL
ACUTE MED 1,847 1,270 410 1,680 167 1,270 0 0 1,270 0 0 0 163 56 219 0 5 186 191
CARDIOVASCULAR 3,165 1,184 519 1,703 1,462 1,039 0 0 1,039 0 0 145 145 0 10 100 110 0 19 391 409
ED 1,659 895 203 1,098 561 95 0 0 95 0 800 800 7 10 162 179 0 0 24 24
RENAL & ONCOLOGY 2,531 921 1,175 2,096 435 838 0 0 838 83 0 83 0 162 335 497 0 5 674 679
SENIOR HEALTH 358 17 10 27 331 17 0 0 17 6 6 0 4 4
SPECIALIST MED 1,712 814 722 1,536 176 302 326 628 0 186 186 0 4 492 496 0 2 225 227
MEDICINE OVERHEADS 222 422 422 -200 200 222 422 0 0 0 0
Grand Total 11,494 5,101 3,462 8,563 2,931 3,259 302 326 3,887 83 0 1,131 1,214 207 577 1,145 1,929 0 30 1,504 1,534
NON-PAY
SHORT
FALL SLA NON-SLA PAY NON-PAY
ACTUAL SHORT
FALL SLA NON-SLA PAY
Medcard are reporting actual CIP of £9.8m. £5.2m is Income contribution and 4.6m is expenditure. In context- divisional Income is favourable by £8m and expenditure is over by £16m. Acute Med are reporting £1.8m delivered CIP and a shortfall of £30k. This includes £1.2m overperformance on income contribution. There are £300k of Green pay and non-pay schemes – mainly specific identified posts being released as well as £135k of Medicines savings. The directorate is £1.4m overspent on expenditure budgets meaning the impact of the CIPs will have been overtaken by other spend control issues. Cardiovascular (CVT) are reporting £1.2m income contribution and £0.8m expense CIPs with a shortfall to target of £1.2m. The main Green CIPs are in non-pay £391k being procurement price change schemes as well as £100k of negotiated price decreases on private sector facilities. CVT are reporting a £6m adverse variance in expenditure meaning the impact of the CIPs will be hidden by other spend issues. Income CIPs include £632k of coding improvements and £400k of cardiology improved contribution above plan. CVT’s ability to meet its CIP target has been severally impacted by operating in the private sector, despite SRG monies to offset some of the costs ED is reporting £1m income CIP delivery and £361k expense CIP delivery, all mostly Green. ED has overperformed on income by £1.4m but expenses are over by £2.4m, of which £0.3m is CIP gap). £800k of the income schemes reflect over performance on Road Traffic Accident income and a further £100k is A&E TV money. Expense schemes are specific including £100k medical staffing reductions (Amber). Renal & Oncology are reporting £2.1m actual CIP with a gap of £0.26m. In context the directorate is reporting £1.6m over performance on income butt a £4.2m overspend. £838k is Red SLA including £105k improved coding, £243k improved unbundled income improvement and £211 BMT improvement. Non-pay Green schemes represent £600k of Medicines savings. Green pay CIPs includes £210k of PA recharges to other organisations. Specialist Medicine is reporting £1.7m of CIP delivery and a £176k shortfall. The schemes are mainly Green rated. The Directorate has performed favourably against plan overall. Medicine overheads have delivered £422k of CIP being release of management posts held centrally but not recruited to.
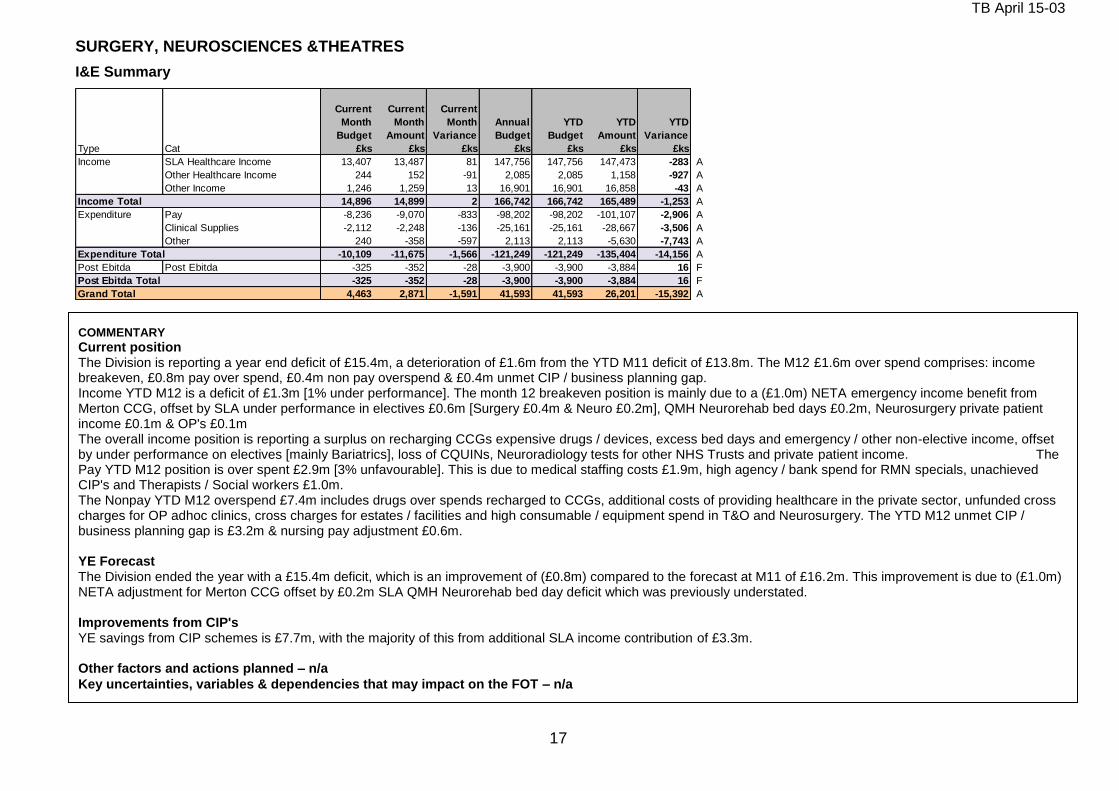
TB April 15-03
17
SURGERY, NEUROSCIENCES &THEATRES
I&E Summary
Type Cat
Current
Month
Budget
£ks
Current
Month
Amount
£ks
Current
Month
Variance
£ks
Annual
Budget
£ks
YTD
Budget
£ks
YTD
Amount
£ks
YTD
Variance
£ks
Income SLA Healthcare Income 13,407 13,487 81 147,756 147,756 147,473 -283 A
Other Healthcare Income 244 152 -91 2,085 2,085 1,158 -927 A
Other Income 1,246 1,259 13 16,901 16,901 16,858 -43 A
Income Total 14,896 14,899 2 166,742 166,742 165,489 -1,253 A
Expenditure Pay -8,236 -9,070 -833 -98,202 -98,202 -101,107 -2,906 A
Clinical Supplies -2,112 -2,248 -136 -25,161 -25,161 -28,667 -3,506 A
Other 240 -358 -597 2,113 2,113 -5,630 -7,743 A
Expenditure Total -10,109 -11,675 -1,566 -121,249 -121,249 -135,404 -14,156 A
Post Ebitda Post Ebitda -325 -352 -28 -3,900 -3,900 -3,884 16 F
Post Ebitda Total -325 -352 -28 -3,900 -3,900 -3,884 16 F
Grand Total 4,463 2,871 -1,591 41,593 41,593 26,201 -15,392 A
COMMENTARY
Current position The Division is reporting a year end deficit of £15.4m, a deterioration of £1.6m from the YTD M11 deficit of £13.8m. The M12 £1.6m over spend comprises: income breakeven, £0.8m pay over spend, £0.4m non pay overspend & £0.4m unmet CIP / business planning gap. Income YTD M12 is a deficit of £1.3m [1% under performance]. The month 12 breakeven position is mainly due to a (£1.0m) NETA emergency income benefit from Merton CCG, offset by SLA under performance in electives £0.6m [Surgery £0.4m & Neuro £0.2m], QMH Neurorehab bed days £0.2m, Neurosurgery private patient income £0.1m & OP's £0.1m The overall income position is reporting a surplus on recharging CCGs expensive drugs / devices, excess bed days and emergency / other non-elective income, offset by under performance on electives [mainly Bariatrics], loss of CQUINs, Neuroradiology tests for other NHS Trusts and private patient income. The Pay YTD M12 position is over spent £2.9m [3% unfavourable]. This is due to medical staffing costs £1.9m, high agency / bank spend for RMN specials, unachieved CIP's and Therapists / Social workers £1.0m. The Nonpay YTD M12 overspend £7.4m includes drugs over spends recharged to CCGs, additional costs of providing healthcare in the private sector, unfunded cross charges for OP adhoc clinics, cross charges for estates / facilities and high consumable / equipment spend in T&O and Neurosurgery. The YTD M12 unmet CIP / business planning gap is £3.2m & nursing pay adjustment £0.6m. YE Forecast The Division ended the year with a £15.4m deficit, which is an improvement of (£0.8m) compared to the forecast at M11 of £16.2m. This improvement is due to (£1.0m) NETA adjustment for Merton CCG offset by £0.2m SLA QMH Neurorehab bed day deficit which was previously understated. Improvements from CIP's YE savings from CIP schemes is £7.7m, with the majority of this from additional SLA income contribution of £3.3m. Other factors and actions planned – n/a
Key uncertainties, variables & dependencies that may impact on the FOT – n/a
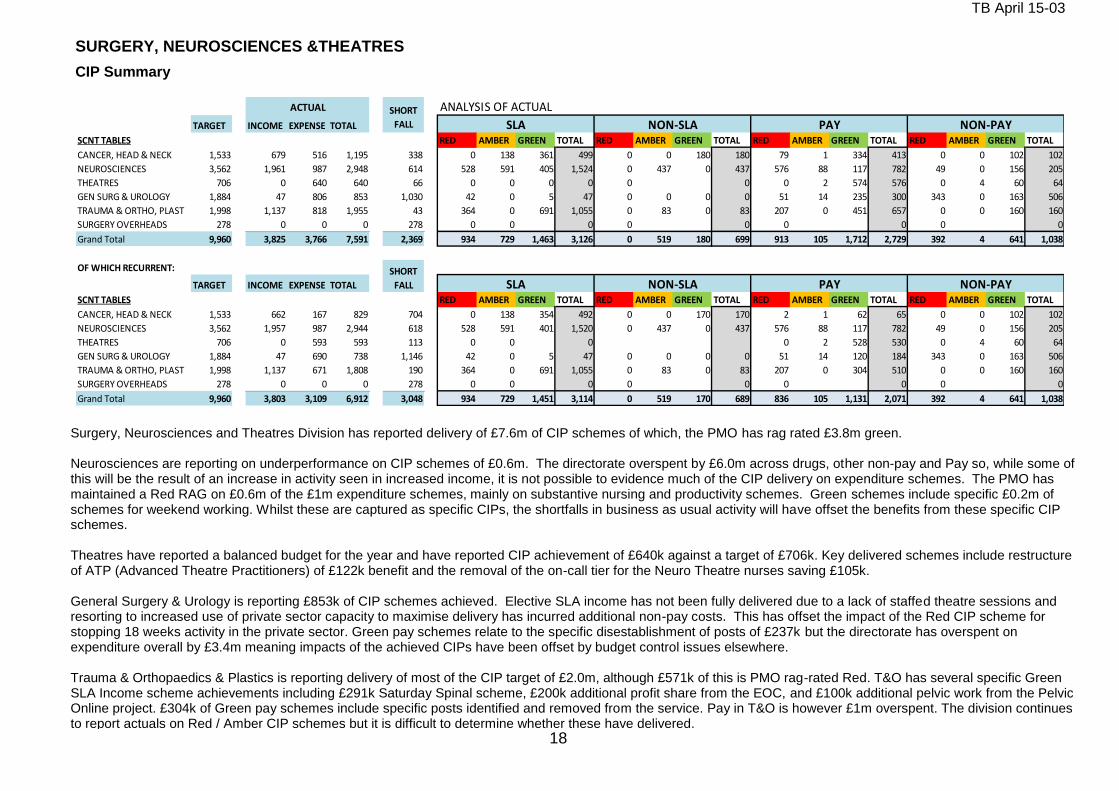
TB April 15-03
18
SURGERY, NEUROSCIENCES &THEATRES
CIP Summary
ANALYSIS OF ACTUAL
TARGET INCOME EXPENSE TOTAL
SCNT TABLES RED AMBER GREEN TOTAL RED AMBER GREEN TOTAL RED AMBER GREEN TOTAL RED AMBER GREEN TOTAL
CANCER, HEAD & NECK 1,533 679 516 1,195 338 0 138 361 499 0 0 180 180 79 1 334 413 0 0 102 102
NEUROSCIENCES 3,562 1,961 987 2,948 614 528 591 405 1,524 0 437 0 437 576 88 117 782 49 0 156 205
THEATRES 706 0 640 640 66 0 0 0 0 0 0 0 2 574 576 0 4 60 64
GEN SURG & UROLOGY 1,884 47 806 853 1,030 42 0 5 47 0 0 0 0 51 14 235 300 343 0 163 506
TRAUMA & ORTHO, PLAST 1,998 1,137 818 1,955 43 364 0 691 1,055 0 83 0 83 207 0 451 657 0 0 160 160
SURGERY OVERHEADS 278 0 0 0 278 0 0 0 0 0 0 0 0 0
Grand Total 9,960 3,825 3,766 7,591 2,369 934 729 1,463 3,126 0 519 180 699 913 105 1,712 2,729 392 4 641 1,038
OF WHICH RECURRENT:
TARGET INCOME EXPENSE TOTAL
SCNT TABLES RED AMBER GREEN TOTAL RED AMBER GREEN TOTAL RED AMBER GREEN TOTAL RED AMBER GREEN TOTAL
CANCER, HEAD & NECK 1,533 662 167 829 704 0 138 354 492 0 0 170 170 2 1 62 65 0 0 102 102
NEUROSCIENCES 3,562 1,957 987 2,944 618 528 591 401 1,520 0 437 0 437 576 88 117 782 49 0 156 205
THEATRES 706 0 593 593 113 0 0 0 0 2 528 530 0 4 60 64
GEN SURG & UROLOGY 1,884 47 690 738 1,146 42 0 5 47 0 0 0 0 51 14 120 184 343 0 163 506
TRAUMA & ORTHO, PLAST 1,998 1,137 671 1,808 190 364 0 691 1,055 0 83 0 83 207 0 304 510 0 0 160 160
SURGERY OVERHEADS 278 0 0 0 278 0 0 0 0 0 0 0 0 0
Grand Total 9,960 3,803 3,109 6,912 3,048 934 729 1,451 3,114 0 519 170 689 836 105 1,131 2,071 392 4 641 1,038
NON-PAY
SHORT
FALL SLA NON-SLA PAY NON-PAY
PAY
ACTUAL SHORT
FALL SLA NON-SLA
Surgery, Neurosciences and Theatres Division has reported delivery of £7.6m of CIP schemes of which, the PMO has rag rated £3.8m green. Neurosciences are reporting on underperformance on CIP schemes of £0.6m. The directorate overspent by £6.0m across drugs, other non-pay and Pay so, while some of this will be the result of an increase in activity seen in increased income, it is not possible to evidence much of the CIP delivery on expenditure schemes. The PMO has maintained a Red RAG on £0.6m of the £1m expenditure schemes, mainly on substantive nursing and productivity schemes. Green schemes include specific £0.2m of schemes for weekend working. Whilst these are captured as specific CIPs, the shortfalls in business as usual activity will have offset the benefits from these specific CIP schemes. Theatres have reported a balanced budget for the year and have reported CIP achievement of £640k against a target of £706k. Key delivered schemes include restructure of ATP (Advanced Theatre Practitioners) of £122k benefit and the removal of the on-call tier for the Neuro Theatre nurses saving £105k. General Surgery & Urology is reporting £853k of CIP schemes achieved. Elective SLA income has not been fully delivered due to a lack of staffed theatre sessions and resorting to increased use of private sector capacity to maximise delivery has incurred additional non-pay costs. This has offset the impact of the Red CIP scheme for stopping 18 weeks activity in the private sector. Green pay schemes relate to the specific disestablishment of posts of £237k but the directorate has overspent on expenditure overall by £3.4m meaning impacts of the achieved CIPs have been offset by budget control issues elsewhere. Trauma & Orthopaedics & Plastics is reporting delivery of most of the CIP target of £2.0m, although £571k of this is PMO rag-rated Red. T&O has several specific Green SLA Income scheme achievements including £291k Saturday Spinal scheme, £200k additional profit share from the EOC, and £100k additional pelvic work from the Pelvic Online project. £304k of Green pay schemes include specific posts identified and removed from the service. Pay in T&O is however £1m overspent. The division continues to report actuals on Red / Amber CIP schemes but it is difficult to determine whether these have delivered.
and not achieving productivity savings.
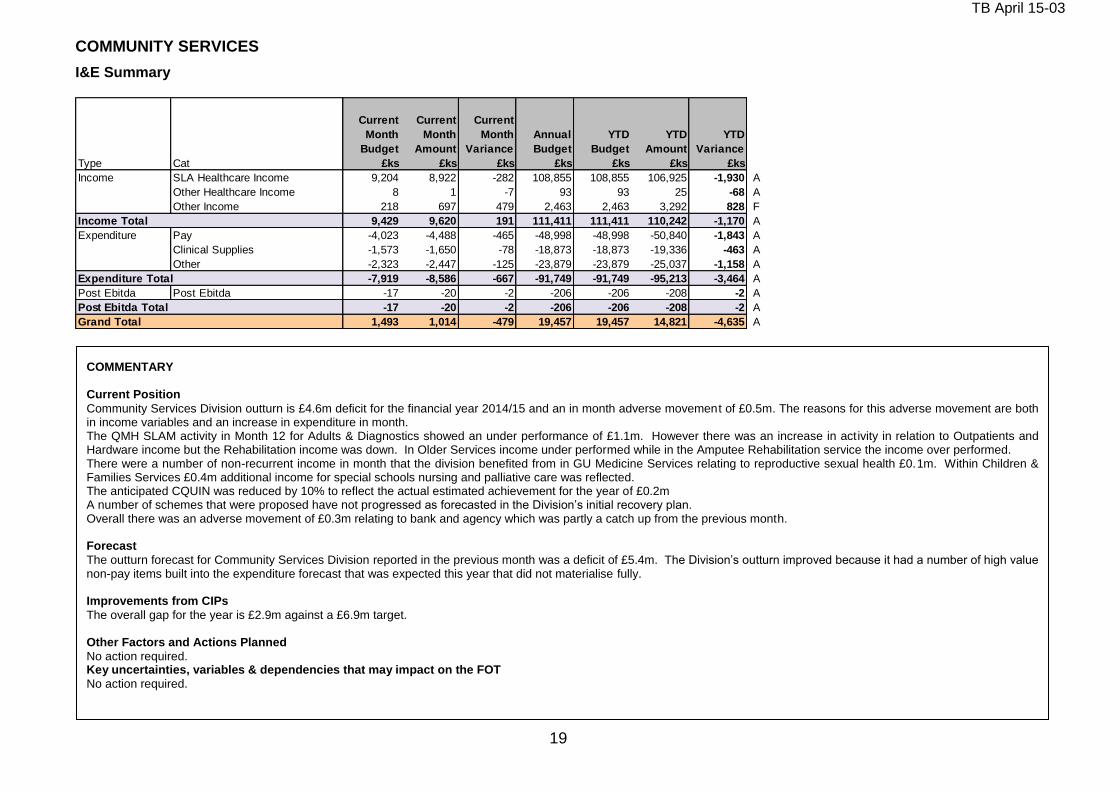
TB April 15-03
19
COMMUNITY SERVICES I&E Summary
Type Cat
Current
Month
Budget
£ks
Current
Month
Amount
£ks
Current
Month
Variance
£ks
Annual
Budget
£ks
YTD
Budget
£ks
YTD
Amount
£ks
YTD
Variance
£ks
Income SLA Healthcare Income 9,204 8,922 -282 108,855 108,855 106,925 -1,930 A
Other Healthcare Income 8 1 -7 93 93 25 -68 A
Other Income 218 697 479 2,463 2,463 3,292 828 F
Income Total 9,429 9,620 191 111,411 111,411 110,242 -1,170 A
Expenditure Pay -4,023 -4,488 -465 -48,998 -48,998 -50,840 -1,843 A
Clinical Supplies -1,573 -1,650 -78 -18,873 -18,873 -19,336 -463 A
Other -2,323 -2,447 -125 -23,879 -23,879 -25,037 -1,158 A
Expenditure Total -7,919 -8,586 -667 -91,749 -91,749 -95,213 -3,464 A
Post Ebitda Post Ebitda -17 -20 -2 -206 -206 -208 -2 A
Post Ebitda Total -17 -20 -2 -206 -206 -208 -2 A
Grand Total 1,493 1,014 -479 19,457 19,457 14,821 -4,635 A
COMMENTARY Current Position
Community Services Division outturn is £4.6m deficit for the financial year 2014/15 and an in month adverse movement of £0.5m. The reasons for this adverse movement are both in income variables and an increase in expenditure in month. The QMH SLAM activity in Month 12 for Adults & Diagnostics showed an under performance of £1.1m. However there was an increase in activity in relation to Outpatients and Hardware income but the Rehabilitation income was down. In Older Services income under performed while in the Amputee Rehabilitation service the income over performed. There were a number of non-recurrent income in month that the division benefited from in GU Medicine Services relating to reproductive sexual health £0.1m. Within Children & Families Services £0.4m additional income for special schools nursing and palliative care was reflected. The anticipated CQUIN was reduced by 10% to reflect the actual estimated achievement for the year of £0.2m A number of schemes that were proposed have not progressed as forecasted in the Division’s initial recovery plan. Overall there was an adverse movement of £0.3m relating to bank and agency which was partly a catch up from the previous month. Forecast
The outturn forecast for Community Services Division reported in the previous month was a deficit of £5.4m. The Division’s outturn improved because it had a number of high value non-pay items built into the expenditure forecast that was expected this year that did not materialise fully. Improvements from CIPs
The overall gap for the year is £2.9m against a £6.9m target. Other Factors and Actions Planned
No action required. Key uncertainties, variables & dependencies that may impact on the FOT
No action required.
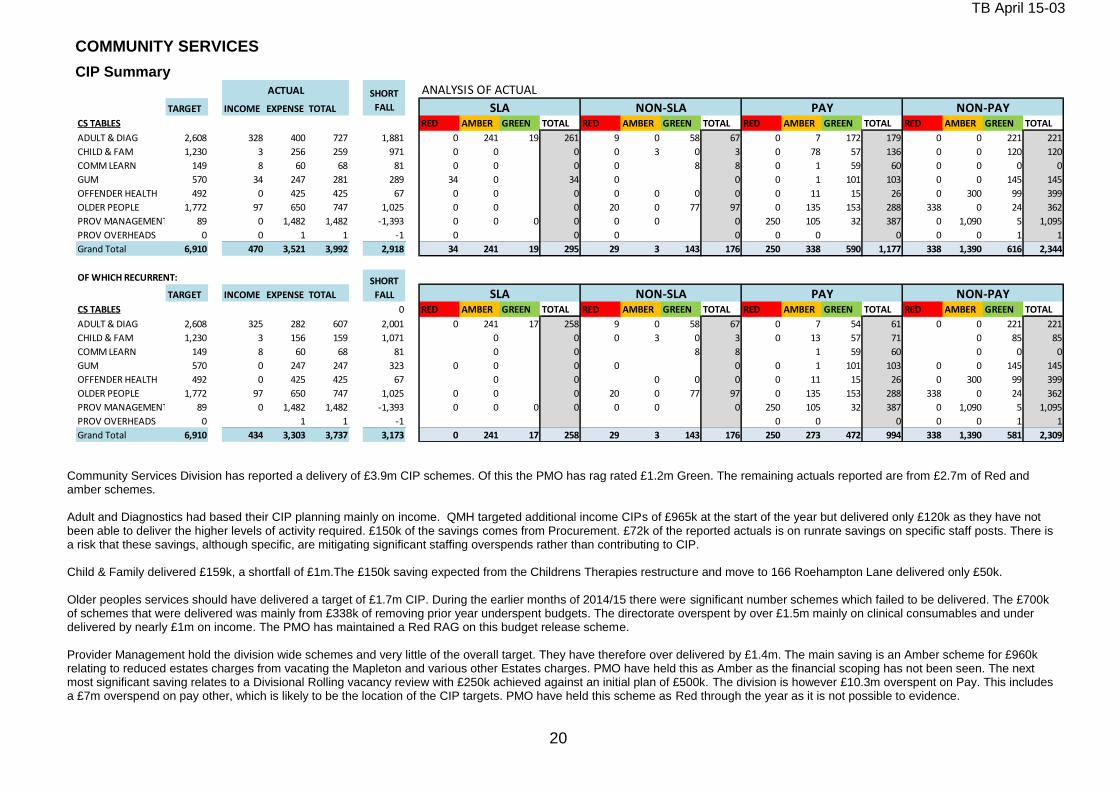
TB April 15-03
20
COMMUNITY SERVICES
CIP Summary
ANALYSIS OF ACTUAL
TARGET INCOME EXPENSE TOTAL
CS TABLES RED AMBER GREEN TOTAL RED AMBER GREEN TOTAL RED AMBER GREEN TOTAL RED AMBER GREEN TOTAL
ADULT & DIAG 2,608 328 400 727 1,881 0 241 19 261 9 0 58 67 0 7 172 179 0 0 221 221
CHILD & FAM 1,230 3 256 259 971 0 0 0 0 3 0 3 0 78 57 136 0 0 120 120
COMM LEARN 149 8 60 68 81 0 0 0 0 8 8 0 1 59 60 0 0 0 0
GUM 570 34 247 281 289 34 0 34 0 0 0 1 101 103 0 0 145 145
OFFENDER HEALTH 492 0 425 425 67 0 0 0 0 0 0 0 0 11 15 26 0 300 99 399
OLDER PEOPLE 1,772 97 650 747 1,025 0 0 0 20 0 77 97 0 135 153 288 338 0 24 362
PROV MANAGEMENT 89 0 1,482 1,482 -1,393 0 0 0 0 0 0 0 250 105 32 387 0 1,090 5 1,095
PROV OVERHEADS 0 0 1 1 -1 0 0 0 0 0 0 0 0 0 1 1
Grand Total 6,910 470 3,521 3,992 2,918 34 241 19 295 29 3 143 176 250 338 590 1,177 338 1,390 616 2,344
OF WHICH RECURRENT:
TARGET INCOME EXPENSE TOTAL
CS TABLES 0 RED AMBER GREEN TOTAL RED AMBER GREEN TOTAL RED AMBER GREEN TOTAL RED AMBER GREEN TOTAL
ADULT & DIAG 2,608 325 282 607 2,001 0 241 17 258 9 0 58 67 0 7 54 61 0 0 221 221
CHILD & FAM 1,230 3 156 159 1,071 0 0 0 3 0 3 0 13 57 71 0 85 85
COMM LEARN 149 8 60 68 81 0 0 8 8 1 59 60 0 0 0
GUM 570 0 247 247 323 0 0 0 0 0 0 1 101 103 0 0 145 145
OFFENDER HEALTH 492 0 425 425 67 0 0 0 0 0 0 11 15 26 0 300 99 399
OLDER PEOPLE 1,772 97 650 747 1,025 0 0 0 20 0 77 97 0 135 153 288 338 0 24 362
PROV MANAGEMENT 89 0 1,482 1,482 -1,393 0 0 0 0 0 0 0 250 105 32 387 0 1,090 5 1,095
PROV OVERHEADS 0 1 1 -1 0 0 0 0 0 1 1
Grand Total 6,910 434 3,303 3,737 3,173 0 241 17 258 29 3 143 176 250 273 472 994 338 1,390 581 2,309
NON-PAY
SHORT
FALL SLA NON-SLA PAY NON-PAY
ACTUAL SHORT
FALL SLA NON-SLA PAY
Community Services Division has reported a delivery of £3.9m CIP schemes. Of this the PMO has rag rated £1.2m Green. The remaining actuals reported are from £2.7m of Red and amber schemes. Adult and Diagnostics had based their CIP planning mainly on income. QMH targeted additional income CIPs of £965k at the start of the year but delivered only £120k as they have not been able to deliver the higher levels of activity required. £150k of the savings comes from Procurement. £72k of the reported actuals is on runrate savings on specific staff posts. There is a risk that these savings, although specific, are mitigating significant staffing overspends rather than contributing to CIP.
Child & Family delivered £159k, a shortfall of £1m.The £150k saving expected from the Childrens Therapies restructure and move to 166 Roehampton Lane delivered only £50k. Older peoples services should have delivered a target of £1.7m CIP. During the earlier months of 2014/15 there were significant number schemes which failed to be delivered. The £700k of schemes that were delivered was mainly from £338k of removing prior year underspent budgets. The directorate overspent by over £1.5m mainly on clinical consumables and under delivered by nearly £1m on income. The PMO has maintained a Red RAG on this budget release scheme. Provider Management hold the division wide schemes and very little of the overall target. They have therefore over delivered by £1.4m. The main saving is an Amber scheme for £960k relating to reduced estates charges from vacating the Mapleton and various other Estates charges. PMO have held this as Amber as the financial scoping has not been seen. The next most significant saving relates to a Divisional Rolling vacancy review with £250k achieved against an initial plan of £500k. The division is however £10.3m overspent on Pay. This includes a £7m overspend on pay other, which is likely to be the location of the CIP targets. PMO have held this scheme as Red through the year as it is not possible to evidence.
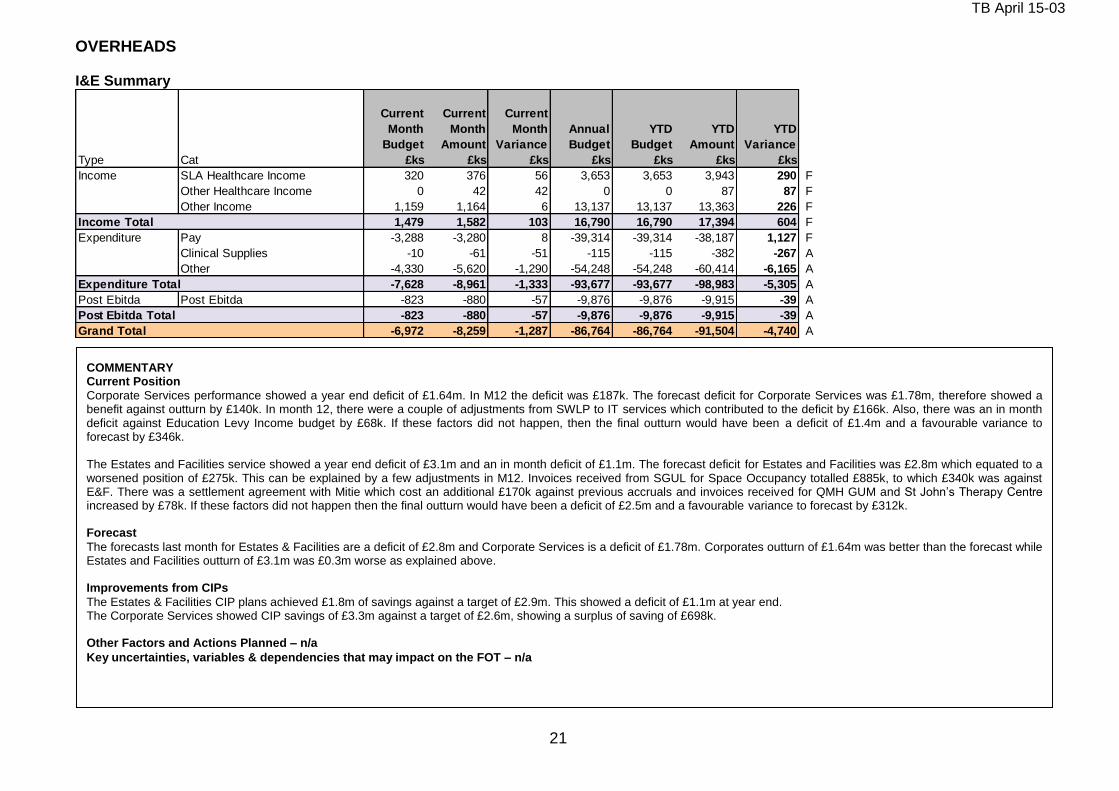
TB April 15-03
21
OVERHEADS I&E Summary
Type Cat
Current
Month
Budget
£ks
Current
Month
Amount
£ks
Current
Month
Variance
£ks
Annual
Budget
£ks
YTD
Budget
£ks
YTD
Amount
£ks
YTD
Variance
£ks
Income SLA Healthcare Income 320 376 56 3,653 3,653 3,943 290 F
Other Healthcare Income 0 42 42 0 0 87 87 F
Other Income 1,159 1,164 6 13,137 13,137 13,363 226 F
Income Total 1,479 1,582 103 16,790 16,790 17,394 604 F
Expenditure Pay -3,288 -3,280 8 -39,314 -39,314 -38,187 1,127 F
Clinical Supplies -10 -61 -51 -115 -115 -382 -267 A
Other -4,330 -5,620 -1,290 -54,248 -54,248 -60,414 -6,165 A
Expenditure Total -7,628 -8,961 -1,333 -93,677 -93,677 -98,983 -5,305 A
Post Ebitda Post Ebitda -823 -880 -57 -9,876 -9,876 -9,915 -39 A
Post Ebitda Total -823 -880 -57 -9,876 -9,876 -9,915 -39 A
Grand Total -6,972 -8,259 -1,287 -86,764 -86,764 -91,504 -4,740 A
COMMENTARY Current Position
Corporate Services performance showed a year end deficit of £1.64m. In M12 the deficit was £187k. The forecast deficit for Corporate Services was £1.78m, therefore showed a benefit against outturn by £140k. In month 12, there were a couple of adjustments from SWLP to IT services which contributed to the deficit by £166k. Also, there was an in month deficit against Education Levy Income budget by £68k. If these factors did not happen, then the final outturn would have been a deficit of £1.4m and a favourable variance to forecast by £346k. The Estates and Facilities service showed a year end deficit of £3.1m and an in month deficit of £1.1m. The forecast deficit for Estates and Facilities was £2.8m which equated to a worsened position of £275k. This can be explained by a few adjustments in M12. Invoices received from SGUL for Space Occupancy totalled £885k, to which £340k was against E&F. There was a settlement agreement with Mitie which cost an additional £170k against previous accruals and invoices received for QMH GUM and St John’s Therapy Centre increased by £78k. If these factors did not happen then the final outturn would have been a deficit of £2.5m and a favourable variance to forecast by £312k. Forecast
The forecasts last month for Estates & Facilities are a deficit of £2.8m and Corporate Services is a deficit of £1.78m. Corporates outturn of £1.64m was better than the forecast while Estates and Facilities outturn of £3.1m was £0.3m worse as explained above. Improvements from CIPs
The Estates & Facilities CIP plans achieved £1.8m of savings against a target of £2.9m. This showed a deficit of £1.1m at year end. The Corporate Services showed CIP savings of £3.3m against a target of £2.6m, showing a surplus of saving of £698k. Other Factors and Actions Planned – n/a
Key uncertainties, variables & dependencies that may impact on the FOT – n/a
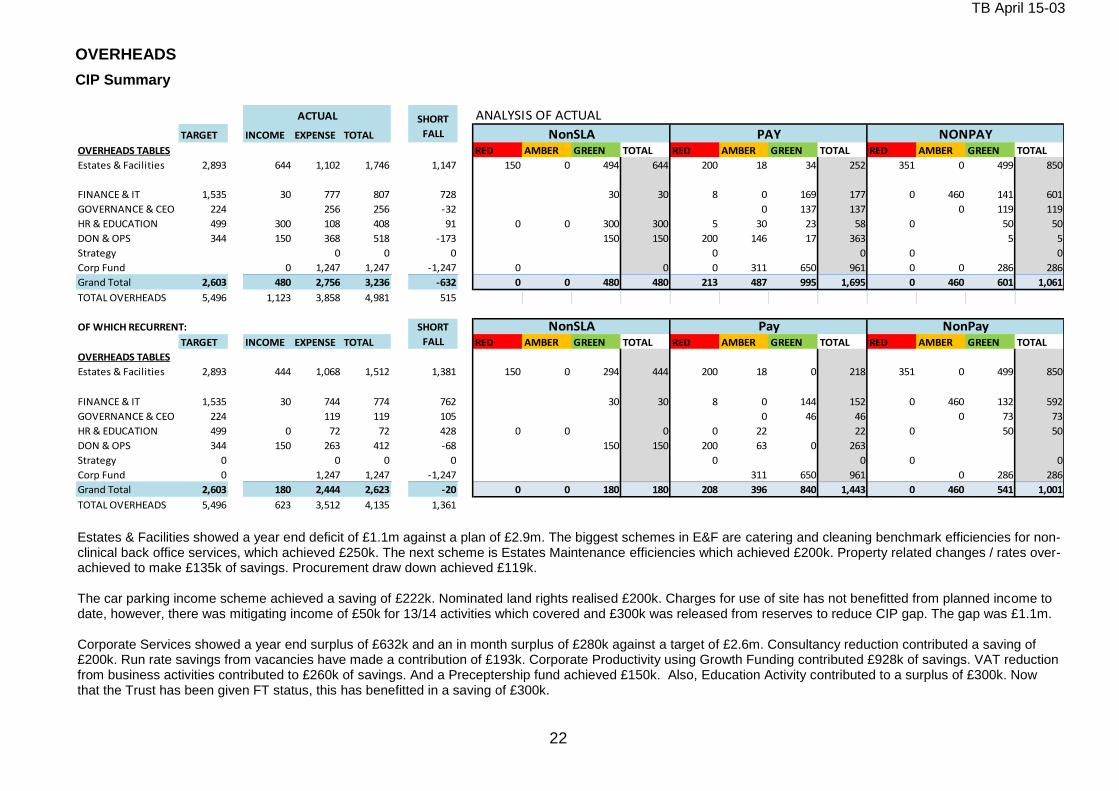
TB April 15-03
22
OVERHEADS
CIP Summary
ANALYSIS OF ACTUAL
TARGET INCOME EXPENSE TOTAL
OVERHEADS TABLES RED AMBER GREEN TOTAL RED AMBER GREEN TOTAL RED AMBER GREEN TOTAL
Estates & Facilities 2,893 644 1,102 1,746 1,147 150 0 494 644 200 18 34 252 351 0 499 850
FINANCE & IT 1,535 30 777 807 728 30 30 8 0 169 177 0 460 141 601
GOVERNANCE & CEO 224 256 256 -32 0 137 137 0 119 119
HR & EDUCATION 499 300 108 408 91 0 0 300 300 5 30 23 58 0 50 50
DON & OPS 344 150 368 518 -173 150 150 200 146 17 363 5 5
Strategy 0 0 0 0 0 0 0
Corp Fund 0 1,247 1,247 -1,247 0 0 0 311 650 961 0 0 286 286
Grand Total 2,603 480 2,756 3,236 -632 0 0 480 480 213 487 995 1,695 0 460 601 1,061
TOTAL OVERHEADS 5,496 1,123 3,858 4,981 515
OF WHICH RECURRENT:
TARGET INCOME EXPENSE TOTAL RED AMBER GREEN TOTAL RED AMBER GREEN TOTAL RED AMBER GREEN TOTAL
OVERHEADS TABLES
Estates & Facilities 2,893 444 1,068 1,512 1,381 150 0 294 444 200 18 0 218 351 0 499 850
FINANCE & IT 1,535 30 744 774 762 30 30 8 0 144 152 0 460 132 592
GOVERNANCE & CEO 224 119 119 105 0 46 46 0 73 73
HR & EDUCATION 499 0 72 72 428 0 0 0 0 22 22 0 50 50
DON & OPS 344 150 263 412 -68 150 150 200 63 0 263
Strategy 0 0 0 0 0 0 0 0
Corp Fund 0 1,247 1,247 -1,247 311 650 961 0 286 286
Grand Total 2,603 180 2,444 2,623 -20 0 0 180 180 208 396 840 1,443 0 460 541 1,001
TOTAL OVERHEADS 5,496 623 3,512 4,135 1,361
SHORT
FALL
NonSLA Pay NonPay
ACTUAL SHORT
FALL NonSLA PAY NONPAY
Estates & Facilities showed a year end deficit of £1.1m against a plan of £2.9m. The biggest schemes in E&F are catering and cleaning benchmark efficiencies for non-clinical back office services, which achieved £250k. The next scheme is Estates Maintenance efficiencies which achieved £200k. Property related changes / rates over-achieved to make £135k of savings. Procurement draw down achieved £119k. The car parking income scheme achieved a saving of £222k. Nominated land rights realised £200k. Charges for use of site has not benefitted from planned income to date, however, there was mitigating income of £50k for 13/14 activities which covered and £300k was released from reserves to reduce CIP gap. The gap was £1.1m. Corporate Services showed a year end surplus of £632k and an in month surplus of £280k against a target of £2.6m. Consultancy reduction contributed a saving of £200k. Run rate savings from vacancies have made a contribution of £193k. Corporate Productivity using Growth Funding contributed £928k of savings. VAT reduction from business activities contributed to £260k of savings. And a Preceptership fund achieved £150k. Also, Education Activity contributed to a surplus of £300k. Now that the Trust has been given FT status, this has benefitted in a saving of £300k.
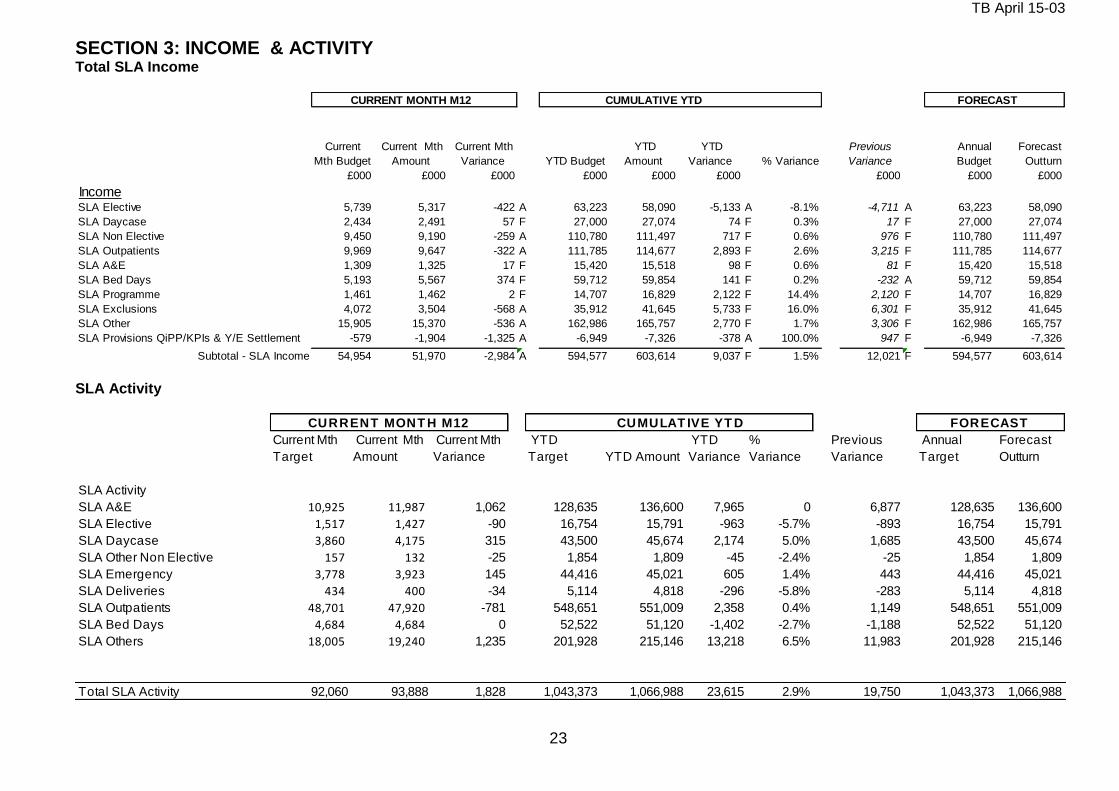
TB April 15-03
23
SECTION 3: INCOME & ACTIVITY Total SLA Income
CURRENT MONTH M12 CUMULATIVE YTD FORECAST
Current
Mth Budget
Current Mth
Amount
Current Mth
Variance YTD Budget
YTD
Amount
YTD
Variance % Variance
Previous
Variance
Annual
Budget
Forecast
Outturn
£000 £000 £000 £000 £000 £000 £000 £000 £000
IncomeSLA Elective 5,739 5,317 -422 A 63,223 58,090 -5,133 A -8.1% -4,711 A 63,223 58,090
SLA Daycase 2,434 2,491 57 F 27,000 27,074 74 F 0.3% 17 F 27,000 27,074
SLA Non Elective 9,450 9,190 -259 A 110,780 111,497 717 F 0.6% 976 F 110,780 111,497
SLA Outpatients 9,969 9,647 -322 A 111,785 114,677 2,893 F 2.6% 3,215 F 111,785 114,677
SLA A&E 1,309 1,325 17 F 15,420 15,518 98 F 0.6% 81 F 15,420 15,518
SLA Bed Days 5,193 5,567 374 F 59,712 59,854 141 F 0.2% -232 A 59,712 59,854
SLA Programme 1,461 1,462 2 F 14,707 16,829 2,122 F 14.4% 2,120 F 14,707 16,829
SLA Exclusions 4,072 3,504 -568 A 35,912 41,645 5,733 F 16.0% 6,301 F 35,912 41,645
SLA Other 15,905 15,370 -536 A 162,986 165,757 2,770 F 1.7% 3,306 F 162,986 165,757
SLA Provisions QiPP/KPIs & Y/E Settlement -579 -1,904 -1,325 A -6,949 -7,326 -378 A 100.0% 947 F -6,949 -7,326
Subtotal - SLA Income 54,954 51,970 -2,984 A 594,577 603,614 9,037 F 1.5% 12,021 F 594,577 603,614 SLA Activity
Current Mth
Target
Current Mth
Amount
Current Mth
Variance
YTD
Target YTD Amount
YTD
Variance
%
Variance
Previous
Variance
Annual
Target
Forecast
Outturn
SLA Activity
SLA A&E 10,925 11,987 1,062 128,635 136,600 7,965 0 6,877 128,635 136,600
SLA Elective 1,517 1,427 -90 16,754 15,791 -963 -5.7% -893 16,754 15,791
SLA Daycase 3,860 4,175 315 43,500 45,674 2,174 5.0% 1,685 43,500 45,674
SLA Other Non Elective 157 132 -25 1,854 1,809 -45 -2.4% -25 1,854 1,809
SLA Emergency 3,778 3,923 145 44,416 45,021 605 1.4% 443 44,416 45,021
SLA Deliveries 434 400 -34 5,114 4,818 -296 -5.8% -283 5,114 4,818
SLA Outpatients 48,701 47,920 -781 548,651 551,009 2,358 0.4% 1,149 548,651 551,009
SLA Bed Days 4,684 4,684 0 52,522 51,120 -1,402 -2.7% -1,188 52,522 51,120
SLA Others 18,005 19,240 1,235 201,928 215,146 13,218 6.5% 11,983 201,928 215,146
Total SLA Activity 92,060 93,888 1,828 1,043,373 1,066,988 23,615 2.9% 19,750 1,043,373 1,066,988
CURRENT MONT H M12 CUMULAT IVE YT D FORECAST
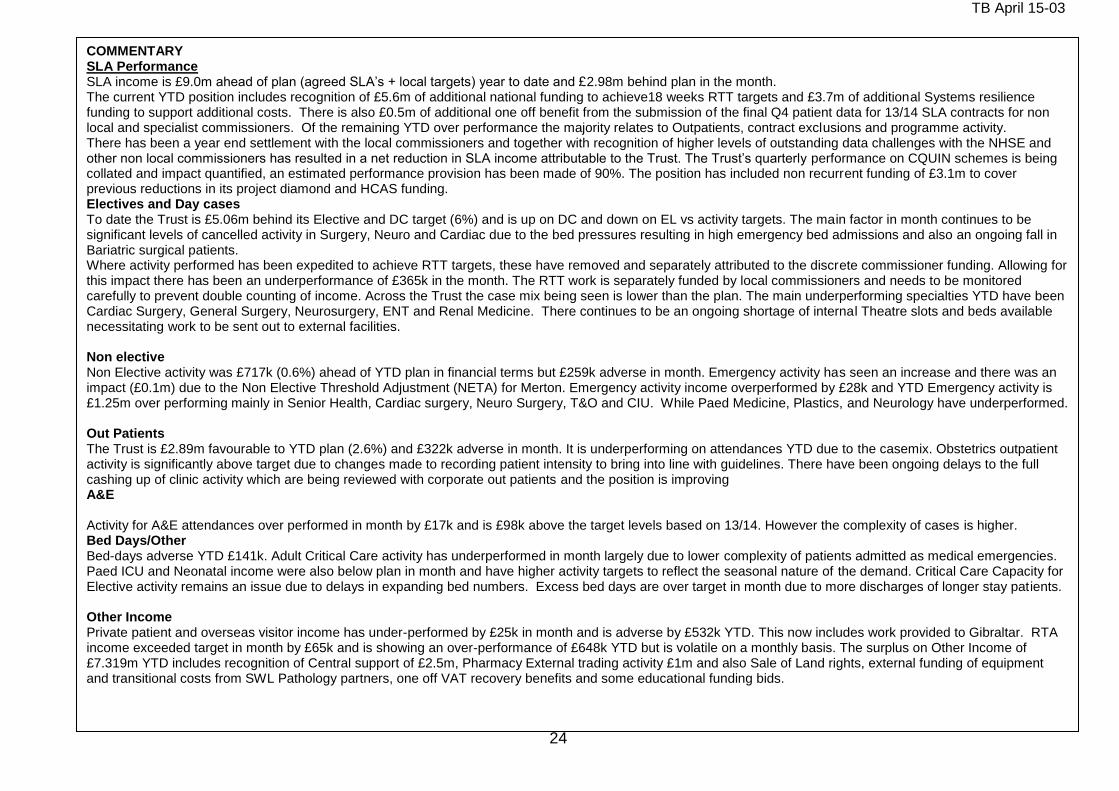
TB April 15-03
24
COMMENTARY SLA Performance SLA income is £9.0m ahead of plan (agreed SLA’s + local targets) year to date and £2.98m behind plan in the month. The current YTD position includes recognition of £5.6m of additional national funding to achieve18 weeks RTT targets and £3.7m of additional Systems resilience funding to support additional costs. There is also £0.5m of additional one off benefit from the submission of the final Q4 patient data for 13/14 SLA contracts for non local and specialist commissioners. Of the remaining YTD over performance the majority relates to Outpatients, contract exclusions and programme activity. There has been a year end settlement with the local commissioners and together with recognition of higher levels of outstanding data challenges with the NHSE and other non local commissioners has resulted in a net reduction in SLA income attributable to the Trust. The Trust’s quarterly performance on CQUIN schemes is being collated and impact quantified, an estimated performance provision has been made of 90%. The position has included non recurrent funding of £3.1m to cover previous reductions in its project diamond and HCAS funding. Electives and Day cases To date the Trust is £5.06m behind its Elective and DC target (6%) and is up on DC and down on EL vs activity targets. The main factor in month continues to be significant levels of cancelled activity in Surgery, Neuro and Cardiac due to the bed pressures resulting in high emergency bed admissions and also an ongoing fall in Bariatric surgical patients. Where activity performed has been expedited to achieve RTT targets, these have removed and separately attributed to the discrete commissioner funding. Allowing for this impact there has been an underperformance of £365k in the month. The RTT work is separately funded by local commissioners and needs to be monitored carefully to prevent double counting of income. Across the Trust the case mix being seen is lower than the plan. The main underperforming specialties YTD have been Cardiac Surgery, General Surgery, Neurosurgery, ENT and Renal Medicine. There continues to be an ongoing shortage of internal Theatre slots and beds available necessitating work to be sent out to external facilities. Non elective Non Elective activity was £717k (0.6%) ahead of YTD plan in financial terms but £259k adverse in month. Emergency activity has seen an increase and there was an impact (£0.1m) due to the Non Elective Threshold Adjustment (NETA) for Merton. Emergency activity income overperformed by £28k and YTD Emergency activity is £1.25m over performing mainly in Senior Health, Cardiac surgery, Neuro Surgery, T&O and CIU. While Paed Medicine, Plastics, and Neurology have underperformed. Out Patients The Trust is £2.89m favourable to YTD plan (2.6%) and £322k adverse in month. It is underperforming on attendances YTD due to the casemix. Obstetrics outpatient activity is significantly above target due to changes made to recording patient intensity to bring into line with guidelines. There have been ongoing delays to the full cashing up of clinic activity which are being reviewed with corporate out patients and the position is improving A&E Activity for A&E attendances over performed in month by £17k and is £98k above the target levels based on 13/14. However the complexity of cases is higher. Bed Days/Other Bed-days adverse YTD £141k. Adult Critical Care activity has underperformed in month largely due to lower complexity of patients admitted as medical emergencies. Paed ICU and Neonatal income were also below plan in month and have higher activity targets to reflect the seasonal nature of the demand. Critical Care Capacity for Elective activity remains an issue due to delays in expanding bed numbers. Excess bed days are over target in month due to more discharges of longer stay patients. Other Income Private patient and overseas visitor income has under-performed by £25k in month and is adverse by £532k YTD. This now includes work provided to Gibraltar. RTA income exceeded target in month by £65k and is showing an over-performance of £648k YTD but is volatile on a monthly basis. The surplus on Other Income of £7.319m YTD includes recognition of Central support of £2.5m, Pharmacy External trading activity £1m and also Sale of Land rights, external funding of equipment and transitional costs from SWL Pathology partners, one off VAT recovery benefits and some educational funding bids.

TB April 15-03
25
Activity Tables
8000
9000
10000
11000
12000
13000
Apr May Jun Jul Aug Sep Oct Nov Dec Jan Feb Mar
SLA A&E
A&E Actual 13/14 A&E Target 14/15 A&E Actual 14/15
800
1000
1200
1400
1600
1800
Apr May Jun Jul Aug Sep Oct Nov Dec Jan Feb Mar
SLA Elective
Elective Actual 13/14 Elective Target 14/15 Elective Actual 14/15
2000
2500
3000
3500
4000
4500
Apr May Jun Jul Aug Sep Oct Nov Dec Jan Feb Mar
SLA Daycase
SLA Daycase Actual 13/14 SLA Daycase Target 14/15
SLA Daycase Actual 14/15
110
130
150
170
190
210
230
Apr May Jun Jul Aug Sep Oct Nov Dec Jan Feb Mar
SLA Other Non Elective
Other Non Elective Actual 13/14 Other Non Elective Target 14/15
Other Non Elective Actual 14/15
1000
3000
5000
Apr May Jun Jul Aug Sep Oct Nov Dec Jan Feb Mar
Emergency
Emergency Actual 13/14 Emergency Target 14/15 Emergency Actual 14/15
20000
30000
40000
50000
60000
Apr May Jun Jul Aug Sep Oct Nov Dec Jan Feb Mar
SLA Outpatients
Outpatients Actual 13/14 Outpatients Target 14/15
Outpatients Actual 14/15
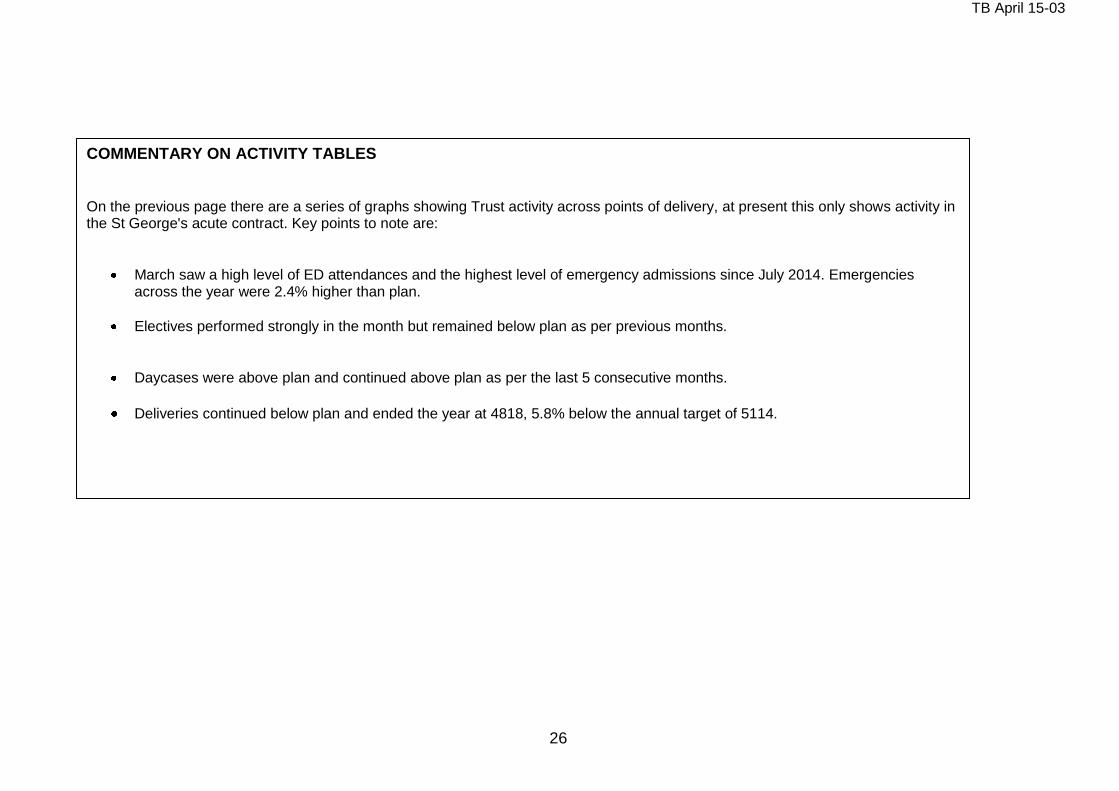
TB April 15-03
26
COMMENTARY ON ACTIVITY TABLES On the previous page there are a series of graphs showing Trust activity across points of delivery, at present this only shows activity in the St George's acute contract. Key points to note are:
March saw a high level of ED attendances and the highest level of emergency admissions since July 2014. Emergencies across the year were 2.4% higher than plan.
Electives performed strongly in the month but remained below plan as per previous months.
Daycases were above plan and continued above plan as per the last 5 consecutive months.
Deliveries continued below plan and ended the year at 4818, 5.8% below the annual target of 5114.
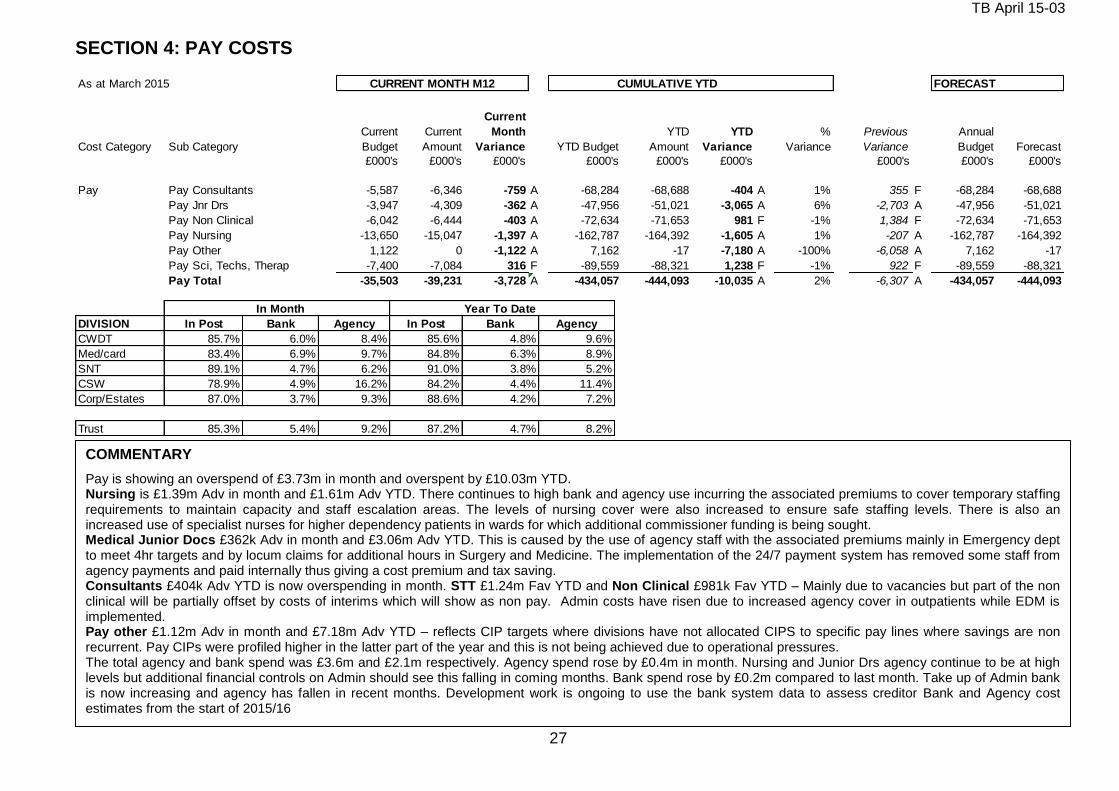
TB April 15-03
27
SECTION 4: PAY COSTS As at March 2015 CURRENT MONTH M12 CUMULATIVE YTD FORECAST
Cost Category Sub Category
Current
Budget
Current
Amount
Current
Month
Variance YTD Budget
YTD
Amount
YTD
Variance
%
Variance
Previous
Variance
Annual
Budget Forecast
£000's £000's £000's £000's £000's £000's £000's £000's £000's
Pay Pay Consultants -5,587 -6,346 -759 A -68,284 -68,688 -404 A 1% 355 F -68,284 -68,688
Pay Jnr Drs -3,947 -4,309 -362 A -47,956 -51,021 -3,065 A 6% -2,703 A -47,956 -51,021
Pay Non Clinical -6,042 -6,444 -403 A -72,634 -71,653 981 F -1% 1,384 F -72,634 -71,653
Pay Nursing -13,650 -15,047 -1,397 A -162,787 -164,392 -1,605 A 1% -207 A -162,787 -164,392
Pay Other 1,122 0 -1,122 A 7,162 -17 -7,180 A -100% -6,058 A 7,162 -17
Pay Sci, Techs, Therap -7,400 -7,084 316 F -89,559 -88,321 1,238 F -1% 922 F -89,559 -88,321
Pay Total -35,503 -39,231 -3,728 A -434,057 -444,093 -10,035 A 2% -6,307 A -434,057 -444,093
In Month Year To Date
DIVISION In Post Bank Agency In Post Bank Agency
CWDT 85.7% 6.0% 8.4% 85.6% 4.8% 9.6%
Med/card 83.4% 6.9% 9.7% 84.8% 6.3% 8.9%
SNT 89.1% 4.7% 6.2% 91.0% 3.8% 5.2%
CSW 78.9% 4.9% 16.2% 84.2% 4.4% 11.4%
Corp/Estates 87.0% 3.7% 9.3% 88.6% 4.2% 7.2%
Trust 85.3% 5.4% 9.2% 87.2% 4.7% 8.2%
COMMENTARY Pay is showing an overspend of £3.73m in month and overspent by £10.03m YTD. Nursing is £1.39m Adv in month and £1.61m Adv YTD. There continues to high bank and agency use incurring the associated premiums to cover temporary staffing requirements to maintain capacity and staff escalation areas. The levels of nursing cover were also increased to ensure safe staffing levels. There is also an increased use of specialist nurses for higher dependency patients in wards for which additional commissioner funding is being sought. Medical Junior Docs £362k Adv in month and £3.06m Adv YTD. This is caused by the use of agency staff with the associated premiums mainly in Emergency dept to meet 4hr targets and by locum claims for additional hours in Surgery and Medicine. The implementation of the 24/7 payment system has removed some staff from agency payments and paid internally thus giving a cost premium and tax saving. Consultants £404k Adv YTD is now overspending in month. STT £1.24m Fav YTD and Non Clinical £981k Fav YTD – Mainly due to vacancies but part of the non clinical will be partially offset by costs of interims which will show as non pay. Admin costs have risen due to increased agency cover in outpatients while EDM is implemented. Pay other £1.12m Adv in month and £7.18m Adv YTD – reflects CIP targets where divisions have not allocated CIPS to specific pay lines where savings are non recurrent. Pay CIPs were profiled higher in the latter part of the year and this is not being achieved due to operational pressures. The total agency and bank spend was £3.6m and £2.1m respectively. Agency spend rose by £0.4m in month. Nursing and Junior Drs agency continue to be at high levels but additional financial controls on Admin should see this falling in coming months. Bank spend rose by £0.2m compared to last month. Take up of Admin bank is now increasing and agency has fallen in recent months. Development work is ongoing to use the bank system data to assess creditor Bank and Agency cost estimates from the start of 2015/16 Overall staffing levels (WTE) usage is significantly above the budgeted establishment levels due to agency and bank count being above vacancies.
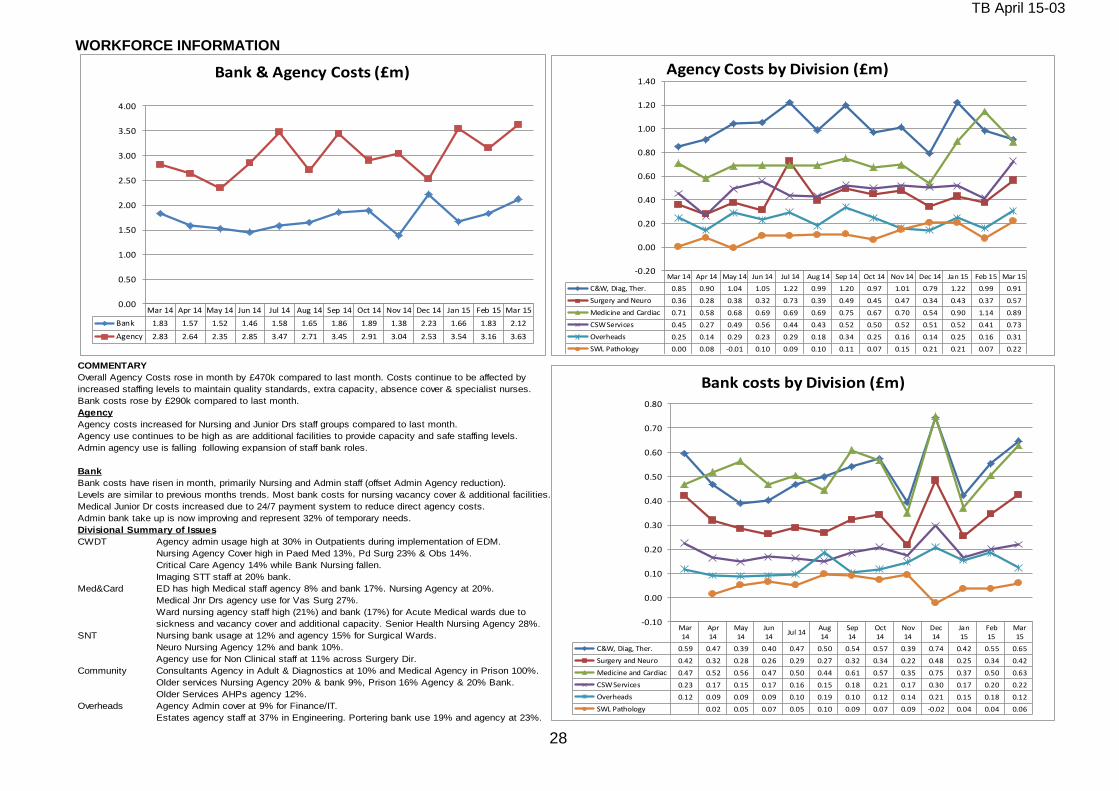
TB April 15-03
28
WORKFORCE INFORMATION
COMMENTARY
Overall Agency Costs rose in month by £470k compared to last month. Costs continue to be affected by
increased staffing levels to maintain quality standards, extra capacity, absence cover & specialist nurses.
Bank costs rose by £290k compared to last month.
Agency
Agency costs increased for Nursing and Junior Drs staff groups compared to last month.
Agency use continues to be high as are additional facilities to provide capacity and safe staffing levels.
Admin agency use is falling following expansion of staff bank roles.
Bank
Bank costs have risen in month, primarily Nursing and Admin staff (offset Admin Agency reduction).
Levels are similar to previous months trends. Most bank costs for nursing vacancy cover & additional facilities.
Medical Junior Dr costs increased due to 24/7 payment system to reduce direct agency costs.
Admin bank take up is now improving and represent 32% of temporary needs.
Divisional Summary of Issues
CWDT Agency admin usage high at 30% in Outpatients during implementation of EDM.
Nursing Agency Cover high in Paed Med 13%, Pd Surg 23% & Obs 14%.
Critical Care Agency 14% while Bank Nursing fallen.
Imaging STT staff at 20% bank.
Med&Card ED has high Medical staff agency 8% and bank 17%. Nursing Agency at 20%.
Medical Jnr Drs agency use for Vas Surg 27%.
Ward nursing agency staff high (21%) and bank (17%) for Acute Medical wards due to
sickness and vacancy cover and additional capacity. Senior Health Nursing Agency 28%.
SNT Nursing bank usage at 12% and agency 15% for Surgical Wards.
Neuro Nursing Agency 12% and bank 10%.
Agency use for Non Clinical staff at 11% across Surgery Dir.
Community Consultants Agency in Adult & Diagnostics at 10% and Medical Agency in Prison 100%.
Older services Nursing Agency 20% & bank 9%, Prison 16% Agency & 20% Bank.
Older Services AHPs agency 12%.
Overheads Agency Admin cover at 9% for Finance/IT.
Estates agency staff at 37% in Engineering. Portering bank use 19% and agency at 23%.
Mar 14 Apr 14 May 14 Jun 14 Jul 14 Aug 14 Sep 14 Oct 14 Nov 14 Dec 14 Jan 15 Feb 15 Mar 15
Bank 1.83 1.57 1.52 1.46 1.58 1.65 1.86 1.89 1.38 2.23 1.66 1.83 2.12
Agency 2.83 2.64 2.35 2.85 3.47 2.71 3.45 2.91 3.04 2.53 3.54 3.16 3.63
0.00
0.50
1.00
1.50
2.00
2.50
3.00
3.50
4.00
Bank & Agency Costs (£m)
Mar 14 Apr 14 May 14 Jun 14 Jul 14 Aug 14 Sep 14 Oct 14 Nov 14 Dec 14 Jan 15 Feb 15 Mar 15
C&W, Diag, Ther. 0.85 0.90 1.04 1.05 1.22 0.99 1.20 0.97 1.01 0.79 1.22 0.99 0.91
Surgery and Neuro 0.36 0.28 0.38 0.32 0.73 0.39 0.49 0.45 0.47 0.34 0.43 0.37 0.57
Medicine and Cardiac 0.71 0.58 0.68 0.69 0.69 0.69 0.75 0.67 0.70 0.54 0.90 1.14 0.89
CSW Services 0.45 0.27 0.49 0.56 0.44 0.43 0.52 0.50 0.52 0.51 0.52 0.41 0.73
Overheads 0.25 0.14 0.29 0.23 0.29 0.18 0.34 0.25 0.16 0.14 0.25 0.16 0.31
SWL Pathology 0.00 0.08 -0.01 0.10 0.09 0.10 0.11 0.07 0.15 0.21 0.21 0.07 0.22
-0.20
0.00
0.20
0.40
0.60
0.80
1.00
1.20
1.40Agency Costs by Division (£m)
Mar14
Apr14
May14
Jun14
Jul 14Aug14
Sep14
Oct14
Nov14
Dec14
Jan15
Feb15
Mar15
C&W, Diag, Ther. 0.59 0.47 0.39 0.40 0.47 0.50 0.54 0.57 0.39 0.74 0.42 0.55 0.65
Surgery and Neuro 0.42 0.32 0.28 0.26 0.29 0.27 0.32 0.34 0.22 0.48 0.25 0.34 0.42
Medicine and Cardiac 0.47 0.52 0.56 0.47 0.50 0.44 0.61 0.57 0.35 0.75 0.37 0.50 0.63
CSW Services 0.23 0.17 0.15 0.17 0.16 0.15 0.18 0.21 0.17 0.30 0.17 0.20 0.22
Overheads 0.12 0.09 0.09 0.09 0.10 0.19 0.10 0.12 0.14 0.21 0.15 0.18 0.12
SWL Pathology 0.02 0.05 0.07 0.05 0.10 0.09 0.07 0.09 -0.02 0.04 0.04 0.06
-0.10
0.00
0.10
0.20
0.30
0.40
0.50
0.60
0.70
0.80
Bank costs by Division (£m)

TB April 15-03
29
SECTION 5: NON-PAY
As at March 2015 CURRENT MONTH M12 CUMULATIVE YTD FORECAST
Cost Category Sub Category
Current
Budget
Current
Amount
Current
Month
Variance YTD Budget
YTD
Amount
YTD
Variance
%
Variance
Previous
Variance
Annual
Budget Forecast
£000's £000's £000's £000's £000's £000's £000's £000's £000's
Clinical Supplies Clinical Consumables -7,332 -7,158 174 F -88,305 -91,937 -3,631 A 4% -3,805 A -88,305 -91,937
Drugs -4,026 -5,414 -1,387 A -43,037 -49,461 -6,425 A 15% -5,037 A -43,037 -49,461
Clinical Supplies Total -11,358 -12,572 -1,214 A -131,342 -141,398 -10,056 A 8% -8,842 A -131,342 -141,398
Other Clinical Negligence -943 -834 109 F -10,193 -9,653 540 F -5% 431 F -10,193 -9,653
Establishment -819 -872 -54 A -9,824 -10,300 -476 A 5% -422 A -9,824 -10,300
General Supplies -1,298 -1,142 156 F -15,672 -16,109 -438 A 3% -594 A -15,672 -16,109
Premises -2,862 -3,954 -1,093 A -34,331 -36,706 -2,375 A 7% -1,282 A -34,331 -36,706
PFI Unitary payment -568 -572 -4 A -6,813 -6,869 -56 A 1% -52 A -6,813 -6,869
Other 17,990 17,984 -5 A -13,658 -30,721 -17,063 A 125% -17,058 A -13,658 -30,721
Other Total 11,500 10,610 -890 A -90,491 -110,359 -19,868 A 22% -18,978 A -90,491 -110,359
Non Pay Total 142 -1,962 -2,104 A -221,833 -251,756 -29,924 A 13% -27,820 A -221,833 -251,756
COMMENTARY (Cross reference to Page 11 Exclusions Table) Non pay costs have over-spent by £2.1m in month (over-spent £29.9m YTD. Of the YTD overspend £5.73m is claimable as income as contract exclusions.
Clinical consumables over-spent £3.63m in total YTD
This was underspent by £174k in month. YTD the two main factors contributing to the adverse position are high cost devices where the costs are offset to commissioners and partly costs relating to activity e.g. Community Patient Appliances. YTD there are significant overspends in T&O, ENT, Neurosurgery, Critical Care and Clinical Genetics which are activity related. This has been offset partly by underspend in Clotting factors in Clinical. Haematology.
Drugs over-spent £6.425m in total YTD
Drugs expenditure was £1.39m over-spent in the month. This included the impact of £1.0m of trading activity with an external enterprise. Clinical Drugs overspend was primarily due to higher use of excluded drugs for Gastro, Rheumatology, Clin Haematology, Neurology and Oncology which are reclaimable directly from Commissioners as income. However, HIV drugs are underspent and the Trust has a contractual issue with the supplier
Energy/Utilities under-spent £122k in total YTD ( Offset by Income over recovery of £55k)
Energy underspent £22k in month. There have been some pressures in the current month gas bill partially offset by lower electricity charges than budgeted. We are now recognising potential liabilities for CRC and EU emission levies which total £187k YTD. The YTD underspent position is partly offset by the reduced recharging of usage costs to other on site organisations. Recharges with the Medical School are now based on updated metered supplies. The Trust is benefitting from net export of surplus energy to the Grid of £326k YTD. The net energy position is now in a small surplus of £121k YTD because of this export of energy.
Other non-pay over-spent £19.87m in total YTD
Other non-pay over-spent in the month by £891k. The main overspends relate to project costs £6.37m YTD which is partly offset by the underspend in non clinical pay and includes IT upgrading costs of £1.24m. Other non pay pressures include the continued use of external facilities to add to capacity for beds and Theatres which is £4.72m adverse YTD. The impact of non achieved non pay CIPs is partly offset by the application of the contingency reserves and the application of the central fighting fund of non recurrent benefits set aside to cover risks.

TB April 15-03
30
SECTION 6: CONTINGENCY & RESERVES
CONTINGENCY & RESERVES
YEAR TO DATE ANNUALFORECAST
Budget Actual Variance Budget Actual Variance
£000's £000's £000's £000's £000's £000's
Inflation
Pay Award 166 0 -166 166 0 -166
Clinical Excellence -192 0 192 -192 0 192
Non Pay 131 0 -131 131 0 -131
Contingency & Reserves
Contract Changes/Devlpmts 1,667 0 -1,667 1,667 0 -1,667
Winter Pressures 0 0 0 0 0 0
R&D Strategy 151 0 -151 151 0 -151
Other Pressures 3,642 0 -3,642 3,642 0 -3,642
Contingency 3,000 0 -3,000 3,000 0 -3,000
TOTAL 8,564 0 -8,564 8,564 0 -8,564
COMMENTARY
Inflationary reserves are held centrally and allocated when the costs are incurred. As at year end to March £0.10m of inflationary reserves that were being held primarily for Energy inflation and Clinical Excellence Awards were released.
During March, a further month of contingency funds of £0.25m was released to aid the position. In total, £3m of the overall contingency funds held was distributed to the Divisional positions.
Reserves for Nursing Establishment and Compliance cost pressures have been released to Divisions.
The Trust’s Central Reserves (excluding contingencies) as at end of March totals £3.8m (£3.6m for Specific Cost pressures, £0.15m for R&D development and other pressures were released.
The Trust had received notification of loss of contracted Project Diamond, HCAS and Educational funding during the year. However additional funding was subsequently made available in March on a non recurrent basis. This has resulted in a net £1.67m of Contractual reserves being available to release.
In addition, the Trust holds income risk provisions held centrally to offset CQUIN risks of £1.7m. Reserves for potential C-diff fines and SLA challenges have been allocated to divisions totalling £6.9m.
Additional non recurring benefits are being identified and then included in the “fighting fund”. The fighting fund is being released as required to support the current financial position.

TB April 15-03
31
SECTION 7: DIVISIONAL FORECAST
FORECAST - COMMENTARY
The Trust prepared an updated forecast at M11 which showed a deficit of £13.7m (IFRS) the final outturn being £16.8m the major movements are shown in the table below
£m
Forecast as at Month 11 -13.7
Divisional Costs Above Trend -2.4
Shortfall on spending review -0.2
Additional Income forecast based on March profile -1.0
Impact of final challenges agreed with Commissioners -2.4
Year end settlement less favourable than planned -1.4
SLA other changes outside of Year end settlement 2.8
Education & Research 0.8
Balance sheet mitigations 1.6
Additional Costs -0.9
Draft Outturn -16.8
The main factors resulting in this continued deterioration were:-
Worsening in divisional operational performance since October resulting in lower elective inpatients than planned.
High levels of emergency inpatients resulting in marginal rates of income above set emergency activity thresholds.
Impact of year end settlement of SLA income and higher data challenges with commissioners.
Inability to achieve the outstanding CIP targets phased into the latter part of the financial year.
Financial controls in place to curb temporary staffing usage and non essential spend have yet to see a significant impact on expenditure trends.
The Trust was only able to mitigate part of the deterioration by a review of its balance sheet
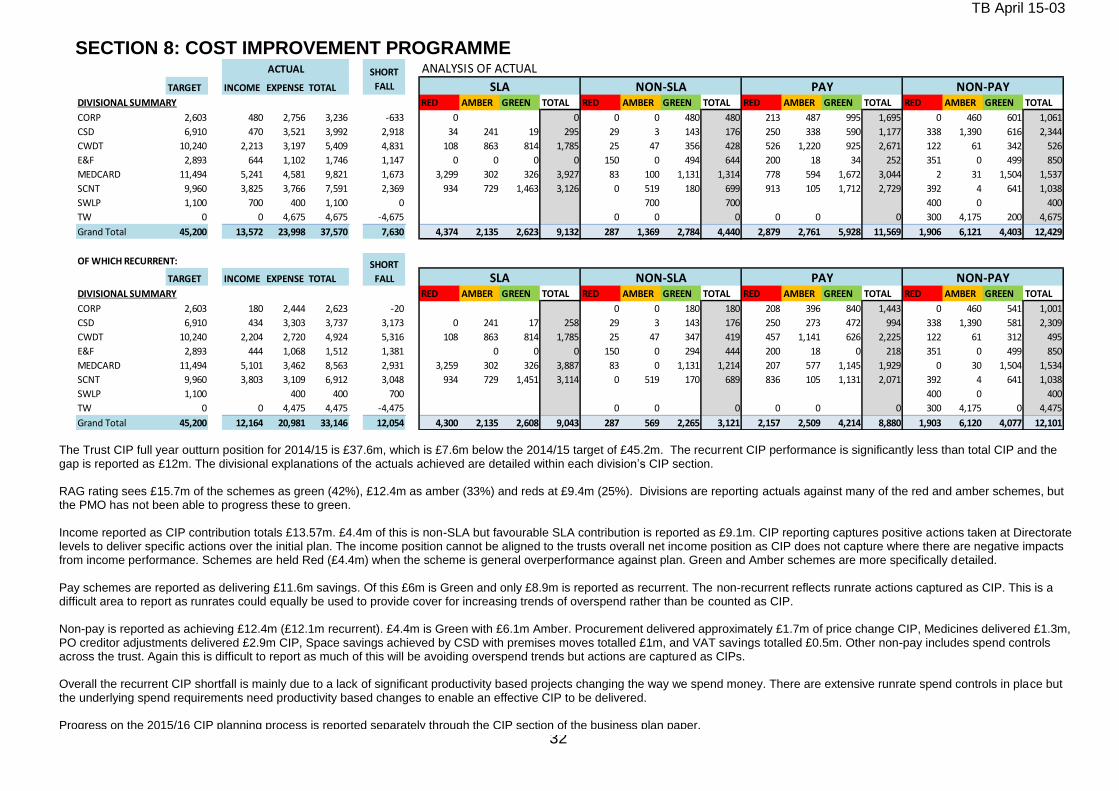
TB April 15-03
32
SECTION 8: COST IMPROVEMENT PROGRAMME ANALYSIS OF ACTUAL
TARGET INCOME EXPENSE TOTAL
DIVISIONAL SUMMARY RED AMBER GREEN TOTAL RED AMBER GREEN TOTAL RED AMBER GREEN TOTAL RED AMBER GREEN TOTAL
CORP 2,603 480 2,756 3,236 -633 0 0 0 0 480 480 213 487 995 1,695 0 460 601 1,061
CSD 6,910 470 3,521 3,992 2,918 34 241 19 295 29 3 143 176 250 338 590 1,177 338 1,390 616 2,344
CWDT 10,240 2,213 3,197 5,409 4,831 108 863 814 1,785 25 47 356 428 526 1,220 925 2,671 122 61 342 526
E&F 2,893 644 1,102 1,746 1,147 0 0 0 0 150 0 494 644 200 18 34 252 351 0 499 850
MEDCARD 11,494 5,241 4,581 9,821 1,673 3,299 302 326 3,927 83 100 1,131 1,314 778 594 1,672 3,044 2 31 1,504 1,537
SCNT 9,960 3,825 3,766 7,591 2,369 934 729 1,463 3,126 0 519 180 699 913 105 1,712 2,729 392 4 641 1,038
SWLP 1,100 700 400 1,100 0 700 700 400 0 400
TW 0 0 4,675 4,675 -4,675 0 0 0 0 0 0 300 4,175 200 4,675
Grand Total 45,200 13,572 23,998 37,570 7,630 4,374 2,135 2,623 9,132 287 1,369 2,784 4,440 2,879 2,761 5,928 11,569 1,906 6,121 4,403 12,429
OF WHICH RECURRENT:
TARGET INCOME EXPENSE TOTAL
DIVISIONAL SUMMARY RED AMBER GREEN TOTAL RED AMBER GREEN TOTAL RED AMBER GREEN TOTAL RED AMBER GREEN TOTAL
CORP 2,603 180 2,444 2,623 -20 0 0 180 180 208 396 840 1,443 0 460 541 1,001
CSD 6,910 434 3,303 3,737 3,173 0 241 17 258 29 3 143 176 250 273 472 994 338 1,390 581 2,309
CWDT 10,240 2,204 2,720 4,924 5,316 108 863 814 1,785 25 47 347 419 457 1,141 626 2,225 122 61 312 495
E&F 2,893 444 1,068 1,512 1,381 0 0 0 150 0 294 444 200 18 0 218 351 0 499 850
MEDCARD 11,494 5,101 3,462 8,563 2,931 3,259 302 326 3,887 83 0 1,131 1,214 207 577 1,145 1,929 0 30 1,504 1,534
SCNT 9,960 3,803 3,109 6,912 3,048 934 729 1,451 3,114 0 519 170 689 836 105 1,131 2,071 392 4 641 1,038
SWLP 1,100 400 400 700 400 0 400
TW 0 0 4,475 4,475 -4,475 0 0 0 0 0 0 300 4,175 0 4,475
Grand Total 45,200 12,164 20,981 33,146 12,054 4,300 2,135 2,608 9,043 287 569 2,265 3,121 2,157 2,509 4,214 8,880 1,903 6,120 4,077 12,101
NON-PAY
SHORT
FALL SLA NON-SLA PAY NON-PAY
ACTUAL SHORT
FALL SLA NON-SLA PAY
The Trust CIP full year outturn position for 2014/15 is £37.6m, which is £7.6m below the 2014/15 target of £45.2m. The recurrent CIP performance is significantly less than total CIP and the gap is reported as £12m. The divisional explanations of the actuals achieved are detailed within each division’s CIP section. RAG rating sees £15.7m of the schemes as green (42%), £12.4m as amber (33%) and reds at £9.4m (25%). Divisions are reporting actuals against many of the red and amber schemes, but the PMO has not been able to progress these to green. Income reported as CIP contribution totals £13.57m. £4.4m of this is non-SLA but favourable SLA contribution is reported as £9.1m. CIP reporting captures positive actions taken at Directorate levels to deliver specific actions over the initial plan. The income position cannot be aligned to the trusts overall net income position as CIP does not capture where there are negative impacts from income performance. Schemes are held Red (£4.4m) when the scheme is general overperformance against plan. Green and Amber schemes are more specifically detailed. Pay schemes are reported as delivering £11.6m savings. Of this £6m is Green and only £8.9m is reported as recurrent. The non-recurrent reflects runrate actions captured as CIP. This is a difficult area to report as runrates could equally be used to provide cover for increasing trends of overspend rather than be counted as CIP. Non-pay is reported as achieving £12.4m (£12.1m recurrent). £4.4m is Green with £6.1m Amber. Procurement delivered approximately £1.7m of price change CIP, Medicines delivered £1.3m, PO creditor adjustments delivered £2.9m CIP, Space savings achieved by CSD with premises moves totalled £1m, and VAT savings totalled £0.5m. Other non-pay includes spend controls across the trust. Again this is difficult to report as much of this will be avoiding overspend trends but actions are captured as CIPs. Overall the recurrent CIP shortfall is mainly due to a lack of significant productivity based projects changing the way we spend money. There are extensive runrate spend controls in place but the underlying spend requirements need productivity based changes to enable an effective CIP to be delivered. Progress on the 2015/16 CIP planning process is reported separately through the CIP section of the business plan paper.
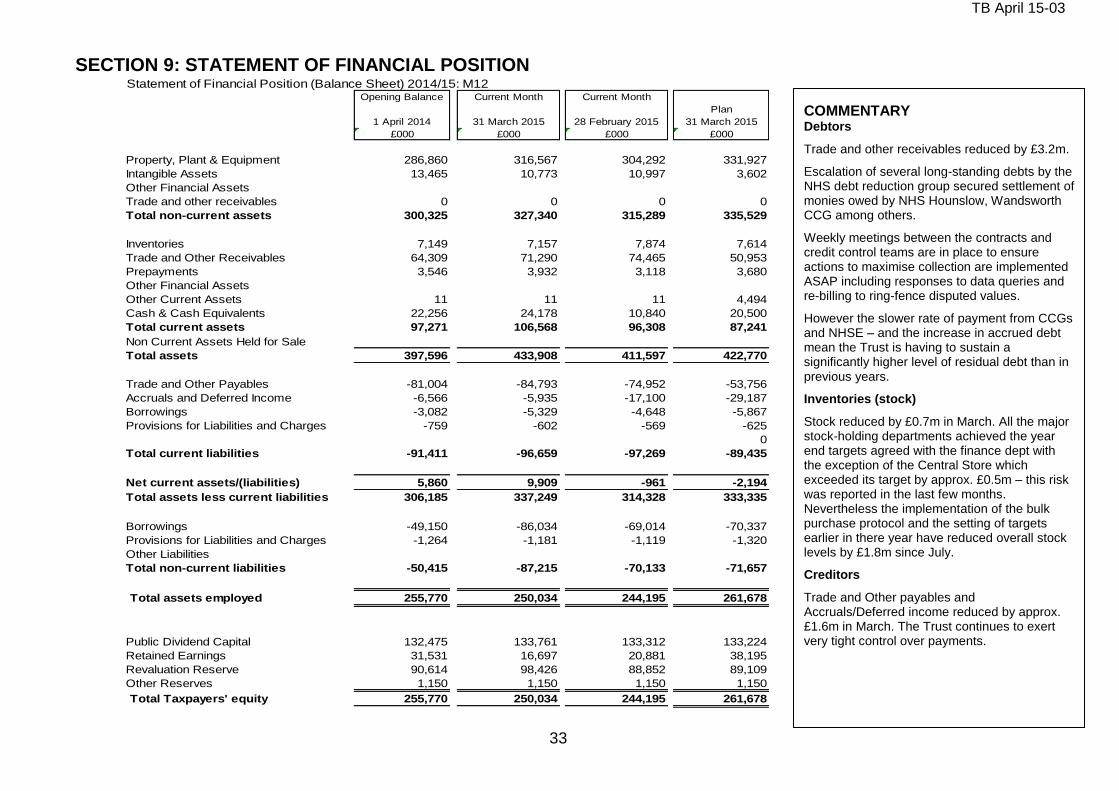
TB April 15-03
33
SECTION 9: STATEMENT OF FINANCIAL POSITION Statement of Financial Position (Balance Sheet) 2014/15: M12
Opening Balance Current Month Current Month
Plan
1 April 2014 31 March 2015 28 February 2015 31 March 2015
£000 £000 £000 £000
Property, Plant & Equipment 286,860 316,567 304,292 331,927
Intangible Assets 13,465 10,773 10,997 3,602
Other Financial Assets
Trade and other receivables 0 0 0 0
Total non-current assets 300,325 327,340 315,289 335,529
Inventories 7,149 7,157 7,874 7,614
Trade and Other Receivables 64,309 71,290 74,465 50,953
Prepayments 3,546 3,932 3,118 3,680
Other Financial Assets
Other Current Assets 11 11 11 4,494
Cash & Cash Equivalents 22,256 24,178 10,840 20,500
Total current assets 97,271 106,568 96,308 87,241
Non Current Assets Held for Sale
Total assets 397,596 433,908 411,597 422,770
Trade and Other Payables -81,004 -84,793 -74,952 -53,756
Accruals and Deferred Income -6,566 -5,935 -17,100 -29,187
Borrowings -3,082 -5,329 -4,648 -5,867
Provisions for Liabilities and Charges -759 -602 -569 -625
0
Total current liabilities -91,411 -96,659 -97,269 -89,435
Net current assets/(liabilities) 5,860 9,909 -961 -2,194
Total assets less current liabilities 306,185 337,249 314,328 333,335
Borrowings -49,150 -86,034 -69,014 -70,337
Provisions for Liabilities and Charges -1,264 -1,181 -1,119 -1,320
Other Liabilities
Total non-current liabilities -50,415 -87,215 -70,133 -71,657
Total assets employed 255,770 250,034 244,195 261,678
Public Dividend Capital 132,475 133,761 133,312 133,224
Retained Earnings 31,531 16,697 20,881 38,195
Revaluation Reserve 90,614 98,426 88,852 89,109
Other Reserves 1,150 1,150 1,150 1,150
Total Taxpayers' equity 255,770 250,034 244,195 261,678
COMMENTARY
Debtors
Trade and other receivables reduced by £3.2m.
Escalation of several long-standing debts by the NHS debt reduction group secured settlement of monies owed by NHS Hounslow, Wandsworth CCG among others.
Weekly meetings between the contracts and credit control teams are in place to ensure actions to maximise collection are implemented ASAP including responses to data queries and re-billing to ring-fence disputed values.
However the slower rate of payment from CCGs and NHSE – and the increase in accrued debt mean the Trust is having to sustain a significantly higher level of residual debt than in previous years.
Inventories (stock)
Stock reduced by £0.7m in March. All the major stock-holding departments achieved the year end targets agreed with the finance dept with the exception of the Central Store which exceeded its target by approx. £0.5m – this risk was reported in the last few months. Nevertheless the implementation of the bulk purchase protocol and the setting of targets earlier in there year have reduced overall stock levels by £1.8m since July.
Creditors
Trade and Other payables and Accruals/Deferred income reduced by approx. £1.6m in March. The Trust continues to exert very tight control over payments.

TB April 15-03
34
SECTION 10 : CASH POSITION ST GEORGE'S UNIVERSITY HOSPITALS NHS FOUNDATION TRUST
Finance Department
Cash flow statement: March 20152014-15 Plan
YTD
2014-15
Actual YTD
2014-15
Full Year
Plan
2014-15 Actual
outturn
£000 £000 £000 £000
CASH FLOWS FROM OPERATING ACTIVITIES
Operating Surplus/(Deficit) 17,253 (5,825) 17,253 (5,825)
Depreciation and Amortisation 20,733 21,146 20,733 21,146
Impairments and Reversals - - -
Other Gains / (Losses) - (12) - (12)
Donated Assets received credited to revenue but non-cash - - -
Government Granted Assets received credited to revenue but non-cash (174) (174) (174) (174)
Interest Paid (3,772) (3,235) (3,772) (3,235)
Dividend (Paid)/Refunded (7,978) (7,696) (7,978) (7,696)
Operating surplus/-deficit less interest and dividends paid 26,062 4,204 26,062 4,204
(Increase)/Decrease in Inventories 749 (8) 749 (8)
(Increase)/Decrease in Trade and Other Receivables 2,543 (7,367) 2,543 (7,367)
(Increase)/Decrease in Other Current Assets 704 704 -
Increase/(Decrease) in Trade and Other Payables (2,982) 2,905 (2,982) 2,905
Increase/(Decrease) in Other Current Liabilities - - -
Net change in working capital balances 1,014 (4,469) 1,014 (4,469)
Provisions Utilised - (240) - (240)
Increase/(Decrease) in Movement in non Cash Provisions 16 16 -
Net Cash Inflow/(Outflow) from Operating Activities 27,092 (505) 27,092 (505)
CASH FLOWS FROM INVESTING ACTIVITIES
Interest received 100 79 100 79
(Payments) for Property, Plant and Equipment (41,266) (32,867) (41,266) (32,867)
(Payments) for Intangible Assets - - -
Proceeds of disposal of assets held for sale (PPE) - 150 - 150
Proceeds from Disposal of Intangible Assets - - -
(Payments) for Investments with DH - - - -
(Payments) for Other Financial Assets - - - -
Proceeds from Disposal of Investement with DH - - -
Procceds from Disposal of Other Financial Assets - - -
Revenue Rental Income - - -
Net Cash Inflow/(Outflow)from Investing Activities (41,166) (32,638) (41,166) (32,638)
NET CASH INFLOW/(OUTFLOW) BEFORE FINANCING (14,074) (33,143) (14,074) (33,143)
CASH FLOWS FROM FINANCING ACTIVITIES
New Public Dividend Capital received in year: PDC Capital 749 1,286 749 1,286
Working capital facility utilised -
Loans received from DH - New Capital Investment Loans 11,170 9,119 11,170 9,119
New Working Capital Loans 15,000 15,000
Other Loans Received 4,004 13,303 4,004 13,303
Loans repaid to DH - Capital Investment Loans Repayment of Principal (447) (447) -
Working Capital Loans Repayment of Principal - -
Other Loans Repaid (388) (388) (388) (388)
Other Capital Receipts - - - -
Capital element of payments relating to PFI, LIFT Schemes and finance
leases (2,814) (3,255) (2,814) (3,255)
Working capital facility - - -
Net Cash Inflow/(Outflow)from Financing 12,274 35,065 12,274 35,065
Net Increase/(Decrease) in Cash and Cash Equivalents (1,800) 1,922 (1,800) 1,922
Cash (and) Cash Equivalents ( and Bank Overdrafts) at the
Beginning of the Financial Period 22,300 22,256 22,300 22,256
Cash (and) Cash Equivalents ( and Bank Overdrafts) at the End of
the Financial Period 20,500 24,178 20,500 24,178
Exclude - LEEF loan not spent (12,502) (12,502)
Cash bal excl LEEF loan not spent 11,676 11,676
COMMENTARY
March The Trust’s cash balance was £24.2m compared to £10.8m last month and the £20.6m forecast last month. The cash balance was higher than forecast due to:
lower capital expenditure in March than forecast (although in line with budget)
receipt of extra £1.3m LEEF loan (not in forecast)
higher receipts from debtors in the last month
These factors helped to offset the cash impact of the high trading deficit in March. The Trust drew down the approved £15m working capital loan on 23
rd March (as
forecast).
The underlying cash balance excluding the unexpended LEEF loan of £12.5m – which will finance capital expenditure - is therefore approx. £11.7m.
2014/15
The Trust incurred a revenue deficit of £16.8m in 14/15 and this is the main cause of the significant deterioration in cash over the year.
Also the Trust incurred an adverse change in net working capital balances of -£4.4m – higher debt levels were to some extent offset by higher creditor levels.
The NHS Debt Reduction Group meets once a week to expedite settlement of disputed values to maximise receipts from commissioners. Although total debt is higher than this time last year it has reduced by £1.5m more than forecast in the January WCBM.
Inventories (stock) has reduced by £1.8m since it peaked in M04 however was approx. £0.4m higher than the WCBM forecast due to the Central Store exceeding its target. The Procurement dept plans to reduce stock significantly in 2015/16
The Trust will have to continue to exert tight management of payments and apply constraints over internally-financed capital expenditure.
Surplus cash is invested in short term deposits with the National Loans Fund facility of the Bank of England. Ttemporary deposits earn interest of 0.25%- 0.50%.
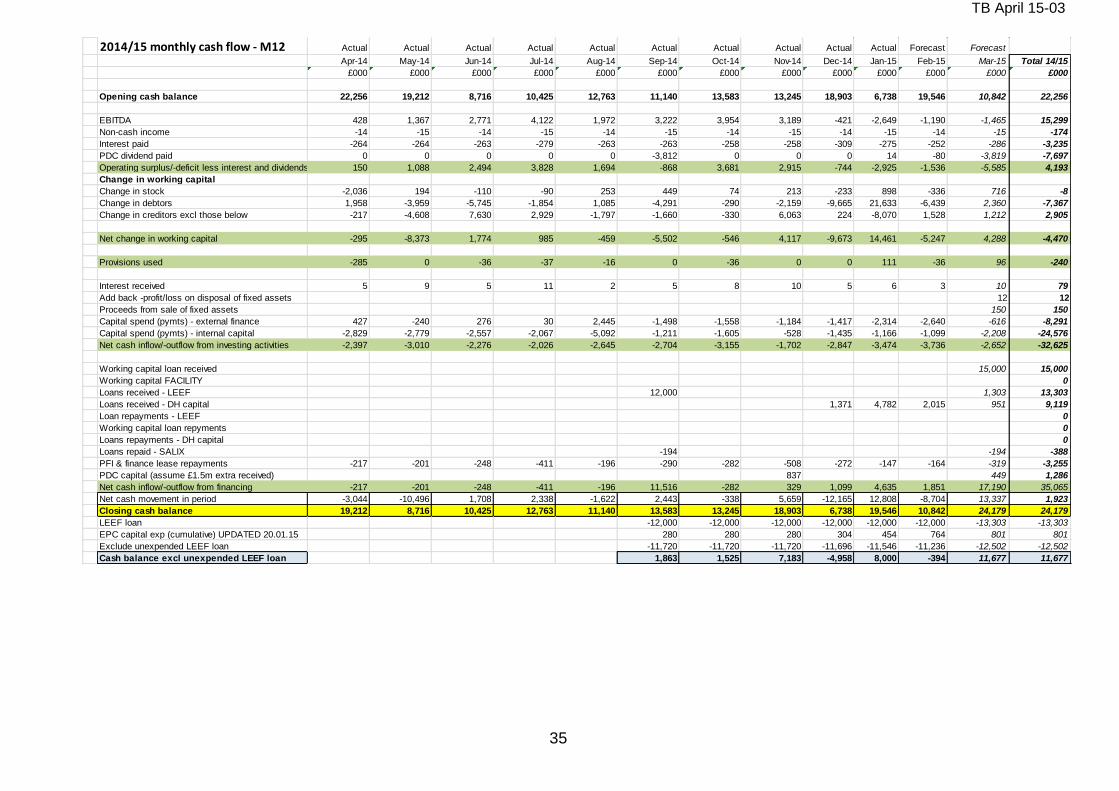
TB April 15-03
35
2014/15 monthly cash flow - M12 Actual Actual Actual Actual Actual Actual Actual Actual Actual Actual Forecast Forecast
Apr-14 May-14 Jun-14 Jul-14 Aug-14 Sep-14 Oct-14 Nov-14 Dec-14 Jan-15 Feb-15 Mar-15 Total 14/15
£000 £000 £000 £000 £000 £000 £000 £000 £000 £000 £000 £000 £000
Opening cash balance 22,256 19,212 8,716 10,425 12,763 11,140 13,583 13,245 18,903 6,738 19,546 10,842 22,256
EBITDA 428 1,367 2,771 4,122 1,972 3,222 3,954 3,189 -421 -2,649 -1,190 -1,465 15,299
Non-cash income -14 -15 -14 -15 -14 -15 -14 -15 -14 -15 -14 -15 -174
Interest paid -264 -264 -263 -279 -263 -263 -258 -258 -309 -275 -252 -286 -3,235
PDC dividend paid 0 0 0 0 0 -3,812 0 0 0 14 -80 -3,819 -7,697
Operating surplus/-deficit less interest and dividends paid 150 1,088 2,494 3,828 1,694 -868 3,681 2,915 -744 -2,925 -1,536 -5,585 4,193
Change in working capital
Change in stock -2,036 194 -110 -90 253 449 74 213 -233 898 -336 716 -8
Change in debtors 1,958 -3,959 -5,745 -1,854 1,085 -4,291 -290 -2,159 -9,665 21,633 -6,439 2,360 -7,367
Change in creditors excl those below -217 -4,608 7,630 2,929 -1,797 -1,660 -330 6,063 224 -8,070 1,528 1,212 2,905
Net change in working capital -295 -8,373 1,774 985 -459 -5,502 -546 4,117 -9,673 14,461 -5,247 4,288 -4,470
Provisions used -285 0 -36 -37 -16 0 -36 0 0 111 -36 96 -240
Interest received 5 9 5 11 2 5 8 10 5 6 3 10 79
Add back -profit/loss on disposal of fixed assets 12 12
Proceeds from sale of fixed assets 150 150
Capital spend (pymts) - external finance 427 -240 276 30 2,445 -1,498 -1,558 -1,184 -1,417 -2,314 -2,640 -616 -8,291
Capital spend (pymts) - internal capital -2,829 -2,779 -2,557 -2,067 -5,092 -1,211 -1,605 -528 -1,435 -1,166 -1,099 -2,208 -24,576
Net cash inflow/-outflow from investing activities -2,397 -3,010 -2,276 -2,026 -2,645 -2,704 -3,155 -1,702 -2,847 -3,474 -3,736 -2,652 -32,625
Working capital loan received 15,000 15,000
Working capital FACILITY 0
Loans received - LEEF 12,000 1,303 13,303
Loans received - DH capital 1,371 4,782 2,015 951 9,119
Loan repayments - LEEF 0
Working capital loan repyments 0
Loans repayments - DH capital 0
Loans repaid - SALIX -194 -194 -388
PFI & finance lease repayments -217 -201 -248 -411 -196 -290 -282 -508 -272 -147 -164 -319 -3,255
PDC capital (assume £1.5m extra received) 837 449 1,286
Net cash inflow/-outflow from financing -217 -201 -248 -411 -196 11,516 -282 329 1,099 4,635 1,851 17,190 35,065
Net cash movement in period -3,044 -10,496 1,708 2,338 -1,622 2,443 -338 5,659 -12,165 12,808 -8,704 13,337 1,923
Closing cash balance 19,212 8,716 10,425 12,763 11,140 13,583 13,245 18,903 6,738 19,546 10,842 24,179 24,179
LEEF loan -12,000 -12,000 -12,000 -12,000 -12,000 -12,000 -13,303 -13,303
EPC capital exp (cumulative) UPDATED 20.01.15 280 280 280 304 454 764 801 801
Exclude unexpended LEEF loan -11,720 -11,720 -11,720 -11,696 -11,546 -11,236 -12,502 -12,502
Cash balance excl unexpended LEEF loan 1,863 1,525 7,183 -4,958 8,000 -394 11,677 11,677
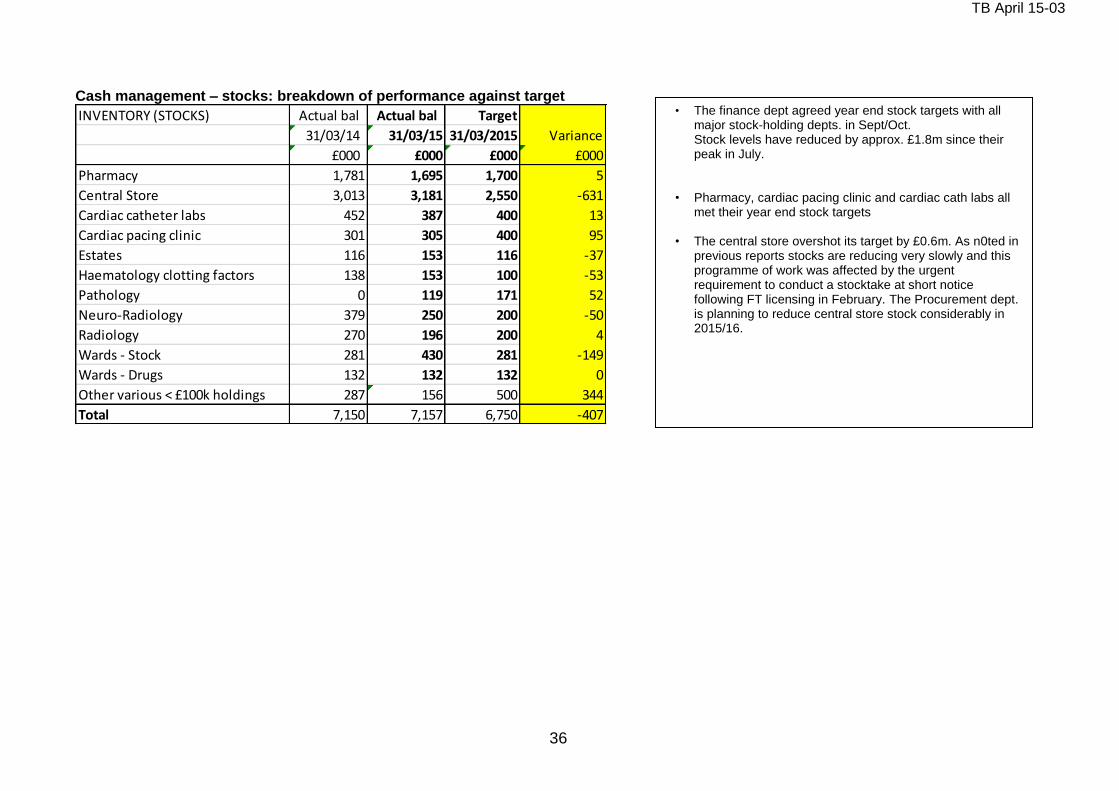
TB April 15-03
36
Cash management – stocks: breakdown of performance against target
INVENTORY (STOCKS) Actual bal Actual bal Target
31/03/14 31/03/15 31/03/2015 Variance
£000 £000 £000 £000
Pharmacy 1,781 1,695 1,700 5
Central Store 3,013 3,181 2,550 -631
Cardiac catheter labs 452 387 400 13
Cardiac pacing clinic 301 305 400 95
Estates 116 153 116 -37
Haematology clotting factors 138 153 100 -53
Pathology 0 119 171 52
Neuro-Radiology 379 250 200 -50
Radiology 270 196 200 4
Wards - Stock 281 430 281 -149
Wards - Drugs 132 132 132 0
Other various < £100k holdings 287 156 500 344
Total 7,150 7,157 6,750 -407
• The finance dept agreed year end stock targets with all major stock-holding depts. in Sept/Oct. Stock levels have reduced by approx. £1.8m since their peak in July.
• Pharmacy, cardiac pacing clinic and cardiac cath labs all
met their year end stock targets • The central store overshot its target by £0.6m. As n0ted in
previous reports stocks are reducing very slowly and this programme of work was affected by the urgent requirement to conduct a stocktake at short notice following FT licensing in February. The Procurement dept. is planning to reduce central store stock considerably in 2015/16.
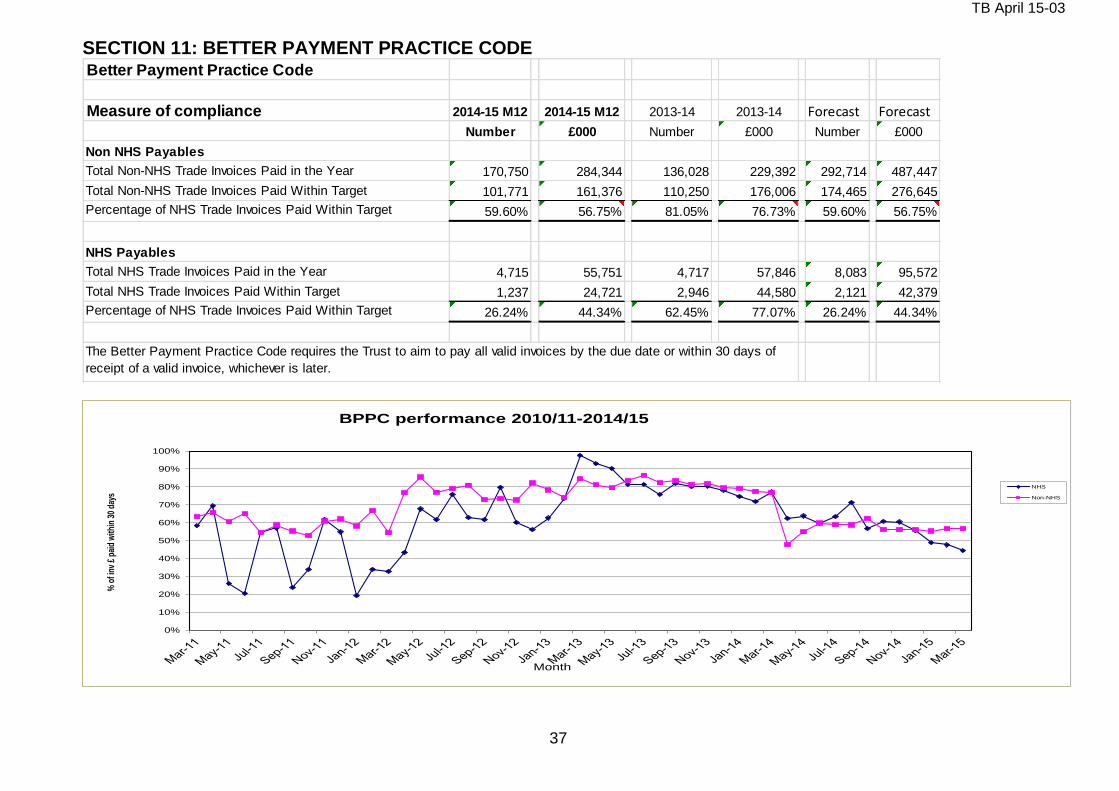
TB April 15-03
37
SECTION 11: BETTER PAYMENT PRACTICE CODE Better Payment Practice Code
Measure of compliance 2014-15 M12 2014-15 M12 2013-14 2013-14 Forecast Forecast
Number £000 Number £000 Number £000
Non NHS Payables
Total Non-NHS Trade Invoices Paid in the Year 170,750 284,344 136,028 229,392 292,714 487,447
Total Non-NHS Trade Invoices Paid Within Target 101,771 161,376 110,250 176,006 174,465 276,645
Percentage of NHS Trade Invoices Paid Within Target 59.60% 56.75% 81.05% 76.73% 59.60% 56.75%
NHS Payables
Total NHS Trade Invoices Paid in the Year 4,715 55,751 4,717 57,846 8,083 95,572
Total NHS Trade Invoices Paid Within Target 1,237 24,721 2,946 44,580 2,121 42,379
Percentage of NHS Trade Invoices Paid Within Target 26.24% 44.34% 62.45% 77.07% 26.24% 44.34%
The Better Payment Practice Code requires the Trust to aim to pay all valid invoices by the due date or within 30 days of
receipt of a valid invoice, whichever is later.
0%
10%
20%
30%
40%
50%
60%
70%
80%
90%
100%
% o
f inv
£ p
aid
with
in 3
0 da
ys
Month
BPPC performance 2010/11-2014/15
NHS
Non-NHS
Forecast

TB April 15-03
38
SECTION 12: CAPITAL
ST GEORGE'S HEALTHCARE NHS TRUST
Finance Department
Capital programme 2014/15 M12 - high level summary budget and actual / forecast exp profile
M01 M02 M03 M04 M05 M06 M07 M08 M09 M10 M11 M12 M12 YTD Total
£000 £000 £000 £000 £000 £000 £000 £000 £000 £000 £000 £000 £000 £000
Capital funding 4,248 3,569 2,749 2,950 3,978 5,097 5,664 5,594 6,264 5,740 6,799 4,363 57,014 57,014
Capital expenditureInfrastructure renewal (appx 1)Budget -116 -263 -395 -611 -925 -1,179 -1,038 -1,030 -842 -882 -674 -892 -8,847 -8,847
Actual -301 -582 -653 -495 -890 -217 -71 -287 -141 -375 -448 -118 -4,578 -4,578
Variance -185 -319 -258 116 35 962 967 743 701 507 226 774 4,269 4,269
Medical equipment (appx 2)Budget - MAJOR MED -616 -1,000 -154 -777 -1,406 -900 -556 -331 -1,306 -1,674 -4,013 -1,166 -13,901 -13,901
Actual exp - MAJOR MED -421 -814 -169 -876 -158 -614 -3,172 -457 -198 -684 -6 -1,158 -8,727 -8,727
Variance - MAJOR MED 195 186 -15 -99 1,248 286 -2,616 -126 1,108 990 4,007 8 5,174 5,174
IMT (appx 3)Budget - OTHER IMT -1,050 -1,541 -1,166 -652 -447 -507 -543 -583 -708 -819 -570 -343 -8,929 -8,929
Actual -1,794 -804 -524 -1,078 -3,388 683 -1,036 400 -753 -823 -788 -718 -10,623 -10,623
Variance - OTHER IMT -744 737 642 -426 -2,941 1,190 -493 983 -45 -4 -218 -375 -1,694 -1,694
Major Projects (appx 4)Budget - Major Projects -2,076 -549 -877 -802 -1,070 -2,389 -3,422 -3,543 -3,347 -2,304 -1,468 -1,916 -23,762 -23,762
Actual -13 -542 -1,110 -357 -715 -1,171 -574 -1,455 -2,277 -1,009 -2,051 -1,919 -13,193 -13,193
Variance - Other Major Projects 2,063 7 -233 445 355 1,218 2,848 2,088 1,070 1,295 -583 -3 10,569 10,569
Other (appx 5)Budget -390 -216 -157 -108 -131 -123 -106 -108 -60 -61 -74 -42 -1,575 -1,575
Actual -28 -43 -116 -25 -386 -30 -60 43 -76 -18 -73 -480 -1,292 -1,292
Variance 362 173 41 83 -255 93 46 151 -16 43 1 -438 283 283
Budget - total -4,248 -3,569 -2,749 -2,950 -3,979 -5,098 -5,665 -5,595 -6,263 -5,740 -6,799 -4,359 -57,014 -57,014
Actual exp - total -2,557 -2,784 -2,570 -2,831 -5,537 -1,349 -4,913 -1,756 -3,445 -2,909 -3,366 -4,393 -38,410 -38,413
Expenditure variance - total 1,691 785 180 119 -1,558 3,749 752 3,839 2,818 2,831 3,433 -34 18,605 18,602
Expenditure underspend as % of YTD budget = 33% 2014/15 OUTTURN
The Trust has incurred capital expenditure of approx. £38.4m for the year against the budget of £57m - an under spend of £18.6m (M11 £18.6m). The under spend is equivalent to 33% of the budget.
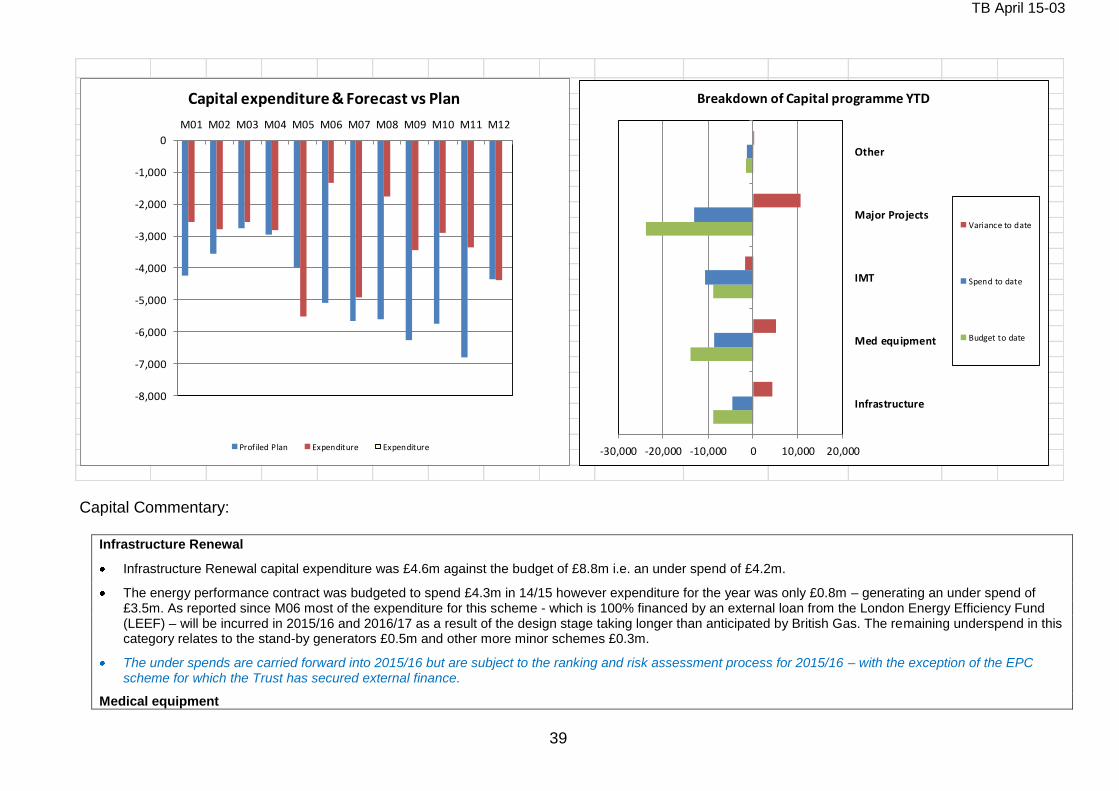
TB April 15-03
39
-8,000
-7,000
-6,000
-5,000
-4,000
-3,000
-2,000
-1,000
0
M01 M02 M03 M04 M05 M06 M07 M08 M09 M10 M11 M12
Capital expenditure & Forecast vs Plan
Prof iled Plan Expenditure Expenditure -30,000 -20,000 -10,000 0 10,000 20,000
Infrastructure
Med equipment
IMT
Major Projects
Other
Breakdown of Capital programme YTD
Variance to date
Spend to date
Budget to date
Capital Commentary:
Infrastructure Renewal
Infrastructure Renewal capital expenditure was £4.6m against the budget of £8.8m i.e. an under spend of £4.2m.
The energy performance contract was budgeted to spend £4.3m in 14/15 however expenditure for the year was only £0.8m – generating an under spend of £3.5m. As reported since M06 most of the expenditure for this scheme - which is 100% financed by an external loan from the London Energy Efficiency Fund (LEEF) – will be incurred in 2015/16 and 2016/17 as a result of the design stage taking longer than anticipated by British Gas. The remaining underspend in this category relates to the stand-by generators £0.5m and other more minor schemes £0.3m.
The under spends are carried forward into 2015/16 but are subject to the ranking and risk assessment process for 2015/16 – with the exception of the EPC scheme for which the Trust has secured external finance.
Medical equipment
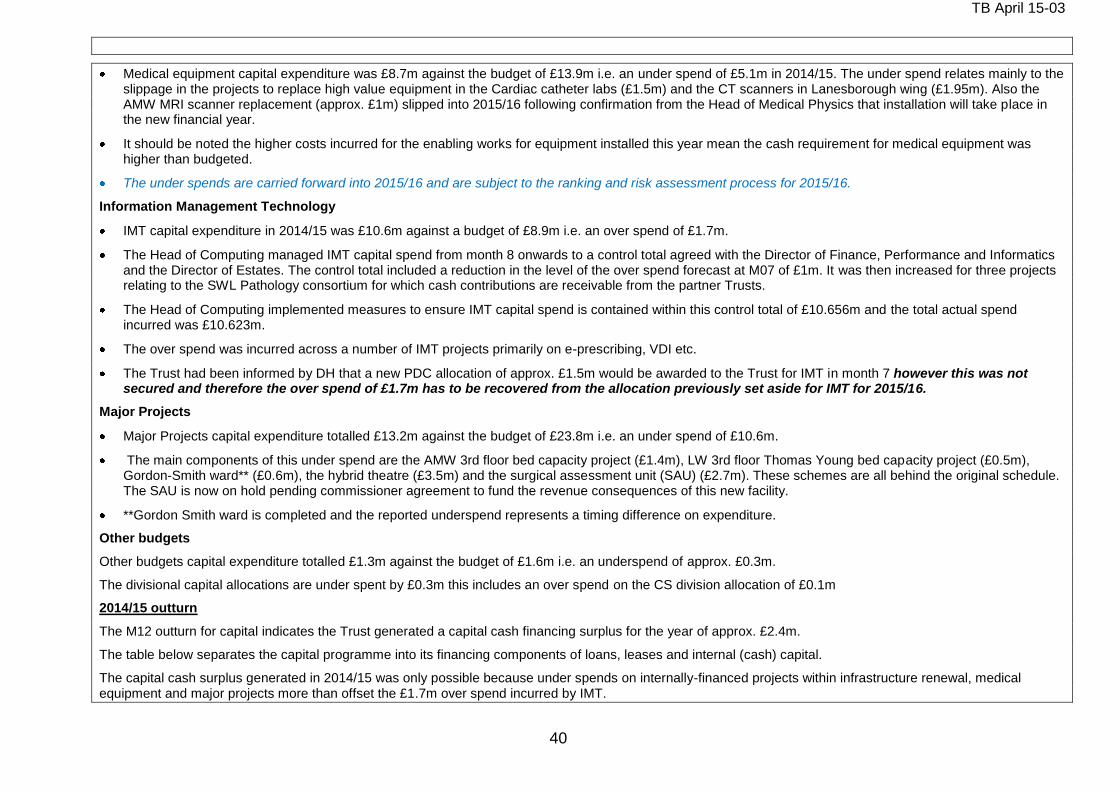
TB April 15-03
40
Medical equipment capital expenditure was £8.7m against the budget of £13.9m i.e. an under spend of £5.1m in 2014/15. The under spend relates mainly to the slippage in the projects to replace high value equipment in the Cardiac catheter labs (£1.5m) and the CT scanners in Lanesborough wing (£1.95m). Also the AMW MRI scanner replacement (approx. £1m) slipped into 2015/16 following confirmation from the Head of Medical Physics that installation will take place in the new financial year.
It should be noted the higher costs incurred for the enabling works for equipment installed this year mean the cash requirement for medical equipment was higher than budgeted.
The under spends are carried forward into 2015/16 and are subject to the ranking and risk assessment process for 2015/16.
Information Management Technology
IMT capital expenditure in 2014/15 was £10.6m against a budget of £8.9m i.e. an over spend of £1.7m.
The Head of Computing managed IMT capital spend from month 8 onwards to a control total agreed with the Director of Finance, Performance and Informatics and the Director of Estates. The control total included a reduction in the level of the over spend forecast at M07 of £1m. It was then increased for three projects relating to the SWL Pathology consortium for which cash contributions are receivable from the partner Trusts.
The Head of Computing implemented measures to ensure IMT capital spend is contained within this control total of £10.656m and the total actual spend incurred was £10.623m.
The over spend was incurred across a number of IMT projects primarily on e-prescribing, VDI etc.
The Trust had been informed by DH that a new PDC allocation of approx. £1.5m would be awarded to the Trust for IMT in month 7 however this was not secured and therefore the over spend of £1.7m has to be recovered from the allocation previously set aside for IMT for 2015/16.
Major Projects
Major Projects capital expenditure totalled £13.2m against the budget of £23.8m i.e. an under spend of £10.6m.
The main components of this under spend are the AMW 3rd floor bed capacity project (£1.4m), LW 3rd floor Thomas Young bed capacity project (£0.5m), Gordon-Smith ward** (£0.6m), the hybrid theatre (£3.5m) and the surgical assessment unit (SAU) (£2.7m). These schemes are all behind the original schedule. The SAU is now on hold pending commissioner agreement to fund the revenue consequences of this new facility.
**Gordon Smith ward is completed and the reported underspend represents a timing difference on expenditure.
Other budgets
Other budgets capital expenditure totalled £1.3m against the budget of £1.6m i.e. an underspend of approx. £0.3m.
The divisional capital allocations are under spent by £0.3m this includes an over spend on the CS division allocation of £0.1m
2014/15 outturn
The M12 outturn for capital indicates the Trust generated a capital cash financing surplus for the year of approx. £2.4m.
The table below separates the capital programme into its financing components of loans, leases and internal (cash) capital.
The capital cash surplus generated in 2014/15 was only possible because under spends on internally-financed projects within infrastructure renewal, medical equipment and major projects more than offset the £1.7m over spend incurred by IMT.
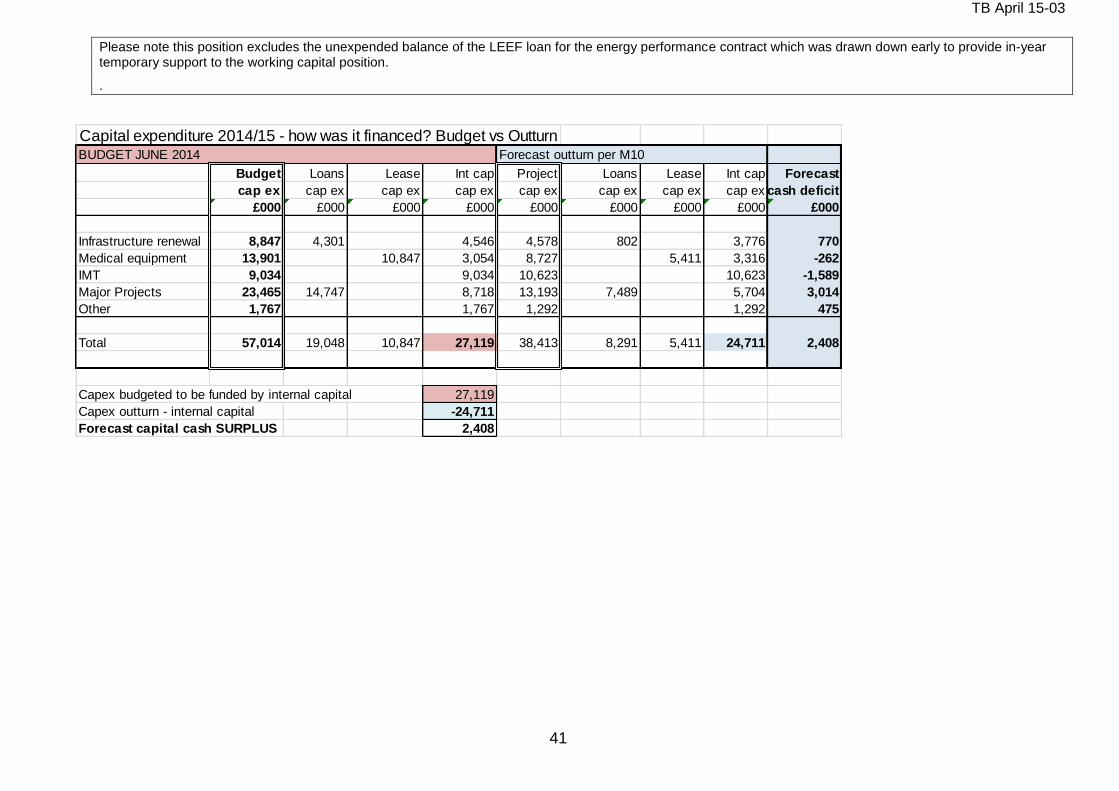
TB April 15-03
41
Please note this position excludes the unexpended balance of the LEEF loan for the energy performance contract which was drawn down early to provide in-year temporary support to the working capital position.
.
Capital expenditure 2014/15 - how was it financed? Budget vs OutturnBUDGET JUNE 2014 Forecast outturn per M10
Budget Loans Lease Int cap Project Loans Lease Int cap Forecast
cap ex cap ex cap ex cap ex cap ex cap ex cap ex cap ex cash deficit
£000 £000 £000 £000 £000 £000 £000 £000 £000
Infrastructure renewal 8,847 4,301 4,546 4,578 802 3,776 770
Medical equipment 13,901 10,847 3,054 8,727 5,411 3,316 -262
IMT 9,034 9,034 10,623 10,623 -1,589
Major Projects 23,465 14,747 8,718 13,193 7,489 5,704 3,014
Other 1,767 1,767 1,292 1,292 475
Total 57,014 19,048 10,847 27,119 38,413 8,291 5,411 24,711 2,408
Capex budgeted to be funded by internal capital 27,119
Capex outturn - internal capital -24,711
Forecast capital cash SURPLUS 2,408
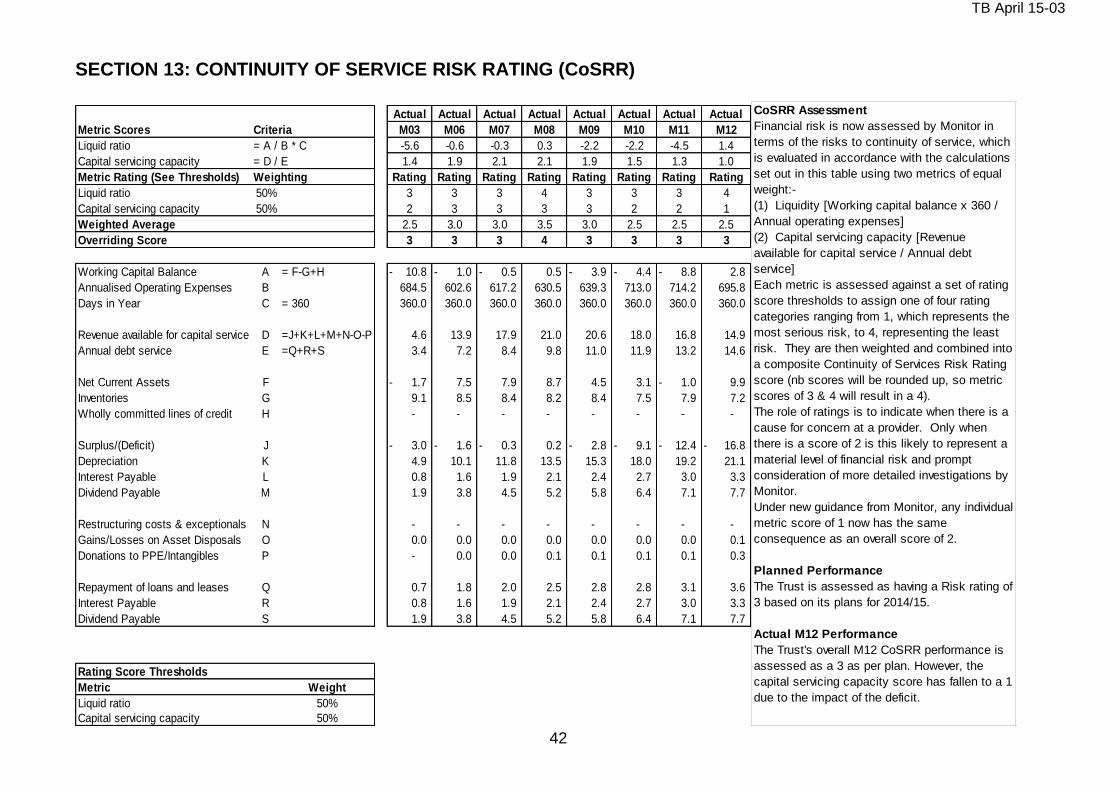
TB April 15-03
42
SECTION 13: CONTINUITY OF SERVICE RISK RATING (CoSRR)
Actual Actual Actual Actual Actual Actual Actual Actual
Metric Scores Criteria M03 M06 M07 M08 M09 M10 M11 M12
Liquid ratio = A / B * C -5.6 -0.6 -0.3 0.3 -2.2 -2.2 -4.5 1.4
Capital servicing capacity = D / E 1.4 1.9 2.1 2.1 1.9 1.5 1.3 1.0
Metric Rating (See Thresholds) Weighting Rating Rating Rating Rating Rating Rating Rating Rating
Liquid ratio 50% 3 3 3 4 3 3 3 4
Capital servicing capacity 50% 2 3 3 3 3 2 2 1
Weighted Average 2.5 3.0 3.0 3.5 3.0 2.5 2.5 2.5
Overriding Score 3 3 3 4 3 3 3 3
Working Capital Balance A = F-G+H 10.8- 1.0- 0.5- 0.5 3.9- 4.4- 8.8- 2.8
Annualised Operating Expenses B 684.5 602.6 617.2 630.5 639.3 713.0 714.2 695.8
Days in Year C = 360 360.0 360.0 360.0 360.0 360.0 360.0 360.0 360.0
Revenue available for capital service D =J+K+L+M+N-O-P 4.6 13.9 17.9 21.0 20.6 18.0 16.8 14.9
Annual debt service E =Q+R+S 3.4 7.2 8.4 9.8 11.0 11.9 13.2 14.6
Net Current Assets F 1.7- 7.5 7.9 8.7 4.5 3.1 1.0- 9.9
Inventories G 9.1 8.5 8.4 8.2 8.4 7.5 7.9 7.2
Wholly committed lines of credit H - - - - - - - -
Surplus/(Deficit) J 3.0- 1.6- 0.3- 0.2 2.8- 9.1- 12.4- 16.8-
Depreciation K 4.9 10.1 11.8 13.5 15.3 18.0 19.2 21.1
Interest Payable L 0.8 1.6 1.9 2.1 2.4 2.7 3.0 3.3
Dividend Payable M 1.9 3.8 4.5 5.2 5.8 6.4 7.1 7.7
Restructuring costs & exceptionals N - - - - - - - -
Gains/Losses on Asset Disposals O 0.0 0.0 0.0 0.0 0.0 0.0 0.0 0.1
Donations to PPE/Intangibles P - 0.0 0.0 0.1 0.1 0.1 0.1 0.3
Repayment of loans and leases Q 0.7 1.8 2.0 2.5 2.8 2.8 3.1 3.6
Interest Payable R 0.8 1.6 1.9 2.1 2.4 2.7 3.0 3.3
Dividend Payable S 1.9 3.8 4.5 5.2 5.8 6.4 7.1 7.7
Rating Score Thresholds
Metric Weight
Liquid ratio 50%
Capital servicing capacity 50%
CoSRR Assessment
Financial risk is now assessed by Monitor in
terms of the risks to continuity of service, which
is evaluated in accordance with the calculations
set out in this table using two metrics of equal
weight:-
(1) Liquidity [Working capital balance x 360 /
Annual operating expenses]
(2) Capital servicing capacity [Revenue
available for capital service / Annual debt
service]
Each metric is assessed against a set of rating
score thresholds to assign one of four rating
categories ranging from 1, which represents the
most serious risk, to 4, representing the least
risk. They are then weighted and combined into
a composite Continuity of Services Risk Rating
score (nb scores will be rounded up, so metric
scores of 3 & 4 will result in a 4).
The role of ratings is to indicate when there is a
cause for concern at a provider. Only when
there is a score of 2 is this likely to represent a
material level of financial risk and prompt
consideration of more detailed investigations by
Monitor.
Under new guidance from Monitor, any individual
metric score of 1 now has the same
consequence as an overall score of 2.
Planned Performance
The Trust is assessed as having a Risk rating of
3 based on its plans for 2014/15.
Actual M12 Performance
The Trust's overall M12 CoSRR performance is
assessed as a 3 as per plan. However, the
capital servicing capacity score has fallen to a 1
due to the impact of the deficit.

TB April 15-03
43
APPENDIX 1- AGED DEBT REPORT
Summary of Outstanding Invoices at 31 March 2015
NHS Invoices outstanding
NHS DEBT Category of debt (Invoiced only)
at 31/03/15
£000s
at 28/02/15
£000s
% change since
last report
at 31/03/14
£000s
% change
since year
end
at 31/03/15
£000s
at 28/02/15
£000s
at 31/03/15
£000s
at 28/02/15
£000s
at 31/03/15
£000s
at 28/02/15
£000s
at 31/03/15
£000s
at 28/02/15
£000s
at 31/03/15
£000s
at 28/02/15
£000s
(1) NHS England - Legacy PCT balances 0% 5 5 0% 8 0 0 0 0 0 0 (2) (2) 7 7
(2) Clinical Commissioning Groups 0% 2,220 4,571 (51%) (3,887) (157%) (1,680) 1,116 2,185 1,616 1,491 2,069 (13) (766) 237 536
(3) NHS Wandsworth CCG 0% 3,876 3,501 11% 3,012 2,018 2,327 1,470 377 106 85 282 712 0 0
(4) NHS Sutton CCG 0% (15) 197 (108%) (449) (44) 233 27 8 0 0 0 (46) 2 2
(5) NHS Merton CCG 0% (367) 1,189 (131%) 1,105 (367) 1,132 0 0 0 (18) 0 75 0 0
(6) NHS Croydon CCG 0% 425 1,007 (58%) (64) 424 785 0 0 0 11 0 210 1 1
(7) NHS Kingston CCG 0% 119 163 (27%) (110) 115 159 0 0 0 0 0 0 4 4
(8) NHS Lambeth CCG 5% (127) 92 (238%) (25) (127) 92 0 0 0 0 0 0 0 0
(9) NHS England 15% 13,645 9,537 43% 16,306 (16%) 5,031 3,686 6,831 1,594 834 4,237 936 17 13 3
(10) Non English NHS NCA Debt 0% 687 636 8% 497 38% 75 73 99 50 23 39 79 63 411 411
(11) English CCG NCA Debt 5% 3,238 3,304 (2%) 2,390 1,053 867 785 609 508 575 513 926 379 327
Clinical Commissioning Groups subtotal 61% 23,706 24,202 (2%) 18,783 26% 0 6,498 10,470 11,397 4,254 2,962 6,998 1,795 1,189 1,054 1,291
(12) Other NHS Organisations 1% 1,698 4,085 (58%) 1,040 63% 121 3,028 731 245 65 142 124 201 657 469
(12.1) Health Education England 0% 1,149 88 1206% 66 1641% 1,102 77 47 11 0 0 0 0 0 0
(13) NHS Trusts 7% 7,890 8,349 (5%) 6,183 28% 2,240 1,505 2,068 2,076 921 1,735 1,056 1,973 1,605 1,060
Total NHS Invoices outstanding 69% 34,443 36,724 (6%) 26,072 32% 0 9,961 15,080 14,243 6,586 3,948 8,875 2,975 3,363 3,316 2,820
Uninvoiced NHS debt
Provision for impairment of NHS invoiced debt (0) (0) Actual 30/11/13 29% 41% 41% 18% 11% 24% 9% 9% 10% 8%
NHS Debt - accruals 613 (5,228) Target - 31/03/14 60% 34% 5% 1% 0%
CSW integration adjustment 5,287 5,287
NHS Debt - Challenges 0 0
2013/14 Partially Completed Spells 3,713 3,713
Total NHS Debt 44,056 40,497
Non-NHS Invoices outstanding
Non-NHS Debt Category of debt (Invoiced only)
at 31/03/15
£000s
at 28/02/15
£000s
% change since
last report
at 31/03/14
£000s
% change
since year
end
at 31/03/15
£000s
at 28/02/15
£000s
at 31/03/15
£000s
at 28/02/15
£000s
at 31/03/15
£000s
at 28/02/15
£000s
at 31/03/15
£000s
at 28/02/15
£000s
at 31/03/15
£000s
at 28/02/15
£000s
(14) General Debtors (Clinical/Technical Services to
Non NHS orgs; etc)5% 3,845 2,760
39%3,396
13% (1,207)1,977 719 581 615 438 404 160 294 689 728
(15) Private Patients 3% 1,257 1,267 (1%) 1,465 (14%) (182) 145 255 286 188 96 76 85 114 645 634
(15.1) Bupa Insurance Services Ltd t/a Bupa 3% 253 198 28% 0 #DIV/0! 140 86 25 35 15 20 73 57 0 0
(15.2) AXA PPP Healthcare Ltd 3% 203 213 (5%) 0 #DIV/0! 76 84 95 82 6 18 26 29 0 0
(16) Overseas Visitors NHS Chargeable 5% 2,423 2,585 (6%) 2,179 11% (1,396) 122 102 123 177 252 218 163 265 1,763 1,823
(17) Salary Overpayments 1% 520 490 6% 528 (2%) (120) 63 6 7 24 55 73 50 33 345 354
(18) Medical School 1% 1,303 1,744 (25%) 353 269% (28) 365 413 326 743 588 526 16 34 8 28
(19) St George's Hospital Charity 0% 365 434 (16%) 313 17% (10) 154 311 105 3 5 14 72 79 29 27
(20) Compensation Recovery Unit 16% 12,013 11,605 4% 9,733 23% (1,847) 542 0 740 1,217 1,092 900 1,624 1,942 8,015 7,546
(21) UK Border Agency 0% 177 178 (1%) 110 61% 0 (1) (1) 50 45 25 38 28 21 75 75
(22) Local Authority 0% 4,219 3,644 16% 0 #DIV/0! 0 911 855 1,454 1,382 1,169 891 542 461 143 55
Total Non-NHS Invoices outstanding 31% 26,578 25,118 6% 18,077 12% (4,790) 4,495 2,830 3,793 4,511 3,741 3,178 2,839 3,329 11,712 11,270
Uninvoiced non-NHS Debt:
Provision for impairment of Non-NHS invoiced debt (4,790) (3,991) Actual - 30/11/13 (exc RTA) 21% 11% 11% 18% 10% 13% 4% 13% 24% 45%
Non-NHS Debt -accruals 1,539 8,978 Target - 31/03/14 (exc RTA) 44% 22% 2% 7% 25%
CSW integration adjustment 896 896
VAT and Prepayments 3,009 2,968 1. Uninvoiced debt is debt which had not been invoiced the debtor at the month-end. Uninvoiced debt excludes 'Provision for impairment of debts.'
Total Non NHS Debt 27,231 33,969 2. Gross debt is total debt with the provision for impairment of debt added back.
3. Non-NHS targets exclude RTA debt which is raised and collected by the Compensation Recovery Unit (CRU) on the Trust's behalf.
Grand Total Debt 71,288 74,466
3 - 6 months old 6 - 12 months old Over 12 months oldUp to 30 Days
Prior year positionBad Debt
Provision
available
Over 12 months old3 - 6 months old 6 - 12 months oldUp to 30 Days 1 - 3 months old
1 - 3 months old% of
unpaid
invoices
% of
unpaid
invoices
Total Outstanding Debt
Bad Debt
Provision
available
Prior year positionTotal Outstanding Debt

TB April 15-03
44

REPORT TO THE TRUST BOARD April 2015
Paper Title: Workforce report
Sponsoring Director: Wendy Brewer, Director of Workforce and Organisational Development
Author: Wendy Brewer, Director of Workforce and Organisational Development Rebecca Hurrell, Head of Workforce Information Jacqueline McCullough, Deputy Director of HR
Purpose:
To provide a report to the board on performance against key performance indicators
Action required by the board:
For information
Document previously considered by:
Workforce and education committee
Executive summary Key points in the report and recommendation to the board
1. Key messages The report contains
Detail of workforce performance against key workforce performance indicators for March 2015. The report also includes available benchmark information. Although there has been marginal movement on most of the indicators, the report shows that the trust continues to be challenged by high turnover.
Papers setting out the plans to reduce turnover and to increase the transfer from agency to bank usage.
Key risks identified: Key workforce risks include:
Failure to recruit and retain sufficient staff in relation to annual turnover rates and to safely support future increases in capacity’
Failure to reduce the unacceptable levels of bullying and harassment reported by staff in the annual staff survey.
Possible reductions in the overall number of junior doctors available with a possible impact on particular speciality areas.
Failure to maintain required levels of attendance at core mandatory and statutory training (MAST)
Related Corporate Objective: Reference to corporate objective that this paper refers to.
To develop a highly skilled and engaged workforce championing our values that is able to deliver the trust’s vision.
Related CQC Standard: Reference to CQC standard that this paper refers to.
Are services well led?

Commentary on performance in key workforce indicators Introduction Although significant recruitment activity was maintained in March, with the appointment of 136 new starters, the turnover rate remains stable but high. The actual vacancy position is being clarified as the trust determines which service developments will proceed and establishments are adjusted to reflect actual budgets. Trajectories for the reduction of turnover and transition from agency to bank usage are attached. Vacancy rate In February the trust appointed 136 new members of staff (leading to an overall increase of 31 WTE in post) but as planned establishment for the Nelson Centre and other areas has been built into the workforce plan (with those members of staff not post in March), the vacancy rate has risen by 0.1%. The work on clarifying the financial baselines and establishments continues and, while the overall establishment figures may be broadly accurate, the detail down to ward level is subject to further review. Turnover and stability The pattern of increased turnover and reduced stability over the past year reflects greater demand for workforce in the market with staff being more confident of obtaining work elsewhere. It also reflects a gradual increase in the number of staff taking retirement. This latter point is particularly relevant in divisions where there is an older staffing population, in particular community services and in Estates and Facilities. In March, there has been a small increase again in both the voluntary and overall turnover. There is a separate paper setting out plans to reduce turnover. The benchmarking information is included at page 10 of the report compares the trust to London teaching hospitals and is based on the most recent data available (January). In this data the trust appears to be less of an outlier on overall turnover. The trust is participating in a HESL funded study being led by St George’s University of London Joint Faculty to understand the causes of turnover and to learn from good practice elsewhere in South London. Staff career development Exit survey data tells us that the trust is losing good members of staff because they find promotion opportunities elsewhere and, therefore, one of the responses to the increasing turnover rates has been to ensure that we are focusing on retaining, developing and promoting our own staff. The data on page 8 shows that of members of staff that have been in post for more than a year 5.4% of them have been promoted into their current post, an increase on last month. With the increased focus, there is an increasing trend of internal promotions as a percentage of overall appointments, with figures of 16.5% in November, 32% in December, 35% in January, 19% in February and 23% in March. Sickness absence Unfortunately, after last’s month’s notable improvement, sickness rate has increased by .2% reflecting high levels of coughs and colds in the staffing population
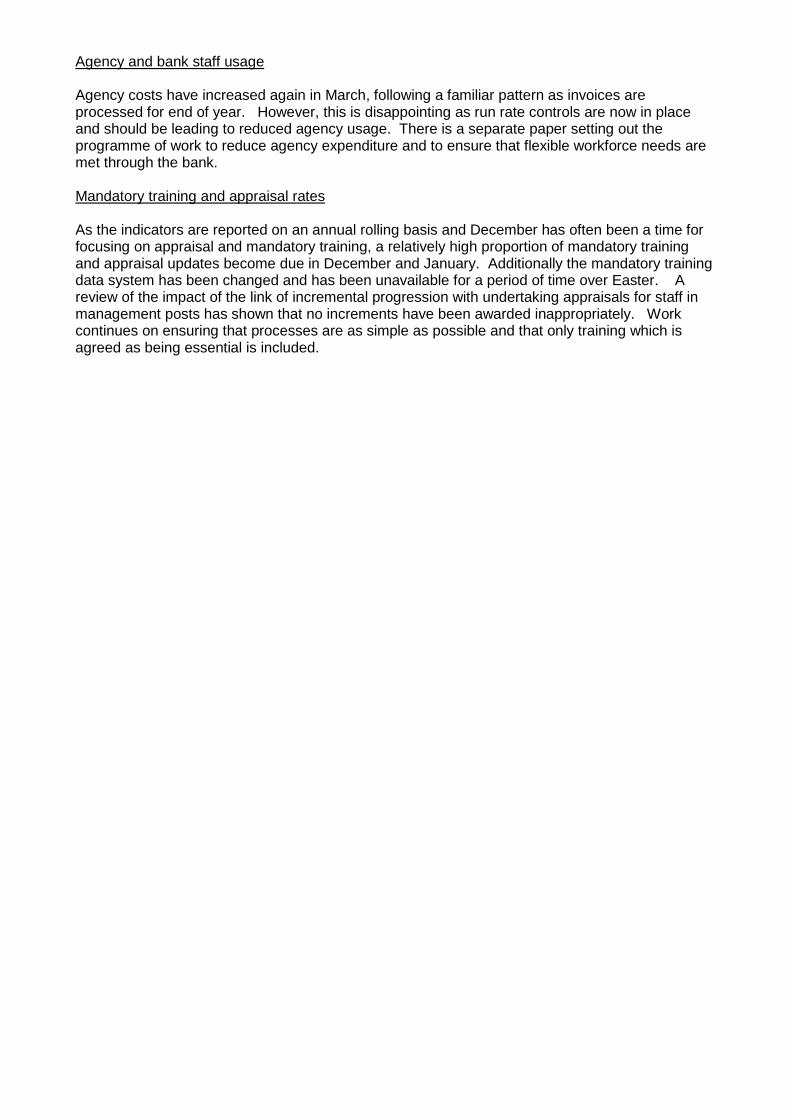
Agency and bank staff usage Agency costs have increased again in March, following a familiar pattern as invoices are processed for end of year. However, this is disappointing as run rate controls are now in place and should be leading to reduced agency usage. There is a separate paper setting out the programme of work to reduce agency expenditure and to ensure that flexible workforce needs are met through the bank. Mandatory training and appraisal rates As the indicators are reported on an annual rolling basis and December has often been a time for focusing on appraisal and mandatory training, a relatively high proportion of mandatory training and appraisal updates become due in December and January. Additionally the mandatory training data system has been changed and has been unavailable for a period of time over Easter. A review of the impact of the link of incremental progression with undertaking appraisals for staff in management posts has shown that no increments have been awarded inappropriately. Work continues on ensuring that processes are as simple as possible and that only training which is agreed as being essential is included.

TB April 15-04b
Document Title: Update on Plans to Reduce Turnover
Committee or Meeting: Trust Board
Report Author(s): Jacqueline McCullough, Deputy Director of HR
Contact Details: [email protected]
Date: 23rd April 2015
1. Introduction 1.1 The Workforce Board reports in 2014 showed that over a period of 12 months our turnover
rate had been increasing gradually, and by October 2014 this had risen to 16.5% compared to 13.2 % 12 months earlier. The trends in turnover rates can be seen in table 1 below. The March 2015 Workforce Board report shows a current rate of 17.23 % for all staff and 18.08% for registered nursing and midwifery staff against a target of 13%1. It was identified that, in combination with difficulties in recruiting additional clinically qualified staff, this increase in turnover would have an effect on the Trust’s ability to meet current and future activity demands.
Table 1: Turnover Trends 2010/11 – 2014/15
1.2 A Nursing Workforce Programme board led by Jennie Hall (Chief Nurse) was established in
2014 to address a range of workforce issues including the increase in recruitment requirements and turnover. The retention workstream focussed attention on the support given to nurses when they join the Trust and are at the early stages of their career, and how we can retain staff through offering development and promotion opportunities. Some areas developed specific action plans to address particularly acute problems (Theatres and Older Health Services). This paper summarises the progress to date in implementing these actions.
1 Total Turnover
6%
8%
10%
12%
14%
16%
18%
20%
Mar Apr May Jun Jul Aug Sep Oct Nov Dec Jan Feb
2010/11
2011/12
2012/13
2013/14
2014/15
TB April 15-04b
2. Action Plan to Reduce Turnover 2.1 The Retention Workstream of the Nursing Workforce Programme was chaired by Alison
Hughes (Divisional Director of Nursing and Governance), and the group established a number of different issues to address in order to reduce turnover:
Increase the numbers of mentors available to support new staff: The group set project milestones for increasing the number of preceptors so that all wards will have 50% of qualified staff as registered preceptors by 30/09/2015 and 75% of qualified staff as registered preceptors by 31/12/2015. A formal ward / department induction process for all new starters to the organisation to be standardised across the trust. There is also a proposal that the induction programme is a 2-day programme every fortnight: A planning group is meeting to discuss this and a plan will be discussed at the nursing board in May 2015. Agree a career development structure for band 5 nurses (to link to initial induction process above) over two years: This has been developed and the outcome will be communicated Trust-wide. We are now recording the number of internal promotions each month and at present around 5.4% of our staff are promoted. Agree a process for Trust staff who want to move between specialities without having to apply through NHS jobs: This process has been developed and is in operation
3. Specific Actions in Theatres 3.1 In October 2014 the Executive Management Team approved an action plan from theatres to
improve their recruitment and retention rates. The action plan included:
Payment of a Recruitment and Retention Premium to bands 5 & 6
Payment of an enhanced bank rate to bands 5,6, & 7
The ATP (band 2) consultation aimed at making the role more rewarding.
Rotation of staff through different theatres
The development of the anaesthetic nurse role
3.2 Progress against the plan (April 2015) is as follows:
Payment of a Recruitment and Retention Premium to bands 5 & 6
The first payment of the £500 retention premium will be paid in November 2015. The first payment of the £1000 Recruitment premium will be in September 2015.
Payment of an enhanced bank rate to bands 5,6, & 7
TB April 15-04b
This appears to have had a significant effect as the agency spend dropped to zero in March 2015. The overall trend in agency spend since October 2014 has been downward.
The ATP (band 2) consultation aimed at making the role more rewarding.
The consultation has now been completed and staff are working to their new job descriptions. However, the consultation finished in March 2015 and so it is too early to evaluate the impact.
Rotation of staff through different theatres
This is taking place on ad hoc basis but it is too early to evaluate the impact.
The development of the anaesthetic nurse role
Discussions are continuing to develop and introduce this role.
3.3 An analysis of the workforce statistics show that the vacancy rate started to increase in June
2014 from 7.74% in May 2014 to 12.22% and has continued to increase month on month. It is now at 21.59% (March 2015). That would suggest that the recruitment premium has not been particularly effective. However, it is important to note that the vacancy figures should be read with some caution as a significant number of new posts have been added to the Theatres establishment which will affect the vacancy rate. Additionally, in the current financial situation, a number of vacancies are being held and recruitment has been frozen for all but essential posts.
3.4 An analysis of the workforce statistics show that the turnover rate increased from 11.38% in
April 2014 to a peak in October 2014 of 15.28%; it has since declined to 12.80% in March 2015. At this stage it is not known if the Retention premium is the main reason for this and the turnover rate will continue to be tracked throughout the calendar year.
4. Community Services Division 4.1 The Community Services Division has the highest turnover rate in the Trust at 19-20% in
recent months. This has reduced slightly from 19% to 18% in the 6 months to March 2015. The greatest reductions have occurred in Adults and Diagnostics where turnover has reduced from 17% to 13% and Community People with Learning Difficulties 17% to 12.7% in Mar 15. Turnover at OHS has risen during this same period from 23% to 31%, with a vacancy rate of 36%. A number of retention strategies have been introduced:
Staff to attend training courses identified in PDPs
Regular recruitment and retention meetings at OHS
Regular divisional recruitment and retention strategy meetings
Develop more innovative recruitment solutions e.g. using social media
Implementation of a recruitment and retention strategy
Advertise OHS at recruitment fairs around England
Develop nursing rotational opportunities into prison from CSD & SLAM

TB April 15-04b
Implement effective use of eRostering
Review and implement local induction process
Clinical supervision offered to staff as per PDP
Exit interview reports to managers
5. Quality of Line Management 5.1 Another factor identified as contributing to staff leaving is their experience of how they are
managed by their line manager. The Leadership Development Programme will include specific modules on improving management styles to ensure they are in line with the Trust’s values. We have increased the support available to the Divisions to coach managers on handling staffing issues to create an improved culture of working between managers and staff. Our Unconscious Bias Training sessions for middle and senior managers in 2014 was part of our action plan to address concerns about harassment, bullying and discrimination felt by managers; this will be rolled-out to band 7 line managers in 2015. All new line managers are invited to a session with Workforce Directorate representatives to highlight how they can access support when dealing with staffing issues.
6. Predicting a Reduction in Turnover
6.1 It is difficult to predict with any accuracy how each of the measures in place will have a
direct impact on turnover or how long it will take to be able to measure that impact. The increase in turnover has occurred over at least a 12-month period, and it is likely that it will take at least as long for a decrease to occur. The table below assumes that the average staff in post number will stay the same for the next 12 months, and if this is the case we would need to see a reduction in leavers of approximately 142 staff over 12 months or about 12 fewer leavers each month. This would still leave us short of our target of 13% but if these measures are effective, we would hope to achieve that reduction over a further 12 months.
Table 2: Projected Reduction in Turnover 2015-16
Month Current
Average Staff in Post WTE
Annual Leavers
WTE
Gross Turnover
Rate %
Mar-15 7097.18 1222.57 17.23%
Apr-15 1222.57 17.23%
May-15 1210.74 17.06%
Jun-15 1198.91 16.89%
Jul-15 1187.08 16.73%
Aug-15 1169.34 16.48%
Sep-15 1151.60 16.23%
Oct-15 1139.77 16.06%
Nov-15 1127.94 15.89%
Dec-15 1116.11 15.73%
Jan-16 1104.28 15.56%
Feb-16 1092.45 15.39%
Mar-16 1080.63 15.23%

TB April 15-04b
7. Conclusion 7.1 The turnover rate for the Trust as a whole and nursing and midwifery in particular remains
high. This is likely to remain high over the next 12 months, as nursing staff work in a climate currently where they have the option to work elsewhere in the NHS with relative ease or can choose to work through an agency for often higher rates of pay. The Trust is facing a challenging time and it is important that we communicate regularly with staff so they remain confident that their future with the Trust is secure. There are some factors outside our control that will affect employees’ decision to leave but the work to reduce turnover will continue to be monitored. The action plans described above are at different stages of development and implementation, therefore, it is likely to be some months before the changes have an impact.
TB April 15-04c
1
Document Title:
Achieving a Switch from Agency to Bank Usage
Committee or Meeting:
Trust Board April 2015
Report Author(s):
Jacqueline McCullough
Date:
22nd April 2015
1. INTRODUCTION 1.1 Over the last 18 months the demand for temporary staff has increased by around 30%. It is
increasingly difficult for the Staff Bank to fill bank shifts as demand outstrips supply with the result that we are more reliant on agency staff.
1.2 The Trust has opened additional clinical areas which has increased the reliance on temporary
staff until permanent staff take up post. A number of areas, and in particular specialist areas, are heavily reliant on agency staff to fill shifts and senior nurse managers have requested that we increase our bank rates so that working through the staff bank is more attractive to our staff. A review of the rates was undertaken in November 2014 at which point the Executive Management Team decided not to increase the bank rates. One of the main factors influencing this decision was a lack of confidence that the departments would be able to achieve a switch from agency to bank if the rates were increased thereby creating a cost pressure in the Divisions.
1.3 At the Workforce and Education Committee in March 2015, the committee acknowledged that
our current target of having spending no more that 3.5% of our staffing budget on agency staff was, at this stage, unrealistic. It was agreed that a plan should be developed to increase the likelihood that the switch could be achieved, and then a more realistic target for agency usage would be set.
1.4 This paper sets out some work underway to improve recruitment to the Staff Bank and further
work that will be required to help achieve the switch from agency to bank.
2. CURRENT BANK AND AGENCY USAGE 2.1 In March 2015, the Staff Bank received 16,0861 requests for temporary staff (excluding
medical staff, administrative and clerical staff and Allied Health Professionals) compared to 12,000 in March 2014. The preference is to use bank instead of agency staff for temporary staffing cover but the demand for temporary staffing is outstripping the supply by both our bank staff and agencies, particularly for specialist areas.
1 These requests include all requests made through the BankStaff system and include 1,266 non-nursing and
midwifery requests in Estates and Facilities and Corporate Directorates. All these requests were filled by bank staff.
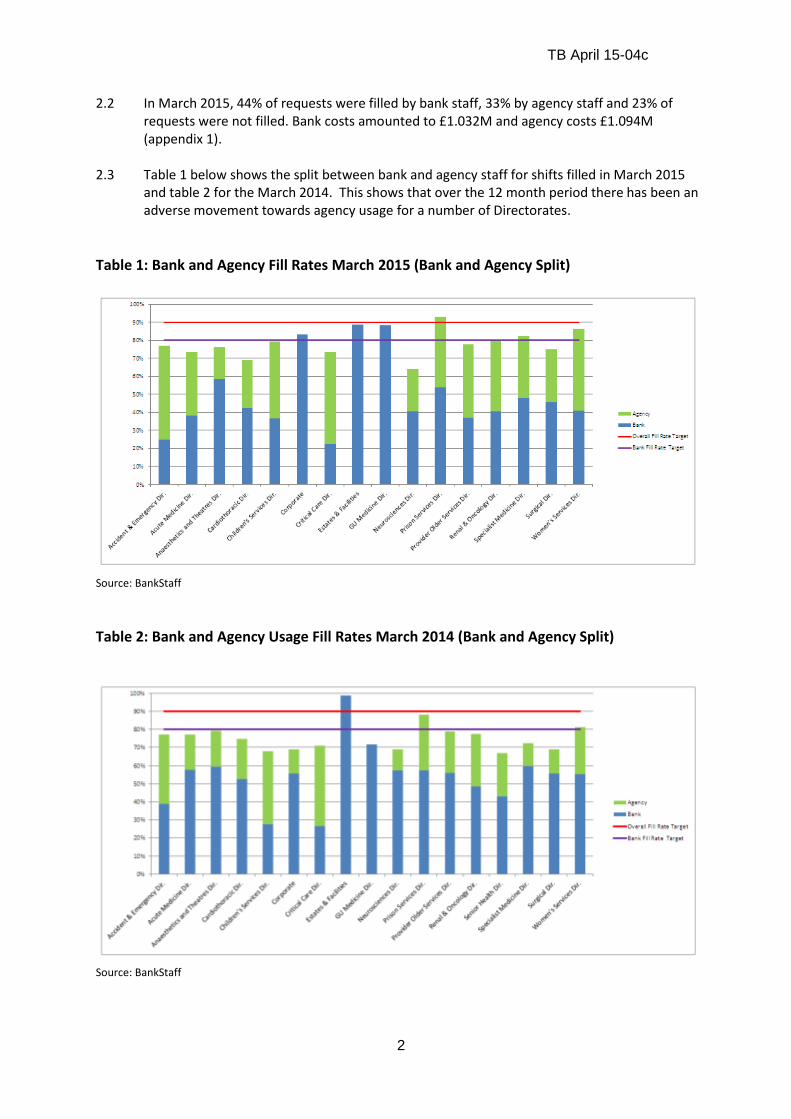
TB April 15-04c
2
2.2 In March 2015, 44% of requests were filled by bank staff, 33% by agency staff and 23% of requests were not filled. Bank costs amounted to £1.032M and agency costs £1.094M (appendix 1).
2.3 Table 1 below shows the split between bank and agency staff for shifts filled in March 2015
and table 2 for the March 2014. This shows that over the 12 month period there has been an adverse movement towards agency usage for a number of Directorates.
Table 1: Bank and Agency Fill Rates March 2015 (Bank and Agency Split)
Source: BankStaff
Table 2: Bank and Agency Usage Fill Rates March 2014 (Bank and Agency Split)
Source: BankStaff

TB April 15-04c
3
3. BANK AND AGENCY SPEND 3.1 As stated above, we have a target of not spending more than 3.5% of our pay bill on agency
staff. Table 3 below shows that we have greatly exceeded that target for each month over the last 12 months, and in February 2015 it accounted for 8.32% of total pay spend.
Table 3: Agency Spend as a Percentage of Pay Bill
Source: BankStaff
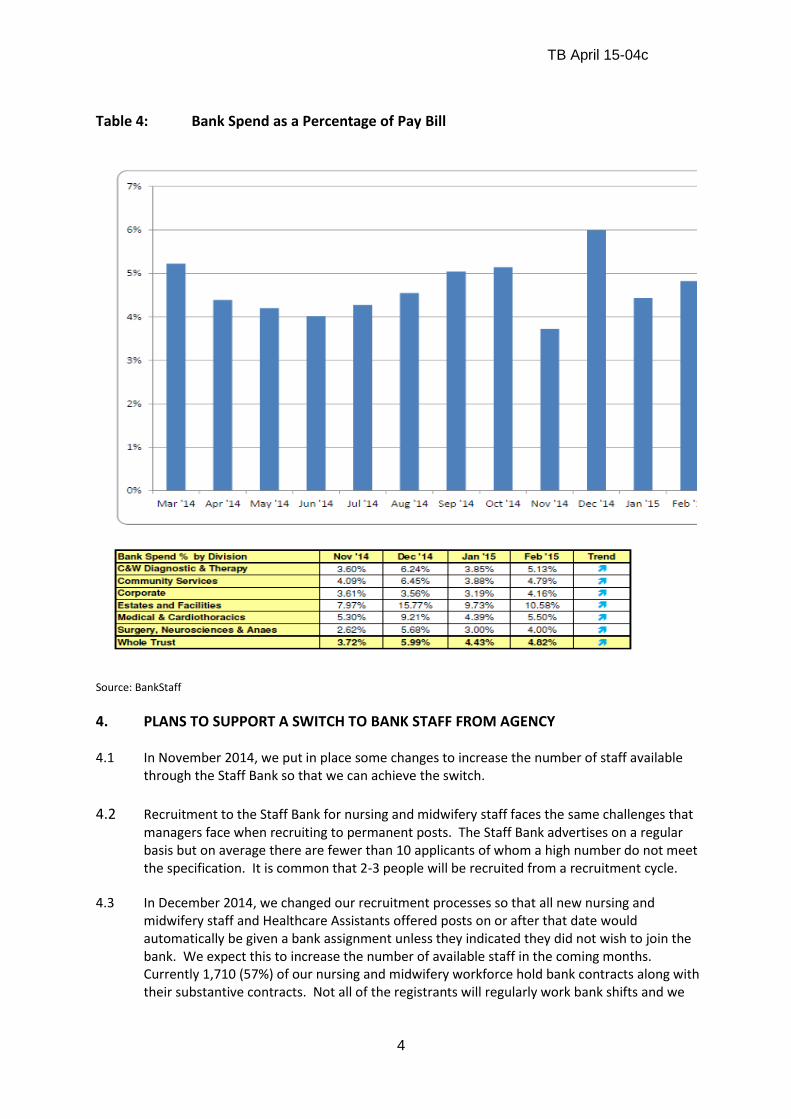
TB April 15-04c
4
Table 4: Bank Spend as a Percentage of Pay Bill
Source: BankStaff
4. PLANS TO SUPPORT A SWITCH TO BANK STAFF FROM AGENCY 4.1 In November 2014, we put in place some changes to increase the number of staff available
through the Staff Bank so that we can achieve the switch.
4.2 Recruitment to the Staff Bank for nursing and midwifery staff faces the same challenges that
managers face when recruiting to permanent posts. The Staff Bank advertises on a regular basis but on average there are fewer than 10 applicants of whom a high number do not meet the specification. It is common that 2-3 people will be recruited from a recruitment cycle.
4.3 In December 2014, we changed our recruitment processes so that all new nursing and
midwifery staff and Healthcare Assistants offered posts on or after that date would automatically be given a bank assignment unless they indicated they did not wish to join the bank. We expect this to increase the number of available staff in the coming months. Currently 1,710 (57%) of our nursing and midwifery workforce hold bank contracts along with their substantive contracts. Not all of the registrants will regularly work bank shifts and we

TB April 15-04c
5
plan to contact all registrants on a regular basis to remind them of the benefits of working through the bank.
4.4 Managers had concerns about delays that occurred when employees leave the Trust but wish
to retain their bank contract after leaving. We have changed the process so that the delays should be minimised or will no longer occur.
4.5 In November 2014, a decision was made not to increase the bank rates for the reasons set out
above. Some of the specialist areas have requested a further evaluation of this, and at present the finance department is preparing a financial analysis of the potential impact of an increase. We have obtained some benchmarking information from other Trusts in London and this again shows that our rates are broadly comparable to those paid by other Trusts for non-specialist areas although a neighbouring Trust, Kingston Hospital, has started paying higher rates.
4.6 It has been reported by some departments (adult Critical Care and Emergency Department)
that our staff are electing not to work on our bank because of the rate of pay but are working agency shifts in units at neighbouring Trusts. We will work with neighbouring Trusts to establish collaborative ways of working that ensures we can all fill our temporary staffing needs through the supply of bank rather than agency staff.
5. ADMINISTRATIVE AND CLERICAL, MEDICAL LOCUMS BANK 5.1 In August 2014 we set up a Staff Bank for Administrative and Clerical Staff with the aim of
supplying 40% of our temporary staffing needs through the Staff Bank by March 2015 and 60%
by July 2015. The bank has achieved the March 2015 target, and it is estimated that we are
realising savings of around £50,000 per month by not having to pay VAT and agency fees when
we substitute bank staff for agency staff.
5.2 Our Medical Locums bank was established in 2013 to centralise all locum bookings. This has
been very successful and the number of doctors registered with the bank is growing, and
recruitment of bank doctors forms a central part of our temporary staffing recruitment plan
for 2015-16.
5.3 We have reviewed historical rates of pay for Allied Health Professional staff (AHPs) to bring
them into line with Agenda for Change rates of pay with effect from 1st May 2015, and we are
working with managers to increase the number of AHPs registered with the bank.
6. CONCLUSIONS
6.1 The current supply of nursing staff for some areas is very difficult and this position is unlikely
to change for some time. The increase in clinical activity in the Trust, often in highly specialist
areas that are already difficult to recruit to, means that we will continue to be reliant on bank
and agency staff to cover existing and new vacancies. We have already put in place some
measures to increase the number of staff working on the bank, and if the current bank rates
for specialist staff are increased this will help to attract more staff to work on the bank and
retain current registrants. The pattern of agency usage would suggest that usage is likely to

TB April 15-04c
6
remain high for some months to come. The Workforce and Education Committee will review
the information at a future meeting to decide a realistic target for agency usage.
6.2 The Administrative and Clerical Bank has been a success to date, and we are confident that
the target of supplying 60% of our temporary staffing needs through the Staff Bank is
achievable and will contribute to further reductions in spending.
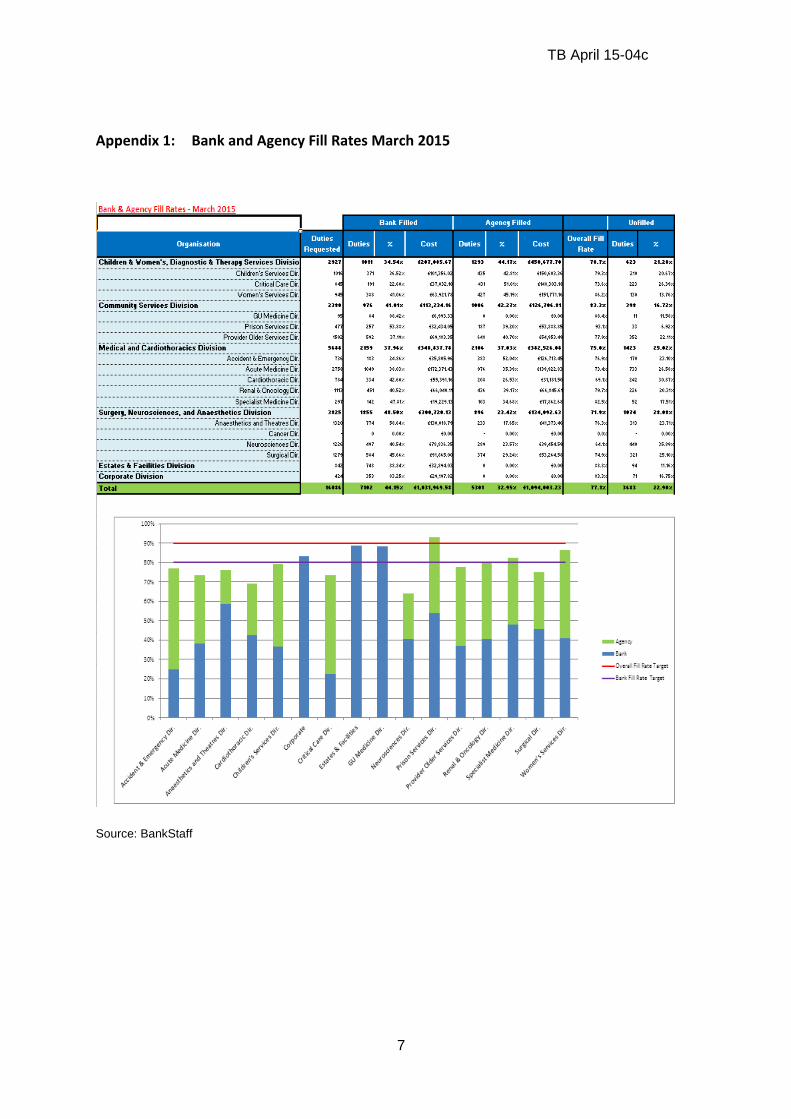
TB April 15-04c
7
Appendix 1: Bank and Agency Fill Rates March 2015
Source: BankStaff
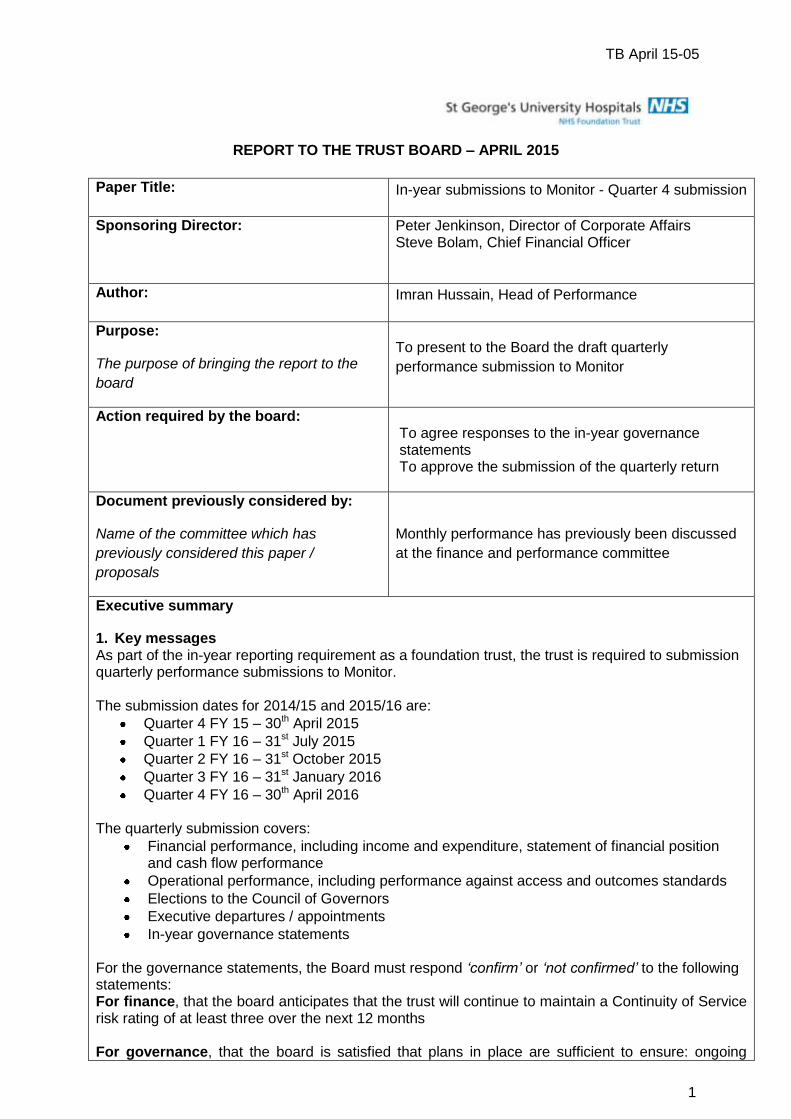
TB April 15-05
1
REPORT TO THE TRUST BOARD – APRIL 2015
Paper Title: In-year submissions to Monitor - Quarter 4 submission
Sponsoring Director: Peter Jenkinson, Director of Corporate Affairs Steve Bolam, Chief Financial Officer
Author: Imran Hussain, Head of Performance
Purpose:
The purpose of bringing the report to the
board
To present to the Board the draft quarterly
performance submission to Monitor
Action required by the board:
To agree responses to the in-year governance statements To approve the submission of the quarterly return
Document previously considered by:
Name of the committee which has
previously considered this paper /
proposals
Monthly performance has previously been discussed
at the finance and performance committee
Executive summary
1. Key messages As part of the in-year reporting requirement as a foundation trust, the trust is required to submission quarterly performance submissions to Monitor. The submission dates for 2014/15 and 2015/16 are:
Quarter 4 FY 15 – 30th April 2015
Quarter 1 FY 16 – 31st July 2015
Quarter 2 FY 16 – 31st October 2015
Quarter 3 FY 16 – 31st January 2016
Quarter 4 FY 16 – 30th April 2016
The quarterly submission covers:
Financial performance, including income and expenditure, statement of financial position and cash flow performance
Operational performance, including performance against access and outcomes standards
Elections to the Council of Governors
Executive departures / appointments
In-year governance statements For the governance statements, the Board must respond ‘confirm’ or ‘not confirmed’ to the following statements: For finance, that the board anticipates that the trust will continue to maintain a Continuity of Service risk rating of at least three over the next 12 months For governance, that the board is satisfied that plans in place are sufficient to ensure: ongoing

TB April 15-05
2
compliance with all existing targets (after the application of thresholds) as set out in Appendix A of the Risk Assessment Framework (included in the ‘Targets and Indicators’ worksheet on the attached template); and a commitment to comply with all known targets going forward. Otherwise, that the Board confirms that there are no matters arising in the quarter requiring an exception report to Monitor (examples as per the risk assessment Framework, copied as an appendix to this report) which have not already been reported. In the case of the board not being able to confirm any of these statements, the Board must submit an explanation and a summary of actions being taken to address any issues identified. The attached template has been completed to include quarterly performance information. Quarterly financial performance information will be added to the template before the board meeting. A completed template will be available at the meeting; the board should therefore note the financial information for end of quarter 4 in the month 12 financial performance report. Recommendation The board is asked to:
consider the performance information available in the monthly performance reports and the attached template;
agree responses to the governance statements and actions where the board agree a response of ‘not confirmed’ for any of the statements;
approve the submission of the completed template.
Key risks identified:
Are there any risks identified in the paper (impact on achieving corporate objectives) – e.g. quality,
financial performance, compliance with legislation or regulatory requirements?
Risks exist on the corporate risk register relating to maintaining compliance with performance
standards.
The Board should consider the current risks as stated, as part of this review, and identify any new
risks in agreeing the governance statements.
Related Corporate Objective:
Reference to corporate objective that this
paper refers to.
All corporate objectives
Related CQC Standard:
Reference to CQC standard that this paper
refers to.
Well-led domain
Effectiveness domain
Equality Impact Assessment (EIA): Has an EIA been carried out? Yes
If yes, please provide a summary of the key findings
No specific groups of patients or community will be affected by the initiatives detailed in the report.
Where there may be an impact on patients then consultation will be managed as part of that specific
programme.
If no, please explain your reasons for not undertaking an EIA.
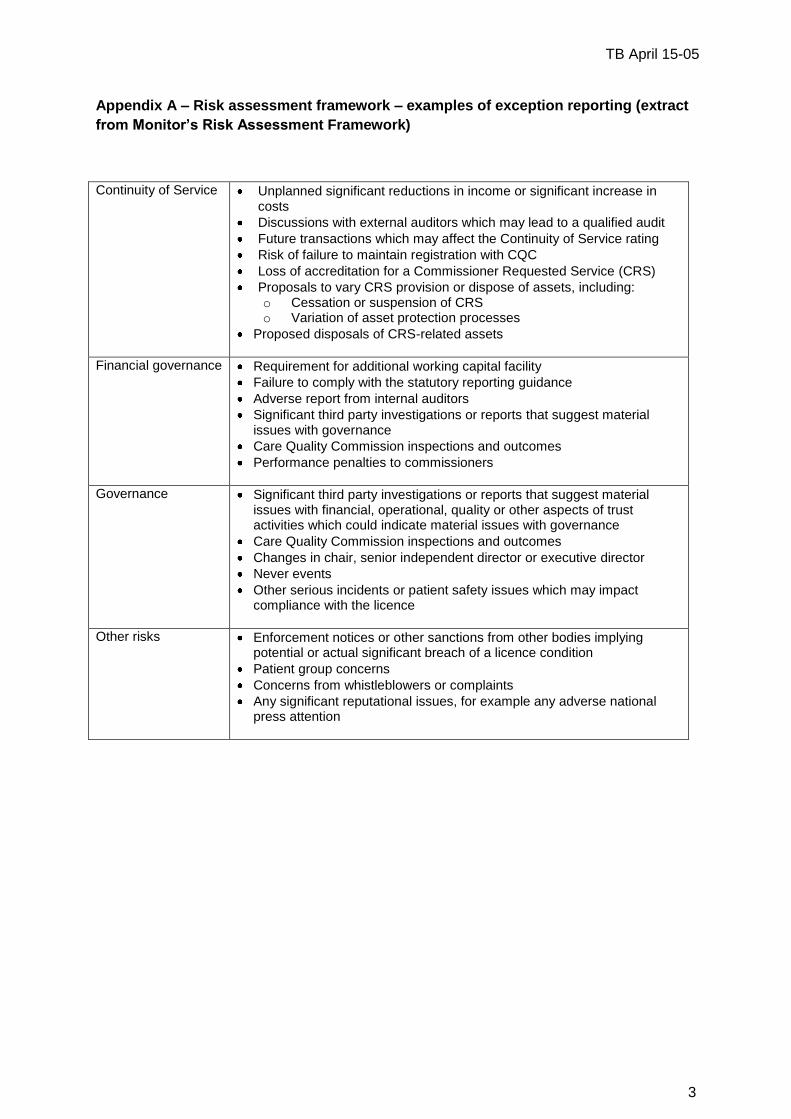
TB April 15-05
3
Appendix A – Risk assessment framework – examples of exception reporting (extract
from Monitor’s Risk Assessment Framework)
Continuity of Service Unplanned significant reductions in income or significant increase in costs
Discussions with external auditors which may lead to a qualified audit
Future transactions which may affect the Continuity of Service rating
Risk of failure to maintain registration with CQC
Loss of accreditation for a Commissioner Requested Service (CRS)
Proposals to vary CRS provision or dispose of assets, including: o Cessation or suspension of CRS o Variation of asset protection processes
Proposed disposals of CRS-related assets
Financial governance Requirement for additional working capital facility
Failure to comply with the statutory reporting guidance
Adverse report from internal auditors
Significant third party investigations or reports that suggest material issues with governance
Care Quality Commission inspections and outcomes
Performance penalties to commissioners
Governance Significant third party investigations or reports that suggest material issues with financial, operational, quality or other aspects of trust activities which could indicate material issues with governance
Care Quality Commission inspections and outcomes
Changes in chair, senior independent director or executive director
Never events
Other serious incidents or patient safety issues which may impact compliance with the licence
Other risks Enforcement notices or other sanctions from other bodies implying potential or actual significant breach of a licence condition
Patient group concerns
Concerns from whistleblowers or complaints
Any significant reputational issues, for example any adverse national press attention
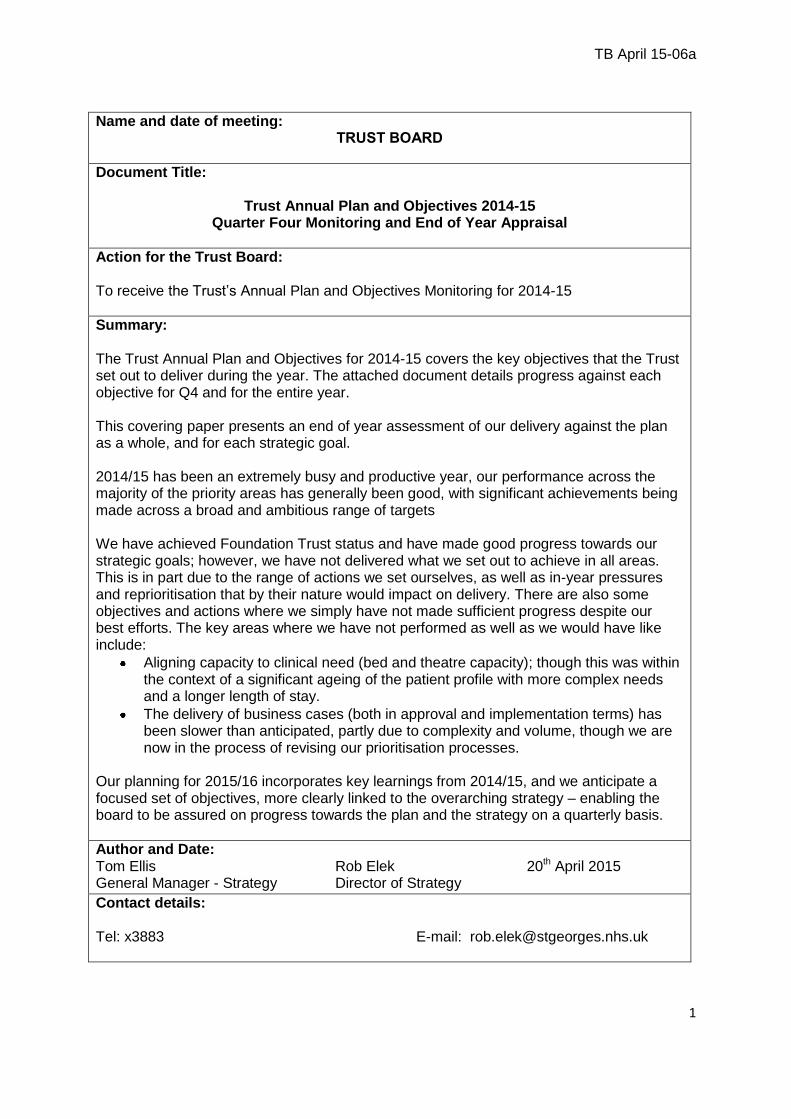
TB April 15-06a
1
Name and date of meeting: TRUST BOARD
Document Title:
Trust Annual Plan and Objectives 2014-15 Quarter Four Monitoring and End of Year Appraisal
Action for the Trust Board: To receive the Trust’s Annual Plan and Objectives Monitoring for 2014-15
Summary: The Trust Annual Plan and Objectives for 2014-15 covers the key objectives that the Trust set out to deliver during the year. The attached document details progress against each objective for Q4 and for the entire year. This covering paper presents an end of year assessment of our delivery against the plan as a whole, and for each strategic goal. 2014/15 has been an extremely busy and productive year, our performance across the majority of the priority areas has generally been good, with significant achievements being made across a broad and ambitious range of targets We have achieved Foundation Trust status and have made good progress towards our strategic goals; however, we have not delivered what we set out to achieve in all areas. This is in part due to the range of actions we set ourselves, as well as in-year pressures and reprioritisation that by their nature would impact on delivery. There are also some objectives and actions where we simply have not made sufficient progress despite our best efforts. The key areas where we have not performed as well as we would have like include:
Aligning capacity to clinical need (bed and theatre capacity); though this was within the context of a significant ageing of the patient profile with more complex needs and a longer length of stay.
The delivery of business cases (both in approval and implementation terms) has been slower than anticipated, partly due to complexity and volume, though we are now in the process of revising our prioritisation processes.
Our planning for 2015/16 incorporates key learnings from 2014/15, and we anticipate a focused set of objectives, more clearly linked to the overarching strategy – enabling the board to be assured on progress towards the plan and the strategy on a quarterly basis.
Author and Date: Tom Ellis Rob Elek 20th April 2015 General Manager - Strategy Director of Strategy
Contact details: Tel: x3883 E-mail: [email protected]
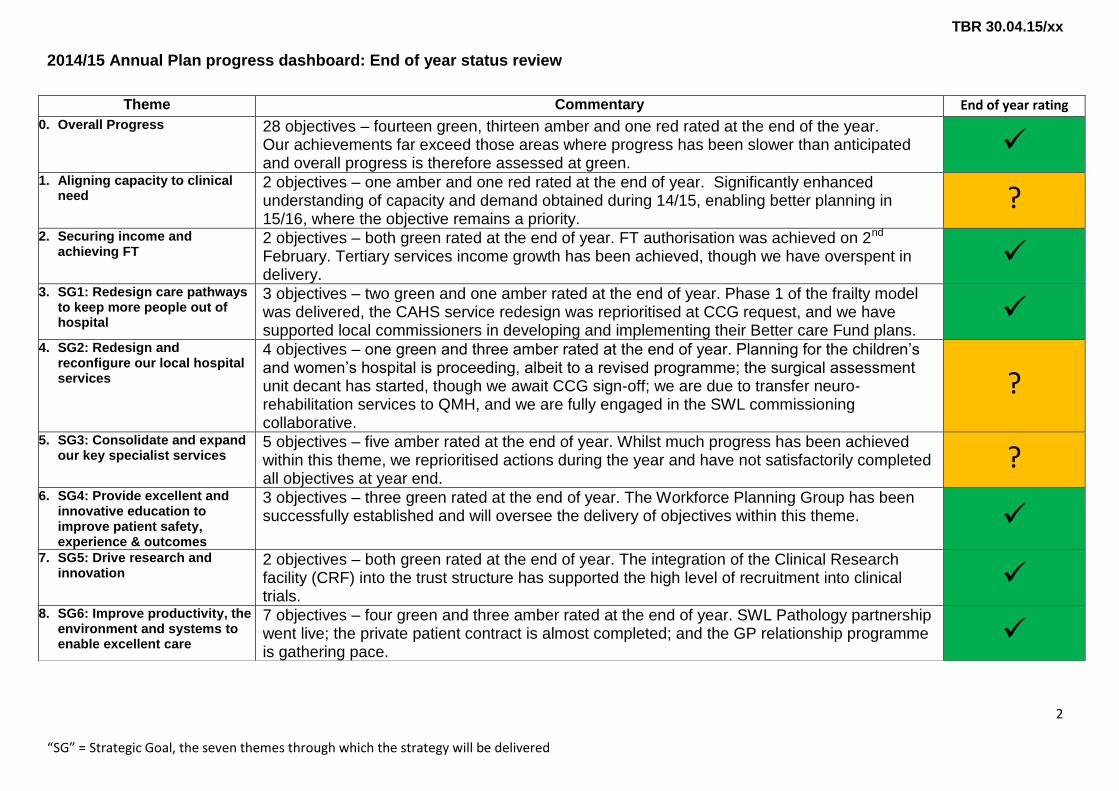
TBR 30.04.15/xx
2014/15 Annual Plan progress dashboard: End of year status review
2
“SG” = Strategic Goal, the seven themes through which the strategy will be delivered
Theme Commentary End of year rating
0. Overall Progress 28 objectives – fourteen green, thirteen amber and one red rated at the end of the year. Our achievements far exceed those areas where progress has been slower than anticipated and overall progress is therefore assessed at green.
1. Aligning capacity to clinical
need 2 objectives – one amber and one red rated at the end of year. Significantly enhanced understanding of capacity and demand obtained during 14/15, enabling better planning in 15/16, where the objective remains a priority.
? 2. Securing income and
achieving FT 2 objectives – both green rated at the end of year. FT authorisation was achieved on 2nd February. Tertiary services income growth has been achieved, though we have overspent in delivery.
3. SG1: Redesign care pathways
to keep more people out of hospital
3 objectives – two green and one amber rated at the end of year. Phase 1 of the frailty model was delivered, the CAHS service redesign was reprioritised at CCG request, and we have supported local commissioners in developing and implementing their Better care Fund plans.
4. SG2: Redesign and
reconfigure our local hospital services
4 objectives – one green and three amber rated at the end of year. Planning for the children’s and women’s hospital is proceeding, albeit to a revised programme; the surgical assessment unit decant has started, though we await CCG sign-off; we are due to transfer neuro-rehabilitation services to QMH, and we are fully engaged in the SWL commissioning collaborative.
?
5. SG3: Consolidate and expand our key specialist services
5 objectives – five amber rated at the end of year. Whilst much progress has been achieved within this theme, we reprioritised actions during the year and have not satisfactorily completed all objectives at year end.
? 6. SG4: Provide excellent and
innovative education to improve patient safety, experience & outcomes
3 objectives – three green rated at the end of year. The Workforce Planning Group has been successfully established and will oversee the delivery of objectives within this theme.
7. SG5: Drive research and innovation
2 objectives – both green rated at the end of year. The integration of the Clinical Research facility (CRF) into the trust structure has supported the high level of recruitment into clinical trials.
8. SG6: Improve productivity, the
environment and systems to enable excellent care
7 objectives – four green and three amber rated at the end of year. SWL Pathology partnership went live; the private patient contract is almost completed; and the GP relationship programme is gathering pace.

Annual Plan and Objectives 2014/15 Quarter Four Monitoring and End of
Year Summary

Addressing the key challenges for 2014/15
2
Aligning capacity to clinical need: 1 Objective
Actions – Quarter 4 2014/15 Summary position – Overall Q 1- Q 4 progress against planned actions Q4 Action Update on Q4 progress
Ensure we align our bed capacity to the clinical needs of our patients
Lead: Director of Delivery and Improvement
Q4 RAG Status Discharge programme developed and in process of being implemented through 3 workstreams; discharge processes, site management and working with partners. Led by Jennie Hall, Chief Nurse. Programme recently updated to reflect ‘SAFER’ structure and branding promoted by ECIST. Scheme postponed to 2015/16 due to contractual discussions. 20 beds opened in Lanesborough Wing. SAU (8 beds) and 14 cardiac and neuro beds delayed to 15/16 due to contractual discussions. Intended length of stay reductions have not been achieved. Release of beds through service improvement activities significantly behind forecast levels although activities and milestones largely delivered to plan. Enhanced tracking of planned improvement benefits developed through PMO team. TOTAL circa 20 - 25
Full year RAG Status
Implement Discharge programme Open 16 beds on Thomas Young following Wolfson move Open 35 beds in Lanesborough, SAU and AMW IP - 15 bed equivalents in addition to above TOTAL 66
We achieved: Ceaser Hawkins remained open Vernon/Gray moved to Surgery Bed capacity growth plans agreed Implemented phase 1 of frailty model to
timetable in August 2015 Develop an enhanced recovery
programme Open additional beds on Allingham (8
beds) Nightingale (20 beds), and Gordon Smith (17 beds)
Implement discharge programme
We did not achieve: Release of planned capacity expected
from service improvement schemes around LOS reduction (45 beds over year)
Release 12 beds from frailty model Move 18 Wolfson beds to QMH (Q3) Implement electronic whiteboards (Q3) Open Cardiac/Nuero beds
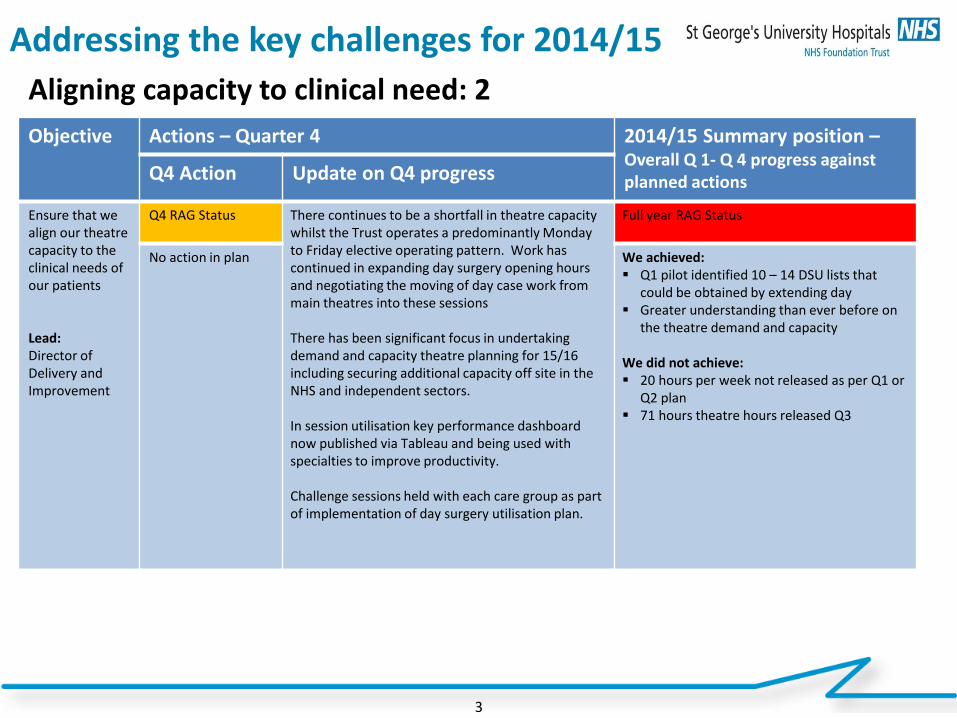
Addressing the key challenges for 2014/15
3
Aligning capacity to clinical need: 2 Objective
Actions – Quarter 4 2014/15 Summary position – Overall Q 1- Q 4 progress against planned actions Q4 Action Update on Q4 progress
Ensure that we align our theatre capacity to the clinical needs of our patients Lead: Director of Delivery and Improvement
Q4 RAG Status There continues to be a shortfall in theatre capacity whilst the Trust operates a predominantly Monday to Friday elective operating pattern. Work has continued in expanding day surgery opening hours and negotiating the moving of day case work from main theatres into these sessions There has been significant focus in undertaking demand and capacity theatre planning for 15/16 including securing additional capacity off site in the NHS and independent sectors. In session utilisation key performance dashboard now published via Tableau and being used with specialties to improve productivity. Challenge sessions held with each care group as part of implementation of day surgery utilisation plan.
Full year RAG Status
No action in plan
We achieved: Q1 pilot identified 10 – 14 DSU lists that
could be obtained by extending day Greater understanding than ever before on
the theatre demand and capacity We did not achieve: 20 hours per week not released as per Q1 or
Q2 plan 71 hours theatre hours released Q3
Addressing the key challenges for 2014/15
4
Securing income and achieving FT authorisation Objective
Actions – Quarter 4 2014/15 Summary position – Overall Q 1- Q 4 progress against planned actions Q4 Action Update on Q4 progress
Take immediate steps to expand our key tertiary services in the longer term and thus increase our income Leads: Director of Delivery and Improvement / Director of Strategy
Q4 RAG Status Cardiovascular income forecast of £15,793k, an over performance in quarter against the target of £365k. Neuro income forecast outturn for Q4 is £13,225k, £980k below target. Target includes income for Thomas Young opening – which is now due in 2015/16. Elective activity and income significantly impacted by winter pressures and non-elective work Total forecast NHS SLA income for Q4 is £151,102 based on M10 forecast outturn, which would represent an over performance in quarter of £1.197M.
Full year RAG Status
Cardiovascular income target Q4 £15,428k Neuroscience Income target Q4 £14,205k Total income target Q4 £149,905k
We achieved: Nelson bid submitted and won Cardiovascular over performed against
income target by year end Neurosciences over performed against
income target by year end NHS SLA income over target at year end
We did not achieve: Achieved targets, but overspent in delivering
it
Continue to make good progress towards being authorised as a Foundation Trust in the coming year Lead: Director of Corporate Affairs
Q4 RAG Status Trust authorised as St. George’s University Hospital NHS Foundation Trust on 2nd February 2015
Full year RAG Status
No action in plan
We achieved: Foundation Trust status
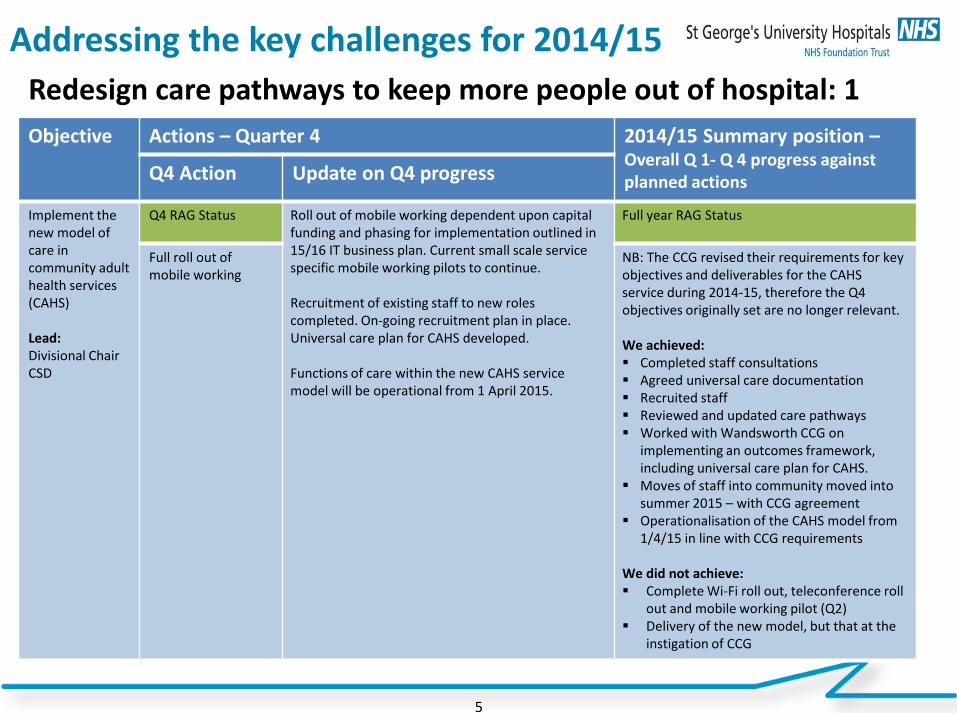
Addressing the key challenges for 2014/15
5
Redesign care pathways to keep more people out of hospital: 1 Objective
Actions – Quarter 4 2014/15 Summary position – Overall Q 1- Q 4 progress against planned actions Q4 Action Update on Q4 progress
Implement the new model of care in community adult health services (CAHS) Lead: Divisional Chair CSD
Q4 RAG Status Roll out of mobile working dependent upon capital funding and phasing for implementation outlined in 15/16 IT business plan. Current small scale service specific mobile working pilots to continue. Recruitment of existing staff to new roles completed. On-going recruitment plan in place. Universal care plan for CAHS developed. Functions of care within the new CAHS service model will be operational from 1 April 2015.
Full year RAG Status
Full roll out of mobile working
NB: The CCG revised their requirements for key objectives and deliverables for the CAHS service during 2014-15, therefore the Q4 objectives originally set are no longer relevant. We achieved: Completed staff consultations Agreed universal care documentation Recruited staff Reviewed and updated care pathways Worked with Wandsworth CCG on
implementing an outcomes framework, including universal care plan for CAHS.
Moves of staff into community moved into summer 2015 – with CCG agreement
Operationalisation of the CAHS model from 1/4/15 in line with CCG requirements
We did not achieve: Complete Wi-Fi roll out, teleconference roll
out and mobile working pilot (Q2) Delivery of the new model, but that at the
instigation of CCG
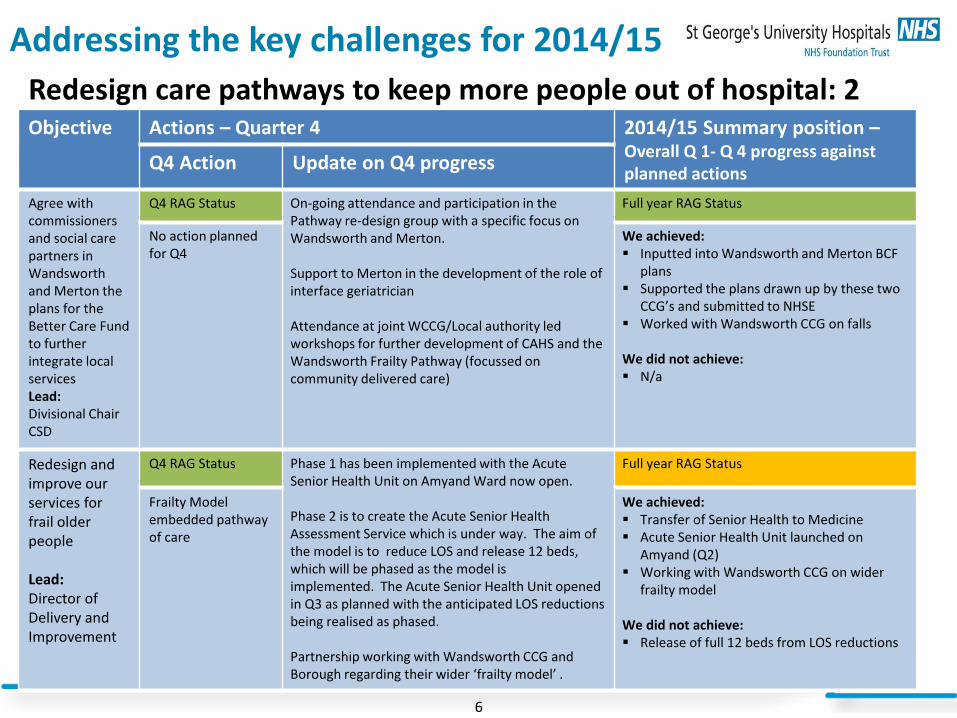
Addressing the key challenges for 2014/15
6
Redesign care pathways to keep more people out of hospital: 2 Objective
Actions – Quarter 4 2014/15 Summary position – Overall Q 1- Q 4 progress against planned actions
Q4 Action Update on Q4 progress
Agree with commissioners and social care partners in Wandsworth and Merton the plans for the Better Care Fund to further integrate local services Lead: Divisional Chair CSD
Q4 RAG Status On-going attendance and participation in the Pathway re-design group with a specific focus on Wandsworth and Merton. Support to Merton in the development of the role of interface geriatrician Attendance at joint WCCG/Local authority led workshops for further development of CAHS and the Wandsworth Frailty Pathway (focussed on community delivered care)
Full year RAG Status
No action planned for Q4
We achieved: Inputted into Wandsworth and Merton BCF
plans Supported the plans drawn up by these two
CCG’s and submitted to NHSE Worked with Wandsworth CCG on falls
We did not achieve: N/a
Redesign and improve our services for frail older people Lead: Director of Delivery and Improvement
Q4 RAG Status Phase 1 has been implemented with the Acute Senior Health Unit on Amyand Ward now open. Phase 2 is to create the Acute Senior Health Assessment Service which is under way. The aim of the model is to reduce LOS and release 12 beds, which will be phased as the model is implemented. The Acute Senior Health Unit opened in Q3 as planned with the anticipated LOS reductions being realised as phased. Partnership working with Wandsworth CCG and Borough regarding their wider ‘frailty model’ .
Full year RAG Status
Frailty Model embedded pathway of care
We achieved: Transfer of Senior Health to Medicine Acute Senior Health Unit launched on
Amyand (Q2) Working with Wandsworth CCG on wider
frailty model
We did not achieve: Release of full 12 beds from LOS reductions

Addressing the key challenges for 2014/15
7
Redesign and reconfigure our local hospital services to provide higher quality care: 1 Objective
Actions – Quarter 4 2014/15 Summary position – Overall Q 1- Q 4 progress against planned actions Q4 Action Update on Q4 progress
Complete the planning for the children’s & women’s hospital so that work can start in 2015 Lead: Director of Corporate Affairs
Q4 RAG Status Discussions are on-going to resolve key interdependencies – Moorfields relocation, Theatre provision and Dalby ward closure implications following the Trust Board approval of the Full Business Case in November 2014. 5th Floor development due to commence early Summer 2015 pending resolution of the above issues and clarification of the capital budget for 2015/16 and 16/17
Full year RAG Status
No actions in plan We achieved: SOC approved for full Children’s & Women’s
Hospital OBC for Children’s 5th floor approval by Trust
Board November 2014
We did not achieve: Complete all planning for C&W Hospital
Commence the building of a surgical assessment unit
Lead: Divisional Chair SNT
Q4 RAG Status Surgical assessment unit originally planned to be opened in Q4 but the timescales have slipped due to delayed commissioner sign-off and a very complex decant plan. The decant has commenced. Commissioners are supportive although formal sign-off is yet to be achieved. The expected date for the SAU to be operational is September 2015.
Full year RAG Status
Open surgical assessment unit
We achieved: Business case approved by July 2014 Trust
Board Commissioner support
We did not achieve: Opening of the SAU – now expected Sept
2015
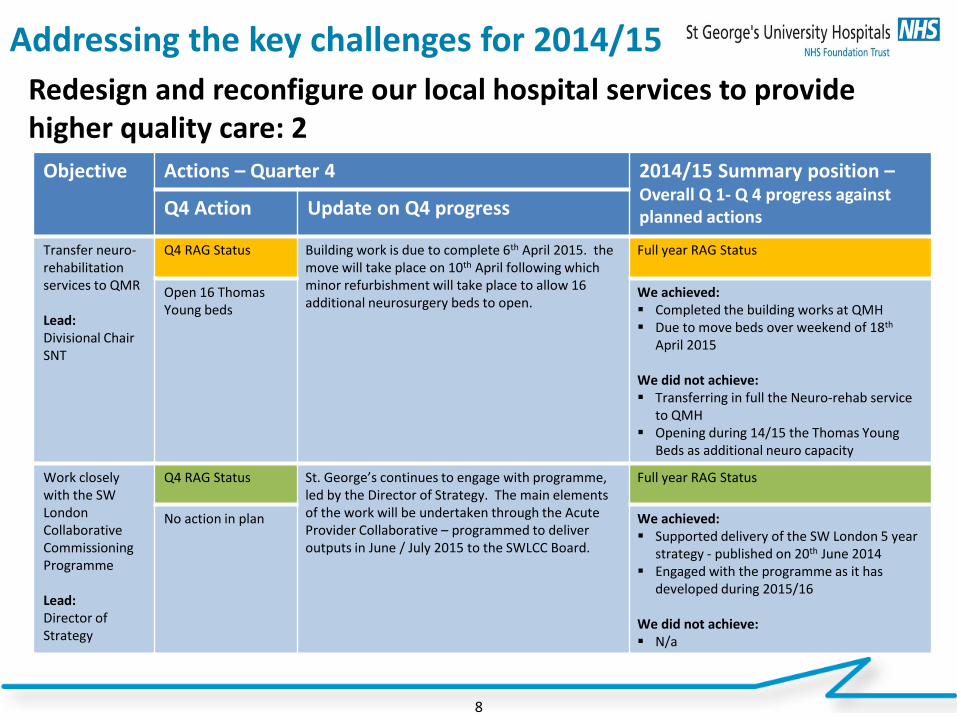
Addressing the key challenges for 2014/15
8
Redesign and reconfigure our local hospital services to provide higher quality care: 2
Objective
Actions – Quarter 4 2014/15 Summary position – Overall Q 1- Q 4 progress against planned actions Q4 Action Update on Q4 progress
Transfer neuro-rehabilitation services to QMR Lead: Divisional Chair SNT
Q4 RAG Status Building work is due to complete 6th April 2015. the move will take place on 10th April following which minor refurbishment will take place to allow 16 additional neurosurgery beds to open.
Full year RAG Status
Open 16 Thomas Young beds
We achieved: Completed the building works at QMH Due to move beds over weekend of 18th
April 2015
We did not achieve: Transferring in full the Neuro-rehab service
to QMH Opening during 14/15 the Thomas Young
Beds as additional neuro capacity
Work closely with the SW London Collaborative Commissioning Programme Lead: Director of Strategy
Q4 RAG Status St. George’s continues to engage with programme, led by the Director of Strategy. The main elements of the work will be undertaken through the Acute Provider Collaborative – programmed to deliver outputs in June / July 2015 to the SWLCC Board.
Full year RAG Status
No action in plan
We achieved: Supported delivery of the SW London 5 year
strategy - published on 20th June 2014 Engaged with the programme as it has
developed during 2015/16
We did not achieve: N/a

Addressing the key challenges for 2014/15
9
Consolidate and expand our key specialist services: 1
Objective
Actions – Quarter 4 2014/15 Summary position – Overall Q 1- Q 4 progress against planned actions Q4 Action Update on Q4 progress
Complete plans for more critical care beds Lead: Divisional Chair CWDT
Q4 RAG Status OBC signed off by Trust Board as per plan at November Board meeting. FBC was completed however, further conversations took place at the ITU Board where is was agreed to align the GICU expansion with the DCP and expand the project further to include a CDU expansion underneath. This would increase the GICU beds from 9 to 21 and future proof the department. Awaiting expenditure review of 15/16 capital programme to determine deadline for FBC completion.
Full year RAG Status
Complete FBC
We achieved: Managed ICU demand during 14/15 OBC approved at November 2014 Trust
Board
We did not achieve: Complete the FBC
Complete the new hybrid operating theatre Lead: Divisional Chair MCV
Q4 RAG Status Hybrid theatre originally planned to be operational in Q4. Now due to open in Q3 2015
Full year RAG Status
Open hybrid theatre
We achieved: FBC approved April 2014 Building works commenced and on-going We did not achieve: Deliver the hybrid theatre to timetable –
now expected Autumn 2015
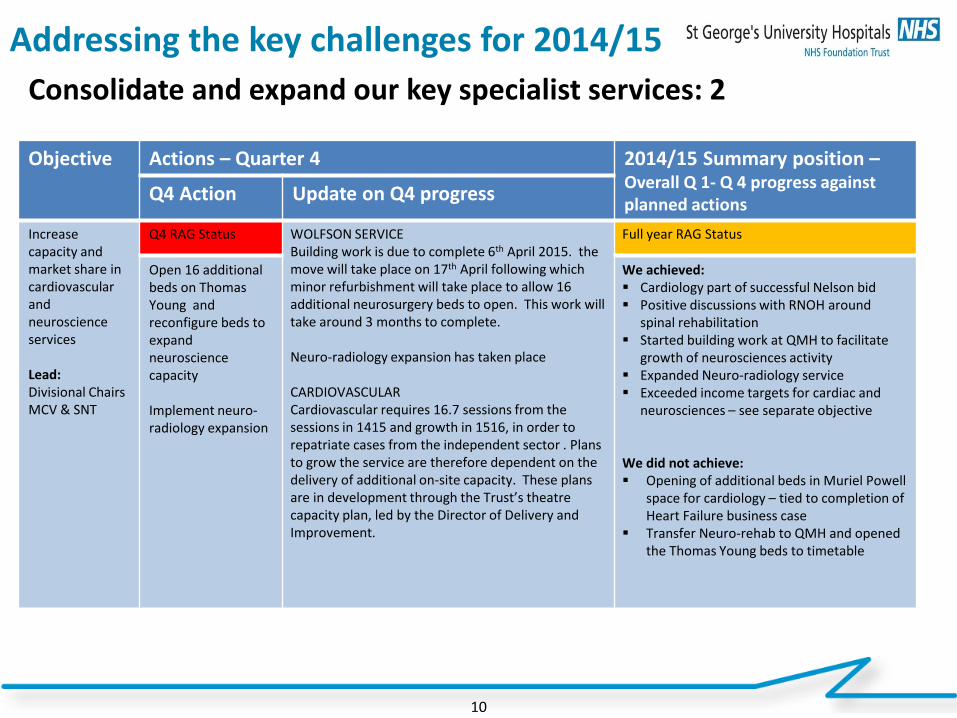
Addressing the key challenges for 2014/15
10
Consolidate and expand our key specialist services: 2 Objective
Actions – Quarter 4 2014/15 Summary position – Overall Q 1- Q 4 progress against planned actions
Q4 Action Update on Q4 progress
Increase capacity and market share in cardiovascular and neuroscience services Lead: Divisional Chairs MCV & SNT
Q4 RAG Status WOLFSON SERVICE Building work is due to complete 6th April 2015. the move will take place on 17th April following which minor refurbishment will take place to allow 16 additional neurosurgery beds to open. This work will take around 3 months to complete. Neuro-radiology expansion has taken place CARDIOVASCULAR Cardiovascular requires 16.7 sessions from the sessions in 1415 and growth in 1516, in order to repatriate cases from the independent sector . Plans to grow the service are therefore dependent on the delivery of additional on-site capacity. These plans are in development through the Trust’s theatre capacity plan, led by the Director of Delivery and Improvement.
Full year RAG Status
Open 16 additional beds on Thomas Young and reconfigure beds to expand neuroscience capacity Implement neuro-radiology expansion
We achieved: Cardiology part of successful Nelson bid Positive discussions with RNOH around
spinal rehabilitation Started building work at QMH to facilitate
growth of neurosciences activity Expanded Neuro-radiology service Exceeded income targets for cardiac and
neurosciences – see separate objective
We did not achieve: Opening of additional beds in Muriel Powell
space for cardiology – tied to completion of Heart Failure business case
Transfer Neuro-rehab to QMH and opened the Thomas Young beds to timetable
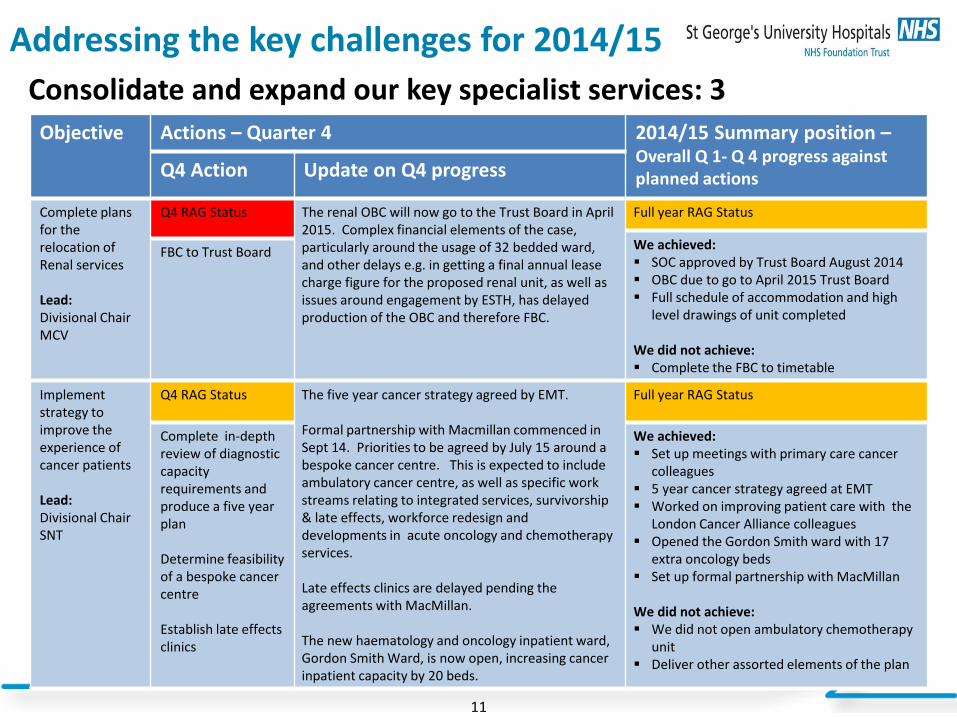
Addressing the key challenges for 2014/15
11
Consolidate and expand our key specialist services: 3 Objective
Actions – Quarter 4 2014/15 Summary position – Overall Q 1- Q 4 progress against planned actions Q4 Action Update on Q4 progress
Complete plans for the relocation of Renal services Lead: Divisional Chair MCV
Q4 RAG Status The renal OBC will now go to the Trust Board in April 2015. Complex financial elements of the case, particularly around the usage of 32 bedded ward, and other delays e.g. in getting a final annual lease charge figure for the proposed renal unit, as well as issues around engagement by ESTH, has delayed production of the OBC and therefore FBC.
Full year RAG Status
We achieved: SOC approved by Trust Board August 2014 OBC due to go to April 2015 Trust Board Full schedule of accommodation and high
level drawings of unit completed We did not achieve: Complete the FBC to timetable
FBC to Trust Board
Implement strategy to improve the experience of cancer patients Lead: Divisional Chair SNT
Q4 RAG Status The five year cancer strategy agreed by EMT. Formal partnership with Macmillan commenced in Sept 14. Priorities to be agreed by July 15 around a bespoke cancer centre. This is expected to include ambulatory cancer centre, as well as specific work streams relating to integrated services, survivorship & late effects, workforce redesign and developments in acute oncology and chemotherapy services. Late effects clinics are delayed pending the agreements with MacMillan. The new haematology and oncology inpatient ward, Gordon Smith Ward, is now open, increasing cancer inpatient capacity by 20 beds.
Full year RAG Status
Complete in-depth review of diagnostic capacity requirements and produce a five year plan Determine feasibility of a bespoke cancer centre Establish late effects clinics
We achieved: Set up meetings with primary care cancer
colleagues 5 year cancer strategy agreed at EMT Worked on improving patient care with the
London Cancer Alliance colleagues Opened the Gordon Smith ward with 17
extra oncology beds Set up formal partnership with MacMillan
We did not achieve: We did not open ambulatory chemotherapy
unit Deliver other assorted elements of the plan

Addressing the key challenges for 2014/15
12
Provide excellent and innovative education to improve patient safety, experience and outcomes: 1 Objective
Actions – Quarter 4 2014/15 Summary position – Overall Q 1- Q 4 progress against planned actions
Q4 Action Update on Q4 progress
Work towards being a national leader in multi-professional training Lead: Director of Human Resources & Organisation Development
Q4 RAG Status Dental simulation suite opened in 2014 - £17,200 income delivered YTD. Presentation of progress made to Workforce and Education Committee in December 2014. Nursing staff now embedded in simulation training days with junior doctors and / or medical students. Harm free care days established as multi-professional training events Acclimatisation programme being rolled out across professional groups.
Full year RAG Status
Achieve international accreditation for the simulation centre
We achieved: Increased the number and range of multi-
professional training events within the simulation centre
1,175 nursing staff have attended multi-professional simulation based training events alongside medical staff in the past year and the nursing participation rate has increased overall to 50%
Dental simulation suite opened (Q3)
We did not achieve: International accreditation for simulation
centre
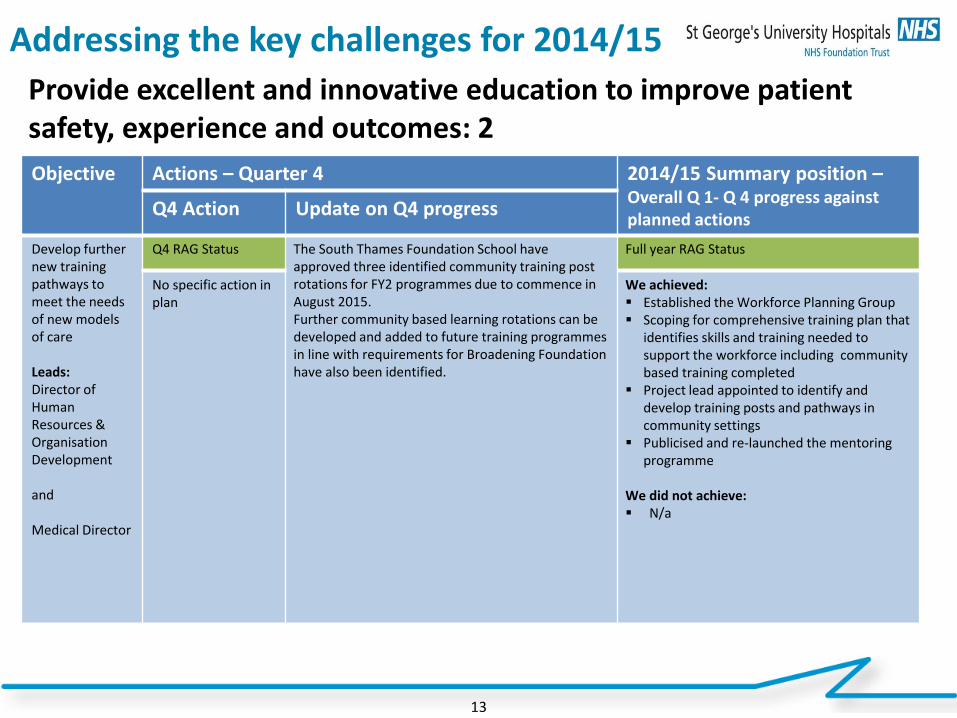
Addressing the key challenges for 2014/15
13
Provide excellent and innovative education to improve patient safety, experience and outcomes: 2 Objective
Actions – Quarter 4 2014/15 Summary position – Overall Q 1- Q 4 progress against planned actions
Q4 Action Update on Q4 progress
Develop further new training pathways to meet the needs of new models of care Leads: Director of Human Resources & Organisation Development and Medical Director
Q4 RAG Status The South Thames Foundation School have approved three identified community training post rotations for FY2 programmes due to commence in August 2015. Further community based learning rotations can be developed and added to future training programmes in line with requirements for Broadening Foundation have also been identified.
Full year RAG Status
No specific action in plan
We achieved: Established the Workforce Planning Group Scoping for comprehensive training plan that
identifies skills and training needed to support the workforce including community based training completed
Project lead appointed to identify and develop training posts and pathways in community settings
Publicised and re-launched the mentoring programme
We did not achieve: N/a
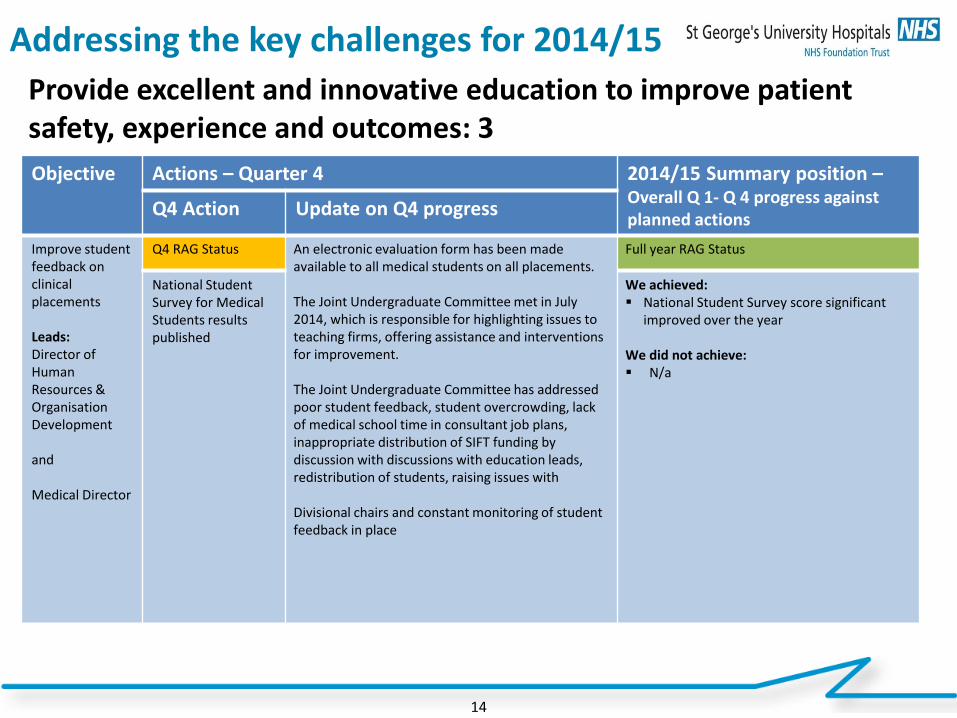
Addressing the key challenges for 2014/15
14
Provide excellent and innovative education to improve patient safety, experience and outcomes: 3 Objective
Actions – Quarter 4 2014/15 Summary position – Overall Q 1- Q 4 progress against planned actions
Q4 Action Update on Q4 progress
Improve student feedback on clinical placements Leads: Director of Human Resources & Organisation Development and Medical Director
Q4 RAG Status An electronic evaluation form has been made available to all medical students on all placements. The Joint Undergraduate Committee met in July 2014, which is responsible for highlighting issues to teaching firms, offering assistance and interventions for improvement. The Joint Undergraduate Committee has addressed poor student feedback, student overcrowding, lack of medical school time in consultant job plans, inappropriate distribution of SIFT funding by discussion with discussions with education leads, redistribution of students, raising issues with Divisional chairs and constant monitoring of student feedback in place
Full year RAG Status
National Student Survey for Medical Students results published
We achieved: National Student Survey score significant
improved over the year We did not achieve: N/a
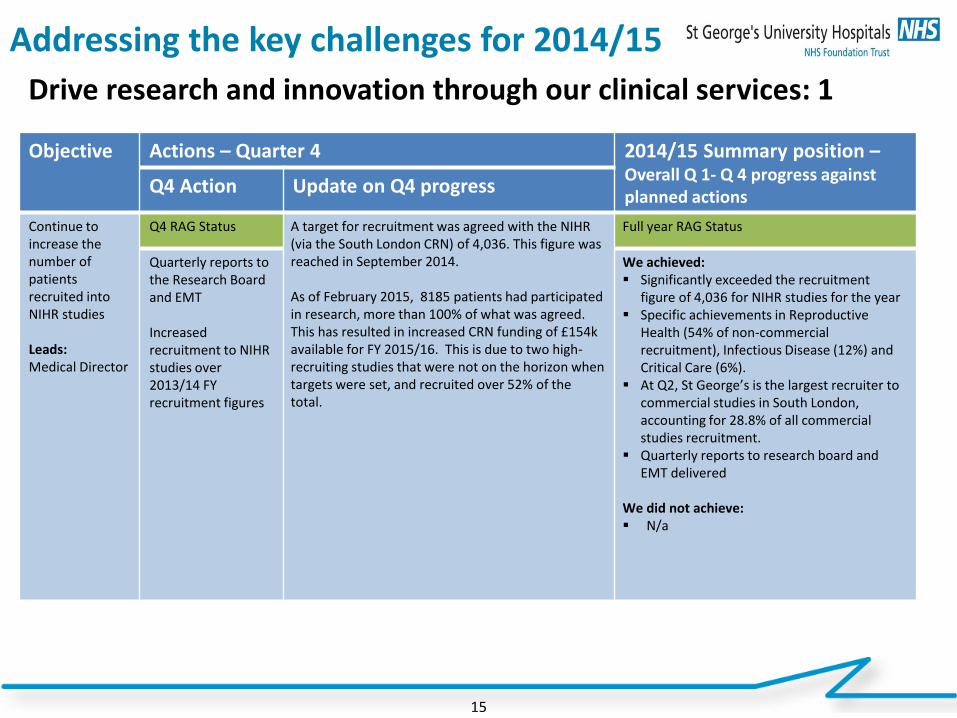
Addressing the key challenges for 2014/15
15
Drive research and innovation through our clinical services: 1 Objective
Actions – Quarter 4 2014/15 Summary position – Overall Q 1- Q 4 progress against planned actions
Q4 Action Update on Q4 progress
Continue to increase the number of patients recruited into NIHR studies Leads: Medical Director
Q4 RAG Status A target for recruitment was agreed with the NIHR (via the South London CRN) of 4,036. This figure was reached in September 2014. As of February 2015, 8185 patients had participated in research, more than 100% of what was agreed. This has resulted in increased CRN funding of £154k available for FY 2015/16. This is due to two high-recruiting studies that were not on the horizon when targets were set, and recruited over 52% of the total.
Full year RAG Status
Quarterly reports to the Research Board and EMT Increased recruitment to NIHR studies over 2013/14 FY recruitment figures
We achieved: Significantly exceeded the recruitment
figure of 4,036 for NIHR studies for the year Specific achievements in Reproductive
Health (54% of non-commercial recruitment), Infectious Disease (12%) and Critical Care (6%).
At Q2, St George’s is the largest recruiter to commercial studies in South London, accounting for 28.8% of all commercial studies recruitment.
Quarterly reports to research board and EMT delivered
We did not achieve: N/a
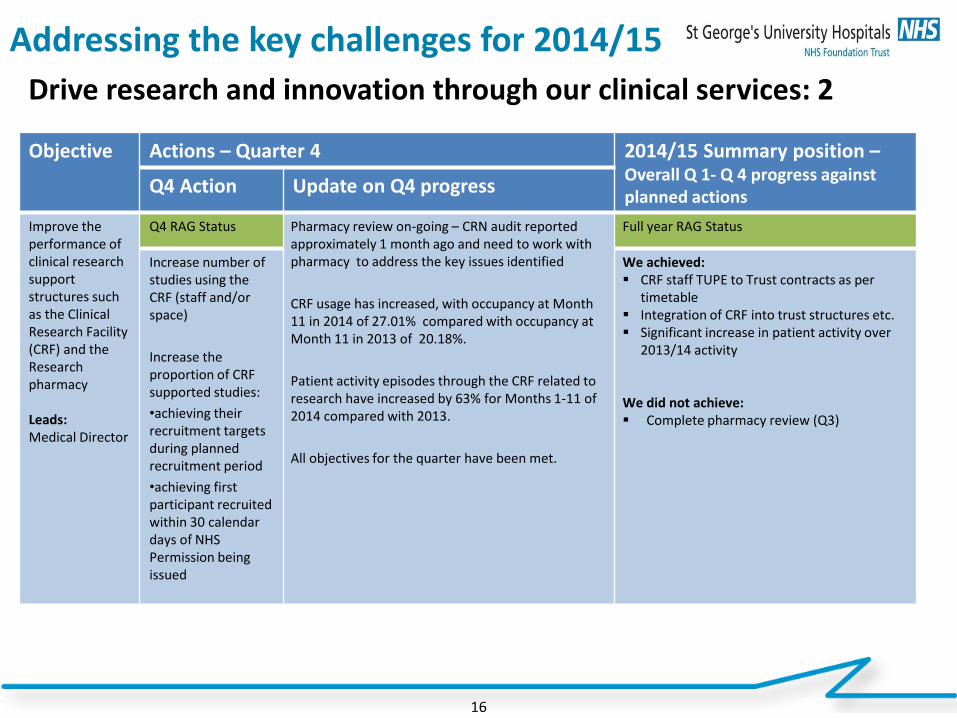
Addressing the key challenges for 2014/15
16
Drive research and innovation through our clinical services: 2 Objective
Actions – Quarter 4 2014/15 Summary position – Overall Q 1- Q 4 progress against planned actions
Q4 Action Update on Q4 progress
Improve the performance of clinical research support structures such as the Clinical Research Facility (CRF) and the Research pharmacy Leads: Medical Director
Q4 RAG Status Pharmacy review on-going – CRN audit reported approximately 1 month ago and need to work with pharmacy to address the key issues identified
CRF usage has increased, with occupancy at Month 11 in 2014 of 27.01% compared with occupancy at Month 11 in 2013 of 20.18%.
Patient activity episodes through the CRF related to research have increased by 63% for Months 1-11 of 2014 compared with 2013.
All objectives for the quarter have been met.
Full year RAG Status
Increase number of studies using the CRF (staff and/or space)
Increase the proportion of CRF supported studies:
•achieving their recruitment targets during planned recruitment period
•achieving first participant recruited within 30 calendar days of NHS Permission being issued
We achieved: CRF staff TUPE to Trust contracts as per
timetable Integration of CRF into trust structures etc. Significant increase in patient activity over
2013/14 activity
We did not achieve: Complete pharmacy review (Q3)
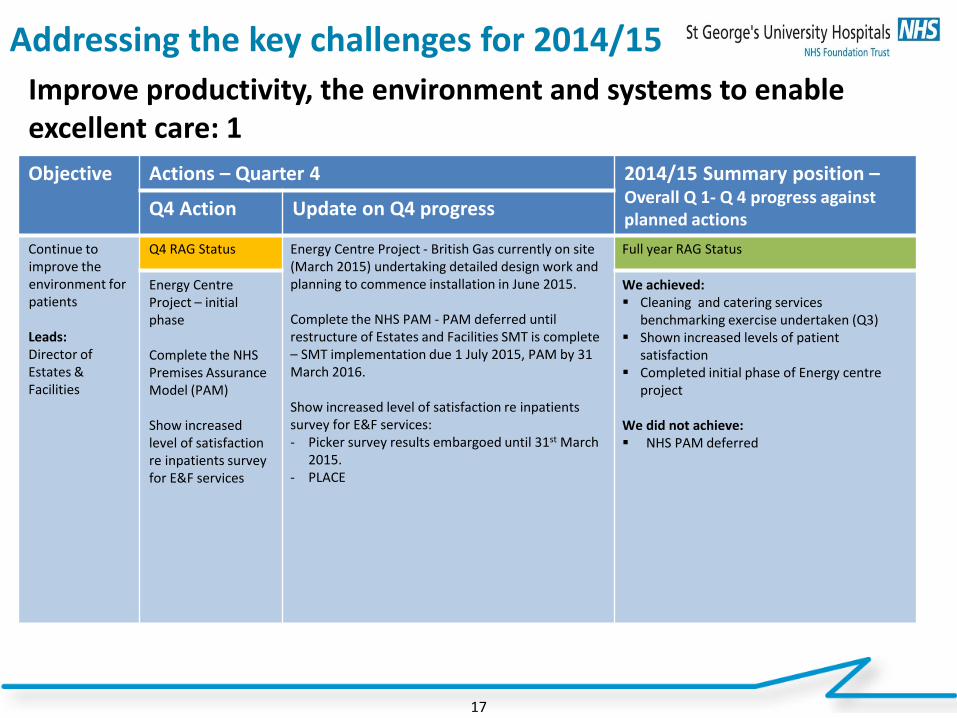
Addressing the key challenges for 2014/15
17
Improve productivity, the environment and systems to enable excellent care: 1 Objective
Actions – Quarter 4 2014/15 Summary position – Overall Q 1- Q 4 progress against planned actions
Q4 Action Update on Q4 progress
Continue to improve the environment for patients Leads: Director of Estates & Facilities
Q4 RAG Status Energy Centre Project - British Gas currently on site (March 2015) undertaking detailed design work and planning to commence installation in June 2015. Complete the NHS PAM - PAM deferred until restructure of Estates and Facilities SMT is complete – SMT implementation due 1 July 2015, PAM by 31 March 2016. Show increased level of satisfaction re inpatients survey for E&F services: - Picker survey results embargoed until 31st March
2015. - PLACE
Full year RAG Status
Energy Centre Project – initial phase Complete the NHS Premises Assurance Model (PAM) Show increased level of satisfaction re inpatients survey for E&F services
We achieved: Cleaning and catering services
benchmarking exercise undertaken (Q3) Shown increased levels of patient
satisfaction Completed initial phase of Energy centre
project We did not achieve: NHS PAM deferred
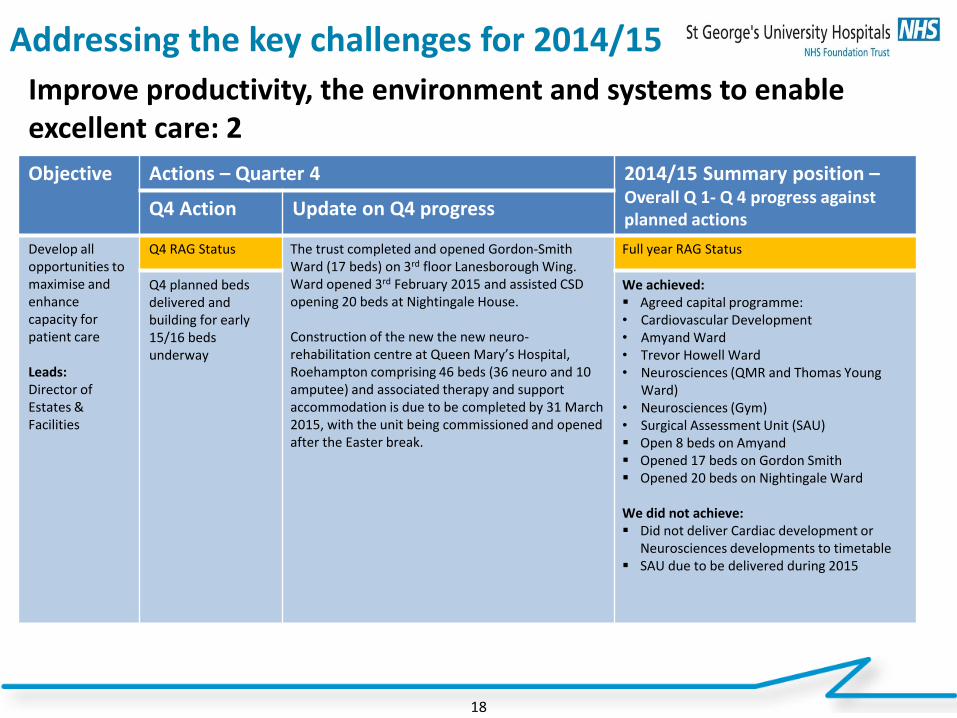
Addressing the key challenges for 2014/15
18
Improve productivity, the environment and systems to enable excellent care: 2 Objective
Actions – Quarter 4 2014/15 Summary position – Overall Q 1- Q 4 progress against planned actions
Q4 Action Update on Q4 progress
Develop all opportunities to maximise and enhance capacity for patient care Leads: Director of Estates & Facilities
Q4 RAG Status The trust completed and opened Gordon-Smith Ward (17 beds) on 3rd floor Lanesborough Wing. Ward opened 3rd February 2015 and assisted CSD opening 20 beds at Nightingale House. Construction of the new the new neuro-rehabilitation centre at Queen Mary’s Hospital, Roehampton comprising 46 beds (36 neuro and 10 amputee) and associated therapy and support accommodation is due to be completed by 31 March 2015, with the unit being commissioned and opened after the Easter break.
Full year RAG Status
Q4 planned beds delivered and building for early 15/16 beds underway
We achieved: Agreed capital programme: • Cardiovascular Development • Amyand Ward • Trevor Howell Ward • Neurosciences (QMR and Thomas Young
Ward) • Neurosciences (Gym) • Surgical Assessment Unit (SAU) Open 8 beds on Amyand Opened 17 beds on Gordon Smith Opened 20 beds on Nightingale Ward We did not achieve: Did not deliver Cardiac development or
Neurosciences developments to timetable SAU due to be delivered during 2015
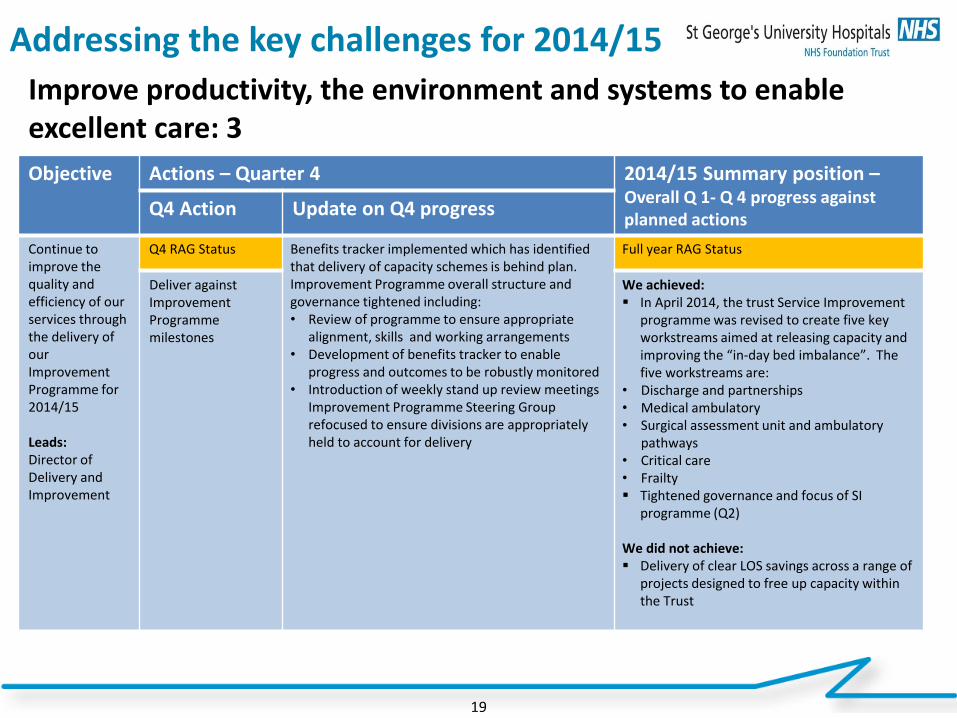
Addressing the key challenges for 2014/15
19
Improve productivity, the environment and systems to enable excellent care: 3 Objective
Actions – Quarter 4 2014/15 Summary position – Overall Q 1- Q 4 progress against planned actions
Q4 Action Update on Q4 progress
Continue to improve the quality and efficiency of our services through the delivery of our Improvement Programme for 2014/15 Leads: Director of Delivery and Improvement
Q4 RAG Status Benefits tracker implemented which has identified that delivery of capacity schemes is behind plan. Improvement Programme overall structure and governance tightened including: • Review of programme to ensure appropriate
alignment, skills and working arrangements • Development of benefits tracker to enable
progress and outcomes to be robustly monitored • Introduction of weekly stand up review meetings
Improvement Programme Steering Group refocused to ensure divisions are appropriately held to account for delivery
Full year RAG Status
Deliver against Improvement Programme milestones
We achieved: In April 2014, the trust Service Improvement
programme was revised to create five key workstreams aimed at releasing capacity and improving the “in-day bed imbalance”. The five workstreams are:
• Discharge and partnerships • Medical ambulatory • Surgical assessment unit and ambulatory
pathways • Critical care • Frailty Tightened governance and focus of SI
programme (Q2) We did not achieve: Delivery of clear LOS savings across a range of
projects designed to free up capacity within the Trust
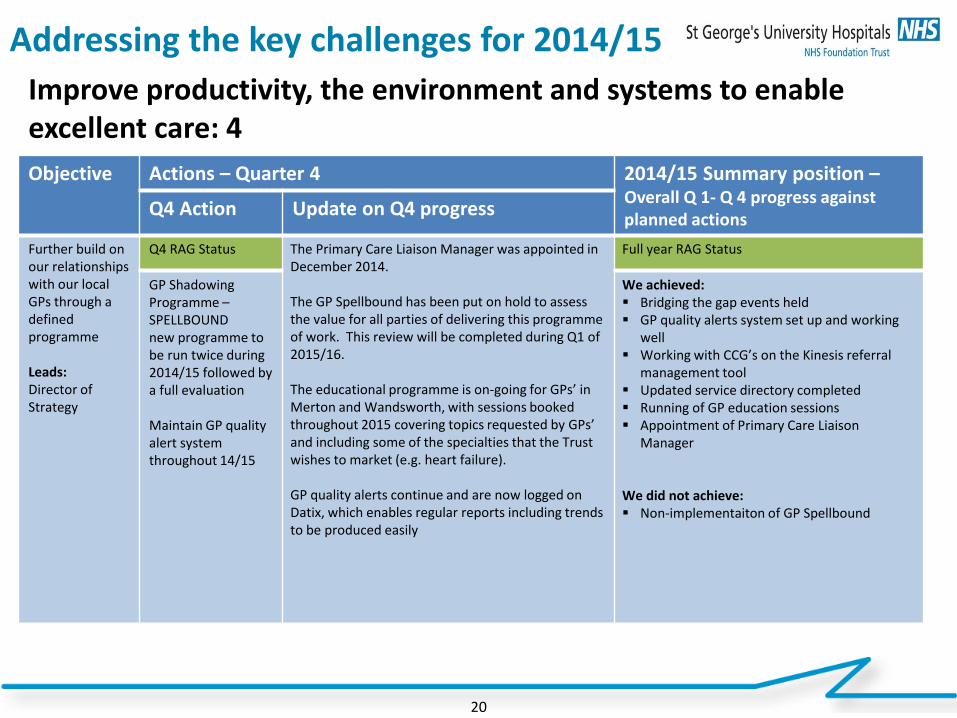
Addressing the key challenges for 2014/15
20
Improve productivity, the environment and systems to enable excellent care: 4 Objective
Actions – Quarter 4 2014/15 Summary position – Overall Q 1- Q 4 progress against planned actions
Q4 Action Update on Q4 progress
Further build on our relationships with our local GPs through a defined programme Leads: Director of Strategy
Q4 RAG Status The Primary Care Liaison Manager was appointed in December 2014. The GP Spellbound has been put on hold to assess the value for all parties of delivering this programme of work. This review will be completed during Q1 of 2015/16. The educational programme is on-going for GPs’ in Merton and Wandsworth, with sessions booked throughout 2015 covering topics requested by GPs’ and including some of the specialties that the Trust wishes to market (e.g. heart failure). GP quality alerts continue and are now logged on Datix, which enables regular reports including trends to be produced easily
Full year RAG Status
GP Shadowing Programme –SPELLBOUND new programme to be run twice during 2014/15 followed by a full evaluation Maintain GP quality alert system throughout 14/15
We achieved: Bridging the gap events held GP quality alerts system set up and working
well Working with CCG’s on the Kinesis referral
management tool Updated service directory completed Running of GP education sessions Appointment of Primary Care Liaison
Manager
We did not achieve: Non-implementaiton of GP Spellbound
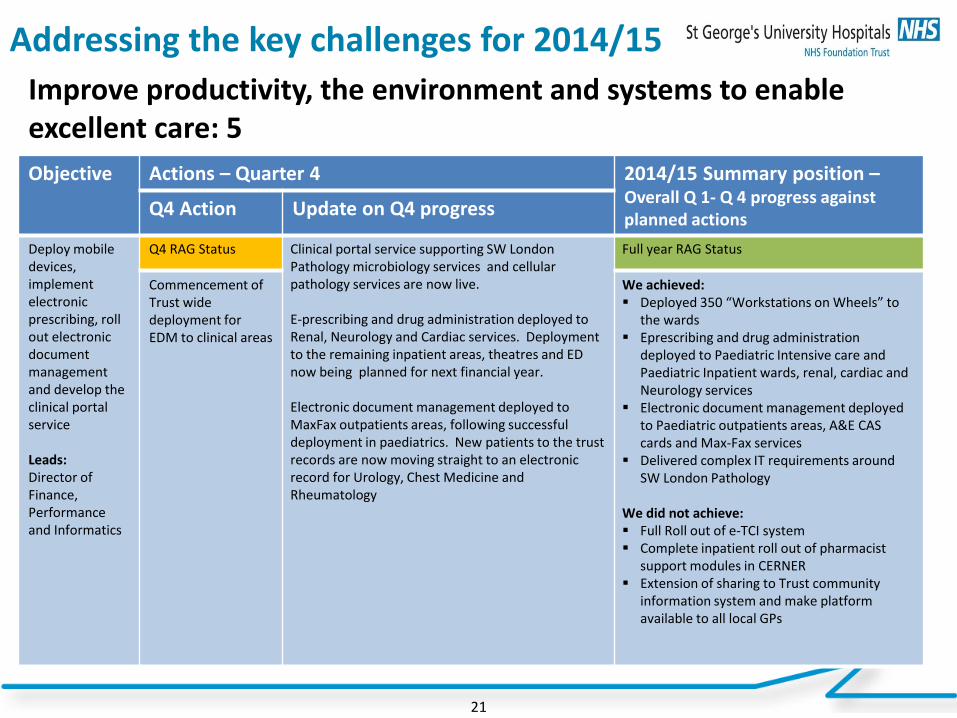
Addressing the key challenges for 2014/15
21
Improve productivity, the environment and systems to enable excellent care: 5 Objective
Actions – Quarter 4 2014/15 Summary position – Overall Q 1- Q 4 progress against planned actions
Q4 Action Update on Q4 progress
Deploy mobile devices, implement electronic prescribing, roll out electronic document management and develop the clinical portal service Leads: Director of Finance, Performance and Informatics
Q4 RAG Status Clinical portal service supporting SW London Pathology microbiology services and cellular pathology services are now live. E-prescribing and drug administration deployed to Renal, Neurology and Cardiac services. Deployment to the remaining inpatient areas, theatres and ED now being planned for next financial year. Electronic document management deployed to MaxFax outpatients areas, following successful deployment in paediatrics. New patients to the trust records are now moving straight to an electronic record for Urology, Chest Medicine and Rheumatology
Full year RAG Status
Commencement of Trust wide deployment for EDM to clinical areas
We achieved: Deployed 350 “Workstations on Wheels” to
the wards Eprescribing and drug administration
deployed to Paediatric Intensive care and Paediatric Inpatient wards, renal, cardiac and Neurology services
Electronic document management deployed to Paediatric outpatients areas, A&E CAS cards and Max-Fax services
Delivered complex IT requirements around SW London Pathology
We did not achieve: Full Roll out of e-TCI system Complete inpatient roll out of pharmacist
support modules in CERNER Extension of sharing to Trust community
information system and make platform available to all local GPs
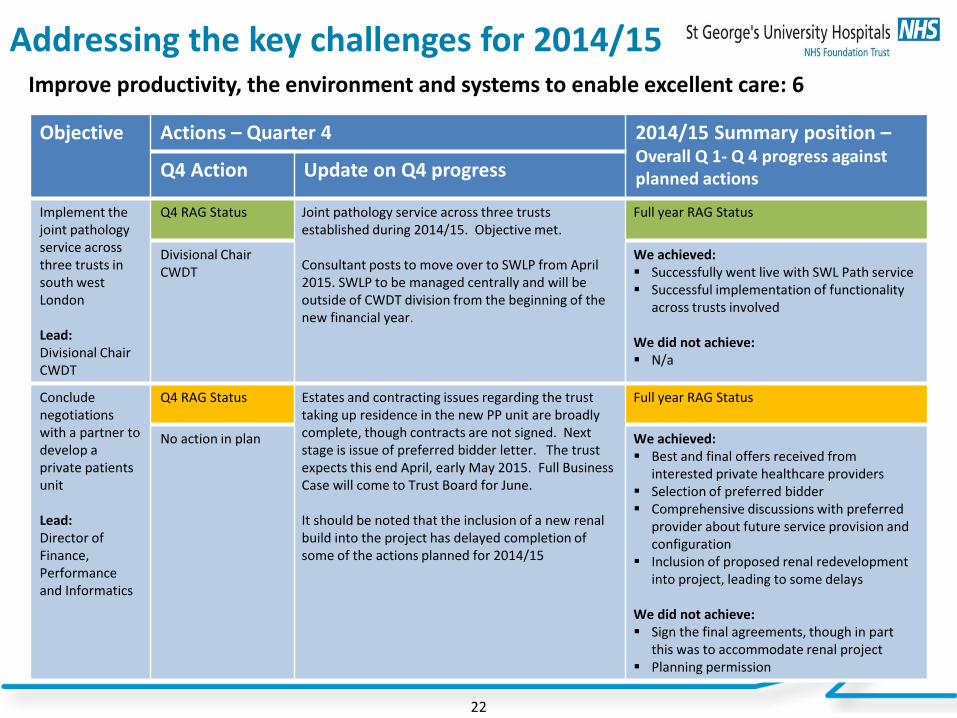
Addressing the key challenges for 2014/15
22
Improve productivity, the environment and systems to enable excellent care: 6
Objective
Actions – Quarter 4 2014/15 Summary position – Overall Q 1- Q 4 progress against planned actions Q4 Action Update on Q4 progress
Implement the joint pathology service across three trusts in south west London Lead: Divisional Chair CWDT
Q4 RAG Status Joint pathology service across three trusts established during 2014/15. Objective met. Consultant posts to move over to SWLP from April 2015. SWLP to be managed centrally and will be outside of CWDT division from the beginning of the new financial year.
Full year RAG Status
Divisional Chair CWDT
We achieved: Successfully went live with SWL Path service Successful implementation of functionality
across trusts involved
We did not achieve: N/a
Conclude negotiations with a partner to develop a private patients unit Lead: Director of Finance, Performance and Informatics
Q4 RAG Status Estates and contracting issues regarding the trust taking up residence in the new PP unit are broadly complete, though contracts are not signed. Next stage is issue of preferred bidder letter. The trust expects this end April, early May 2015. Full Business Case will come to Trust Board for June. It should be noted that the inclusion of a new renal build into the project has delayed completion of some of the actions planned for 2014/15
Full year RAG Status
No action in plan We achieved: Best and final offers received from
interested private healthcare providers Selection of preferred bidder Comprehensive discussions with preferred
provider about future service provision and configuration
Inclusion of proposed renal redevelopment into project, leading to some delays
We did not achieve: Sign the final agreements, though in part
this was to accommodate renal project Planning permission
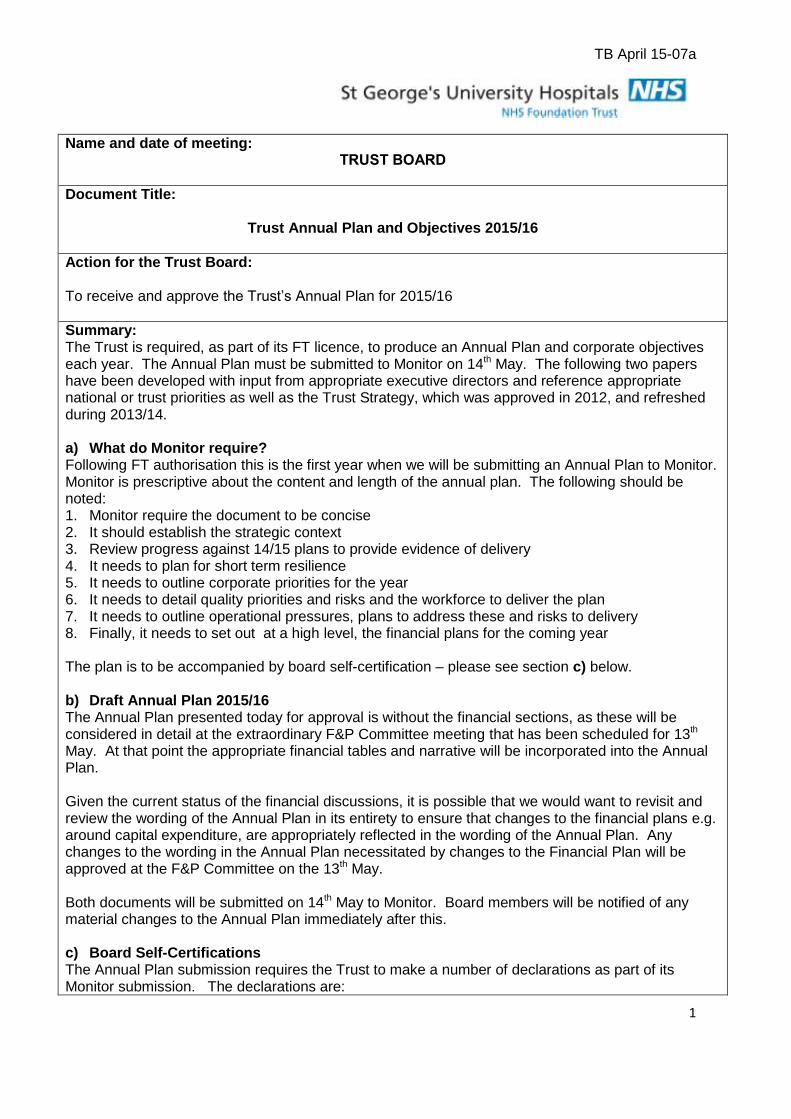
TB April 15-07a
1
Name and date of meeting: TRUST BOARD
Document Title:
Trust Annual Plan and Objectives 2015/16
Action for the Trust Board: To receive and approve the Trust’s Annual Plan for 2015/16
Summary: The Trust is required, as part of its FT licence, to produce an Annual Plan and corporate objectives each year. The Annual Plan must be submitted to Monitor on 14th May. The following two papers have been developed with input from appropriate executive directors and reference appropriate national or trust priorities as well as the Trust Strategy, which was approved in 2012, and refreshed during 2013/14. a) What do Monitor require? Following FT authorisation this is the first year when we will be submitting an Annual Plan to Monitor. Monitor is prescriptive about the content and length of the annual plan. The following should be noted: 1. Monitor require the document to be concise 2. It should establish the strategic context 3. Review progress against 14/15 plans to provide evidence of delivery 4. It needs to plan for short term resilience 5. It needs to outline corporate priorities for the year 6. It needs to detail quality priorities and risks and the workforce to deliver the plan 7. It needs to outline operational pressures, plans to address these and risks to delivery 8. Finally, it needs to set out at a high level, the financial plans for the coming year The plan is to be accompanied by board self-certification – please see section c) below. b) Draft Annual Plan 2015/16 The Annual Plan presented today for approval is without the financial sections, as these will be considered in detail at the extraordinary F&P Committee meeting that has been scheduled for 13th May. At that point the appropriate financial tables and narrative will be incorporated into the Annual Plan. Given the current status of the financial discussions, it is possible that we would want to revisit and review the wording of the Annual Plan in its entirety to ensure that changes to the financial plans e.g. around capital expenditure, are appropriately reflected in the wording of the Annual Plan. Any changes to the wording in the Annual Plan necessitated by changes to the Financial Plan will be approved at the F&P Committee on the 13th May. Both documents will be submitted on 14th May to Monitor. Board members will be notified of any material changes to the Annual Plan immediately after this. c) Board Self-Certifications The Annual Plan submission requires the Trust to make a number of declarations as part of its Monitor submission. The declarations are:

TB April 15-07a
2
1) Declaration of Sustainability - The board declares that, on the basis of the plans as set out in this document, the Trust will be financially, operationally and clinically sustainable according to current regulatory standards in one, three and five years
2) Continuity of services condition 7 - Availability of Resources (Either) a. After making enquiries the Directors of the Licensee have a reasonable expectation that
the Licensee will have the Required Resources available to it after taking account distributions which might reasonably be expected to be declared or paid for the period of 12 months referred to in this certificate. OR
b. After making enquiries the Directors of the Licensee have a reasonable expectation, subject to what is explained below, that the Licensee will have the Required Resources available to it after taking into account in particular (but without limitation) any distribution which might reasonably be expected to be declared or paid for the period of 12 months referred to in this certificate. However, they would like to draw attention to the following factors (as described in the text box in section 4, below) which may cast doubt on the ability of the Licensee to provide Commissioner Requested Services. OR
c. In the opinion of the Directors of the Licensee, the Licensee will not have the Required Resources available to it for the period of 12 months referred to in this certificate.
3) Declaration of interim and/or planned term support requirements – The trust forecasts a requirement for Department of Health (DH) interim support or planned term support for the year ending 31 March 2016
The Monitor submission form is shown on the following page.
Given the issues identified in section b) above, the Board is not being asked to make these declarations at this stage in the process – that will be managed through the extraordinary F&P Committee on 13th May. However, it is felt important that the Board has early sight of these declarations and can provide guidance and instruction for any action that it would like to see taken up to submission on the 14th May. d) Corporate Objectives 2015/16 Linked to the production of an Annual Plan is for a more granular set of Corporate objectives to be delivered during 2015/16. As for 2014/15 these are primarily based on the domains of the Trust Strategy, and have been developed by the appropriate executive director. e) Recommendation The Board is asked to approve the Annual Plan subject to the above.
Author and Date: Tom Ellis Rob Elek 23rd April 2015 General Manager - Strategy Director of Strategy
Contact details: Tel: x3883 E-mail: [email protected]
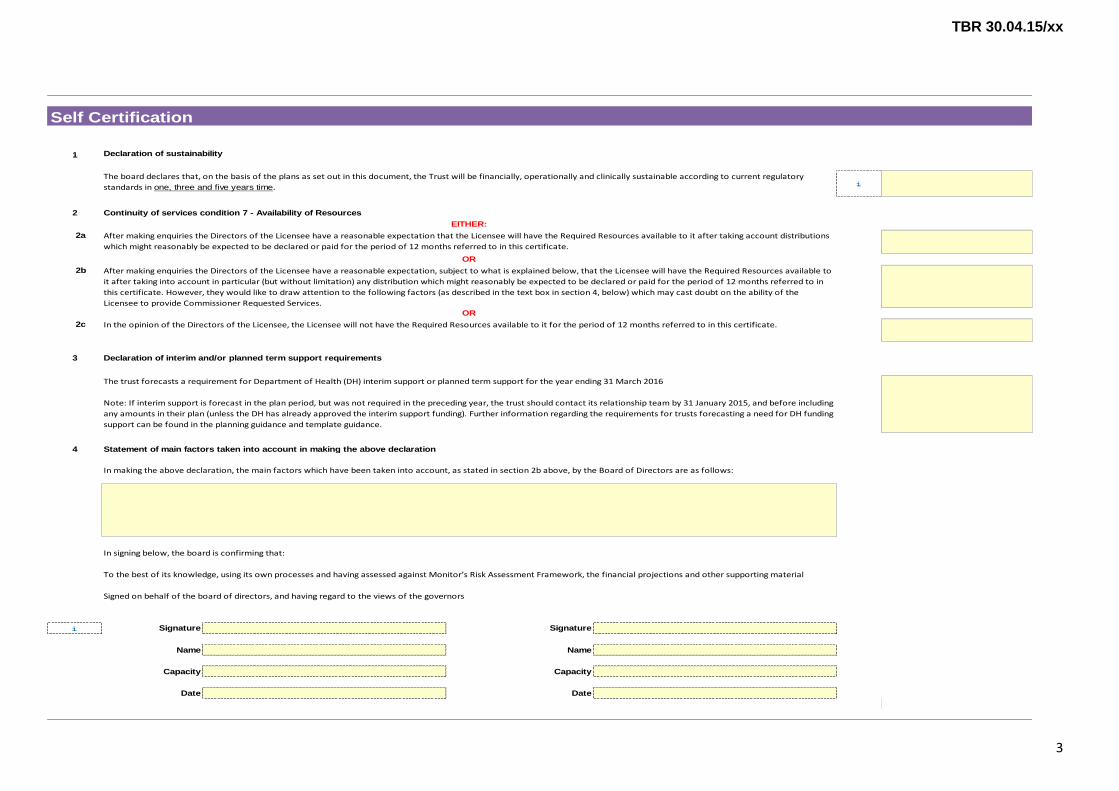
TBR 30.04.15/xx
3
1
i
2
2a
2b
2c
3
4
i Signature Signature
Name Name
Capacity Capacity
Date Date
Signed on behalf of the board of directors, and having regard to the views of the governors
The trust forecasts a requirement for Department of Health (DH) interim support or planned term support for the year ending 31 March 2016
Note: If interim support is forecast in the plan period, but was not required in the preceding year, the trust should contact its relationship team by 31 January 2015, and before including
any amounts in their plan (unless the DH has already approved the interim support funding). Further information regarding the requirements for trusts forecasting a need for DH funding
support can be found in the planning guidance and template guidance.
Statement of main factors taken into account in making the above declaration
In making the above declaration, the main factors which have been taken into account, as stated in section 2b above, by the Board of Directors are as follows:
In signing below, the board is confirming that:
To the best of its knowledge, using its own processes and having assessed against Monitor’s Risk Assessment Framework, the financial projections and other supporting material
Declaration of interim and/or planned term support requirements
Self Certification
Declaration of sustainability
The board declares that, on the basis of the plans as set out in this document, the Trust will be financially, operationally and clinically sustainable according to current regulatory
standards in one, three and five years time.
Continuity of services condition 7 - Availability of Resources
EITHER:
After making enquiries the Directors of the Licensee have a reasonable expectation that the Licensee will have the Required Resources available to it after taking account distributions
which might reasonably be expected to be declared or paid for the period of 12 months referred to in this certificate.
OR
After making enquiries the Directors of the Licensee have a reasonable expectation, subject to what is explained below, that the Licensee will have the Required Resources available to
it after taking into account in particular (but without limitation) any distribution which might reasonably be expected to be declared or paid for the period of 12 months referred to in
this certificate. However, they would like to draw attention to the following factors (as described in the text box in section 4, below) which may cast doubt on the ability of the
Licensee to provide Commissioner Requested Services.OR
In the opinion of the Directors of the Licensee, the Licensee will not have the Required Resources available to it for the period of 12 months referred to in this certificate.

1
OPERATIONAL PLAN 2015-16
Excellence in specialist and community healthcare
2
Contents Page
1. Introduction 3
2. Sustainability 3 2.1 Strategy 3 2.2 Engagement 5 2.3 The External Environment 5 2.4 Future Strategic Direction 6
3. 2014/15 Performance 8 3.1 Five Year Forward View (FYFV) 8 3.2 Corporate Priorities 2014/15 9 3.3 Operational Performance 9 3.4 Quality Performance 11 3.5 Productivity and Efficiency 13
3.5.1 Service Improvement 3.6 Financial performance 13
4. Operational Plan for 2015/16 14 4.1 Corporate Priorities 14 4.2 Quality 17
4.2.1 Quality Improvement Plan for 2015-16 4.2.2 Overview of Existing Quality Concerns 4.2.3 Quality Risks
4.3 Productivity and Efficiency 21 4.3.1 Service Improvement Programme 4.3.2 CIP Programme
4.4 Operational Requirements 22 4.4.1 Demand and capacity 4.4.2 Workforce capacity 4.4.3 Information Communications and Technology (ICT) 4.4.4 Key Risks to Operational Delivery
5. Financial plan 25 Appendix 1 26 Board Declarations

3
1. Introduction St George’s University Hospitals NHS Foundation Trust (the trust / St George’s) is the largest healthcare provider in southwest London, with over 8,000 dedicated staff caring for patients around the clock. St George’s is one of the oldest healthcare organisations in London, founded in 1733 at what is now the Lanesborough Hotel at Hyde Park Corner, before completing our move to Tooting in 1980. The trust provides a full range of acute and community based services for the 560,000 population of Wandsworth, Merton and parts of Lambeth; and is the specialist regional centre for the 2.6 million people of southwest London and Surrey. St George’s also provides a range of supra-regional services such as cardiothoracic medicine and surgery, neurosciences and renal transplantation for significant populations from southwest London, Surrey and Sussex, totalling 3.5 million people. In the delivery of its role as the specialist tertiary centre for south west London, the trust is one of four major trauma centres, and one of only two in London currently with a Helipad, and one of eight hyper-acute stroke units serving London. Our main site, St George’s Hospital in Tooting – one of the country’s principal teaching hospitals – is shared with St George’s, University of London (SGUL), which trains medical students and carries out advanced medical research. St George’s also hosts the St George’s, University of London and Kingston University Faculty of Health and Social Care Sciences, which is responsible for training a wide range of healthcare professionals from across the region. Following an exhaustive process of review and challenge by the NTDA and Monitor, St George’s was authorised as a foundation trust on 1st February 2015, the culmination of many years of sustained improvement in the organisations performance across the widest range of indicators.
2. Sustainability
2.1 Strategy The trust developed its strategy in 2012 and reviewed it in 2013/14. The trust’s Integrated Business Plan (IBP), developed to support the foundation trust application in June 2014, reaffirmed and articulated the organisation’s strategy over the following 5 years. The 10-year strategy defined St. George’s mission, vision and values: Our mission – the primary purpose of the organisation, is “To provide excellent
clinical care, education and research to improve the health of the populations we serve.”
Our vision – what we want to be, is “An excellent integrated care provider and a comprehensive specialist centre for southwest London, Surrey and beyond with thriving programmes of education and research.”
Our values – guiding the way in which we work and the behaviours we would expect to see are:

4
Alongside the values the trust the other guiding principle the Trust looked to when developing its strategy is that of quality, and delivering quality. Patients and service users are at the heart of everything we do. The trust uses the national definition of quality, which is divided into the following three domains: Patient safety; Patient experience and Patient outcomes (clinical effectiveness). The seven strategic goals that will deliver the Trust vision are depicted below
Renowned integrated services enabling people to live at home. We will work with primary care, social care and the third sector to deliver integrated
services for those with long‐term conditions, older people and children, redesigning care pathways to keep more people out of hospital; by 2022 we will:
Be amongst the best for the quality of our community services
Deliver the majority of care for long term conditions at or near home, keeping hospital stays to a minimum
Have joined up hospital, community and social care services with people’s needs at the centre.
Providing the highest quality local hospital care, in the most effective and efficient way We will do this by delivery outstanding hospital care for the local population, with as much of the pathway as possible based out of the hospital; and by 2022 we will:
Be amongst the best for the quality (patient experience, outcomes and safety) of our local hospital care.
An excellent integrated care provider and a comprehensive specialist centre for south west
London & Surrey and beyond with
Thriving research,
innovation and education driving improvements in
clinical care
Providing the highest quality local hospital
care in the most effective and efficient way
A workforce proud to provide excellent care, teaching and
research
A comprehensive regional hospital with outstanding
outcomes
Renowned integrated
services enabling people to live at
home
Transformed productivity, environment and systems

5
Enhanced services and facilities for children and women
Be providing more ambulatory care in a community or home setting
Have played a clinical leadership and partnership role in developing improved, high quality and sustainable local hospital services in southwest London.
Developing a comprehensive regional hospital with outstanding outcomes We are and will be the hospital in London with the widest range of specialist services on one site, uniquely enabling us to look after patients with complex clinical needs; and by 2022 we will:
Be amongst the best fir the quality (patient experience, outcomes and safety) of our specialist care.
Have a dedicated Children’s and Women’s Hospital providing integrated and seamless services.
Have developed clinical academic groups for our expanded cardiovascular and neuroscience services to deliver world class care and research.
Be a renowned centre for specialist surgery, and develop and further improve cancer services.
To support the delivery of the above three strategic objectives, our strategy will also see us develop:
Thriving research, innovation and education driving improvements in clinical care.
A workforce proud to provide excellent care, teaching and research.
Transformed productivity, environment, and systems.
2.2 Engagement We already have in place governance arrangements for patient and public involvement, including a patient reference group, lay members attending key committees and regular reporting from divisions regarding service improvement initiatives involving patients. We also have a lay member as a patient ambassador within our service improvement programme. However we recognise that we can always improve the existing framework and we also recognise the fact that we now have a new model of governance as a foundation trust, including governors and members. We are therefore undertaking a project to assess our current arrangements with a view to developing a new strategy for patient and public involvement and will involve governors and the patient representatives in this process. A key focus for the next year will be developing the Council of Governors and ensuring that they are able to represent the views of members and engage with the Board in a meaningful way. We will also be continuing to implement our membership strategy, to ensure our members are engaged with the trust and a vibrant membership is maintained
2.3 The External Environment The external environment has changed significantly over the last 12 months, with new strategic and quality guidance (Five Year Forward View, Dalton Review, Freedom to Speak Up report), and increased financial and operational pressure on the healthcare sector. On 25th March NHS England (London) and the London CCGs set out plans for their vision to drive the Five Year Forward View (FYFV) and London Health Commission improvements in healthcare. As these plans move forward to the implementation phase, St. George’s would wish to be integrally involved with this as an integrated provider of

6
both acute and community services, and would expect to ensure that the plans are encompassed in the operational priorities for 2015-16. Areas of particular relevance are the plans for:
Preventing ill health and making Londoners healthier o Promoting health in children under 5 including uptake of immunisations o Developing new and stronger local partnerships to promote health,
including with the health workforce and Health and Wellbeing Boards (which links to the implementation of the Wandsworth Health and Wellbeing Strategy)
Giving London’s children the best start in life o Develop effective interface between primary and acute care providers o Ensuring that agreed pan-London standards are met
All Londoners to be able to access the best cancer care in the world o Improve screening uptake with targeted populations o Develop local strategies to deliver chemotherapy closer to home o Ensure delivery of cancer waiting times targets
Transforming London’s urgent care and emergency system o Ensure that the London quality Standards are met o Participate as a leader in the UEC networks to be established
Creating world class specialised care services o Work with commissioners to review and agree pathway changes as
appropriate
Developing London’s workforce to enable transformation of care o Work with commissioners to identify and support workforce productivity
initiatives o Ensure workforce capacity plans are relevant and appropriate
The publication by Monitor and NHS England of the proposed tariffs for 2015-16 represents a significant risk to St. George’s, particularly in relation to the proposals for payment of over-performance of specialised commissioning services; growth of these is a key part of the existing organisational strategy. St. George’s has opted for the default tariff rollover option and the financial planning for 2015-16 is therefore based on this. The key priorities that the Wandsworth Systems Resilience Group will oversee in 2015-16 include:
Delivering sustainable performance in relation to the 95% A&E access standard
The FYFV objective to provide enhance health care services into care homes, including further development of the Trust’s frailty model of care
Ensuring that demand and capacity are aligned across the local health economy These priorities are reflected in the corporate objectives of the organisation.
2.4 Future Strategic Direction The Trust Board has considered the current organisational strategy in light of the changes to the external environment and the financial and operational pressures that the organisation is facing. The Board has taken the view that, whilst the core aims and principles of the strategy remain appropriate, it will be refreshed in 2015/16 to ensure that the changes to the external environment (in particular the tariff generally and the payment regime for specialised services) have been fully considered in determining how the strategy is articulated and implemented. A key part of this refresh will include consideration of how the 5 Year Forward View (5YFV) and the Dalton Review recommendations should be implemented by St.

7
George’s, and the strategic and leadership capability that will be needed for this (which links to the workforce priorities in 2015-16 to develop senior leadership capability). St. George’s is already participating in a buddying scheme with the Shrewsbury and Telford Hospital in relation to cancer patients’ experience of care. This represents a significant quality improvement for St. George’s, as only two years ago the organisation featured as one of the ten lowest performing organisations against the national cancer patient survey itself, and it is now one of the most improved organisations. Once details of the “kitemark” credentialing process proposed in the Dalton Review are finalised, St. George’s would intend to put itself forward to obtain this.
8
3 2014/15 Performance 3.1 The Five Year Forward View The publication of the FYFV in December 2014 provided a framework for St. George’s to build on in relation to the existing strategic objectives of the organisation, particularly in relation to the objective to redesign care pathways to keep more people out of hospital. Co-Creating New Models of Care During 2014-15 St. George’s has worked closely with Wandsworth CCG to review the frailty pathway, resulting in the redesign of the clinical pathway for community adult health services. Phase 2 of this work will be implemented during 2015-16, and although Wandsworth CCG was not successful in its vanguard site application in relation to providing enhanced health care services into care homes, this will be a key part of the redesign work. St. George’s is also working closely with Merton CCG and Merton Local Authority in relation to their integration fund, with a new initiative to be implemented in quarter 1 of 2015-16, which will be to provide specialist Senior Health consultant time into the community. This also links to the providing enhanced health care services into care homes initiative. The South West London Collaborative Commissioning (SWLCC) Programme SWL was a challenged local health economy (LHE), but following the development of a viable 5 year strategic plan in October this designation was removed. The “Making Local Health Economies Work Better for Patients” guidance produced in December 2014 reflects the key challenges that the SWL LHE faces, e.g. the need to secure clinical and financial sustainability; the need to ensure the right capability and capacity is in place to manage complex changes; and the need for strong clinical leadership. The SWLCC is a system-wide programme led by commissioners, but with NHS provider organisations and local authorities also represented and integrally involved. The work of the SWLCC Programme links to the FYFV new approaches to smaller viable hospitals model of care, and a key milestone for this is May 2015, when the acute providers are due to present a proposal for consideration by the SWLCC Board regarding more innovative delivery of acute healthcare across SWL. Engaging Communities A key strand of the Workforce and Organisation Development Strategy implementation plan for 2015-16 links to staff as members of the community. As part of the strategic objective to embed the Trust’s values, ensuring that members of staff are recognised for their achievement and contribution based on the Trust’s values, are able to achieve their maximum potential and wellbeing and that poor behaviours or performance is tackled, are priorities to ensure that:
St. George’s meets the Race Equality standard by: establishing a St. George’s As One steering group; holding a big conversation event as part of the Listening into Action programme; and commissioning further unconscious bias workshops for line managers
A programme to support staff wellbeing is developed: this includes implementing the requirements of the DH Responsibility Partnership status; developing personal resilience support; and evaluating a case to employ a physiotherapist as part of the Occupational Health team.
Accelerating Useful Innovation St. George’s has been designated as a Genomics Medicine Centre in partnership with King’s Health Partners. The organisation has delivered a SWL Pathology Service during 2014-15 in partnership with acute provider partners. These two developments place St. George’s in a prime position to be involved in working with commissioners on further transformation of these services during 2015-16.
9
3.2 Corporate priorities 2014/15 The Annual Plan detailed the key objectives that the Trust set out to deliver during 2014/15. 2014/15 was an extremely busy and productive year, our performance across the majority of the priority areas has generally been good, with significant achievements being made across a broad and ambitious range of targets, as shown in the table on the following page. This shows that against the 9 major themes, linked to the strategic objectives of the trust, the trust has rated itself as green on 6 of them, and amber on 3. Overall this shows positive delivery by the trust against a wide range of complex and challenging actions over the course of the year. We achieved Foundation Trust status and have made good progress towards our strategic goals; however, we have not delivered what we set out to achieve in all areas. This is in part due to the range of actions we set ourselves, as well as in-year pressures and reprioritisation that by their nature would impact on delivery. There are also some objectives and actions where we simply have not made sufficient progress despite our best efforts. The key areas where we have not performed as well as we would have like include:
Aligning capacity to clinical need (bed and theatre capacity); though this was within the context of a significant ageing of the patient profile with more complex needs and a longer length of stay.
The delivery of business cases (both in approval and implementation terms) has been slower than anticipated, partly due to complexity and volume, though we are now in the process of revising our prioritisation processes.
The summary annual plan dashboard is presented on the following page.
3.3 Operational performance As anticipated, 2014/15 was operationally challenging with a continued, though higher than anticipated, rise in non-elective demand and continued growth in elective demand. Additional planned bed and staff capacity was brought on line during the year to support this increased demand and to off-set existing high levels of bed occupancy however this, together with important improvements we made in our emergency flow model, were not sufficient to sustain the successful delivery of the A&E 4-hour operational standard that we achieved in the first half of the year through into the second half of the year. Disappointing performance in Q3 and 4 was also common with the NHS across London and the rest of the UK. One of the drivers of under-delivery was a significant shift in the complexity of patients, towards a more elderly group, including a 9.4% rise in the number of patients over 70 attending the emergency department (against a south west London average of 3.3%) and a 14.2% rise in the number of patients over 70 being admitted as emergencies. This placed an exceptional demand on the trust’s bed capacity through a significant increase in occupied bed days, which had not been forecast by the trust or its commissioners going into the year. In quarter three the trust was also a set, like the wider NHS by an exceptional pressure caused by an early and unusual flu pattern, which was not covered by the vaccine. The pressures on non-elective pathways also impacted significantly on our elective programme, reducing our available capacity for elective services in Q3 and Q4. Consequently following a 25% reduction in our 18-week Referral to Treatment (RTT) backlog during the first half of the year, this backlog rose again during the latter half of the year bringing the trusts backlog to levels equal to the start of the financial year.
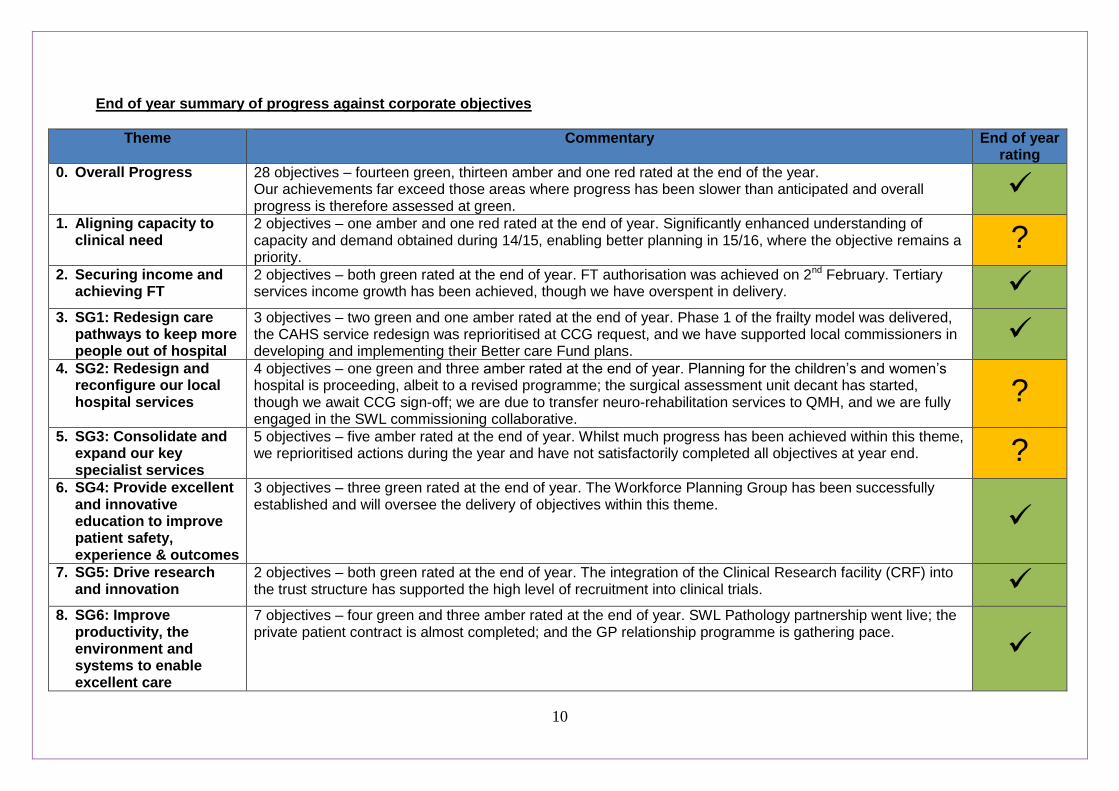
10
End of year summary of progress against corporate objectives
Theme Commentary End of year rating
0. Overall Progress 28 objectives – fourteen green, thirteen amber and one red rated at the end of the year. Our achievements far exceed those areas where progress has been slower than anticipated and overall progress is therefore assessed at green.
1. Aligning capacity to
clinical need 2 objectives – one amber and one red rated at the end of year. Significantly enhanced understanding of capacity and demand obtained during 14/15, enabling better planning in 15/16, where the objective remains a priority.
? 2. Securing income and
achieving FT 2 objectives – both green rated at the end of year. FT authorisation was achieved on 2nd February. Tertiary services income growth has been achieved, though we have overspent in delivery.
3. SG1: Redesign care pathways to keep more people out of hospital
3 objectives – two green and one amber rated at the end of year. Phase 1 of the frailty model was delivered, the CAHS service redesign was reprioritised at CCG request, and we have supported local commissioners in developing and implementing their Better care Fund plans.
4. SG2: Redesign and
reconfigure our local hospital services
4 objectives – one green and three amber rated at the end of year. Planning for the children’s and women’s hospital is proceeding, albeit to a revised programme; the surgical assessment unit decant has started, though we await CCG sign-off; we are due to transfer neuro-rehabilitation services to QMH, and we are fully engaged in the SWL commissioning collaborative.
?
5. SG3: Consolidate and expand our key specialist services
5 objectives – five amber rated at the end of year. Whilst much progress has been achieved within this theme, we reprioritised actions during the year and have not satisfactorily completed all objectives at year end. ?
6. SG4: Provide excellent and innovative education to improve patient safety, experience & outcomes
3 objectives – three green rated at the end of year. The Workforce Planning Group has been successfully established and will oversee the delivery of objectives within this theme.
7. SG5: Drive research and innovation
2 objectives – both green rated at the end of year. The integration of the Clinical Research facility (CRF) into the trust structure has supported the high level of recruitment into clinical trials.
8. SG6: Improve productivity, the environment and systems to enable excellent care
7 objectives – four green and three amber rated at the end of year. SWL Pathology partnership went live; the private patient contract is almost completed; and the GP relationship programme is gathering pace.

11
3.4 Quality performance The Trusts Quality Improvement Strategy (QIS) - 2012-17 – is designed to drive Quality Improvement, underpinned by three supporting domains namely Patient Safety, Patient Experience and Patient Outcomes. As well as local quality aspirations, the trust has taken account of the Francis report, the Berwick Report and Dalton review in framing its quality agenda, and continues to seek to build on the “Good” overall rating obtained from the HM Inspector of Hospital’s CQC inspection undertaken in February 2014. The QIS annual plan agreed by the Board for 2014/15 and followed through within the Quality Account detailed a number of key priorities that would be monitored during 14/15. These priorities were contained within the QIS. The table below indicates progress that has been made against the priorities since the publication of the 2013/14 Quality Account:
Improvement priority for 2014/15
Progress as of March 2015
Conduct twice yearly nursing and midwifery reviews as recommended in the National Quality Board report ‘how to ensure the right people, with the right skills, are in the right place at the right time.’
Establishment Review completed in May, recommendations agreed by the Board with all bar one implemented during 2014/15.
Further Acuity/ Dependency Review undertaken in autumn of 2014.
Safe Staffing Framework in place and amended to include “Red flag” indicators
Monthly reporting to Board in place regarding safe staffing
Nursing / Midwifery Workforce Programme in place since August 2014 to support the forward planning for recruitment and retention of staff and the commissioning of additional operational capacity during the year.
To ensure that we implement the recommendations of the Clwyd/Hart review of the complaints system in hospitals to further strengthen our response to patient complaints, learn from their feedback and use as a means to implement improvements.
Work undertaken to strengthen the complaints function including performance management for response time and to ensure evidence of learning from complaints.
Participation in National Patient Surveys for Inpatient, Maternity and Paediatric Settings. Final results awaited for some surveys and work to focus on response to findings.
National Cancer Patient Survey results received indicating that SGH was one of the 10 most improved Trusts. Responses to findings now agreed and being implemented.
Annual community patient survey (Sept 2014) outcomes reviewed with action plans at DGB.
Strengthening of use of Family Friendly test with FFT now in place across Inpatient, Emergency Department, Midwifery settings. A Trial of the Medication Safety Thermometer also completed. Focus on triangulation of commentary with Complaints/ Compliments data. FFT feedback and data being displayed, actions taken. ED have marked uptake in responses using SMS service.

12
To ensure that we meet the ‘Duty of Candour’ requirements and make sure we continue to endorse and develop a culture of openness and transparency.
Report produced to identify current practice and challenges. Monthly reports being collated to indicate compliance with Duty of Candour.
Master classes held to raise awareness with senior clinicians and support good practice with Patients.
To ensure we focus on improving the experience of patients visiting our outpatient departments.
Roll out of E-triage began Feb 2015.
Capacity and demand analysis completed across specialities,
Refurbishment of estate to commence April 2015 including improved signage, new furniture installed in clinic rooms, metro newspapers available in clinics,
patient experience training delivered to call centre and clinic administrative staff March 2015, training opportunities advertised to staff,
Successful recruitment of permanent staff, on-going staff forums. Roll out of FFT in April 2015.
To continue to focus on reducing avoidable grade 3 and 4 pressure ulcers, implementing the Sepsis Care Bundle to improve care of patients with severe sepsis and improving our discharge process.
Patients admitted with sepsis from the ED are regularly audited to identify MISSED (Mortality In Severe Sepsis in the ED) this is reported at the sepsis group
The trend for grade 3 and 4 pressure ulcers is showing a downward trajectory.
To maintain our commitment to improving end of life care.
Programme board established with agreed scope to take forward trust-wide actions to implement NICE standards and five priorities (which replaced Liverpool Care Pathway).
Audit of Palliative Care activity completed during the year with presentation to key committees.
Development of New Care Plan for patients.
To establish the dementia and delirium team to meet the national CQUIN requirements, embed the ‘butterfly’ scheme and improve the care of this vulnerable group of patients.
Full nursing team recruited and have to date met all CQUIN targets for 2014/15.
Dementia and Delirium Guidelines updated.
Dementia training Roll Out
13
3.5 Productivity and Efficiency The trust recognises that with the continued efficiency requirements that the health sector needs to deliver, that continuing to deliver efficiencies without having a significant and adverse impact on quality will not be possible without taking a holistic approach to cost and service improvement. The Trust has a robust and well-established approach to delivery of the productivity and efficiency challenges, overseen by Programme Management Offices for the CIP Programme and the Service Improvement Programme. 3.5.1 Service Improvement During 2014/15 the Trust’s service improvement programme has delivered quality and capacity improvements in a number of pathways, including frailty, community adult health services and breast, and managed the implementation of much needed capacity schemes. Programme resources were embedded within clinical divisions and delivered around 15 beds worth of capacity, which was some way short of the original 57 bed aspiration due to weaknesses in project planning and clinical engagement. This was also compounded by a change in the age profile of patients attending the emergency department and a 15% increase in the number of over 70 year old patients admitted as emergencies, and an increase in average length of stay due to patient complexity. This shift had not been foreseen and therefore was not factored into commissioners or Trust plans. For 2015/16 improvement programme resources have been brought under direct central control and will focus on three key areas:
Undertaking a trust wide Service Line Review - to ensure the sustainability of the Trust by reducing the cost base of services by circa £100 million over three years. This programme is led by the Director of Delivery and Improvement
Improving non-elective flow and discharge. This programme is led by the Chief Nurse.
Improving elective capacity and its management – particularly in outpatients and theatres and across the RTT pathway. This programme is led by the Director of Delivery and Improvement.
3.6 Financial Performance TO BE COMPLETED
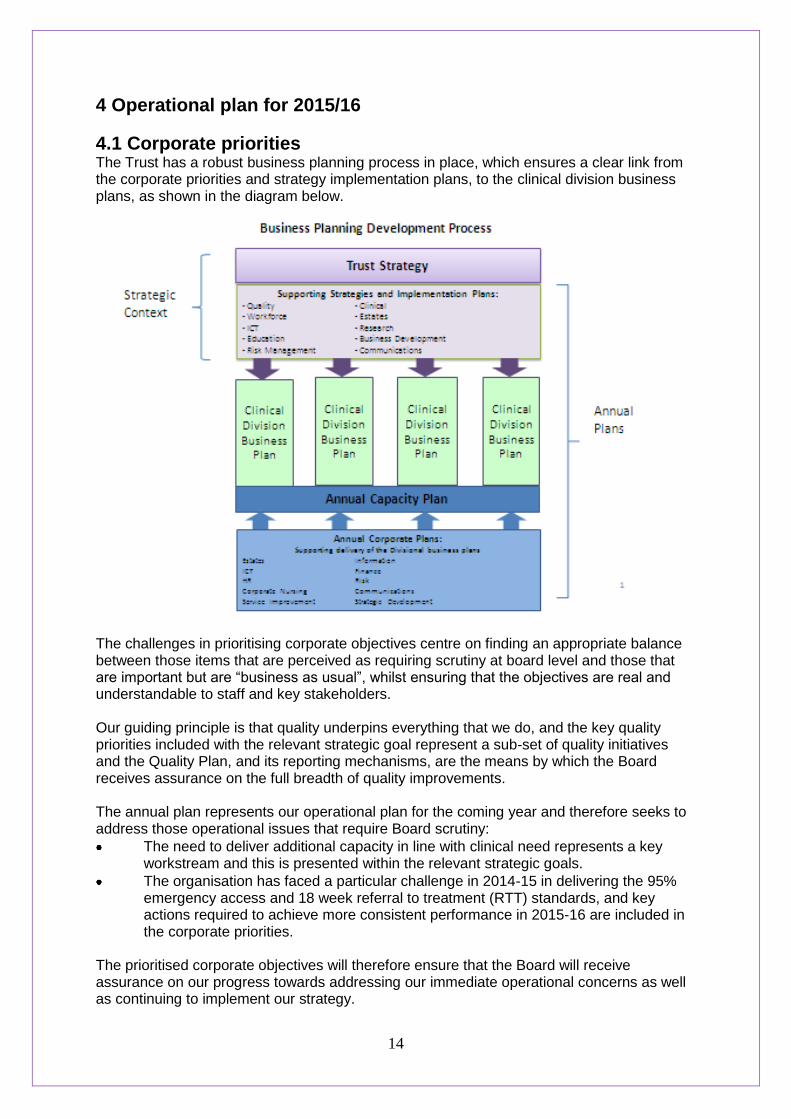
14
4 Operational plan for 2015/16
4.1 Corporate priorities The Trust has a robust business planning process in place, which ensures a clear link from the corporate priorities and strategy implementation plans, to the clinical division business plans, as shown in the diagram below.
The challenges in prioritising corporate objectives centre on finding an appropriate balance between those items that are perceived as requiring scrutiny at board level and those that are important but are “business as usual”, whilst ensuring that the objectives are real and understandable to staff and key stakeholders. Our guiding principle is that quality underpins everything that we do, and the key quality priorities included with the relevant strategic goal represent a sub-set of quality initiatives and the Quality Plan, and its reporting mechanisms, are the means by which the Board receives assurance on the full breadth of quality improvements. The annual plan represents our operational plan for the coming year and therefore seeks to address those operational issues that require Board scrutiny:
The need to deliver additional capacity in line with clinical need represents a key workstream and this is presented within the relevant strategic goals.
The organisation has faced a particular challenge in 2014-15 in delivering the 95% emergency access and 18 week referral to treatment (RTT) standards, and key actions required to achieve more consistent performance in 2015-16 are included in the corporate priorities.
The prioritised corporate objectives will therefore ensure that the Board will receive assurance on our progress towards addressing our immediate operational concerns as well as continuing to implement our strategy.

15
The priorities identified by the Board for 2015-16, with the key outcomes, are:
Delivery of the strategic plan The changes in the external environment, and our operational and financial performance, present new challenges and opportunities; in order to respond to these we will:
o Complete a review of the current strategy to determine whether it remains robust; and / or whether the objectives to deliver the strategy remain appropriate.
o Undertake a strategic options appraisal for all services o Review all recent investment decisions. o Agree a shortlist of 'big ideas' for alternatives to service delivery and/or
organisation configuration and partnerships.
We will continue to implement the existing strategy, particularly with respect to external stakeholders and will:
o Work with CCGs and local authorities to implement new models of care for community adult health services, complete the redesign of services for frail older people, and support the implementation of local health & wellbeing strategies.
o Further develop new methods for service delivery and our network of care in accordance with the Dalton Review, 5YFV and the Southwest London Commissioning Collaborative programme.
o Increase the close working between St George’s, University of London and the trust through the Joint Implementation Board by developing Clinical Academic Groups, preparing for the NIHR clinical research bid, and increasing the numbers of patients recruited to clinical studies.
Quality In order to continue to maintain and improve the quality of our services, we will:
o Review how we involve and listen to our patients by refreshing our patient and public engagement strategy
o Ensure delivery of safe clean environments and use of patient feedback as a vehicle for continuous improvement and adoption of best practice.
o Create reliable processes for reducing avoidable harm, for example around follow up of diagnostic tests, and implement a framework which will mitigate risk to an acceptable position.
o Further develop and implement our Quality Improvement Strategy, for example commence “Sign Up to Safety Programme”.
o Redesign our cancer services in partnership with Macmillan cancer support. o Publish key clinical quality and safety data o Evaluate clinical audit results and act on findings to ensure audit contributes to
improvements for patients. o Continue to implement our IT Strategy by further deploying electronic clinical
records, electronic prescribing, document management systems and the new e-referral system.
Provision of additional capacity In order to secure operational performance, and to support the delivery of the strategy, we will:
o Deliver a phased programme of works to provide additional bed and theatre capacity through the year.
o Continue to progress the Women and Children’s project. o Commence construction for our new renal / specialist services expansion project. o Consider how we can release capacity and / or improve productivity, for example
by working closely with the SW London Commissioning Collaborative programme

16
and its Acute Provider and Out of Hospital workstreams, and delivering an outpatient strategy.
Financial viability In order to secure our financial viability we will:
o Identify and deliver CIPs to the levels planned in the 2014 IBP / LTFM. o Restructure the trust's cost base, reimbursement and / or service portfolio to deal
recurrently with pressures beyond this level of CIP. o Strengthen liquidity to maintain cash balances of 15 days expenditure. o Revise the capital financing strategy to ensure commitment of internally
generated capital can only be made once the cash has been generated, and that an affordable borrowing limit is established for the Trust within which cases can be approved for individual schemes.
o Develop a pipeline of new income opportunities, including market share growth for NHS services, and commercial and research projects.
Workforce and leadership To support the delivery of these priorities we will ensure that we have the right workforce and leadership in place by continuing to implement our Workforce Strategy and will:
o Implement an organisational development programme. o Develop an agreed St George’s leadership style, and implementing an
accreditation and assessment programme for our clinical, operational and management leaders.
o Develop and implement a programme to support a flexible workforce working across historic professional and organisational boundaries.
These priorities have been turned into more detailed objectives that the Board will oversee delivery of, with quarterly reporting of progress to the Board. As the annual plan is the primary implementation vehicle for the strategy, these detailed objectives are presented within the context of our seven strategic goals and are annexed to this plan. The more detailed strategy implementation plans have also been approved by the relevant Board sub-committees, which will also receive a regular report of progress.

17
4.2 Quality Quality underpins everything the trust does. The delivery of the highest quality patient care is central to St. George’s Mission “To provide excellent clinical care, education and research to improve the health of the Populations that we serve”. The Quality Improvement Strategy (2012-17) is based on the three central strands of quality of care: Patient Safety, Patient Experience, Patient Outcomes (clinical effectiveness). It is aligned with the overall Trust Strategy.
4.2.1 Quality Improvement Plan for 2015-16 The quality improvement plan priorities are taken from a range of sources, including national priorities, commissioner priorities, Board priorities and clinical services priorities. The plan is developed and agreed with input from both internal and external stakeholders, including the newly established Council of Governors. Final approval of the plan sits with the Quality and Risk Committee, a Board sub-committee with delegated authority from the Trust Board. Local commissioning quality initiatives will be part of the on-going contract discussions with commissioners, as the Trust has opted for the default tariff rollover (DTR), and the usual CQUIN payments do not apply as part of this. At this moment in time, in line with other DTR funded trusts, St. George’s is in discussion with commissioners about how quality indicators and tariffs will function during 2015/16. Notwithstanding the CQUIN issue, the key quality priorities for St. George’s in 2015-16 are: Patient Safety
Implement Learning from Surgical/ Obstetric Never events to enhance safer surgery
Extend work in relation to the early detection and escalation of patient deterioration
Strengthen Ward level data to support appropriate oversight and decision making by clinical teams
Expand the profile of the Safety Thermometer to strengthen improvement programmes by supporting teams in addressing their most frequent themes
Enhance learning by improving staff feedback when they have reported incidents
Support the flow programme by linking with the programme to improve safety metrics
Reduce avoidable harm by introducing the sepsis care bundle and reducing avoidable grade 3 and 4 pressure ulcers
Support the Development of Care Group Clinical Leads
Develop systems to support staff to deliver the contractual Duty of Candour
Ensure there is a robust system in place for follow-up of diagnostic test results
St. George’s is already involved in the Sign up to Safety Campaign and this will continue to be part of the “business as usual” quality objectives for the clinical divisions. In addition, the organisation will continue to make progress against the clinical standards for seven day services, as agreed with commissioners. Patient Experience
Roll out the Friends and Family Test to outpatients, day surgery and Community Services and act on feedback supported by National Patient Survey information.
Introduce a Dementia and Delirium Team and continue to embed the Butterfly scheme.
Ensure compassionate care at the end of life is supported and monitored closely following the withdrawal of the Liverpool Care Pathway.
Improve the patient experience in the outpatient department
To be able to evidence the changes and improvements made as a result of patient feedback and see an improvement in feedback as a result of actions taken; and ensure that patient complaints are responded to within the required standards.
18
To continue to undertake a regular programme of audit and surveys relating to privacy, dignity and other indicators using the outputs to support sustainable improvements in patients experience.
Patient Outcomes (Clinical Effectiveness)
Each Division will have a prioritised programme of local and national clinical audit activity with results, actions and outcomes registered centrally with the clinical audit team. This programme will encompass national, local and Trust-wide priorities
Carry out investigations and act on findings in all areas where mortality appears to be higher than expected as derived from monthly Dr Foster Benchmarking and data from other sources
Provide transparency on outcomes by publishing consultant level activity data, clinical quality measures and survival rates from all nationally agreed audits
Looking forward, there are a number of additional quality priorities that the organisation will need to implement during 2015-16, such as the outcome of the NHS England review of maternity services, which is expected to recommend choice for maternity care; plus the expected revised national cancer strategy.
4.2.2 Overview of Existing Quality Concerns St. George’s received the new format CQC Chief Inspector of Hospitals inspection in February 2014. The organisation received an overall rating of good across all services, with a rating of outstanding for adult critical care services against all five CQC domains, and a rating of outstanding for maternity services for the ‘caring’ domain. There were two issues of non-compliance identified as a result of the visit, requiring mandatory action, in relation to the ‘safe’ domain:
Mental capacity act: people who use services and others were not protected against the risks associated with obtaining the consent of patients with limited capacity, as not all relevant staff understood the requirements of Mental Capacity Act 2005 and how this relates to vulnerable adults in terms of best interest decisions and informed consent.
Corporate out-patient services: people who use services and others were not protected against the risks associated with not having medical records available in the outpatient department to provide appropriate care based on previous history.
An action plan was put in place to address the two identified issues of non-compliance. All actions have now been completed, however monitoring the effectiveness of these actions will continue in line with good practice. The compliance action plan was presented to commissioners in January 2015, alongside the improvement action plan to address issues where the CQC recommended that action should be considered (non-mandatory actions) e.g. regular safe staffing reports, tracker to monitor actions arising from adverse incidents, discharge and patient flow workstream, and end of life care improvement programme. Commissioners have confirmed that they consider the Trust has provided good assurance in relation to progress of both action plans, and agreed to close down the specific review meeting established to review progress. The effectiveness of both plans will now be monitored on an on-going basis through existing governance meetings and processes (e.g. the Clinical Quality Review Meetings).
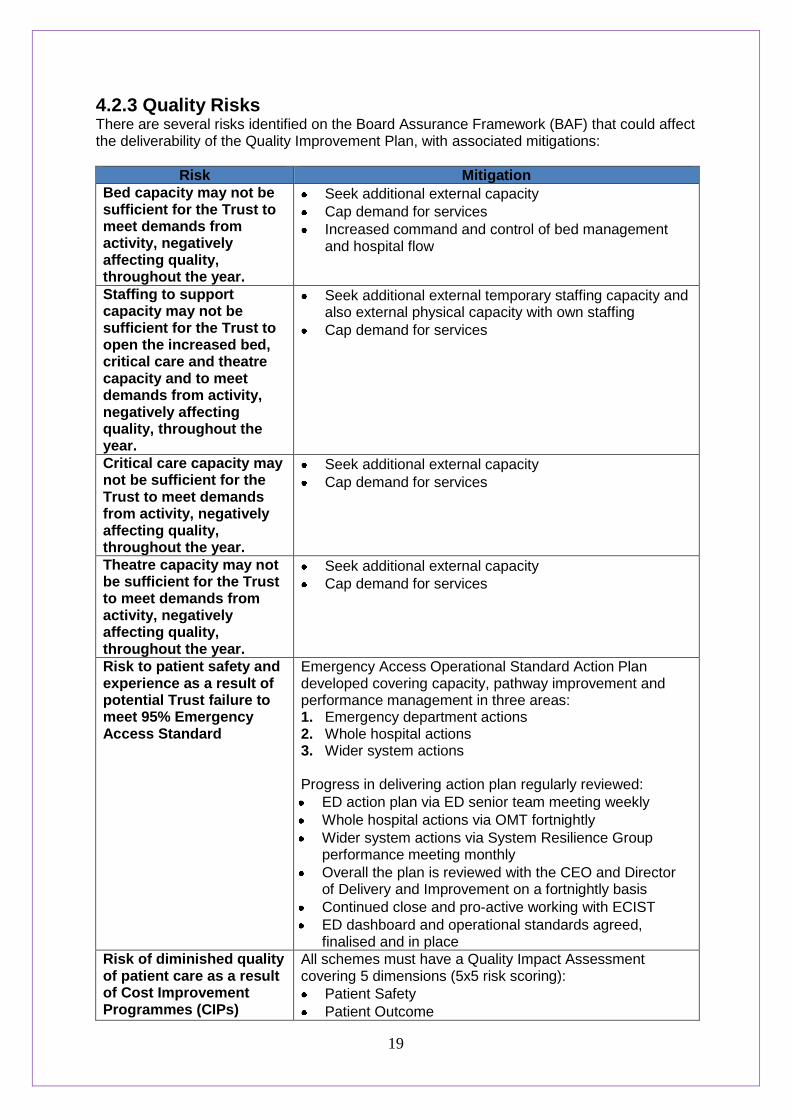
19
4.2.3 Quality Risks There are several risks identified on the Board Assurance Framework (BAF) that could affect the deliverability of the Quality Improvement Plan, with associated mitigations:
Risk Mitigation
Bed capacity may not be sufficient for the Trust to meet demands from activity, negatively affecting quality, throughout the year.
Seek additional external capacity
Cap demand for services
Increased command and control of bed management and hospital flow
Staffing to support capacity may not be sufficient for the Trust to open the increased bed, critical care and theatre capacity and to meet demands from activity, negatively affecting quality, throughout the year.
Seek additional external temporary staffing capacity and also external physical capacity with own staffing
Cap demand for services
Critical care capacity may not be sufficient for the Trust to meet demands from activity, negatively affecting quality, throughout the year.
Seek additional external capacity
Cap demand for services
Theatre capacity may not be sufficient for the Trust to meet demands from activity, negatively affecting quality, throughout the year.
Seek additional external capacity
Cap demand for services
Risk to patient safety and experience as a result of potential Trust failure to meet 95% Emergency Access Standard
Emergency Access Operational Standard Action Plan developed covering capacity, pathway improvement and performance management in three areas: 1. Emergency department actions 2. Whole hospital actions 3. Wider system actions Progress in delivering action plan regularly reviewed:
ED action plan via ED senior team meeting weekly
Whole hospital actions via OMT fortnightly
Wider system actions via System Resilience Group performance meeting monthly
Overall the plan is reviewed with the CEO and Director of Delivery and Improvement on a fortnightly basis
Continued close and pro-active working with ECIST
ED dashboard and operational standards agreed, finalised and in place
Risk of diminished quality of patient care as a result of Cost Improvement Programmes (CIPs)
All schemes must have a Quality Impact Assessment covering 5 dimensions (5x5 risk scoring):
Patient Safety
Patient Outcome

20
Patient Experience
Staff welfare
Financial impact These are subject to local governance scrutiny and approval, at care group, directorate and divisional level. Clinical Governance Group (CGG) chaired by Medical Director – all schemes with risk score > 12 referred for consideration for approval by CGG. CGG reports exceptional risks to Quality and Risk Committee. Clinical Divisions make a self-declaration upon management of schemes not presented to CGG
Failure to sustain the Trust response rate to complaints
Weekly spread-sheet detailing care group response times circulated and included as a measure within the divisional performance scorecard.
LEAN review of complaints process.
Greater oversight of complaints by DDNGs
Regular reporting via PEC, QRC & Trust Board.
Risk rating system implemented to identify high risk complaints.
Complaints action plan in place from November 2014 focussing on 5 key areas to ensure improved turnaround of complaints but also to strengthen learning and organisation capacity to deal with complaints.
Trust performance reviewed by PEC every 2 months and reported to Trust Board monthly
Risk to patient safety due to inconsistent processes and procedures for the follow up of diagnostic test results
All doctors have been reminded of their responsibility for ensuring that tests that they order are followed up by Medical Director.
All Care Groups have been asked to develop Standard Operating Procedures to ensure that this happens.
All serious incidents resulting from failure to follow up tests have been reviewed and themes reported to Divisions.
Radiology have strengthened their safety net system. This now includes e mail to MDT for unexpected cancer (cancer MDTs are working through their responses to these alerts).
Cerner order comms system has ability to undertake and record result endorsement for tests organised via order comms.
Project group set up including IT, operations and service improvement to improve process of results endorsement on Cerner and roll its use out in Trust.
The most significant risks on the BAF are reported to the Trust Board on a monthly basis, and a system of ‘deep dive’ reviews into all risks on the BAF has been agreed with the Quality and Risk Committee (QRC), to ensure all risks are reviewed over a 12 month period. QRC is also responsible for specifically overseeing all risks related to quality.

21
4.3 Productivity and Efficiency
4.3.1 Service Improvement Programme The Service Improvement Programme’s primary focus in 2015-16 will be on creating capacity, which is one of the Trust’s most significant risks to operational resilience. Modelling indicates that there is a need for c.£18m of cost improvements in 2015-16 through creating capacity: both through undertaking current activity levels within less resource and through generating a margin on any additional activity through increased efficiency. This will require the creation of an additional 90 beds or the release of the same through length of stay improvements. The agreed focus for 2015-16 is on four key areas:
Reducing the amount of time from admission to first consultant ward round
Implementing 7 day consultant ward rounds for all patients within medical wards
Daily tracking through iCLIP of all patients’ fitness for discharge against their expected date of discharge, supported by key performance indicators and dashboards to indicate where management intervention is required.
Continued focus on pre-11am discharges to ensure beds are available when patients The capacity modelling and indicative capacity gap have been discussed with commissioners who have indicated they are supportive of the approach the Trust has taken and the key findings. There will be further discussion with commissioners re. the financial implications of the capacity planning and capacity requirements within the context of agreeing the 2015-16 contract.
4.3.2 CIP Programme The trust CIP programme comprises a number of central workstreams as well as local divisionally run savings schemes. The Trust has a PMO which reviews all CIP schemes and applies a RAG rating to inform the board on how robust the CIP programme is. The key components are:
Workstream Focus
Procurement run by our Procurement team who renegotiate up-coming contracts and use a Basket of Goods analysis to provide information related to number of suppliers and spend across the whole Trust for given items, which will be used to identify the potential for the Trust to obtain volume discounts
Medicine Management
Opportunities to be exploited include review of existing contracts, return and reuse of prescribed medicines, and increased use of community prescribing
Commercial This includes expansion of private patient business, training and other non-NHS activity
Workforce These are mainly enabling projects which change the level of resourcing the divisions require to deliver the same levels of activity. The key themes relate to:
Recruitment: time to recruit, e-recruitment
Temporary staff: Trust policy, use of staff bank
Medical staff efficiencies: clinical excellence awards, programmed activity
Sickness absence management
Others: medical secretaries, apprenticeship schemes
Corporate Back Office
a review of the Corporate back office to determine where transformational changes could be initiated and costs reduced accordingly

22
Other Divisional
this is the trusts main workstream. Each budget holder must seek out cost reduction schemes to meet their targets. The schemes in Other divisional will be a mixture of the drawdown of enabling workstreams such as Workforce, a direct drawdown of the Medicines and Procurement workstreams as well as range of specific schemes delivered by the budget holders. These range from skill mix review and change projects to spend controls and run-rate schemes
4.4 Operational Requirements
4.4.1 Demand and capacity During 2015/16 we anticipate growing as a Trust to deal with an increase in population and population aging combined with the need to increase our run rate to deal with increases in demand driven largely by a growth in non-elective activity and by specialist elective activity. Overall, we anticipate an approximate 5% growth in non-elective activity levels and a 6% growth in elective activity levels in 2015/16. This growth is broadly in line with our integrated business plan and our long term financial model and underpinned by our overarching strategy to be both a community provider, a local hospital secondary care provider and a specialist centre serving South West London and Surrey. Working closely with our Clinical Commissioning Group and NHS England Commissioning colleagues we have developed a joint demand activity and capacity plan for 2015/16 covering beds, theatres, outpatients and, to a lesser extent, other support services. This plan responds to the increase in activity expected due to demographic growth, a planned reduction in RTT backlogs and a desire by the Trust and Commissioners to reduce hospital bed occupancy to 90% as a way of supporting delivery particularly of the Emergency Department for our operational standard. This work has identified a current bed gap within the Trust of circa 90 beds which is approximately 10% of our general and acute hospital bed base. It has also identified a need for an approximate 10% increase in operating theatre sessions undertaken per week to deal with increased activity levels anticipated and to ensure improved capacity for emergency paediatric (CEPOD) activity. The Trust and its partners have identified a number of potential schemes to close the bed capacity gap during 2015/16. This includes continuing with implementation of some existing physical new ward schemes on the St George’s Hospital site, together with a range of schemes to increase capacity in the Community through a “St George’s at …” model. This continues the trend over the last year of increasing bed capacity off the St George’s site due to the current physical constraints on the hospital site. We are currently finalising discussions with Commissioners around which schemes implement given both the overall financial envelope and the lead-in time required. Implementation risks are being mitigated through working with tried and tested partners with experience in developing and implementing and running some of these types of schemes. In 2015/16 we anticipate being able to increase our number of theatre sessions per week by around 8% through increased evening and weekend working. Staffing for these sessions has been secured through both recruitment and through reaching agreements with staff to work additional hours. Part of the increase in theatre capacity will be achieved through the introduction of an additional theatre in September time particularly to support an increase of cardiac activity. During the development of this work, some work will continue to be done off-site through local independent sector hospitals. Given difficulties in 2014/15 the Trust and Commissioners are currently undertaking a contractual Joint Investigation into sustainable delivery of the 4 hour emergency standard
23
and the 18 week elective referral to treatment NHS constitution commitment. This investigation is looking at 5 drivers for the emergency standard (in-ED flow; the acute medical unit model; in-hospital bed capacity and flow; discharge; and structural/data issues) and 2 drivers for the RTT standard (capacity and demand; and booking). The Trust is working with neighbouring hospitals to potentially utilise additional bed and theatre capacity on their sites to support reductions in the overall size of the Trusts RTT admitted waiting list, and also potentially for some specific adjustments to non-elective pathways within a hub and spoke model. Discussions are progressing well at this stage. The Trust has identified that it has a 90 bed challenge in 2015-16, which will be met through a combination of building additional physical capacity on-site, utilising off-site capacity, and service improvement schemes to realise potential length of stay efficiencies. The capacity requirements have formed a key part of discussion with commissioners as part of the contract negotiations for 2015-16, with the key service developments under discussion including:
Additional clinical decision unit capacity
Surgical assessment unit
Neurosurgery expansion
Trauma and orthopaedic expansion
Increased ICU beds
Spinal cord rehabilitation
Neuro-rehabilitation beds to be provided at Queen Mary’s Hospital
4.4.2 Workforce Capacity There are five elements to the workforce and organisational development strategy action plan for 2015, which has the overall aim of developing a highly skilled, motivated and engaged workforce. The five overall objectives are:
Developing leadership behaviours to deliver high quality care – including supporting the development of the executive team, the development of a leadership development programme, ensuring that incremental progression based on performance is embedded and making Listening into Action the ‘way we do things at St George’s’.
Supporting the organisational development of the divisional governance structures by undertaking a review of the barriers to team working.
Embedding the trust’s values through tackling poor behaviour and bullying, meeting the requirements of the workforce race equality standard and developing a programme that supports staff well being.
Deploying the workforce in the most efficient way possible and improving the efficiency of internal workforce department processes through reducing time to recruit and continuing to reduce sickness absence.
Finally, the fifth strand of the workforce strategy action plan is related to actual workforce capacity:
“Ensure the right number of skilled members of staff is available to provide the best possible quality of care.” There are three key objectives in 2015-16 to support the delivery of this: 1. Recruit the required nursing numbers to support safe staffing in all clinical areas:
2. Provide support to the nursing board programme in order to meet the nursing recruitment
targets.

24
Review and revise nursing induction: content and frequency
Develop an induction programme for overseas nursing including acclimatisation support
Streamline the recruitment process to ensure that the time to recruit is as short as possible.
Work with other corporate departments to improve processes so that staff are recruited to the bank in an efficient way
3. Develop a skilled workforce:
Review current activity and develop a learning and development plan based on contribution from professional leaders, annual business plans, and needs assessment drawn from appraisals.
Review the opportunity to set up a learning zone facility
Ensure implementation of care certificate for all new Health Care Assistants
Review preceptor programme There are in addition objectives related to the establishment of a medical workforce planning group, and supporting the development of appropriate new and changed roles (which is linked to the education strategy).
4.4.3 Information Communications and Technology (ICT) Standardisation of care in line with best practice contributes to the quality of outcome for patients and ICT has a key role to play in the delivery of this. The key priorities for 2015-16 are:
Deploying the electronic patient record: ensuring safe transition from national to locally managed services for the key clinical information systems of the Trust. This includes the Cerner clinical information system at St. George's Hospital and the national PACS service at Queen Mary’s Hospital
Complete the deployment of electronic prescribing, drug administration and clinical documentation to inpatient, theatres and the Emergency Department at St. George's
Implement Electronic Document Management and electronic referral system for all new outpatient registrations at St. George's Hospital
Joining up care records across organisations: develop the clinical portal to support the development of a SW London electronic medical record and support the delivery of SW London Pathology services
Developing decision support capability: improve the completeness, accuracy and timeliness of the collection and the dissemination of information by the Trust to support the planning, performance monitoring and delivery of clinical services to our patients
Ensuring appropriate governance and clinical engagement: support operational continuity and new service developments for the Trust by ensuring appropriate access and capacity to store data and access clinical and operational information to support current and new service or new service configurations
Providing patients access to their information: develop and implement direct access to the electronic medical record for patients on one of the chronic disease pathways
The Clinical Systems Programme Board tracks progress and reports, via the Executive Management Team, to the Trust Board.
4.4.4 Key Risks to Operational Delivery The most significant risks to delivery of our operational requirements are the availability of physical capacity (beds, theatres and critical care capacity), the workforce capacity to support this, and the finance to deliver what is required.

25
5. Financial Plan TO BE COMPLETED

26
Appendix 1: Board Declarations TO BE COMPLETED

Corporate Objectives 2015/16 Delivery Plan and Monitoring
St George’s Healthcare NHS Trust:
the next decade
ST GEORGE’S HEALTHCARE NHS TRUST: THE NEXT DECADE

This document sets out the proposed corporate priorities (in line with the discussions at the Board Strategy Seminar in February 2015), and key actions and milestones that the Trust will take to ensure these are delivered. The priorities identified by the Board for 2015-16 are: •The strategic plan •Additional capacity •Quality •Financial viability •Workforce and leadership These are the priority objectives that the Board will oversee delivery of, with quarterly reporting of progress. There are further objectives that need to be delivered in 2015-16, that will be monitored by the relevant Board Sub-Committees, in line with the governance arrangements detailed on the following slide (previously presented to the Board in February 2015).
2
Delivery of our 15/16 Annual Plan and Objectives
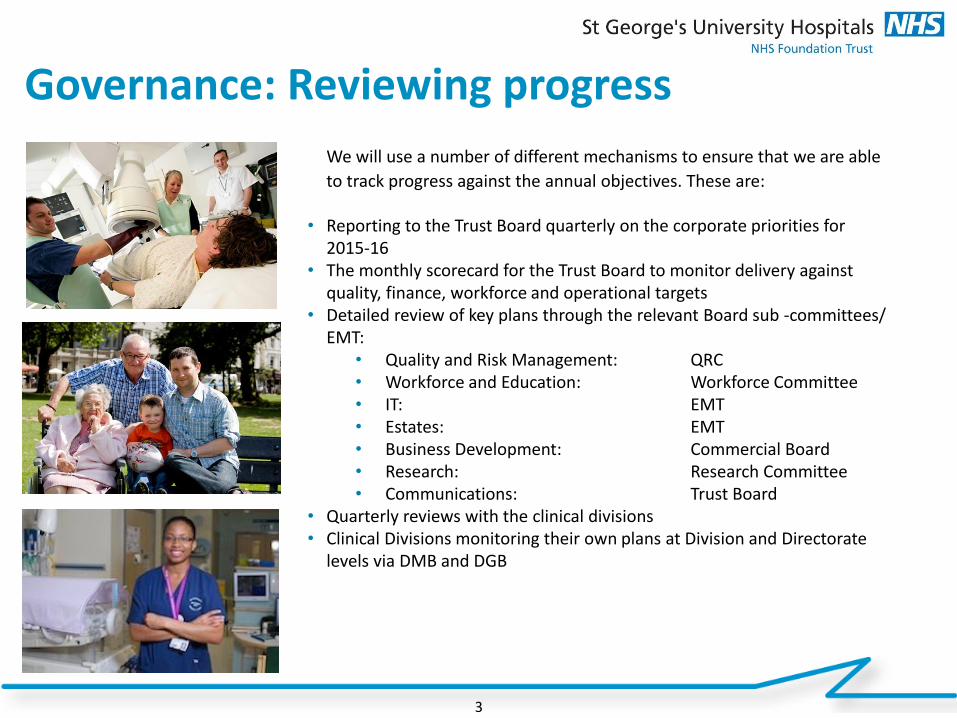
We will use a number of different mechanisms to ensure that we are able
to track progress against the annual objectives. These are: • Reporting to the Trust Board quarterly on the corporate priorities for
2015-16 • The monthly scorecard for the Trust Board to monitor delivery against
quality, finance, workforce and operational targets • Detailed review of key plans through the relevant Board sub -committees/
EMT: • Quality and Risk Management: QRC • Workforce and Education: Workforce Committee • IT: EMT • Estates: EMT • Business Development: Commercial Board • Research: Research Committee • Communications: Trust Board
• Quarterly reviews with the clinical divisions • Clinical Divisions monitoring their own plans at Division and Directorate
levels via DMB and DGB
Governance: Reviewing progress
3
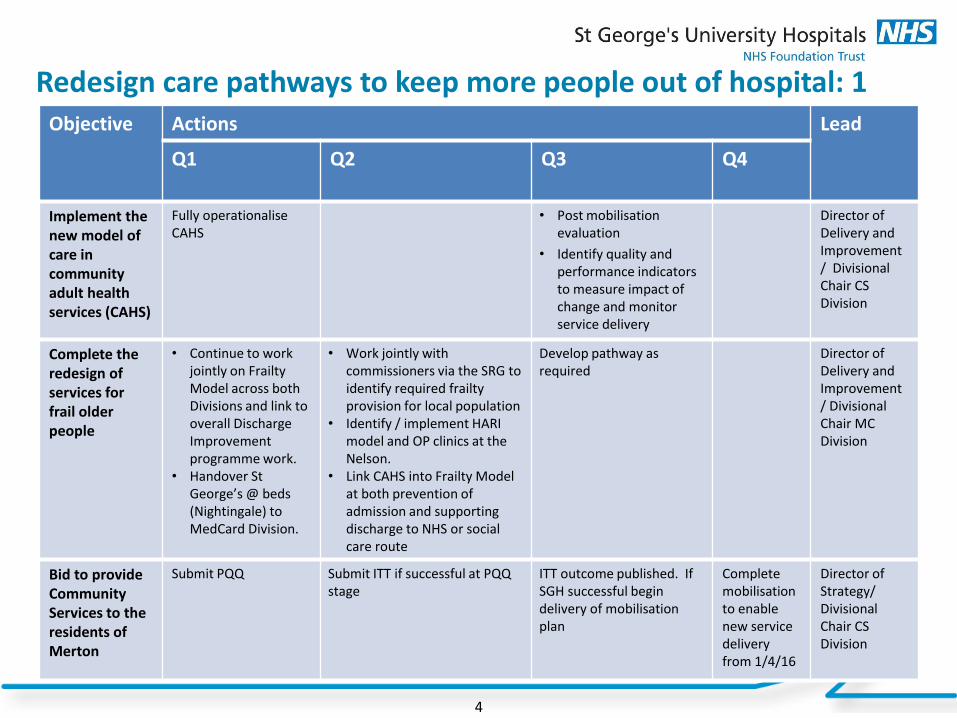
Redesign care pathways to keep more people out of hospital: 1
4
Objective Actions Lead
Q1 Q2 Q3 Q4
Implement the new model of care in community adult health services (CAHS)
Fully operationalise CAHS
• Post mobilisation evaluation
• Identify quality and performance indicators to measure impact of change and monitor service delivery
Director of Delivery and Improvement / Divisional Chair CS Division
Complete the redesign of services for frail older people
• Continue to work jointly on Frailty Model across both Divisions and link to overall Discharge Improvement programme work.
• Handover St George’s @ beds (Nightingale) to MedCard Division.
• Work jointly with commissioners via the SRG to identify required frailty provision for local population
• Identify / implement HARI model and OP clinics at the Nelson.
• Link CAHS into Frailty Model at both prevention of admission and supporting discharge to NHS or social care route
Develop pathway as required
Director of Delivery and Improvement / Divisional Chair MC Division
Bid to provide Community Services to the residents of Merton
Submit PQQ Submit ITT if successful at PQQ stage
ITT outcome published. If SGH successful begin delivery of mobilisation plan
Complete mobilisation to enable new service delivery from 1/4/16
Director of Strategy/ Divisional Chair CS Division

Redesign care pathways to keep more people out of hospital: 2
5
Objective Actions Lead
Q1 Q2 Q3 Q4
Support the delivery of the Wandsworth joint health and well being strategy
Launch of Health & Well being strategy
Will be updated once Health & Well being programme agreed in Q1
As per Q2 As per Q2 Director of Strategy / Divisional Chair CS Division
Develop and implement new models of care and further develop the St. George’s network as per 5YFV
Engage with Monitor / NHSE
Scope opportunities for closer working and new models of care
Develop programme for review and approval
Begin process of implementation
Director of Strategy / Director of Delivery & Improvement / Divisional Chair CS Division
Deliver access targets - RTT, A&E and Cancer through 1. Robust use of
information 2. Aligning capacity
and demand 3. Working in
partnership with providers
Ensure that the Trust has robust information on RTT performance
Deliver off-site capacity where required through working with a range of NHS and private providers
Shared cancer data set across all different providers in cancer pathway, to ensure better information and joined up care
Increased bed capacity either physical or through LOS reductions on-site at the Trust
Director of Delivery & Improvement
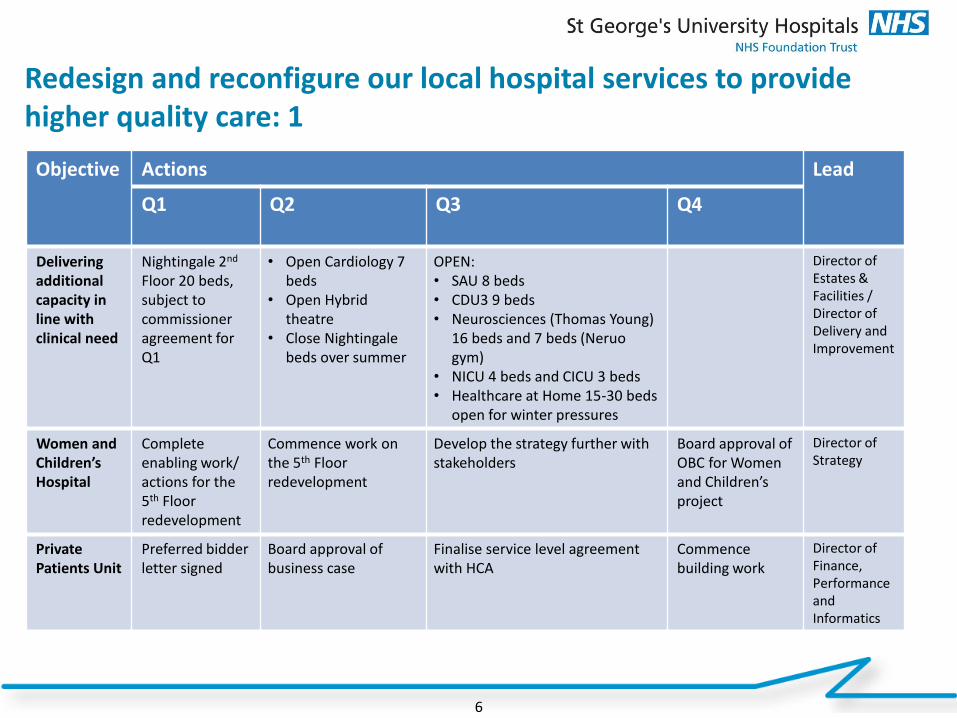
Redesign and reconfigure our local hospital services to provide higher quality care: 1
6
Objective Actions Lead
Q1 Q2 Q3 Q4
Delivering additional capacity in line with clinical need
Nightingale 2nd Floor 20 beds, subject to commissioner agreement for Q1
• Open Cardiology 7 beds
• Open Hybrid theatre
• Close Nightingale beds over summer
OPEN: • SAU 8 beds • CDU3 9 beds • Neurosciences (Thomas Young)
16 beds and 7 beds (Neruo gym)
• NICU 4 beds and CICU 3 beds • Healthcare at Home 15-30 beds
open for winter pressures
Director of Estates & Facilities / Director of Delivery and Improvement
Women and Children’s Hospital
Complete enabling work/ actions for the 5th Floor redevelopment
Commence work on the 5th Floor redevelopment
Develop the strategy further with stakeholders
Board approval of OBC for Women and Children’s project
Director of Strategy
Private Patients Unit
Preferred bidder letter signed
Board approval of business case
Finalise service level agreement with HCA
Commence building work
Director of Finance, Performance and Informatics
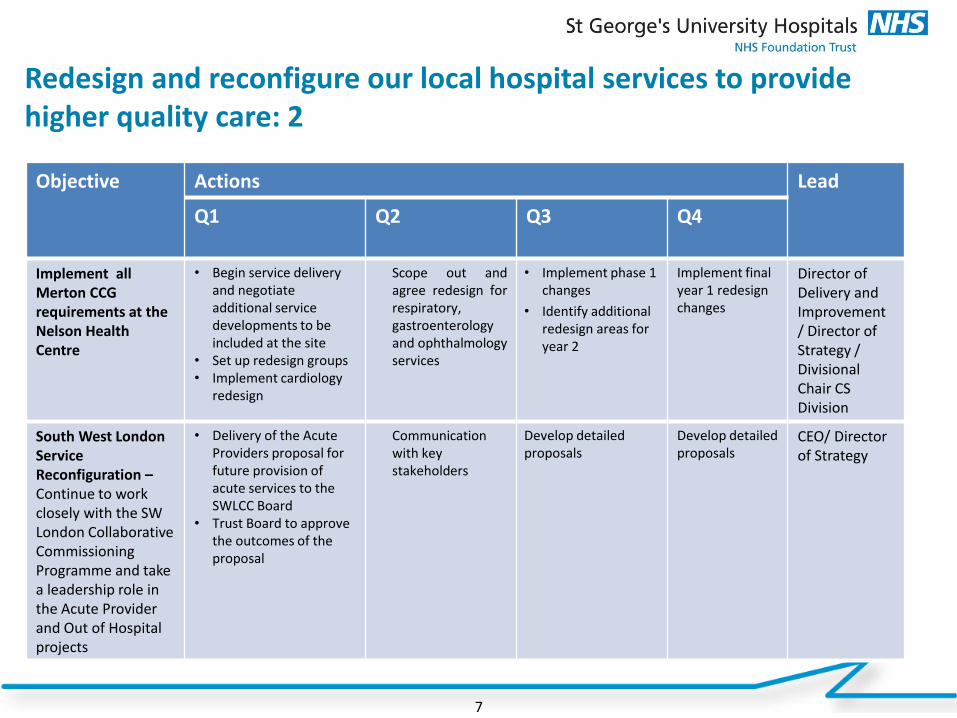
Redesign and reconfigure our local hospital services to provide higher quality care: 2
7
Objective Actions Lead
Q1 Q2 Q3 Q4
Implement all Merton CCG requirements at the Nelson Health Centre
• Begin service delivery and negotiate additional service developments to be included at the site
• Set up redesign groups • Implement cardiology
redesign
Scope out and agree redesign for respiratory, gastroenterology and ophthalmology services
• Implement phase 1 changes
• Identify additional redesign areas for year 2
Implement final year 1 redesign changes
Director of Delivery and Improvement / Director of Strategy / Divisional Chair CS Division
South West London Service Reconfiguration – Continue to work closely with the SW London Collaborative Commissioning Programme and take a leadership role in the Acute Provider and Out of Hospital projects
• Delivery of the Acute Providers proposal for future provision of acute services to the SWLCC Board
• Trust Board to approve the outcomes of the proposal
Communication with key stakeholders
Develop detailed proposals
Develop detailed proposals
CEO/ Director of Strategy
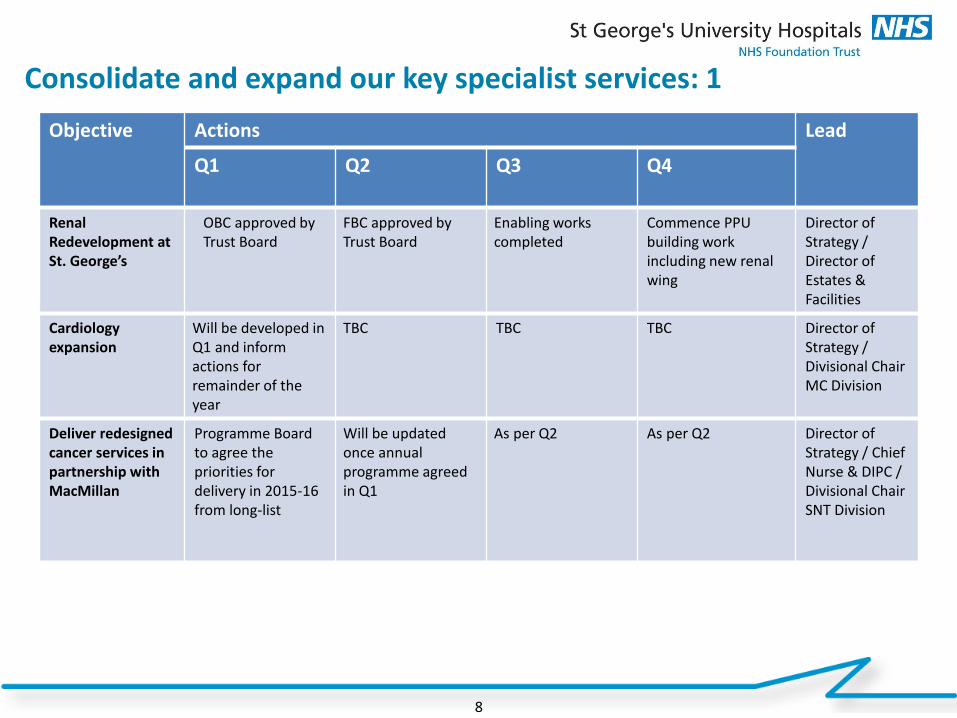
Consolidate and expand our key specialist services: 1
8
Objective Actions Lead
Q1 Q2 Q3 Q4
Renal Redevelopment at St. George’s
OBC approved by Trust Board
FBC approved by Trust Board
Enabling works completed
Commence PPU building work including new renal wing
Director of Strategy / Director of Estates & Facilities
Cardiology expansion
Will be developed in Q1 and inform actions for remainder of the year
TBC TBC TBC Director of Strategy / Divisional Chair MC Division
Deliver redesigned cancer services in partnership with MacMillan
Programme Board to agree the priorities for delivery in 2015-16 from long-list
Will be updated once annual programme agreed in Q1
As per Q2 As per Q2 Director of Strategy / Chief Nurse & DIPC / Divisional Chair SNT Division

Consolidate and expand our key specialist services: 2
9
Objective Actions Lead
Q1 Q2 Q3 Q4
Neurosciences Expansion
• Additional physical capacity delivered – Thomas Young and QMH Beds
• Professor of Neurology interviews
Professor of Neurology in post
• Appointment of senior lecturer in neurosurgery
• Deliver increased activity target for year following opening of new capacity
Director of Delivery and Improvement/ Divisional Chair STNC Division
Develop and implement a rehabilitation strategy Establish a 6 bedded spinal rehabilitation service in partnership with the Royal National Orthopaedic Hospital, Stanmore
• Establish Divisional Rehabilitation Strategy Group
• Cohort existing spinal beds together as pilot
Evaluation of pilot spinal unit and report to commissioners
Decision by commissioners re. support for 6 bedded unit
Director of Delivery and Improvement/ Director of Strategy
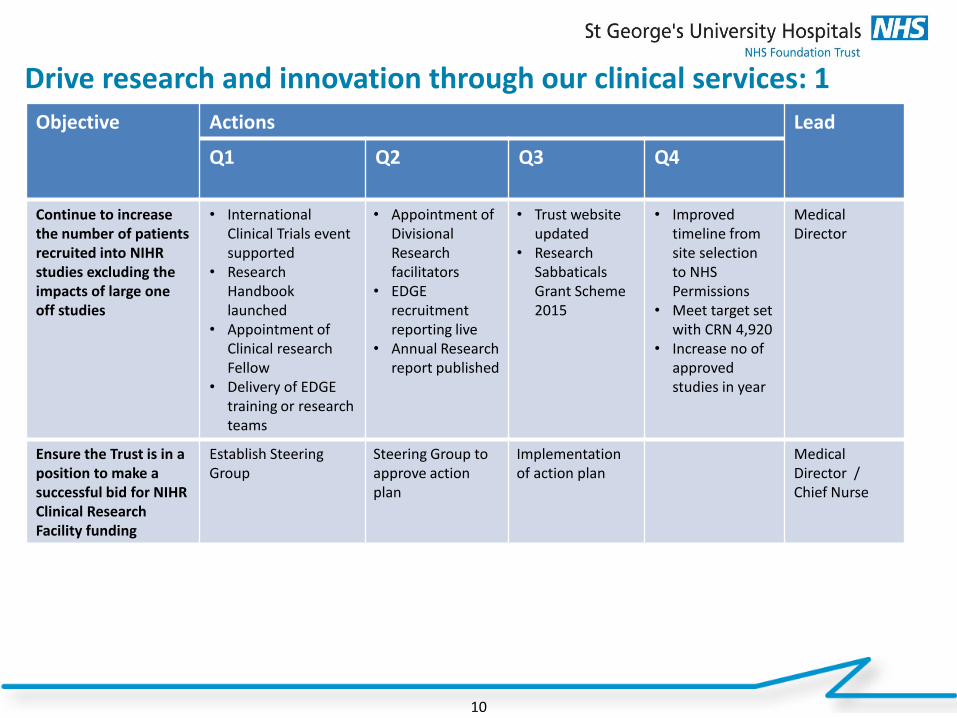
Drive research and innovation through our clinical services: 1
10
Objective Actions Lead
Q1 Q2 Q3 Q4
Continue to increase the number of patients recruited into NIHR studies excluding the impacts of large one off studies
• International Clinical Trials event supported
• Research Handbook launched
• Appointment of Clinical research Fellow
• Delivery of EDGE training or research teams
• Appointment of Divisional Research facilitators
• EDGE recruitment reporting live
• Annual Research report published
• Trust website updated
• Research Sabbaticals Grant Scheme 2015
• Improved timeline from site selection to NHS Permissions
• Meet target set with CRN 4,920
• Increase no of approved studies in year
Medical Director
Ensure the Trust is in a position to make a successful bid for NIHR Clinical Research Facility funding
Establish Steering Group
Steering Group to approve action plan
Implementation of action plan
Medical Director / Chief Nurse

Drive research and innovation through our clinical services: 2
11
Objective Actions Lead
Q1 Q2 Q3 Q4
Increase collaborations between SGUL Institutes and Trust clinical directorates through the development of further CAGs: Cardiology Neurosciences
Establish steering group to oversee operational delivery of Cardiology CAG
CAG Chief of Cardiology appointed
Cardiology CAG fully operational Neurosciences CAG established
Director of Strategy
Develop additional commercial income streams
NIPT testing for Down’s Syndrome in place
Commercial strategy approved
Director of Strategy

Improve productivity, the environment and systems to enable excellent care: 1
12
Objective Actions Lead
Q1 Q2 Q3 Q4
Complete the deployment of electronic prescribing, drug administration and clinical documentation to inpatients, theatres and the emergency department on the St. George’s Hospital site
• Complete exit from the BT contract for Cerner services
• Identify, agree and enable approach to delivery of new maternity reporting requirements
• Medical Device integration
• RiO Mobile working deployed in Battersea
• Completion of nursing whiteboards deployment
• Begin to utilise the information provided to support the delivery of clinical services
Complete electronic clinical documentation, e-prescribing and drug administration to wards, theatres, and emergency department on St. George's campus
Cerner Code upgrade live
Director of Finance, Performance and Informatics
Implement electronic document management and electronic referral system for all new out-patient registrations at St. George’s
Complete recruitment to in house scanning bureau
• All newly registered outpatient records scanned for St. George's campus activity
• All GP referrals triaged electronically
• Choose and book referrals incorporated in the electronic triage system
Tertiary referrals incorporated into the electronic triage system
Director of Finance, Performance and Informatics
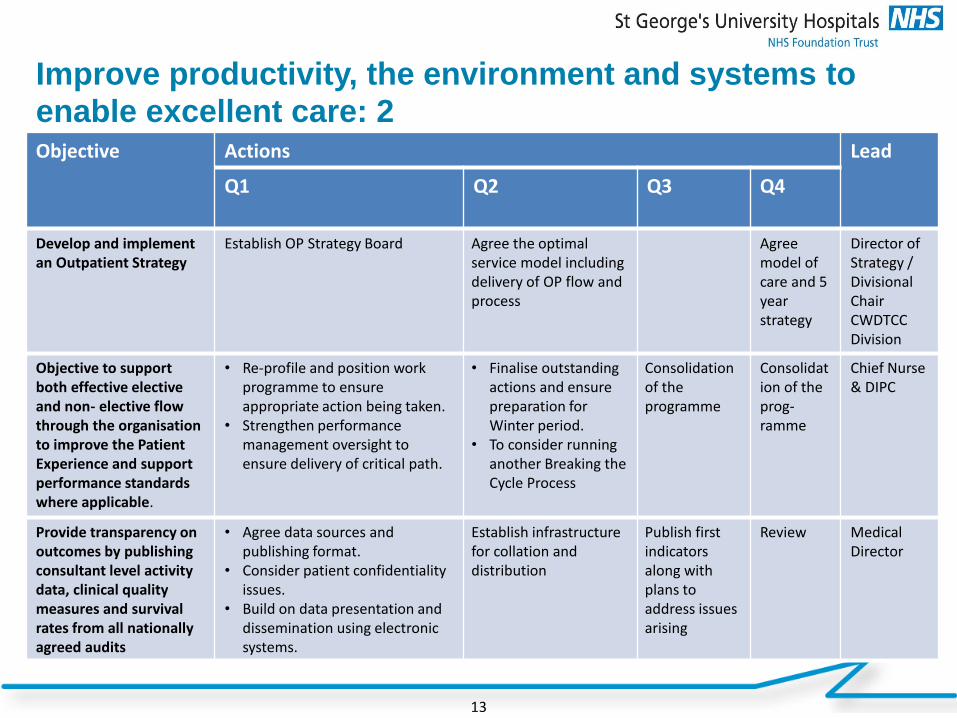
Improve productivity, the environment and systems to enable excellent care: 2
13
Objective Actions Lead
Q1 Q2 Q3 Q4
Develop and implement an Outpatient Strategy
Establish OP Strategy Board Agree the optimal service model including delivery of OP flow and process
Agree model of care and 5 year strategy
Director of Strategy / Divisional Chair CWDTCC Division
Objective to support both effective elective and non- elective flow through the organisation to improve the Patient Experience and support performance standards where applicable.
• Re-profile and position work programme to ensure appropriate action being taken.
• Strengthen performance management oversight to ensure delivery of critical path.
• Finalise outstanding actions and ensure preparation for Winter period.
• To consider running another Breaking the Cycle Process
Consolidation of the programme
Consolidation of the prog-ramme
Chief Nurse & DIPC
Provide transparency on outcomes by publishing consultant level activity data, clinical quality measures and survival rates from all nationally agreed audits
• Agree data sources and publishing format.
• Consider patient confidentiality issues.
• Build on data presentation and dissemination using electronic systems.
Establish infrastructure for collation and distribution
Publish first indicators along with plans to address issues arising
Review Medical Director
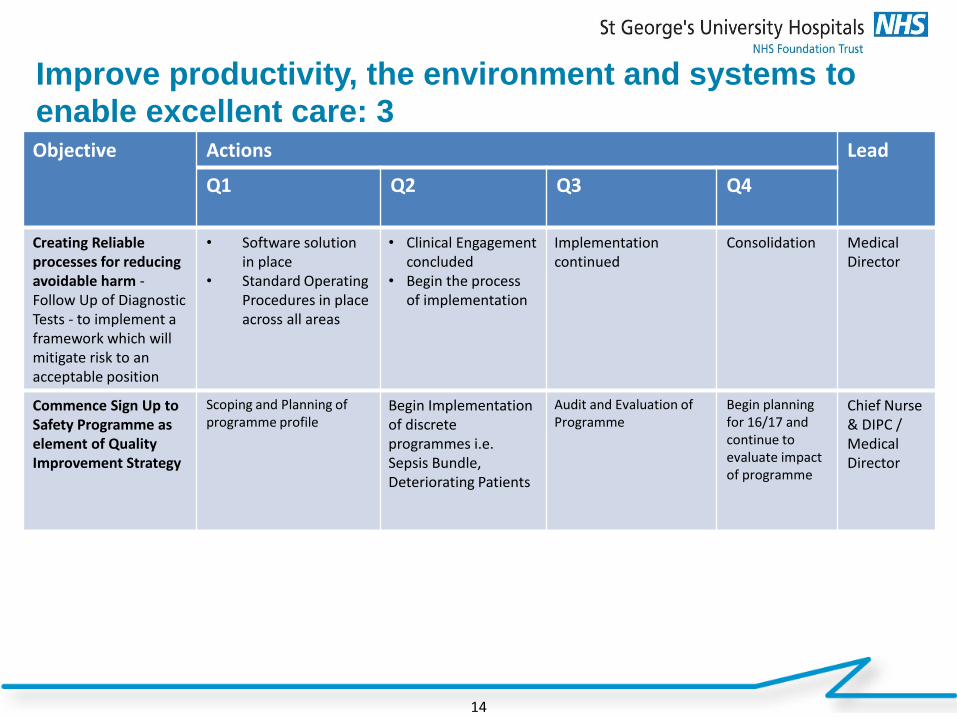
14
Objective Actions Lead
Q1 Q2 Q3 Q4
Creating Reliable processes for reducing avoidable harm - Follow Up of Diagnostic Tests - to implement a framework which will mitigate risk to an acceptable position
• Software solution in place
• Standard Operating Procedures in place across all areas
• Clinical Engagement concluded
• Begin the process of implementation
Implementation continued
Consolidation Medical Director
Commence Sign Up to Safety Programme as element of Quality Improvement Strategy
Scoping and Planning of programme profile
Begin Implementation of discrete programmes i.e. Sepsis Bundle, Deteriorating Patients
Audit and Evaluation of Programme
Begin planning for 16/17 and continue to evaluate impact of programme
Chief Nurse & DIPC / Medical Director
Improve productivity, the environment and systems to enable excellent care: 3
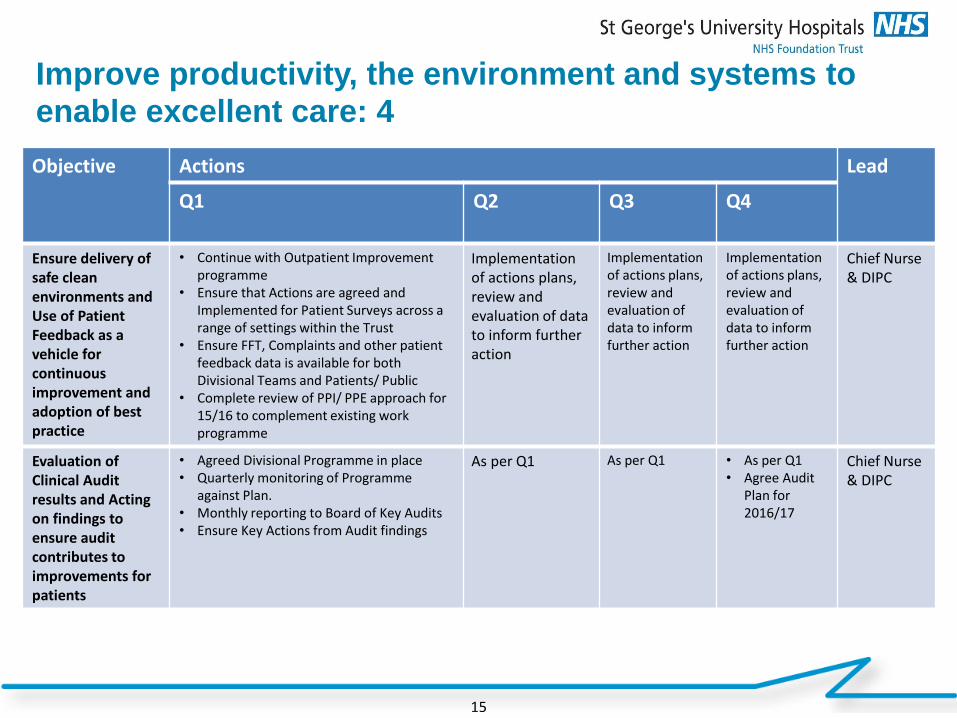
15
Objective Actions Lead
Q1 Q2 Q3 Q4
Ensure delivery of safe clean environments and Use of Patient Feedback as a vehicle for continuous improvement and adoption of best practice
• Continue with Outpatient Improvement programme
• Ensure that Actions are agreed and Implemented for Patient Surveys across a range of settings within the Trust
• Ensure FFT, Complaints and other patient feedback data is available for both Divisional Teams and Patients/ Public
• Complete review of PPI/ PPE approach for 15/16 to complement existing work programme
Implementation of actions plans, review and evaluation of data to inform further action
Implementation of actions plans, review and evaluation of data to inform further action
Implementation of actions plans, review and evaluation of data to inform further action
Chief Nurse & DIPC
Evaluation of Clinical Audit results and Acting on findings to ensure audit contributes to improvements for patients
• Agreed Divisional Programme in place • Quarterly monitoring of Programme
against Plan. • Monthly reporting to Board of Key Audits • Ensure Key Actions from Audit findings
As per Q1 As per Q1 • As per Q1 • Agree Audit
Plan for 2016/17
Chief Nurse & DIPC
Improve productivity, the environment and systems to enable excellent care: 4
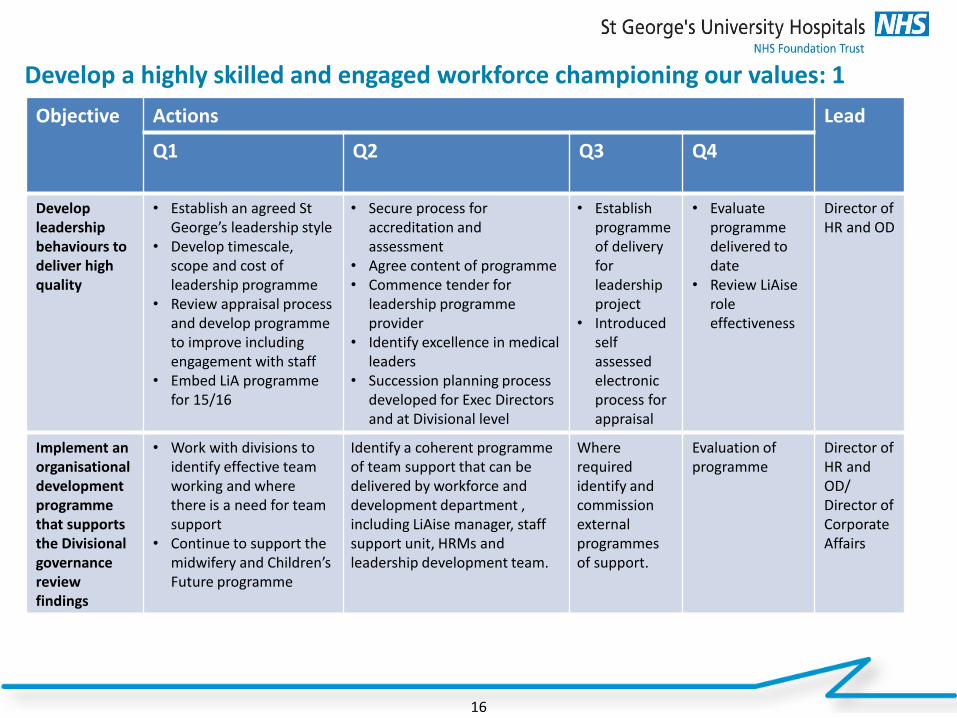
Develop a highly skilled and engaged workforce championing our values: 1
16
Objective Actions Lead
Q1 Q2 Q3 Q4
Develop leadership behaviours to deliver high quality
• Establish an agreed St George’s leadership style
• Develop timescale, scope and cost of leadership programme
• Review appraisal process and develop programme to improve including engagement with staff
• Embed LiA programme for 15/16
• Secure process for accreditation and assessment
• Agree content of programme • Commence tender for
leadership programme provider
• Identify excellence in medical leaders
• Succession planning process developed for Exec Directors and at Divisional level
• Establish programme of delivery for leadership project
• Introduced self assessed electronic process for appraisal
• Evaluate programme delivered to date
• Review LiAise role effectiveness
Director of HR and OD
Implement an organisational development programme that supports the Divisional governance review findings
• Work with divisions to identify effective team working and where there is a need for team support
• Continue to support the midwifery and Children’s Future programme
Identify a coherent programme of team support that can be delivered by workforce and development department , including LiAise manager, staff support unit, HRMs and leadership development team.
Where required identify and commission external programmes of support.
Evaluation of programme
Director of HR and OD/ Director of Corporate Affairs
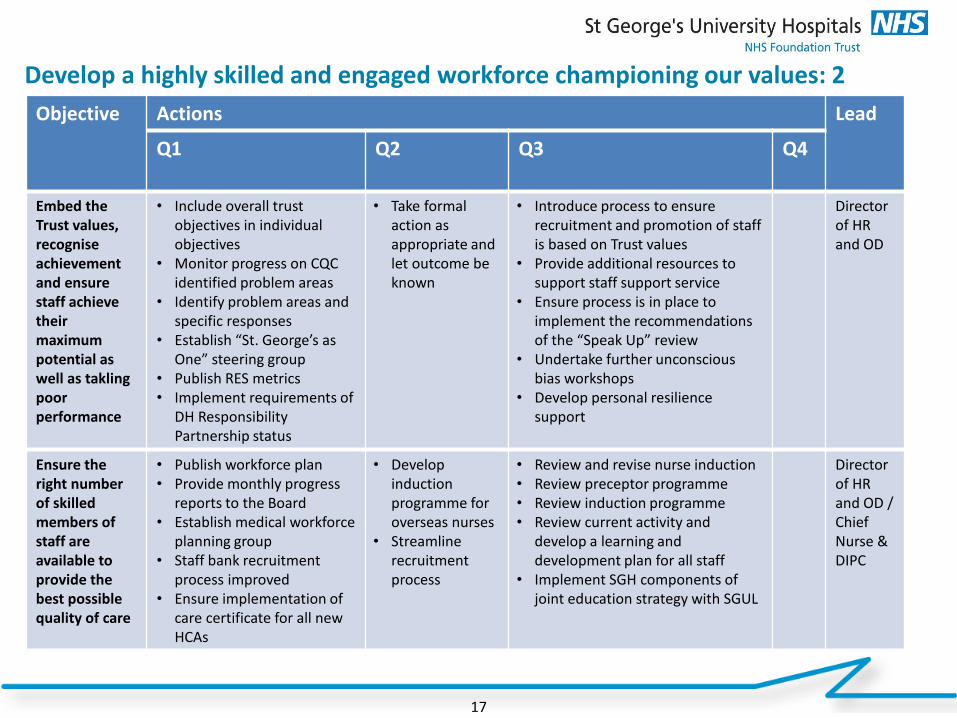
17
Objective Actions Lead
Q1 Q2 Q3 Q4
Embed the Trust values, recognise achievement and ensure staff achieve their maximum potential as well as takling poor performance
• Include overall trust objectives in individual objectives
• Monitor progress on CQC identified problem areas
• Identify problem areas and specific responses
• Establish “St. George’s as One” steering group
• Publish RES metrics • Implement requirements of
DH Responsibility Partnership status
• Take formal action as appropriate and let outcome be known
• Introduce process to ensure recruitment and promotion of staff is based on Trust values
• Provide additional resources to support staff support service
• Ensure process is in place to implement the recommendations of the “Speak Up” review
• Undertake further unconscious bias workshops
• Develop personal resilience support
Director of HR and OD
Ensure the right number of skilled members of staff are available to provide the best possible quality of care
• Publish workforce plan • Provide monthly progress
reports to the Board • Establish medical workforce
planning group • Staff bank recruitment
process improved • Ensure implementation of
care certificate for all new HCAs
• Develop induction programme for overseas nurses
• Streamline recruitment process
• Review and revise nurse induction • Review preceptor programme • Review induction programme • Review current activity and
develop a learning and development plan for all staff
• Implement SGH components of joint education strategy with SGUL
Director of HR and OD / Chief Nurse & DIPC
Develop a highly skilled and engaged workforce championing our values: 2
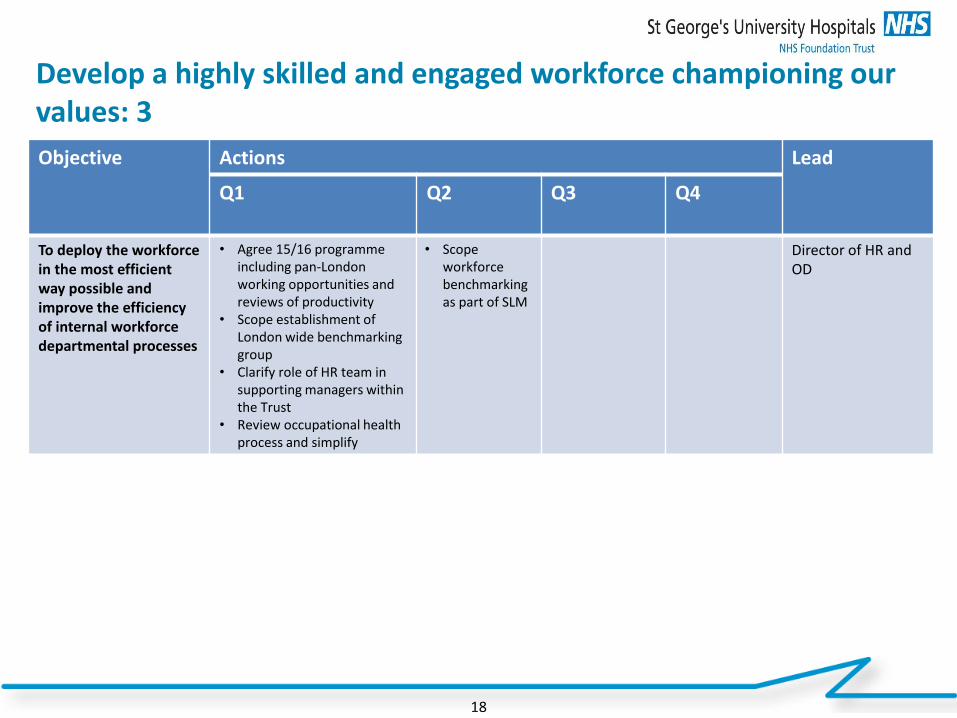
Develop a highly skilled and engaged workforce championing our values: 3
18
Objective Actions Lead
Q1 Q2 Q3 Q4
To deploy the workforce in the most efficient way possible and improve the efficiency of internal workforce departmental processes
• Agree 15/16 programme including pan-London working opportunities and reviews of productivity
• Scope establishment of London wide benchmarking group
• Clarify role of HR team in supporting managers within the Trust
• Review occupational health process and simplify
• Scope workforce benchmarking as part of SLM
Director of HR and OD
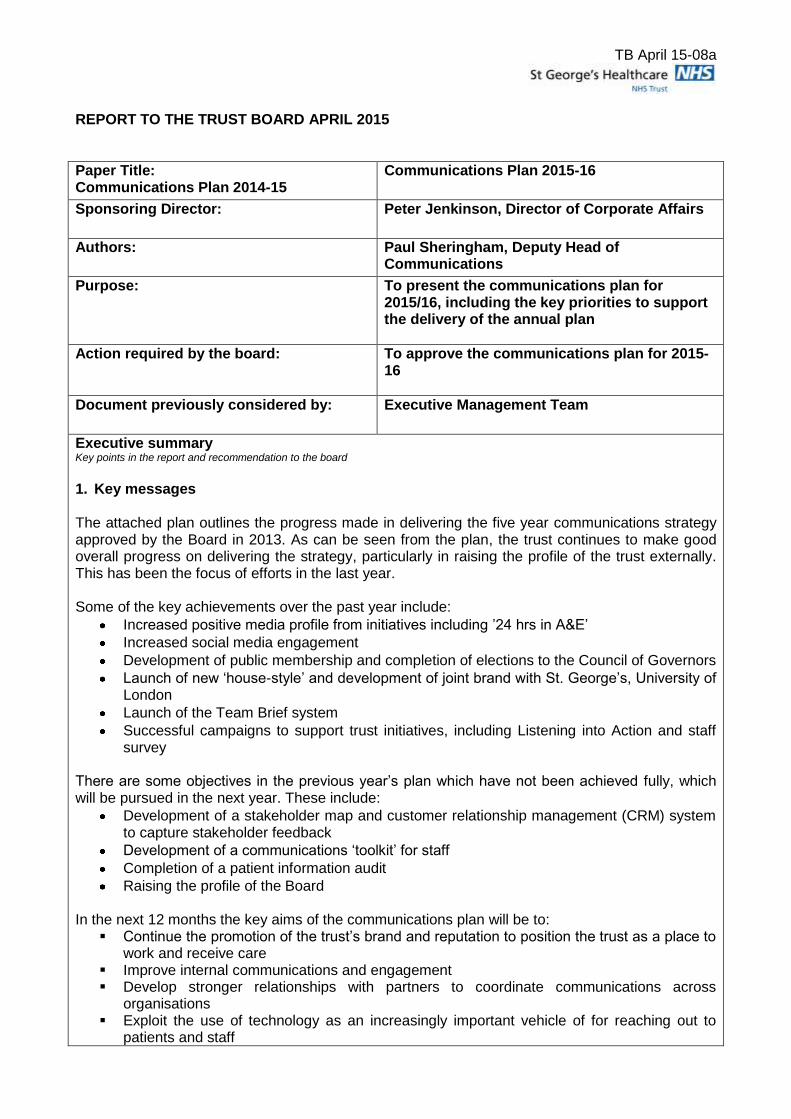
TB April 15-08a
REPORT TO THE TRUST BOARD APRIL 2015
Paper Title: Communications Plan 2014-15
Communications Plan 2015-16
Sponsoring Director:
Peter Jenkinson, Director of Corporate Affairs
Authors: Paul Sheringham, Deputy Head of Communications
Purpose:
To present the communications plan for 2015/16, including the key priorities to support the delivery of the annual plan
Action required by the board:
To approve the communications plan for 2015-16
Document previously considered by:
Executive Management Team
Executive summary Key points in the report and recommendation to the board
1. Key messages
The attached plan outlines the progress made in delivering the five year communications strategy approved by the Board in 2013. As can be seen from the plan, the trust continues to make good overall progress on delivering the strategy, particularly in raising the profile of the trust externally. This has been the focus of efforts in the last year. Some of the key achievements over the past year include:
Increased positive media profile from initiatives including ’24 hrs in A&E’
Increased social media engagement
Development of public membership and completion of elections to the Council of Governors
Launch of new ‘house-style’ and development of joint brand with St. George’s, University of London
Launch of the Team Brief system
Successful campaigns to support trust initiatives, including Listening into Action and staff survey
There are some objectives in the previous year’s plan which have not been achieved fully, which will be pursued in the next year. These include:
Development of a stakeholder map and customer relationship management (CRM) system to capture stakeholder feedback
Development of a communications ‘toolkit’ for staff
Completion of a patient information audit
Raising the profile of the Board
In the next 12 months the key aims of the communications plan will be to: Continue the promotion of the trust’s brand and reputation to position the trust as a place to
work and receive care Improve internal communications and engagement Develop stronger relationships with partners to coordinate communications across
organisations Exploit the use of technology as an increasingly important vehicle of for reaching out to
patients and staff
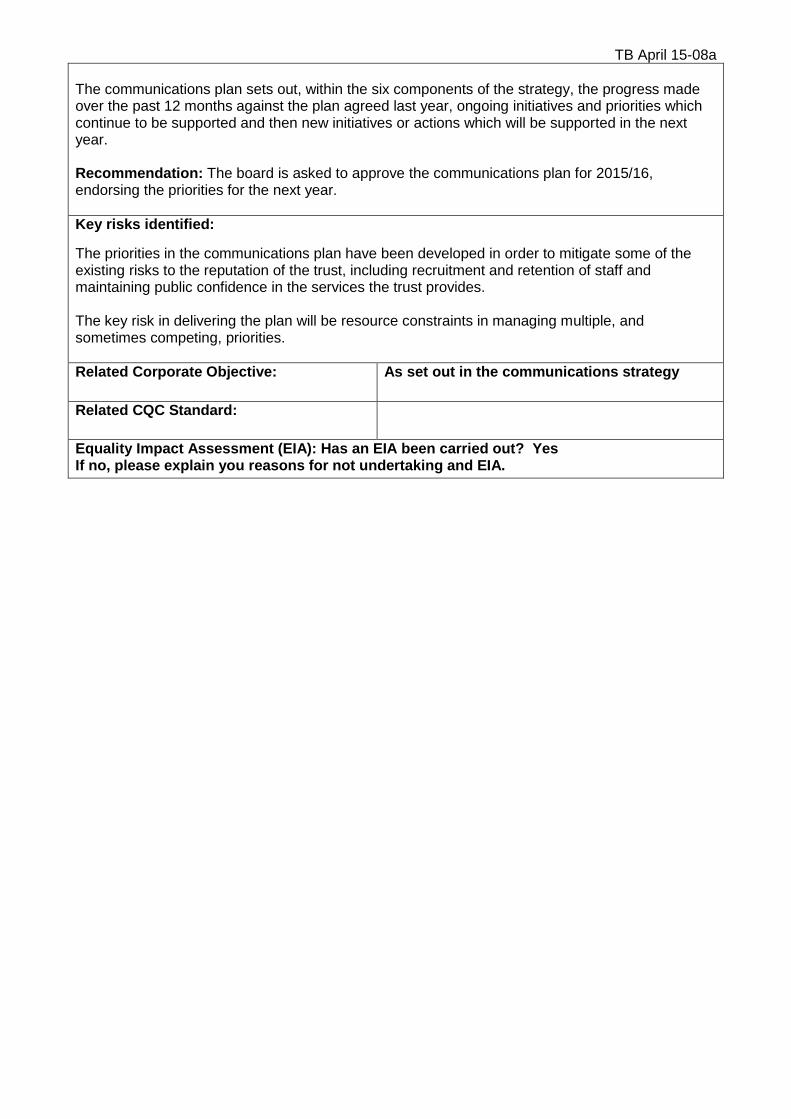
TB April 15-08a
The communications plan sets out, within the six components of the strategy, the progress made over the past 12 months against the plan agreed last year, ongoing initiatives and priorities which continue to be supported and then new initiatives or actions which will be supported in the next year. Recommendation: The board is asked to approve the communications plan for 2015/16, endorsing the priorities for the next year.
Key risks identified:
The priorities in the communications plan have been developed in order to mitigate some of the existing risks to the reputation of the trust, including recruitment and retention of staff and maintaining public confidence in the services the trust provides. The key risk in delivering the plan will be resource constraints in managing multiple, and sometimes competing, priorities.
Related Corporate Objective:
As set out in the communications strategy
Related CQC Standard:
Equality Impact Assessment (EIA): Has an EIA been carried out? Yes If no, please explain you reasons for not undertaking and EIA.
Excellence in specialist and community healthcare
Communications Plan 2015/16

Communications Plan 2015/16 / St George’s University Hospitals NHS Foundation Trust
Contents
1. Executive summary
2. Communications strategy objectives
3. Progress and plans in each area:
– 1. Develop the St George’s brand
– 2. Promote understanding and ownership of the Trust’s vision and strategy
– 3. Strengthen staff engagement
– 4. Further develop our patient and public involvement
– 5. Enhance our stakeholder relationships
– 6. Develop our communications infrastructure and tools/techniques
2

Communications Plan 2015/16 / St George’s University Hospitals NHS Foundation Trust
3
The Five Year Communications and Engagement Strategy
A proactive communications and engagement
approach to support delivery
of the Trust vision & objectives
1. Develop the trust brand
3. Strengthen staff engagement
4. Further develop our patient and
public involvement
5. Enhance our relationships with
external stakeholders
2. Promote understanding and ownership of the Trust’s Vision and
Strategy
In 2013 the communications team developed a five year
communications and engagement strategy to underpin the
trust’s 10yr strategic plan. This strategy focused on six
measurable and accountable components which were
designed to cover breadth of the corporate communications
function at the trust. The purpose of this document is to
reflect upon our achievements towards the five year plan
and to determine where we should focus our priorities for
the next twelve months to both develop our
communications infrastructure to meet the 21st century
needs of our patients and staff.
6. Develop our communications
infrastructure and tools/techniques
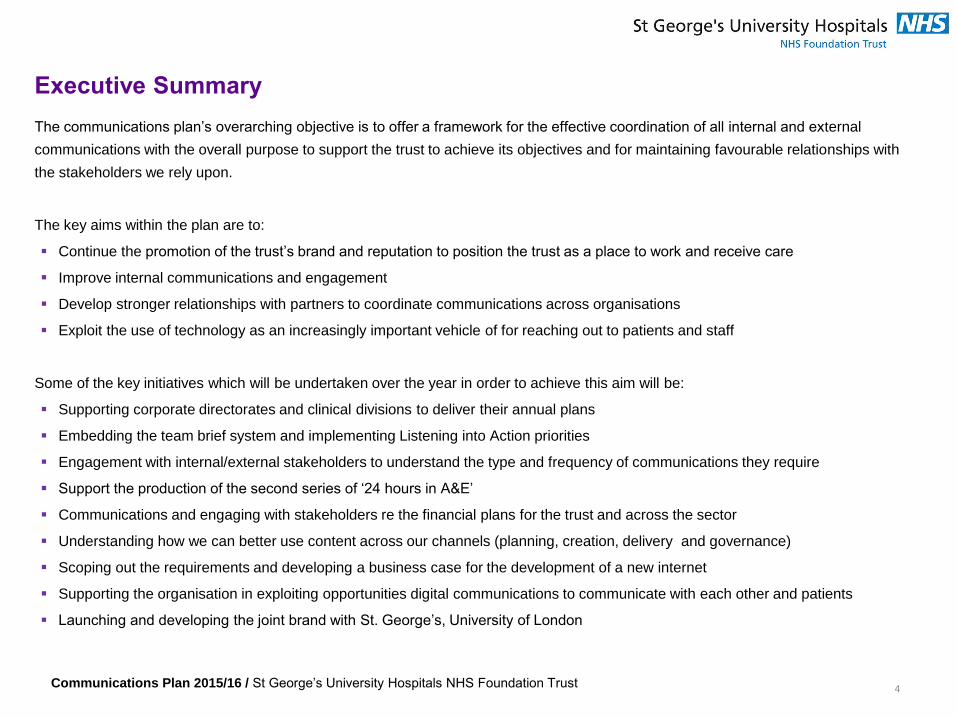
Communications Plan 2015/16 / St George’s University Hospitals NHS Foundation Trust
4
Executive Summary
The communications plan’s overarching objective is to offer a framework for the effective coordination of all internal and external
communications with the overall purpose to support the trust to achieve its objectives and for maintaining favourable relationships with
the stakeholders we rely upon.
The key aims within the plan are to:
Continue the promotion of the trust’s brand and reputation to position the trust as a place to work and receive care
Improve internal communications and engagement
Develop stronger relationships with partners to coordinate communications across organisations
Exploit the use of technology as an increasingly important vehicle of for reaching out to patients and staff
Some of the key initiatives which will be undertaken over the year in order to achieve this aim will be:
Supporting corporate directorates and clinical divisions to deliver their annual plans
Embedding the team brief system and implementing Listening into Action priorities
Engagement with internal/external stakeholders to understand the type and frequency of communications they require
Support the production of the second series of ‘24 hours in A&E’
Communications and engaging with stakeholders re the financial plans for the trust and across the sector
Understanding how we can better use content across our channels (planning, creation, delivery and governance)
Scoping out the requirements and developing a business case for the development of a new internet
Supporting the organisation in exploiting opportunities digital communications to communicate with each other and patients
Launching and developing the joint brand with St. George’s, University of London
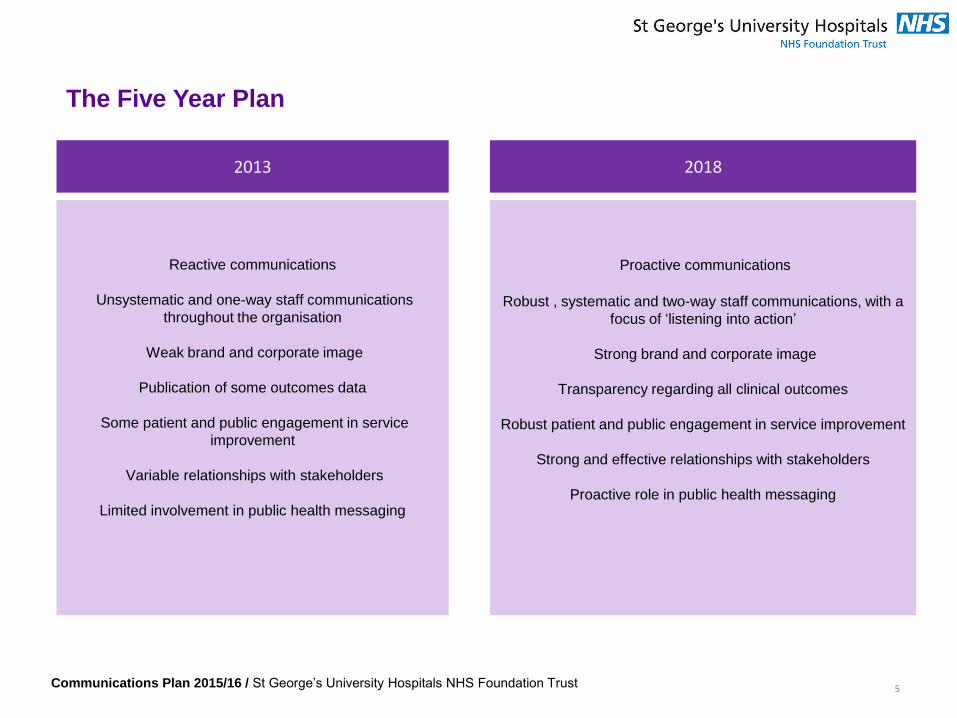
Communications Plan 2015/16 / St George’s University Hospitals NHS Foundation Trust
5
2013 2018
Reactive communications
Unsystematic and one-way staff communications
throughout the organisation
Weak brand and corporate image
Publication of some outcomes data
Some patient and public engagement in service
improvement
Variable relationships with stakeholders
Limited involvement in public health messaging
Proactive communications
Robust , systematic and two-way staff communications, with a
focus of ‘listening into action’
Strong brand and corporate image
Transparency regarding all clinical outcomes
Robust patient and public engagement in service improvement
Strong and effective relationships with stakeholders
Proactive role in public health messaging
The Five Year Plan
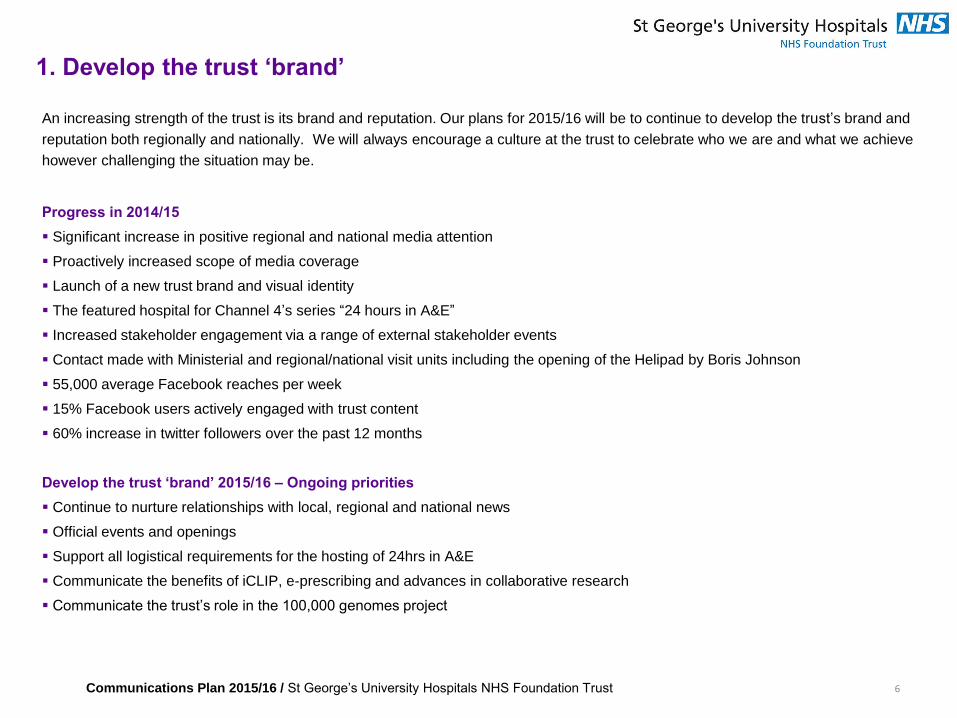
Communications Plan 2015/16 / St George’s University Hospitals NHS Foundation Trust
1. Develop the trust ‘brand’
An increasing strength of the trust is its brand and reputation. Our plans for 2015/16 will be to continue to develop the trust’s brand and
reputation both regionally and nationally. We will always encourage a culture at the trust to celebrate who we are and what we achieve
however challenging the situation may be.
Progress in 2014/15
Significant increase in positive regional and national media attention
Proactively increased scope of media coverage
Launch of a new trust brand and visual identity
The featured hospital for Channel 4’s series “24 hours in A&E”
Increased stakeholder engagement via a range of external stakeholder events
Contact made with Ministerial and regional/national visit units including the opening of the Helipad by Boris Johnson
55,000 average Facebook reaches per week
15% Facebook users actively engaged with trust content
60% increase in twitter followers over the past 12 months
Develop the trust ‘brand’ 2015/16 – Ongoing priorities
Continue to nurture relationships with local, regional and national news
Official events and openings
Support all logistical requirements for the hosting of 24hrs in A&E
Communicate the benefits of iCLIP, e-prescribing and advances in collaborative research
Communicate the trust’s role in the 100,000 genomes project
6
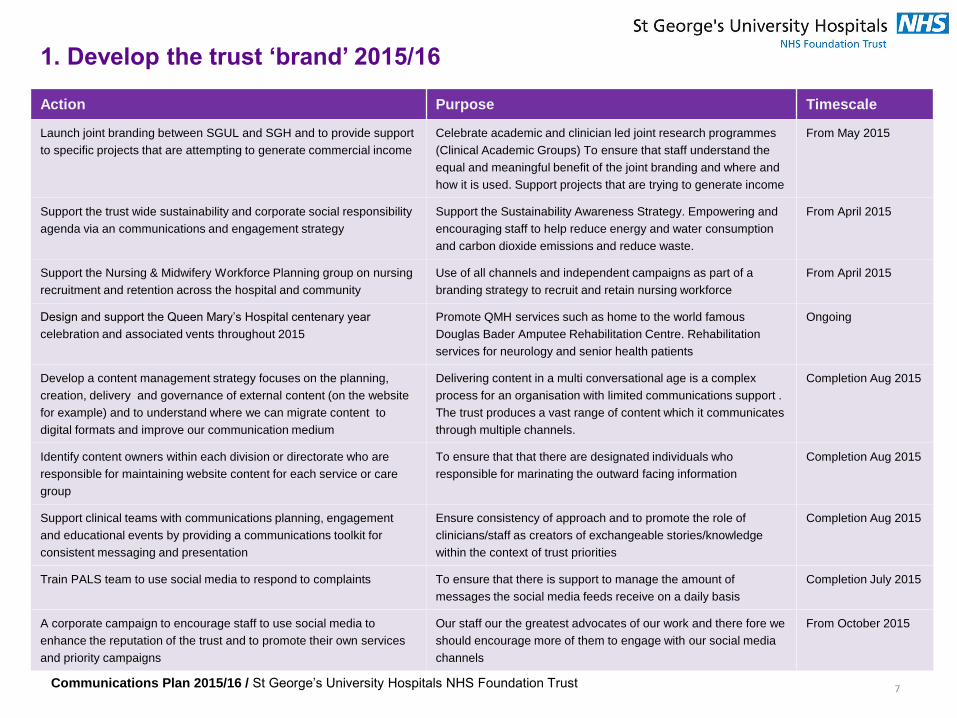
Communications Plan 2015/16 / St George’s University Hospitals NHS Foundation Trust
7
1. Develop the trust ‘brand’ 2015/16
Action Purpose Timescale
Launch joint branding between SGUL and SGH and to provide support
to specific projects that are attempting to generate commercial income
Celebrate academic and clinician led joint research programmes
(Clinical Academic Groups) To ensure that staff understand the
equal and meaningful benefit of the joint branding and where and
how it is used. Support projects that are trying to generate income
From May 2015
Support the trust wide sustainability and corporate social responsibility
agenda via an communications and engagement strategy
Support the Sustainability Awareness Strategy. Empowering and
encouraging staff to help reduce energy and water consumption
and carbon dioxide emissions and reduce waste.
From April 2015
Support the Nursing & Midwifery Workforce Planning group on nursing
recruitment and retention across the hospital and community
Use of all channels and independent campaigns as part of a
branding strategy to recruit and retain nursing workforce
From April 2015
Design and support the Queen Mary’s Hospital centenary year
celebration and associated vents throughout 2015
Promote QMH services such as home to the world famous
Douglas Bader Amputee Rehabilitation Centre. Rehabilitation
services for neurology and senior health patients
Ongoing
Develop a content management strategy focuses on the planning,
creation, delivery and governance of external content (on the website
for example) and to understand where we can migrate content to
digital formats and improve our communication medium
Delivering content in a multi conversational age is a complex
process for an organisation with limited communications support .
The trust produces a vast range of content which it communicates
through multiple channels.
Completion Aug 2015
Identify content owners within each division or directorate who are
responsible for maintaining website content for each service or care
group
To ensure that that there are designated individuals who
responsible for marinating the outward facing information
Completion Aug 2015
Support clinical teams with communications planning, engagement
and educational events by providing a communications toolkit for
consistent messaging and presentation
Ensure consistency of approach and to promote the role of
clinicians/staff as creators of exchangeable stories/knowledge
within the context of trust priorities
Completion Aug 2015
Train PALS team to use social media to respond to complaints To ensure that there is support to manage the amount of
messages the social media feeds receive on a daily basis
Completion July 2015
A corporate campaign to encourage staff to use social media to
enhance the reputation of the trust and to promote their own services
and priority campaigns
Our staff our the greatest advocates of our work and there fore we
should encourage more of them to engage with our social media
channels
From October 2015
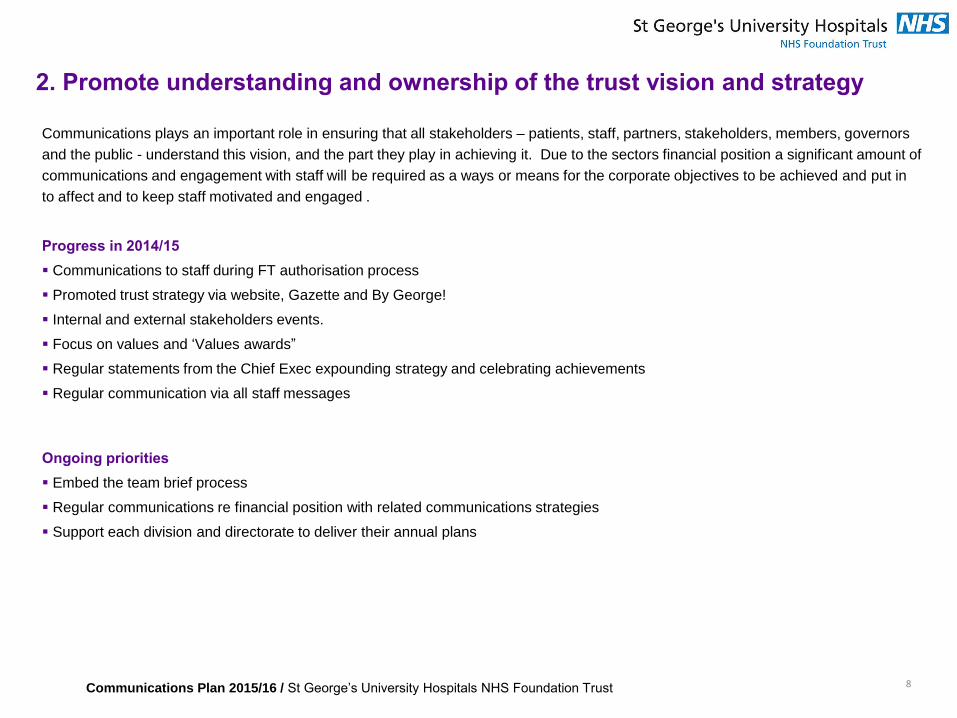
Communications Plan 2015/16 / St George’s University Hospitals NHS Foundation Trust
2. Promote understanding and ownership of the trust vision and strategy
Communications plays an important role in ensuring that all stakeholders – patients, staff, partners, stakeholders, members, governors
and the public - understand this vision, and the part they play in achieving it. Due to the sectors financial position a significant amount of
communications and engagement with staff will be required as a ways or means for the corporate objectives to be achieved and put in
to affect and to keep staff motivated and engaged .
Progress in 2014/15
Communications to staff during FT authorisation process
Promoted trust strategy via website, Gazette and By George!
Internal and external stakeholders events.
Focus on values and ‘Values awards”
Regular statements from the Chief Exec expounding strategy and celebrating achievements
Regular communication via all staff messages
Ongoing priorities
Embed the team brief process
Regular communications re financial position with related communications strategies
Support each division and directorate to deliver their annual plans
8

Communications Plan 2015/16 / St George’s University Hospitals NHS Foundation Trust 9
2. Promote understanding and ownership of the trust strategy 2015/16
Action Purpose Timescale
Development of a trust wide Patient Flow Programme
communications strategy which builds upon the
‘Breaking the Cycle’ process to change and improve the
way we work.
To support and underpin the work of the discharge programme to ensure every
member of staff is engaged and takes ownership and responsibility for the
discharge of patients. Communicate the mission and vision of the discharge
programme that exercises behavioural and change communications.
From April 2015
Development of the Senior Leaders Programme (SLP)
including workshops/masterclasses
To value, bring together, motivate and support leaders - encourage them to
cascade key message and inspire their workforce on the implications of the
Integrated Business Plan (IBP) and Long Term Financial Management plan
(LTFM)
From April 2015
Disseminate the implications of Integrated Business Plan
(IBP) and Long Term Financial Management plan
(LTFM) to all staff via corporate channels.
To provide information and assurance to staff so that they are engaged with the
short and long term implications of how IBP & and LTFM affect their day-to-day
working
From April 2015
Utilise the Team Brief to engage with staff on key
messages and ensure that these are aligned to all other
messages communicated by the board for consistency
Communicate trust wide strategic messages/ local briefs for divisional specific
messages as well as good news stories
Ongoing
Provide support to the programme designed to reduce
waste and expenditure
To gain best-practice insight into what our staff think, feel, believe and do.
Create trust-wide campaigns that measurably change the behaviour of our staff
From May 2015
Promote and publicise developments in the trust’s
facilities/estate
Effective internal communications and engagement will enable staff, patients,
the public and partners to understand and be involved in how we improve
efficiency to make best use of our resources
Ongoing
Provide communications support to the trust wide Sign
up to Safety programme
Sign up to safety is a national initiative that aims to reduce avoidable harm by
50% which equates to 6,000 lives over a three year period. The trust is in the
process of confirming if we have funding to support
tbc

Communications Plan 2015/16 / St George’s University Hospitals NHS Foundation Trust
3. Strengthen staff engagement
A key component of the communications plan and workforce strategy is to “Strengthen the sense of engagement and belonging to the
trust felt by all community and acute staff”. Our staff are our greatest asset. In 2015/16 we will continue to provide dedicated support to
the HR and Workforce teams and will develop our internal communications channels
Progress in 2014/15
Hosted multiple internal events for staff such as FT and thank you events
Staff survey communications resulted in +40% a significantly better response than previous years.
Engaged staff in phase one of the Agenda for Change performance related pay and appraisal process via range of toolkits and events.
Successfully communicated well being initiatives such as the Global Corporate Challenge.
100 staff attended the first Schwartz round
Ongoing priorities
Complete the lifecycle of the NHS Change day/Swap Shop
Support for trust priority campaigns infection control, MAST training, Flu FFT
Deployment of iCLIP to the remainder of the hospital
Produce bi-monthly By George
Provide dedicated support to Listening in to Action and HR and Workforce teams
Provide communications support Schwartz rounds
Celebrate values awards and long service staff
Celebrate and communicate additional capacity ahead of winter 2015/16
Support business continuity planning
Produce a suite of filmed Q&As with Miles and other execs
10

Communications Plan 2015/16 / St George’s University Hospitals NHS Foundation Trust 11
3. Strengthen staff engagement 2015/16
Action Purpose Timescale
Undertake periodic evaluation of the Team Brief to
determine its reach and effectiveness and to asses if the
model could be improved
To determine success and reach to date to better understand how effectively
the team brief is being disseminated
From May 2015
Undertake a Listening into Action Communications event An LIA event is scheduled in May available to all staff to attend. To gain
perspectives on how we should manage our corporate communications with
staff which is of crucial importance when strategically planning towards different
internal stakeholders
Completion May 2015
Support the Education team to improve the experience of
new starters on the induction programme. To devise ways
to support new starters during their first few months at the
trust
To create a more engaging induction programme though a range of new and
innovative ideas such as the use of social media and a buddying system
From April 2015
Collaborate with the Education Team and Nursing and
Midwifery workforce team to create a video for both
induction and recruitment purposes
The purpose of this is to capture the depth and breadth of services of the trust
and to introduce new starters and potential employees to the some of the staff at
the trust
From April 2015
Engage staff in the Phase 2 of the Agenda for Change
performance related pay and appraisal process via range
of toolkits and events
To ensure staff are aware of how they are affected by the new appraisal process
that enables objectives to be set for staff, for self-assessment to take place and
for there to be discussion about levels of achievement and contribution.
From April 2014
Provide a rolling communications programme of between
April and September to feedback to staff the outcomes of
the 2014/15 staff survey communications strategy to
engage support the staff survey 2015/16
To highlight how the trust is addressing some of the negative feedback in the
trust survey. To both encourage staff to engage in some of the programmes and
to take part in the 2015/16 we will focus on one key theme per month including
Bullying, discrimination, raising concerns and training and development
From April 2015
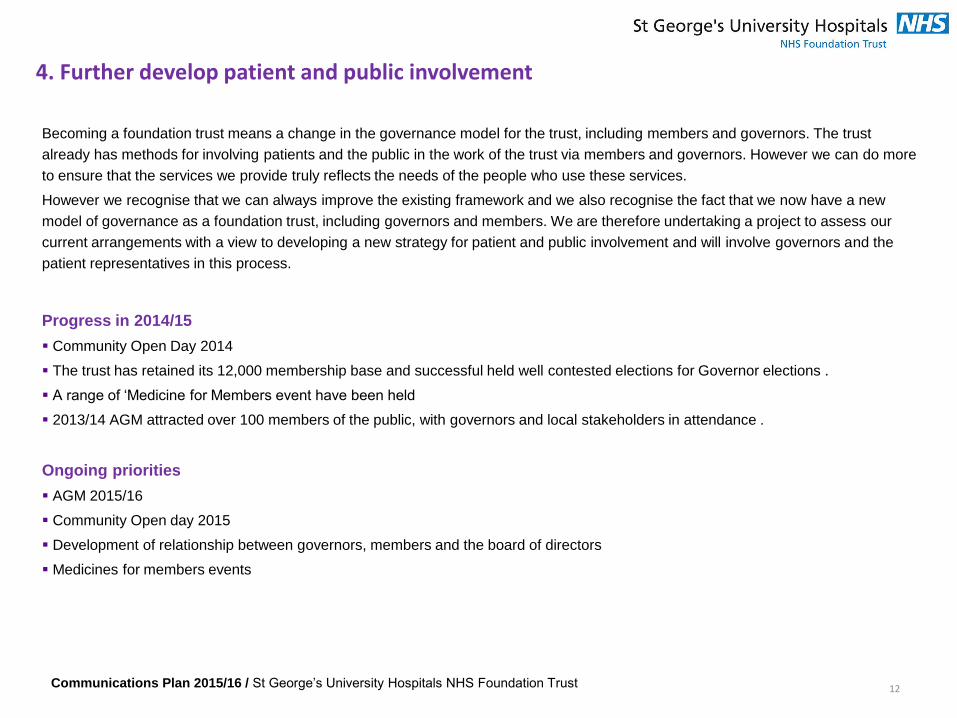
Communications Plan 2015/16 / St George’s University Hospitals NHS Foundation Trust
12
4. Further develop patient and public involvement
Becoming a foundation trust means a change in the governance model for the trust, including members and governors. The trust
already has methods for involving patients and the public in the work of the trust via members and governors. However we can do more
to ensure that the services we provide truly reflects the needs of the people who use these services.
However we recognise that we can always improve the existing framework and we also recognise the fact that we now have a new
model of governance as a foundation trust, including governors and members. We are therefore undertaking a project to assess our
current arrangements with a view to developing a new strategy for patient and public involvement and will involve governors and the
patient representatives in this process.
Progress in 2014/15
Community Open Day 2014
The trust has retained its 12,000 membership base and successful held well contested elections for Governor elections .
A range of ‘Medicine for Members event have been held
2013/14 AGM attracted over 100 members of the public, with governors and local stakeholders in attendance .
Ongoing priorities
AGM 2015/16
Community Open day 2015
Development of relationship between governors, members and the board of directors
Medicines for members events
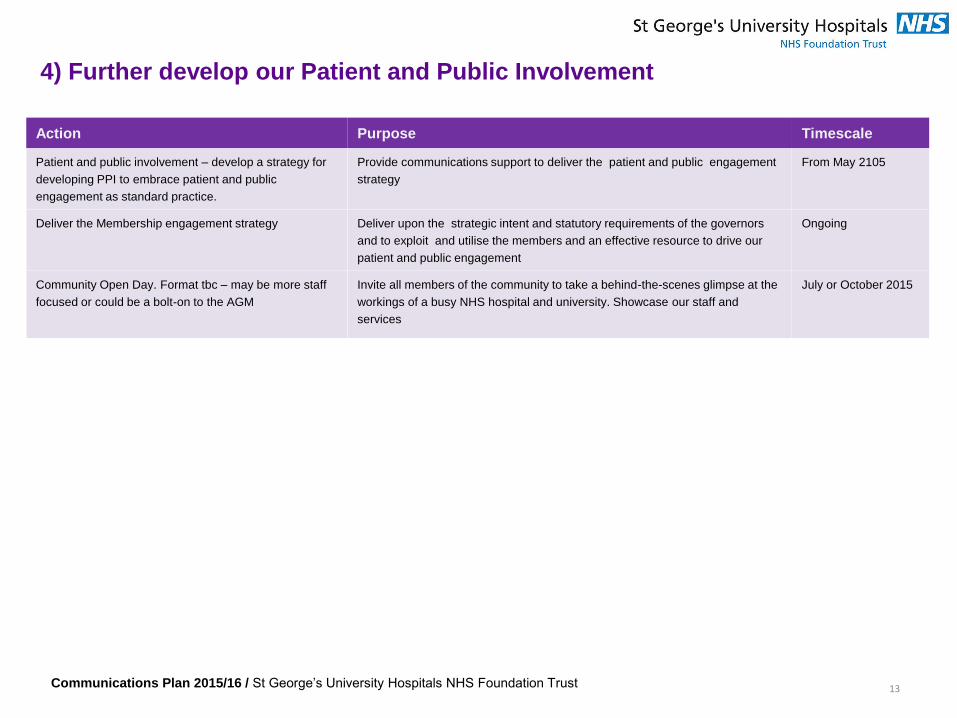
Communications Plan 2015/16 / St George’s University Hospitals NHS Foundation Trust
13
4) Further develop our Patient and Public Involvement
Action Purpose Timescale
Patient and public involvement – develop a strategy for
developing PPI to embrace patient and public
engagement as standard practice.
Provide communications support to deliver the patient and public engagement
strategy
From May 2105
Deliver the Membership engagement strategy Deliver upon the strategic intent and statutory requirements of the governors
and to exploit and utilise the members and an effective resource to drive our
patient and public engagement
Ongoing
Community Open Day. Format tbc – may be more staff
focused or could be a bolt-on to the AGM
Invite all members of the community to take a behind-the-scenes glimpse at the
workings of a busy NHS hospital and university. Showcase our staff and
services
July or October 2015
Communications Plan 2015/16 / St George’s University Hospitals NHS Foundation Trust
5. Enhance our engagement with external stakeholders
14
The work of the communications team involves the management of a desired position for the trust in terms of how it wants to bee seen
by its different stakeholder groups. In 2015/16 we will look to improve our communications approach to meet various stakeholders
needs and expectations We have a number of strategic partnerships which are important to the future of healthcare across south west
London and developing and maintaining these relationships with key partners is vitally important to the achievement of the trust’s vision.
Progress in 2014/15
Relationships with other external stakeholders have been promoted though various media and events and openings of services
Published 5 editions of Gazette including a FT special to celebrate our achievement
Directly communicated with all key stakeholders via email and letter on key strategic decisions or achievements such as achieving FT
status and our the financial environment .
Key external stakeholders attended foundation trust launch event
Supported local MPs at the events, including Sadiq Khan’s coffee morning
Attended GP stakeholder event to gain understanding of the type and frequency of information they require
Ongoing priorities
Gazette
Develop the format for the 2013/14 AGM in July 2015
NIPT - accurate results from a new, low risk and convenient procedure
Extending the existing relationship with Wandsworth Healthwatch and Overview and Scrutiny Committees to other local boroughs.
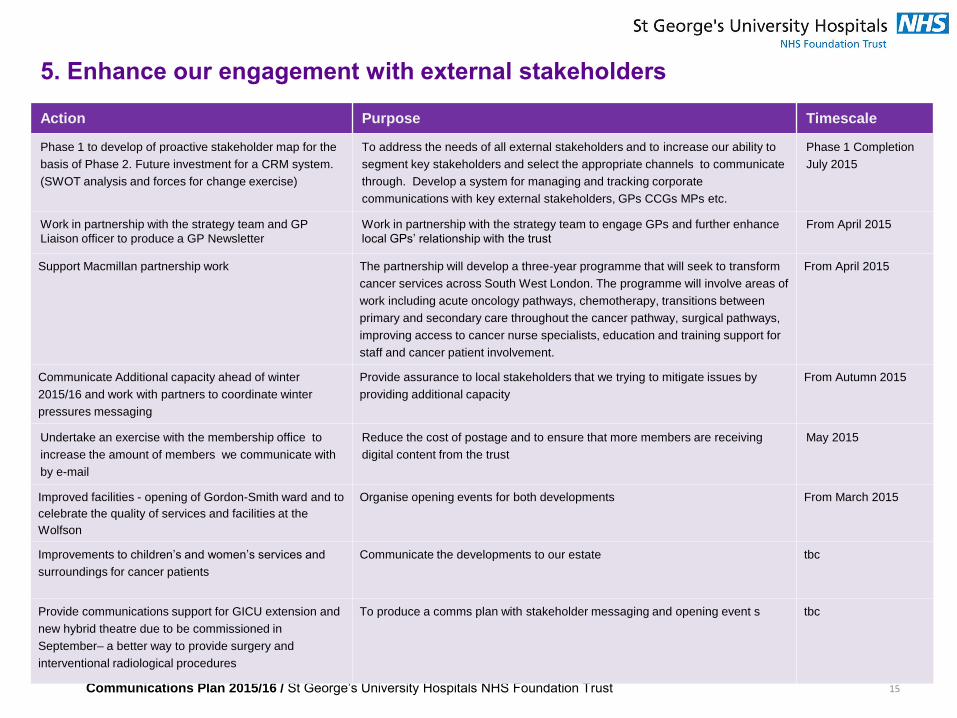
Communications Plan 2015/16 / St George’s University Hospitals NHS Foundation Trust 15
5. Enhance our engagement with external stakeholders
Action Purpose Timescale
Phase 1 to develop of proactive stakeholder map for the
basis of Phase 2. Future investment for a CRM system.
(SWOT analysis and forces for change exercise)
To address the needs of all external stakeholders and to increase our ability to
segment key stakeholders and select the appropriate channels to communicate
through. Develop a system for managing and tracking corporate
communications with key external stakeholders, GPs CCGs MPs etc.
Phase 1 Completion
July 2015
Work in partnership with the strategy team and GP
Liaison officer to produce a GP Newsletter
Work in partnership with the strategy team to engage GPs and further enhance
local GPs’ relationship with the trust
From April 2015
Support Macmillan partnership work The partnership will develop a three-year programme that will seek to transform
cancer services across South West London. The programme will involve areas of
work including acute oncology pathways, chemotherapy, transitions between
primary and secondary care throughout the cancer pathway, surgical pathways,
improving access to cancer nurse specialists, education and training support for
staff and cancer patient involvement.
From April 2015
Communicate Additional capacity ahead of winter
2015/16 and work with partners to coordinate winter
pressures messaging
Provide assurance to local stakeholders that we trying to mitigate issues by
providing additional capacity
From Autumn 2015
Undertake an exercise with the membership office to
increase the amount of members we communicate with
by e-mail
Reduce the cost of postage and to ensure that more members are receiving
digital content from the trust
May 2015
Improved facilities - opening of Gordon-Smith ward and to
celebrate the quality of services and facilities at the
Wolfson
Organise opening events for both developments From March 2015
Improvements to children’s and women’s services and
surroundings for cancer patients
Communicate the developments to our estate tbc
Provide communications support for GICU extension and
new hybrid theatre due to be commissioned in
September– a better way to provide surgery and
interventional radiological procedures
To produce a comms plan with stakeholder messaging and opening event s tbc
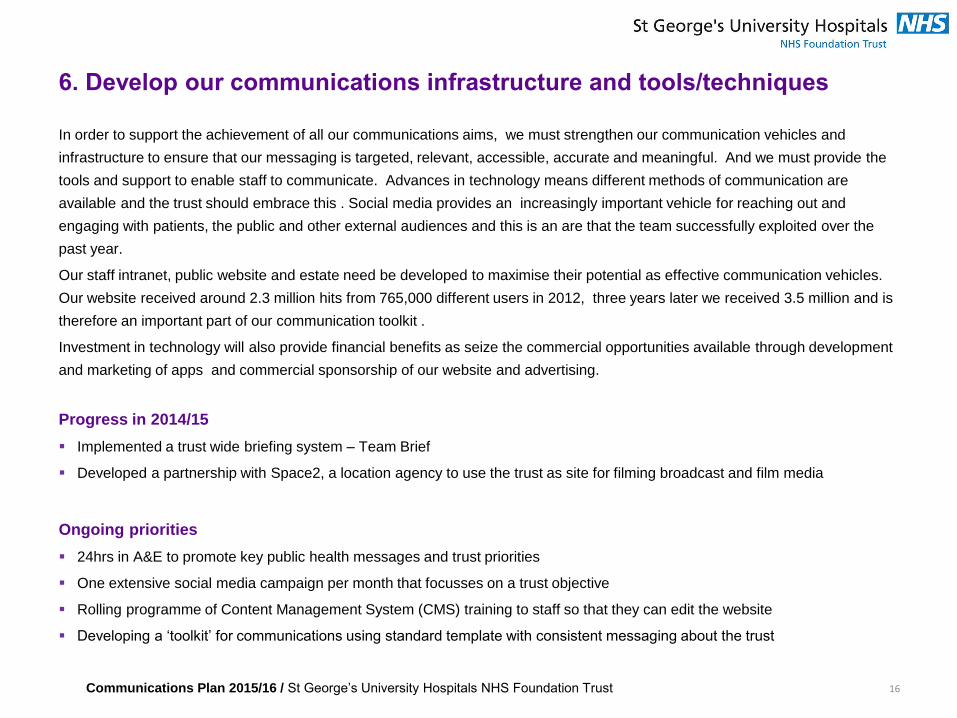
Communications Plan 2015/16 / St George’s University Hospitals NHS Foundation Trust
6. Develop our communications infrastructure and tools/techniques
In order to support the achievement of all our communications aims, we must strengthen our communication vehicles and
infrastructure to ensure that our messaging is targeted, relevant, accessible, accurate and meaningful. And we must provide the
tools and support to enable staff to communicate. Advances in technology means different methods of communication are
available and the trust should embrace this . Social media provides an increasingly important vehicle for reaching out and
engaging with patients, the public and other external audiences and this is an are that the team successfully exploited over the
past year.
Our staff intranet, public website and estate need be developed to maximise their potential as effective communication vehicles.
Our website received around 2.3 million hits from 765,000 different users in 2012, three years later we received 3.5 million and is
therefore an important part of our communication toolkit .
Investment in technology will also provide financial benefits as seize the commercial opportunities available through development
and marketing of apps and commercial sponsorship of our website and advertising.
Progress in 2014/15
Implemented a trust wide briefing system – Team Brief
Developed a partnership with Space2, a location agency to use the trust as site for filming broadcast and film media
Ongoing priorities
24hrs in A&E to promote key public health messages and trust priorities
One extensive social media campaign per month that focusses on a trust objective
Rolling programme of Content Management System (CMS) training to staff so that they can edit the website
Developing a ‘toolkit’ for communications using standard template with consistent messaging about the trust
16

Communications Plan 2015/16 / St George’s University Hospitals NHS Foundation Trust 17
6. Develop our communications infrastructure and tools/techniques
Action Purpose Timescale
Undertake a trust-wide patient information audit. Develop
a planned cycle of patient audits across the trust
To detail an accurate picture of information displayed and distributed to patients
in services, wards and departments across the trust. To further produce
guidelines for a trust wide policy for patient information - a comprehensive report
on the findings and recommendations will be produced before rebranding
From April/May 2015
Work towards NHS England’s Accessible Information
Standard
Compliance with the mandate that trusts should ensure that disabled patients /
service users and, where appropriate, carers, receive information in formats that
they can understand, and that they receive appropriate support to help them to
communicate.
April 2016 (for full
compliance)
Development of a digital strategy - digital
communications is used to represent both
communications channels such as the trust’s website,
intranet sites, teleconferencing, apps, e-mail, tablets,
plasma screens, social media and also how we manage,
create and govern digital content such as website text,
videos, templates, documents and publications
An integrated digital strategy to support both internal and external
communications programmes.
From May 2015
Proactively advertise the trust as a potential sile for
commercial filing opportunities
The communications team has successfully utilised the site as a filming location
over the past 12 months. This has included filming ITV’s Broadchurch, Sky’s
Critical and Britain's got Talent. We have also hosted many smaller production
companies and facilitated the launch of the 24hrs in A&E at the trust. Each of
the projects generates income for the trust
From May 2015
Develop communications team portfolio of services and
publish/make available to teams
Promote improved internal communications through a greater understanding of
the role of communications team and now it can support staff and teams
Completion Aug 2015
Invest in email marketing software Produce standardised email templates for communications with key
stakeholders GPS, MPs, and CCGs. Manage and track responses though a
system that is designed to help you improve your communications
May 2015
Identify and pursue commercial benefits for patient
information, website and communication channels
Secure sponsorship and advertising to maximise income Ongoing

Communications Plan 2015/16 / St George’s University Hospitals NHS Foundation Trust 18
6. Develop our communications infrastructure and tools/techniques
18
Action Purpose Timescale
Work with the strategy and commercial committee to
review the trusts marketing and commercial
opportunities to
To understand the trusts commercial requirements and the relationship to the
communications plan
June 2015
Undertake a scoping and discovery phase with internal
staff to identity staff and business goals through
stakeholder interviews, surveys, focus groups and
workplace observation.
It is important to clearly understand current requirements and how the trust may
grow and change in the future to develop an outline information architecture .
Completion July 2015
Train PALS team to use social media to respond to
complaints
To ensure that there is support to manage the amount of messages the social
media feeds receive on a daily basis
June 2015
Create and publicise resources for services to help them
understand how to use and exploit social media for
marketing purposes
The communications team retains control of the corporate digital
communications channels. With adequate training and support teams and
services could take ownership of campaigns themselves which increases their
professional development
June 2015
Understand how the ‘internal social media’ concept can
help us to improve services , reduce costs and engage
staff
To become a more social organisations- which is about everyone. To encourage
‘social’ the heart of everything we do to genuinely empower staff to improve the
service they provide to patients
From July 2015
Create and publicise resources for services to help them
understand how to use and exploit social media for
marketing purposes
The communications team retains control of the corporate digital
communications channels. With adequate training and support teams and
services could take ownership of campaigns themselves which increases their
professional development
June 2015
Develop a framework for using analytics to better
evaluate the effectiveness of our digital communication
channels .
Improve the measurement and effectiveness of our digital channels From July 2015

TB April 15-10
REPORT TO TRUST BOARD April 2015
Paper Title: Risk and Compliance report for Board incorporating: 1. Board Assurance Framework 2. External assurances
Sponsoring Director: Peter Jenkinson, Director of Corporate Affairs
Author: Sal Maughan, Head of Risk Management
Purpose:
To highlight key risks and provide assurance regarding their management. To provide assurance to Board regarding compliance with external regulatory requirements
Action required by the committee:
To note the report and consider the assurances provided. To request the relevant Board sub-committee review and seek assurance around risks on the CQC IMR.
Document previously considered by: Quality and Risk Committee (QRC)
Executive summary Key Messages As part of the Risk Management Strategy, one action was to separate the Board Assurance Framework (BAF) from the Corporate Risk Register (CRR). Therefore the risks are now transferred to the CRR. The BAF will be developed over the next two months based around the ‘Well led framework for governance’ published by Monitor.
The CRR will include risks escalated from the divisions and top down corporate risks.
The CRR is reviewed in detail with Executive Owners every two months therefore this is an interim report and a fully updated report will be presented to the next meeting.
Controls are developed for all risks, with a rolling programme of review by QRC during 2015. The focus of the April QRC is the ‘Impact of CIPs on quality’ (Ref 02-02)
External Assurances, including the CQC Intelligent Monitoring Report (IMR):
External assurances received during the period are detailed within the report , with no significant issues identified
A summary of the new risks identified in the Care Quality Commission Intelligent Monitoring draft report, published in April 2014 are included. An assurance regarding each new risk is also included and the Trust awaits final publication in June.
The recommendation to the Trust Board is to request that the relevant Trust Board sub-committee review the risks contained in the CQC IMR and seek assurance around actions underway to address these.
Risks The most significant risks on the Corporate Risk Register are detailed within the report.
Related Corporate Objective: Reference to corporate objective that this paper refers to.
All
Related CQC Standard: Reference to CQC standard that this paper refers to.
All CQC Fundamental standards & regulations
Equality Impact Assessment (EIA): Has an EIA been carried out? Yes If yes, please provide a summary of the key findings
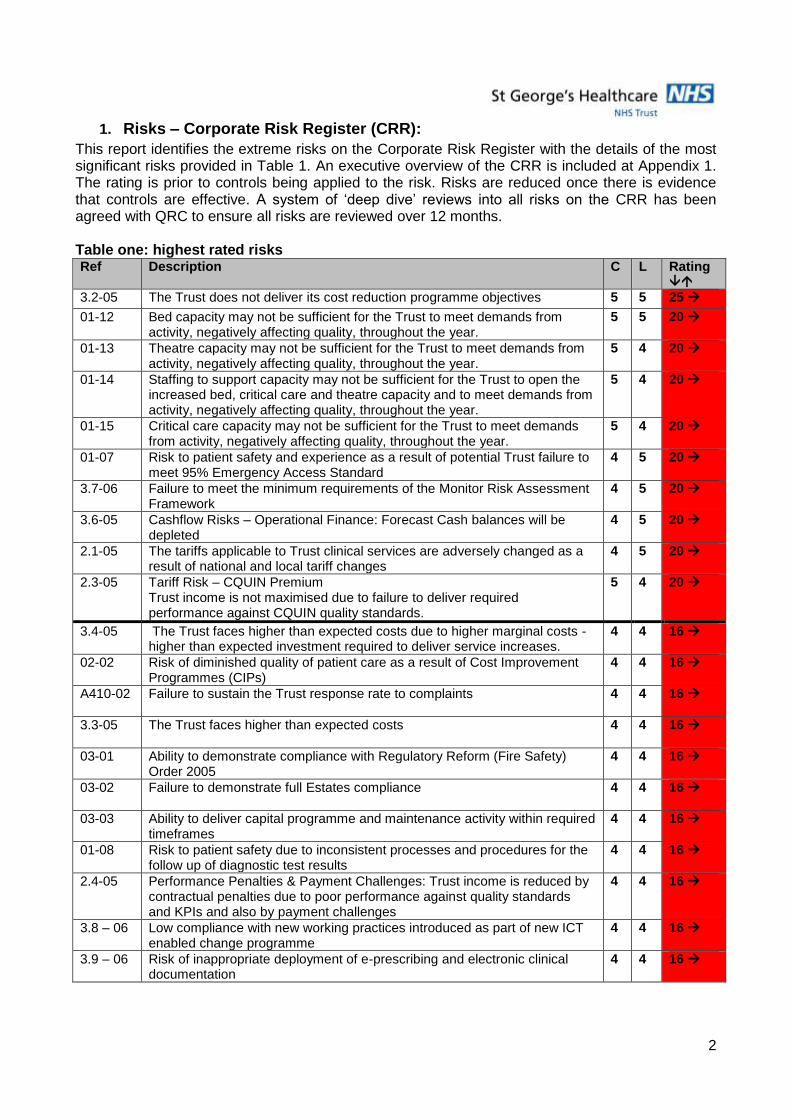
2
1. Risks – Corporate Risk Register (CRR):
This report identifies the extreme risks on the Corporate Risk Register with the details of the most significant risks provided in Table 1. An executive overview of the CRR is included at Appendix 1. The rating is prior to controls being applied to the risk. Risks are reduced once there is evidence that controls are effective. A system of ‘deep dive’ reviews into all risks on the CRR has been agreed with QRC to ensure all risks are reviewed over 12 months. Table one: highest rated risks Ref Description C L Rating
3.2-05 The Trust does not deliver its cost reduction programme objectives 5 5 25
01-12 Bed capacity may not be sufficient for the Trust to meet demands from activity, negatively affecting quality, throughout the year.
5 5 20
01-13 Theatre capacity may not be sufficient for the Trust to meet demands from activity, negatively affecting quality, throughout the year.
5 4 20
01-14 Staffing to support capacity may not be sufficient for the Trust to open the increased bed, critical care and theatre capacity and to meet demands from activity, negatively affecting quality, throughout the year.
5 4 20
01-15 Critical care capacity may not be sufficient for the Trust to meet demands from activity, negatively affecting quality, throughout the year.
5 4 20
01-07 Risk to patient safety and experience as a result of potential Trust failure to meet 95% Emergency Access Standard
4 5 20
3.7-06 Failure to meet the minimum requirements of the Monitor Risk Assessment Framework
4 5 20
3.6-05 Cashflow Risks – Operational Finance: Forecast Cash balances will be depleted
4 5 20
2.1-05 The tariffs applicable to Trust clinical services are adversely changed as a result of national and local tariff changes
4 5 20
2.3-05 Tariff Risk – CQUIN Premium Trust income is not maximised due to failure to deliver required performance against CQUIN quality standards.
5 4 20
3.4-05 The Trust faces higher than expected costs due to higher marginal costs - higher than expected investment required to deliver service increases.
4 4 16
02-02 Risk of diminished quality of patient care as a result of Cost Improvement Programmes (CIPs)
4 4 16
A410-02 Failure to sustain the Trust response rate to complaints
4 4 16
3.3-05 The Trust faces higher than expected costs
4 4 16
03-01 Ability to demonstrate compliance with Regulatory Reform (Fire Safety) Order 2005
4 4 16
03-02 Failure to demonstrate full Estates compliance
4 4 16
03-03 Ability to deliver capital programme and maintenance activity within required timeframes
4 4 16
01-08 Risk to patient safety due to inconsistent processes and procedures for the follow up of diagnostic test results
4 4 16
2.4-05 Performance Penalties & Payment Challenges: Trust income is reduced by contractual penalties due to poor performance against quality standards and KPIs and also by payment challenges
4 4 16
3.8 – 06 Low compliance with new working practices introduced as part of new ICT enabled change programme
4 4 16
3.9 – 06 Risk of inappropriate deployment of e-prescribing and electronic clinical documentation
4 4 16
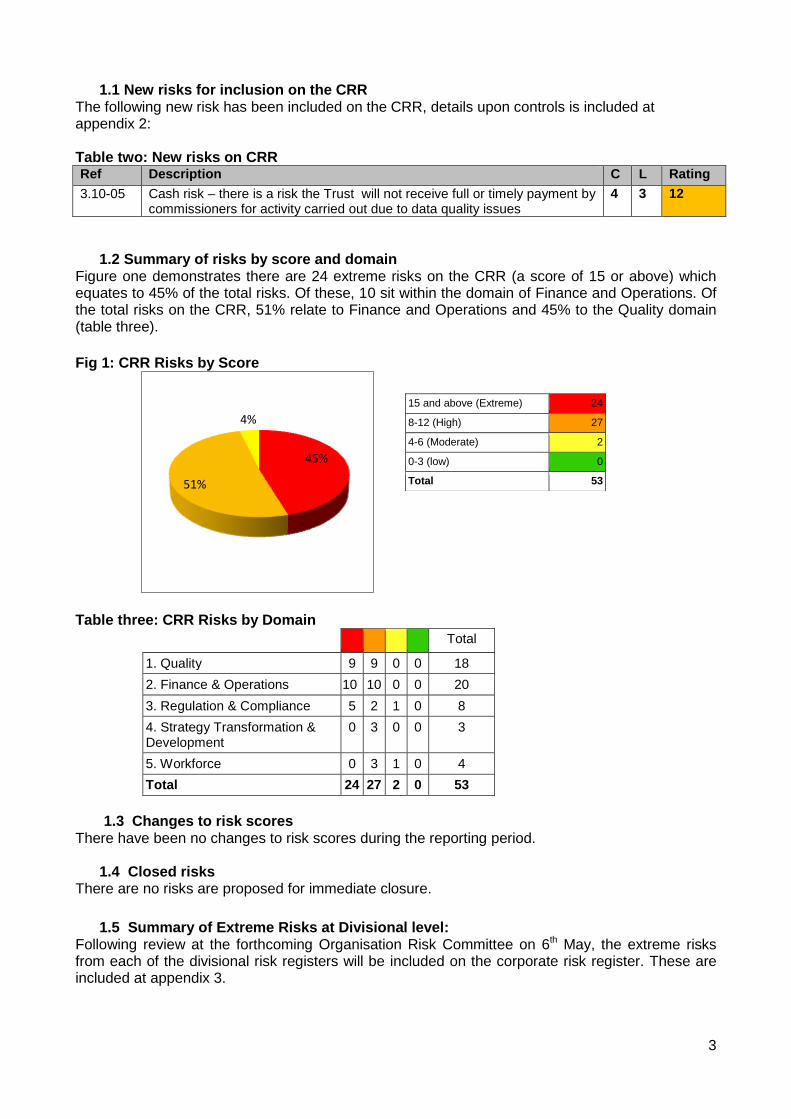
3
1.1 New risks for inclusion on the CRR The following new risk has been included on the CRR, details upon controls is included at appendix 2: Table two: New risks on CRR Ref Description C L Rating
3.10-05 Cash risk – there is a risk the Trust will not receive full or timely payment by commissioners for activity carried out due to data quality issues
4 3 12
1.2 Summary of risks by score and domain Figure one demonstrates there are 24 extreme risks on the CRR (a score of 15 or above) which equates to 45% of the total risks. Of these, 10 sit within the domain of Finance and Operations. Of the total risks on the CRR, 51% relate to Finance and Operations and 45% to the Quality domain (table three).
Fig 1: CRR Risks by Score
Table three: CRR Risks by Domain
Total
1. Quality 9 9 0 0 18
2. Finance & Operations 10 10 0 0 20
3. Regulation & Compliance 5 2 1 0 8
4. Strategy Transformation & Development
0 3 0 0 3
5. Workforce 0 3 1 0 4
Total 24 27 2 0 53
1.3 Changes to risk scores
There have been no changes to risk scores during the reporting period.
1.4 Closed risks There are no risks are proposed for immediate closure.
1.5 Summary of Extreme Risks at Divisional level: Following review at the forthcoming Organisation Risk Committee on 6th May, the extreme risks from each of the divisional risk registers will be included on the corporate risk register. These are included at appendix 3.
45%
51%
4%
15 and above (Extreme) 24
8-12 (High) 27
4-6 (Moderate) 2
0-3 (low) 0
Total 53
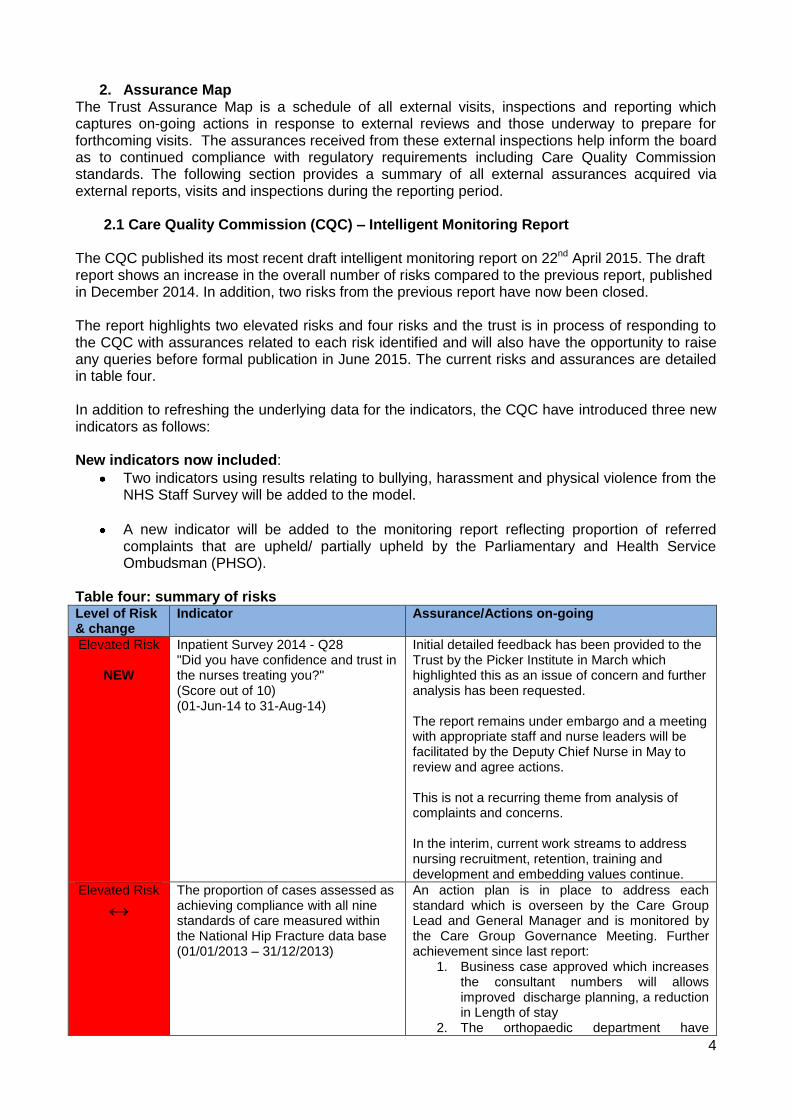
4
2. Assurance Map The Trust Assurance Map is a schedule of all external visits, inspections and reporting which captures on-going actions in response to external reviews and those underway to prepare for forthcoming visits. The assurances received from these external inspections help inform the board as to continued compliance with regulatory requirements including Care Quality Commission standards. The following section provides a summary of all external assurances acquired via external reports, visits and inspections during the reporting period.
2.1 Care Quality Commission (CQC) – Intelligent Monitoring Report
The CQC published its most recent draft intelligent monitoring report on 22nd April 2015. The draft report shows an increase in the overall number of risks compared to the previous report, published in December 2014. In addition, two risks from the previous report have now been closed. The report highlights two elevated risks and four risks and the trust is in process of responding to the CQC with assurances related to each risk identified and will also have the opportunity to raise any queries before formal publication in June 2015. The current risks and assurances are detailed in table four. In addition to refreshing the underlying data for the indicators, the CQC have introduced three new indicators as follows: New indicators now included:
Two indicators using results relating to bullying, harassment and physical violence from the NHS Staff Survey will be added to the model.
A new indicator will be added to the monitoring report reflecting proportion of referred complaints that are upheld/ partially upheld by the Parliamentary and Health Service Ombudsman (PHSO).
Table four: summary of risks Level of Risk & change
Indicator Assurance/Actions on-going
Elevated Risk
NEW
Inpatient Survey 2014 - Q28 "Did you have confidence and trust in the nurses treating you?" (Score out of 10) (01-Jun-14 to 31-Aug-14)
Initial detailed feedback has been provided to the Trust by the Picker Institute in March which highlighted this as an issue of concern and further analysis has been requested. The report remains under embargo and a meeting with appropriate staff and nurse leaders will be facilitated by the Deputy Chief Nurse in May to review and agree actions. This is not a recurring theme from analysis of complaints and concerns. In the interim, current work streams to address nursing recruitment, retention, training and development and embedding values continue.
Elevated Risk
↔ The proportion of cases assessed as achieving compliance with all nine standards of care measured within the National Hip Fracture data base (01/01/2013 – 31/12/2013)
An action plan is in place to address each standard which is overseen by the Care Group Lead and General Manager and is monitored by the Care Group Governance Meeting. Further achievement since last report:
1. Business case approved which increases the consultant numbers will allows improved discharge planning, a reduction in Length of stay
2. The orthopaedic department have

5
redeveloped the theatre template to accommodate additional trauma capacity.
3. A second ortho-geriatrician is in post and a further 3 PAs have now started hence the shared workload should mean the service will be able to meet this standard.
It is anticipated the next audit will demonstrate improvements and result in a commensurate reduction in the risk.
Risk
↓
(Previously an elevated risk)
Emergency readmissions with an overnight stay following an elective admission (01/04/2013 – 31/03/2014)
Re-admission profile by month from Aug-13 to May-14 showed our re-admission rate as having a high elevated risk from Oct-13 to Feb-14. However, from March onwards this reduced back to within expected range and for April and May our re-admissions are below that of the national average which is positive this has led to the risk being re-evaluated from a previous elevated risk. This position internally remains unchanged.
Risk Incidence of Methicillin-resistant Staphylococcus aureus (MRSA) (01-Aug-13 to 31-Jul-14)
The Trust has now reported 6 MRSA bacteraemia cases to the end of March (within de minimis limit for 2014/15) This is currently a high risk on the CRR: A513-01 and detailed assurance is provided to the Board through the Quality report.
Risk
NEW
Composite risk rating of ESR items relating to staff turnover (01-Jan-14 to 31-Dec-14)
The Trust is aware of the risk associated with high staff turnover and there is a high risk on the Corporate Risk Register 5.1-01 with a number of controls in place to address. The Trust has a target to reduce turnover and a workforce strategy plan that supports this work which reports to the workforce and education committee.
Risk
NEW
Composite indicator: NHS staff survey questions relating to abuse from other staff (01-Sep-14 to 31-Dec-14)
The Trust is aware of the high number of staff who report bullying and harassment as highlighted by the staff survey and has a strategy to reduce levels of bullying in the trust and to support staff. There is a risk on the Corporate Risk in to this A518-04 with detailed controls in place.
Closed In-hospital mortality – trauma and orthopaedic conditions (01/04/2012 – 18/06/2014).
Closed NHS Staff Survey - KF10. The proportion of staff receiving health and safety training in last 12 months (01-Sep-13 to 31-Dec-13)
2.2 Summary of external assurance and third party inspections March/April 2015 The QRC seeks assurance, on behalf of the Trust Board, around the progress and appropriateness of actions in place to address any issues of non-conformities identified through an external or third party inspection or peer review. A summary of external assurances acquired via external reports, visits and inspections during the reporting period is provided as follows:
2.2.1 HMP Inspector of Prisons / CQC Visit to HMP Wandsworth March 2015 The HM Inspector of Prisons carried out a full inspection of HMP Wandsworth across a three week period in March. This was a dual inspection with CQC inspectors and was based upon the HMP governance Framework ‘Expectations’ of which one domain is ‘Respect’. Healthcare services
6
come under this domain and the CQC inspected healthcare services in relation to this and the CQC standards. Formal feedback from the CQC was provided on 5th March, there were no major concerns or matters of non-compliance identified and the draft report has now been shared. An action plan is being developed to address the findings ahead of receiving the final report and will be presented to the Patient Safety Committee in May 2015. The CQC will not issue a stand-alone report following this inspection but will contribute to the overall HMIP report.
2.2.2 Health and Safety Executive – Mortuary The Health and Safety Executive (HSE) carried out an inspection in the Mortuary on 25th March which encompassed a review of policies and procedures and facilities and equipment particularly in relation to high risk post mortems. The HSE were assured that any identified issues were already being managed appropriately and there were no significant issues of concern. The HSE wrote to the Trust on 23rd April to advise of three issues requiring remedial action and the Trust will respond to set out how it will do this by 8th May 2015.
2.2.3 Civil Aviation Authority (CAA) helipad inspection
Hospital helipads are exempt from being licenced by the CAA, however, the St George’s Hospital helipad commissioned a visit to check levels of compliance and that all risk assessments are fit for purpose. The outcome of the visit was positive and in particular the CAA commended the dedicated helipad team and building layout.
2.2.4. 2015 General Medical Council National Training Survey As part of the annual Trainee Survey in relation, a concern was identified by the Pan-London Quality and Regulation Unit and categorised as potentially high risk requiring immediate attention. Once notified of the concern, which relates to quality of handover, discharge planning and leadership at Queen Mary’s Site; rehabilitation, the Trust has a period of three weeks to investigate and respond to the concern. An immediate investigation was instigated by the Chief Nurse and the outcome will inform the response to the Q&R unit/GMC with assurances around actions taken in due course.
2.3 Forthcoming external inspections
2.3.1 PLACE – Patient Led Assessments of the Care Environment PLACE is the system for assessing the quality of the patient environment, replacing the old Patient Environment Action Team (PEAT) inspections. The Trust anticipates it will undergo assessment some time during May and all areas are being fully prepared for assessment supported by Estates and Facilities teams.
2.3.2 Anaesthesia Clinical Services Accreditation (ACSA) – May 2015 The Trust continues its preparations for the forthcoming inspection by the Royal College of Anaesthetists in may in anticipation of achieving accreditation in May.
3. Conclusion
There are detailed action plans in place to address the issues identified through external inspections, and these are monitored by the QRC. The Trust Board can be assured that no significant risks have been identified through external inspections and reports received during the reporting period.
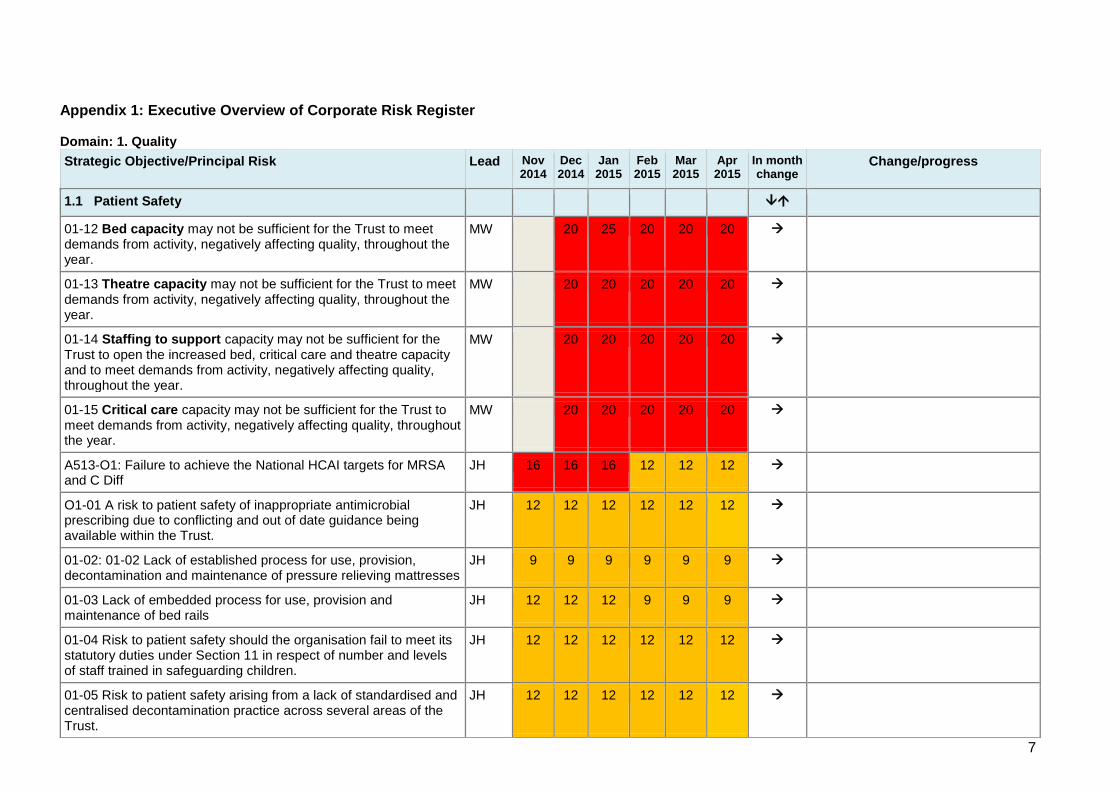
7
Appendix 1: Executive Overview of Corporate Risk Register Domain: 1. Quality
Strategic Objective/Principal Risk Lead Nov 2014
Dec 2014
Jan 2015
Feb 2015
Mar 2015
Apr 2015
In month change
Change/progress
1.1 Patient Safety
01-12 Bed capacity may not be sufficient for the Trust to meet demands from activity, negatively affecting quality, throughout the year.
MW 20 25 20 20 20
01-13 Theatre capacity may not be sufficient for the Trust to meet demands from activity, negatively affecting quality, throughout the year.
MW 20 20 20 20 20
01-14 Staffing to support capacity may not be sufficient for the Trust to open the increased bed, critical care and theatre capacity and to meet demands from activity, negatively affecting quality, throughout the year.
MW 20 20 20 20 20
01-15 Critical care capacity may not be sufficient for the Trust to meet demands from activity, negatively affecting quality, throughout the year.
MW 20 20 20 20 20
A513-O1: Failure to achieve the National HCAI targets for MRSA and C Diff
JH 16 16 16 12 12 12
O1-01 A risk to patient safety of inappropriate antimicrobial prescribing due to conflicting and out of date guidance being available within the Trust.
JH 12 12 12 12 12 12
01-02: 01-02 Lack of established process for use, provision, decontamination and maintenance of pressure relieving mattresses
JH 9 9 9 9 9 9
01-03 Lack of embedded process for use, provision and maintenance of bed rails
JH 12 12 12 9 9 9
01-04 Risk to patient safety should the organisation fail to meet its statutory duties under Section 11 in respect of number and levels of staff trained in safeguarding children.
JH 12 12 12 12 12 12
01-05 Risk to patient safety arising from a lack of standardised and centralised decontamination practice across several areas of the Trust.
JH 12 12 12 12 12 12
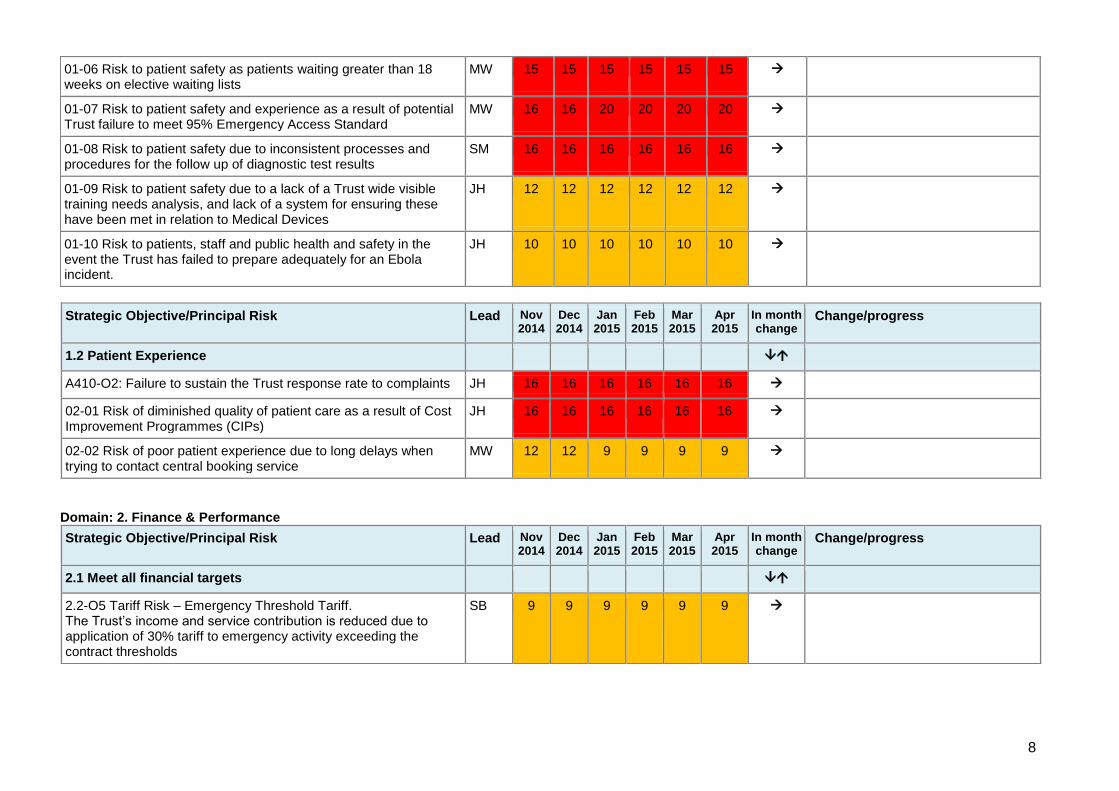
8
Strategic Objective/Principal Risk Lead Nov 2014
Dec 2014
Jan 2015
Feb 2015
Mar 2015
Apr 2015
In month change
Change/progress
1.2 Patient Experience
A410-O2: Failure to sustain the Trust response rate to complaints JH 16 16 16 16 16 16
02-01 Risk of diminished quality of patient care as a result of Cost Improvement Programmes (CIPs)
JH 16 16 16 16 16 16
02-02 Risk of poor patient experience due to long delays when trying to contact central booking service
MW 12 12 9 9 9 9
Domain: 2. Finance & Performance
Strategic Objective/Principal Risk Lead Nov 2014
Dec 2014
Jan 2015
Feb 2015
Mar 2015
Apr 2015
In month change
Change/progress
2.1 Meet all financial targets
2.2-O5 Tariff Risk – Emergency Threshold Tariff. The Trust’s income and service contribution is reduced due to application of 30% tariff to emergency activity exceeding the contract thresholds
SB 9 9 9 9 9 9
01-06 Risk to patient safety as patients waiting greater than 18 weeks on elective waiting lists
MW 15 15 15 15 15 15
01-07 Risk to patient safety and experience as a result of potential Trust failure to meet 95% Emergency Access Standard
MW 16 16 20 20 20 20
01-08 Risk to patient safety due to inconsistent processes and procedures for the follow up of diagnostic test results
SM 16 16 16 16 16 16
01-09 Risk to patient safety due to a lack of a Trust wide visible training needs analysis, and lack of a system for ensuring these have been met in relation to Medical Devices
JH 12 12 12 12 12 12
01-10 Risk to patients, staff and public health and safety in the event the Trust has failed to prepare adequately for an Ebola incident.
JH 10 10 10 10 10 10
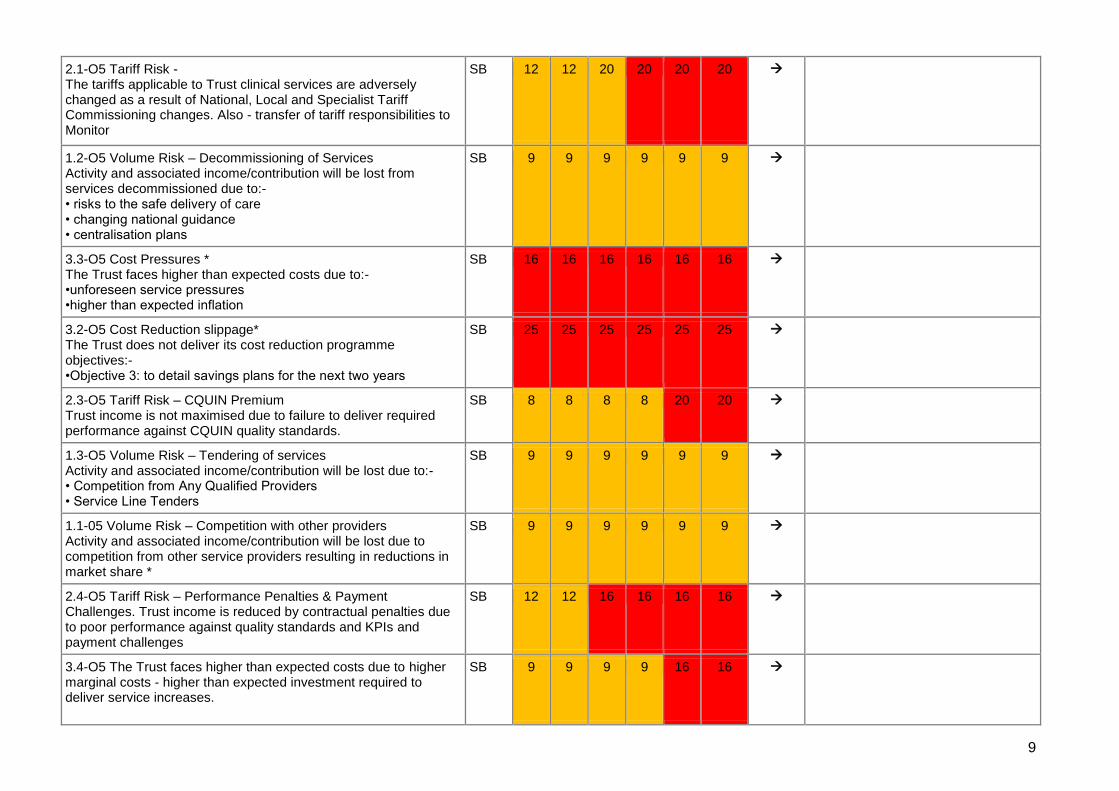
9
2.1-O5 Tariff Risk - The tariffs applicable to Trust clinical services are adversely changed as a result of National, Local and Specialist Tariff Commissioning changes. Also - transfer of tariff responsibilities to Monitor
SB 12 12 20 20 20 20
1.2-O5 Volume Risk – Decommissioning of Services Activity and associated income/contribution will be lost from services decommissioned due to:- • risks to the safe delivery of care • changing national guidance • centralisation plans
SB 9 9 9 9 9 9
3.3-O5 Cost Pressures * The Trust faces higher than expected costs due to:- •unforeseen service pressures •higher than expected inflation
SB 16 16 16 16 16 16
3.2-O5 Cost Reduction slippage* The Trust does not deliver its cost reduction programme objectives:- •Objective 3: to detail savings plans for the next two years
SB 25 25 25 25 25 25
2.3-O5 Tariff Risk – CQUIN Premium Trust income is not maximised due to failure to deliver required performance against CQUIN quality standards.
SB 8 8 8 8 20 20
1.3-O5 Volume Risk – Tendering of services Activity and associated income/contribution will be lost due to:- • Competition from Any Qualified Providers • Service Line Tenders
SB 9 9 9 9 9 9
1.1-05 Volume Risk – Competition with other providers Activity and associated income/contribution will be lost due to competition from other service providers resulting in reductions in market share *
SB 9 9 9 9 9 9
2.4-O5 Tariff Risk – Performance Penalties & Payment Challenges. Trust income is reduced by contractual penalties due to poor performance against quality standards and KPIs and payment challenges
SB 12 12 16 16 16 16
3.4-O5 The Trust faces higher than expected costs due to higher marginal costs - higher than expected investment required to deliver service increases.
SB 9 9 9 9 16 16
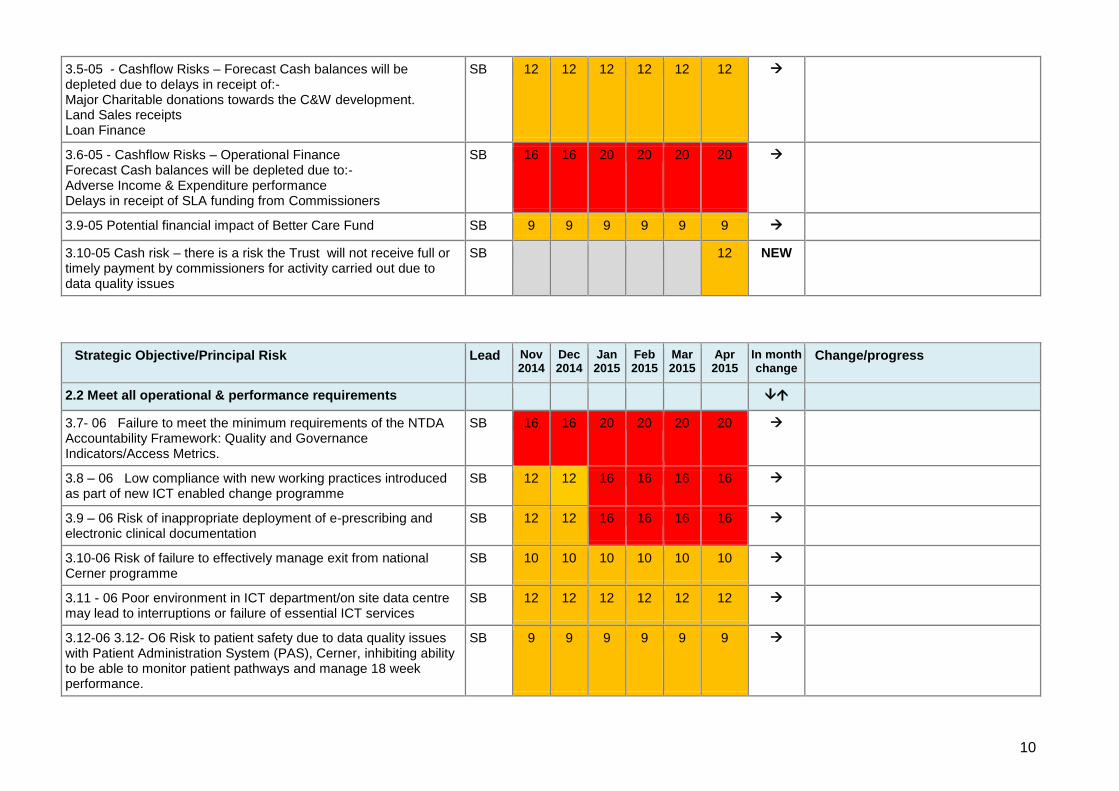
10
3.5-05 - Cashflow Risks – Forecast Cash balances will be depleted due to delays in receipt of:- Major Charitable donations towards the C&W development. Land Sales receipts Loan Finance
SB 12 12 12 12 12 12
3.6-05 - Cashflow Risks – Operational Finance Forecast Cash balances will be depleted due to:- Adverse Income & Expenditure performance Delays in receipt of SLA funding from Commissioners
SB 16 16 20 20 20 20
3.9-05 Potential financial impact of Better Care Fund SB 9 9 9 9 9 9
3.10-05 Cash risk – there is a risk the Trust will not receive full or timely payment by commissioners for activity carried out due to data quality issues
SB 12 NEW
Strategic Objective/Principal Risk Lead Nov 2014
Dec 2014
Jan 2015
Feb 2015
Mar 2015
Apr 2015
In month change
Change/progress
2.2 Meet all operational & performance requirements
3.7- 06 Failure to meet the minimum requirements of the NTDA Accountability Framework: Quality and Governance Indicators/Access Metrics.
SB 16 16 20 20 20 20
3.8 – 06 Low compliance with new working practices introduced as part of new ICT enabled change programme
SB 12 12 16 16 16 16
3.9 – 06 Risk of inappropriate deployment of e-prescribing and electronic clinical documentation
SB 12 12 16 16 16 16
3.10-06 Risk of failure to effectively manage exit from national Cerner programme
SB 10 10 10 10 10 10
3.11 - 06 Poor environment in ICT department/on site data centre may lead to interruptions or failure of essential ICT services
SB 12 12 12 12 12 12
3.12-06 3.12- O6 Risk to patient safety due to data quality issues with Patient Administration System (PAS), Cerner, inhibiting ability to be able to monitor patient pathways and manage 18 week performance.
SB 9 9 9 9 9 9
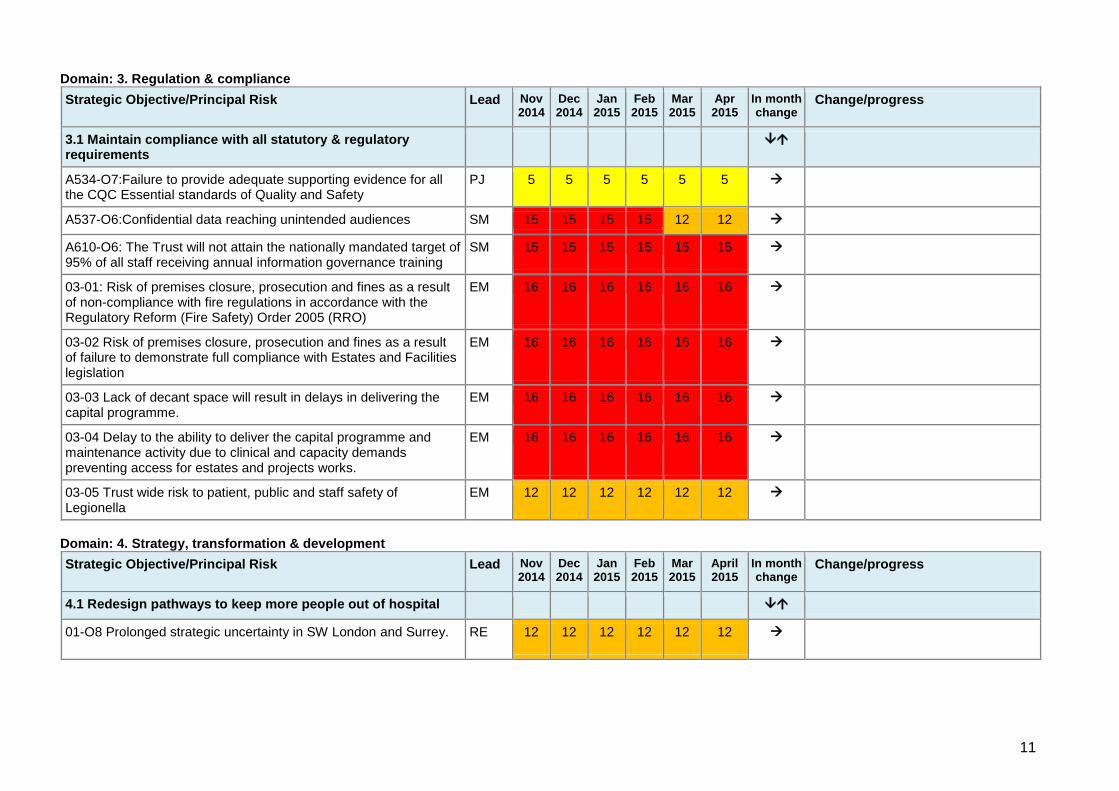
11
Domain: 3. Regulation & compliance
Strategic Objective/Principal Risk Lead Nov 2014
Dec 2014
Jan 2015
Feb 2015
Mar 2015
Apr 2015
In month change
Change/progress
3.1 Maintain compliance with all statutory & regulatory requirements
A534-O7:Failure to provide adequate supporting evidence for all the CQC Essential standards of Quality and Safety
PJ 5 5 5 5 5 5
A537-O6:Confidential data reaching unintended audiences SM 15 15 15 15 12 12
A610-O6: The Trust will not attain the nationally mandated target of 95% of all staff receiving annual information governance training
SM 15 15 15 15 15 15
03-01: Risk of premises closure, prosecution and fines as a result of non-compliance with fire regulations in accordance with the Regulatory Reform (Fire Safety) Order 2005 (RRO)
EM 16 16 16 16 16 16
03-02 Risk of premises closure, prosecution and fines as a result of failure to demonstrate full compliance with Estates and Facilities legislation
EM 16 16 16 16 16 16
03-03 Lack of decant space will result in delays in delivering the capital programme.
EM 16 16 16 16 16 16
03-04 Delay to the ability to deliver the capital programme and maintenance activity due to clinical and capacity demands preventing access for estates and projects works.
EM 16 16 16 16 16 16
03-05 Trust wide risk to patient, public and staff safety of Legionella
EM 12 12 12 12 12 12
Domain: 4. Strategy, transformation & development
Strategic Objective/Principal Risk Lead Nov 2014
Dec 2014
Jan 2015
Feb 2015
Mar 2015
April 2015
In month change
Change/progress
4.1 Redesign pathways to keep more people out of hospital
01-O8 Prolonged strategic uncertainty in SW London and Surrey.
RE 12 12 12 12 12 12
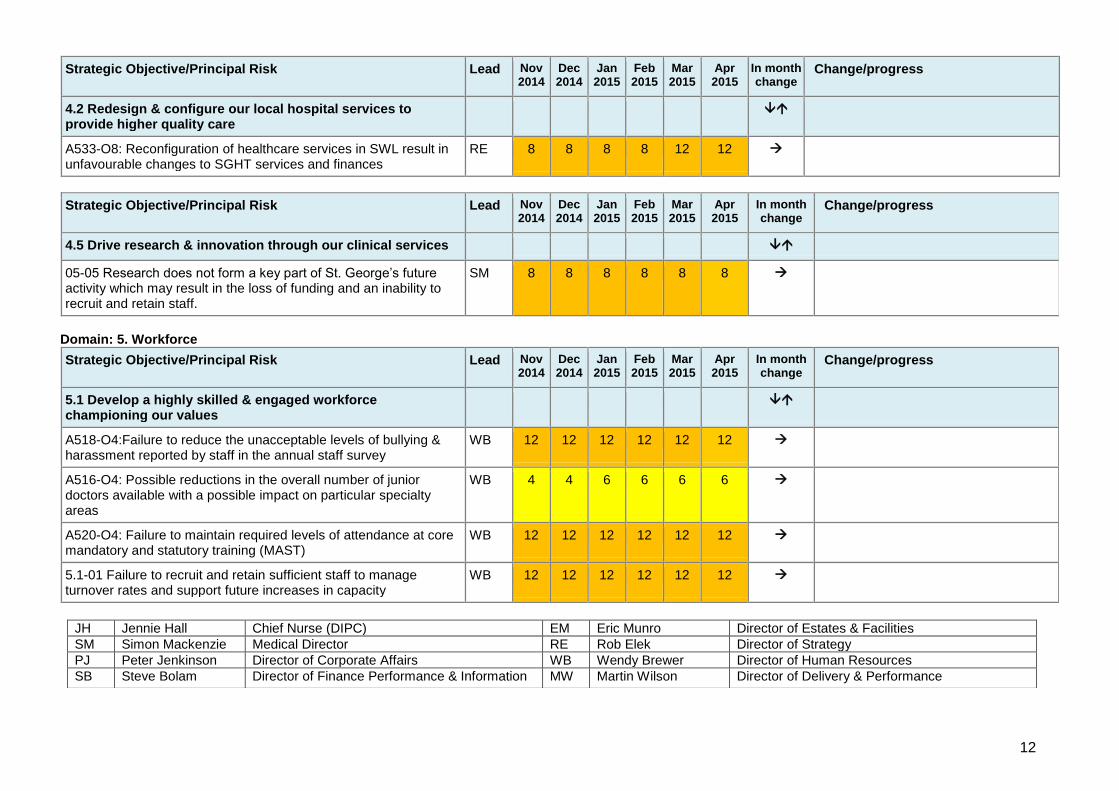
12
Strategic Objective/Principal Risk Lead Nov 2014
Dec 2014
Jan 2015
Feb 2015
Mar 2015
Apr 2015
In month change
Change/progress
4.2 Redesign & configure our local hospital services to provide higher quality care
A533-O8: Reconfiguration of healthcare services in SWL result in unfavourable changes to SGHT services and finances
RE 8 8 8 8 12 12
Strategic Objective/Principal Risk Lead Nov 2014
Dec 2014
Jan 2015
Feb 2015
Mar 2015
Apr 2015
In month change
Change/progress
4.5 Drive research & innovation through our clinical services
05-05 Research does not form a key part of St. George’s future activity which may result in the loss of funding and an inability to recruit and retain staff.
SM 8 8 8 8 8 8
Domain: 5. Workforce
Strategic Objective/Principal Risk Lead Nov 2014
Dec 2014
Jan 2015
Feb 2015
Mar 2015
Apr 2015
In month change
Change/progress
5.1 Develop a highly skilled & engaged workforce championing our values
A518-O4:Failure to reduce the unacceptable levels of bullying & harassment reported by staff in the annual staff survey
WB 12 12 12 12 12 12
A516-O4: Possible reductions in the overall number of junior doctors available with a possible impact on particular specialty areas
WB 4 4 6 6 6 6
A520-O4: Failure to maintain required levels of attendance at core mandatory and statutory training (MAST)
WB 12 12 12 12 12 12
5.1-01 Failure to recruit and retain sufficient staff to manage turnover rates and support future increases in capacity
WB 12 12 12 12 12 12
JH Jennie Hall Chief Nurse (DIPC) EM Eric Munro Director of Estates & Facilities
SM Simon Mackenzie Medical Director RE Rob Elek Director of Strategy
PJ Peter Jenkinson Director of Corporate Affairs WB Wendy Brewer Director of Human Resources
SB Steve Bolam Director of Finance Performance & Information MW Martin Wilson Director of Delivery & Performance
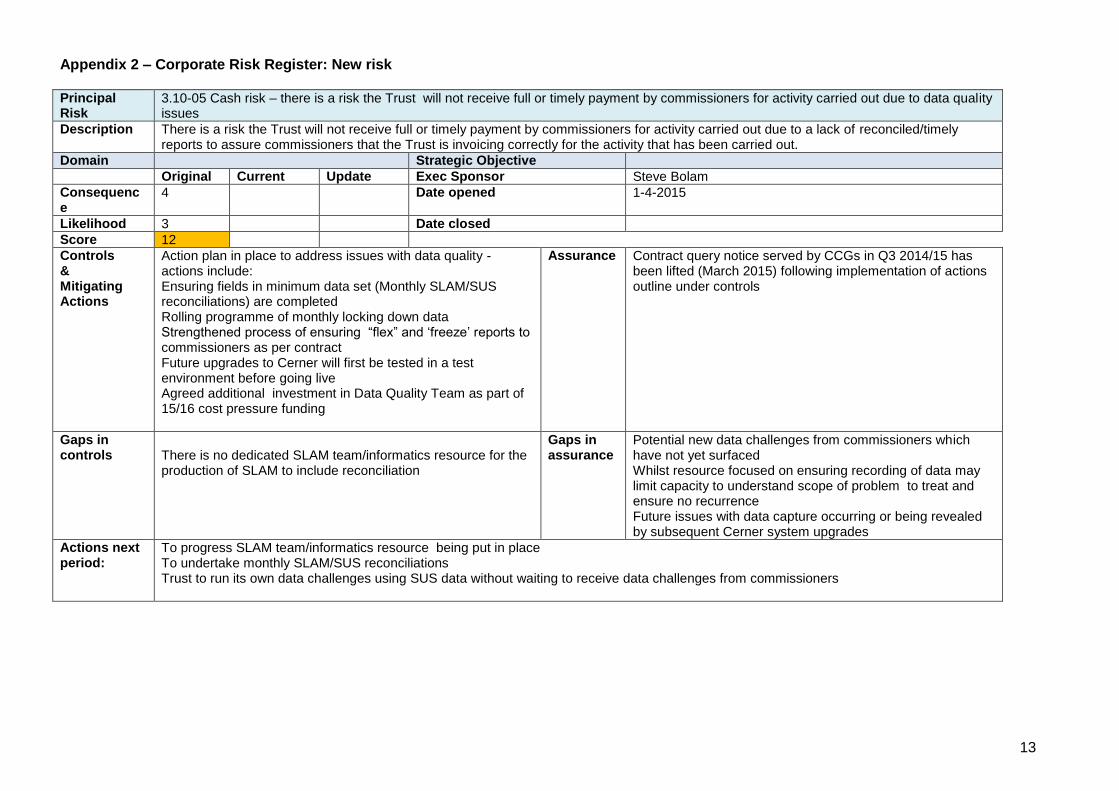
13
Appendix 2 – Corporate Risk Register: New risk Principal Risk
3.10-05 Cash risk – there is a risk the Trust will not receive full or timely payment by commissioners for activity carried out due to data quality issues
Description There is a risk the Trust will not receive full or timely payment by commissioners for activity carried out due to a lack of reconciled/timely reports to assure commissioners that the Trust is invoicing correctly for the activity that has been carried out.
Domain Strategic Objective
Original Current Update Exec Sponsor Steve Bolam
Consequence
4 Date opened 1-4-2015
Likelihood 3 Date closed
Score 12
Controls & Mitigating Actions
Action plan in place to address issues with data quality - actions include: Ensuring fields in minimum data set (Monthly SLAM/SUS reconciliations) are completed Rolling programme of monthly locking down data Strengthened process of ensuring “flex” and ‘freeze’ reports to commissioners as per contract Future upgrades to Cerner will first be tested in a test environment before going live Agreed additional investment in Data Quality Team as part of 15/16 cost pressure funding
Assurance Contract query notice served by CCGs in Q3 2014/15 has been lifted (March 2015) following implementation of actions outline under controls
Gaps in controls
There is no dedicated SLAM team/informatics resource for the production of SLAM to include reconciliation
Gaps in assurance
Potential new data challenges from commissioners which have not yet surfaced Whilst resource focused on ensuring recording of data may limit capacity to understand scope of problem to treat and ensure no recurrence Future issues with data capture occurring or being revealed by subsequent Cerner system upgrades
Actions next period:
To progress SLAM team/informatics resource being put in place To undertake monthly SLAM/SUS reconciliations Trust to run its own data challenges using SUS data without waiting to receive data challenges from commissioners

14
Appendix 3– Divisional Extreme Risks Risk Ref. CW&DT Score April 15
Change
Rationale for change
Risk
CW048 - Lack of awareness and resources for inpatients may mean that patients who are victims of Domestic Violence are not identified. (4x4=16)
Closed Post holder in place
CW057 The Division is significantly overspent due to a number of adverse movements. 25
B205 Loss of data due to clinical database no longer being supported 16
CW0067 Financial risk – growth.
Risk of CCG not paying for increased income assumptions particularly in children services, radiology and women’s
15
CW0068 Financial risk – CQUIN From 15/16 Maternity will no longer get CQUIN funding and instead CCG will develop a local tariff for 2015/16. Estimated value of risk in 14/15 = £2.5m
16
CW0070 Financial risk – cost.
The division fails to achieve its CIP programme
15
CW0071 CW0071 - Financial risk – cost.
The division does not receive funding for identified cost pressures.
Estimated value of risk in 14/15 = c. £1.1m
16
CW0081 Temperature during the summer months in Lanesborough Wing 16
CW082 Manual Handling of deceased patients into Mortuary fridges 16 New trolleys have arrived – risk likely to be reduced after agreement at next DGB
CW0087 Call alarms in St James’ wing therapy dept not working properly – risk to patient safety in the event of an emergency
15
CW088 - Pharmacy service core standards to Adult ICUs are not being met, increasing the risk of harm to patients. (4x4=16)
closed 3 pharmacists now in place
CW089 Insufficient number of CTG monitors for a full triage and full induction bay meaning some women need to wait for monitoring
20
CW090 Lack of NICU capacity – presenting both clinical and financial risk 15
CW091 Lack of GICU capacity – presenting both clinical and financial risk 15
CW092 Lack of CTICU capacity – presenting both clinical and financial risk 15
CW093 Roof leak in room 5.011, 5th Floor Lanesborough Wing tbc NEW Risk anticipated to be extreme but score
will be agreed at next DGB.
CW0094 Call bell failure on delivery suite 16 NEW
CW0097 Critical Care Run Rate Risks impacting Patient Care & Staff morale 16 NEW
M&C Change
Risk Ref. Risk Score
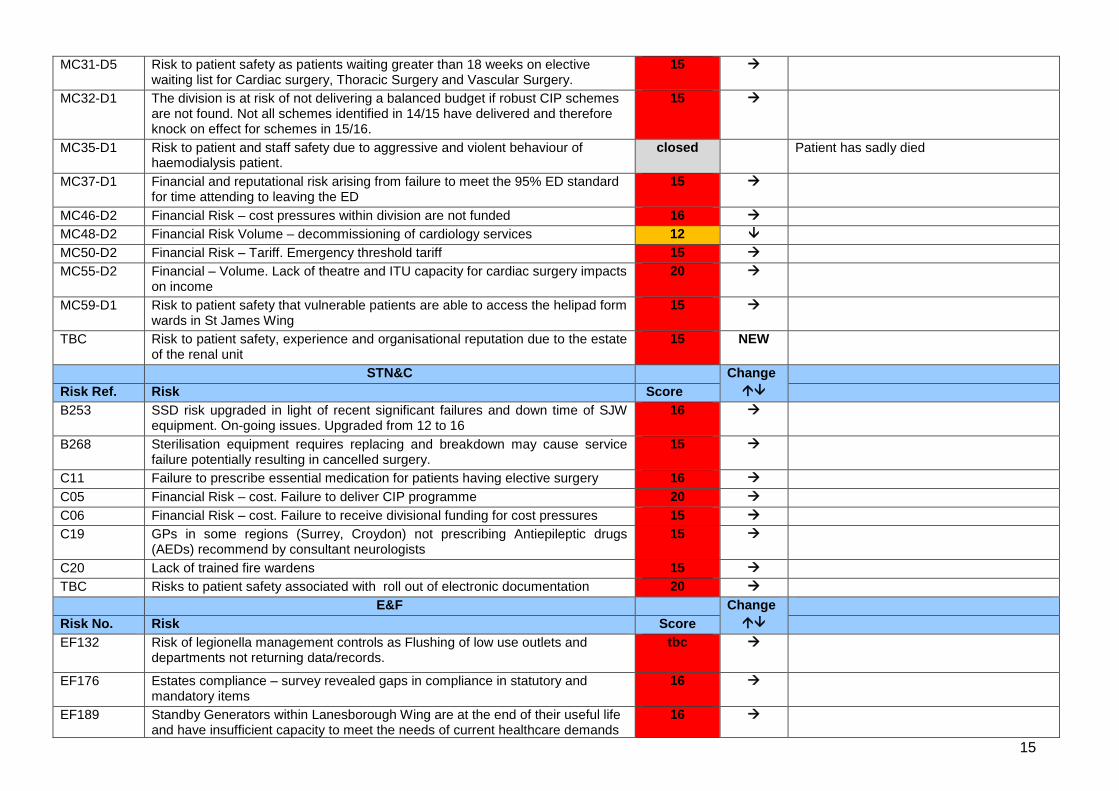
15
MC31-D5 Risk to patient safety as patients waiting greater than 18 weeks on elective waiting list for Cardiac surgery, Thoracic Surgery and Vascular Surgery.
15
MC32-D1 The division is at risk of not delivering a balanced budget if robust CIP schemes are not found. Not all schemes identified in 14/15 have delivered and therefore knock on effect for schemes in 15/16.
15
MC35-D1 Risk to patient and staff safety due to aggressive and violent behaviour of haemodialysis patient.
closed Patient has sadly died
MC37-D1 Financial and reputational risk arising from failure to meet the 95% ED standard for time attending to leaving the ED
15
MC46-D2 Financial Risk – cost pressures within division are not funded 16
MC48-D2 Financial Risk Volume – decommissioning of cardiology services 12
MC50-D2 Financial Risk – Tariff. Emergency threshold tariff 15
MC55-D2 Financial – Volume. Lack of theatre and ITU capacity for cardiac surgery impacts on income
20
MC59-D1 Risk to patient safety that vulnerable patients are able to access the helipad form wards in St James Wing
15
TBC Risk to patient safety, experience and organisational reputation due to the estate of the renal unit
15 NEW
STN&C Change
Risk Ref. Risk Score
B253 SSD risk upgraded in light of recent significant failures and down time of SJW equipment. On-going issues. Upgraded from 12 to 16
16
B268 Sterilisation equipment requires replacing and breakdown may cause service failure potentially resulting in cancelled surgery.
15
C11 Failure to prescribe essential medication for patients having elective surgery 16
C05 Financial Risk – cost. Failure to deliver CIP programme 20
C06 Financial Risk – cost. Failure to receive divisional funding for cost pressures 15
C19 GPs in some regions (Surrey, Croydon) not prescribing Antiepileptic drugs (AEDs) recommend by consultant neurologists
15
C20 Lack of trained fire wardens 15
TBC Risks to patient safety associated with roll out of electronic documentation 20
E&F Change
Risk No. Risk Score
EF132 Risk of legionella management controls as Flushing of low use outlets and departments not returning data/records.
tbc
EF176 Estates compliance – survey revealed gaps in compliance in statutory and mandatory items
16
EF189 Standby Generators within Lanesborough Wing are at the end of their useful life and have insufficient capacity to meet the needs of current healthcare demands
16

16
and will not need the demand as the building is re-developed and refurbished to modern standards.
EF195 Electrical upgrades/maintenance to UPS and IPS in AMW 16
EF198 Risk of noncompliance with fire regulations as a result of the lack of fire risk assessments for some areas on the St George's Hospital site.
15
EF200 Delay to ability to deliver the capital programme and maintenance activity due to clinical and capacity demands preventing access for works
16
EF202 There is a risk of absconding patients getting onto the helipad as access is via a fire escape route
16
IM&T Change
Risk No. Risk Score
IT016 Reduction in capacity to deliver new infrastructure, systems and change programs
20
IT018 Community staff experiencing access difficulties and slow response to RIO 16
IT029 There is a risk of onsite data centre (DC) failure due to inadequate provision and support of air conditioning cooling in the DC.
16
IT031 There is a risk to the provision of existing and future ICT applications hosted in the onsite DC due to poor environmental monitoring [UPS, air conditioning, BMS push alerts]
16
IT032 Increased risk to network availability due to inadequate electrical supply to key locations.
15
IT033 Increased clinical risk to patient safety resulting from lack of UPS protection for main Trust Switchboard.
16
CSW Change
Risk No. Risk Score
CSW1023-COM-D5
Cost Improvement Programme not achieving target. 16
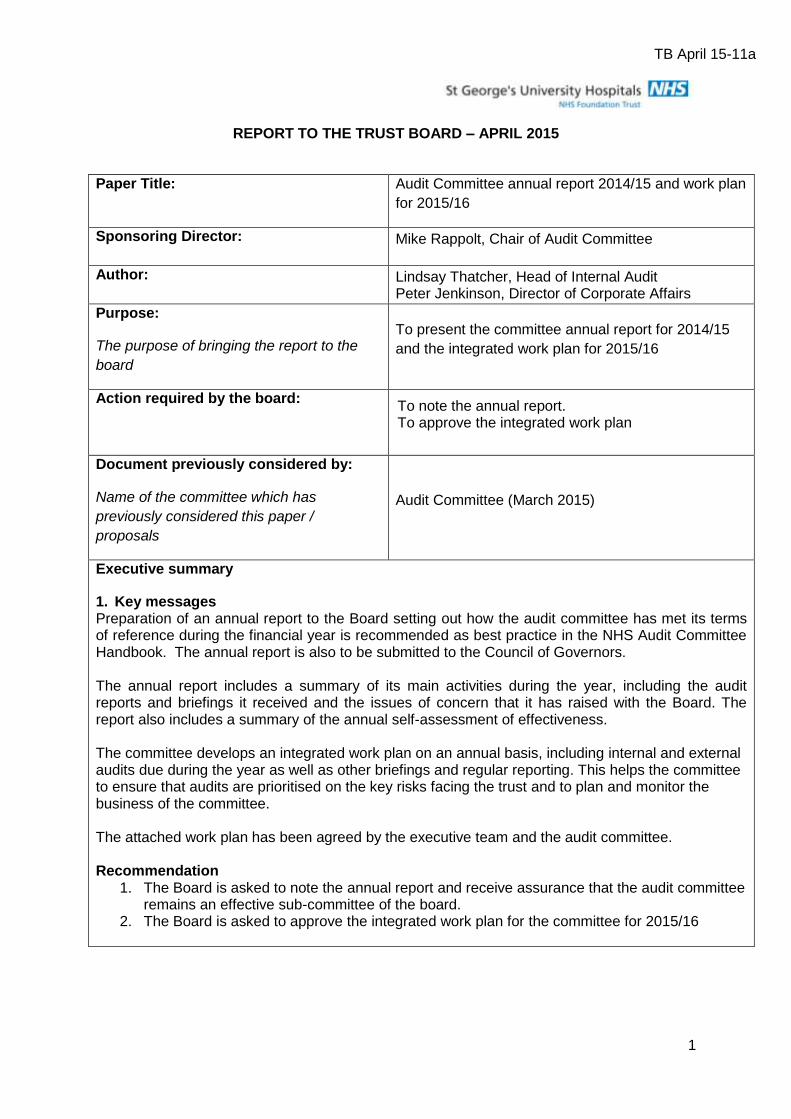
TB April 15-11a
1
REPORT TO THE TRUST BOARD – APRIL 2015
Paper Title: Audit Committee annual report 2014/15 and work plan
for 2015/16
Sponsoring Director: Mike Rappolt, Chair of Audit Committee
Author: Lindsay Thatcher, Head of Internal Audit Peter Jenkinson, Director of Corporate Affairs
Purpose:
The purpose of bringing the report to the
board
To present the committee annual report for 2014/15
and the integrated work plan for 2015/16
Action required by the board:
To note the annual report. To approve the integrated work plan
Document previously considered by:
Name of the committee which has
previously considered this paper /
proposals
Audit Committee (March 2015)
Executive summary
1. Key messages Preparation of an annual report to the Board setting out how the audit committee has met its terms of reference during the financial year is recommended as best practice in the NHS Audit Committee Handbook. The annual report is also to be submitted to the Council of Governors. The annual report includes a summary of its main activities during the year, including the audit reports and briefings it received and the issues of concern that it has raised with the Board. The report also includes a summary of the annual self-assessment of effectiveness. The committee develops an integrated work plan on an annual basis, including internal and external audits due during the year as well as other briefings and regular reporting. This helps the committee to ensure that audits are prioritised on the key risks facing the trust and to plan and monitor the business of the committee. The attached work plan has been agreed by the executive team and the audit committee. Recommendation
1. The Board is asked to note the annual report and receive assurance that the audit committee remains an effective sub-committee of the board.
2. The Board is asked to approve the integrated work plan for the committee for 2015/16
TB April 15-11a
2
Key risks identified:
Are there any risks identified in the paper (impact on achieving corporate objectives) – e.g. quality,
financial performance, compliance with legislation or regulatory requirements?
An ineffective audit committee would increase the risk of non-compliance with regulatory
requirements and corporate governance best practice, including Care Quality Commission
standards and NHS Audit Committee Handbook.
Related Corporate Objective:
Reference to corporate objective that this
paper refers to.
All corporate objectives
Related CQC Standard:
Reference to CQC standard that this paper
refers to.
Well-led domain
Equality Impact Assessment (EIA): Has an EIA been carried out? Yes
If yes, please provide a summary of the key findings
No specific groups of patients or community will be affected by the initiatives detailed in the report.
Where there may be an impact on patients then consultation will be managed as part of that specific
programme.
If no, please explain your reasons for not undertaking an EIA.
TB April 15–11b
1
AUDIT COMMITTEE ANNUAL REPORT 2014/15
1. PURPOSE OF THE AUDIT COMMITTEE
The aim of the Audit Committee is to review and independently scrutinise St George’s Healthcare NHS Trust’s (now St George’s University Hospitals NHS Foundation Trust) systems of clinical governance, internal control and risk management thereby ensuring, through proper process and challenge, that integrated governance principles are embedded and practised across all St George’s activities and that they support the achievement of the Trust’s objectives. It also reviews key internal and external financial, clinical, fraud and corruption and other policies, reports and assurance functions thereby providing independent assurance on them to the Board of St George’s. In addition, the Committee provides a form of independent check upon the executive arm of the Board. Preparation of an annual report to the Board setting out how they have met their terms of reference during the financial year is recommended as best practice in the NHS Audit Committee Handbook. The annual report is also to be submitted to the Council of Governors of St George’s University Hospitals NHS Foundation Trust setting out how the Audit Committee of the Trust has met its terms of reference.
2. TERMS OF REFERENCE AND MEMBERSHIP The Audit Committee is a subcommittee of the Board.
2.1 Terms of Reference The Committee reviewed and agreed its terms of reference in January 2015, with no changes required. These are shown at Appendix 1.
2.2 Frequency of Meetings Under the terms of reference, the Committee is required to meet not less than four times a year. During 2014/15 the Committee met on five occasions (see Appendix 2 for meeting dates and attendees).
TB April 15–11b
2
2.3 Membership The Committee members, including the Chair, are appointed by the Board and comprise three Non-Executive Directors. Meetings require the attendance of two members in order to be quorate. The members of the Committee throughout the year, together with their other committee memberships, were:
Michael Rappolt (Chair) - Nominations and Remuneration Committee, Finance and Performance Committee, FT Stakeholders Steering Group, Commercial Committee and Deputy Chair of the Trust;
Sarah Wilton - Finance and Performance Committee, FT Programme Board, Quality and Risk Committee (Chair), Nominations and Remunerations Committee;
Judith Hulf – Quality and Risk Committee, Nominations and Remunerations Committee, Research Committee.
2.4 Agenda Timetable A risk based integrated work plan was published covering the Committee’s business for 2014/15 and was approved by the Board on 29th May 2014. With only minor variations, this was delivered in full to help ensure the Committee met the responsibilities within its Terms of Reference. The work plan is underpinned by the work of and reports from the Trust’s internal and external auditors and the work plan is timetabled to ensure reports are received at the most appropriate times and that key reporting deadlines are met.
2.5 Appointment of External Auditors The current external auditors are Grant Thornton as approved by the Board of Governors at their meeting in February 2015. The Audit Committee actively assessed the effectiveness of Grant Thornton by reviewing key performance indicators highlighting their performance.
2.6 Appointment of Internal Auditors The current internal auditors are London Audit Consortium. The Audit Committee actively assessed their effectiveness by reviewing key performance
indicators highlighting their performance.
3. WORK DONE
3.1 General The Committee performed its work by establishing risk based areas, in the form of its Audit Committee Work Plan, that it wished to receive assurance upon; commissioning internal audit and external audit to report on those areas; requiring those executives responsible to attend meetings to explain matters more thoroughly; and seeking further information from them as required. A systematic Matters Arising arrangement is used, to ensure that outstanding issues and actions are brought back to the next appropriate meeting and followed up. In addition, the internal auditors follow a programme of audits set out at the beginning of the year, which is
TB April 15–11b
3
discussed and agreed with Trust Management and with the Audit Committee, approved by the Audit Committee and incorporated with the External Auditor’s plan into the integrated plan. A comprehensive Audit Tracking System is in use to monitor the implementation of agreed internal and external audit recommendations. The operation and maintenance of this tracking system is the responsibility of the Corporate Office, under the management of the Director of Corporate Affairs and is reviewed at each meeting.
The Committee is satisfied that the auditors have received the necessary assistance from Trust managers and staff when carrying out their work programmes and no limitations have been place by management on the scope of the work carried out by the auditors.
3.2 Briefings
The Committee was provided with regular briefings on the work of the Quality and Risk Committee, providing additional assurances on matters of quality and risk management. The Director of Finance, Informatics and Performance, on behalf of the Finance Committee, provided briefings on the work of the Finance Committee and matters arising from that work, providing additional assurances on matters of financial and performance control. The Audit Committee also received briefings, including the following:
Clinical Audit activity and the work of the Clinical Audit and Effectiveness Committee;
Action Tracking reports, from the Trust Secretary;
Quality Accounts, in particular relating to matters of data assurance;
Cyber Security, from the Director of Finance, Performance and Information;
An update on the new Audit Committee Handbook;
Local Counter Fraud (see 3.5. below).
3.3 External Audit
The Audit Committee reviewed and where necessary approved, reports including:
The External Audit Plan and fees;
External Audit Progress Reports;
Annual Audit letter and responses;
External Audit review of the audited Annual Accounts and Financial Statements 2013/14;
External assurance on the Trust’s Quality Accounts;
A review of cash management within the Trust.
3.4 Internal Audit
The Audit Committee reviewed and where necessary approved:
The Internal Audit Plan 2015/16 and amendments thereto;
Head of Internal Audit Opinion on the effectiveness of the system of internal control;
Progress Reports at each meeting;
Annual Report, including key performance indicators;
TB April 15–11b
4
Individual Internal Audit reports across the main operational areas of the Trust as follows:
o Safety/Patient Focus Reviews: safeguarding of children; nursing, midwifery and care establishments; and capacity planning.
o Governance Reviews : Board Assurance Framework and risk reporting; Care
Quality Commission registration; whistleblowing; information governance and security; service improvement programme.
o Financial Systems Reviews : Fundamental financial systems audits; central
stores, LCRN research funding.
o Clinical and Cost Effectiveness : Data quality reviews in respect of Referral to Treatment Time reporting, cancer waiting time reporting, overall data quality governance and the performance information database; medical locums; SWL pathology IT portal project; E-rostering project.
o Care, Environment & Amenities Reviews : Estates maintenance follow up
reviews (2); Fire safety follow-up reviews (3); cleaning; postage; and estates statutory compliance.
3.5 Local Counter Fraud Specialist (LCFS) The Audit Committee received, reviewed and where necessary approved
The LCFS Annual Report 2013/14;
Progress reports (at each meeting);
The LCFS plan 2015/16.
The Committee is satisfied with the efforts being made by the Trust to address fraud within the Trust and that the LCFS feels free to report any concerns to the Committee. It was reported that the Trust was RAG rated green on all expected items using the NHS Protect Self Assessment Tool for counter fraud.
3.6 Annual report and financial reporting The Audit Committee reviewed:
Compliance with accounting standards and practices and any changes being proposed;
Changes to Standard Financial Instructions;
The financial accounts for 2013/14 and recommended their adoption by the Board;
The Head of Internal Audit’s Opinion on the effectiveness of the system of internal control for the year ended 31 March 2014;
Issues arising from the Audit of the accounts;
The External Auditors’ Annual Letter
and made recommendations to the Board.
3.7 Disclosure Statements
The Audit Committee reviewed:
TB April 15–11b
5
The Annual Governance Statement 2013/14;
The Trust’s Annual Report for 2013/14
and made recommendations for adoption to the Board
3.8 Quality Accounts The Audit Committee reviewed the Trust’s Quality Accounts from the perspective of assurance of the quality of the underlying data upon which the Quality Accounts were based. Patient quality issues within the Quality Accounts were considered by the Quality and Risk Committee who reported on them to the Board. The Audit Committee considered that the Quality Accounts had considerably improved from the previous year. From their perspective they were happy to recommend the Quality Accounts to the Trust Board, subject to final amendments.
3.9 Financial Governance
The Audit Committee regularly considered:
Debt Write Offs;
Losses and Ex Gratia Payments;
Waivers of Standing Financial Instructions, mainly in respect of non-tendering of various procurement contracts.
The Committee also reviewed the Trust’s Standing Financial Instructions and Scheme of Delegation and approved these with minor amendments.
3.10 Reporting to the Board Minutes of the Audit Committee are provided to the Trust Board. In addition, after each meeting, the Audit Committee Chair provides a written report to the next meeting of the Trust Board on significant conclusions, concerns and recommendations arising from the Committee’s work. The issues highlighted to the Board this year included the following:
Fire Safety. Fire Safety continued to be an issue of concern for the committee in 2014-15. Although it was noted that infrastructure work had been undertaken, follow-up audit reports in April, September and March reported that issues still remained with fire risk assessments, fire folders, fire evacuation drills, and fire warden training. Although staffing resources had been increased, they had again been reduced, and implementation dates for recommendations had slipped. It was recommended that a report was provided directly to the Board and this was done. The Executive were urged to take responsibility for implementing required actions.
SWL pathology IT portal, safeguarding of children, nursing and midwifery establishment, contracted out cleaning, postage, estates compliance, CQC compliance, performance management database, information governance and security, risk management framework. Reasonable assurance was reported from these internal audit reports.
Fundamental Financial Systems. 5 of the component systems were allocated significant assurance and 3 reasonable. The Audit Committee agreed to monitor late notifications of leavers which had resulted in an increased number of salary overpayments compared to the previous year.
TB April 15–11b
6
Central stores. A limited assurance audit report was discussed, with a lack of compliance with stock control processes, weakness in governance arrangements and a high error rate of recorded stock levels noted. A follow up report was requested in 2015.
Pacemakers – stock and income controls. A follow up internal audit review reported that not all of the previous recommendations had been implemented due to an inability of clinicians, procurement and estates to reach agreement. Management action was required to address this, and a report from management in 2015 was requested.
Estates maintenance. Two follow-up audit reports to the 2013-14 limited assurance report continued to provide limited assurance on the delivery of planned and reactive maintenance work. The committee was reassured by the Director of Estates in respect of mitigating actions being taken to reduce risks and these will be followed up.
Data quality governance. A limited assurance audit report was provided on the overall data quality framework in place at the Trust. The Executive was asked to prioritise work to improve cashing up in outpatient clinics and to strengthen the implementation of data quality governance.
Referral to treatment times data quality. A Reasonable assurance audit report was provided on the quality of the data, after validation that is reported externally, apart from in community services where limited assurance was provided. Management action has been agreed to be taken to resolve the issues.
Whistleblowing. A limited assurance report was provided, and it was agreed that an action plan would be developed to improve the whistleblowing culture in place and reporting. An enhanced procedure was subsequently provided to the Committee by the Director of Corporate Affairs.
E-rostering. This was a very poorly managed and implemented project with significant variances both in time and cost from the original plan. The report identified a number of general governance and control issues and the lessons resulted in a number of recommended changes to the governance, project management and post project review arrangements were put to the Board and endorsed by them.
Financial governance of CRN funding for the JREO. A limited assurance audit report was provided for this review which had been commissioned externally by the Clinical Research Network.
3.11 Action Tracking The Committee continued to monitor the implementation of agreed recommendations through the action tracking reports produced by the Director of Corporate Affairs. Discussions were held as to how the effectiveness of the system could be improved.
4. SUPPORT TO THE AUDIT COMMITTEE Support to the Committee was provided, as follows:
TB April 15–11b
7
4.1 Internal Audit
The Trust’s internal audit service during 2014/15 continued to be provided by London Audit Consortium (LAC), an NHS non-profit organisation providing a range of services to the NHS and other public sector bodies. The internal audit team has been based at the Trust throughout the year. Internal Audit reports directly to the Audit Committee.
4.2 External Audit
The Trust’s External Audit Service was provided by Grant Thornton. The Annual Audit Letter for 2013/14 was presented to the Committee in September 2014. The Committee received and noted the external audit plan for 2014/15.
4.3 Local Counter Fraud Specialist (LCFS) The Trust has 2 employees acting as the Trust’s LCFS. The LCFSs have a direct line of reporting to the Director of Finance, Informatics and Performance consistent with the Secretary of State’s Directions and also to the Chair of the Audit Committee.
4.4 Trust Executive and Senior Managers The Director of Finance, Informatics and Performance and Chief Nurse, or their deputies attend each meeting of the Committee. In addition, as and when required, other Trust executives and senior managers prepare reports, action follow up items and attend the Audit Committee meetings to discuss and comment upon internal audit reports relevant to their specific areas. A schedule of Trust managers attending is included in Appendix 2. The Director of Corporate Affairs (Trust Secretary) has provided support to the Audit Committee throughout the year by acting as secretary to the Committee.
5. COMMITTEE DEVELOPMENTS
5.1 Audit Committee Self Assessment The Audit Committee undertook its annual self assessment survey in February 2015. Overall the results were very positive. It was agreed that for questions where respondents were unsure or disagreed with the assurance statements provided, these would be included for clarification in the committee development plan
5.2 Changes to the operation of the Audit Committee after potentially attaining Foundation Trust status were discussed, including relationships with the Council of Governors.

TB April 15–11b
8
6 CONCLUSION The Audit Committee believes that it has, to the best of its ability, met its terms of reference. It gratefully acknowledges the excellent support it has received without which it could not have fulfilled its remit. Mike Rappolt Chair of the Audit Committee 2014/15
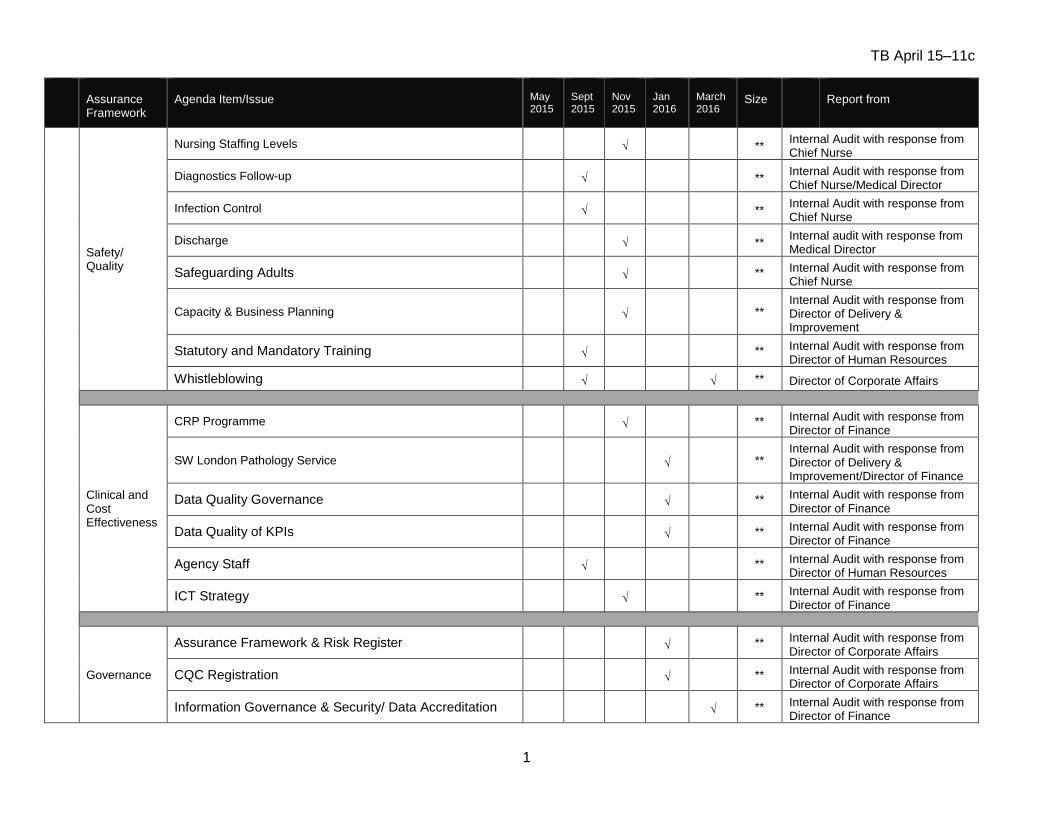
TB April 15–11c
1
Assurance Framework
Agenda Item/Issue
May 2015
Sept 2015
Nov 2015
Jan 2016
March 2016
Size
Report from
Safety/ Quality
Nursing Staffing Levels √ ** Internal Audit with response from Chief Nurse
Diagnostics Follow-up √ ** Internal Audit with response from Chief Nurse/Medical Director
Infection Control √ ** Internal Audit with response from Chief Nurse
Discharge √ ** Internal audit with response from Medical Director
Safeguarding Adults √ ** Internal Audit with response from Chief Nurse
Capacity & Business Planning √ ** Internal Audit with response from Director of Delivery & Improvement
Statutory and Mandatory Training √ ** Internal Audit with response from Director of Human Resources
Whistleblowing √ √ ** Director of Corporate Affairs
Clinical and Cost Effectiveness
CRP Programme √ ** Internal Audit with response from Director of Finance
SW London Pathology Service √ ** Internal Audit with response from Director of Delivery & Improvement/Director of Finance
Data Quality Governance √ ** Internal Audit with response from Director of Finance
Data Quality of KPIs √ ** Internal Audit with response from Director of Finance
Agency Staff √ ** Internal Audit with response from Director of Human Resources
ICT Strategy √ ** Internal Audit with response from Director of Finance
Governance
Assurance Framework & Risk Register √ ** Internal Audit with response from Director of Corporate Affairs
CQC Registration √ ** Internal Audit with response from Director of Corporate Affairs
Information Governance & Security/ Data Accreditation √ ** Internal Audit with response from Director of Finance
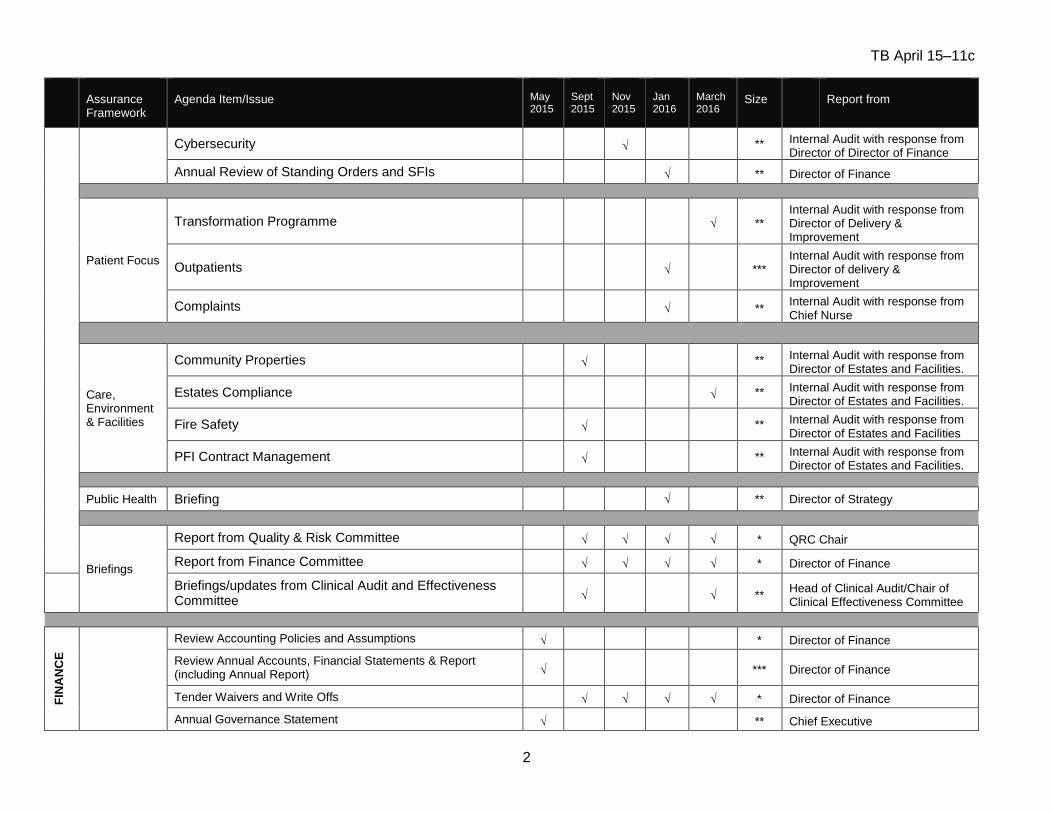
TB April 15–11c
2
Assurance Framework
Agenda Item/Issue
May 2015
Sept 2015
Nov 2015
Jan 2016
March 2016
Size
Report from
Cybersecurity √ ** Internal Audit with response from Director of Director of Finance
Annual Review of Standing Orders and SFIs √ ** Director of Finance
Patient Focus
Transformation Programme √ ** Internal Audit with response from Director of Delivery & Improvement
Outpatients √ *** Internal Audit with response from Director of delivery & Improvement
Complaints √ ** Internal Audit with response from Chief Nurse
Care, Environment & Facilities
Community Properties √ ** Internal Audit with response from Director of Estates and Facilities.
Estates Compliance √ ** Internal Audit with response from Director of Estates and Facilities.
Fire Safety √ ** Internal Audit with response from Director of Estates and Facilities
PFI Contract Management √ ** Internal Audit with response from Director of Estates and Facilities.
Public Health Briefing √ ** Director of Strategy
Briefings
Report from Quality & Risk Committee √ √ √ √ * QRC Chair
Report from Finance Committee √ √ √ √ * Director of Finance
Briefings/updates from Clinical Audit and Effectiveness Committee √ √ **
Head of Clinical Audit/Chair of Clinical Effectiveness Committee
FIN
AN
CE
Review Accounting Policies and Assumptions √ * Director of Finance
Review Annual Accounts, Financial Statements & Report (including Annual Report) √ *** Director of Finance
Tender Waivers and Write Offs √ √ √ √ * Director of Finance
Annual Governance Statement √ ** Chief Executive

TB April 15–11c
3
Assurance Framework
Agenda Item/Issue
May 2015
Sept 2015
Nov 2015
Jan 2016
March 2016
Size
Report from
Head of Internal Audit Opinion √ * Head of Internal Audit
Analysis of Salary Overpayments and Outcomes √ * Director of Finance
Fundamental Financial Audits √ √ ** Internal Audit with response from Director of Finance
Stores √ * Internal Audit with response from Director of Finance
INT
ER
NA
L A
UD
IT
Internal Audit Terms of Reference √ * Internal Audit
Agree Internal Audit KPIs 2016/17 √ * Internal Audit
Approval of Internal Audit 3 year plan √ ** Internal Audit
Approval of one year Internal Audit plan 2016/17 – Draft and Final √ √ * Internal Audit
Annual Internal Audit Report and Opinion 2014/15 √ * Internal Audit
Internal Audit Progress Reports √ √ √ √ * Internal Audit
EX
TE
RN
AL
AU
DIT
Agreement of External Audit Plans and Fees for 2016/17 √ * External Audit
Agree External Audit KPIs √ * External Audit
External Audit Progress Reports √ √ √ √ * External Audit
Review of Audited Annual Accounts and Financial Statement 2014/15 √ ** External Audit
Review of Quality Report √ ** External Audit
Annual Audit Letter √ ** External Audit
LC
FS
Agreement of Counter Fraud Plan √ * LCFS
Counter Fraud Progress Reports √ √ √ √ * LCFS
Counter Fraud Qualitative Assessment √ * LCFS
Counter Fraud Annual Report √ * LCFS
CO
M
MIT
T
EE
BU
SI
NE
S
S
Private discussion with Internal Audit √ * AC members
Private discussion with External Audit √ * AC members
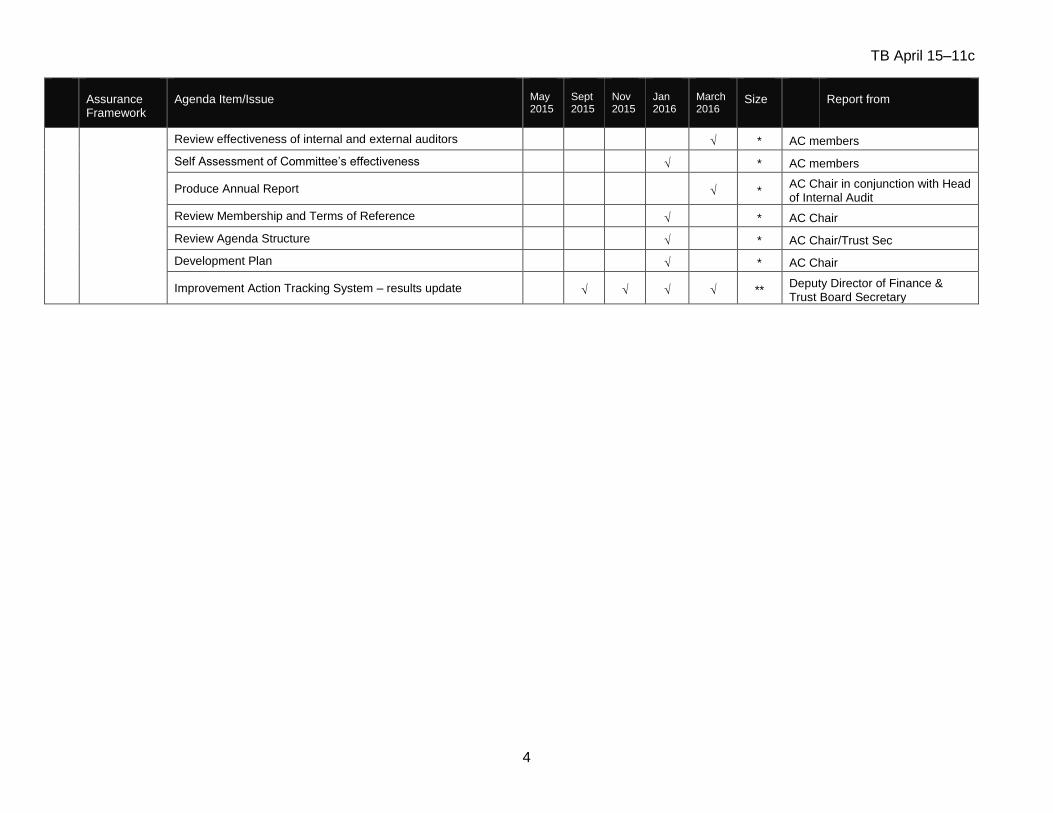
TB April 15–11c
4
Assurance Framework
Agenda Item/Issue
May 2015
Sept 2015
Nov 2015
Jan 2016
March 2016
Size
Report from
Review effectiveness of internal and external auditors √ * AC members
Self Assessment of Committee’s effectiveness √ * AC members
Produce Annual Report √ * AC Chair in conjunction with Head of Internal Audit
Review Membership and Terms of Reference √ * AC Chair
Review Agenda Structure √ * AC Chair/Trust Sec
Development Plan √ * AC Chair
Improvement Action Tracking System – results update √ √ √ √ ** Deputy Director of Finance & Trust Board Secretary
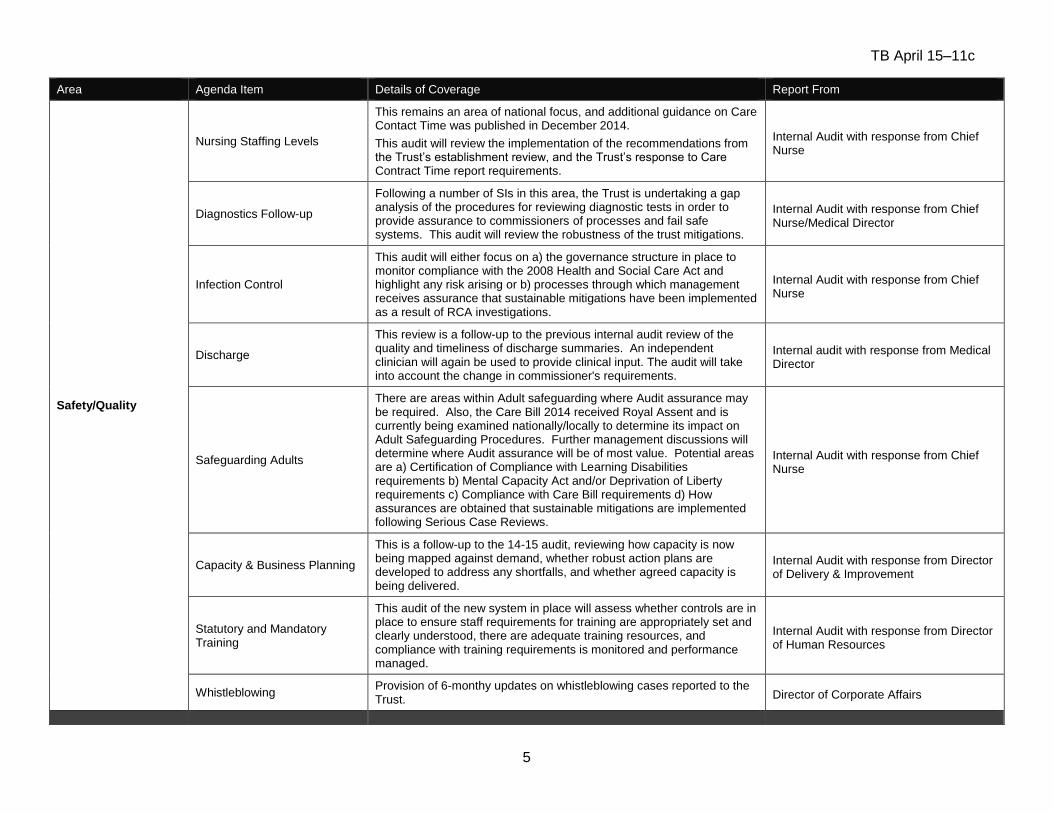
TB April 15–11c
5
Area Agenda Item Details of Coverage Report From
Safety/Quality
Nursing Staffing Levels
This remains an area of national focus, and additional guidance on Care Contact Time was published in December 2014.
This audit will review the implementation of the recommendations from the Trust’s establishment review, and the Trust’s response to Care Contract Time report requirements.
Internal Audit with response from Chief Nurse
Diagnostics Follow-up
Following a number of SIs in this area, the Trust is undertaking a gap analysis of the procedures for reviewing diagnostic tests in order to provide assurance to commissioners of processes and fail safe systems. This audit will review the robustness of the trust mitigations.
Internal Audit with response from Chief Nurse/Medical Director
Infection Control
This audit will either focus on a) the governance structure in place to monitor compliance with the 2008 Health and Social Care Act and highlight any risk arising or b) processes through which management receives assurance that sustainable mitigations have been implemented as a result of RCA investigations.
Internal Audit with response from Chief Nurse
Discharge
This review is a follow-up to the previous internal audit review of the quality and timeliness of discharge summaries. An independent clinician will again be used to provide clinical input. The audit will take into account the change in commissioner's requirements.
Internal audit with response from Medical Director
Safeguarding Adults
There are areas within Adult safeguarding where Audit assurance may be required. Also, the Care Bill 2014 received Royal Assent and is currently being examined nationally/locally to determine its impact on Adult Safeguarding Procedures. Further management discussions will determine where Audit assurance will be of most value. Potential areas are a) Certification of Compliance with Learning Disabilities requirements b) Mental Capacity Act and/or Deprivation of Liberty requirements c) Compliance with Care Bill requirements d) How assurances are obtained that sustainable mitigations are implemented following Serious Case Reviews.
Internal Audit with response from Chief Nurse
Capacity & Business Planning
This is a follow-up to the 14-15 audit, reviewing how capacity is now being mapped against demand, whether robust action plans are developed to address any shortfalls, and whether agreed capacity is being delivered.
Internal Audit with response from Director of Delivery & Improvement
Statutory and Mandatory Training
This audit of the new system in place will assess whether controls are in place to ensure staff requirements for training are appropriately set and clearly understood, there are adequate training resources, and compliance with training requirements is monitored and performance managed.
Internal Audit with response from Director of Human Resources
Whistleblowing Provision of 6-monthy updates on whistleblowing cases reported to the Trust. Director of Corporate Affairs
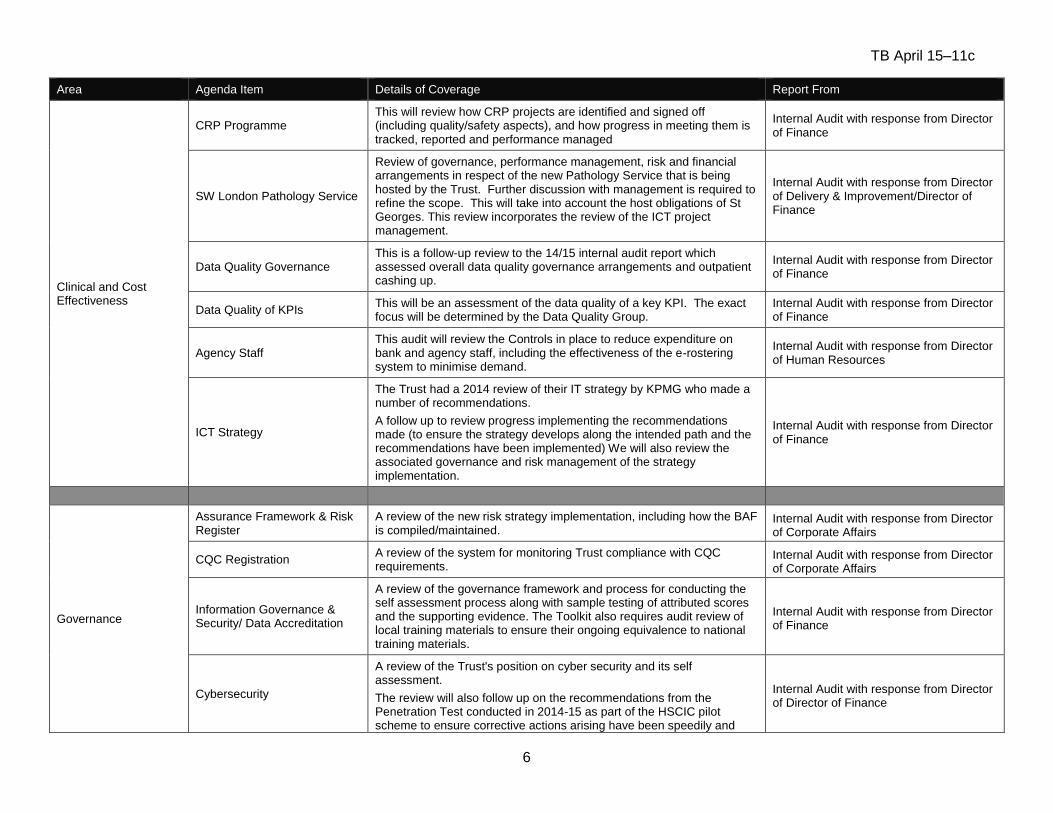
TB April 15–11c
6
Area Agenda Item Details of Coverage Report From
Clinical and Cost Effectiveness
CRP Programme This will review how CRP projects are identified and signed off (including quality/safety aspects), and how progress in meeting them is tracked, reported and performance managed
Internal Audit with response from Director of Finance
SW London Pathology Service
Review of governance, performance management, risk and financial arrangements in respect of the new Pathology Service that is being hosted by the Trust. Further discussion with management is required to refine the scope. This will take into account the host obligations of St Georges. This review incorporates the review of the ICT project management.
Internal Audit with response from Director of Delivery & Improvement/Director of Finance
Data Quality Governance This is a follow-up review to the 14/15 internal audit report which assessed overall data quality governance arrangements and outpatient cashing up.
Internal Audit with response from Director of Finance
Data Quality of KPIs This will be an assessment of the data quality of a key KPI. The exact focus will be determined by the Data Quality Group.
Internal Audit with response from Director of Finance
Agency Staff This audit will review the Controls in place to reduce expenditure on bank and agency staff, including the effectiveness of the e-rostering system to minimise demand.
Internal Audit with response from Director of Human Resources
ICT Strategy
The Trust had a 2014 review of their IT strategy by KPMG who made a number of recommendations.
A follow up to review progress implementing the recommendations made (to ensure the strategy develops along the intended path and the recommendations have been implemented) We will also review the associated governance and risk management of the strategy implementation.
Internal Audit with response from Director of Finance
Governance
Assurance Framework & Risk Register
A review of the new risk strategy implementation, including how the BAF is compiled/maintained.
Internal Audit with response from Director of Corporate Affairs
CQC Registration A review of the system for monitoring Trust compliance with CQC requirements.
Internal Audit with response from Director of Corporate Affairs
Information Governance & Security/ Data Accreditation
A review of the governance framework and process for conducting the self assessment process along with sample testing of attributed scores and the supporting evidence. The Toolkit also requires audit review of local training materials to ensure their ongoing equivalence to national training materials.
Internal Audit with response from Director of Finance
Cybersecurity
A review of the Trust's position on cyber security and its self assessment.
The review will also follow up on the recommendations from the Penetration Test conducted in 2014-15 as part of the HSCIC pilot scheme to ensure corrective actions arising have been speedily and
Internal Audit with response from Director of Director of Finance
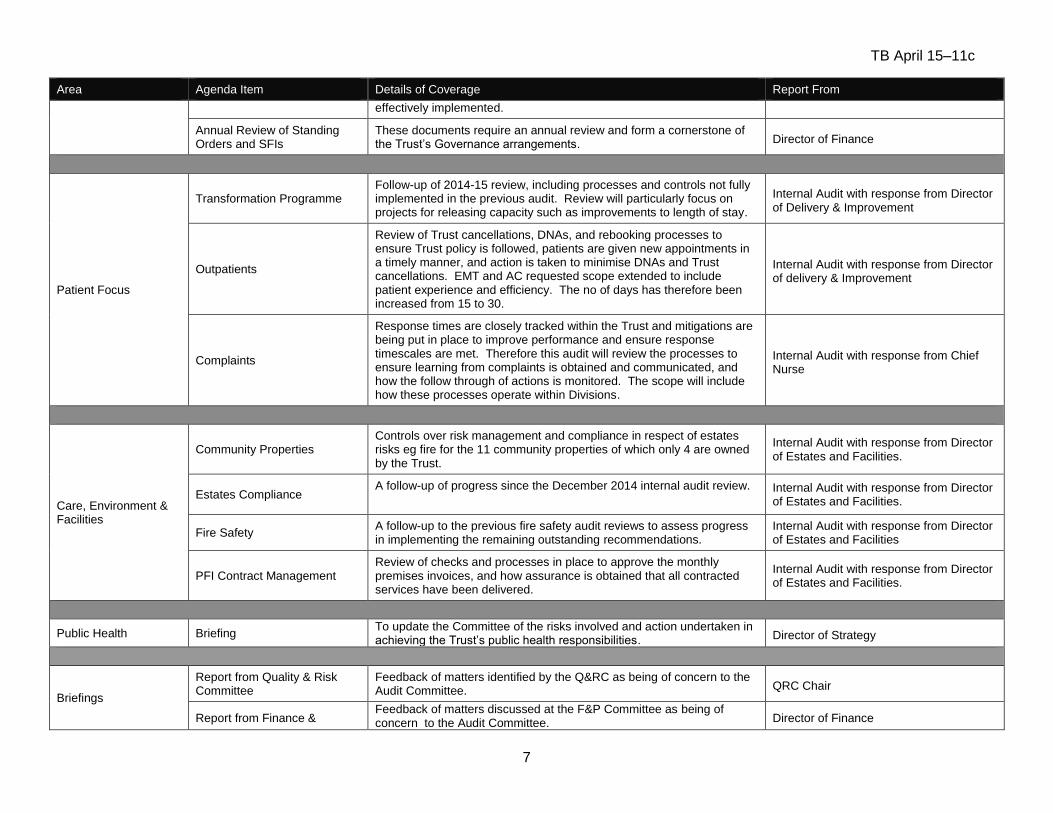
TB April 15–11c
7
Area Agenda Item Details of Coverage Report From
effectively implemented.
Annual Review of Standing Orders and SFIs
These documents require an annual review and form a cornerstone of the Trust’s Governance arrangements. Director of Finance
Patient Focus
Transformation Programme Follow-up of 2014-15 review, including processes and controls not fully implemented in the previous audit. Review will particularly focus on projects for releasing capacity such as improvements to length of stay.
Internal Audit with response from Director of Delivery & Improvement
Outpatients
Review of Trust cancellations, DNAs, and rebooking processes to ensure Trust policy is followed, patients are given new appointments in a timely manner, and action is taken to minimise DNAs and Trust cancellations. EMT and AC requested scope extended to include patient experience and efficiency. The no of days has therefore been increased from 15 to 30.
Internal Audit with response from Director of delivery & Improvement
Complaints
Response times are closely tracked within the Trust and mitigations are being put in place to improve performance and ensure response timescales are met. Therefore this audit will review the processes to ensure learning from complaints is obtained and communicated, and how the follow through of actions is monitored. The scope will include how these processes operate within Divisions.
Internal Audit with response from Chief Nurse
Care, Environment & Facilities
Community Properties Controls over risk management and compliance in respect of estates risks eg fire for the 11 community properties of which only 4 are owned by the Trust.
Internal Audit with response from Director of Estates and Facilities.
Estates Compliance A follow-up of progress since the December 2014 internal audit review.
Internal Audit with response from Director of Estates and Facilities.
Fire Safety A follow-up to the previous fire safety audit reviews to assess progress in implementing the remaining outstanding recommendations.
Internal Audit with response from Director of Estates and Facilities
PFI Contract Management Review of checks and processes in place to approve the monthly premises invoices, and how assurance is obtained that all contracted services have been delivered.
Internal Audit with response from Director of Estates and Facilities.
Public Health Briefing To update the Committee of the risks involved and action undertaken in achieving the Trust’s public health responsibilities. Director of Strategy
Briefings
Report from Quality & Risk Committee
Feedback of matters identified by the Q&RC as being of concern to the Audit Committee. QRC Chair
Report from Finance & Feedback of matters discussed at the F&P Committee as being of concern to the Audit Committee. Director of Finance
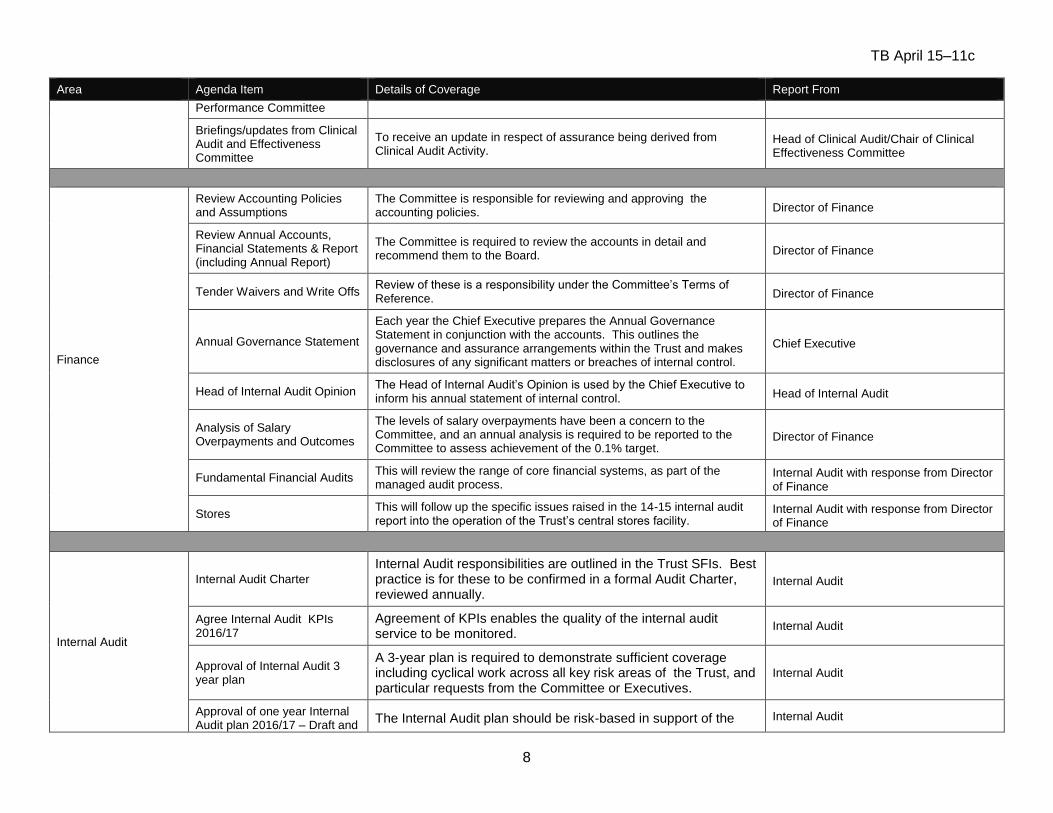
TB April 15–11c
8
Area Agenda Item Details of Coverage Report From
Performance Committee
Briefings/updates from Clinical Audit and Effectiveness Committee
To receive an update in respect of assurance being derived from Clinical Audit Activity.
Head of Clinical Audit/Chair of Clinical Effectiveness Committee
Finance
Review Accounting Policies and Assumptions
The Committee is responsible for reviewing and approving the accounting policies. Director of Finance
Review Annual Accounts, Financial Statements & Report (including Annual Report)
The Committee is required to review the accounts in detail and recommend them to the Board. Director of Finance
Tender Waivers and Write Offs Review of these is a responsibility under the Committee’s Terms of Reference. Director of Finance
Annual Governance Statement
Each year the Chief Executive prepares the Annual Governance Statement in conjunction with the accounts. This outlines the governance and assurance arrangements within the Trust and makes disclosures of any significant matters or breaches of internal control.
Chief Executive
Head of Internal Audit Opinion The Head of Internal Audit’s Opinion is used by the Chief Executive to inform his annual statement of internal control. Head of Internal Audit
Analysis of Salary Overpayments and Outcomes
The levels of salary overpayments have been a concern to the Committee, and an annual analysis is required to be reported to the Committee to assess achievement of the 0.1% target.
Director of Finance
Fundamental Financial Audits This will review the range of core financial systems, as part of the managed audit process.
Internal Audit with response from Director of Finance
Stores This will follow up the specific issues raised in the 14-15 internal audit report into the operation of the Trust’s central stores facility.
Internal Audit with response from Director of Finance
Internal Audit
Internal Audit Charter
Internal Audit responsibilities are outlined in the Trust SFIs. Best practice is for these to be confirmed in a formal Audit Charter, reviewed annually.
Internal Audit
Agree Internal Audit KPIs 2016/17
Agreement of KPIs enables the quality of the internal audit service to be monitored.
Internal Audit
Approval of Internal Audit 3 year plan
A 3-year plan is required to demonstrate sufficient coverage including cyclical work across all key risk areas of the Trust, and particular requests from the Committee or Executives.
Internal Audit
Approval of one year Internal Audit plan 2016/17 – Draft and
The Internal Audit plan should be risk-based in support of the Internal Audit
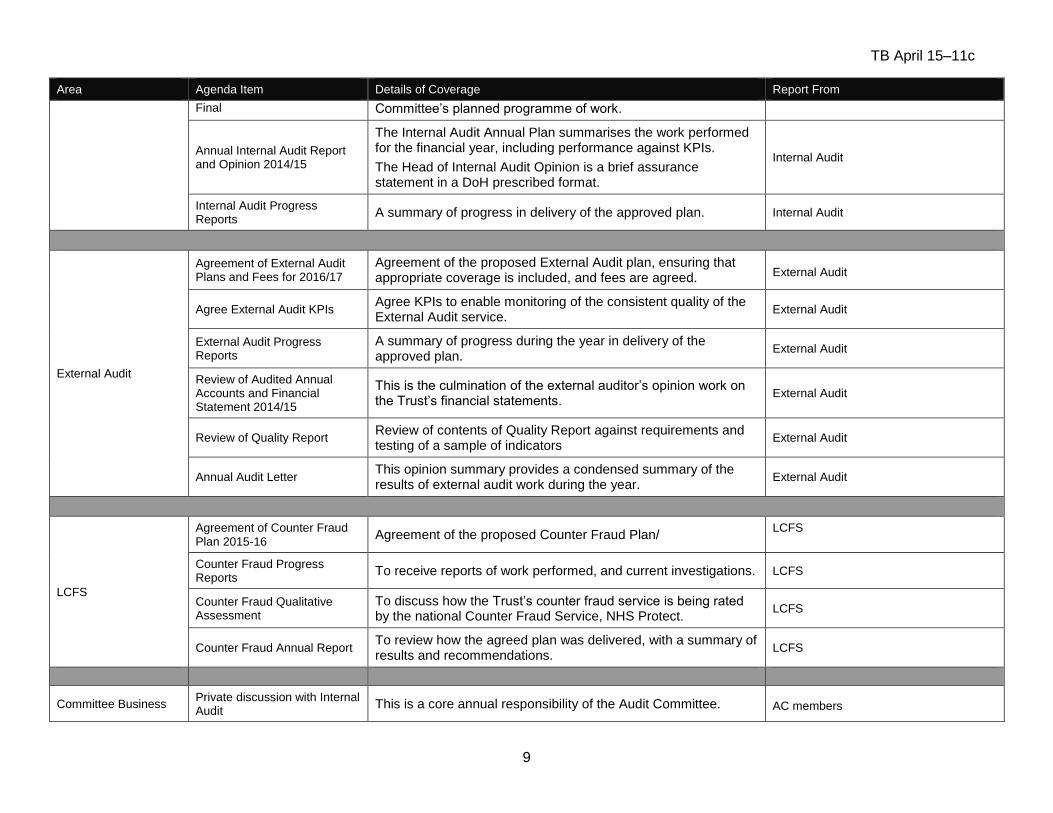
TB April 15–11c
9
Area Agenda Item Details of Coverage Report From
Final Committee’s planned programme of work.
Annual Internal Audit Report and Opinion 2014/15
The Internal Audit Annual Plan summarises the work performed for the financial year, including performance against KPIs.
The Head of Internal Audit Opinion is a brief assurance statement in a DoH prescribed format.
Internal Audit
Internal Audit Progress Reports
A summary of progress in delivery of the approved plan. Internal Audit
External Audit
Agreement of External Audit Plans and Fees for 2016/17
Agreement of the proposed External Audit plan, ensuring that appropriate coverage is included, and fees are agreed. External Audit
Agree External Audit KPIs Agree KPIs to enable monitoring of the consistent quality of the External Audit service.
External Audit
External Audit Progress Reports
A summary of progress during the year in delivery of the approved plan.
External Audit
Review of Audited Annual Accounts and Financial Statement 2014/15
This is the culmination of the external auditor’s opinion work on the Trust’s financial statements.
External Audit
Review of Quality Report Review of contents of Quality Report against requirements and testing of a sample of indicators
External Audit
Annual Audit Letter This opinion summary provides a condensed summary of the results of external audit work during the year.
External Audit
LCFS
Agreement of Counter Fraud Plan 2015-16
Agreement of the proposed Counter Fraud Plan/ LCFS
Counter Fraud Progress Reports
To receive reports of work performed, and current investigations. LCFS
Counter Fraud Qualitative Assessment
To discuss how the Trust’s counter fraud service is being rated by the national Counter Fraud Service, NHS Protect.
LCFS
Counter Fraud Annual Report To review how the agreed plan was delivered, with a summary of results and recommendations.
LCFS
Committee Business Private discussion with Internal Audit
This is a core annual responsibility of the Audit Committee. AC members
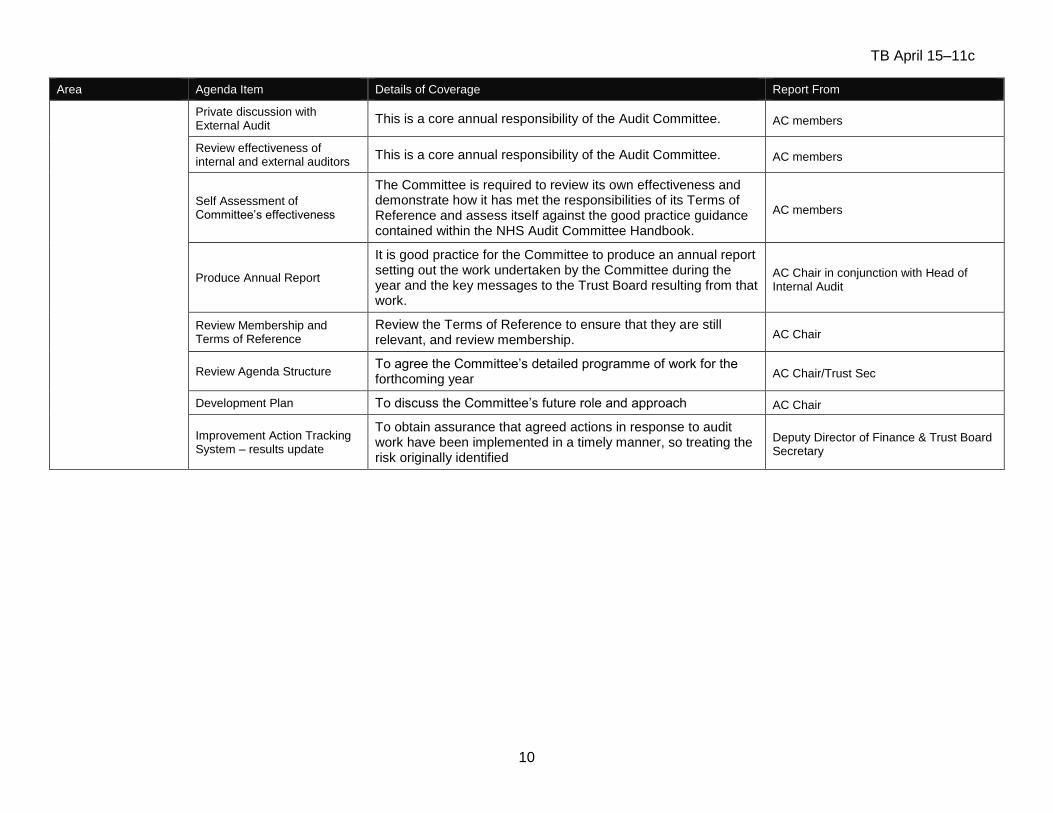
TB April 15–11c
10
Area Agenda Item Details of Coverage Report From
Private discussion with External Audit
This is a core annual responsibility of the Audit Committee. AC members
Review effectiveness of internal and external auditors
This is a core annual responsibility of the Audit Committee. AC members
Self Assessment of Committee’s effectiveness
The Committee is required to review its own effectiveness and demonstrate how it has met the responsibilities of its Terms of Reference and assess itself against the good practice guidance contained within the NHS Audit Committee Handbook.
AC members
Produce Annual Report
It is good practice for the Committee to produce an annual report setting out the work undertaken by the Committee during the year and the key messages to the Trust Board resulting from that work.
AC Chair in conjunction with Head of Internal Audit
Review Membership and Terms of Reference
Review the Terms of Reference to ensure that they are still relevant, and review membership. AC Chair
Review Agenda Structure To agree the Committee’s detailed programme of work for the forthcoming year AC Chair/Trust Sec
Development Plan To discuss the Committee’s future role and approach AC Chair
Improvement Action Tracking System – results update
To obtain assurance that agreed actions in response to audit work have been implemented in a timely manner, so treating the risk originally identified
Deputy Director of Finance & Trust Board Secretary

TERMS OF REFERENCE
AUDIT COMMITTEE
Document History
Version Date Comments
V. 1.0 August 2009 Review of existing terms of reference
1.1 01.09.2009 Review comments from Chair of Audit Committee
1.2 19.01.2011 Annual review following annual committee effectiveness review
1.3 18.01.2012 Annual review following annual committee effectiveness review and changes to the trust management structure
Policy No: Audit Committee Terms of Reference
Version No: 1.5
Authorisation: Trust Board
Date this version issued: January 2015
Date this version authorised:
Next review date: January 2016
Pages: 7
Produced by: author(s) and/or SDU or Department
Peter Jenkinson, Trust Secretary
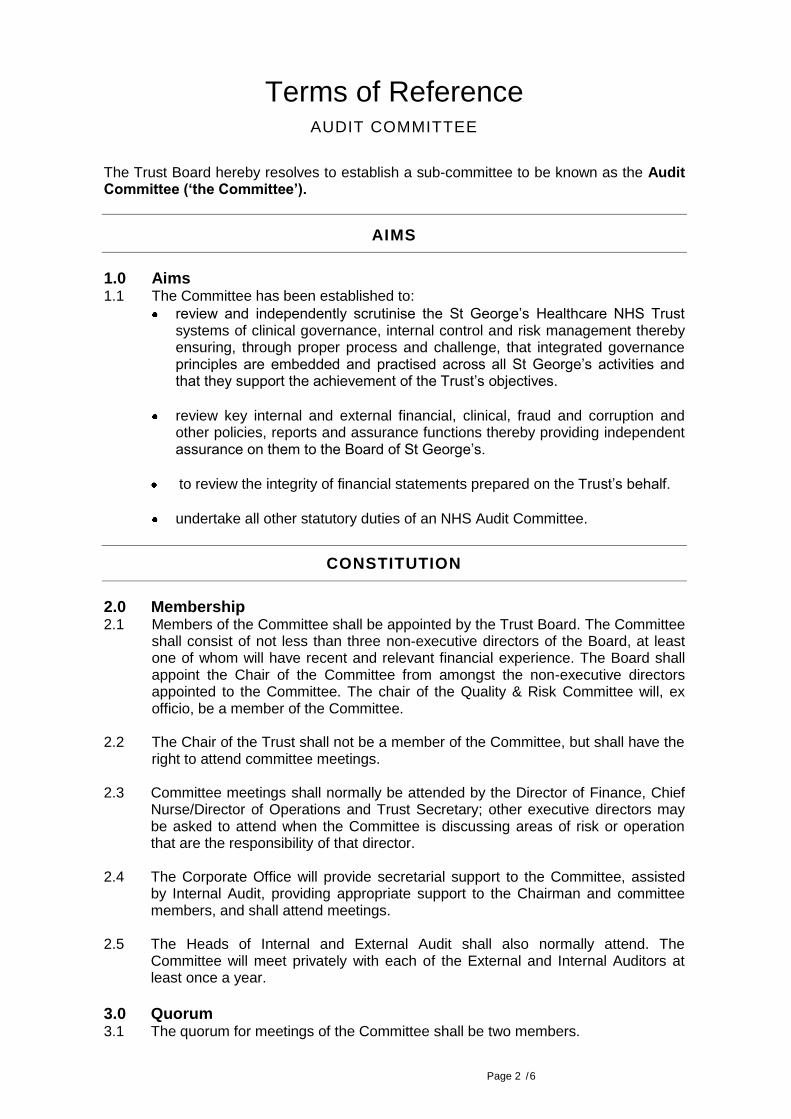
Page 2 /6
Terms of Reference AUDIT COMMITTEE
The Trust Board hereby resolves to establish a sub-committee to be known as the Audit Committee (‘the Committee’).
AIMS
1.0 Aims 1.1 The Committee has been established to:
review and independently scrutinise the St George’s Healthcare NHS Trust systems of clinical governance, internal control and risk management thereby ensuring, through proper process and challenge, that integrated governance principles are embedded and practised across all St George’s activities and that they support the achievement of the Trust’s objectives.
review key internal and external financial, clinical, fraud and corruption and other policies, reports and assurance functions thereby providing independent assurance on them to the Board of St George’s.
to review the integrity of financial statements prepared on the Trust’s behalf.
undertake all other statutory duties of an NHS Audit Committee.
CONSTITUTION
2.0 Membership 2.1 Members of the Committee shall be appointed by the Trust Board. The Committee
shall consist of not less than three non-executive directors of the Board, at least one of whom will have recent and relevant financial experience. The Board shall appoint the Chair of the Committee from amongst the non-executive directors appointed to the Committee. The chair of the Quality & Risk Committee will, ex officio, be a member of the Committee.
2.2 The Chair of the Trust shall not be a member of the Committee, but shall have the
right to attend committee meetings. 2.3 Committee meetings shall normally be attended by the Director of Finance, Chief
Nurse/Director of Operations and Trust Secretary; other executive directors may be asked to attend when the Committee is discussing areas of risk or operation that are the responsibility of that director.
2.4 The Corporate Office will provide secretarial support to the Committee, assisted
by Internal Audit, providing appropriate support to the Chairman and committee members, and shall attend meetings.
2.5 The Heads of Internal and External Audit shall also normally attend. The
Committee will meet privately with each of the External and Internal Auditors at least once a year.
3.0 Quorum 3.1 The quorum for meetings of the Committee shall be two members.
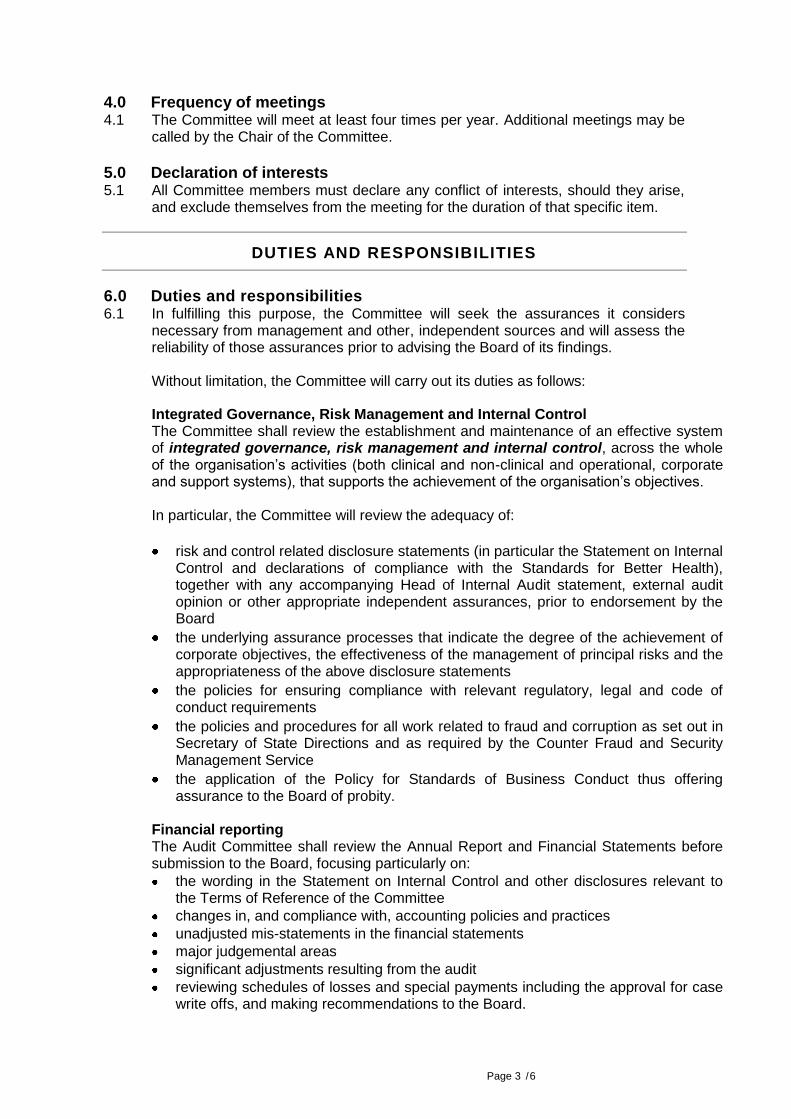
Page 3 /6
4.0 Frequency of meetings 4.1 The Committee will meet at least four times per year. Additional meetings may be
called by the Chair of the Committee.
5.0 Declaration of interests 5.1 All Committee members must declare any conflict of interests, should they arise,
and exclude themselves from the meeting for the duration of that specific item.
DUTIES AND RESPONSIBILITIES
6.0 Duties and responsibilities 6.1 In fulfilling this purpose, the Committee will seek the assurances it considers
necessary from management and other, independent sources and will assess the reliability of those assurances prior to advising the Board of its findings.
Without limitation, the Committee will carry out its duties as follows:
Integrated Governance, Risk Management and Internal Control The Committee shall review the establishment and maintenance of an effective system of integrated governance, risk management and internal control, across the whole of the organisation’s activities (both clinical and non-clinical and operational, corporate and support systems), that supports the achievement of the organisation’s objectives. In particular, the Committee will review the adequacy of:
risk and control related disclosure statements (in particular the Statement on Internal Control and declarations of compliance with the Standards for Better Health), together with any accompanying Head of Internal Audit statement, external audit opinion or other appropriate independent assurances, prior to endorsement by the Board
the underlying assurance processes that indicate the degree of the achievement of corporate objectives, the effectiveness of the management of principal risks and the appropriateness of the above disclosure statements
the policies for ensuring compliance with relevant regulatory, legal and code of conduct requirements
the policies and procedures for all work related to fraud and corruption as set out in Secretary of State Directions and as required by the Counter Fraud and Security Management Service
the application of the Policy for Standards of Business Conduct thus offering assurance to the Board of probity.
Financial reporting The Audit Committee shall review the Annual Report and Financial Statements before submission to the Board, focusing particularly on:
the wording in the Statement on Internal Control and other disclosures relevant to the Terms of Reference of the Committee
changes in, and compliance with, accounting policies and practices
unadjusted mis-statements in the financial statements
major judgemental areas
significant adjustments resulting from the audit
reviewing schedules of losses and special payments including the approval for case write offs, and making recommendations to the Board.

Page 4 /6
The Committee should also ensure that the systems for financial reporting to the Board, including those of budgetary control, are subject to review as to completeness and accuracy of the information provided to the Board.
Corporate Governance The Trust’s Standing Orders and Standing Financial Instructions also place certain obligations upon the Committee. In particular, the Committee will provide assurance to the Board of probity in the conduct of Trust business, by:
reviewing annually the continuing appropriateness of the Trust’s Standing Orders, Standing Financial Instructions and Scheme of Delegation;
monitoring the implementation of policy on standards of business conduct for staff
receiving and considering information on any waivers to Standing Orders;
reviewing schedules of losses and special payments including the case for write-offs.
Whistleblowing The committee shall review the effectiveness of the Trust’s Whistleblowing Policy and arrangements by which staff may raise concerns about possible improprieties in financial or other matters.
7.0 Approaches to obtaining relevant assurances 7.1 In carrying out this work the Committee will primarily utilise the work of Internal Audit,
External Audit and other assurance functions, but will not be limited to these audit functions. It will also seek reports and assurances from directors and managers as appropriate, concentrating on the over-arching systems of integrated governance, risk management and internal control, together with indicators of their effectiveness as set out below: Internal Audit The Committee will ensure that there is an effective internal audit function established by management that meets mandatory NHS Internal Audit Standards and provides appropriate independent assurance to the Audit Committee, Chief Executive and Board. This will be achieved by:
consideration of the provision of the Internal Audit service, the cost of the audit and any questions of resignation and dismissal
review and approval of the Internal Audit strategy, operational plan and more detailed programme of work, ensuring that this is consistent with the audit needs of the organisation as identified in the Assurance Framework
consideration of the major findings of internal audit work (and management’s response), and ensure co-ordination between the Internal and External Auditors to optimise audit resources
ensuring that the Internal Audit function is adequately resourced and has appropriate standing within the organisation
annual review of the effectiveness of internal audit
External Audit The Committee will review the work and findings of the External Auditor appointed by the Audit Commission and consider the implications and management’s responses to their work. This will be achieved by:
consideration of the appointment and performance of the External Auditor, as far as the Audit Commission’s rules permit
discussion and agreement with the External Auditor, before the audit commences, of the nature and scope of the audit as set out in the Annual Plan, and ensure co-ordination, as appropriate, with other External Auditors in the local health economy
discussion with the External Auditors of their local evaluation of audit risks and assessment of the Authority/Trust/PCT and associated impact on the audit fee

Page 5 /6
review all External Audit reports, including agreement of the annual audit letter before submission to the Board and any work carried outside the annual audit plan, together with the appropriateness of management responses
Counter Fraud The Committee will ensure that there is an effective local counter fraud function established by management that meets mandatory NHS Counter Fraud Standards and provides adequate arrangements to counter fraud. This will be achieved by:
consideration of the provision of the Local Counter Fraud Service (LCFS), the cost of the service and any questions of resignation and dismissal
review and approval of the LCFS strategy and annual plan, ensuring that this is consistent with the needs of the organisation and gives adequate assurances on all areas of the NHS Counter Fraud Strategy
consideration of LCFS reports
ensuring that the LCFS function is adequately resourced and has appropriate standing within the organisation
annual review of the effectiveness of Counter Fraud via the LCFS annual report
Other Assurance Functions The Audit Committee shall review the findings of other significant assurance functions, both internal and external to the organisation, and consider the implications to the governance of the organisation. These may include, but not be limited to, any reviews by Department of Health Arms Length Bodies or Regulators/Inspectors (e.g. Healthcare Commission, NHS Litigation Authority, etc.), professional bodies with responsibility for the performance of staff or functions (e.g. Royal Colleges, accreditation bodies, etc.) In addition, the Audit Committee will review the work of other relevant Committees within the organisation, whose work can provide relevant assurance to the Audit Committee’s own scope of work, in particular, those Committees with a remit for clinical governance and risk. The Audit Committee will wish to satisfy themselves on the assurances that can be gained from those functions which audit clinical outcome and performance.
Management The committee may request and review reports and positive assurance from directors and managers on the overall arrangements for governance, risk management and internal control. They may also request specific reports from individual functions within the organisation (e.g. clinical audit) as they may be appropriate to the overall arrangements. The committee will establish a formal system of following up recommendations arising from reports by:
establishing and recording the resultant actions, the date by which they should be completed and which Executive Director is responsible for them
reviewing and updating this list at each meeting
AUTHORITY AND ACCOUNTABILITY
8.0 Accountability 8.1 The Committee is established as a permanent sub-committee of the Trust Board
and is accountable to the Trust Board. (Appendix A presents the committee structure for Board sub-committees and principal executive committees relating to governance).

Page 6 /6
9.0 Authority 9.1 The Committee is authorised by the Board to investigate any activity within its
terms of reference. It is authorised to seek any information it requires from any employee and all employees are directed to co-operate with any request made by the Committee.
9.2 The Committee is authorised by the Board to obtain outside legal or other
independent professional advice and to secure the attendance of outsiders with relevant experience and expertise if it considers this necessary.
9.3 The Committee has no executive responsibilities except insofar as explicitly stated
in these Terms of Reference. 10.0 Reporting 10.1 The minutes of the Committee will be formally recorded and submitted to the
Board. In addition the chair of the Committee shall present a report to the Board after each meeting, drawing to the attention of the Board any issues that require disclosure to the full Board, or require executive action.
10.2 The Committee will also submit a written report to the Board annually on its
activities in support of the Statement on Internal Control.
MONITORING EFFECTIVENESS
11.1 In order to support the continual improvement of governance standards, sub-
committees of the Trust Board and executive committees are required to annually:
complete a self-assessment of the effectiveness of the committee;
present an annual written report to the Board or committee from which the committee derives its delegated authority;
review the terms of reference for the Committee, reaffirming the purpose and objectives;
prepare a work plan, for approval by the Board on an annual basis. 11.2 This Committee will report the results of the assessment of its effectiveness and
its annual report to the Trust Board.