Mechanical reliability characterization of low carbon steel brazed joints with copper filler metal
11
Materials Science and Engineering A 528 (2011) 6146–6156 Contents lists available at ScienceDirect Materials Science and Engineering A journal homepage: www.elsevier.com/locate/msea Mechanical reliability characterization of low carbon steel brazed joints with copper filler metal Morvarid K. Ghovanlou ∗ , Hamid Jahed, Amir Khajepour Department of Mechanical and Mechatronics Engineering, University of Waterloo, 200 University Avenue West, Waterloo, Ontario, N2L 3G1, Canada article info Article history: Received 5 January 2011 Received in revised form 3 April 2011 Accepted 17 April 2011 Available online 28 April 2011 Keywords: Brazed joint Strength evaluation Fracture toughness Finite element modeling Failure mechanism abstract In this paper, mechanical reliability of low carbon steel brazed joints with copper as the filler metal is investigated. Tensile and shear strengths of the joint are evaluated by tension and torsion tests performed on butt-brazed joint specimens. Brazed joint failure under mixed mode loading is evaluated by biaxial tension–torsion tests as well. It is shown that a power law mixed mode failure criterion based on the single mode tensile and shear strengths well predicts the biaxial failure of the brazed joint. Furthermore, tensile, torsion, and biaxial tests are numerically simulated using ABAQUS software. Applying the exper- imentally measured deformations to the FE model the joint strengths are well estimated. Resistance of the brazed joint against crack propagation is evaluated by fracture toughness testing on SENB and SENT specimens. Crack extension is monitored using a video-microscope camera during the fracture test. The obtained fracture toughness values show dependency on the loading configurations applied to the speci- mens. SEM images of the joint fracture surfaces show two different failure mechanisms of dimple rupture and dendritic failure on the fracture specimens failed under tensile stresses. The EDS chemical analysis on the fracture surface of the tensile specimens reveals that MnS-rich dendrites are the source of den- dritic failure, while the finer Fe-rich dendrites and microvoids cause the dimple rupture. Dimple rupture initiated from dendrites and microvoids is the only failure mechanism observed on the fracture surface of the torsion specimens failed under shear stresses. © 2011 Elsevier B.V. All rights reserved. 1. Introduction Brazing, as a type of welding process, is widely used in industry to manufacture assembled products from two or more individual parts. In the brazing process a filler metal in the form of foil, wire, paste, plating, or powder with a melting point of above 450 ◦ C and below the solidus temperature of the base metal is melted and dis- tributed between the faying surfaces of the individual parts to join them following solidification [1]. As compared to the fusion weld- ing, brazing technique produces less thermal distortion due to the uniform heating of components to the brazing temperature. Fur- thermore, preservation of physical and mechanical properties of base materials, reduction of induced residual stresses during join- ing, more uniform distribution of applied loads over a larger joint area, and feasibility of producing joints with high precision are among the advantages of brazed joints over weldments which have made this technique interesting in engineering applications [2]. Structural reliability of a brazed assembly is strongly depen- dent on the joint mechanical properties. Mechanical reliability of ∗ Corresponding author. Tel.: +1 519 888 4567x33646; fax: +1 519 885 58623. E-mail addresses: [email protected] (M.K. Ghovanlou), [email protected] (H. Jahed), [email protected] (A. Khajepour). brazed joints has been characterized by various criteria such as strength and toughness [3]. Effect of brazing temperature, heat- ing rate, holding time, and cooling process on the joint strength and ductility have been experimentally investigated for a wide range of brazed materials [4–8]. Yu and Lai [4] studied the effects of gap filler and brazing temperature on fracture of brazed joint. They found that increasing brazing temperature as well as addi- tion of gap filler at elevated temperatures improves joint strength and ductility. Chen and Chin [5] investigated the influence of braz- ing hold time on tensile and fatigue strength of brazed joints. It was observed that a shorter brazing cycle reduces diffusion reac- tion and the corresponding brittleness at the joint interface which yields more ductility and strength. Nayeb-Hashemi and Lockwood [6] showed that increasing the brazing time increases the amount of shrinkage porosities in the diffusion layer which reduces the joint strength, remarkably. Paiva et al. [7] and Feng et al. [8] investi- gated the effect of different brazing parameters such as hold time, temperature and filler metal on microstructure and mechanical properties of metal/ceramic joints to enhanced joint shear strength. Effects of joint clearance, different filler metals, and the correspond- ing microstructure on joint strength have also been investigated [9–12]. Nishi and Kikuchi [9] found out that the brazing filler metal has a significant effect on the joint strength as compared to that of the joint clearance and brazing hold time. They further observed 0921-5093/$ – see front matter © 2011 Elsevier B.V. All rights reserved. doi:10.1016/j.msea.2011.04.070
-
Upload
independent -
Category
Documents
-
view
3 -
download
0
Transcript of Mechanical reliability characterization of low carbon steel brazed joints with copper filler metal

Mc
MD
a
ARRAA
KBSFFF
1
tppbttiutbiaam
d
h
0d
Materials Science and Engineering A 528 (2011) 6146–6156
Contents lists available at ScienceDirect
Materials Science and Engineering A
journa l homepage: www.e lsev ier .com/ locate /msea
echanical reliability characterization of low carbon steel brazed joints withopper filler metal
orvarid K. Ghovanlou ∗, Hamid Jahed, Amir Khajepourepartment of Mechanical and Mechatronics Engineering, University of Waterloo, 200 University Avenue West, Waterloo, Ontario, N2L 3G1, Canada
r t i c l e i n f o
rticle history:eceived 5 January 2011eceived in revised form 3 April 2011ccepted 17 April 2011vailable online 28 April 2011
eywords:razed jointtrength evaluationracture toughnessinite element modeling
a b s t r a c t
In this paper, mechanical reliability of low carbon steel brazed joints with copper as the filler metal isinvestigated. Tensile and shear strengths of the joint are evaluated by tension and torsion tests performedon butt-brazed joint specimens. Brazed joint failure under mixed mode loading is evaluated by biaxialtension–torsion tests as well. It is shown that a power law mixed mode failure criterion based on thesingle mode tensile and shear strengths well predicts the biaxial failure of the brazed joint. Furthermore,tensile, torsion, and biaxial tests are numerically simulated using ABAQUS software. Applying the exper-imentally measured deformations to the FE model the joint strengths are well estimated. Resistance ofthe brazed joint against crack propagation is evaluated by fracture toughness testing on SENB and SENTspecimens. Crack extension is monitored using a video-microscope camera during the fracture test. Theobtained fracture toughness values show dependency on the loading configurations applied to the speci-
ailure mechanism mens. SEM images of the joint fracture surfaces show two different failure mechanisms of dimple ruptureand dendritic failure on the fracture specimens failed under tensile stresses. The EDS chemical analysison the fracture surface of the tensile specimens reveals that MnS-rich dendrites are the source of den-dritic failure, while the finer Fe-rich dendrites and microvoids cause the dimple rupture. Dimple ruptureinitiated from dendrites and microvoids is the only failure mechanism observed on the fracture surfaceof the torsion specimens failed under shear stresses.
. Introduction
Brazing, as a type of welding process, is widely used in industryo manufacture assembled products from two or more individualarts. In the brazing process a filler metal in the form of foil, wire,aste, plating, or powder with a melting point of above 450 ◦C andelow the solidus temperature of the base metal is melted and dis-ributed between the faying surfaces of the individual parts to joinhem following solidification [1]. As compared to the fusion weld-ng, brazing technique produces less thermal distortion due to theniform heating of components to the brazing temperature. Fur-hermore, preservation of physical and mechanical properties ofase materials, reduction of induced residual stresses during join-
ng, more uniform distribution of applied loads over a larger jointrea, and feasibility of producing joints with high precision aremong the advantages of brazed joints over weldments which have
ade this technique interesting in engineering applications [2].Structural reliability of a brazed assembly is strongly depen-ent on the joint mechanical properties. Mechanical reliability of
∗ Corresponding author. Tel.: +1 519 888 4567x33646; fax: +1 519 885 58623.E-mail addresses: [email protected] (M.K. Ghovanlou),
[email protected] (H. Jahed), [email protected] (A. Khajepour).
921-5093/$ – see front matter © 2011 Elsevier B.V. All rights reserved.oi:10.1016/j.msea.2011.04.070
© 2011 Elsevier B.V. All rights reserved.
brazed joints has been characterized by various criteria such asstrength and toughness [3]. Effect of brazing temperature, heat-ing rate, holding time, and cooling process on the joint strengthand ductility have been experimentally investigated for a widerange of brazed materials [4–8]. Yu and Lai [4] studied the effectsof gap filler and brazing temperature on fracture of brazed joint.They found that increasing brazing temperature as well as addi-tion of gap filler at elevated temperatures improves joint strengthand ductility. Chen and Chin [5] investigated the influence of braz-ing hold time on tensile and fatigue strength of brazed joints. Itwas observed that a shorter brazing cycle reduces diffusion reac-tion and the corresponding brittleness at the joint interface whichyields more ductility and strength. Nayeb-Hashemi and Lockwood[6] showed that increasing the brazing time increases the amount ofshrinkage porosities in the diffusion layer which reduces the jointstrength, remarkably. Paiva et al. [7] and Feng et al. [8] investi-gated the effect of different brazing parameters such as hold time,temperature and filler metal on microstructure and mechanicalproperties of metal/ceramic joints to enhanced joint shear strength.Effects of joint clearance, different filler metals, and the correspond-
ing microstructure on joint strength have also been investigated[9–12]. Nishi and Kikuchi [9] found out that the brazing filler metalhas a significant effect on the joint strength as compared to that ofthe joint clearance and brazing hold time. They further observed
e and Engineering A 528 (2011) 6146–6156 6147
tf[ifitbnjlambptGnTnfTtmwc[i
fofitsiwavfl
aeaa[mjdtbtasWtfw
wobmppos
Table 1Chemical composition of steel (ASTM A36) as the base metal [29].
Composition C Mn S Si P
under displacement controlled condition with a rate of 0.005 mm/s.Shear strength of the butt-brazed joints were evaluated by
means of torsion testing under rotation controlled condition andrate of 0.05 degree/s. Thin-walled tubular shape specimens with a
M.K. Ghovanlou et al. / Materials Scienc
hat brazed joints with smaller grain size in the recrystallized dif-usion layer show higher fracture strength. Nowacki and Kawiak10] reported that increasing joint thickness reduces the joint rigid-ty, significantly. Dixon [11] investigated the effect of differentller metals and joint clearances on the joint strength in ordero achieve the highest possible shear strength in metal/compositerazed joints. Gao and Qiana [12] used the micro-indentation tech-ique to investigate the micromechanical properties of different
oint regions. Regions with higher Young’s modulus and initial yieldimit were identified as the weakest sites for fatigue crack initi-tion. Environmental factors such as test temperatures and testedia on the joint strength and embrittlement have been studied
y Michler et al. [13]. Joint resistance against the propagation ofre-existing defects in the bond has been characterized by fractureoughness testing on notched specimens. Moorhead et al. [14] andan et al. [3] investigated the variation of the joint fracture tough-ess with different types of filler metals and brazing temperatures.he most common specimen configurations used in fracture tough-ess testing of brazed joints are double cantilever beam (DCB),
our-point bend beam, and notched tensile specimens [3,14–17].he initial crack required for fracture testing in all types of theested specimens was commonly introduced by electro discharge
achining (EDM) technique [3,15,16]. In some cases pre-crackingas attempted by applying static loading; however, difficulty of
ontrolling the crack initiation makes this method less successful3,14–17]. Scanning electron microscopy (SEM) was often used todentify different failure mechanisms of brazed joints [3,13,16].
In addition to the experimental investigations on brazed jointailures, numerical techniques have been used for failure predictionf brazed joints. Assuming an ideal bonding between the base andller materials, FE estimation of the joint interfacial stress distribu-ion reveals possible failure locations within the joint [16,18,19]. FEimulations have been done for the prediction of residual stressesnduced by the mismatch of thermal expansion coefficients of joint
ith different base materials and their effect on the joint strengthnd fracture toughness [15,20–23]. Furthermore, FE method pro-ides a useful tool for estimation of interfacial stress intensityactors for specific fracture specimen geometries for which ana-ytical stress intensity functions are not readily available [17].
Several attempts have been made to predict the joint tensilend shear strengths by a suitable failure criterion. Saxton et al. [24]stimated the lower and upper bounds of the joint tensile strengths a function of filler metal yield and ultimate tensile strengthsnd joint dimensions using an analytic approach. Flom and Wang25] proposed a damage zone failure criterion based on the filler
etal equivalent Mises stress to predict shear strength of lap shearoints. Leinenbach et al. [16] employed an in situ approach for jointeformation measurement during tensile test to estimate the jointensile strength with the help of FE modeling. Despite the fact thatrazed joints practically experience complicated loading condi-ions in engineering designs, prediction of the joint strength undermixed loading condition of tension and shear has not been con-
idered. Depending on the types of applied loads, Lee et al. [26] andung et al. [27] proposed mixed mode failure criteria for predic-
ion of spot weld strength. These failure criteria, expressed in theorm of power law equations, are capable of failure prediction ofeldments based on the combination of single-mode strengths.
In this study, mechanical reliability of low carbon steel brazedith copper filler metal is investigated. Tensile and shear strengths
f the joints are measured by tensile and torsion testing on therazed specimens, respectively. Brazed joint strength under mixedode loading is evaluated by biaxial tension–torsion testing. To
redict the joint strength under biaxial loading, a stress-basedower law failure criterion is used and calibrated based on thebtained experimental data. Deformation and failure of the brazedpecimens are numerically simulated using ABAQUS [28] commer-
Weight% 0.25 0.80–1.20 0.05 0.40 0.04max max max max
cial finite element software. Applying the experimentally measureddeformations at the joint failure to the FE model, strength of thejoints is well predicted. Moreover, fracture toughness of the brazedjoint is measured by performing quasi-static fracture tests on singleedge notched bend (SENB) and single edge notched tension (SENT)specimens. A starter crack is produced in the fracture specimensusing the stop-off materials coating. The effect of specimen loadingconfiguration on the joint fracture toughness, as a result of cracktip constraint effect, is investigated. Scanning electron microscopy(SEM) is used to examine the joint fracture surfaces and to iden-tify the corresponding failure mechanisms. Energy dispersive X-rayspectroscopy (EDS) chemical analysis of the joint is performed toconfirm the sources of different failure mechanisms.
2. Experimental procedure
Blanks of low carbon steel (ASTM A36) with the dimension40 mm × 19 mm × 50 mm were prepared and the related fayingsurfaces were ground with 240 grit silicon carbide sand paper. Thechemical compositions of the steel used here are listed in Table 1.
The steel blanks were cleaned by immersing them in an ultra-sonic bath of acetone for 5 min. Copper brazing filler metal (AWSBCu-1), in the shape of 75-�m thick cold rolled foil and purity of99.95%, was cut and placed between the faying surfaces. Steel shimwith the thickness of 50 �m was placed at four corners between thefaying surfaces to preserve a uniform joint clearance during braz-ing process. The assembly was constrained on both sides and placedinto the brazing furnace. The furnace was evacuated first by a dif-fusion pump and then purged by Argon inert gas with a dynamicpressure of 20 kPa. The furnace was then heated to 1110 ◦C and heldfor 30 min at this temperature to let the copper melt, flow, and dif-fuse into the base metals. The samples were furnace cooled at theend of the brazing process. The joint cross section was ground andpolished up to 1 �m diamond paste and etched using a 2% Nitalsolution to reveal the joint microstructure.
Strength of the butt-brazed joint in the normal direction wasmeasured by tensile testing. Flat dog-bone shape tensile specimens(Fig. 1) with a central joint were machined from the brazed block. Toinvestigate the effect of the base metal yield limit on the joint ten-sile strength, tensile specimens with a different base metal of lowcarbon steel, ASTM A108, were prepared as well. Uniaxial tensiletests were performed using servo hydraulic Instron tensile machine
Fig. 1. Flat dog-bone shape specimen with a central joint for tensile test (dimensionsin mm).

6148 M.K. Ghovanlou et al. / Materials Science and Engineering A 528 (2011) 6146–6156
Fig. 2. Round tubular specimen with a central joint for torsion and biaxial tests(
cfdbrcae
fTmtwiteajutoadw
ia
Fig. 4. Fracture specimen geometry and dimensions with the crack length a (dimen-sions in mm).
The crack length was monitored by a CCD video-microscope
dimensions in mm).
entral joint, Fig. 2, recommended by ASMT-E 2207 [30] were usedor the torsion test so that the assumption of uniform shear stressistribution on the joint cross sectional area be valid. In addition,iaxial tension–torsion tests with different extension to twist angleatios were performed on the same tubular shaped specimens toharacterize the joint strength in a general state of loading. Tensilend shear strains were measured by a 10-mm gage length biaxialxtensometer.
Pre-cracked brazed specimens were used to obtain the jointracture toughness and crack resistance curve by a fracture test.he ASTM E1820 standard recommended crack depth to the speci-en width ratio of 0.5 was selected for all specimens [31]. To create
he starter crack inside the joint, half portion of the faying surfacesere coated by means of NICROBRAZ Green Stop-off Pen contain-
ng ceramic powder to prevent this portion from brazing. Sincehe stop-off material solvent has a boiling temperature of 82 ◦C, itasily evaporates during brazing and produces gas bubbles whichre trapped inside the joint. In order to avoid gas porosities in theoint, the coated faying surfaces were preheated inside a furnacep to 100 ◦C for 20 min before assembling. The copper foil with thehickness of 75 �m was cut and placed on the other half portionf the specimen. As previously mentioned, steel shims were useds spacers during the brazing process. The brazing assembly andetail of the joint faying surface are shown in Fig. 3. The assemblyas furnace brazed in the same condition described before.
The brazed block was cut and machined into the fracture spec-mens shown in Fig. 4. The specimen dimensions were selectedccording to the ASTM E1820 recommendation [31].
Fig. 3. Brazing assembly (a) front view, (b) side view,
Fig. 5. SENB specimen under four-point bend loading (dimensions in mm).
Four-point bending and tensile quasi-static fracture tests wereperformed on the SENB and SENT specimens to characterize thefracture toughness of the brazed joints, respectively. The tests wereconducted under displacement controlled condition with a rate of0.03 mm/s. Loading configurations of these two sets of specimensare shown in Figs. 5 and 6. In the four-point bend test, inner andouter loading spans were gripped into the jigs of a servo hydraulicInstron tensile machine. The SENT specimens were tested withthe clamping distance of 60 mm. Load and cross-head positionswere recorded during the test. Crack mouth opening displacement(CMOD) was measured by the use of a clip-gage attached to theknife edges which were screwed to the specimens within a gagelength of 8 mm, as shown in Figs. 5 and 6.
camera during the fracture test. Lab View software was pro-grammed to capture images of the crack tip locations at every 0.01 stime interval. The load output signal was also recorded simultane-
(c) joining region top view (dimensions in mm).
M.K. Ghovanlou et al. / Materials Science and Engineering A 528 (2011) 6146–6156 6149
Fig. 6. SENT specimen under tensile loading (dimensions in mm).
Table 2Mechanical properties of the base metals.
Material Elasticmodulus[GPa]
Poisson’sratio
Yieldstrength[MPa]
ott
3
sAttpoa(mt
t
a
Table 3Weight % of brazed joint element composition from EDS analysis.
Region A B C
Fe 82.6 1.5 9.9Cu 17.4 48.2 90.1
Low carbon steel (A108) 200 0.3 338Low carbon steel (A36) 200 0.3 220
usly to identify the corresponding applied load for which the crackip image was captured. Fig. 7 shows the schematic of the fractureest and image capturing set-up.
. Numerical modeling
To model the brazed joints deformation and failure, the ten-ile, torsion and biaxial tests are numerically simulated using theBAQUS 6.7 commercial FE software. Fig. 8 shows a 3D model of
he half 10-mm gage section of the tensile specimen. A quarter ofhe specimen is modeled due to the presence of two symmetriclanes. Symmetric boundary condition is placed on the mid-planef the joint and the experimentally measured extension is appliedt the end section of the model. Quadratic hexagonal solid elementsC3D20) were used in the simulation. The joint is model as a bi-
aterial and the corresponding material properties are assigned tohe base and filler metal sections.
Mechanical properties of the base metals determined by tensileests are presented in Table 2.
Hardening behaviors of the two base metals used in this studyre shown in Fig. 9.
Fig. 7. Schematic of the fracture tes
Mn 0 30.2 0S 0 20.1 0
The mechanical properties for the filler metal are assumed to bethe same as its pure bulk material properties [32]. In the presentsimulation, an elastic modulus of 82 GPa, a Poisson’s ratio of 0.34,and a yield limit of 215 MPa were used for the copper filler metal[33].
A power law hardening model is used for the copper as follows[33]:
� = 450(0.025 + εp)0.2 (1)
where � and εp are the equivalent Mises stress and the corre-sponding plastic strain, respectively. To simulate the deformationof the tubular specimens in torsion and biaxial tests, the 10-mmgage section of the tubular specimen is modeled. Axisymmetric 8-noded quadrilateral elements (CAX8) were used in the simulation.One end of the model was fixed and the experimentally measuredextensions and twist angles with different ratios were applied toa reference point (RP) coupled to the other end of the model, asshown in Fig. 10.
4. Results and discussion
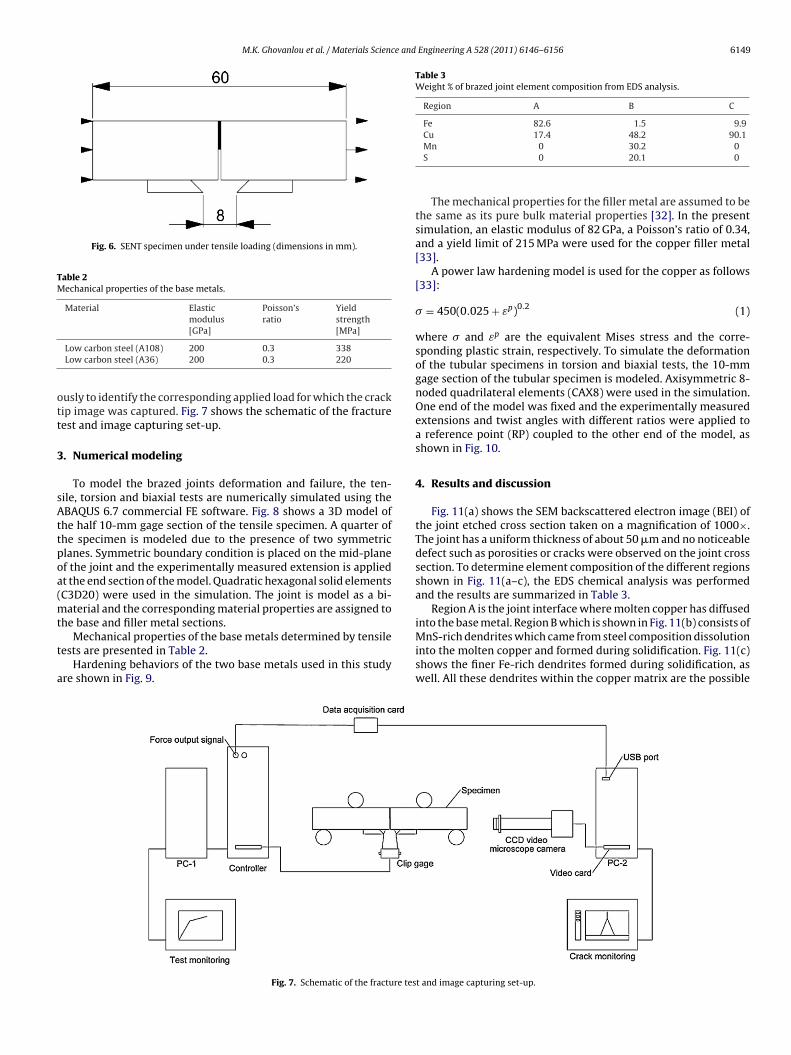
Fig. 11(a) shows the SEM backscattered electron image (BEI) ofthe joint etched cross section taken on a magnification of 1000×.The joint has a uniform thickness of about 50 �m and no noticeabledefect such as porosities or cracks were observed on the joint crosssection. To determine element composition of the different regionsshown in Fig. 11(a–c), the EDS chemical analysis was performedand the results are summarized in Table 3.
Region A is the joint interface where molten copper has diffusedinto the base metal. Region B which is shown in Fig. 11(b) consists ofMnS-rich dendrites which came from steel composition dissolution
into the molten copper and formed during solidification. Fig. 11(c)shows the finer Fe-rich dendrites formed during solidification, aswell. All these dendrites within the copper matrix are the possiblet and image capturing set-up.

6150 M.K. Ghovanlou et al. / Materials Science and Engineering A 528 (2011) 6146–6156
Fig. 8. FE model and boundary cond
Fig. 9. Stress–plastic strain curves of the two base metals.
F
fl
eb
TB
ig. 10. Axisymmetric FE model and boundary conditions of the tubular specimen.
ailure locations in the mechanical testing which will be discussedater.
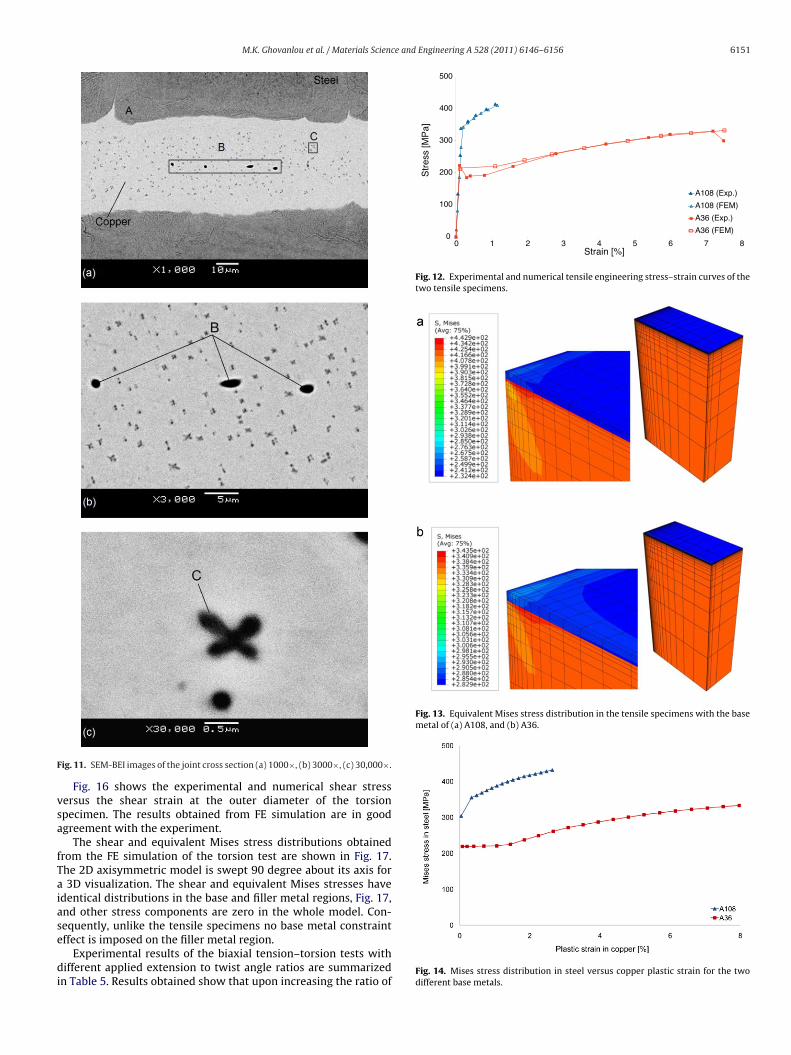
Tensile stresses versus the tensile strains obtained from thexperiment and FE simulation of the brazed specimens with thease metals of different yield limits are presented in Fig. 12. For
able 4razed joint strength for base metals with different yield limits.
Base metalalloy
ASTMspecification
Base metal yield lim[MPa]
Low carbon steel A108 338Low carbon steel A36 220
itions of the tensile specimen.
the ease of comparison, the tensile strengths of the different spec-imens are summarized in Table 4. In the numerical modeling, thebase metal tensile stress corresponding to the maximum appliedextension is taken as the joint tensile strength.
The equivalent Mises stress distribution obtained from FE mod-eling of the tensile specimens, Fig. 13, shows that the externalcorner of the joint is the critical location for failure. Applying theexperimentally measured extension to the FE model, the predictedstrengths from the simulation agree well with the experimentalresults.
The results show that brazed joint tensile strength improves byincreasing the base metal yield limit. The effect of the base metalyield limit on the joint tensile strength is related to the constraintsimposed by the base metal on the joint region [24]. In the case thatthe filler metal yield limit is less than that of the base metal, the jointtends to deform plastically under the lateral constraint imposed bythe base metal elastic deformation. This constraint induces a hightriaxial state of stress in the joint region. As shown in Fig. 14, thisconstraint vanishes upon reaching the base metal yield limit andallows the filler metal to deform plastically. Therefore, a base metalwith a higher yield limit promotes the joint tensile strength bydelaying the filler metal extensive plastic deformation to a higherapplied load level.
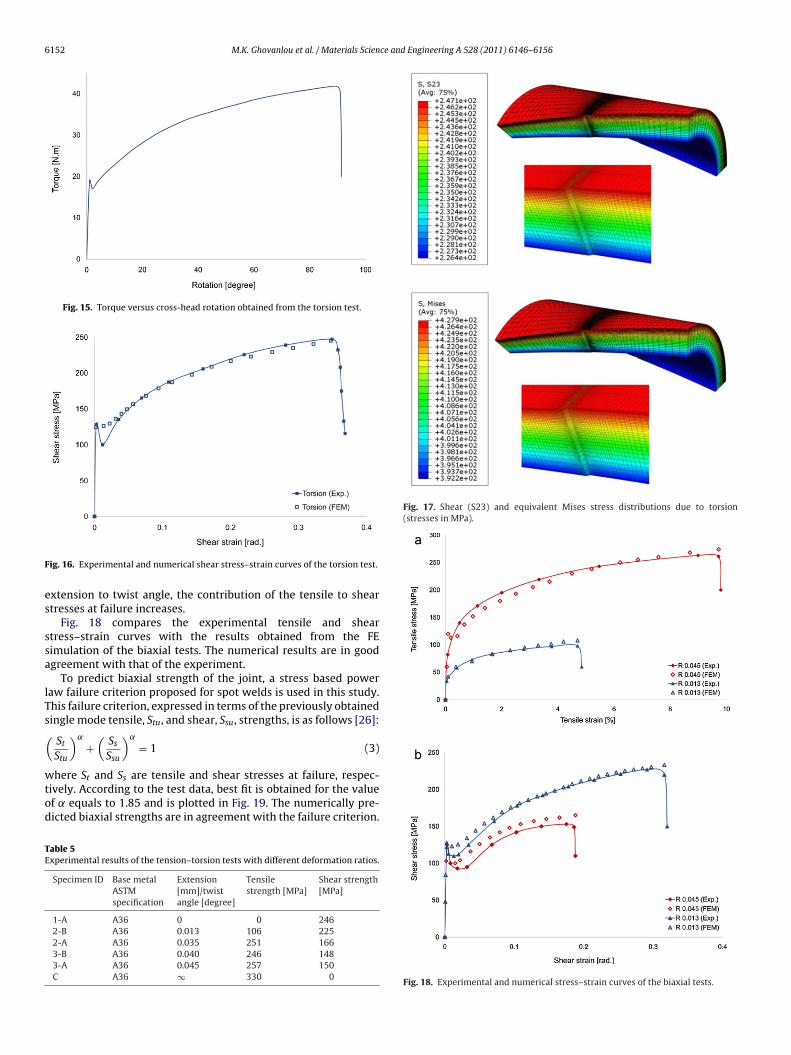
Torque versus cross-head rotation obtained from the torsion testis plotted in Fig. 15. The maximum recorded torque at the onset offailure was 42 N m.
The average shear stress, �ave, for thin-walled tubular specimensunder applied torque, T, is calculated as follows [30]:
�ave = 16T
�(d2o − d2
i)(do + di)
(2)
where di and do are inner and outer diameters of the specimen,respectively. Using Eq. (2), an average ultimate shear strength of246 MPa for the joint is estimated.
it Experimental jointtensile strength [MPa]
FEM joint tensilestrength [MPa]
417 418330 332
M.K. Ghovanlou et al. / Materials Science and Engineering A 528 (2011) 6146–6156 6151
F
vsa
fTaiase
di
0
100
200
300
400
500
876543210
Str
ess
[MP
a]
Strain [%]
A108 (Exp.)
A108 (FEM)
A36 (Exp.)
A36 (FEM)
Fig. 12. Experimental and numerical tensile engineering stress–strain curves of thetwo tensile specimens.
Fig. 13. Equivalent Mises stress distribution in the tensile specimens with the basemetal of (a) A108, and (b) A36.
ig. 11. SEM-BEI images of the joint cross section (a) 1000×, (b) 3000×, (c) 30,000×.
Fig. 16 shows the experimental and numerical shear stressersus the shear strain at the outer diameter of the torsionpecimen. The results obtained from FE simulation are in goodgreement with the experiment.
The shear and equivalent Mises stress distributions obtainedrom the FE simulation of the torsion test are shown in Fig. 17.he 2D axisymmetric model is swept 90 degree about its axis for3D visualization. The shear and equivalent Mises stresses have
dentical distributions in the base and filler metal regions, Fig. 17,nd other stress components are zero in the whole model. Con-equently, unlike the tensile specimens no base metal constraint
ffect is imposed on the filler metal region.Experimental results of the biaxial tension–torsion tests withifferent applied extension to twist angle ratios are summarized
n Table 5. Results obtained show that upon increasing the ratio ofFig. 14. Mises stress distribution in steel versus copper plastic strain for the twodifferent base metals.
6152 M.K. Ghovanlou et al. / Materials Science and Engineering A 528 (2011) 6146–6156
Fig. 15. Torque versus cross-head rotation obtained from the torsion test.
F
es
ssa
lTs(
wtod
TE
Fig. 17. Shear (S23) and equivalent Mises stress distributions due to torsion(stresses in MPa).
ig. 16. Experimental and numerical shear stress–strain curves of the torsion test.
xtension to twist angle, the contribution of the tensile to sheartresses at failure increases.
Fig. 18 compares the experimental tensile and sheartress–strain curves with the results obtained from the FEimulation of the biaxial tests. The numerical results are in goodgreement with that of the experiment.
To predict biaxial strength of the joint, a stress based poweraw failure criterion proposed for spot welds is used in this study.his failure criterion, expressed in terms of the previously obtainedingle mode tensile, Stu, and shear, Ssu, strengths, is as follows [26]:
St
Stu
)˛
+(
Ss
Ssu
)˛
= 1 (3)
here St and Ss are tensile and shear stresses at failure, respec-ively. According to the test data, best fit is obtained for the valuef ˛ equals to 1.85 and is plotted in Fig. 19. The numerically pre-icted biaxial strengths are in agreement with the failure criterion.
able 5xperimental results of the tension–torsion tests with different deformation ratios.
Specimen ID Base metalASTMspecification
Extension[mm]/twistangle [degree]
Tensilestrength [MPa]
Shear strength[MPa]
1-A A36 0 0 2462-B A36 0.013 106 2252-A A36 0.035 251 1663-B A36 0.040 246 1483-A A36 0.045 257 150C A36 ∞ 330 0
Fig. 18. Experimental and numerical stress–strain curves of the biaxial tests.

M.K. Ghovanlou et al. / Materials Science and Engineering A 528 (2011) 6146–6156 6153
Ttnro
ami
twir
mel
F(
Fig. 19. Power law failure criterion curve fit to the biaxial test results.
he results show that in addition to the single mode strengths inensile and shear directions, the biaxial strengths of the joint areumerically well estimated. Further, the power law failure crite-ion in terms of single mode strengths is well suited to the naturef biaxial failure in brazed joints.
Fig. 20 shows the optical micrograph of the fracture speciment the produced starter crack. The crack root radius, which waseasured less than 1 �m for all of the specimens, is sharp enough
n order not to affect the fracture test results.From the quasi-static fracture toughness tests performed on the
wo types of SENB and SENT specimens, load versus CMOD curvesere plotted in Fig. 21. Behavior of all of the tested specimens
n each test group is in good agreement which validates the testepeatability and accuracy.
The images taken from the crack during the fracture tests deter-
ine the corresponding critical load levels, Pc, at which the crackxtension has initiated for each tested specimen. These criticaloads are listed in Table 6.
ig. 20. Micrograph of brazed joint and starter crack taken by an optical microscopea) 100×, (b) 500×.
Fig. 21. Load–CMOD curves recorded for (a) SENB and (b) SENT specimens.
The fracture toughness, Jc, of the brazed joint is calculated asthe critical amount of the energy release rate at initiation of crackextension. ASTM-E1820 standard code for the fracture toughnesstesting of metallic materials [31] provides equations needed for thecalculation of the energy release rate from a fracture test results.The values of the load and CMOD which are experimentally mea-sured for each increment of the crack advance (i) are used forthe calculations. The elastic and plastic components of the energyrelease rate are calculated from [31]:
Jel(i+1) =K2
(i+1)
E(4)
Jpl(i+1) =(
Jpl(i) + �iCMODbiB
Ai+1,iVpl
)(1 − �i
CMODbi
(ai+1 − ai)
)(5)
P(i+1)(a(i+1)
)
K(i+1) =BW1/2f
W(6)
where W and B are the specimen width and thickness, respectively.Furthermore, a is the crack length and f(a/W) is a dimensionless
Table 6Critical load and fracture toughness for the SENB and SENT specimens.
Specimen type Test Pc [kN] Pmax [kN] Jc[
kJ/m2]
SENB 4-Point bend 1.89 2.14 10.63SENT Tension 10.87 11.48 133.45
6154 M.K. Ghovanlou et al. / Materials Science and
w(
f15 −
f)3
](8)
wf
F
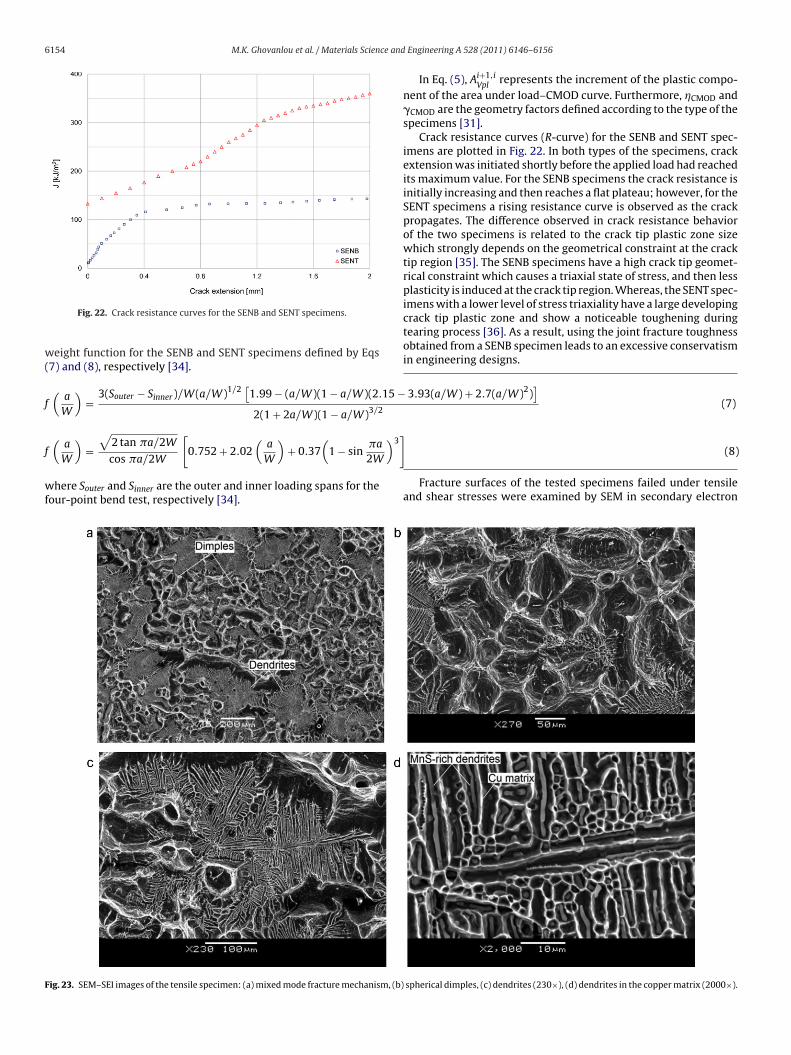
Fig. 22. Crack resistance curves for the SENB and SENT specimens.
eight function for the SENB and SENT specimens defined by Eqs7) and (8), respectively [34].
(a
W
)=
3(Souter − Sinner)/W(a/W)1/2 [1.99 − (a/W)(1 − a/W)(2.
2(1 + 2a/W)(1 − a/W)3/2
(a
)=
√2 tan �a/2W
[0.752 + 2.02
(a
)+ 0.37
(1 − sin
�a
W cos �a/2W W 2W
here Souter and Sinner are the outer and inner loading spans for theour-point bend test, respectively [34].
ig. 23. SEM–SEI images of the tensile specimen: (a) mixed mode fracture mechanism, (b)
Engineering A 528 (2011) 6146–6156
3.93(a/W) + 2.7(a/W)2)]
(7)
In Eq. (5), Ai+1,iVpl
represents the increment of the plastic compo-nent of the area under load–CMOD curve. Furthermore, �CMOD and�CMOD are the geometry factors defined according to the type of thespecimens [31].
Crack resistance curves (R-curve) for the SENB and SENT spec-imens are plotted in Fig. 22. In both types of the specimens, crackextension was initiated shortly before the applied load had reachedits maximum value. For the SENB specimens the crack resistance isinitially increasing and then reaches a flat plateau; however, for theSENT specimens a rising resistance curve is observed as the crackpropagates. The difference observed in crack resistance behaviorof the two specimens is related to the crack tip plastic zone sizewhich strongly depends on the geometrical constraint at the cracktip region [35]. The SENB specimens have a high crack tip geomet-rical constraint which causes a triaxial state of stress, and then lessplasticity is induced at the crack tip region. Whereas, the SENT spec-imens with a lower level of stress triaxiality have a large developingcrack tip plastic zone and show a noticeable toughening duringtearing process [36]. As a result, using the joint fracture toughnessobtained from a SENB specimen leads to an excessive conservatismin engineering designs.
Fracture surfaces of the tested specimens failed under tensileand shear stresses were examined by SEM in secondary electron
spherical dimples, (c) dendrites (230×), (d) dendrites in the copper matrix (2000×).
M.K. Ghovanlou et al. / Materials Science and
F
iaaiiofaDSsmtswpvfrndctrt
udsrcr
5
ctRfifc
Srf
[
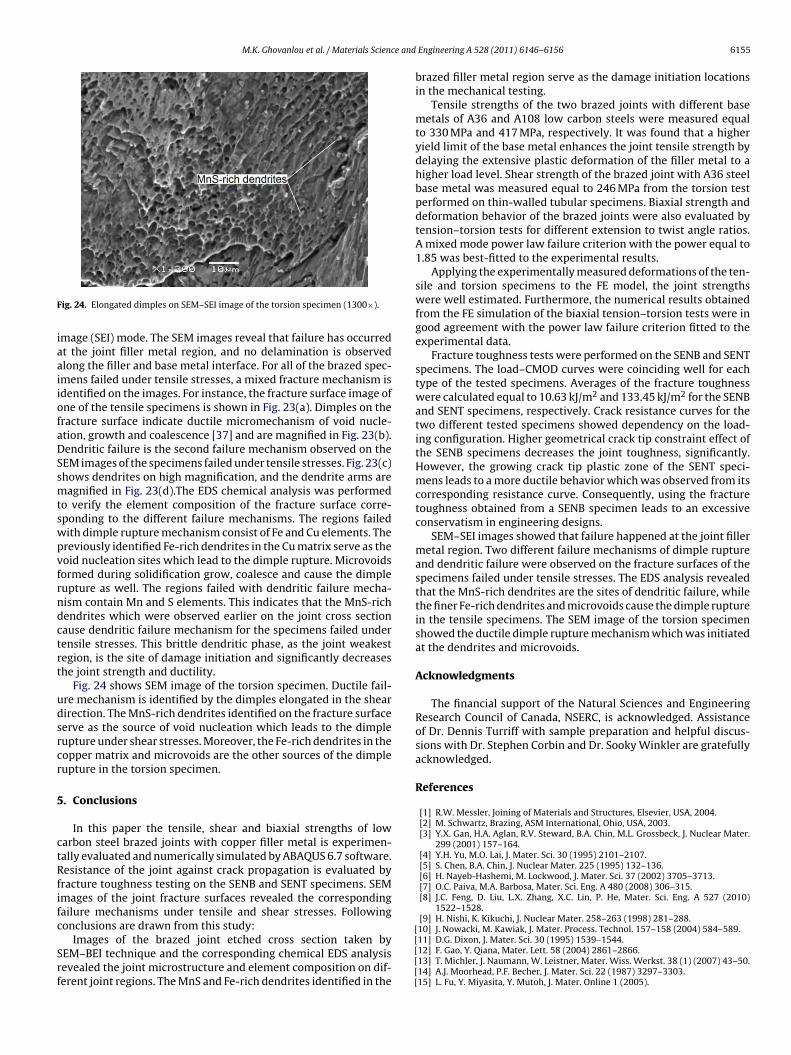
ig. 24. Elongated dimples on SEM–SEI image of the torsion specimen (1300×).
mage (SEI) mode. The SEM images reveal that failure has occurredt the joint filler metal region, and no delamination is observedlong the filler and base metal interface. For all of the brazed spec-mens failed under tensile stresses, a mixed fracture mechanism isdentified on the images. For instance, the fracture surface image ofne of the tensile specimens is shown in Fig. 23(a). Dimples on theracture surface indicate ductile micromechanism of void nucle-tion, growth and coalescence [37] and are magnified in Fig. 23(b).endritic failure is the second failure mechanism observed on theEM images of the specimens failed under tensile stresses. Fig. 23(c)hows dendrites on high magnification, and the dendrite arms areagnified in Fig. 23(d).The EDS chemical analysis was performed
o verify the element composition of the fracture surface corre-ponding to the different failure mechanisms. The regions failedith dimple rupture mechanism consist of Fe and Cu elements. Thereviously identified Fe-rich dendrites in the Cu matrix serve as theoid nucleation sites which lead to the dimple rupture. Microvoidsormed during solidification grow, coalesce and cause the dimpleupture as well. The regions failed with dendritic failure mecha-ism contain Mn and S elements. This indicates that the MnS-richendrites which were observed earlier on the joint cross sectionause dendritic failure mechanism for the specimens failed underensile stresses. This brittle dendritic phase, as the joint weakestegion, is the site of damage initiation and significantly decreaseshe joint strength and ductility.
Fig. 24 shows SEM image of the torsion specimen. Ductile fail-re mechanism is identified by the dimples elongated in the shearirection. The MnS-rich dendrites identified on the fracture surfaceerve as the source of void nucleation which leads to the dimpleupture under shear stresses. Moreover, the Fe-rich dendrites in theopper matrix and microvoids are the other sources of the dimpleupture in the torsion specimen.
. Conclusions
In this paper the tensile, shear and biaxial strengths of lowarbon steel brazed joints with copper filler metal is experimen-ally evaluated and numerically simulated by ABAQUS 6.7 software.esistance of the joint against crack propagation is evaluated by
racture toughness testing on the SENB and SENT specimens. SEMmages of the joint fracture surfaces revealed the correspondingailure mechanisms under tensile and shear stresses. Followingonclusions are drawn from this study:
Images of the brazed joint etched cross section taken byEM–BEI technique and the corresponding chemical EDS analysisevealed the joint microstructure and element composition on dif-erent joint regions. The MnS and Fe-rich dendrites identified in the
[[[[[
Engineering A 528 (2011) 6146–6156 6155
brazed filler metal region serve as the damage initiation locationsin the mechanical testing.
Tensile strengths of the two brazed joints with different basemetals of A36 and A108 low carbon steels were measured equalto 330 MPa and 417 MPa, respectively. It was found that a higheryield limit of the base metal enhances the joint tensile strength bydelaying the extensive plastic deformation of the filler metal to ahigher load level. Shear strength of the brazed joint with A36 steelbase metal was measured equal to 246 MPa from the torsion testperformed on thin-walled tubular specimens. Biaxial strength anddeformation behavior of the brazed joints were also evaluated bytension–torsion tests for different extension to twist angle ratios.A mixed mode power law failure criterion with the power equal to1.85 was best-fitted to the experimental results.
Applying the experimentally measured deformations of the ten-sile and torsion specimens to the FE model, the joint strengthswere well estimated. Furthermore, the numerical results obtainedfrom the FE simulation of the biaxial tension–torsion tests were ingood agreement with the power law failure criterion fitted to theexperimental data.
Fracture toughness tests were performed on the SENB and SENTspecimens. The load–CMOD curves were coinciding well for eachtype of the tested specimens. Averages of the fracture toughnesswere calculated equal to 10.63 kJ/m2 and 133.45 kJ/m2 for the SENBand SENT specimens, respectively. Crack resistance curves for thetwo different tested specimens showed dependency on the load-ing configuration. Higher geometrical crack tip constraint effect ofthe SENB specimens decreases the joint toughness, significantly.However, the growing crack tip plastic zone of the SENT speci-mens leads to a more ductile behavior which was observed from itscorresponding resistance curve. Consequently, using the fracturetoughness obtained from a SENB specimen leads to an excessiveconservatism in engineering designs.
SEM–SEI images showed that failure happened at the joint fillermetal region. Two different failure mechanisms of dimple ruptureand dendritic failure were observed on the fracture surfaces of thespecimens failed under tensile stresses. The EDS analysis revealedthat the MnS-rich dendrites are the sites of dendritic failure, whilethe finer Fe-rich dendrites and microvoids cause the dimple rupturein the tensile specimens. The SEM image of the torsion specimenshowed the ductile dimple rupture mechanism which was initiatedat the dendrites and microvoids.
Acknowledgments
The financial support of the Natural Sciences and EngineeringResearch Council of Canada, NSERC, is acknowledged. Assistanceof Dr. Dennis Turriff with sample preparation and helpful discus-sions with Dr. Stephen Corbin and Dr. Sooky Winkler are gratefullyacknowledged.
References
[1] R.W. Messler, Joining of Materials and Structures, Elsevier, USA, 2004.[2] M. Schwartz, Brazing, ASM International, Ohio, USA, 2003.[3] Y.X. Gan, H.A. Aglan, R.V. Steward, B.A. Chin, M.L. Grossbeck, J. Nuclear Mater.
299 (2001) 157–164.[4] Y.H. Yu, M.O. Lai, J. Mater. Sci. 30 (1995) 2101–2107.[5] S. Chen, B.A. Chin, J. Nuclear Mater. 225 (1995) 132–136.[6] H. Nayeb-Hashemi, M. Lockwood, J. Mater. Sci. 37 (2002) 3705–3713.[7] O.C. Paiva, M.A. Barbosa, Mater. Sci. Eng. A 480 (2008) 306–315.[8] J.C. Feng, D. Liu, L.X. Zhang, X.C. Lin, P. He, Mater. Sci. Eng. A 527 (2010)
1522–1528.[9] H. Nishi, K. Kikuchi, J. Nuclear Mater. 258–263 (1998) 281–288.10] J. Nowacki, M. Kawiak, J. Mater. Process. Technol. 157–158 (2004) 584–589.
11] D.G. Dixon, J. Mater. Sci. 30 (1995) 1539–1544.12] F. Gao, Y. Qiana, Mater. Lett. 58 (2004) 2861–2866.13] T. Michler, J. Naumann, W. Leistner, Mater. Wiss. Werkst. 38 (1) (2007) 43–50.14] A.J. Moorhead, P.F. Becher, J. Mater. Sci. 22 (1987) 3297–3303.15] L. Fu, Y. Miyasita, Y. Mutoh, J. Mater. Online 1 (2005).
6 ce and
[
[[[
[
[[
[[[[
[
[[
[
[
[
[[
Taylor and Francis, USA, 2005.
156 M.K. Ghovanlou et al. / Materials Scien
16] C. Leinenbach, H.J. Schindler, T.A. Baser, N. Rüttimann, K. Wegener, Eng. Fail.Anal. 17 (3) (2010) 672–682.
17] N.R. Philips, M.Y. He, A.G. Evans, Acta Mater. 56 (2008) 4593–4600.18] J. Zhang, L.Y. Jin, J. Mater. Sci. Technol. 21 (12) (2005) 1455–1459.19] H.A. Nied, C.A. Schlanskier, IEEE Trans. Compon. Hybrid Manuf. Technol. 7 (1)
(1984) 112–124.20] R.U Vaidyaa, P. Rangaswamya, M.A.M. Bourkea, D.P. Butta, Acta Mater. 46 (6)
(1998) 2047–2061.21] D.N. Travessa, M. Ferrante, G. Ouden, J. Mater. Sci. Technol. 16 (2000) 687–691.22] J.X. Zhang, R.S. Chandel, Y.Z. Chen, H.P. Seow, J. Mater. Process. Technol. 122
(2–3) (2002) 220–225.23] W. Jiang, J. Gong, S. Tu, Q. Fan, Mater. Des. 30 (1) (2009) 23–27.24] H.J. Saxton, A.J. West, C.R. Barrett, Metall. Trans. 2 (1971) 999–1007.
25] Y. Flom, L. Wang, J. Welding Res. (2004) 32–38S.26] Y.L. Lee, T.J. Wehner, M.W. Lu, T.W. Morrissett, E. Pakalnins, J. Test. Eval. 26(1998) 213–219.27] P. Wung, T. Walsh, A. Ourchane, W. Stewart, M. Jie, Exp. Mech. 41 (2001)
100–106.
[[
[
Engineering A 528 (2011) 6146–6156
28] ABAQUS/CAE, Version 6.7-1, Dassault Systemes, 2007.29] Standard Specification for Carbon Structural Steel, Designation: A36/A36M-08,
ASTM International, 2008.30] Standard Practice for Strain-Controlled Axial–Torsional Fatigue Testing with
Thin-Walled Tubular Specimens, Designation: E 2207-08, ASTM International,2008.
31] Standard Test Method for Measurement of Fracture Toughness, Designation: E1820-08a, ASTM International, 2008.
32] C.T. Chang, R.K. Shiue, Int. J. Refract. Metals Hard Mater. 23 (2005)161–170.
33] J.D. Bressan, R.K. Unfer, J. Mater. Process. Technol. 179 (2006) 23–29.34] T.L. Anderson, Fracture Mechanics: Fundamentals and Applications, 3rd ed.,
35] R.W. Judy, R.J. Goode, ASTM STP 527 (1973) 48–61.36] B. Nyhus, M.L. Polanco, O. Orjasater, Proceedings of 22nd International Confer-
ence on Offshore Mechanics and Arctic Engineering, Cancun, Mexico, 2003.37] ASM Handbook, Fractography 12 (2010).