Mechanical properties of a leaded, resulfurized ...
68
NATL INST OF STAND S TECH A111D7 3TDbOD NBS PUBLICATIONS NBSIR 84-2839 Mechanical Properties of A Leaded, Resulfurized, Rephosphorized Steel in Various Thermo/Mechanical Conditions U.S. DEPARTMENT OP COMMERCE National Bureau of Standards National Measurement Laboratory Metallurgy Division Washington, DC 20234 January 1 984 Final Report issued March 1 984 Dr epared for «« "sited States Coast Guard apartment of Transportation 1 ashington, DC 20590 .1156 34-2339 1934
-
Upload
khangminh22 -
Category
Documents
-
view
0 -
download
0
Transcript of Mechanical properties of a leaded, resulfurized ...
NATL INST OF STAND S TECH
A111D7 3TDbOD
NBS
PUBLICATIONS
NBSIR 84-2839
Mechanical Properties of A Leaded,Resulfurized, Rephosphorized Steel
in Various Thermo/MechanicalConditions
U.S. DEPARTMENT OP COMMERCENational Bureau of Standards
National Measurement Laboratory
Metallurgy Division
Washington, DC 20234
January 1 984
Final Report
issued March 1 984
Drepared for
«« "sited States Coast Guardapartment of Transportation
1 ashington, DC 20590
.1156
34-2339
1934

NATIONAL BUREAUOF STANDARDS
LIBRARY
NBSIR 84-2839
MECHANICAL PROPERTIES OF A LEADED,
RESULFURIZED, REPHOSPHORIZED STEEL
IN VARIOUS THERMO/MECHANICALCONDITIONS
J. G. Early
U S. DEPARTMENT OF COMMERCENational Bureau of Standards
National Measurement Laboratory
Metallurgy Division
Washington, DC 20234
January 1 984
Final Report
Issued March 1 984
Prepared for
United States Coast GuardDepartment of Transportation
Washington, DC 20590
U.S. DEPARTMENT OF COMMERCE, Malcolm Baldrige, Secretary
NATIONAL BUREAU OF STANDARDS, Ernest Ambler, Director
Q*

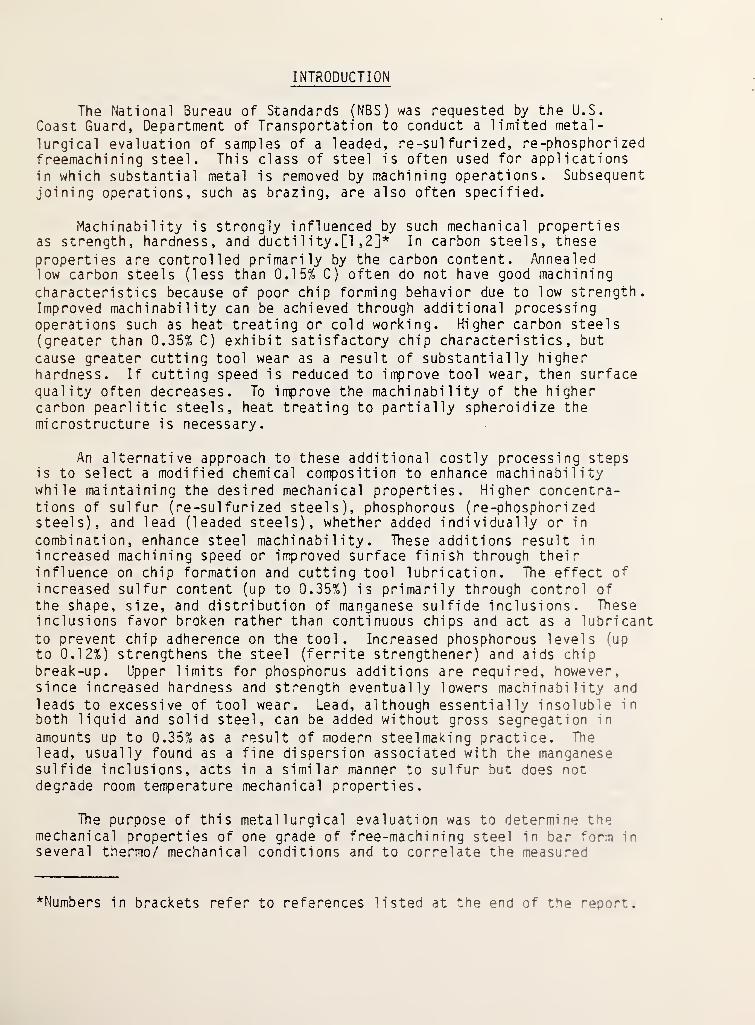
INTRODUCTION
The National Bureau of Standards (NBS) was requested by the U.S.Coast Guard, Department of Transportation to conduct a limited metal-
lurgical evaluation of samples of a leaded, re-sul furi zed, re-phosphori zed
f reemachi ni ng steel. This class of steel is often used for applicationsin which substantial metal is removed by machining operations. Subsequentjoining operations, such as brazing, are also often specified.
Machi nabi 1 i ty is strongly influenced by such mechanical propertiesas strength, hardness, and ductility. [1 ,2]* In carbon steels, tnese
properties are controlled primarily by the carbon content. Annealedlow carbon steels (less than 0.15% C) often do not have good macnining
characteristics because of poor chip forming behavior due to low strength.Improved machi nabi 1 i ty can be achieved through additional processingoperations such as heat treating or cold working. Higher carbon steels(greater than 0.35% C) exhibit satisfactory chip characteri sti cs , but
cause greater cutting tool wear as a result of substantially higherhardness. If cutting speed is reduced to improve tool wear, then surfacequality often decreases. To iiTprove the machi nabi 1 ity of the highercarbon pearlitic steels, heat treating to partially spheroidize the
mi crost ructure is necessary.
An alternative approach to these additional costly processing stepsis to select a modified chemical composition to enhance machi nabi 1 i tywhile maintaining the desired mechanical properties. Higher concentra-tions of sulfur (re-sul furi zed steels), phosphorous (re-phosphori zedsteels), and lead (leaded steels), whether added individually or in
combination, enhance steel machi nabi 1 i ty . These additions result in
increased machining speed or improved surface finish through theirinfluence on chip formation and cutting tool lubrication. The effect of
increased sulfur content (up to 0.35%) is primarily through control of
the shape, size, and distribution of manganese sulfide inclusions. Theseinclusions favor broken rather than continuous chips and act as a lubricant
to prevent chip adherence on the tool. Increased phosphorous levels (up
to 0.12%) strengthens the steel (ferrite strengthener) and aids chip
break-up. Upper limits for phosphorus additions are required, however,since increased hardness and strength eventually lowers machi nabi 1 i ty and
leads to excessive of tool wear. Lead, although essentially insoluble in
both liquid and solid steel, can be added without gross segregation in
amounts up to 0.35% as a result of modern steel making practice. Thelead, usually founa as a fine dispersion associated with the manganesesulfide inclusions, acts in a similar manner to sulfur but does notdegrade room temperature mechanical properties.
The purpose of this metallurgical evaluation was to determine themechanical properties of one grade of free-machining steel in bar *orm in
several thermo/ mechanical conditions and to correlate the measured
*Numbers in brackets refer to references listed at the end of the report.
mechanical properties with its microstructure. The effect of subsequentthermal processing, e.g. brazing, on mechanical properties was alsoi nvesti gated.
MATERIAL
The material selected for this study was reportedly produced toAmerican Iron and Steel Institute ( A I S I )
grade 12L14. The nominal
specified composition for this grade is: carbon 0.15% max; manganese0.85-1.15%, sulfur 0 . 26%-0. 35% ;
phosphorus 0.04-0.09%; and lead 0.15-
0.35%. [3, 4] The as-received samples were in the form of eight foot(2.44 m) lengths of bar stock cut from longer lengths. The bar stock
samples were supplied in the following sizes and reported thermo/mechan-ical conditions: 3/4 inch (19 mm) diameter, cold finished hexagonal
bars; 3/4-inch (19mm) diameter, hot rolled round bars; 1-1/2 inch(38 mm) diameter, cold finished hexagonal bars; and 1-1/2 inch (38 mm)diameter, hot rolled round bars.
Flat rolled steel products are classified as either hot rolled orcold finished. [5] Hot rolled products are produced entirely at elevatedtemperatures with the final thickness or diameter of carbon steelsachieved at temperatures above the lower transformati on temperature.Cold rolled products are actually only cold finished because most of
the size reduction operations are carried out hot as for hot rolledproducts. Generally, cold finished products receive enough cold workingin the final rolling operations to improve the surface finish andaffect the mechanical properties of the final product.
In order to investigate the role of a subsequent thermal processingoperation, portions of one length of 1-1/2 inch (38 mm) cold finishedbar stock were subjected to the thermal cycle of a commercial brazingprocess. In this report, these samples will be referred to as being in
the cold finished/heat treated condition. Individual pieces of barstock (without the brazing alloy) were placed along side actual componentspassing through a continuous brazing furnace. [6]
The brazing furnace was a four zone furnace, 42 feet (13 m) long.The conveyor belt moved at a speed of six inches/minute (15 cm/minute).A slightly reducing atmosphere was maintained throughout the furnace,although only the second zone 4 feet (1.2 m) long and the third zone 2
feet (0.6 m) long were directly heated. The zones were not separatedso heating also occurred throughout zone 1. The second zone was controlled
at 2100 F (1149 C) and the combination of zone length, belt speed, andtemperature caused the metal parts to reach this temperature at the end
of zone 2 without a significant soaking period. The third zone was setat a lower temperature so that slow cooling occurred before entering
the unheated fourth zone where the parts cooled to about 150 F (66 C).
The entire cycle took approximately 1 hour 24 minutes to complete.
2
EXPERIMENTAL PROCEDURE
Tensile properties and standard Charpy V-notch impact propertieswere determined, hardness surveys performed, and microscopic observationsmade on each bar stock size in each thermo/mechanical condition.
Longitudinal specimens (specimen axis aligned parallel to bar axis)were prepared for the tensile tests and Charpy inpact tests.
Metal! ographi c Analysis and Hardness Survey
Representative photomi crographs were obtained from selected polishedand etched areas oriented parallel and perpendi cul ar to the bar axis
of each type of bar stock. The ferrite grain size was measured in
accordance with the circular intercept method from ASTM El 12-74, InterceptMethod.
Rockwell B hardness measurements were made on specimens adjacentto the metallographic specimens and correlated with the mi crostructureof each bar sample. Hardness measurements were obtained on transversesections, from surface-to-surface across the bar diameter.
Mechanical Property Testing
Longitudinal test specimens for both tensile tests and Charpy impact
tests were taken as closely as possible from the quarter diameter positionsin each type of bar stock. A schematic of the tests specimen orientation
and location followed in this study is shown in Figure 1. A broach wasused to create a uniform and reproducible V-notch in the Charpy specimens,and the notch was oriented (in the specimen) approximately facing thecenter of the bar. The tensile specimens, standard 0.250 inch (6.3 mm)in diameter with a 1-inch (25.4 mm) gage length, and standard 0.394inch (10 mm) Charpy V-notch specimens were tested, respectfully, in
accordance with ASTM A370-73, Mechanical Testing of Steel Products, andASTM E23-72, Notched Bar Impact Testing of Metallic Materials.
RESULTS AND DISCUSSION
Metallographic Analyses and Hardness Measurements
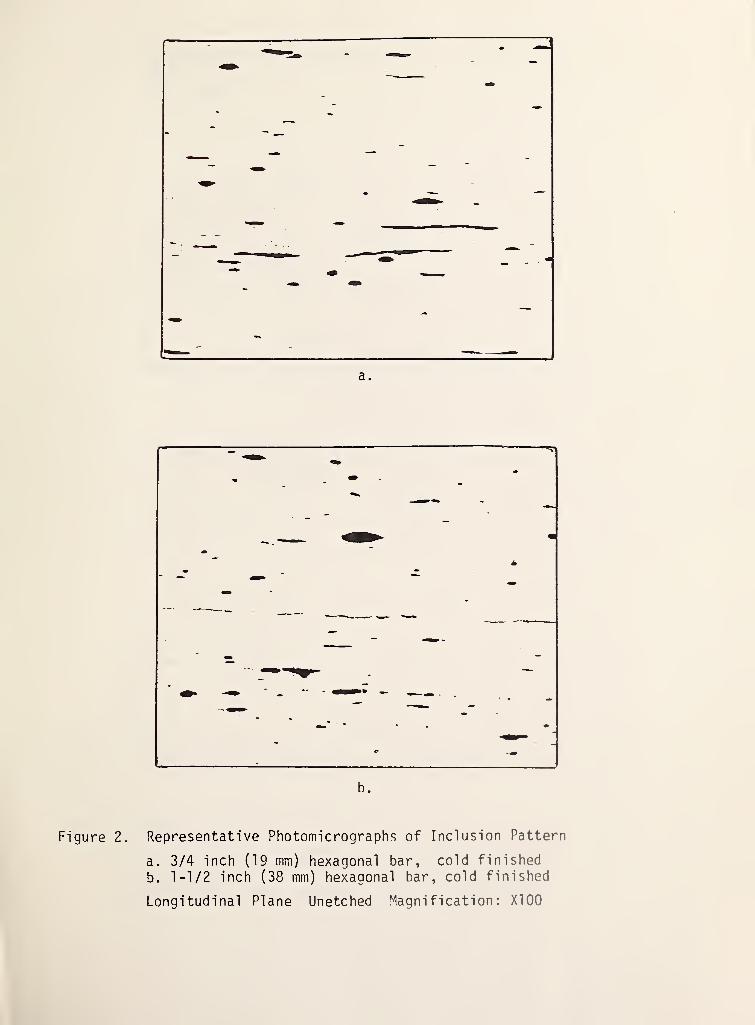
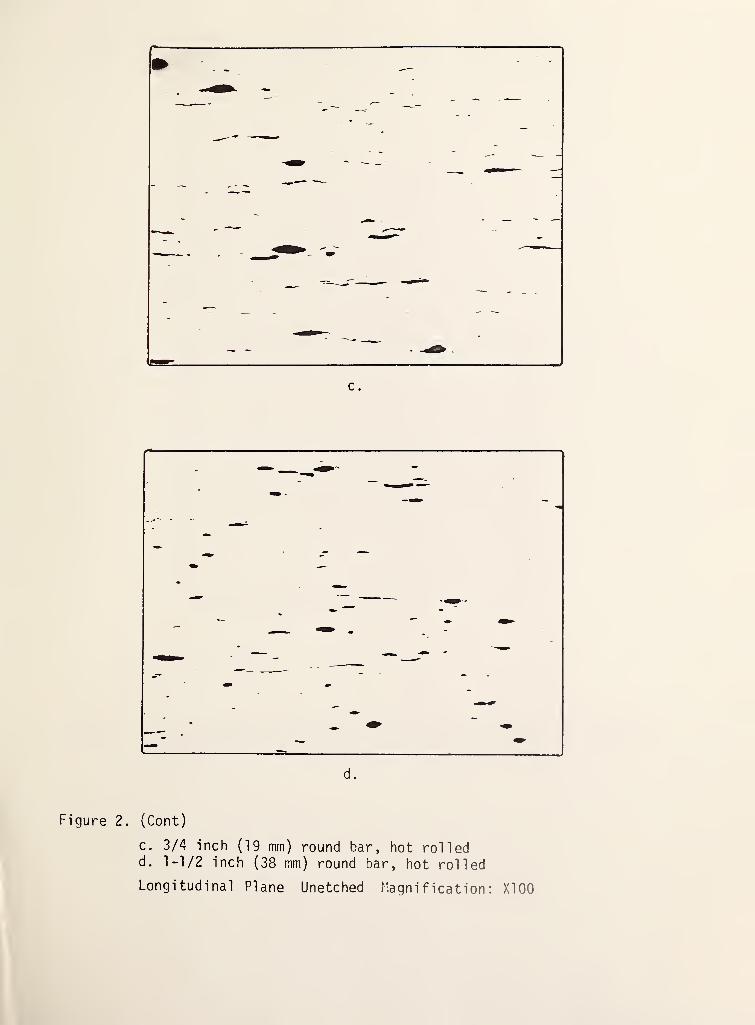
Representative photomi crographs taken at low magnification onlongitudinal and transverse planes of unetched samples of the as-receivedbars are shown in Figure 2. Numerous thick and thin inclusions, primari ly
manganese sulfide, can be seen, and this observation is consistent withthe higher permitted sulfur content for this steel. Tne fine leaddroplets are not observed at this magnification. This inclusion micro-
structure is contrasted with that found in a steel of similar manganesecontent (1.15%) but a much lower sulfur content (0.017%), Figure 3. In
the low sulfur steel, the manganese sulfide inclusion are all thin andthe inclusion volume fraction is lower than for the high sulfur steelused in this study.
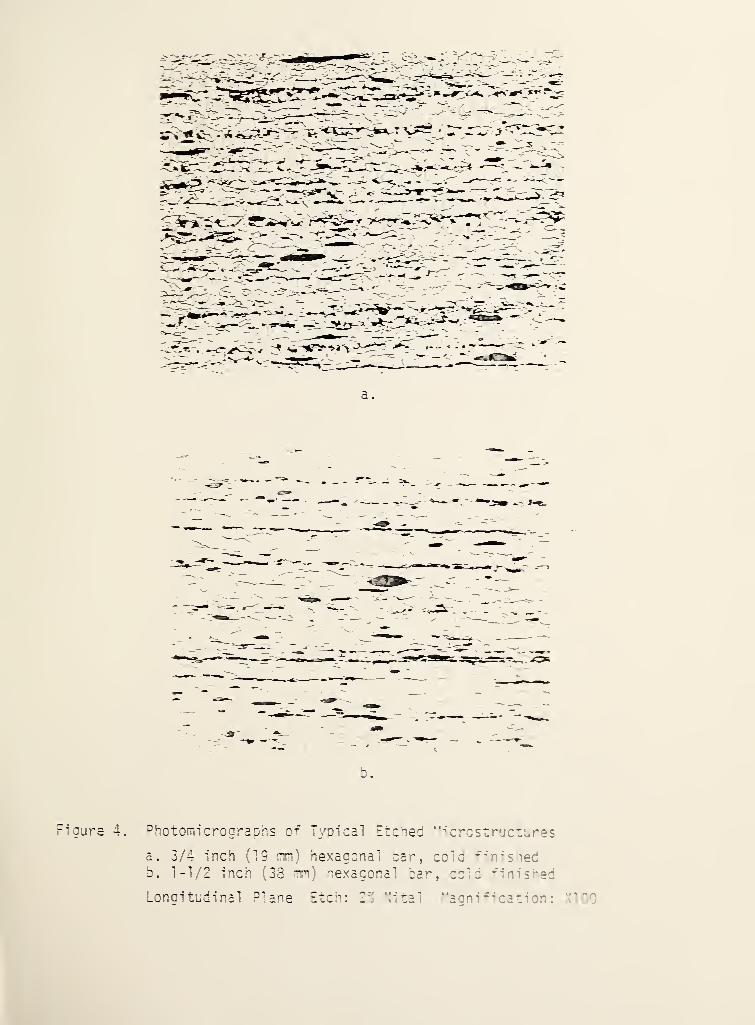
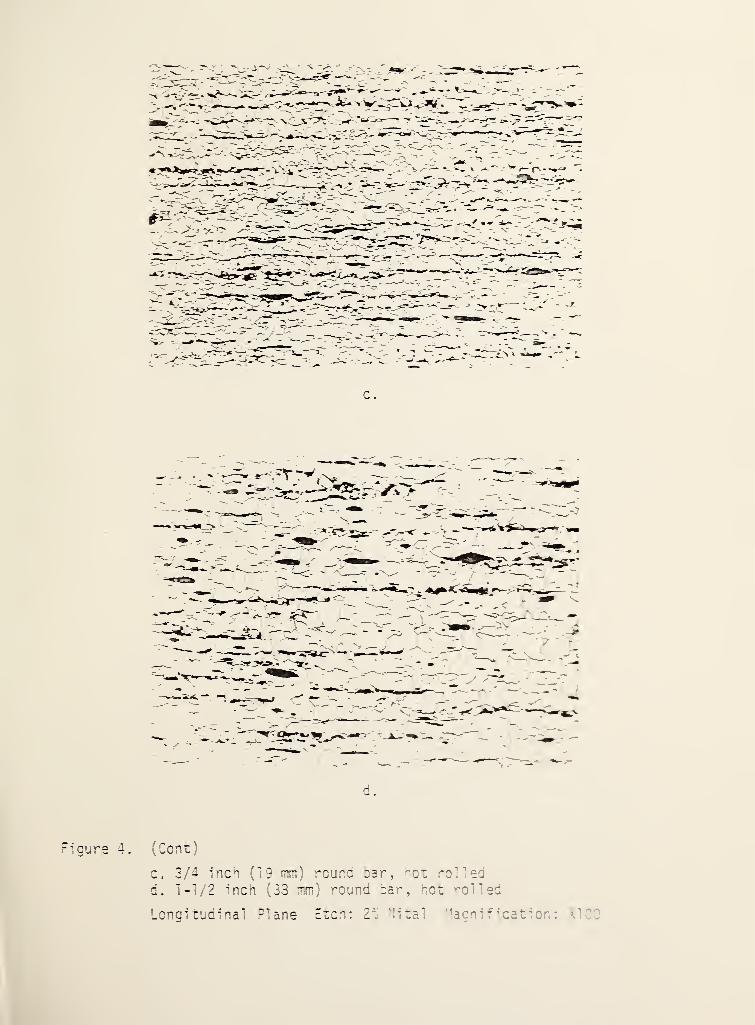
Representative microstructures of each as-received sample are shownin the etched condition in Figure 4. The mi crostructure of the sampleof the 1-1/2 inch (38 mm) bar in the cold finished/heat treated condition
is shown in Figure 5. The mi crostructures are typical of low-carbonsteels and consist primarily of proeutectoid ferrite with small amountsof pearl ite. The longitudinal photomicrographs of both the hot rolledand the cold finished bars show the ferrite grains to be equiaxed and
the pearl ite and inclusions aligned parallel to the bar axis. Thepearlite distribution anisotrophy (often called banding in plate
products) is a result of chemical segregation in the original ingotwhich has now been elongated parallel to the bar axis as a result of
the bar forming operations.
The measured ferrite grain sizes are reported in Table I. Ferritegrain sizes is strongly influenced by the prior austenite grain size, thecooling rate through the transformation temperature, and any subsequentthermo/mechanical processing after the initial austeni te-to-ferri te/pear-lite transformation. The absence of any evidence of elongated ferritegrains in either of the sizes of hexagonal bars suggests that the cold
worked bars were re-heated or stress relieved just before or after thefinal forming operation so that the ferrite grains recrystal 1 i zed.
Stress relieving of cold finished bars is often done to change the sizeand distribution of residual stresses.
The observations that both of the small diameter bars, 3/4 inch
(19 mm) hexagonal and round, had almost the same ferrite grain size,and both of the larger diameter bars 1-1/2 inch (38 mm) hexagonal and
round, had the identical but somewhat larger ferrite grain size, indicatedthat the hot finishing temperatures for both sizes of both hexagonal
and round bars were probably similar. The somewhat larger grain sizein the larger diameter bars probably resulted from a slower coolingrate through the transformation temperature due to their larger mass.The grain size for the cold finished/heat treated 1-1/2 inch (38 mm)
bar condition was the same as the other 1-1/2 inch (38 mm) bars suggestingthat the brazing cycle heat treatment did not cause any change in
mi crostructure.
The results of the hardness measurements are shown in Table II.The average Rockwell B hardness values for the cold finished bars was
twenty-two hardness points higher for each size than for the hot rolledbars HRB 86 vs. 64 for the smaller diameter bars, HRB 81-1/2 vs. 60 forthe larger diameter bars. The average hardness value for the 1-1/2
inch (38 mm) bar samples in the cold finished/heat treated condition,HRB 61-1/2, is similar to the values for the hot rolled bars, HRB 64and 60, and considerably lower than the values for the cold finishedbars, HRB 86 and 81-1/2. This indicates that the brazing cycle heat
treatment was similar in effect to a process anneal or stress reliefheat treatment.
The hardness profiles for the two sizes of cold finished bars arequite uniform except for the values measured nearest the bar surfaces
4
which are slightly higher, possibly due to a final cold forming operationthat work hardened the surface slightly. The hardness profiles for the
two sizes of hot rolled bars were also very uniform except for the
values nearest the bar surface in the smaller bar which are slightlylower. This may have resulted from some decarburi zati on of the surface.
Tensile Properties
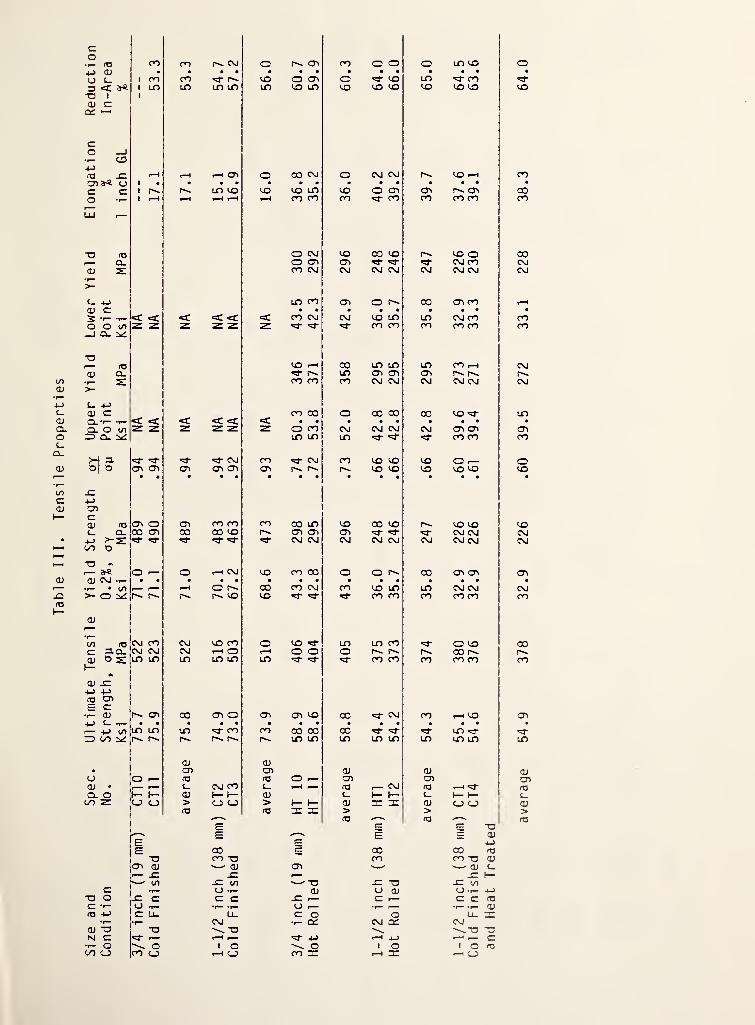
The measured tensile properties of each bar size and condition are
given in Table III. The average ultimate tensile strength and yieldstrength values for the 3/4 inch (19 mm) bars, in both the cold finished
and hot rolled conditions, were somewhat higher than for the 1-1/2 inch(38mm) bars finished to the same conditions. These differences, whichappear to be a function of bar diameter, are consistent with the grain
size measurements and the hardness profile measurements. The smallerdiameter bars, in each thermo/mechanical condition, had a finer ferritegrain size (resulting in higher yield strength) and higher averagehardness values (resulting in higher ultimate tensile strength) than
the larger diameter bars.
The average ultimate tensile strength and yield strength valuesfor the bars tested in the cold finished condition were substantiallyhigher than for the bars tested in the hot rolled condition. The
average ultimate-tensile strength values for the cold finished conditionand the hot rolled condition for the 3/4" inch (19 mm) bars were 75.8
Ksi (522 MPa) and 58.8 Ksi (405 MPa), respectively, while the average0.2% offset yield-strength values were 71.0 Ksi (489 MPa) and 43.0 Ksi
(296 MPa), respectively. For the 1-1/2 inch (38 mm) bars, the averageultimate tensile strength values in the cold finished condition and thehot rolled condition were 73.9 Ksi (510 MPa) and 54.3 Ksi (374 MPa),
respectively, while the average 0.2% offset yi el d-strength values were68.6 Ksi (473 MPa) and 35.8 Ksi (247 MPa), respecti vely . For samples
of the 1-1/2 inch (38 mm) bar in the cold finished/heat treated condition,the average ultimate tensile strength and 0.2% offset yield-strengthvalues of 54.9 Ksi (378 MPa) and 32.9 ksi (226 MPa), respecti vely , are
very close to the values (54.3 Ksi and 35.8 Ksi), for the 1-1/2 inch(38 mm) hot finished bar.
The ultimate-tensile-strength data can be compared with the hardnessmeasurements. Using a reported [7] empirical relationship betweenhardness and ultimate tensile strength, the measured average hardnessvalues of HRB 86 and HRB 81.3, respecti vely , for the 3/4 inch (19 mm)and the 1-1/2 inch (38 mm) cold finished bars correspond to ultimate-tensile strength values of 81 Ksi (558 MPa) and 75 Ksi (517 MPa),reespecti vely . The measured average ultimate-tensile-strength valuesof 75.8 Ksi (522 MPa) and 73.9 Ksi (510 MPa), respectively, are 6% and1-1/2% lower than the predicted values. The measured average hardnessvalue of HRB 64 for the 3/4 inch (19 mm) hot rolled bar corresponds toan ultimate-tensile-strength value of 56 Ksi (386 MPa). The measuredaverage ultimate-tensile-strength value of 58.8 Ksi (405 MPa) is 5%above the predicted value. The measured average hardness value of HRB
5
60 and HRB 61.5, respectively, for the 1-1/2 inch (38 mm) hot rolledbar and the 1-1/2 inch (38 mm) cold finished/heat treated bar fall
below the lowest value (HRB 64, 56 Ksi) reported for the empiricalhardness-tensile strength relationship and thus the equivalent ultimatetensile strength values would be below 56 Ksi. The measured ultimate-tensile-strength values of 54.3 Ksi (374 MPa) and 54.9 Ksi (378 MPa)
are consistent with the predicted values of less than 56 Ksi (386 MPa).
This generally good agreement between the empirically derived ultimate-tensile-strength values and the measured values (within + 6%) is as
good as can be expected for this type of correlation and confirms the
expected trends between hardness and ultimate tensile strength.
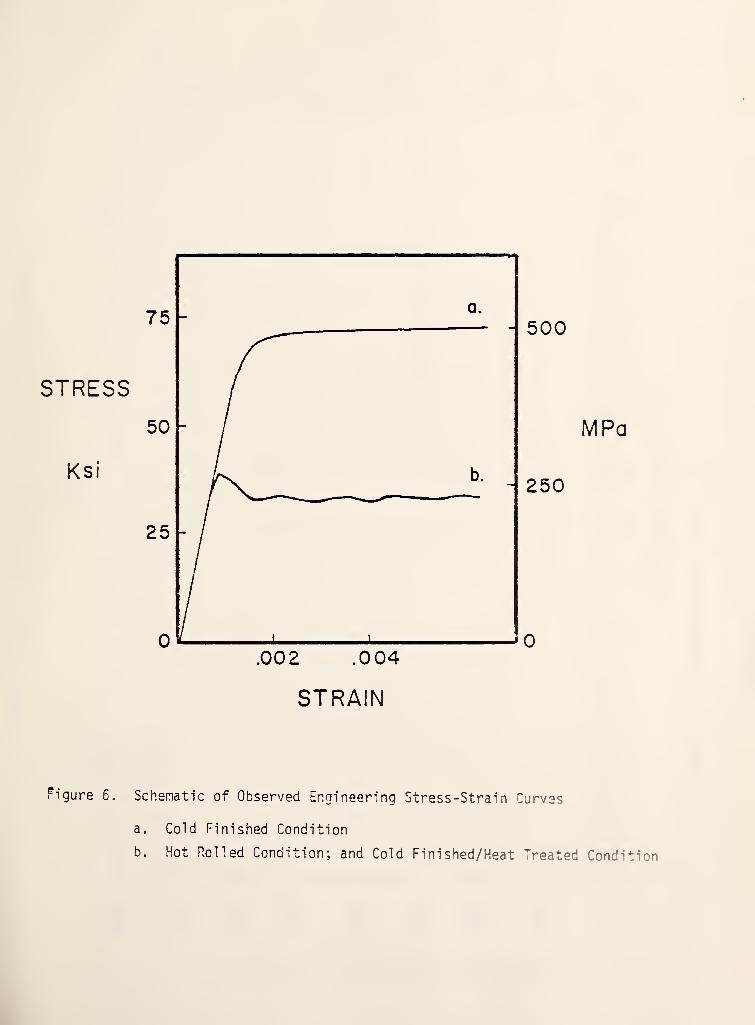
The yielding behavior can provide further evidence as to theeffect of cold work on mechanical properties. Sufficient cold work can
lead to the elimination of a sharp yield point, increases in ultimatetensile strength and yield strength, decreases in ductility, and increasesin the ducti le-to-brittle transition temperature as measured by Charpy
V-notch impact tests. Schematics of the typical stress-strai n curvesobserved are shown in Figure 6. None of the specimens taken from
either diameter of the cold finished bars exhibited a sharp yieldpoint. All of the specimens from both diameters of the hot rolled bar
exhibited sharp yield points with measurable upper and lower yieldpoint values. The specimens from the cold finished/heat treated
bar also exhibited upper and lower yield points.
The absence of sharp yield points in the cold finished specimensindicates that the cold work introduced by the final cold formingoperation was sufficient to eliminate the yield point observed in thehot rolled condition and to increase substantially the yield strength.The re-appearance of a sharp yield point in the cold finished barsubjected to the brazing thermal treatment indicates that the thermaltreatment was sufficient to remove the effects of cold work.
Calculated values of the yield strength/tensile strength ratio, ay/aufor the cold finished bars (0.94 and 0.93) illustrate the strong influenceof the cold finishing process on increasing the yield strength when
compared to the ratio for the hot rolled bars (0.73 and 0.66). Thehigh (yield/tensile) ratio for the cold finished bars demonstrates the
low capacity for work hardening in this condition. The bars in the hotrolled condition, however, can be work hardened considerably more. The
average yield/tensile ratio (0.60) for the cold finished/heat treatedsamples is very close to the hot rolled values and indicates a completerecovery from the strengthening due to the cold finishing operations.
The average tensile ductility values as measured by percent elongationand percent reduction-in area for the 3/4 inch (19 mm) bars, in both thecold finished and the hot rolled conditions, were generally lower thanfor the 1-1/2 inch (38 mm) bars in the same conditions. These tensileductility results (compared to the data for the larger diameter bars)are in agreement with the somewhat higher strength, higher hardness, and
finer grain size reported for the smaller diameter bars.
6
The average tensile ductility values for both bar sizes in the coldfinished condition were substantially lower than for both sizes in the
hot rolled condition, e.g. percent elongation values for the cold
finished samples were less than one-half that for the hot rolled samples.The average percent elongation and percent reducti on-i n-area values for
the cold finished/heat treated samples of the 1-1/2 inch (38 mm) bar(38.3% and 64%, respectively) were very close to the values for the hot
rolled bar (39.7% and 65%, respecti vely ) . This further confirms the
recovery from the effects of cold finishing.
Impact Properties
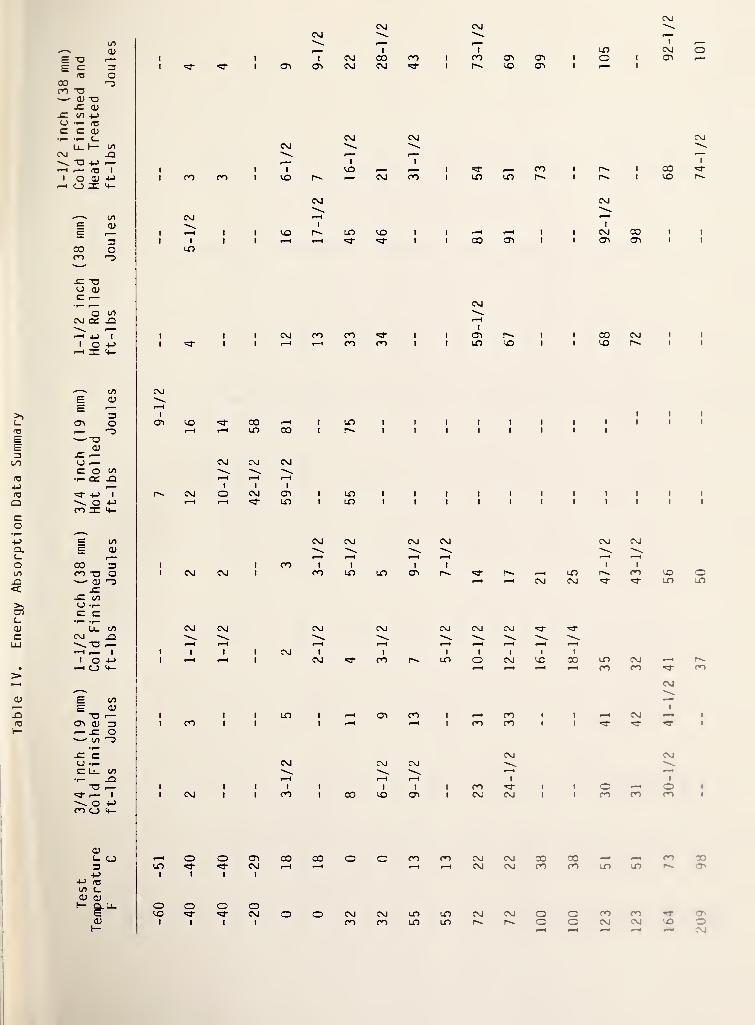
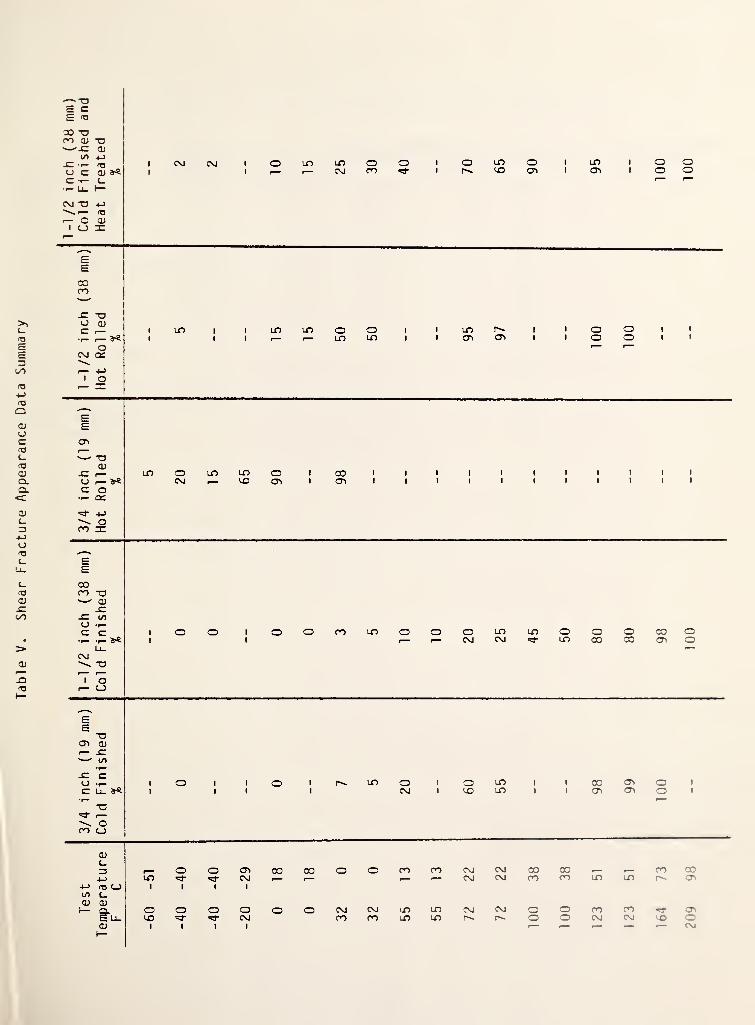
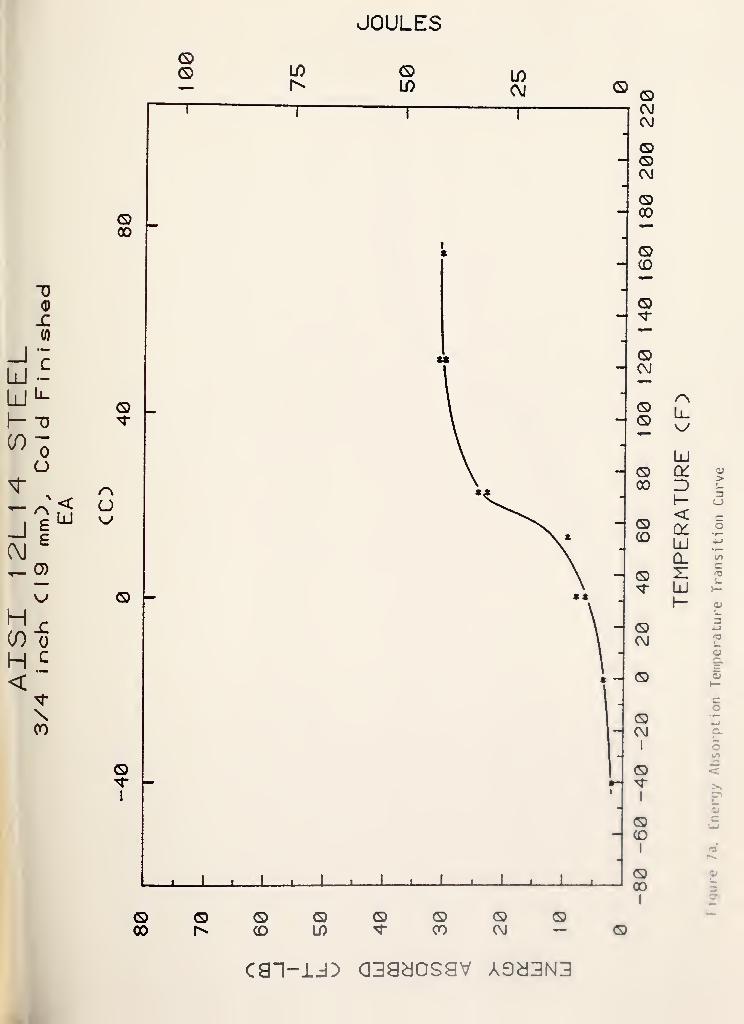
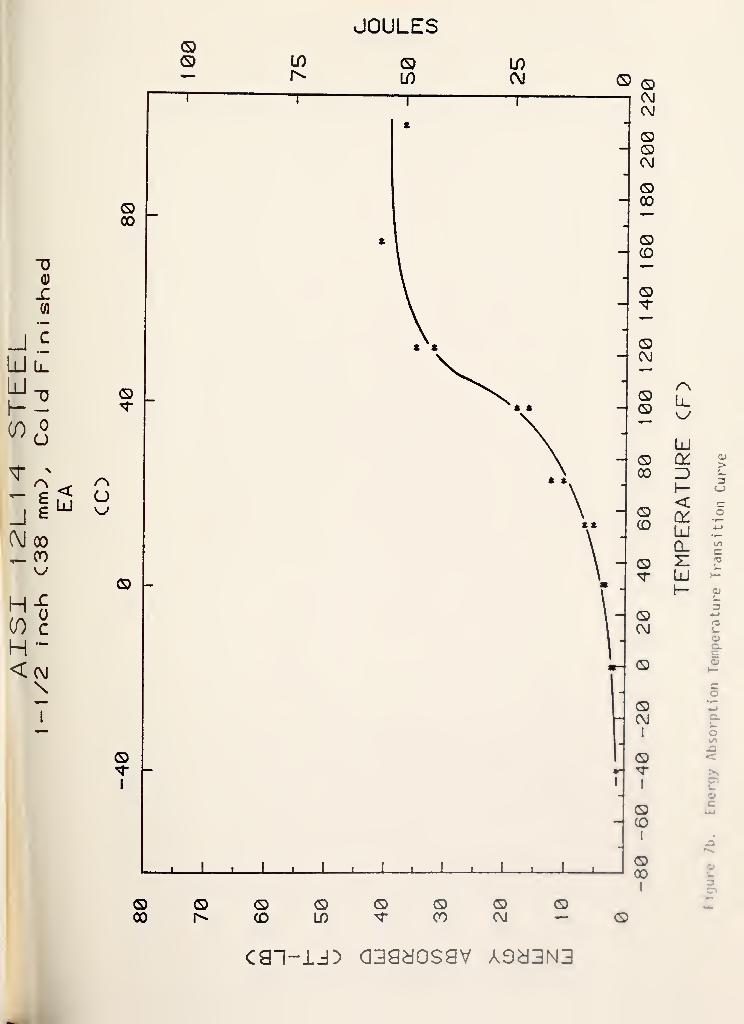
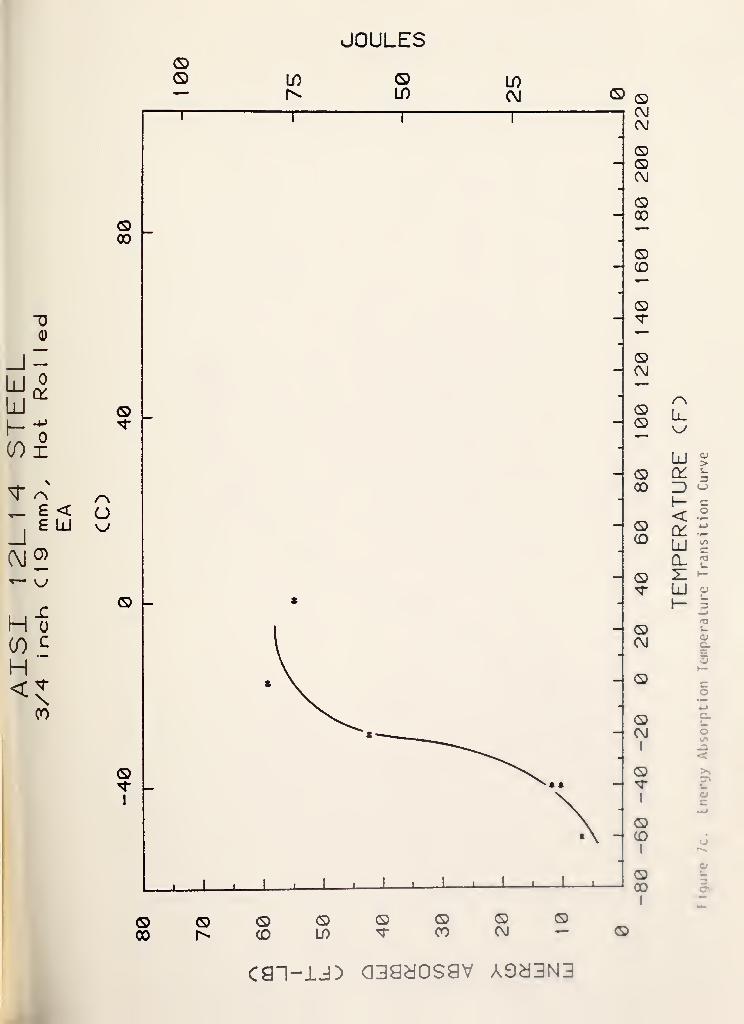
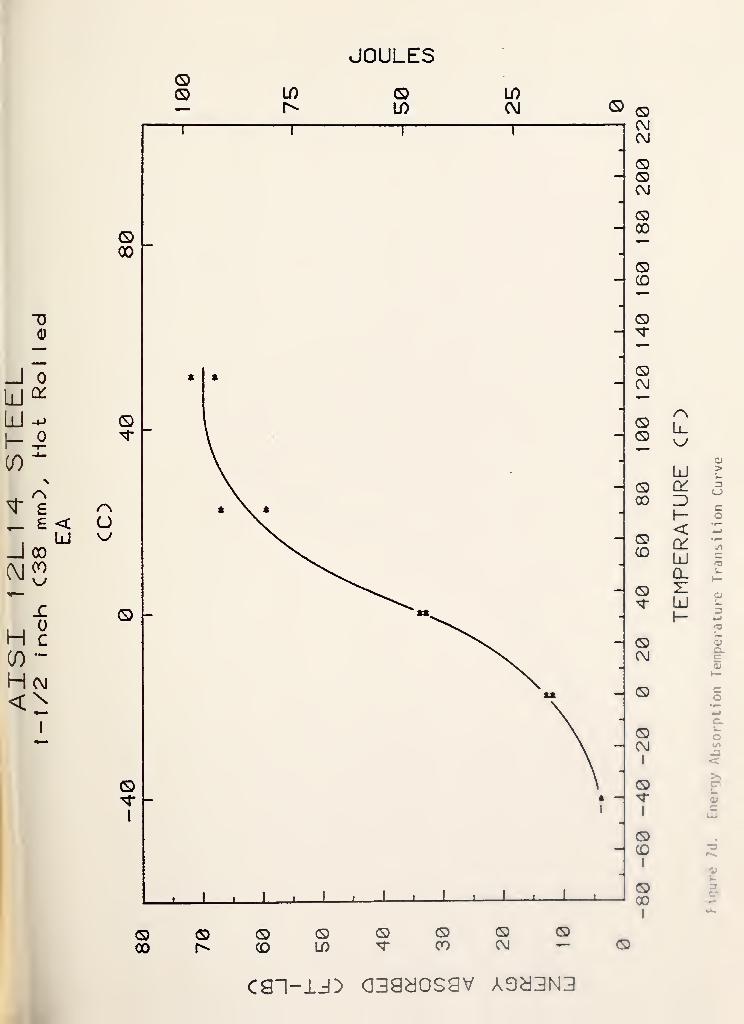
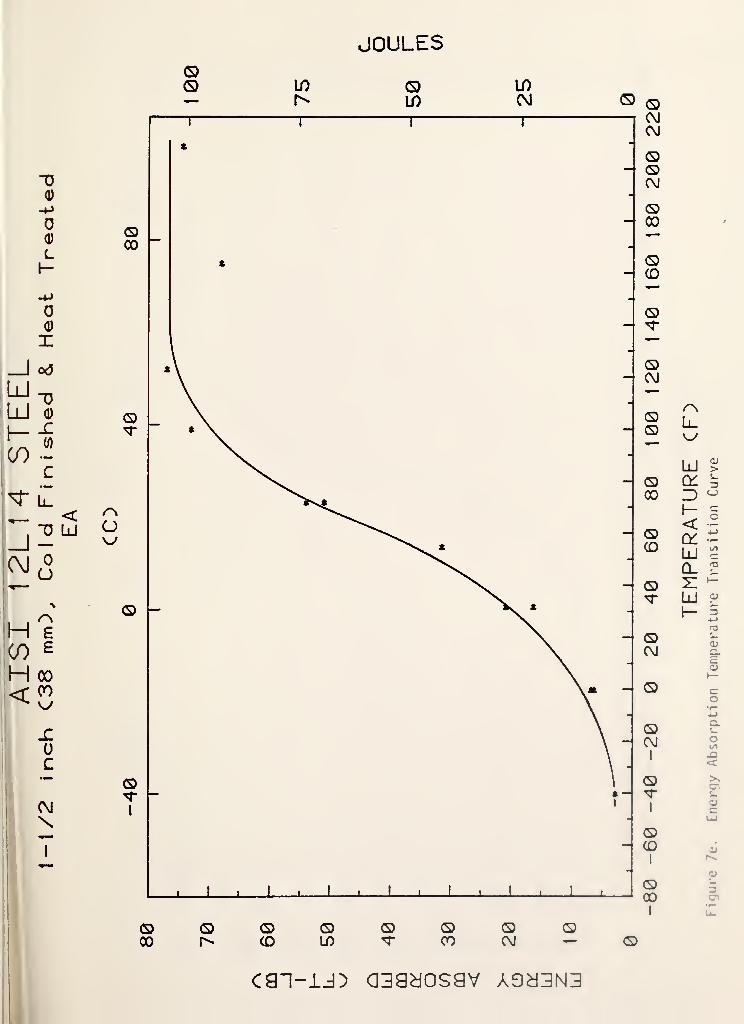
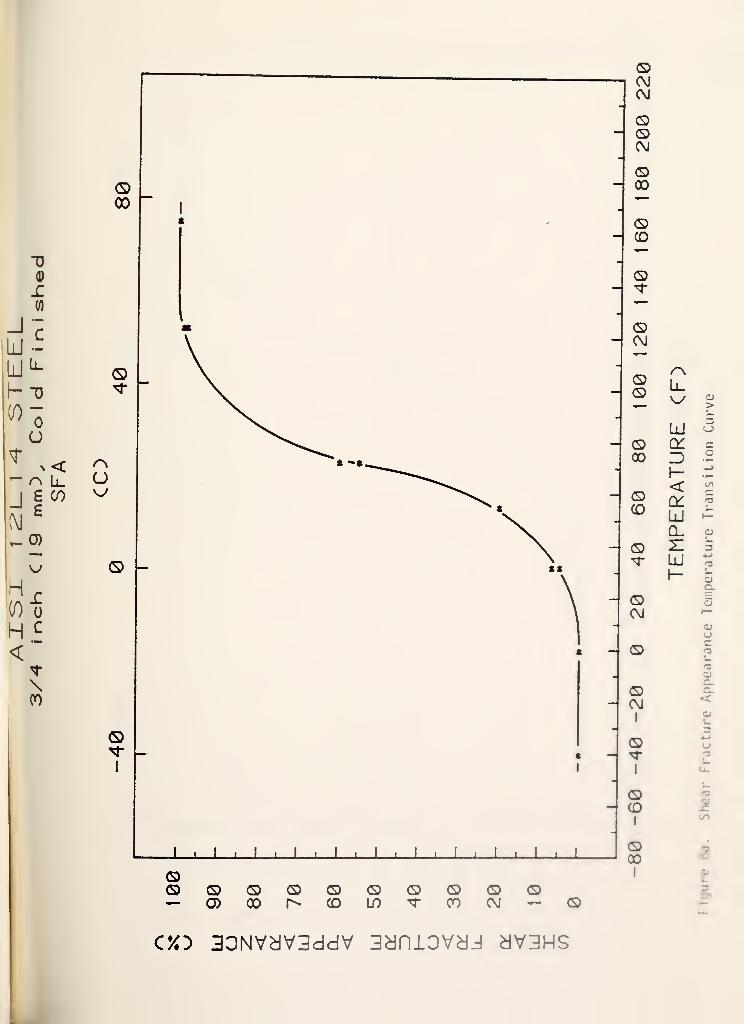
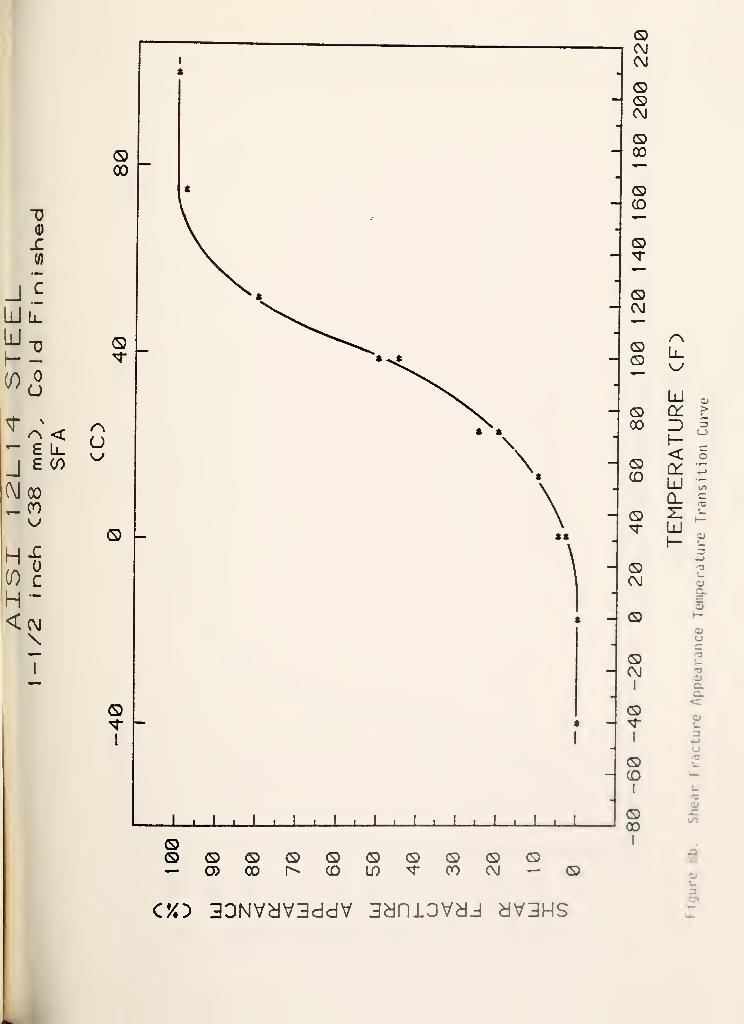
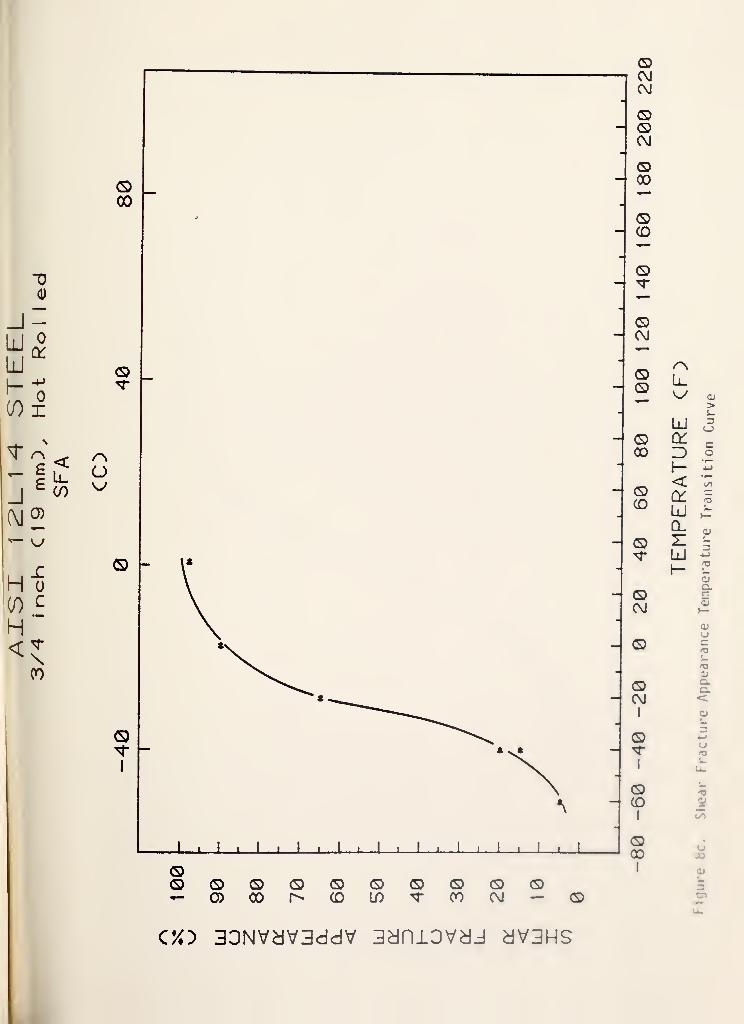
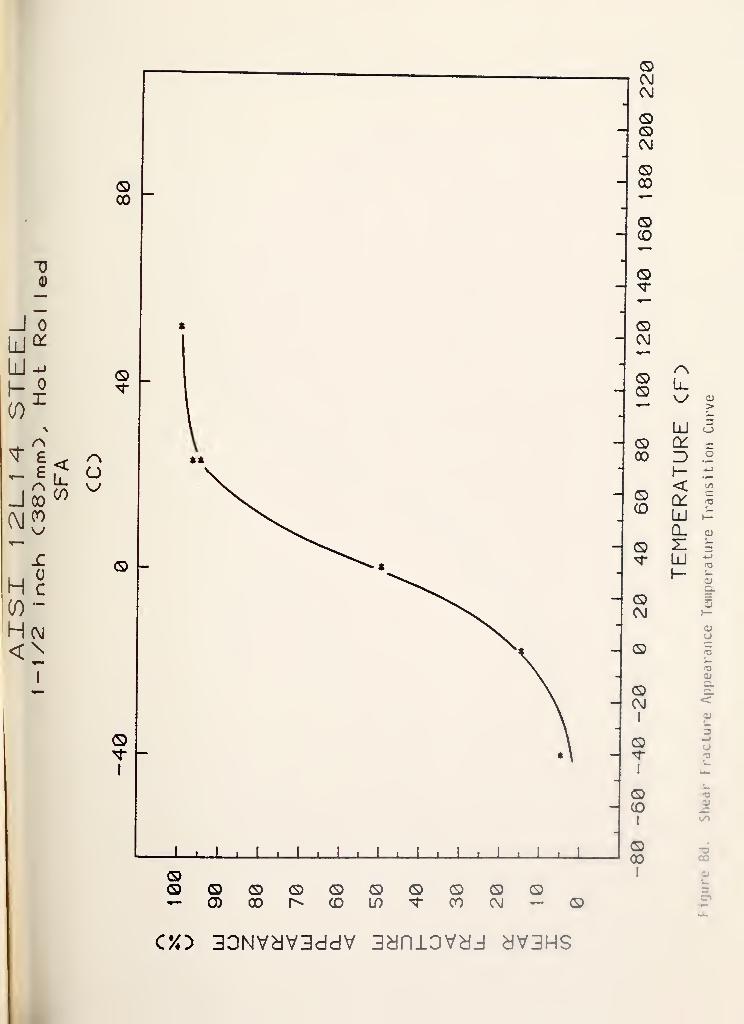
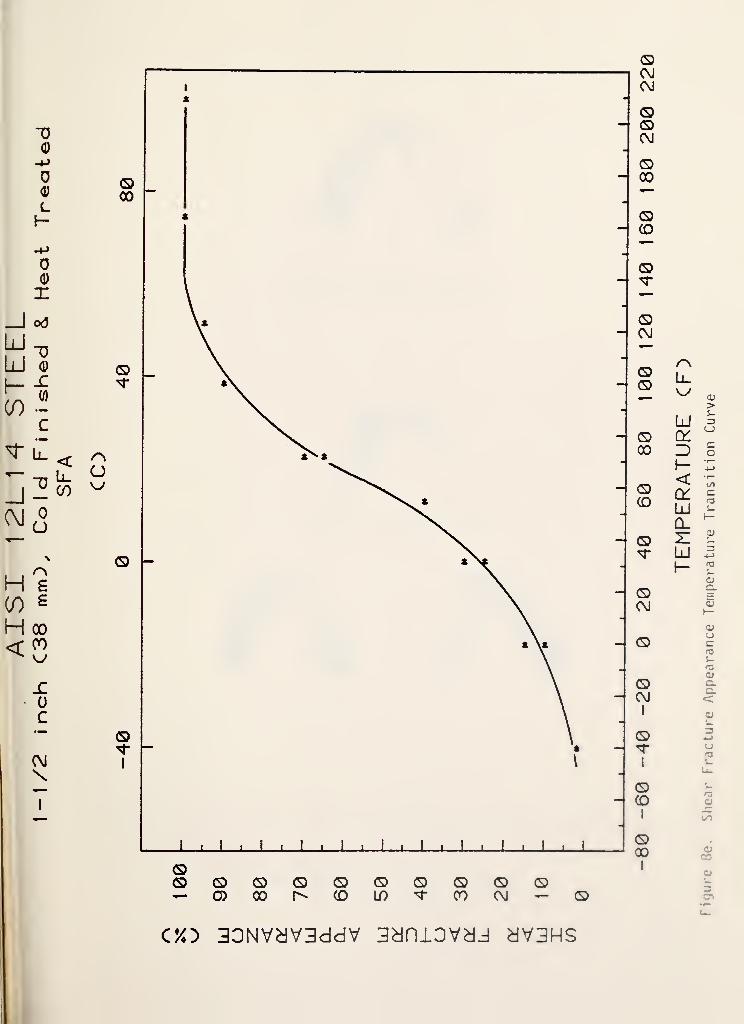
The notched impact toughness properties as measured by the CharpyV-notch (CVN) impact test for each bar size and thermo/mechanical conditionare given in Tables IV, V, and VI and Figures 7 and 8 for two widely usedfracture criteria: energy absorption and shear fracture appearance (SFA).
Carbon steels generally exhibit a well-defined ducti 1 e-to-bri ttl
e
temperature transition as measured by the temperature dependence of the
fracture criteria. Brittle or cleavage fracture is observed at tempera-tures below the lower knee of the curves (Figures 7 and 8); ductile or
shear fracture is observed at temperatures above the upper knee of thecurves; and a mixture of ductile and brittle fracture modes are found
in the temperature region between the two knees. The temperaturetransition regions for the cold finished bars and hot rolled bars are
different regardless of bar diameter; further, for each thermo/mechanicalcondition, the temperature transition regions for the 3/4 inch (19 mm)bars are different than those of the 1-1/2 inch (38 mm) bars. Theseconclusions are illustrated in the SFA plot. The CVN transition regionfor the 3/4 inch (19 mm) and 1-1/2 inch (38 mm) cold finished bars
extends from 0 F (-18 C) to +120 F (+49 C) and from OF (-18 C) to +180F (+82 C), respecti vely . The CVN transition region for the hot rolledbars extends from <-60 F (<-51 C) to +40 F (+4 C) and from <-60 F (<-51
C) to +100 F (+38 C), respecti vely . The CVN transition range for the
cold finished/heat treated bar extends from -40 F (-40 C) to +120 F
(+49 C). The Charpy V-notch ducti 1 e-to-bri ttl e transition temperatureof carbon steels, often characteri zed by the 15 ft-lb (20 joules)transition temperature or the 50 percent SFA transition temperature, is
primarily controlled by the steel chemistry, (decreasing transitiontemperature with increasing manganese/carbon ratio), ferrite grain size(decreasing transition temperature with decreasing grain size), and thethermo/mechanical condition (increasing transition temperature with in-
creasing cold work). In the present study, the steel chemistry is assumedto be similar for all samples. As shown in Figures 7 and 8, the thermo/mechanical condition has the major influence on the transition temperature.Both sizes of cold finished bars exhibit higher transition temperatures(lower toughness) than the hot rolled bars as a result of the effect ofthe cold work. The transition temperatures of the bars in the coldfinished/heat treated condition falls in between the cold finished andhot rolled values. Further, for both toughness criteria, the smallerdiameter bars in either the cold finished or the hot rolled condition
7
exhibit lower transition temperatures (higher toughness) than thelarger diameter bars. This observation is consistent with the effectof increasing toughness with decreasing ferrite grain size.
The upper shelf energy absorption values for the 1-1/2 inch (38 mm)bars in both the cold finished and the hot rolled conditions (38 ft -lbs,
52 joules and 70 ft-lbs, 95 joules) are higher than the values measuredfor the 3/4 inch (19 mm) bars in the same conditions. Further, theupper shelf energy absorption values for the hot rolled bars (58 ft-lbs,
79 joules and 70 ft-lbs, 95 joules) are substantially higher than for
the cold finished bars (31 ft-lbs, 42 joules and 38 ft-lbs, 52 joules).These observations are in agreement with the hardness data discussedearlier in this report where it was found that the hardness of the coldfinished bars was substantially higher than for the hot rolled bars,
and, for each thermo/mechani cal condition, the smaller diameter barsexhibited higher hardness than the larger diameter bars. In addition,there is a direct relationship between the upper shelf energy absorptionvalues and the measured yield strength; as the yield strength valuesincrease, the energy absorption values decrease. This observation is
in good agreement with studies reported for a wide variety of steels invarious heat treated conditions, including carbon/ manganese steels. [8]
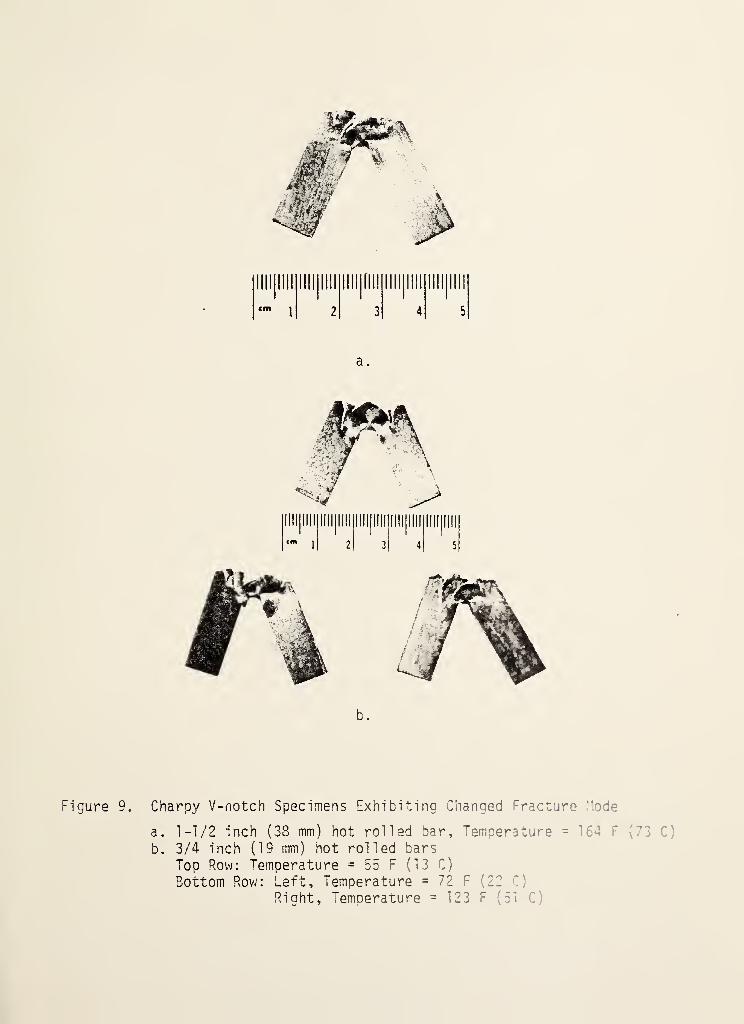
Visual inspection of the tested Charpy specimens revealed a changein fracture behavior in some hot rolled bar specimens tested at tempera-
tures on the upper shelf plateau. As shown in Table IV, the upper shelfenergy absorption plateau (67 to 72 ft-lbs, 91 to 98 joules) was reached
in the temperature range of 72 F (22 C) to 123 F (31 C) for the 1-1/2inch (38 mm) hot rolled bar. Similarly, 100 per cent SFA was attainedover this same temperature range. A specimen tested at 164 F (73 C),
however, did not fracture and exhibited an abnormally high energyabsorption compared to the upper shelf plateau. Examination of thespecimen (Figure 9a) revealed that a tensile stress overload bent thespecimen with little or no evidence of crack propagation from the
bottom of the V-notch. Further, the specimen exhibited splittingperpendi cul ar to the V-notch and parallel to the long axis, in theprincipal bar deformation direction. This behavior indicated that a
change in fracture mode occurred over the temperature range between 123
F (51 C) and 164 F (73 C).
The identical behavior was observed in specimens from the 3/4 inch
(19 mm) hot rolled bar. The upper shelf energy absorption plateau (55
to 60 ft-lbs, 75 to 82 joules) and the 100 percent SFA were reached in
the temperature range of OF (18 C) to 32 F (0 C). Specimens testedabove 55 F (13 C) did not fracture and exhibited abnormally large
energy absorption values. Examination of these specimens (Figure 9b)revealed the same features as observed in the 1-1/2 inch (38 mm) specimen.
One specimen from the 1-1/2 inch (38 mm) cold finished/heat treated baralso behaved in a similar manner. In this thermo/mechanical condition,
however, greater variability in fracture behavior was found. Althoughtwo specimens were tested at 123 F (51 C), one specimen at 163 F (73C), and one specimen at 209 F (98 C), only one of the specimens testedat 123 F (51 C) exhibited bending failure and splitting.
8

The energy absorption data from specimens exhibiting bending failurehave no significance because the high energy absorption results from thebending of the test specimen, its ejection from the holding fixture, and
the friction forces overcome as the specimen was pushed out of the Charpytest machine. These data are not shown in Figures 7 and 8. None of thespecimens from the cold finished bars exhibited this behavior over therange of test temperatures
.
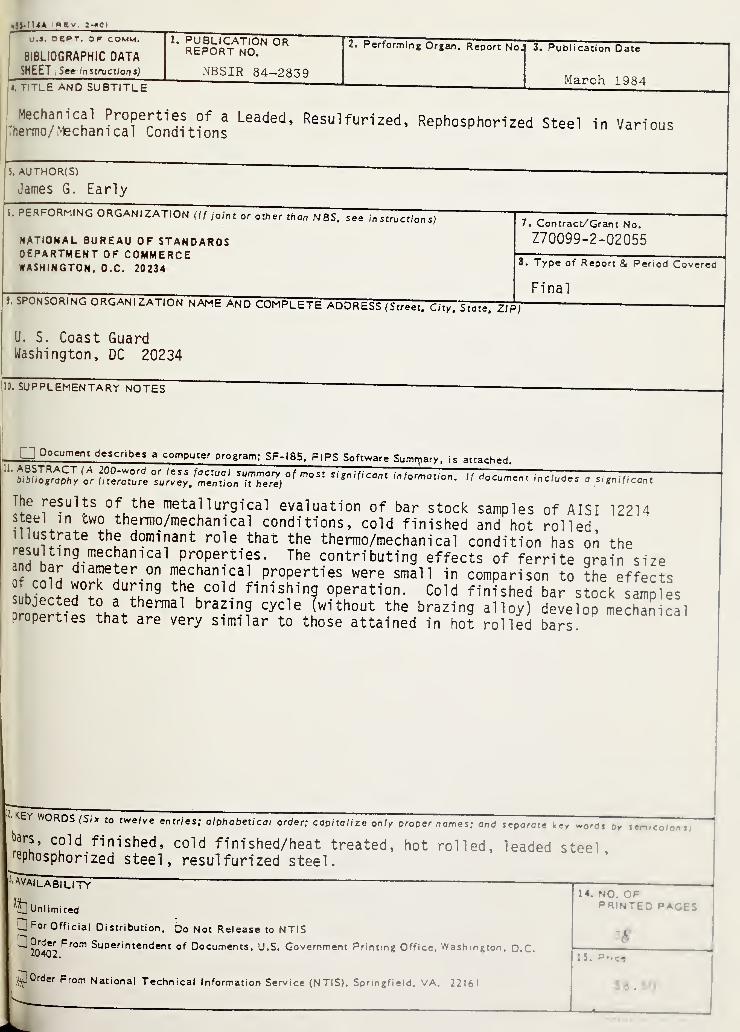
SUMMARY
The results of the metallurgical evaluation of bar stock samplesof AISI 12214 steel in two thermo/mechanical conditions, cold finishedand hot rolled, illustrate the dominant role that the thermo/mechanicalcondition has on the resulting mechanical properties. The contributingeffects of ferrite grain size and bar diameter on mechanical properties
were small in comparison to the effects of cold work during the coldfinishing operation. Cold finished bar stock samples subjected to a
thermal brazing cycle (without the brazing alloy) develop mechanicalproperties that are very similar to those attained in hot rolled bars.
ACKNOWLDGEMENT
The author wishes to thank Mr. C. H. Brady for his contributions tothe metal 1 ographi c and grain size determination portions of this report.Special thanks to Mrs. Mary Wykes for her assistance in preparing thefinal version of this report.
9
REFERENCES
1. Metals Handbook, Vol. 1, Properties and Selection of Metals, 8th Edition,American Society for Metals, 1961, pp. 304-309.
2. Metals Handbook, Vol. 1, Properties and Selection: Irons and Steels,9th Edition, American Society for Metals, 1978, pp. 572-578.
3. American Society for Testing and Materials Specification A1 08-81
,
"Standard Specification for Steel Bars, Carbon, Cold-Finished, Special
Quality."
4. American Society for Testing and Materials Specification A576-81 ,
"Standard Specification for Steel Bars, Carbon, Hot -Wrought, SpecialQuality."
5. The Making, Shaping and Treating of Steel, U.S. Steel Corporation,
1971, pp. 932-93.
6. Private Communication, W. Currie, Parker-Hanni f i n Corp., January 4, 1984.
7. Army-Navy Approximate Hardness Tensile Strength Relationship ofCarbon and Low Alloy Steels, AN-QQ-H - 201 , 1943.
.8. Gross, J. H., "The Effective Utilization of Yield Strength," J. Engr.Industry, ASME Paper No. 71-PVP-ll, 1971.
10

Table I. Ferrite Grain Size Measurements
Ferrite Grain
Condition Diameter Size( a)
Cold Finished 3/4 inch (19 mm) 8
Cold Finished 1-1/2 inch (38 mm) 7
Hot Rolled 3/4 inch (19 mm) 8-1/2
HoT Rolled 1-1/2 inch (38 mm) 7
Cold Finished 1-1/2 inch (38 mm) 7and Heat Treated
(^Measured according to ASTM El 12—74, Intercept Method

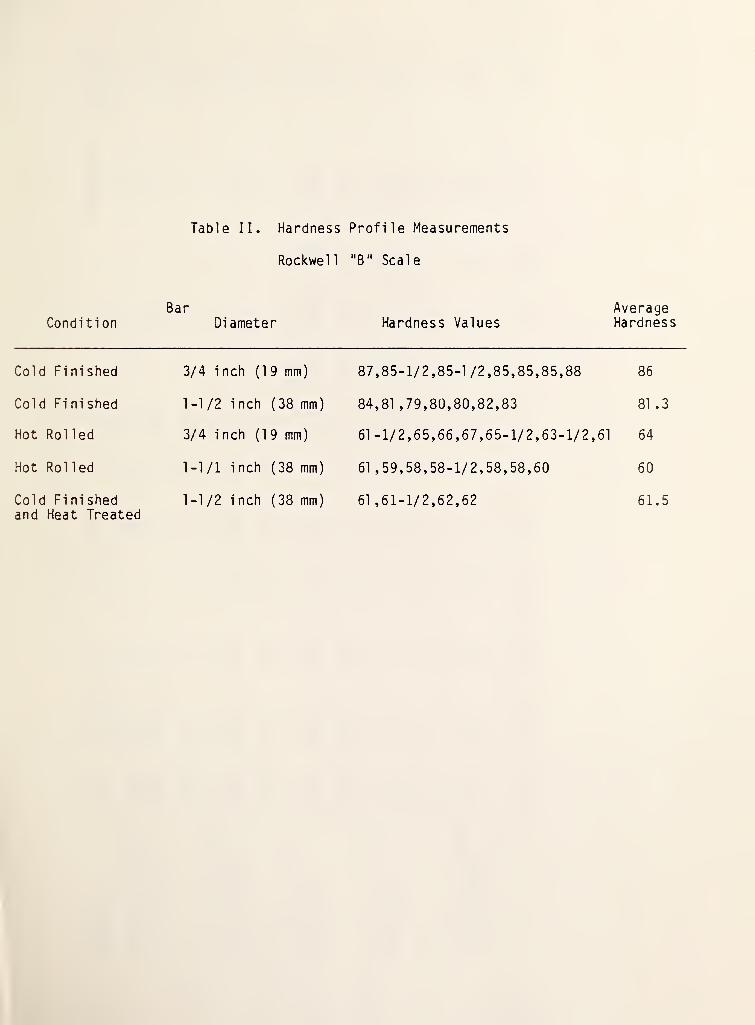
Table II. Hardness Profile Measurements
Condition
Cold Fi ni shed
Cold Finished
Hot Rolled
Hot Rolled
Rockwell "B" Scale
Bar AverageDiameter Hardness Values Hardness
3/4 inch (19 mm) 87,85-1/2,85-1 /2,85,85,85,88 86
1-1/2 inch (38 mm) 84,81 ,79,80,80,82,83 81 .3
3/4 inch (19 mm) 61 -1/2,65,66,67,65-1/2,63-1/2,61 64
1-1/1 inch (38 mm) 61,59,58,58-1/2,58,58,60 60
1-1/2 i nch (38 mm)Cold Fi ni shedand Heat Treated
61 ,61-1/2,62,62 61.5

Table
III.
Tensile
Properties
coI- <TJ CO co i". cm O 03 CO 0 0 0 LO LO4J 3 • • • • • • • • • • • • •
U l— 1 CO CO CO 0 03 0 CO LO O' CO
a i
3 coc *—
1
1
LO LO LO LO LO CO LO CO LO LO LO CO LO
cO _l-r- CO+->
T> JO r-H r-H t-h <ys 0 co CM 0 CM CM LO i-H
03 »« <_> 1 • • • • • • • • • • • • «
c c 1 LO C£> CO CO LO CO O 03 03 03o 1 r-H r-H r-H r-H CO CO <0 CO CO CO COr—LlJ ,
—
TO <T3 0 CM CO co LO LO Oi— Q. 0 03 03 ^P ^P CM CO3 2: CO CM CM CM CM CM CM CM
•r—>-
C_ +J LO CO 03 O co 03 CO3 c • • • • • • • •
3 -r- •!— c c <c c CO CM CM LO LO LO CM COO O LOJH^ z Z z z z z CO CO CO CO CO
T3»— 03 CO r—H co LO LO LO CO r-H
3 Cl. *3” LO 03 03 03 p^t- 21>-
CO CO CO CM CM CM CM CM
t- -i->
3 c CO co 0 co CO co LOO.M- -r- <c *=c c < <=c c • • • • • • • •
Q. O LO z Z z z z z 0 CO CM CM CM CM 03 033 O. V LO LO LO ^P ^P CO CO
H =5- *3“ O' CM co CM CO LO LO LO O r—o| 0 03 03 03 03 03 03 1
—
LO LO LO LO CO
z-MCDCaj 03 O 03 CO CO CO co LO LO 00 LO LO LOc_ a. co 03 00 CO CO p^ 03 03 03 ^P ^P CM CMm00 0
«^P «^p *53- CM CM CM CM CM CM CM CM
0 *>
r— 0 0 r-l CM co CO CO O O CO 03 03<D C\J •*—
•r- • (/) ) r-H O co CO CM CO CO LO LO CM CM> 0 V r- r>. co co ^p ^p CO CO co CO CO
3r—•1—co 03 CM CO CM CO CO 0 CO LO LO CO *=P O LOC 3.0- CM CM CM r-H O r—H 0 0 0 00aj 5 2
1— cn LO LO LO LO LO ^p CO CO CO CO CO
CD Z4-> +J03 03E c•r- a> 03 co 03 O 03 03 CO CO CM CO r-H LO4-> <- •-1— -P cn LO LO LO O' CO CO CO CO CO ^p ^P *^p LO rj"D IP y p^ p^ LO LO LO LO LO LO LO LO
<D 0)• 03 03 <3 3a 0 r— >T3 03 O r— 03 03CL) • r—
.
r— CM CO t_ r-H r— <0 r— CM rO r-H ^PCL O 1
—
i— ai 1— 1— O) £_ 1— )— C_ t— l—
00 2: 0 0 > O CJ > 1— i— 3 z Z 3 0 CJ
fO CO z z > ><T3 03
E E E TO** E r*
—
E cz 3E F 4-J
E co c= co 00 T30 CO -0 CO CO TD 303 aj cu 03 >— aj L_|— z J
3
r— r~ h-cn Z CO >—" 0 _£Z a SZ LO
c •r— U aj u 3 u 4->
T3 O JC c c c Z r— c ( c c fT3
C -t- CJ •r— •f— »r— <j r— •r- r— •r— *r— 3n3 4-> <z u_ Ll_ c 0 0 U- ~r~
•r— •1— CM •r— cc CM QC CXJ
3 "O TO "O TOM C r— r-H r— ^P *-> r—H 4-> r-H c:•I— O \ 0 1 0 0 I 0 t 0 ^3CO cj PO 0 t—
1
C_3 CO z r-H z •-H CJ
o*=s-
LO
co•
coon
coC\J
CM
COco
C\J
r»C\J
LO•
03PO
oCO
COCMCM
03•
C\Jco
00
CO
<T>
LO
O)C7)
<T3
t-
>

Table
IV.
Energy
Absorption
Data
Summary
3o-O
</)
<U
E T3 r—e =
reooco ~o—' QJ "O
-c ajJX l/l .(_>
U -r- (T3
C C a)i- c_
U_ I— 00JOa +j r—
>— re i
o aj -•->UX H-
</)
ai
CVJ
COCO
3o"O
JO -oOJ 0)tx I
—
o VICVJ QC .Q
o -*->
•—' l/l
E CL)
E <—3
ai or— re
' "Oaj
jx
—
OJ r—C O V)V- OC JO
re- +j i
O +jco zn 4-
E vi
E aj
CO 3co -a o—- <u
JO-3 00a •<-
c c•r— *i—
U_ 1/1
CVJ X)^-"O 1
—r-i
i I
i O -t->
1—10 4—
E VI
E U-O I—
Cl HI 3i— X O
OO '“0
OJ -r-
C Ll_ CO•i- JO
-O r—re- 1— i\ o +jCO C_5 4-
ajC- O3+J
4-> reOO t_
a; ajI— Q.Ll_
EOJ
CO
I
on
CO
Ol OO
CVJ
CVJ
CVJ
CVI
rHi
CO
CVJ
CVJ
LOI
oOO
I
CVJ
ore
i
ore
i
ore
i
coon
CVJ
i
CVJ
re-
01CVJ
oCVJ
I
ai
CVJ
i
OO
OO
CVI
CO
CVI
I
CTv
on
CVJ
on
cvj
i
CO
co
CVJ
I
Ol
I-'.
CVJ
CO
CVI
CO
CVJ
I
CVI
co
CVJ
CVI
CVJ
I
COCVJ
CVJ
OO r—1— CVJ
onre
COre
coCO
reCO
onr--
onm
cvj
i
on
cvj
i
CO
Ol
COI
OO
CVI
coCVJ
CO
COre
CVJ
CO
CVJ
I
Ol
CO
I
Ol
onon
CVI
CVJ
I
on
onon
CVI
i
COI
—
re-on
CO
CVJ
I
Olon
CVJ
Io
COCVJ
CVJ
CVJ
cvj
r--
oioo
OlOl
ono
CVJ
CVJ
Ol
on
Ol
cor-.
I
CVI
OlCOOl
00OO
CVJ
I
rer*.
r-^
oocooo
CVJ
CVI
onCVI
I
COre-
00on
oon
CVJ
coco
cvj
i
recvj
CVJ
CVJ
CVJ
r*.
i
oo CO onco
CVJ
co
cvj
re
r^.
co
CVI
COCO
oo
coco
oo
oCO
COcvj
COCVI
re reOO O— CVJ

Table
V.
Shear
Fracture
Appearance
Data
Summary

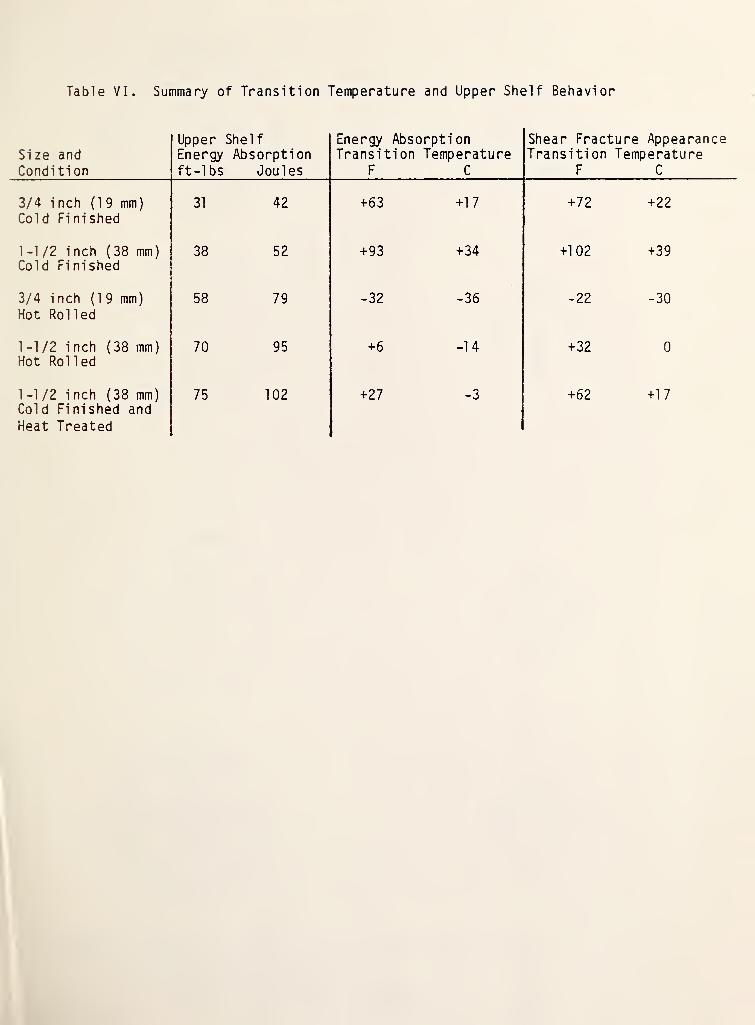
Table VI. Summary of Transition Temperature and Upper Shelf Behavior
Size and
Condition
Upper ShelfEnergy Absorptionft-lbs Joules
Energy AbsorptionTransition Temperature
F C
Shear Fracture AppearanceTransition Temperature
F C
3/4 i nch (19 mm)Cold Finished
31 42 +63 +17 +72 +22
1 -1 /2 i nch (38 mm)Cold Finished
38 52 +93 +34 +102 +39
3/4 i nch (19 mm)
Hot Rol 1 ed
58 79 -32 -36 -22 -30
1 -1 /2 i nch (38 mm)Hot Rolled
70 95 +6 -14 +32 0
1 -1 /2 i nch (38 mm)Cold Finished and
Heat Treated
75 102 +27 -3 +62 +17


a.
b.
Fiaure 1. Schematic of Test Specimen Location and Orientation
a. Tensile Test Specimensb. Charpy V-notch Impact Specimens

b.
Figure 2. Representative Photomicrographs of Inclusion Pattern
a. 3/4 inch (19 mm) hexagonal bar, cold finished
b. 1-1/2 inch (38 mm) hexagonal bar, cold finished
Longitudinal Plane Unetched Magnification: X100

c
.
Figure 2. (Cont)
c. 3/4 inch (19 mm) round bar, hot rolledd. 1-1/2 inch (38 mm) round bar, hot rolled
Longitudinal Plane Unetched Magnification: X100

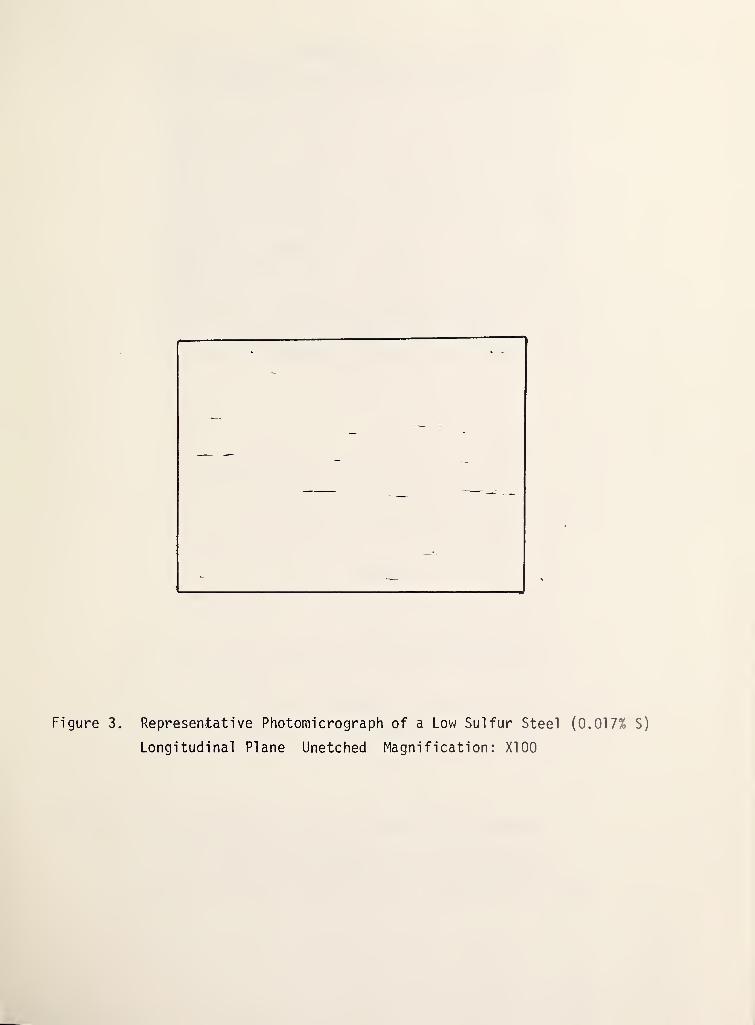
Figure 3. Representative Photomicrograph of a Low Sulfur Steel (0.017% S)
Longitudinal Plane Unetched Magnification: XI 00

cr
Q<
r igure 4. Photomicrographs o^ .ypical itcnec crest ructures
. 3/4 inch (19 mm) hexagonal oar, colt ^'nisned
. 1-1/2 inch (38 fm) hexagonal bar, cold fini
Longitudinal ?! ane Etch: 2\ Nital **agni cation:

C)
O
d.
Figure 4. (Coni:)
. 3/4 inch (19 nun) round oar, nor rolled
. 1-1/2 inch (33 mm) round bar, rot •'oi’ec
Longitudinal Plane Eton: 2\ Cital ''acn-i f 'cat'c r:

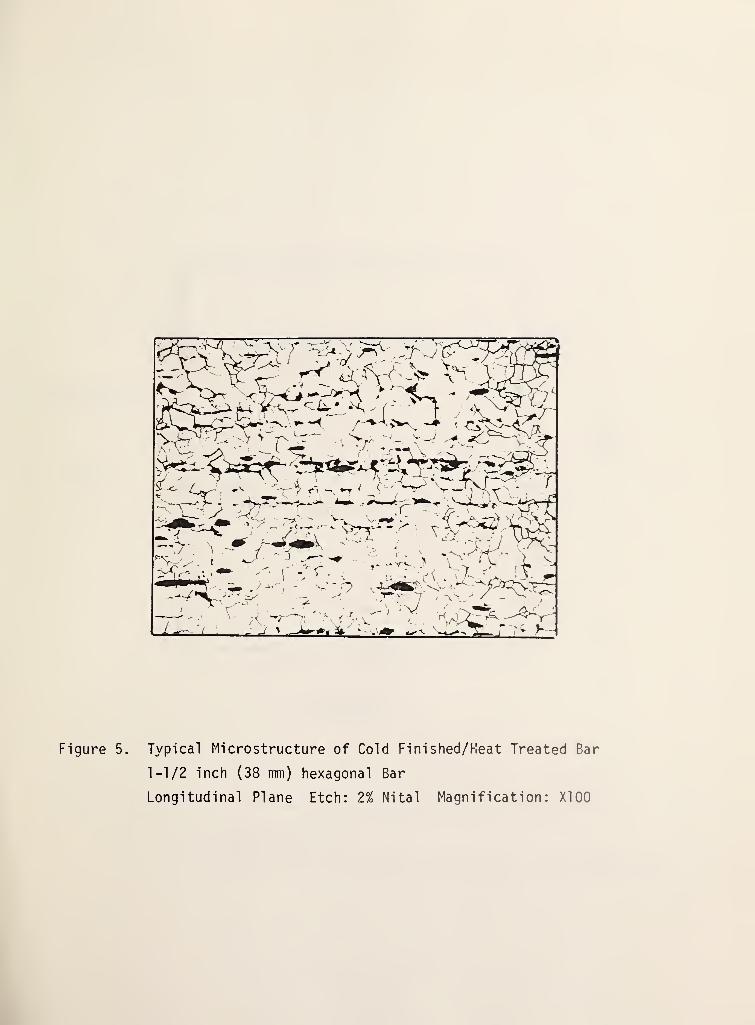
Figure 5. Typical Microstructure of Cold Finished/Heat Treated Ba
1-1/2 inch (38 mm) hexagonal Bar
Longitudinal Plane Etch: 2% Nital Magnification: X100

STRAIN
Figure 5 .
MPa
Schematic of Observed Engineering Stress-Strain Curves
a. Cold Finished Condition
b. Hot Rolled Condition; and Cold Finished/Heat Treated Condition

AISI
12L14
STEEL
3/4
inch
CI9
mm),
Cold
Finished
JOULES
can-ij> a39dosav asj3N3
Absorption
Temperature
Transition
Cur

AISI
1
2L
1
4
STEEL
1/2
inch
C38
mm),
Cold
Finished
JOULES<s>
Q LO Q LOLO (\1 © Q
COr-COLO^OOCNJ — ©
CST-JLjD 039d0sav ASd3N!3
TEMPERATURE
CF)

12L14
STEEL
QO
JOULES
cai-ia) aaadosav ASdaNa
TEMPERATURE
CF5

AXSI
12L14
STEEL
1/2
inch
C38
mm),
Hot
Ro
Iled
©©
JOULES
cai-l-d} 038aosav A9d3N3
TEMPERATURE
CF)

JOULES
can-id } G3adosav A9J3N3
TEMPERATURE
CF)

AISI
1
2L
1-4
STEEL
i
nch
CI9
mm}.
Cold
Finished
SFA
<S(\J
(\J
C 50 30NVdV3ddV 3dfll3VdJ dV3HS
TEMPERATURE
CF)
ture
Appearance
Temperature
Transition
Curve

CJO 30NVdV3ddV 3dfllOVdd dV3HS
TEMPERATURE
CF)

C\J
OJ
1 . 1 1 I I I I 1 I I
G>
-O)OOh0WtCOW©00
©— ©
C/O 33NVdV3ddV 3dniOVdd dV3HS
TEMPERATURE
CF)
Shear
Fracture
Appearance
Temperature
Transition
Curve

G>CMC\J
C50 30NVdV3ddV 3dfllGVdd dV3HS
TEMPERATURE
CF>

AISI
12L14
STEEL
1/2
inch
C38
mm),
Cold
Finished
&
Heat
Treated
SFA
CJO 30NVdV3ddV 3dniOVdJ dV3HS
TEMPERATURE
CF>

a.
b.
Figure 9. Charpy V-notch Specimens Exhibiting Changed Fracture "a :e
a. 1-1/2 inch (33 mm) hot rolled bar, Temoerature ='
'4 r
b. 3/4 inch (19 mm) hot rolled bars
Top Row: Temperature = 55 F (13 C)
Bottom Row: Left, Temperature = 72 F (22 C
Right, Temperature = 123 F (51 C)

kBS*I14A irev. 2-601
U.s. OEPT. OF COMM.
BIBLIOGRAPHIC DATASHEET .See instructions)
1. PUBLICATION ORREPORT NO.
NBSIR 84-2839
2. Performing Organ. Report No. 3. Publication Date
March 1984*. IIILfc "NU jU 1 1 1 Lc
Hechanical Properties of a Leaded, Resul fori zed, Rephosphorized Steel in Varihermo/ Mechanical Conditions
dr 1 ous
5. AUTHOR(S)
James G. Early
6. PERFORMING ORGANIZATION (If joint or other than NBS. see instructions)
NATIONAL BUREAU OF STANDARDSDEPARTMENT OF COMMERCEWASHINGTON, D.C. 20234
7. Contract/Grant No.
Z70099-2-02055
3. Type of Report & Period Covered
Final9. SPONSORING ORGANIZATION NAME AND COMPLETE ADDRESS (Street. City. State . ZIP)
U. S. Coast GuardWashington, DC 20234
10. SUPPLEMENTARY NOTES
J Document describes a computer program; SF-185, FIPS Software Summary, is attached
si gnificant information. „ document includes 0 si gnif,can t
The results of the metallurgical evaluation of bar stock samples of AISI 12214steel in cwo thermo/mechanical conditions, cold finished and hot rolledillustrate the dominant role that the thermo/mechanical condition has on the
n^ meC5aniCal P r°Perties * The contributing effects of ferrite grain sizeand bar diameter on mechanical properties were small in comparison to the effects
°Ibi«5Ld°?n ^ehC0ld finisbin
?operation. Cold finished bar stock samples
ranertflbra
?ln
?cycle <wlthout the b™zing alloy) develop mechanicsproperties that are very similar to those attained in hot rolled bars.
key WORDS (Six to twelve entries; alphabetical order; capitalize only proper names; and separate „e Y wore: ,
tars, cold finished, cold finished/heat treated, hot rolled, leaded steelreDhrKnhnv'i 7qH 1sphosphorized steel, resulfurized steel.
Availability
Unlimited
Tj For Official Distribution. Do Not Release to NTIS
204*2^ r°m Superintendent of Documents, U.S. Government Printing Office, Washington. D.C.
,17]0rder From National Technical Information Service (NTIS), Springfield, VA. 22! 6 i
14. NO. OFprinted pages
15. P>

.