Meat quality, fatty acid composition and flavour analysis in Belgian retail beef
10
Meat quality, fatty acid composition and flavour analysis in Belgian retail beef K. Raes a , A. Balcaen a , P. Dirinck b , A. De Winne b , E. Claeys a , D. Demeyer a , S. De Smet a, * a Department of Animal Production, Faculty of Agricultural and Applied Biological Sciences, Ghent University, Proefhoevestraat 10, 9090 Melle, Belgium b Chemical and Biochemical Research Centre (CBOK), Department of Chemistry and Biochemistry, KaHo Sint-Lieven, Gebroeders Desmetstraat 1, 9000 Ghent, Belgium Received 28 June 2002; received in revised form 9 January 2003; accepted 9 January 2003 Abstract The objective of this study was to evaluate the differences in biochemical, sensorial and quality characteristics of retail beef in Belgium. Four types of beef (Belgian Blue double-muscled, Limousin, Irish and Argentine) and two different muscles (longissimus lumborum and semimembranosus) were bought at the retail level and compared with regard to colour, shear force, collagen content, fatty acid analysis, taste panel evaluation as well as flavour analysis. Belgian Blue and Limousin beef had a paler colour, lower collagen and intramuscular fat contents. Fatty acid profiles were significantly different between the four types, with significantly higher PUFA/SFA and n-6/n-3 ratios for Belgiam Blue and Limousin beef compared to Argentine and Irish beef. There were sig- nificant differences between the meat types for taste panel tenderness and shear force, however both measurements did not fully correspond. Flavour analysis by gas chromatography–mass spectrometry as well as sensory analysis demonstrated that Irish and Argentine beef had a higher flavour intensity related to higher contents of volatile compounds. Differences in tenderness and fla- vour between the meat types were probably affected by differences in ageing time, related to import vs local production of meat. # 2003 Elsevier Ltd. All rights reserved. Keywords: Beef quality; Meat origin; Fatty acid composition; Flavour 1. Introduction Variation in beef quality is large and is due to many factors, such as differences in genetic background, sex, age, management, nutrition. In Belgium, beef cattle are mostly of the Belgian Blue breed and are fattened indoors on high-concentrate diets. However, at the retail level, imported meat from more extensive grass- based production systems is available and is labelled accordingly. Often, labels on these meats claim specific sensory or health benefits and generally have a positive public image due to their more ‘natural’ character. Beef from a specific production system represents the com- bined effects of breed, genotype, sex, age, nutrition and management, and these effects can interact at many points. As a consequence, a comparison of retail meat samples does not allow us to attribute differences in meat quality to one particular factor. However, from a consumer’s point of view, only the overall differences in meat quality are of interest, and one can question whe- ther meat labels differentiate meat objectively. The consumer’s decision to purchase beef is guided by the perception of healthiness and a variety of sensory traits including colour, tenderness, juiciness, and aroma or flavour (Verbeke & Viaene, 1999). It is therefore worth- while considering differences in meat quality at the con- sumer level, with respect to both sensory traits and health aspects. The purpose of this work is to present objective measurements of meat quality characteristics (colour, tenderness, juiciness, fatty acid composition, sensory and instrumental flavour analyses) of retail beef samples of four different origins, either produced locally or imported. 2. Material and methods 2.1. Meat samples Meat samples of four different origins (combination of breed and nutrition) were obtained in collaboration 0309-1740/03/$ - see front matter # 2003 Elsevier Ltd. All rights reserved. doi:10.1016/S0309-1740(03)00031-7 Meat Science 65 (2003) 1237–1246 www.elsevier.com/locate/meatsci * Corresponding author. Tel.: +32-9-264-90-03; fax: +32-9-264- 90-99. E-mail address: [email protected] (S. De Smet).
Transcript of Meat quality, fatty acid composition and flavour analysis in Belgian retail beef
Meat quality, fatty acid composition and flavouranalysis in Belgian retail beef
K. Raesa, A. Balcaena, P. Dirinckb, A. De Winneb,E. Claeysa, D. Demeyera, S. De Smeta,*
aDepartment of Animal Production, Faculty of Agricultural and Applied Biological Sciences,
Ghent University, Proefhoevestraat 10, 9090 Melle, BelgiumbChemical and Biochemical Research Centre (CBOK), Department of Chemistry and Biochemistry,
KaHo Sint-Lieven, Gebroeders Desmetstraat 1, 9000 Ghent, Belgium
Received 28 June 2002; received in revised form 9 January 2003; accepted 9 January 2003
Abstract
The objective of this study was to evaluate the differences in biochemical, sensorial and quality characteristics of retail beef inBelgium. Four types of beef (Belgian Blue double-muscled, Limousin, Irish and Argentine) and two different muscles (longissimus
lumborum and semimembranosus) were bought at the retail level and compared with regard to colour, shear force, collagen content,fatty acid analysis, taste panel evaluation as well as flavour analysis. Belgian Blue and Limousin beef had a paler colour, lowercollagen and intramuscular fat contents. Fatty acid profiles were significantly different between the four types, with significantly
higher PUFA/SFA and n-6/n-3 ratios for Belgiam Blue and Limousin beef compared to Argentine and Irish beef. There were sig-nificant differences between the meat types for taste panel tenderness and shear force, however both measurements did not fullycorrespond. Flavour analysis by gas chromatography–mass spectrometry as well as sensory analysis demonstrated that Irish andArgentine beef had a higher flavour intensity related to higher contents of volatile compounds. Differences in tenderness and fla-
vour between the meat types were probably affected by differences in ageing time, related to import vs local production of meat.# 2003 Elsevier Ltd. All rights reserved.
Keywords: Beef quality; Meat origin; Fatty acid composition; Flavour
1. Introduction
Variation in beef quality is large and is due to manyfactors, such as differences in genetic background, sex,age, management, nutrition. In Belgium, beef cattle aremostly of the Belgian Blue breed and are fattenedindoors on high-concentrate diets. However, at theretail level, imported meat from more extensive grass-based production systems is available and is labelledaccordingly. Often, labels on these meats claim specificsensory or health benefits and generally have a positivepublic image due to their more ‘natural’ character. Beeffrom a specific production system represents the com-bined effects of breed, genotype, sex, age, nutrition andmanagement, and these effects can interact at manypoints. As a consequence, a comparison of retail meatsamples does not allow us to attribute differences inmeat quality to one particular factor. However, from a
consumer’s point of view, only the overall differences inmeat quality are of interest, and one can question whe-ther meat labels differentiate meat objectively.The consumer’s decision to purchase beef is guided bythe perception of healthiness and a variety of sensorytraits including colour, tenderness, juiciness, and aroma orflavour (Verbeke & Viaene, 1999). It is therefore worth-while considering differences in meat quality at the con-sumer level, with respect to both sensory traits and healthaspects. The purpose of this work is to present objectivemeasurements of meat quality characteristics (colour,tenderness, juiciness, fatty acid composition, sensory andinstrumental flavour analyses) of retail beef samples offour different origins, either produced locally or imported.
2. Material and methods
2.1. Meat samples
Meat samples of four different origins (combinationof breed and nutrition) were obtained in collaboration
0309-1740/03/$ - see front matter # 2003 Elsevier Ltd. All rights reserved.
doi:10.1016/S0309-1740(03)00031-7
Meat Science 65 (2003) 1237–1246
www.elsevier.com/locate/meatsci
* Corresponding author. Tel.: +32-9-264-90-03; fax: +32-9-264-
90-99.
E-mail address: [email protected] (S. De Smet).
with a local supermarket: Belgian Blue double-muscled(BB), Limousin, Irish and Argentine beef. Beef from BBand Limousin animals originated from animals fattenedunder high intensive production conditions in Belgium,while Irish and Argentine beef originated from animalsfattened in their respective countries and were claimedto represent more extensive production systems com-pared to the Belgian situation. For each type of beef,eight samples from two muscles each [longissimus lum-borum (LL) and semimembranosus (SM)] were pur-chased. Steaks (2.5 cm thick) from each sample werecut, as possible perpendicular to the fibre direction.Steaks of BB and Limousin animals were vacuumpacked and aged for 14 days at 4 �C. Argentine andIrish steaks were vacuum packed and frozen (�20 �C)after the determination of colour at arrival. It was sta-ted that the ageing time for Argentine and Irish beef was29 and 22 days, respectively, at day of purchase. Ana-tomical sites of steaks were similar for similar analyses.One steak was taken for collagen content, one for fattyacid analysis, one for shear force and sarcomere length,and three steaks were taken for flavour analysis andtaste panel evaluation (taste, tenderness and juiciness).
2.2. Meat quality characteristics
After cutting the muscles into steaks, colour wasmeasured in duplicate on different fresh samples furtherused for shear force determination, flavour analysis andsensory analysis. The samples were allowed to bloomfor 1 h. The Hunterlab L*, a* and b* values were mea-sured with a Hunterlab Miniscan colorimeter (D65 lightsource, 10� standard observer, 45�/0� geometry, 1 inlight surface, white standard). After the colour mea-surements, the samples were vacuum packed, aged (BBand Limousin samples) and stored at �20 �C until shearforce, flavour or sensory analysis.Warner–Bratzler shear force (WBSF) measurementswere performed using a Lloyd TA 500 Texture Analy-ser. After thawing, samples were heated by hangingthem into plastic bags and immersing them into a water
bath (75 �C) for 60 min. Fifteen to twenty cores (ø 1.27cm) were cut from the steaks parallel to the muscle fibreorientation. The mean value of the replicate determina-tions of the maximum force needed to shear the sampleswas taken as the shear force value (WBSF). The totalarea under the shear force curve, representing totalwork, was allocated to a collagen and a myofibrillarcomponent (Harris & Shorthose, 1988), as described byClaeys, De Smet, Balcaen, and Demeyer (2000).Collagen measurements were performed on mincedmeat samples by measuring the hydroxyproline content(ISO/DIS 3496.2).Sarcomere length was determined on the samples usedfor shear force, before heating (Vandendriessche, Buts,Claeys, Dendooven, & Demeyer, 1984).
2.3. Fatty acid analysis
Intramuscular fat was extracted by means of a modi-fication of Folch, Lees, and Stanley (1957) usingchloroform/methanol (2/1; v/v). Fatty acids were ana-lysed by gas chromatography as described by Raes, DeSmet, and Demeyer (2001). Briefly, nonadecanoic acid wasadded as an internal standard. After methylation (NaOH/MeOH followed by HCl/MeOH), the fatty acids wereanalysed on a HP6890 gas chromatograph with a CP-Sil88 column (100 m�0.25 mm�0.2 mm). The followingtemperature program was used: 150 �C during 2 min fol-lowed by an increase of 1.5 �C/min to 175 �C, followedby an increase of 5 �C/min to 215 �C, and then held atthis temperature until C22:6 n-3 had been detected.
2.4. Sensory evaluation
Sensory characteristics were evaluated by a 10-mem-ber, inhouse trained panel (22–55 years of age). Asroasting is the most used preparation method in Bel-gium, meat samples (3�3�2 cm) were grilled for 2 minon a 2-contact grill and served on pre-heated plates. Thepanellists were asked to assess the following attributes:tenderness, juiciness and flavour intensity. A rankingtest was used for flavour intensity, while tenderness andjuiciness were scored on an 8-point scale (1=extremelytough/dry to 8=extremely tender/juicy).
2.5. Instrumental flavour analysis
Gas chromatography–mass spectrometry (GC–MS)analyses were performed on extracts of 3 separatelygrilled samples of the LL muscles (without visible fat) ofeach beef type (7�7�2.5 cm). Meat samples were grilledfor 4 min (SEB, grill minute). After grilling, the meatwas cut into pieces (1�1 cm). Aroma compounds wereisolated by Likens-Nickerson extraction (4 h reflux time)using 600 ml distilled water and 60 ml dichloromethane asextraction solvent. Semi-quantitative data of the flavour
Nomenclature
BB Belgian Blue double-muscledCLA conjugated linoleic acidGC–MS gas chromatography–mass spectrometryLL longissimus lumborumMUFA monounsaturated fatty acidsPCA Principal Component AnalysisPUFA polyunsaturated fatty acidsSFA saturated fatty acidsSM semimembranosusWBSF Warner–Bratzler shear force
1238 K. Raes et al. /Meat Science 65 (2003) 1237–1246
compounds were obtained by relating the peak inten-sities to the intensity of nonane, added to the dichloro-methane phase as an internal standard. The extractswere concentrated to 0.2 ml by Kuderna-Danish eva-poration and stored at �18 �C until analysis. Analyseswere performed on a HP5890 gas chromatograph cou-pled to a HP5971A mass spectrometer. The gas chro-matographic conditions were: injector temperature:250 �C; detector temperature: 280 �C; methylsiliconecapillary column (50 m�0.2 mm�0.5 mm); carrier gas: He;flow: 1 ml/min; oven temperature: 40 �C for 5 min, fol-lowed by an increase of 5 �C/min to 250 �C and then heldthere for 13 min. The mass spectrometer operated in anelectron impact mode with an electron energy of 70 eV, asource temperature and pressure of 191 �C and 25–30mTorr respectively. The mass spectrometer scanned fromm/z 40 to 260. Identification of the volatile componentswas based on comparison of the spectra with the spectraof the Wiley/NBS library and of a self-made library.
2.6. Statistical analysis
Data were subjected to analysis of variance(ANOVA), using Duncan’s post-hoc test (SPSS 9.0).Discriminant analysis and principal component analysis(PCA) was carried out using data of the fatty acid ana-lysis and flavour analysis, respectively.
3. Results
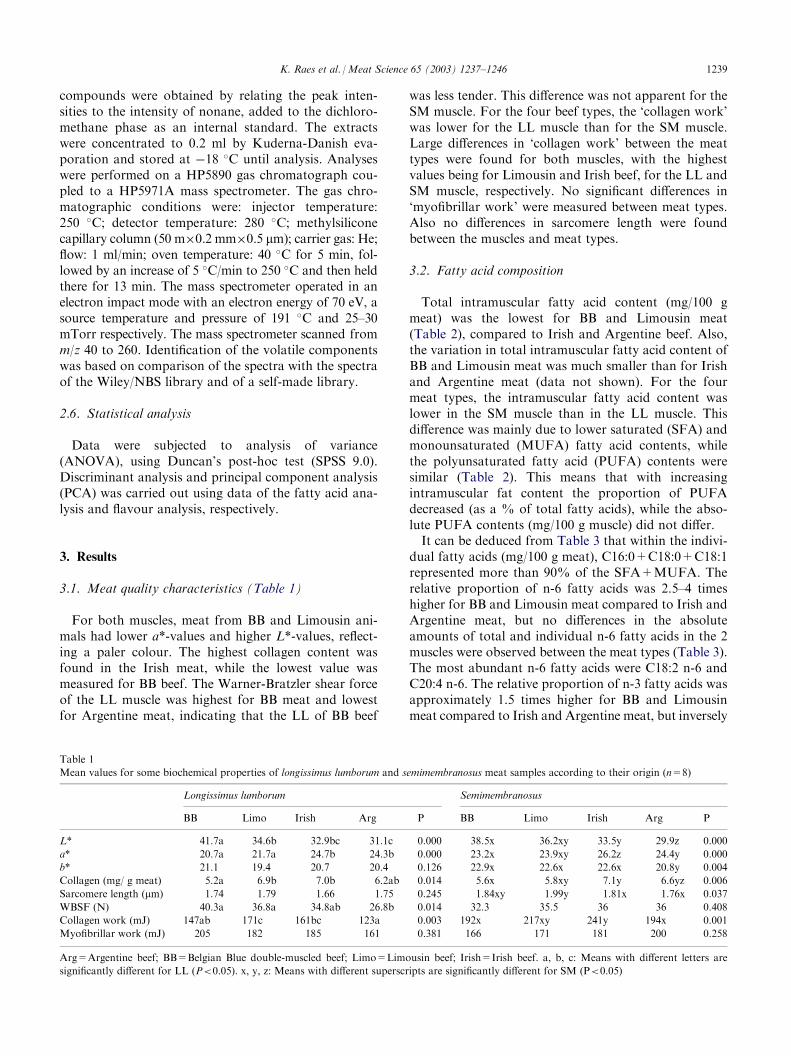
3.1. Meat quality characteristics (Table 1)
For both muscles, meat from BB and Limousin ani-mals had lower a*-values and higher L*-values, reflect-ing a paler colour. The highest collagen content wasfound in the Irish meat, while the lowest value wasmeasured for BB beef. The Warner-Bratzler shear forceof the LL muscle was highest for BB meat and lowestfor Argentine meat, indicating that the LL of BB beef
was less tender. This difference was not apparent for theSM muscle. For the four beef types, the ‘collagen work’was lower for the LL muscle than for the SM muscle.Large differences in ‘collagen work’ between the meattypes were found for both muscles, with the highestvalues being for Limousin and Irish beef, for the LL andSM muscle, respectively. No significant differences in‘myofibrillar work’ were measured between meat types.Also no differences in sarcomere length were foundbetween the muscles and meat types.
3.2. Fatty acid composition
Total intramuscular fatty acid content (mg/100 gmeat) was the lowest for BB and Limousin meat(Table 2), compared to Irish and Argentine beef. Also,the variation in total intramuscular fatty acid content ofBB and Limousin meat was much smaller than for Irishand Argentine meat (data not shown). For the fourmeat types, the intramuscular fatty acid content waslower in the SM muscle than in the LL muscle. Thisdifference was mainly due to lower saturated (SFA) andmonounsaturated (MUFA) fatty acid contents, whilethe polyunsaturated fatty acid (PUFA) contents weresimilar (Table 2). This means that with increasingintramuscular fat content the proportion of PUFAdecreased (as a % of total fatty acids), while the abso-lute PUFA contents (mg/100 g muscle) did not differ.It can be deduced from Table 3 that within the indivi-dual fatty acids (mg/100 g meat), C16:0+C18:0+C18:1represented more than 90% of the SFA+MUFA. Therelative proportion of n-6 fatty acids was 2.5–4 timeshigher for BB and Limousin meat compared to Irish andArgentine meat, but no differences in the absoluteamounts of total and individual n-6 fatty acids in the 2muscles were observed between the meat types (Table 3).The most abundant n-6 fatty acids were C18:2 n-6 andC20:4 n-6. The relative proportion of n-3 fatty acids wasapproximately 1.5 times higher for BB and Limousinmeat compared to Irish and Argentine meat, but inversely
Table 1
Mean values for some biochemical properties of longissimus lumborum and semimembranosus meat samples according to their origin (n=8)
Longissimus lumborum
SemimembranosusBB
Limo Irish Arg P BB Limo Irish Arg PL*
41.7a 34.6b 32.9bc 31.1c 0.000 38.5x 36.2xy 33.5y 29.9z 0.000a*
20.7a 21.7a 24.7b 24.3b 0.000 23.2x 23.9xy 26.2z 24.4y 0.000b*
21.1 19.4 20.7 20.4 0.126 22.9x 22.6x 22.6x 20.8y 0.004Collagen (mg/ g meat)
5.2a 6.9b 7.0b 6.2ab 0.014 5.6x 5.8xy 7.1y 6.6yz 0.006Sarcomere length (mm)
1.74 1.79 1.66 1.75 0.245 1.84xy 1.99y 1.81x 1.76x 0.037WBSF (N)
40.3a 36.8a 34.8ab 26.8b 0.014 32.3 35.5 36 36 0.408Collagen work (mJ)
147ab 171c 161bc 123a 0.003 192x 217xy 241y 194x 0.001Myofibrillar work (mJ)
205 182 185 161 0.381 166 171 181 200 0.258Arg=Argentine beef; BB=Belgian Blue double-muscled beef; Limo=Limousin beef; Irish=Irish beef. a, b, c: Means with different letters are
significantly different for LL (P<0.05). x, y, z: Means with different superscripts are significantly different for SM (P<0.05)
K. Raes et al. /Meat Science 65 (2003) 1237–1246 1239
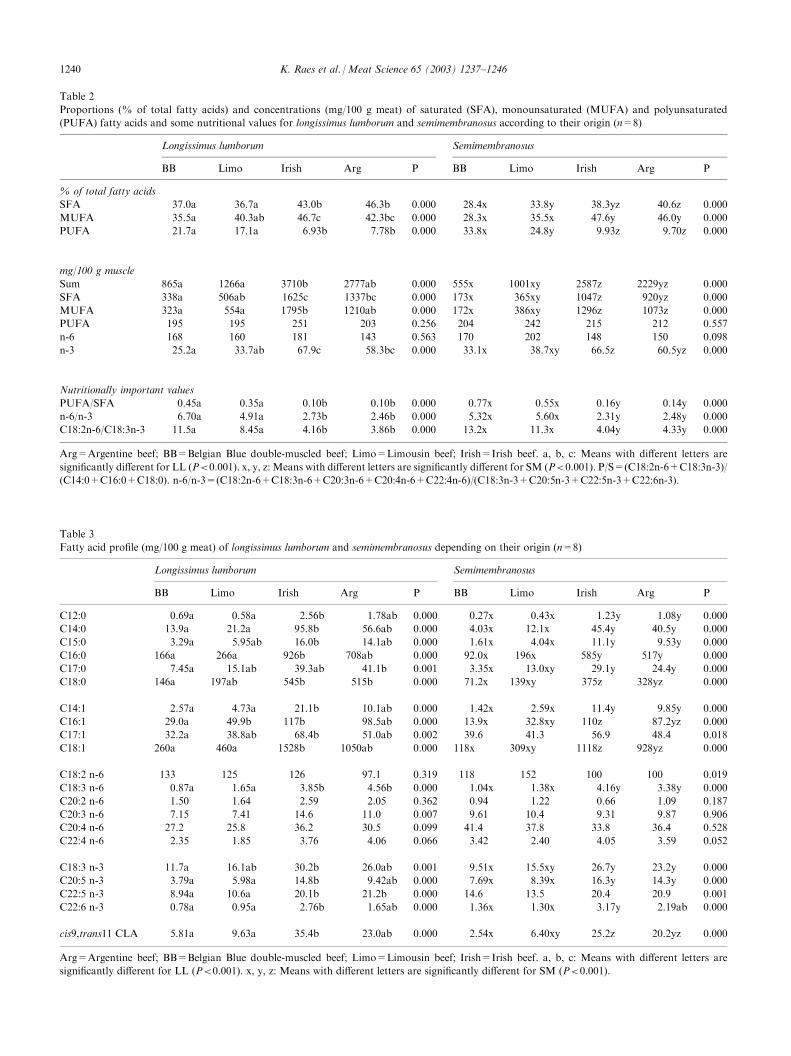
Table 2
Proportions (% of total fatty acids) and concentrations (mg/100 g meat) of saturated (SFA), monounsaturated (MUFA) and polyunsaturated
(PUFA) fatty acids and some nutritional values for longissimus lumborum and semimembranosus according to their origin (n=8)
Longissimus lumborum
SemimembranosusBB
Limo Irish Arg P BB Limo Irish Arg P% of total fatty acids
SFA
37.0a 36.7a 43.0b 46.3b 0.000 28.4x 33.8y 38.3yz 40.6z 0.000MUFA
35.5a 40.3ab 46.7c 42.3bc 0.000 28.3x 35.5x 47.6y 46.0y 0.000PUFA
21.7a 17.1a 6.93b 7.78b 0.000 33.8x 24.8y 9.93z 9.70z 0.000mg/100 g muscle
Sum
865a 1266a 3710b 2777ab 0.000 555x 1001xy 2587z 2229yz 0.000SFA
338a 506ab 1625c 1337bc 0.000 173x 365xy 1047z 920yz 0.000MUFA
323a 554a 1795b 1210ab 0.000 172x 386xy 1296z 1073z 0.000PUFA
195 195 251 203 0.256 204 242 215 212 0.557n-6
168 160 181 143 0.563 170 202 148 150 0.098n-3
25.2a 33.7ab 67.9c 58.3bc 0.000 33.1x 38.7xy 66.5z 60.5yz 0.000Nutritionally important values
PUFA/SFA
0.45a 0.35a 0.10b 0.10b 0.000 0.77x 0.55x 0.16y 0.14y 0.000n-6/n-3
6.70a 4.91a 2.73b 2.46b 0.000 5.32x 5.60x 2.31y 2.48y 0.000C18:2n-6/C18:3n-3
11.5a 8.45a 4.16b 3.86b 0.000 13.2x 11.3x 4.04y 4.33y 0.000Arg=Argentine beef; BB=Belgian Blue double-muscled beef; Limo=Limousin beef; Irish=Irish beef. a, b, c: Means with different letters are
significantly different for LL (P<0.001). x, y, z: Means with different letters are significantly different for SM (P<0.001). P/S=(C18:2n-6+C18:3n-3)/
(C14:0+C16:0+C18:0). n-6/n-3=(C18:2n-6+C18:3n-6+C20:3n-6+C20:4n-6+C22:4n-6)/(C18:3n-3+C20:5n-3+C22:5n-3+C22:6n-3).
Table 3
Fatty acid profile (mg/100 g meat) of longissimus lumborum and semimembranosus depending on their origin (n=8)
Longissimus lumborum
SemimembranosusBB
Limo Irish Arg P BB Limo Irish Arg PC12:0
0.69a 0.58a 2.56b 1.78ab 0.000 0.27x 0.43x 1.23y 1.08y 0.000C14:0
13.9a 21.2a 95.8b 56.6ab 0.000 4.03x 12.1x 45.4y 40.5y 0.000C15:0
3.29a 5.95ab 16.0b 14.1ab 0.000 1.61x 4.04x 11.1y 9.53y 0.000C16:0
166a 266a 926b 708ab 0.000 92.0x 196x 585y 517y 0.000C17:0
7.45a 15.1ab 39.3ab 41.1b 0.001 3.35x 13.0xy 29.1y 24.4y 0.000C18:0
146a 197ab 545b 515b 0.000 71.2x 139xy 375z 328yz 0.000C14:1
2.57a 4.73a 21.1b 10.1ab 0.000 1.42x 2.59x 11.4y 9.85y 0.000C16:1
29.0a 49.9b 117b 98.5ab 0.000 13.9x 32.8xy 110z 87.2yz 0.000C17:1
32.2a 38.8ab 68.4b 51.0ab 0.002 39.6 41.3 56.9 48.4 0.018C18:1
260a 460a 1528b 1050ab 0.000 118x 309xy 1118z 928yz 0.000C18:2 n-6
133 125 126 97.1 0.319 118 152 100 100 0.019C18:3 n-6
0.87a 1.65a 3.85b 4.56b 0.000 1.04x 1.38x 4.16y 3.38y 0.000C20:2 n-6
1.50 1.64 2.59 2.05 0.362 0.94 1.22 0.66 1.09 0.187C20:3 n-6
7.15 7.41 14.6 11.0 0.007 9.61 10.4 9.31 9.87 0.906C20:4 n-6
27.2 25.8 36.2 30.5 0.099 41.4 37.8 33.8 36.4 0.528C22:4 n-6
2.35 1.85 3.76 4.06 0.066 3.42 2.40 4.05 3.59 0.052C18:3 n-3
11.7a 16.1ab 30.2b 26.0ab 0.001 9.51x 15.5xy 26.7y 23.2y 0.000C20:5 n-3
3.79a 5.98a 14.8b 9.42ab 0.000 7.69x 8.39x 16.3y 14.3y 0.000C22:5 n-3
8.94a 10.6a 20.1b 21.2b 0.000 14.6 13.5 20.4 20.9 0.001C22:6 n-3
0.78a 0.95a 2.76b 1.65ab 0.000 1.36x 1.30x 3.17y 2.19ab 0.000cis9,trans11 CLA
5.81a 9.63a 35.4b 23.0ab 0.000 2.54x 6.40xy 25.2z 20.2yz 0.000Arg=Argentine beef; BB=Belgian Blue double-muscled beef; Limo=Limousin beef; Irish=Irish beef. a, b, c: Means with different letters are
significantly different for LL (P<0.001). x, y, z: Means with different letters are significantly different for SM (P<0.001).
1240 K. Raes et al. /Meat Science 65 (2003) 1237–1246
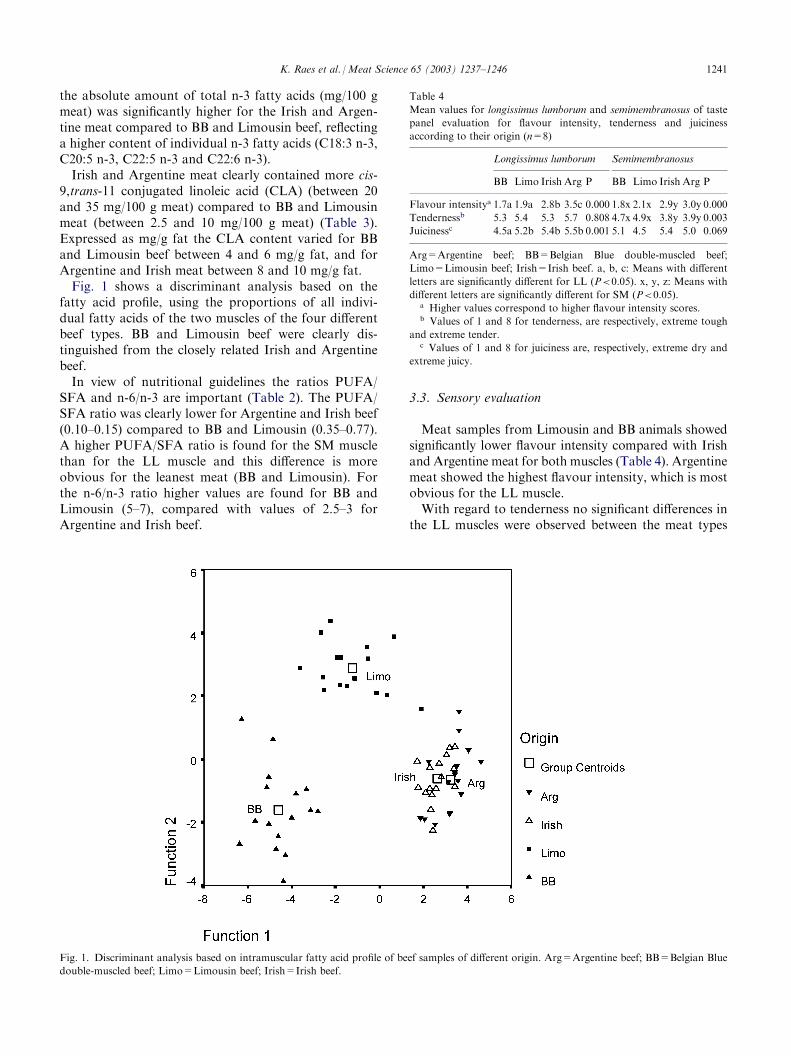
the absolute amount of total n-3 fatty acids (mg/100 gmeat) was significantly higher for the Irish and Argen-tine meat compared to BB and Limousin beef, reflectinga higher content of individual n-3 fatty acids (C18:3 n-3,C20:5 n-3, C22:5 n-3 and C22:6 n-3).Irish and Argentine meat clearly contained more cis-9,trans-11 conjugated linoleic acid (CLA) (between 20and 35 mg/100 g meat) compared to BB and Limousinmeat (between 2.5 and 10 mg/100 g meat) (Table 3).Expressed as mg/g fat the CLA content varied for BBand Limousin beef between 4 and 6 mg/g fat, and forArgentine and Irish meat between 8 and 10 mg/g fat.Fig. 1 shows a discriminant analysis based on thefatty acid profile, using the proportions of all indivi-dual fatty acids of the two muscles of the four differentbeef types. BB and Limousin beef were clearly dis-tinguished from the closely related Irish and Argentinebeef.In view of nutritional guidelines the ratios PUFA/SFA and n-6/n-3 are important (Table 2). The PUFA/SFA ratio was clearly lower for Argentine and Irish beef(0.10–0.15) compared to BB and Limousin (0.35–0.77).A higher PUFA/SFA ratio is found for the SM musclethan for the LL muscle and this difference is moreobvious for the leanest meat (BB and Limousin). Forthe n-6/n-3 ratio higher values are found for BB andLimousin (5–7), compared with values of 2.5–3 forArgentine and Irish beef.
3.3. Sensory evaluation
Meat samples from Limousin and BB animals showedsignificantly lower flavour intensity compared with Irishand Argentine meat for both muscles (Table 4). Argentinemeat showed the highest flavour intensity, which is mostobvious for the LL muscle.With regard to tenderness no significant differences inthe LL muscles were observed between the meat types
Fig. 1. Discriminant analysis based on intramuscular fatty acid profile of beef samples of different origin. Arg=Argentine beef; BB=Belgian Blue
double-muscled beef; Limo=Limousin beef; Irish=Irish beef.
Table 4
Mean values for longissimus lumborum and semimembranosus of taste
panel evaluation for flavour intensity, tenderness and juiciness
according to their origin (n=8)
L
ongissimus lumborum S emimembranosusB
B L imo I rish A rg P B B L imo I rish A rg PFlavour intensitya 1
.7a 1 .9a 2 .8b 3 .5c 0 .000 1 .8x 2 .1x 2 .9y 3 .0y 0 .000Tendernessb 5
.3 5 .4 5 .3 5 .7 0 .808 4 .7x 4 .9x 3 .8y 3 .9y 0 .003Juicinessc 4
.5a 5 .2b 5 .4b 5 .5b 0 .001 5 .1 4 .5 5 .4 5 .0 0 .069Arg=Argentine beef; BB=Belgian Blue double-muscled beef;
Limo=Limousin beef; Irish=Irish beef. a, b, c: Means with different
letters are significantly different for LL (P<0.05). x, y, z: Means with
different letters are significantly different for SM (P<0.05).a Higher values correspond to higher flavour intensity scores.b Values of 1 and 8 for tenderness, are respectively, extreme tough
and extreme tender.c Values of 1 and 8 for juiciness are, respectively, extreme dry and
extreme juicy.
K. Raes et al. /Meat Science 65 (2003) 1237–1246 1241
(Table 4). However, for the SM muscle the BB andLimousin meat showed the lowest value, correspondingto more tender meat. The LL muscle of the BB meatwas the most juicy (Table 4), while for the SM musclethe Limousin meat tended to be the most juicy.
3.4. Instrumental flavour analysis (GC–MS)
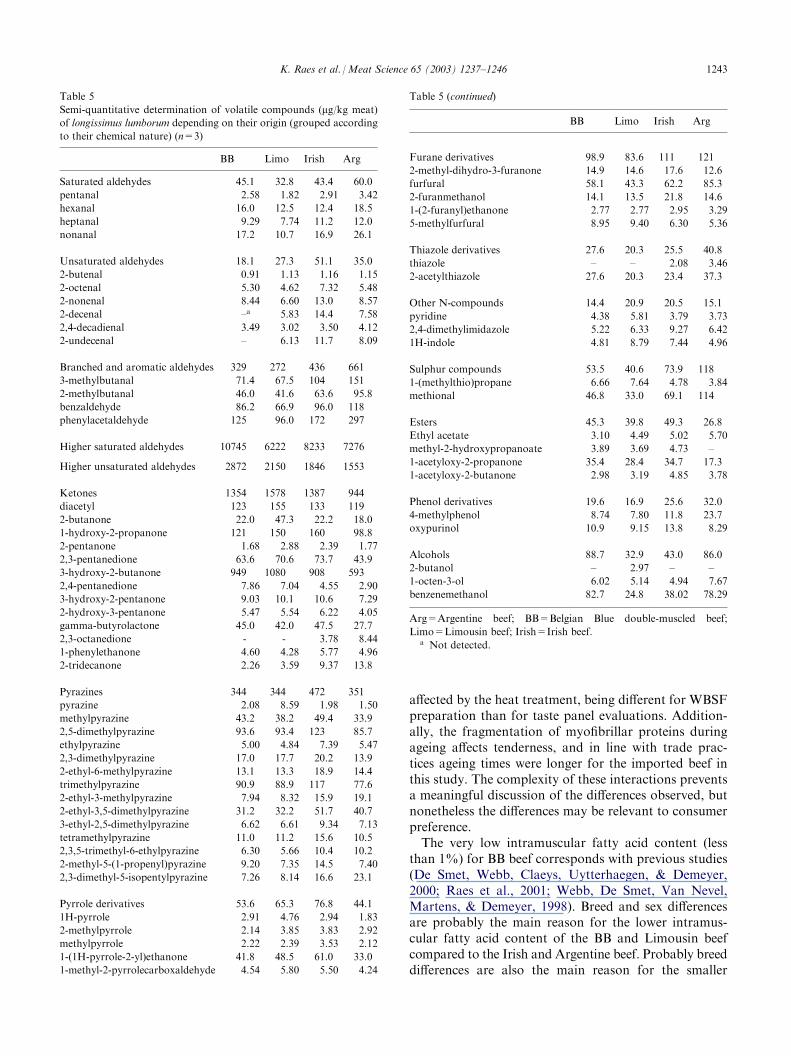
Based on experience in our laboratory we preferred touse the Likens-Nickerson extraction method for theisolation of the volatiles in grilled meat. Using thisextraction method to obtain ‘a total volatile’ analysishas several advantages compared to headspace proce-dures, that do not allow isolation of the less volatile keyaroma compounds. Also the ‘total volatile’ isolationprocedure eliminates the problem of aroma release,which in the case of heterogeneous products, like meat,hinder reproducibility (Demeyer et al., 2000; Dirinck,Van Opstaele, & Vandendriessche, 1997; Schmidt &Berger, 1998). It has been reported that the type of iso-lation method affects the number and the relative pro-portion of the volatile compounds (Demeyer et al.,2000). This study deals with the flavour of roasted meat(the general preparation method of beef in Belgium).Roasting meat is already a severe heat treatment and forthis type of meat Likens-Nickerson extraction should begood practice, since we have shown in our laboratory itis the preferred method to extract volatile compounds ofother roasted products, like coffee. In these type ofroasted products good correlations between sensory andGC–MS profiling using Likens-Nickerson extraction asan isolation procedure for the volatile compounds havebeen found.Sixty-seven volatiles were identified in the GC-MSanalyses of the grilled meat samples. The semi-quanti-tative volatile composition of the grilled meat samples ispresented in Table 5. The volatile compounds wereclassified according to their chemical nature: aldehydes,ketones, pyrazines, pyrroles, furane derivatives, thia-zoles, sulphur compounds, esters and alcohols. Alde-hydes were the chemical family of highest concentrationand a distinction could be made between the higher andthe lower molecular weight saturated and unsaturatedaldehydes. Because of their low volatility the highermolecular weight aldehydes, which also occur in rawmeat, should have a minor impact on roasted meat fla-vour and for this reason they are not individually pre-sented. The low molecular weight aldehydes wereclassified into: saturated straight-chain alkanals (penta-nal, hexanal, heptanal, nonanal), unsaturated aldehydes(2-butenal, 2-octenal, 2-nonenal, 2-decenal, 2,4-deca-dienal and 2-undecenal), branched aldehydes (2- and3-methylbutanal) and aromatic aldehydes (benzalde-hyde and phenylacetaldehyde). Among the ketones,considerable amounts of 3-hydroxy-2-butanone anddiacetyl were detected.
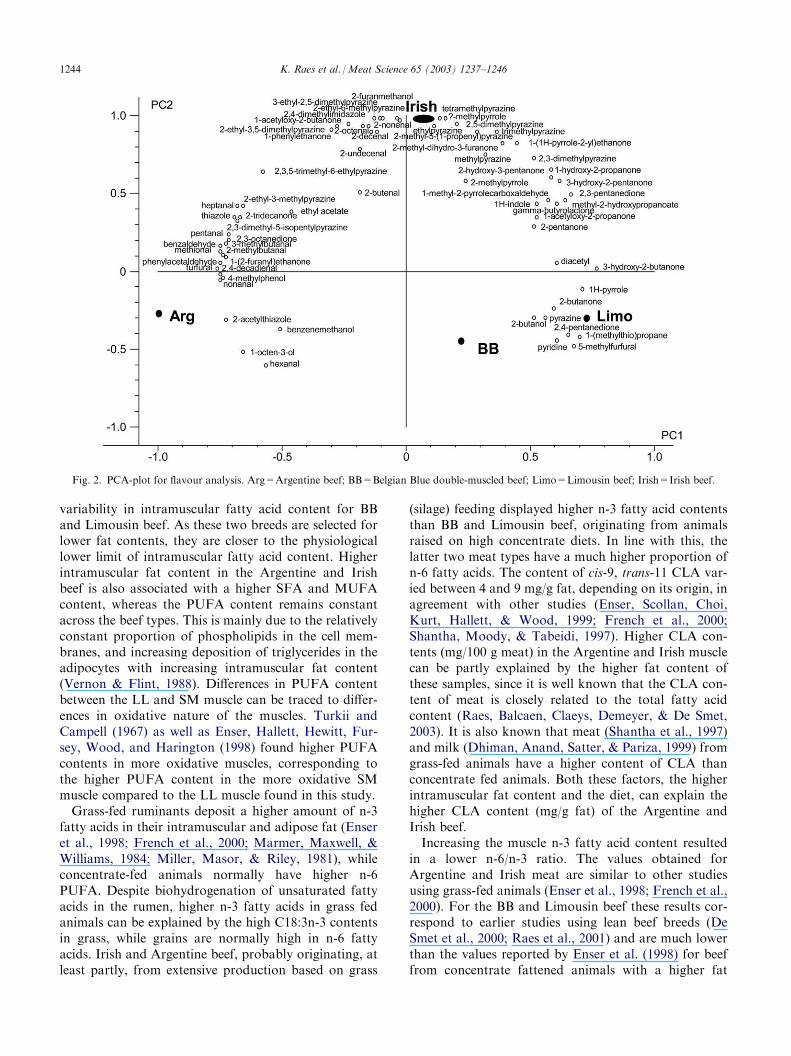
Argentine and Irish beef clearly contained higherconcentrations of the lower saturated and unsaturatedaldehydes, resulting from fat oxidation, as well as bran-ched and aromatic aldehydes, resulting from proteolysisand amino acid degradation (Table 5). Irish beef had thehighest content of both pyrazines and pyrrole derivatives.To visualise the volatile composition of the roastedbeef samples a PCA-analysis with 67 individual aromacompounds was performed. PC1 and PC2 are plotted inFig. 2. BB and Limousin beef were situated at the lowerright quadrant of the PCA-plot, reflecting the lowestcontent of aroma compounds. The Irish meat was situ-ated at the positive side of PC2 and was characterisedby high amounts of aroma compounds. The highconcentrations of pyrazines should be important con-tributors to the pronounced roasted meat flavour of theIrish beef, which had also the highest level of potentaroma unsaturated aldehydes. The Argentine beef wassituated in the region of the saturated, branched andaromatic aldehydes, probably as a result of the longerageing of the meat.
4. Discussion
The paler colour of BB and Limousin beef, compared toIrish and Argentine beef, may be the result of both nutri-tional and genetic factors. A darker colour of Irish andArgentine meat is probably related to the more extensivegrass-based production systems, as is apparent from thefatty acid composition, and corresponds with literaturedata (Priolo, Micol, & Agabriel, 2001). Also, Vester-gaard, Oksbjerg, and Henckel (2000) found that musclesfrom pasture-fed animals had a higher proportion ofoxidative fibres and a darker colour than muscles fromgrain-fed animals. According to these authors, differ-ence in feeding levels and physical activity betweengrain- and pasture-fed animals could be responsible fora change in the metabolic characteristics as well as thecolour of the muscles. In addition, it is known that leanbreeds like the double-muscled BB have more glycolyticfibre type (Fiems, Van Hoof, Uytterhaegen, Boucque, &Demeyer, 1995), which would also contribute to thedifferences in colour observed.Tenderness evaluation by the taste panel did not fullycorrespond with the WBSF values. No differences intaste panel tenderness were observed between the beeftypes for the LL muscle in spite of differences in WBSFvalues, whereas tenderness scoring was in line withWBSF values for the SM muscle. On the other hand,differences in juiciness between beef types were larger inthe LL than in the SM muscle. In this study, the tastepanel tenderness evaluations appeared to be more rela-ted to the collagen content and to the ‘collagen work’rather than to the ‘myofibrillar work’ during shearing.Myofibrillar and collagen resistance to shearing are
1242 K. Raes et al. /Meat Science 65 (2003) 1237–1246
affected by the heat treatment, being different for WBSFpreparation than for taste panel evaluations. Addition-ally, the fragmentation of myofibrillar proteins duringageing affects tenderness, and in line with trade prac-tices ageing times were longer for the imported beef inthis study. The complexity of these interactions preventsa meaningful discussion of the differences observed, butnonetheless the differences may be relevant to consumerpreference.The very low intramuscular fatty acid content (lessthan 1%) for BB beef corresponds with previous studies(De Smet, Webb, Claeys, Uytterhaegen, & Demeyer,2000; Raes et al., 2001; Webb, De Smet, Van Nevel,Martens, & Demeyer, 1998). Breed and sex differencesare probably the main reason for the lower intramus-cular fatty acid content of the BB and Limousin beefcompared to the Irish and Argentine beef. Probably breeddifferences are also the main reason for the smaller
Table 5
Semi-quantitative determination of volatile compounds (mg/kg meat)of longissimus lumborum depending on their origin (grouped according
to their chemical nature) (n=3)
BB
Limo Irish ArgSaturated aldehydes
45.1 32.8 43.4 60.0pentanal
2.58 1.82 2.91 3.42hexanal
16.0 12.5 12.4 18.5heptanal
9.29 7.74 11.2 12.0nonanal
17.2 10.7 16.9 26.1Unsaturated aldehydes
18.1 27.3 51.1 35.02-butenal
0.91 1.13 1.16 1.152-octenal
5.30 4.62 7.32 5.482-nonenal
8.44 6.60 13.0 8.572-decenal
–a 5.83 14.4 7.582,4-decadienal
3.49 3.02 3.50 4.122-undecenal
– 6.13 11.7 8.09Branched and aromatic aldehydes
329 272 436 6613-methylbutanal
71.4 67.5 104 1512-methylbutanal
46.0 41.6 63.6 95.8benzaldehyde
86.2 66.9 96.0 118phenylacetaldehyde
125 96.0 172 297Higher saturated aldehydes
10745 6222 8233 7276Higher unsaturated aldehydes
2872 2150 1846 1553Ketones
1354 1578 1387 944diacetyl
123 155 133 1192-butanone
22.0 47.3 22.2 18.01-hydroxy-2-propanone
121 150 160 98.82-pentanone
1.68 2.88 2.39 1.772,3-pentanedione
63.6 70.6 73.7 43.93-hydroxy-2-butanone
949 1080 908 5932,4-pentanedione
7.86 7.04 4.55 2.903-hydroxy-2-pentanone
9.03 10.1 10.6 7.292-hydroxy-3-pentanone
5.47 5.54 6.22 4.05gamma-butyrolactone
45.0 42.0 47.5 27.72,3-octanedione
- - 3.78 8.441-phenylethanone
4.60 4.28 5.77 4.962-tridecanone
2.26 3.59 9.37 13.8Pyrazines
344 344 472 351pyrazine
2.08 8.59 1.98 1.50methylpyrazine
43.2 38.2 49.4 33.92,5-dimethylpyrazine
93.6 93.4 123 85.7ethylpyrazine
5.00 4.84 7.39 5.472,3-dimethylpyrazine
17.0 17.7 20.2 13.92-ethyl-6-methylpyrazine
13.1 13.3 18.9 14.4trimethylpyrazine
90.9 88.9 117 77.62-ethyl-3-methylpyrazine
7.94 8.32 15.9 19.12-ethyl-3,5-dimethylpyrazine
31.2 32.2 51.7 40.73-ethyl-2,5-dimethylpyrazine
6.62 6.61 9.34 7.13tetramethylpyrazine
11.0 11.2 15.6 10.52,3,5-trimethyl-6-ethylpyrazine
6.30 5.66 10.4 10.22-methyl-5-(1-propenyl)pyrazine
9.20 7.35 14.5 7.402,3-dimethyl-5-isopentylpyrazine
7.26 8.14 16.6 23.1Pyrrole derivatives
53.6 65.3 76.8 44.11H-pyrrole
2.91 4.76 2.94 1.832-methylpyrrole
2.14 3.85 3.83 2.92methylpyrrole
2.22 2.39 3.53 2.121-(1H-pyrrole-2-yl)ethanone
41.8 48.5 61.0 33.01-methyl-2-pyrrolecarboxaldehyde
4.54 5.80 5.50 4.24Table 5 (continued)
BB
Limo Irish ArgFurane derivatives
98.9 83.6 111 1212-methyl-dihydro-3-furanone
14.9 14.6 17.6 12.6furfural
58.1 43.3 62.2 85.32-furanmethanol
14.1 13.5 21.8 14.61-(2-furanyl)ethanone
2.77 2.77 2.95 3.295-methylfurfural
8.95 9.40 6.30 5.36Thiazole derivatives
27.6 20.3 25.5 40.8thiazole
– – 2.08 3.462-acetylthiazole
27.6 20.3 23.4 37.3Other N-compounds
14.4 20.9 20.5 15.1pyridine
4.38 5.81 3.79 3.732,4-dimethylimidazole
5.22 6.33 9.27 6.421H-indole
4.81 8.79 7.44 4.96Sulphur compounds
53.5 40.6 73.9 1181-(methylthio)propane
6.66 7.64 4.78 3.84methional
46.8 33.0 69.1 114Esters
45.3 39.8 49.3 26.8Ethyl acetate
3.10 4.49 5.02 5.70methyl-2-hydroxypropanoate
3.89 3.69 4.73 –1-acetyloxy-2-propanone
35.4 28.4 34.7 17.31-acetyloxy-2-butanone
2.98 3.19 4.85 3.78Phenol derivatives
19.6 16.9 25.6 32.04-methylphenol
8.74 7.80 11.8 23.7oxypurinol
10.9 9.15 13.8 8.29Alcohols
88.7 32.9 43.0 86.02-butanol
– 2.97 – –1-octen-3-ol
6.02 5.14 4.94 7.67benzenemethanol
82.7 24.8 38.02 78.29Arg=Argentine beef; BB=Belgian Blue double-muscled beef;
Limo=Limousin beef; Irish=Irish beef.a Not detected.
K. Raes et al. /Meat Science 65 (2003) 1237–1246 1243
variability in intramuscular fatty acid content for BBand Limousin beef. As these two breeds are selected forlower fat contents, they are closer to the physiologicallower limit of intramuscular fatty acid content. Higherintramuscular fat content in the Argentine and Irishbeef is also associated with a higher SFA and MUFAcontent, whereas the PUFA content remains constantacross the beef types. This is mainly due to the relativelyconstant proportion of phospholipids in the cell mem-branes, and increasing deposition of triglycerides in theadipocytes with increasing intramuscular fat content(Vernon & Flint, 1988). Differences in PUFA contentbetween the LL and SM muscle can be traced to differ-ences in oxidative nature of the muscles. Turkii andCampell (1967) as well as Enser, Hallett, Hewitt, Fur-sey, Wood, and Harington (1998) found higher PUFAcontents in more oxidative muscles, corresponding tothe higher PUFA content in the more oxidative SMmuscle compared to the LL muscle found in this study.Grass-fed ruminants deposit a higher amount of n-3fatty acids in their intramuscular and adipose fat (Enseret al., 1998; French et al., 2000; Marmer, Maxwell, &Williams, 1984; Miller, Masor, & Riley, 1981), whileconcentrate-fed animals normally have higher n-6PUFA. Despite biohydrogenation of unsaturated fattyacids in the rumen, higher n-3 fatty acids in grass fedanimals can be explained by the high C18:3n-3 contentsin grass, while grains are normally high in n-6 fattyacids. Irish and Argentine beef, probably originating, atleast partly, from extensive production based on grass
(silage) feeding displayed higher n-3 fatty acid contentsthan BB and Limousin beef, originating from animalsraised on high concentrate diets. In line with this, thelatter two meat types have a much higher proportion ofn-6 fatty acids. The content of cis-9, trans-11 CLA var-ied between 4 and 9 mg/g fat, depending on its origin, inagreement with other studies (Enser, Scollan, Choi,Kurt, Hallett, & Wood, 1999; French et al., 2000;Shantha, Moody, & Tabeidi, 1997). Higher CLA con-tents (mg/100 g meat) in the Argentine and Irish musclecan be partly explained by the higher fat content ofthese samples, since it is well known that the CLA con-tent of meat is closely related to the total fatty acidcontent (Raes, Balcaen, Claeys, Demeyer, & De Smet,2003). It is also known that meat (Shantha et al., 1997)and milk (Dhiman, Anand, Satter, & Pariza, 1999) fromgrass-fed animals have a higher content of CLA thanconcentrate fed animals. Both these factors, the higherintramuscular fat content and the diet, can explain thehigher CLA content (mg/g fat) of the Argentine andIrish beef.Increasing the muscle n-3 fatty acid content resultedin a lower n-6/n-3 ratio. The values obtained forArgentine and Irish meat are similar to other studiesusing grass-fed animals (Enser et al., 1998; French et al.,2000). For the BB and Limousin beef these results cor-respond to earlier studies using lean beef breeds (DeSmet et al., 2000; Raes et al., 2001) and are much lowerthan the values reported by Enser et al. (1998) for beeffrom concentrate fattened animals with a higher fat
Fig. 2. PCA-plot for flavour analysis. Arg=Argentine beef; BB=Belgian Blue double-muscled beef; Limo=Limousin beef; Irish=Irish beef.
1244 K. Raes et al. /Meat Science 65 (2003) 1237–1246
content. Compared to the nutritional guidelines (Natio-nale Raad voor Voeding, 1996) for the n-6/n-3 ratio tobe 5 or lower, only BB meat was slightly too high. Onthe contrary, the PUFA/SFA ratio was much higher forBB and Limousin beef and approached most closely thenutritional recommendation of 0.7. This is the result ofthe (genetically determined) lower fat level of thesebreeds, resulting in lower SFA and MUFA contents.The analytical flavour analyses corresponded with theresults observed by the taste-panel. Taste-panel evalua-tions indicated the highest flavour intensity for Irish andArgentine meat. Both meat types were situated in thePCA-plot in the region of very potent aroma com-pounds, such as pyrazines, saturated and unsaturatedaldehydes. The members of the taste panel noticed alsothe weaker flavour of Limousin, and especially of BBbeef, which corresponds to their location in the PCA-plot. Again there may be several factors involved inthese differences, e.g. differences in fat content, feeding,sex, slaughter age, ageing time.In roasted products pyrazines, resulting from Mail-lard reaction and Strecker degradation, are importantflavour compounds, associated with the roasty flavour(Mottram, 1985). No differences in the pyrazine contentwere observed between the four beef types, which is inagreement with findings of Elmore, Mottram, Enser,and Wood (1999) showing that the dietary fat sourcehas no effect on the pyrazine volatiles. The higher fla-vour intensity described by the taste-panel for the Irishand Argentine beef is probably linked with higheramounts of lower molecular weight unsaturated alde-hydes. These lower molecular weight unsaturated alde-hydes are derived from fat oxidation, especially fromlong chain PUFA (Mottram & Edwards, 1983). Thesevolatiles have a low threshold value and are thus prob-ably making a major contribution to the higher flavourintensity of the Irish as well as the Argentine beef. Inboth these beef types, the absolute PUFA content wasmuch higher than for the leaner BB and Limousin.The higher amount of lower molecular weight satu-rated, branched and aromatic aldehydes, productsderived from protein degradation, in the Argentine beefis probably due to the longer ageing time and as a con-sequence of more pronounced proteolysis. Beef from BBand Limousin animals showed higher concentrations ofproducts derived from carbohydrates (acetoine, diace-tyl). This may be associated with the more glycolyticnature of the muscles of these breeds and the high-con-centrate feeding that was applied.Among the ketones, considerable amounts of3-hydroxy-2-butanone and diacetyl were detected, thatare known to impart buttery notes to food products.The presence of 2,3-octanedione has been attributed topasture-fed animals by Young, Berdague, Viallon,Rousset-Akrim, and Theriez (1997). Accordingly, in ourstudy this volatile compound was only detected in the
Irish and Argentine beef, representing the more exten-sive production system, and not in the BB and Limousinbeef.The pyrazines, pyrroles, thiazoles and furanes are typi-cal Maillard reaction products contributing to roastedmeat flavour. Also methional and 1-(methylthio)-propaneare potent aroma compounds and originate from sul-phur containing amino acids. The compounds4-methylphenol and 1-octen-3-ol, which impart amushroom odour, have low threshold values. Thehigher content of 4-methylphenol in the Argentine andIrish beef could be due to the more extensive productionsystem for both these beef types. Ha and Lindsay (1991)speculated that higher concentrations of methylphenolscould be encountered in pasture-fed beef, confirming thefindings of Young et al. (1997) for grass and grain fedlambs.
5. Conclusions
Distinct differences in fat content, fatty acid compo-sition and flavour characteristics of beef can be expectedat the retail level, depending on the origin and treatmentof the meat, whereas differences in colour and tender-ness are less evident. Based on a series of objectivemeasurements, beef sources could be well discriminatedin this study.
Acknowledgements
This study was funded by the Ministry of SmallEnterprises, Traders and Agriculture, DirectorateResearch and Development. The authors are gratefulfor the technical assistance of S. Coolsaet, D. Baeyensand B. Lammertyn. Mr. Broeckaert and Mr. Van derWeeen are gratefully acknowledged for their help in themeat supply.
References
Claeys, E., De Smet, S. Balcaen, A., & Demeyer, D. (2000). Analyse
du profil de la mesure de la force de cisaillement. In Compte rendu
des VIIIe journees des sciences du muscle et technologies de la viande
(pp. 237–240), 21–22 November 2000, Paris, France.
Demeyer, D., Raemaekers, M., Rizzo, A., Holck, A., De Smedt, A.,
ten Brink, B., Hagen, B., Montel, C., Zanardi, E., Murbrekk, E.,
Leroy, F., Vandendriessche, F., Lorentsen, K., Venema, K., Sune-
sen, L., Stahnke, L., De Vuyst, L., Talon, R., Chizzolini, R., &
Eerola, S. (2000). Control of bioflavour and safety in fermented
sausages: first results of a European project. Food Research Inter-
national, 33, 171–180.
De Smet, S., Webb, E. C., Claeys, E., Uytterhaegen, L., & Demeyer,
D. I. (2000). Effect of dietary energy and protein levels on fatty acid
composition of intramuscular fat in double-muscled Belgian Blue
bulls. Meat Science, 56, 73–79.
K. Raes et al. /Meat Science 65 (2003) 1237–1246 1245
Dhiman, T. R., Anand, G. R., Satter, L. D., & Pariza, M. W. (1999).
Conjugated linoleic acid content of milk from cows fed different
diets. Journal of Dairy Science, 82, 2146–2156.
Dirinck, P., Van Opstaele, F., & Vandendriessche, F. (1997). Flavour
differences between Northern and Southern European cured hams.
Food Chemistry, 59, 511–521.
Elmore, J. S., Mottram, D. S., Enser, M., & Wood, J. D. (1999). Effect
of the polyunsaturated fatty acid composition of beef muscle on the
profile of aroma volatiles. Journal of Agriculture and Food Chem-
istry, 47, 1619–1625.
Enser, M., Hallett, K. G., Hewitt, B., Fursey, G. A. J., Wood, J. D., &
Harrington, G. (1998). Fatty acid content and composition of UK
beef and lamb muscle in relation to production system and impli-
cations for human nutrition.Meat Science, 49, 329–341.
Enser, M., Scollan, N. D., Choi, N. J., Kurt, E., Hallett, K., & Wood,
J. D. (1999). Effect of dietary lipid on the content of conjugated
linoleic acid (CLA) in beef muscle. Animal Science, 69, 143–146.
Fiems, L. O., Van Hoof, J., Uytterhaegen, L., Boucque, C. H., &
Demeyer, D. I. (1995). Comparative quality of meat from double-
muscled and normal beef cattle. In A. Ouali, D. I. Demeyer, &
F. J. M. Smulders (Eds.), Expression of tissue and regulation of pro-
tein degradation as related to meat quality (pp. 381–393). Utrecht,
The Netherlands: ECCEAMST.
Folch, J., Lees, M., & Stanley, S. G. H. (1957). A simple method for
the isolation and purification of total lipids from animal tissues.
Journal of Biological Chemistry, 226, 497–509.
French, P., Stanton, C., Lawless, F., O’Riordan, E. G., Monahan,
F. J., Caffrey, P. J., & Moloney, A. P. (2000). Fatty acid composi-
tion, including conjugated linoleic acid, of intramuscular fat from
steers offered grass, grass silage or concentrate-based diets. Journal
of Animal Science, 78, 2849–2855.
Ha, J. K., & Lindsay, R. C. (1991). Volatile alkylphenols and thio-
phenols in species-related characterising flavors of red meat. Journal
of Food Science, 56, 1197–1202.
Harris, P. V., & Shorthose, W. R. (1988). Meat texture. In R. A. Lawrie
(Ed.), Developments in meat science-4 (pp. 245–296). London, UK:
Elsevier Applied Science.
Marmer, W. N., Maxwell, R. J., & Williams, J. E. (1984). Effects of
dietary regimen and tissue site on bovine fatty acid profiles. Journal
of Animal Science, 59, 109–121.
Miller, G. J., Masor, M. L., & Riley, M. L. (1981). Intramuscular
lipids and triglyceride structures in range and feedlot steers. Journal
of Food Science, 46, 1333–1335.
Mottram, D. S. (1985). The effect of cooking conditions on the for-
mation of volatile heterocyclic compounds in pork. Journal of the
Science of Food and Agriculture, 36, 377–382.
Mottram, D. S., & Edwards, R. A. (1983). The role of triglycerides
and phospholipids in the aroma of cooked beef. Journal of the
Science of Food and Agriculture, 34, 517–522.
National Raad voor Voeding (1996). Voedingsaanbevelingen voor Bel-
gie. Zevekotestraat 43, B-9830 Sint-Martens-Latem, Belgium: G. De
Backer.
Priolo, A., Micol, D., & Agabriel, J. (2001). Effects of grass feeding
systems on ruminant meat colour and flavour. A review. Animal
Research, 50, 185–200.
Raes, K., De Smet, S., & Demeyer, D. (2001). Effect of double-mus-
cling in Belgian Blue young bulls on the intramuscular fatty acid
composition with emphasis on conjugated linoleic acid and poly-
unsaturated fatty acids. Animal Science, 73, 253–260.
Raes, K., Balcaen, A., Claeys, E., Demeyer, D., & De Smet, S. (2003).
Effect of duration of feeding diets rich in n-3 fatty acids on the fatty
acid composition of Belgian Blue double-muscled young bulls.
Reproduction, Nutrition Development (accepted for publication).
Shantha, N. C., Moody, W. G., & Tabeidi, Z. (1997). Conjugated linoleic
acid concentration in semimembranosus muscle of grass- and grain-fed
and zeranol-implanted beef cattle. Journal ofMuscle Foods, 8, 105–110.
Schmidt, S., & Berger, R. G. (1998). Aroma compounds in fermented
sausages of different origines. Zeitschrift fur Lebensmittel Untersu-
chung Forschung, 31, 559–567.
Turkii, P. R., & Cambell, A. M. (1967). Relation of phospholipids to
other lipid components in two beef muscles. Journal of Food
Science, 32, 151–154.
Vandendriessche, F., Buts, B., Claeys, E., Dendooven, R., & Demeyer,
D. (1984). Sarcomere length measurement by laser diffraction and
light microscopy. In Proceedings 30th European Meeting of Meat
Research Workers (pp. 110–111), Bristol, UK.
Verbeke, W., & Viaene, J. (1999). Beliefs, attitude and behaviour
towards fresh meat consumption in Belgium: empirical evidence
from a consumer survey. Food, Quality and Preference, 10, 437–445.
Vernon, R. G., & Flint, D. F. (1988). Lipid metabolism in farm ani-
mals. Proceedings of the Nutrition Society, 47, 283–287.
Vestergaard, M., Oksbjerg, N., & Henckel, P. (2000). Influence of
feeding intensity, grazing and finishing feeding on muscle fibre char-
acteristics and meat colour of semitendinosus, longissimus dorsi and
supraspinatusmuscles of young bulls.Meat Science, 54, 177–185.
Webb, E. C., De Smet, S., Van Nevel, C., Martens, B., & Demeyer,
D. (1998). Effect of anatomical location on the composition of
fatty acids in double-muscled Belgian Blue cows. Meat Science, 50,
45–53.
Young, O. A., Berdague, J.-L., Viallon, C., Rousset-Akrim, S., &
Theriez, M. (1997). Fat-borne volatiles and sheepmeat odour.Meat
Science, 45, 183–200.
1246 K. Raes et al. /Meat Science 65 (2003) 1237–1246