MEASURING WEALTH GENERATION IN EARLY-STAGE ENTREPRENEURIAL ORGANIZATIONS: AN ALTERNATIVE TO THE...
15
_____________________________________________________________________________________________ Small Business Institute® Research Review, Volume 35, 2008 122 MEASURING WEALTH GENERATION IN EARLY-STAGE ENTREPRENEURIAL ORGANIZATIONS: AN ALTERNATIVE TO THE CAPITAL ASSET PRICING MODEL Robert Fiore, Springfield College Robert Lussier, Springfield College ABSTRACT There is no generally accepted measure of wealth created by new ventures as most early stage firms do not have positive cashflows and discount rates estimate-able with sufficient accuracy as required by the Capital Asset Pricing Model (CAP-M). Through regression analysis of organizational economic value as assessed by 145 CPAs, this research supports using a Validated Nascent Organizational Structure Sequence (VNOSS) model as an improved alternative to CAP-M in establishing the perceived economic value of early-stage entrepreneurial firms. Implications of the results and bearings on further research are discussed. INTRODUCTION Nominally, entrepreneurs start business ventures to generate economic wealth. To adequately study wealth creation, it must first be measured. The Capital Asset Pricing Model (CAP-M) is commonly used to estimate the economic value of assets that produce positive cashflows. Although expected cashflows and expected discount rates can used, there exists serious doubt that a CAP-M evaluation of very new firms is sufficiently accurate because of the margin of error in prospective cashflow estimation and the fact that CAP-M mathematics are extremely sensitive to the accuracy of inputs (Smith & Smith, 2000). More importantly, there is no accepted method to produce an accurate discount rate, as required by CAP-M. Henceforth, the key questions not answered in the literature becomes how can nascent firms be evaluated without using cashflows or discount rates? What are the characteristics of economic growth as these firms grow and in what period are the rates of return on invested capital generally highest? Such questions and answers are pertinent to entrepreneurs, their investors (banks, angels, and venture capitalists), managers, consultants, researchers, and academics interested in new venture wealth creation. This exploratory study examined a Validated Nascent Organizational Structure Sequence (VNOSS) (Fiore & Lussier, 2007), an early-stage organizational structure model for use as an improved alternative to CAP-M in establishing the perceived economic value in entrepreneurial firms. It is hypothesized that the very structure of the organization, and growth in that structure is itself, a possible indicator of firm value. LITERATURE REVIEW Entrepreneurs and financiers want to know their chances of successfully creating wealth, and there is a need for better measures (Lussier & Pfeifer, 2000). Minniti and Bygrave (2001) stated that “Our entrepreneur wishes to maximize the subjective expected discounted value from his choices consistently with his intent” (p. 29). Deeds, DeCarolis and Coombs (1998) stated that, “market value added is a particularly appropriate measure of entrepreneurial performance
-
Upload
springfieldcollege -
Category
Documents
-
view
6 -
download
0
Transcript of MEASURING WEALTH GENERATION IN EARLY-STAGE ENTREPRENEURIAL ORGANIZATIONS: AN ALTERNATIVE TO THE...
_____________________________________________________________________________________________
Small Business Institute® Research Review, Volume 35, 2008
122
MEASURING WEALTH GENERATION IN EARLY-STAGE ENTREPRENEURIAL
ORGANIZATIONS: AN ALTERNATIVE TO THE CAPITAL ASSET PRICING MODEL
Robert Fiore, Springfield College Robert Lussier, Springfield College
ABSTRACT
There is no generally accepted measure of wealth created by new ventures as most early stage firms do not have positive cashflows and discount rates estimate-able with sufficient accuracy as required by the Capital Asset Pricing Model (CAP-M). Through regression analysis of organizational economic value as assessed by 145 CPAs, this research supports using a Validated Nascent Organizational Structure Sequence (VNOSS) model as an improved alternative to CAP-M in establishing the perceived economic value of early-stage entrepreneurial firms. Implications of the results and bearings on further research are discussed. INTRODUCTION Nominally, entrepreneurs start business ventures to generate economic wealth. To adequately study wealth creation, it must first be measured. The Capital Asset Pricing Model (CAP-M) is commonly used to estimate the economic value of assets that produce positive cashflows. Although expected cashflows and expected discount rates can used, there exists serious doubt that a CAP-M evaluation of very new firms is sufficiently accurate because of the margin of error in prospective cashflow estimation and the fact that CAP-M mathematics are extremely sensitive to the accuracy of inputs (Smith & Smith, 2000). More importantly, there is no accepted method to produce an accurate discount rate, as required by CAP-M.
Henceforth, the key questions not answered in the literature becomes how can nascent firms be evaluated without using cashflows or discount rates? What are the characteristics of economic growth as these firms grow and in what period are the rates of return on invested capital generally highest? Such questions and answers are pertinent to entrepreneurs, their investors (banks, angels, and venture capitalists), managers, consultants, researchers, and academics interested in new venture wealth creation.
This exploratory study examined a Validated Nascent Organizational Structure Sequence (VNOSS) (Fiore & Lussier, 2007), an early-stage organizational structure model for use as an improved alternative to CAP-M in establishing the perceived economic value in entrepreneurial firms. It is hypothesized that the very structure of the organization, and growth in that structure is itself, a possible indicator of firm value.
LITERATURE REVIEW
Entrepreneurs and financiers want to know their chances of successfully creating wealth, and there is a need for better measures (Lussier & Pfeifer, 2000). Minniti and Bygrave (2001) stated that “Our entrepreneur wishes to maximize the subjective expected discounted value from his choices consistently with his intent” (p. 29). Deeds, DeCarolis and Coombs (1998) stated that, “market value added is a particularly appropriate measure of entrepreneurial performance

_____________________________________________________________________________________________
Small Business Institute® Research Review, Volume 35, 2008
123
because of its focus on wealth creation, which is the essence of entrepreneurship; the Generally Accepted Accounting Principles (GAAP) are inadequate measures of entrepreneurial effectiveness, as it is apparent that accounting-based measures of performance fail to accurately reflect the amount of shareholder wealth being created by the firm”.
Organization structure is the result (the legacy), and the tool (used to capture or harvest value), of the entrepreneur (an economic agent). Since the purpose of the entrepreneurial process is value creation, the process could be defined and measured in terms of value output, or more accurately, the extent of economic value created. Hence it is proposed that organizational structure is an alternative indicator of value of the firm even if there is not current cashflow. Organizational structure may be a measurable alternative to these predecessor factors (Fiore & Lussier, 2006). Since entrepreneurship is the building of the new organization, important questions arise; what is the best and most appropriate way to conceptualize the construct of economic value and secondly, in what manner can emerging, entrepreneurial economic value be measured?
The Capital Asset Pricing Model (CAP-M) Normally, the economic value of a capital asset can be estimated by the Capital Asset Pricing Model (CAP-M). The CAP-M approach is such that the price (present value) of an economic asset can be derived by the application of a risk adjusted discount rate (k) to expected future cashflows.
Deeds et al. (1998) outlined the use of cashflow for evaluation purposes. The basis for Market Value Added begins with the concept of free cash flow (FCF) first developed by Modigliani and Miller. Since a new entrepreneurial organization is an economic asset, the CAP-M is used to evaluate its worth or value. Key factors required for the assessment of economic value of an organization are forecasts of the expected FCF, the expected growth rate (g) of the FCF, and the appropriate discount rate (k) for the time value and riskiness of those future cashflows.
A critical question now arises as to whether the application of expected future free cashflows, beta coefficients, risk correlation indices, and CAP-M derived discount rate is appropriate for “entrepreneurial” situations? Can the CAP-M be accurately employed before cashflows exist? Since creation of economic value is the objective of the behavior; these are important questions for entrepreneurs, investors, and for speculators. Smith and Smith (2000) summarized the controversy; “Is CAP-M the correct description of the rate of return investors require for waiting and for bearing risk? In particular, is it the correct description of the required rate of return for investing in a new venture?” (p. 249). Similarly, Harper (1993) stated, “Considerable controversy surrounds the choice of the discount rate used to capitalize earnings of cash flows...” (p. 22). Fama (1996) warned, “...with perfect certainty and perfect capital markets, pricing by discounting has an airtight economic story. The market value of a future payoff is its present value calculated using 1-period simple interest rates (e.g., Fama & Miller). In a world of uncertainty, the rigorous justification for estimating values by discounting expected payoffs with CAP-M ... expected 1-period simple returns is fragile” (p. 426). Clearly, there is nothing certain about the “expected returns” of entrepreneurial ventures.
Hence, we agree with the many authors noting that for the emerging or pre-operational firm, the inputs of cashflow and risk-adjusted discount rates are indeterminate and gross estimations. CAP-M is an important tool for economic evaluation but the model was not developed for “high-uncertainty” applications such as new firms. These facts along with

_____________________________________________________________________________________________
Small Business Institute® Research Review, Volume 35, 2008
124
recognition of the sensitivity of the CAP-M evaluation to assumptions and inputs lead to a proposal that the accuracy of any economic evaluation of new firms is doubtful. These conclusions lead to the proposal that an appropriate indicator for economic value may be the structure of the organization itself or the sequence of change in that structure. Hence, this research correlates assessed economic value based on the organizational structure of an emerging organization.
General Findings From The Literature
General findings, based on the literature review, are as follows: 1. An episodic stage model of early organizational development has yet to be fully developed in the
organizational development or entrepreneurship literature. 2. CAP-M may not be the most appropriate analytical tool for the economic evaluation of nascent
organizations. 3. Many authors refer to “take-off” points in a new firm’s early life, implying that one or more
growth stage(s) may produce “unusual” or “disproportionate” amounts of wealth. 4. No known study specifically points to a stage of organizational growth (if any) that signifies
sustainability. 5. No known study has specifically linked the emerging economic value of an organization to its
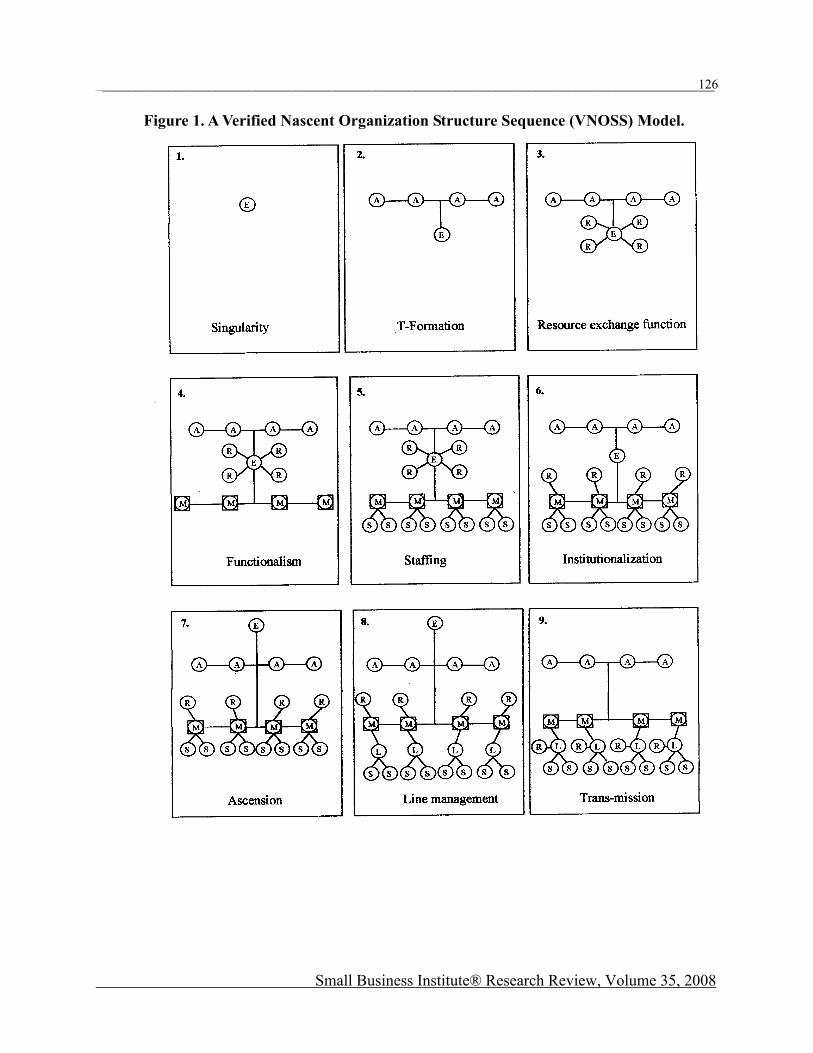
very early or nascent hierarchical organizational development. A Verified Nascent Organizational Structure Sequence (VNOSS) Model A model of entrepreneurial organizational structures was required in order to test the relationship of economic wealth creation on organizational structure. Previous research by Fiore and Lussier (2007) indicated that there are general standard stages of early organizational growth. Their proposed Nascent Organizational Structure Sequence (NOSS) model was statistically tested resulting in a Verified Model. The “Verified” or refined model was termed “VNOSS” after refinement. The VNOSS model is not contributed as the only possible entrepreneurial model, simply one of many possible archetypes. The episodic, early-stage organizational-growth model is forged on a behavioral, resource exchange paradigm, centered on the entrepreneur as a prime economic agent. The model is presented in Figure 1. Below is an explanation of each of the 9 stages in the VNOSS model. 1. The Entrepreneur (E) is in the conceptual or thinking stage about the business. 2. The Entrepreneur seeks (A) Advice and knowledge. A formal or informal Advisory board develops. Since the Entrepreneur usually gains financing approval through board approval, the Entrepreneur is subordinate to them. 3. The Entrepreneur goes into business by exchanging required Resources (R) with the environment. 4. The first Management (M) team is developed, and “departments” or functions are formed, but the Entrepreneur retains the responsibility to obtain required Resources.

_____________________________________________________________________________________________
Small Business Institute® Research Review, Volume 35, 2008
125
5. With further growth, Staff (S) is added. 6. As further growth occurs, the Entrepreneur assigns “resource exchange functions” to the Management team. 7. Based on continued successful growth, the Entrepreneur arises in real power over the Advisory board of directors. 8. As growth continues, additional layers of organization and levels of Line managers (L) are added. 9. The Entrepreneur leaves the firm and the Entrepreneur’s mission is maintained as part of the culture of the firm.
Possible Patterns Of Growth In Economic Value The literature suggests that the change in the economic value of an emerging organization may not be linear as the organization grows. Value may be created “spontaneously” at some point, as the future cashflows become “real” and as belief in the sustainability of the organization becomes manifest.
The questions arise: when does value-creation first occur in organizational formation, and to what extent is the growth in value linear or nonlinear? Disproportionate amounts of value may be created in a short period of time as the organization “coalesces” or first becomes systemized. Early in the literature, Follett (1941) outlined a doctrine of “holistic” or a circular response as the basis for a theory of organizing, implying that the organization becomes a “unity” or entity at some level of complexity. Follett identified processes that become “circular” or “on-going” at some point in a firm’s life. Organization coming into fruition as a “self-creating” coherence. Follett (1941) wrote, “Whether you have [an organization] with all its parts so coordinated, so moving together in their closely knit and adjusting activities, so linking, interlocking, interrelating, that they make a working unit--that is, not a congeries of separate pieces, but what I called a functional whole or integrative unity” (p. 71). Bhide in Sahlman et al. (1999), stated, the failure to attain sustainability matters and an enterprise that is perceived to be self-sustaining can enter a virtuous cycle: expectations of longevity attract customers and other resources that further consolidate its position and open new opportunities. When is the organization first considered “sustainable” as assessed by the market? Attainment of such “sustainability” is a major goal of the entrepreneur. This organizational “unification” is described by Russell (1999): Maruyama has described ‘morphogenetic’ systems whose elements are linked by mutual reinforcing positive feedback loops ... the positive feedback between the norms and participation in the entrepreneurial process itself may create an ‘autocatalytic’ subsystem within an entrepreneurial organization in which new ideas are continuously generated and processed without the necessity of external motivation” (p 79).
_____________________________________________________________________________________________
Small Business Institute® Research Review, Volume 35, 2008
126
Figure 1. A Verified Nascent Organization Structure Sequence (VNOSS) Model.

_____________________________________________________________________________________________
Small Business Institute® Research Review, Volume 35, 2008
127
McMullan and Long (1990) pointed to a “special period” in a venture’s early life: “our idealized entrepreneurial strategy involves a systematic evolution of a venture medium into a living system over time. The end point of the entrepreneurial process is, then, the end of an entrepreneur’s attempts at strategic development--the point at which a venture becomes a living system no longer needing the entrepreneur’s contribution to survive and prosper” (p. 138); “The living system is, by definition, a self-sustaining entity” (p. 138). Issues of time-frame, decay and decline are left undefined. Many other authors point to sustainability or systemization as a particularly valuable
organizational event. It is hypothesized that a “disproportional” amount of an organization’s initial value may be created during a specific period of organizational growth. It is proposed that this critical phase may be identified by a high rate of growth in economic value. Hence, the current study applies curve-linear regressions to test if these patterns exist. Research Questions The following questions have been developed.
1. Using an episodic model of early-stage organization development, what is the perceived economic value based on the existence of the structure itself within a market opportunity?
2. What, if any, stage or growth episode produces extraordinary or disproportionate amount of economic value?
3. What are the typical characteristics of the growth pattern of increasing economic value as a firm grows through early stages?
The present research measured the perceived assessed economic value of new organizations at each stage of a Verified Nascent Organizational Structure Sequence (VNOSS) model development. METHODS
The research design was survey research. Survey research, particularly mail surveys, have been a standard in quantitative research on small business and entrepreneurship (Dennis, 2003). In fact, an examination of important journals (ET&P, ISBJ, JBV, and JSBM) revealed that one-third of the articles were based on mail survey (Newby, Watson, & Woodliff, 2003). The purpose of the Evaluation survey was to determine the economic value the “market” would assign to an organization as it grows in accordance with the VNOSS model, when presented with a fixed economic opportunity.
The Sample and Data Collection A sample of CPAs were chosen as evaluation experts in small or nascent business evaluation because they regularly evaluate the economic worth of businesses for estate, tax, transfer, legal proceedings and other purposes. Hence, they represent a group of market makers, or market proxy, for emerging firms.
CPAs were chosen at random from CPAs practicing in Massachusetts as listed by the Massachusetts Society of Certified Public Accountants. The CPAs were asked to assess the economic value of the organization in various stages of emerging formulation, in accord with the
_____________________________________________________________________________________________
Small Business Institute® Research Review, Volume 35, 2008
128
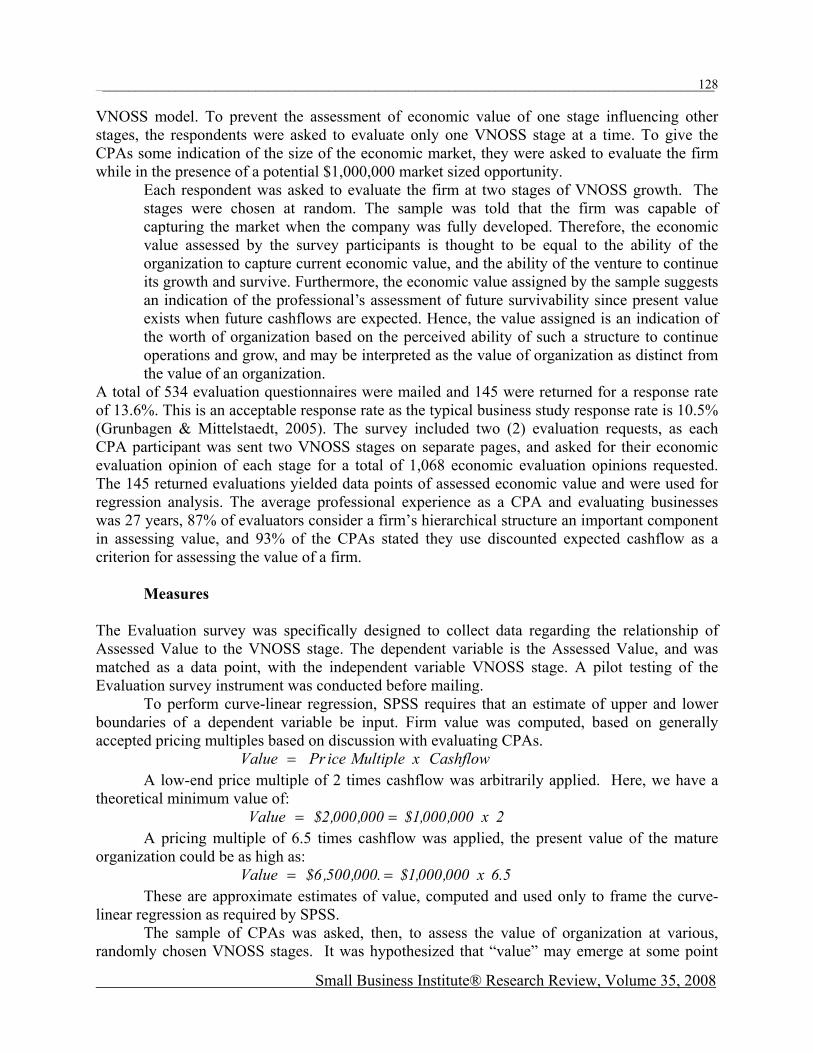
VNOSS model. To prevent the assessment of economic value of one stage influencing other stages, the respondents were asked to evaluate only one VNOSS stage at a time. To give the CPAs some indication of the size of the economic market, they were asked to evaluate the firm while in the presence of a potential $1,000,000 market sized opportunity.
Each respondent was asked to evaluate the firm at two stages of VNOSS growth. The stages were chosen at random. The sample was told that the firm was capable of capturing the market when the company was fully developed. Therefore, the economic value assessed by the survey participants is thought to be equal to the ability of the organization to capture current economic value, and the ability of the venture to continue its growth and survive. Furthermore, the economic value assigned by the sample suggests an indication of the professional’s assessment of future survivability since present value exists when future cashflows are expected. Hence, the value assigned is an indication of the worth of organization based on the perceived ability of such a structure to continue operations and grow, and may be interpreted as the value of organization as distinct from the value of an organization.
A total of 534 evaluation questionnaires were mailed and 145 were returned for a response rate of 13.6%. This is an acceptable response rate as the typical business study response rate is 10.5% (Grunbagen & Mittelstaedt, 2005). The survey included two (2) evaluation requests, as each CPA participant was sent two VNOSS stages on separate pages, and asked for their economic evaluation opinion of each stage for a total of 1,068 economic evaluation opinions requested. The 145 returned evaluations yielded data points of assessed economic value and were used for regression analysis. The average professional experience as a CPA and evaluating businesses was 27 years, 87% of evaluators consider a firm’s hierarchical structure an important component in assessing value, and 93% of the CPAs stated they use discounted expected cashflow as a criterion for assessing the value of a firm.
Measures
The Evaluation survey was specifically designed to collect data regarding the relationship of Assessed Value to the VNOSS stage. The dependent variable is the Assessed Value, and was matched as a data point, with the independent variable VNOSS stage. A pilot testing of the Evaluation survey instrument was conducted before mailing.
To perform curve-linear regression, SPSS requires that an estimate of upper and lower boundaries of a dependent variable be input. Firm value was computed, based on generally accepted pricing multiples based on discussion with evaluating CPAs.
CashflowxMultipleicePrValue = A low-end price multiple of 2 times cashflow was arbitrarily applied. Here, we have a
theoretical minimum value of: 2x000,000,1$000,000,2$Value ==
A pricing multiple of 6.5 times cashflow was applied, the present value of the mature organization could be as high as:
5.6x000,000,1$.000,500,6$Value == These are approximate estimates of value, computed and used only to frame the curve-
linear regression as required by SPSS. The sample of CPAs was asked, then, to assess the value of organization at various,
randomly chosen VNOSS stages. It was hypothesized that “value” may emerge at some point

_____________________________________________________________________________________________
Small Business Institute® Research Review, Volume 35, 2008
129
and grow in a non-linear form, and in particular, in a non-linear “S” form with the lower asymptote near zero and the upper asymptote somewhere between Pricing Multiple derived assessment of between $2,000,000. and $6,500,000. These values were utilized as limiting parameters in the non-linear regression procedures performed within this study. Statistical Analysis One linear and two nonlinear regression procedures (S-curve and cubic) were applied to determine the relationship between the dependent variable Assessed Value at each independent variable VNOSS growth stage and the characteristics of growth in economic value tested the goodness of fit for each model. It was hypothesized that the relationship of Assessed Value and VNOSS stage may not be linear and that the relationship may be described as an “S” curve or some other higher-level curve function. Such curves are not linear in the parameters and therefore may not be transformed into linearity, hence, curvilinear regression must be specifically applied to the data.
The “S” curve is a function having one “inflection point” and two “bends” or differential growth periods. One published general “S” function testable by SPSS, as a nonlinear fitting procedure is the Gompertz expression. The Gompertz function is expressed as follows:
Y A Ce e B X M
= + − − −( )
Where: Y = Assessed Value
X = VNOSS stage A, controls the lower asymptote C, controls the upper asymptote M, controls the time of maximum growth B, controls the growth rate
The Gompertz equation outlined above was rewritten as a model expression for input to SPSS as: Y A C B X M= + − − −*exp( exp( * ( )))
The Gompertz growth function is thought to generally describe an exponential growth situation where limiting factors naturally occur, slowing the rate of growth after an initial high-growth period. This type of growth pattern is seen in biology and economic markets where some natural limit of growth exists (i.e. competition occurs).
The aim of the specific modeling strategy was to determine the impact of the treatment of VNOSS stage on the dependent variable, “Assessed Value” growth as an entrepreneurial organization grows. The data was graphed and visually examined. The F-test for testing linearity of regression was noted. Multicollinearity is not a concern as there is only one independent variable. The R2 for the simple linear regression was noted and the standardized residuals were examined.
Additional polynomial functions were tested and the total variance (adjusted R2) explained by each curvilinear model was noted for determination of improved model specification. Since economic value is the output of the entrepreneurial process, it is proposed that the function of “entrepreneurship” as “creative innovation” has successfully occurred when sustainability has been reached. This definition of entrepreneurship as based on a measurable output would be significant to the investment and venture capital fields where professional investors are searching for new paradigms to assess, identify, and predict emerging value.

_____________________________________________________________________________________________
Small Business Institute® Research Review, Volume 35, 2008
130
It is believed that the assumption of independence for each Assessed Value observation is met, as the respondents did not influence each other. The cases represent a random selection from the population. The 534 sample CPAs were selected at random from the population of approximately 5,500 Massachusetts CPAs. Violation of multicollinearity is not a concern because there is only one independent variable [VNOSS stage]. RESULTS Visual inspection of the scatterplot as presented below in Figure 2, indicated that the relationship might be prescribed by one of the regressions tested. According to the SPSS manual, “For a nonlinear model, the tests for linear models are not appropriate ... the residual mean squares is not an unbiased estimate of the error variance, even if the model is correct ... the F statistic cannot be used for testing hypothesis.” However, the adjusted R2 can be employed to determine the total variance explained by the model. So only the adjusted R2 coefficients can be directly compared. Figure 2. Scatterplot*
*The relationship of an organization’s perceived economic value ($000,000) as assessed by a sample of CPAs based on a Verified Nascent Organization’s Sequence of Structures (VNOSS).

_____________________________________________________________________________________________
Small Business Institute® Research Review, Volume 35, 2008
131
(As N = 145, each point may represent multiple data values). The nonlinear regression module of SPSS was employed to determine the parameters of
the best fitting model of the variables. A linear model was analyzed first for use as a baseline to judge the fit of more complex curvilinear functions. Model expressions for various “S” curves were employed because these models were thought to generally portray the growth of organisms and systems where there is initially slow growth, a period of high growth, and then a subsequent slowing of growth as some capacity constraint begins to take place. It is thought that the economic value of a nascent firm may grow exponentially from a near zero asymptote, exhibit high growth and then experience a slow-down in the rate of growth, due to the ending of the entrepreneurial phase, the introduction of competition, or possibly the capture of the total market opportunity. Linear Regression A linear regression analysis was first conducted to evaluate the fit of Assessed Value to the VNOSS stage variable. The scatterplot of the two variables, as shown in Figure 3, indicates that the two variables could be considered linearly related since, as the VNOSS stage proceeds from stage 1 to stage 9, the overall assessed value increases. The correlation between the Assessed Value and the VNOSS stages was .68, t (143) = 11.32, p = .000 and approximately 47% of the variance of the Assessed Value are accounted for by its linear relationship with the VNOSS stage. The linear regression results are presented in Table 1. Table 1. Linear Regression Results ______________________________________________________________________
Variable B SE B β ______________________________________________________________________
Constant -1.914 0.369 - VNOSS 0.717 0.063 0.687
_____________________________________________________________________
The linear regression equation for predicting the overall Assessed Value regressed on VNOSS stage is:
Assessed Value VNOSS stage= − +1 914 000 717 000, , . , This linear model does not yield a positive value until the third stage [Resource
exchange] of the VNOSS has been achieved. This result is outlined here: AssessedValue = − +1 914 000 717 000 3, , . , ( ) Assessed Value = $237, .000
As hypothesized, the Assessed Value increases as the VNOSS stage increases. The slope of 717,000 suggests that the perceived value of the new organization grows by $717,000 as the organization progresses to the next VNOSS stage. Assuming that the relationship between Assessed Value and the VNOSS stage is prescribed linearly, the predicted values for the first two VNOSS stages would be negative. This finding may indicate that the early “thought”, “conceptual” or “pre-organizational” stages have little or no economic value to the market.
_____________________________________________________________________________________________
Small Business Institute® Research Review, Volume 35, 2008
132
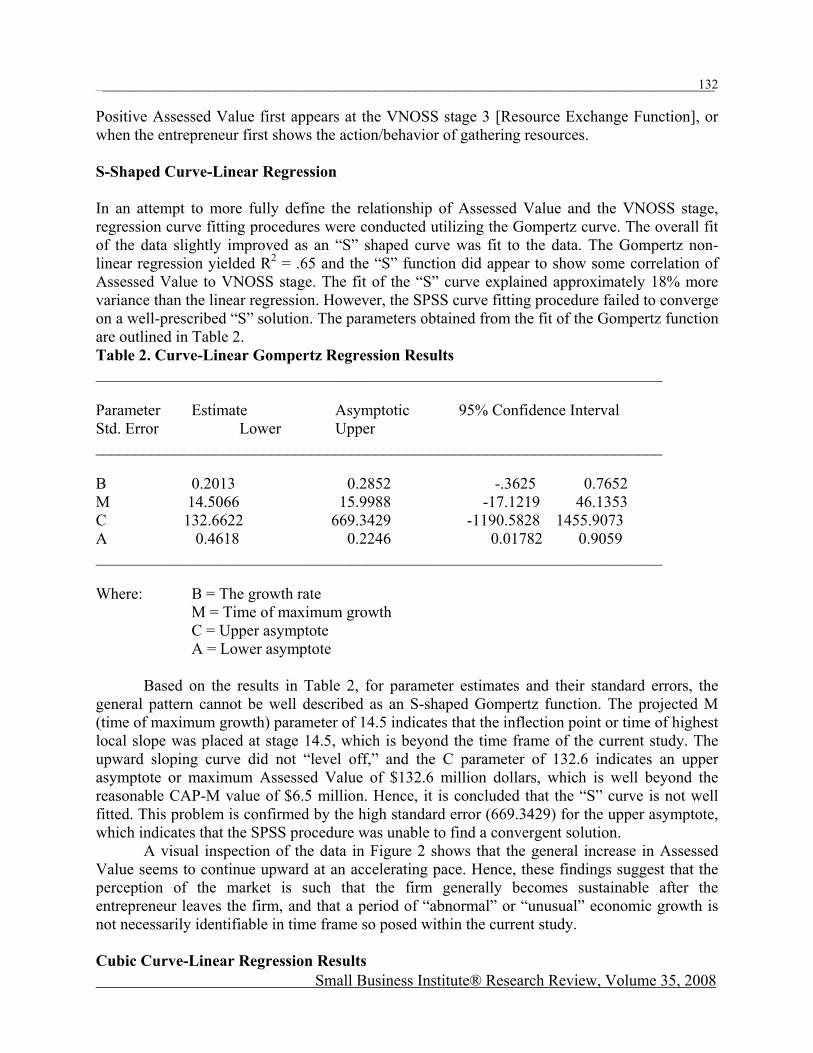
Positive Assessed Value first appears at the VNOSS stage 3 [Resource Exchange Function], or when the entrepreneur first shows the action/behavior of gathering resources. S-Shaped Curve-Linear Regression In an attempt to more fully define the relationship of Assessed Value and the VNOSS stage, regression curve fitting procedures were conducted utilizing the Gompertz curve. The overall fit of the data slightly improved as an “S” shaped curve was fit to the data. The Gompertz non-linear regression yielded R2 = .65 and the “S” function did appear to show some correlation of Assessed Value to VNOSS stage. The fit of the “S” curve explained approximately 18% more variance than the linear regression. However, the SPSS curve fitting procedure failed to converge on a well-prescribed “S” solution. The parameters obtained from the fit of the Gompertz function are outlined in Table 2. Table 2. Curve-Linear Gompertz Regression Results _______________________________________________________________________ Parameter Estimate Asymptotic 95% Confidence Interval Std. Error Lower Upper _______________________________________________________________________ B 0.2013 0.2852 -.3625 0.7652 M 14.5066 15.9988 -17.1219 46.1353 C 132.6622 669.3429 -1190.5828 1455.9073 A 0.4618 0.2246 0.01782 0.9059 _______________________________________________________________________ Where: B = The growth rate
M = Time of maximum growth C = Upper asymptote A = Lower asymptote
Based on the results in Table 2, for parameter estimates and their standard errors, the general pattern cannot be well described as an S-shaped Gompertz function. The projected M (time of maximum growth) parameter of 14.5 indicates that the inflection point or time of highest local slope was placed at stage 14.5, which is beyond the time frame of the current study. The upward sloping curve did not “level off,” and the C parameter of 132.6 indicates an upper asymptote or maximum Assessed Value of $132.6 million dollars, which is well beyond the reasonable CAP-M value of $6.5 million. Hence, it is concluded that the “S” curve is not well fitted. This problem is confirmed by the high standard error (669.3429) for the upper asymptote, which indicates that the SPSS procedure was unable to find a convergent solution.
A visual inspection of the data in Figure 2 shows that the general increase in Assessed Value seems to continue upward at an accelerating pace. Hence, these findings suggest that the perception of the market is such that the firm generally becomes sustainable after the entrepreneur leaves the firm, and that a period of “abnormal” or “unusual” economic growth is not necessarily identifiable in time frame so posed within the current study. Cubic Curve-Linear Regression Results

_____________________________________________________________________________________________
Small Business Institute® Research Review, Volume 35, 2008
133
Use of the curve fitting procedure of SPSS regression analysis outlined a cubic function; a non-linear curve defined by the independent variable with third, second and first power exponents. Cubic functions describe high growth in the dependent variable. While the linear regression provided an R squared of 47%, and the Gompertz function explained 65% of the variance, it was found that the fit of a cubic function would explain 66% of the variance (p = 000). The results of a cubic fit are presented in Table 3. Table 3. Cubic Regression Analysis Results ______________________________________________________________________ Variable B SE B β T Sig T ______________________________________________________________________ Constant -1.8883 0.8389 - -2.251 .0259 VNOSS 2.1013 0.6962 2.0155 3.018 .0030 VNOSS2 -.5539 0.1588 -5.5195 -3.488 .0006
VNOSS3 .04750 0.0104 4.3687 4.529 .0000 ______________________________________________________________________ Each of the variables shows significance. The “cubic” equation found is delineated as follows: Assessed Value VNOSS VNOSS VNOSS= − + − +$1, , $2, , $553, $47,888 300 101 300 900 5002 3
Assuming a cubic function fit, an evaluation of this equation shows that value first “emerges” or becomes non-negative at VNOSS stage 2 [T-Formation] where: Assessed Value = − + − +$1, , $2, , ( ) $553, ( ) $47, ( )888 300 101 300 2 900 2 500 22 3
Assessed Value = $478, .700
As was mentioned, the increase in Assessed Value did not appear to slow or “level off” as the VNOSS stage progressed. This finding may be explained by the “framing” or limitation of the study in imposing a limit in the assessment of value of the organization to when the entrepreneur leaves the firm. It is possible that the growth in value begins to slow after that phase and hence, a slowing of growth period was not included in the data of the current study. A subsequent study encompassing a longer developmental time frame and larger samples may exhibit a slowing of Assessed Value that may better prescribe an “S” function shape. DISCUSSION The method for determining the association of assessed value regressed on VNOSS stage was examined within three regression functions. Linear regression, an S-type curve-linear regression and a cubic type curve-linear were applied to the data. Based on the regression results, the Assessed Value was found to be related to the VNOSS stage of growth.
A curve-linear Gompertz “S” type function was not found to be well specified as the parameter estimates did not converge on reasonably expected values. Based on the failure of the “S” functions to converge on reasonably expected values and stage numbers within the model, the specified “S” shaped curve-linear relationship was not found. A linear correlation (R2 = 47%, p = .000) between the Assessed Value and the VNOSS stage was found. A

_____________________________________________________________________________________________
Small Business Institute® Research Review, Volume 35, 2008
134
“cubic” or third-powered exponential growth function was also detected (R2 = 66%, p = 000) in the relationship between assessed Economic Value and VNOSS stage.
The current study suggests that evaluation experts perceive a change in economic value for episodic stages of development in new organizations in the presence of market opportunities. The results also suggest that the economic value of two early stages VNOSS 1 [singularity] and VNOSS 2 [T-formation] are nil or low. The firm whose entrepreneur IS in the “thought, discussion,” or “advising” stage of development has little identifiable economic value.
The results also suggest that evaluation experts first attribute value to an entrepreneurial organization when the entrepreneur has begun the advising [T-Formation, VNOSS 2] stage or resource acquisition [VNOSS 3] stage, depending on the assumption of a cubic or linear function. The firm’s economic Assessed Value seems to grow substantially as the entrepreneur advances the company beyond these stages to multiples of about 4 to 7 times free cashflow.
An “S” curve function was also tested, and the regression fit of a Gompertz “S” curve function did not converge on reasonably expected parameters. Hence, it is suggested, then that any “disproportional” wealth creation rate, may be beyond the timeframe of the current study and may occur beyond the time when the entrepreneur leaves the firm, which was defined as Stage 9 [Trans-mission] of the VNOSS model.
A cubic or exponential growth function did fit the data well (R2 = 66%) and provided a significant result (F= 89.83, p. = .000) indicating that the value of the firm increases at an increasing rate and becomes positive at the second VNOSS stage [Resource Exchange] of growth. IMPLICATIONS Earlier research (Fiore & Lussier, 2007) suggested that episodic growth stages of development (the VNOSS model) may exist for emerging organizations. All stages of growth beyond the first VNOSS stage (the phase where the entrepreneur is simply formulating conceptual plans) exhibited increasing perceived economic value according to a sample of CPAs.
The existence of any “disproportionate” growth in perceived economic value was not located by the presence of any “local maximum slope” or inflection point in an “S” curve. It is suggested that any “high economic growth” period may be beyond the timeframe as accessed in the current study. This may indicate that evaluators perceive that the firm has substantial value-growth potential beyond the stage where the originating entrepreneur leaves the firm.
Evidence was found that the economic value of the firm grows exponentially in a cubic manner, and that the growth in economic value may level off or slows after the time frame of this study. Although a linear increase in assessed Economic Value verses VNOSS stage growth was detected in the data, an “S” or non-linear function did not fit the data well. A “cubic” relationship was found to significantly describe the relationship of Assessed Value and VNOSS stage.
The authors acknowledge that the current research is exploratory in nature and that further work in experimental refinement needs to be accomplished. It is suggested that future research be conducted using a longitudinal structured interview analysis. Episodic hierarchical development should be noted as unbiased observation by a person other than the entrepreneur. Research initiatives should be based on a broader scale and with a greater sample size and targeted to a more diverse sample group. This study should also be applied to low-growth and medium-growth organizations. This type of study could also be applied across nations to detect possible differentiation of episodic growth patterns per nation, possibly based on cultural or economic differences. A study conducted by industry may yield additional insights. Further empirical identification of episodic stages in organizational growth needs to be accomplished.
Verification of commonly occuring episodic stages of growth may help entrepreneurs track their growth progress, and assist investors in maximizing capital allocation and returns, increase entrepreneurial success rates and provide growth guidelines. These improvements would

_____________________________________________________________________________________________
Small Business Institute® Research Review, Volume 35, 2008
135
reduce wasteful bankruptcies and failures. Clearly there are classes of entrepreneurial endeavors with varying degrees of intensities
and potential return. It would be beneficial to the entrepreneur to have organizational development goals and plans in mind to lead the organization towards increased value-creation and ultimately harvest. The present study suggests that the episodic VNOSS growth model may serve as a set of important milestones to leaders, evaluators or owners of such organizations.
It is recommended that investors who are searching for high rates of return consider identifying target firms that are rapidly developing along an episodic sequence of organizational structure. Assessing the potential of organizational structure growing, and the velocity of change in that structure, in the presence of a substantial market opportunity, may yield an effective investment strategy. Such an evaluation methodology may be superior to the use of multiples applied to historical cashflows when evaluating emerging entrepreneurial ventures. REFERENCES Baril, C. P., Marshall, S. B., & Sartelle, R. F. (1997). Economic value added and small
businesses. Journal of Small Business Strategy, 8(2), 67-79. Damodaran, A. (Ed.). (1994). Damodaran on valuation. New York: John Wiley & Sons, Inc. Deeds, D. L., DeCarolis, D., & Coombs, J. E. (1998). Firm-specific resources and wealth
creation in high-technology ventures: Evidence from newly public biotechnology firms. Entrepreneurship: Theory and Practice, 22(3), 55-56.
Dennis, W.J. (2003). Raising response rates in mail surveys of small business owners: results of an experiment,” Journal of Small Business Management 41(3), 278-295. Fama, E. F. (1996). Discounting under uncertainty. Journal of Business, 69(4), 415-428. Fiore, R. A. & Lussier, R. N. (2007). The development and statistical testing of a nascent
organizational structure sequence model,” Journal of Small Business Strategy, 18(1), 17-33. Fiore, R. A. & Lussier, R. N. (2006). The development and statistical testing of a nascent
organizational structure sequence model,” USASBE/SBI Joint Conference Proceedings, CD. Follett, M. P. (1941). Dynamic administration, The collected papers of Mary Parker Follett.
(H.C. Metcalf & Urwick, Eds.). New York: Harper Row. Grunbagen, M. and Mittelstaedt, R.A. (2005). Entrepreneurs or investors: Do multi-unit franchisees have different philosophical orientations?” Journal of Small Business Management 43(3), 207-225. Harper, C. P. (1993). Accuracy of appraisers and appraisal methods of closely held companies.
Entrepreneurship: Theory and Practice, 17(3), 21-34. Lussier, R. N. & Pfeifer, S. (2000). A comparison of business success versus failure variables
between U.S. and Central Eastern Europe Croatian Entrepreneurs, Entrepreneurship Theory and Practice 24(4), 59-67.
McMullan, W. E., & Long, W. A. (1990). Developing new ventures. San Diego: Harcourt Brace Jovanovich, Inc.
Minniti, M., & Bygrave, W. (2001). A dynamic model of entrepreneurial learning. Entrepreneurship: Theory and Practice, 25(3), 5-16.
Newby, R., Watson, J. & Woodliff, D. (2003). SME survey methodology: Response rates, data quality, and cost effectiveness,” Entrepreneurship Theory and Practice 27(2), 163-172. Russell, R. (1999). Developing a process model of intrapreneurial systems: A cognitive mapping
approach. Entrepreneurship: Theory and Practice, 23(3), 65-93. Sahlman, W. A., Stevenson, H. H., Roberts, M. J., & Bhide, A. (1999). The entrepreneurial
venture (2nd ed.). Boston: Harvard Business School.

_____________________________________________________________________________________________
Small Business Institute® Research Review, Volume 35, 2008
136
Schilit, W. K. (Ed.). (1991). Dream makers and deal breakers. Englewood Cliffs, NJ: Prentice Hall.
Smith, R. L., & Smith, J. K. (2000). Entrepreneurial finance. New York: John Wiley & Sons, Inc.
Timmons, J. A. (2005). New venture creation (7th ed.). Boston: Irwin McGraw-Hill.