Measuring variation in iron smelting slags: an empirical evaluation of group-identification...
10
421 Introduction Slag is unquestionably one of the most important artefacts encountered by researchers of extinct iron production technologies. Slag provides a fossilised thermochemical history of operations within a single iron production cycle and varies according to differences in furnace design, furnace operation, resource usage, and production stages. Since this same information is often missing or incomplete in the metal itself, the analysis of slag morphology, microstructure, and chemistry are essential for the effective modelling of extinct ironmaking systems (see Bachmann, 1982). Slag inclusion chemistry, in particular, is becoming increasingly recognised for its potential to source objects made of bloomery iron to the region or site where the metal was extracted (e.g., Buchwald and Wivel, 1998; Coustures, et al., 2003, 2006; Dillmann and L’Héritier, 2007; Blakelock, et al., 2009; Desaulty, et al., 2009; Leroy, et al., 2011). Most problems in the archaeology of iron production require that the variation in slag characteristics be measured in some meaningful way. The necessary starting point for this procedure is the construction of nominal scale classifications and/or groups of slag based on morphological, microstructural, or chemical attributes. The identification and description of chemical clusters is typically based on ratio scale measures of oxide and trace element concentrations, while morphological and microstructural groups are more often generated by nominal scale measures of formal attributes. Ordinal and ratio scale measures of slag morphology and microstructure are also possible but rarely used (e.g., Gordon, 1997). Once such units are constructed, be they classes or empirical groupings, other measures of variation may be employed to quantify the attributes of their members (by calculating standard deviations, coefficients of variation, etc.) or compare groups (by conducting t-tests, analysis of variance, linear discriminant analysis, etc.). The particular attributes used to define or identify classes or groups may be chosen for their perceived relevance to theoretical or descriptive purposes. The distinction between classes and groups is subtle, yet significant. Following definitions given by Dunnell (1971) and O’Brien and Lyman (2000), a class is an ideational unit with an explicitly defined set of attributes and attribute states that are necessary and sufficient for empirical specimens to be considered representative of that class. Because classes are not empirical units, they have distributed representation across space and time. This property makes them well-suited to measuring nominal scale variation, and applicable to a wide range of theoretically derived models. Groups, in contrast, are empirical collections of things that display similarity as a consequence of class membership or some measurement, such as an oxide weight percent or oxide ratio. Their definitions are fluid, determined solely by the presence of an empirical sample and changing with the addition and subtraction of new specimens. Groups have specific locations in space and time and are unreliable measures of nominal scale variation. This is not to say that non-classificatory techniques designed to identify groups within empirical samples are not without value. They have an important role to play in recognising patterned differences between empirical samples, such as iron production systems from different times and places. They describe, but cannot explain the existence of the observed patterns. Measuring variation in iron smelting slags: an empirical evaluation of group-identification procedures Michael F. Charlton, Peter Crew, Thilo Rehren, and Stephen J. Shennan ABSTRACT: The chemistry of ironworking slag exhibits high levels of spatiotemporally distributed variation because of differences in available resources, technological traditions, and post-depositional processes. Archaeometallurgists have devised numerous classificatory and grouping methods to break up this variation into meaningful units for investigating technological and archaeological questions. As the discipline matures, it is appropriate to ask whether or not the unit construction techniques in use are adequate for their respective tasks. This paper reviews the common practices for creating groups and classes from slag chemistry, paying special attention to their application in different research contexts. Methods are compared and evaluated against experimental ironworking slag and published data from sites in Europe. Results indicate that most of the units used to measure variation in slag chemistry perform reasonably well. However, multivariate analytical strategies generally make the most efficient use of the available data relative to the time spent analysing it. Keywords: Slag chemistry, systematics, oxide ratios, multivariate statistics. In: The World of Iron (J. Humphris and Th. Rehren, eds.), 421-430
Transcript of Measuring variation in iron smelting slags: an empirical evaluation of group-identification...
M e a s u r i n g va r i at i o n i n i r o n s M e lt i n g s l ag s
421
Introduction
Slag is unquestionably one of the most important artefacts encountered by researchers of extinct iron production technologies. Slag provides a fossilised thermochemical history of operations within a single iron production cycle and varies according to differences in furnace design, furnace operation, resource usage, and production stages. Since this same information is often missing or incomplete in the metal itself, the analysis of slag morphology, microstructure, and chemistry are essential for the effective modelling of extinct ironmaking systems (see Bachmann, 1982). Slag inclusion chemistry, in particular, is becoming increasingly recognised for its potential to source objects made of bloomery iron to the region or site where the metal was extracted (e.g., Buchwald and Wivel, 1998; Coustures, et al., 2003, 2006; Dillmann and L’Héritier, 2007; Blakelock, et al., 2009; Desaulty, et al., 2009; Leroy, et al., 2011).
Most problems in the archaeology of iron production require that the variation in slag characteristics be measured in some meaningful way. The necessary starting point for this procedure is the construction of nominal scale classifications and/or groups of slag based on morphological, microstructural, or chemical attributes. The identification and description of chemical clusters is typically based on ratio scale measures of oxide and trace element concentrations, while morphological and microstructural groups are more often generated by nominal scale measures of formal attributes. Ordinal and ratio scale measures of slag morphology and microstructure are also possible but rarely used (e.g., Gordon, 1997). Once such units are constructed, be they classes or empirical
groupings, other measures of variation may be employed to quantify the attributes of their members (by calculating standard deviations, coefficients of variation, etc.) or compare groups (by conducting t-tests, analysis of variance, linear discriminant analysis, etc.). The particular attributes used to define or identify classes or groups may be chosen for their perceived relevance to theoretical or descriptive purposes.
The distinction between classes and groups is subtle, yet significant. Following definitions given by Dunnell (1971) and O’Brien and Lyman (2000), a class is an ideational unit with an explicitly defined set of attributes and attribute states that are necessary and sufficient for empirical specimens to be considered representative of that class. Because classes are not empirical units, they have distributed representation across space and time. This property makes them well-suited to measuring nominal scale variation, and applicable to a wide range of theoretically derived models. Groups, in contrast, are empirical collections of things that display similarity as a consequence of class membership or some measurement, such as an oxide weight percent or oxide ratio. Their definitions are fluid, determined solely by the presence of an empirical sample and changing with the addition and subtraction of new specimens. Groups have specific locations in space and time and are unreliable measures of nominal scale variation. This is not to say that non-classificatory techniques designed to identify groups within empirical samples are not without value. They have an important role to play in recognising patterned differences between empirical samples, such as iron production systems from different times and places. They describe, but cannot explain the existence of the observed patterns.
Measuring variation in iron smelting slags: an empirical evaluation of group-identification proceduresMichael F. Charlton, Peter Crew, Thilo Rehren, and Stephen J. Shennan
ABSTRACT: The chemistry of ironworking slag exhibits high levels of spatiotemporally distributed variation because of differences in available resources, technological traditions, and post-depositional processes. Archaeometallurgists have devised numerous classificatory and grouping methods to break up this variation into meaningful units for investigating technological and archaeological questions. As the discipline matures, it is appropriate to ask whether or not the unit construction techniques in use are adequate for their respective tasks. This paper reviews the common practices for creating groups and classes from slag chemistry, paying special attention to their application in different research contexts. Methods are compared and evaluated against experimental ironworking slag and published data from sites in Europe. Results indicate that most of the units used to measure variation in slag chemistry perform reasonably well. However, multivariate analytical strategies generally make the most efficient use of the available data relative to the time spent analysing it.
Keywords: Slag chemistry, systematics, oxide ratios, multivariate statistics.
In: The World of Iron (J. Humphris and Th. Rehren, eds.), 421-430
M i c h a e l F. c h a r lto n , P e t e r c r e w, t h i lo r e h r e n , a n d S t e P h e n J . S h e n n a n
422
This paper reviews the methods used by archaeometallurgists to describe and group bloomery iron production slag with respect to their investigative goals. Those methods intended to have analytical significance are evaluated across multiple data sets in order to assess their ability to discern meaningful variation in slag. While not discounting the importance of morphology and microstructure, this paper focuses strictly on groups and classes constructed from ratio scale chemical attributes.
The chemical systematics of bloomery slag
Archaeometallurgists study iron production slag for two main reasons: 1) to investigate and explain engineering processes; and 2) to investigate and explain technological variation and diversity. Both lines of inquiry require systematics, or procedures for classifying and grouping observed phenomena. Assuming that iron production slag can be safely distinguished from slag derived from other processes (see Bachmann, 1982; Tylecote, 1987), it must be categorised according to its particular technological origins (i.e., bloomery furnace, blast furnace, puddling hearth, finery, smithy, or subcategories thereof ). The chemical systematics for identifying such groups is not well developed, and grouping generally relies on the weight of interferences drawn from morphological, microstructural and contextual analysis (but see Gordon, 1997). The chemical systematics for slag derived from bloomery systems, while more mature, still lacks robust definitions.
When confronted with an assemblage of bloomery iron production residues obtained from a single context, the starting assumption must be that it represents a relatively synchronous deposit of material stemming from a solitary ironmaking system. The validity of this assumption ultimately rests on associated chronological indicators and stratigraphic coherency. Variation within the assemblage is caused by: 1) biases imposed on slag derived from different stages of production; 2) the heterogeneous character of slag derived from single production cycles; 3) more or less random differences between production cycles; and 4) the use of multiple production recipes during assemblage accumulation. Slag from different stages of production (smelting and smithing at its most general level) is often distinguished on the basis of morphological criteria alone (Serneels and Perret, 2003). For cases where smithing and smelting slag morphologies grade into one another, the two may be discriminated chemically. Charlton (2007, pp.127-132) provides a model for discriminating smelting from smithing slag based on the latter’s chemical tendency to be enriched in fuel ash and ceramic based oxides, but further elaboration is beyond the scope of this paper. It is hereafter assumed that specimens of smelting and smithing slag have been successfully allocated into distinct groups.
All smelting slag from a bloomery system is derived from the chemistry of its parent materials and will follow the general formula:
Cslag = C [(O-RFeO) + A + L + F– V] Formula 1
where C is oxide composition; and the weight percent contributions to composition by ore, reduced oxides, fuel ash, furnace lining, flux, and volatile elements are expressed as O, R, A, L, F, and V, respectively. The bulk chemistry of slag derived from a single unchanging recipe is expected to swarm around a mean. Variation around the mean represents sampling errors across heterogeneous specimens and random differences between smelts. The bulk chemistry of slag from different recipes should cluster such that the variation between recipes is greater than the variation within them.
The presence of multiple compositional groups in a slag sample derived from multiple phases, sites or regions may indicate the use of different mineral resources and fuels (Buchwald and Wivel, 1998), furnace design and operating parameters (Humphris, et al., 2009), and change over time (Charlton, 2007, 2009; Charlton, et al., 2010). Interpretations for the groups will vary from case to case as a consequence of their multivariate structure and, most importantly, the method of analysis. As Bishop and Neff (1989) note, techniques of statistical data analysis are both structure-revealing and structuring. The interpretative value of an analysis depends heavily on well-reasoned assumptions about the underlying structure of the data and an informed choice of technique for revealing it. Several analytical techniques have been used to identify groups within samples of bloomery smelting slag, including ternary diagrams, bivariate plots and histograms of oxides and oxide ratios, and multivariate statistics. These techniques are described and compared below.
Ternary diagrams
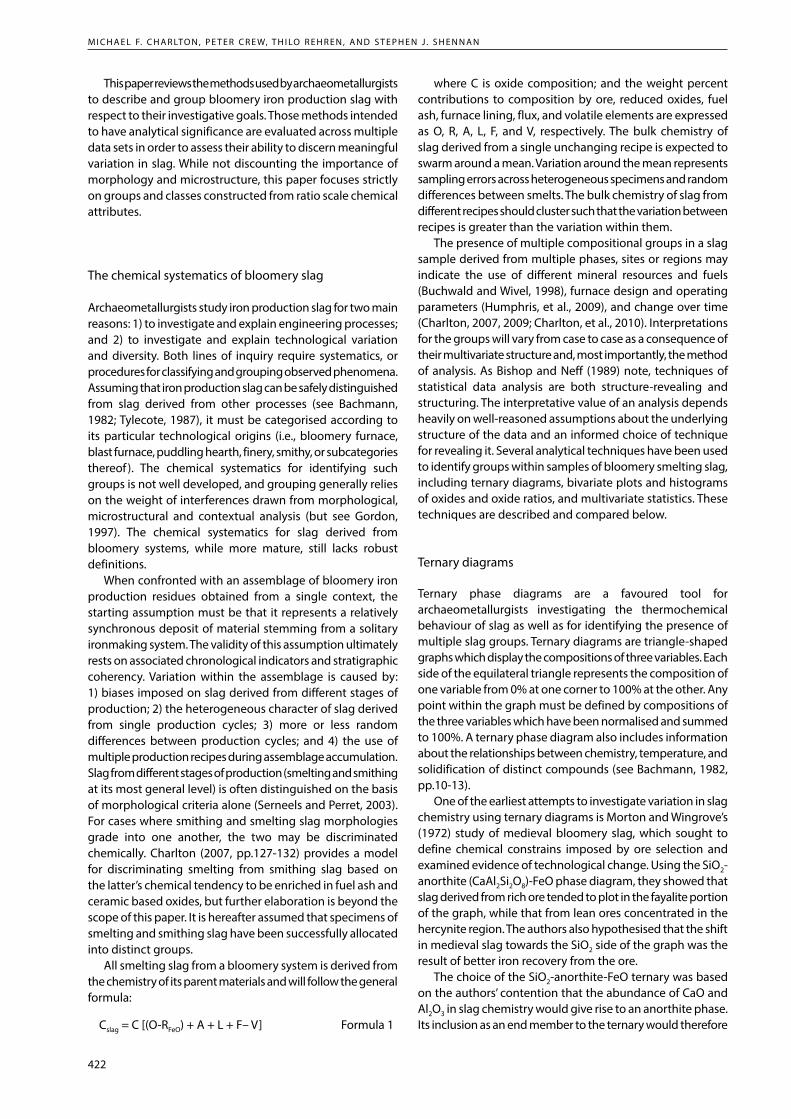
Ternary phase diagrams are a favoured tool for archaeometallurgists investigating the thermochemical behaviour of slag as well as for identifying the presence of multiple slag groups. Ternary diagrams are triangle-shaped graphs which display the compositions of three variables. Each side of the equilateral triangle represents the composition of one variable from 0% at one corner to 100% at the other. Any point within the graph must be defined by compositions of the three variables which have been normalised and summed to 100%. A ternary phase diagram also includes information about the relationships between chemistry, temperature, and solidification of distinct compounds (see Bachmann, 1982, pp.10-13).
One of the earliest attempts to investigate variation in slag chemistry using ternary diagrams is Morton and Wingrove’s (1972) study of medieval bloomery slag, which sought to define chemical constrains imposed by ore selection and examined evidence of technological change. Using the SiO2-anorthite (CaAl2Si2O8)-FeO phase diagram, they showed that slag derived from rich ore tended to plot in the fayalite portion of the graph, while that from lean ores concentrated in the hercynite region. The authors also hypothesised that the shift in medieval slag towards the SiO2 side of the graph was the result of better iron recovery from the ore.
The choice of the SiO2-anorthite-FeO ternary was based on the authors’ contention that the abundance of CaO and Al2O3 in slag chemistry would give rise to an anorthite phase. Its inclusion as an end member to the ternary would therefore
M e a s u r i n g va r i at i o n i n i r o n s M e lt i n g s l ag s
423
be more accurate for determining slag physical properties and representing slag in chemical space. Fells (1983) found that the SiO2-anorthite-FeO ternary was a valid means of representing slag chemistry, but not effective for predicting physical properties or mineralogy. Indeed, as a means of demonstrating diversity in slag samples (for either technological or resource differences), it often performs no better than the more standard FeO-SiO2-Al2O3 ternary. Fig. 1 shows the same separation between the slag groups graphed in Morton and Wingrove’s (1969, 1972) SiO2-anorthite-FeO ternary graphs using the FeO-SiO2-Al2O3 ternary system. Serneel’s (1993) data for slag from western Switzerland and Charlton’s (2007) data for slag from northwest Wales also show clear differences in groups belonging to different techno-cultures and regions when projected into FeO-SiO2-Al2O3 ternary diagrams.
Plots of oxides and oxide ratios
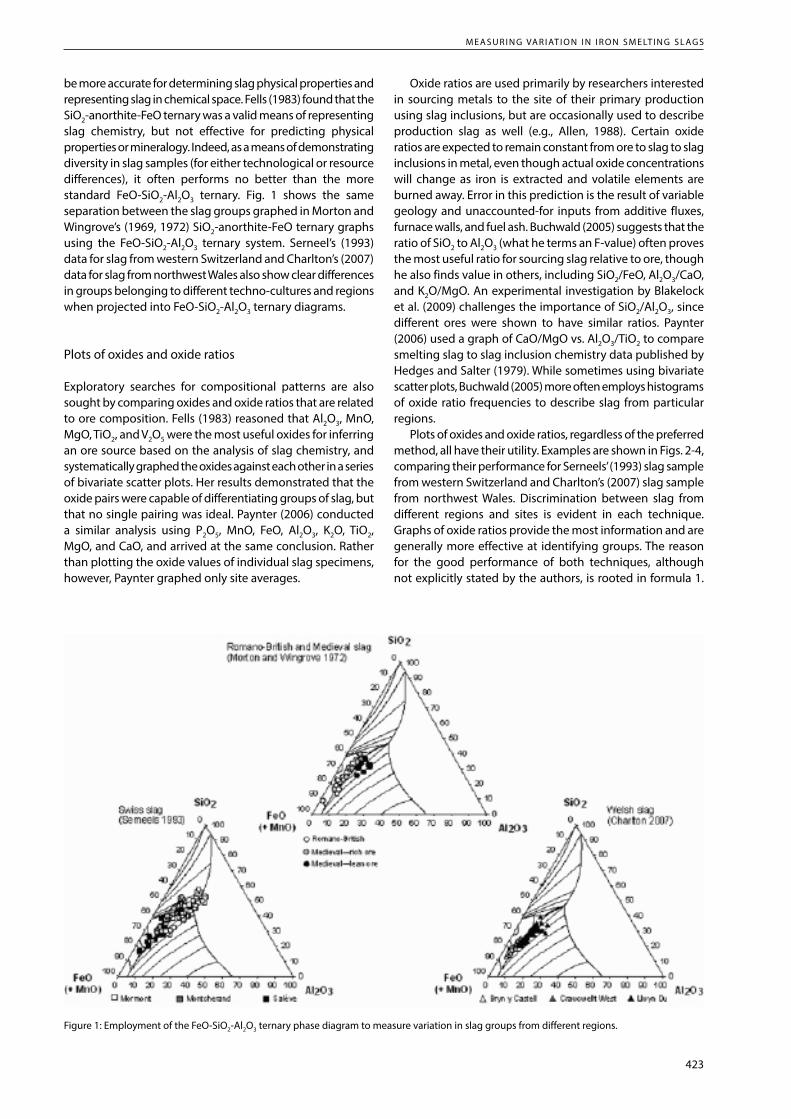
Exploratory searches for compositional patterns are also sought by comparing oxides and oxide ratios that are related to ore composition. Fells (1983) reasoned that Al2O3, MnO, MgO, TiO2, and V2O5 were the most useful oxides for inferring an ore source based on the analysis of slag chemistry, and systematically graphed the oxides against each other in a series of bivariate scatter plots. Her results demonstrated that the oxide pairs were capable of differentiating groups of slag, but that no single pairing was ideal. Paynter (2006) conducted a similar analysis using P2O5, MnO, FeO, Al2O3, K2O, TiO2, MgO, and CaO, and arrived at the same conclusion. Rather than plotting the oxide values of individual slag specimens, however, Paynter graphed only site averages.
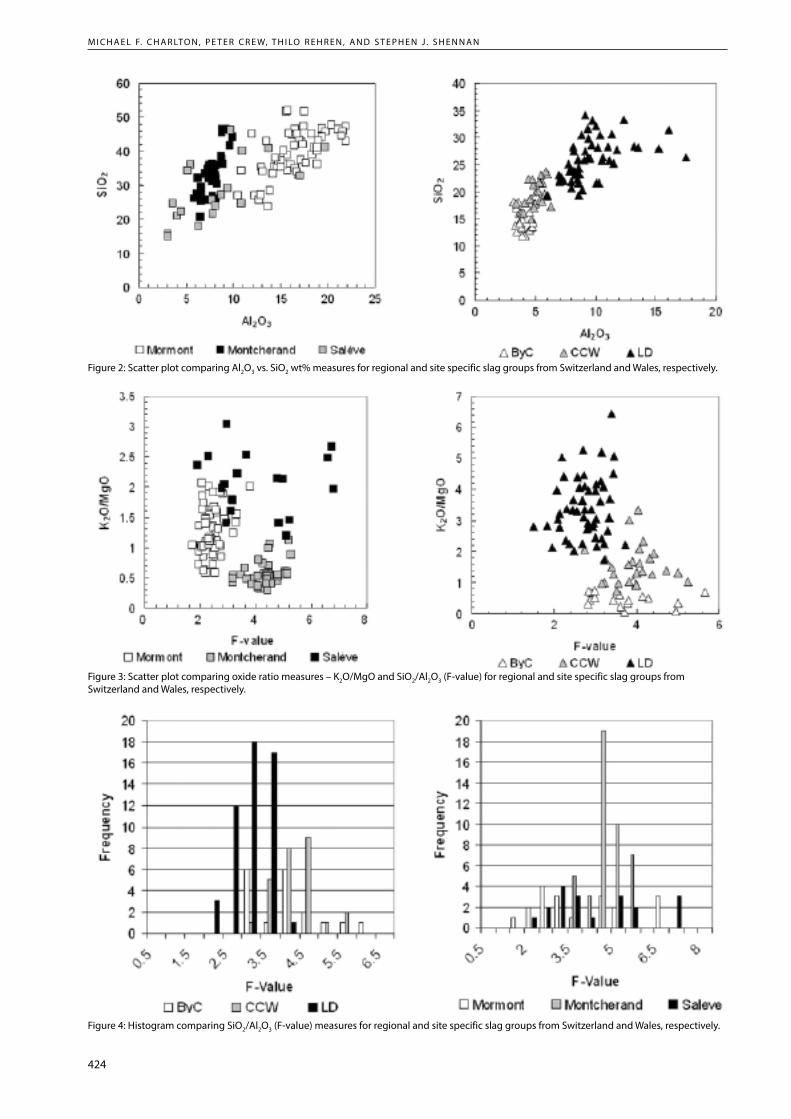
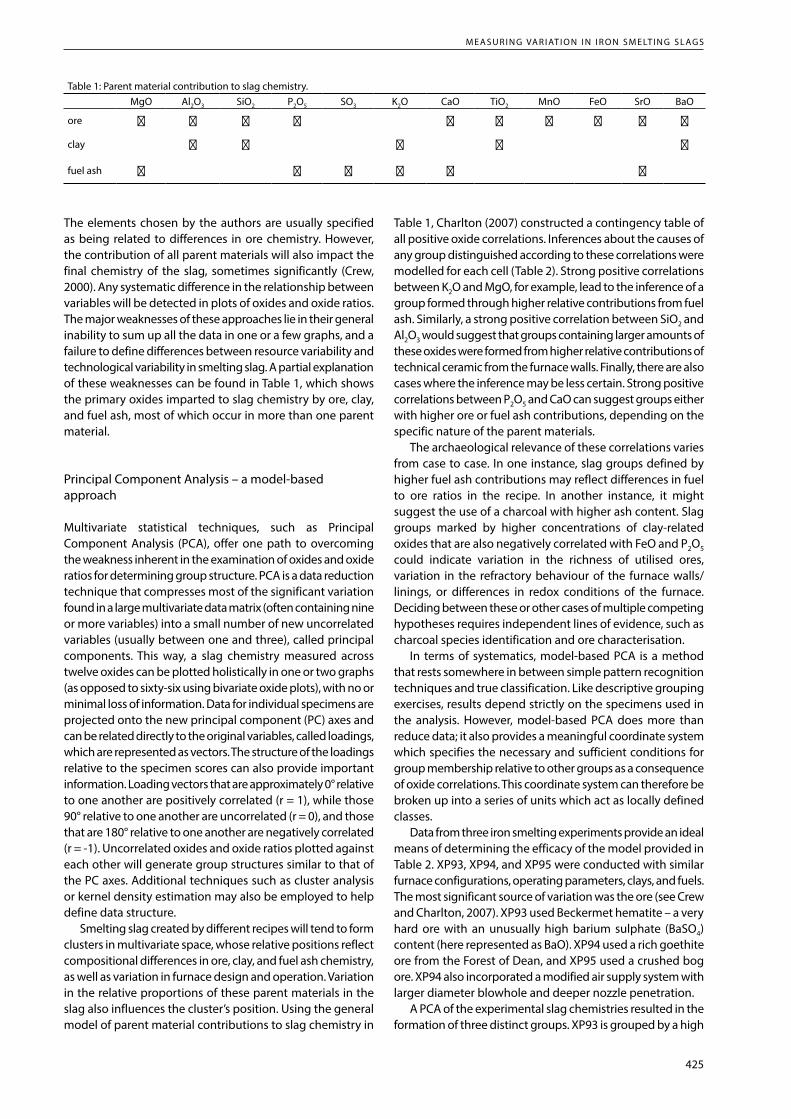
Oxide ratios are used primarily by researchers interested in sourcing metals to the site of their primary production using slag inclusions, but are occasionally used to describe production slag as well (e.g., Allen, 1988). Certain oxide ratios are expected to remain constant from ore to slag to slag inclusions in metal, even though actual oxide concentrations will change as iron is extracted and volatile elements are burned away. Error in this prediction is the result of variable geology and unaccounted-for inputs from additive fluxes, furnace walls, and fuel ash. Buchwald (2005) suggests that the ratio of SiO2 to Al2O3 (what he terms an F-value) often proves the most useful ratio for sourcing slag relative to ore, though he also finds value in others, including SiO2/FeO, Al2O3/CaO, and K2O/MgO. An experimental investigation by Blakelock et al. (2009) challenges the importance of SiO2/Al2O3, since different ores were shown to have similar ratios. Paynter (2006) used a graph of CaO/MgO vs. Al2O3/TiO2 to compare smelting slag to slag inclusion chemistry data published by Hedges and Salter (1979). While sometimes using bivariate scatter plots, Buchwald (2005) more often employs histograms of oxide ratio frequencies to describe slag from particular regions.
Plots of oxides and oxide ratios, regardless of the preferred method, all have their utility. Examples are shown in Figs. 2-4, comparing their performance for Serneels’ (1993) slag sample from western Switzerland and Charlton’s (2007) slag sample from northwest Wales. Discrimination between slag from different regions and sites is evident in each technique. Graphs of oxide ratios provide the most information and are generally more effective at identifying groups. The reason for the good performance of both techniques, although not explicitly stated by the authors, is rooted in formula 1.
Figure 1: Employment of the FeO-SiO2-Al2O3 ternary phase diagram to measure variation in slag groups from different regions.
M i c h a e l F. c h a r lto n , P e t e r c r e w, t h i lo r e h r e n , a n d S t e P h e n J . S h e n n a n
424
Figure 4: Histogram comparing SiO2/Al2O3 (F-value) measures for regional and site specific slag groups from Switzerland and Wales, respectively.
Figure 2: Scatter plot comparing Al2O3 vs. SiO2 wt% measures for regional and site specific slag groups from Switzerland and Wales, respectively.
Figure 3: Scatter plot comparing oxide ratio measures – K2O/MgO and SiO2/Al2O3 (F-value) for regional and site specific slag groups from Switzerland and Wales, respectively.
M e a s u r i n g va r i at i o n i n i r o n s M e lt i n g s l ag s
425
The elements chosen by the authors are usually specified as being related to differences in ore chemistry. However, the contribution of all parent materials will also impact the final chemistry of the slag, sometimes significantly (Crew, 2000). Any systematic difference in the relationship between variables will be detected in plots of oxides and oxide ratios. The major weaknesses of these approaches lie in their general inability to sum up all the data in one or a few graphs, and a failure to define differences between resource variability and technological variability in smelting slag. A partial explanation of these weaknesses can be found in Table 1, which shows the primary oxides imparted to slag chemistry by ore, clay, and fuel ash, most of which occur in more than one parent material.
Principal Component Analysis – a model-based approach
Multivariate statistical techniques, such as Principal Component Analysis (PCA), offer one path to overcoming the weakness inherent in the examination of oxides and oxide ratios for determining group structure. PCA is a data reduction technique that compresses most of the significant variation found in a large multivariate data matrix (often containing nine or more variables) into a small number of new uncorrelated variables (usually between one and three), called principal components. This way, a slag chemistry measured across twelve oxides can be plotted holistically in one or two graphs (as opposed to sixty-six using bivariate oxide plots), with no or minimal loss of information. Data for individual specimens are projected onto the new principal component (PC) axes and can be related directly to the original variables, called loadings, which are represented as vectors. The structure of the loadings relative to the specimen scores can also provide important information. Loading vectors that are approximately 0° relative to one another are positively correlated (r = 1), while those 90° relative to one another are uncorrelated (r = 0), and those that are 180° relative to one another are negatively correlated (r = -1). Uncorrelated oxides and oxide ratios plotted against each other will generate group structures similar to that of the PC axes. Additional techniques such as cluster analysis or kernel density estimation may also be employed to help define data structure.
Smelting slag created by different recipes will tend to form clusters in multivariate space, whose relative positions reflect compositional differences in ore, clay, and fuel ash chemistry, as well as variation in furnace design and operation. Variation in the relative proportions of these parent materials in the slag also influences the cluster’s position. Using the general model of parent material contributions to slag chemistry in
Table 1, Charlton (2007) constructed a contingency table of all positive oxide correlations. Inferences about the causes of any group distinguished according to these correlations were modelled for each cell (Table 2). Strong positive correlations between K2O and MgO, for example, lead to the inference of a group formed through higher relative contributions from fuel ash. Similarly, a strong positive correlation between SiO2 and Al2O3 would suggest that groups containing larger amounts of these oxides were formed from higher relative contributions of technical ceramic from the furnace walls. Finally, there are also cases where the inference may be less certain. Strong positive correlations between P2O5 and CaO can suggest groups either with higher ore or fuel ash contributions, depending on the specific nature of the parent materials.
The archaeological relevance of these correlations varies from case to case. In one instance, slag groups defined by higher fuel ash contributions may reflect differences in fuel to ore ratios in the recipe. In another instance, it might suggest the use of a charcoal with higher ash content. Slag groups marked by higher concentrations of clay-related oxides that are also negatively correlated with FeO and P2O5 could indicate variation in the richness of utilised ores, variation in the refractory behaviour of the furnace walls/linings, or differences in redox conditions of the furnace. Deciding between these or other cases of multiple competing hypotheses requires independent lines of evidence, such as charcoal species identification and ore characterisation.
In terms of systematics, model-based PCA is a method that rests somewhere in between simple pattern recognition techniques and true classification. Like descriptive grouping exercises, results depend strictly on the specimens used in the analysis. However, model-based PCA does more than reduce data; it also provides a meaningful coordinate system which specifies the necessary and sufficient conditions for group membership relative to other groups as a consequence of oxide correlations. This coordinate system can therefore be broken up into a series of units which act as locally defined classes.
Data from three iron smelting experiments provide an ideal means of determining the efficacy of the model provided in Table 2. XP93, XP94, and XP95 were conducted with similar furnace configurations, operating parameters, clays, and fuels. The most significant source of variation was the ore (see Crew and Charlton, 2007). XP93 used Beckermet hematite – a very hard ore with an unusually high barium sulphate (BaSO4) content (here represented as BaO). XP94 used a rich goethite ore from the Forest of Dean, and XP95 used a crushed bog ore. XP94 also incorporated a modified air supply system with larger diameter blowhole and deeper nozzle penetration.
A PCA of the experimental slag chemistries resulted in the formation of three distinct groups. XP93 is grouped by a high
Table 1: Parent material contribution to slag chemistry.MgO Al2O3 SiO2 P2O5 SO3 K2O CaO TiO2 MnO FeO SrO BaO
ore ● ● ● ● ● ● ● ● ● ●clay ● ● ● ● ●
fuel ash ● ● ● ● ● ●
M i c h a e l F. c h a r lto n , P e t e r c r e w, t h i lo r e h r e n , a n d S t e P h e n J . S h e n n a n
426
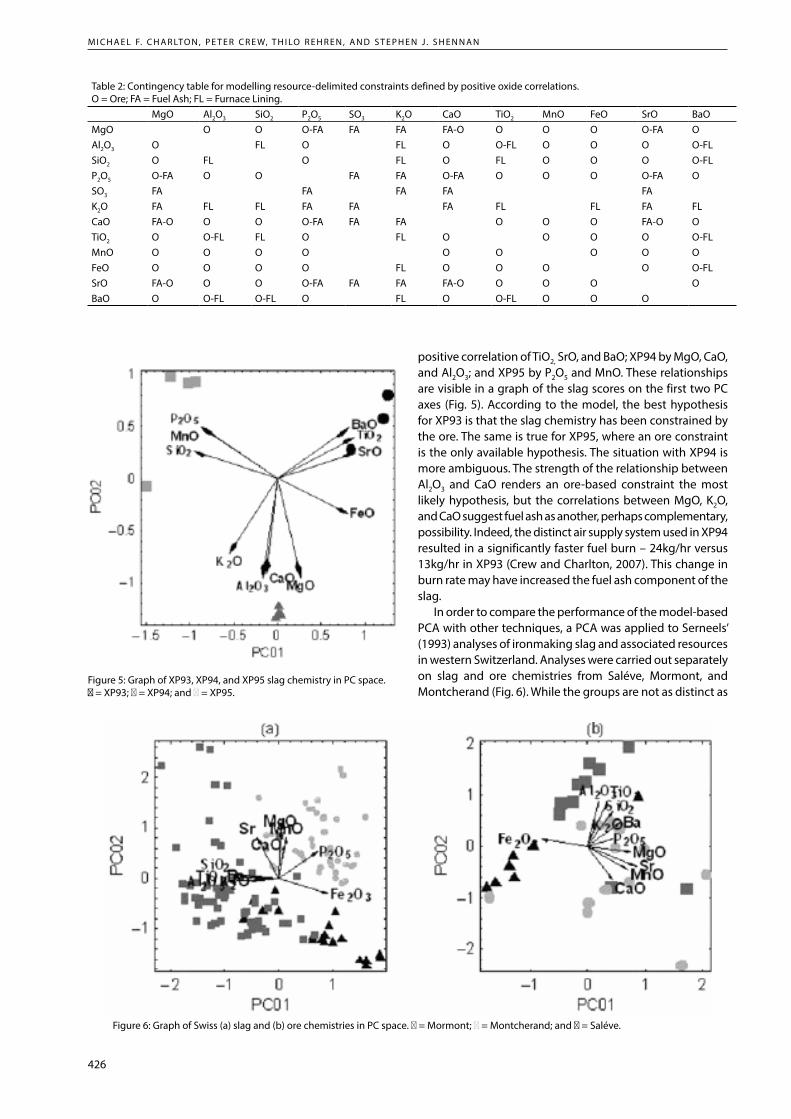
positive correlation of TiO2, SrO, and BaO; XP94 by MgO, CaO, and Al2O3; and XP95 by P2O5 and MnO. These relationships are visible in a graph of the slag scores on the first two PC axes (Fig. 5). According to the model, the best hypothesis for XP93 is that the slag chemistry has been constrained by the ore. The same is true for XP95, where an ore constraint is the only available hypothesis. The situation with XP94 is more ambiguous. The strength of the relationship between Al2O3 and CaO renders an ore-based constraint the most likely hypothesis, but the correlations between MgO, K2O, and CaO suggest fuel ash as another, perhaps complementary, possibility. Indeed, the distinct air supply system used in XP94 resulted in a significantly faster fuel burn – 24kg/hr versus 13kg/hr in XP93 (Crew and Charlton, 2007). This change in burn rate may have increased the fuel ash component of the slag.
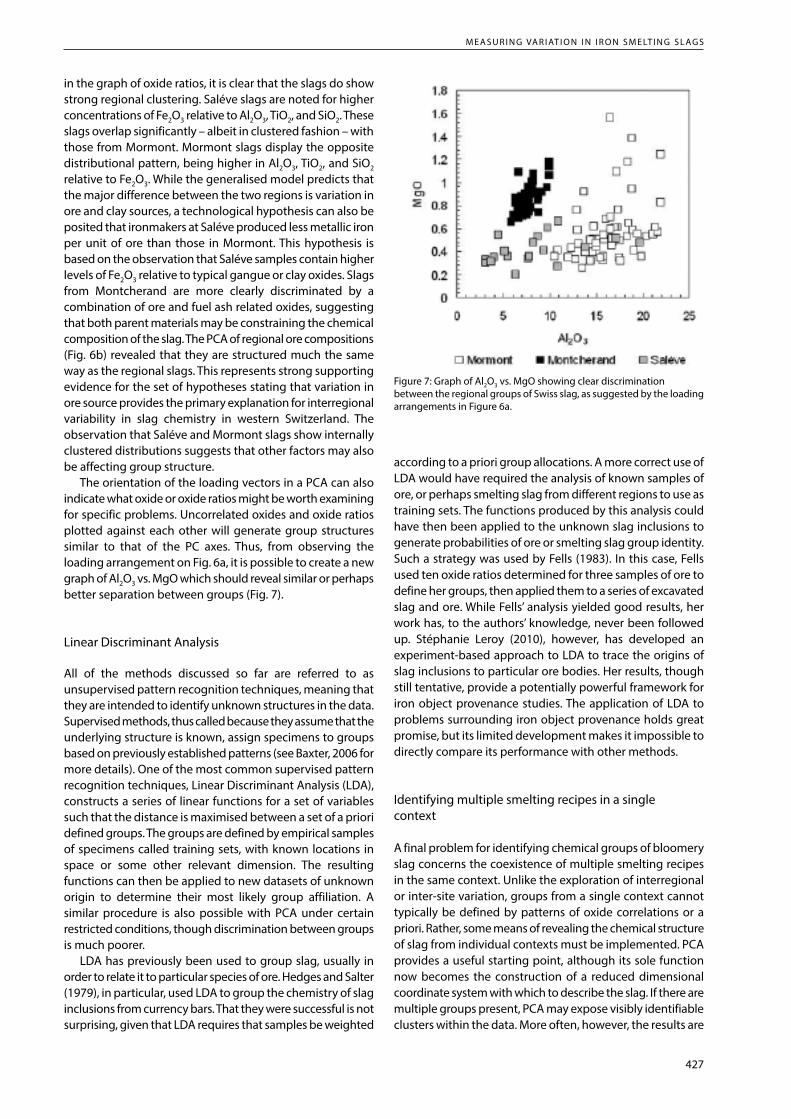
In order to compare the performance of the model-based PCA with other techniques, a PCA was applied to Serneels’ (1993) analyses of ironmaking slag and associated resources in western Switzerland. Analyses were carried out separately on slag and ore chemistries from Saléve, Mormont, and Montcherand (Fig. 6). While the groups are not as distinct as
Table 2: Contingency table for modelling resource-delimited constraints defined by positive oxide correlations. O = Ore; FA = Fuel Ash; FL = Furnace Lining. MgO Al2O3 SiO2 P2O5 SO3 K2O CaO TiO2 MnO FeO SrO BaOMgO O O O-FA FA FA FA-O O O O O-FA OAl2O3 O FL O FL O O-FL O O O O-FLSiO2 O FL O FL O FL O O O O-FLP2O5 O-FA O O FA FA O-FA O O O O-FA OSO3 FA FA FA FA FA K2O FA FL FL FA FA FA FL FL FA FLCaO FA-O O O O-FA FA FA O O O FA-O OTiO2 O O-FL FL O FL O O O O O-FLMnO O O O O O O O O OFeO O O O O FL O O O O O-FLSrO FA-O O O O-FA FA FA FA-O O O O OBaO O O-FL O-FL O FL O O-FL O O O
Figure 5: Graph of XP93, XP94, and XP95 slag chemistry in PC space. ● = XP93; ● = XP94; and ● = XP95.
Figure 6: Graph of Swiss (a) slag and (b) ore chemistries in PC space. ● = Mormont; ● = Montcherand; and ● = Saléve.
M e a s u r i n g va r i at i o n i n i r o n s M e lt i n g s l ag s
427
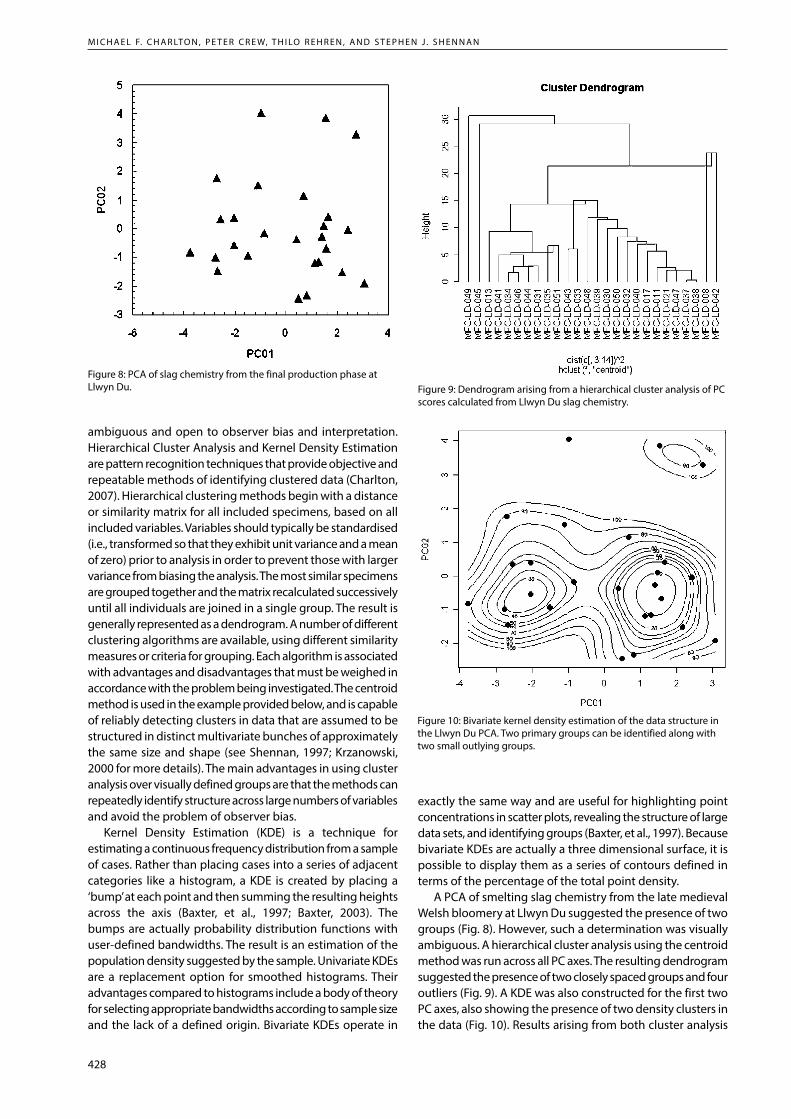
in the graph of oxide ratios, it is clear that the slags do show strong regional clustering. Saléve slags are noted for higher concentrations of Fe2O3 relative to Al2O3, TiO2, and SiO2. These slags overlap significantly – albeit in clustered fashion – with those from Mormont. Mormont slags display the opposite distributional pattern, being higher in Al2O3, TiO2, and SiO2 relative to Fe2O3. While the generalised model predicts that the major difference between the two regions is variation in ore and clay sources, a technological hypothesis can also be posited that ironmakers at Saléve produced less metallic iron per unit of ore than those in Mormont. This hypothesis is based on the observation that Saléve samples contain higher levels of Fe2O3 relative to typical gangue or clay oxides. Slags from Montcherand are more clearly discriminated by a combination of ore and fuel ash related oxides, suggesting that both parent materials may be constraining the chemical composition of the slag. The PCA of regional ore compositions (Fig. 6b) revealed that they are structured much the same way as the regional slags. This represents strong supporting evidence for the set of hypotheses stating that variation in ore source provides the primary explanation for interregional variability in slag chemistry in western Switzerland. The observation that Saléve and Mormont slags show internally clustered distributions suggests that other factors may also be affecting group structure.
The orientation of the loading vectors in a PCA can also indicate what oxide or oxide ratios might be worth examining for specific problems. Uncorrelated oxides and oxide ratios plotted against each other will generate group structures similar to that of the PC axes. Thus, from observing the loading arrangement on Fig. 6a, it is possible to create a new graph of Al2O3 vs. MgO which should reveal similar or perhaps better separation between groups (Fig. 7).
Linear Discriminant Analysis
All of the methods discussed so far are referred to as unsupervised pattern recognition techniques, meaning that they are intended to identify unknown structures in the data. Supervised methods, thus called because they assume that the underlying structure is known, assign specimens to groups based on previously established patterns (see Baxter, 2006 for more details). One of the most common supervised pattern recognition techniques, Linear Discriminant Analysis (LDA), constructs a series of linear functions for a set of variables such that the distance is maximised between a set of a priori defined groups. The groups are defined by empirical samples of specimens called training sets, with known locations in space or some other relevant dimension. The resulting functions can then be applied to new datasets of unknown origin to determine their most likely group affiliation. A similar procedure is also possible with PCA under certain restricted conditions, though discrimination between groups is much poorer.
LDA has previously been used to group slag, usually in order to relate it to particular species of ore. Hedges and Salter (1979), in particular, used LDA to group the chemistry of slag inclusions from currency bars. That they were successful is not surprising, given that LDA requires that samples be weighted
according to a priori group allocations. A more correct use of LDA would have required the analysis of known samples of ore, or perhaps smelting slag from different regions to use as training sets. The functions produced by this analysis could have then been applied to the unknown slag inclusions to generate probabilities of ore or smelting slag group identity. Such a strategy was used by Fells (1983). In this case, Fells used ten oxide ratios determined for three samples of ore to define her groups, then applied them to a series of excavated slag and ore. While Fells’ analysis yielded good results, her work has, to the authors’ knowledge, never been followed up. Stéphanie Leroy (2010), however, has developed an experiment-based approach to LDA to trace the origins of slag inclusions to particular ore bodies. Her results, though still tentative, provide a potentially powerful framework for iron object provenance studies. The application of LDA to problems surrounding iron object provenance holds great promise, but its limited development makes it impossible to directly compare its performance with other methods.
Identifying multiple smelting recipes in a single context
A final problem for identifying chemical groups of bloomery slag concerns the coexistence of multiple smelting recipes in the same context. Unlike the exploration of interregional or inter-site variation, groups from a single context cannot typically be defined by patterns of oxide correlations or a priori. Rather, some means of revealing the chemical structure of slag from individual contexts must be implemented. PCA provides a useful starting point, although its sole function now becomes the construction of a reduced dimensional coordinate system with which to describe the slag. If there are multiple groups present, PCA may expose visibly identifiable clusters within the data. More often, however, the results are
Figure 7: Graph of Al2O3 vs. MgO showing clear discrimination between the regional groups of Swiss slag, as suggested by the loading arrangements in Figure 6a.
M i c h a e l F. c h a r lto n , P e t e r c r e w, t h i lo r e h r e n , a n d S t e P h e n J . S h e n n a n
428
ambiguous and open to observer bias and interpretation. Hierarchical Cluster Analysis and Kernel Density Estimation are pattern recognition techniques that provide objective and repeatable methods of identifying clustered data (Charlton, 2007). Hierarchical clustering methods begin with a distance or similarity matrix for all included specimens, based on all included variables. Variables should typically be standardised (i.e., transformed so that they exhibit unit variance and a mean of zero) prior to analysis in order to prevent those with larger variance from biasing the analysis. The most similar specimens are grouped together and the matrix recalculated successively until all individuals are joined in a single group. The result is generally represented as a dendrogram. A number of different clustering algorithms are available, using different similarity measures or criteria for grouping. Each algorithm is associated with advantages and disadvantages that must be weighed in accordance with the problem being investigated. The centroid method is used in the example provided below, and is capable of reliably detecting clusters in data that are assumed to be structured in distinct multivariate bunches of approximately the same size and shape (see Shennan, 1997; Krzanowski, 2000 for more details). The main advantages in using cluster analysis over visually defined groups are that the methods can repeatedly identify structure across large numbers of variables and avoid the problem of observer bias.
Kernel Density Estimation (KDE) is a technique for estimating a continuous frequency distribution from a sample of cases. Rather than placing cases into a series of adjacent categories like a histogram, a KDE is created by placing a ‘bump’ at each point and then summing the resulting heights across the axis (Baxter, et al., 1997; Baxter, 2003). The bumps are actually probability distribution functions with user-defined bandwidths. The result is an estimation of the population density suggested by the sample. Univariate KDEs are a replacement option for smoothed histograms. Their advantages compared to histograms include a body of theory for selecting appropriate bandwidths according to sample size and the lack of a defined origin. Bivariate KDEs operate in
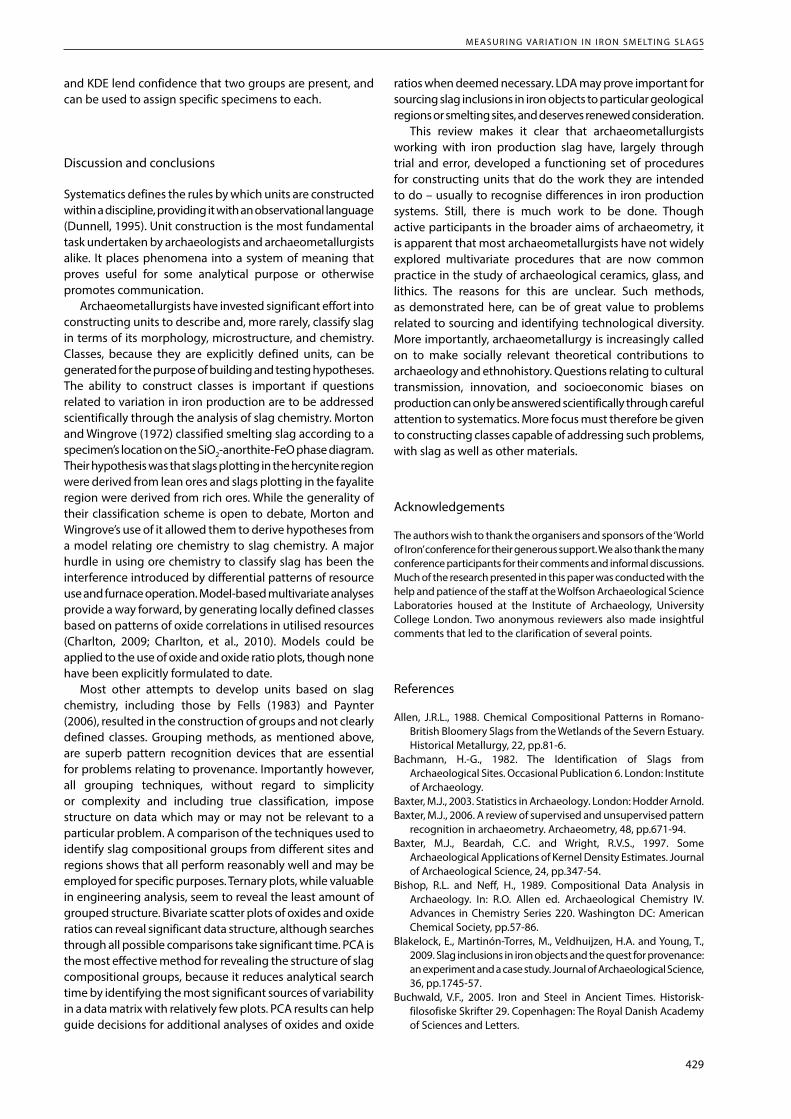
Figure 8: PCA of slag chemistry from the final production phase at Llwyn Du. Figure 9: Dendrogram arising from a hierarchical cluster analysis of PC
scores calculated from Llwyn Du slag chemistry.
Figure 10: Bivariate kernel density estimation of the data structure in the Llwyn Du PCA. Two primary groups can be identified along with two small outlying groups.
exactly the same way and are useful for highlighting point concentrations in scatter plots, revealing the structure of large data sets, and identifying groups (Baxter, et al., 1997). Because bivariate KDEs are actually a three dimensional surface, it is possible to display them as a series of contours defined in terms of the percentage of the total point density.
A PCA of smelting slag chemistry from the late medieval Welsh bloomery at Llwyn Du suggested the presence of two groups (Fig. 8). However, such a determination was visually ambiguous. A hierarchical cluster analysis using the centroid method was run across all PC axes. The resulting dendrogram suggested the presence of two closely spaced groups and four outliers (Fig. 9). A KDE was also constructed for the first two PC axes, also showing the presence of two density clusters in the data (Fig. 10). Results arising from both cluster analysis
M e a s u r i n g va r i at i o n i n i r o n s M e lt i n g s l ag s
429
and KDE lend confidence that two groups are present, and can be used to assign specific specimens to each.
Discussion and conclusions
Systematics defines the rules by which units are constructed within a discipline, providing it with an observational language (Dunnell, 1995). Unit construction is the most fundamental task undertaken by archaeologists and archaeometallurgists alike. It places phenomena into a system of meaning that proves useful for some analytical purpose or otherwise promotes communication.
Archaeometallurgists have invested significant effort into constructing units to describe and, more rarely, classify slag in terms of its morphology, microstructure, and chemistry. Classes, because they are explicitly defined units, can be generated for the purpose of building and testing hypotheses. The ability to construct classes is important if questions related to variation in iron production are to be addressed scientifically through the analysis of slag chemistry. Morton and Wingrove (1972) classified smelting slag according to a specimen’s location on the SiO2-anorthite-FeO phase diagram. Their hypothesis was that slags plotting in the hercynite region were derived from lean ores and slags plotting in the fayalite region were derived from rich ores. While the generality of their classification scheme is open to debate, Morton and Wingrove’s use of it allowed them to derive hypotheses from a model relating ore chemistry to slag chemistry. A major hurdle in using ore chemistry to classify slag has been the interference introduced by differential patterns of resource use and furnace operation. Model-based multivariate analyses provide a way forward, by generating locally defined classes based on patterns of oxide correlations in utilised resources (Charlton, 2009; Charlton, et al., 2010). Models could be applied to the use of oxide and oxide ratio plots, though none have been explicitly formulated to date.
Most other attempts to develop units based on slag chemistry, including those by Fells (1983) and Paynter (2006), resulted in the construction of groups and not clearly defined classes. Grouping methods, as mentioned above, are superb pattern recognition devices that are essential for problems relating to provenance. Importantly however, all grouping techniques, without regard to simplicity or complexity and including true classification, impose structure on data which may or may not be relevant to a particular problem. A comparison of the techniques used to identify slag compositional groups from different sites and regions shows that all perform reasonably well and may be employed for specific purposes. Ternary plots, while valuable in engineering analysis, seem to reveal the least amount of grouped structure. Bivariate scatter plots of oxides and oxide ratios can reveal significant data structure, although searches through all possible comparisons take significant time. PCA is the most effective method for revealing the structure of slag compositional groups, because it reduces analytical search time by identifying the most significant sources of variability in a data matrix with relatively few plots. PCA results can help guide decisions for additional analyses of oxides and oxide
ratios when deemed necessary. LDA may prove important for sourcing slag inclusions in iron objects to particular geological regions or smelting sites, and deserves renewed consideration.
This review makes it clear that archaeometallurgists working with iron production slag have, largely through trial and error, developed a functioning set of procedures for constructing units that do the work they are intended to do – usually to recognise differences in iron production systems. Still, there is much work to be done. Though active participants in the broader aims of archaeometry, it is apparent that most archaeometallurgists have not widely explored multivariate procedures that are now common practice in the study of archaeological ceramics, glass, and lithics. The reasons for this are unclear. Such methods, as demonstrated here, can be of great value to problems related to sourcing and identifying technological diversity. More importantly, archaeometallurgy is increasingly called on to make socially relevant theoretical contributions to archaeology and ethnohistory. Questions relating to cultural transmission, innovation, and socioeconomic biases on production can only be answered scientifically through careful attention to systematics. More focus must therefore be given to constructing classes capable of addressing such problems, with slag as well as other materials.
Acknowledgements
The authors wish to thank the organisers and sponsors of the ‘World of Iron’ conference for their generous support. We also thank the many conference participants for their comments and informal discussions. Much of the research presented in this paper was conducted with the help and patience of the staff at the Wolfson Archaeological Science Laboratories housed at the Institute of Archaeology, University College London. Two anonymous reviewers also made insightful comments that led to the clarification of several points.
References
Allen, J.R.L., 1988. Chemical Compositional Patterns in Romano-British Bloomery Slags from the Wetlands of the Severn Estuary. Historical Metallurgy, 22, pp.81-6.
Bachmann, H.-G., 1982. The Identification of Slags from Archaeological Sites. Occasional Publication 6. London: Institute of Archaeology.
Baxter, M.J., 2003. Statistics in Archaeology. London: Hodder Arnold.Baxter, M.J., 2006. A review of supervised and unsupervised pattern
recognition in archaeometry. Archaeometry, 48, pp.671-94.Baxter, M.J., Beardah, C.C. and Wright, R.V.S., 1997. Some
Archaeological Applications of Kernel Density Estimates. Journal of Archaeological Science, 24, pp.347-54.
Bishop, R.L. and Neff, H., 1989. Compositional Data Analysis in Archaeology. In: R.O. Allen ed. Archaeological Chemistry IV. Advances in Chemistry Series 220. Washington DC: American Chemical Society, pp.57-86.
Blakelock, E., Martinón-Torres, M., Veldhuijzen, H.A. and Young, T., 2009. Slag inclusions in iron objects and the quest for provenance: an experiment and a case study. Journal of Archaeological Science, 36, pp.1745-57.
Buchwald, V.F., 2005. Iron and Steel in Ancient Times. Historisk-filosofiske Skrifter 29. Copenhagen: The Royal Danish Academy of Sciences and Letters.
M i c h a e l F. c h a r lto n , P e t e r c r e w, t h i lo r e h r e n , a n d S t e P h e n J . S h e n n a n
430
Buchwald, V.F. and Wivel, H., 1998. Slag analysis as a method for the characterization and provenancing of ancient iron objects. Materials Characterization, 40, pp.73-96.
Charlton, M.F., 2007. Ironworking in Northwest Wales: An Evolutionary Analysis. PhD Thesis, University College London.
Charlton, M.F., 2009. Identifying iron production lineages: a case study in northwest Wales. In: S.J. Shennan ed. Pattern and Process in Cultural Evolution. Berkeley: University of California Press, pp.133-44.
Charlton, M.F., Crew, P., Rehren, Th. and Shennan, S.J., 2010. Explaining the evolution of ironmaking recipes – An example from northwest Wales. Journal of Anthropological Archaeology, 29, pp.352-67.
Coustures, M.P., Béziat, D., Tollon, F., Domergue, C., Long, L. and Rebiscoul, A., 2003. The use of trace element analysis of entrapped slag inclusions to establish ore – bar iron links: examples from two Gallo-Roman iron-making sites in France (Les Martys, Montagne Noire, and Les Ferrys Loiret). Archaeometry, 45, pp.599-613.
Coustures, M.P., Rico, C., Béziat, D., Djaoui, D., Long, L., Domergue, C. and Tollon, F., 2006. La provenance des barres de fer Romaines des Saintes-Maries-De-La-Mer (Bouches-Du-Rhône). Gallia, 63, pp.243-61.
Crew, P., 2000. The influence of Clay and Charcoal Ash on Bloomery Slags. In: C.C. Tizzoni and M. Tizzoni eds. Iron in the Alps: Deposits, Mines and Metallurgy from Antiquity to the XVI Century. Proceedings of the International Conference (October 2-4, 1998, Bienno, Italy). Breno: Comune di Bienno, pp.38-48.
Crew, P. and Charlton, M., 2007. The anatomy of a furnace...and some of its ramifications. In: S. La Niece, D. Hook and P. Craddock eds. Metals and Mines: Studies in Archaeometallurgy..London: Archetype, pp.219-25.
Desaulty, A.M., Dillmann, P., L’Héritier, M., Mariet, C., Gratuze, B., Joron, J.L. and Fluzin, P., 2009. Does it come from Pays de Bray? Examination of an origin hypothesis for the ferrous reinforcements used in French medieval churches using major and trace element analyses. Journal of Archaeological Science, 36, pp.2445-62.
Dillmann, P. and L’Héritier, M., 2007. Slag Inclusion Analyses for Studying Ferrous Alloys Employed in French Medieval Buildings: Supply of Materials and Diffusion of Smelting Processes. Journal of Archaeological Science, 34, pp.1810-23.
Dunnell, R.C., 1971. Systematics in Prehistory. New York: Free Press.Dunnell, R.C., 1995. What Is It That Actually Evolves? In P.A. Teltser
ed. Evolutionary Archaeology: Methodological Issues. Tucson: University of Arizona Press, pp.33-50.
Fells, S., 1983. The Structure and Constitution of Ferrous Process Slags. PhD thesis, University of Aston in Birmingham.
Gordon, R., 1997. Process Deduced From Ironmaking Wastes and Artefacts. Journal of Archaeological Science, 24, pp.9-18.
Hedges, R.E.M. and Salter, C.J., 1979. Source Determination of Iron Currency Bars through Analysis of the Slag Inclusions. Archaeometry, 22, pp.161-75.
Humphris, J., Martinón-Torres, M., Rehren, Th. and Reid, A., 2009. Variability in single smelting episodes – a pilot study using iron slag from Uganda. Journal of Archaeological Science, 36, pp.359-69.
Krzanowski, W.J., 2000. Principles of Multivariate Analysis: A User’s Perspective. Oxford: Oxford University Press.
Leroy, S., 2010. Circulation au Moyen Age des Materiaux Ferreux Issus des Pyrenees Ariegeoises et de la Lombardie. Apport du Couplage des Analyses en Elements Traces et Multivariees. PhD Thesis, Université de Technologie de Belfort-Montbéliard.
Leroy, S., Simon, R., Bertrand, L., Williams, A., Foy, E. and Dillmann, P., 2011. First examination of slag inclusions in medieval armours by confocal SR-µ-XRF and LA-ICP-MS. Journal of Analytical Atomic Spectrometry, 26, pp.1078-87.
Morton, G.R. and Wingrove, J., 1969. Constitution of Bloomery Slags: Part I: Roman. Journal of the Iron and Steel Institute, 207, pp.1556-64.
Morton, G.R. and Wingrove, J., 1972. Constitution of Bloomery Slags: Part II: Medieval. Journal of the Iron and Steel Institute, 210, pp.478-88.
O’Brien, M.J. and Lyman, R.L., 2000. Applying Evolutionary Archaeology: A Systematic Approach. New York: Kluwer Academic/Plenum Publishers.
Paynter, S., 2006. Regional Variations in Bloomery Smelting Slag of the Iron Age and Romano-British Periods. Archaeometry, 48, 271-92.
Serneels, V., 1993. Archéométrie des Scories de Fer. Recherches sur la Sidérurgie Ancienne en Suisse Occidentale. Cahiers d’Archéologie Romande 61. Lausanne: Cahiers d’Archéologie Romande.
Serneels, V. and Perret, S., 2003. Quantification of Smithing Activities Based on the Investigation of Slag and Other Material Remains. In Archaeometallurgy in Europe, Volume 1, Procedings of the International Conference Milano, Italy, September 24-26, 2003. Milano: Associazione Italiana di Metallurgia, pp.469-78.
Shennan, S.J., 1997. Quantifying Archaeology. Iowa City: University of Iowa Press.
Tylecote, R.F., 1987. The Early History of Metallurgy in Europe. New York: Longman.
Authors’ addresses
• MichaelF.Charlton*,ThiloRehren,StephenJ.Shennan Institute of Archaeology, University College London, 31-34
Gordon Square, London, WC1H OPY, UK *Corresponding author: Permanent Address: 5430 127th PL SE,
Snohomish, WA 98296, USA E-mail: [email protected] • ThiloRehren UCL Qatar, Hamad bin Khalifa University, Georgetown Building Doha, Qatar Email: [email protected] • PeterCrew Pen Cefn, Penrhyndeudraeth, Gwynedd, LL48 6DR, UK Email: [email protected]