Measuring the neighborhood environment: associations with young girls' energy intake and expenditure...
10
Leung et al. International Journal of Behavioral Nutrition and Physical Activity 2010, 7:52 http://www.ijbnpa.org/content/7/1/52 Open Access RESEARCH © 2010 Leung et al; licensee BioMed Central Ltd. This is an Open Access article distributed under the terms of the Creative Commons Attribution License (http://creativecommons.org/licenses/by/2.0), which permits unrestricted use, distribution, and reproduction in any medium, provided the original work is properly cited. Research Measuring the neighborhood environment: associations with young girls' energy intake and expenditure in a cross-sectional study Cindy W Leung 1 , Steven E Gregorich 2 , Barbara A Laraia 3 , Lawrence H Kushi 4 and Irene H Yen* 2 Abstract Background: Neighborhood environments affect children's health outcomes. Observational methods used to assess neighborhoods can be categorized as indirect, intermediate, or direct. Direct methods, involving in-person audits of the neighborhoods conducted by trained observers, are recognized as an accurate representation of current neighborhood conditions. The authors investigated the associations of various neighborhood characteristics with young girls' diet and physical activity. Methods: This study is based on a subset of participants in the Cohort Study of Young Girls' Nutrition, Environment and Transitions (CYGNET). In-person street audits were conducted within 215 girls' residential neighborhoods using a modified St. Louis Audit Tool. From the street audit data, exploratory factor analysis revealed five neighborhood scales: "mixed residential and commercial," "food and retail," "recreation," "walkability," and "physical disorder." A Neighborhood Deprivation Index was also derived from census data. The authors investigated if the five neighborhood scales and the Neighborhood Deprivation Index were associated with quartiles of total energy intake and expenditure (metabolic equivalent (MET) hours/week) at baseline, and whether any of these associations were modified by race/ethnicity. Results: After adjustment for demographic characteristics, there was an inverse association between prevalence of "food and retail" destinations and total energy intake (for a one quartile increase, OR = 0.84, 95% CI 0.74, 0.96). Positive associations were also observed between the "recreation" and "walkability" scales with physical activity among Hispanic/Latina girls (for a one quartile increase in MET, OR = 1.94, 95% CI 1.31, 2.88 for recreation; OR = 1.71, 95% CI 1.11, 2.63 for walkability). Among African-American girls, there was an inverse association between "physical disorder" and physical activity (OR = 0.31, 95% CI 0.12, 0.80). Conclusions: These results suggest that neighborhood food and retail availability may be inversely associated with young girls' energy intakes in contrast to other studies' findings that focused on adults. There is considerable variation in neighborhoods' influences on young girls' physical activity behaviors, particularly for young girls of different racial/ ethnic backgrounds. Background Neighborhoods are geographic and social units that can have profound effects on health outcomes. For children, neighborhoods can encompass the schools they attend, the grocery stores their families patronize, the streets and roadways they travel on, and the other children and adults with whom they interact. These components also help to define different sub-neighborhood environments, such as the physical activity environment, the consumer environment, or the "information environment," [1] each of which may have different effects on children's health. Previous studies have shown that neighborhood char- acteristics are associated with children's health outcomes, including low birth weight [2-4], childhood lead poison- ing [5], asthma [6-9], pedestrian fatalities [10], and cogni- tive development [11,12]. As rates of childhood obesity have increased, researchers have focused on how certain * Correspondence: [email protected] 2 Division of General Internal Medicine, Department of Medicine, University of California, San Francisco, 3333 California Street, Suite 335, Box 0856, San Francisco, CA 94143-0856 USA Full list of author information is available at the end of the article
Transcript of Measuring the neighborhood environment: associations with young girls' energy intake and expenditure...
Leung et al. International Journal of Behavioral Nutrition and Physical Activity 2010, 7:52http://www.ijbnpa.org/content/7/1/52
Open AccessR E S E A R C H
ResearchMeasuring the neighborhood environment: associations with young girls' energy intake and expenditure in a cross-sectional studyCindy W Leung1, Steven E Gregorich2, Barbara A Laraia3, Lawrence H Kushi4 and Irene H Yen*2
AbstractBackground: Neighborhood environments affect children's health outcomes. Observational methods used to assess neighborhoods can be categorized as indirect, intermediate, or direct. Direct methods, involving in-person audits of the neighborhoods conducted by trained observers, are recognized as an accurate representation of current neighborhood conditions. The authors investigated the associations of various neighborhood characteristics with young girls' diet and physical activity.
Methods: This study is based on a subset of participants in the Cohort Study of Young Girls' Nutrition, Environment and Transitions (CYGNET). In-person street audits were conducted within 215 girls' residential neighborhoods using a modified St. Louis Audit Tool. From the street audit data, exploratory factor analysis revealed five neighborhood scales: "mixed residential and commercial," "food and retail," "recreation," "walkability," and "physical disorder." A Neighborhood Deprivation Index was also derived from census data. The authors investigated if the five neighborhood scales and the Neighborhood Deprivation Index were associated with quartiles of total energy intake and expenditure (metabolic equivalent (MET) hours/week) at baseline, and whether any of these associations were modified by race/ethnicity.
Results: After adjustment for demographic characteristics, there was an inverse association between prevalence of "food and retail" destinations and total energy intake (for a one quartile increase, OR = 0.84, 95% CI 0.74, 0.96). Positive associations were also observed between the "recreation" and "walkability" scales with physical activity among Hispanic/Latina girls (for a one quartile increase in MET, OR = 1.94, 95% CI 1.31, 2.88 for recreation; OR = 1.71, 95% CI 1.11, 2.63 for walkability). Among African-American girls, there was an inverse association between "physical disorder" and physical activity (OR = 0.31, 95% CI 0.12, 0.80).
Conclusions: These results suggest that neighborhood food and retail availability may be inversely associated with young girls' energy intakes in contrast to other studies' findings that focused on adults. There is considerable variation in neighborhoods' influences on young girls' physical activity behaviors, particularly for young girls of different racial/ethnic backgrounds.
BackgroundNeighborhoods are geographic and social units that canhave profound effects on health outcomes. For children,neighborhoods can encompass the schools they attend,the grocery stores their families patronize, the streets androadways they travel on, and the other children andadults with whom they interact. These components also
help to define different sub-neighborhood environments,such as the physical activity environment, the consumerenvironment, or the "information environment," [1] eachof which may have different effects on children's health.
Previous studies have shown that neighborhood char-acteristics are associated with children's health outcomes,including low birth weight [2-4], childhood lead poison-ing [5], asthma [6-9], pedestrian fatalities [10], and cogni-tive development [11,12]. As rates of childhood obesityhave increased, researchers have focused on how certain
* Correspondence: [email protected] Division of General Internal Medicine, Department of Medicine, University of California, San Francisco, 3333 California Street, Suite 335, Box 0856, San Francisco, CA 94143-0856 USAFull list of author information is available at the end of the article
© 2010 Leung et al; licensee BioMed Central Ltd. This is an Open Access article distributed under the terms of the Creative CommonsAttribution License (http://creativecommons.org/licenses/by/2.0), which permits unrestricted use, distribution, and reproduction inany medium, provided the original work is properly cited.

Leung et al. International Journal of Behavioral Nutrition and Physical Activity 2010, 7:52http://www.ijbnpa.org/content/7/1/52
Page 2 of 10
neighborhood characteristics may affect children's dietand physical activity.
Observational methods used to assess the neighbor-hood environment can be indirect, intermediate, anddirect [13]. Indirect methods involve combining censusor geographic information systems data to create indicesof neighborhood/area deprivation, such as the Neighbor-hood Deprivation Index [14], Townsend Material Devel-opment Score [15], or the Carstairs Deprivation Index[16]. Intermediate measures include using aerial photog-raphy or telephone book yellow pages to determineregional land-use and neighborhood composition [17].Direct methods involve in-person audits of the neighbor-hood conducted by trained observers. Direct methodsmay capture elements missing from indirect or interme-diate methods, such as sidewalk width or landscapemaintenance [18], and unlike other methods, are not lim-ited by databases that can have out-of-date information[13].
Davison and Lawson [19] reviewed 33 studies aboutneighborhood environments and children's physicalactivity. Access to recreational facilities and schools,presence of sidewalks, access to destinations and publictransportation, were each associated with increasedphysical activity in children. Conversely, higher crimerates, physical disorder (e.g. presence of graffiti or emptybeer bottles) and area deprivation (e.g. rates of car owner-ship, unemployment and crowding) were all negativelyassociated with children's physical activity. Neighbor-hood effects on children's diet have been less pro-nounced. Burdette and Whitaker [20] found noassociation between proximity to fast food restaurantsand childhood obesity. Other evidence [21-23] has shownthat school-based interventions can promote children'sconsumption of fruits and vegetables. However, most ofthe previously mentioned studies have used indirect orintermediate measures of the neighborhood environ-ment. Few studies have examined the associationbetween neighborhood characteristics and total energyintake, especially among younger children.
In addition, race/ethnicity may act as an effect modifierin the associations between the neighborhood environ-ment and total energy intake and expenditure. Previousstudies have already reported disparities in the local foodenvironment. Individuals residing in neighborhoods withpredominantly White residents generally have moreaccess to chain supermarkets, fruit and vegetable mar-kets, and bakeries than individuals residing in neighbor-hoods with predominantly low-income or minorityresidents [24,25]. A study from the Youth Risk BehaviorSurvey [26] found that living in neighborhoods with highproportions of Hispanic residents was associated withmore healthful dietary habits while living in low socio-economic neighborhoods was associated with poorer
dietary habits among adolescents. Another study ofeighth-grade girls in South Carolina [27], found thatWhite girls reported greater access to sports equipment,ability to walk safely in the neighborhood, and self-effi-cacy for physical activity than African-American girls.
In this study, we examined associations between neigh-borhood characteristics and energy intake and expendi-ture among young girls. We conducted in-person auditsof the geographic neighborhoods in which these younggirls resided, and used a factor analysis approach withthese audit data to develop neighborhood scales. Thesescales and a combined Neighborhood Deprivation Indexderived from census data were examined in associationwith measures of total energy intake and energy expendi-ture. Lastly, we examined whether these associationswere modified by race/ethnicity.
Materials and methodsStudy participantsThis study is based on a subset of participants in theCohort Study of Young Girls' Nutrition, Environment,and Transitions (CYGNET). A project of the Bay AreaBreast Cancer and the Environment Research Center, theCYGNET Study is a prospective cohort study that focuseson identifying environmental and other exposures associ-ated with differences in age-at-onset of pubertal develop-ment [28]. The CYGNET Study began in 2005 when 444girls were recruited from the Kaiser Permanente North-ern California (KPNC) health plan membership. Partici-pants for the CYGNET Study were identified through theKPNC Infant Cohort File, a database containing informa-tion on all live births occurring in KPNC facilities. Chil-dren were eligible for recruitment if they were female, agesix or seven years at time of recruitment, current mem-bers of KPNC, residents in Marin County, San Francisco,and select East Bay Communities currently and at thetime of birth, and not intending to move from the area inthe near future. Exclusion criteria included having a pre-existing medical condition known to influence puberty ora psychiatric condition that could potentially limit studyparticipation.
From June 2005 to August 2006, participants com-pleted a baseline clinical visit where a range of clinicalassessments were conducted, including collection ofblood and urine samples, anthropometric measurements,and Tanner stage evaluation. Tanner stage evaluationconsists of five stages of breast and pubic hair develop-ment, and is used to assess the degree of pubertal devel-opment of young girls [29]. The visit also included aninterview with the primary caregiver about chemicalexposures, weight changes, and residential history. Par-ticipants were informed that they would be calledapproximately every three months to assess food intakeby a telephone 24-hour dietary recall. Dietary recalls were
Leung et al. International Journal of Behavioral Nutrition and Physical Activity 2010, 7:52http://www.ijbnpa.org/content/7/1/52
Page 3 of 10
conducted by trained interviewers at the Cincinnati Chil-dren's Hospital Dietary Data Entry Center, using methodsdeveloped by the University of Minnesota NutritionCoordinating Center. All CYGNET Study procedureswere approved by the Kaiser Permanente InstitutionalReview Board.
Study procedures and data collectionFrom the CYGNET study, 215 girls were randomlyselected to participate in an auxiliary study on the rela-tion between neighborhood environments and dietaryand physical activity behaviors. Direct observations of thegirls' neighborhoods were conducted using a modifiedversion of the St. Louis Audit Tool [30], which consistedof a 68-item checklist of mostly dichotomous responsecategories (e.g. visible or not visible). Audit tool items fitinto five categories: land use environment, transportationenvironment, facilities, park or playground contents, andphysical disorder.
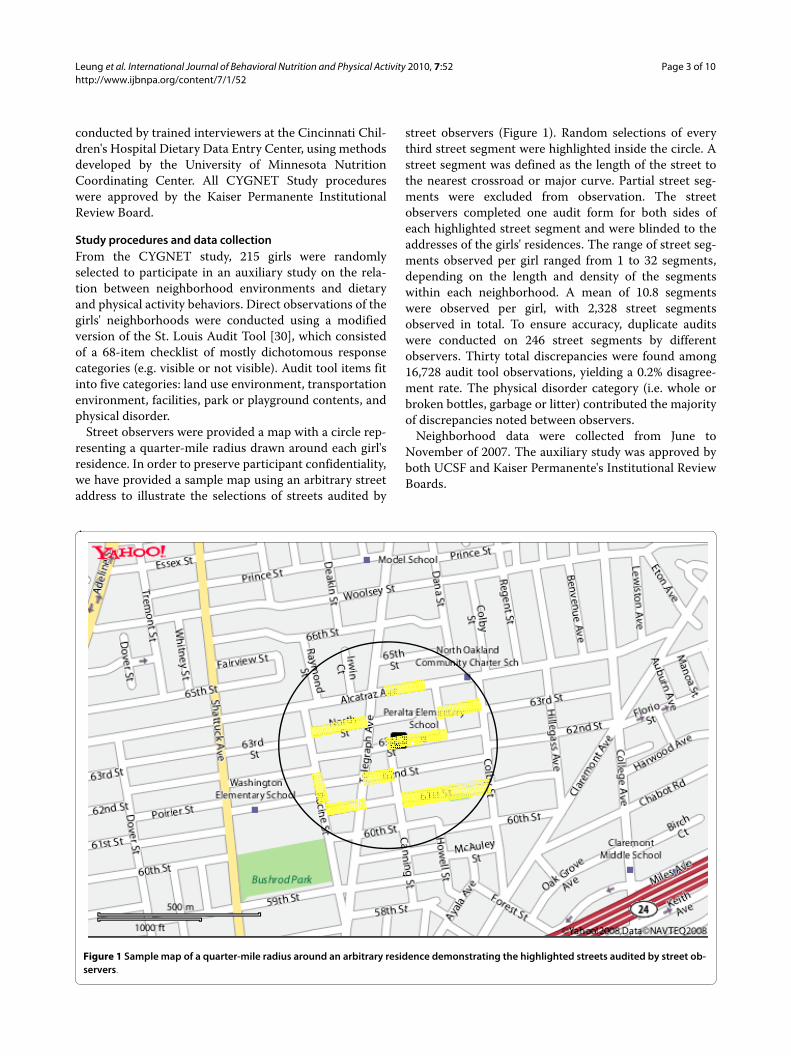
Street observers were provided a map with a circle rep-resenting a quarter-mile radius drawn around each girl'sresidence. In order to preserve participant confidentiality,we have provided a sample map using an arbitrary streetaddress to illustrate the selections of streets audited by
street observers (Figure 1). Random selections of everythird street segment were highlighted inside the circle. Astreet segment was defined as the length of the street tothe nearest crossroad or major curve. Partial street seg-ments were excluded from observation. The streetobservers completed one audit form for both sides ofeach highlighted street segment and were blinded to theaddresses of the girls' residences. The range of street seg-ments observed per girl ranged from 1 to 32 segments,depending on the length and density of the segmentswithin each neighborhood. A mean of 10.8 segmentswere observed per girl, with 2,328 street segmentsobserved in total. To ensure accuracy, duplicate auditswere conducted on 246 street segments by differentobservers. Thirty total discrepancies were found among16,728 audit tool observations, yielding a 0.2% disagree-ment rate. The physical disorder category (i.e. whole orbroken bottles, garbage or litter) contributed the majorityof discrepancies noted between observers.
Neighborhood data were collected from June toNovember of 2007. The auxiliary study was approved byboth UCSF and Kaiser Permanente's Institutional ReviewBoards.
Figure 1 Sample map of a quarter-mile radius around an arbitrary residence demonstrating the highlighted streets audited by street ob-servers.
Leung et al. International Journal of Behavioral Nutrition and Physical Activity 2010, 7:52http://www.ijbnpa.org/content/7/1/52
Page 4 of 10
Dependent variablesDietary and physical activity variables were collected aspart of the CYGNET Study.DietTotal energy intake was calculated from 24-hour dietaryrecalls collected up to four times over the course of a yearand approximately three months apart. The girl and herparent or guardian most knowledgeable of the girl's dietcompleted the 24-hour recalls. Total energy intake wasaveraged over all 24-hour recalls completed in the base-line year. Girls who had completed only one 24-hourrecall were excluded (n = 3). For analysis, total energyintake was categorized by quartiles with cut-points at1365.30, 1554.19, and 1745.54 kilocalories.Physical activityPhysical activity was measured in metabolic equivalents(MET), where one MET is defined as the energy require-ment per kilogram of body weight per hour of activitydivided by the energy requirement per kilogram of bodyweight at rest [31]. Data were based on a physical activityquestionnaire that collected information about the num-ber of hours per week over a one-year period that a girlparticipated in various physical activities, such as dance,soccer, basketball, and swimming, in the baseline year.Individual activities were converted to MET values,which contributed to each girl's total energy expenditure.Questions from the physical activity questionnaire havebeen previously validated in other studies [32]. For eachparticipant, responses for these activities were combinedto derive an estimate of total MET hours per week. Girlswho had incomplete or missing MET hours per weekwere excluded (n = 6). Because the data were positivelyskewed, physical activity was categorized into quartileswith cut-points at 1.20, 8.33, and 16.00 MET hours perweek for analysis.
Neighborhood measuresNeighborhood Deprivation IndexThe Neighborhood Deprivation Index was calculatedusing the method described by Messer et al. [14]. TheIndex is an empirical summary of socioeconomic depri-vation based on eight census variables: % of individualswith income in 1999 below poverty level; % of familieswith female headed households with no husband presentand children under age 18 y; % of households withincomes under $30,000/year; % of households with publicassistance income; % of people age 16 or older in civilianlabor force currently unemployed; % of males in manage-ment; % of all persons age 25 or older with less than ahigh school degree; and, % of households with more thanone person per room. Using census data, we fit a princi-pal component analysis (PCA) to obtain the item load-ings, which were used to weight each census variable'scontribution to the first principal component. The com-
ponent was standardized to create individual Neighbor-hood Deprivation Indices for census tracts and countieswithin the study area.Neighborhood scalesNeighborhood audit data were averaged across the num-ber of street segments observed per girl, in order to pre-serve the unit of observation as the individual. Because ofthe skewed distribution of several neighborhood items,we did not transform the neighborhood items as thiswould not have helped to normalize the distributions.Rather, the resulting means were dichotomized with thevalue 1 if the targeted attribute was visible on anyobserved street segment within a quarter-mile radius ofthe girl's residence, and 0 if not visible.Other covariatesWeight was measured in kilograms, using a calibrateddigital Tanita® scale TBF 300A, where participants stoodwithout shoes or socks. Height was measured in centime-ters using a fixed stadiometer. Body mass index (BMI)was calculated as the ratio of weight in kilograms over thesquare of height in meters. BMI-for-age ≥85th percentile,using age (in months)-specific distribution standardsfrom the Centers for Disease Control and Prevention, wasdefined as overweight and obese.
Covariates for multivariable regression analysesincluded the girl's age at time of clinic visit (to the nearesttenth year), race/ethnicity (Non-Hispanic White, Afri-can-American, Asian, Hispanic/Latina, "Other or Multi-ple"), BMI, household size, age of birth mother, andhousehold income (< $25,000; $25,000-$49,999; $50,000-$74,999; $75,000-$99,999; ≥$100,000).
Statistical analysisWe estimated the tetrachoric correlation matrix of thestreet audit items and fit an exploratory factor analysis(EFA) with oblique rotation [33], to reduce the dimen-sionality of the neighborhood audit items. We chose EFAin order to identify the underlying variables contributingto the shared variance of the observed neighborhooditems without a priori hypotheses of how these relation-ships may exist. Prior to EFA analysis, specific neighbor-hood item variables were removed due to insufficientvariation in their distributions across the study popula-tion. Multiple EFA models were fit to obtain the numberof factors with the "cleanest" structure [34]. Neighbor-hood item variables were removed individually if theyfailed to load ≥0.45 on any factor or if they had similarloadings on multiple factors. Forty neighborhood itemvariables were retained in the final model. We then cre-ated neighborhood scales by summing the responses ofthe corresponding items. The internal reliability of theneighborhood scales was assessed by calculating Cron-bach's alphas.
Leung et al. International Journal of Behavioral Nutrition and Physical Activity 2010, 7:52http://www.ijbnpa.org/content/7/1/52
Page 5 of 10
The relationships between the Neighborhood Depriva-tion Index and the neighborhood scales derived fromEFA were estimated by Pearson correlation coefficients.Two girls were excluded from the analytical sample dueto missing Neighborhood Deprivation Indices.
Next, using ordinal logistic models, total energy intakequartiles and physical activity quartiles were regressedonto the neighborhood measures. The NeighborhoodDeprivation Index and neighborhood scales were intro-duced separately into the model. The first model adjustedfor the total number of street segments observed per girl.The second model included age, race/ethnicity, and BMI.The third model added covariates of household size, ageof birth mother and household income. Girls wereexcluded from the third model if their household incomewas missing (n = 3). Fitted models were single-level mod-els because girls were originally sampled from a singulardatabase based on being members of KPNC at time ofbirth, rather than sampled from a geographic entity (i.e. acensus block).
Last, we assessed whether weight status or race/ethnic-ity modified the associations between neighborhoodmeasures and total energy intake and physical activity.Interaction terms corresponding to each neighborhoodmeasure were introduced into the third model. Statisticaltests were two-sided and significance was determined atP < 0.05. All statistical analyses were performed usingSAS 9.2 (SAS Institute Inc., Cary, NC, USA).
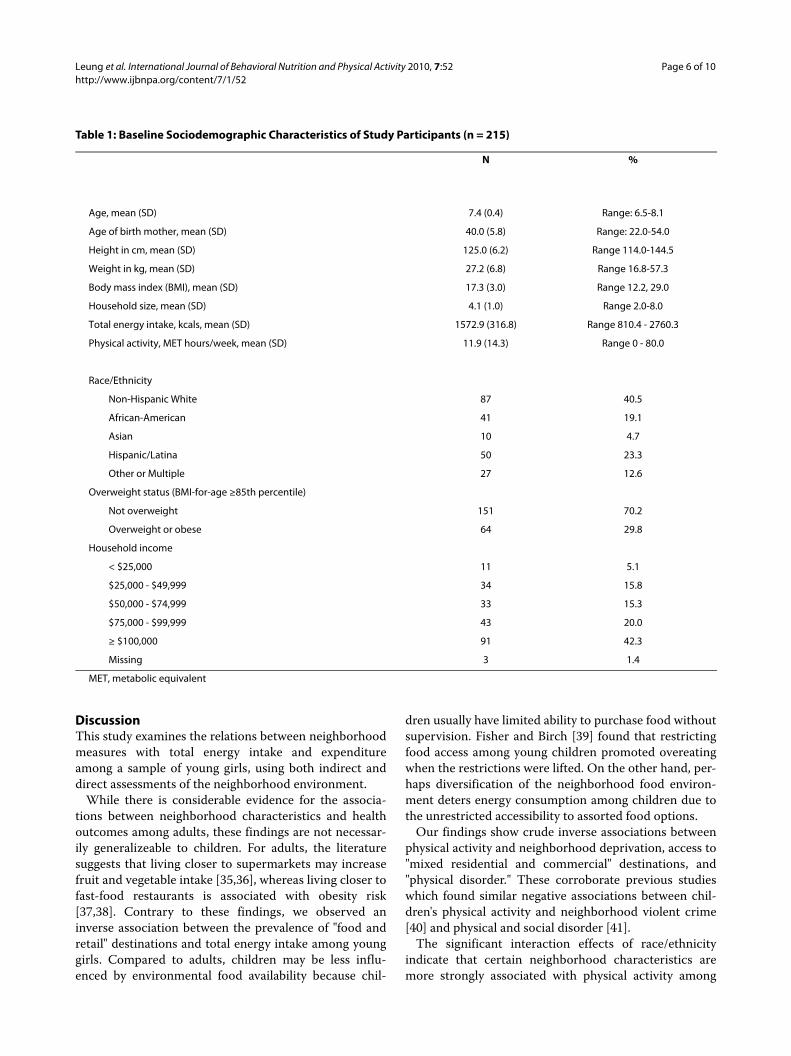
ResultsBaseline sociodemographic characteristics of the studypopulation are shown in Table 1. The mean age was 7.4(0.4) years. The sample was comprised of mostly non-Hispanic Whites (40.5%), followed by Hispanics/Latinas(23.3%), and African-Americans (19.1%). Mean BMI was17.3 (3.0) kg/m2, and 29.8% of girls were overweight orobese, as defined by having a BMI-for-age ≥85th percen-tile.
Six scales initially emerged from the EFA on the neigh-borhood items (see additional file 1: Neighborhood AuditTool Items, Standardized Regression Coefficients andRaw Cronbach's Alphas for Scales Derived From Explor-atory Factor Analysis). The first scale, which we called"mixed residential and commercial," (Cronbach's α =0.87) was associated with 14 items, including residentialproperties, convenience stores, and places of worship.The second scale, called "food and retail" (α = 0.83), wascomprised of 11 items, including restaurants, supermar-kets, and commercial destinations. The third scale, called"recreation" (α = 0.76) was comprised of parks, play-grounds, sports/playing fields, walking trails, and "com-plete sports equipment." The fourth scale called"walkability" (α = 0.50) was comprised of street shoulders,curb extensions, traffic circles, street signs asking drivers
to watch out for children, and playground equipment.The fifth scale, called "physical disorder" (α = 0.58) wascomprised of garbage, litter or broken glass; graffiti; rail-road tracks, bridge, tunnel, highway or overpass; miscel-laneous government buildings; and coffee shops. Onlyone item, "incomplete sports equipment," loaded on asixth scale; therefore, we eliminated this scale from sub-sequent analyses.
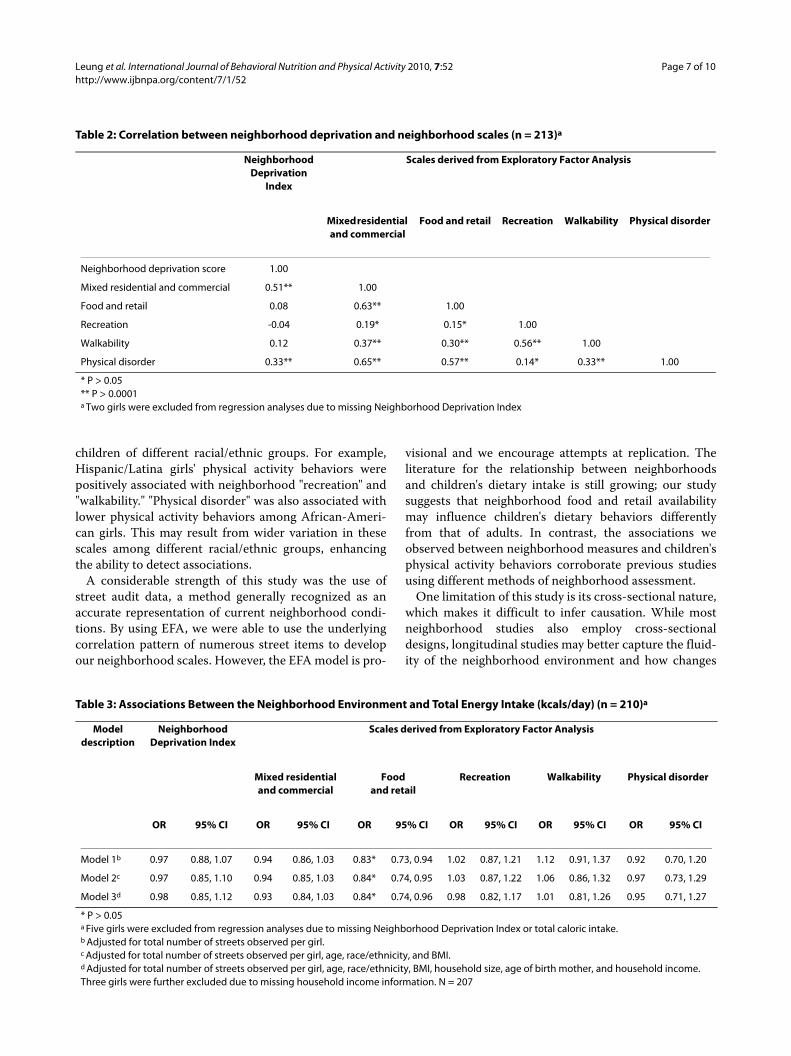
The correlations between the five neighborhood scalesderived from EFA and the Neighborhood DeprivationIndex derived from census information are shown inTable 2. The Neighborhood Deprivation Index was mod-estly positively correlated with both the "mixed residen-tial and commercial" and "physical disorder" scales. The"mixed residential and commercial" scale was also posi-tively correlated with "food and retail" and "physical dis-order."
Table 3 presents the results of logistic regression analy-ses for total energy intake. After adjusting for all covari-ates, "food and retail" was inversely related to total energyintake, where each one-item increase on the "food andretail" scale was associated with a 16% decreased odds ofconsuming the next highest quartile of total energy (OR =0.84, 95% CI 0.74, 0.96). Race/ethnicity did not modifythe associations between neighborhood measures andtotal energy intake.
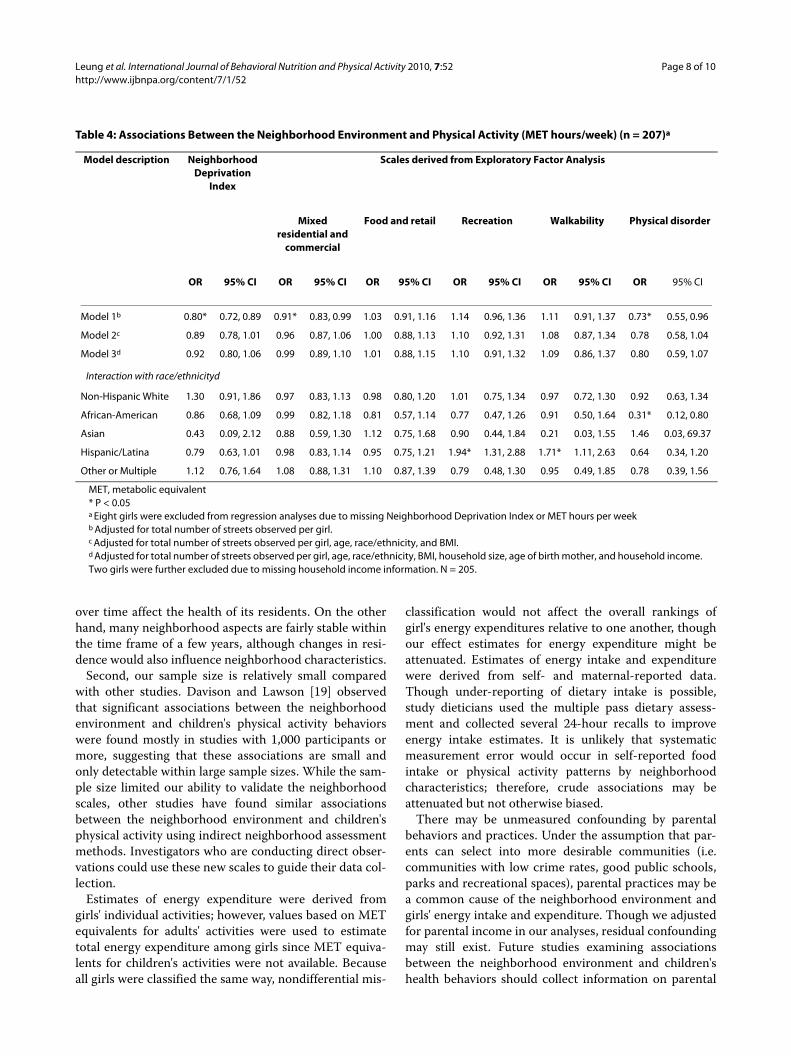
The relations between neighborhood measures andphysical activity, as measured in MET hours per week,are shown in Table 4. In the first model, adjusting for totalnumber of street segments observed per girl, there weresignificant inverse associations between physical activityand neighborhood deprivation (OR = 0.80, 95% CI 0.72,0.89), "mixed residential and commercial" destinations(OR = 0.91, 95% CI 0.83, 0.99), and "physical disorder"(OR = 0.73, 95% CI 0.55, 0.96). However, these associa-tions were attenuated after adjusting for other covariates.
Some associations between the neighborhood mea-sures and physical activity were modified by race/ethnic-ity. In our sample, Asian girls were most active, averaging16.9 MET hours per week, and Hispanic/Latina girls wereleast active, averaging 9.0 MET hours per week. AmongHispanic/Latina girls, both neighborhood recreation andwalkability were positively associated with physical activ-ity. Each one-item increase on the "recreation" scale wasassociated with a 94% increased odds of engaging in thenext highest quartile of physical activity (OR = 1.94, 95%CI 1.31, 2.88). Similarly, each one-item increase on the"walkability" scale was associated with a 71% increasedodds of engaging in the next highest quartile of physicalactivity (OR = 1.71, 95% CI 1.11, 2.63). An inverse associ-ation was also observed between "physical disorder" andphysical activity among African-American girls (OR =0.31, 95% CI 0.12, 0.80).
Leung et al. International Journal of Behavioral Nutrition and Physical Activity 2010, 7:52http://www.ijbnpa.org/content/7/1/52
Page 6 of 10
DiscussionThis study examines the relations between neighborhoodmeasures with total energy intake and expenditureamong a sample of young girls, using both indirect anddirect assessments of the neighborhood environment.
While there is considerable evidence for the associa-tions between neighborhood characteristics and healthoutcomes among adults, these findings are not necessar-ily generalizeable to children. For adults, the literaturesuggests that living closer to supermarkets may increasefruit and vegetable intake [35,36], whereas living closer tofast-food restaurants is associated with obesity risk[37,38]. Contrary to these findings, we observed aninverse association between the prevalence of "food andretail" destinations and total energy intake among younggirls. Compared to adults, children may be less influ-enced by environmental food availability because chil-
dren usually have limited ability to purchase food withoutsupervision. Fisher and Birch [39] found that restrictingfood access among young children promoted overeatingwhen the restrictions were lifted. On the other hand, per-haps diversification of the neighborhood food environ-ment deters energy consumption among children due tothe unrestricted accessibility to assorted food options.
Our findings show crude inverse associations betweenphysical activity and neighborhood deprivation, access to"mixed residential and commercial" destinations, and"physical disorder." These corroborate previous studieswhich found similar negative associations between chil-dren's physical activity and neighborhood violent crime[40] and physical and social disorder [41].
The significant interaction effects of race/ethnicityindicate that certain neighborhood characteristics aremore strongly associated with physical activity among
Table 1: Baseline Sociodemographic Characteristics of Study Participants (n = 215)
N %
Age, mean (SD) 7.4 (0.4) Range: 6.5-8.1
Age of birth mother, mean (SD) 40.0 (5.8) Range: 22.0-54.0
Height in cm, mean (SD) 125.0 (6.2) Range 114.0-144.5
Weight in kg, mean (SD) 27.2 (6.8) Range 16.8-57.3
Body mass index (BMI), mean (SD) 17.3 (3.0) Range 12.2, 29.0
Household size, mean (SD) 4.1 (1.0) Range 2.0-8.0
Total energy intake, kcals, mean (SD) 1572.9 (316.8) Range 810.4 - 2760.3
Physical activity, MET hours/week, mean (SD) 11.9 (14.3) Range 0 - 80.0
Race/Ethnicity
Non-Hispanic White 87 40.5
African-American 41 19.1
Asian 10 4.7
Hispanic/Latina 50 23.3
Other or Multiple 27 12.6
Overweight status (BMI-for-age ≥85th percentile)
Not overweight 151 70.2
Overweight or obese 64 29.8
Household income
< $25,000 11 5.1
$25,000 - $49,999 34 15.8
$50,000 - $74,999 33 15.3
$75,000 - $99,999 43 20.0
≥ $100,000 91 42.3
Missing 3 1.4
MET, metabolic equivalent
Leung et al. International Journal of Behavioral Nutrition and Physical Activity 2010, 7:52http://www.ijbnpa.org/content/7/1/52
Page 7 of 10
children of different racial/ethnic groups. For example,Hispanic/Latina girls' physical activity behaviors werepositively associated with neighborhood "recreation" and"walkability." "Physical disorder" was also associated withlower physical activity behaviors among African-Ameri-can girls. This may result from wider variation in thesescales among different racial/ethnic groups, enhancingthe ability to detect associations.
A considerable strength of this study was the use ofstreet audit data, a method generally recognized as anaccurate representation of current neighborhood condi-tions. By using EFA, we were able to use the underlyingcorrelation pattern of numerous street items to developour neighborhood scales. However, the EFA model is pro-
visional and we encourage attempts at replication. Theliterature for the relationship between neighborhoodsand children's dietary intake is still growing; our studysuggests that neighborhood food and retail availabilitymay influence children's dietary behaviors differentlyfrom that of adults. In contrast, the associations weobserved between neighborhood measures and children'sphysical activity behaviors corroborate previous studiesusing different methods of neighborhood assessment.
One limitation of this study is its cross-sectional nature,which makes it difficult to infer causation. While mostneighborhood studies also employ cross-sectionaldesigns, longitudinal studies may better capture the fluid-ity of the neighborhood environment and how changes
Table 2: Correlation between neighborhood deprivation and neighborhood scales (n = 213)a
Neighborhood Deprivation
Index
Scales derived from Exploratory Factor Analysis
Mixed residential and commercial
Food and retail Recreation Walkability Physical disorder
Neighborhood deprivation score 1.00
Mixed residential and commercial 0.51** 1.00
Food and retail 0.08 0.63** 1.00
Recreation -0.04 0.19* 0.15* 1.00
Walkability 0.12 0.37** 0.30** 0.56** 1.00
Physical disorder 0.33** 0.65** 0.57** 0.14* 0.33** 1.00
* P > 0.05** P > 0.0001a Two girls were excluded from regression analyses due to missing Neighborhood Deprivation Index
Table 3: Associations Between the Neighborhood Environment and Total Energy Intake (kcals/day) (n = 210)a
Modeldescription
NeighborhoodDeprivation Index
Scales derived from Exploratory Factor Analysis
Mixed residentialand commercial
Foodand retail
Recreation Walkability Physical disorder
OR 95% CI OR 95% CI OR 95% CI OR 95% CI OR 95% CI OR 95% CI
Model 1b 0.97 0.88, 1.07 0.94 0.86, 1.03 0.83* 0.73, 0.94 1.02 0.87, 1.21 1.12 0.91, 1.37 0.92 0.70, 1.20
Model 2c 0.97 0.85, 1.10 0.94 0.85, 1.03 0.84* 0.74, 0.95 1.03 0.87, 1.22 1.06 0.86, 1.32 0.97 0.73, 1.29
Model 3d 0.98 0.85, 1.12 0.93 0.84, 1.03 0.84* 0.74, 0.96 0.98 0.82, 1.17 1.01 0.81, 1.26 0.95 0.71, 1.27
* P > 0.05a Five girls were excluded from regression analyses due to missing Neighborhood Deprivation Index or total caloric intake.b Adjusted for total number of streets observed per girl.c Adjusted for total number of streets observed per girl, age, race/ethnicity, and BMI.d Adjusted for total number of streets observed per girl, age, race/ethnicity, BMI, household size, age of birth mother, and household income. Three girls were further excluded due to missing household income information. N = 207
Leung et al. International Journal of Behavioral Nutrition and Physical Activity 2010, 7:52http://www.ijbnpa.org/content/7/1/52
Page 8 of 10
over time affect the health of its residents. On the otherhand, many neighborhood aspects are fairly stable withinthe time frame of a few years, although changes in resi-dence would also influence neighborhood characteristics.
Second, our sample size is relatively small comparedwith other studies. Davison and Lawson [19] observedthat significant associations between the neighborhoodenvironment and children's physical activity behaviorswere found mostly in studies with 1,000 participants ormore, suggesting that these associations are small andonly detectable within large sample sizes. While the sam-ple size limited our ability to validate the neighborhoodscales, other studies have found similar associationsbetween the neighborhood environment and children'sphysical activity using indirect neighborhood assessmentmethods. Investigators who are conducting direct obser-vations could use these new scales to guide their data col-lection.
Estimates of energy expenditure were derived fromgirls' individual activities; however, values based on METequivalents for adults' activities were used to estimatetotal energy expenditure among girls since MET equiva-lents for children's activities were not available. Becauseall girls were classified the same way, nondifferential mis-
classification would not affect the overall rankings ofgirl's energy expenditures relative to one another, thoughour effect estimates for energy expenditure might beattenuated. Estimates of energy intake and expenditurewere derived from self- and maternal-reported data.Though under-reporting of dietary intake is possible,study dieticians used the multiple pass dietary assess-ment and collected several 24-hour recalls to improveenergy intake estimates. It is unlikely that systematicmeasurement error would occur in self-reported foodintake or physical activity patterns by neighborhoodcharacteristics; therefore, crude associations may beattenuated but not otherwise biased.
There may be unmeasured confounding by parentalbehaviors and practices. Under the assumption that par-ents can select into more desirable communities (i.e.communities with low crime rates, good public schools,parks and recreational spaces), parental practices may bea common cause of the neighborhood environment andgirls' energy intake and expenditure. Though we adjustedfor parental income in our analyses, residual confoundingmay still exist. Future studies examining associationsbetween the neighborhood environment and children'shealth behaviors should collect information on parental
Table 4: Associations Between the Neighborhood Environment and Physical Activity (MET hours/week) (n = 207)a
Model description Neighborhood Deprivation
Index
Scales derived from Exploratory Factor Analysis
Mixed residential and
commercial
Food and retail Recreation Walkability Physical disorder
OR 95% CI OR 95% CI OR 95% CI OR 95% CI OR 95% CI OR 95% CI
Model 1b 0.80* 0.72, 0.89 0.91* 0.83, 0.99 1.03 0.91, 1.16 1.14 0.96, 1.36 1.11 0.91, 1.37 0.73* 0.55, 0.96
Model 2c 0.89 0.78, 1.01 0.96 0.87, 1.06 1.00 0.88, 1.13 1.10 0.92, 1.31 1.08 0.87, 1.34 0.78 0.58, 1.04
Model 3d 0.92 0.80, 1.06 0.99 0.89, 1.10 1.01 0.88, 1.15 1.10 0.91, 1.32 1.09 0.86, 1.37 0.80 0.59, 1.07
Interaction with race/ethnicityd
Non-Hispanic White 1.30 0.91, 1.86 0.97 0.83, 1.13 0.98 0.80, 1.20 1.01 0.75, 1.34 0.97 0.72, 1.30 0.92 0.63, 1.34
African-American 0.86 0.68, 1.09 0.99 0.82, 1.18 0.81 0.57, 1.14 0.77 0.47, 1.26 0.91 0.50, 1.64 0.31* 0.12, 0.80
Asian 0.43 0.09, 2.12 0.88 0.59, 1.30 1.12 0.75, 1.68 0.90 0.44, 1.84 0.21 0.03, 1.55 1.46 0.03, 69.37
Hispanic/Latina 0.79 0.63, 1.01 0.98 0.83, 1.14 0.95 0.75, 1.21 1.94* 1.31, 2.88 1.71* 1.11, 2.63 0.64 0.34, 1.20
Other or Multiple 1.12 0.76, 1.64 1.08 0.88, 1.31 1.10 0.87, 1.39 0.79 0.48, 1.30 0.95 0.49, 1.85 0.78 0.39, 1.56
MET, metabolic equivalent* P < 0.05a Eight girls were excluded from regression analyses due to missing Neighborhood Deprivation Index or MET hours per weekb Adjusted for total number of streets observed per girl.c Adjusted for total number of streets observed per girl, age, race/ethnicity, and BMI.d Adjusted for total number of streets observed per girl, age, race/ethnicity, BMI, household size, age of birth mother, and household income. Two girls were further excluded due to missing household income information. N = 205.
Leung et al. International Journal of Behavioral Nutrition and Physical Activity 2010, 7:52http://www.ijbnpa.org/content/7/1/52
Page 9 of 10
perceptions of the neighborhood to better control for anypotential confounding.
The participants from the CYGNET Study may not berepresentative of the general population. All participantswere members of KPNC at birth and at time of recruit-ment, although their health coverage in the interim hasnot been examined. The study sample also tended to befrom higher socioeconomic status households. On theother hand, study participants are diverse racially andethnically, with over 25 percent being Hispanic/Latina,reflecting the diversity of the San Francisco Bay Area.While non-representativeness suggests caution in extrap-olating inferences to the general population, the aim ofthis study was to determine whether variations in neigh-borhood measures are associated with variations inenergy intake or expenditure. As indicated by the sub-stantial variation in the number of street segments thatwere observed per girl, we successfully achieved variationin the neighborhood measures.
Because the study population was comprised of younggirls, we cannot generalize our findings to boys. Previousstudies that have examined the neighborhood environ-ment in relation to energy expenditure have been incon-sistent, with some studies showing stronger associationsin girls [42,43], and others showing larger effects amongboys [44,45]. Further research is warranted to determineif neighborhood environments affect energy intake andexpenditure differentially in girls and boys. Like otherneighborhood studies, we also did not measure how par-ticipants used their neighborhood environments, nor didwe measure the school environment. Therefore, we can-not determine if the observed associations betweenneighborhood measures and dietary and physical activitybehaviors are direct or resultant from unmeasured char-acteristics. However, such information is now being col-lected in follow-up interviews with CYGNET Studyparticipants, enabling future investigation of theseaspects with the neighborhood measures presented here.
ConclusionPrincipal findings of this study include an inverse associa-tion between prevalence of "food and retail" destinationsand total energy intake; positive associations of "recre-ation" and "walkability" with energy expenditure amongHispanic/Latina girls; and an inverse association of "phys-ical disorder" with energy expenditure among African-American girls. These results suggest that neighborhoodfood and retail availability may be inversely associatedwith children's energy intakes in contrast to other studies'findings, which focused on adults. There is considerablevariation in neighborhoods' influences on children'sphysical activity behaviors, particularly for children ofdifferent racial/ethnic backgrounds.
The current body of literature suggests that neighbor-hood characteristics can affect children's health out-comes through numerous processes. It is only when thesemechanisms are better understood by health profession-als, policymakers and community members that we candevelop appropriate policy and behavioral changes topreserve children's health.
Additional material
Competing interestsThe authors declare that they have no competing interests.
Authors' contributionsCL created the analysis plan, conducted the analysis, contributed to the inter-pretation of the data, and drafted the manuscript. SG helped to design thestudy's statistical methodology. BL obtained the census variables and derivedthe Neighborhood Deprivation Index using these measures. LK helped preparethe Materials and Methods section, and is the principal investigator of the CYG-NET data. IY directed the collection of the street audit data, contributed to theoverall study design, helped to direct the study's implementation, and contrib-uted to the interpretation of the data. All authors also contributed to criticallyreviewing and revising the intellectual content of the manuscript, and haveapproved the final submitted manuscript.
AcknowledgementsThe authors thank the participants and families of the CYGNET Study; the CYG-NET Study staff; Louise Swig, David Burian and Anja Simms for collection of street audit data; Marcia Schmidt for supervision of the collection of 24-hour dietary recall data; Barbara Sternfield for technical guidance for measurement of physical activity; Dana Nickleach, Anousheh Mirabedi, and Josh Ergas for data support; and Julianna Deardorff for useful feedback.This work was supported by the National Institute of Environmental Health Sci-ences (grant U01 ES012801), and by the California Breast Cancer Research Pro-gram (grants 12IB-0013 and 14NB-0173)
Author Details1Departments of Nutrition and Epidemiology, Harvard School of Public Health, 665 Huntington Avenue, Boston, MA 02215 USA, 2Division of General Internal Medicine, Department of Medicine, University of California, San Francisco, 3333 California Street, Suite 335, Box 0856, San Francisco, CA 94143-0856 USA, 3Division of Prevention Sciences, Department of Medicine, University of California, San Francisco, 3333 California Street, Suite 465, San Francisco, CA 94118 USA and 4Division of Research, Kaiser Permanente, 2000 Broadway, Oakland, CA 94612 USA
References1. Sallis JF, Glanz K: Physical activity and food environments: solutions to
the obesity epidemic. Milbank Q 2009, 87:123-154.2. Buka SL, Brennan RT, Rich-Edwards JW, Raudenbush SW, Earls F:
Neighborhood support and the birth weight of urban infants. Am J Epidemiol 2003, 157:1-8.
3. Collins JW Jr, Wambach J, David RJ, Rankin KM: Women's lifelong exposure to neighborhood poverty and low birth weight: a population-based study. Matern Child Health J 2009, 13:326-333.
4. English PB, Kharrazi M, Davies S, Scalf R, Waller L, Neutra R: Changes in the spatial pattern of low birth weight in a southern California county: the
Additional file 1 Neighborhood Audit Tool Items, Standardized Regression Coefficients, and Raw Cronbach's Alphas for Scales Derived From Exploratory Factor Analysis. This file describes the results from exploratory factor analysis, including the individual neighborhood audit tool items, standardized regression coefficients, and raw Cronbach's alphas for each of the five derived scales.
Received: 1 February 2010 Accepted: 1 June 2010 Published: 1 June 2010This article is available from: http://www.ijbnpa.org/content/7/1/52© 2010 Leung et al; licensee BioMed Central Ltd. This is an Open Access article distributed under the terms of the Creative Commons Attribution License (http://creativecommons.org/licenses/by/2.0), which permits unrestricted use, distribution, and reproduction in any medium, provided the original work is properly cited.International Journal of Behavioral Nutrition and Physical Activity 2010, 7:52
Leung et al. International Journal of Behavioral Nutrition and Physical Activity 2010, 7:52http://www.ijbnpa.org/content/7/1/52
Page 10 of 10
role of individual and neighborhood level factors. Soc Sci Med 2003, 56:2073-2088.
5. Sargent JD, Brown MJ, Freeman JL, Bailey A, Goodman D, Freeman DH Jr: Childhood lead poisoning in Massachusetts communities: its association with sociodemographic and housing characteristics. Am J Public Health 1995, 85:528-534.
6. Dales R, Wheeler AJ, Mahmud M, Frescura AM, Liu L: The influence of neighborhood roadways on respiratory symptoms among elementary schoolchildren. J Occup Environ Med 2009, 51:654-660.
7. Juhn YJ, Sauver JS, Katusic S, Vargas D, Weaver A, Yunginger J: The influence of neighborhood environment on the incidence of childhood asthma: a multilevel approach. Soc Sci Med 2005, 60:2453-2464.
8. Lovasi GS, Quinn JW, Neckerman KM, Perzanowski MS, Rundle A: Children living in areas with more street trees have lower prevalence of asthma. J Epidemiol Community Health 2008, 62:647-649.
9. Newcomb P, Li J: Predicting admissions for childhood asthma based on proximity to major roadways. J Nurs Scholarsh 2008, 40:319-325.
10. Mueller BA, Rivara FP, Bergman AB: Urban-rural location and the risk of dying in a pedestrian-vehicle collision. J Trauma 1988, 28:91-94.
11. Caughy MO, Hayslett-McCall KL, O'Campo PJ: No neighborhood is an island: incorporating distal neighborhood effects into multilevel studies of child developmental competence. Health Place 2007, 13:788-798.
12. Santos DN, Assis AM, Bastos AC, Santos LM, Santos CA, Strina A, Prado MS, Almeida-Filho NM, Rodrigues LC, Barreto ML: Determinants of cognitive function in childhood: a cohort study in a middle income context. BMC Public Health 2008, 8:202.
13. Booth KM, Pinkston MM, Poston WS: Obesity and the built environment. J Am Diet Assoc 2005, 105:S110-117.
14. Messer LC, Laraia BA, Kaufman JS, Eyster J, Holzman C, Culhane J, Elo I, Burke JG, O'Campo P: The development of a standardized neighborhood deprivation index. J Urban Health 2006, 83:1041-1062.
15. Townsend PPP, Beattie A: Health and deprivation: inequality and the North. London: Routledge; 1988.
16. Carstairs V, Morris R: Deprivation and Health in Scotland. Aberdeen University Press; 1990.
17. Yen IH, Kaplan GA: Neighborhood social environment and risk of death: multilevel evidence from the Alameda County Study. Am J Epidemiol 1999, 149:898-907.
18. Brownson RC, Hoehner CM, Day K, Forsyth A, Sallis JF: Measuring the built environment for physical activity: state of the science. Am J Prev Med 2009, 36:S99-123. e112
19. Davison KK, Lawson CT: Do attributes in the physical environment influence children's physical activity? A review of the literature. Int J Behav Nutr Phys Act 2006, 3:19.
20. Burdette HL, Whitaker RC: Neighborhood playgrounds, fast food restaurants, and crime: relationships to overweight in low-income preschool children. Prev Med 2004, 38:57-63.
21. Blanchette L, Brug J: Determinants of fruit and vegetable consumption among 6-12-year-old children and effective interventions to increase consumption. J Hum Nutr Diet 2005, 18:431-443.
22. French SA, Stables G: Environmental interventions to promote vegetable and fruit consumption among youth in school settings. Prev Med 2003, 37:593-610.
23. Reynolds KD, Franklin FA, Binkley D, Raczynski JM, Harrington KF, Kirk KA, Person S: Increasing the fruit and vegetable consumption of fourth-graders: results from the high 5 project. Prev Med 2000, 30:309-319.
24. Powell LM, Slater S, Mirtcheva D, Bao Y, Chaloupka FJ: Food store availability and neighborhood characteristics in the United States. Prev Med 2007, 44:189-195.
25. Moore LV, Diez Roux AV: Associations of neighborhood characteristics with the location and type of food stores. Am J Public Health 2006, 96:325-331.
26. Lee RE, Cubbin C: Neighborhood context and youth cardiovascular health behaviors. Am J Public Health 2002, 92:428-436.
27. Felton GM, Dowda M, Ward D, Dishman R, Trost S, Saunders R, Pate R: Differences in Physical Activity Between Black and White Girls Living in Rural and Urban Areas. J Sch Health 2002, 72:250-255.
28. Wolff MS, Teitelbaum SL, Pinney SM, Windham G, Liao L, Biro F, Kushi LH, Erdmann C, Hiatt RA, Rybak ME, Calafat AM: Investigation of Relationships between Urinary Biomarkers of Phytoestrogens,
Phthalates, and Phenols and Pubertal Stages in Girls. Environ Health Perspect .
29. Bonat S, Pathomvanich A, Keil MF, Field AE, Yanovski JA: Self-assessment of pubertal stage in overweight children. Pediatrics 2002, 110:743-747.
30. Brownson RC, Hoehner CM, Brennan LK, Cook RA, Elliott MB, McMullen KM: Reliability of 2 Instruments for Auditing the Environment for Physical Activity. Journal of Physical Activity and Health 2004, 1:191-208.
31. Hu FB, Sigal RJ, Rich-Edwards JW, Colditz GA, Solomon CG, Willett WC, Speizer FE, Manson JE: Walking compared with vigorous physical activity and risk of type 2 diabetes in women: a prospective study. JAMA 1999, 282:1433-1439.
32. Kimm SY, Glynn NW, Kriska AM, Fitzgerald SL, Aaron DJ, Similo SL, McMahon RP, Barton BA: Longitudinal changes in physical activity in a biracial cohort during adolescence. Med Sci Sports Exerc 2000, 32:1445-1454.
33. Goldberg LR, Digman JM: Revealing structure in the data: Principles of exploratory factor analysis. In Differentiating normal and abnormal personality Edited by: Strack S, Lorr M. New York: Springer; 1994:216-242.
34. Costello AB, Osborne J: Best practices in exploratory factor analysis: four recommendations for getting the most from your analysis. Book Best practices in exploratory factor analysis: four recommendations for getting the most from your analysis. Editor ed.^eds 2005, 10:.
35. Morland K, Wing S, Diez Roux A: The contextual effect of the local food environment on residents' diets: the atherosclerosis risk in communities study. Am J Public Health 2002, 92:1761-1767.
36. Zenk SN, Lachance LL, Schulz AJ, Mentz G, Kannan S, Ridella W: Neighborhood retail food environment and fruit and vegetable intake in a multiethnic urban population. Am J Health Promot 2009, 23:255-264.
37. Inagami S, Cohen DA, Brown AF, Asch SM: Body Mass Index, Neighborhood Fast Food and Restaurant Concentration, and Car Ownership. J Urban Health 2009.
38. Li F, Harmer P, Cardinal BJ, Bosworth M, Johnson-Shelton D, Moore JM, Acock A, Vongjaturapat N: Built environment and 1-year change in weight and waist circumference in middle-aged and older adults: Portland Neighborhood Environment and Health Study. Am J Epidemiol 2009, 169:401-408.
39. Fisher JO, Birch LL: Restricting access to palatable foods affects children's behavioral response, food selection, and intake. Am J Clin Nutr 1999, 69:1264-1272.
40. Gomez JE, Johnson BA, Selva M, Sallis JF: Violent crime and outdoor physical activity among inner-city youth. Prev Med 2004, 39:876-881.
41. Molnar BE, Gortmaker SL, Bull FC, Buka SL: Unsafe to play? Neighborhood disorder and lack of safety predict reduced physical activity among urban children and adolescents. Am J Health Promot 2004, 18:378-386.
42. Mota J, Gomes H, Almeida M, Ribeiro JC, Santos MP: Leisure time physical activity, screen time, social background, and environmental variables in adolescents. Pediatr Exerc Sci 2007, 19:279-290.
43. Spence JC, Cutumisu N, Edwards J, Evans J: Influence of neighbourhood design and access to facilities on overweight among preschool children. Int J Pediatr Obes 2008, 3:109-116.
44. Colabianchi N, Kinsella AE, Coulton CJ, Moore SM: Utilization and physical activity levels at renovated and unrenovated school playgrounds. Prev Med 2009, 48:140-143.
45. Roemmich JN, Epstein LH, Raja S, Yin L: The neighborhood and home environments: disparate relationships with physical activity and sedentary behaviors in youth. Ann Behav Med 2007, 33:29-38.
doi: 10.1186/1479-5868-7-52Cite this article as: Leung et al., Measuring the neighborhood environment: associations with young girls' energy intake and expenditure in a cross-sec-tional study International Journal of Behavioral Nutrition and Physical Activity 2010, 7:52
http://www.ncbi.nlm.nih.gov/entrez/query.fcgi?cmd=Retrieve&db=PubMed&dopt=Abstract&list_uids=7702117