
E-learning Readiness Analysis (ERA): an e-health case study of e-learning readiness
Upload
khangminh22Category
view
1download
0
C O R P O R A T I O N
BRADLEY MARTIN, MICHAEL E. LINICK, LAURA FRAADE-BLANAR, JACQUELINE GARDNER BURNS, CHRISTY FORAN, KRISTA ROMITA GROCHOLSKI, KATHERINE C. HASTINGS, SYDNEY JEAN LITTERER, KRISTIN F. LYNCH, JARED MONDSCHEIN
Measuring
Strategic ReadinessIdentifying Metrics for Core Dimensions
RR-A453-1 Cover.indd All Pages 5/24/21 2:16 PM

Limited Print and Electronic Distribution Rights
This document and trademark(s) contained herein are protected by law. This representation of RAND intellectual property is provided for noncommercial use only. Unauthorized posting of this publication online is prohibited. Permission is given to duplicate this document for personal use only, as long as it is unaltered and complete. Permission is required from RAND to reproduce, or reuse in another form, any of its research documents for commercial use. For information on reprint and linking permissions, please visit www.rand.org/pubs/permissions.
The RAND Corporation is a research organization that develops solutions to public policy challenges to help make communities throughout the world safer and more secure, healthier and more prosperous. RAND is nonprofit, nonpartisan, and committed to the public interest.
RAND’s publications do not necessarily reflect the opinions of its research clients and sponsors.
Support RANDMake a tax-deductible charitable contribution at
www.rand.org/giving/contribute
www.rand.org
For more information on this publication, visit www.rand.org/t/RRA453-1
Library of Congress Cataloging-in-Publication Data is available for this publication.
ISBN: 978-1-9774-0622-4
Published by the RAND Corporation, Santa Monica, Calif.
© Copyright 2021 RAND Corporation
R® is a registered trademark.
Cover photo by Cpl. Alisha Grezlik / Defense Visual Information Distribution Service

iii
Preface
For nearly three decades, the U.S. national defense community focused on challenges from nonstate actors or small regional powers. The rise in renewed aggressive behavior from near peers resulted in revision of the National Defense Strategy to emphasize major-power competition.1 This competition implies not just the ability to successfully carry out military operations in the short term but also the abilities to generate and protect readiness in key industries and infrastructure and to conduct research for competition and conflict over longer periods.
In May 2019, the Office of the Under Secretary of Defense for Personnel and Readiness (OUSD [P&R]), asked RAND to provide a method and specific metrics to enable OUSD (P&R)—and the entire defense community—to more fully answer questions concerning the nation’s readiness to execute the National Defense Strategy. Focusing on seven newly defined core dimensions of strategic readiness, we were asked to assess whether those seven dimensions were sufficiently broad to effectively evaluate DoD’s strategic readiness and to define additional dimensions if needed.
The development of the core dimensions can be traced, in part, to a series of readiness research projects, both conducted within DoD and conducted by RAND on behalf of DoD. The RAND research included assessments of some of the limits and untapped potential of the Defense Readiness Reporting System (DRRS). Other recent research also highlighted the need for a more holistic approach to thinking about readiness than was provided by DRRS and its primary focus on unit and campaign assessments.
This effort was informed by several years of RAND studies looking at aspects of readiness and different approaches for characterizing it. For this project, we were asked to map the relationships between the core dimensions of readiness and to develop examples of how readiness-related questions could be explored within that mapping. To answer these questions, the team developed two methodologies for examining the relationships between the core dimensions and evaluating how changes in one dimension might affect another across three time horizons. Using four case studies, we demonstrated the use of the methodologies and how to assess the interactions between readiness dimensions. The applications of the methodology, the analyses of the interactions, and results are contained in this report. The research reported here was completed in October 2020 and underwent security review with the sponsor and the Defense Office of Prepublication and Security Review before public release.
1 See U.S. Department of Defense (DoD), Summary of the 2018 National Defense Strategy of the United States of America: Sharpening the American Military’s Competitive Edge, Washington, D.C., 2018.

iv
This research was sponsored by the Office of the Under Secretary of Defense for Personnel and Readiness and conducted within the Forces and Resources Policy Center of the RAND National Security Research Division (NSRD), which operates the RAND National Defense Research Institute (NDRI), a federally funded research and development center (FFRDC) sponsored by the Office of the Secretary of Defense, the Joint Staff, the Unified Combatant Commands, the Navy, the Marine Corps, the defense agencies, and the defense intelligence enterprise.
For more information on the RAND Forces and Resources Policy Center, see www.rand.org/nsrd/frp or contact the director (contact information is provided on the webpage).

v
Contents
Preface............................................................................................................................................ iii Figures........................................................................................................................................... vii Tables ............................................................................................................................................. ix
Summary ......................................................................................................................................... x
Acknowledgments........................................................................................................................ xvi Abbreviations .............................................................................................................................. xvii 1. Introduction ................................................................................................................................. 1
Research Objective and Approach ............................................................................................................ 2
Examining the Core Dimensions of Strategic Readiness .......................................................................... 4
The Case Studies ..................................................................................................................................... 11
Organization of This Report .................................................................................................................... 13
2. General Methodology ............................................................................................................... 14
Methodology 1: Interactive Methodology............................................................................................... 14
Methodology 2: System Methodology .................................................................................................... 24
Employing the Methodologies ................................................................................................................ 26
3. Case Study: Unit Training and Presence Trade-offs................................................................. 28
Introduction ............................................................................................................................................. 28
Application of the Interactive Methodology ........................................................................................... 31
Relevant Variables .................................................................................................................................. 31
Interactions Between Variables ............................................................................................................... 34 Analysis of the Unit Training and Presence Trade-offs Framework and Readiness
Dimension Interactions ..................................................................................................................... 39
Key Insights............................................................................................................................................. 45
4. Case Study: Readiness of the Medical Force ............................................................................ 47
Introduction ............................................................................................................................................. 47 Application of the Interactive Methodology ........................................................................................... 50
Relevant Variables .................................................................................................................................. 51
Interaction Between Variables and Parameters ....................................................................................... 58
Analysis of the Medical Readiness Framework and Readiness Dimension Interactions ....................... 63
Key Insights............................................................................................................................................. 70
5. Case Study: Increased Air Force Force Structure ..................................................................... 72
Introduction ............................................................................................................................................. 72
Application of the Interactive Methodology ........................................................................................... 73
Key Variables and Parameters ................................................................................................................ 74
Interactions Between Variables ............................................................................................................... 77
Analysis of Air Force Structure Interactions ........................................................................................... 86
Key Insights............................................................................................................................................. 89

vi
6. Case Study: Impact of Deferring Overseas MILCON .............................................................. 91
Introduction ............................................................................................................................................. 91
Application of the System Methodology ................................................................................................ 91
Key Variables and Parameters ................................................................................................................ 94 System Analysis ...................................................................................................................................... 96
Key Insights............................................................................................................................................. 98
7. Conclusions and Recommendations ....................................................................................... 100
Practicality ............................................................................................................................................. 100
Framework for Readiness Assessment .................................................................................................. 102 Implementation Recommendations ....................................................................................................... 104
Implementation Options ........................................................................................................................ 105
Final Observations................................................................................................................................. 106
Appendix. Compiled Table of Proposed FY 2020 MILCON Projects Located Outside the United States ................................................................................................................... 107
References ................................................................................................................................... 111
vii
Figures
Figure 1.1. Core Dimension Interactive Hierarchy ....................................................................... 10
Figure 2.1. Summary of the Interactive Methodology .................................................................. 14
Figure 2.2. Example Interaction Matrix Drawn from the Unit Training and Presence Trade-offs Case Study........................................................................................................... 16
Figure 2.3. Example Variable-Level Network Diagram Drawn from Readiness of the Medical Force Case Study .............................................................................................. 19
Figure 2.4. Example Dimension-Level Network Diagram Drawn from Readiness of the Medical Force Case Study .............................................................................................. 20
Figure 2.5. Example Potential Inhibitor Variable Drawn from Unit Training and Presence Trade-offs Case Study ........................................................................................... 21
Figure 2.6. Sample Network Diagram for Calculating Connectedness at the Dimension Level ................................................................................................................... 23
Figure 2.7. Summary of System Methodology ............................................................................. 25
Figure 3.1. Variable Interaction Matrix—Unit Training and Presence Trade-offs ...................... 35
Figure 3.2. Interactions Between Variables Diagram—Unit Training and Presence Trade-offs .............................................................................................................. 37
Figure 3.3. Interactions Between Dimensions of Readiness Diagram—Unit Training and Presence Trade-offs ........................................................................................................ 38
Figure 3.4. Number of Variable-Level Interactions Between Readiness Dimensions— Unit Training and Presence Trade-offs ................................................................................. 43
Figure 3.5. Number of Pairwise Connections Between Readiness Dimensions— Unit Training and Presence Trade-offs ................................................................................. 44
Figure 3.6. Interaction Diagram for Readiness Dimensions—Unit Training and Presence Trade-offs .............................................................................................................. 44
Figure 4.1. Variable Interaction Matrix—Readiness of the Medical Force ................................. 59
Figure 4.2. Interactions Between Variables and Parameters Diagram—Readiness of the Medical Force ................................................................................................................. 61
Figure 4.3. Interactions Between Dimensions of Readiness Diagram—Readiness of the Medical Force ................................................................................................................. 62
Figure 4.4. Number of Variable-Level Interactions Between Readiness Dimensions— Readiness of the Medical Force Case Study ......................................................................... 68
Figure 4.5. Total Number of Pairwise Connections Between Readiness Dimensions— Readiness of the Medical Force Case Study ......................................................................... 68
Figure 4.6. Interaction Diagram for Readiness Dimensions—Readiness of the Medical Force Case Study .................................................................................................... 69
viii
Figure 5.1. We Assess Readiness Variables Across Three Time Horizons.................................. 74
Figure 5.2. Interaction Matrix, Years Zero to Three..................................................................... 79
Figure 5.3. Interaction Matrix, Years Two to Seven .................................................................... 80
Figure 5.4. Interaction Matrix, Years Five to Fifteen ................................................................... 81
Figure 5.5. System Diagram, Years Zero to Three ....................................................................... 82
Figure 5.6. System Diagram, Years Zero to Three, Magnitude 3 Interactions Only .................... 83
Figure 5.7. System Diagram, Years Two to Seven, Magnitude 3 Interactions Only.................... 84
Figure 5.8. System Diagram, Years Five to 15, Magnitude 3 Interactions Only.......................... 85
Figure 5.9. Percentage of Interactions Falling Within Each Readiness Area over Time ............. 88
Figure 5.10. Percentage of Interactions at Different Levels of Magnitude over Time ................. 89
Figure 6.1. Structure of Systems Methodology for Assessing Impact of MILCON Project on Readiness Dimension .......................................................................................... 93
Figure 6.2. Structure of Systems Methodology for Assessing Impact of MILCON Project on Military Effectiveness.......................................................................................... 97
Figure 6.3. Distribution of Impacts of OCONUS MILCON Projects Across Readiness Dimensions ........................................................................................................................... 98

ix
Tables
Table 3.1. Relevant Variables in the Unit Training and Presence Trade-offs Case Study ........... 33
Table 3.2. Connectedness of Unit Training and Presence Trade-offs Variables .......................... 40
Table 3.3. Connectedness of Readiness Dimensions in the Context of Unit Training and Presence Trade-offs ........................................................................................................ 40
Table 3.4. Impact Potential of Unit Training and Presence Trade-offs Variables ........................ 41
Table 3.5. Impact Potential of Readiness Dimensions in the Context of Unit Training and Presence Trade-offs ........................................................................................................ 42
Table 4.1. Key Variables in the Readiness of the Medical Force Case Study .............................. 52
Table 4.2. Additional Relevant Scenario-Related Parameters ...................................................... 57
Table 4.3. Readiness of the Medical Force Variables with the Highest Connectedness .............. 64
Table 4.4. Connectedness of Readiness Dimensions in the Context of Readiness of the Medical Force ................................................................................................................. 65
Table 4.5. Readiness of the Medical Force Variables with the Highest Impact Potentials .......... 66
Table 4.6. Impact Potential of Readiness Dimensions in the Context of Readiness of the Medical Force ................................................................................................................. 67
Table 5.1. Key Variables in the Increased Air Force Force Structure Case Study ....................... 75
Table 5.2. Most-Connected Variables .......................................................................................... 86
Table 5.3. Variables with the Most Impact Potential.................................................................... 87
Table 6.1. Variables Related to the CNMI MILCON Projects Affecting Operational Readiness .......................................................................................................... 94
Table 6.2. Variables Related to the CNMI MILCON Projects Affecting Structural Readiness... 95
Table A.1. FY 2020 Proposed OCONUS MILCON Projects .................................................... 107

x
Summary
For the past five years, the RAND Corporation has worked with the Office of the Secretary of Defense to explore a more expansive approach to readiness assessments—one that looks beyond the narrow lens of operational readiness more typical of readiness systems in use in the department today and considers a broader set of dimensions that could have an impact on readiness outcomes. This more expansive perspective is beneficial because it can lead to a better understanding of the root cause of readiness shortfalls—or, at a minimum, better insights into how to uncover the root cause—and, in turn, inform more-effective solutions to remedy them. Each research effort conducted over this period has built on the prior and culminated in this report’s novel methodology that could be adopted by the U.S. Department of Defense (DoD) to assess its strategic readiness.
In May 2019, the Office of the Under Secretary of Defense for Personnel and Readiness (OUSD [P&R]), asked RAND to provide a method and specific metrics to enable OUSD (P&R) and the entire defense community to more fully answer questions about the nation’s readiness to execute the National Defense Strategy. In developing those methods and metrics, we were asked to focus on seven core dimensions of strategic readiness, as newly defined by the Office of the Secretary of Defense (OSD) and the Joint Staff, to assess whether those seven dimensions were sufficiently broad to effectively evaluate DoD’s strategic readiness—and to define additional dimensions if needed. These readiness dimensions are as follows:
1. Military effectiveness—the quality, skill, integration, and responsiveness of military forces vis-à-vis a competitor. It requires the performance of similar military activities better than an opponent and is applicable across all warfare domains.
2. Operational readiness—the status of major force elements, i.e., whether they have the resources and training right now to undertake the mission for which they were organized and designed.
3. Force posture—the global organization, distribution, and employment of military forces in furtherance of military strategy.
4. Structural readiness—the speed at which DoD can bring existing forces that are not operationally ready at the beginning of military operations to an employable and deployable state in required time.
5. Mobilization readiness—the swift and deliberate structural expansion of military forces to close the gap between the supply of or demand for actual capability needed now and potential capability needed later.
6. Sustainment readiness—how well the nation and its industrial base can meet the continual demand signal for ready forces, equipment, materiel, and munitions until the conclusion of operations.
7. Resilience—the ability of military forces, military infrastructure, and critical national infrastructure to absorb, withstand, and (when necessary) rapidly recover from the full force of enemy attack in all warfighting domains.

xi
Research Approach
Develop an Assessment Methodology
We were asked to develop a practical approach to mapping and measuring readiness at the strategic level and across seven very different but interdependent dimensions. Our solution was to develop two general methodologies that had broad utility but still required subject-specific expertise to apply. Building on prior phases of this research, the two methodologies—one using an interactive and one using a systems approach—enable assessment of different types of readiness problems in a common framework across all the dimensions. We could not provide a set of generalizable formulas or equations—like those that measure equipment readiness or training readiness in units. But we could provide a set of approaches that (1) allow for detailed analysis and (2) provide a common language that subject-matter experts (SMEs) could use to measure and discuss readiness and readiness trades with a common language.
The methodologies, the steps of which are detailed in Figure S.1, use two different approaches to assessing readiness. The first methodology uses an interactive approach that is useful for identifying readiness problems and interactions that might not be otherwise evident. The process begins with identification of the readiness-related issue and iterative identification of factors relevant to the issue and how they relate to each other and to the core strategic readiness dimensions. These interactions are then displayed and analyzed to identify those that most contribute to the problem at hand and to help identify potential solutions.
The interactive methodology is most useful for identifying and mapping interactions in broad readiness questions or programs, but sometimes the requirement is to analyze specific project-level investments, for which the system methodology is better suited. In these cases, interactions between readiness dimensions and their underlying variables are analyzed independently. So, for example, the interactive methodology could be used to look at a question of overall force structure growth in a specific capability area (as will be demonstrated in case studies)—sort of a “class” of readiness. By contrast, the systems methodology would look at a specific action—in our case, a specific set of military construction (MILCON) projects and not the entire category of MILCON. This systems methodology involves slight but important differences from the interactive methodology by using systems modeling to enable the identification and understanding of variables that may not appear directly related to the project yet, in fact, enable or inhibit the anticipated readiness benefit.
These methodologies can be applied to a wide array of readiness issues, projects, and decisions. Both methodologies can be used independently to analyze most readiness questions, or they can be used sequentially—employing the interactive analysis to help refine the discrete questions, followed by system analysis to add depth to the understanding of key issues.

xii
Figure S.1. Summary of Readiness Assessment Methodologies
Demonstrate the Methodology on Disparate Case Studies
The group of researchers working on our project, some of them readiness SMEs and some with other areas of expertise, formed four teams. These teams developed and then demonstrated these methodologies using four case studies, each of which examined a typical DoD strategic readiness question, examining how actual resources, policies, systems, processes, environmental aspects, and other factors would affect readiness. The assessments provide a broad view of the interactions between the core dimensions of strategic readiness relevant to the specific readiness question and a detailed accounting of how key variables interact at a discrete level. The four case studies examined are as follows:
1. Unit Training and Presence Trade-offs looked at the Navy’s challenges in balancing maintenance and operational availability. The intent of this case study was to develop a framework to assess how near-term reductions in ship availability—to allow maintenance backlogs to be cleared and add to the level of crew maintenance training—would affect
Interactive Methodology
Step 1: Identify and describe readiness-related issue to be analyzed.
Step 2: Identify variables relevant to the analysis.
Step 3: Create (first-order) interaction matrix.
Step 4: Iterate on Steps 2 and 3 as needed to refine set of relevantvariables.
Step 5: Compute network analysis metrics of interest.
Step 6: Create visual representation(s) of interactions.
Step 7: Analyze results to identify key insights or findings.
System Methodology
Step 1: Identify and describe the readiness project or decision to be assessed
Step 2: Identify the readiness dimension(s) affected by the project/decision
Step 3: Identify direct inputs
Step 4: Identify external enablers
Step 5: Identify external inhibitors
Step 6: Assess how the project/decision impacts overall militaryeffectiveness

xiii
future levels of availability. In other words, our intent was to understand the trade-offs between near-term and long-term readiness.
2. Readiness of the Medical Force looked at readiness of the military medical systems, specifically how readiness (and the ability) to provide medical care in deployed settings is not solely dependent on the ability or readiness of the medical providers but also relies on a broader array of systems. The methodology was able to pinpoint how these various systems interact and the strength of the interactions.
3. Increased Air Force Force Structure examined the Air Force’s decision to increase the number of operational squadrons between now and 2030. This case study maps and quantifies the many dependencies associated with force structure expansion—resources (personnel and equipment), infrastructure, and training, among others—to illuminate the implications for readiness if the various resource demands go unmet.
4. Impact of Deferring Overseas MILCON analyzed the implication for operational readiness, structural readiness, sustainment readiness, and military effectiveness of two specific MILCON projects.
The interactive methodology was used in the assessment in the first three cases, the system methodology to examine the fourth. The primary purpose of the case studies was to demonstrate how the methodologies could be tailored to assess a varied set of readiness concerns; the results were not intended to produce specific policy guidance.
Key Findings Associated with Our Readiness Assessment Framework The body of this report contains detailed descriptions of how the relevant methodologies
were applied to each case and of the resulting implications for the core dimensions of strategic readiness, and we refer the interested reader to those discussions. Here, we offer a set of cross-cutting findings that emerge from the readiness assessments.
• The core strategic readiness dimensions encompass enough of the major elements of readiness to be useful in assessing the nation’s overall ability to respond to conflicts at various levels. Some terms, such as structural and mobilization readiness, do not align well with how DoD typically uses these terms and require care in how they are messaged and discussed. That said, we did identify some variables that could not be categorized within these dimensions, which suggests that continued work will be required to revise the definitions and ensure that they are enough.
• Operational readiness is well measured and understood but can be misleading if not placed in a broader framework. Attempts to optimize operational readiness variables by monitoring changes in Defense Readiness Reporting System (DRRS) categories could miss important interactions between other readiness dimensions that have a direct effect on optimizing operational readiness.
• Military effectiveness would seem to be an apex dimension but is, in fact, only weakly associated with other dimensions. Military effectiveness appears to be a second-order effect, with such dimensions as structural, sustainment, and operational readiness more directly influenced by resource changes.
• Readiness dimensions persist in impact across time and must be connected to other departmental processes. The case studies clearly illustrated the interconnected nature of

xiv
the core readiness dimensions and the degree to which these relationships vary. Prominent interactions can evolve over different time frames (near, middle, and long term) with significant policy implications.
• Although the proposed framework effectively captures enduring dimensions, scenario circumstances have a significant and variable impact. All case studies show strong associations with a class of variables that do not easily fit into the readiness dimensions. Typically, these relate to scenario-specific variables, such as specific theater transportation requirements, which often cannot be generalized until a specific situation arises. It is difficult to provide an assessment of how ready the system is to respond to such variables within our general framework. But the framework does provide an effective description of factors that must be present to deal with scenario requirements.
• The methodologies provide a mechanism for objective and reproducible reviews of readiness issues but still require SME interpretation. Inputs to these assessment frameworks require engagement by SMEs. But the methodology does provide a systematic framework in which the assessment of different observers can be aggregated, saved, revised, and reused to speed up subsequent analysis and open new analytic opportunities.
Practicality The methodologies described and applied in this report can be used as policy analysis tools,
but the primary value of the framework and methodologies is conceptual rather than immediately practical.
The interactive methodology is primarily intended to look at a broad area and find associations without knowing in advance where relationships are likely to be strongest. This can inform what kinds of readiness issues providers should be addressing, but it will not immediately yield a specific decision. That will take additional analysis and interpretation. The system methodology is intended to answer specific questions that might result from application of the interaction analysis or could result from some other process, such as program budget review. But it should not be viewed as a tool that will yield an answer absent someone asking an informed question.
So, the practical aspect of this report does not deliver a “Strategic Readiness Scorecard.” Nor does it sit on an action officer’s desk and provide an answer, at a level-3 level of detail, to “how ready is the department to do x?” Instead, as we will argue, just as the core dimensions provide a useful framework for beginning to understand more about strategic readiness, the methodologies presented in this report provide two useful frameworks for further developing that understanding and moving it through level 2 and potentially into a level-3 system of data collection, analysis, and reporting requirements.

xv
Implementation Recommendations The overall framework, including consideration of the readiness dimensions and application
of the methodologies, requires different thinking than is currently applied in readiness assessment. Fully implementing the framework will require collection, or at least collation, of some data not currently held in data sets available to DoD. Several steps should be undertaken to facilitate an assessment of strategic readiness:
• The OSD’s draft directive on strategic readiness, which defined the seven dimensions, or some close equivalent should be adopted as policy. Clear direction will be needed to effectively implement a different approach to discussing and analyzing readiness.
• Depictions of readiness need to clearly specify what dimension(s) of readiness they are addressing and what time frames are included. This is particularly important for operational readiness. All analysis should include near-, middle-, and long-term effects.
• Service and agency program objective memorandum (POM) submissions should include an assessment of how well they support strategic readiness goals. We acknowledge that direction to perform the analysis we describe in this report will likely be resisted as staff intensive, but, without this kind of analysis, only a small part of the overall enterprise can reasonably be called optimized. This may be easier to accomplish if broad readiness assessments are conducted year-round and then incorporated as entering arguments into POM development.
• Program budget review should be explicitly connected to readiness deficiencies identified in the front-end assessment, with program budget review actions assessed in terms of impact across readiness dimensions (as we describe in this report). As with the front-end assessment, this requires effort. However, the methodology proposed in this report can guide such an effort, and the results allow discussion that currently is simply not possible with the data provided.
Final Observations This research is the culmination of several years of work on readiness, all of which points to
the need for a comprehensive approach to readiness, going far beyond the relatively easily measured factors that the current system provides in DRRS. DoD has continued to modify its approach to match overall readiness to broader strategic frameworks. The current effort to use dimensions of readiness as a basis for analysis captures enough of the major elements needed for a thorough understanding of the factors necessary to assess and improve the nation’s ability to respond to the range of challenges. We do caution, however, that no readiness analysis will tell a policymaker what to do. The best that can be provided is increasingly useful data that can show the wide range of effects that are likely to happen once a decision is made.

xvi
Acknowledgments
We would like to thank the reviewers, Lisa Harrington and LTG(Ret) Mitchell Stevenson. We are also grateful for the guidance of Assistant Secretary of Defense Veronica Daigle, Deputy Assistant Secretary of Defense Matthew Shipley, Lt Col Scott Geer, and Eric Carpenter.

xvii
Abbreviations
AoR area of responsibility
CNMI Commonwealth of the Northern Mariana Islands
CONUS continental United States
COVID-19 coronavirus disease 2019
DoD U.S. Department of Defense
DOTMLPF-P doctrine, organization, training, materiel, leadership and education, personnel, facilities, and policy
DOW died of wounds
DRRS Defense Readiness Reporting System
DTM Directive Type Memorandum
FY fiscal year
GAO U.S. Government Accountability Office
IDA Institute for Defense Analyses
JMPT Joint Medical Planning Tool
KSA knowledge, skills, and ability
LOGDET logistics detail
MEFPAK Manpower and Equipment Force Packaging System
MILCON military construction
MHS Military Health System
MTF medical treatment facility
Mx maintenance
OCONUS outside the continental United States
OFRP (Navy’s) Optimized Fleet Response Plan
OPTEMPO operational tempo
OSD Office of the Secretary of Defense
OUSD (P&R) Office of the Under Secretary of Defense for Personnel and Readiness

xviii
PESTONI personnel, equipment, supply, training, ordnance, networks, and infrastructure
POI point of injury
POM program objective memorandum
RTD return to duty
SME subject-matter expert
TPFDD Time Phased Force Deployment Data
UMD unit manning document
USINDOPACOM U.S. Indo-Pacific Command

1
1. Introduction
For nearly three decades, the U.S. national defense community has focused on challenges from nonstate actors or small regional powers. These challenges levied demands that were, in many ways, a departure from longer-term historical patterns. The rise of China and the renewed aggressive behavior of Russia resulted in revision of the National Defense Strategy to emphasize major-power competition.2 This competition implies not only the ability to successfully carry out military operations in the near term but also the ability to generate and protect readiness in key industries and infrastructure and to conduct research for competition and conflict over longer periods.
In May 2019, the Office of the Under Secretary of Defense for Personnel and Readiness (OUSD [P&R]), asked the RAND Corporation to provide a method and specific metrics to enable OUSD (P&R) and the entire defense community to more fully answer questions about the nation’s readiness to execute the National Defense Strategy. In developing those methods and metrics, we were asked to focus on seven core dimensions of strategic readiness, as newly defined by the Office of the Secretary of Defense (OSD) and the Joint Staff. These dimensions were developed to provide a more complete view of the factors essential to ensuring readiness to execute the National Defense Strategy. These dimensions of readiness were designed to “provide a framework that ensures the DoD [U.S. Department of Defense] appropriately organizes, trains, and equips for deterrence, and when necessary, combat,”3 and their definitions are as follows:
1. Military effectiveness. Military effectiveness is the quality, skill, integration, and responsiveness of military forces vis-à-vis a competitor. It requires the performance of similar military activities better than an opponent and is applicable across all warfare domains. Technological superiority, coupled with the operational concepts to exploit it (i.e., what can be termed modernization), are key to military effectiveness. Militarily effective forces must be able to overcome fundamental military problems posed by adversaries.
2. Operational readiness. Operational readiness is the type of readiness associated with the status of major force elements, i.e., whether they have the resources and training right now to undertake the mission for which they were organized and designed. 4 It indicates whether an existing unit or force element is at peak capability for combat
2 See U.S. Department of Defense, Summary of the 2018 National Defense Strategy of the United States of America: Sharpening the American Military’s Competitive Edge, Washington, D.C., 2018. 3 OSD, “Dimensions of Strategic Readiness,” memorandum, undated. 4 Joint Publication 1-02 defines operational readiness as “the capability of a unit/formation, ship, weapon system, or equipment to perform the missions or functions for which it is organized or designed” (U.S. Joint Chiefs of Staff, Department of Defense Dictionary of Military and Associated Terms, Joint Publication 1-02, Washington, D.C., January 2020, p. 167).

2
according to known standards. It entails whether there are enough units in a deployable and employable state to meet demand for current operations and/or the beginning of major military operations, i.e., commencement day.
3. Force posture. In keeping with the OSD (Policy) definition, force posture is the global organization, distribution, and employment of military forces in furtherance of military strategy. Force posture recognizes three interdependent elements used to define, plan for, and assess U.S. foreign and overseas military presence: forces, footprints, and agreements. Militarily effective and operationally ready forces must be correctly postured to ensure strategic relevance.
4. Structural readiness. Structural readiness considers the speed at which DoD can develop a joint force of enough size and capability to defeat the forces an enemy can make available over time. In other words, it involves how quickly DoD can bring existing forces that are not operationally ready at the beginning of military operations to an employable and deployable state in required time. It is constrained by the limits of organized potential capacity and capability in existing forces before mobilization.
5. Mobilization readiness. Mobilization readiness is the swift and deliberate structural expansion of military forces to close the gap between the supply of or demand for actual capability needed now and the supply of or demand for potential capability needed later. It involves the proper sequencing and synchronization of rapid manpower expansion with the training and equipping of personnel and industrial production.
6. Sustainment readiness. Sustainment readiness entails how well the nation and its industrial base can meet the continual demand signal for ready forces, equipment, materiel, and munitions until the conclusion of operations. Crucially, it not only involves moving forces and materiel to distant theaters and logistically sustaining those forces in the field but also encompasses assessing how rapidly the nation can reconstitute losses due to attrition.
7. Resilience. This dimension of readiness reflects the ability of military forces, military infrastructure, and critical national infrastructure to absorb, withstand, and (when necessary) rapidly recover from the full force of an enemy attack in all warfighting domains. Resilience ensures that DoD and its interagency partners are capable of actively pursuing the National Security Strategy and National Defense Strategy objectives for extended durations.5
Research Objective and Approach
We were asked to provide an external, holistic look at the seven defined dimensions and provide feedback on the following questions:
• Are the dimensions sufficiently broad for effective evaluation of DoD’s strategic readiness—and is it possible to define additional dimensions if needed?
• What kinds of insights can DoD gain by use of the domains, and what kinds of methods might help DoD develop those insights and better measure readiness?
5 The dimensions are drawn from a draft Directive Type Memorandum (DTM) on Strategic Readiness that is not available to the general public.

3
• How are the domains related to each other, and how does mapping help decisionmakers understand how systemic inputs (most commonly funding or resource changes, but potentially policy changes or changes in any of the doctrine, organization, training, materiel, leadership and education, personnel, facilities, and policy [DOTMLPF-P] areas) propagate through those relationships and cause second- and third-order effects across the domains?
We were specifically asked to accept the seven dimensions and their definitions as is, with some room for suggestions of increased clarity, but not to recommend fundamental changes. Through the analyses, we found that the provided dimensions and definitions adequately covered the range of activities executed by DoD and necessary to consider in an assessment of DoD’s strategic readiness.
Put differently, what we found was that the core dimensions were useful—and, we believe, more useful than not having this integrating framework (i.e., using only inputs from the Defense Readiness Reporting System [DRRS] or having only stovepiped readiness inputs from other DoD data sources). As with all modeling efforts, it is never really a question of whether the model is “right” or “wrong”; it is a question of how well the model helps in understanding a complex reality in a simpler way. Further, as will be highlighted below, the model would benefit from continued refinement to make it more useful.
We were also asked to focus on practical methodologies and specifically asked not to solely provide a theoretical model. This proved only partially feasible. To understand how these core dimensions interact, some theoretical development was necessary—both with regard to what strategic readiness is and with regard to how the dimensions interact to provide it. However, the theoretical analysis did lead to the development of useful exemplars of practical applications.
In developing our approach to map and measure readiness, we decided to develop two general methodologies that had broad utility but still required subject-specific expertise to apply. Building on prior phases of this research, the two methodologies—one using an interactive and one using a systems approach—enable assessment of different types of readiness problems in a common framework across all the dimensions. We could not provide a set of generalizable formulas or equations, like those that measure equipment readiness or training readiness in units. But we could provide a set of approaches that (1) allow for detailed analysis and (2) provide a common language that subject-matter experts (SMEs) could use to measure and discuss readiness and readiness trades with a common language..
Using mappings developed early in the research and refined continuously throughout, we conducted four distinctly different readiness case studies: one focused on the Navy’s challenges in balancing maintenance and operational availability, one focused on the readiness of the medical force, one focused on changes in force structure, and one focused on military construction (MILCON).
It is important to understand that these methodologies are not, themselves, readiness models. Instead, they are a way in which SMEs can develop subject-specific models that highlight broad

4
strategic readiness effects. The models developed using these methodologies can be continuously refined and improved, as relationships are better understood or as new data are collected. But, because the various applications of the models (each subject-specific) are developed using a similar methodology, there is an improved ability to see how the different models relate to each other because they share a common structure, lexicon, and approach.
Examining the Core Dimensions of Strategic Readiness Before we could map the relationships between the core dimensions of strategic readiness,
we needed to understand the following key things about each of the dimensions:
• What are the components of the area being assessed? • What is, or must be, assumed within this specific area of assessment? • What levers are available if one is not happy with the results of the readiness assessment? • What can be measured and how? • How accurately can parameters be measured (and how accurately must they be measured)
using what data?
For example, military effectiveness is defined as having the following components: quality of the force, skill of the force, integration of the force, responsiveness of the force, technological superiority of the force, and operational concepts of the force. All of these are measured in relative and contextual terms (the joint force is better or worse than a specific adversary in a specific context), not in absolute terms (the joint force has a score of “x”). Furthermore, the terms are not additive; instead, shortfalls in one can be made up with strengths in another—still measured, however, against a static picture of the opponent. Alter any aspect of the context (for example, an opponent’s effectiveness), and it becomes a different assessment.
We also came to a few important realizations (influenced heavily by earlier readiness research) that significantly influenced our approach to the rest of the study. Three critical (admittedly theoretic) aspects of readiness affect how one thinks about measuring readiness:
1. Readiness is a relative function, not an independent one, and all readiness must be measured against a standard. The higher the level of fidelity with which the standard is defined, the more effectively readiness to meet it can be measured. The lower the fidelity of the standard’s definition, the lower the fidelity of the measurement of readiness. Therefore:
a. Readiness must be measured in terms not just of for what, with what, for when,6 but also of how well and how. Changes in the definition of any of those terms will change what it means to be ready, and changes in the specificity of the definition of any of those will change how well readiness will or can be measured.
6 Richard K. Betts, Military Readiness: Concepts, Choices, Consequences, Washington, D.C.: Brookings Institution, 1995. See, specifically, Chapter 1.

5
b. The higher the level of analysis (e.g., soldier, small team, unit, formation), the more potential paths exist to achieve readiness. Only one of them must be viable, but identifying all the permutations and determining their likely outcome is difficult. Also, the more complex the mission statement and the more complex the resource options available, the more pathways become available. More than one of them is likely to be viable. Deciding which to resource is a policy decision for which a model cannot provide a right answer.
c. The more specifically the standard is defined, the fewer the cases to which that standard will apply; the more broadly the standard is defined, the more broadly it can be applied (e.g., no two campaign plans have the same requirements for readiness, as defined here, but two different general strategic plans might). Finding the right balance is an art, not a science.
2. Readiness is a “wasting function.” It requires constant injections of resources to maintain at any given level, and different types of readiness operate on different timelines with regard to injections of new resources effecting an increase in readiness level. So, time is also a critical factor to consider in assessing readiness. Further, the wasting nature affects not just the near term (training decay), but also the middle and long terms (obsolescence, inadequate doctrine, failing infrastructure).
3. Readiness is a “wicked problem.”7 The intervening variables between injecting a resource and measuring the final impact on readiness are dense and difficult to map. These variables are unlikely to align in the same way again. The implication is that there is a constant need to reassess how resources are affecting readiness—throughout the process, not just at the end state. This issue with variables also suggests the challenge of attempting to measure and map readiness with any degree of precision. The most feasible course of action is to observe general relationships, their direction, and their general order of magnitude.
This set of observations has a profound impact on the kinds of output that an analysis like this—or a strategic readiness assessment methodology such as this research is designed to provide—can produce.
A unit assessment process can provide a specific and repeatable outcome. Based on a defined set of standardized metrics, a unit is C-1, or R-1 or T-2—and even though that assessment is a snapshot in time and could easily change the next day, the readiness rating is assumed to carry forward until the next report is submitted. The purpose of the assessment is twofold. First, it provides that snapshot-in-time assessment, which (a) has some utility in explaining force
7 Wicked problems have been described as those in which “the information needed to understand the problem depends upon one’s idea for solving it. That is to say: in order to describe a wicked problem in sufficient detail, one has to develop an exhaustive inventory of all conceivable solutions ahead of time. The reason is that every question asking for additional information depends upon the understanding of the problem—and its resolution—at that time. Problem understanding and problem resolution are concomitant to each other. Therefore, in order to anticipate all questions (in order to anticipate all information required for resolution ahead of time), knowledge of all conceivable solutions is required” (Horst W. Rittel and Melvin M. Webber, “Dilemmas in a General Theory of Planning,” Policy Sciences, Vol. 4, 1973, p. 161). There are more definitions and views but, in general, the problems described all are in a class with those faced by DoD with regard to understanding readiness.

6
readiness and the potential of the force to be used in the near term and (b) can be used to inform specific decisions related to the global force management process. Second, it provides resourcing clues as to what may be needed to improve (or sustain) a unit’s or the force’s readiness level. Presumably, the aggregation of these resourcing clues provides information on how to program for such things as spare parts, consumable supplies, training ranges, and other elements of the DoD program. As some of our earlier research suggests, however, these are not always clear resource demands. Often, the shortages (e.g., trained pilots, equipment readiness rates) are masking other problems (e.g., training of the maintainers). However, if the underlying causes can be determined, a specific funding answer can be developed that clearly and directly links to fixing the problem. Whether that funding is provided, in whole or in part, is a risk and resource decision made by the relevant service or staff. In other words, a unit-level readiness system can provide a specific funding decision to which a senior leader can apply his or her risk metric and make a clear decision—and presumably then track whether the funding (or absence thereof) created the expected result.
In a similar way, campaign-level assessments, for all their documented faults, still provide a well-defined mark on the wall—a requirement. The ability of the department to meet that requirement can be assessed with some precision and fidelity. This is because all the facts and assumptions were worked out as part of the campaign plan development. What is left is a time-phased list of capability demands (and the associated supply and services demands of those capabilities over time), as represented in a Time Phased Force Deployment Data (TPFDD) database (and the plan’s logistic annexes). What is being assessed is whether the department can deliver those demands in the time frame called for by the plan. In other words, an entire set of assumptions, guidance, assessments, and calculations are aggregated and captured in a very specific TPFDD and operations plan. This specificity allows for discrete and repeatable measurements and for documentation of any shortfalls, but it assumes that the underlying analysis that led to the plan’s specific demands is still accurate and relevant. However, given that assumption, this process allows for a decisionmaker to be provided with a risk and resourcing choice that is directly (if imperfectly) measurable.
Measuring strategic readiness is fundamentally different. The specificity of even the best National Security Strategy, force sizing construct, or Defense Programming Guidance is vague compared to a campaign plan and its TPFDD. Strategic readiness must consider multiple time frames, multiple potential input options, multiple possible demand signals, and multiple possible ways to meet the amorphous requirement. Even with an effective force sizing construct, the level of planning and analysis needed to aggregate all of the demands and requirements, over time and across threats, is just too vast and uncertain to allow for the creation of a TPFDD-like strategic document that defines the requirement.
What a readiness methodology can provide are assessments of the general nature of the impacts of different decisions on the different dimensions of readiness. It can measure—imperfectly, imprecisely, and yet usefully—how favoring near-term readiness investments may

7
affect long-term readiness outcomes (or vice versa). A strategic readiness methodology can help illuminate, even if it cannot fully describe, how changes in force structure will stress (and relieve stress on) readiness in different dimensions in different time frames. In other words, strategic readiness assessments are far less specific and far less predictive than are unit- or campaign-level assessments. They provide decisionmakers with a first-order set of guidance on general trends that are likely to occur in response to a change in funding or policy, but they provide it across the breadth of what DoD does and not just in one analytic stovepipe. If developed far enough, these types of assessments can also point out where the key friction points are likely to be. This can provide enough information to form more-specific investment questions with more-specific answers that can—and should—affect specific program-level investments. But on a first-order pass, it is, admittedly, less than satisfying for a staff-intensive process not to result in an outcome that gives senior leaders clearly defined choices at a programmatic level.
Thus, our focus was on understanding and developing methods to measure the interrelationships between the strategic readiness dimensions. And, as we analyzed the dimensions of readiness and considered their inputs and outputs, as well as how time played a role in the analysis, we developed an initial mapping of relationships. In developing this mapping, we began by grappling with how the dimensions interacted. Was there a hierarchy? Were influences unidirectional or bidirectional? How strong was the effect? For example, did a change in sustainment readiness cause changes in mobilization readiness? Sometimes, always, or never? Was the impact large or small? And, did mobilization readiness changes also affect sustainment readiness?
Our first attempts resulted in a set of diagrams like the one depicted in Figure 1.1. In this diagram, we proposed a hierarchy that suggested that military effectiveness and resilience were interrelated (the arrow connecting them points in both directions) and were impacted by the other readiness dimensions. However, we also postulated that changes in military effectiveness and resilience were dependent on changes in the other dimensions—but did not themselves cause changes in such things as mobilization readiness or sustainment readiness (hence, the arrows are unidirectional from the bottom five dimensions to the top two).
In this example of an initial mapping, we also postulated that sustainment readiness was an intermediate step that translated mobilization, operational, and structural readiness into military effectiveness and resilience. Put another way, we proposed that mobilization, operational, and structural readiness processes built a usable force, but that sustainment readiness was the necessary intermediate step for turning that force from its potential capability into its actual capability.
Finally, we saw the three dimensions on the lowest levels; they all interacted with each other (note the bidirectional arrows) and, in combination, produced outputs that fed into sustainment readiness and, through it, into military effectiveness and resilience. And since primary inputs occurred at this bottom level, we postulated that they were where change would first be observable, and that it would take time for that change to propagate through the intermediate

8
steps and create change in military effectiveness. Put another way, a direct change in structural readiness resourcing or policy will not be observable in a changed state of military effectiveness for some period, and, in the interim, that direct change will have caused changes in operational and/or mobilization and sustainment readiness levels first.
The placement of military effectiveness at the top of the hierarchy seemed intuitive; all the other forms of readiness are designed to build military effectiveness. In fact, as will be shown in the case studies, military effectiveness is rarely the dimension directly affected by the variables we examined. Instead, it often grows or shrinks as a secondary effect, when one of the other domains (or several of them) are affected. Thus, injections of resources designed to improve sustainment readiness will, as a secondary effect, also improve military effectiveness.
As indicated in the figure, resilience is also at the top of the hierarchy. We placed it there according to intuition rather than to hard data or modeling. For a variety of reasons, resilience is the dimension on which we spent the least time and effort. Intuitively, it also is the indirect beneficiary of improvements in the other dimensions of readiness. Resilience is also, perhaps, the most difficult to measure.
As an initial attempt, it seemed to make sense to put the key building blocks of readiness (what I can do now—operational readiness; what I can do, additionally, with resources I own—structural readiness; and how well I can access new resources—mobilization readiness) on the same level. Sustainment readiness seemed a necessary intermediate step adjoining these three building blocks: It is what gets that readiness to where it needs to be and then allows it to “stay in the fight.”
One of the discoveries from doing this initial mapping was the level of redundancy between force posture and structural readiness (hence, the lack of inclusion of the force posture dimension in these diagrams). Posture addresses how and where forces are located and how that location affects the ability to respond to contingencies—or to deter such contingencies by their presence or responsiveness. In many ways, structural readiness does the same thing but includes the specific goals of bringing less-ready forces up to an employable readiness level in a meaningful period, which is an aspect of responsiveness. Both rely on similar assessments of the strategic transportation system and the “mobilization” system (we will explain later why “mobilization” is in quotes). It may be possible to roll force posture into other dimensions—something we did in developing the mapping depicted in Figure 1.1. Alternatively, it may be desirable to better define and articulate force posture to better deconflict it with the other dimensions.
Although we started with a deductive approach—trying to map the relationships between dimensions, working from our understanding of their definitions and our subject-matter expertise—subsequent analysis, as will be depicted in the case studies in later chapters of this report, suggested that an inductive approach might make more sense. By starting with the subelements of a particular readiness question and determining which dimensions we believed they were best placed in, and with which dimensions we thought they most likely interacted, we

9
could develop unique mappings for each question that could validate or suggest changes to our deductive mapping.
What we found was that there does not appear to be a single macro mapping of the relationship. For different readiness questions, the strength of the interactions will vary, the connectivity or direction of influence of the different dimensions will also vary, and there will be some number of key issues that do not fall directly into one of the core dimensions but have an important effect on understanding the specific readiness question. As an example, some of these additional facilitating inputs may be the effects of the operational environment (e.g., the types of casualties expected in a campaign have a direct effect on the kinds of medical readiness needed to support that campaign).8
8 We note that operational readiness, as defined above, is primarily about two things—whether the units are ready enough (or the distribution of that readiness), and whether there are enough of each type of them to do what needs to be done. This discussion of casualty rates, then, is a good example of the problems also discussed earlier, with regard to the difference between strategic readiness and campaign readiness analysis. In the campaign analysis, the casualties expected can be approximated, and the specific medical requirements that they imply can be calculated (and entered into the TPFDD). In strategic readiness assessments, unless the entire strategy is to be assessed against only one (or maybe two) campaigns at a specific time and with all other dimensions being held constant (so the force modernization, force structure, distribution of readiness, strategic transportation capacity, etc., are all “fixed” for analytic purposes), the casualties are not clearly articulable, and the specific requirements are not definable. It is this lack of definable characteristics that suggests to us that the operational environment can be looked at to help refine understanding of strategic readiness issues (an instantiation of a specific set of demands that can be compared to other instantiations with varying demand signals but is not, itself, embedded within the analysis of operational readiness.

10
Figure 1.1. Core Dimension Interactive Hierarchy
NOTES: Arrows, indicating direction of influence, are sometimes unidirectional and sometimes bidirectional. Force posture is taken as an overarching condition and not included in the interactive matrix.
Thus, this figure and some derivations of it (explained in Chapter 2) were necessary to get us started but were then supplanted by the more informative mappings that were generated by each readiness case study—examples of which appear in each of the case study chapters. Still, understanding this initial, deductive approach and how we used it is foundational to understanding how we developed the methodologies that are the core output of this research. For us, this discussion of mapping and relationships—direction, magnitude, and sequencing—became the basis for how we decided to conduct our case studies. The case studies, in turn, helped us refine our understanding of the relationships.
Another discovery made while developing the initial methodology was that, while the terminology employed in the definitions of structural and mobilization readiness are technically correct, they are culturally problematic. The current DoD-wide general understanding of the term mobilization applies to activities associated with bringing DoD’s seven reserve components onto active duty and preparing them for employment. However, in the context of the core dimensions, this activity falls under structural readiness—the ability of the department to employ resources it already owns at the start of a contingency. The perhaps traditionally correct usage of mobilization as the ability of the department to access additional new resources—specifically, personnel and materiel—is what the core dimension of mobilization readiness is focused on, and that ability requires the department to do assessments of law, policy, the industrial base, and
Structural Readiness
Operational Readiness
Mobilization Readiness
Sustainment Readiness
Military Effectiveness Resilience
Readiness components to consider at base level are similar across time horizons
Evaluation of effectiveness and resiliency changes on longer time horizons

11
other, outward-facing factors (e.g., demographics).9 This terminology issue is not a fatal flaw but will require careful attention when the department considers how to discuss these two core dimensions with wider audiences.
Later, in the case studies, we also discovered—or, more properly, confirmed what we suspected—that the dimensions are highly interactive. Any attempt to trace a resource injection (or lack thereof) within one dimension always leads to investigation of another. In fact, one of the things we found was that to independently analyze a specific readiness dimension (e.g., military effectiveness), one almost must assume the outputs of the others. In other words, in measuring military effectiveness, one would assume a certain output from structural readiness and/or force posture that would determine the specific force and specific timeline for delivery of that force. Different techniques for understanding variances—and critical factors—in that force timeline could be used, but there are simply too many interactions available if other dimensions of readiness are permitted to “float”—hence, the wicked nature of readiness measurement at higher levels of analysis. It was this discovery that shifted our focus to case studies and analysis of how, or whether, we could observe what happens as inputs propagate through multiple dimensions.
The Case Studies To conduct the case studies, we established four teams, each of which would examine a
“typical” DoD or department-level strategic readiness question at the input level—how actual resources, policies, systems, processes, environmental aspects, and other factors would impact readiness. Each team, using the same initial basic understanding that we had developed about interactions between the dimensions and examining interactions using the PESTONI (personnel, equipment, supply, training, ordnance, networks, and infrastructure) factors within the dimension, was tasked to map and quantify (at a very high level of abstraction) readiness impacts of these inputs to the extent possible.10 Each of the four case studies described real-life departmental resourcing decisions and focused on decisions that particularly affected three key dimensions: structural posture, mobilization, and sustainment.11
9 Two good sources for discussions of the traditional view of mobilization are Alan L. Gropman, Mobilizing U.S. Industry in World War II: Myth and Reality, McNair Paper 50, Washington, D.C.: Institute for National Strategic Studies, National Defense University, August 1996; and Maury Klein, A Call to Arms: Mobilizing America for World War II, New York: Bloomsbury Press, 2013. 10 Note that PESTONI is similar to, but in some ways more expansive than, the more common DOTMLPF-P terminology. We believed PESTONI would have more utility in this analysis. The choice between the two constructs, however, is just that—a choice; either will work. 11 There was no particular reason for the four case studies we developed. We down-selected from a larger set of options that met the following criteria: the issue posed a real budgetary question within the department or service; the scenario was suggestive of a wide-enough readiness question as to affect multiple readiness dimensions; we had to have access to sufficient expertise and data to do the assessment; and the question couldn’t be classified. Some of

12
The first study, Unit Training and Presence Trade-offs, centered around the Navy’s challenges in balancing maintenance and operational availability. Previous RAND work had examined how low training levels of sailors on ships led to an inability of the crews to accurately forecast the maintenance required by the ship once it returned to port for a maintenance evolution.12 This inability, in turn, led to delays in shipyard maintenance and reduced availability for operational deployments—putting pressure on the Navy to shorten the predeployment training cycle, which affected crew training and perpetuated the cycle.
In this project, the intent of the case study was to provide a framework to assess how near-term reductions in ship availability—to allow maintenance backlogs to be cleared and add to the level of crew maintenance training—would affect future levels of availability. In other words, is it possible to trade near-term readiness for long-term readiness? And, if so, at what cost? These assessments primarily affect structural readiness (the speed with which a quantity of ships can be generated, and the time required to train sailors) but have significant effects on operational readiness—and via that, on military effectiveness—and interact with several other core dimensions.
The second study, Readiness of the Medical Force, explored readiness of the military medical system—specifically, how readiness and the ability to provide medical care in deployed settings is not solely dependent on the ability or readiness of the medical providers but also relies on several systems. Therefore, we analyzed medical provider readiness (i.e., knowledge, skills, and ability [KSA]), the supply chain (e.g., access to supplies and resupply capability), and transportation. All these factors play major roles and have an underlying dependence on uninterrupted communication and command and control, especially in contested environments. The intent was to determine how these systems interact to build sustainment readiness and operational readiness, as well as how they rely on or interact with mobilization readiness and resilience.
The third case study, Increased Air Force Force Structure, examined the Air Force’s decision to increase the number of operational squadrons between now and 2030. This increase in aircraft and associated flight crews has secondary effects or places demands on tens of thousands of additional airmen in supporting roles, and all the associated resources (personnel and equipment), infrastructure, and training. By mapping and quantifying those dependencies, we could examine how a decision based on military effectiveness (the imperative driving the Air Force decision to expand squadrons) interacted with the other dimensions—and, in doing so, affected the ability to forecast resource demands in all of the supporting areas and the readiness
the nonselected cases were impacts of moving DoD money to fund the border wall; improving contracting efficiency; burden-sharing with partner nations; and diverting funding to pay for defense support to civil authorities missions (specifically, hurricane response). 12 See, for example, Robert W. Button, Bradley Martin, Jerry M. Sollinger, and Abraham Tidwell, Assessment of Surface Ship Maintenance Requirements, Santa Monica, Calif.: RAND Corporation, RR-1155-NAVY, 2015.

13
impacts of meeting, or failing to meet, those demands. For this study, we also evaluated three different time frames to show how readiness effects across the dimensions changed over time.
For the last case study, Impact of Deferring Overseas MILCON, we chose two interrelated MILCON projects located in Joint Region Marianas-Tinian in the Commonwealth of the Northern Mariana Islands (CNMI): a project to construct a new jet fuel system, including harbor fuel receipt, a pipeline, fuel storage, and high–flow rate fuel delivery to a parking apron hydrant system and truck stands; and a project that provides site development for Air Force access to Tinian International Airport.13 These MILCON projects were analyzed across operational readiness, structural readiness, sustainment readiness, and military effectiveness.
The four teams, operating from a common understanding of the readiness dimensions, developed two different methodologies—an interactive model adopted by three teams using essentially identical processes, but adapting the application of that process to the specifics of their area of inquiry, and a system methodology used by the MILCON team.
Organization of This Report The remainder of this report discusses the findings and conclusions of the case studies.
However, before turning to the case studies, we begin in Chapter 2 with a detailed discussion of the methodologies developed and used in analyzing the cases. Chapters 3 through 6 apply the methodology to each of the four case studies—unit training and presence, medical readiness, increasing Air Force force structure, and military construction—detailing the findings and conclusions from our analyses. Chapter 7 draws together the overall findings and conclusions from our efforts, with emphasis on the value of using a structured methodology as demonstrated here to inform departmental decisionmaking.
13 These projects were selected as the focus of this case study because their readiness implications were sufficiently broad to enable an assessment across all readiness types.

14
2. General Methodology
Although the four case studies were examined separately and concurrently by our four teams of researchers, the Unit Training and Presence Trade-offs, Readiness of the Medical Force, and Increased Air Force Force Structure case studies applied a similar interactive methodology to their investigations. The approach to the Impact of Deferring Overseas MILCON case study was inherently different and used a system methodology. In this chapter, we present a general description of these two methodologies; specific details and deviations of the methodologies employed by a particular case study are discussed in its respective chapter.
Methodology 1: Interactive Methodology Methodology 1 uses an interactive approach that is useful for identifying readiness problems
and interactions that might not be otherwise evident. The seven steps of this approach, depicted in Figure 2.1, begin with identification of the readiness-related issue and iteratively identify relevant factors and how they relate to each other. These interactions are then displayed and analyzed to identify those that most contribute to the problem at hand and to help identify potential solutions. This section contains a detailed description of each step.
Figure 2.1. Summary of the Interactive Methodology
Interactive Methodology
Step 1: Identify and describe readiness-related issue to be analyzed
Step 2: Identify variables relevant to the analysis
Step 3: Create (first-order) interaction matrix
Step 4: Iterate on Steps 2 and 3 as needed to refine set of relevantvariables
Step 5: Compute network analysis metrics of interest
Step 6: Create visual representation(s) of interactions
Step 7: Analyze results to identify key insights or findings

15
Detailed Description of Interactive Methodology
Step 1: Identify and Describe Readiness-Related Issue to Be Analyzed
The first step of any analysis should be to identify the question to be addressed. Here, the readiness issue should be fully defined so that the analyst has a comprehensive understanding of it. A description of the issue should include any inciting events or motivation, as well as any perceived consequences (benefits or drawbacks) of the decision(s) or action(s) under scrutiny.
Step 2: Identify Variables Relevant to the Analysis
Once the issue or proposal to be analyzed has been fully described, it is necessary to identify the set of parameters that play a role in the analysis. Often, a limited set of variables form the focal point of change in an analysis—“What if I change X?”—but a much larger set of variables will be affected by such a change. It is typically easier to identify the variables that are likely to change, but it may be more difficult to identify the entire set of variables that may ultimately be affected.
In some instances, a particular outcome may be of interest in the analysis. For example, in the Unit Training and Presence Trade-offs case study, we are particularly interested in assessing how changes to unit training times affect U.S. naval presence in the near and far terms. While a number of readiness-related concerns arise from modifications to training, this case study narrowed its focus to only one—presence. When both the principal variable and outcome of interest are clear, the analysis then centers on identifying the intermediate variables and parameters that link these two aspects. This may be more easily achieved than the identification of all affected variables in a case study that is more open ended, such as the Increased Air Force Force Structure case study.
The particular method used to generate a relevant set of variables may differ according to the analysis at hand. However, we suggest an iterative approach that begins with a small set of pertinent and, likely, obvious variables (e.g., in the context of the Unit Training and Presence Trade-offs case study, an obvious set of initial variables are training time and forward presence). For each variable, such questions as the implications of changes to a variable, the other things dependent on that variable, or whether the variable is dependent on something else help to identify other variables that may be relevant to the analysis. The analyst(s) should continue in this manner until their set of variables converges. (Note that the set of variables will continue to be revised as the interaction matrix in Step 3 is created to ensure that only direct, first-order interactions are captured.)
In general, using existing frameworks, such as PESTONI, DOTMLPF-P,14 and associated readiness metrics (e.g., unit resource ratings for personnel, equipment and supplies on hand,
14 See U.S. Joint Chiefs of Staff, 2020, p. 266.

16
equipment condition, and training), to guide the identification of pertinent variables may prove beneficial to the analyst.
Step 3: Create (First-Order) Interaction Matrix
The purpose of identifying variables relevant to the analysis is to further identify the pairwise relationships that exist between them. An interaction matrix can be used to help organize this information. The variables identified in Step 2 form both row and column headers in this matrix, and the cell at the intersection of a row and column contains information on the interaction between the corresponding variables; specifically, the cell indicates whether a change in the row header variable directly causes a change or has an effect on the column header variable.15 We consider this to be a first-order interaction. Figure 2.2 shows an example of an interaction matrix in which the entire set of variables under consideration forms both the row and column headers of the matrix.
Figure 2.2. Example Interaction Matrix Drawn from the Unit Training and Presence Trade-offs Case Study
NOTE: Mx = maintenance.
The representation of interactions can take a variety of forms and be either simple or complex. Examples of simple indicators include “yes”/“no,” which shows whether an interaction
15 When identifying interactions, we focus on first-order interactions only. That is, an interaction is reflected only if a change to one variable causes an immediate or direct change in another variable. We do not consider or indicate secondary interactions or beyond in the matrix because these inhibit the ability to observe direct connections between variables and readiness dimensions. Secondary effects and beyond can be determined by following a chain of interactions throughout the matrix.
Training time
Crew certifications
Skill proficiency
Mx properly predicted
Duty time
Efficient and effective
performance
Error reports
Equipment usage
Scheduled/predicted
Mx
Unscheduled Mx
Shipyard capacity
Availability for deployment
Forward Presence
Credible deterrence
TrainingTraining time + + + +
Crew certifications − + +
Job Performance
Skill proficiency + + − + − +Mx properly
predicted −
Duty time −Efficient and
effective performance
− + − − +
Error reports + + −
Utilization and Mx
Equipment usage + +Scheduled/predicted
Mx − −
Unscheduled Mx − − − −
Shipyard capacity − +
Deterrence Effect
Availability for deployment − + +
Forward Presence +Credible deterrence
Training time
Crew certifications
Skill proficiency
Mx properly predicted
TrainingTraining time + +
Crew certifications − +
Job Performance
Skill proficiency + +Mx properly
predicted

17
exists, and “positive”/“negative”/“none,” which not only indicates whether an interaction exists but also provides insight into the relationship between the variables. (Note that it is necessarily the case that no variable directly affects itself, so no interaction is indicated.) A positive interaction indicates that the variables move in tandem, while a negative interaction indicates that the variables are inversely related and move in opposite directions.
The matrix in Figure 2.2 uses a simple interaction notation. For example, in the enlarged section at the lower right of Figure 2.2, we see that “crew certifications” has a negative interaction with “Training time,” as indicated by the “−” in the cell at the intersection of the “Crew certifications” row and “Training time” column, and a positive interaction with “Skill proficiency,” as indicated by the “+” at the intersection of the “Crew certifications” row and “Skill proficiency” column. Thus, an increase in completion of crew certifications by personnel leads to a decrease in required training (an effect in opposite directions), and it also causes an increase in crew proficiency (an effect in the same direction). Note that the effect of A on B may not be the same as the effect of B on A. Blank cells indicate a lack of direct interaction between a variable and itself or no first-order interaction between variables.
Complex indicators may go beyond just “positive”/“negative”/“none” assignments and assign magnitudes to the interactions (when such differences can be determined or estimated). In such cases, descriptors (e.g., “none,” “small,” “moderate,” “large”) or numerical values (e.g., –3, –2, –1, 0, 1, 2, 3) may be used to describe the relative difference in magnitudes of interactions. Ideally, specific quantifiable measures of interactions would be assigned to each interaction. However, such data often do not exist, or assigning a specific quantity would be quite difficult. Therefore, in the absence of quantitative measures, expert opinion can be substituted. Interactions should be described with as much detail as possible.
Because the objective of this analysis is to identify and understand relationships between individual or categories of variables, as well as readiness dimensions, some grouping and/or categorization of variables is necessary and important. For example, variables may be categorized according to a common association (e.g., personnel, equipment, job performance) and/or may be classified according to a strategic readiness dimension. In some cases, it may also be possible to classify an interaction according to a readiness dimension. As a means of organizing data in a single location (and to aid in the creation of visualizations in Step 6), such categorizations should be indicated on the interaction matrix.
Step 4: Iterate on Steps 2 and 3 as Needed to Refine the Set of Relevant Variables
It is often the case that some variables are overlooked during initial identification or that creation of the interaction matrix, which focuses on first-order interactions, brings to light the need for additional variables. In some cases, it may also be that variables initially identified in Step 2 are found to be unnecessary or even redundant and can be removed from consideration. Therefore, Step 4 is characterized by an iterative process between Steps 2 and 3 that works to refine and finalize the set of variables to be considered.

18
Step 5: Compute Network Analysis Metrics of Interest
Network-related metrics can aid in understanding the types and levels of interactions that exist and serve to highlight critical interactions or variables. Several such metrics exist, and their selection may be dependent on the construction of the analysis. Here, we have identified and implemented two metrics that are applicable to all three case studies. These metrics act as measures of importance of individual variables or dimensions and will be described later in this chapter. The way these metrics are used in a readiness assessment may be tailored to the case, as we will show in Chapters 3 through 5.
For example, the Increased Air Force Force Structure case study associated variables and interactions with readiness dimensions in a different manner than did the Unit Training and Presence Trade-offs and Readiness of the Medical Force case studies. As a result, additional analyses were logical for some of the case studies, which are described within their respective chapters. Note that the suggested metrics in the various case studies are meant to provide an initial understanding of the system at hand, rather than function as perfect indicators of system behavior. Additional discussion related to this matter is presented with the network metric analyses as appropriate.
Step 6: Create Visual Representation(s) of Interactions
The interaction matrix created in Step 3 serves as a means of organizing data in a single location. However, depending on the structure of the matrix or number of variables, the data may be easier to interpret in a more visual format so that meaningful conclusions can be drawn. Network interaction diagrams—such as the one illustrated in Figure 2.3, in which nodes represent variables and edges of the interactions—can be useful when analyzing the network because visual representations illustrate interactions better than the matrix format does. Here, a directed network is used to highlight not only connections but also the direction of those connections. For example, the directed edge from “Level of medical provider training (relative to KSAs)” to “Fill rate of deploying billets” indicates that the former variable affects the latter (i.e., a change to the “Level of medical provider training [relative to KSAs]” variable will elicit an effect on the “Fill rate of deploying billets” variable because whether a medical provider meets specified training criteria affects his or her eligibility for deployment and, thus, the ability to fill deploying billets). Furthermore, variables are grouped (and highlighted) according to the readiness dimension within which they operate to also emphasize connections between readiness dimensions, a goal of this analysis.

19
Figure 2.3. Example Variable-Level Network Diagram Drawn from Readiness of the Medical Force Case Study
Furthermore, other types of visual formats, such as the network representation illustrated in Figure 2.4, make high-degree connections between readiness dimensions or prominent readiness dimensions more easily observed. Here, the strongest relationships are indicated by the thickness of the lines. Visualizations other than a traditional network representation may be possible and even preferable, depending on the analysis being conducted.

20
Figure 2.4. Example Dimension-Level Network Diagram Drawn from Readiness of the Medical Force Case Study
Step 7: Analyze Results to Identify Key Findings or Insights
From the process outlined in Steps 1 through 6, the analyst can identify necessary inputs, key interactions, and important outputs or outcomes that may result from a case study. Such analysis brings to light important considerations that must be addressed when considering the readiness issue at hand. Furthermore, gaps in required data that must be rectified before proper analysis is done will be identified.
Network Analysis Metrics
In this analysis, we use two metrics, which we refer to as connectedness and impact potential, as a practical way to highlight the importance of an element within the framework—either a variable or a readiness dimension. By importance, we do not necessarily mean that variables or dimensions that rank highly on these metrics directly affect the most-relevant outcomes; rather, these metrics provide a more general measure for the degree to which a change in one variable or dimension has the potential to affect other variables or dimensions.16 More specifically, altering variables or dimensions with high connectedness and/or high impact potential will likely lead to larger and/or more widespread effects. We define the two metrics and describe their calculation next; examples of their application are provided in the individual case study chapters.
16 A downstream variable or dimension is one that is located later in a chain of interactions. An upstream variable or dimension is one that occurs earlier in a chain of interactions.

21
Connectedness
We define connectedness as the number of other variables or dimensions with which a given variable or dimension directly interacts.17 This metric provides a measure of the prominence of the variable within the analysis: The greater the connectedness of a variable, the more interactions it has with other variables. Thus, such a variable is more likely to a play a key role in the analysis. For example, a variable that has a large number of backward (incoming) connections may have a greater chance of acting as an inhibitor to the percolation of readiness changes (improvements) throughout the system because there are more opportunities for its constriction by these many incoming connections. On the other hand, a variable with many forward (outgoing) connections is more likely to have greater impact on the system because it percolates readiness changes throughout the system along more paths. The latter concept is referred to as impact potential and is discussed more in the next section.
For example, within the context of the Unit Training and Presence Trade-offs case study, “Necessary Mx properly predicted” is an intermediate variable between “Skill proficiency” and “Unscheduled Mx (delays),” as shown in Figure 2.5. An increase in personnel skill proficiency can decrease the amount of unscheduled maintenance completed by helping personnel better predict when maintenance is necessary, but this effect is diminished if personnel ability to accurately predict necessary maintenance is constricted by other (inbound) factors (e.g., personnel are unable to effectively perform their duties due to fatigue); these other factors are not explicitly shown here. Thus, the more variables to which “Necessary Mx properly predicted” is backward connected (via inbound connections), the more potential there is for any factor which constricts that variable to also reduce the efficacy of improvements to upstream variables in increasing readiness, causing “Necessary Mx properly predicted” to act as an inhibitor. Conversely, if “Necessary Mx properly predicted” is forward connected (via outbound connections) to many variables, it could percolate readiness improvements across many channels.
Figure 2.5. Example Potential Inhibitor Variable Drawn from Unit Training and Presence Trade-offs Case Study
17 In graph theory, this is called the degree of the node—in this case, variable—as the formal mathematical definition provided subsequently will confirm. We choose to use the informal term connectedness to elicit the notion of connections between variables and, more importantly, between readiness dimensions.
Skill proficiency
Necessary Mx properly predicted
Unscheduled Mx (delays)

22
Mathematically, the connectedness of each variable is calculated by adding the number of “inbound” and “outbound” interactions (in graph theory, indegree plus outdegree) for the variable in the interaction matrix and then subtracting the number of bidirectional interactions to avoid double-counting interactions.18 The result is the total number of variables to which a given variable is connected.
Given our classification of variables relative to the seven dimensions of strategic readiness, it is also possible to use similar metrics to examine the interconnectedness of the readiness dimensions in the context of unit training and presence. However, because most relevant dimensions of readiness are described by multiple variables, there are two possible approaches to calculating the connectedness of readiness dimensions:
1. Perform analysis at the variable level by calculating the number of inbound and outbound interactions as the total number of variable-level interactions entering or leaving the readiness dimension (counting bidirectional interactions only once, as before).
2. Treat each readiness dimension as a higher-level variable and aggregate the variable-level interactions into higher-level interactions that are of equal magnitude regardless of whether they represent one variable-level interaction or multiple such interactions.
For example, consider the simple directed network shown in Figure 2.6, which contains six variables categorized into three readiness dimensions. Applying the first approach above, we see that Dimension A has two inbound connections (Variable 4→Variable 2 and Variable 5→Variable 1) and two outbound connections (Variable 1→Variable 3 and Variable 1→Variable 5). Note the bidirectional connection Variable 1 Variable 5 has been identified twice—once in the inbound connections for Dimension A, and once in its outbound connections. Thus, the first method for calculating connectedness at the dimension level results in a connectedness value of 2 + 2 – 1 = 3. Similarly, Dimension B has a connectedness of 2 + 1 – 0 = 3, and Dimension C has a connectedness of 2 + 3 – 1 = 4.
Applying the second approach to calculating dimension connectedness, Dimension A has a single inbound connection (Dimension C→Dimension A). Note that this single inbound connection represents two variable-level interactions: Variable 4→Variable 2 and Variable 5→Variable 1. There are two outbound connections, Dimension A→Dimension B (representing the single variable-level interaction Variable 1→Variable 3) and Dimension A→Dimension C (representing the single variable-level interaction Variable 1→Variable 5), and a single bidirectional connection between Dimensions AC (represented by the bidirectional variable-level connection Variable 1Variable 5). Thus, we calculate the connectedness of Dimension A to be 1 + 2 – 1 = 2. Similarly, Dimension B has a connectedness of 2 + 1 – 0 = 3, and Dimension C has a connectedness of 2 + 2 – 1 = 3.
18 Outbound interactions are indicated in the row of the interaction matrix corresponding to the variable of interest; inbound interactions are indicated in the corresponding column.

23
Figure 2.6. Sample Network Diagram for Calculating Connectedness at the Dimension Level
The first approach shows the degree to which a given readiness dimension is connected to the other readiness dimensions, whereas the second approach shows the extent to which these connections cut across the various dimensions. (Hence, metrics calculated using the first approach are categorized as measuring the degree of interconnectedness, whereas metrics calculated using the second approach are categorized as measuring the extent of interconnectedness.)
Note that these are very different concepts: The first is more likely to highlight depth of connections between dimensions, while the second emphasizes breadth of connections. The first provides a means to identify prominent dimensions in the analysis at hand and can emphasize depth of connections over breadth. For example, a readiness dimension with many variable-level interactions that occur across few other dimensions will rank more highly on the former measure, while a dimension with a small number of variable-level interactions that occur across many other dimensions will rank more highly on the latter measure. The former provides insight into which dimension or dimensions are prominent in the analysis in that the former measure is more likely to play a larger role in the analysis, whether because it is affected by many things or could affect many things. Should there be a question as to the office or department in which an analysis should take place, identifying the prominent dimension may aid in the decision.19 The second approach we described to calculating the connectedness of readiness dimensions identifies those dimensions that are widely connected and highlights circumstances that may necessitate coordination among disparate individuals, departments, or offices. Broadly connected dimensions may represent those offices that should be informed of decisions in other offices
19 In this context, it is assumed that oversight of the resources and policy decisions that characterize the different dimensions fall under the responsibility of different individuals, offices, or departments. Consequently, they likely represent different pools of money as well.
Dimension C
Variable 6
Variable 5Variable 4
Dimension A
Variable 1 Variable 2
Dimension B
Variable 3

24
because they are likely to be affected (inbound connections) or areas in which a policy change may have widespread effects. Identifying those dimensions that may have widespread effects is the goal of the impact potential metric discussed next.
Impact Potential
As noted earlier, there may be some variables with high connectedness values whose high measure is driven by many outbound connections. Such variables have a greater potential for affecting the overall state of the system because there are more avenues by which changes can percolate through the system. We refer to this as the impact potential of a variable and calculate it to be the number of outbound connections, that is, the number of other variables impacted by the given variable. (Note that this can be easily calculated from the interaction matrix. The impact potential of a variable is equal to the number of nonblank columns in the row corresponding to the variable, i.e., the number of columns with an indicated interaction.) While the ability to make changes to any part of the system is, of course, affected by a variety of factors, such as funding and political will, identifying the best potential “knobs” for improving the system via variables with high impact potential can aid in prioritization.
With regard to impact potential of a readiness dimension, the calculation can be made in the two different manners previously described for connectedness, the first of which calculates the degree of impact potential for the dimension and the second of which calculates the extent of impact potential for the dimension.
For example, consider Dimension C in the example network of Figure 2.6. Dimension C has a total of three outbound connections (Variable 4→Variable 2, Variable 4→Variable 3, and Variable 5→Variable 1). Thus, the degree of impact potential of Dimension C is 3, the total number of outbound connections. However, two of those connections (Variable 4→Variable 2, and Variable 5→Variable 1) indicate a connection from Dimension C to Dimension A, while one (Variable 4→Variable 3) represents a connection from Dimension C to Dimension B. Thus, the extent of impact potential of Dimension C is 2, the total number of other dimensions to which Dimension C is connected via outbound connections.
Methodology 2: System Methodology
While the interactive methodology described in the previous section is most useful for identifying and mapping interactions in broad readiness questions or programs (such as changing force structure), sometimes the requirement is to analyze specific project-level investments. As a result, the interactions between readiness dimensions and their underlying variables to produce military effectiveness must be analyzed independently. The six-step methodology employed to do so is highlighted in Figure 2.7 and described in detail in this section, using MILCON as an exemplar. Broadly, the system methodology involves slight but important differences from the interactive methodology; both methodologies rely on systems modeling, but the “stock and flow”

25
approach used here enables the development of a system dynamics model that facilitates a more detailed understanding of how an initiative influences readiness.
While this methodology was applied only to the MILCON case study, we believe it to be applicable in a wider array of readiness projects and decisions. In fact, both methodologies could be used independently to analyze most readiness questions. The decision of which to use or whether to use both may depend on the complexity of the analysis or the level of definition of the problem. Problems that are defined more discretely lend themselves more to the system methodology; less-defined problems lend themselves more to the interactive methodology. Using the methodologies sequentially is also an option—interactive analysis to help refine the discrete question, followed by system analysis to add depth to the understanding of key issues.
Figure 2.7. Summary of System Methodology
Detailed Description of System Methodology
Step 1: Identify and Describe the Readiness Project or Decision to Be Assessed
After selection of the project or decision for review, supporting documentation should be identified and made available for analysis. Ideal documentation would provide detailed information pertaining to the project or decision, such as the status quo, objective for improvement, requirement, and impact if the project or decision is not supported.
Step 2: Identify the Readiness Dimension(s) Affected by the Project or Decision
Use the documentation from Step 1 to determine the specific readiness dimension(s) at the center of the project or decision. These are the dimensions that are intended to benefit from the project or decision, or those that will suffer should the project or decision not be executed.
System Methodology
Step 1: Identify and describe the readiness project or decision to be assessed
Step 2: Identify the readiness dimension(s) affected by the project/decision
Step 3: Identify direct inputs
Step 4: Identify external enablers
Step 5: Identify external inhibitors
Step 6: Assess how the project/decision impacts overall militaryeffectiveness

26
Step 3: Identify Direct Inputs
Direct inputs are variables that are direct outcomes or results of the readiness project or decision and that contribute positively toward one or more dimensions of readiness. A complete list of direct inputs should sufficiently detail the attributes of the project or decision, as well as the end results, to enable an external reader to understand and describe the proposed project or decision. As with the interactive methodology, existing frameworks such as PESTONI and DOTMLPF-P may serve as helpful guidance.
Step 4: Identify External Enablers
External enablers are variables that are external to the project or decision but are necessary to enable a positive impact on readiness. These variables are typically those required to successfully operationalize the project or decision after completion. For example, in the context of a MILCON project, the construction of a new airfield cannot positively affect readiness if the required associated supplies and personnel are not also made available.
Step 5: Identify External Inhibitors
External inhibitors are variables external to the project or decision that serve as obstacles limiting the anticipated readiness benefits of the project or decision. These variables are typically those that would prevent or limit the successful operationalization of the project or decision after completion or implementation. For example, in the context of the MILCON airfield construction project noted previously, poor weather conditions or high vulnerability of supply chains to adversarial actions would likely decrease the number of sorties an airfield could support, thereby limiting the airfield’s impact on readiness.
Step 6: Assess How the Project or Decision Affects Overall Military Effectiveness
The impact of the readiness project or decision on military effectiveness can be assessed by compiling the direct inputs, external enablers, and external inhibitors that were identified for the individual readiness (dimension) assessments. Aggregating these variables enables an understanding of how the project or decision may provide improved posture options and U.S. abilities to project force and coordinate actions in a specific area of responsibility. Furthermore, this aggregation supports the recognition of external inhibitors that may prevent these benefits from being realized.
Employing the Methodologies The methodologies described in this chapter produce two levels of output. The higher-fidelity
outputs, such as those illustrated with the interaction matrix in Figure 2.2 and the variable-level interaction diagram in Figure 2.3, allow for visualizing interactions among key variables at a discrete level. At a high level, it is possible to observe and, to an extent, quantify the relationships between readiness dimensions that are relevant to the specific readiness question.

27
This level of analysis provides a broad view of the interactions between the core dimensions of strategic readiness, as illustrated in Figure 2.4. Used together, the methodologies provide insight into factors driving readiness concerns.
An unstated but useful final step in each methodology is to document and archive the analysis. Future readiness analysis on the same or on closely related issues will benefit greatly from refining and advancing existing work rather than starting anew. Further, as the archive grows, the ability to compare readiness analysis between different types of questions should also serve to illuminate the interactions between the dimensions more effectively and completely.

28
3. Case Study: Unit Training and Presence Trade-offs
Introduction
In 2017, the U.S. Navy’s 7th Fleet, stationed in the Pacific, was involved in multiple surface ship incidents in which ships ran aground or collided with local fishing and merchant ships. Two incidents resulted in the loss of life. These incidents prompted two separate investigations into the root causes: (1) Chief Naval Officer Admiral John Richardson commissioned the Comprehensive Review of Recent Surface Force Incidents, which was conducted by Commander U.S. Fleet Forces Command Admiral Phil Davidson,20 and (2) Secretary of the Navy Richard Spencer commissioned the 2017 Strategic Readiness Review, which was conducted by a “team of senior civilian executives and former senior military officers” and led by Michael Bayer and Admiral Gary Roughead (U.S. Navy, retired).21 A U.S. Government Accountability Office (GAO) study investigating training and maintenance issues was also conducted at the same time. All three studies pointed to several decisions made by the Navy over the past 20 to 30 years that have resulted in increased stress on the force and, ultimately, degradation in performance.
Between 1990 and the early 2000s, the U.S. Navy ship inventory decreased while deployment levels remained the same, resulting in an increase in operational tempo (OPTEMPO). The Strategic Readiness Review notes repeatedly that the only way to maintain such a high OPTEMPO was by making compromises to training and maintenance:
To accomplish operational demands with a decreasing number of ships, the Navy sought to find more efficient ways to operate its forces and get more out of its resources and people. Within the fleet, often the only option to meet those demands were short-term tradeoffs to training, manning, and maintenance. . . .
Training initiatives and time to conduct training were traded away to meet pressing short term operational needs . . . .22
The Navy also opted to increase overseas homeporting as a means of meeting operational demands with a smaller inventory.23 However, to maximize operational availability of forward deployed ships, their training and maintenance periods are limited. Compared with ships based out of the United States (and, thus, adhering to the Navy’s Optimized Fleet Response Plan
20 U.S. Fleet Forces Command, Comprehensive Review of Recent Surface Force Incidents, Washington, D.C.: Department of the Navy, 2017, p. 11. 21 Department of the Navy, Strategic Readiness Review, Washington, D.C., 2017, p. 10. 22 Department of the Navy, 2017, p. 2. 23 In fact, the percentage of the fleet homeported overseas has doubled since 2006. See GAO, Navy Force Structure: Sustainable Plan and Comprehensive Assessment Needed to Mitigate Long-Term Risks to Ships Assigned to Overseas Homeports, GAO-15-329, Washington, D.C., May 2015.

29
[OFRP]), which have approximately 9.5 months of dedicated training time, as of 2015, “there were no dedicated training periods built into the operational schedules of cruisers, destroyers, and amphibious ships homeported in Yokosuka and Sasebo, Japan.”24 The lack of dedicated training time makes it nearly impossible to maintain a fully trained crew. In fact, “[a]s of June 2017, 37 percent of the warfare certifications for cruiser and destroyer crews homeported in Japan had expired.”25
Furthermore, the Navy also experienced reductions in personnel. While the decline in the number of ships triggered a corresponding decrease in personnel, combat operations following the attacks of September 11, 2001, further reduced the number of personnel available for “traditional” fleet duty because many sailors were assigned to duties supporting Operations Iraqi Freedom and Enduring Freedom. The resulting limited manning of ships was justified by “the adoption of the 2002 Optimum Manning initiative, which reduced destroyer and cruiser manning by 18% and 12% respectively.”26
The reduced manning levels ultimately resulted in increased workloads for the remaining personnel because the established manning levels accounted only for the operational requirements of the ship and did not account for nonoperational requirements, such as training and routine maintenance. Increased workloads contributed to sailors working 100+ hours per week, nearly 30 percent more than the on-duty allocation of 81 hours per week. Excessive overtime leads to fatigue and a decreased ability to perform tasks and maintain the ship. The 2017 GAO report cited a lack of analytic support for these reductions and noted that “[w]ith fewer sailors operating and maintaining surface ships, the material condition of the ships declined.”27
The decrease in inventory and disproportionate reduction in personnel, along with their corresponding effects, have perpetuated a detrimental cycle within the OFRP schedule in which a reduction in training (time) begets an increase in unscheduled maintenance (time), which begets a further reduction in training (time). Detrimental effects can be observed among forward deployed ships as well.
To address underlying issues identified by the studies, the Comprehensive Review suggests the following actions pertaining to training and certifications:
Improve seamanship and navigation individual skills training for Surface Warfare Officer candidates, Surface Warfare Officers, Quartermasters and Operations Specialists.
24 GAO, Navy Readiness: Actions Needed to Address Persistent Maintenance, Training, and Other Challenges Facing the Fleet, GAO-17-798T, Washington, D.C., September 7, 2017, p. 7. 25 GAO, 2017, p. 7. 26 Department of the Navy, 2017, p. 45. 27 GAO, 2017, p. 9.

30
Create an objective, standardized assessment program to periodically assess individual seamanship and navigation skills over the course of a Surface Warfare Officer’s career.
Improve current seamanship and navigation team training and certifications to include assessment in emergency and extremis environments.
Improve shore-based Bridge trainers and add CIC [Combat Information Center] functionality to team training facilities.
Integrate Bridge and CIC evaluations for unit level seamanship and navigation training scenarios in shore-based team trainers, and during at sea training and certifications events.28
In response to the incidents in 2017 and the subsequent reviews, the Navy has made pointed efforts to improve the training of its sailors. One of the cornerstones of the Sailor 2025 initiative is the Ready, Relevant Learning model, which aims to optimize training of sailors by providing training at appropriate times in their careers rather than front-loading training (at accession-level “A” and “C” schools).29 Such front-loading runs the risk of retention issues, outdated knowledge and skills, and skill atrophy due to lack of immediate applicability. Under the Ready, Relevant Learning model, necessary training is provided when it is immediately relevant to ensure current knowledge and skills and encourage retention of that training. Thus, training shifts from the early stages of one’s career, prior to fleet assignment, to being distributed throughout the course of one’s career, while on assignment and, thus, more directly within the OFRP cycle.
Furthermore, the Navy allocated $210.3 million toward training initiatives in its fiscal year (FY) 2020 budget. A significant portion of this funding was specifically allocated to the Mariner Skills Training Program, which is aimed at improving basic mariner skills of sailors.30 In addition to new facilities and training technology, the program includes new Junior Officer of the Deck, Officer of the Deck, and stand-alone certified mariner skills courses, as well as expansions to the Basic Division Officer Course.
While modifications to current Navy training originate within the realm of structural readiness (because of their inherent relation to how long it takes to prepare personnel) and are aimed at improving the skills of sailors and their abilities to properly perform their duties—measures that fall inherently within operational readiness—they cannot be considered in isolation. Such changes within the structural readiness dimension will not only affect operational readiness but also have ramifications for other readiness dimensions. For example, because the training period is a key part of the Navy’s OFRP cycle, any adjustment to the training period, including its length, affects the entire OFRP schedule.
28 U.S. Fleet Forces Command, 2017, p. 11. 29 Kyle Cozad, “Ready, Relevant Learning: Better, Faster, More Effective,” Navy Live blog, March 16, 2018. 30 “Resourcing a Ready Surface Force,” Navy Live blog, May 6, 2019.

31
Assuming a 36-month cycle is maintained,31 an increase in the training period must be accompanied by a decrease in the maintenance, deployment, and/or sustainment period. A decrease in the deployment or sustainment period has a detrimental effect on force posture because the Navy’s overseas presence will decline. However, this decrease in presence may only be experienced in the near term. As noted earlier, it has been suggested that the improved skills of sailors (resulting from increased training) may lead to better prediction of necessary maintenance and, thus, decreases in unscheduled maintenance overruns. Decreases in unscheduled maintenance suggest increased availability for deployment. Therefore, increased training may lead to near-term decreases in presence and long-term increases in presence.
Application of the Interactive Methodology This case study employed the interactive methodology outlined in Chapter 2. A “simple”
indication of interaction was used—a positive interaction is indicated by a “+,” a negative interaction is denoted by a “−,” and a lack of interaction is indicated by a blank cell. No attempt was made to differentiate or assign magnitudes to the interactions.
In the following sections, we identify the relevant variables for this case study and their interactions. Visualizations highlight interactions between different aspects of the system and, more importantly, interactions between the various dimensions of strategic readiness. Several network metrics are also presented, both at the system-wide and individual-variable levels to reinforce insights gained through the visualizations.
Relevant Variables To develop our list of pertinent variables, we began with the question at hand—“What are the
trade-offs in unit training and presence?”—and the additional motivation for the question, which was previous RAND analyses that identified significant maintenance delays that could be traced to an inability to properly predict necessary maintenance. We then determined that we needed to identify a collection of variables that ultimately connected training to presence with maintenance somewhere in between. To do so, we began at both ends of the analysis—training and presence—and developed a set of variables in response to questions regarding what enables or inhibits the Navy’s ability to maintain forward presence, what the purpose of training is, and what outcomes could be expected from an increase in training. We then performed this process in an iterative manner by identifying variables, asking questions pertaining to the role of those variables in the analysis, and identifying additional variables in response to those questions. We
31 Although the OFRP operates on a notional 36-month schedule, unscheduled maintenance often extends the length of the cycle. Even scheduled maintenance experiences overruns. In 2018, for example, only 15 percent of scheduled maintenance was completed on time. And, in 2019, 57 percent of delays were for 90 or more days (see Jared Serbu, “For New Navy Chief, Fixing Readiness Problems Trumps Building Bigger Fleet,” Federal News Network, January 16, 2020).

32
continued until our variable development and line of questioning from either end converged. Interactions were then identified, and we iterated on the set of variables to ensure our interactions captured direct, first-order connections.
Ultimately, we identified a surprisingly limited set of variables that have immediate relevance in an analysis of near-term versus long-term trade-offs between unit training and presence. Broadly, these variables fall within the personnel-related categories of Training and Job Performance, the equipment-related category of Utilization and Maintenance, and the category of Deterrence Effect. Note that this case study focuses heavily on the ultimate effects of modifications to training on presence and does not consider other possible effects, such as changes to the training force, requirement for additional training equipment and material, or any associated funding requirements. Table 3.1 provides details on the key variables of this case study.

33
Table 3.1. Relevant Variables in the Unit Training and Presence Trade-offs Case Study
Variable Description Relevance Status of Measurement
Training time Amount of time that crew members are required to participate in unit training
Training is a key phase of the OFRP cycle; effects of modifications to time spent training are the focus of this investigation
Currently measured
Crew certifications Percentage of required certifications currently held by each crew member
Used to determine possible correlation with ability to perform duties (e.g., through error rates and proper Mx predictions)
Currently measured/tracked
Skill proficiency Level of proficiency achieved by each crew member on assessed tasks
Used in conjunction with certification data to determine possible correlation with ability to perform duties (e.g., through error rates and proper Mx predictions)
Current assessment criteria may need to be revised to accurately capture proficiency for the purposes of analysis
Mx properly identified Indicator of whether necessary Mx was properly identified/predicted prior to the start of the Mx period, i.e., Mx is considered “scheduled” rather than “unscheduled”; likely done by task
Lack of ability to properly identify Mx can lead to unscheduled Mx overruns and indicates inability to properly perform duties (e.g., due to lack of training)
Can be derived from current Mx measurements and records
Duty time Daily or weekly time that each crew member spends on the job, i.e., time not spent “off the clock” or on rest
Fatigue due to excessive working hours can degrade ability to perform duties
Not explicitly measured
Error reports Records of human errors in performance, including type of error, date of occurrence, crew member responsible for error
Used over time as indicator of whether increased training has improved crew member performance
Currently measured
Equipment usage Steaming hours Driving factor for maintenance needs
Can be derived from deployment and exercise schedules
Scheduled/predicted Mx (time)
Required Mx task(s) predicted prior to the start of the Mx period
Used to identify unscheduled Mx tasks
Currently measured
Unscheduled/unpredicted Mx (time)
Required Mx task(s) identified/discovered during the Mx period and not predicted prior to the start of the Mx period
Unscheduled Mx leads to inability to adhere to OFRP schedule
Derived from difference between Mx completed and Mx predicted
Shipyard capacity Current Mx capacity as well as capacity for expansion
Related to the ability of the industrial base to increase capacity to meet demand as needed; metric associated with structural and/or mobilization readiness
Can be determined from estimated necessary increase and capacity for expansiona

34
Variable Description Relevance Status of Measurement
Availability for deployment Indicator of whether a unit/ship is available for deployment at a given time
Direct measure of operational readiness
Currently measured and tracked, but data must be aggregated across personnel and equipment
Forward presence Percentage of units/ships/forces deployed at a given time
Level of forward presence serves as indicator of U.S ability to deter adversaries
Global force management deployment records
Credible deterrent Measure of whether the force provides sufficient deterrent effect against possible adversaries at any given time
Measure of military effectiveness and ultimate goal of forward positioning of troops
Not necessarily quantifiable; likely subjective; possibly a combination of forward presence and number of forces available for deployment
a Measurement is likely limited by the ability to correctly model or predict the capacity for expansion (e.g., workforce availability, physical space).
Interactions Between Variables Figure 3.1 depicts the interaction matrix for the variables discussed in the previous section.
Variables are listed in both Column 2 and Row 1 to form both the row and column heads. We have classified the variables in two manners. First, the variables are grouped according to the categories of training, job performance, maintenance and utilization, and deterrence effect. These categories are shown in Column 1 of the interaction matrix. Second, the variables have been color coded according to the readiness dimension with which they have been associated, to the extent that this is possible. For example, the training time variable falls within the category of training and is associated with the dimension of structural readiness (blue). We associate training time with structural readiness because it is directly related to how quickly forces can be brought to an employable and deployable state. Note that we assume variables will be categorized into a single readiness dimension, which requires comprehensive definition across the set of dimensions and clear distinction between the dimensions. As we have previously expressed, we have assessed this to be the case.
As previously noted, we use a simple interaction indicator (“+” indicates a positive interaction, “−” indicates a negative interaction, and a blank cell indicates no interaction) and focus on first-order interactions only. Recall that variables that form the row headers (shown in Column 2 of the matrix) are assumed to change, and we indicate the effect of such changes on the variables shown in the column headers (Row 1). For example, while an increase in training may ultimately lead to a decrease in errors and error reports, it is assumed that the increase in training leads to an increase in certifications and proficiency, which results in decreased errors. Thus, training time is shown to have a positive interaction with crew certifications and skill proficiency (i.e., an increase in training yields an increase in crew certifications and proficiency).

35
Figure 3.1. Variable Interaction Matrix—Unit Training and Presence Trade-offs
NOTE: All relevant variables are included in both Row 1 and Column 2 of the matrix to maintain symmetry, regardless of the presence or absence of inbound interactions or outbound interactions. For example, “Credible deterrence” is shown in Column 2 but has no outbound interactions; it does, however, have multiple inbound interactions, as shown in the last column of the matrix.
Training
time
Crew
certifications
Skill
proficiency
Mx
properly predicted
Duty timeEfficient and
effective performance
Error
reports
Equipment
usage
Scheduled/
predicted Mx
Unscheduled
Mx
Shipyard
capacity
Availability for
deployment
Forward
Presence
Credible
deterrence
TrainingTraining time + + + +
Crew certifications − + +
Job Performance
Skill proficiency + + − + − +
Mx properly predicted −
Duty time −
Efficient and effective
performance− + − − +
Error reports + + −
Utilization and Mx
Equipment usage + +
Scheduled/predicted
Mx− −
Unscheduled Mx − − − −
Shipyard capacity − +
Deterrence Effect
Availability for
deployment− + +
Forward Presence +Credible deterrence
Readiness Dimensions
Military Effectiveness
Operational Readiness
Force Posture
Structural Readiness
Mobilization Readiness
Sustainment Readiness
Resilience
+ indicates a positive first-order interaction
− indicates a negative first-order interaction
A c
han
ge in
th
is v
aria
ble…
…causes a change in this variable.

36
We also highlight some possible paradoxes. For example, training time and crew certifications have both a positive and negative interaction, depending on which variable is assumed to be the “toggle variable.” For example, when training time is the variable that is changing, there is a positive interaction with crew certifications—an increase in training increases crew certifications and crew certification levels. On the other hand, when crew certifications are the changing variable, there is a negative interaction—an increase in crew certifications may result in a decrease in training because less training may be required to ensure that all crew members have the appropriate certifications. We caution the reader, however, that it is not the case that these impacts occur simultaneously; instead, they create a cycle whose effects permeate the system when considered in isolation—increasing training increases crew certifications, which may decrease the need for future training.
While the interaction matrix shown in Figure 3.1 provides a systematic way to organize data as variables and identify interactions, the figure can be difficult to parse in a meaningful way. Treating the interaction matrix as an oriented incidence matrix, we can create visual representations of the connections in the form of the directed networks shown in Figures 3.2 and 3.3. Such visual aids allow the analyst to more easily observe the relationships that exist between variables and can be used in conjunction with network analysis metrics to better understand the interactions. (Note that these diagrams highlight the existence of relationships but do not provide insight into the nature of those relationships; that is, few to no quantifiable measures of interactions can be gleaned from these diagrams.)
While Figures 3.2 and 3.3 depict the same connections—those of the interaction matrix in Figure 3.1—Figure 3.3 reorganizes the variables by readiness dimension. Here, individual variables are not color-coded according to variable category but are instead grouped (to the extent possible) according to the dimension of readiness into which they have been classified. For example, “Availability for deployment,” “Crew certifications,” “Skill proficiency,” and “Effective and efficient performance” are all variables that pertain to operational readiness, and they are grouped within the red box of Figure 3.3. This representation enables easy identification of the connectedness between various dimensions and the level of connectedness as suggested by the number of connecting arrows. For example, several connections exist between the operational readiness and structural readiness dimensions, but only one exists between operational readiness and force posture. However, these are only first-order interactions, and secondary, tertiary, etc., reactions are not as easily observable. Also, it may be that the quality or importance of interactions is more significant that the quantity of interactions.

37
Figure 3.2. Interactions Between Variables Diagram—Unit Training and Presence Trade-offs

38
Figure 3.3. Interactions Between Dimensions of Readiness Diagram—Unit Training and Presence Trade-offs

39
Analysis of the Unit Training and Presence Trade-offs Framework and Readiness Dimension Interactions
In this section, we examine the results of applying our connectedness and impact potential metrics to the interaction matrix in Figure 3.1. These quantified metrics generate further insight into the structure of the system and role of various components depicted in Figures 3.2 and 3.3. Although we believe our list of variables captured the most relevant components of the problem, our list may not be exhaustive. Thus, these metrics, which rely on the number of connections between variables, are useful but should be considered rough measures of the concepts discussed in this section. Using these metrics as inputs for more-complex analyses would compound this uncertainty.
Connectedness
Table 3.2 shows the connectedness measure (Column 3). This table generally confirms what can be seen intuitively when examining Figures 3.2 and 3.3, and this calculation provides more value as a system increases in complexity and visual diagrams become more difficult to interpret. For this relatively small case study, these calculations serve as a useful complement to the interaction diagrams because they can be created and interpreted more quickly and accurately. On the other hand, consulting an interaction diagram improves the conclusion drawn from interpreting the connectedness values. For example, while most of the variables that have high connectedness values are in a position to act as key levers in the analysis because they may either act as inhibitors to the flow of readiness improvements through the system or percolate such improvements along many channels (see discussion in Chapter 2), the “Credible deterrence” variable is not. From Figures 3.2 and 3.3, it is easy to see that “Credible deterrence” has a high connectedness rating because it is an important outcome or “endgame” variable rather than a key “player” in the system. Situations such as the one exemplified by the “Credible deterrence” variable increase the importance of the interaction diagrams in aiding interpretation. While there are more-complex metrics that could avoid confounding the flow valve variables with variables that act exclusively as inputs or outcomes, we avoided suggesting more-complex calculations for the reasons discussed previously.

40
Table 3.2. Connectedness of Unit Training and Presence Trade-offs Variables
Variable Category Connectedness
Skill proficiency Job performance 7
Ability to efficiently and effectively perform duties Job performance 6
Unscheduled Mx (delays) Utilization and Mx 6
Credible deterrence Deterrence effect 6
Training time Training 5
Error reports Job performance 5
Availability for deployment Deterrence effect 5
Crew certifications Training 3
Necessary Mx properly predicted Job performance 3
Use of equipment Utilization and Mx 3
Scheduled Mx (predicted Mx time) Utilization and Mx 3
Duty time Job performance 2
(Increase in) shipyard capacity Utilization and Mx 2
Forward presence Deterrence effect 2
Table 3.3 shows the degree of connectedness and extent of connectedness values for each readiness dimension. From this table, we see that operational readiness, structural readiness, and the group of “Additional facilitating” variables are most likely to play pivotal roles in an analysis of unit training time and presence trade-offs because of their high levels of connectedness, both in terms of the degree of connectedness and the extent of connectedness. Personnel, offices, and departments with oversight of resources and policy decisions that fall within these dimensions should be given priority consideration and should be key players in the analysis or policy decisions at hand. Note that the unique character of the “Credible deterrence” variable carries over into the results for military effectiveness. Military effectiveness is connected to a moderate number of readiness dimensions, but this is exclusively attributable to the impact that a variety of readiness dimensions have on military effectiveness.
Table 3.3. Connectedness of Readiness Dimensions in the Context of Unit Training and Presence Trade-offs
Dimension Degree of Connectedness Extent of Connectedness
Operational readiness 17 5
Additional facilitating variablesa 13 3
Structural readiness 12 3
Military effectiveness 6 3
Mobilization readiness 2 2
Force posture 2 2 a These are variables that do not explicitly fall within a dimension of readiness but are necessary to form a complete understanding of the system and often to form important bridges between dimensions.

41
Impact Potential
Table 3.4 shows the impact potential values of each variable related to Unit Training and Presence Trade-offs with variables presented in order of decreasing impact potential. As shown in the table, variables concerned with the ability of personnel to complete their work well have a high impact potential, suggesting that improvements in this area could have an outsized effect on overall readiness in the system. Furthermore, “Credible deterrence” has no impact potential, again, because this is an outcome of the system. Use of impact potential in conjunction with connectedness provides another means to avoid misinterpretation of connectedness values—if a highly connected variable has no impact potential, then it is solely an outcome variable.
Table 3.4. Impact Potential of Unit Training and Presence Trade-offs Variables
Variable Category Impact
Skill proficiency Job performance 6
Ability to efficiently and effectively perform duties Job performance 5
Training time Training 4
Unscheduled Mx (delays) Utilization and Mx 4
Crew certifications Training 3
Error reports Job performance 3
Availability for deployment Deterrence effect 3
Use of equipment Utilization and Mx 2
Scheduled Mx (predicted Mx time) Utilization and Mx 2
Increase in shipyard capacity Utilization and Mx 2
Necessary Mx properly predicted Job performance 1
Duty time Job performance 1
Forward presence Deterrence effect 1
Credible deterrence Deterrence effect 0
As previously mentioned in Chapter 2, the metrics we have suggested for the Unit Training
and Presence Trade-offs, Readiness of the Medical Force, and Increased Air Force Force Structure case studies are meant to provide a means to quickly and easily gain a preliminary understanding of the most relevant components of the framework presented. They do not rely on extensive calculations or require any data about the system variables. This is an important benefit—as Table 3.1 demonstrates, relevant system variables may not be measured.
However, the trade-off to completing analysis at a greater level of abstraction is a requirement to interpret the results with caution. Achieving a higher level of certainty regarding the conclusions drawn in this analysis (and those accompanying the Readiness of the Medical Force and Increase Air Force Force Structure case studies) would require accurate collection of

42
the necessary data and development of an appropriate model to represent the system, both of which come at the cost of greater time and effort.32
The impact potential for the dimensions of readiness are shown in Table 3.5. As in the calculation of connectedness, both the degree and extent of impact potential are calculated and shown. Operational readiness, structural readiness, and the group of additional facilitating variables rank high with respect to impact potential similar to connectedness. This further suggests that these dimensions have greater potential to affect readiness in other dimensions as changes are made.
Table 3.5. Impact Potential of Readiness Dimensions in the Context of Unit Training and Presence Trade-offs
Dimension Degree of Impact Potential Extent of Impact Potential
Operational readiness 5 5
Additional facilitating variablesa 3 3
Structural readiness 3 3
Military effectiveness 3 0
Force posture 2 1
Mobilization readiness 2 2 a These are variables that do not explicitly fall within a dimension of readiness but are necessary to form a complete understanding of the system and often form important bridges between dimensions.
Pairs of Readiness Dimensions
It is also possible to use variable-level interaction totals to analyze the degree of interaction between pairs of readiness dimensions. The matrix in Figure 3.4 shows the number of unidirectional variable-level interactions between dimensions. The value in the cell of an intersecting row and column specifies the number of variable-level interactions originating in the readiness dimension identified by the corresponding row header and ending in the dimension identified by the corresponding column header. For example, the cell in Row 1, Column 3 has a value of 5 and indicates that there are five variable-level connections from structural readiness to operational readiness. (Note that this matrix can also be thought of as an adjacency matrix in which nonzero cells indicate direct interactions between two dimensions, as well as the number and direction of those interactions.)
32 The type and complexity of model will depend on the particular readiness analysis to be done. For example, the Unit Training and Presence Trade-offs case study ultimately focuses on an analysis of a schedule and can likely be done in Excel and/or with simple simulation techniques, whereas the Readiness of the Medical Force Case Study in Chapter Three would require a more intensive flow model to represent the system.

43
Figure 3.4. Number of Variable-Level Interactions Between Readiness Dimensions—Unit Training and Presence Trade-offs
NOTE: Bidirectional interactions are considered as two opposite-direction interactions in these calculations.
Figure 3.4 highlights that the most interdimension interactions exist between operational readiness and the additional facilitating variables with connections going from operational readiness to the facilitating variables. There are also a relatively large number of connections from structural readiness to operational readiness, from the additional facilitating variables to structural readiness, and from operational readiness to military effectiveness. Figure 3.4 can also be used to identify those readiness dimensions that are impacted by, or impacted to the greatest extent by, another given dimension. For example, Table 3.5 demonstrates that military effectiveness is affected by variables falling into three distinct readiness dimensions. From Figure 3.4, however, we observe that most of these variables actually fall within a single readiness dimension, namely operational readiness.
While Figure 3.4 provides a detailed breakdown of the directional relationships between the dimensions of readiness in this case study, Figure 3.5 provides an overall measure of the strength of the connections between pairs of readiness dimensions. Here, the values in the matrix represent the number of variable-level connections between one readiness dimension and another regardless of direction, that is, bidirectional interactions are considered only once.
Based on the matrix in Figure 3.5, we created the diagram shown in Figure 3.6, which shows a high-level summary of how the individual dimensions of strategic readiness interact within the context of unit training and presence trade-offs. The lines between pairs of dimensions indicate direct interaction between the two dimensions, and the lines are weighted according to the number of connections specified in Figure 3.6.
Structural Readiness
Operational Readiness
Mobilization Readiness
Force PostureMilitary
Effectiveness
Additional Facilitating Variables
Structural Readiness
5 1 0 0 3
Operational Readiness
2 1 1 4 6
Mobilization Readiness
1 1 0 0 0
Force Posture 0 0 0 1 0
Military Effectiveness
0 0 0 0 0
Additional Facilitating Variables
5 1 0 0 1

44
Figure 3.5. Number of Pairwise Connections Between Readiness Dimensions—Unit Training and Presence Trade-offs
NOTE: Bidirectional interactions were counted only once.
Figure 3.6. Interaction Diagram for Readiness Dimensions—Unit Training and Presence Trade-offs
From Figure 3.6, we can draw several conclusions relative to the observed interactions between variables:
• Operational readiness, structural readiness, and the additional facilitating variables arehighly interconnected.
• Operational readiness has direct interaction with all other readiness dimensions relevantto this case study.
• Structural readiness and operational readiness are strongly connected in the context ofvariables in unit training and presence trade-offs. (The interaction matrix in Figure 3.4
Structural Readiness
Operational Readiness
Mobilization Readiness
Force PostureMilitary
Effectiveness
Operational Readiness
5
Mobilization Readiness
1 1
Force Posture 0 1 0
Military Effectiveness
0 4 0 1
Additional Facilitating Variables
6 6 0 0 1

45
suggests that operational readiness is more heavily dependent on structural readiness than structural readiness is on operational readiness.)
• Military effectiveness is most strongly connected with operational readiness. (The interaction matrix in Figure 3.4 confirms that it is military effectiveness that is heavily dependent on operational readiness and not the other way around.)
• Mobilization readiness and force posture are on the periphery of the system, interacting with the other readiness dimensions to both a small extent and small degree. However, this does not imply that these interactions are not important interactions, and this graph cannot convey such information. For example, force posture (in the form of presence) is the “endgame” variable of interest in this case study, and the interactions with variable(s) in this dimension tend to be minimal and unidirectional. Here, force posture is influenced only by the “Availability for deployment” variable within the operational readiness dimension (see Figures 3.1–3.3), but availability for deployment can be achieved or improved in this context only through a chain of interactions involving training, performance, and maintenance. Thus, the operational readiness dimension is a key conduit to improving force posture, and that single link is vital. With respect to force posture, this characteristic may be peripheral because presence (and force posture) is the “endgame” variable of interest in this case study. Thus, interactions with presence and force posture variables tend to be minimal and unidirectional.
Key Insights We emphasized that the insights to be gained from this case study lie primarily in a
demonstration of the methodology applied to a real-world example rather than in specific policy guidance about how to resolve a particular readiness shortfall. The assessment of variable relationships described in this case study reflects SME assessments; the network analysis shows how those assessments might interact. However, the case study could show the following:
• A relatively small collection of variables can be used to assess the effects and trade-offs in changes to unit training (time) and presence in both in the near and far terms.
• A relatively straightforward readiness assessment can affect a wide array of readiness dimensions.
• Increased training can have a beneficial effect on presence as increased training increases operational readiness.
• Presence as a force posture is a desired outcome, which draws from the other readiness areas, but it does not appear to give readiness back. The mere fact of being somewhere does not confer additional readiness in other dimensions.
• Though a given decision within one readiness dimension may be expected to have ramifications in another dimension, the effect is likely not direct or isolated. In this case study, we consider how a change within the structural readiness dimension (training and training time) affects force posture (and military effectiveness, to an extent) and see that consequences are not immediately realized but rather are facilitated by other dimensions.
• While training does favorably influence other variables, and particularly promotes force posture presence, the case study does not identify whether additional or improved training is actually possible. To use the terms established in the systems methodology, there may be external enablers or inhibitors (additional resources, such as funding,

46
trainers, etc.) that could affect assumed values of the variables in this analysis. Establishing that there are enough trainers or enough scheduling opportunities to add training requires additional research. The case study does suggest that close examination of these factors is warranted.
• The strong interaction of additional facilitating variables with other dimensions could suggest that the dimensions are insufficiently inclusive but more likely suggests that theater and scenario-specific variables are having an impact. The additional facilitating group is strongly associated with structural and operational readiness. This could reflect service culture differences between theaters concerning the importance of some kinds of training or proficiency levels—if, for example, regardless of what the Navy’s overall readiness system and priorities look like, one theater has decided some different standard is “good enough.” It could reflect policy and scheduling decisions that require commitment to diplomatic or engagement events, regardless of the status of other readiness dimensions. Differences in standards or policies may be difficult to readily import into a standing framework.

47
4. Case Study: Readiness of the Medical Force
Introduction
The first case study, Unit Training and Presence Trade-offs, focused on understanding a specific question—what is the relationship between two desired outcomes, and how does that relationship interact with other aspects of readiness? The assessment informs a discrete policy decision. In this case study, we do not look at a specific question or decision. Instead, this case is about understanding a system better. From that understanding, specific questions may present themselves as needing further analysis or as suggesting opportunities for policy decisions.
The responsibilities of the military medical force are multifaceted. Providers have the peacetime mission of administering routine medical care to service members and their families to ensure that they are healthy and that service members are able to complete their assigned missions.33 Health care is also provided to military retirees and their families, as well as other individuals deemed eligible to receive care through the Military Health System (MHS).34 Military medical providers also have the wartime mission of providing medical care to service members in deployed settings, which are in stark contrast to the settings in the military treatment facilities (MTFs) where these providers train. In deployed settings, medical providers may also care for foreign populations that present different medical needs.
While medical force readiness includes multiple dimensions, we focused this case study on readiness of the medical force to provide care in combat settings. Specifically, medical force readiness entails being prepared “to provide, and to maintain readiness to provide, medical services and support to the armed forces during military operations.”35 As a result, medical readiness cuts across a wide range of domains—provider readiness, training, supply chains, transportation, communication, and others—and requires coordination across all.
Historically, measures of readiness and effectiveness of the medical system were premised on counts of facility capabilities and providers (i.e., beds and clinicians with current credentials).36 Providers were considered ready if they held current credentials, and a unit was considered ready if there were a sufficient number of ready personnel, regardless of whether
33 Health issues, with either a service member or a member of his or her immediate family, may prevent the individual from being able to fulfill his or her duties (e.g., through deployment). Therefore, it is an important mission to ensure the health of such individuals and maintain the “medical readiness” of the force. 34 Note that beneficiary care (for families and retirees) is typically provided through a combination of civilian and military providers. Tricare is responsible for the civilian care component of the MHS. 35 Susan D. Hosek and Gary Cecchine, Reorganizing the Military Health System: Should There Be a Joint Command? Santa Monica, Calif.: RAND Corporation, MR-1350-OSD, 2001, pp. 2–3. 36 GAO, Actions Needed to Determine the Required Size and Readiness of Operational Medical and Dental Forces, GAO-19-206, Washington, D.C., February 2019.

48
their credentials matched requirements. Two separate Institute for Defense Analyses (IDA) reports highlight such issues: “Medical personnel were often considered substitutable, e.g., a pediatrician could serve in a position providing emergency care interchangeably with an emergency medicine physician”37 and “a combat support hospital could be reported as ready to deploy for delivery of combat casualty care when, in fact, no trauma surgeon with current trauma experience was assigned or available to the unit,”38 showing lack of concern regarding appropriate matching of credentials to requirements.
Other goals, while not explicitly metrics of readiness, focused on expectations of timing to treatment, particularly the golden hour, which requires a maximum of one hour from point of injury (POI) to medical assistance.39 However, with greater interconnectedness of staffing, supply, and transport needs across sectors of the military, as well as new on-scene treatment technology, the ability of these measures to reflect medical readiness is waning.40 Although further metrics of medical readiness have been proposed or are in development (e.g., KSA metrics), validity and usability concerns remain.41
The MHS is responsible for ensuring provider training through assignments at MTFs. However, it has proved difficult and expensive to ensure adequate preparation for providing combat medical care through training at the MTFs, given that the workloads and environments experienced in deployed settings often cannot be replicated in an MTF setting.42 The most-common procedures in an MTF setting center on obstetric and pediatric care, as well as general elective procedures and surgeries.43 In combat settings, however, the workload may range from routine sick visits to disease and nonbattle injuries to multiple trauma injuries.
37 John E. Whitley, James M . Bishop, Sarah K. Burns, Kristen M. Guerrera, Philip M. Lurie, Brian Q. Rieksts, Bryan W. Roberts, Timothy J. Wojtecki, and Linda Wu, Medical Total Force Management: Assessing Readiness and Cost, Alexandria, Va.: Institute for Defense Analyses, IDA Paper P-8805, May 2018, p. iii. 38 John E. Whitley, Joseph F. Adams, Joseph J. Angello, Jennifer T. Brooks, Sarah K. Burns, Jason A. Dechant, Stanley A. Horowitz, Philip M. Lurie, John E. Morrison, and Paul M. Thompson, Essential Medical Capabilities and Medical Readiness, Alexandria, Va.: Institute for Defense Analyses, IDA Paper NS P-5305, July 2016, p. v. 39 The term golden hour was originally coined by R. Adams Cowley of Maryland’s Shock Trauma Center. In 2009, Secretary of Defense Robert Gates implemented the golden hour policy to reduce medical evacuation times in Afghanistan from two hours to the one hour observed in Iraq. See Tanisha M. Fazal, Todd Rasmussen, Paul Nelson, and P. K. Carlton, “How Long Can the U.S. Military’s Golden Hour Last?” War on the Rocks, October 8, 2018. 40 Fazal et al., 2018. 41 GAO, 2019. 42 Christine Eibner, Maintaining Military Medical Skills During Peacetime: Outlining and Assessing a New Approach, Santa Monica, Calif: RAND Corporation, MG-638-OSD, 2008; Whitley et al., 2018. 43 National Academies of Sciences, Engineering, and Medicine, A National Trauma Care System: Integrating Military and Civilian Trauma Systems to Achieve Zero Preventable Deaths After Injury, Washington, D.C.: National Academies Press, 2016; Matthew R. D’Angelo, Diane Seibert, Matthew D. Welder, Ronald M. Cervero, and Steven J. Durning, “Decoding Readiness: Towards a Ready Military Healthcare Force,” Military Medicine, Vol. 184, No. 5/6, 2019, p. 122.

49
A 2016 report by IDA highlights the mismatch by showing that categories of care common in MTFs tend to be uncommon in deployed settings and vice versa. For example, “Open wounds of head, neck, and trunk” ranked No. 1 among inpatient diagnoses in Iraq in 2007 but ranked 143 in terms of frequency among direct care hospitals in 2015.44 A subsequent IDA report found that specialties central to operational missions (e.g., emergency room clinicians) were historically understaffed, while noncombat health care competencies (e.g., pediatricians) were overstaffed.45
In addition to skill discrepancies, the environment in which medical care must be provided will differ drastically in a deployed setting. While nondeployed care is provided in traditional hospital settings and likely with sufficient access to resources, medical providers in deployed settings must deliver care in austere and likely hostile environments where access to resources may be limited. In fact, future combat environments may differ significantly from those to which the United States has become accustomed.
Over the past two decades, the United States has been engaged in combat operations in Iraq and Afghanistan in which fairly low numbers of casualties have been observed with injuries typically caused by standard kinetic weapons.46 Additionally, the United States had sufficient access to medical care—both providers and supplies—to care for the wounded, and air superiority and freedom of movement allowed for casualty evacuation as needed. While there was some limited availability and lack of experience among medical personnel, the medical system did not experience a high degree of stress.47 A GAO report following Operation Desert Storm questioned military readiness to provide medical care if the ground war had proceeded in any way other than it did (e.g., lasted longer, started earlier). Among the issues cited are classic concerns in medical force readiness: outdated and incomplete information systems and poor training.48 It is conceivable that, as the nature of conflict changes, the medical system may not enjoy such success in future operating environments.49
44 Whitley et al., 2016, p. vi.45 Whitley et al., 2018.46 Brent Thomas, Mahyar A. Amouzegar, Rachel Costello, Robert A. Guffey, Andrew Karode, Christopher Lynch, Kristin F. Lynch, Ken Munson, Chad J. R. Ohlandt, Daniel M. Romano, Ricardo Sanchez, Robert S. Tripp, and Joseph V. Vesely, Project AIR FORCE Modeling Capabilities for Support of Combat Operations in Denied Environments, Santa Monica, Calif.: RAND Corporation, RR-427-AF, 2015. 47 GAO, 2019; Steve Sternberg, “A Crack in the Armor: Military Health System Isn’t Ready for Battlefield Injuries,” US News and World Report, October 10, 2019; Sabrina Taghizadeh, Medical Operations in Denied Environments (MODE): Are Our AF Medics Ready? Maxwell Air Force Base, Ala.: Air Command and Staff College, 2016. 48 Hosek and Cecchine, 2001.49 David Ochmanek, Peter A. Wilson, Brenna Allen, John Speed Meyers, and Carter C. Price, U.S. Military Capabilities and Forces for a Dangerous World: Rethinking the U.S. Approach to Force Planning, Santa Monica, Calif.: RAND Corporation, RR-1782-1-RC, 2017.

50
China and Russia have emerged as near-peer competitors with significant missile capability.50 Should they choose to employ these capabilities, they have the ability to inflict severe damage on U.S. installations. The result would be a mass-casualty event characterized by a large number of severe trauma injuries requiring huge amounts of resources, including bed space, vital Class VIII supplies (e.g., blood and saline), and evacuation assets.51 Furthermore, the United States will likely be operating in a contested environment where communication and command and control may be severely degraded or denied, which would inhibit the movement of patients and the ability to obtain necessary supplies through resupply measures. Such attacks will present a massive challenge to medical personnel, who will be forced to treat casualties of severities and magnitudes not encountered in their day-to-day noncombat settings with limited supplies and in environments that may be unforgiving.
Providing medical care is about more than having adequate properly trained personnel. Rather, medical readiness is affected by and influences many different systems, including sourcing, distributing, appropriate storage and maintenance of supplies, transportation of medical personnel and wounded service members, and ground and air support for freedom of movement. Because these systems touch on nearly all dimensions of readiness, medical readiness is ideal for a case study analyzing strategic readiness.52 Furthermore, the ability—or, possibly more appropriately, the inability—to provide sufficient care in such settings has ramifications on the dimensions of military effectiveness and resilience. Because of these tight connections, problems with medical readiness can reverberate throughout the military, far beyond simple treatment of an injury or wound.
This approach is not intended to replace the casualty evacuation and casualty estimation models that medical planners use for operational planning. The same level of detail that planners apply for operations, logistics, command and control, and every other operations plan annex goes into medical planning for contingencies. Our intention here is to describe the broader readiness structures and to include several factors that are often treated as “black boxes” in some estimation models. In doing so, we provide a way to assess and improve overall medical readiness, not just ensure adequate coverage of particular contingencies.
Application of the Interactive Methodology Like the Unit Training and Presence Trade-offs case study, the Readiness of the Medical
Force case study applied the interactive methodology presented in Chapter 2 with a simple interaction matrix. Interactions were indicated as being positive (+) or negative (−), and no
50 Thomas et al., 2015, pp. 1–3.51 Marta Kepe, “Lives on the Line: The A2AD Challenge to Combat Casualty Care,” Modern War Institute blog,July 30, 2018. 52 D’Angelo et al., 2019.

51
magnitude of interaction was assigned. Visualizations similar to those in Chapter 3 were also created to highlight the interaction between categories of variables and the dimensions of strategic readiness; corresponding network metrics were also calculated.
Relevant Variables As noted earlier, the ability of the medical force to provide care to personnel, particularly in
cases of injury, is not solely dependent on the ability or readiness of the medical providers; but relies also on a number of systems. Medical provider readiness (i.e., KSAs), the supply chain (e.g., access to supplies and resupply capability), and transportation all play major roles and have an underlying dependence on uninterrupted communication and command and control, especially in contested environments. Accordingly, this case study has identified a number of variables, described in Table 4.1, that affect the overall readiness of the combat medical care system and providers’ abilities to provide care, as well as measures of effectiveness of the system.

52
Table 4.1. Key Variables in the Readiness of the Medical Force Case Study
Variable Description Relevance Status of Measurement
Candidate population of military medical providers
The number and type of medical providers that the service(s) can accessb
Defines the population from which deploying billets must be filled, and defines an upper bound on the type and amount of care that can be provided
Can be determined from personnel files and is affected by mobilization
Level of medical provider training (relative to KSAs)
Personnel readiness metric indicating level of achievement of required skillsc
Deployment eligibility is dependent on the medical provider meeting the specified criteria of each KSA
Not currently measured
Fill rate of deploying medical billets
Number or percentage of deploying medical billets by type
Fill rate of deploying billets affects treatment capacity
Currently measured, or can be determined from provider readiness levels (KSAs) and deployment requirements
Blood supply Amount of blood and blood components available
Blood supply acts as a limiting factor in treatment capacity
Baseline resourcing currently measured in service UTC data (e.g., Air Force Manpower and Equipment Force Packaging System [MEFPAK], logistics detail [LOGDET]); real-time tracking currently measured but requires high-level interaction between a number of systemsj
Saline supply Amount of saline available Saline supply acts as a limiting factor in treatment capacity
Baseline resourcing currently measured in service UTC data (e.g., Air Force MEFPAK, LOGDET); real-time tracking currently measured but requires high-level interaction between a number of systems
Other MTF supplies Number and type of key pieces of equipment and other supplies available at a given timee
Supplies and equipment act as limiting factors in treatment capacity
Baseline resourcing currently measured in Service UTC data (e.g., Air Force MEFPAK, LOGDET); real-time tracking currently measured but requires high-level interaction between a number of systems
(First responder) medical kit completeness
Number and fill rate of kitf Limits the type and amount of care that can be provided at POIg
Baseline resourcing currently measured in Service UTC data (e.g., Air Force MEFPAK, LOGDET)

53
Variable Description Relevance Status of Measurement
Availability of transportation from POI (ground)
Capacity for movement from POI to higher echelon of care via ground assets at a given time
Affects requirement for transportation from a given MTF over time; limited availability may cause bottlenecks in system and limit treatment capacity at MTF
Real-time metric based on asset availability
Availability of transportation from POI (rotary)
Capacity for movement of casualties from POI to higher echelon of care via rotary assets at a given time
Affects requirement for transportation from a given MTF over time; limited availability may cause bottlenecks in system and limit treatment capacity at MTF
Real-time metric based on asset availability
Requirement for transportation from POI
Number of patients that require transport from POI at a given time
Demand indicator in system; also affects availability of transportation at other stages
Currently measured/tracked via patient records and request for transport; real-time widespread availability of data depends on status of communication
Availability of transportation between in-theater MTFs (ground)
Capacity for movement of casualties from MTF to higher echelon of care via ground assets at a given time
Affects requirement for transportation from a given MTF over time; limited availability may cause bottlenecks in system and limit treatment capacity at MTF
Real-time metric based on asset availability
Availability of transportation between in-theater MTFs (rotary)
Capacity for movement of casualties from MTF to higher echelon of care via rotary assets at a given time
Affects requirement for transportation from a given MTF over time; limited availability may cause bottlenecks in system and limit treatment capacity at MTF
Real-time metric based on asset availability
Availability of transportation between in-theater MTFs (fixed-wing)
Capacity for movement of casualties from MTF to higher echelon of care via fixed-wing assets at a given time
Affects requirement for transportation from a given MTF over time; limited availability may cause bottlenecks in system and limit treatment capacity at MTF
Real-time metric based on asset availability
Requirement for transportation between in-theater MTFs
Number of patients that require transport to high echelon of care within theater
Demand indicator in system; also affects availability of transportation at other stages
Currently measured and tracked via patient records and request for transport; real-time widespread availability of data depends on status of communication
Availability of transportation for out-of-theater evacuation (rotary)
Capacity for out-of-theater evacuation of casualties via rotary assets at a given time
Affects requirement for transportation from a given MTF over time; limited availability may cause bottlenecks in system and limit treatment capacity at MTF
Real-time metric based on asset availability

54
Variable Description Relevance Status of Measurement
Availability of transportation for out-of-theater evacuation (fixed-wing)
Capacity for out-of-theater evacuation of casualties via fixed-wing assets at a given time
Affects requirement for transportation from a given MTF over time; limited availability may cause bottlenecks in system and limit treatment capacity at MTF
Real-time metric based on asset availability
Availability of transportation for out-of-theater evacuation (naval)
Capacity for out-of-theater evacuation of casualties via naval assets at a given time
Affects requirement for transportation from a given MTF over time; limited availability may cause bottlenecks in system and limit treatment capacity at MTF
Real-time metric based on asset availability
Requirement for transportation for out-of-theater evacuation
Number of patients that require evacuation to higher level of care outside of theater
Demand indicator for the system; also affects requirement to fill open positions of evacueesi
Currently measured and tracked via patient records and request for transport; real-time widespread availability of data depends on status of communications
Died of wounds (DOW) rates
Number of casualties that succumb to their wounds (i.e., “died of wounds”)d
Measure of effectiveness of medical network; also affects transportation requirements
Currently measured
Return-to-duty (RTD) timelines
Amount of time before an injured individual returns to duty
Measure of effectiveness of medical network and affects treatment requirements
Currently measured (or determined) through patient records
Rates of out-of-theater evacuation
Number of casualties evacuated at a given time
Affects requirement to fill open positions of evacueesi
Currently measured via patient records
Requirement for treatment at MTFa
Full details of treatment that must be provided to meet injury requirementh
Demand indicator for resources
Real-time metric determined
Average time spent in MTFa
Average amount of time spent at a given location (e.g., POI or MTF) receiving treatment before being transported, returning to duty, or succumbing to wounds
Affects resource utilization and treatment capacity at MTF
Can be determined via patient records
Treatment provided at MTFa
Full details of treatment provided at location at same level of fidelity as “Requirement for treatment at MTF” variable
Specifies resource utilization at MTF
Can be determined from patient records, though provider utilization data may be limited
Requirement to fill open combat positions
Number of open combat positions that must be filled due to loss (DOW or evacuation)
Affects operational and mission performance and has external effects on structural, mobilization, and sustainment readiness
Tracked via requests for forces

55
Variable Description Relevance Status of Measurement
Operational capability/effectiveness
Metrics of operational capability (e.g., sortie generation); likely differs by service and possibly by contingency
Measure of effectiveness (service-level or DoD-level)
Depends on the particular measures of effectiveness of interest, but likely measured
Theater evacuation policy Maximum amount of time casualty may be held at theater hospital for treatment before RTD or evacuation; casualties that cannot RTD within this period are evacuated out of theater
Affects requirement for out-of-theater evacuation assets as well as in-theater treatment requirements and supply usage
Currently measured and set for each contingency
NOTES: UTC = Coordinated Universal Time. a Used in this context, MTF also entails first-responder care provided at POI. b This metric defines the total population of medical providers who may be available according to the specified level of mobilization. It does not take into account deployment eligibility of individual providers. c Current readiness metrics are based solely on whether an individual medical provider’s credentials are currently valid. The implementation of specific DoD KSAs was discussed in GAO 19-206 (GAO, 2019). We envision this metric as a set of indicators associated with each KSA that specify whether the individual has met the deployment criteria for the KSA. d Under the variable structure of this case study, DOW includes both DOW and KIA (killed in action) casualties. In the widely accepted Joint Medical Planning Tool (JMPT) model, DOW is used to indicate casualties who succumb to their wounds after receiving some level of care, while KIA is used to indicate casualties who succumb to their wounds before care can be administered. e Some supplies are one-time use, and others are reusable. For reusable supplies, there is an additional time component that must be considered to allow for sterilization, relocation, etc. (Sources such as the JMPT may be used to identify key pieces of equipment and/or supplies, as well as any additional related time components.) f Similar to “Other MTF supplies,” the fill rate of medical kits may be more appropriately done at the individual item level with particular focus on key supplies. g Real-time tracking of first-responder medical kit completeness is likely not possible because these providers are constantly using materiel and resupplying from MTF stocks when the opportunity arises (e.g., a first responder who has accompanied a casualty to the MTF may return with supplies). h The requirement for treatment must be fully described in terms of resource utilization, including level of treatment (e.g., simple examination, emergency service, operation), which affects the amount of time spent in the MTF, the level of supplies required (e.g., estimated blood and saline usage), and provider utilization (e.g., number of doctors and nurses required, as well as length of time of usage). I Many medical providers reside in the Reserve Component, so mobilization of the Reserves will increase the size of the pool of providers who may deploy. j The entirety of blood supply can be quite difficult to track in real time because there are multiple sources from which blood may be procured—the Armed Services Blood Program, partner nations, walking blood banks on base, etc.
In addition to these variables, there are some other variables that our team identified as pertinent but for which specific interactions (particularly quantifiable interactions) could not be easily determined. For example, medical providers’ knowledge of current resource availability and proximity can affect the ability of medical providers to deliver sufficient care. In an illustrative anecdote, two inexperienced surgeons in Iraq attempted to care for four soldiers with poly-trauma as part of a forward surgical team. Not realizing how close they were to the MTF and unaware of the difficulty of the field procedure they were attempting, the surgeons tried to

56
treat the injuries rather than stabilize and transport. The resultant delays in care ultimately cost one serviceman his leg.53
Another such variable addresses the overall accuracy and depth of knowledge of the current situation (both at the service and DoD levels). Extensive and reliable situational awareness and understanding of current conditions, particularly when conditions are not favorable to the United States, can enable proper support. For example, if a significant impending attack is likely to generate large numbers of casualties, it may be possible to prepare for support by calling for additional medical resources prior to the attack. If a threat to forward locations is suspected, with a corresponding loss of communication, it may be possible to continue support in the form of push packages, as well as making regular trips forward (when conditions allow) with evacuation assets rather than waiting for an evacuation request, as is standard.
These are just two examples of variables that our team identified as important without being able to explicitly quantify their importance within this framework. There may be others, and they should, at the very least, be identified and their potential impacts discussed.
It is important to note that the variables described in Table 4.1 are concerned with the readiness of the combat medical care system in a given situation (i.e., a specified operational setting). Many of these variables have an underlying dependence on the characteristics of the given situation. For example, the level of mobilization and theater evacuation policy are determined by the particular contingency into which the United States has entered (though both may be modified after conflict operations begin); the requirement for treatment and transportation are determined by the casualty stream, which is dependent on the types of weapons and targeting methods employed by the adversary; and even the availability of transportation and evacuation assets is dependent on the particular situation because the United States may not enjoy high degrees of freedom of movement.
In terms of performing predictive modeling and assessment of readiness and capability of the medical care network, some preparatory modeling must be performed using such tools as the JMPT and the Medical Planners’ Toolkit to predict casualty streams and other characteristics of the network. Table 4.2 contains a summary of the scenario-related parameters that support this preanalysis.54 To the extent possible, these parameters’ influences on the variables presented in Table 4.1 are also addressed.
53 Whitley et al., 2016. 54 We refer to these as parameters rather than variables because, in the context of the analyses, these items are assumed to be more or less fixed, and they do not represent policy-related levers.

57
Table 4.2. Additional Relevant Scenario-Related Parameters
Parameter Description Relevance
Description of casualties Describes the expected casualty stream, including casualty rates, disposition, severity, and modes (e.g., combat and noncombat injuries)
Defines the requirements placed on the medical care system
Integrity of communications Specifies whether communications are intact, degraded, or denied
Affects ability to maintain situational awareness, request transportation or evacuation, resupply, etc.
Air superiority Indicator of whether United States has secured the area to obtain and maintain air superiority
Affects ability to transport and/or evacuate casualties via rotary or fixed-wing aircraft, as well as resupply efforts
Reliability of transportation (rotary) Percentage of rotary assets that successfully complete required evacuation(s)
Affects assumed availability of rotary assets for transportation; affected by level of contestedness of environment (i.e., air superiority or lack thereof)
Transportation speed (rotary) Expected transit speed of rotary assetsa
Affects availability of rotary assets for transportation at a given time (e.g., reduction in transit speed increases number of assets in transit, thus decreasing availability for transit at any given time)
Reliability of transportation (fixed-wing)
Percentage of fixed-wing assets that successfully complete their required evacuation(s)
Affects (assumed) availability of fixed-wing assets for transportation; affected by level of contestedness of environment (i.e., air superiority or lack thereof)
Transportation speed (fixed-wing) Expected transit speed of fixed-wing assetsa
Affects availability of fixed-wing assets for transportation at a given time (e.g., reduction in transit speed increases number of assets in transit, thus decreasing availability for transit at any given time)
Freedom of movement (ground) Indicator of whether United States secured the area to obtain and maintain freedom of (ground) movement
Affects ability to transport and/or evacuate casualties via ground assets, as well as the movement of supplies to forward locations
Reliability of transportation (ground) Percentage of ground assets that successfully complete their required evacuation(s)
Affects (assumed) availability of ground assets for transportation; affected by level of contestedness of environment (i.e., freedom of movement of lack thereof)
Transportation speed (ground) Expected transit speed of ground assetsa
Affects availability of ground assets for transportation at a given time (e.g., reduction in transit speed increases number of assets in transit, thus decreasing availability for transit at any given time)
Freedom of movement (naval) Indicator of whether the United States has secured the area in order to obtain and maintain freedom of (sea) movement
Affects the ability to evacuate patients to out-of-theater MTFs

58
Parameter Description Relevance
Facility treatment capacity Treatment capacity of an MTF at a given time as determined by resource availability (e.g., bed space, equipment, supplies, providers)
Affects the ability to provide treatment at an MTF
Distance between POI and initial MTF/treatment location
Distance between casualties’ POI and first responder treatment location (if not at POI)
Coupled with freedom of movement indicators, affects availability of transportation assets; may also affect treatment required and resource requirements if conditions and/or DOW rates worsen
Distance between in-theater MTFs Distance between in-theater MTFs of increasing echelons of care
Coupled with freedom of movement indicators, affects availability of transportation assets; may also affect treatment required and resource requirements if conditions and/or DOW rates worsen
Distance to out-of-theater MTF Distance from theater to out-of-theater care
Coupled with freedom of movement indicators, affects availability of transportation assets
a Transit speed of assets can be affected by air superiority and/or freedom of movement. A lack of freedom of movement can reduce effective transit speed.
Interaction Between Variables and Parameters The interaction for the variables presented in Table 4.1 is shown in Figure 4.1.55 The matrix
is structured similar to that of the Unit Training and Presence Trade-offs case study. Grouped variables appear in both Row 1 and Column 2 of the matrix (note that Column 1 identifies the variable groups), and a simple “+/−” notation is used to signify interactions. Four main categories of variables have been identified in this case study—“Treatment capacity,” “Medical supply availability,” “Transportation requirements and availability,” and “Casualties.” A fifth category, “Other,” contains just a single variable, the “Theater evacuation policy” variable. This variable is set according to the operation and can have significant effects on the medical network—a long timeline increases the requirements placed on the in-theater medical network, while a short timeline increases demand for transportation—but does not explicitly fit into any of the other categories. Variables are also classified according to a readiness dimension, as indicated by the color-coded cells. Note that variables touch on all dimensions except structural readiness. However, the “Requirement to fill open (combat) positions” may technically relate to both structural and mobilization readiness.
55 The parameters shown in Table 4.2 are not reflected in this figure because they are assumed to representquantities that are more or less fixed. Thus, their lack of change cannot elicit a change in any other variable.

59
Figure 4.1. Variable Interaction Matrix—Readiness of the Medical Force
Accuracy
and depth of
knowledge
of current
situation
Medical provider
knowledge of
resource
availability and
proximity
Level of
medical
provider
training
(relative to
KSAs)
Ability to fill
deploying
medical
billets
Access to
military medical
personnel (i.e.,
sufficient level of
mobilization)
Blood
supply
Saline
supply
Availability
of other
medical
supplies
Medical supply
kit
completeness
Availability of
(intratheater)
transportation
from point of
injury - ground
Availability of
(intratheater)
transportation
from point of
injury - rotary
Requirement
for transport
from point of
injury
Availability of
evacuation
assets for
transport to in-
theater major
MTF - ground
Availability of
evacuation
assets for
transport to in-
theater major
MTF - rotary
Availability of
evacuation assets
for transport to in-
theater major
MTF - fixed wing
Requiremen
t for
evacuation
to in-theater
major MTF
Availability of
evacuation
assets for
transport to out-
of-theater MTF -
rotary
Availability of
evacuation
assets for
transport to out-
of-theater MTF -
fixed wing
Availability of
evacuation
assets for
transport to out-
of-theater MTF -
naval
Requirement
for evacuation
to out-of-
theater MTF
DOW
Rates
RTD
Timelines
Rates of
evacuation
out of theater
Requirement
for treatment
at a given
location
Average time
spent in MTF
Treatment
provided
Requirement
to fill open
(combat)
positions
Operational
capability /
effectiveness
Theater
Evacuation
Policy
(time)
Accuracy and depth of knowledge of
current situation + +Medical provider knowledge of resource
availability and proximity
Level of medical provider training
(relative to KSAs) + * * *
Ability to fill deploying medical billets +Access to military medical providers (i.e.,
sufficient level of mobilization) +Blood supply [2] [3]
Saline supply [3]
Other MTF medical supply (do we want
to include storage and re-supply?) [3] +
Medical supply kit completeness [3] [4] + − + −Availability of (intratheater) − − + −Availability of (intratheater) − − + −Requirement for transport from point of
injury + − − −Availability of evacuation assets for
transport to in-theater major MTF -
ground−
Availability of evacuation assets for
transport to in-theater major MTF -
rotary
−
Availability of evacuation assets for
transport to in-theater major MTF - fixed
wing−
Requirement for evacuation to in-theater
major MTF + + + − − − −Availability of evacuation assets for
transport to out-of-theater MTF - rotary−
Availability of evacuation assets for
transport to out-of-theater MTF - fixed
wing
−
Availability of evacuation assets for
transport to out-of-theater MTF - naval−
Requirement for evacuation to out-of-
theater MTF + + + − − −
DOW Rates − − − +
RTD Timelines (length) −
Rates of evacuation out of theater +Requirement for treatment at given
location +
Average time spent in MTF − − +
Treatment provided − − − − + + + − −Requirement to fill open (combat)
positions−
Operational capability/effectiveness + +O ther
Theater Evacuation Policy (time) +
Readiness Area
[1] includes knob for whether medical personnel are among casualties
[2] knob includes mix of sources (US, partner nation, walking blood bank)[3] affected by contested environment (freedom of movement, etc.)
[4] assuming used solely at point of injury
Sustainment Readiness
Resilience
Military Effectiveness
Operational ReadinessForce Posture
Structural Readiness
Mobilization Readiness
Casualt ies
"Conteste dness" of
Environm ent
Treatm e nt Capability
Me dical Supply
A vailability
Transportat ion
Availability and
Require m ents
+ indicates a positive first-order interaction− indicates a negative first-order interaction
A c
han
ge in
th
is v
aria
ble…
…causes a change in this variable.

60
The diagram in Figure 4.2 provides a visual representation of the interaction matrix in terms of variable groups. Note that in this diagram, we have also included the scenario-dependent parameters discussed in Table 4.2 to emphasize their effects on the system. We have outlined in yellow the three key measures of effectiveness for the medical network—“DOW rates,” “RTD timelines,” and “Operational capability/effectiveness.”
Figure 4.3 shows the same variables and parameters and their interactions but is reorganized according to readiness dimension classification. We have also omitted the scenario-related variables, which cannot necessarily be classified according to a readiness dimension (because we consider these variables to essentially be fixed inputs) and thus are not immediately pertinent to the analysis of readiness dimension interaction. Here, we see that many of the variables fall within the operational readiness dimension, and, while there are some direct connections to the structural readiness and resilience dimensions, there are many more that have an intermediate connection through one or more variables that do not explicitly fall within a readiness dimension.

61
Figure 4.2. Interactions Between Variables and Parameters Diagram—Readiness of the Medical Force

62
Figure 4.3. Interactions Between Dimensions of Readiness Diagram—Readiness of the Medical Force

63
Analysis of the Medical Readiness Framework and Readiness Dimension Interactions
We used the interaction information in Figure 4.1 to generate metrics quantifying the relationships between individual variables and readiness dimensions shown in Figures 4.2 and 4.3. These suggested metrics provide a means of quickly generating initial insights into the structure of the system and role of various system components.
While we believe that we have captured the most-relevant components of the problem, our list of variables is likely not exhaustive. This means that metrics relying on the number of connections between variables are useful but rough measures of the concepts discussed in this section. Using these metrics as inputs for more-complex analyses would compound this uncertainty.
Connectedness
Recall that we define connectedness as the number of other variables with which a given variable directly interacts and that this metric can be interpreted as providing a measure of prominence within the system. In the context of medical readiness considered here, such variables can be interpreted another way as well. The medical readiness framework investigated here is directly concerned with the flow of personnel and supplies (during a contingency operation) rather than the more general spread of improvements to readiness that are the focus of other analyses. Thus, variables that have high connectedness have the potential to become bottlenecks in the system, preventing the flow (treatment) of casualties and thus limiting the effectiveness of the system. In this case, bottlenecks represent impediments to readiness and ability to provide care.
Table 4.3 shows the connectedness values for those variables with the highest levels of connectedness.56 The results shown in the table further highlight the importance of effective and efficient provision of treatment at MTFs during a contingency. Every casualty creates a requirement for treatment that must be met by an MTF or care at POI.57 Because the two most connected variables in the system—“Treatment provided at MTF” and “Requirement for treatment at MTF”—are so closely linked, the ability of one or the other to constrict or enhance the flow of personnel and supplies through the system depends strongly on the behavior of or changes to the other variable. In this framework, increases to the capacity of an MTF or the training of MTF medical personnel do little to improve downstream variables such as “DOW rates” and “Operational capability/effectiveness” if the treatment capacity is already sufficient to
56 The intent was to show data for the top ten variables only. However, the eighth, ninth, tenth, and 11th variables allhave a connectedness value of 5. Therefore, the top 11 variables are shown in this table. 57 Recall that, for simplification, we use MTF to include both actual treatment facilities and treatment at POI.

64
meet the requirement.58 Conversely, a large influx of casualties can quickly overwhelm an MTF if treatment capacity cannot be expanded to meet demand.
Table 4.3. Readiness of the Medical Force Variables with the Highest Connectedness
Variable Category Connectedness
Treatment provided at MTF Casualties 12
Requirement for treatment at MTF Casualties 10
Requirement for transportation between in-theater MTFs Transportation Availability and Requirements 9
Requirement for transportation for out-of-theater evacuation Transportation Availability and Requirements 9
DOW rates Casualties 8
Availability of transportation from POI (rotary) Transportation Availability and Requirements 6
Requirement for transportation from POI Transportation Availability and Requirements 6
(First responder) medical kit completeness Medical Supply Availability 5
Availability of transportation from POI (ground) Transportation Availability and Requirements 5
RTD timelines Casualties 5
Rates of out-of-theater evacuation Casualties 5
A stark example of this dynamic was evident in the civilian medical system during the 2020
coronavirus disease 2019 (COVID-19) pandemic. In the span of a few short weeks during March and April 2020, hospitals across the United States (and, in fact, worldwide during the first months of 2020) were quickly overwhelmed—there were insufficient beds, ventilators, and personal protective equipment for providers to meet the rapidly increasing demand.59 While efforts to “flatten the curve,” such as social distancing and stay-at-home orders, were enacted to help prevent the spread of COVID-19 and alleviate the stress on the medical system by reducing the number of people requiring medical treatment at any given time, such measures are not feasible in contingency settings.
Most of the other highly connected variables in the medical readiness system concern the movement of personnel. Note also that four of the 11 variables shown (three transportation variables and “[First responder] medical kit completeness”) center on treatment at POI. While they are not the highest-ranking variables in terms of connectedness, their collective presence
58 One might argue that the training or experience of medical personnel can greatly affect downstream variables such as DOW rates. However, in the particular scenario (i.e., contingency medical operations) considered here, we could not identify data that explicitly relate provider training and experience to casualty outcomes, and we are doubtful that such data exist. 59 Annie Walman, Al Shaw, Ash Ngu, and Sean Campbell, “Are Hospitals Near Me Ready for Coronavirus? Here Are Nine Different Scenarios.” ProPublica, March 17, 2020.

65
indicates that an inability to treat people at POI and either return them to duty or move them to subsequent MTFs could have significant ramifications for the medical system considered here, as well as the war in general.
Table 4.4 shows the degree of connectedness and extent of connectedness for each of the readiness dimensions involved in this analysis. Dimensions are shown in order of decreasing degree of connectedness. It should not be surprising that operational readiness ranks highest. From Figure 4.3, it is clear that operational readiness is the largest group of variables, and these variables have a significant number of interactions with other variables within this analysis.60 It is somewhat surprising that the resilience dimension, which comprises only three variables (see Figure 4.3), ranks high on both degree and extent of connectedness.
Table 4.4. Connectedness of Readiness Dimensions in the Context of Readiness of the Medical Force
Dimension Degree of Connectedness Extent of Connectedness
Operational readiness 35 4
Additional facilitating variablesa 34 6
Resilience 18 6
Sustainment readiness 13 3
Mobilization readiness 3 2
Military effectiveness 2 2
Force posture 1 1 a These are variables that do not explicitly fall within a dimension of readiness but are necessary to form a complete understanding of the system and often to form important bridges between dimensions.
Similar to the Unit Training and Presence Trade-offs analysis, there is once again a set of variables that are not easily categorized into a dimension but are necessary to understanding the complete system, which we group into a single “Additional facilitating variables” dimension. Here, we see that these additional variables rank high on both connectedness values. It is important to note that there are only five additional facilitating variables in this analysis, four of which pertain to the requirement for treatment and transportation. However, the requirements for treatment and transportation are crucial elements of this analysis, being the key demand drivers; hence, their high level of connection to other dimensions.
60 In this analysis, we consider variables pertaining to the availability of transportation assets to fall within the realmof operational readiness. Some may argue that these variables should be classified under sustainment readiness, given that they relate to the ability to continue to provide for troops within theater. However, we view them from a resourcing perspective and approach the analysis asking whether the medical force is properly resourced with transportation and evacuation assets.

66
Impact Potential
Variables with the highest impact potential are shown in Table 4.5.61 As in the case of Table 4.2, we show only the top ten variables, and variables are presented in terms of decreasing impact potential. The results shown in Table 4.5 further highlight the centrality of the effective provision of medical treatment to the system. As with connectedness, both the requirement for transportation and the ability to meet that requirement at various stages in the medical readiness system are also relevant. Note that the variables related to POI rank even higher on this metric. Considering how this metric is calculated, this is unsurprising because these variables are pertinent at the beginning of the flow of personnel through the system. Thus, they are affected by relatively few upstream variables but have a great deal of potential to affect how the rest of the system functions.
Table 4.5. Readiness of the Medical Force Variables with the Highest Impact Potentials
Variable Category Impact Potential
Treatment provided at MTF Casualties 10
Requirement for transportation between in-theater MTFs Transportation Availability and Requirements 7
Requirement for transportation for out-of-theater evacuation Transportation Availability and Requirements 6
(First responder) medical kit completeness Medical Supply Availability 5
Availability of transportation from POI (ground) Transportation Availability and Requirements 4
Availability of transportation from POI (rotary) Transportation Availability and Requirements 4
Requirement for transportation from POI Transportation Availability and Requirements 4
DOW rates Casualties 4
Average time spent in MTF Casualties 3
Other MTF supplies Medical Supply Availability 2
Operational capability/effectiveness Casualties 2
Table 4.6 shows the degree and extent of impact potential for the readiness dimensions. As
anticipated, operational readiness variables, along with the group of additional facilitating variables, rank highest on both values. As noted earlier, the variables in these two categories account for nearly all of the limiting factors in this analysis and are the main determinants of flow through the medical network represented here. In fact, seven of the top ten variables shown in Table 4.4 fall within the operational readiness dimension and the group of additional facilitating variables. Furthermore, the extremely low impact potential values for mobilization readiness, force posture, and military effectiveness dimensions would suggest that these
61 Once again, the intent was to show the top ten ranked variables. However, ties among variables’ impact potential resulted in the top 11 variables being shown.

67
dimensions are more directly defined by outcome-related variables only. Figures 4.2 and 4.3 confirm that this is the case for mobilization readiness and military effectiveness. However, we see that the force posture dimension, here defined by the sole “Theater evacuation policy” variable, is actually not an outcome variable in any way but rather an input variable that affects just a single other variable.
Table 4.6. Impact Potential of Readiness Dimensions in the Context of Readiness of the Medical Force
Dimension Degree of Impact Potential Extent of Impact Potential
Operational readiness 24 3
Additional facilitating variablesa 19 3
Resilience 6 3
Sustainment readiness 7 3
Mobilization readiness 1 1
Force posture 1 1
Military effectiveness 0 0 a These are variables that do not explicitly fall within a dimension of readiness but are necessary to form a complete understanding of the system and often to form important bridges between dimensions.
Interactions Between Dimensions
Figure 4.4 shows the adjacency matrix for the medical readiness framework. Here, we see that the most interactions between readiness dimensions go from operational readiness to the group of additional facilitating variables and vice versa. There is also a relatively large number of interactions from operational readiness to resilience and from the additional facilitating variables to sustainment readiness. The figure also provides insight into the interactions highlighted in Tables 4.3 and 4.5. For example, the extent-of-interconnectedness calculation of the “Connectedness” variable indicates that modifications within sustainment readiness have direct effects on three other readiness dimensions. Figure 4.4 shows that these dimensions are “Operational readiness,” “Resilience,” and the “Additional facilitating variables,” with the greatest number of impacts being in “Operational readiness.”62
62 Given that one “dimension” is the group of additional facilitating variables, sustainment readiness technically has the potential to impact only two other dimensions.

68
Figure 4.4. Number of Variable-Level Interactions Between Readiness Dimensions—Readiness of the Medical Force Case Study
While the matrix in Figure 4.4 provides a detailed breakdown of the directional relationships between the dimensions of readiness in this case study, Figure 4.5 provides an overall measure of the strength of the connections between pairs of readiness dimensions. The values in Figure 4.5 are simply the number of variable-level connections between one readiness dimension and another, regardless of direction.
Figure 4.5. Total Number of Pairwise Connections Between Readiness Dimensions—Readiness of the Medical Force Case Study
NOTE: Bidirectional interactions were counted only once.
The values in Figure 4.5 were used to create Figure 4.6, which shows a high-level summary of how the dimensions of readiness interact within the context of medical provider and network readiness. The lines between readiness dimensions are weighted by the number of connections given in Figure 4.5.
Operational Readiness
Mobilization Readiness
Force PostureMilitary
EffectivenessSustainment
ReadinessResilience
Additional Facilitating Variables
Operational Readiness
0 0 0 49 11
Mobilization Readiness
0 0 1 00 0
Force Posture 0 0 0 0 0 1
Military Effectiveness
0 0 0 00 0
Sustainment Readiness
4 0 0 02 1
Resilience 0 2 0 1 0 3
Additional Facilitating Variables 11 0 0 0 7 1
Operational Readiness
Mobilization Readiness
Force PostureMilitary
EffectivenessSustainment
ReadinessResilience
Mobilization Readiness
0
Force Posture 0 0
Military Effectiveness
0 1 0
Sustainment Readiness
4 0 0 0
Resilience 9 2 0 1 2
Additional Facilitating Variables 22 0 1 0 7 4
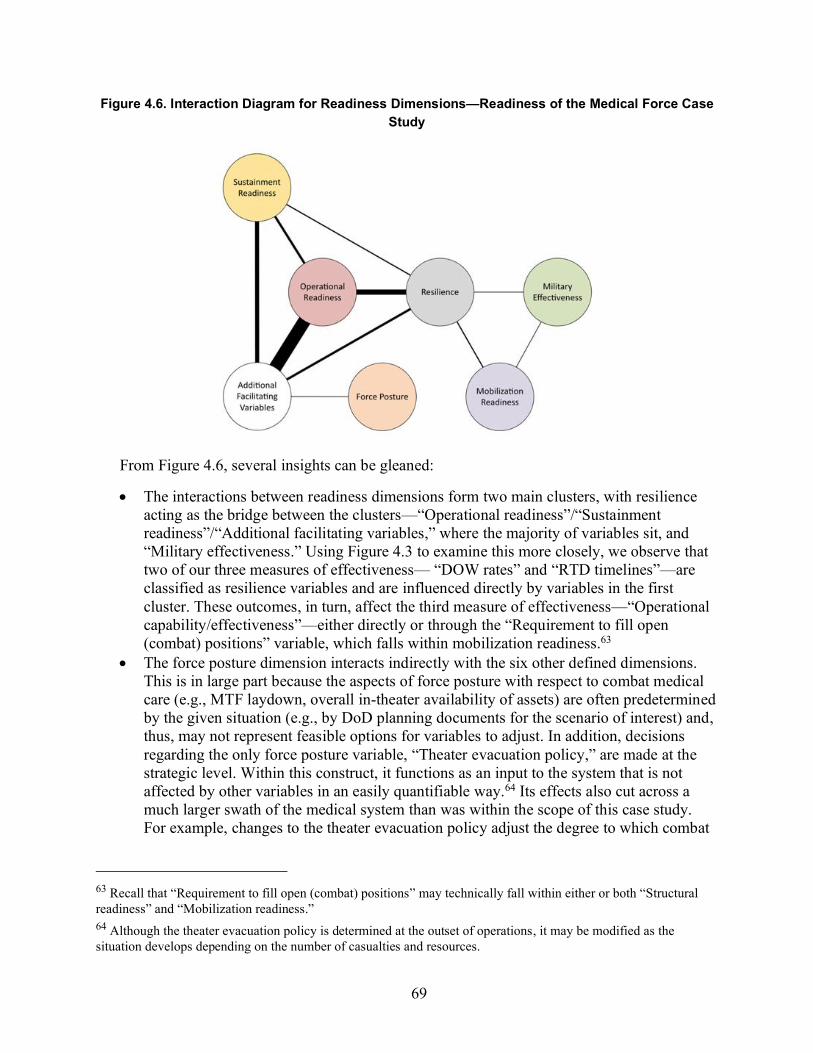
69
Figure 4.6. Interaction Diagram for Readiness Dimensions—Readiness of the Medical Force Case Study
From Figure 4.6, several insights can be gleaned:
• The interactions between readiness dimensions form two main clusters, with resilienceacting as the bridge between the clusters—“Operational readiness”/“Sustainmentreadiness”/“Additional facilitating variables,” where the majority of variables sit, and“Military effectiveness.” Using Figure 4.3 to examine this more closely, we observe thattwo of our three measures of effectiveness— “DOW rates” and “RTD timelines”—areclassified as resilience variables and are influenced directly by variables in the firstcluster. These outcomes, in turn, affect the third measure of effectiveness—“Operationalcapability/effectiveness”—either directly or through the “Requirement to fill open(combat) positions” variable, which falls within mobilization readiness.63
• The force posture dimension interacts indirectly with the six other defined dimensions.This is in large part because the aspects of force posture with respect to combat medicalcare (e.g., MTF laydown, overall in-theater availability of assets) are often predeterminedby the given situation (e.g., by DoD planning documents for the scenario of interest) and,thus, may not represent feasible options for variables to adjust. In addition, decisionsregarding the only force posture variable, “Theater evacuation policy,” are made at thestrategic level. Within this construct, it functions as an input to the system that is notaffected by other variables in an easily quantifiable way.64 Its effects also cut across amuch larger swath of the medical system than was within the scope of this case study.For example, changes to the theater evacuation policy adjust the degree to which combat
63 Recall that “Requirement to fill open (combat) positions” may technically fall within either or both “Structuralreadiness” and “Mobilization readiness.” 64 Although the theater evacuation policy is determined at the outset of operations, it may be modified as thesituation develops depending on the number of casualties and resources.

70
medical operations affect the military and/or civilian medical system in the continental United States (CONUS).65
• Figure 4.6 draws attention to the highly interconnected nature of operational readinessand the group of additional facilitating variables. Upon examining the interactions inFigure 4.1, we can see that this relationship is primarily between the “Requirement fortransportation/treatment” and the “Availability of transportation/treatment.” This suggeststhat the degree to which the capability to move people through and between MTFs meetsthe requirement to do so may play an integral role in the overall effectiveness of themilitary medical system.
Key Insights Medical provider readiness, the supply chain, and transportation all contribute to the medical
readiness of the force. Our focus in this case study was to determine how the elements of this complex system interact to build sustainment and operational readiness. Our key insights from this case highlight the multidimensional character of medical readiness and the consequences of narrowly focusing on operational readiness alone:
• Medical force readiness touches all the strategic readiness dimensions to a degree andwould be impossible to assess without consideration of multiple variables. This is mademore difficult by a potentially misleading focus on operational readiness. The normaloperational environment looks nothing like the potential wartime environment.
• In terms of training and personnel levels, this case study suggests the need for tieredreporting—reporting done at both the force and unit levels—which specifically addressesthe readiness of personnel to deal with the kinds and numbers of casualties likely in amajor contingency. This is a force-level report rather than a unit-level report, and it refersto the number of providers who have recent training and experience in major trauma,triage, and combat-related conditions rather than simple completion of routine medicaltraining.
• The ability to transport patients from POI to different facilities belongs generally insustainment readiness when viewed as a standing capability. This is associated withoperational readiness and resilience to a degree but is most strongly associated with thegroup of additional facilitating variables, which have to do with theater policiesconcerning treatment priorities and casualty levels that may be difficult to predict inadvance.
• The most salient insight is that the medical system has a fairly clear idea of how torespond to normal demands but may have a very difficult time reacting to the demands ofcontingencies, foreseen and unforeseen. A tiered readiness generation and reporting
65 Casualties evacuated to CONUS tend to go to MTFs. However, if the number and severity of casualties is greatenough, casualties may also be evacuated to CONUS civilian facilities. (Information from conversation with Brent Thomas, March 24, 2020.)

71
system allows assessment not just of unit steady state but of force-level major contingency requirements. A system focusing just on operational readiness would miss many essential relationships.

72
5. Case Study: Increased Air Force Force Structure
Introduction
We have looked at one case study that sought to describe specific trade-offs between two key outcome variables and one aimed at improving understanding of a complex system. We now turn to one that shares key aspects of both and uses a slightly different approach to measuring variables so that it can focus more on the magnitude of effect, not just the direction. We also show an expansion and refinement of the ability to illuminate how readiness inputs and outputs are different over time.
Following a recent Air Force analysis using “thousands of simulations and wargames,” Air Force leadership has determined that its force structure is too small to “implement the [2018] National Defense Strategy and prevail over our highest priority competitors.” Thus, as part of the USAF Posture Statement for Fiscal Year 2020, the Air Force has announced a new initiative—termed “The Air Force We Need”—founded on a proposal to increase the number of operational Air Force squadrons from 312 to 386 by 2030.66 The expansion would include the following:
• 7 new fighter squadrons• 22 new command and control, intelligence, surveillance, and reconnaissance squadrons• 14 new tanker squadrons• 5 new bomber squadrons• 9 new combat search and rescue squadrons• 7 new special operations squadrons• 1 new airlift squadron• 2 new remotely piloted aircraft squadrons.
This increase in operational squadrons equates to not only thousands of new pilots and maintainers, but also to tens of thousands of additional airmen in supporting roles and all the associated resources (personnel and equipment), infrastructure, and training. Specifically, 74 additional squadrons would require approximately 40,000 airmen and civilians, resulting in a total force structure of roughly 725,000.67 Currently, the Air Force has about 670,000 personnel, including active duty airmen, Guardsmen, Reservists, and civilians. This number is expected to rise to 685,000 by FY 2023, which is 40,000 short of the 2030 goal.
66 U.S. Air Force, USAF Posture Statement Fiscal Year 2020, Washington, D.C., March 2019, p. 3.67 Stephen Losey, “New in 2019: Growing the Force—the Road to 386 Squadrons,” Air Force Times, January 2,2019.

73
The long-term effects of such a shift in the force structure of the Air Force are far reaching, which made this case study both particularly complicated and particularly relevant to the real-world strategic readiness issues that DoD faces every day. We were interested in evaluating the magnitude of effects of an expanded force structure on any given readiness variable. Given the complex nature of the case study and that every variable we examined had numerous interactions with other readiness variables, we wanted to demonstrate, analytically, the specific interactions, as well as which variables were most affected in any given readiness dimension across several different time horizons.
Our goal was to capture both short-term and longer-term trade-offs in and impacts on readiness. For example, when the number of operational squadrons is increased, there may be a deficit of experienced airmen at higher skill levels across career fields during the zero- to three-year time frame, regardless of how many new airmen are hired. This deficit will lead to a decrease in operational readiness in the near term. That same decision (to increase force structure) would have different effects in years two to seven and years five to 15. To capture the varying effects across different time horizons, we found it important to designate the readiness dimension in which an interaction between two variables occurred, as opposed to designating the variables themselves to these dimensions.
Application of the Interactive Methodology Like the previous two case studies, the Increased Air Force Force Structure case study
applied the interactive methodology, using a complex interaction matrix. Instead of indicating only positive, negative, or no interaction between variables, we used numeric values (for example, 0, 1, 2, 3) to describe the relative magnitude of the interactions between variables in addition to positive and negative indications. We also evaluated the variables across three different time horizons (see Figure 5.1). These time horizons are consistent with DoD planning processes outlined in Chairman of the Joint Chiefs of Staff Instruction 3050.01, Implementing Global Integration.68 The result is a set of three interaction matrices (one per time horizon) that illustrate the interaction and magnitude of effect between readiness variables, as the following sections will describe.
68 Chairman of the Joint Chiefs of Staff Instruction 3050.01, Implementing Global Integration, Washington D.C.:Joint Staff, December 31, 2018, Not available to the general public.

74
Figure 5.1. We Assess Readiness Variables Across Three Time Horizons
Key Variables and Parameters We began by populating the interaction matrices with variables related to the seven core
dimensions of strategic readiness introduced in Chapter 1. Using the PESTONI framework, also introduced in Chapter 1, we identified numerous variables in every area that would be directly affected by an increase in force structure. Using the DOTMLPF-P framework, we identified an additional category of variables, “Host nation support,” which we included in the analysis because host nations may be able to supply some of the resources needed (personnel or equipment) to support an increase in force structure. There were many relevant variables for this case study (39), which are listed in Table 5.1 along with definitions.
2 – 7 Years0 – 3 Years ~5 – 15 Years
Force Employment
ForcePlanning
ForceDesign
Analysis conducted for each time horizon informs the analysis for
other time horizons

75
Table 5.1. Key Variables in the Increase in Air Force Force Structure Case Study
Variable Description Relevance Status of Measurement
Aircrew Number of aircrew personnel required and assigned to support increased force structure
Used to show additional personnel requirements and shortfalls in authorized and assigned personnel
Currently measured on unit manning document (UMD)
Maintainers Number of maintenance personnel required and assigned to support increased force structure
Used to show additional personnel requirements and shortfalls in authorized and assigned personnel
Currently measured on UMD
Support personnel Number of support personnel required and assigned to support increased force structure
Used to show additional personnel requirements and shortfalls in authorized and assigned personnel
Currently measured on UMD
Skill levels Demand for higher skill levels across career fields; time to achieve those skill levels
Used to show skill level requirement and shortfalls across career fields
Currently measured on UMD, through Ready Aircrew Program (pilots), and in unit reports (maintenance)
Personnel health and well-being
Readiness of personnel to perform their mission
Used to show number of personnel ready to meet mission requirement and any shortfalls
Currently measured in squadron commanders’ assessments in DRRS
New aircraft Number of new aircraft required and available to support increased force structure
Used to show additional new aircraft requirements and shortfalls in availability
Currently measured, requirement in AF/A5X with geographic combatant commands, available in DRRS
Existing aircraft Number of existing aircraft (refurbished or extended life) required and available to support increased force structure
Used to show additional existing aircraft requirements and shortfalls in availability
Currently measured by System Program Office
Support equipment Demand for and supply of support equipment to support increased force structure
Used to show additional support equipment requirements and shortfalls in available support equipment
Currently measured in unit-level accounting of equipment in DRRS
Aircraft parts Demand for and supply of aircraft parts to support increased force structure
Used to show additional aircraft parts requirements and shortfalls in available parts
Currently measured in Integrated Logistics System–Supply
Depot health Ability of the depot to conduct the workload required to support increased force structure
Used to show availability of depot to execute new workload
Currently measured in DRRS
Supply levels Demand for and availability of parts to support increased force structure
Used to show additional supply requirements and shortfalls in available supply
Currently measured in Integrated Logistics System–Supply
Unscheduled maintenance
Demand for unscheduled maintenance with increased force structure
Used to show additional unscheduled maintenance workload
Currently measured in DRRS

76
Variable Description Relevance Status of Measurement
Scheduled maintenance
Demand for scheduled maintenance with increased force structure
Used to show additional scheduled maintenance workload
Currently measured through programmed flying hour schedule in DRRS
Fuel Amount of fuel required and available to fuel increased force structure
Used to show additional fuel requirements and shortfalls in available fuel
Currently measured by Defense Logistics Agency Energy and Air Force Petroleum Office
Contractor logistics support
Requirement for contractor logistics support to support increased force structure
Used to show amount and type of reliance on contractor support
Currently measured by the System Program Office and in the contractor logistics support contract
Trainers Number of trainers required and available to support increased force structure
Used to show additional trainer requirements and any shortfall
Currently measured by the System Program Office, AF/A5X, and availability in DRRS
Munitions Number of required and available munitions to arm increased force structure
Used to show additional munitions requirements and shortfalls in available munitions
Currently measured and tracked by Global Ammunition Control Point and reported in DRRS
Bandwidth and system access
Amount of bandwidth required and available to access systems needed to support increased force structure
Used to show additional bandwidth and system access requirements
Currently tracked through mission defense teams
Basing Amount of infrastructure required and available to support increased force structure
Used to show additional basing and infrastructure requirements
Currently tracked through GEOBASE
Transportation Amount of transportation required and available to support increased force structure
Used to show additional transportation requirements
Currently tracked by U.S. Transportation Command
Industry skilled labor Availability and capability of industrial labor base to support increased force structure
Used to show additional requirement for skilled industrial base
Not currently trackeda
Raw materials Availability of raw materials to support increased force structure
Used to show additional requirements for raw materials
Not currently trackedb
Industrial infrastructure Amount and availability of commercial infrastructure—for aircraft and support resources—to support increased force structure
Used to show additional industrial infrastructure capabilities to build aircraft and manufacture the resources to support those aircraft
Not currently tracked
Host nation support Amount and availability of host nation resources to support increased force structure
Used to show additional host nation capabilities
Currently tracked by in Base Support Plans and reported in DRRS
NOTES: AF/A5X = Office of the Deputy Chief of Staff, Plans and Requirements, Directorate of Operational Planning, Policy and Strategy. a Although not currently tracked by the Air Force, workforce statistics, such as those tracked by the Aerospace Industries Association, could serve as a proxy. b The U.S. Geological Survey, while not tracking availability of raw materials, provides Mineral Industry Surveys showing monthly domestic production that could provide some insight into availability of raw materials.

77
While the majority of the PESTONI variables in this case study are measured through DRRS, other variables that we identified as important, such as those related to the industrial base, are not currently measured, either within DoD or at all. When this occurs, the ability to refine and eventually quantify relationships may be compromised—until the data can be developed. Nevertheless, the general magnitude and direction will probably be discoverable and usable at this high level of abstraction. Next, we demonstrate how we illustrated the interaction between the identified variables.
Interactions Between Variables To construct the interactive matrices, we listed each variable identified in a spreadsheet with
each variable listed in a single column (see Column C in Figure 5.2) and as an individual column heading (see Row 3 in Figure 5.2).
Next, we evaluated each variable’s interactions, as well as the magnitude of those interactions, and classified each interaction with respect to the affected readiness dimension. For each variable, we determined whether it will be directly69 affected by the initiative and the magnitude (0–3)—positive or negative—of that effect and entered the magnitude in the matrix, where
• 0 = no effect• 1 = small effect• 2 = moderate effect• 3 = large effect.Then, for each interaction, we determined the aspect of readiness affected using the
following color-coding for presentation purposes:
• Military effectiveness = green• Operational readiness = red• Structural readiness = blue• Mobilization readiness = purple• Sustainment readiness = yellow• Resiliency = gray.70
69 It is important to not capture secondary or tertiary interactions in the matrix, because this will distort magnitudescores and flow charts. For example, the number of new support personnel has a direct impact on the demand for transportation because the new airmen will need transportation to and from training, duty locations, and deployments. However, while the increased demand for transportation will create an increased demand for fuel, this should not be captured in the interaction between the number of new support personnel and the demand for fuel because that is a secondary interaction. This interaction should only be captured between the demand for transportation and its direct effect on the demand for fuel. 70 Note that the force posture dimension of readiness is not included in this case study because the initiative itself isabout force posture. The force posture dimension should be included in the evaluation of other initiatives.

78
In this analysis and for the purpose of methodology demonstration, our team used its internal knowledge of the initiative and what would be required to make these judgments. However, such analyses should include input and opinion from multiple SMEs regarding interactions, magnitudes, and impacts on readiness dimensions. The value of this framework is that it presents a systematic process, with rules and structure, that is transparent and documented so that readers can see how the results were derived by reviewing the results. From this, users can discuss why an interaction is rated at a certain level or magnitude and which aspect of readiness this interaction affects. We repeated the process of evaluating interactions and magnitudes and identifying the readiness dimensions that were affected for each time horizon because the magnitudes of interaction and aspects of readiness may change over time. The resulting matrices that captured this analysis are shown in Figures 5.2–5.4.
As shown in Figure 5.2, in years zero to three, there is a focus on operational readiness and mobilization readiness. Figure 5.3 shows a shift in emphasis to sustainment readiness and military effectiveness in the two- to seven-year horizon, as well as continued effects on operational readiness and mobilization readiness. In years five to 15 (Figure 5.4), the effects of earlier-year decisions are seen on military effectiveness and resiliency, showing how decisions on personnel levels and aircraft type and numbers may affect ability to meet future threats, adversaries, and possibly a new National Defense Strategy in the longer term.
Converting the zero-to-three-year interaction matrix in Figure 5.2 into a network diagram, as shown in Figure 5.5, we see that changes to force structure affect an extensive and highly interconnected system with numerous feedback loops. This complexity makes it difficult to explicitly model or otherwise analyze the behavior of the system as a whole; however, it is possible to gain an understanding of the basic characteristics of the system to facilitate a more focused analysis of components of interest.
The system diagrams shown in Figures 5.6–5.8 demonstrate one way of understanding the system over the different time horizons. These figures show only the strongest interactions (magnitudes of three), both positive and negative, for each of the three different time horizons. As noted previously, in years zero to three, the strongest interactions are between operational readiness and mobilization readiness; in the two- to seven-year time horizon, we start to see a shift toward sustainment readiness and military effectiveness; in years five to 15, the effects on military effectiveness and resilience of earlier-year decisions have become apparent.
The following sections detail a number of metrics that can be used to understand the system or, at least, narrow the scope of analysis to the most important system components.71
71 Note that the metrics provided are all relatively straightforward to calculate. While we believe that we havecaptured the most-relevant components of the problem, our list of variables is likely not exhaustive. This means that metrics relying on the number of connections between variables are useful but rough measures of the concepts discussed in this section. Using these metrics as inputs for more-complex analyses would compound this uncertainty.

79
Figure 5.2. Interaction Matrix, Years Zero to Three
1 = small effect2 = moderate effect3 = large effect# = magnitude of effect unknown* = possible effect, but difficult to quantify
Num
ber of Required
New
Aircrew
Num
ber of Assigned
New
Aircrew
Num
ber of Required
New
MX
Num
ber of Assigned N
ew M
X
Num
ber of Required
New
Support Billets
Num
ber of Assigned
New
Supporting
Airmen
Dem
and for higher skill levels across
career fields
Readiness Levels of
Personnel
Num
ber of New
Aircraft Rq
Num
ber of New
Aircraft Available
Refurbished/extended life of
existing aircraft (Rq)
Refurbished/
extended life of ex-isting aircraft (Avail)
Dem
and for Support
Equipment
Supply of Support
Equipment
Dem
and for Aircraft
Parts
Supply of Aircraft
Parts
Depot H
ealth
Dem
and for overall supply
Overall Supply Levels
Dem
and for
unscheduled
Maintenance
Dem
and for scheduled
Maintenance
Dem
and for Fuel
Supply of Fuel
Dem
and for Contractor Logistics
Support
Num
ber of Required
New
Trainers
Num
ber of Available
New
Trainers
Time Required to Skill Level
Dem
and for
Munitions
Supply of Munitions
Dem
and for
Bandwidth
Supply of Bandwidth
Dem
and for
Transportation
Supply of
Transportation
Industry Skilled Labor
Raw M
aterials
Industrial Infrastructure
Supply
Dem
and
Personnel
Number of Required New
Aircrew 3 2 # 2
Number of Assigned New
Aircrew 3 2 # 2 -2 2 2 3 -3 2 2 1 -1 2 -2 1*
-2Number of Required New MX 2 2 # 2
Number of Assigned New MX 2 2 # 1 -1 2 -2 -2 2 2 -2 2 -2 -2
Number of Required New
Support Billets 2 * 2 # 2
Number of Assigned New
Supporting Airmen 2 * 2 # 2 -2 -2 2 2 -2 2 -2 -2
Demand for higher skill levels
across career fields 2 1 2 1 -1 1 -1 1
Readiness levels of personnel
(Health and well being) 2 2 2 -1 -1 2 2 -1
Equipment
Number of New Aircraft Rq 3 3 2 2 2 * # # # 2
Number of New Aircraft Available 3 2 3 2 2 # 2 -2 2 -2 2 2 3 -3 # -1 2 -1 1 -1 -2 2 -2
Refurbished/extended life of
existing aircraft (Rq) 3 3 2 2 3 -3 3 3 2 * # # # 2
Refurbished/extended life of
existing aircraft (Avail) 3 2 3 2 2 # 2 -2 3 -3 3 3 3 -3 # -1 2 -1 1 -1 -2 2 -2
Demand for Support Equipment 1 -1 2 2 1 -1 # # # 2
Supply of Support Equipment 1 1 2 2 1 -1 1 -1 -2
Supply
Demand for Aircraft Parts 1 -1 -2 * 2 -2 # # # 2
Supply of Aircraft Parts 1 1 2 * 2 -2 -2
Depot Health 2 3 -2 2 -2
Demand for overall supply -1 -1 -1 -2 -1 2 -2 # # 2Overall Supply Levels 1 1 1 2 1 -2
Demand for unscheduled maintenance 3 2 2 # 2 -2 3 -3 -2 2 -2 * * * 1 -1 -2 #Demand for scheduled
maintenance 3 2 2 # 2 -2 3 -3 -2 2 -2* * *
1 -1 #
Demand for fuel 2 1 1 -1 -2 1 -1 * # 2
Supply of Fuel 2 1 3 3 2 * 3 -2
Demand for contractor logistics support 1 * * # # #
Training
Number of Required New
Trainers #
Number of Available New
Trainers 3 3 3 # -1 -2 1 -1 1 -1
Time Required to Skill Level 3 3 3 3 2
OrdinanceDemand for munitions 1 -1 2 2 2 -2 # # # 2
Supply of Munitions * -2 2 * 1 -1 -2
System Network
Demand for bandwidth/Access
to Systems 1 1 # 1
Supply of bandwidth/Access to
Systems 1 1 1 1 1 1 1 # 1 -1 1
Infrastructure
Military Basing 2 2 2 2 1 2 -2 2 -2 * #Demand for Transportation 2 2 2 -2 # 3 3 3 -3 2 1 -1 2
Supply of Transportation 2 2 2 -2 -2 1 2 2 # 2 -1 2 1 -1 -2
Industry Skilled Labor 3 # 2 2 # # -2
Raw Materials 3 # 2 2 * # 2 # -2
Industrial Infrastructure 3 # 2 2 * # 2 # -2
Host Nation Support Supply# # # # # # # # # # # # # # # # -2 # # * * # #
Demand # # # # # # # # # # * * # #
Readiness Dimension
Military Effectiveness
Operational ReadinessStructural Readiness
Mobilization Readiness
Sustainment Readiness
Resilience

80
Figure 5.3. Interaction Matrix, Years Two to Seven
Number of
Required NewAircrew
Number of Assigned
New Aircrew
Number of
Required New MX
Number of
Assigned New MX
Number of
Required New Support Billets
Number of
Assigned New Supporting Airm
en
Demand for higher
skill levels across career fields
Readiness Levels of Personnel
Number of New
Aircraft Rq
Number of New
Aircraft Available
Refurbished/extendedlife of existing
aircraft (Rq)
Refurbished/extendedlife of existing
aircraft (Avail)
Demand for
Support Equipment
Supply of Support Equipm
ent
Demand for
Aircraft Parts
Supply of Aircraft Parts
Depot Health
Demand for overall
supply
Overall Supply
Levels
Demand for
unscheduled M
aintenance
Demand for
scheduled M
aintenance
Demand for Fuel
Supply of Fuel
Demand for
Contractor Logistics Support
Number of
Required New
Trainers
Number of
Available New
Trainers
Time Required to Skill Level
Demand for
Munitions
Munitions
Demand for
Bandwidth
Supply of Bandwidth
Demand for
Transportation
Supply of Transportation
Industry Skilled Labor
Raw Materials
Industrial Infrastructure
Supply
Demand
Personnel
Number of Required New Aircrew
3 2 # 2
Number of Assigned New Aircrew
3 2 # 2 -2 2 2 3 -3 2 2 1 -1 2 -2 1 * -2
Number of Required New MX 2 2 # 2
Number of Assigned New MX 2 2 # 3 3 1 -1 2 -2 -2 2 2 -2 2 -2 -2
Number of Required New Support Billets 2 * 2 # 2
Number of Assigned New Supporting Airmen 2 * 2 # 2 -2 -2 2 2 -2 2 -2 -2
Demand for higher skill levels across career fields 2 1 2 1 -1 1 -1 1
Readiness levels of personnel (Health and well being)
2 2 2 -1 -1 2 2 -1
Equipment
Number of New Aircraft Rq 3 3 2 2 2 -2 # # # 2
Number of New Aircraft Available 3 2 3 2 2 # 2 -2 2 -2 2 2 3 -3 # -1 2 -2 1 -1 -2 2 -2
Refurbished/extended life of existing aircraft (Rq) 3 3 2 2 3 -3 3 3 2 -2 # # # 2
Refurbished/extended life of existing aircraft (Avail) 3 2 3 2 2 # 2 -2 3 -3 3 3 3 -3 # -1 2 -2 1 -1 -2 2 -2
Demand for Support Equipment 1 -1 2 2 1 -1 # # # 2
Supply of Support Equipment 1 1 2 2 1 1 -1 -2
Supply
Demand for Aircraft Parts 1 -2 -2 -2 * 2 -2 # # # 2
Supply of Aircraft Parts 1 2 2 2 * 2 -2 -2Depot Health # # 2 3 -2 2 -2
Demand for overall supply -1 -1 -1 -2 -1 2 -2 # # 2Overall Supply Levels 1 1 1 2 1 -2Demand for unscheduled maintenance 3 2 2 # 2 -2 3 -3 -2 2 -2 * * * 1 -1 -2 #
Demand for scheduled maintenance 3 2 2 # 2 -2 3 -3 -2 2 -2 * * * 1 -1 #
Demand for fuel 2 1 1 -1 -2 1 -1 * # 2
Supply of Fuel 2 1 3 3 2 * 3 -2Demand for contractor logistics support 1 * * # # #
Training
Number of Required New Trainers #
Number of Available New Trainers 3 3 3 # -1 -2 1 -1 1 -1
Time Required to Skill Level 3 3 3 3 2
OrdinanceDemand for munitions 1 -1 2 2 2 -2 # # # 2Supply of Munitions * -2 2 * 1 -1 -2
System Network
Demand for bandwidth/Access to Systems
1 1 # 1
Supply of bandwidth/Access to Systems
1 1 1 1 1 1 1 # 1 -1 1
Infrastructure
Military Basing 2 2 2 2 1 2 -2 2 -2 * #Demand for Transportation 2 2 2 -2 # 3 3 3 -3 2 1 -1 2
Supply of Transportation 2 2 2 -2 -2 1 2 2 # 2 -1 2 1 -1 -2
Industry Skilled Labor 3 # 2 2 # # -2
Raw Materials 3 # 2 2 * # 2 # -2Industrial Infrastructure 3 # 2 2 * # 2 # -2
Host Nation Support
Supply # # # # # # # # # # # # # # # # -2 # # * * # #
Demand # # # # # # # # # # * * # #
Readiness Dimension
Military EffectivenessOperational ReadinessStructural ReadinessMobilization ReadinessSustainment ReadinessResilience
1 = small effect2 = moderate effect3 = large effect# = magnitude of effect unknown* = possible effect, but difficult to quantify

81
Figure 5.4. Interaction Matrix, Years Five to Fifteen
Num
ber of Required N
ew A
ircrew
Num
ber of Assigned New
Aircrew
Num
ber of Required N
ew M
X
Num
ber of Assigned New
M
X
Num
ber of Required N
ew Support Billets
Num
ber of Assigned New
Supporting A
irmen
Dem
and for higher skill
levels across career fields
Readiness Levels of
Personnel
Num
ber of New
Aircraft
Rq
Num
ber of New
Aircraft A
vailable
Refurbished/extended
life of existing aircraft
(Rq)
Refurbished/extended
life of existing aircraft (A
vail)
Dem
and for Support
Equipment
Supply of Support
Equipment
Dem
and for Aircraft
Parts
Supply of Aircraft Parts
Depot H
ealth
Dem
and for overall
supply
Overall Supply Levels
Dem
and for unscheduled
Maintenance
Dem
and for scheduled
Maintenance
De m
and for Fuel
Supply of Fuel
Dem
and for Contractor
Logistics Support
Num
ber of Required
New
Trainers
Num
ber of Available New
Trainers
Time Required to Skill
Level
Dem
and for munitions
Supply of Munitions
Dem
and for Bandwidth
Supply of Bandwidth
Dem
and for
Transportation
Supply of Transportation
Industry Skilled Labor
Raw M
aterials
Industrial Infrastructure
Supply
Dem
and
Personnel
Number of Required New
Aircrew3 2 # 2
Number of Assigned New
Aircrew 3 2 # 2 -2 2 2 3 -3 2 2 1 -1 2 -2 1 * -2
Number of Required New MX 2 2 # 2
Number of Assigned New MX 2 2 # 3 3 1 -1 2 -2 -2 2 2 -2 2 -2 -2
Number of Required New
Support Billets2 * 2 # 2
Number of Assigned New
Supporting Airmen2 * 2 # 2 -2 -2 2 2 -2 2 -2 -2
Demand for higher skill levels
across career fields 2 1 2 1 -1 1 -1 1
Readiness levels of personnel
(Health and well being)2 2 2 -1 -1 2 2 -1
Equipment
Number of New Aircraft Rq 3 3 2 2 2 -2 # # # 2
Number of New Aircraft
Available 3 2 3 2 2 # 2 -2 2 -2 2 2 3 -3 # -1 2 -2 1 -1 -2 2 -2
Refurbished/extended life of existing aircraft (Rq)
3 3 2 2 3 -3 3 3 2 -2 # # # 2
Refurbished/extended life of
existing aircraft (Avail)3 2 3 2 2 # 2 -2 3 -3 3 3 3 -3 # -1 2 -2 1 -1 -2 2 -2
Demand for Support Equipment1 -1 2 2 1 -1 # # # 2
Supply of Support Equipment 1 1 2 2 1 1 -1 -2
Supply
Demand for Aircraft Parts 1 -2 -2 -2 * 2 -2 # # # 2
Supply of Aircraft Parts 1 2 2 2 * 2 -2 -2
Depot Health # # 2 3 -2 2 0 -2
Demand for overall supply -1 -1 -1 -2 -1 2 -2 # # 2
Overall Supply Levels 1 1 1 2 1 0 -2
Demand for unscheduled
maintenance3 2 2 # 2 -2 3 -3 -2 2 -2 * * * 1 -1 -2 #
Demand for scheduled
maintenance3 2 2 # 2 -2 3 -3 -2 2 -2 * * * 1 -1 0 #
Demand for fuel 2 1 1 -1 -2 1 -1 * # 0 2
Supply of Fuel 2 1 3 3 2 * 3 -2
Demand for contractor logistics support
1 * * # # #
Training
Number of Required New
Trainers #
Number of Available New
Trainers 3 3 3 # -1 -2 1 -1 1 -1
Time Required to Skill Level 3 3 3 3 2
OrdinanceDemand for munitions 1 -1 2 2 2 -2 # # # 2
Supply of Munitions * -2 2 * 1 -1 -2
System Network
Demand for bandwidth/Access to Systems
1 1 # 1 0
Supply of bandwidth/Access to
Systems1 1 1 1 1 1 1 # 1 -1 1
Infrastructure
Military Basing 2 2 2 2 1 2 -2 2 -2 * #Demand for Transportation 2 2 2 -2 # 3 3 3 -3 2 1 -1 2
Supply of Transportation 2 2 2 -2 -2 1 2 2 # 2 -1 2 1 -1 -2
Industry Skilled Labor 3 # 2 2 # # -2
Raw Materials 3 # 2 2 * # 2 # -2
Industrial Infrastructure 3 # 2 2 * # 2 # -2
Host Nation Support Supply # # # # # # # # # # # # # # # # -2 # # * * # #Demand # # # # # # # # # # * * # #
Readiness Dimensions
Military Effectiveness
Operational Readiness
Structural Readiness
Mobilization Readiness
Sustainment Readiness
Resilience
1 = small effect2 = moderate effect3 = large effect# = magnitude of effect unknown* = possible effect, but difficult to quantify

82
Figure 5.5. System Diagram, Years Zero to Three
NOTE: Related supply and demand variables are combined in Figure 5.5 (for example, Supply of Fuel and Demand for Fuel are displayed as Fuel [Supply/Demand]). The set of interactions shown for a combined variable consists of all the interactions belonging to either the supply or the demand variable.

83
Figure 5.6. System Diagram, Years Zero to Three, Magnitude 3 Interactions Only

84
Figure 5.7. System Diagram, Years Two to Seven, Magnitude 3 Interactions Only

85
Figure 5.8. System Diagram, Years Five to 15, Magnitude 3 Interactions Only

86
Analysis of Air Force Structure Interactions As in the previous two case studies, we begin by examining the connectedness and impact
potential of variables.
Connectedness
The variables that ranked in the top ten for connectedness are listed in Table 5.2. Our results suggest that “Host nation support,” “Number of aircraft available,” “Transportation,” “Required support personnel,” “Assigned aircrew,” and “Demand for maintenance” are important aspects of the readiness system that have the potential to either facilitate or constrict the spread of readiness improvements throughout the Air Force. As demonstrated in the previous figures, these variables have the most connections with other variables in this case study, and thus have the ability to affect the greatest number of other variables related to readiness, creating tertiary impacts on readiness. Host nation support, for example, has the capacity to affect almost every other category of variables because the more host nation support available in any given area (i.e., aircraft, aircrew, fuel, supply), the less effect shortfalls on the U.S. side would have.
Table 5.2. Most-Connected Variables
Rank Variable PESTONI Area Connectedness
1 Demand for host nation support Host nation support 29
2 Number of new aircraft available Equipment 27
2 Refurbished/extended life of existing aircraft (availability)
Equipment 27
4 Supply of transportation Infrastructure 26
5 Number of required new support billets Personnel 25
5 Demand for transportation Infrastructure 25
7 Number of assigned new aircrew Personnel 23
8 Demand for unscheduled maintenance Supply 21
8 Supply of host nation support Host nation support 21
10 Demand for scheduled maintenance Supply 20
Impact Potential
Table 5.3 shows the variables that ranked in the top ten for impact potential. Our analysis suggests that changes to the number of aircraft available, supply of host nation support, assigned aircrew and mechanics, demand for maintenance, transportation, and requirements for extended life of existing aircraft may have widespread impacts on the Air Force. As defined in Chapter 2,

87
we calculated impact potential by simply counting the number of other variables impacted by a given variable.72 Table 5.3 reports the average impact potential across the three time frames.
Table 5.3. Variables with the Most Impact Potential
Ranka Variable PESTONI Area Impact Potential b
1 Number of new aircraft available Equipment 23
1 Refurbished/extended life of existing aircraft (availability)
Equipment 23
3 Supply of host nation support Host Nation Support 21
4 Number of assigned new aircrew Personnel 17
5 Number of assigned new Mx Personnel 15.33
6 Demand for unscheduled maintenance Supply 15
6 Supply of transportation Infrastructure 15
8 Demand for scheduled maintenance Supply 14
9 Refurbished/extended life of existing aircraft (requirements)
Equipment 13.67
10 Demand for transportation Infrastructure 13 a Rank shown is based on average impact potential across all three time frames. It happens that this average-based ranking matches the time frame–specific ranking for the two-to-seven-year and five-to-15-year time frames. In the zero-to-three-year time frame, “Number of assigned new Mx” actually ranked below “Demand for unscheduled maintenance” and “Supply of transportation.” b Average impact potential across all three time frames. “Number of assigned new Mx” and “Refurbished/extended life of existing aircraft (requirements)” are the only variables shown with impact potentials that vary across time frames.
It is also relevant to note that the following PESTONI categories do not appear in the top ten for either connectedness or impact potential: training, ordnance, and networks. The ordnance and networks variables do not strongly interact with any other variables, suggesting that they may be less important to understanding or influencing the system than other variables. On the other hand, variables falling under training interact strongly with other variables, including “Assigned new aircrew” and “Assigned new Mx.” This suggests that their impact, while limited in scope, may still be relevant owing to their effect on more well-connected and influential variables. Because these case studies serve as a demonstration of a methodology and not as a detailed analysis, the true relevance and impact of each variable is not known here.
Distribution of Interactions
We also examined the interactions between system variables to quantify the relationship(s) between the readiness dimensions and the time frames of our analysis. While the system cuts across multiple readiness areas in each time frame, there is a distinct shift in the distribution of interactions across those readiness dimensions at longer time frames. As shown in Figure 5.9,
72 This is the same as the number of outbound interactions, as defined in Chapter 2.

88
most interactions (approximately 78 percent) in the zero-to-three-year time frame fall within operational readiness, but this drops significantly (to 48 percent in the two-to-seven-year time frame and less than 10 percent in the five-to-15-year time frame) as military effectiveness and resilience gain importance. Mobilization readiness encompasses much less of the system but also drops at longer time frames. The share of interactions falling within sustainment readiness does not follow a clear trend, but a number of interactions initially falling under operational readiness shift to sustainment readiness after the zero-to-three-year time frame.
Figure 5.9. Percentage of Interactions Falling Within Each Readiness Area over Time
NOTE: Bidirectional interactions were considered separately.
While the distribution of interactions across readiness dimensions changed over time, we found that the magnitude of the interactions was relatively constant and that most interactions were of magnitude 2 (moderate effect; see Figure 5.10). However, we were unable to confidently assign a magnitude to about one-fifth of the interactions. This suggests that many variables that are relevant to understanding the impact of force structure changes on readiness are difficult to measure or currently inadequately tracked.
0%
10%
20%
30%
40%
50%
60%
70%
80%
90%
0-3 Years 2-7 Years 5-15 Years
% o
f Tot
al In
tera
ctio
ns
Timeframe
OperationalReadiness
MobilizationReadiness
SustainmentReadiness
MilitaryEffectiveness
Resilience
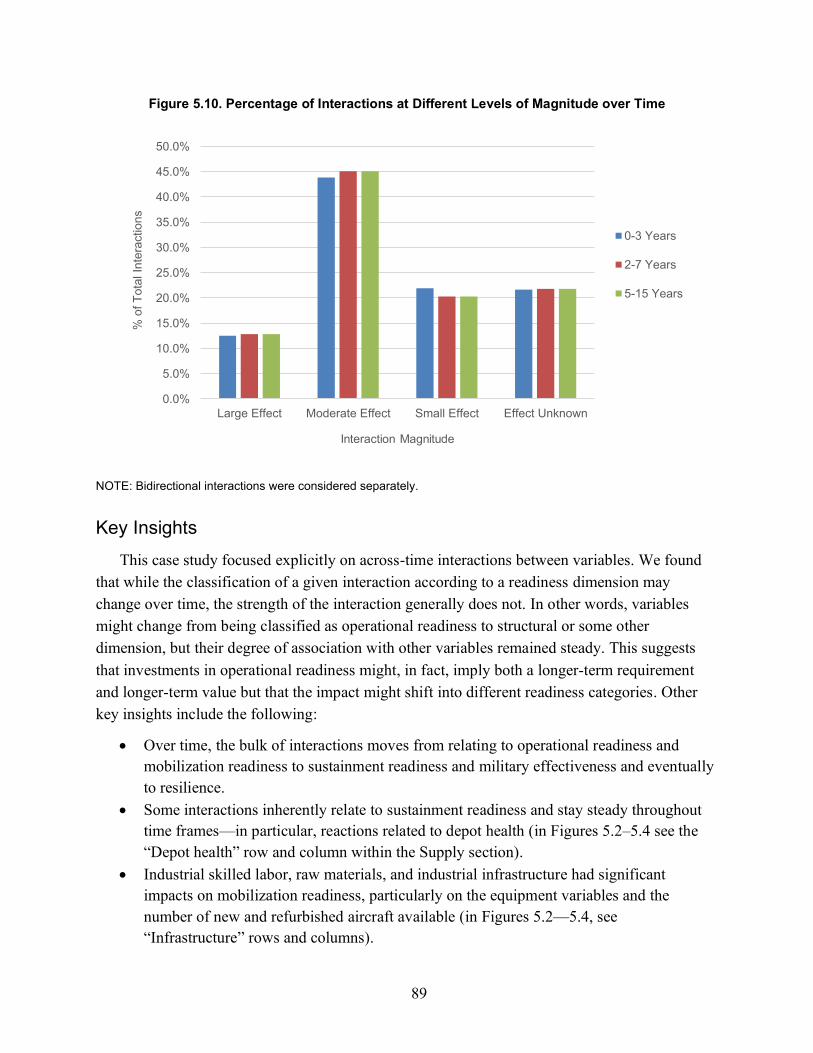
89
Figure 5.10. Percentage of Interactions at Different Levels of Magnitude over Time
NOTE: Bidirectional interactions were considered separately.
Key Insights
This case study focused explicitly on across-time interactions between variables. We found that while the classification of a given interaction according to a readiness dimension may change over time, the strength of the interaction generally does not. In other words, variables might change from being classified as operational readiness to structural or some other dimension, but their degree of association with other variables remained steady. This suggests that investments in operational readiness might, in fact, imply both a longer-term requirement and longer-term value but that the impact might shift into different readiness categories. Other key insights include the following:
• Over time, the bulk of interactions moves from relating to operational readiness andmobilization readiness to sustainment readiness and military effectiveness and eventuallyto resilience.
• Some interactions inherently relate to sustainment readiness and stay steady throughouttime frames—in particular, reactions related to depot health (in Figures 5.2–5.4 see the“Depot health” row and column within the Supply section).
• Industrial skilled labor, raw materials, and industrial infrastructure had significantimpacts on mobilization readiness, particularly on the equipment variables and thenumber of new and refurbished aircraft available (in Figures 5.2—5.4, see“Infrastructure” rows and columns).
0.0%
5.0%
10.0%
15.0%
20.0%
25.0%
30.0%
35.0%
40.0%
45.0%
50.0%
Large Effect Moderate Effect Small Effect Effect Unknown
% o
f Tot
al In
tera
ctio
ns
Interaction Magnitude
0-3 Years
2-7 Years
5-15 Years

90
• “Industrial base” variables have implications across most readiness dimensions, thoughtheir magnitude may not be fully known at this time, in part, because the data may not beas readily tracked or accessible.
• “Host nation support”—including the type and level of support—is another key variablethat is difficult to measure and predict but has significant readiness impacts.
• While large effect (magnitude 3) interactions are significant, some variables have a highnumber of moderate effect (magnitude 2) interactions (such as demand fortransportation), resulting in an overall higher significance of that variable and increasingthe importance of tracking its effect(s) on readiness over time.
91
6. Case Study: Impact of Deferring Overseas MILCON
Introduction
We have presented three different case studies that used variations of a methodology focused on interactions. In each case, we had broad programmatic or systemic questions and needed to better understand those interactions at a point in time and/or over time. We now apply a different methodology focused on more-specific program element–level questions. For this kind of more-focused inquiry, we use a systems analysis approach.
MILCON projects, particularly those located outside the continental United States (OCONUS),73 are essential to ensuring that DoD can implement the 2018 National Defense Strategy. Indeed, the ability to project power overseas and rapidly transport troops and materiel into theater are directly enabled by the presence of facilities ranging from airfields and piers to ammunition storage depots, fuel tanks, and personnel housing. However, a 2018 report from the Congressional Research Service concludes that MILCON budgets decreased over the five preceding years, corresponding to the end of a surge in base realignment and closure (BRAC) spending (FYs 2013–2018) following the passage of the Budget Control Act of 2011.74 More recently, overseas MILCON budgets have been deprioritized relative to other national security considerations and have been subjected to significant cuts.75 Mechanisms for assessing and understanding the readiness implications of individual MILCON projects are important to facilitate budget prioritization efforts and ensure the availability of military infrastructure.
Application of the System Methodology The uniqueness of MILCON projects requires them to be assessed individually across each
readiness dimension.76 For a specific MILCON project, we identified the readiness dimensions
73 According to DoD budget justification documents, MILCON projects are categorized as external to the UnitedStates or internal to the United States. Locations external to the United States include U.S. territories and sovereign nations. 74 Christopher T. Mann, FY2018 Military Construction Authorizations and Appropriations, Washington, D.C.:Congressional Research Service, R45217, June 6, 2018; Public Law 112-25, An Act to Provide for Budget Control, August 2, 2011. 75 In FY 2019, $3.5 billion was transferred from DoD’s MILCON budget, removing funds slated for MILCONprojects in Poland, Greece, Germany, and Great Britain, among other locations. Additional funds were transferred in FY 2020. See, for example, R. Sisk, “Pentagon Releases List of Military Construction Projects Paused to Fund Border Wall,” Military.com, September 4, 2019. 76 Note that we are looking at specific projects. If the question had been the broader issue of overall MILCONspending, use of the interactive methodology, as the first-order analysis, would probably have been more appropriate.

92
expected to be directly affected. Within each dimension, we identified variables that (1) are directly produced by the MILCON project and contribute positively toward readiness (direct inputs), (2) are external to the MILCON project but are required to enable the MILCON project to positively affect readiness (external enablers), and (3) are external to the MILCON project and may serve as obstacles limiting the anticipated readiness benefits (external inhibitors). Each variable was analyzed for its impact on each readiness dimension. The interactions between readiness dimensions and their underlying variables to produce military effectiveness was then analyzed.
This system methodology, which involves slight but important differences from the interactive methodology employed in the three previously discussed case studies, uses systems modeling to identify and understand external variables that enable or inhibit the anticipated readiness benefit from a MILCON project. Systems models, often rendered as stock-and-flow diagrams, are a way to visualize the interactions of different variables or components to produce dynamic changes in the availability of products.77 This characteristic is crucial for facilitating collaborations to produce military budget plans and readiness assessments that maximize positive outcomes.
To identify direct inputs, external enablers, and external inhibitors using the systems methodology, sufficient project-specific background information must be available (Figure 6.1). Our project team found that this information could be readily sourced from DoD budget justification documents, which are produced annually by the individual services for submission to the U.S. Congress. These documents contain the DD Form 1391 associated with each proposed MILCON project, which provides information regarding project location, the MILCON requirement, the current preconstruction situation, the impact if the proposed project is not provided, and additional supporting details.
77 Donella H. Meadows, Thinking in Systems: A Primer, White River Junction, Vt.: Chelsea Green Publishing, 2008.

93
Figure 6.1. Structure of Systems Methodology for Assessing Impact of MILCON Project on Readiness Dimension
We analyzed FY 2020 MILCON budget justification documents produced by the U.S. Navy and Marine Corps,78 Navy and Marine Corps Reserve,79 U.S. Army,80 Army National Guard,81 Army Reserve,82 U.S. Air Force,83 and Air National Guard,84 and the European Defense Initiative85 to identify the DD Form 1391s86 associated with proposed MILCON projects for FY 2020. We identified 35 MILCON projects located outside the United States from these documents (their details are provided in the appendix). From these 35, two interrelated projects
78 Department of the Navy, “Fiscal Year (FY) 2020 Budget Estimates, Justification of Estimates,” Washington,D.C., March 2019a.79 Department of the Navy, “Fiscal Year (FY) 2020 Budget Estimates, Military Construction Reserve Force(MCNR),” Washington, D.C., March 2019b. 80 Department of the Army, “Department of the Army Fiscal Year (FY) 2020 President’s Budget Submission,”Washington, D.C., March 2019b. 81 Department of the Army, “Army National Guard Fiscal Year (FY) 2020 Budget Estimates, MilitaryConstruction,” Washington, D.C., March 2019a. 82 Department of the Army, “United States Army Reserve Fiscal Year (FY) 2020 Budget Estimates, MilitaryConstruction,” Washington, D.C., March 2019c. 83 Department of the Air Force, “Military Construction Program Fiscal Year (FY) 2020 Budget Estimates,”Washington, D.C., March 2019b. 84 Department of the Air Force, “Air National Guard Fiscal Year (FY) 2020 Budget Estimates,” Washington, D.C.,March 2019a. 85 Office of the Under Secretary of Defense (Comptroller), “European Defense Initiative Department of DefenseBudget Fiscal Year (FY) 2020,” Washington, D.C., March 2019. 86 The DD Form 1391 includes a cost estimate, a description of the proposed construction, the specific requirementcreating the need for the project, the current facility situation, the impact if the project is not approved, and additional justification information. It is required for all MILCON projects (Daniel H. Else, Military Construction: Process and Outcomes, Washington, D.C.: Congressional Research Service, R44710, December 14, 2016).
Readiness Level
External Enablers
External Inhibitors
Direct Inputs

94
located in Joint Region Marianas–Tinian in the CNMI were selected for further analysis of their readiness implications: a project to construct a new jet fuel system, including harbor fuel receipt, a pipeline, fuel storage, and high–flow rate fuel delivery to a parking apron hydrant system and truck stands; and a project that provides site development for Air Force access to Tinian International Airport. These projects were selected as the focus of this case study because their readiness implications were sufficiently broad to enable an assessment across readiness dimensions and were analyzed across the dimensions of operational readiness, structural readiness, sustainment readiness, and military effectiveness.
Key Variables and Parameters As shown in Table 6.1, we identified 17 variables—six direct inputs, six external enablers,
and five external inhibitors—related to the CNMI MILCON projects’ abilities to positively affect operational readiness. These variables were identified by considering the features and capabilities that these combined MILCON projects add to the military in conjunction with the supplies, materiel, personnel, capabilities, and/or knowledge required to use them. Additional variables were identified by considering how these projects impact and are impacted by the utilization of forces, materiel, and personnel elsewhere and other DoD investments (including other MILCON projects).
For example, upon completion, these CNMI MILCON projects will have produced facilities capable of housing future supplements to existing Air Force munition storage depots and enhancing overall capacity in the U.S. Indo-Pacific Command (USINDOPACOM) area of responsibility (AoR), thus improving operational readiness. To achieve this anticipated impact on operational readiness, the Air Force must provide sufficient quantities of aircraft, as well as the necessary pilots and support personnel, that can use these munitions. Furthermore, the anticipated positive impact on operational readiness could be limited if adversarial action inhibits delivery of munitions to fill these storage facilities.
Table 6.1. Variables Related to the CNMI MILCON Projects Affecting Operational Readiness
Direct Inputs External Enablers External Inhibitors
• An airfield • Comprehensive infrastructure • Bulk fuel storage • Aircraft parking • Training facilities • Humanitarian assistance and
disaster relief capabilities
• Aircraft • Pilots • Aircraft repair and
maintenance • Training • Humanitarian assistance
supplies • Emergency response supplies
• Diversion of aerial refueling aircraft
• Risk to infrastructure and logistics associated with severe weather
• Risk to exposed supply lines reliant on CONUS hubs
• Budget cuts that prevent the full realization of MILCON project plans
• Limited budget capacity to invest in external enablers

95
1. Fifteen variables related to the CNMI MILCON projects’ abilities to improve structural readiness are shown in Table 6.2. Because structural readiness is defined as the measure of speed at which a capability can be developed, the variables impacting structural readiness are measured in terms of rates. These variables were identified by considering how the rate of capability development is affected by these projects and by assessing how these rates are compensated for by alterations in the speed of development of other capabilities (i.e., maintenance and procurement, both allowing for availability of equipment).
Additional variables were identified by considering the impact of the specific time scale of regional commitment. For example, by constructing an additional airfield for Air Force use, these projects could produce an increased capacity for aerial refueling (among other types of sorties) in the USINDOPACOM AoR through additional runway access and aircraft storage, thus improving structural readiness. However, without the required maintenance capabilities, the tanker aircraft fleet may experience prolonged groundings, thus reducing the net positive gain to structural readiness. Furthermore, prioritization of current or anticipated operations in other AoRs may result in the transfer of key personnel from the CNMI, reducing the number of aerial refueling sorties and decreasing the benefit of these MILCON projects to structural readiness.
Table 6.2. Variables Related to the CNMI MILCON Projects Affecting Structural Readiness
Direct Inputs External Enablers External Inhibitors
• Training capacity • Maintenance capacity • Storage and stock of fuel and
equipment • Refueling capacity for
INDOPACOM AoR
• Western Pacific sorties • Aircraft maintenance • Aerial refueling missions • Altered training capacity • Humanitarian missions • Disaster-relief missions
• Personnel and equipment shortages
• Stability and maintenance of military partnership with the CNMI
• Seasonal limitations in accessibility
• Budget cuts that prevent the full realization of MILCON project plans
• Limited budget capacity to invest in external enablers
Table 6.3 presents the 11 variables related to the CNMI MILCON projects’ abilities to
improve structural readiness. These variables were identified by considering the challenges of resupplying an airfield in the Northern Marianas with respect to industrial base capacity and adversarial actions that may affect military logistics. For example, by constructing facilities that could house future additional munitions storage facilities in the CNMI, structural readiness would be increased because capacity for sustained operations in the USINDOPACOM AoR would be improved. Factors that could limit the potential impact to structural readiness include the presence of insufficient maintenance capacity, which would limit the availability of aircraft

96
that can use these munitions, and limited industrial base capacity, which may lead to other airfields being prioritized for resupply missions.
Table 6.3. Variables Related to the CNMI MILCON Projects Affecting Sustainment Readiness
Direct Inputs External Enablers External Inhibitors
• Storage facilities for munitions, aircraft, and personnel
• Improved capability to sustain operations in INDOPACOM AoR
• Rate of aircraft use • Rate of on-boarding, transfer,
and retirement of personnel • Equipment use and lifespan • Maintenance capacity • Replacement equipment and
ordnance
• Limited industrial production capacity
• Difficult resupply logistics • Budget cuts that prevent the full
realization of MILCON project plans
• Limited budget capacity to invest in external enablers
System Analysis
The impact of these two CNMI MILCON projects on military effectiveness can be assessed by compiling the variables identified for the operational readiness, structural readiness, and sustainment readiness assessments (see Figure 6.2). By aggregating these variables, it is possible to gain an understanding of how the Air Force is able to generate improved posture options and its ability to project force and coordinate actions in the INDOPACOM AoR as a direct result of these MILCON projects. Aggregation also highlights the external inhibitors that may prevent these benefits from being realized.
Fortunately, data describing the variables shown in Tables 6.1–6.3 should be widely available. Indeed, DRRS provides records of authorized and assigned personnel, training information, equipment, and ordnance. The Defense Logistics Agency has location-specific records for fuel, parts, and logistical supply times. Service maintenance completion documents can be used to calculate maintenance status and highest possible repair capacity. The structure of the model allows for identification of the variables that allow for full utilization of the MILCON project for each form of readiness. For example, the model suggests additional training will be required for the CNMI construction to grow some measure of operational readiness, such as extended reach in the Pacific.

97
Figure 6.2. Structure of Systems Methodology for Assessing Impact of MILCON Project on Military Effectiveness
The methodology described in this chapter considers the variables that contribute to each type of readiness, as well as those external inhibitors that would drain the development of that readiness. One benefit of this approach is that it requires systemic thinking about all the elements that must coalesce to improve a specific readiness dimension. The description of those elements establishes an inventory of the components of each readiness dimension that are generally relevant to an assessment process. The major constraint with this type of approach is that it will differ with each specific case; the process can be described generally, but any model will have to be instantiated for a specific set of conditions and variables.
This methodology can be readily applied to other MILCON projects (regardless of location) to identify relevant variables and assess their anticipated impact on readiness. For example, for FY 2020, the U.S. Navy proposed to construct a small craft berthing facility at Naval Station Rota in Rota, Spain, to better support the use of small watercraft that conduct port operations functions.87 This MILCON effort directly affects the operational readiness of Naval Station Rota but will likely have limited impact on sustainment readiness and structural readiness. Direct inputs to operational readiness from this project include the increased availability of small craft achieved with increased berthing capacity. External enablers include watercraft operational requirements, such as fuel and operations personnel. External inhibitors that may prevent the anticipated benefits to operational readiness include the diversion of watercraft maintenance personnel to other Navy priorities, decreasing the operational availability of the watercraft for which the berths were constructed.
For all MILCON assessments, the availability of data characterizing direct inputs, external enablers, and external inhibitors is critical. The review of FY 2020 MILCON budget justification documents identified 27 projects outside the United States that were considered to directly affect at least one dimension of readiness (Figure 6.3). Of those 27, most (74 percent) contributed mainly to operational readiness. Many were considered to also contribute to structural readiness
87 Department of the Navy, 2019a.
Operational Readiness
Structural Readiness
Sustainment Readiness
Military Effectiveness
External Inhibitors
Direct Inputs

98
(67 percent), sustainment readiness (59 percent), and military effectiveness (59 percent). One project was highlighted as contributing to mobilization readiness (4 percent); this project is the construction of a new joint mobility center and administrative and training buildings for the U.S. Navy.88
Figure 6.3. Distribution of Impacts of OCONUS MILCON Projects Across Readiness Dimensions
The systems modeling approach described here is different from, but complementary to, the
interactions modeling utilized in the other case studies. The systems methodology described considers variables that contribute to each type of readiness, as well as those variables that enable or inhibit development of that readiness. The interaction modeling used in the other case studies centers on identification of key variables and designation of interactions (positive and negative) between those variables. Each variable or interaction is then associated with a readiness dimension. Alignment of these two approaches is possible when all the variables that make up a readiness dimension are specified. In the system model, the relationships between all the variables would be specified as either enabling or inhibiting, which would be the same as positive or negative interaction in the interactive methodology. In the interactive methodology, all the variables that constitute a type of readiness would combine to provide an assessment of the relative level of that readiness. The two methodologies would be complementary in those situations in which the specific components that make up a type of readiness are identified.
Key Insights This case study illustrates our system methodology and shows that important insights can
emerge from consideration of strategic dimensions. Items such as congressional marks on
88 Office of the Under Secretary of Defense (Comptroller), 2019, p. 13.
0% 20% 40% 60% 80% 100%
Mobilization Readiness
Military Effectiveness
Sustainment Readiness
Structural Readiness
Operational Readiness
Percent of MILCON projects with direct Readiness Effects

99
programs or ordered program adjustments may not have much more justification than short-term need, and this methodology can help illustrate the resulting consequences. Overseas MILCON rarely has significant support from Congress and is often treated as a bill-payer for other priorities. This methodology allows a readiness-based discussion of the resulting effects. More specifically, we found the following:
• MILCON projects add capacity and capabilities to the systems that produce readiness. The degree to which these newly constructed features result in enhanced readiness is dependent on the enabling resources needed to use them.
• Specification of measurement parameters for each kind of readiness allows development of a system model for a specific MILCON project. For example, one structural readiness measurement for the CNMI MILCON could be the rate which the Air Force can change the sortie capacity and reach in the Western Pacific. That goal allows characterization of the features that enable or support the capacity added with the proposed construction.
• Consideration of the variables necessary to enhance readiness and their availability in context of a specific MILCON project allows further analyses to visualize and understand the trade-offs necessary for the project to contribute to that readiness.
• Alignment of the system methodology applied to MILCON and the interactive methodology used in the other cases is possible when all the variables that constitute a readiness dimension are specified and their interaction characterized.

100
7. Conclusions and Recommendations
The primary authors of this report and many of our team members have worked jointly with OSD for more than five years on a series of five readiness studies. Each has built on the previous work, and each has been conducted in parallel with other, internal, OSD efforts, as well as readiness work across the analytic community. Over that time, we have seen OSD recognize the limitations of a reliance on DRRS—and its focus on operational readiness—as “the” readiness measurement, and we have seen OSD try to better understand what data are available and how that data can be better analyzed and transformed into policy-relevant information across a much wider spectrum of DoD activities.
The seven core dimensions of readiness proposed by DoD in its draft DTM represent a highly interactive set of activities. Analyzing any one of them in isolation requires making an assumption about the state of each of the others at a point in time, and then using that state, or a variation of it, to assess the isolated element. We did not believe that we would find great utility in this type of “internal to a dimension” analysis.
We did, however, find that, collectively, the dimensions provide adequate coverage of the full range of DoD activities or areas of interest (e.g., the mobilization capacity of the United States). More importantly, we found that the dimensions provide a useful framework for strategic readiness analysis. However, this analysis requires input from SMEs and a considerable development of variable relationships and temporal connections to be more than a framework.
We considered several case studies as examples of how the methodology might be applied, but it is important to remember that the results of these case studies should be evaluated less in terms of specific policy guidance and more in terms of analytic frameworks. The case studies showed the high degree of complexity that can accompany variable relationships. The case studies also showed that a workable analysis tool using the dimensions specified in the DTM can be developed and applied to the point of improving decisionmaking on trends, investments, and priorities—provided, of course, that there are sufficient staff resources to develop the necessary interaction models and sufficient time in the decisionmaking process to do both the first-order work discussed in this report and the second-order work of analyzing the key tension points identified in these models. Here, we discuss the principal findings that emerged from our case studies and the steps that the department would need to take to implement this framework for conducting readiness assessments.
Practicality
Readiness assessment, we argue, occurs at three levels. At the highest level, there is an understanding or belief that items or sets of items combine to create some form of readiness. The

101
creation of the seven core dimensions is one example of such a high-level intuitive belief, informed by research, expertise, and experience. Another is the combination of personnel, material readiness, supply, and training data that are the key elements of a Commander’s Unit Status Report. It may, at this level, seem self-evident or be discovered, through research and analysis, that the elements to be measured will usefully describe readiness; but, as yet, it is still only a high-level generalized description of how a specified type of readiness is created within an organization.
At the lowest level, the interactions and dependencies and the quantification of effects have all been mapped, and a “scorecard” has been agreed upon. This, too, is represented in the Commander’s Unit Status Report, by the specific reporting elements and calculations required of units. This level is represented in the checklists for personnel deployability, in the tasks, conditions, and standards used for evaluating training events, and in the determination of how many flying hours or tank miles to fund for training purposes. For readiness at the campaign level, these measurable areas of interest may include things like the feasibility of a TPFDD, the theater stockage level (in days of supply) for selected items, or mobilization capacity of the system—all of which are clearly understood to contribute to campaign readiness, but each of which needs to be quantified before a commander can say “I am ready.”
It is the middle level, however, where the analysis in this report is focused. Taking a generalized idea that there are measurements and relationships that are important to understanding a specified type of readiness (level 1) and translating that idea into specific measurements and relationships (level 3) requires a great deal of analysis. That analysis happens in level 2. Moving a readiness concept from the general to the very specific requires the ability to map and understand relationships, and then eventually to quantify them, determine at what level “success” is achieved, and turn the system into a level-3 reporting system.
It is certainly possible (and likely what has happened in the past) to customize the process every time a new readiness concept is developed or needed. Certainly, the attempt would be informed by other attempts to quantify readiness, but the methodologies might be different in every case. And, as other research has shown, there are many areas of readiness that are not well understood or well reported. In some cases, proxy measures are used (as DRRS is now used as a proxy for strategic readiness).
The practical thing that this analysis proposes is to systemize that process. We used the core dimensions and the imperative to take that level-1 concept and see what needed to be measured and began the steps to move through level 2 and into level 3. First, we validated that the readiness approach of the core dimensions was useful—we determined, we believe, that the level-1 work had utility, even given the fact that it still required maturation and refining. To do this, we had to do enough of the level-2 work to ensure that we knew that there was some substance there. That work helped us generate two methodologies that can be used, if DoD so decides, to better systemize and integrate level-2 analysis for both existing readiness assessment

102
processes and future ones. Eventually these level-2 efforts could translate into refined and integrated level-3 efforts.
Framework for Readiness Assessment
This report began as an effort to evaluate the assessment framework contained in a draft DTM, specifically to assess whether the variable categories completely describe strategic readiness and how the categories interact. We concluded that the framework is useful and the variable categories sufficient as a basis for managing and resourcing strategic readiness. However, the interactions are complex and require detailed analysis.
The structure in the proposed DTM encompasses enough of the major elements of readiness to be useful in assessing the nation’s overall ability to respond to conflicts at various levels. While we found that the framework captures most enduring factors of readiness and should be used and refined in future assessment of overall readiness, we did note some areas that present definitional challenges or need more development.
Specifically, the terms structural and mobilization readiness, as used in the DTM, differ from DoD’s traditional usage, particularly the term mobilization. We only recommend that, to avoid confusion, care be taken in how each of these terms is messaged and discussed. We also note the highly overlapping and interactive nature of force posture and structural readiness but accept that they can still be considered different dimensions.
We also only tangentially touched on resilience—perhaps the most difficult dimension to define and describe. It is, in some sense, a reactive rather than a proactive activity. There is room for some additional analysis of the definition and role of this dimension.
We also discovered many other factors that have an impact on readiness that we were not able to easily categorize into one or more of the dimensions. In some cases, this occurred because scenario-relevant information is necessary to some analysis but is independent of readiness itself (e.g., expected casualty types and rates). In other cases, there may be disagreement about the dimension into which a variable may be placed; this provides opportunities to revise the definitions and continually assess whether they are sufficient. The existence of uncategorized elements, however, does not invalidate either the concept of the dimensions or the methodologies we have developed.
Operational readiness is well measured and understood but can be misleading if not placed in a broader framework. An analyst or decisionmaker attempting to optimize operational readiness variables could readily see changes in DRRS categories but would not necessarily see the impact on the other readiness dimensions, which are not so well displayed and monitored by DoD. The case studies show several examples, but the trade-off between optimizing medical readiness for normal operations and for the demands likely to be present on a larger scale in a major conflict is particularly striking. Units report medical readiness for operations in terms of having sufficient personnel and sufficient resources to conduct day-to-day

103
missions. System reporting would indicate serious shortfalls in transportation and training and would show that strenuous efforts to meet operational demands could create problems in the other dimensions of readiness. Moving the readiness discussion away from an operational readiness focus is necessary to avoid conceptual errors.
Military effectiveness would seem to be an apex dimension but is, in fact, only weakly associated with other dimensions. In the case studies, we found that military effectiveness is only sometimes directly influenced by the types of variables we identified, and rarely strongly. This seems counterintuitive and bears further examination, as military effectiveness would seem to be the apex dimension. What may be happening is that resource impacts are felt in other dimensions, and it is the change in those dimensions that, as a second-order effect, would lead to changes in military effectiveness. This might suggest considering military effectiveness, in general, as a final rather than direct or intermediate outcome. However, there are several areas that fall almost solely inside of military effectiveness and are not likely to be observed in the other dimensions directly. Military effectiveness encompasses technological levels, training effectiveness, and concepts and doctrine. Each of these places demands on other dimensions—but is probably not directly influenced by them.89 Thus, measures of military effectiveness may be different in kind than measures of the other dimensions.
Readiness dimensions persist in impact across time and must be connected to other departmental processes. The case studies clearly show that readiness dimensions interconnect, sometimes to a very great degree, and control of these dimensions may reside in processes that do not regularly consider readiness impact. For example, decisions concerning military construction are typically made within service program and budget processes, possibly reconsidered in OSD-led program budget review. These are typically time and resource constrained and often focus primarily on balance and meeting timelines, not necessarily on complete consideration of readiness impacts. However, as the case study demonstrates, the impacts across dimensions are widespread.
Although the proposed framework effectively captures enduring dimensions, scenario circumstances have a significant and variable impact. The network tables resulting from the case studies show a strong association with a class of variables that do not readily fit into the readiness dimensions. Typically, these relate to scenario-specific variables, which likely remain unknown until some scenario presents itself. For example, the assessment of medical readiness includes consideration of specific theater requirements for evacuation and expected casualty levels in some specific plans. Providing an evaluation of how ready the system is to respond to these requires consideration of specifics that are not necessarily part of a more general
89 The types of technology in use drive the transportation and sustainment demands of the force, as well as thetraining demands. Sustainment and operational readiness rely on the technology in the force—they do not drive what that technology should be. A similar discussion can be applied to concepts and doctrine.

104
framework. That said, the framework still provides an effective description of factors that must be present to deal with scenario requirements.
The methodologies provide a mechanism for objective and reproducible reviews of readiness issues but still require SME interpretation. The methodologies involve the identification of relevant variables and then an assessment of potentially interacting pairs of variables, which can then be integrated into an overall characterization of interaction. The selection of variables inherently depends on the judgment of the analyst that certain things might be connected. The assessment of degrees of association can likely be made more directly measurable, but for our purposes, the assessment is still an experience-based analyst assessment. What the methodologies allow, however, is aggregation of the assessments that different observers might make. Archiving and reusing, revising, and comparing assessments can help speed new analysis and open new analytic opportunities. The methodologies we developed to accompany the framework are not the only ones that could be used. However, they do demonstrate a useful and effective way to address policy questions in a systemic and comprehensive process that allows for a common language and comparative analysis.
The methodologies can be used as policy analysis tools, but the primary value of the framework and methodologies is conceptual rather than immediately practical. The interactive methodology is primarily intended to analyze a broad area and find associations without knowing in advance where relationships are likely to be strongest. This can inform the kinds of readiness issues that providers should be addressing, but it will not immediately yield a specific decision. That will take additional analysis and interpretation. The system methodology is intended to answer specific questions, which might result from application of the interactive methodology or could result from some other process, such as program budget review. But it should not be viewed as a tool that will yield an answer absent someone asking an informed question.
Implementation Recommendations The overall framework, including consideration of the readiness dimensions and application
of the methodologies, requires different thinking than is currently applied in readiness assessment. Fully implementing the framework will require collection, or at least collation, of some data not currently held in data sets available to DoD. Several steps should be undertaken to facilitate an assessment of strategic readiness.
The draft DTM on strategic readiness, or some close equivalent, should be adopted as policy. The activities and perspectives in the DTM will not occur as a matter of course. Specific direction at the departmental level will be necessary for any part of it to be implemented. This is not to say that the DTM should not be modified at all, just that it provides clear direction, which will be needed to effectively implement a different approach to discussing and analyzing readiness.

105
Depictions of readiness need to clearly specify what dimension(s) of readiness they are addressing and what time frames are included. This is most particularly an issue with representations of current operational readiness. It should be made clear that the discussions omit important factors captured by the other dimensions. Where possible, the health of other dimensions should be represented, particularly when actions affecting those other dimensions are under discussion. All analysis should include near-, middle-, and long-term effects.
Service and agency program objective memorandum (POM) submissions should include an assessment of how well they support strategic readiness goals. Service POMs will include force structure targets, personnel end strength goals, and funding to achieve some level of readiness in parts and equipment. These will not be assessed or reported in terms of how they impact the dimensions of readiness we have identified here. Applying the methodologies that we have developed will highlight focus areas that will not be apparent from just looking at reported levels of funding.
We acknowledge that direction to perform this kind of analysis will likely be resisted as staff-intensive, but we emphasize that without this kind of analysis, only a small part of the overall enterprise can reasonably be called optimized. Performing this kind of analysis may be more palatable if the broad readiness assessments are conducted year-round and then placed as entering arguments into POM development.
Program budget review (PBR) should be explicitly connected to readiness deficiencies identified in the front-end assessment, with PBR actions being assessed in terms of impact across readiness dimensions. PBR involves directed adjustments in readiness actions, which can now be discussed only in terms of account movements. The system methodology allows assessment of actions in terms of observable impact. This can be done as part of PBR issue team deliberation. As with the front-end assessment, this requires effort. However, the methodology guides the effort, and the results allow discussion that currently is simply not possible with the data provided.
Implementation Options Ideally, OSD, partnering OSD (Personnel and Readiness) and Cost Assessment and Program
Evaluation, would develop an integrated plan to systemize the use of these methodologies. This would entail a prioritized set of interactions to focus on, collaboration with the departments and services on the assessment and measurement of those prioritized readiness questions, an iterative review and approval process for the resulting interaction matrices, and an archive of work that has been completed. It might also require specific POM requests to submit supporting interaction matrices using one or both available methodologies.
The armed services could also initiate this kind of analysis at their own level and use its outcomes to help support their discussions with OSD on emerging POM decisions. Again, developing a prioritized list of key questions, collaborating widely (including jointly and with

106
OSD and the Joint Staff) and using an iterative approach and an accessible archive, would allow for the slow accumulation of an increasingly broad and detailed set of readiness interaction matrices—both for general readiness assessment and for informing specific POM proposals. This, in turn, could lead to the ability to see readiness better over time.
Ultimately, and perhaps not for several years, new level-3 reporting regimens can be developed and approved, systematizing data collection and improving shared vision and situational awareness of readiness. Ongoing validation of the relationships captured in the interaction matrices should continue (adding new matrices to the architecture). And as the body of knowledge increases in nuance and breadth, DoD will have ever better ability to understand how investment decisions across DOTMLPF-P will affect readiness across all the core dimensions.
Final Observations This report is the culmination of several years of work on readiness, all of which points to the
need for a comprehensive approach to readiness, going far beyond the easily measured factors that the current system provides. DoD has continued to modify its approach to match overall readiness to broader strategic frameworks. The current effort to use dimensions of readiness as a basis for analysis captures enough of the major elements needed for a thorough understanding of the factors necessary to assess and improve the nation’s ability to respond to the range of challenges. We do caution, however, that no readiness analysis will tell a policymaker what to do. The best that can be provided is increasingly useful data that can show the wide range of effects that are likely once a decision is made.

107
Appendix. Compiled Table of Proposed FY 2020 MILCON Projects Located Outside the United States
Table A.1 details the OCONUS MILCON projects proposed in the FY 2020 service budgets.
Table A.1. FY 2020 Proposed OCONUS MILCON Projects
Service Location Project Description
Air Force Royal Australian Air Force Base Tindal (RAAF Tindal)
Jet fuel storage tanks Construct two 4 ML(25,000 barrel ea) cut-and-cover bulk fuel storage tanks using standard design and construction methods to accommodate U.S. Air Force mission aircraft training at RAAF Tindal. In addition, construct aircraft liquid fuel truck fill stands, fuel stand unloading, pumphouses, and filter building.
Air Force RAAF Tindal, Australia Earth covered magazines (ECMs)
Construct two ECMs and an ancillary explosive facility for loading and unloading munitions.
Air Force Royal Air Force (RAF) Akrotiri, Cyprus
1st Expeditionary Reconnaissance Squadron (1 ERS) dorm
Construct new masonry and structural steel dormitory facility with a 147 room capacity for 1 ERS deployed assigned and transient personnel.
Air Force Joint Region Marianas- Andersen Air Force (AF) Base Site #1, Guam
Munitions storage igloos PH 3
Construct munitions igloos to support existing missions at Andersen Air Force Base.
Air Force Yokota Air Base, Japan Fuel receipt and distribution upgrades
Expand and upgrade the existing liquid fuel unloading facility to accommodate rail cars (existing capability) and fuel delivery trucks and comply with current requirements
Air Force Muwaffaq Salti Air Base, Jordan
Air traffic control tower (ATCT)
Construct a 12-story ATCT with reinforced concrete pile foundation and slab floor, masonry walls, and standing seam metal roof.
Air Force Muwaffaq Salti Air Base, Jordan
Munitions storage area (MSA)
Construct south MSA to include ECMs (igloos) to store up to 3.0 m Net Explosive Weight munitions with the necessary associated paved roads, security fencing, and lightning protection
Air Force Joint Region Marianas–Tinian CNMI
Fuel tanks with receipt pipeline and hydrant system
Construct new jet fuel system including harbor fuel receipt, pipeline, fuel storage, and high–flow rate fuel delivery to parking apron hydrant system, as well as to truck stands

108
Service Location Project Description
Air Force Joint Region Marianas–Tinian CNMI
Airfield development phase 1
This project provides site development for Air Force access to Tinian International Airport, including a cleared and level site with paved road access, security fencing, extensive earthwork, drainage, electrical and water utility connections, demolition of World War II–era airfield pavements, repair and improvement of haul route, and all other requirements.
Air Force Joint Region Marianas–Tinian CNMI
Parking apron Construct an aircraft parking apron and taxiways, with associated shoulders, using established airfield concrete and hotmix asphalt standards.
Air Force RAF Lakenheath, United Kingdom
F-35 precision guided munitions facility
Construct a facility with reinforced concrete foundation and walls, concrete slab, structural steel frame, standing seam metal roof and vertical cladding. This facility accommodates missile and munitions assembly and disassembly inspection, testing, and repair.
Air Force Keflavik Naval Air Station, Iceland
European Deterrence Initiative (EDI): airfield upgrades–apron expansion
This project will provide a full-depth concrete pavement/subbase aircraft parking apron expansion that supports powered on-and-off operations for a squadron of U.S. Air Force or North Atlantic Treaty Organization aerial refueler equivalent aircraft. Mooring eyes and grounding points will be provided and storm water improvements installed as required to meet local environmental regulations.
Air Force Keflavik Naval Air Station, Iceland
EDI: airfield upgrades-–dangerous cargo pad
This project will provide a full-depth concrete pavement/subbase dangerous cargo pad (DCP) with paved asphalt shoulders sized for aircraft up to and including a C-5.
Air Force Keflavik Naval Air Station, Iceland
EDI: beddown site preparation
This project will provide a level, firm, well-drained 40,000-square-meter graveled area consisting of a full depth aggregate base course with crushed stone drainage course enclosed by a perimeter security fence.
Air Force Morón Air Base, Spain EDI: hot cargo pad Construct a DCP of concrete pavement over select base course to support heavy aircraft loaded with hot cargo and dangerous materials, complete with taxiway access, pavements, and utilities.
Air Force Unspecified EDI: hot cargo pad Construct a hazardous cargo pad and taxi lane access supporting the full weight and turning radius of a Strategic Transport Aircraft, using conventional design and construction methods.

109
Service Location Project Description
Air Force Unspecified EDI: munitions storage area
Construct a Joint MSA using conventional design and construction methods to accommodate storage of a variety of munitions types, supporting operations within the region.
Air Force Unspecified EDI: European Contingency Air Operations Sets Deployable Air Base Systems (DABS)–Facilities, Equipment, and Vehicles (FEV)/Expeditionary Medical Support Storage (EMEDSS)
Construct humidity-controlled warehouses and a vehicle maintenance facility using conventional design and construction methods to accommodate airfield infrastructure DABS–FEV/EMEDSS, in support of the EDI.
Air Force Gwangju Air Base, Korea Hydrant fuel system, multi Use host nation funding to convert Tank 1311 (100,000 barrels) and Tank 1315 (60,000 barrels) to constant pressure hydrant fuel system operating tanks with 3 600-gallon-per-minute pumps. Construct control/filter building with pump motor control centers, fuel lab.
Air Force Kunsan Air Base, Korea Dining facility Use host nation funding to construct a new dining facility incorporating economical design and construction methods to accommodate the mission of the facility.
Air Force Kunsan Air Base, Korea Upgrade electrical distribution system
Use host nation funding to upgrade Kunsan Air Base’s electrical distribution system incorporating economical design and construction methods to sustain the installation’s mission and add operational resiliency for theaterwide operations.
Air Force Suwon Air Base, Korea Hydrant fuel system, multi Use host nation funding to construct a hydrant fuel system consisting generally of two 10,000-barrel fuel storage tanks and two truck fill stands with return to bulk capabilities for refueling trucks. Include commercial fuel truck offload capability at truck fill stands.
Army Soto Cano Air Base, Honduras
Aircraft maintenance hangar
Construct a modified Army standard design aviation maintenance hangar for rotary-wing aircraft. Primary facilities include aircraft maintenance hangar, covered hardstand, redundant power generators, and aircraft parking aprons.
Navy Naval Support Activity, Bahrain
Electrical system upgrade Upgrade the electrical system at Naval Support Activity Bahrain in terms of capacity for specific buildings and greater energy resiliency of the medium-voltage distribution system.
Navy Naval Base Guam Bachelor enlisted quarters (BEQ)
Construct a BEQ and support facilities

110
Service Location Project Description
Navy Naval Base Guam Explosive Ordnance Disposal Compound Facilities
Construct an operations building, multi-purpose training building, maintenance building, armory, and storage structures for Explosive Ordnance Disposal Mobile Unit (EODMU) 5.
Navy U.S. Naval Support Activity Andersen Guam
Machine gun range Construct a multilane multipurpose machine gun range, a range control tower, ammunition distribution point, covered bleachers and utilities and site work.
Navy Naval Air Station (NAS) Sigonella Italy
Communications station Construct a new communications station at NAS Sigonella. The facility will provide secure and reliable classified and unclassified voice and data telecommunications to surface, subsurface, air, and ground forces in support of real-world operations and exercises by U.S. Naval, Joint, and Coalition operating forces in the theaters of operation. The facility will also provide a satellite communications area, a secure cryptographic equipment area, and redundant mechanical and electrical power systems. Designated systems will be seismic certified to remain functional after an earthquake.
Navy Marine Corps Air Station Iwakuni Japan
Vertical takeoff and landing (VTOL) pad–south
Construct a high temperature–resistant concrete VTOL pad that effectively supports Unit Deployment Program aircraft flight operations and complies with F-35 requirements. Demolish the existing nonconforming VTOL pad on the south side of the runway.
Navy Commander Fleet Activities Yokosuka, Japan
Pier 5 (Berths 2 and 3) Construct a fixed single-deck pier to replace the existing floating pier
Navy Naval Station Rota, Spain EDI: joint mobility center Construct new joint mobility center, administrative, and training buildings.
Navy Naval Station Rota, Spain EDI: In-Transit Munitions Facility
Construct In-Transit Munitions Facility that will support the build-up and break down of outsize multiple pallets with pallet pits, scales, hydraulic lifts, and pallet position high-line docks attached to the facility.
Navy Naval Station Rota, Spain EDI: small craft berthing facility
Construct a small craft berthing facility. Construct a breakwater to protect the berthing facility.

111
References
Betts, Richard K., Military Readiness: Concepts, Choices, Consequences, Washington, D.C.: Brookings Institution, 1995.
Button, Robert W., Bradley Martin, Jerry M. Sollinger, and Abraham Tidwell, Assessment of Surface Ship Maintenance Requirements, Santa Monica, Calif.: RAND Corporation, RR-1155-NAVY, 2015. As of June 22, 2020: https://www.rand.org/pubs/research_reports/RR1155.html
Chairman of the Joint Chiefs of Staff Instruction 3050.01, Implementing Global Integration, Washington D.C.: Joint Staff, December 31, 2018, Not available to the general public.
Cozad, Kyle, “Ready, Relevant Learning: Better, Faster, More Effective,” Navy Live blog, March 16, 2018.
D’Angelo, Matthew R., Diane Seibert, Matthew D. Welder, Ronald M. Cervero, and Steven J. Durning, “Decoding Readiness: Towards a Ready Military Healthcare Force,” Military Medicine, Vol. 184, No. 5/6, 2019, pp. 122–126.
Department of the Air Force, “Air National Guard Fiscal Year (FY) 2020 Budget Estimates,” Washington, D.C., March 2019a.
———, “Military Construction Program Fiscal Year (FY) 2020 Budget Estimates,” Washington, D.C., March 2019b.
Department of the Army, “Army National Guard Fiscal Year (FY) 2020 Budget Estimates, Military Construction,” Washington, D.C., March 2019a.
———, “Department of the Army Fiscal Year (FY) 2020 President’s Budget Submission,” Washington, D.C., March 2019b.
———, “United States Army Reserve Fiscal Year (FY) 2020 Budget Estimates, Military Construction,” Washington, D.C., March 2019c.
Department of the Navy, Strategic Readiness Review, Washington, D.C., 2017.
———, “Fiscal Year (FY) 2020 Budget Estimates, Justification of Estimates,” Washington, D.C., March 2019a.
———, “Fiscal Year (FY) 2020 Budget Estimates, Military Construction Reserve Force (MCNR),” Washington, D.C., March 2019b.
Eibner, Christine, Maintaining Military Medical Skills During Peacetime: Outlining and Assessing a New Approach, Santa Monica, Calif: RAND Corporation, MG-638-OSD, 2008.

112
As of November 12, 2020: https://www.rand.org/pubs/monographs/MG638.html
Else, Daniel H., Military Construction: Process and Outcomes, Washington, D.C.: Congressional Research Service, R44710, December 14, 2016. As of June 3, 2020: https://apps.dtic.mil/dtic/tr/fulltext/u2/1024167.pdf
Fazal, Tanisha M., Todd Rasmussen, Paul Nelson, and P. K. Carlton, “How Long Can the U.S. Military’s Golden Hour Last?” War on the Rocks, October 8, 2018. As of May 2020: https://warontherocks.com/2018/10/how-long-can-the-u-s-militarys-golden-hour-last/
GAO—See U.S. Government Accountability Office.
Gropman, Alan L., Mobilizing U.S. Industry in World War II: Myth and Reality, McNair Paper 50, Washington, D.C.: Institute for National Strategic Studies, National Defense University, August 1996.
Hosek, Susan D., and Gary Cecchine, Reorganizing the Military Health System: Should There Be a Joint Command? Santa Monica, Calif.: RAND Corporation, MR-1350-OSD, 2001. As of June 4, 2020: https://www.rand.org/pubs/monograph_reports/MR1350.html
Kepe, Marta, “Lives on the Line: The A2AD Challenge to Combat Casualty Care,” Modern War Institute blog, July 30, 2018. As of April 6, 2021: https://mwi.usma.edu/lives-line-a2ad-challenge-combat-casualty-care/
Klein, Maury, A Call to Arms: Mobilizing America for World War II, New York: Bloomsbury Press, 2013.
Losey, Stephen, “New in 2019: Growing the Force—the Road to 386 Squadrons,” Air Force Times, January 2, 2019.
Mann, Christopher T., FY2018 Military Construction Authorizations and Appropriations, Washington, D.C.: Congressional Research Service, R45217, June 6, 2018. As of November 9, 2020: https://fas.org/sgp/crs/natsec/R45217.pdf
Meadows, Donella H., Thinking in Systems: A Primer, White River Junction, Vt.: Chelsea Green Publishing, 2008.
National Academies of Sciences, Engineering, and Medicine, A National Trauma Care System: Integrating Military and Civilian Trauma Systems to Achieve Zero Preventable Deaths After Injury, Washington, D.C.: National Academies Press, 2016. As of May 2020: https://www.ncbi.nlm.nih.gov/books/NBK390327/pdf/Bookshelf_NBK390327.pdf

113
Ochmanek, David, Peter A. Wilson, Brenna Allen, John Speed Meyers, and Carter C. Price, U.S. Military Capabilities and Forces for a Dangerous World: Rethinking the U.S. Approach to Force Planning, Santa Monica, Calif.: RAND Corporation, RR-1782-1-RC, 2017. As of November 12, 2020: https://www.rand.org/pubs/research_reports/RR1782-1.html
Office of the Secretary of Defense, “Dimensions of Strategic Readiness,” memorandum, undated.
Office of the Under Secretary of Defense (Comptroller), “European Defense Initiative Department of Defense Budget Fiscal Year (FY) 2020,” Washington, D.C., March 2019.
OSD—See Office of the Secretary of Defense.
Public Law 112-25, An Act to Provide for Budget Control, August 2, 2011.
“Resourcing a Ready Surface Force,” Navy Live blog, May 6, 2019. As of May 19, 2020: https://www.navy.mil/Resources/Blogs/Detail/Article/2237008/resourcing-a-ready-surface-force/
Rittel, Horst W., and Melvin M. Webber, “Dilemmas in a General Theory of Planning,” Policy Sciences, Vol. 4, 1973, pp. 155–169. As of July 2, 2020: http://www.uctc.net/mwebber/Rittel+Webber+Dilemmas+General_Theory_of_Planning.pdf
Serbu, Jared, “For New Navy Chief, Fixing Readiness Problems Trumps Building Bigger Fleet,” Federal News Network, January 16, 2020. As of November 10, 2020: https://federalnewsnetwork.com/navy/2020/01/for-new-navy-chief-fixing-readiness-problems-trumps-building-bigger-fleet/
Sisk, R., “Pentagon Releases List of Military Construction Projects Paused to Fund Border Wall,” Military.com, September 4, 2019. As of April 21, 2020: https://www.military.com/daily-news/2019/09/04/pentagon-releases-list-military-construction-projects-paused-fund-border-wall.html
Sternberg, Steve, “A Crack in the Armor: Military Health System Isn’t Ready for Battlefield Injuries,” US News and World Report, October 10, 2019. As of November 9, 2020: https://www.usnews.com/news/national-news/articles/2019-10-10/military-health-system-isnt-ready-for-battlefield-injuries
Taghizadeh, Sabrina, Medical Operations in Denied Environments (MODE): Are Our AF Medics Ready? Maxwell Air Force Base, Ala.: Air Command and Staff College, 2016. As of May 2020: https://apps.dtic.mil/docs/citations/AD1044972
Thomas, Brent, Mahyar A. Amouzegar, Rachel Costello, Robert A. Guffey, Andrew Karode, Christopher Lynch, Kristin F. Lynch, Ken Munson, Chad J. R. Ohlandt, Daniel M. Romano,

114
Ricardo Sanchez, Robert S. Tripp, and Joseph V. Vesely, Project AIR FORCE Modeling Capabilities for Support of Combat Operations in Denied Environments, Santa Monica, Calif.: RAND Corporation, RR-427-AF, 2015. As of June 2, 2020: https://www.rand.org/pubs/research_reports/RR427.html
U.S. Air Force, USAF Posture Statement Fiscal Year 2020, Washington, D.C., March 2019.
U.S. Department of Defense, Summary of the 2018 National Defense Strategy of the United States of America: Sharpening the American Military’s Competitive Edge, Washington, D.C., 2018.
U.S. Fleet Forces Command, Comprehensive Review of Recent Surface Force Incidents, Washington, D.C.: Department of the Navy, 2017.
U.S. Government Accountability Office, Navy Force Structure: Sustainable Plan and Comprehensive Assessment Needed to Mitigate Long-Term Risks to Ships Assigned to Overseas Homeports, GAO-15-329, Washington, D.C., May 2015.
———, Navy Readiness: Actions Needed to Address Persistent Maintenance, Training, and Other Challenges Facing the Fleet, GAO-17-798T, Washington, D.C., September 7, 2017.
———, Actions Needed to Determine the Required Size and Readiness of Operational Medical and Dental Forces, GAO-19-206, Washington, D.C., February 2019.
U.S. Joint Chiefs of Staff, Department of Defense Dictionary of Military and Associated Terms, Joint Publication 1-02, Washington, D.C., January 2020.
Walman, Annie, Al Shaw, Ash Ngu, and Sean Campbell, “Are Hospitals Near Me Ready for Coronavirus? Here Are Nine Different Scenarios.” ProPublica, March 17, 2020. As of November 13, 2020: https://projects.propublica.org/graphics/covid-hospitals
Whitley, John E., Joseph F. Adams, Joseph J. Angello, Jennifer T. Brooks, Sarah K. Burns, Jason A. Dechant, Stanley A. Horowitz, Philip M. Lurie, John E. Morrison, and Paul M.Thompson, Essential Medical Capabilities and Medical Readiness, Alexandria, Va.: Institute for Defense Analyses, IDA Paper NS P-5305, July 2016.
Whitley, John E., James M . Bishop, Sarah K. Burns, Kristen M. Guerrera, Philip M. Lurie, Brian Q. Rieksts, Bryan W. Roberts, Timothy J. Wojtecki, and Linda Wu, Medical Total Force Management: Assessing Readiness and Cost, Alexandria, Va.: Institute for Defense Analyses, IDA Paper P-8805, May 2018.

$40.00
For five years, RAND researchers have worked with the Office of the
Secretary of Defense to explore a more expansive approach to readiness
assessments—one that looks beyond the narrow lens of operational
readiness more typical of readiness systems in use in the Department of
Defense (DoD) and considers a broader set of dimensions that could have
an impact on readiness outcomes. This more expansive perspective can lead to a better
understanding of the root cause of readiness shortfalls—or, at a minimum, better insights
into how to uncover the root cause—and, in turn, inform more-effective solutions to
remedy them. Each research effort conducted over this period has built on the prior and
culminated in this report’s novel methodology that could be adopted by DoD to assess
its strategic readiness.
In May 2019, the Office of the Under Secretary of Defense for Personnel and Readiness
(OUSD [P&R]), asked RAND to provide a method and specific metrics to enable
OUSD (P&R) and the entire defense community to more fully answer questions about
the nation’s readiness to execute the National Defense Strategy. In developing those
methods and metrics, the research team was asked to focus on seven core dimensions
of strategic readiness, as newly defined by the Office of the Secretary of Defense and
the Joint Staff, to assess whether those seven dimensions were sufficiently broad for
effective evaluation of DoD’s strategic readiness—and to define additional dimensions
if needed.
RR-A453-1
www.rand.org
NATIONAL DEFENSE RESEARCH INSTITUTE
9 7 8 1 9 7 7 4 0 6 2 2 4
ISBN-13 978-1-9774-0622-4ISBN-10 1-9774-0622-X
54000
RR-A453-1 Cover.indd All Pages 5/24/21 2:16 PM
Copyright © 2022 FDOKUMEN