Public investment in transportation infrastructures and regional asymmetries in Portugal
Upload
khangminh22Category
view
2download
0
LHC
b-PU
B-20
15-0
0520
/03/
2015
LHCb-PUB-2015-005March 18, 2015
Undergraduate LaboratoryExperiment: Measuring MatterAntimatter Asymmetries at the
Large Hadron Collider
C. Parkes1, M. Gersabeck1, J. Gutierrez1.
1The University of Manchester, Manchester, United Kingdom
Abstract
This document is the student manual for a third year undergraduate laboratoryexperiment at the University of Manchester. This project aims to measure afundamental difference between the behaviour of matter and antimatter through theanalysis of data collected by the LHCb experiment at the Large Hadron Collider.The three-body decays B±→ h±h+h−, where h± is a π±or K± are studied. Theinclusive matter antimatter asymmetry is calculated, and larger asymmetries aresearched for in localized regions of the phase-space.


1 Background information
An undergraduate laboratory experiment has been developed using LHCb data to studyCP Violation. This experiment is undertaken by third year undergraduate students at theUniversity of Manchester. The students have a choice of experiments which vary from thoseon classic topics such as a Michelson interferometer and Nuclear Magnetic Resonance, tothose closer to currrent research areas in the department such as gravitational microlensingfor extra-solar planets and measuring properties of Graphene. The students have eightdays in the laboratory to work on the project. The project is normally undertaken in pairsof students. There are around 250 undergraduate students per year and the laboratoryprojects run four times per year, around 60 students perform each of the more popularprojects per year. These students have had a previous programming course in C++, butno knowledge of ROOT. They have undertaken courses in special relativity and will have aknowledge of the fundamental particles in the Standard Model. Depending on the periodof the year in which they take the project, some students will have undertaken a coreparticle physics course but this is not assumed. A staff member gives them an introductionto the laboratory project on their first day, and then the staff member is available severaltimes per day on the subsequent days of the project to offer advice. The project is assessedby (1) an interview where the students give a short presentation of their work, (2) thestudents write up the results of their project in the format of a short scientific paper.
This document is the student manual. At the time of writing the project has operatedfor one full academic year. It has proved to be an extremely popular choice and hasreceived very positive feedback. The following resources are also available by contactingthe authors:
• The source files for this student manual.
• A companion document of notes for staff supervising the experiment.
• The data files used (LHCb data and phase space monte-carlo simulation).
• An example program and macro file for the students to use.
2 Aims & Objectives of Laboratory Project
Knowledge of special relativity and basic statistical techniques, as taught in the first yearcourses, are assumed. A detailed knowledge of particle physics is not required for theproject.
This project assumes basic familiarity with C++ syntax. The Linux operating systemand ROOT package are used but prior knowledge of these is not assumed.
2.1 Aims
1. To utilise and understand data analysis techniques used in modern particle physicsexperiments.
1

2. To understand how matter antimatter differences can be observed.
3. To understand the design of a particle physics detector.
2.2 Objectives
1. To write a C++ program to select and analyse three-body decays of charged B mesons.
2. To use the data to observe intermediate resonance states in the decays.
3. To use the data to observe matter antimatter differences.
3 Introduction
The Large Hadron Collider [1] (LHC) is a particle accelerator at CERN, the EurpoeanOrganisation for Nuclear Research, located near Geneva. In the data analysed in thisproject, the LHC collided protons with protons at energies of 3.5 TeV, giving a centre-of-mass energy of 7 TeV. The LHC beams consist of around 2000 bunches of protons, witheach bunch containing around 1011 protons. For the data sample used here, the bunchesfrom the two beams were crossed in the LHCb detector at a rate of 15 MHz. Each timethe beams cross (called ‘events’) there is a high probability of one or more collisions, thatis inelastic interactions between the constituents of the protons.
The first physics runs of the LHC started in 2010 and operations continued until early2013. The LHC, with various upgrades, is expected to continue for around two decades.The main aims of the LHC experiments are to test the Standard Model (SM) of particlephysics and to search for new phenomena beyond the SM.
LHCb [2] is one of the four large experiments at the LHC. It is an experiment dedicatedto searching for new physics from beyond the Standard Model through the study of matterantimatter differences (CP Violation) and rare decays of hadrons containing b and c quarks.The design of the detector is described in Sect. 5. In this project you will analyse datarecorded by the experiment to attempt to observe CP Violation.
The processes being observed are rare, so statistical analysis is used to sieve informationfrom large quantities of data. You have been given a subset of data collected by the LHCbexperiment which has been preselected (i.e. filtered) to contain events of primary interestfor this analysis.
4 CP Violation
Why does the universe contain much more matter than antimatter? This is one of themajor outstanding questions of fundamental physics. The big-bang is expected to haveproduced equal amounts of matter and antimatter. The universe today is made primarilyof matter. A fundamental difference between the behaviour of matter and antimatter (CP
2
Violation) is one of the requirements, known as the Sakharov conditions, to explain howthis can have arisen [3].
CP -symmetry is the product of two symmetries: C for charge conjugation that trans-forms a particle into its antiparticle, and P for parity that reflects the spatial co-ordinates.A violation of this symmetry was discovered in 1964 [4] in weak decays of the kaons forwhich the 1980 Nobel Prize was awarded. A mechanism to include CP Violation in theSM (through the CKM matrix [5]) was suggested in 1973 and verified through tests ofCP Violation in weak decays of the B mesons at the BaBar and Belle experiments from1999-2010 [6], with the 2008 Nobel Prize being awarded for this work. Further informationon CP Violation can be found in Refs. [7–9].
The LHC experiments have discovered the last particle of the SM, the Higgs boson [10,11], and are engaged in searching for new physics from beyond the SM. The SM of particle-physics includes CP Violation, but the magnitude of the effect is far too small to explainthe matter antimatter imbalance in the universe. Consequently additional sources of CPViolation are required. New particles from beyond the SM will in general add additionalsources of CP Violation. Hence measurements of CP Violation provide an importantmethod of searching for new phenomena from beyond the SM. These new physics particlescould potentially also provide explanations for other major unanswered questions such asthe nature of dark-matter.
Experimental studies of CP Violation can be conducted by comparing the decays ofa particle and antiparticle state. The LHCb experiment is the experiment at the LHCdedicated to such studies and has produced a number of major results. Regularly updatedhighlights from its physics programme are described on the web pages at [12, 13]. Theanalysis undertaken here is based on the largest CP Violation effects that have beenobserved [14,15].
5 Detector, software and data sample
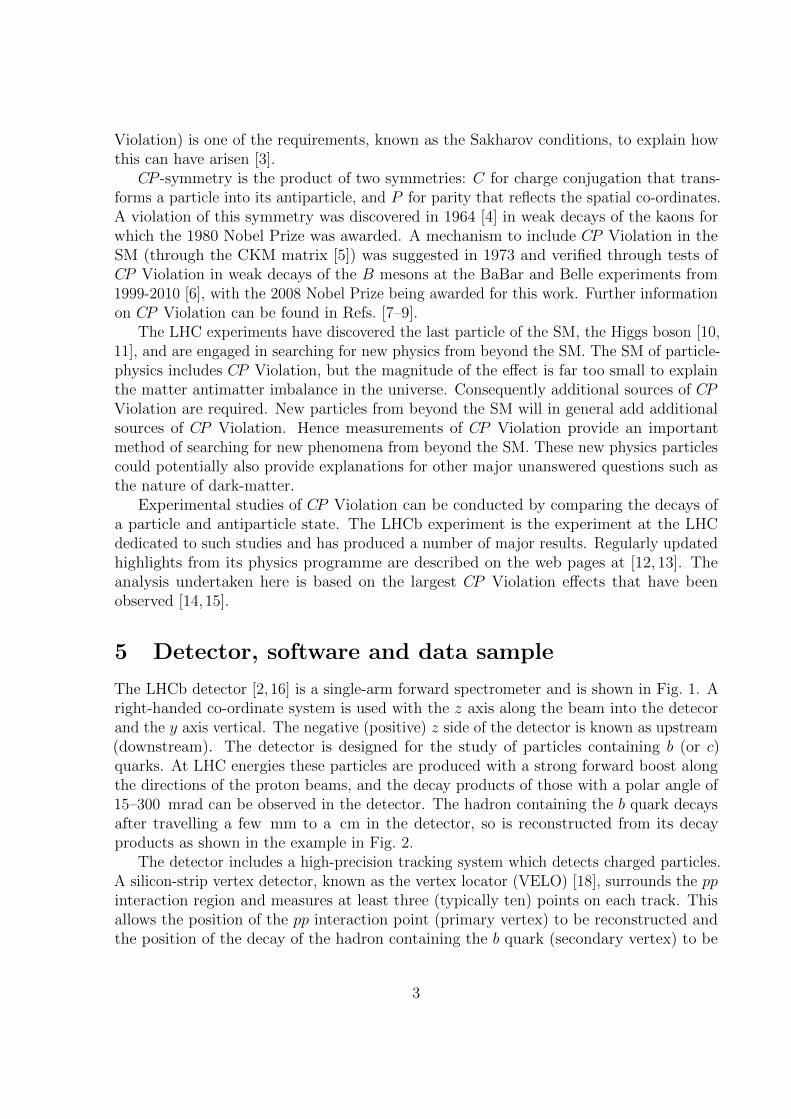
The LHCb detector [2, 16] is a single-arm forward spectrometer and is shown in Fig. 1. Aright-handed co-ordinate system is used with the z axis along the beam into the detecorand the y axis vertical. The negative (positive) z side of the detector is known as upstream(downstream). The detector is designed for the study of particles containing b (or c)quarks. At LHC energies these particles are produced with a strong forward boost alongthe directions of the proton beams, and the decay products of those with a polar angle of15–300 mrad can be observed in the detector. The hadron containing the b quark decaysafter travelling a few mm to a cm in the detector, so is reconstructed from its decayproducts as shown in the example in Fig. 2.
The detector includes a high-precision tracking system which detects charged particles.A silicon-strip vertex detector, known as the vertex locator (VELO) [18], surrounds the ppinteraction region and measures at least three (typically ten) points on each track. Thisallows the position of the pp interaction point (primary vertex) to be reconstructed andthe position of the decay of the hadron containing the b quark (secondary vertex) to be
3

Figure 1: (top) Layout of the LHCb experiment. The beams travel along the horizontal pipe inthe centre of the detector and collide in the Vertex Locator at the left hand side of the diagram.The subdetector components are described in the text. (bottom) Photograph of the LHCb cavern.The image has been mirror reflected to be in the same orientation as the layout diagram.
measured. The charged particles passing through the silicon create electron-hole pairs andthese are drifted in an electric field across the silicon, and a signal obtained. A large-areasilicon-strip detector, known as TT, has four detection layers and is located upstreamof the dipole magnet. Charged particles are bent by the magnetic force, and the dipole
4

Figure 2: Event display images showing tracks reconstructed in a candidate B0s→ µ+µ− event.
The first evidence for this decay [17] was one of the major physics results from the LHC run 1 as itplaces significiant constraints on new physics in Supersymmetry models. (left) All reconstructedtracks in LHCb. (right) A zoom on the VELO region, showing the reconstructed primary vertexand secondary decay vertex of the B0
s meson separated by 14 mm. The reconstructed muontracks are highlighted in magenta.
magnet has a bending power of about 4 Tm. The direction of the magnetic field is regularlyreversed. This allows systematic uncertainties from oppositely charged particles bendinginto different regions of the detector, with potentially different detection efficiencies, to becontrolled. Three stations of silicon-strip detectors (each with four detection layers) andstraw drift tubes [19] are placed downstream of the magnet and are known as T1,T2,T3.The straw drift tubes are filled with a gas (Ar & CO2) that is ionised by the chargedparticles passing through, and this charge is drifted under an electric field to be measured.
The measured points are used to reconstruct the track of charged particles. Themomentum of the charged particle can be obtained from the bend of the track. Thecombined tracking system provides a momentum measurement with a relative uncertaintythat varies from 0.5% at low momentum, p, to 1% at 200 GeV/c, and an impact parameter(see section 6.3) measurement with a resolution of 20µm for charged particles with largetransverse momentum, pT.
Different types of charged hadrons (pions, kaons, and protons) are distinguished usinginformation from two ring-imaging Cherenkov detectors [20]. Charged particles travelthrough volumes of gases (CF4, C4F10) or ultra-light solids (aerogel) faster than the localphase velocity of light in those materials, and radiate photons. This is known as theCherenkov effect. These photons are measured and the angle at which the light is givenoff is directly related to the velocity of the particle. By combining the velocity informationwith the momentum information, the particle mass can be deduced and used to determinethe type of the charged hadron.
Photon, electron and hadron candidates are identified by a calorimeter system consistingof scintillating-pad (SPD) and preshower (PS) detectors, an electromagnetic calorimeter(ECAL) and a hadronic calorimeter (HCAL). The calorimeters are based on alternatinglayers of iron and scintillator. The particles interact and are absorbed in the iron andthe amount of scintillation light detected allows the reconstruction of the energy of thepaticles. Photons and electrons are primarily absorbed in the electromagnetic calorimeter.
5

Hadrons are primarily absorbed in the hadron calorimeter. Only neutrinos, which remainundetected, and muons typically pass through the calorimeters. Muons are identifiedby a system (M1–5) composed of alternating layers of iron and multiwire proportionalchambers [21].
Around 11 MHz of bunch-bunch crossings contain one or more inelastic pp interactionsin the data sample studied here. The size of the event data produced by the LHCb detectormeans that this could only be written to disc at a rate of 3 kHz. The system used todetermine which events to store is known as the trigger [22]. It consists of a hardwarestage, based on information from the calorimeter and muon systems, followed by a softwarestage, which applies a full event reconstruction. The software stage is run in a large farmof multiprocessor CPUs which run 26,110 copies of the program. The trigger aims toretain as high efficiency as possible for the decays channels that will be studied whilerejecting events of low interest.
The data is then processed at CERN and by computers in an worldwide computingsystem known as the GRID. The data undergoes preselection to write out events of interestfor paticular physics processes. Individual groups of analysts then write programs, usingthe LHCb software framework, to perform further selection and reduce the data sizestoring only the variables of primary interest. The data that you are provided with in theexperiment is of this form.
Simulations, in which the physics process under study or background processes are alsogenerated for comparison with the data. These may also include detailed simulations ofthe response of the detector, so that the simulation data is directly comparable with thedata. Simplified simulation data, not including detector repsonse, is provided here.
The data sample provided has been selected by the trigger and offline selection fromapproximately 1014 beam crossings that occurred at LHCb in 2011. The sample providedincludes only the most important reconstructed variables needed to perform this analysisin order to reduce the data file size and decrease the processing time for your analysis. Thesamples contain 3.4 million (5.1 million) events corresponding to an integrated luminosityof 434 pb−1 (584 pb−1) with the magnet in the “up” (“down”) polarity.
6 Experimental Strategy
The analysis performed here compares the rates for the decays B+→ h+h+h− and itsantiparticle equivalent B−→ h−h−h+ , where h± is a π± or K±. The B+ mesons arecomposed of a b quark and u quark. The π+ meson is composed of d and u quarks. TheK+ meson is composed of u and s quarks. The decays studied proceed through the weakforce (via W± bosons), where the CP symmetry is known to be violated.1
You will be assigned by your demonstrator to perform the analysis of one of the threedecays:
• B+→ π+π+π−
1The observation of CP Violation requires interference between two decay routes to the same final state(this is beyond the scope of this project and is discussed in the Frontiers in Particle Physics 2 course [8]).
6

• B+→ K+K+K−
• B+→ K+π+π− .
A simple quark flow diagram can also be written down for the B+→ π+K+K− decaychannel but experimentally the decay has somewhat higher background and is thereforenot included in this project.
6.1 Getting Started
You are provided with an example C++ program which you can use to perform the analysis.You will use the Linux operating system, some basic commands are given in Appendix BThe program is stored in the files MyAnalysis.cpp and MyAnalysis.h. The BookHistosroutine is called only once at the start of the execution of the program. This is where youwill book your histograms. The Execute routine is called for every event of the data sample.This is where you will call any routines to make calculations and selection cuts and fill thehistograms. The SaveHistos routine is called only once at the end of the program. Thisautomatically saves your output histograms to an output file. You will use the CERNROOT package to fill and plot histograms and to fit them, extensive guidance on ROOT isavailable at [23].
The data is stored in a .root file with the value of characteristic variables for the threemeasured final state tracks having been computed and stored for each event, the variablesavailable are given in Appendix A. Two samples of data collected by the LHCb experimentare provided with different orientations of the magnetic field. Data in the same formatfrom a simple simulation of the decay channel B+→ K+K+K− is also provided. Thissimulated data only has the momentum and charge variables filled, all others have theirvalues set to zero.
The histogram output of the program is also stored in a .root file. An example ROOT
macro is provided which will plot the saved histogram to the screen.
Aim: Run the example program. Display the example histogram that this producesfrom the data.
Hints: Copy the directory containing the code to your home area (the ’.’ means thisdirectory as the destination):
cp -r /opt/Software .
Change into the directory: cd Software
Make symbolic links in your area to the data filesln -s /data/LabData/PhaseSpaceSimulation.root PhaseSpaceSimulation.root
ln -s /data/LabData/B2HHH MagnetDown.root B2HHH MagnetDown.root
7

ln -s /data/LabData/B2HHH MagnetUp.root B2HHH MagnetUp.root
Compile the program, using:> make clean
> make
To see the options for the program> ./analyse
Execute the program, running over 50000 events of the Phase Space simulation:> ./analyse PhaseSpace 50000
This will have created a file called outputPhaseSpace.root which contains someexample histograms.
Start ROOT> root
Execute the example macro.> .x drawOutput.C
ROOT interprets standard C++ commands and uses C++ syntax from the command line.Many operations on histograms can also be performed by right mouse clicking on the graphsor axes.
To display a window that allows access to all available histograms and to open .rootfiles, type at the ROOT prompt
> TBrowser b;
To quit ROOT type> .q
Aim: Learn how to book, fill, save and plot histograms. Produce a plot of theprobability that the final state particles are pions or kaons.
Hints: A suitable text editor for modifying the example programs is called emacs.> emacs &
6.2 Invariant Mass Reconstruction
Aim:(i) Produce a plot of the invariant mass of the B meson using the simulation data
file. Assume that all final state particles are kaons.(ii) Explain why it is better to rely on the measured momenta and assumed masses
of the particles than their measured energies.
8

Hints: The invariant mass can be calculated from special relativity using the measuredmomenta of the final state tracks and known masses [24]. Derive the required formulas onpaper first, and then code them.
The simulation data should be used for these plots. The plots for the experimentaldata are more complex to understand as they contain a mixture of pions and kaons andbackground events. The plots for the experimental data will be analysed later.
6.3 Selection
The data sample you are given has pre-selection cuts applied to select a sample of eventswith relatively low background. The most important pre-selection cuts that have beenapplied are listed in table 1, and explained here:
• Momentum. The three final state tracks should all have significant momentum (p)and momentum in the plane transverse to the beam direction (pT) as they originatefrom a B decay, whereas tracks from background processess will typically have lowmomenta.
• B± Mass. The mass of the candidate B± meson can be computed from the measuredmomenta of the final state particles (under an assumption as to whether they arekaons or pions) and events with masses close to the known mass of this particle [24]are selected.
• Impact Parameters. The B± meson has a mean lifetime τ of 1.6× 10⁻¹² s [24], andwill travel a distance γcτ before decaying, where γ is the Lorentz factor of specialrelativity. This distance is typically a few mm in LHCb. The distance betweenits production point where the proton beams collide, known as the primary vertex,and the decay vertex into the three final state tracks is key to identifying a cleansample of events. The closest distance of approach of the final state tracks to theprimary vertex is known as the impact parameter (IP). These tracks will thus havea significant IP. The IPχ2 is the IP divided by its estimated uncertainty all squared.Hence a track from a background process that originates at the primary vertex willtypically have a low IPχ2.
The sample has not had any identification of the final state particles applied and hencecontains all combinations of charged pions and kaons. The event selection is commonbetween all the B±→ h+h+h− channels as the kinematics of all the channels will be verysimilar. Using the information from the particle identification systems [20] of the detector,particularly the RICH detectors to separate pions and kaons, the decay channel that is tobe studied can be separated out. This is a statistical process, there will still be a significantmisidentification rate of the h particle as pion/kaon in order to retain a high efficiency forselecting the signal.
9

Variable Selection CutTrack Transverse Momentum (pT) > 0.1 GeV/cSum of pT of Tracks > 4.5 GeV/cTrack Momentum (p) > 1.5 GeV/cB± candidate mass assuming all tracks are K± (MKKK) 5.05 < MKKK < 6.30 GeV/c2
Track Impact Parameter (IP) χ2 > 1Sum of IP χ2 of Tracks > 500B± candidate vertex fit χ2 < 12
Table 1: The most important pre-selection cuts applied to the data sample (see text for details).
Aim:(i) Select the sample of events for the channel that you will study using particle
identification information.(ii) Show that a clear mass peak is observed in the data for the B± once the
correct mass hypotheses for the final state particles are assumed. Identify that thereare regions in the mass plot dominated by signal events and regions dominated bybackground (known as side-bands).
Hints: Students studying the decay B±→ K±π+π− will need to determine which finalstate particle is most likely to be the kaon in each event in order to impose the correctmass hypothesis for the final state particles.
6.4 Two-body Resonances
The decays can proceed either directly to the three-body final state or via an intermediateparticle. For example, B+→ h+1 h
+2 h
−3 , could proceed through the decay B+→ h+1 R
0,where R0 is a neutral particle resonance which can decay R0→ h+2 h
−3 .
Aim: Identify the two-body resonances in the data for your decay channel.
Hints: The mass, width and other properties of all known particles can be obtainedfrom [24].
For the channels with all the same type of final state particles (B±→ π+π+π− andB±→ K+K+K− ), there are two identical pairings (π+π− or K+K−). It is conventionalto distiguish these by plotting the higher and lower mass pairs of each event.
10

The simulation contains no resonances so you should not observe these peaks in thatsample.
The analysis performed here is to study the CP Violation in the charmless B mesondecays to pions and kaons. However, the most frequent decays of the B mesons occurthrough the b quark decaying into a c quark. These events can be discarded by removingthe decays that may have proceeded via a D meson (which contains the c quark).
There is a small probability of a muon track being misidentifed as a charged pion trackin the detector. Consequently the B±→ J/ψK±, with J/ψ→ µ+µ− can be a backgroundprocess that fakes the signal if both muons are misidentified as pions.
Aim: Reject events from D meson decays and (if relevant) from B±→ J/ψK± fromthe event sample you are studying.
6.5 Global CP Asymmetry
The CP asymmetry A is defined as:
A =N− −N+
N− +N+,
where N+ is the number of B+→ h+h+h− events observed in the channel analysed andN− the number for the corresponding B− decay. The value of N± can be estimated byfitting the B± invariant mass distribution to extract the signal event contribution.
Other effects can fake a CP asymmetry. The LHC is a proton-proton collider andhence the initial state is not matter antimatter symmetric. While the primary productionmechanisms will produce bb quark-pairs there may be a small production asymmetry, itis estimated that this could be approximately 1%. The LHCb detector could be moreefficient for detecting the B+ or B− final states as the positive and negative particles willbe bent by the magnet in different directions in the detector2.
Aim: (i) Calculate the global CP asymmetry. Have you found evidence for CPViolation?
(ii) Show that the statistical uncertainty on the asymmetry is given by σA =√1−A2
N−+N+ .
2Another mechanism is that final state particles of one charge can have a higher probability ofinteracting with the detector than those of the other. This is a consequence of the detector being made ofmatter rather than anti-matter.
11

Hints: Correctly reconstructed signal decays will peak around the B± mass. Backgroundevents from random combinations of tracks that have passed the event selection cuts willhave a much smoother variation in mass. Peaking backgrounds from four-body decays ofB± mesons where only three tracks have been observed may also be present.
ROOT includes a versatile fitting package, instructions are available in the user guide [25].You can use, and combine, the built in fuctions or for more versatility define your ownfitting function. You can give the program reasonable starting values for the free parametersto allow the fit to converge.
The asymmetry will be a binomially distributed random variable, and its statisticaluncertainty must be calculated appropriately, see for example Ref. [26]. The asymmetrycan be rewritten in terms of efficiencies ε1 = N−
N−+N+ , ε2 = N+
N−+N+ . The uncertainty onthese efficiencies can then be calculated. The correlation between these two efficienciesmust also be considered.
6.6 Dalitz Plots
The Dalitz Plot [27] is an important technique for analysing three-body decays. Thekinematics of a three-body decay can be fully described using only two variables. Theaxes for a standard Dalitz Plot are the squares of the invariant masses of two pairs oftwo-body masses. Consequently, the intermediate resonances will be visible as bands onthe Dalitz Plot. Hence in the decay B+→ h+1 h
+2 h
−3 , M2
h+1 h−
3
and M2h+2 h−
3
are a potential
choice of variables. The kinematic constraints of a Dalitz Plot are shown in Fig. 3. Themain properties of a Dalitz Plot are:
• Decays that proceed simply according to phase space, not proceeding via resonances,uniformly populate the Dalitz Plot.
• Resonances appear as bands of events in the Dalitz Plot.
• The position and size of the band relate to the mass and width of the resonance.
• The spin of the resonance governs the distribution of events along the band. Spin0 (scalar) resonances will produce uniformly populated bands. Spin 1 (vector)resonances will show a minimum in the band.
• The exact pattern of events in the Dalitz Plot is determined by interference betweenthe various contributing states.
Aim:(i) Produce a Dalitz Plot for the simulation sample.(ii) Produce a Dalitz Plot for the data sample you are analysing.(iii) Produce a Dalitz Plot which describes the signal events only in the data
12

45. Kinematics 5
(m23)max
0 1 2 3 4 5 0
2
4
6
8
10
m12 (GeV2)
m23 (G
eV
2)
(m1+m2)2
(M−m3)2
(M−m1)2
(m2+m3)2
(m23)min2
2
2
2
Figure 45.3: Dalitz plot for a three-body final state. In this example, the stateis π+K0p at 3 GeV. Four-momentum conservation restricts events to the shadedregion.
45.4.4. Kinematic limits :
45.4.4.1. Three-body decays: In a three-body decay (Fig. 45.2) the maximum of |p3|,[given by Eq. (45.20)], is achieved when m12 = m1 + m2, i.e., particles 1 and 2 havethe same vector velocity in the rest frame of the decaying particle. If, in addition,m3 > m1, m2, then |p
3|max > |p
1|max, |p2
|max. The distribution of m12 values possessesan end-point or maximum value at m12 = M − m3. This can be used to constrain themass difference of a parent particle and one invisible decay product.
December 18, 2013 11:58
Figure 3: Dalitz Plot for an example three body final state. Four-momentum conservationrestricts events to the shaded region. Reproduced from Ref. [24], where additional informationon the technique is available.
sample.(iv) Revisit your identification of two-body resonances and observe how they are
distributed on the Dalitz Plot.
Hints: You may wish to produace the Dalitz Plots with several alternative binningsusing 2D histograms. Fine bins may allow you to observe the resonances more easily.However, for the asymmetry analysis below large bins (say 2.5 GeV2/c4 × 2.5 GeV2/c4)will be needed to keep the uncertainties on the number of entries in each bin small.
As in Sect. 6.4 it is conventional to use the higher and lower mass h+h− pairs in eachevent for the case of final states with all pions or all kaons.
Discuss with your demonstrator your ideas for performing the background subtraction.
To calculate the errors correctly when manipulating a histogram myHist call the functionmyHist->Sumw2(); before filling the histogram.
13
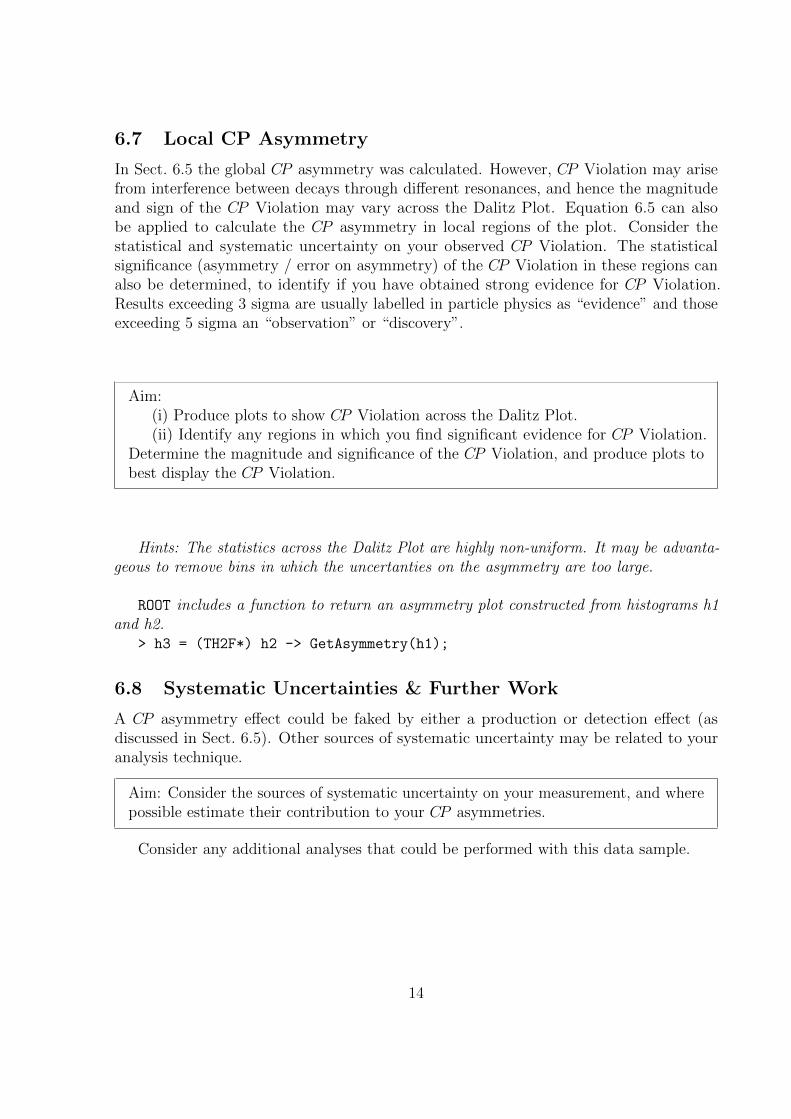
6.7 Local CP Asymmetry
In Sect. 6.5 the global CP asymmetry was calculated. However, CP Violation may arisefrom interference between decays through different resonances, and hence the magnitudeand sign of the CP Violation may vary across the Dalitz Plot. Equation 6.5 can alsobe applied to calculate the CP asymmetry in local regions of the plot. Consider thestatistical and systematic uncertainty on your observed CP Violation. The statisticalsignificance (asymmetry / error on asymmetry) of the CP Violation in these regions canalso be determined, to identify if you have obtained strong evidence for CP Violation.Results exceeding 3 sigma are usually labelled in particle physics as “evidence” and thoseexceeding 5 sigma an “observation” or “discovery”.
Aim:(i) Produce plots to show CP Violation across the Dalitz Plot.(ii) Identify any regions in which you find significant evidence for CP Violation.
Determine the magnitude and significance of the CP Violation, and produce plots tobest display the CP Violation.
Hints: The statistics across the Dalitz Plot are highly non-uniform. It may be advanta-geous to remove bins in which the uncertanties on the asymmetry are too large.
ROOT includes a function to return an asymmetry plot constructed from histograms h1and h2.
> h3 = (TH2F*) h2 -> GetAsymmetry(h1);
6.8 Systematic Uncertainties & Further Work
A CP asymmetry effect could be faked by either a production or detection effect (asdiscussed in Sect. 6.5). Other sources of systematic uncertainty may be related to youranalysis technique.
Aim: Consider the sources of systematic uncertainty on your measurement, and wherepossible estimate their contribution to your CP asymmetries.
Consider any additional analyses that could be performed with this data sample.
14

Acknowledgements
We are grateful to Vava Gligorov for his advice and preparation of the initial ntuples. Wewish to thank Irina Nasteva for her guidance on the stripping line and offline selectioncuts. We thank Sabah Salih for all his support and effort in setting up the computingfacilities for this experiment.
15

Appendices
A Data Variables
The variables available for each event in the .root data files are described below. Thedata is stored in a TTree structure. The B± candiate is reconstructed from three chargedtracks which are labelled H{1,2,3} in the following. Not all variables are filled for thesimulated data. Not all variables are required for the project, but additional variableshave been included as they may be useful for extensions of the project.
Variable DescriptionH1 PX Reconstructed momentum component of particle in X direction [ MeV/c ].H1 PY Reconstructed momentum component of particle in Y direction [ MeV/c ].H1 PZ Reconstructed momentum component of particle in Z direction [ MeV/c ].
The momentum is reconstructed from the curvature of the pathof the track in the magnetic field.
H1 ProbK Likehood of particle being Kaon [range 0 to 1].H1 ProbPi Likehood of particle being Pion [range 0 to 1].
The particle likelihood is obtained from combining information fromthe RICH and tracking detectors.
H1 Charge Particle charge (+1 or -1)Obtained from direction of curvature of path of the trackin the magnetic field.
H1 isMuon Identification of track as a muon, obtained from muon chamber hits(0 is false, 1 is true)
B FlightDistance The distance travelled by the B candidate before decaying. Obtained fromthe distance from the primary vertex to thevertex made by three charged tracks [ mm ].
B VertexChi2 χ2 of the quality of the vertex made by the three charged tracks.H1 IPChi2 Impact Parameter χ2.
16
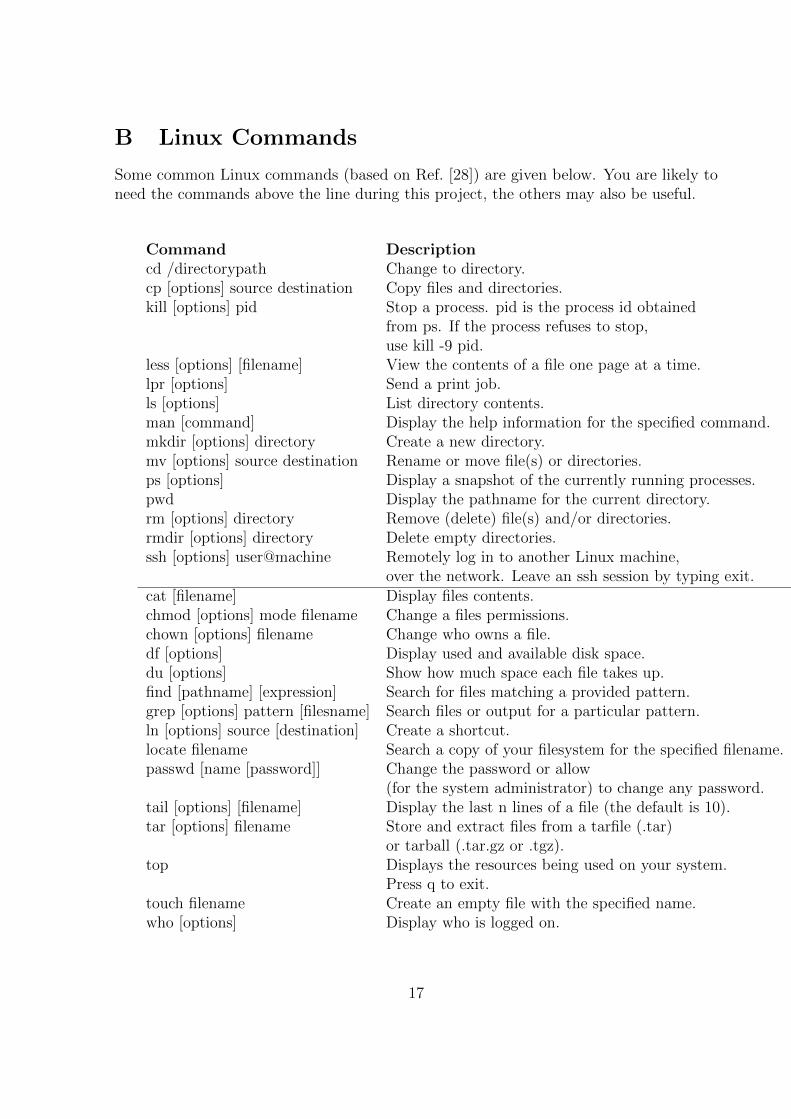
B Linux Commands
Some common Linux commands (based on Ref. [28]) are given below. You are likely toneed the commands above the line during this project, the others may also be useful.
Command Descriptioncd /directorypath Change to directory.cp [options] source destination Copy files and directories.kill [options] pid Stop a process. pid is the process id obtained
from ps. If the process refuses to stop,use kill -9 pid.
less [options] [filename] View the contents of a file one page at a time.lpr [options] Send a print job.ls [options] List directory contents.man [command] Display the help information for the specified command.mkdir [options] directory Create a new directory.mv [options] source destination Rename or move file(s) or directories.ps [options] Display a snapshot of the currently running processes.pwd Display the pathname for the current directory.rm [options] directory Remove (delete) file(s) and/or directories.rmdir [options] directory Delete empty directories.ssh [options] user@machine Remotely log in to another Linux machine,
over the network. Leave an ssh session by typing exit.cat [filename] Display files contents.chmod [options] mode filename Change a files permissions.chown [options] filename Change who owns a file.df [options] Display used and available disk space.du [options] Show how much space each file takes up.find [pathname] [expression] Search for files matching a provided pattern.grep [options] pattern [filesname] Search files or output for a particular pattern.ln [options] source [destination] Create a shortcut.locate filename Search a copy of your filesystem for the specified filename.passwd [name [password]] Change the password or allow
(for the system administrator) to change any password.tail [options] [filename] Display the last n lines of a file (the default is 10).tar [options] filename Store and extract files from a tarfile (.tar)
or tarball (.tar.gz or .tgz).top Displays the resources being used on your system.
Press q to exit.touch filename Create an empty file with the specified name.who [options] Display who is logged on.
17

References
[1] L. Evans and P. Bryant, LHC Machine, JINST 3 (2008) S08001.
[2] LHCb collaboration, A. A. Alves Jr. et al., The LHCb detector at the LHC, JINST 3(2008) S08005.
[3] A. Sakharov, Violation of CP Invariance, C Asymmetry, and Baryon Asymmetry ofthe Universe, Pisma Zh. Eksp. Teor. Fiz. 5 (1967) 32.
[4] J. Christenson, J. Cronin, V. Fitch, and R. Turlay, Evidence for the 2 π Decay of thek02 Meson, Phys. Rev. Lett. 13 (1964) 138.
[5] M. Kobayashi and T. Maskawa, CP Violation in the Renormalizable Theory of WeakInteraction, Prog. Theor. Phys. 49 (1973) 652.
[6] BaBar, Belle, A. Bevan et al., The Physics of the B Factories, Eur. Phys. J. C74(2014), no. 11 3026, arXiv:1406.6311.
[7] B. R. Martin and G. Shaw, Particle physics, Wiley-Blackwell, 2008.
[8] C. Parkes, Frontiers in Particle Physics 2, University of Manchester, http://www.
hep.manchester.ac.uk/u/parkes/Teaching/CPViolation/PP.html, 2014.
[9] M. S. Sozzi, Discrete symmetries and CP violation: From experiment to theory, .
[10] ATLAS collaboration, G. Aad et al., Observation of a new particle in the search forthe Standard Model Higgs boson with the ATLAS detector at the LHC, Phys. Lett.B716 (2012) 1, arXiv:1207.7214.
[11] CMS collaboration, S. Chatrchyan et al., Observation of a new boson at a massof 125 GeV with the CMS experiment at the LHC, Phys. Lett. B716 (2012) 30,arXiv:1207.7235.
[12] LHCb collaboration, LHCb Public Page, http://lhcb-public.web.cern.ch/
lhcb-public/, 2014. [Online; accessed 27-May-2014].
[13] LHCb collaboration, LHCb-UK Public Page, www.lhcb.ac.uk/, 2014. [Online;accessed 27-May-2014].
[14] LHCb collaboration, R. Aaij et al., Measurement of CP violation in the phase spaceof B± → K+K−π± and B± → π+π−π± decays, Phys. Rev. Lett. 112 (2014) 011801,arXiv:1310.4740.
[15] LHCb collaboration, R. Aaij et al., Measurement of CP violation in the phase spaceof B± → K±π+π− and B± → K±K+K− decays, Phys. Rev. Lett. 111 (2013) 101801,arXiv:1306.1246.
18

[16] LHCb, R. Aaij et al., LHCb Detector Performance, Int. J. Mod. Phys. A30 (2015)1530022, arXiv:1412.6352.
[17] LHCb collaboration, R. Aaij et al., First Evidence for the Decay B0s → µ+µ−, Phys.
Rev. Lett. 110 (2013) 021801, arXiv:1211.2674.
[18] LHCb VELO Group, R. Aaij et al., Performance of the LHCb Vertex Locator, JINST9 (2014) 09007, arXiv:1405.7808.
[19] LHCb Outer Tracker group, R. Arink et al., Performance of the LHCb Outer Tracker,JINST 9 (2014) 01002, arXiv:1311.3893.
[20] LHCb collaboration, M. Adinolfi et al., Performance of the LHCb RICH detector atthe LHC, Eur. Phys. J. C73 (2013) 2431, arXiv:1211.6759.
[21] F. Archilli et al., Performance of the Muon Identification at LHCb, JINST 8 (2013)P10020, arXiv:1306.0249.
[22] R. Aaij et al., The LHCb Trigger and its Performance in 2011, JINST 8 (2013)P04022, arXiv:1211.3055.
[23] CERN, ROOT, root.cern.ch/, 2014. [Online; accessed 27-May-2014].
[24] Particle Data Group, K. Olive et al., Review of Particle Physics, Chin. Phys. C38(2014) 090001.
[25] CERN, ROOT User Guide Chapter on Fitting Histograms, http:
//root.cern.ch/root/htmldoc/guides/users-guide/ROOTUsersGuideChapters/
FittingHistograms.pdf, 2014. [Online; accessed 11-June-2014].
[26] R. J. Barlow, Statistics: A guide to the Use of Statistical Methods in the PhysicalSciences, Wiley-Blackwell, 1989.
[27] R. Dalitz, On the analysis of tau-meson data and the nature of the tau-meson, Phil.Mag. 44 (1953) 1068.
[28] R. Blum, Linux for Dummies, John Wiley & Sons, 2009.
19
Copyright © 2022 FDOKUMEN