Measuring Efficiency in Field Audit Offices
22
MEASURING EFFICIENCY AT FIELD AUDIT OFFICES 1 By Muhammad Akram Khan Former Deputy Auditor General of Pakistan [email protected] http://issuu.com/makram100/docs/ measuring_efficiency_in_audit_offic/0 1. OBJECTIVE The objective of this paper is to develop a methodology for measuring efficiency in Field Audit Offices (FAOs) in the Department of the Auditor General of Pakistan. Of late, the Department is under considerable pressure both from within itself and also from the various clients it serves to improve its efficiency. The legislators and executive heads of the governments are asking for the audits which are professionally competent and which also add value to the society at large. The gap between what the society expects the state auditors to perform and what the auditors think about their own role is widening with the passage of time. The auditors are complaining that they do not have adequate physical and financial resources to meet the challenge, while the clients of the department and the government think that the department is wasting its resources and is doing a ‘useless’ work with very little utility. In this scenario, where the need of more resources cannot be denied, the department also needs to do some soul searching. The fact is that the department has never tried to measure its own efficiency either at the level of individuals or at the organizational level. The department is operating like any other public sector organization with all the handicaps and built-in inadequacies. The department of the Auditor General is supposed to act as a watchdog of the other departments. 1?* document.doc
-
Upload
independent -
Category
Documents
-
view
2 -
download
0
Transcript of Measuring Efficiency in Field Audit Offices

MEASURING EFFICIENCY AT FIELD AUDIT OFFICES1
By
Muhammad Akram KhanFormer Deputy Auditor General of Pakistan
[email protected]://issuu.com/makram100/docs/
measuring_efficiency_in_audit_offic/0
1. OBJECTIVE
The objective of this paper is to develop a methodology formeasuring efficiency in Field Audit Offices (FAOs) in theDepartment of the Auditor General of Pakistan. Of late, theDepartment is under considerable pressure both from withinitself and also from the various clients it serves toimprove its efficiency. The legislators and executive headsof the governments are asking for the audits which areprofessionally competent and which also add value to thesociety at large. The gap between what the society expectsthe state auditors to perform and what the auditors thinkabout their own role is widening with the passage of time.The auditors are complaining that they do not have adequatephysical and financial resources to meet the challenge,while the clients of the department and the government thinkthat the department is wasting its resources and is doing a‘useless’ work with very little utility. In this scenario,where the need of more resources cannot be denied, thedepartment also needs to do some soul searching. The fact isthat the department has never tried to measure its ownefficiency either at the level of individuals or at theorganizational level. The department is operating like anyother public sector organization with all the handicaps andbuilt-in inadequacies. The department of the Auditor Generalis supposed to act as a watchdog of the other departments.1?* document.doc
With the addition of performance auditing into its role, ithas also started commenting on the economy and efficiency ofother departments. While it is a welcome addition to therole of the traditional role of government auditors, it hasalso made them more vulnerable. Those who try to evaluatethe efficiency of others must not display significantinefficiencies in their own operations. That is why, theAuditor General’s department should emerge as an office ofhighest efficiency and excellence. For this purpose a highdegree of efficiency-consciousness is necessary among theofficers of the department. The present paper tries todevelop a system of efficiency measurement in the FieldAudit Offices. At present no such system exists. As aresult, the efficiency of the offices is not measured. Noone can say with any precision about the quality andefficacy of the work done by an office or its officers. Inthis scenario, some people are able to score a highermileage not because of actual output but by their acumen toinfluence their audience. Also, those who are really hardworking but cannot do enough of “marketing” for their work,seem to have not done enough. As a result, it is difficultto define merit and excellence. Such a situation promotes avalue system that is conducive to cronyism and corruption.The present paper is an attempt to devise a mechanism thatdefines merit in as objective terms as possible.
2. THE CHALLENGE OF DEVELOPING A COMPOSIT INDEX OF EFFICIENCY
While trying to devise a suitable mechanism for an auditoffice, the real challenge is to develop a compost index ofefficiency. In the literature on performance measurement,there is hardly anything on the efficiency of governmentaudit offices. The usual symbols of efficiency in an auditoffice in Pakistan are number of audit observations, numberof audit reports, recoveries affected at the instance ofaudit and the number of audit paragraphs printed in theaudit report. Although these variables are valuable but theydo not tell the entire story. For example, they do not tell
2

anything about the cost of audit, time taken to develop theaudit observations, the ratio of resources expended onfinancial audit and performance audit, resources spent ondeveloping audit infrastructure for improving theeffectiveness of office in the long run, etc. Thus there isa need for developing an index of efficiency that takes careof multiple aspects of efficiency. A further challenge is toreduce all the variables to one common denominator so thatthey can be interpreted. Another problem is to express ajudgement on the importance of different variables. Thisrequires assigning weights to different variables. By itsvery nature such a task is subjective. But we have stilladopted this method, since having subject and measurableweights is better than not having any system of measurement.If we apply the subject weights consistently the bias isneutralized to some extent.
3. SCOPE
The present paper covers the economy and efficiency aspectsand does not include effectiveness aspects. Theeffectiveness of a FAO has several dimensions and itsmeasurement requires much extensive data than can becollected economically in the present scenario. It will be asubject of some future exercise.
The present paper covers the efficiency of the FAOs and notindividuals working in these offices. We shall address tothe question of individual efficiency in a subsequent paper.
4. PARAMETERS OF EFFICIENCY
The parameters of efficiency of a FAO are as follows:
Output Parameters
Quantitative Output Quality of Audit
3

Developing Management Infrastructure
Input Parameters
Number of person days consumed Cost of audit operations
As we shall illustrate later, we shall adopt person years asthe main determinant of efficiency in each case. Therefore,it will not emerge as an independent index efficiency.
We shall elaborate these parameters in the following discussion.
4.1 Quantitative Output
The quantitative output of a FAO consists of the following:
Number of audit reports printed for the PAC Work-in-progress
4.1.1 Number of Audit Reports
The number of audit reports prepared by a FAO is theforemost indicator of its performance. But since auditassignments differ in size, significance, and scope of work,it is not possible to adopt the number of audit assignmentsas a variable for comparing the efficiency of two FAOs.Moreover, it will generate a tendency to increase the numberof audit reports on flimsy grounds. Therefore, we need toadopt a more uniform variable, keeping intact the issue ofaudit reports printed by a FAO. We think, the Audited/Expenditure (AE) is a more uniform measure. It is not underthe absolute control of the FAO also, although the FAOs havea limited flexibility to increase or decrease the coverageof AE. Thus we can adopt the AE of the audits completed andprinted as audit reports as one variable.
4

4.1.2 Work-in-progress
At the close of a year, every FAO will have some work done in the pipeline. We should take that into account. Or this purpose, following factors may be adopted to convert the work-in-progress (WIP) into complete audit reports:
Audits only planned: 10% of the AE of the planned audit
Audits in progress 20 % Audits completed but AIR not issued to the auditee
35% Audits completed and AIR issued to the auditee
50% Audit Report issued to the PAO 75% Audit Report approved by the AGP 85% Audit Report sent to press 95%
Once we are able to add up the AE we can work out a ratio ofAE with person days and cost of audit.
For performance audits we can use these percentages to addup to the number of performance audit reports instead of theAE.
4.2 Quality of Audit
4.2.1 It is very difficult to measure quality of auditdirectly. We have to adopt a proxy measure. One such measurecould be the extent of supervision of audits. We can adoptthe person-days spent on audit supervision by the DeputyDirector, Directors or Directors General. Information onthis will be available from their tour/ local visitsprogram, which should be documented properly. This can becompared with the planned supervision person-days and anindex can be calculated.
4.2.2 Recoveries made at the instance of audit
5

One important indicator of quality of audit is the amount ofrecoveries made at the instance of audit. This can becompared with the cost of audit. We can then say for eachrupee spent on audit led to so many rupees of recoveries.
4.2.2 Savings made on recommendations of audit
Another indicator of quality of audit is to the acceptanceof audit recommendations by the executive leading tosavings. This can then be compared with the cost of audit.We can then say that for each rupee spent on audit led to somuch saving in terms of government expenditure.
4.3 Management Infrastructure
It consists of the FAO's efforts in three areas:
Development of master files Arrangement for weeding out old records System for keeping the office manuals updated
It is difficult to measure output on this count directly.Therefore, we need to adopt a proxy measure. We think allthese areas are equally important. Therefore, we cancalculate an efficiency by dividing the planned person-daysby actual person-days spent on these activities.
5. ANALYSIS
5.1 Number of Person-days consumed on various activities
This will be the most important input measure. It will meanadding up all the working days of the staff from B-5 to B-20in a FAO. We should classify the entire time into variousactivities. For example, first we should calculate the timefor regularity audit. The time planned for regularity auditwill be the time net of other activities, such asadministration, audit of Foreign Aided Projects (FAP), ThirdParty Validation of SAP (TPV) and Performance Auditing.
6
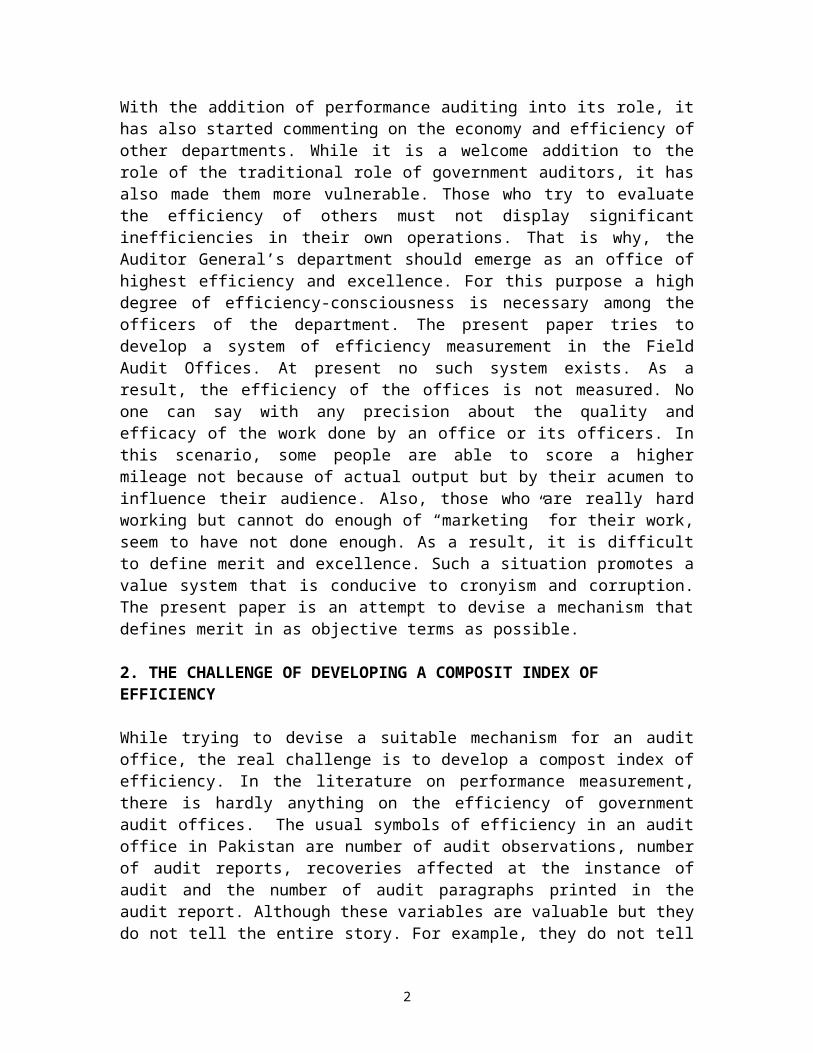
5. 2 Cost of Audit
It is a simple concept. The total budget of a FAO is thecost of audit. But for applying this concept to efficiencymeasurement, we need to refine it. The FAOs carry outseveral types of audits, like regularity audit, specialaudit, audit of foreign aided projects, Third partyValidation, audit of SAP expenditure, special assignmentsrequiring detailed investigations, etc. Therefore, we needto find out a mechanism for allocating cost to variousactivities. We do not have detailed cost accounting system.Therefore, it is not possible to have a precise and refinedallocation system of cost. In the present scenario, tryingto develop a cost accounting system will be self-defeatingand the whole exercise of efficiency measurement willsuffer. Therefore we can adopt a proxy system of allocatingcost. We can adopt the concept of Average Cost of a Person Day(ACPD). This can be determined by dividing the total budgetof an office by the total number of person days for auditactivities. It means we shall first calculate the totalnumber of staff from B-5 to B-20, multiply it with thenumber of working days in a year and divide the total budgetof the FAO by these working days. This will give us AverageCost per Person Day (ACPD). The ACPD can then be used toallocate cost to various types of audit activities accordingto the number of person days required by each activity.
6. HYPOTHETICAL EXAMPLE OF PERFORMANCE MEASUREMENT OF AFIELD AUDIT OFFICE
Planned Data
Actual Data
Total Budgeted of the Auditee Formations:
75000 M 78000
Total number of formations 836 836Budget /Expenditure of the 28000 M 32000
7

Formations included in the audit plan No. of auditee formations 380 360Person days available with the FAO (B5- B-20)
32000 30500
Budget of the FAO 24 M 25MNo. of regularity audit reports 9 6Average time for one audit assignment*
24 weeks 30 weeks
AE of regularity audit reports 22000 M 18000MWIP at the end of the year 6000 M 4000Performance Audit Reports 3 1Person days for regualrity audit
16000 18000
Person days for performance audit
4000 2400
Average time for one performance audit report*
20 weeks 28 weeks
Person days for SAP TPV 3200 3600Sites for validation 280 225Absenteeism cases 325 280Procurement cases 115 105Recruitment 70 65Person days for FAP 2800 2000No. of projects 45 30Person days for administration & co-ordination, etc
6000 4500
Person days for Supervision [included in Regularity Audit Time ]
3200 2800
No. of audits supervised 125 90Person days for Audit Management Infrastructure [included in Administration & Co-ordination Tim]
800 300
* It means the time taken for all stages of audit, from planning through printing of the report. This will be
8

relevant to those reports, which have been printed. Work in progress will not be considered for this purpose.
7. ANAYLYSIS
7.1 Quantitative Outputs:
(a) AE Ratio: Actual AE/ Planned AE= 22000 / 28000 = 0.79 [Ratio 1]
(b) Cost of Regularity Audit:
Average Cost of Person day = Planned: Rs 24000,000 /32000 = Rs 750
Actual: Rs 25000,000 /30,500 = Rs 820Total planned cost of Regularity Audit: 16000 x 750 = 12 MTotal actual cost of Regularity Audit 18000 x 820 = 14.75 MRegularity Audit Cost Ratio: 12 /14.75 = 0.81
[Ratio 2]
(c) Timeliness of Regularity Audit:Average planned time for completing one audit assignment: 24weeksAverage actual time for completing one audit assignment: 30Average delay: 30 - 24 = 6 weeksEfficiency in finalizing the audit assignment [ 1- (6 / 24 ) ] = 0.75 [Ratio 3]
(d) Overall Efficiency Index in Regularity Audit: 0.81 x 0.79 x 0.75 = 0.48 [Index 1]
(e) AE person day ratio:
AE planned per person day: 28000 / 16000 = 1.75 M per personday
9

AE actual per person day: 22000/ 18000 = 1.22 M per person day
AE Person day Efficiency Ratio: 1.22 /1.75 = 0.70 [Ratio 4]
(f) Cost of Performance Audit
Total planned cost of performance audits: 4000 x 750 =Rs 3000,000Total actual cost of performance audit: 2400 x 820 = Rs 1968,000Achievement in terms of reports: 1/ 3 = 0.33Average planned cost of producing one performance audit report: 3000,000 /3 = 1000,000Average actual cost of producing one performance audit report: 19680000Performance audit cost ratio: 1000,000/ 1968000 =0.51 [Ratio5]
(g) Timeliness of performance audit:
Average planned time for finalizing a P.A. = 20 weeksAverage actual time for completing a P.A = 28 weeksAverage delay = 8 weeksEfficiency in finalizing a P.A. = [ 1 - (8 /20 ) ] = 0.60 [Ratio 6 ]
(f) Overall Efficiency Index in Performance audit: 0.33x 0.51 x 0.60 = 0.10 [Index 2]
(g) Social Action Program Third Party Validation Work
Site verification ratio: 225/280 = 0.80Absenteeism ratio: 280/325 = 0.86Procurement cases: 105/115 = 0.91Recruitment cases: 65/70 = 0.93Overall achievement in SAP TPV Work: (0.81+0.86+0.91+0.93) /4 = 0.88 [Ratio 7]
10

(h) SAP Cost ratio: (3200 x750) / (3600 x820) =0.81[Ratio 8]
(i) Overall Efficiency Index in SAP= 0.88 x 0.81 = 0.71 [Index 3]
(j) FAP Efficiency Formations audited: 30Formations planned for audit3=45 Achievement rate: 30/45 = 0.66
[Ratio 9]
(k) Cost Efficiency in FAP Work: (2000 x750)/(2800 x820) =0.65 [Ratio 10]
(l) Overall Efficiency Index in FAP = 0.66 x0.65 = 0.43[Index 4]
(m) Contribution of Audit
1. Recoveries: Cost ratio
This ratio measures the relationship between recoveries madeat the instance of audit and the cost of audit. It will be worked out as follows:
Recovery: Cost Ratio = 1 - (Total Cost of Regularity Audit/ Total Recoveries at the Instance of Audit), where the amountof recoveries is larger than the cost of audit. Where the recoveries are less that the cost of audit, this ratio will be ignored.
2. Savings: Cost ratio
This ratio measures any savings caused by accepting theadvice of audit. This will usually be the case in respect ofperformance audit reports. Therefore, the cost figure inthis ratio will be the cost of performance audit. although
11

it does not debar us from adopting the figure of cost ofregularity audit, if the recommendation was made by theregularity audit and accepted by the auditees.
Savings: Cost ratio = 1 - (Total Cost of Performance Audit/Total Savings on the Recommendation of Audit), where theamount of savings is larger than the cost of audit. Wherethe savings are less that the cost of audit, this ratio willbe ignored.
7. 2 Quality of Audit
(a) Supervision -Person days Ratio: 2800/3200 = 0.88[Ratio 11]
(b) Supervision Coverage ratio: 90/125 = 0.72[Ratio 12]
(c) Overall Supervision Efficiency Index: 0.88 x 0.72 = 0.63 [Index 5]
6.3 Audit Management Infrastructure
(a) Infrastructure Achievement ratio: 300/ 800 = 0.38 [Ratio 13]
8. OVERALL ASSESSMENT
We have calculated 13 ratios. By using these ratios we haveworked out 5 efficiency indices. But since all activitiesare not of equal importance, we think, we should assign someweights to various efficiency indices. In the followingtable column 3 has a set of suggested weights. They arepurely for illustrative purposes.
Particulars Efficiency Index
Weight WeightedIndex
Regularity 0.48 0.40 0.19
12

AuditPerformance audit
0.10 0.20 0.02
SAP TPV Work 0.71 0.15 0.11FAP work 0.43 0.10 0.04Supervision 0.63 0.10 0.06Management Infrastructure
0.38 0.05 0.02
Total 0.44
Overall Efficiency of the FAO = 44%____________________________________
The conclusion is that if we have arrangements forcollecting necessary data on planned and actual achievementsof a FAO we are able to determine its efficiency, howsoevercrude it may be. It will still be better than mereconjectural assertions.
9. APPLYING THE METHODOLOGY IN THE FIELD AUDIT OFICES
The next question is: how do we apply this methodology inthe FAOs. It requires collection and validation of a largeamount of data. As a practical measure, the FAOs should beinformed in the beginning of the year about the parameterson which they would be evaluated. They should then be askedto maintain necessary record for collecting information onvarious variables. At the year-end, the FAOs shouldsummarize the information for each variable and submit it tothe Auditor General’s office. The Deputy Auditor Generalconcerned should then visit each FAO and ask it to produceevidence in support of the information submitted by theoffice. The task of the Deputy Auditor General is that of anauditor. He has to verify most of the information presentedby the office with reference to the original documentsmaintained by it. This is a detailed exercise and can takemore than a day. At the end of the examination, the DeputyAuditor General should tick off all valid information andengage one of his assistant to work out various ratios. For
13
the facility of the FAOs, we have provided specimens of theforms required for submitting summary to the AuditorGeneral’s.
Once the Deputy Auditor General completes his round of all FAOs and prepares the analysis of various ratios, it would be possible to present the results in the form of a spreadsheet and place different offices in comparison to oneanother. This spreadsheet can, then, also become basis for any incentives, rewards or prizes to be given by the AuditorGeneral for better performing offices.
It is important to add here that the forms annexed to thispaper are only a summary information. The information inthese forms cannot be provided until every FAO has adetailed information, which is kept updated on a dailybasis. For this purpose, each FAO must set aside human andphysical resources. Preferably, the FAOs should create asmall cell responsible for monitoring of the plan. This cellshould maintain detail information, either manually or oncomputer, which should be summarized for the office ofAuditor General on the forms annexed with paper.
10. CONCLUDING REMARKS
The performance measurement system proposed in this papershould be taken with a grain of salt. The performance of anorganization or a person is determined by a host of factors.Some of these factors , such as will to work, properorganization of assignments, discipline and sense of urgency, are in the control of a person or an organization. Butsome of these factors are beyond one’s control. Examplesare: lack of financial and human resources, poor incentivesystem, and inadequate salary structure, lack of appropriatetraining facilities, political interference and humantemperaments, etc. Although performance measurement is acurrent rage in the administration theory, yet not muchattention has been given to the impact of these controllableand non-controllable factors. The moral of the story is that
14

it is very easy to draw conclusion about the efficiency ofan organization but rather difficult to understand andanalyze reasons for the particular level of efficiency. Itis imperative, therefore, that once the above analysis ismade, the Deputy Auditor General concerned should hold adetailed session with the field audit office to analyze thelevel of efficiency achieved by that office. The ultimatedecision regarding the performance of an office should beseen in the light of the review session.
15

Evaluation-1
EVALUATION OF FIELD AUDIT OFFICES
GENERAL INFORMATION
NAME OF THE AUDIT OFFICE
------------------------------------------------
YEAR: October 19----September 19----
Particulars Planned2 Actual RemarksTotal No. of Assignments of RegularityAudit3
Total No. of Formations Total Expenditure/Income audited4
Total No. of Available person-days (B-5 to B-20)
*5
2 It means the data provided in the original approved plan. Please ignore all subsequent revisions for the purpose of evaluation of your office.3 Also include any special assignments relating to regularity audit4 It means the total of expenditure or income audited in case of government organizations. It does not mean the total of the sample. In case of organization which keep accounts on double entry basis and prepare a balance sheet and an income statement, it means total of all assets plus total of all expenses. Include any special assignments relating to regularity audit.5 Please account for any transfers without replacements, leave by the staff and officers as actually availed or posting in of any personnel.
16

Total Budget/Expenditure of the FAONo. of Regularity Audit Reportsprinted by the FAOPerson-days Spent on Regularity Audits (All Assignments)6
Person-days spent on Performance Audit7
No. of P.A. AssignmentsPerson-days spent on SAP(TPV)8
Person-days spent on SAP (FA)9
Person-days spent on FAPSites for validation under SAP TPV
7 It will include time spent on all stages of P.A. Include any special assignments pertaining to performance audit.8 It will include time spent on all stages of TPV.9 It will include time spent on all stages of SAP (FA).
17

Absenteeism Cases for Validation under SAP TPVProcurement cases for validation under SAP (TPV)Recruitment cases for validation under SAP TPVNo. of Projects under FAPPerson-days spent on Supervision10
No. of Auditssupervised 11
Person-days for Administration & Co-ordination workPerson-days for master files
11 It refers to the number of formations where the supervisory officer went.
18

Person days for weeding out old recordPerson days for updating office manualsRecoveries made at the instance of audit12 Savings affected on the advice ofaudit13
12 Recoveries made during the period under report, even though were pointed out in earlier audit reports. Please give only actual figures. This cannot be planned.13 Please give actual figures only. There cannot be any planned figure. Also support it with evidence.
19

Evaluation-2
EVALUATION OF FIELD AUDIT OFFICES
DATA ON ASSIGNMENTS COMPLETED14
POSITION AS ON 30.9.19----
Title/No. ofAssignment
Planned Actual
Person-days
Expenditure/IncomeAudited
Calendar
days15
Person-days
Expenditure/
Income
Audited
Calendardays
Total
20

6 Fill in Form Evaluation-2. The time spent on Regularity Audit will include all time spent on various stages of Regularity Audit from planning to printing of the reports. It will also include time in the processing of the reports, DACs, Pre-PACs, PACs, and inter-departmental meetings, etc.
10 It refers to the supervision in the field by officers like Deputy Directors/ Directors/ Directors General. This is already included in various categories of person-days enumerated above. The person-days under regularity audit stated above will include the time for supervision. At this stage, we mention it as a part of the total mentioned above.14 Assignment includes all types of assignments such as regularity audit, performance audit, SAP TPV, special assignment. Please mention them in blocks of information under proper headings. Classify any special assignment into regularity audit, performance audit and others as the case may be.
21

Evaluation-3
EVALUATION OF FIELD AUDIT OFFICES
DATA ON AUDIT ASSIGNMENTS IN PROGRESS
AS ON 30.9.19----
Title of Assignment Total ExpenditureAudited
Stage ofWork16
Stages of Work;
1. Audits only planned2. Field work in progress3. Audit completed but Audit Inspection Report not yet
issued4. Audit completed and Audit Inspection Report issued to the
auditee5. Audit Report issued to the principal accounting Officer6. Audit Report approved by the Auditor General7. Audit Report sent to press for printing
15 It means the time from planning of audit assignment to printing of the audit report.16 Please indicate the stage no. from the list given below.
22