Multiscale modeling of the atmospheric fate and transport of mercury
ACPD10, 30279–30303, 2010
Measurements ofatmospheric mercuryin Shanghai during
September 2009
H. R. Friedli et al.
Title Page
Abstract Introduction
Conclusions References
Tables Figures
J I
J I
Back Close
Full Screen / Esc
Printer-friendly Version
Interactive Discussion
Discussion
Paper
|D
iscussionP
aper|
Discussion
Paper
|D
iscussionP
aper|
Atmos. Chem. Phys. Discuss., 10, 30279–30303, 2010www.atmos-chem-phys-discuss.net/10/30279/2010/doi:10.5194/acpd-10-30279-2010© Author(s) 2010. CC Attribution 3.0 License.
AtmosphericChemistry
and PhysicsDiscussions
This discussion paper is/has been under review for the journal Atmospheric Chemistryand Physics (ACP). Please refer to the corresponding final paper in ACP if available.
Measurements of atmospheric mercury inShanghai during September 2009
H. R. Friedli1, A. F. Arellano Jr.1,3, F. Geng2, C. Cai2, and L. Pan2
1Atmospheric Chemistry Division, National Center for Atmospheric Research, P.O. Box 3000,Boulder, CO 80307, USA2Shanghai Meteorological Bureau, Shanghai 200135, China3now at: Department of Atmospheric Sciences, University of Arizona, P.O. Box 210081,Tucson, AZ 85721, USA
Received: 11 November 2010 – Accepted: 22 November 2010 – Published: 13 December2010
Correspondence to: H. R. Friedli ([email protected])
Published by Copernicus Publications on behalf of the European Geosciences Union.
30279

ACPD10, 30279–30303, 2010
Measurements ofatmospheric mercuryin Shanghai during
September 2009
H. R. Friedli et al.
Title Page
Abstract Introduction
Conclusions References
Tables Figures
J I
J I
Back Close
Full Screen / Esc
Printer-friendly Version
Interactive Discussion
Discussion
Paper
|D
iscussionP
aper|
Discussion
Paper
|D
iscussionP
aper|
Abstract
We report on total gaseous mercury (TGM) measurements made in Pudong, Shanghaiin August/September 2009. The average TGM was 2.7±1.7 ng m−3. This representsabout 90% of the total atmospheric mercury. This is an underestimate for an annual-mean concentration because the meteorology in September favored predominantly5
easterly oceanic air, replaced in other seasons by airflow from industrial areas. Theobserved TGM follows a pattern seen in other cities around the world: a backgroundelevated over mean hemispheric background (1.5 ng m−3), and pollution plumes of dif-ferent magnitude and duration, interspersed with very sharp spikes of high concentra-tion (60 ng m−3). The September 2009 Shanghai measurements are lower than those10
reported for most other Chinese cities and Mexico City, and similar to concentrationsfound in some Asian and in North American cities. Such comparisons are tenuousbecause of differences in season and year of the respective measurements. We findthat the observed TGM are most likely coming from coal fired power plants, smeltersand industrial sources, based on its high correlation with NOx, SO2, CO and wind di-15
rections.
1 Introduction
China has become a fast economical growth country in recent years. The ongoingindustrialization of China has caused rapid expansion of power demand and basicmaterials production, two processes which result in increased release of mercury to20
the atmosphere (Pirrone et al., 2010). This has significant regional and global conse-quences: direct emissions and evasion from previously deposited mercury affect theregional atmospheric concentration, and lofted pollution plumes exported eastwards bythe warm conveyor belt impact Northern Hemispheric (NH) concentrations.
The ecological concern of mercury pollution is its toxicity. The most important toxic25
form of mercury, neurotoxic methyl mercury, is formed by the conversion of ionic
30280

ACPD10, 30279–30303, 2010
Measurements ofatmospheric mercuryin Shanghai during
September 2009
H. R. Friedli et al.
Title Page
Abstract Introduction
Conclusions References
Tables Figures
J I
J I
Back Close
Full Screen / Esc
Printer-friendly Version
Interactive Discussion
Discussion
Paper
|D
iscussionP
aper|
Discussion
Paper
|D
iscussionP
aper|
mercury in water bodies and bio-accumulation through the food chain into fish (NRC,2000). Other exposure to humans and animals is by consumption of grains and vegeta-tion (Zhang et al., 2010) containing mercury accumulated from wet and dry depositionto plants and soil, or uptake from heavily contaminated soil. Inhalation of gaseous ele-mental mercury is hazardous in cases of gross exposure, e.g. in artisan gold production5
or mercury mining.Atmospheric mercury exists in three operationally-defined species with distinctly dif-
ferent physical properties and distributions. Gaseous elemental mercury (GEM) in theNorthern Hemisphere averages about 1.5 ng m−3 and accounts for about 95–97% ofall tropospheric mercury. GEM has low chemical reactivity and water solubility, low de-10
position rate and accordingly exhibits a long atmospheric lifetime of 0.5 to 2 years de-pending on the environment. The other two major atmospheric species, gaseous ionicmercury (mostly called RGM or reactive gaseous mercury) and mercury contained inaerosol (particulate Hg or pHg) are more water soluble, more readily washed out andhave shorter lifetimes of days to weeks and therefore are deposited closer to emission15
sources. The sum of the rural background concentration for these two species is in therange of 3–5% of the total mercury loading, but the contributions from point source canbe much higher.
For China, including Shanghai, the major mercury sources to the atmosphere arecoal combustion, i.e. coal fired power plants (CFPP), industrial boilers and domestic20
use, emissions from smelters (mostly Zn, Pb, Cu, Au) and incinerators, manufacturing(cement, iron and steel, batteries and lamps), and transportation releases from roadsand harbors (Streets et al., 2005). The wind direction in Shanghai is strongly seasonalresulting in exposure of mercury from different anthropogenic sources. During theharvesting season, the Shanghai area is affected by mercury from biomass burning25
emissions carried by southerly winds (Wang et al., 2002). As deposition from RGMand pHg from point sources is high in China (Selin et al., 2007), soil evasion drivenby insolation and wind becomes a significant contributor to mercury in the surface airlayer.
30281

ACPD10, 30279–30303, 2010
Measurements ofatmospheric mercuryin Shanghai during
September 2009
H. R. Friedli et al.
Title Page
Abstract Introduction
Conclusions References
Tables Figures
J I
J I
Back Close
Full Screen / Esc
Printer-friendly Version
Interactive Discussion
Discussion
Paper
|D
iscussionP
aper|
Discussion
Paper
|D
iscussionP
aper|
Data on atmospheric mercury exist for many Chinese cities (see Table 3) but weare not aware of published gas phase mercury data for Shanghai. Here, we presentatmospheric mercury measurements taken as part of an exploratory campaign calledMegacity Impacts on Regional And Global Environments (MIRAGE-Shanghai 2009,http://www.acd.ucar.edu/mirage). MIRAGE-Shanghai 2009 was conducted in collabo-5
ration with the Shanghai Meteorological Bureau (SMB). The goal of the campaign is toassess pollution and its precursors in preparation for detailed possible fieldwork in thefuture. The main objective of the mercury component of this campaign was to continu-ously measure atmospheric mercury during August/September 2009 in SMB, Pudong,Shanghai. Total gaseous mercury (TGM) measurements were taken using a Tekran10
2537A instrument and correlated with simultaneous meteorological (wind direction andspeed) and chemical (CO, SO2, NOx) measurements, in order to elucidate meteorolog-ical patterns and potential mercury source types. The Shanghai TGM results are thencontrasted with those from other regional and global observations to provide broadercontext of the measurements.15
2 Methods
2.1 Sampling site
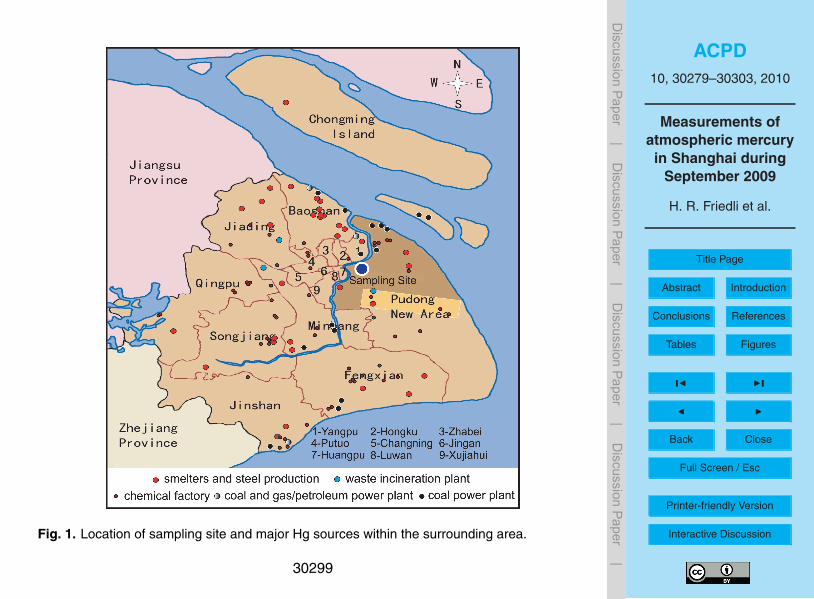
Continuous TGM samples were collected and analyzed on the top of the SMB build-ing in August/September 2009. The sampling point is located at 31◦ 13′ 48′′ N and121◦ 32′ 24′′ E at an altitude of 19 m a.s.l. (see Fig. 1). SO2, NOx, CO and wind were20
measured at the same site as part of the ongoing data record for this station. The build-ing is bordered by a large city park to the south, a green belt of conifers and deciduoustrees along the streets, and major traffic arteries to the north and west. It is surroundedby high-rise buildings in the north, south, and west, while the east is devoid of largebuildings. It is also in proximity to numerous mercury sources as indicated in Fig. 1,25
with the sources classified as coal combustion, smelters and industrial.
30282
ACPD10, 30279–30303, 2010
Measurements ofatmospheric mercuryin Shanghai during
September 2009
H. R. Friedli et al.
Title Page
Abstract Introduction
Conclusions References
Tables Figures
J I
J I
Back Close
Full Screen / Esc
Printer-friendly Version
Interactive Discussion
Discussion
Paper
|D
iscussionP
aper|
Discussion
Paper
|D
iscussionP
aper|
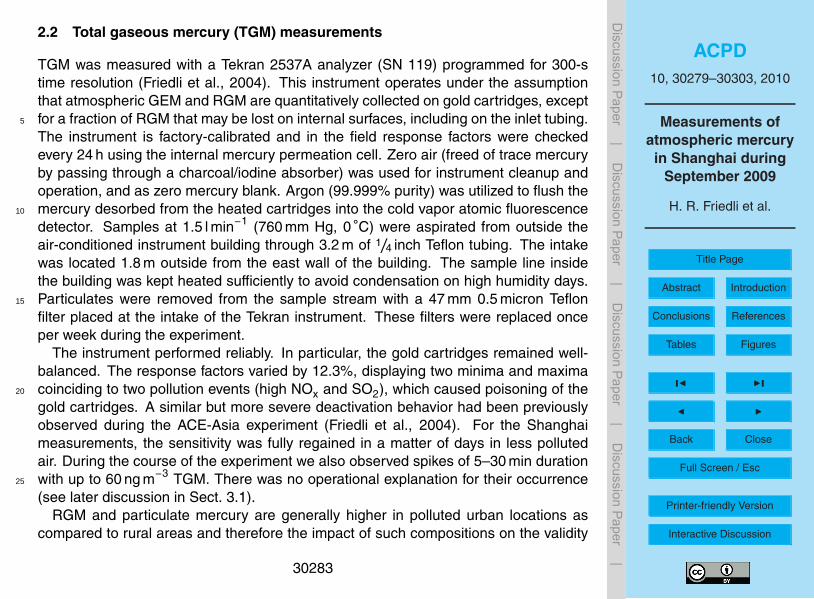
2.2 Total gaseous mercury (TGM) measurements
TGM was measured with a Tekran 2537A analyzer (SN 119) programmed for 300-stime resolution (Friedli et al., 2004). This instrument operates under the assumptionthat atmospheric GEM and RGM are quantitatively collected on gold cartridges, exceptfor a fraction of RGM that may be lost on internal surfaces, including on the inlet tubing.5
The instrument is factory-calibrated and in the field response factors were checkedevery 24 h using the internal mercury permeation cell. Zero air (freed of trace mercuryby passing through a charcoal/iodine absorber) was used for instrument cleanup andoperation, and as zero mercury blank. Argon (99.999% purity) was utilized to flush themercury desorbed from the heated cartridges into the cold vapor atomic fluorescence10
detector. Samples at 1.5 l min−1 (760 mm Hg, 0 ◦C) were aspirated from outside theair-conditioned instrument building through 3.2 m of 1/4 inch Teflon tubing. The intakewas located 1.8 m outside from the east wall of the building. The sample line insidethe building was kept heated sufficiently to avoid condensation on high humidity days.Particulates were removed from the sample stream with a 47 mm 0.5 micron Teflon15
filter placed at the intake of the Tekran instrument. These filters were replaced onceper week during the experiment.
The instrument performed reliably. In particular, the gold cartridges remained well-balanced. The response factors varied by 12.3%, displaying two minima and maximacoinciding to two pollution events (high NOx and SO2), which caused poisoning of the20
gold cartridges. A similar but more severe deactivation behavior had been previouslyobserved during the ACE-Asia experiment (Friedli et al., 2004). For the Shanghaimeasurements, the sensitivity was fully regained in a matter of days in less pollutedair. During the course of the experiment we also observed spikes of 5–30 min durationwith up to 60 ng m−3 TGM. There was no operational explanation for their occurrence25
(see later discussion in Sect. 3.1).RGM and particulate mercury are generally higher in polluted urban locations as
compared to rural areas and therefore the impact of such compositions on the validity
30283
ACPD10, 30279–30303, 2010
Measurements ofatmospheric mercuryin Shanghai during
September 2009
H. R. Friedli et al.
Title Page
Abstract Introduction
Conclusions References
Tables Figures
J I
J I
Back Close
Full Screen / Esc
Printer-friendly Version
Interactive Discussion
Discussion
Paper
|D
iscussionP
aper|
Discussion
Paper
|D
iscussionP
aper|
of measurements made with a Tekran instrument must be considered. Part of RGMmay not be accounted for because of its stickiness to tubing and filters and its variabilitycould introduce hysteresis effects. Speciated RGM measurements in Chinese (Shanget al., 2003) and other cities indicate that, except in cases of extreme point sources,RGM always remains in the pg m−3 range as contrasted to GEM in ng m−3 and thus5
accounts for a small fraction of the total gaseous mercury. In the case of pHg, theparticulates are predominantly >1.6 micron and therefore are kept out of the Tekraninstrument by the filter. The contribution of pHg to the mercury budget in Shanghaican be estimated from the extensive measurements by Xiu et al. (2009) of mercury inparticles in the ambient air. The total particulate mass (TPM) in Shanghai seasonally10
varies by a factor of about 3 in the Xiu et al. (2009) data set and is large under pollutedconditions but its mercury content varies only from 1.5 to 2.5 ppm. Compared to theTGM average of 2.7±1.7 ng m−3 (see results in Sect. 3) and an average of 0.27 ng m−3
of pHg (Xiu et al., 2009), the average contribution of pHg to the mercury mass balanceis 9.1%. Based on these arguments, we conclude that the TGM measurements ac-15
count for at least 90% of the atmospheric mercury observed and can be consideredas a reasonable representation for atmospheric mercury at the sampling site duringSeptember 2009.
2.3 Complementary measurements: NOx, SO2, CO and wind
These measurements were taken by the SMB staff using instrumentations described20
in Geng et al. (2009). NO-NO2-NOx was measured with a chemiluminescence tracelevel analyzer (TEL; Model 42iTL) programmed for 60-s time resolution. The Model42iTL operates on the principle that nitric oxide (NO) and ozone (O3) react to producea characteristic luminescence that is linearly proportional to the NO concentration. Itoperates in two flow modes, NO and NOx, where in the NOx mode the NO2 is first25
converted to NO. The instrument has a detection limit (DL) of 0.4 ppbv. CO was ob-served using an EC9830B/ECOTECH carbon monoxide analyzer programmed for 60-stime resolution. The analyzer generates infrared radiation (IR) that is absorbed by the
30284
ACPD10, 30279–30303, 2010
Measurements ofatmospheric mercuryin Shanghai during
September 2009
H. R. Friedli et al.
Title Page
Abstract Introduction
Conclusions References
Tables Figures
J I
J I
Back Close
Full Screen / Esc
Printer-friendly Version
Interactive Discussion
Discussion
Paper
|D
iscussionP
aper|
Discussion
Paper
|D
iscussionP
aper|
CO within the 5-m folded path length. The gas filter correlation wheel facilitates re-jection of interferences and the narrow band-pass filter ensures measuring only theCO-sensitive IR wavelengths. The analyzer had DL value of 0.05 ppmv. SO2 was mea-sured with a ML9850/ECOTECH analyzer, which is an ultraviolet (UV) fluorescencespectrometer designed to continuously measure low concentration of SO2 in ambient5
air, programmed for 60-s time resolution. The ML9850 analyzer comprises an opti-cal sensor assembly, an electronic signal preprocessor module, microprocessor-basedcontrol and computation electronics, and a pneumatic system that samples ambientair. The analyzer had DL value of 0.5 ppbv. The data for wind speed and direction wereobtained from a MILOS500 automatic weather station.10
3 Results and discussion
This section begins with a description of time series for TGM, CO, SO2, NOx, and windparameters (Sect. 3.1). This is followed by an assessment of the diurnal cycle anddetailed evaluation of three distinct segments of the time series: 1) background, whichis mostly at the beginning and end of the experiment under easterly flow conditions15
(Sect. 3.2), 2) a minor Hg plume event observed around 8 September (Sect. 3.2), and3) a major Hg plume event observed around 12 September (Sect. 3.2). Another Hgplume observed during the early part of the experiment (1 September) is not includedin the analysis due to lack of complete SO2 and NOx data during this period.
3.1 Time series for TGM, CO, SO2, NOx and wind20
3.1.1 Overall description
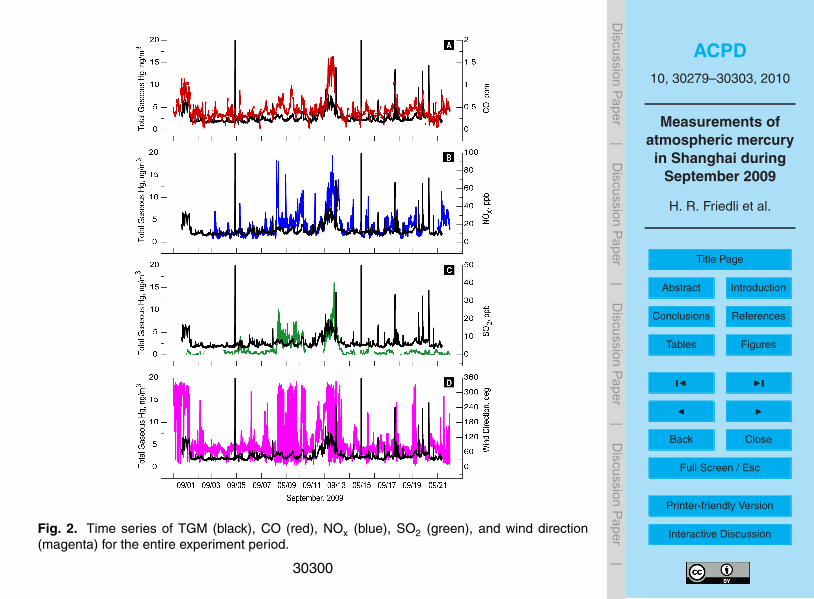
The time series for the period of 30 August to 22 September 2009 are plotted in Fig. 2.All data points are averaged to the 300-s time resolution of the TGM measurements.The statistics of the time series are summarized in Table 1. Overall, TGM at Pudong,
30285
ACPD10, 30279–30303, 2010
Measurements ofatmospheric mercuryin Shanghai during
September 2009
H. R. Friedli et al.
Title Page
Abstract Introduction
Conclusions References
Tables Figures
J I
J I
Back Close
Full Screen / Esc
Printer-friendly Version
Interactive Discussion
Discussion
Paper
|D
iscussionP
aper|
Discussion
Paper
|D
iscussionP
aper|
Shanghai during the experiment is characterized by: (1) a relatively well-defined back-ground and diurnal cycle, and (2) intermittent high concentrations that are mostly re-lated to changes in air parcels containing high levels of pollution.
The mean concentration for TGM is 2.7±1.7 ng m−3, which is higher than the meanvalue for the Northern Hemisphere of 1.5 ng m−3. The large standard deviation is in-5
dicative of the large variability in the TGM measurement. As clearly seen in Fig. 2, thevariability of TGM is strongly correlated with the wind direction. For this period, thedominant meteorology is an easterly airflow from China Sea and North Pacific Ocean.This represents a relatively clean and processed air largely contributing to the TGMbackground observed in the Pudong site. The change in the wind patterns (and other10
meteorological conditions) during the course of the entire experiment correlates wellwith the three clearly defined plume events and the more complex period during thelast third of the experiment.
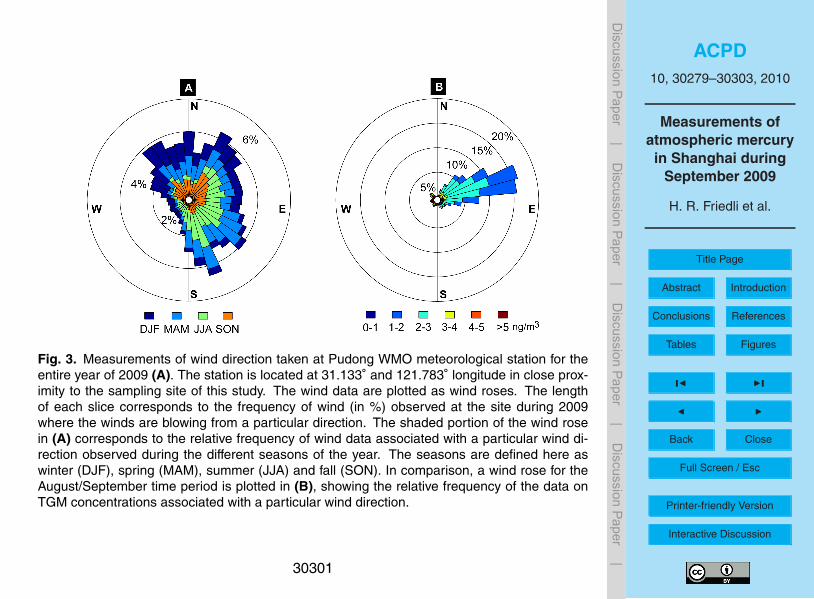
However, we should note that the meteorological patterns during the experiment onlyrepresent a small fraction of the annual-mean meteorological condition in this area. In15
particular, we find that the wind pattern changes quite significantly across the fourseasons of the year, with large fractions of wind directed from the northwest, southeastand northeast. These fractions are shown as wind roses in Fig. 3a. In comparison, thewind pattern during September is mostly northeasterly (Fig. 3b) resulting in relativelylow concentrations of TGM for this period. The TGM levels reflect the seasonality in20
CO and NOx levels observed in Shanghai by Ran et al. (2009), which reports maximumlevels of CO and NOx in winter and minima in summer.
Over the course of the experiment, we observed seven TGM spikes >10 ng m−3 ofshort duration (5–30 min) and values of up to 60 ng m−3. These spikes did not cor-respond with unique wind directions. Such events are common as they were also25
observed in many other cities (e.g. in Guiyang by Feng et al., 2004, in Toronto, Canadaby Song et al., 2009, and in Houston, TX by Brooks et al., 2009). One interpretationwould be short-term and intermittent high concentration pockets of Hg released nearthe measuring site that are not associated to combustion-related activities.
30286
ACPD10, 30279–30303, 2010
Measurements ofatmospheric mercuryin Shanghai during
September 2009
H. R. Friedli et al.
Title Page
Abstract Introduction
Conclusions References
Tables Figures
J I
J I
Back Close
Full Screen / Esc
Printer-friendly Version
Interactive Discussion
Discussion
Paper
|D
iscussionP
aper|
Discussion
Paper
|D
iscussionP
aper|
3.1.2 Diurnal variation
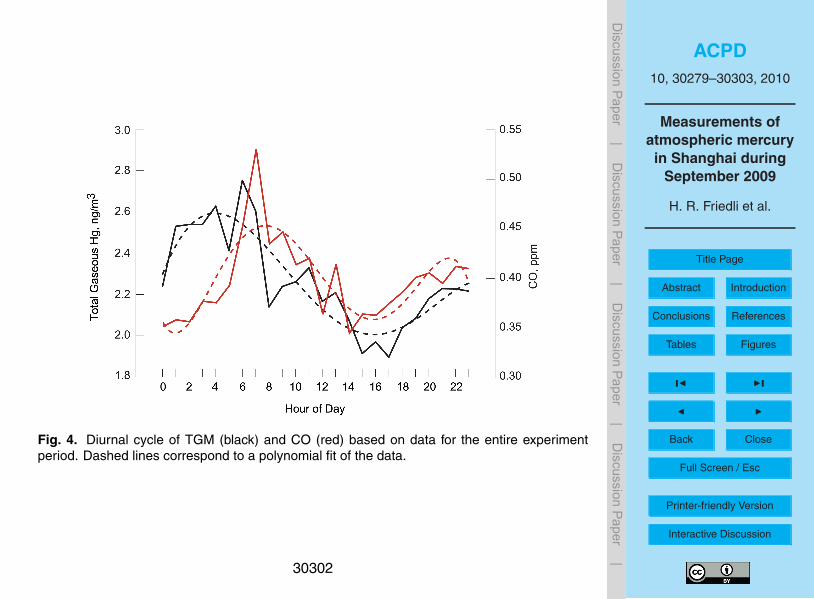
We present in Fig. 4 the diurnal cycle of TGM and CO as derived from the entire timeseries. The diurnal cycle is calculated as the median value for each hour of the timeseries. A polynomial fit to the derived data is shown to provide an overall trend. We findthat the observed TGM follows a clear diurnal cycle which is mainly a reflection of the5
background characteristic of TGM in the area. This is consistent with many other urbancases, which report similar strong diurnal variations in atmospheric Hg (e.g., Songet al., 2009). The observed CO also shows a diurnal cycle that is very consistent withthe changes during the day of the boundary layer and emission patterns, most notablyduring rush hours (e.g., Tie et al., 2007; Stephens et al., 2008; Ran et al., 2009). The10
CO diurnal cycle shows a major peak during the morning rush hours followed by a dropin concentration in the middle of the day due to the growth in the boundary layer height.A minor peak is observed in the evening as a result of the evening rush hours followedby a drop of the boundary layer height during the night. This diurnal pattern in COconcentrations is out-of-phase with the Hg diurnal pattern, which appears to coincide15
only to changes in the boundary layer height (Geng et al., 2007). We have not looked atthe diurnal cycles of observed NOx and SO2 because of incomplete data for the wholeexperiment. However, Ran et al. (2009) have reported seasonal diurnals for NOx inShanghai consistent with the CO diurnals of this work.
3.2 Background during the experiment20
The background is characterized by flow of aged easterly air low in NOx and SO2 thathas resided several days in the boundary layer over the ocean and contains a mean of2.4±1.2 ng m−3 TGM (see Table 1 and Fig. 5a). Back trajectories (not shown) trace theair parcels to Japan crossing over Korea 3 to 5 days earlier. This TGM value exceedsthe Northern Hemisphere mean value of 1.5 ng m−3 because at the measuring site25
the mercury background consists of the mercury contained in the advected air (Koreaand Japan), augmented by soil evasion from large previously deposited mercury (Selinet al., 2007), and contributions from small local sources.
30287

ACPD10, 30279–30303, 2010
Measurements ofatmospheric mercuryin Shanghai during
September 2009
H. R. Friedli et al.
Title Page
Abstract Introduction
Conclusions References
Tables Figures
J I
J I
Back Close
Full Screen / Esc
Printer-friendly Version
Interactive Discussion
Discussion
Paper
|D
iscussionP
aper|
Discussion
Paper
|D
iscussionP
aper|
3.3 Minor and major pollution plumes
The major plume event (see Table 1) exhibits the highest mean concentration of TGM,CO, SO2, and NOx. As shown in Fig. 2, correlations exist between TGM, wind direction,and the other pollutants, especially during the minor and major plume events. Here,we calculate the overall correlation factors with those in the minor and major plume.5
These factors are calculated based on a subset of the data where simultaneous mea-surements are available for all of the variables observed.
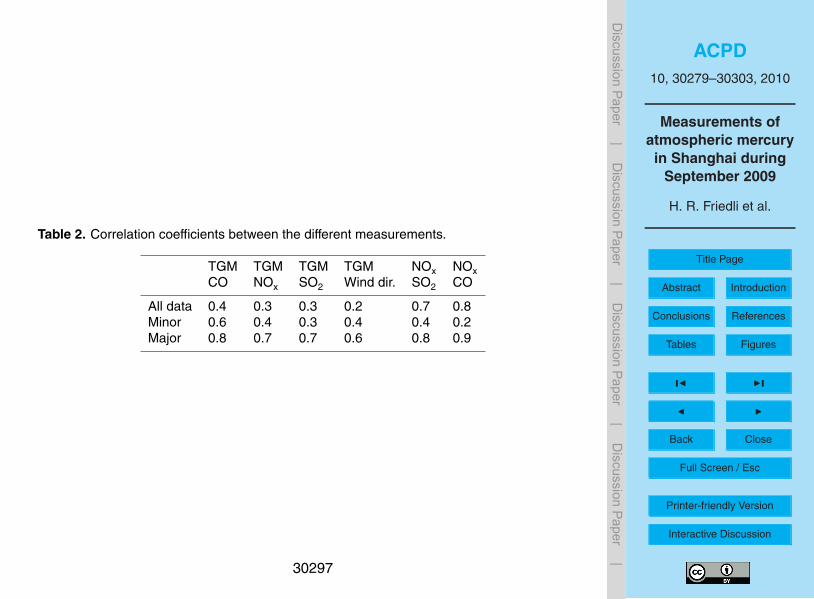
As shown in Table 2, the two plumes do not only show the highest concentrations(see Table 1) but also the highest correlation with TGM, decreasing from CO to NOxand SO2. While the correlation between TGM and CO is statistically higher than that10
with SO2 and NOx, the variability of TGM cannot be explained by the variability of COalone. There are cases in the time series wherein changes in TGM are not directlyassociated with the changes in CO, suggesting other sources in the variability of TGM.
A desirable outcome from these measurements would be the ability to identifysource receptor relationships as it has been accomplished for simpler cases with well-15
constrained sources (Rutter et al., 2009; Manolopoulos et al., 2007). For Shanghai inSeptember, Streets et al. (2005) have estimated that 71.4% of Hg comes from coalcombustion, 12.5% from smelters and 16.1% from others sources. However, the de-tailed compositions are not known. As noted above, we find that observed TGM ofthe major plume are very well-correlated with wind directions and combustion-related20
pollutants pointing along the pathways where Hg emitting industries are located. Inparticular, Fig. 5c in conjunction with Fig. 1, indicates that the high concentration ofHg in the major plume is directly related to the northwesterly and southwesterly air-flow pointing to nearby smelters and CFPPs in Shanghai as its sources. For example,TGM concentrations during the morning hours of 12 September 2009 peak at about25
7 ng m−3. They are associated with air parcels blowing from Northern Baoshan, wherea cluster of smelters and power plants are located. Back trajectories trace the airparcels to Baoshan 1 to 2 h earlier.
30288

ACPD10, 30279–30303, 2010
Measurements ofatmospheric mercuryin Shanghai during
September 2009
H. R. Friedli et al.
Title Page
Abstract Introduction
Conclusions References
Tables Figures
J I
J I
Back Close
Full Screen / Esc
Printer-friendly Version
Interactive Discussion
Discussion
Paper
|D
iscussionP
aper|
Discussion
Paper
|D
iscussionP
aper|
SO2 and NOx are the most relevant tracers for TGM. Here, we use the publishedemission ratios of NOx and SO2 and compare them with measured concentration ratios,to determine the dominance of coal combustion or smelting. NOx and SO2 are co-emitted from CFPPs and nonferrous smelting processes but the emission ratios varygreatly among industries, fuel types, degree of pollution abatement and within each5
source type (Lin et al., 2010; Lu et al., 2010). On a global scale, the NOx/SO2 emissionratio is 0.52 for CFPP significantly higher than 0.01 for non-ferrous smelters (Voldneret al., 1997). For Shanghai in 2006, Zhang et al. (2009) reported an emission ratio of1.02. Our data show a NOx/SO2 mass concentration ratio for the major plume eventof 2.78. This high NOx/SO2 ratio indicates that CFPPs are the main contributor to10
observed TGM during the plume events. This confirms the emission-based contributionof CFPP reported by Streets et al. (2005) for Shanghai in September.
Although TGM have the highest correlation factor with CO, particularly during theminor/major plumes, the sources of CO are difficult to assign to a specific industryand source type because Shanghai has diverse industries with elevated emission fac-15
tors for CO. Biomass burning (BMB) with well defined TGM/CO emission ratios, is nota contributor of atmospheric mercury in September in Shanghai. The two biggest COsources in Shanghai associated with mercury emissions are industrial plants (cement,bricks, boilers, iron and steel) and transportation. CFPPs, although large mercury emit-ters, are minor sources for CO. Domestic coal combustion is a large CO emissions for20
China as a whole but it is small in Shanghai (Streets et al., 2006). A CO contributionfrom transportation is suggested in the CO diurnal (Fig. 4) with maxima coinciding withtraffic peak hours (see also Ran et al., 2009).
It is interesting to note that for some segments of the experiment TGM concentrationsare elevated in the absence of elevated SO2 and/or NOx, suggesting that there are25
unique sources, not yet elucidated, that emit mostly TGM and CO (e.g., 20 September).
30289

ACPD10, 30279–30303, 2010
Measurements ofatmospheric mercuryin Shanghai during
September 2009
H. R. Friedli et al.
Title Page
Abstract Introduction
Conclusions References
Tables Figures
J I
J I
Back Close
Full Screen / Esc
Printer-friendly Version
Interactive Discussion
Discussion
Paper
|D
iscussionP
aper|
Discussion
Paper
|D
iscussionP
aper|
3.4 Comparative data
Fang et al. (2009) have reviewed the distribution of atmospheric mercury (non-speciated) in the Pacific region: Korea, Japan, China and Taiwan. Their data covervarious seasons and time periods and therefore are not directly comparable with ourshort duration measurements at a single site. This is of concern because the wind pat-5
tern in September 2010 are untypical for annual winds but bring mostly aged relativelyclean air from the east, the ocean. Other months (Fig. 3) show a progressive changein dominant wind direction to northerly and westerly flow with the highest mercury con-tributions and southerly flows from areas with BMB during midsummer. In Table 3 wecompare atmospheric mercury observed in cities in China, in other Asian cities and10
in the Americas. In this compilation, Shanghai in September 2009 shows the lowestTGM pollution among Chinese cities listed. Tokyo and Seoul are in the same rangeas Shanghai, as are US cities and Toronto. Mexico City is more polluted, similar toChinese cities.
4 Conclusions15
This work is a time and spatially limited snapshot of atmospheric mercury in a relativelyclean megacity. During September 2009 at the SMB, Pudong, Shanghai, the mean at-mospheric mercury was 2.7±1.7 ng m−3. The reason for the relative low value is thefact that most of the sampling period was under the influence of clean easterly airflow.However, this is an exceptional condition for Shanghai as in other seasons the winds20
are from directions along the path where anthropogenic point sources are located. Themean TGM, which represents roughly 90% of total atmospheric mercury (the remain-der being RGM, but mostly pHg), is therefore an underestimate for an annual-meanShanghai TGM value.
The observed TGM in Shanghai follows a pattern seen in other cities around the25
world: a background elevated relative to rural and mean hemispheric background,
30290
ACPD10, 30279–30303, 2010
Measurements ofatmospheric mercuryin Shanghai during
September 2009
H. R. Friedli et al.
Title Page
Abstract Introduction
Conclusions References
Tables Figures
J I
J I
Back Close
Full Screen / Esc
Printer-friendly Version
Interactive Discussion
Discussion
Paper
|D
iscussionP
aper|
Discussion
Paper
|D
iscussionP
aper|
and pollution plumes of different magnitude and duration, interspersed with very sharpspikes of high concentration but short duration. The mercury pollution at the site, de-pending on wind direction, is composed of mercury advected with easterly air arrivingfrom the China Sea and Pacific Ocean, mercury anthropogenic emissions mostly fromnortherly and westerly industrial centers, and mercury evasion from soil.5
The SO2, NOx and wind measurements are correlated with TGM to variable degrees.The correlations are especially high during the major plume event consistent with thedominance of coal burning and smelter emission. We find that the major mercurycontributors are CFPP, followed by smelters and poorly defined industrial sources wellcorrelated with CO. TGM and CO have the highest correlation factors among measured10
pollutants, overall and particularly in the plumes, but there are no clear ties to knownCO emitters, although industrial processing operations are suspected.
Looking into the future, we note that pollution from newer CFPPs is reduced depend-ing on the level of use and type of modern abatement technologies. Importantly, thisis also consequential for mercury speciation, which drives local deposition. Mercury at15
stack level can be essentially free of pHg and low on RGM while in the raw combustiongases mercury is mostly in ionic and in particulate form (Wang et al., 2010). The largenumber of source types and the variation within source types and the variable degreeof abatement makes detailed source-receptor analysis impossible or not worthwhile atthis time because of unacceptable uncertainties.20
To obtain a better assessment of variability and trends, mercury measurements(TGM, preferably augmented by speciated mercury and Hg analysis in aerosol) shouldbe continued or initiated at multiple locations in and around Shanghai. Integrated mea-surements (NOx, SO2, CO and meteorology) are mandatory. Such data are useful fortracking progress in pollution abatement and as input to predictive models of atmo-25
spheric Hg.
Acknowledgements. We thank the SMB staff and MIRAGE-Shanghai team for helpful collab-oration. Dr. Geng (email: [email protected]) is the main contact person for non-Hg dataused in this study. We thank Electric Power Research Institute (EPRI) for the loan of the Tekran
30291
ACPD10, 30279–30303, 2010
Measurements ofatmospheric mercuryin Shanghai during
September 2009
H. R. Friedli et al.
Title Page
Abstract Introduction
Conclusions References
Tables Figures
J I
J I
Back Close
Full Screen / Esc
Printer-friendly Version
Interactive Discussion
Discussion
Paper
|D
iscussionP
aper|
Discussion
Paper
|D
iscussionP
aper|
instrument. We also acknowledge the National Climatic Data Center for Pudong weather dataused in Fig. 3a and NOAA Air Resources Laboratory for the HYSPLIT trajectories used assupporting information. We thank David Streets, Frank Flocke, and Xuexie Tie for helpful com-ments. The National Center for Atmospheric Research is sponsored by the National ScienceFoundation.5
References
Brooks, S., Luke, W., Cohen, M., Kelly, P., Lefer, B., Rappenglueck, B.: Mercury species mea-sured atop the Moody Tower TRAMP site, Houston, Texas, Atmos. Environ., 43(1), 1–11,2009.
Denis, M. S., Song, X. J., Lu, J. Y., and Feng, X. B.: Atmospheric gaseous elemental mercury10
in downtown Toronto, Atmos. Environ., 40, 4016–4024, 2006.Fang, F. M., Wang, Q. C., and Li, J. F.: Urban environmental mercury in Changchun,
a metropolitan city in Northeastern China: source, cycle, and fate, Sci. Total Environ., 330,159–170, doi:10.1016/j.scitotenv.2004.04.006, 2004.
Fang, G., Wu, Y., and Chang, T.: Comparison of atmospheric mercury among Korea, Japan,15
China and Taiwan, J. Hazard. Mater., 162, 607–615, 2009.Feng, X. B., Shang, L. H., Wang, S. F., Tang, S. L., and Zheng, W.: Temporal variation
of total gaseous mercury in the air of Guiyang, China, J. Geophys. Res., 109, D03303,doi:10.1029/2003JD004159, 2004.
Friedli, H. R., Radke, L. F., Prescott, R., Pan, L., Woo, J. H., and Carmichael, G. R.: Mercury20
in the atmosphere around Japan, Korea and China as observed during the 2001 ACE-Asiafield campaign: measurements, distribution, sources, and implications, J. Geophys. Res.,109, D19S25, doi:1029/2003JD004244, 2004.
Geng, F., Zhao, C., Tang, X., Lu, G., and Tie, X.: Analysis of ozone and VOCs measured inShanghai: a case study, Atmos. Environ., 41, 989–1001, 2007.25
Geng, F., Zhang, Q., Tie, X., Huang, M., Ma, X., Deng, Z., Yu, Q., Quan, J., and Zhao, C.:Aircraft measurements of O3, NOx, CO, VOCs, and SO2 in the Yangtze River Delta region,Atmos. Environ., 43, 584–593, 2009.
Kim, K. H., Ebinghaus, R., Schroeder, W. H., Blanchard, P., Kock, H. H., Steffen, A.,Froude, F. A., Kim, M. Y., Hong, S. M., and Kim, J. H.: Atmospheric mercury concentrations30
30292

ACPD10, 30279–30303, 2010
Measurements ofatmospheric mercuryin Shanghai during
September 2009
H. R. Friedli et al.
Title Page
Abstract Introduction
Conclusions References
Tables Figures
J I
J I
Back Close
Full Screen / Esc
Printer-friendly Version
Interactive Discussion
Discussion
Paper
|D
iscussionP
aper|
Discussion
Paper
|D
iscussionP
aper|
from several observatory sites in the Northern Hemisphere, J. Atmos. Chem., 50, 1–24,2005.
Kim, S. H., Han, Y. J., Holsen, T. M., and Yi, S. M.: Characteristics of atmospheric speciatedmercury concentrations (TGM, Hg(II) and Hg(p)) in Seoul, Korea, Atmos. Environ., 43, 3267–3274, doi:10.1016/j.atmosenv.2009.02.038, 2009.5
Landis, M. S., Vette, A. F., and Keeler, G. J.: Atmospheric mercury in the Lake Michigan Basin:influence of the Chicago/Gary urban area, Environ. Sci. Technol., 36, 4508–4517, 2002.
Lin, J.-T., McElroy, M. B., and Boersma, K. F.: Constraint of anthropogenic NOx emissions inChina from different sectors: a new methodology using multiple satellite retrievals, Atmos.Chem. Phys., 10, 63–78, doi:10.5194/acp-10-63-2010, 2010.10
Lu, Z., Streets, D. G., Zhang, Q., Wang, S., Carmichael, G. R., Cheng, Y. F., Wei, C., Chin, M.,Diehl, T., and Tan, Q.: Sulfur dioxide emissions in China and sulfur trends in East Asia since2000, Atmos. Chem. Phys., 10, 6311–6331, doi:10.5194/acp-10-6311-2010, 2010.
Lynam, M. M. and Keeler, G. J.: Comparison of methods for particulate phase mercury analysis:sampling and analysis, Anal. Bioanal. Chem., 374, 1009–1014, 2002.15
Monolopoulos, H., Snyder, D., Schauer, J., Hill, J., Turner, J., Olson, M., and Krabbenhoft, D.:Sources of speciated atmospheric mercury at a residential neighborhood impacted by indus-trial sources, Environ. Sci. Technol., 41(16), 5626–5633, 2007.
National Research Council: Toxicological Effects of Methylmercury, National Academy Press,Washington, DC, 2000.20
Pirrone, N., Cinnirella, S., Feng, X., Finkelman, R. B., Friedli, H. R., Leaner, J., Mason, R.,Mukherjee, A. B., Stracher, G. B., Streets, D. G., and Telmer, K.: Global mercury emissionsto the atmosphere from anthropogenic and natural sources, Atmos. Chem. Phys., 10, 5951–5964, doi:10.5194/acp-10-5951-2010, 2010.
Ran, L., Zhao, C., Geng, F., Tie, X., Tang, X., Peng, L., Zhou, G., Yu, Q., Xu, J., and Guen-25
ther, A.: Ozone photochemical production in urban Shanghai, China: analysis based onground level observations, J. Geophys. Res., 114, D15301, doi:10.1029/2008JD010752,2009.
Rutter, A. P., Snyder, D. C., Stone, E. A., Schauer, J. J., Gonzalez-Abraham, R., Molina, L. T.,Marquez, C., Cardenas, B., and de Foy, B.: In situ measurements of speciated atmospheric30
mercury and the identification of source regions in the Mexico City Metropolitan Area, Atmos.Chem. Phys., 9, 207–220, doi:10.5194/acp-9-207-2009, 2009.
Sakata, M. and Marumoto, K.: Formation of atmospheric particulate mercury in the Tokyo
30293

ACPD10, 30279–30303, 2010
Measurements ofatmospheric mercuryin Shanghai during
September 2009
H. R. Friedli et al.
Title Page
Abstract Introduction
Conclusions References
Tables Figures
J I
J I
Back Close
Full Screen / Esc
Printer-friendly Version
Interactive Discussion
Discussion
Paper
|D
iscussionP
aper|
Discussion
Paper
|D
iscussionP
aper|
metropolitan area, Atmos. Environ., 36, 239–246, 2002.Selin, N. E., Jacob, D. J., Park, R. J., Yantosca, R. M., Strode, S., Jaegle, L., and Jaffe, D.:
Chemical cycling and deposition of atmospheric mercury: global constraints from observa-tions, J. Geophys. Res., 112, DO2308, doi:10.1029/2006JD007450, 2007.
Shang, L., Feng, X., Zheng, W., and Yan, H.: Preliminary study of the distribution of speciated5
mercury species in the air of Guiyang city, China, J. Phys. IV, 107(II), 1219–1222, 2003.Song, X., Cheng, I., and Lu, J.: Annual atmospheric mercury species in downtown Toronto,
Canada, J. Environ. Monitor., 11, 660–669, 2009.Stephens, S., Madronich, S., Wu, F., Olson, J. B., Ramos, R., Retama, A., and Munoz, R.:
Weekly patterns of Mexico City’s surface concentrations of CO, NOx, PM10 and O3 during10
1986–2007, Atmos. Chem. Phys., 8, 5313–5325, doi:10.5194/acp-8-5313-2008, 2008.Streets, D. G., Hao, J., Wu, Y., Jiang, J., Chan, M., Tian, H., and Feng, X.: Anthropogenic
mercury emissions in China, Atmos. Environ., 39, 7789–7806, 2005.Streets, D. G., Zhang, Q., Wang, L., He, K., Hao, J., Wu, Y., Tang, Y., and Carmichael, G.: Revis-
iting China’s CO emissions after the TRACE-P mission: synthesis of inventories, atmospheric15
modeling, and observations, J. Geophys. Res., 111, D14306, doi:10.1029/2006JD007118,2006.
Tie, X., Madronich, S., Li, G. H., Ying, Z. M., Zhang, R., Garcia, A., Lee-Taylor, J., and Liu, Y.:Characterizations of chemical oxidants in Mexico City: a regional chemical/dynamical model(WRF-Chem) study, Atmos. Environ., 41, 1989–2008, 2007.20
Voldner, E., Li, Y.-F., Scholtz, M., and Davidson, K.: 1◦×1◦ Global SOx and NOx 2-Level Inven-tory Resolved Seasonally, Ortech Corporation, Mississauga, Ontario, Canada, 1997.
Wang, S. X., Zhang, L., Li, G. H., Wu, Y., Hao, J. M., Pirrone, N., Sprovieri, F., and Ancora, M. P.:Mercury emission and speciation of coal-fired power plants in China, Atmos. Chem. Phys.,10, 1183–1192, doi:10.5194/acp-10-1183-2010, 2010.25
Wang, T., Wong, C. H., Cheung, T. F., Blake, D. R., Arimoto, R., Baumann, K., Tang, J.,Ding, G. A., Yu, X. M., Li, S. Y., Streets, D. G., and Simpson, I. J.: Relationships of tracegases and aerosols and the emission characteristics at Lin’an, a rural site in Eastern China,during spring 2001, J. Geophys. Res., 107, D12, 4157, doi:10.1029/2001JD000724, 2002.
Wang, Z. W., Zhang, X. S., Chen, Z. S., and Zhang, Y.: Mercury concentrations in size-30
fractionated airborne particles at urban and suburban sites in Beijing, China, Atmos. Env-iron., 40, 2194–2201, 2006.
Wang, Z. W., Chen, Z. S., Duan, N., and Zhang, X. S.: Gaseous elemental mercury
30294
ACPD10, 30279–30303, 2010
Measurements ofatmospheric mercuryin Shanghai during
September 2009
H. R. Friedli et al.
Title Page
Abstract Introduction
Conclusions References
Tables Figures
J I
J I
Back Close
Full Screen / Esc
Printer-friendly Version
Interactive Discussion
Discussion
Paper
|D
iscussionP
aper|
Discussion
Paper
|D
iscussionP
aper|
concentration in atmosphere at urban and remote sites in china, J. Environ. Sci.-China, 19,176–180, 2007.
Xiu, G., Cai, J., Zhang, W., Zhang, D., Bueler, A., Lee, S., Shen, Y., Xu, L., Huang, X., Zhang, P.:Speciated mercury in size-fractionated particles in Shanghai ambient air, Atmos. Environ.,43, 3145–3154, 2009.5
Yang, Y. K., Chen, H., and Wang, D. Y.: Spatial and temporal distribution of gaseous elementalmercury in Chongqing, China, Environ. Monit. Assess., 156, 479–489, 2009.
Zhang, Q., Streets, D. G., Carmichael, G. R., He, K. B., Huo, H., Kannari, A., Klimont, Z.,Park, I. S., Reddy, S., Fu, J. S., Chen, D., Duan, L., Lei, Y., Wang, L. T., and Yao, Z. L.: Asianemissions in 2006 for the NASA INTEX-B mission, Atmos. Chem. Phys., 9, 5131–5153,10
doi:10.5194/acp-9-5131-2009, 2009.Zhang, H., Feng, X., Larssen, T., Qiu, G., and Vogt, R. D.: In inland China, rice, rather than fish
is the major pathway for methyl mercury exposure, Environ. Health Persp., 118, 1183–1188,doi:10.1289/ehp.1001915, 2010.
30295

ACPD10, 30279–30303, 2010
Measurements ofatmospheric mercuryin Shanghai during
September 2009
H. R. Friedli et al.
Title Page
Abstract Introduction
Conclusions References
Tables Figures
J I
J I
Back Close
Full Screen / Esc
Printer-friendly Version
Interactive Discussion
Discussion
Paper
|D
iscussionP
aper|
Discussion
Paper
|D
iscussionP
aper|
Table 1. Summary statistics of the time series.
All data Backgrounda Minorb Majorc
TGM (ng m−3) 2.7±1.7 2.4±1.2 2.5±0.5 3.8±1.6CO (ppbv) 446±215 397±170 470±140 622±380NOx (ppbv) 18.7±13.0 16.8±5.0 21.7±13.3 28.4±19.1SO2 (ppbv) 3.7±5.2 1.5±1.1 6.6±4.8 10.2±8.6Wind dir.d (◦) 77±39 77±26 75±92 116±135Wind spd. (m s−1) 1.5±0.9 1.6±1.0 1.5±0.7 1.3±0.8
a 31 Aug–8 Sep 2009b 7 Sep–11 Sep 2009c 11 Sep–13 Sep 2009d Calculated as median±inter quartile range
30296
ACPD10, 30279–30303, 2010
Measurements ofatmospheric mercuryin Shanghai during
September 2009
H. R. Friedli et al.
Title Page
Abstract Introduction
Conclusions References
Tables Figures
J I
J I
Back Close
Full Screen / Esc
Printer-friendly Version
Interactive Discussion
Discussion
Paper
|D
iscussionP
aper|
Discussion
Paper
|D
iscussionP
aper|
Table 2. Correlation coefficients between the different measurements.
TGM TGM TGM TGM NOx NOxCO NOx SO2 Wind dir. SO2 CO
All data 0.4 0.3 0.3 0.2 0.7 0.8Minor 0.6 0.4 0.3 0.4 0.4 0.2Major 0.8 0.7 0.7 0.6 0.8 0.9
30297

ACPD10, 30279–30303, 2010
Measurements ofatmospheric mercuryin Shanghai during
September 2009
H. R. Friedli et al.
Title Page
Abstract Introduction
Conclusions References
Tables Figures
J I
J I
Back Close
Full Screen / Esc
Printer-friendly Version
Interactive Discussion
Discussion
Paper
|D
iscussionP
aper|
Discussion
Paper
|D
iscussionP
aper|
Table 3. Atmospheric Hg in Chinese and other cities.
TGM (ng m−3) Date Reference
Beijing 8.3±3.6 Jan 2005 Wang et al. (2006, 2007)6.5±5.2 Apr 20054.9±3.3 Jul 20056.7±3.5 Oct 2005
Guangzhou 13.5±7.1 Jan 2005 Wang et al. (2007)Changchun 18.4 (4.7–79.6) Jul 2009 Fang et al. (2004)Guiyang 8.4±4.9 Nov 2001 Feng et al. (2004)Chongqing 6.74±0.37 Aug 2006 Yang et al. (2009)Shanghai 2.7±0.7 Sep 2009 This workSeoul 14.4±9.6 1987–1988 Kim et al. (2005, 2009)
5.34±3.92 1999–2000Tokyo 2.7±3.6 2000–2001 Sakata and Moromato (2002)Chicago 3.6±2.9 1994–1995 Landis et al. (2002)Detroit 1.2–4.0 1995–2002 Lynam and Keeler (2005)E. St. Louis 4.6±6.0 Oct 2002 Monolopulous et al. (2006)Toronto 4.5 2002–2004 Dennis et al. (2002)Mexico City 7.2±4.8 Mar 2006 Rutter et al. (2009)
30298
ACPD10, 30279–30303, 2010
Measurements ofatmospheric mercuryin Shanghai during
September 2009
H. R. Friedli et al.
Title Page
Abstract Introduction
Conclusions References
Tables Figures
J I
J I
Back Close
Full Screen / Esc
Printer-friendly Version
Interactive Discussion
Discussion
Paper
|D
iscussionP
aper|
Discussion
Paper
|D
iscussionP
aper|
Fig. 1. Location of sampling site and major Hg sources within the surrounding area.
30299
ACPD10, 30279–30303, 2010
Measurements ofatmospheric mercuryin Shanghai during
September 2009
H. R. Friedli et al.
Title Page
Abstract Introduction
Conclusions References
Tables Figures
J I
J I
Back Close
Full Screen / Esc
Printer-friendly Version
Interactive Discussion
Discussion
Paper
|D
iscussionP
aper|
Discussion
Paper
|D
iscussionP
aper|
Fig. 2. Time series of TGM (black), CO (red), NOx (blue), SO2 (green), and wind direction(magenta) for the entire experiment period.
30300
ACPD10, 30279–30303, 2010
Measurements ofatmospheric mercuryin Shanghai during
September 2009
H. R. Friedli et al.
Title Page
Abstract Introduction
Conclusions References
Tables Figures
J I
J I
Back Close
Full Screen / Esc
Printer-friendly Version
Interactive Discussion
Discussion
Paper
|D
iscussionP
aper|
Discussion
Paper
|D
iscussionP
aper|
Fig. 3. Measurements of wind direction taken at Pudong WMO meteorological station for theentire year of 2009 (A). The station is located at 31.133◦ and 121.783◦ longitude in close prox-imity to the sampling site of this study. The wind data are plotted as wind roses. The lengthof each slice corresponds to the frequency of wind (in %) observed at the site during 2009where the winds are blowing from a particular direction. The shaded portion of the wind rosein (A) corresponds to the relative frequency of wind data associated with a particular wind di-rection observed during the different seasons of the year. The seasons are defined here aswinter (DJF), spring (MAM), summer (JJA) and fall (SON). In comparison, a wind rose for theAugust/September time period is plotted in (B), showing the relative frequency of the data onTGM concentrations associated with a particular wind direction.
30301
ACPD10, 30279–30303, 2010
Measurements ofatmospheric mercuryin Shanghai during
September 2009
H. R. Friedli et al.
Title Page
Abstract Introduction
Conclusions References
Tables Figures
J I
J I
Back Close
Full Screen / Esc
Printer-friendly Version
Interactive Discussion
Discussion
Paper
|D
iscussionP
aper|
Discussion
Paper
|D
iscussionP
aper|
Fig. 4. Diurnal cycle of TGM (black) and CO (red) based on data for the entire experimentperiod. Dashed lines correspond to a polynomial fit of the data.
30302

ACPD10, 30279–30303, 2010
Measurements ofatmospheric mercuryin Shanghai during
September 2009
H. R. Friedli et al.
Title Page
Abstract Introduction
Conclusions References
Tables Figures
J I
J I
Back Close
Full Screen / Esc
Printer-friendly Version
Interactive Discussion
Discussion
Paper
|D
iscussionP
aper|
Discussion
Paper
|D
iscussionP
aper|
Fig. 5. TGM data plotted as wind roses over the following time periods of the study: back-ground (A), minor (B), and major plume (C). These periods are defined in Sect. 3 and Table 1.The length of each slice corresponds to the frequency of wind data (in %) blowing at a par-ticular direction over the time period. Note that the unaccounted percentages are associatedwith missing data. The shaded portion of each slice corresponds to the relative frequency ofa particular range of TGM concentration values associated with a particular wind direction.
30303
Copyright © 2022 FDOKUMEN