Measurements Dualities of - HAISENBERG
405
A knowledge of the performance characteristics of an instrument is essential for selecting the most suitable instrument for specific measuring jobs. It consists of two basic characteristics-static and dynamic. 1.2 PERFORMANCE CHARACTERISTICS Instrumentation is a technology of measurement which serves not only science but all branches of engineering, medicine, and almost every human endeavour, The knowledge of any parameter largely depends on the measurement. The indepth knowledge of any parameter can be easily understood by the use of measurement, and further modifications can also be obtained. Measuring is basically used to monitor a process or operation, or as well as the controlling process. For example, thermometers, barometers, anemometers are used to indicate the environmental conditions. Similarly, water, gas and electric meters are used to keep track of the quantity of the commodity used, and also special monitoring equipment are used in hospitals. Whatever may be the nature of application, intelligent selection and use of measuring equipment depends on a broad knowledge of what is available and how the performance of the equipment renders itself for thejob to be performed. But there are some basic measurement techniques and devices that are useful and will continue to be widely used also. There is always a need for improve- ment and development of new equipment to solve measurement problems. The major problem encountered with any measuring instrument is the error. Therefore, it is obviously necessary to select the appropriate measuring instrument and measurement method which minimises error. To avoid errors in any experimental work, careful planning, execution and evaluation of the experiment are essential. The basic concern of any measurement is that the measuring instrument should not effect the quantity being measured; in practice, this non-interference principle is never strictly obeyed. Null measurements with the use of feedback in an instrument minimise these interference effects. INTRODUCTION 1.1 Measurements Dualities of
-
Upload
khangminh22 -
Category
Documents
-
view
1 -
download
0
Transcript of Measurements Dualities of - HAISENBERG

A knowledge of the performance characteristics of an instrument is essential forselecting the most suitable instrument for specific measuring jobs. It consists oftwo basic characteristics-static and dynamic.
1.2PERFORMANCE CHARACTERISTICS
Instrumentation is a technology of measurement which serves not only sciencebut all branches of engineering, medicine, and almost every human endeavour,The knowledge of any parameter largely depends on the measurement. Theindepth knowledge of any parameter can be easily understood by the use ofmeasurement, and further modifications can also be obtained.
Measuring is basically used to monitor a process or operation, or as well as thecontrolling process. For example, thermometers, barometers, anemometers areused to indicate the environmental conditions. Similarly, water, gas and electricmeters are used to keep track of the quantity of the commodity used, and alsospecial monitoring equipment are used in hospitals.
Whatever may be the nature of application, intelligent selection and use ofmeasuring equipment depends on a broad knowledge of what is available and howthe performance of the equipment renders itself for the job to be performed.
But there are some basic measurement techniques and devices that are usefuland will continue to be widely used also. There is always a need for improvement and development of new equipment to solve measurement problems.
The major problem encountered with any measuring instrument is theerror. Therefore, it is obviously necessary to select the appropriate measuringinstrument and measurement method which minimises error. To avoid errorsin any experimental work, careful planning, execution and evaluation of theexperiment are essential.
The basic concern of any measurement is that the measuring instrumentshould not effect the quantity being measured; in practice, this non-interferenceprinciple is never strictly obeyed. Null measurements with the use of feedback inan instrument minimise these interference effects.
INTRODUCTION 1.1
MeasurementsDualities of
Measurement is the process of comparing an unknown quantity with an acceptedstandard quantity. It involves connecting a measuring instrument into the systemunder consideration and observing the resulting response on the instrument.The measurement thus obtained is a quantitative measure of the so-called "truevalue" (since it is very difficult to define the true value, the term "expectedvalue" is used). Any measurement is affected by many variables, therefore theresults rarely reflect the expected value. For example, connecting a measuringinstrument into the circuit under consideration always disturbs (changes) thecircuit, causing the measurement to differ from the expected value.
Some factors that affect the measurements are related to the measuringinstruments themselves. Other factors are related to the person using theinstrument. The degree to which a measurement nears the expected value IS
expressed in terms of the error of measurement.Error may be expressed either as absolute or as percentage of error.Absolute error may be defined as the difference between the expected value of
the variable and the measured value of the variable, or
1.4ERROR IN MEASUREMENT
The static characteristics of an instrument are, in general, considered forinstruments which are used to measure an unvarying process condition. All thestatic performance characteristics are obtained by one form or another of a processcalled calibration. There are a number of related definitions (or characteristics),which are described below, such as accuracy, precision, repeatability, resolution,errors, sensitivity, etc.
1. Instrument A device or mechanism used to determine the presentvalue of the quantity under measurement.
2. Measurement The process of determining the amount, degree, orcapacity by comparison (direct or indirect) with the accepted standardsof the system units being used.
3. Accuracy The degree of exactness (closeness) of a measurementcompared to the expected (desired) value.
4. Resolution The smallest change in a measured variable to which aninstrument will respond.
S. Precision A measure of the consistency or repeatability of measurements, i.e. successive reading do not differ. (Precision is the consistencyof the instrument output for a given value of input).
6. Expected value The design value, i.e. the most probable value thatcalculations indicate one should expect to measure.
7. Error The deviation of the true value from the desired value.8. Sensitivity The ratio of the change in output (response) of the instrument
to a change of input or measured variable.
1.3STATIC CHARACTERISTICS
2 Electronic Instrumentation

e=Yn-Xnwhere e = error, Y" = expected value, X; = measured value
Step 1:Absolute error
Solution
Example 1.1(b) The expected value of the current through a resistor is20 mAoHowever the measurement yields a current value of 18mAo Calculate(i) absolute error (ii) % error (iii) relative accuracy (iv) % accuracy
a = 100% - % of error = 100% -1.25% = 98.75%or(iv) % of Accuracy a = 100 x A = 100 x 0.9875 = 98.75%
A = 1 - 1/80 = 79/80 = 0.9875
A = 1_ I_Y,;.;_lI_X__;'''-'1= 1_ 80 - 79Y" 80
Solution(i) Absolute error e = Yn - X" = 80 - 79 = 1 V
Y" - X" 00 80 - 79 00 0)/(ii) % Error = x 1 = x l = 1.25 10Y" 80
(iii) Relative Accuracy
Example 1.1(a) The expected value of the voltage across a resistor is 80 V.However, the measurement gives a value of 79 V. Calculate (i) absolute error,(ii) % error, (iii) relative accuracy, and (iv) % o.f accuracy.
where a is the % accuracy.a =A x 100 %
Y"where A is the relative accuracy.Accuracy is expressed as % accuracy
a = 100% - % error
Therefore
where e = absolute errorYI1 = expected valueXI1 = measured value
Therefore % Error = Absolute value x 100 = !!_ x 100Expected value Y"
( Y" - XII 1 00Therefore % Error = Yn X 1
It is more frequently expressed as a accuracy rather than error.
A = 1 _ Y" - Xn
Qualities of Measurements 3
Measurement Measurement valuenumber x,
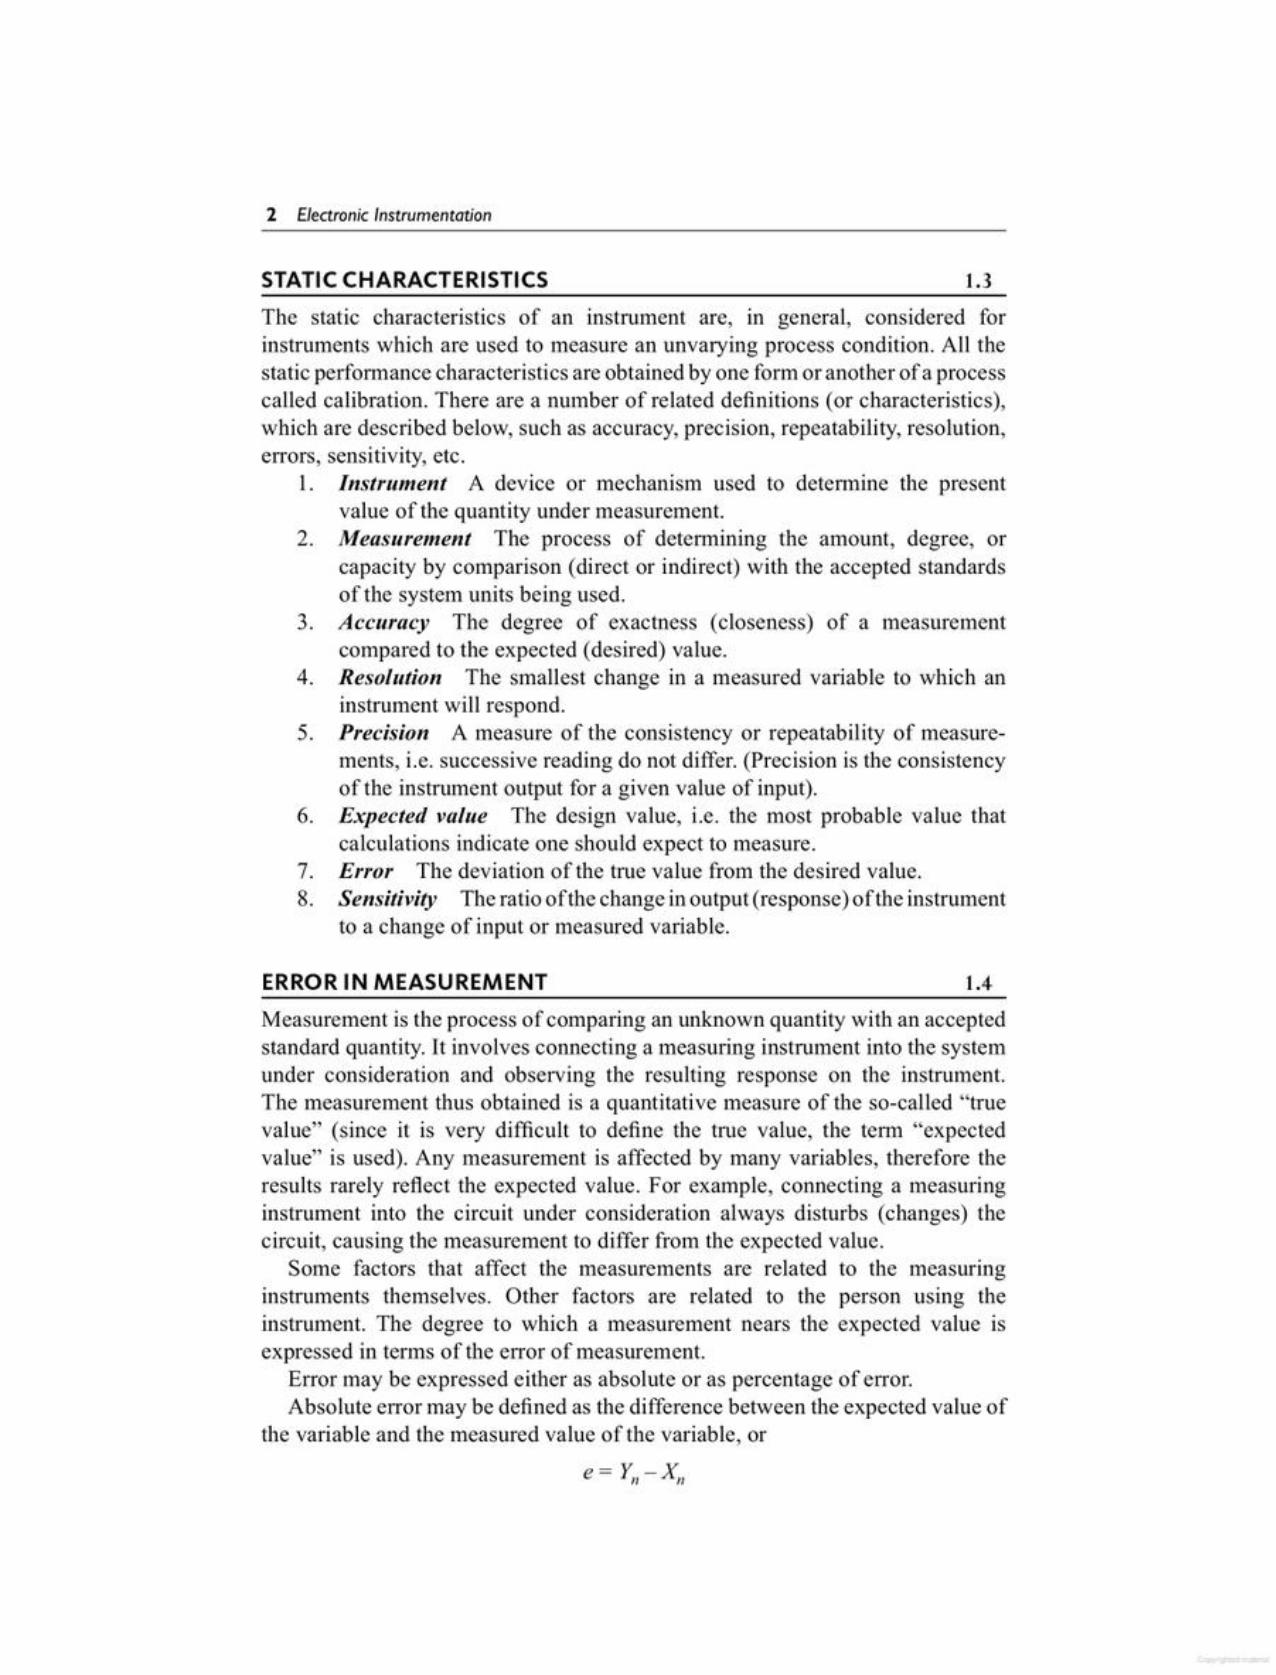
1 98
2 10 1
3 102
4 97
5 10 1
6 100
7 103
8 98
9 106
10 99
Example 1.2 Table1.1gives the set ofI 0measurement that were recordedin the laboratory. Calculate the precision of the 6th measurement.
Table 1.1
where Xn = value of the nth measurementX; = average set of measurement
P = 1_ I_X__;",,-=_X__;1;:_'1X"
If a measurement is accurate, it must also be precise, i.e. Accuracy meansprecision. However, a precision measurement may not be accurate. (The precisionof a measurement is a quantitative or nurnerical indication of the closeness withwhich a repeated set of measurement of the same variable agree with the averageset of measurements.) Precision can also be expressed mathematically as
a = A x 100% = 0.90 x 100% = 90%and
Step 4: % accuracya = 100% - %error = 100% - 10%= 90%
A = 1- ~, - X" = 1_ 20 InA -18 rnA = 1- ~ = 1- 0.1 = 0.90~, 20 rnA 20
Step 3: Relative accuracy
Step 2: % error
% error = ~,-Xn xl00= 201UA-181nA xl00= 2mA xlOO=10%~, 20mA 20mA
Given Yfl = 20 InA and Xfl = 18 rnATherefore e = Y -x = 20 lnA- 18mA = 21nAn n
4 Electronic Instrumentation
1.5.2 Systematic ErrorsThese errors occur due to shortcomings of the instrument, such as defective orworn parts, or ageing or effects of the environment on the instrument.
1.5.1 Gross ErrorsThese errors are mainly due to human mistakes in reading or in using instrumentsor errors in recording observations. Errors may also occur due to incorrectadjustment of instruments and computational mistakes. These errors cannot betreated mathematically.
The complete elimination of gross errors is not possible, but one can minimisethem. Some errors are easily detected while others may be elusive.
One of the basic gross errors that occurs frequently is the improper use of aninstrument. The error can be minimized by taking proper care in reading andrecording the measurement parameter.
In general, indicating instruments change ambient conditions to some extentwhen connected into a complete circuit. (Refer Examples 1.3(a) and (bj).
(One should therefore not be completely dependent on one reading only; atleast three separate readings should be taken, preferably under conditions Inwhich instruments are switched off and on.)
The static error of a measuring instrument is the numerical difference betweenthe true value of a quantity and its value as obtained by measurement, i.e.repeated measurement of the same quantity gives different indications. Staticerrors are categorised as gross errors or human errors, systematic errors, andrandom errors.
1.5TYPES OF STATIC ERROR
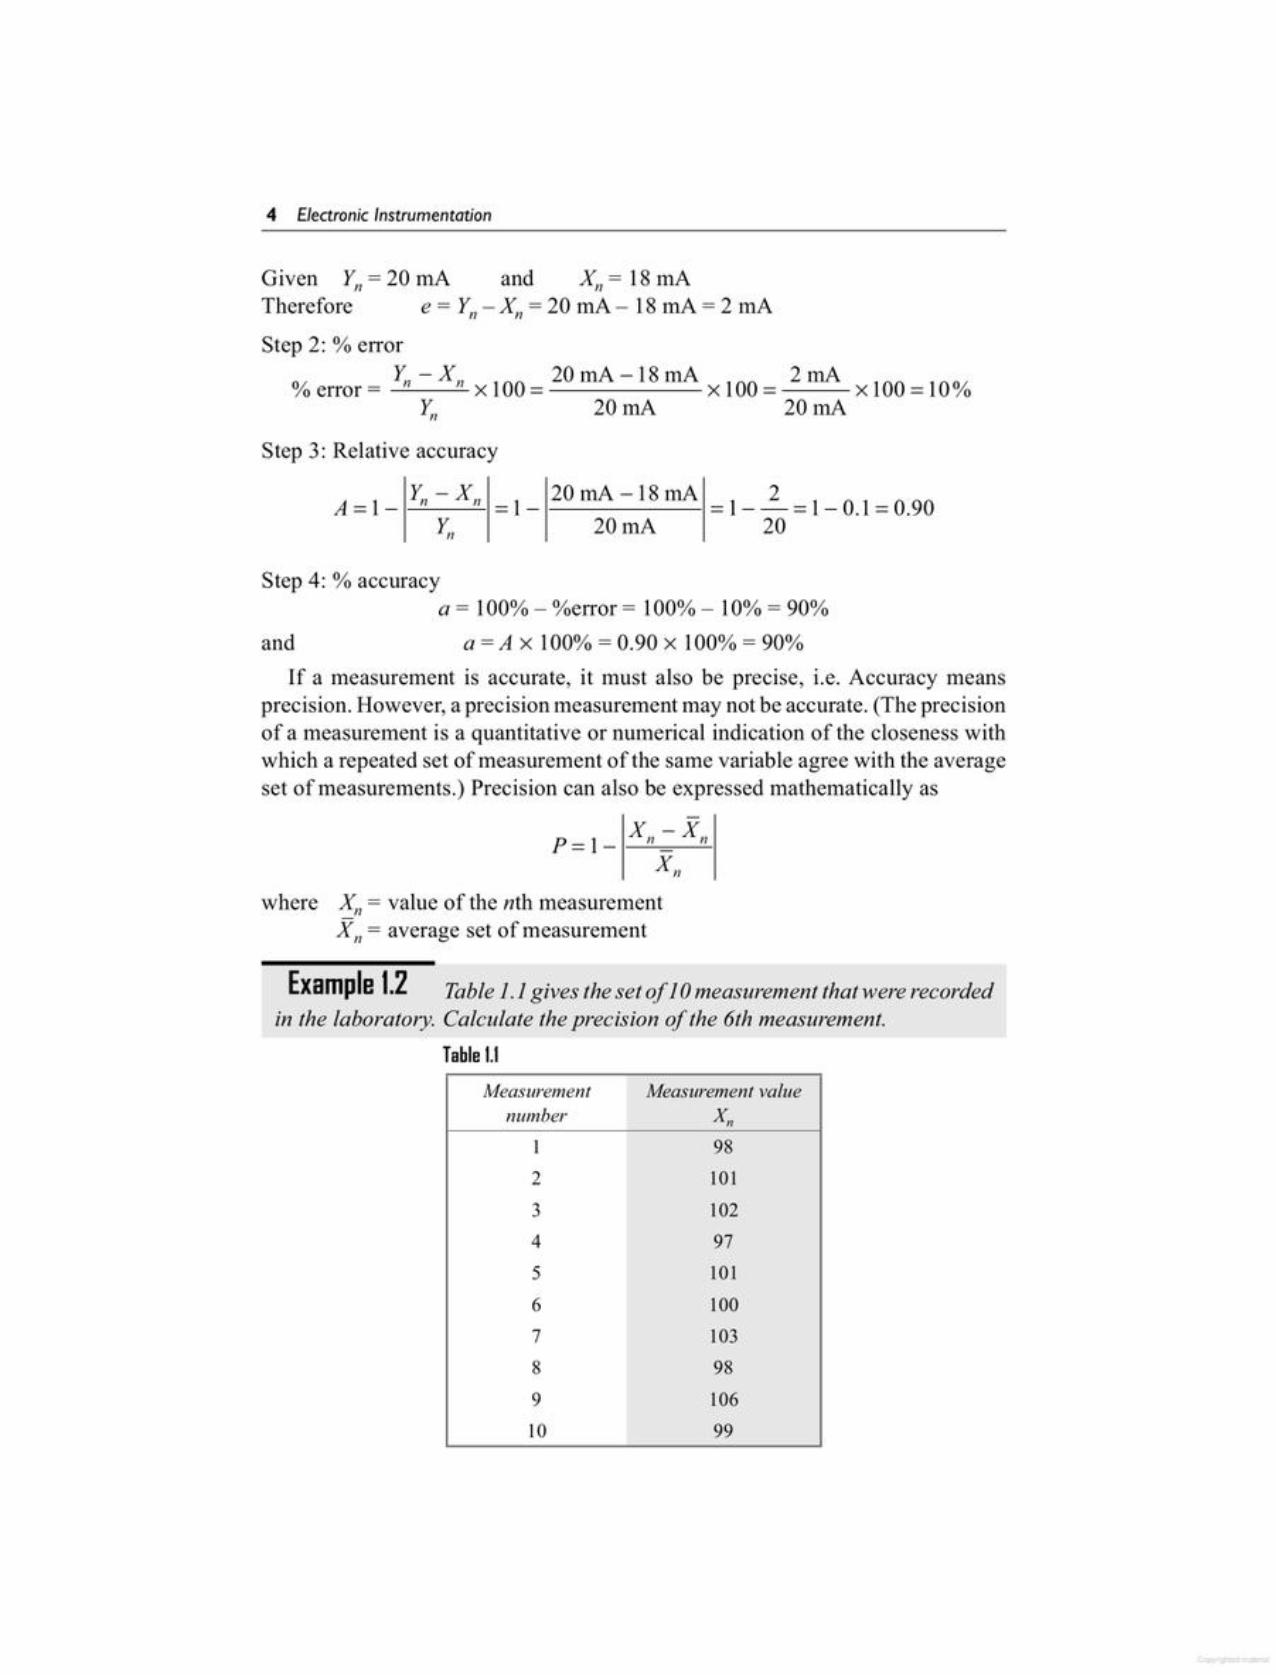
The accuracy and precision of measurements depend not only on the qualityof the measuring instrument but also on the person using it. However, whateverthe quality of the instrument and the case exercised by the user, there is alwayssome error present in the measurement of physical quantities.
100-100.5 =1- 0.5 = 100 =0.995100.5 100.5 100.5
Precision = 1-
For the 6th reading
. . X17 - XI1Precision = 1- I-~:--":':"'I
= 1005 = 100.510
10x = Sum of the 10 measurement values
11
Solution The average value for the set of measurements is given by
Qualities of Measurements 5
Example 1.3 (a) A voltmeter having a sensitivity of 1 kWV is connectedacross an unknown resistance in series with a milliammeter reading 80 Von150 Vscale. When the milliammeter reads 10 mA, calculate the (i) Apparentresistance of the unknown resistance, (ii) Actual resistance of the unknownresistance, and (iii) Error due to the loading effect of the voltmeter.
(ii) Environmental ErrorsEnvironmental errors are due to conditions external to the measuring device,including conditions in the area surrounding the instrument, such as the effectsof change in temperature, humidity, barometric pressure or of magnetic orelectrostatic fields.
These errors can also be avoided by (i) air conditioning, (ii) hermeticallysealing certain components in the instruments, and (iii) using magnetic shields.(iii) Observational ErrorsObservational errors are errors introduced by the observer. The most commonerror is the parallax error introduced in reading a meter scale, and the error ofestimation when obtaining a reading from a meter scale.
These errors are caused by the habits of individual observers. For example, anobserver may always introduce an error by consistently holding his head too farto the left while reading a needle and scale reading.
In general, systematic errors can also be subdivided into static and dynamicerrors. Static errors are caused by limitations of the measuring device or thephysical laws governing its behaviour. Dynamic errors are caused by theinstrument not responding fast enough to follow the changes in a measuredvariable.
These errors are sometimes referred to as bias, and they influence allmeasurements of a quantity alike. A constant uniform deviation of the operationof an instrument is known as a systematic error. There are basically three types ofsystematic errors-(i) Instrumental, (ii) Environmental, and (iii) Observational.(i) Instrumental ErrorsInstrumental errors are inherent in measuring instruments, because of theirmechanical structure. For example, in the D'Arsonval movement, friction in thebearings of various moving components, irregular spring tensions, stretching ofthe spring, or reduction in tension due to improper handling or overloading ofthe instrument.
Instrumental errors can be avoided by(a) selecting a suitable instrument for the particular measurement
applications. (Refer Examples 1.3 (a) and (bj).(b) applying correction factors after determining the amount of instrumental
error.(c) calibrating the instrument against a standard.
6 Electronic Instrumentation
In Example 1.3 (a), a well calibrated voltmeter may give a misleadingresistance when connected across two points in a high resistance circuit. Thesame voltmeter, when connected in a low resistance circuit (Example 1.3 (b)may give a more dependable reading. This show that voltmeters have a loadingeffect in the circuit during measurement,
R = RT xRv = SOxlS0k = 7S00k =SO.167Qx Rv-RT lS0k-SO 149.Sk
% Error = S0.167 - SOx 100 = 0.167 x 100 = 0.33%S0.167 S0.167
2. The voltmeter resistance R; equalsR; = 1000 QN x ISO= ISOkQ
Neglecting the resistance of the milliammeter, the value of unknown resistance=SO Q
Solution1. The total circuit resistance is given by
RT = VT = 30 = SOQIT 0.6
Example 1.3 (b) Referring to Ex. 1.3 (a), if the milliammeter reads 600 rnAand the voltmeter reads 30 V on a 150 V scale, calculate the following:(i)Apparent, resistance of the unknown resistance. (ii) Actual resistance of theunknown resistance. (iii) Error due to loading effect of the voltmeter.Comment on the loading effect due to the voltmeter for both Examples 1.3 (a)and (b). (Voltmeter sensitivity given 1000 Q/V)
8.4Sk - 8k x 1008.4Sk
0/ Actual value - Apparent value/0 error = ------~---
Actual value= 0.OS3 x 100 = S.3%
(iii)
----
. R x R 8 k x 1SOk:. actual value of unknown resistance Rx = T v = ----
Rv-RT lS0k-8k
1200k2 8.4SQ142k
So~t0n V 80(i) The total circuit resistance RT = I~- 10 rnA = 8 kQ
(Neglecting the resistance of the milliammeter.)
(ii) The voltmeter resistance equals R; = 1000 Q/V x ISO= ISO ill
Qualities of Measurements 7
Instruments rarely respond instantaneously to changes in the measured variables.Instead, they exhibit slowness or sluggishness due to such things as mass, thermalcapacitance, fluid capacitance or electric capacitance. In addition to this, puredelay in time is often encountered where the instrument waits for some reactionto take place. Such industrial instruments are nearly always used for measuringquantities that fluctuate with time. Therefore, the dynamic and transient behaviourof the instrument is as important as the static behaviour.
The dynamic behaviour of an instrument is determined by subjecting its primaryelement (sensing element) to some unknown and predetermined variations in themeasured quantity. The three most common variations in the measured quantityare as follows:
1. Step change, in which the primary elelnent is subjected to an instantaneousand finite change in measured variable.
2. Linear change, in which the primary element is following a measuredvariable, changing linearly with time.
1.7DYNAMIC CHARACTERISTICS
The sources of error, other than the inability of a piece of hardware to provide atrue measurement, are as follows:
1. Insufficient knowledge of process parameters and design conditions2. Poor design3. Change in process parameters, irregularities, upsets, etc.4. Poor maintenance5. Errors caused by person operating the instrument or equipment6. Certain design limitations
1.6SOURCESOF ERROR
1.5.3 Random ErrorsThese are errors that remain after gross and systematic errors have beensubstantially reduced or at least accounted for. Random errors are generally anaccumulation of a large number of small effects and may be of real concernonly in measurements requiring a high degree of accuracy. Such errors can beanalyzed statistically.
These errors are due to unknown causes, not determinable in the ordinaryprocess of making measurements. Such errors are normally small and follow thelaws of probability. Random errors can thus be treated mathematically.
For example, suppose a voltage is being monitored by a voltmeter whichis read at 15 minutes intervals. Although the instrument operates under idealenvironmental conditions and is accurately calibrated before measurement, it stillgives readings that vary slightly over the period of observation. This variationcannot be corrected by any method of calibration or any other known method ofcontrol.
8 Electronic Instrumentation

where K = bolao = static sensitivity
d'" .r:' dx· x· x·= b", d III I + ...+ b",_I II + ...+ b, __ I + bo == X; (1.1).t dt"" dt
where Xo = output quantityx; = input quantityt = time
a's and b's are combinations of systems physical parameters, assumedconstant.
When all the a's and b's, other than ao and bo are assumed to be zero, thedifferential equation degenerates into the simple equation given as
aoXo = boX; (1.2)Any instrument that closely obeys Eq. (1.2) over its intended range of operating
conditions is defined as a zero-order instrument. The static sensitivity (or steadystate gain) of a zero-order instrument may be defined as follows
bXo = _Q_x; = K.x;
ao
1.7.1 Dynamic Response of Zero Order InstrumentsWe would like an equation that describes the performance of the zero orderinstrument exactly. The relations between any input and output can, by usingsuitable simplifying assumptions, be written as
dn dn-I dXo Xo Xo_a'l -~ + a/l_, ,+ ...+ a, -~ + a()Xo
dt" d ,"- d t
3. Sinusoidal change, in which the primary element follows a measuredvariable, the magnitude of which changes in accordance with a sinusoidalfunction of constant amplitude.
The dynamic characteristics of an instrument are (i) speed of response,(ii) fidelity, (iii) lag, and (iv) dynamic error.
(i) Speed of Response It is the rapidity with which an instrument respondsto changes in the measured quantity.
(ii) Fidelity It is the degree to which an instrument indicates the changesin the measured variable without dynamic error (faithful reproduction).
(iii) Lag It is the retardation or delay in the response of an instrument tochanges in the measured variable.
(iv) Dynamic Error It is the difference between the true value of a quantitychanging with time and the value indicated by the instrument, ifno staticerror is assumed.
When measurement problems are concerned with rapidly varying quantities,the dynamic relations between the instruments input and output are generallydefined by the use of differential equations.
Qualities of Measurements 9

where "'" ~ ~ ~ undamped natural frequency in radians/time
2~ = al /~ao a2 = damping ratio
K = bolao = static sensitivity
The above equations can be reduced as
( D: + 2~D + l).Xo :;;:Kxi(1)" fI
1.7.3 Dynamic Response of Second Order InstrumentA second order instrument is defined as one that follows the equation
d2 Xo dx ;a2 2 + al-- + aoxo :;;:bOXi
dt dt
A very common example of a first-order instrument is a mercury-in-glassthermometer.
where r= a/ao = time constantK = bolao = static sensitivity
The time constant r always has the dimensions of time while the staticsensitivity Khas the dimensions of outputlinput. The operational transfer functionof any first order instrument is
or
1.7.2 Dynamic Response of a First Order InstrumentIfin Eq. (1.1) all a's and b's other than ai' ao, bo are taken as zero, we get
dx;al -- + aoXo = bOXi
dtAny instrument that follows this equation is called a first order instrument. By
dividing by ao, the equation can be written as
al dx; bo- +xo :;;:-Xiao dt ao(r·D+ 1) ·xo=KXi
Since the equation Xo = K Xi is an algebraic equation, it is clear that nomatter how Xi might vary with time, the instrument output (reading) follows itperfectly with no distortion or time lag of any sort. Thus, a zero-order instrumentrepresents ideal or perfect dynamic performance. A practical example of a zeroorder instrument is the displacement measuring potentiometer.
10 Electron;c Instrumentat;on
1.8.2 Deviation from the MeanThis is the departure of a given reading from the arithmetic mean of the groupof readings. If the deviation of the first reading, x I' is called d, and that of thesecond reading x2 is called d2, and so on,
The deviations from the mean can be expressed as
d, = XI - X, d2= x2 - x ... , similarly d; = xl1- xThe deviation may be positive or negative. The algebraic sum of all the
deviations must be zero.
where X = Arithmetic meanXI1 = nth reading takenn = total number of readings
II
LX"- XI + x2 + X3 + ... + xn n=1x= --
n n
1.8.1 Arithmetic MeanThe most probable value of a measured variable is the arithmetic mean ofthe number of readings taken. The best approximation is possible when thenumber of readings of the same quantity is very large. The arithmetic mean of nmeasurements at a specific count of the variable x is given by the expression
The statistical analysis of measurement data is important because it allows ananalytical determination of the uncertainty of the final test result. Tomake statistical analysis meaningful, a large number of measurements is usually required.Systematic errors should be small compared to random errors, because statisticalanalysis of data cannot remove a fixed bias contained in all measurements.
1.8STATISTICAL ANALYSIS
Any instrument following this equation is a second order instrument. Apractical example of this type is the spring balance. Linear devices range frommass spring arrangements, transducers, amplifiers and filters to indicators andrecorders.
Most devices have first or second order responses, i.e. the equations of motiondescribing the devices are either first or second order linear differentials. Forexample, a search coil and mercury-in-glass thermometer have a first orderresponse. Filters used at the output of a phase sensitive detector and amplifiersused in feedback measuring systems essentially have response due to a singletime constant. First order systems involve only one kind of energy, e.g. thermalenergy in the case of a thermometer, while a characteristic feature of secondorder system is an exchange between two types of energy, e.g. electrostatic andelectromagnetic energy in electrical LC circuits, moving coil indicators andelectromechanical recorders.
Qualities of Measurements I I

Idd, Id21, ... , Idnl = Absolute value of deviationsand n = total number of readings
Highly precise instruments yield a low average deviation between readings.
Dav = average deviationwhere
or
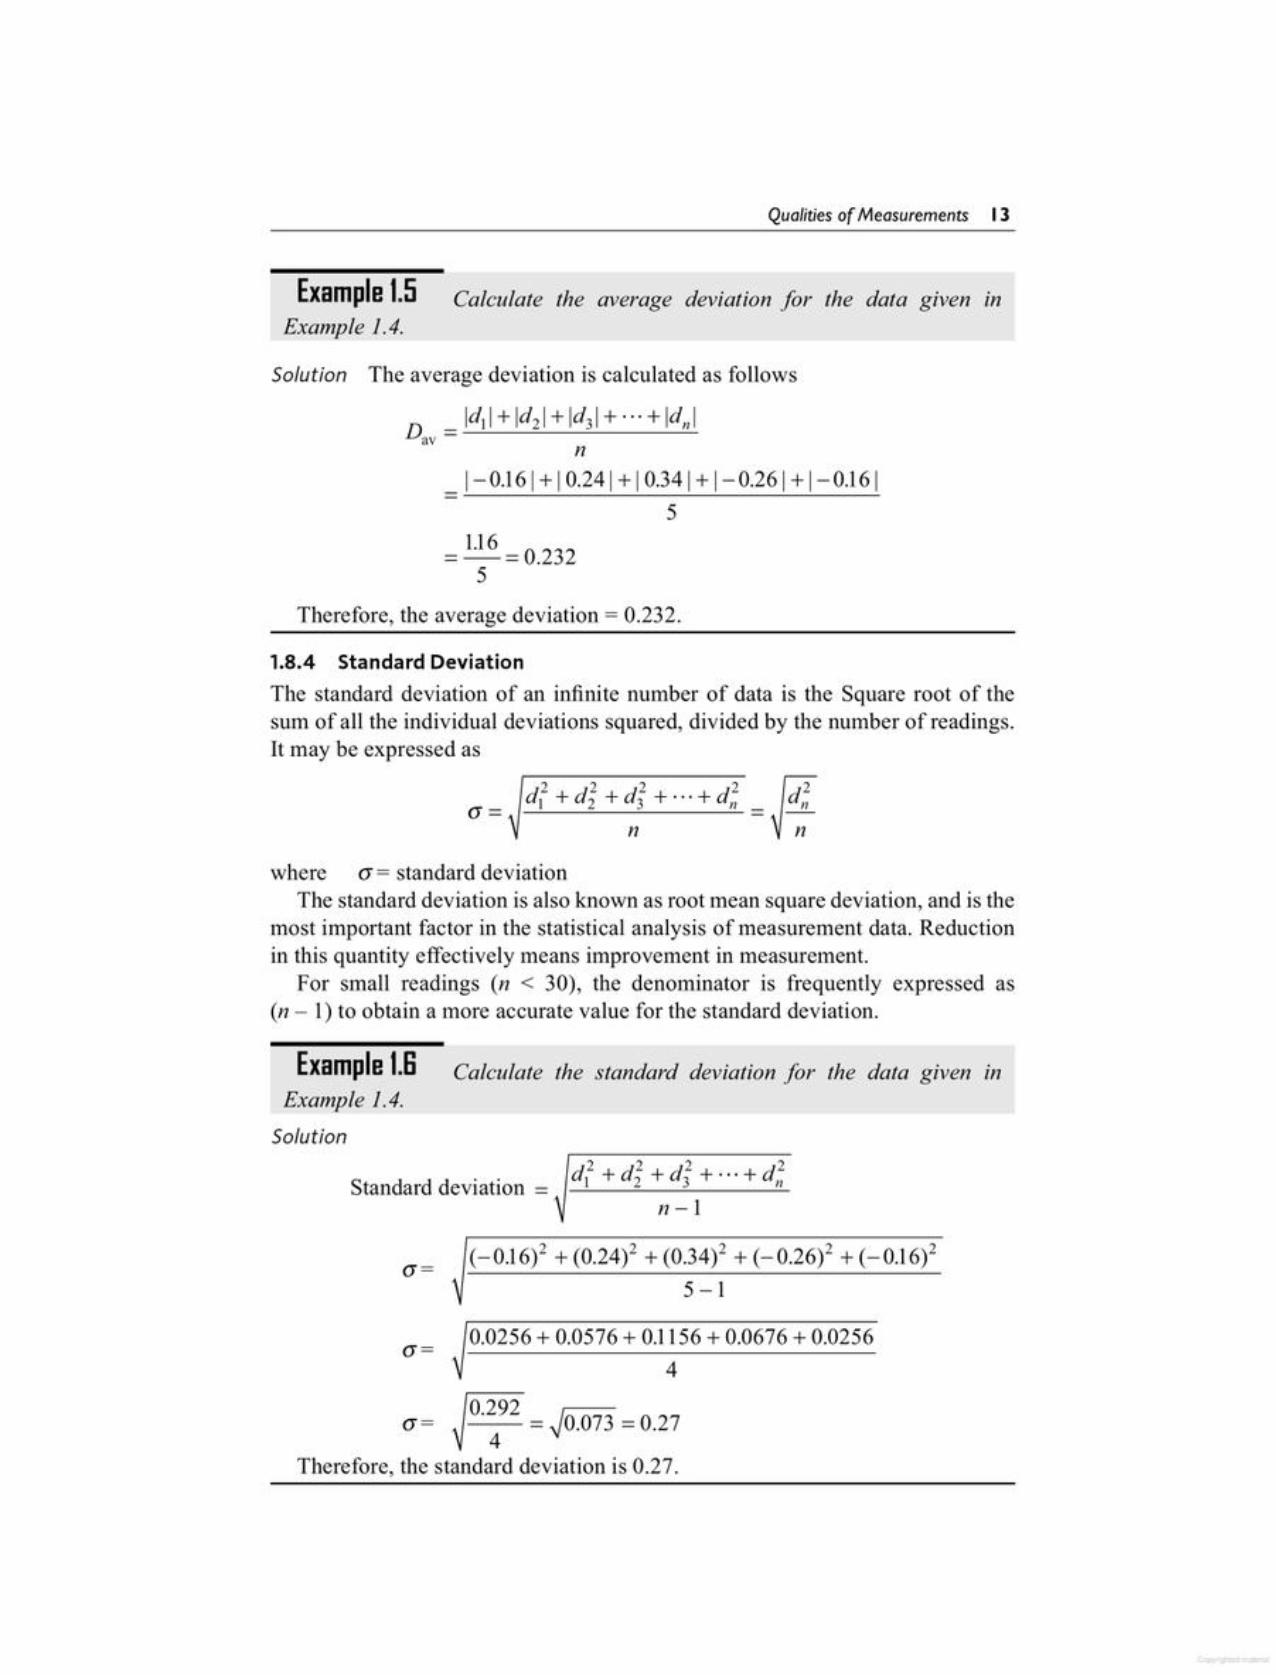
1.8.3 Average DeviationsThe average deviation is an indication of the precision of the instrument usedin measurement. Average deviation is defined as the sum of the absolute valuesof the deviation divided by the number of readings. The absolute value of thedeviation is the value without respect to the sign.
Average deviation may be expressed as
Idtl+ Id21 + Id31 + ... + IdnlDav = ---'-----=-----"---_:..:_
n
(ii) The deviations from each value are given byd, =x] -x = 49.7 - 49.86 = - 0.16d2= x2 -x = 50.1 - 49.86 = + 0.24d3 = x3 -x = 50.2 - 49.86 = + 0.34d4 =X4 -x = 49.6 - 49.86 = - 0.26ds =xs -x = 49.7 - 49.86 = - 0.16
(iii) The algebraic sum of the deviation is
dtotal = - 0.16 + 0.24 + 0.34 - 0.26 - 0.16= + 0.58 - 0.58 = 0
- xl + x2 + x3 + X4 + XsX = --'---=---___::----'---=-
5
= 49.7 + 50.1+ 50.2 + 49.6 + 49.7 = 49.865
Solution(i) The arithmetic mean is calculated as follows
Example 1.4 For thefollowing given data, calculate(i) Arithmetic mean; (ii) Deviation of each value; (iii) Algebraic sum of thedeviationsGiven
xl = 49.7,' x2 = 50.1; x3 = 50.2; x4 = 49.6; x5 = 49.7
12 Electron;c Instrumentat;on
0.0256 + 0.0576 + 0.1156+ 0.0676 + 0.0256a=
(-0.16)2 + (0.24)2 + (0.34)2 + (-0.26)2 + (-0.16)25-1
a=
d2 + d2 + d2 + ... + d2I 2 3 n
n-lStandard deviation =
Example 1.8 Calculate the standard deviation for the data given InExample 1.4.
Solution
where a= standard deviationThe standard deviation is also known as root mean square deviation, and is the
most important factor in the statistical analysis of measurement data. Reductionin this quantity effectively means improvement in measurement.
For small readings (n < 30), the denominator is frequently expressed as(n - 1) to obtain a more accurate value for the standard deviation.
1.8.4 Standard DeviationThe standard deviation of an infinite nUlnber of data is the Square root of thesum of all the individual deviations squared, divided by the number of readings.It may be expressed as
a = dl2 + di + df + ... + d,; = fdYn ~-:;-
Therefore, the average deviation = 0.232.
= 1.16= 0.2325
1- 0.161+ 10.241+ 10.341+ 1- 0.261+ 1- 0.161-
5
Idtl+ Id21 + Id31 + ... + IdnlDav = .:........!_:....._:........=..:...._.:........::..:....__:....._--'!..:.
n
Solution The average deviation is calculated as follows
Example 1.5 Calculate the average deviation for the data given InExample 1.4.
Qualities of Measurements 13
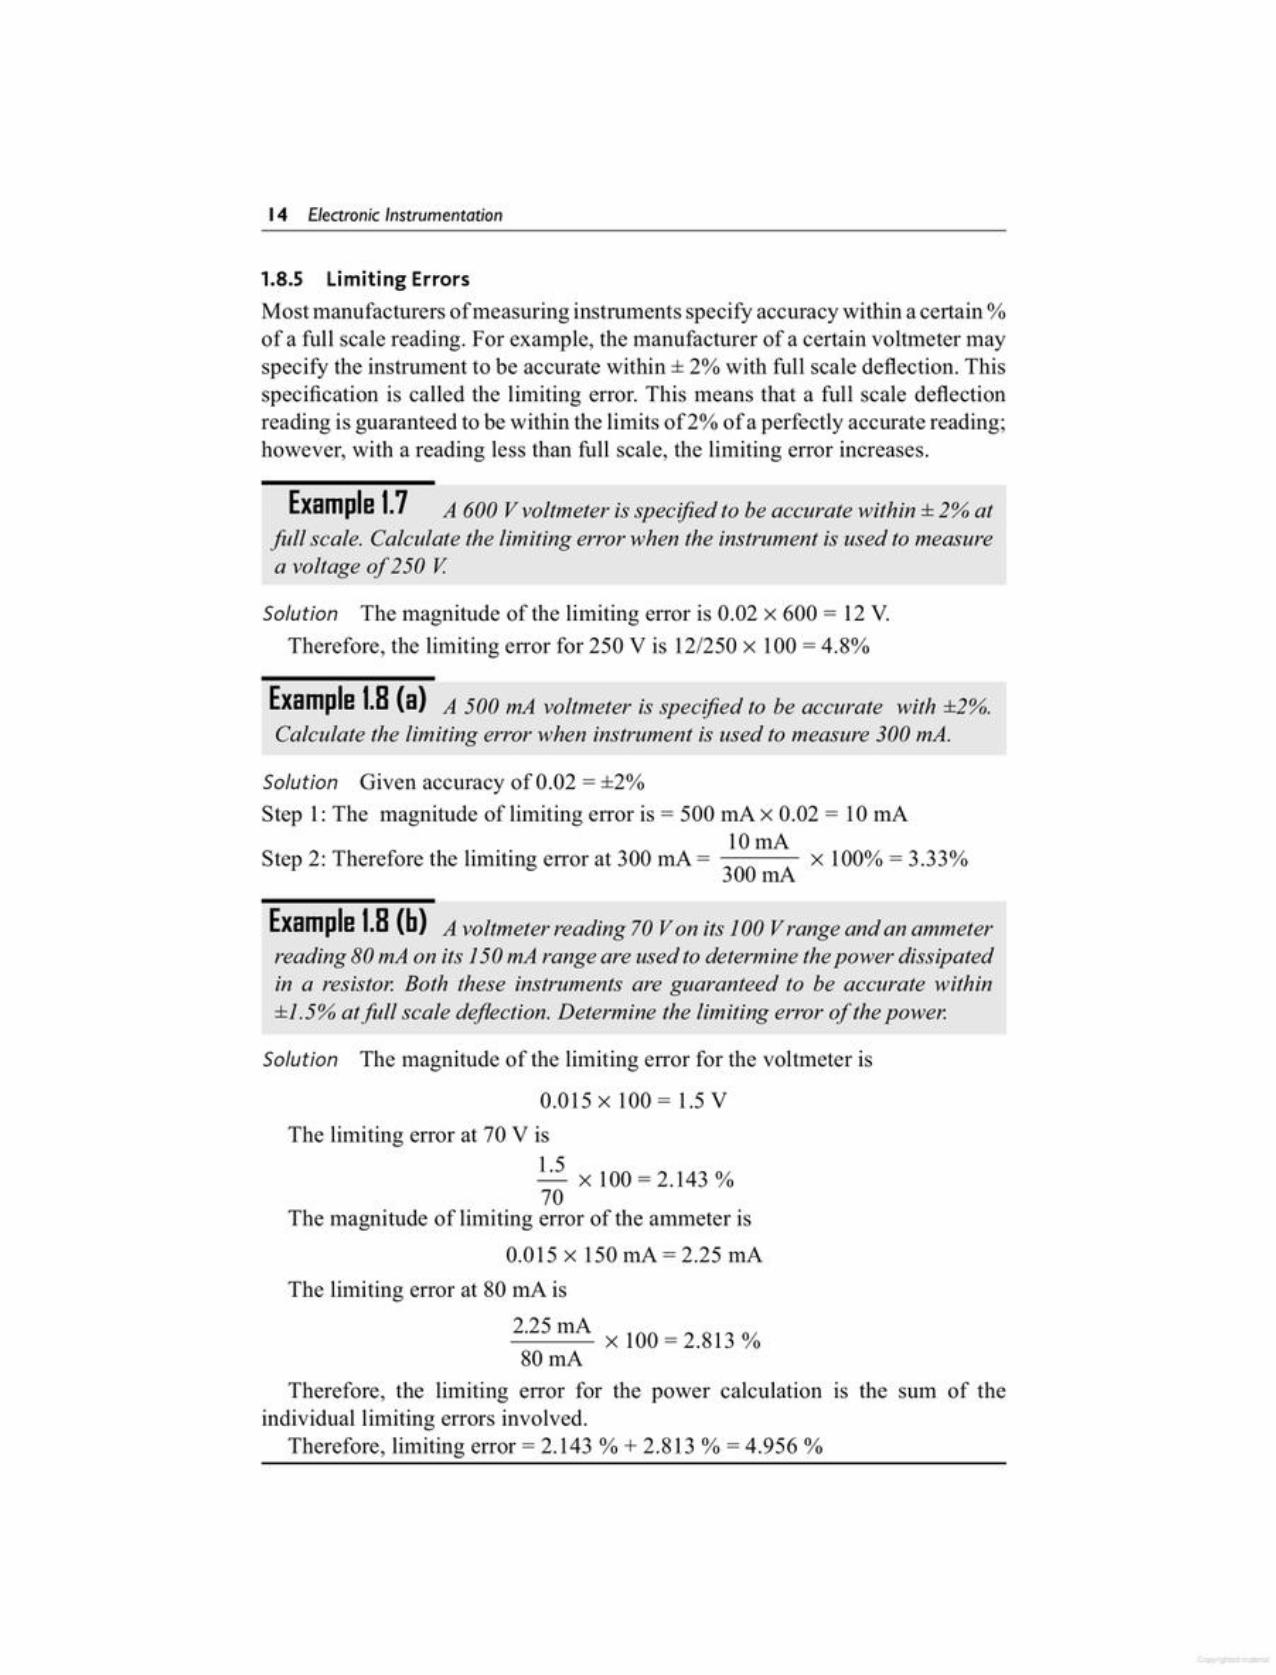
Therefore, the limiting error for the power calculation is the sum of theindividual limiting errors involved.
Therefore, limiting error = 2.143 % + 2.813 % = 4.956 %
x 100 = 2.813 %
0.015x 100= 1.5VThe limiting error at 70 V is
1.5 x 100 = 2.143 %70
The magnitude of limiting error of the ammeter is
0.015 x 150 rnA = 2.25 rnAThe limiting error at 80 rnA is
2.25mA80 rnA
Solution The magnitude of the limiting error for the voltmeter is
Solution Given accuracy of 0.02 = ±2%Step 1: The magnitude of limiting error is = 500 rnA x 0.02 = 10 rnA
10mAStep 2: Therefore the limiting error at 300 rnA = 300 rnA x 100% = 3.33%
Example 1.8 (b) A voltmeter reading 70 Von its 100 Vrange and an ammeterreading 80 rnAon its 150 mA range are used to determine the power dissipatedin a resistor. Both these instruments are guaranteed to be accurate within±1. 5% atfull scale deflection. Determine the limiting error of the power.
Example 1.8 (a) A 500 mA voltmeter is specified to be accurate with ±2%.Calculate the limiting error when instrument is used to measure 300 niA.
Solution The magnitude of the limiting error is 0.02 x 600 = 12 V.Therefore, the limiting error for 250 V is 12/250 x 100 = 4.8%
Example 1.7 A 600 V voltmeter is specified to be accurate within ± 2% atfoil scale. Calculate the limiting error when the instrument is used to measurea voltage o.f 250 V
1.8.S Limiting ErrorsMost manufacturers of measuring instruments specify accuracy wi thin a certain %of a full scale reading. For example, the manufacturer of a certain voltmeter mayspecify the instrument to be accurate within ± 2% with full scale deflection. Thisspecification is called the limiting error. This means that a full scale deflectionreading is guaranteed to be within the limits of2% ofa perfectly accurate reading;however, with a reading less than full scale, the limiting error increases.
14 Electron;c Instrumentat;on
1.9.2 Primary StandardsThe principle function of primary standards is the calibration and verification ofsecondary standards. Primary standards are maintained at the National StandardsLaboratories in different countries.
The primary standards are not available for use outside the National Laboratory.These primary standards are absolute standards of high accuracy that can be usedas ultimate reference standards.
1.9.1 International StandardsInternational standards are defined by International agreement. They areperiodically evaluated and checked by absolute measurements in terms offundamental units of Physics. They represent certain units of measurementto the closest possible accuracy attainable by the science and technology ofmeasurement. These International standards are not available to ordinary usersfor measurements and calibrations.
International Ohms It is defined as the resistance offered by a column of mercuryhaving a mass of 14.4521 gms, uniform cross-sectional area and length of 106.300cm, to the flow of constant current at the melting point of ice.
International Amperes It is an unvarying current, which when passed througha solution of silver nitrate in water (prepared in accordance with stipulatedspecifications) deposits silver at the rate of 0.00 111800 gm/s.
Absolute Units International units were replaced in 1948 by absolute units.These units are more accurate than International units, and differ slightly fromthem. For example,
1 International ohm = 1.00049 Absolute ohm1 International ampere = 0.99985 Absolute ampere
A standard is a physical representation of a unit of measurement. A known accuratemeasure of physical quantity is termed as a standard. These standards are used todetermine the values of other physical quantities by the comparison method.
In fact, a unit is realized by reference to a material standard or to naturalphenomena, including physical and atomic constants. For example, the fundamentalunit of length in the International system (SI) is the metre, defined as the distancebetween two fine lines engraved on gold plugs near the ends of a platinumiridium alloy at O°C and mechanically supported in a prescribed manner.
Similarly, different standards have been developed for other units ofmeasurement (including fundamental units as well as derived mechanical andelectrical units). All these standards are preserved at the International Bureau ofWeight and Measures at Sevres, Paris.
Also, depending on the functions and applications, different types of "standardsof measurement" are classified in categories (i) international, (ii) primary,(iii) secondary, and (iv) working standards.
1.9STANDARD
Qualities of Measurements I 5
All electrical measurements are based on the fundamental quantities I, RandV. A systematic measurement depends upon the definitions of these quantities.These quantities are related to each other by the Ohm's law, V = l.R. It istherefore sufficient to define only two parameters to obtain the definitions ofthe third. Hence, in electrical measurements, it is possible to assign values ofthe remaining standard, by defining units of other two standards. Standards ofemf and resistance are, therefore, usually maintained at the National Laboratory.The base values of other standards are defined from these two standards. Theelectrical standards are
(a) Absolute Ampere (b) Voltage Standard (c) Resistance Standard
1.10.1 Absolute AmpereThe International System of Units (SI) defines the Ampere, that is, the fundamentalunit of electric current, as the constant current which if maintained in two straightparallel conductors of infinite length placed one metre apart in vacuum, willproduce between these conductors a force equal to 2 x 10⁷ newton per metrelength. These measurements were not proper and were very crude. Hence, it wasrequired to produce a more practical, accurate and reproducible standard for theNational Laboratory.
Hence, by international agreement, the value of international ampere asdiscussed in the previous topic, was then based on the electrolytic deposition ofsilver from a silver nitrate solution. In this method, difficulties were encounteredin determining the exact measurement of the deposited silver and slightdifferences existed between the measurements made independently by variousNational Standard laboratories.
1.10ELECTRICAL STANDARDS
1.9.4 Working StandardsWorking standards are the principal tools of a measurement laboratory. Thesestandards are used to check and calibrate laboratory instrument for accuracyand performance. For example, manufacturers of electronic components such ascapacitors, resistors, etc. use a standard called a working standard for checkingthe component values being manufactured, e.g. a standard resistor for checkingof resistance value manufactured.
1.9.3 SecondaryStandardsSecondary standards are basic reference standards used by measurement andcalibration laboratories in industries. These secondary standards are maintainedby the particular industry to which they belong. Each industry has its ownsecondary standard. Each laboratory periodically sends its secondary standardto the National standards laboratory for calibration and comparison against theprimary standard. After comparison and calibration, the National StandardsLaboratory returns the Secondary standards to the particular industrial laboratorywith a certification of measuring accuracy in terms of a primary standard.
16 Electron;c Instrumentat;on
1.10.2 Voltage StandardsAs described before, if two parameters of Ohm's law are known, the third can beeasily derived. Standard voltage cell is used as one of the parameter.
The standard voltage called the saturated standard cell or standard cell wasbased on the principle of electrochemical cell for many years. But the standardcell had a drawback that it suffered from temperature dependence. This voltagewas a function of a chemical reaction and was not directly related to any otherphysical constants. Hence, a new standard for volt was developed. This standardused a thin film junction, which is cooled to nearly absolute zero and irradiatedwith microwave energy, a voltage is developed across the junction. This voltageis related to the irradiating frequency by the relation V = (h .j)/2e where h isthe Planck's constant (6.63 X 10⁻³⁴ J-s), 'e' is the charge of an electron (1.602x 10⁻¹⁹C) and '1.' is the frequency of the microwave irradiation. Since '/', theirradiating frequency is the only variable in the equation, hence the standard voltis related to the standard frequency (or time).
The accuracy of the standard volt including all system inaccuraciesapproximately is one part in 109, when the microwave irradiating frequency islocked to an atomic clock or to a broadcast frequency standard.
Standard cells are used for transferring the volt from the standard. Based onthe thin film junction to the secondary standards used for calibration, this deviceis called the normal or saturated Weston cell.
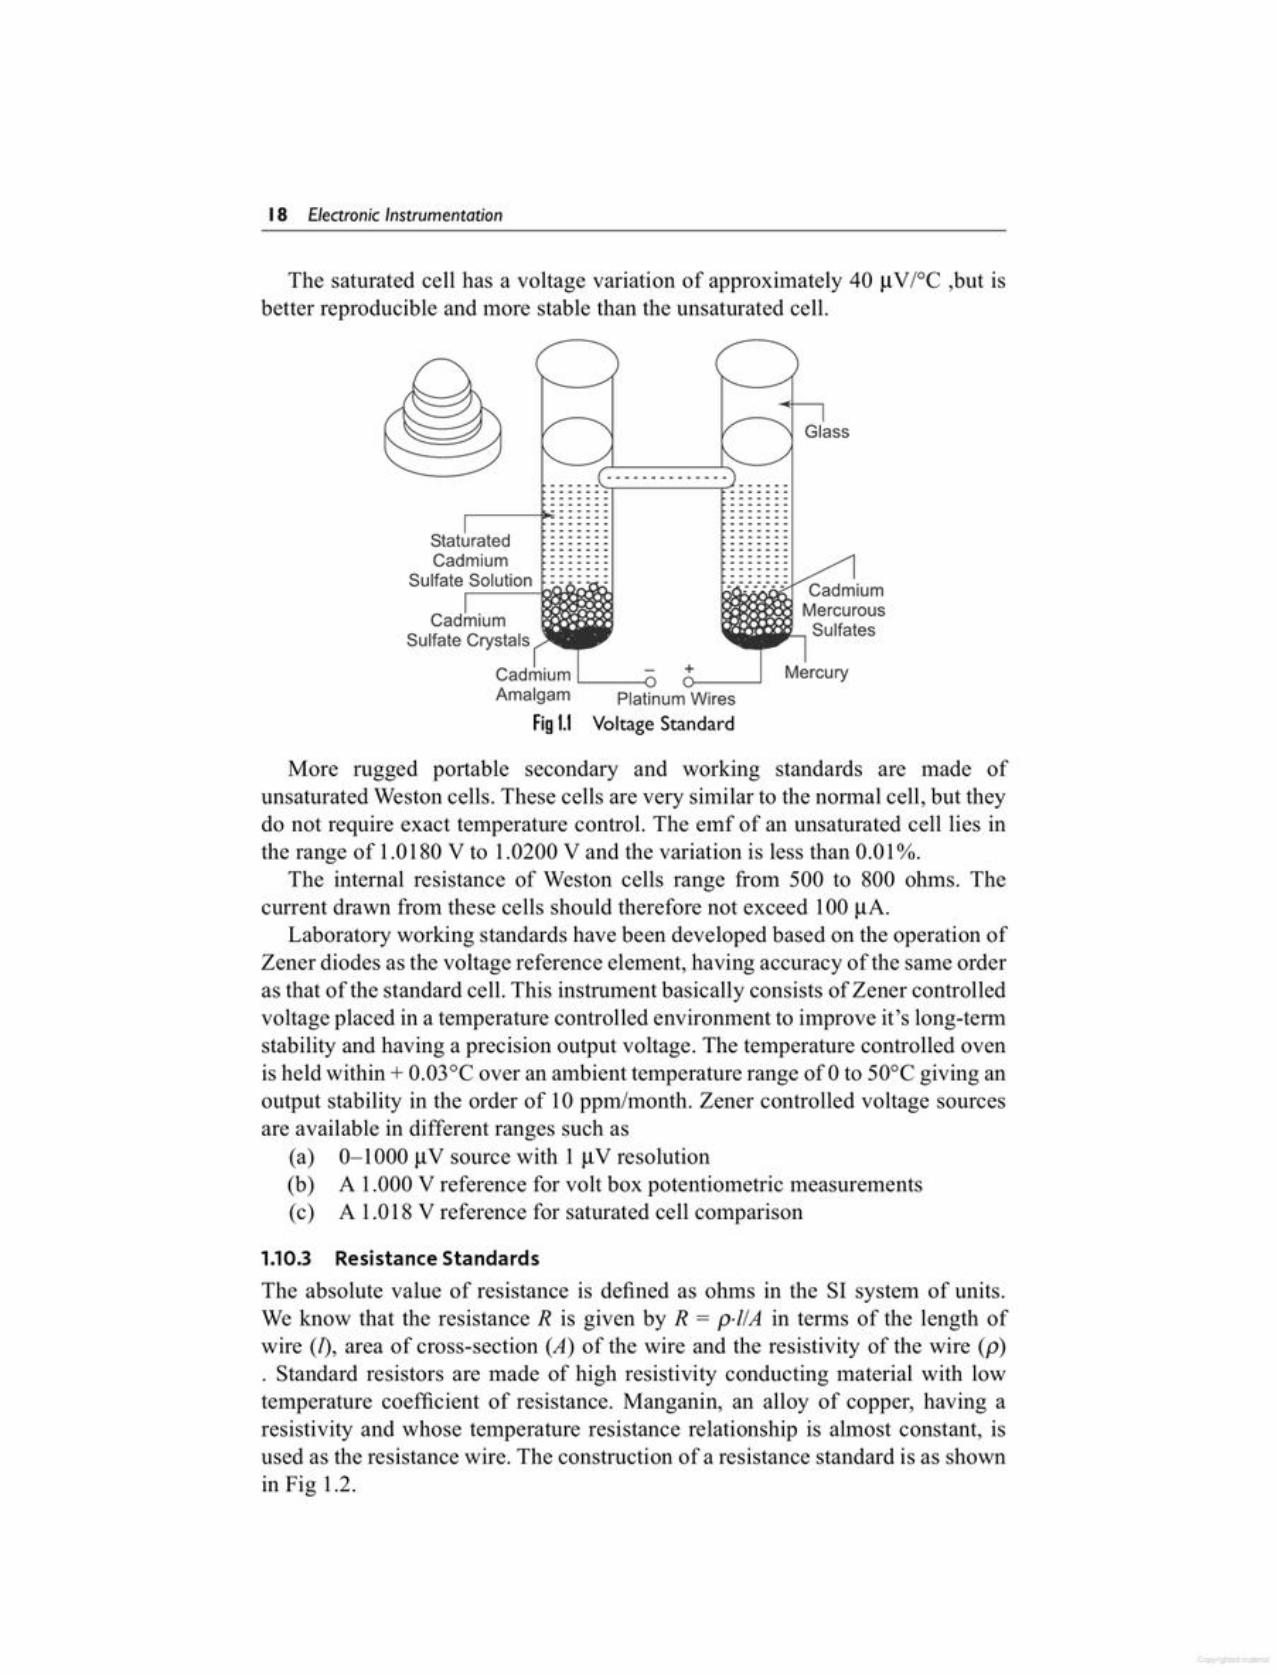
The saturated cell has mercury as the positive electrode and cadium amalgam(10% cadium). The electrolyte used is a solution of cadium sulphate. Theseelectrodes with the electrolyte are placed in a H-shaped glass container as shownin Fig 1.1.
There are two types of Weston cells called the saturated cell and the unsaturated cell. In a saturated cell, the electrolyte used is saturated at all temperaturesby the cadium sulphate crystals covering the electrodes.
In the unsaturated cell, the concentration of cadium sulphate is such that itproduces saturation at 40°C. The unsaturated cell has a negligible temperaturecoefficient of voltage at normal room temperature.
The International Ampere was then replaced by the Absolute Ampere. ThisAbsolute Ampere was determined by means of a current balance, which measuresthe force exerted between two current-carrying coils. This technique of forcemeasurement was further improved to a value of ampere which is much superiorto the early measurement (the relationship between force and the current whichproduces the force, can be calculated from the fundamental electromagnetictheory concepts).
The Absolute Ampere is now the fundamental unit of electric current in the SIsystem and is universally accepted by international agreements.
Voltage (V), cun·ent (1) and resistance (R) are related by Ohm's law V = l.R.If any of the two quantities is defined, the third can be easily known. In order todefine the Ampere with high precision over long periods of time, the standardvoltage cell and the standard resistor are used.
Qualities of Measurements 17
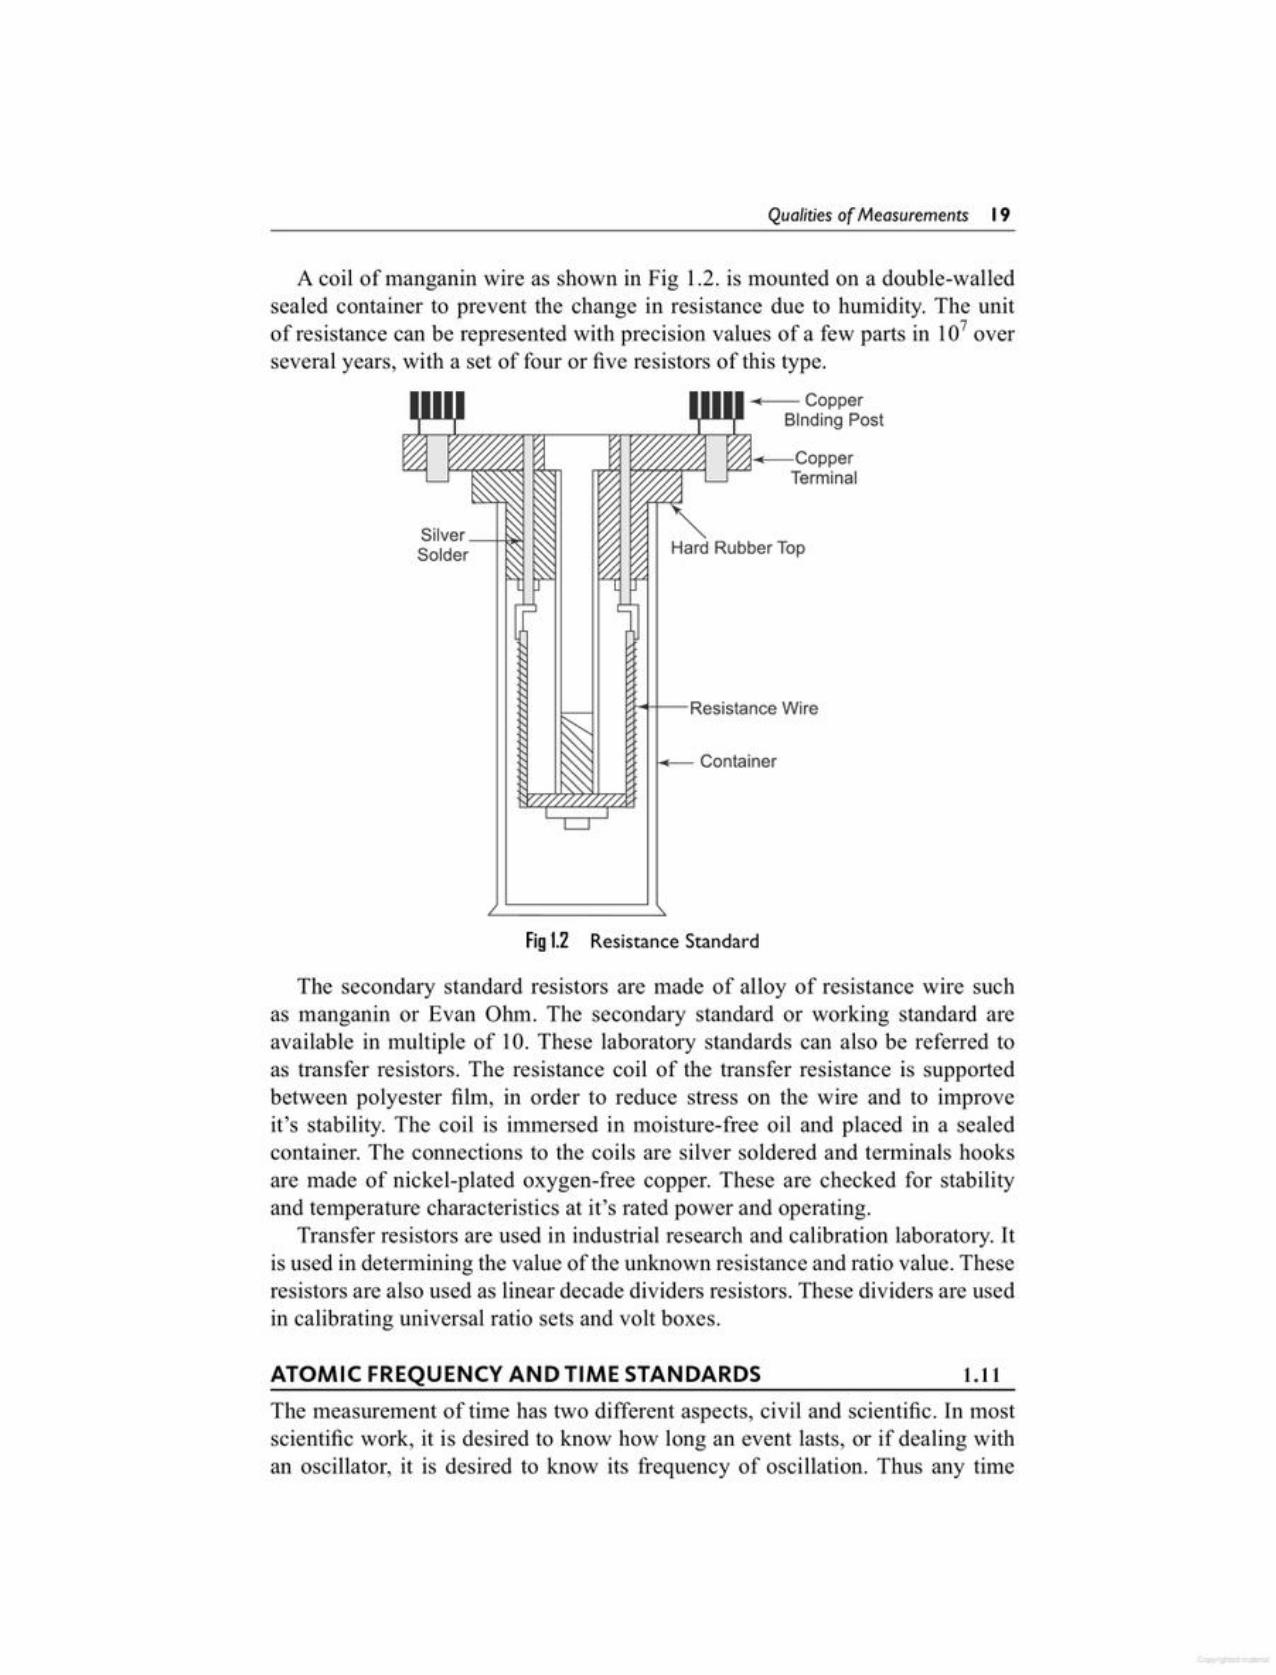
1.10.3 Resistance StandardsThe absolute value of resistance is defined as ohms in the SI system of units.We know that the resistance R is given by R = p·/IA in terms of the length ofwire (l), area of cross-section (A) of the wire and the resistivity of the wire (p). Standard resistors are made of high resistivity conducting material with lowtemperature coefficient of resistance. Manganin, an alloy of copper, having aresistivity and whose temperature resistance relationship is almost constant, isused as the resistance wire. The construction of a resistance standard is as shownin Fig 1.2.
More rugged portable secondary and working standards are made ofunsaturated Weston cells. These cells are very similar to the normal cell, but theydo not require exact temperature control. The emf of an unsaturated cell lies inthe range of 1.0180 V to 1.0200 V and the variation is less than 0.01%.
The internal resistance of Weston cells range from 500 to 800 ohms. Thecurrent drawn from these cells should therefore not exceed 100 !-lA.
Laboratory working standards have been developed based on the operation ofZener diodes as the voltage reference element, having accuracy of the same orderas that of the standard cell. This instrument basically consists of Zener controlledvoltage placed in a temperature controlled environment to improve it's long-termstability and having a precision output voltage. The temperature controlled ovenis held within + 0.03°C over an ambient temperature range of 0 to 50°C giving anoutput stability in the order of 10 ppm/month. Zener controlled voltage sourcesare available in different ranges such as
(a) O-IOOO!-lV source with IIlV resolution(b) A 1.000 V reference for volt box potentiometric measurements(c) A 1.018 V reference for saturated cell comparison
Sulfate Crystals
Cadmium '---0Amalgam Platinum Wires
Fig 1.1 Voltage Standard
StaturatedCadmium
Sulfate Solution
.-----p.;- ::::::
The saturated cell has a voltage variation of approximately 40 IlV1°C ,but isbetter reproducible and more stable than the unsaturated cell .
18 Electron;c Instrumentat;on
The measurement of time has two different aspects, civil and scientific. In mostscientific work, it is desired to know how long an event lasts, or if dealing withan oscillator, it is desired to know its frequency of oscillation. Thus any time
1.11ATOMIC FREQUENCY AND TIME STANDARDS
The secondary standard resistors are made of alloy of resistance wire suchas manganin or Evan Ohm. The secondary standard or working standard areavailable in multiple of 10. These laboratory standards can also be referred toas transfer resistors. The resistance coil of the transfer resistance is supportedbetween polyester film, in order to reduce stress on the wire and to improveit's stability. The coil is immersed in moisture-free oil and placed in a sealedcontainer. The connections to the coils are silver soldered and terminals hooksare made of nickel-plated oxygen-free copper. These are checked for stabilityand temperature characteristics at it's rated power and operating.
Transfer resistors are used in industrial research and calibration laboratory. Itis used in determining the value of the unknown resistance and ratio value. Theseresistors are also used as linear decade dividers resistors. These dividers are usedin calibrating universal ratio sets and volt boxes.
Fig 1.2 Resistance Standard
~- Container
H-+-Resistance Wire
Ha RubberTop
A coil of manganin wire as shown in Fig 1.2. is mounted on a double-walledsealed container to prevent the change in resistance due to humidity. The unitof resistance can be represented with precision values of a few parts in 107 overseveral years, with a set of four or five resistors of this type.
~-CopperBindingPost
Qualities of Measurements 19
Suppose that a certain voltage is measured 51 times. The result which might beobtained are shown in Table 1.2.
1.12GRAPHICAL REPRESENTATION OF MEASUREMENTS AS ADISTRIBUTION
standard must be able to answer both the question "what time is it" and the tworelated questions "how long does it last" or "what is its frequency".
Any phenomena that repeats itself can be used as a measure of time, themeasurement consisting of counting the repetitions. Of the many repetitivephenomena occurring in nature, the rotation of the earth on its axis whichdetermines the length of the day, has been long used as a time standard. Timedefined in terms of rotation of the earth is called Universal time (UT).
Time defined in terms of the earth's orbital motion is called Ephemersis time(ET). Both UT and ET are determined by astronomical observation. Since theseastronomical observations extend over several weeks for UT and several yearsfor ET, a good secondary terrestrial clock calibrated by astronomical observationis needed. A quartz crystal clock based on electrically sustained natural periodicvibrations of a quartz wafer serves as a secondary time standard. These clockshave a maximum error of 0.02 sec per year. One of the most common of timestandards is the determination of frequency.
In the RF range, frequency comparisons to a quartz clock can be madeelectronically to a precision of atleast 1 part in 1010.
To Ineet a better time standard, atomic clocks have been developed usingperiodic atomic vibrations as a standard. The transition between two energylevels, Eland E2 of an atom is accompanied by the emission (or absorption) ofradiation given by the following equation
E2 -E1v = --=----!...h
where v = fi·equencyof emission and depends on the internal structure of anatoln
h = Planck's constant = 6.636 x 10⁻³⁴ J-sec.Provided that the energy levels are not affected by the external conditions
such as magnetic field etc.Since frequency is the inverse of the time interval, time can be calibrated in
terms of frequency.The atomic clock is constructed on the above principle. The first atomic clock
was based on the Cesium atom,The International Committee of Weights and Measures defines the second
in terms of the frequency of Cesium transitions, assigning a value of 9,192,631,770 Hz to the hyperfine transitions of the Cesium atom unperturbed byexternal fields. If two Cesium clocks are operated at one precision and if thereare no other sources of error, the clocks will differ by only Is in 5000 years.
20 Electron;c Instrumentat;on
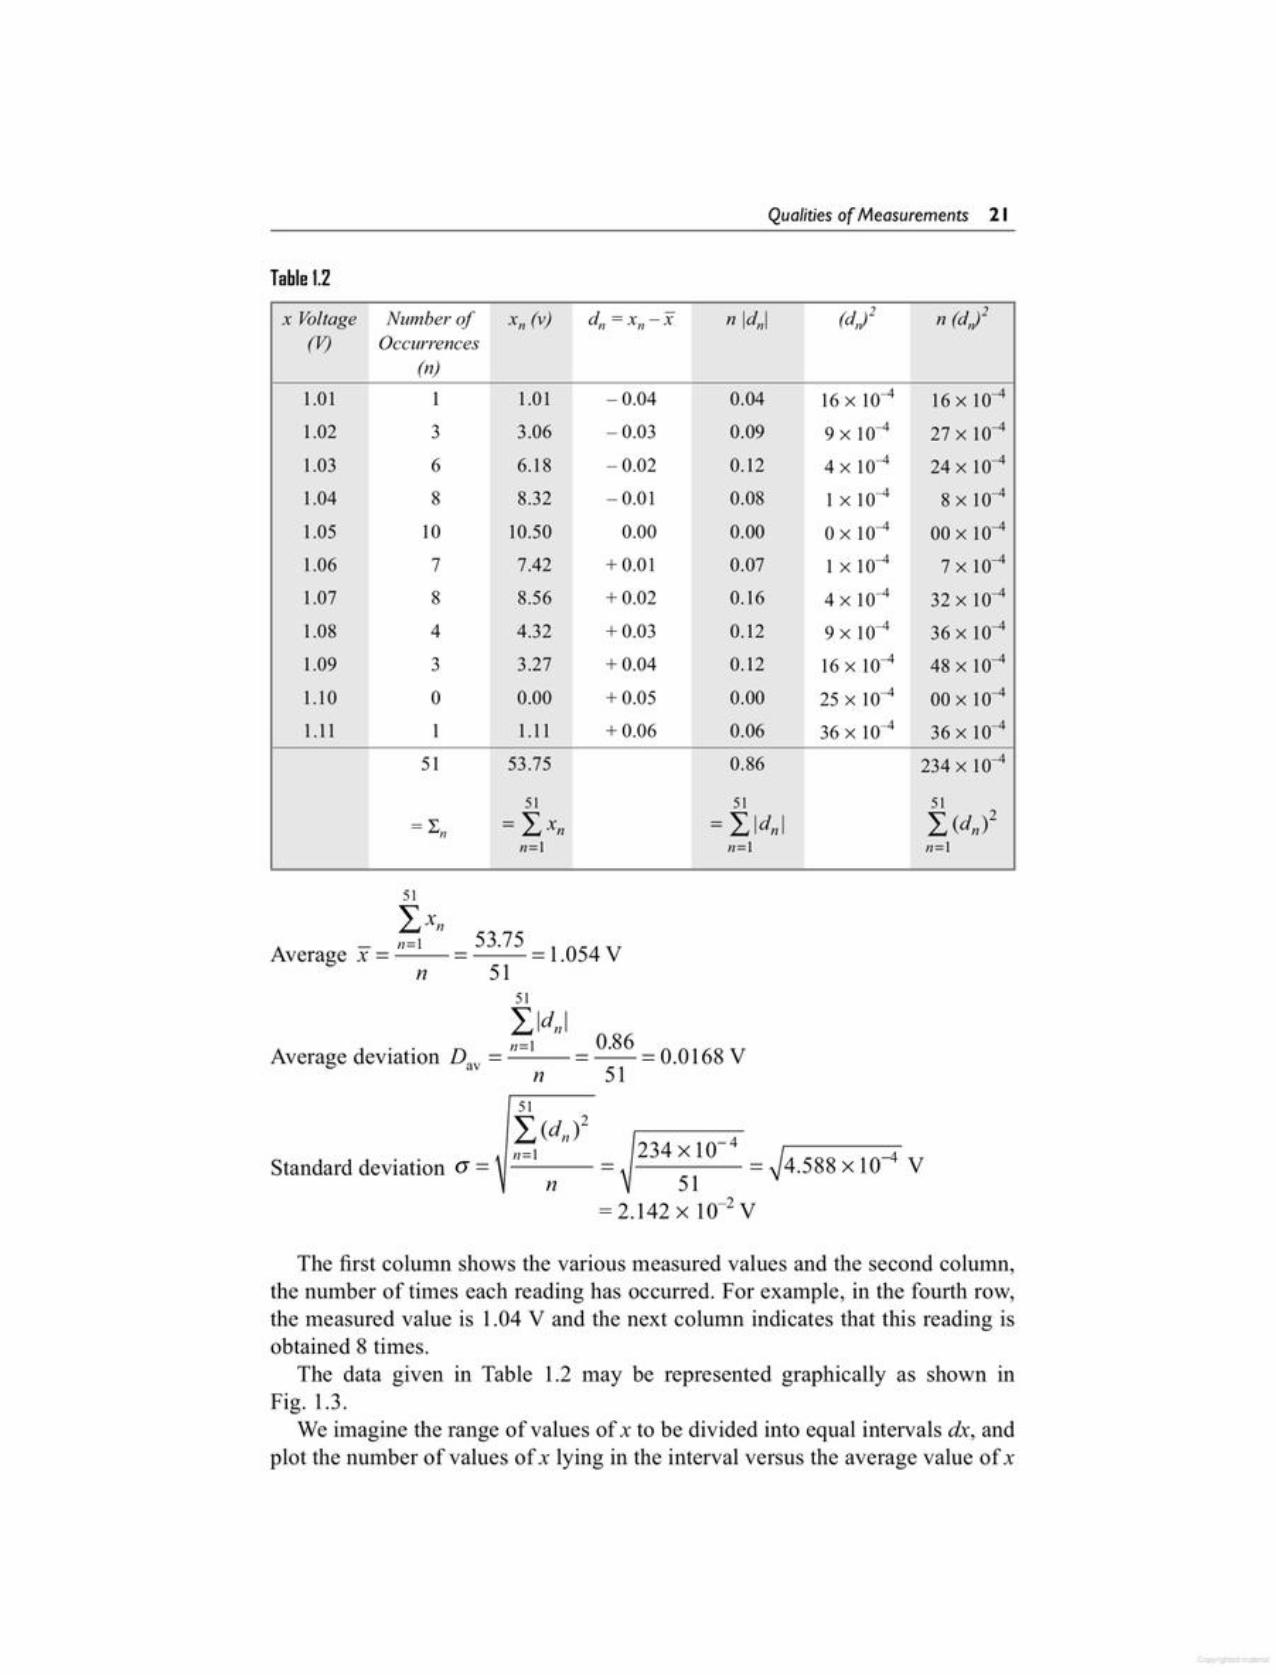
The first column shows the various measured values and the second column,the number of times each reading has occurred. For example, in the fourth row,the measured value is 1.04 V and the next column indicates that this reading isobtained 8 times.
The data given in Table 1.2 may be represented graphically as shown inFig. 1.3.
We imagine the range of values of x to be divided into equal intervals dx, andplot the number of values of x lying in the interval versus the average value of x
51I,(d,,)2 -4
,,=1 = 234 x 10 = J4.588 X 10-4 Vn 51
= 2.142 x 10⁻² V
Standard deviation (J =
51
I,ldlllAverage deviation Dav = n=1 = 0.86 = 0.0168 V
n 51
51
I,xnAverage x = n=1 = 53.75 = 1.054V
n 51
x Voltage Number of «, (v) d; = XII-X n Idnl (d,J2 2n (d.)(V) Occurrences
(n)
1.01 I 1.01 -0.04 0.04 16 x 10-4 16 X 10-4
1.02 3 3.06 -0.03 0.09 9 x 10⁻⁴ 27x10-4
1.03 6 6.18 -0.02 0.12 4 x 10⁻⁴ 24 X 10-4
1.04 8 8.32 - 0.01 0.08 1 x 10⁻⁴ 8 x 10⁻⁴
1.05 10 10.50 0.00 0.00 Ox 10-4 00 X 10-4
1.06 7 7.42 + 0.01 0.07 1 x 10⁻⁴ 7 X 10⁻⁴
1.07 8 8.56 +0.02 0.16 4 x 10⁻⁴ 32 X 10-4
1.08 4 4.32 + 0.03 0.12 9 x 10⁻⁴ 36 X 10-4
1.09 3 3.27 +0.04 0.12 16 x 10-4 48 X 10-4
1.10 0 0.00 + 0.05 0.00 25 x 10-4 00 X 10-4
1.11 I 1.11 +0.06 0.06 36 x 10-4 36xl0-4
51 53.75 0.86 234 x 10-4
51 51 51
= :E" = L.x" = L.ldlll L. (dn)2n=1 11=1 n=1
Table 1.2
Qualities of Measurements 21
11. What are the causes of environmenterrors?
12. How are instrumental errors differentfrom gross errors? Explain.
13. Define absolute errors.14. How is accuracy expressed?15. What are the different types of errors
that occur during measurement? Explain each.
16. What do you understand by dynamiccharacteristics of an instrument?
17. Define speed of response and fidelity.
18. Differentiate between lag and dynamic error.
19. What are limiting errors? What is thesignificance of limiting errors?
20. Define the following terms:
I. What do you understand by staticcharacteristics?
2. List different static characteristics.3. Define the terms: instrument, accu
racy, precision and errors.4. Define the terms: resolution, sensi
tivity and expected value.5. Discuss the difference between accu
racy and precision of a measurement6. List different types of errors.7. Explain gross error in details. How
can it be minimized?8. Explain systematic error in detail.
How can it be minimized?9. Explain random error in detail.10. A person using an ohmmeter reads
the measured value as 470 n,whenthe actual value is 47 n. What kindof error does this represent?
Review Duestions I-----------------------------~
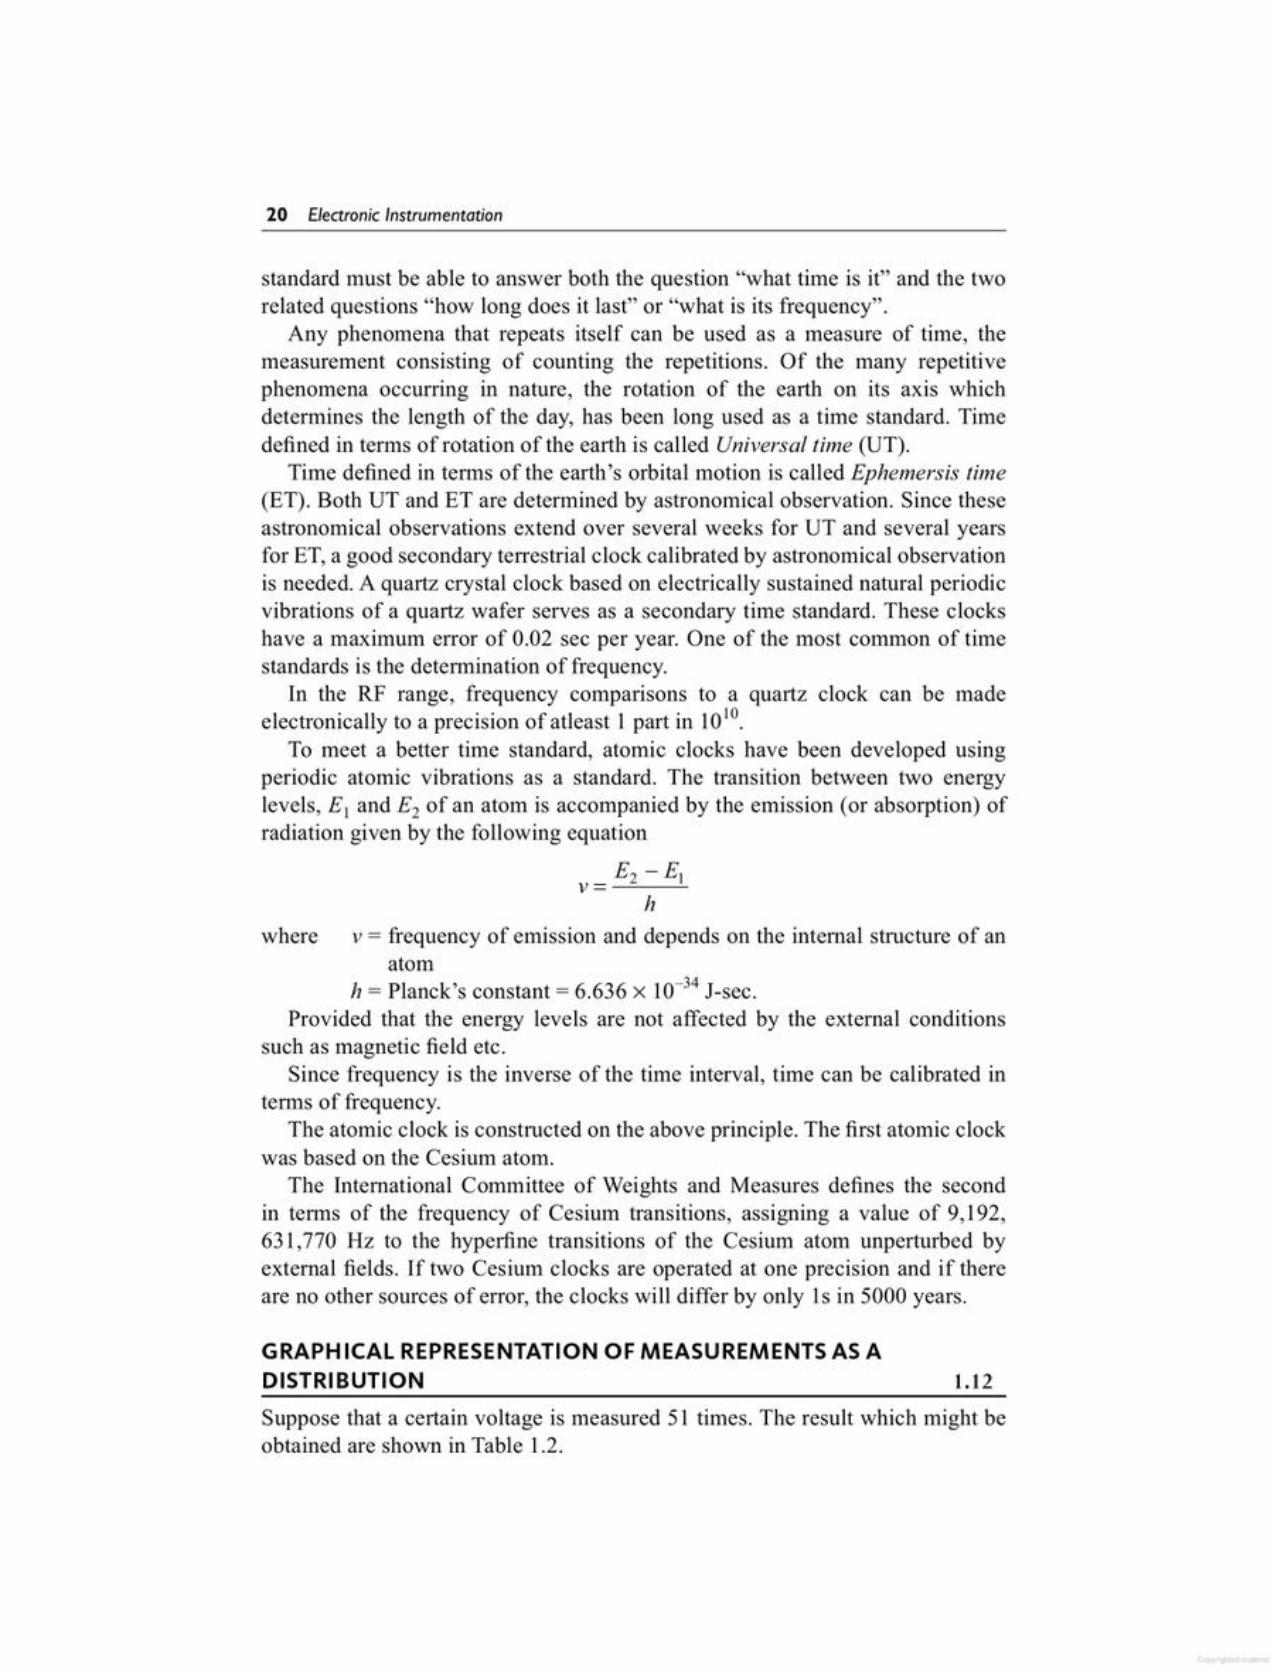
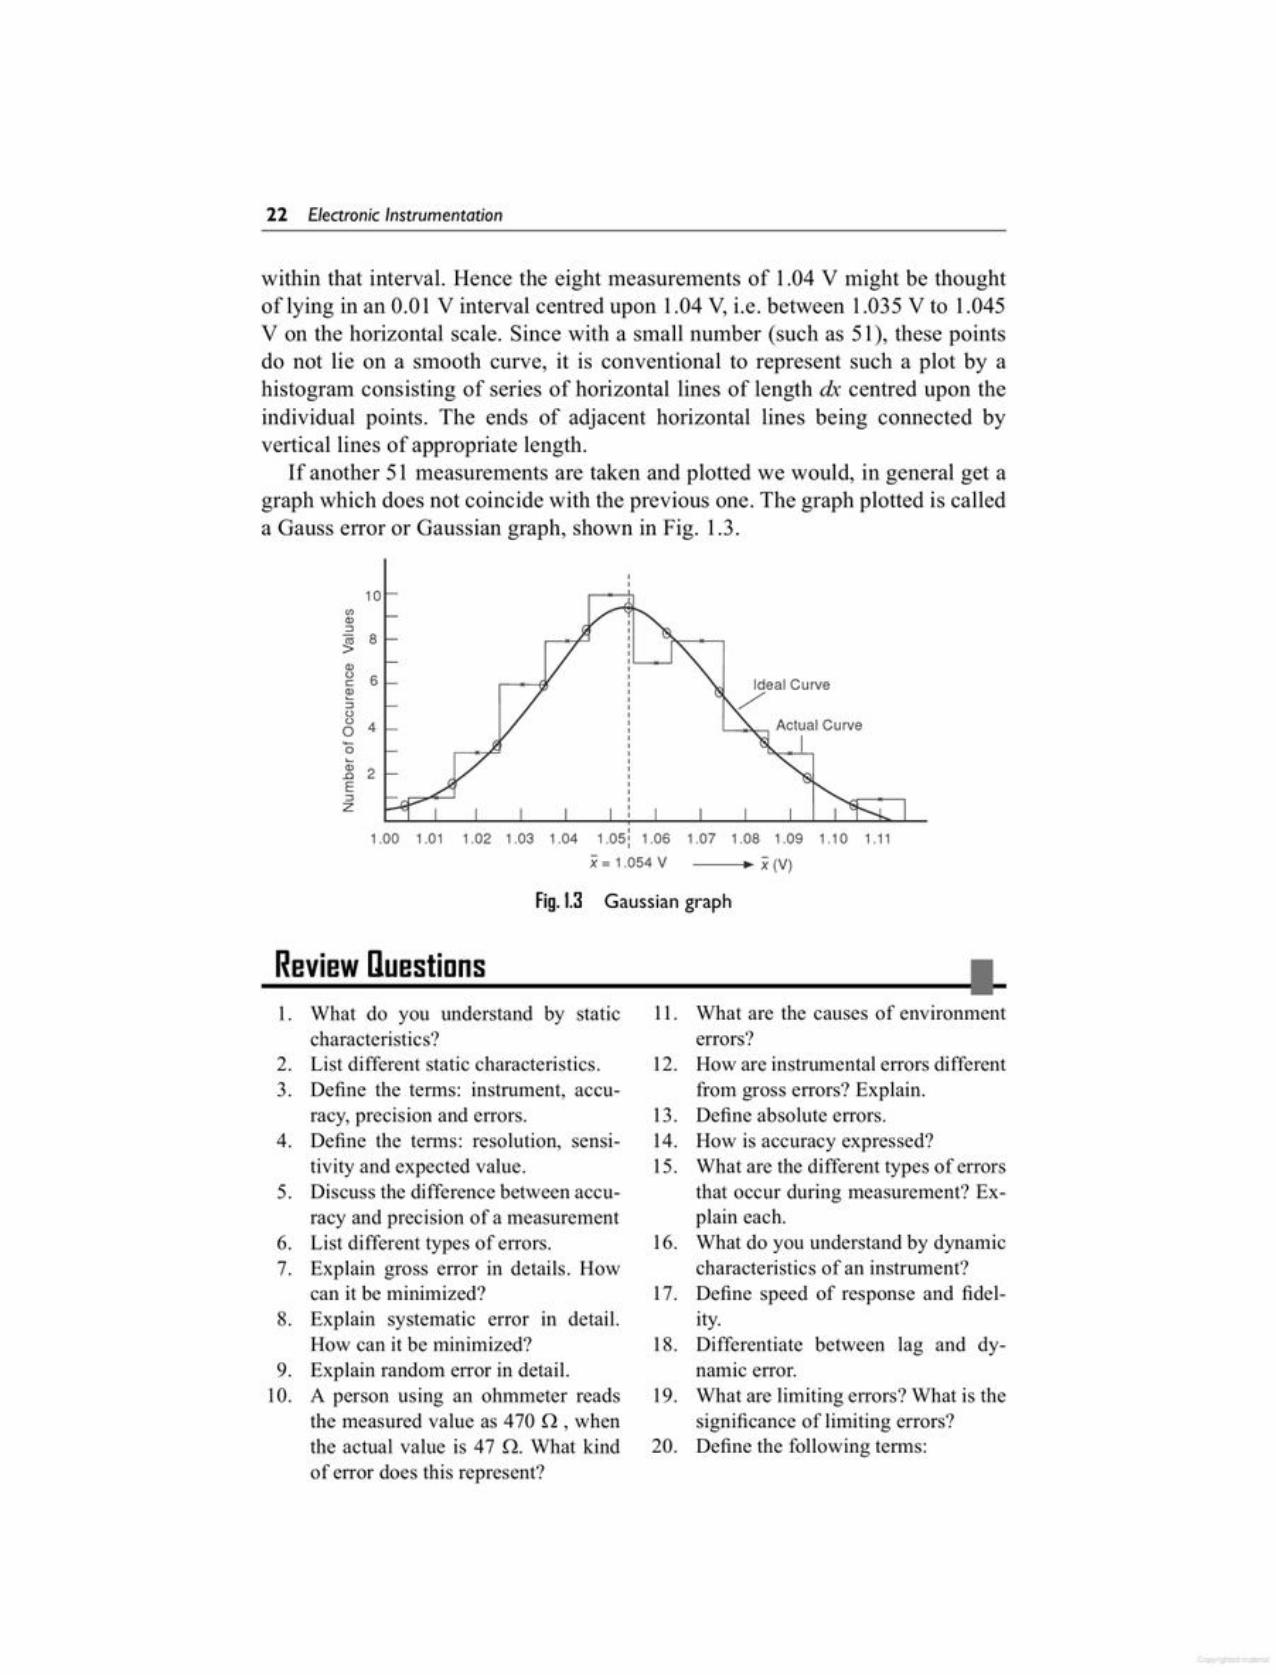
Gaussian graphFig. 1.3
1.05, 1.06 1.07 1.08 1.09 1.10 1.11
Ii= 1.054V Ii (V)1.001.01 1.021.031.04
~.2: 2E::JZ
IF)Q)::J- 8~Q)
g 6~::Jo(5 4
within that interval. Hence the eight measurements of 1.04 V might be thoughtof lying in an 0.01 V interval centred upon 1.04 V, i.e. between 1.035V to 1.045V on the horizontal scale. Since with a small number (such as 51), these pointsdo not lie on a smooth curve, it is conventional to represent such a plot by ahistogram consisting of series of horizontal lines of length dx centred upon theindividual points. The ends of adjacent horizontal lines being connected byvertical lines of appropriate length.
If another 51 measurements are taken and plotted we would, in general get agraph wbich does not coincide witb the previous one. Tbe graph plotted is calleda Gauss error or Gaussian graph, shown in Fig. 1.3.
22 Electron;c Instrumentat;on
(a) noise (b) temperature(c) light (d) mains voltage
8. The ability of an instrument to respond to the weakest signal is defined as(a) sensitivity (b) repeatability(c) resolution (d) precision.
9. The difference between the expectedvalue of the variable and the measured variable is termed(a) absolute error(b) random error(c) instrumental error(d) gross error
10. Accuracy is expressed as(a) relative accuracy(b) % accuracy(c) error(d) % error
11. Error is expressed as(a) absolute error (b) relative error(c) % error (d) % accuracy
12. Gross errors occurs due to(a) human error(b) instrumental error(c) environmental error(d) random error
13. Static errors are caused due to(a) measuring devices(b) human error(c) environmental error(d) observational error
1. The closeness of values indicated byan instrument to the actual value isdefined as(a) repeatability (b) reliability(c) uncertainty (d) accuracy.
2. Precision is defined as(a) repeatability (b) reliability(c) uncertainty (d) accuracy
3. The ratio of change in output to thechange in the input is called(a) precision (b) resolution(c) sensitivity (d) repeatability
4. The deviation of the measured valueto the desired value is defined as(a) error (b) repeatability(c) hystersis (d) resolution
5. Improper setting of range of a multimeter leads to an error called(a) random error(b) limiting error(c) instrumental error(d) observational error
6. Errors that occur even when all thegross and systematic errors are takencare of are called(a) environmental errors(b) instrumental errors(c) limiting errors(d) random errors.
7. A means of reducing environmentalerrors is the regulation of ambient
_M_u_lt.ip_le_C_h_Di_ce__ Uu_e_st_iD_n_s ~
26. What do you understand by a working standard?
27. State the difference between secondary and working standards.
28. Explain in brief atomic frequencyand time standards.
29. How is time defined?30. What do you understand by electrical
standard?31. List different types of electrical stan
dards.
(i) Average value (ii) Arithmeticmean (iii) Deviation (iv) Standarddeviation
21. What do you mean by a standard?What is the significance of standard?
22. What are international standards?List various international standards.
23. Define primary and secondary standards?
24. What are primary standards? Whereare they used?
25. What are secondary standards?Where are they used?
Qualities of Measurements 23
3. Yardley Beers, Theory of Errors,1967.
4. Resnick and Halliday, Physics, WileyEastern, 1987.
1. Barry Jones, instrumentation Measurements and Feedback.
2. Larry D. Jones and A. Foster Chin,Electronic Instruments and Measurement, John Wiley and Sons, 1987.
_F_ur_t_he_r_R_ea_d_in~g ~1-
Which is the most precise measurement?
6. A 270 Q + 10<Yo resistance is connected to a power supply source operating at 300 V dc.What range of current would flow ifthe resistor varied over the range of+ 10% of its expected value? What isthe range of error in the current?
7. A voltmeter is accurate to 98% of itsfull scale reading.(i) If a voltmeter reads 200 V on
500 V range, what is the absolute error?
(ii) What is the percentage errorreading of Part (i)?
8. The expected value of voltage acrossa resistor is 100 V. However, thevoltmeter reads a value of 99 V.Calculate (a) absolute error, (b) %error, (c) relative error, and (d) %accuracy.
1. The current through a resistor is 3.0A, but measurement gives a value of2.9 A. Calculate the absolute errorand % error of the measurement.
2. The current through a resistor is 2.5A, but measurement yields a value of2.45 A. Calculate the absolute errorand % error of the measurement.
3. The value of a resistor is 4.7 k-ohms,while measurement yields a value of4.63 K-ohms.Calculate (a) the relative accuracy,and (b) % accuracy.
4. The value ofa resistor is 5.6 K-ohms,while measurement reads a value of5.54K-ohITIS.Calculate (a) the relativeaccuracy, and (b)% accuracy.
5. The output voltage of an amplifierwas measured at eight different intervals using the same digital voltmeterwith the following results: 20.00,19.80, 19.85, 20.05, 20.10, 19.90,20.25, 19.95.
Practice Problems I---------------------------------~
15. Limiting errors are(a) manufacturer's specifications of
accuracy(b) manufacturer'S specifications of
instrumental error(c) environmental errors(d) random errors
14. Dynamic errors are caused by(a) instrument not responding fast(b) human error(c) environmental error(d) observational error
24 Electron;c Instrumentat;on
2.1.1 Typesof InstrumentThe following types of instrument are mainly used as ammeters and voltmeters.
1. PMMC 2. Moving Iron3. Electrodynamometer 4. Hot wire5. Thermocouple 6. Induction type7. Electrostatic 8. RectifierOf these, the PMMC type can be used for dc measurements only, and the
induction type for ac measurements only. The other types can be used for both.The moving coil and moving iron types depend upon the magnitude effect of
current. The latter is the most commonly used form of indicating instrument, aswell as the cheapest. It can be used for both ac and de measurements and is veryaccurate, if properly designed.
The PMMC instrument is the most accurate type for dc measurement.Instrument of this type are frequently constructed to have substandard accuracy.
The calibration of the electrodynamometer type of instrument is the samefor ac and de. The same situation prevails for thermal instruments. These areparticularly suitable for ac measurements, since their deflection depends directlyupon the heating effect of the ac, i.e. upon the rms value of the current. Theirreadings are therefore independent of the frequency.
Electrostatic instruments used as voltmeters have the advantage that theirpower consumption is exceedingly small. They can be made to cover a largerange of voltage and can be constructed to have sub-standard accuracy.
Analogue ammeters and voltmeters are classified together, since there is nobasic difference in their operating principles. The action of all ammeters andvoltmeters, except those of the electrostatic variety, depends upon a deflectingtorque produced by an electric current. In an ammeter this torque is producedby the current to be measured, or by a definite traction of it. In a voltmeter it isproduced by a current that is proportional to the voltage to be measured. Henceboth voltmeters and ammeters are essentially current measuring devices.
The essential requirements of a measuring instrument are (a) that itsintroduction into the circuit where measurements are to be made, should not alterthe circuit conditions, and (b) the power consumed by it be small.
2.1INTRODUCTION
Indicators andDisplay Devices
c=Bw A'x l x Nwhere "C= torque, Newton-meter
B = flux density in the air gap, Wb/m2
A = effective coil area (ln2)N = number of turns of wire of the coil1= current in the movable coil (amperes)
The equation shows that the developed torque is proportional to the fluxdensity of the field in which the coil rotates, the current coil constants (area andnumber of turns). Since both flux density and coil constants are fixed for a giveninstrument, the developed torque is a direct indication of the current in the coil.The pointer deflection can therefore be used to measure current.
2.2.1 Permanent Magnetic Moving Coil MovementIn this instrument, we have a coil suspended in the magnetic field of a permanentmagnet in the shape of a horse-shoe. The coil is suspended so that it can rotatefreely in the magnetic field. When current flows in the coil, the developed(electromagnetic) torque causes the coil to rotate. The electromagnetic (EM)torque is counterbalanced by a mechanical torque of control springs attachedto the movable coil. The balance of torques, and therefore the angular positionof the movable coil is indicated by a pointer against a fixed reference called ascale. The equation for the developed torque, derived from the basic law forelectromagnetic torque is
D'Arsonval principleFig. 2.1+
s
sN
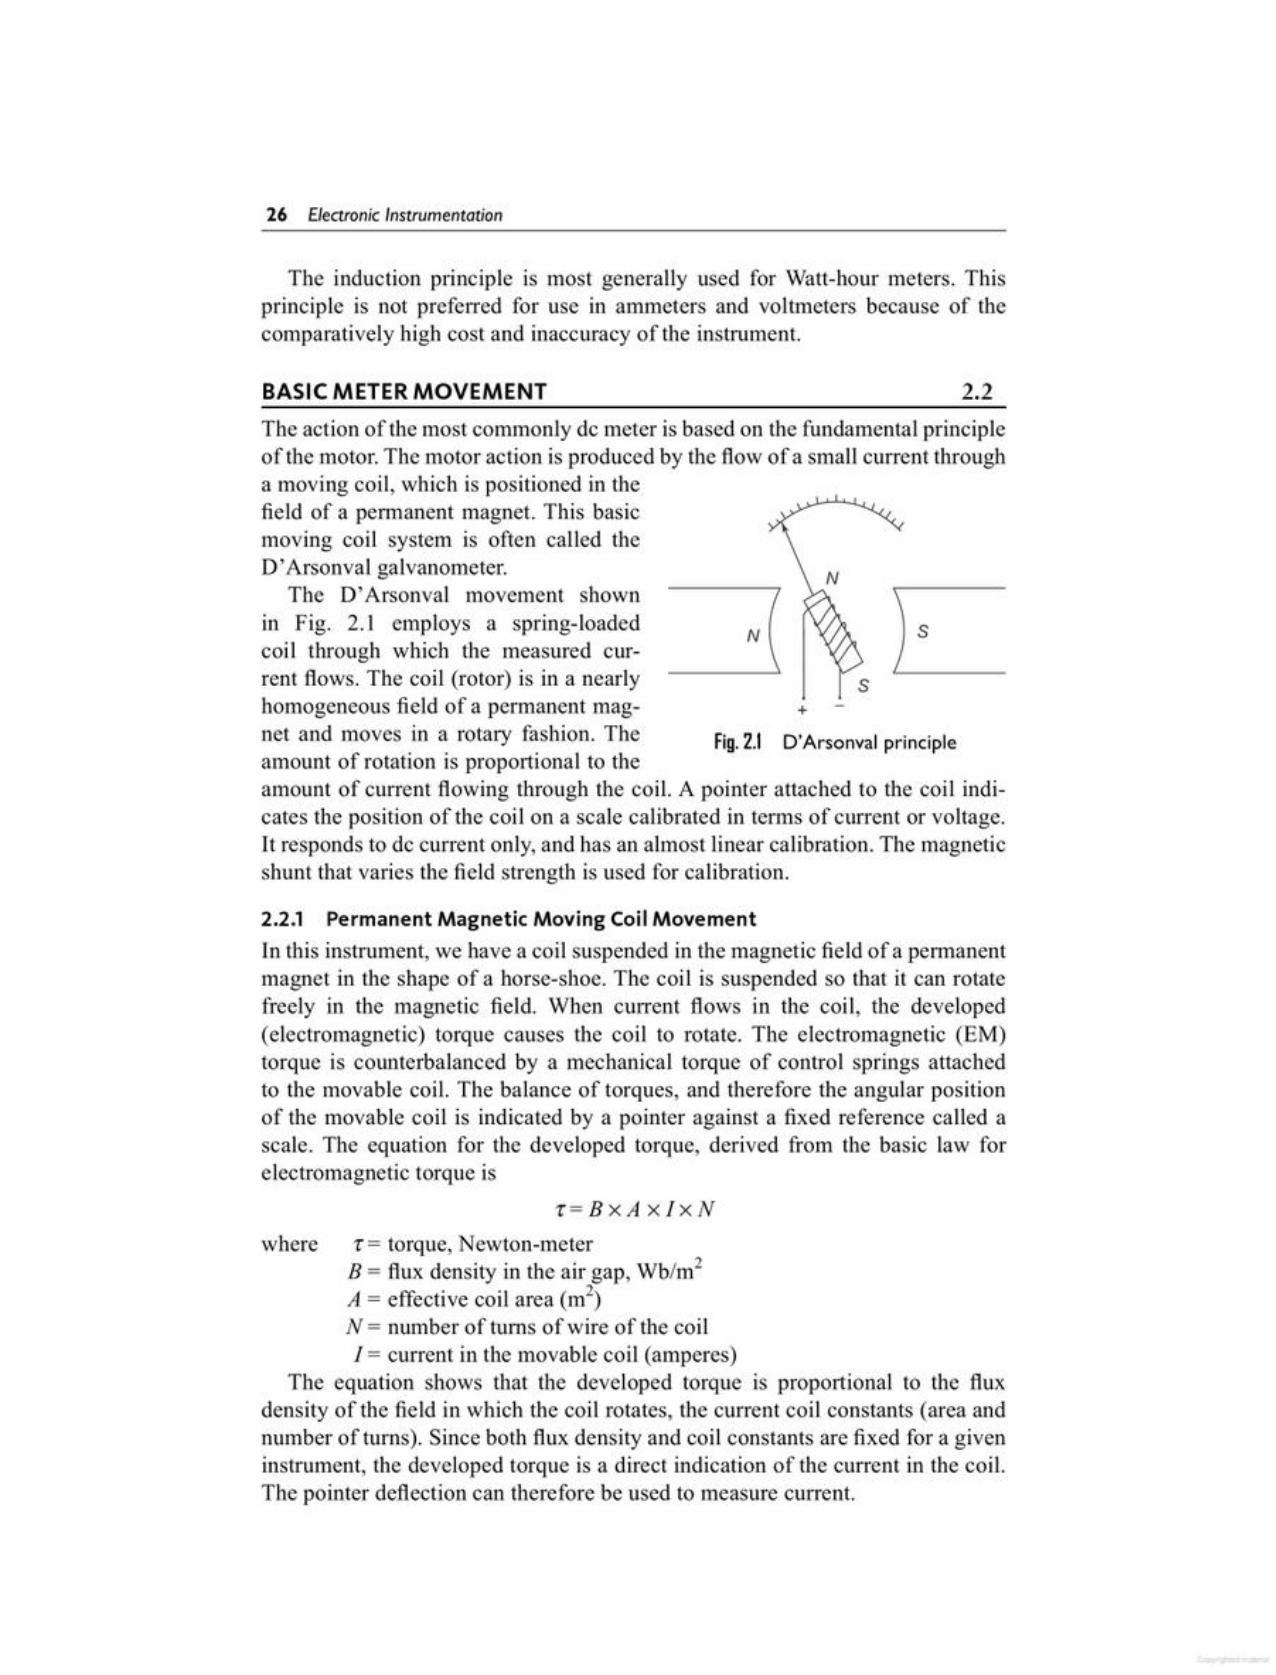
The action of the most commonly de meter is based on the fundamental principleof the motor. The motor action is produced by the flow of a small current througha moving coil, which is positioned in thefield of a permanent magnet. This basicmoving coil system is often called theD'Arsonval galvanometer.
The D' Arsonval movement shownin Fig. 2.1 employs a spring-loadedcoil through which the measured current flows. The coil (rotor) is in a nearlyhomogeneous field of a permanent magnet and moves in a rotary fashion. Theamount of rotation is proportional to theamount of current flowing through the coil. A pointer attached to the coil indicates the position of the coil on a scale calibrated in terms of current or voltage.It responds to de current only, and has an almost linear calibration. The magneticshunt that varies the field strength is used for calibration.
2.2BASIC METER MOVEMENT
The induction principle is most generally used for Watt-hour meters. Thisprinciple is not preferred for use in ammeters and voltmeters because of thecomparatively high cost and inaccuracy of the instrument.
26 Electron;c Instrumentat;on
2.2.2 Practical PMMC MovementThe basic PMMC movement (also called a D'Arsonval movement) offers thelargest magnet in a given space, in the form of a horse-shoe, and is used whena large flux is required in the air gap. The D'Arsonval movement is based on
Solution The deflecting torque is given by
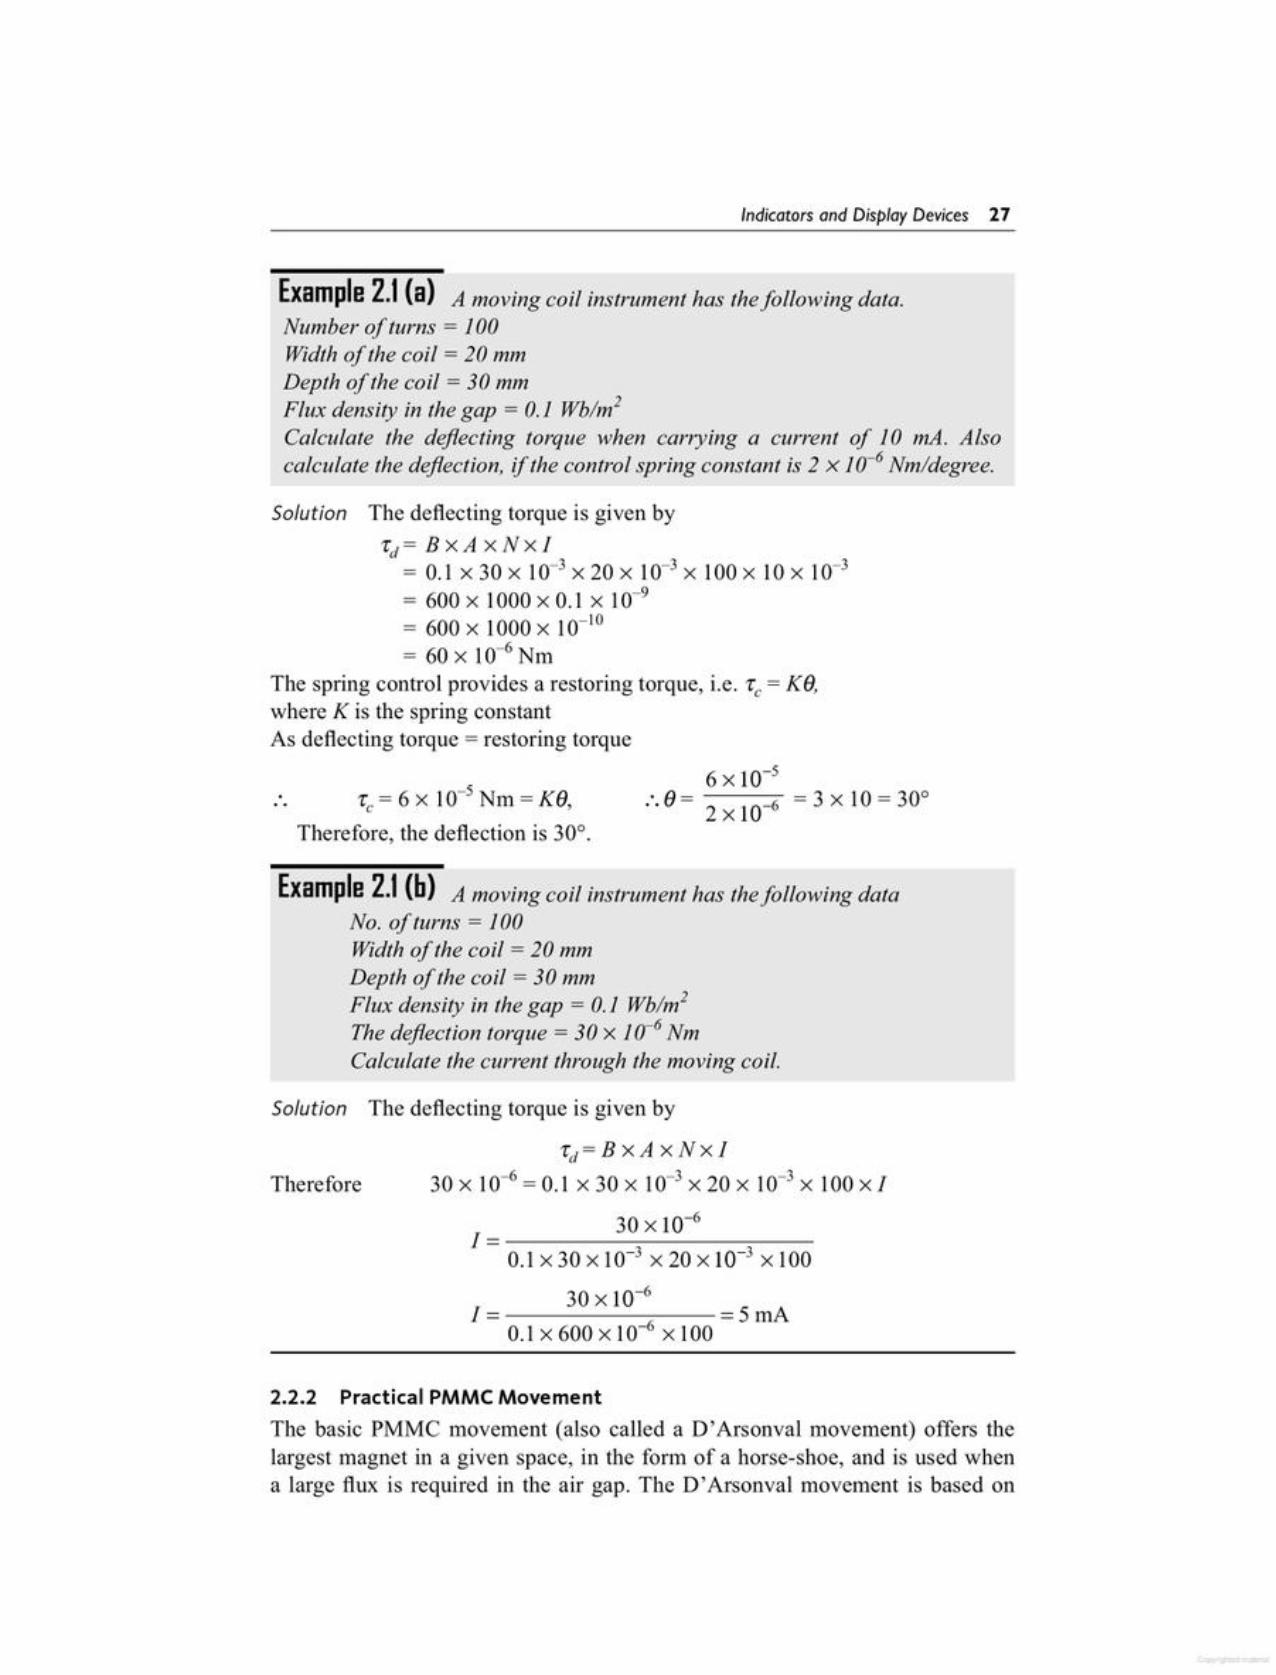
'rd=B xA xNxI30 x 10-6 = 0.1 x 30 x 10-3 X 20 x 10-3 X 100 x J
I=- 30xlO-60.1 x 30 x 10-3 X 20 X 10-3 X 100
I =- 30 x 10-6 =- 5 rnA0.1 x 600 x 10-6 X 100
Therefore
Example 2.1 (b) A moving coil instrument has the following dataNo. of turns = 100Width of the coil = 20 mmDepth of the coil = 30 mmFlux density in the gap = 0.1 Wblm2
The deflection torque = 30 x 10-6 NmCalculate the current through the moving coil.
Therefore, the deflection is 30°.
6 X 10⁻⁵:.f)= 2x10-6 =3xlO=30°'r = 6 x 10⁻⁵ Nm = Kf)c ,
Solution The deflecting torque is given by'rd= B x A x N x I
= 0.1 x30x 10-3x20x 10-3 X 100x lOx 10-3= 600 x 1000 x 0.1 X 10-9= 600 x 1000 X 10-10= 60 x 10-6Nm
The spring control provides a restoring torque, i.e. 'rc = Ki),where K is the spring constantAs deflecting torque = restoring torque
Example 2.1 (a) A moving coil instrument has the following data.Number of turns = 100Width of the coil = 20 mmDepth of the coil = 30 mmFlux density in the gap = 0.1 Wblm2
Calculate the deflecting torque when carrying a current of lOrnA. Alsocalculate the deflection, if the control spring constant is 2 X 10⁻⁶ Nmldegree.
Indicators and Display Devices 27
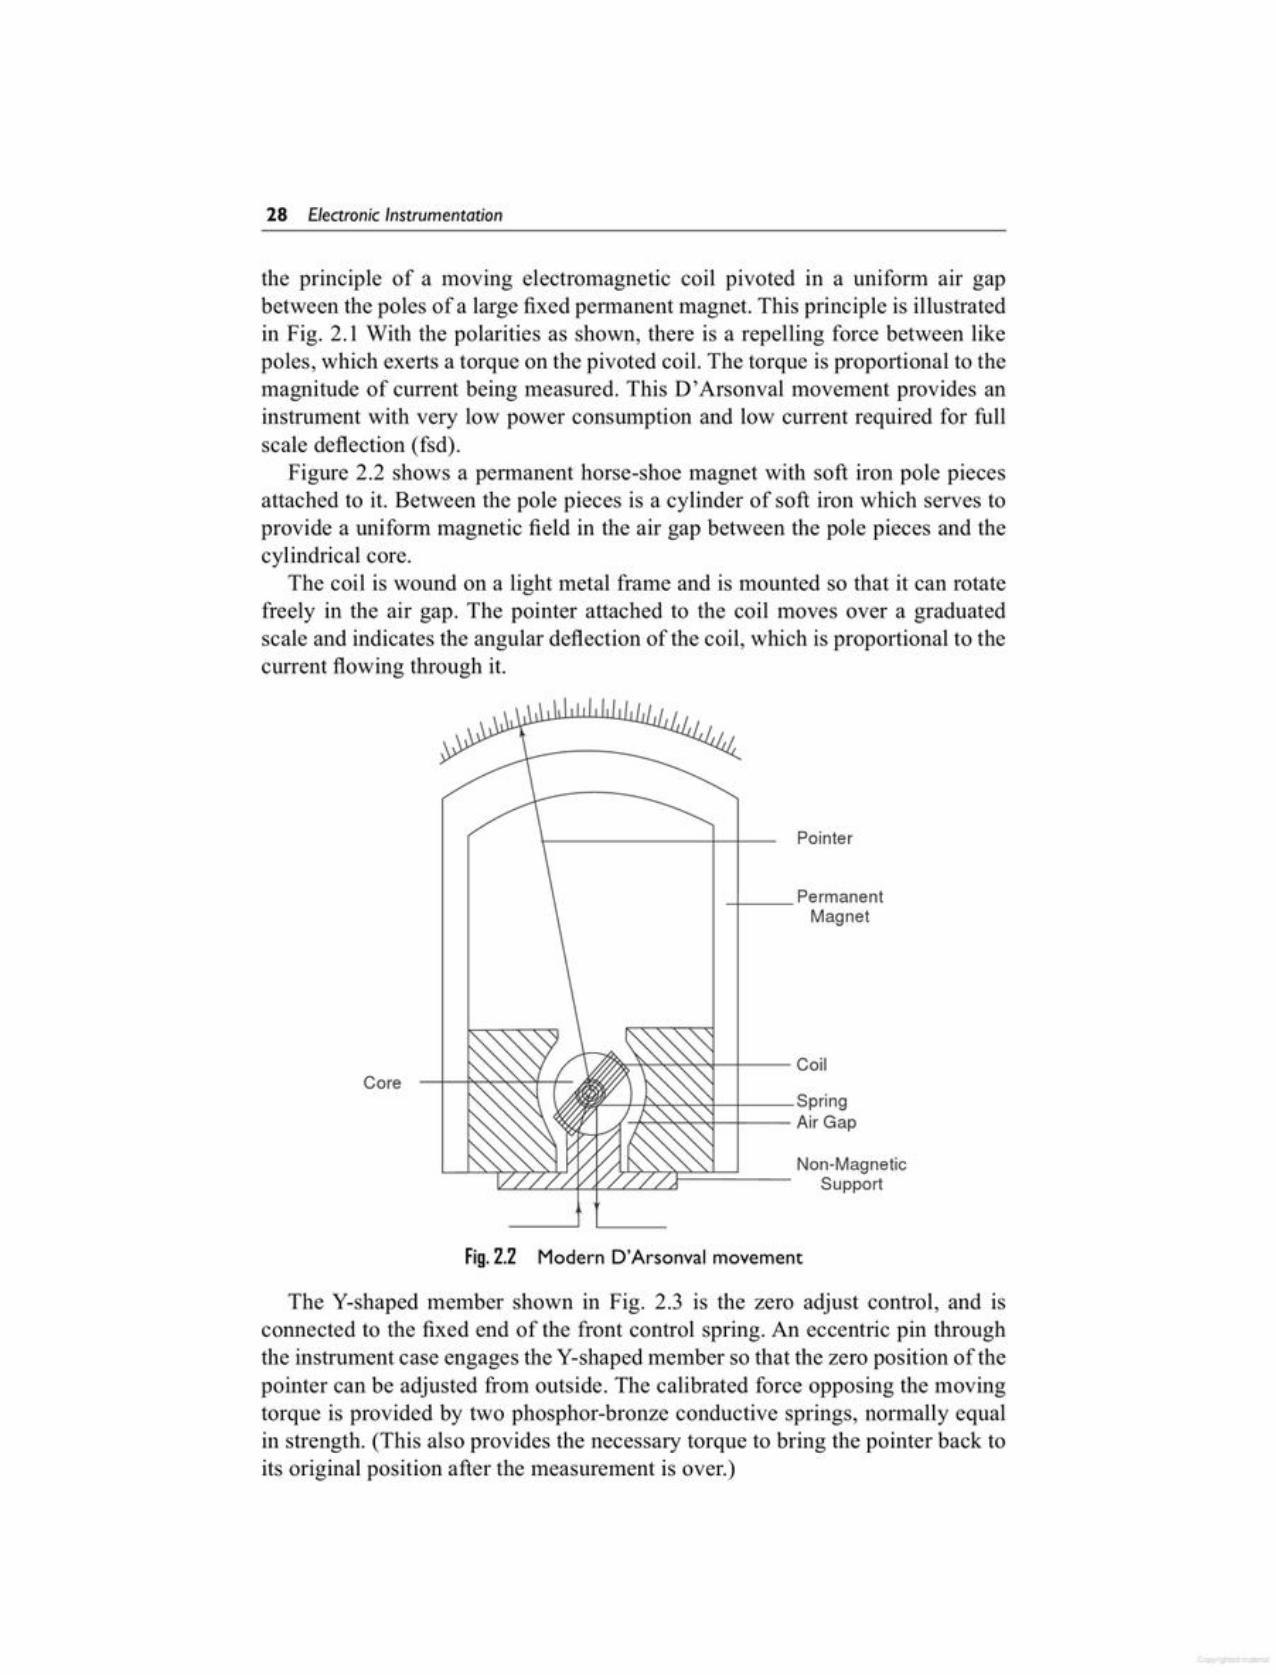
The Y-shaped member shown in Fig. 2.3 is the zero adjust control, and isconnected to the fixed end of the front control spring. An eccentric pin throughthe instrument case engages the Y-shapedmember so that the zero position of thepointer can be adjusted from outside. The calibrated force opposing the movingtorque is provided by two phosphor-bronze conductive springs, normally equalin strength. (This also provides the necessary torque to bring the pointer back toits original position after the measurement is over.)
Fig.2.2 Modern D'Arsonval movement
Pointer
Core
the principle of a moving electromagnetic coil pivoted in a uniform air gapbetween the poles of a large fixed permanent magnet. This principle is illustratedin Fig. 2.1 With the polarities as shown, there is a repelling force between likepoles, which exerts a torque on the pivoted coil. The torque is proportional to themagnitude of current being measured. This D'Arsonval movement provides aninstrument with very low power consumption and low current required for fullscale deflection (fsd).
Figure 2.2 shows a permanent horse-shoe magnet with soft iron pole piecesattached to it. Between the pole pieces is a cylinder of soft iron which serves toprovide a uniform magnetic field in the air gap between the pole pieces and thecylindrical core.
The coil is wound on a light metal frame and is mounted so that it can rotatefreely in the air gap. The pointer attached to the coil moves over a graduatedscale and indicates the angular deflection of the coil, which is proportional to thecurrent flowing through it.
28 Electron;c Instrumentat;on
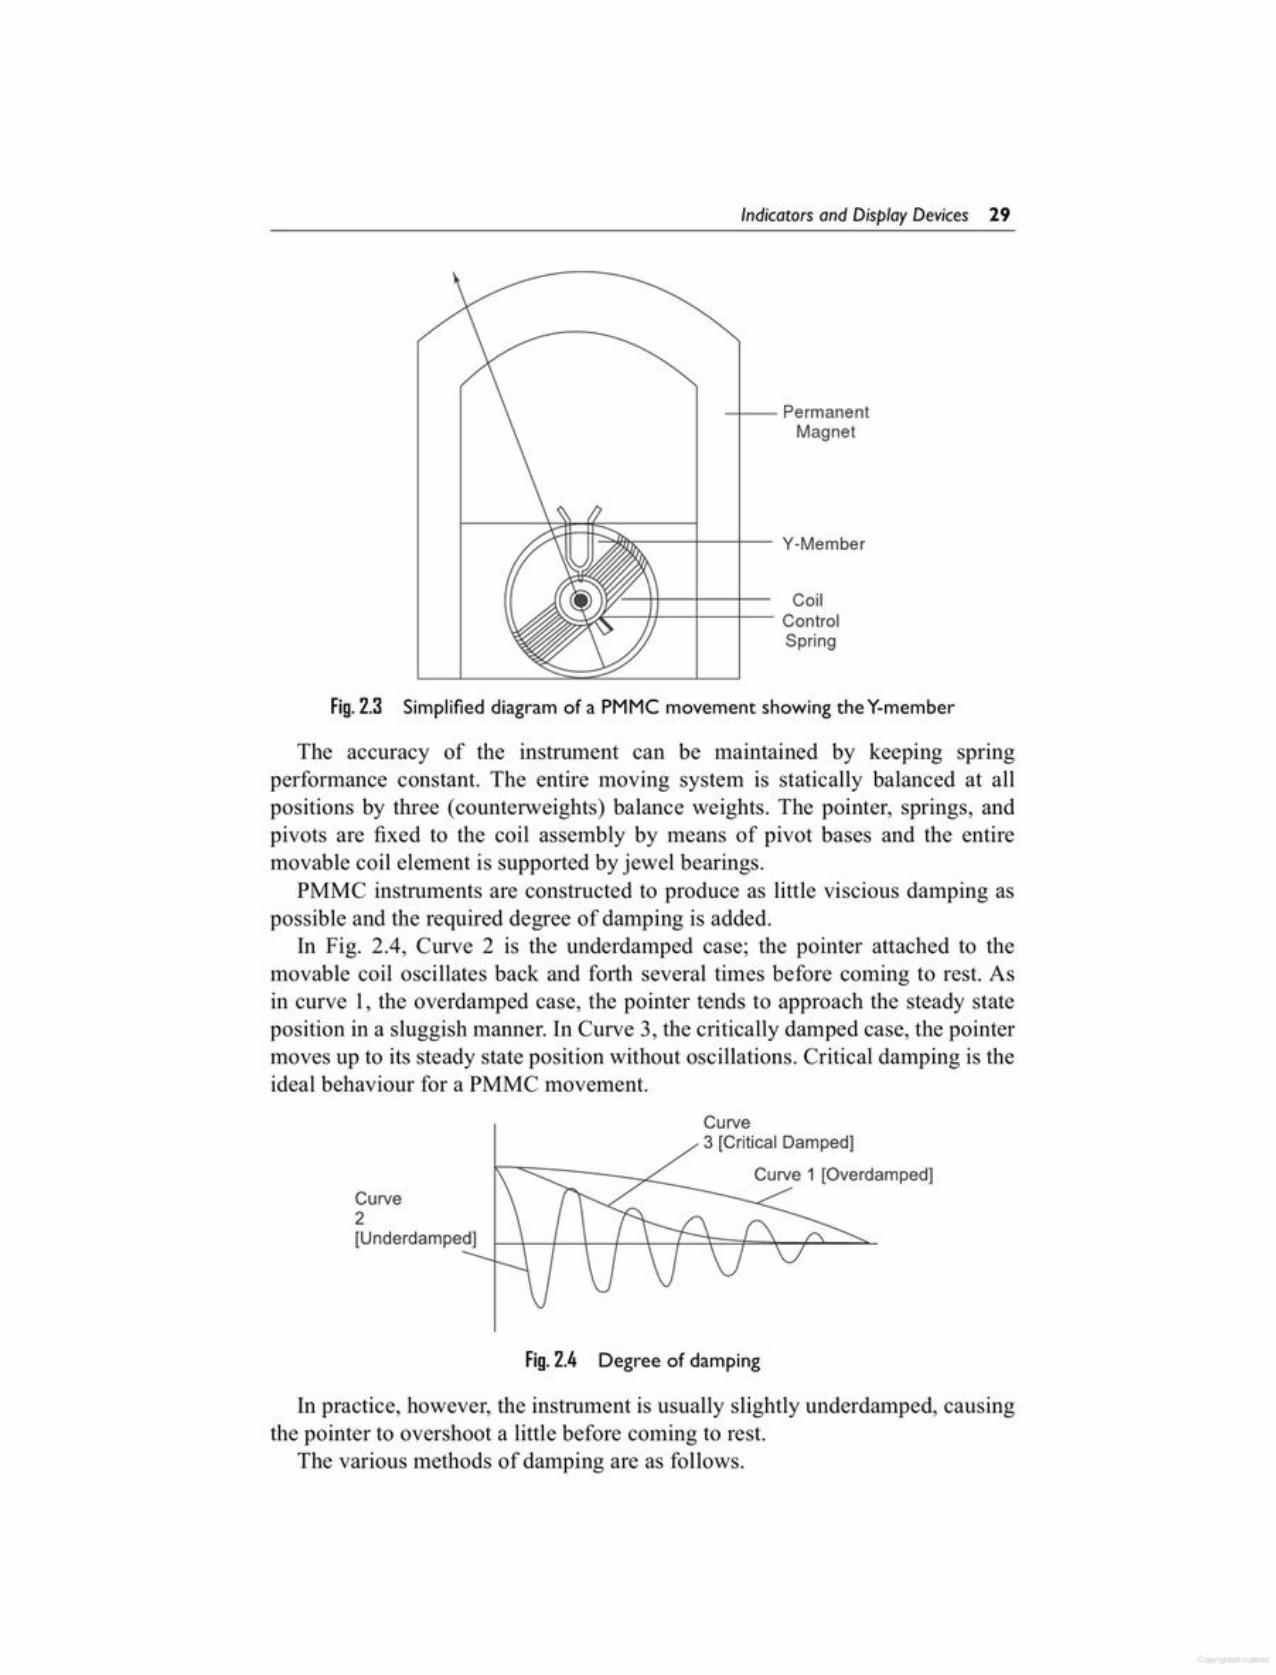
In practice, however, the instrument is usually slightly underdamped, causingthe pointer to overshoot a little before corning to rest.
The various methods of damping are as follows.
Fig. 2.4 Degree of damping
Curve2[Underdamped)
Curve3 [Critical Damped)
The accuracy of the instrument can be maintained by keeping springperformance constant. The entire moving system is statically balanced at allpositions by three (counterweights) balance weights. The pointer, springs, andpivots are fixed to the coil assembly by means of pivot bases and the entiremovable coil element is supported by jewel bearings.
PMMC instruments are constructed to produce as little viscious damping aspossible and the required degree of damping is added.
In Fig. 2.4, Curve 2 is the underdamped case; the pointer attached to themovable coil oscillates back and forth several times before coming to rest. Asin curve 1, the overdamped case, the pointer tends to approach the steady stateposition in a sluggish manner, In Curve 3, the critically damped case, the pointermoves up to its steady state position without oscillations. Critical damping is theideal behaviour for a PMMC movement.
Fig. 2.3 Simplified diagram of a PMMC movement showing the Y-member
-+-- PermanentMagnet
Indicators and Display Devices 29
One of the simplest methods is to attach an aluminium vane to the shaft of themoving coil. As the coil rotates, the vane moves in an air chamber, the amountof clearance between the chamber walls and the air vane effectively controls thedegree of damping.
Some instruments use the principle of electromagnetic damping (Lenz's law),where the movable coil is wound on a light aluminium frame. The rotation of thecoil in the magnetic field sets up a circulating current in the conductive frame,causing a retarding torque that opposes the motion of the coil.
A PMMC movement may also be damped by a resistor across the coil. Whenthe coil rotates in the magnetic field, a voltage is generated in the coil, whichcirculates a current through it and the external resistance. This produces anopposing or retarding torque that damps the motion. In any galvanometer, thevalue of the external resistance that produces critical damping can be found.This resistance is called critically damping external resistance (CDRX). Mostvoltmeter coils are wound onmetal frames to provide Electro-Magnetic damping.The metal frames constitute a short-circuit turn in a magnetic field.
Ammeters coils, are however wound in a non-conductive frame, because thecoil turns are effectively shorted by the ammeter shunt. The coil itself providesthe EM damping.
If low frequency alternating current is applied to the movable coil, thedeflection of the pointer would be upscale for half the cycle of the input waveform and downscale (in the opposite direction) for the next half. At power linefrequency (50 Hz) and above, the pointer cannot follow the rapid variations indirection and quivers slightly around the zero mark, seeking the average value ofthe ac (which equals zero). The PMMC instrument is therefore unsuitable for acmeasurements, unless the current is rectified before reaching the coil.
Practical coil areas generally range from 0.5 - 2.5 cm2.
The flux density for modern instruments usually ranges from 1500 - 5000Wb/cm2.
The power requirements of D' Arsonval movements are quite small, typicallyfrom 25 - 200 ).tW.
The accuracy of the instrument is generally of the order of2 - 5% of full scaledeflection.
The permanent magnet is made up of Alnico material.Scale markings of basic de PMMC instruments are usually linearly spaced,
because the torque (and hence the pointer deflection) is directly proportionalto the coil current. The basic PMMC instrument is therefore a linear-readingdevice.
The advantages and disadvantages of PMMC are as follows.Advantages
1. They can be modified with the help of shunts and resistance to cover awide range of currents and voltages.
2. They display no hystersis.3. Since operating fields of such instruments are very strong, they are not
significantly affected by stray magnetic fields.
30 Electron;c Instrumentat;on

The current to be measured is passed through the coil, thereby energising it.The interaction of the magnetic fields deflects the cradle to one side and movesthe pointer along the scale.
The movement of the cradle exerts a twisting force on the steel bands. Thesetwisted bands supply the torque to return the pointer to zero, when no current
Fig.2.5 (b) Taut band instrument (Top view)
s~_-+--I- __ Cradle
-+--- Ring Bar Magnet1*----+-+-- Coil Assembly
Scafe
N
~Cradle
Fig.2.5 (a) Taut band instrument (Side view)
l::::::::;::::;:::::::::::;;:::;;:::==::;::::;::::::.J TautBand
Spring
Pointer
The taut band movement utilises the same principle as the D'Arsonval movablecoil and fixed magnet. The primary difference between the two is the method ofmounting the movable coil.
The taut band movement has the advantage of eliminating the friction causedby a jewel-pivot suspension. The meter has a coil mounted in a cradle andsurrounded by a ring-bar magnet, as shown in Fig. 2.5. The cradle is securedto a support bracket, which in turn is suspended between two steel taut bands(ribbon), i.e. the movable coil is suspended by means of two taut torsion ribbons.The ribbons are placed under sufficient tension to eliminate any sag. This tensionis provided by the tension spring, so that the instrument can be used in anyposition.
2.3TAUT BAND INSTRUMENT
Disadvantages1. Some errors may set in due to ageing of control springs and the permanent
magnet.2. Friction due to jewel-pivot suspension.
Indicators and Display Devices 3 I
The D' Arsonval movement responds to the average or dc value of the currentflowing through the coil.
If ac current is sought to be measured, the current would flow through thecoil with positive and negative half cycles, and hence the driving torque wouldbe positive in one direction and negative in the other. If the frequency of the acis very low, the pointer would swing back and forth around the zero point on themeter scale.
At higher frequencies, the inertia of the coil is so great that the pointer doesnot follow the rapid variations of the driving torque and vibrates around the zeromark.
Therefore, to measure ac on aD' Arsonval movement, a rectifier has to beused to produce a unidirectional torque. This rectifier converts ac into dc andthe rectified current deflects the coil. Another method is to use the heating effectof ac current to produce an indication of its magnitude. This is done using anelectro dynamometer (EDM).
An electrodynamometer is often used in accurate voltmeter and ammeters notonly at power line frequency but also at low AF range. The electrodynamometercan be used by slightly modifying the PMMC movement. Itmay also serve as atransfer instrument, because it can be calibrated on de and then used directly onac thereby equating ac and de measurements of voltage and current directly.
A movable coil is used to provide the magnetic field in an electrodynamometer,instead of a permanent magnet, as in the D' Arsonval movement. This movablecoil rotates within the magnetic field. The EDM uses the current undermeasurement to produce the required field flux. A fixed coil, split into two equalhalves provides the magnetic field in which the movable coil rotates, as shown inFig. 2.6 (a). The coil halves are connected in series with the moving coil and arefed by the current being measured. The fixed coils are spaced far apart to allowpassage for the shaft of the movable coil. The movable coil carries a pointer,which is balanced by counterweights. Its rotation is controlled by springs, similarto those in a D' Arsonval movement.
The complete assembly is surrounded by a laminated shield to protect theinstrument from stray magnetic field which may affect its operation.
Damping is provided by aluminium air vanes moving in a sector shapedchamber. (The entire movement is very solid and rigidly constructed in order tokeep its mechanical dimensions stable, and calibration intact.)
2.4ELECTRODYNAMOMETER
flows. There are no bearings, and there is a constant level of sensitivity throughoutthe range of movement,
Taut band instruments have a higher sensitivity than those using pivots andjewels. In addition taut band instruments are relatively insensitive to shock andtemperature and are capable of withstanding greater overloads than PMMC orother types.
32 Electron;c Instrumentat;on

The operation of the instrument may be understood from the expression forthe torque developed by a coil suspended in a magnetic field, i.e.
'C=BxAxNxJindicating that the torque which deflects the movable coil is directly proportionalto the coil constants (A and N), the strength of the magnetic field in which the coilmoves (B), and the current (1) flowing through the coil.
In an EDM the flux density (B) depends on the current through the fixed coiland is therefore proportional to the deflection current (1). Since the coil constantsare fixed quantities for any given meter, the developed torque becomes a functionof the current squared (J2).
If the EDM is used for de measurement, the square law can be noticed by thecrowding of the scale markings at low current values, progressively spreading athigher current values.
For ac measurement, the developed torque at any instant is proportional tothe instantaneous current squared (p). The instantaneous values of P are alwayspositive and torque pulsations are therefore produced.
The meter movement, however, cannot follow rapid variations of the torqueand take up a position in which the average torque is balanced by the torque ofthe control springs. The meter deflection is therefore a function of the mean ofthe squared current. The scale of the EDM is usually calibrated in terms of thesquare root of the average current squared, and therefore reads the effective orrms value of the ac.
The transfer properties of the EDM become apparent when we compare theeffective value of the alternating current and the direct current in terms of theirheating effect, or transfer of power.
(If the EDM is calibrated with a direct current of 500 rnA and a mark is placedon the scale to indicate this value, then that ac CUITentwhich causes the pointer todeflect to the same mark on the scale must have an rms value of 500 InA.)
The EDM has the disadvantage of high power consumption, due to itsconstruction. The current under measurement must not only pass through themovable coil, but also provide the necessary field flux to get a sufficiently strongmagnetic field. Hence high mmf is required and the source must have a highcurrent and power.
In spite of this high power consumption the magnetic field is still weaker thanthat of the D' Arson val movement because there is no iron in the path, the entireflux path consisting of air.
The EDM can be used to measure ac or de voltage or current, as shown inFigs. 2.6 (a) and (b).
Typical values of EDM flux density are in the range of approximately 60gauss as compared to the high flux densities (1000 - 4000 guass) of a goodD' Arsonval movement. The low flux density of the EDM affects the developedtorque and therefore the sensitivity of the instrument.
The addition of a series multiplier converts the basic EDM into a voltmeter[Fig. 2.6 (b)] which can be used for ac and de measurements. The sensitivity of
Indicators and Display Devices 33
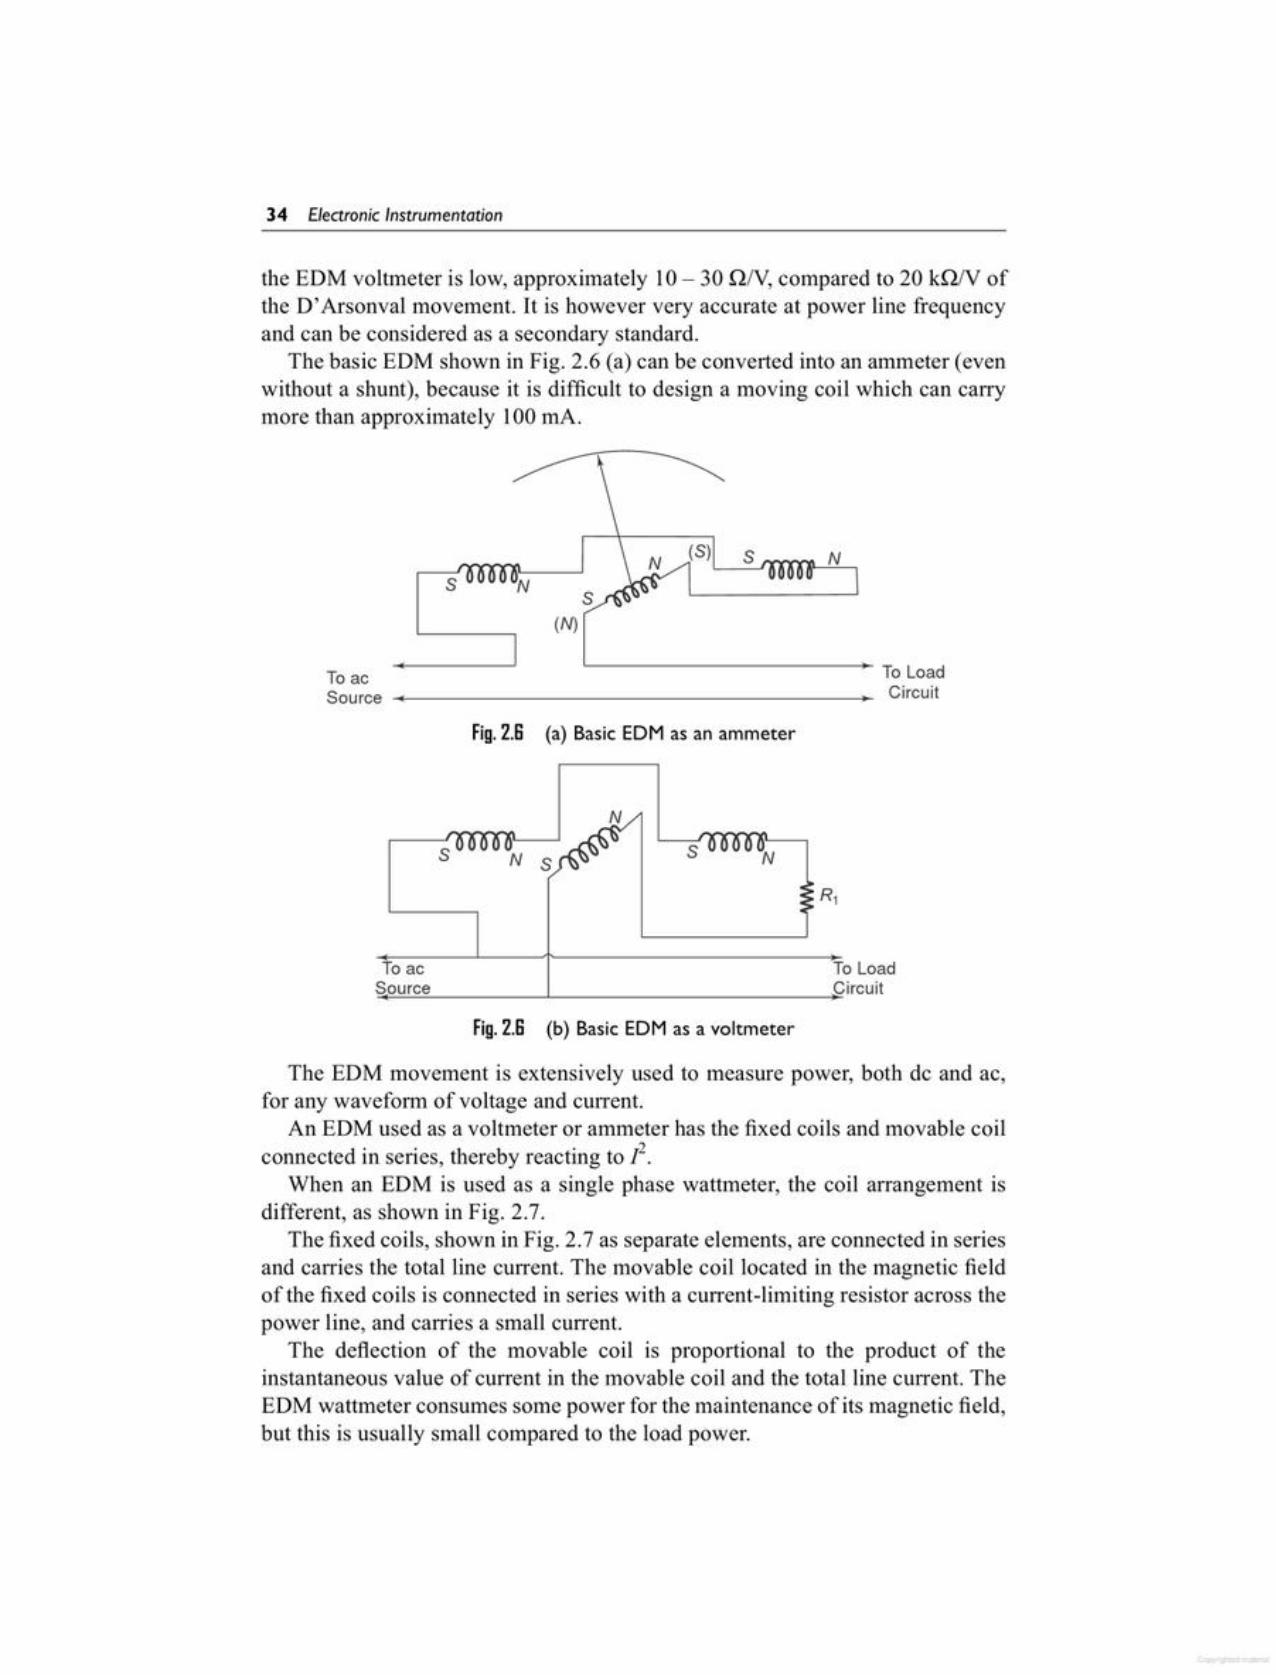
The EDM movement is extensively used to measure power, both de and ac,for any waveform of voltage and current.
An EDM used as a voltmeter or ammeter has the fixed coils and movable coilconnected in series, thereby reacting to 12.
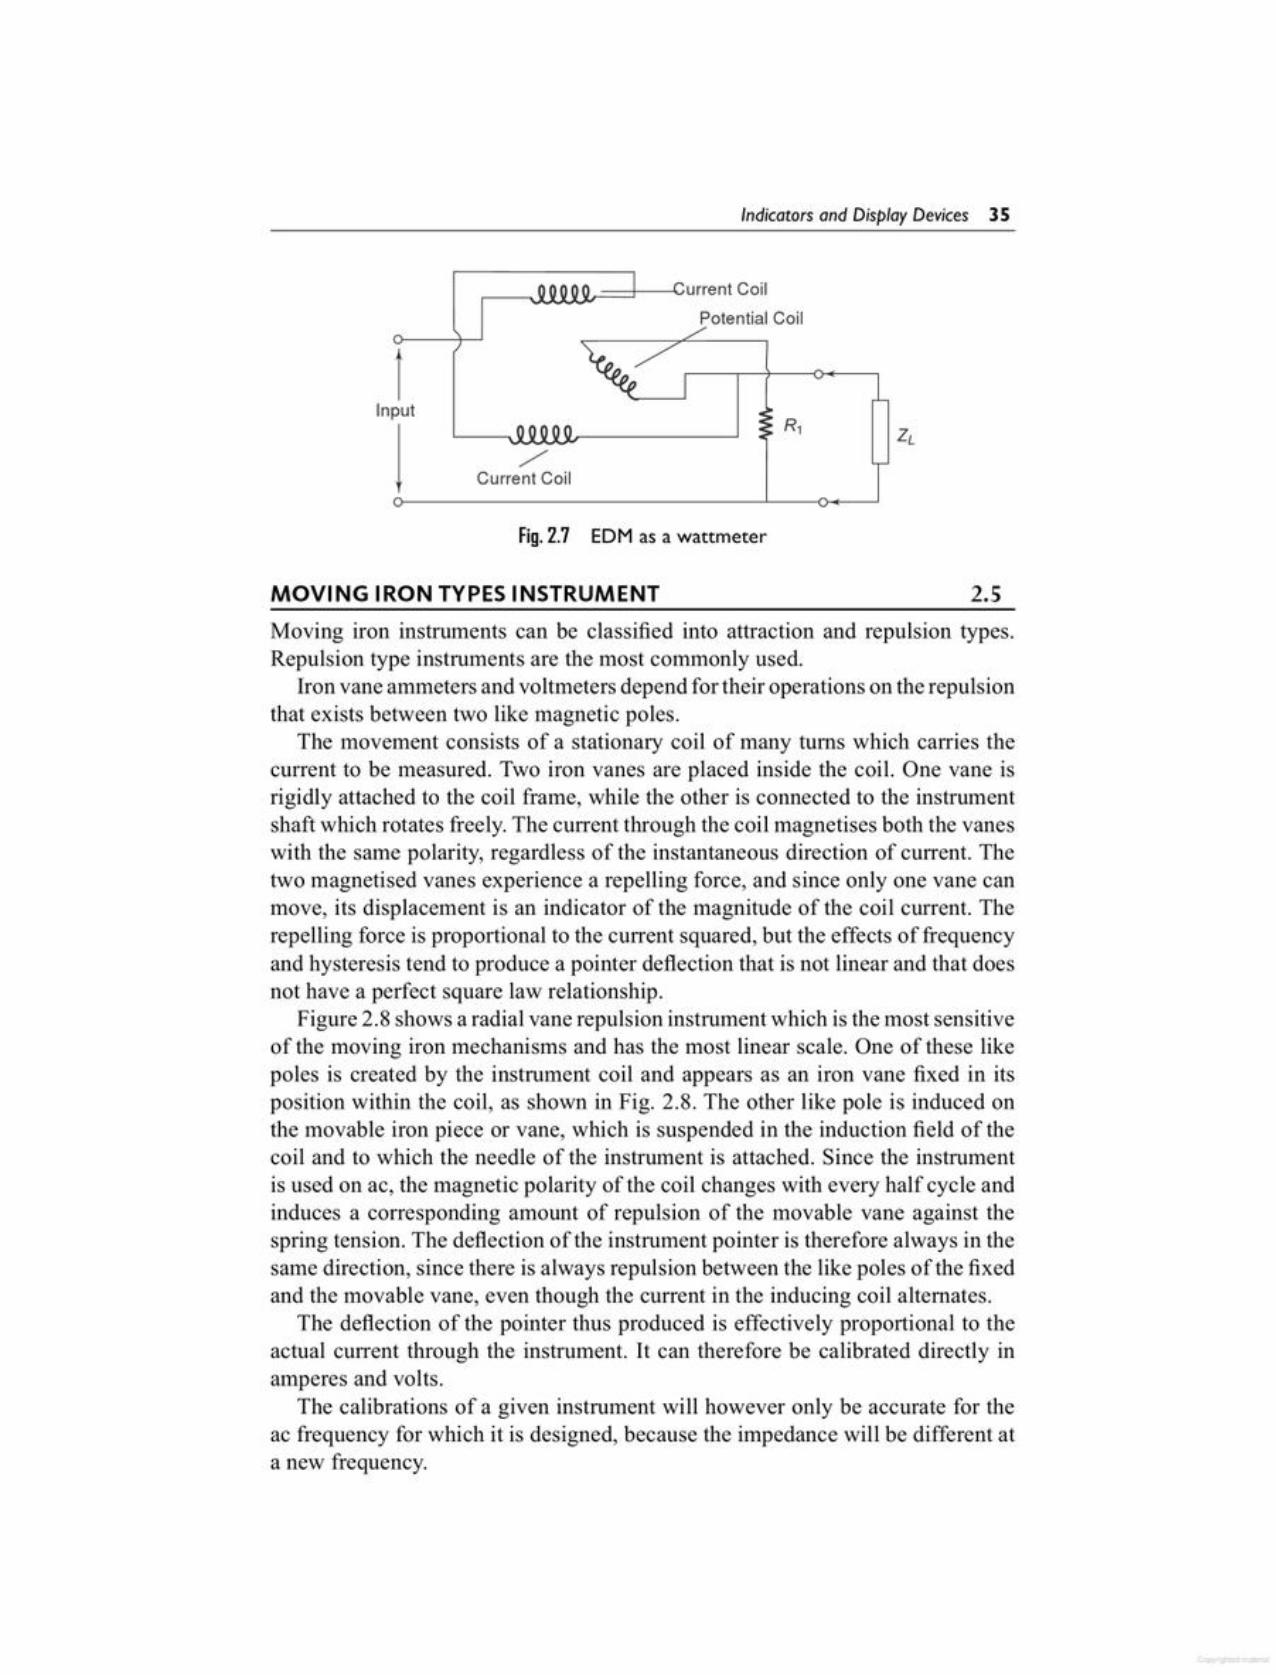
When an EDM is used as a single phase wattmeter, the coil arrangement isdifferent, as shown in Fig. 2.7.
The fixed coils, shown in Fig. 2.7 as separate elements, are connected in seriesand carries the total line current. The movable coil located in the magnetic fieldof the fixed coils is connected in series with a current-limiting resistor across thepower line, and carries a small current.
The deflection of the movable coil is proportional to the product of theinstantaneous value of current in the movable coil and the total line current. TheEDM wattmeter consumes some power for the maintenance of its magnetic field,but this is usually small compared to the load power.
Fig.2.8 (b) Basic EDM as a voltmeter
Toac ToLoadS~o""u""rc"'e"--------J....-----------____i~Circuit
s s
Fig.2.8 (a) BasicEDM as an ammeter
ToacSource-+--------------------
L-- ToLoad
Circuit
s
the EDM voltmeter is low, approximately 10- 30 Q/V, compared to 20 kQ/V ofthe D'Arsonval movement. It is however very accurate at power line frequencyand can be considered as a secondary standard.
The basic EDM shown in Fig. 2.6 (a) can be converted into an ammeter (evenwithout a shunt), because it is difficult to design a moving coil which can carrymore than approximately 100 mAo
34 Electron;c Instrumentat;on
Moving iron instruments can be classified into attraction and repulsion types.Repulsion type instruments are the most commonly used.
Iron vane ammeters and voltmeters depend for their operations on the repulsionthat exists between two like magnetic poles.
The movement consists of a stationary coil of many turns which carries thecurrent to be measured. Two iron vanes are placed inside the coil. One vane isrigidly attached to the coil frame, while the other is connected to the instrumentshaft which rotates freely. The current through the coil magnetises both the vaneswith the same polarity, regardless of the instantaneous direction of current. Thetwo magnetised vanes experience a repelling force, and since only one vane canmove, its displacement is an indicator of the magnitude of the coil current. Therepelling force is proportional to the current squared, but the effects of frequencyand hysteresis tend to produce a pointer deflection that is not linear and that doesnot have a perfect square law relationship.
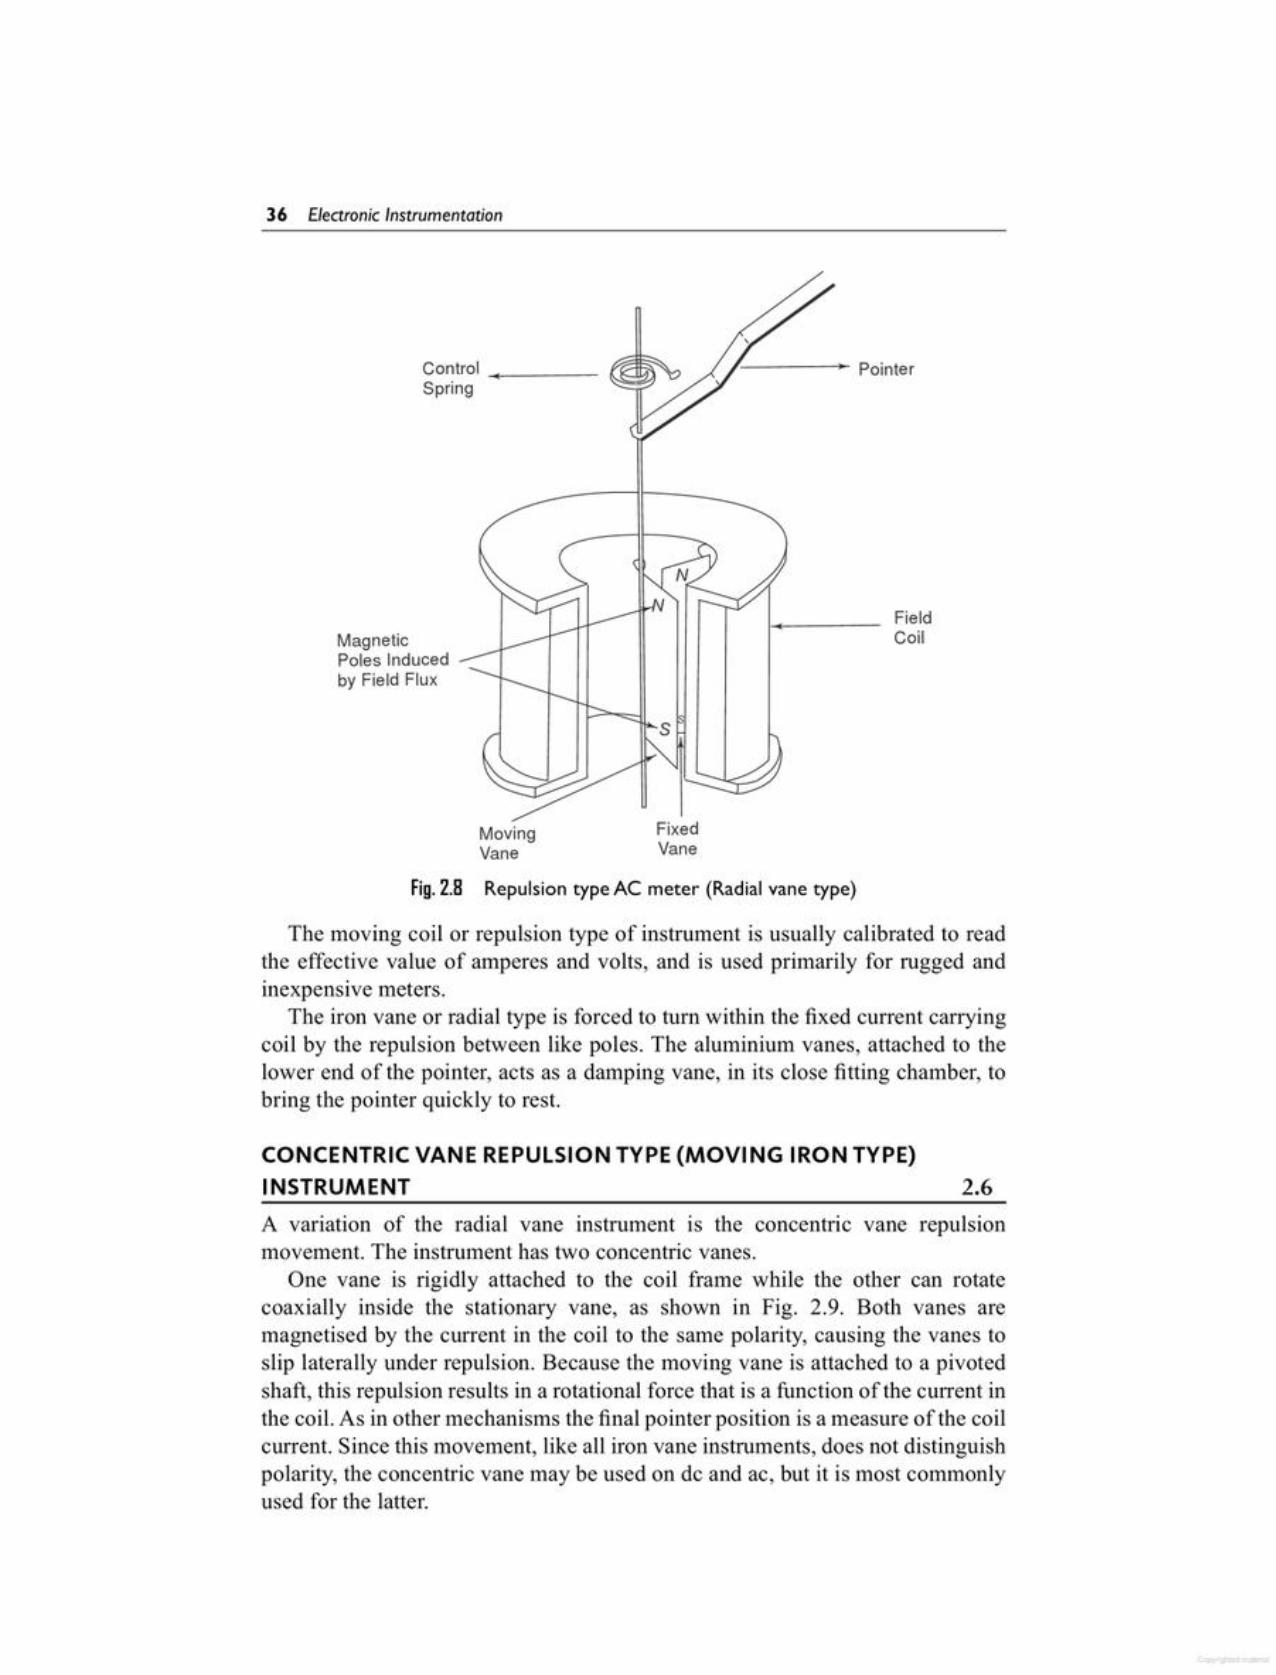
Figure 2.8 shows a radial vane repulsion instrument which is the most sensitiveof the moving iron mechanisms and has the most linear scale. One of these likepoles is created by the instrument coil and appears as an iron vane fixed in itsposition within the coil, as shown in Fig. 2.8. The other like pole is induced onthe movable iron piece or vane, which is suspended in the induction field of thecoil and to which the needle of the instrument is attached. Since the instrumentis used on ac, the magnetic polarity of the coil changes with every half cycle andinduces a corresponding amount of repulsion of the movable vane against thespring tension. The deflection of the instrument pointer is therefore always in thesame direction, since there is always repulsion between the like poles of the fixedand the movable vane, even though the current in the inducing coil alternates.
The deflection of the pointer thus produced is effectively proportional to theactual current through the instrument. It can therefore be calibrated directly inamperes and volts.
The calibrations of a given instrument will however only be accurate for theac frequency for which it is designed, because the impedance will be different ata new frequency.
2.5MOVING IRON TYPES INSTRUMENT
Fig.2.7 EDM as a wattmeter
-:CurrentCoil
1Input
j
,--_~i1t-==:I--4_;urrent CoilPotentialCoil
Indicators and Display Devices 35
A variation of the radial vane instrument is the concentric vane repulsionmovement. The instrument has two concentric vanes.
One vane is rigidly attached to the coil frame while the other can rotatecoaxially inside the stationary vane, as shown in Fig. 2.9. Both vanes aremagnetised by the current in the coil to the same polarity, causing the vanes toslip laterally under repulsion. Because the moving vane is attached to a pivotedshaft, this repulsion results in a rotational force that is a function of the current inthe coil. As in other mechanisms the final pointer position is a measure of the coilcurrent. Since this movement, like all iron vane instruments, does not distinguishpolarity, the concentric vane may be used on de and ac, but it is most commonlyused for the latter.
2.6CONCENTRIC VANE REPULSION TYPE (MOVING IRON TYPE)INSTRUMENT
The moving coil or repulsion type of instrument is usually calibrated to readthe effective value of amperes and volts, and is used primarily for rugged andinexpensive meters.
The iron vane or radial type is forced to turn within the fixed current carryingcoil by the repulsion between like poles. The aluminium vanes, attached to thelower end of the pointer, acts as a damping vane, in its close fitting chamber, tobring the pointer quickly to rest.
Fig.2.8 Repulsion type AC meter (Radial vane type)
FixedVane
MovingVane
s
FieldCoilMagnetic
Poles Inducedby Field Flux
36 Electron;c Instrumentat;on
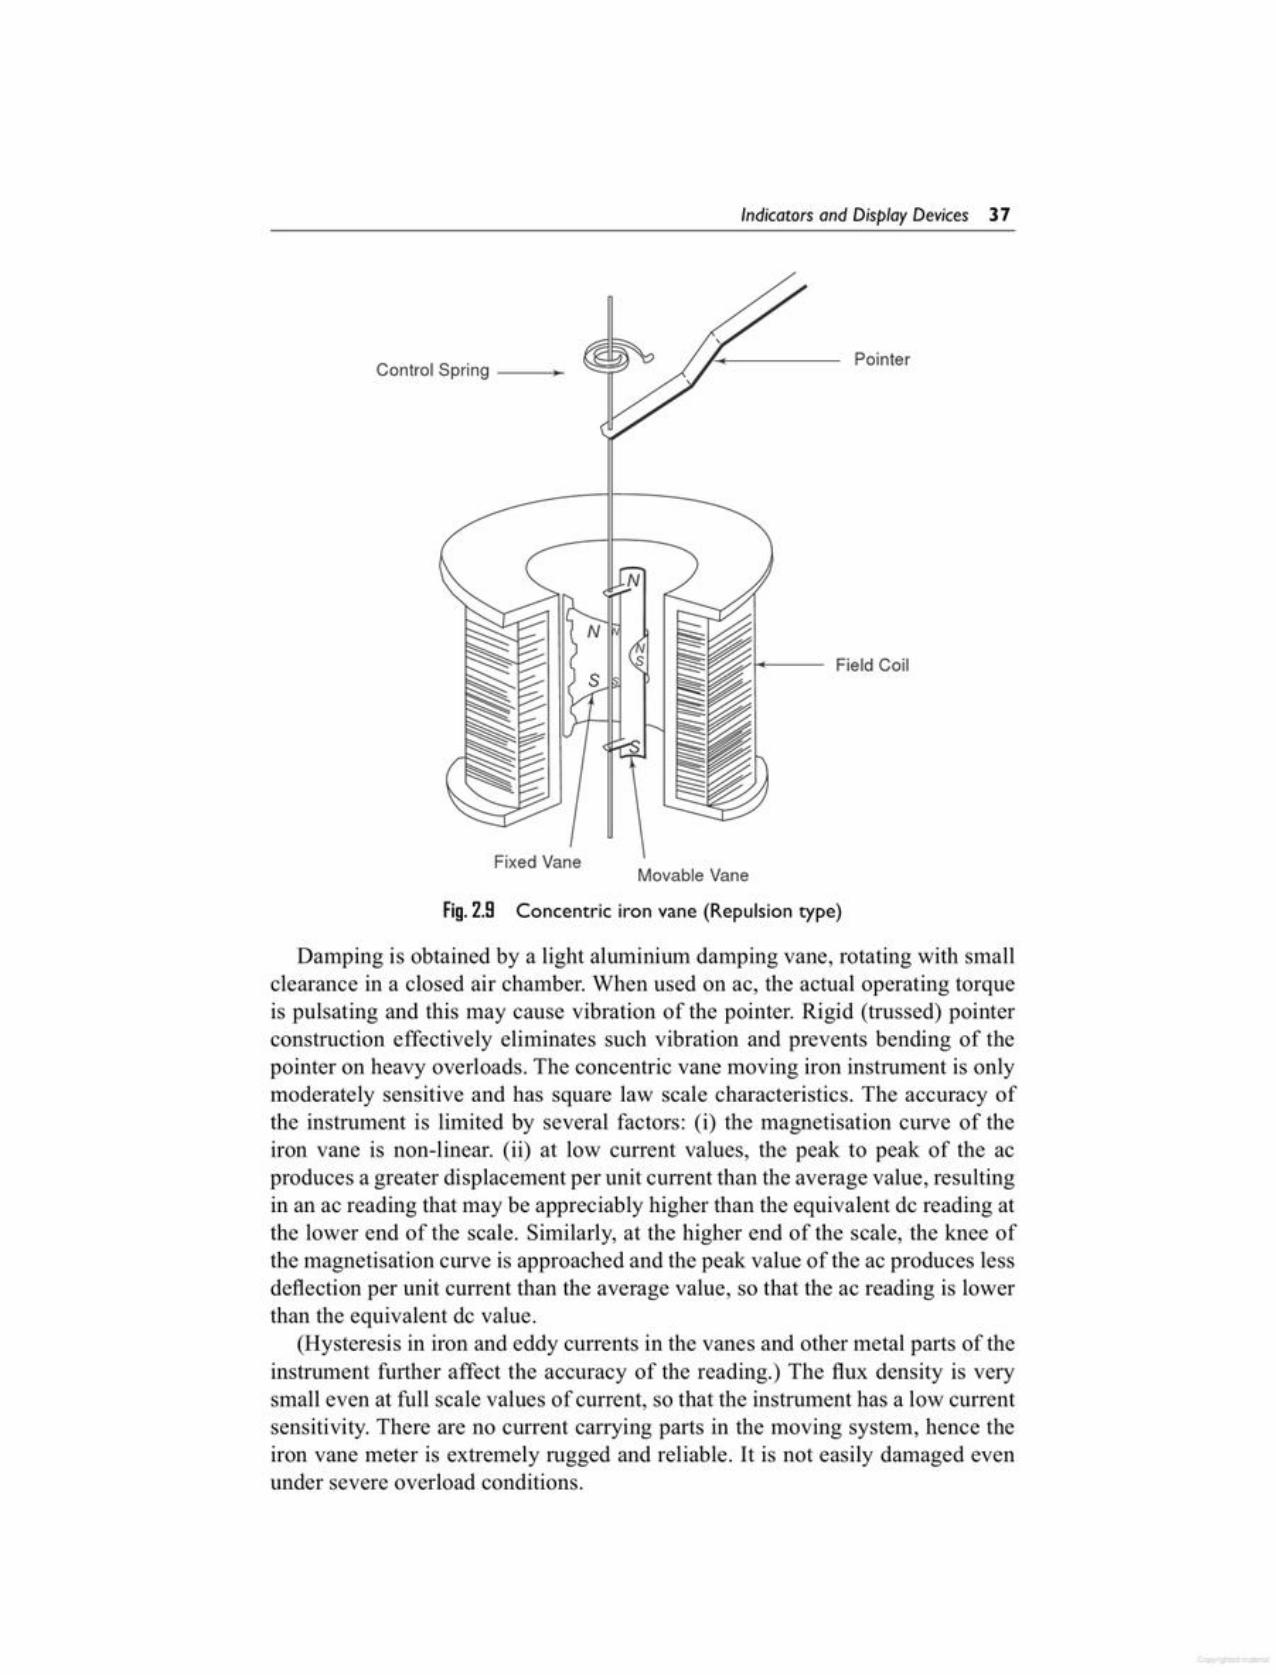
Damping is obtained by a light aluminium damping vane, rotating with smallclearance in a closed air chamber. When used on ac, the actual operating torqueis pulsating and this may cause vibration of the pointer. Rigid (trussed) pointerconstruction effectively eliminates such vibration and prevents bending of thepointer on heavy overloads. The concentric vane moving iron instrument is onlymoderately sensitive and has square law scale characteristics. The accuracy ofthe instrument is limited by several factors: (i) the magnetisation curve of theiron vane is non-linear. (ii) at low current values, the peak to peak of the acproduces a greater displacement per unit current than the average value, resultingin an ac reading that may be appreciably higher than the equivalent de reading atthe lower end of the scale. Similarly, at the higher end of the scale, the knee ofthe magnetisation curve is approached and the peak value of the ac produces lessdeflection per unit current than the average value, so that the ac reading is lowerthan the equivalent de value.
(Hysteresis in iron and eddy currents in the vanes and other metal parts of theinstrument further affect the accuracy of the reading.) The flux density is verysmall even at full scale values of current, so that the instrument has a low currentsensitivity. There are no current carrying parts in the moving system, hence theiron vane meter is extremely rugged and reliable. It is not easily damaged evenunder severe overload conditions.
Fig. 2.9 Concentric iron vane (Repulsion type)
Movable VaneFixed Vane
Field Coil
PointerControl Spring --~
Indicators and Display Devices 37
Commonly used displays in the digital electronic field are as follows.1. Cathode Ray Tube (CRT)2. Light Emitting Diode (LED)3. Liquid Crystal Display (LCD)4. Gas discharge plasma displays (Cold cathode displays or Nixies)5. Electro-Luminescent (EL) displays6. Incandescent display7. ElectroPhoretic Image Displays (EPID)8. Liquid Vapour Display (LVD)In general, displays are classified in a number of ways, as follows.1. On methods of conversion of electrical data into visible light
(a) Active displays(Light emitters - Incandescent, i.e. due to temperature, luminescence,i.e. due to non-thermal means or physio-thermal, and gas dischargeglow of light around the cathode.)- CRTs, Gas discharge plasma, LEDs, etc.
(b) Passive displaysLight controllers, LCDs, EPIDs, etc.
2. On the applications(a) Analog displays - Bar graph displays (CRT)(b) Digital displays - Nixies, Alphanumeric, LEDs, etc.
3. According to the display size and physical dimensions(a) Symbolic displays -Alphanumeric, Nixie tubes, LEOs, etc.(b) Console displays - CRTs, LEOs, etc.(c) Large screen display - Enlarged projection system
4. According to the display format(a) Direct view type (Flat panel planar) - Segmental, dotmatrix - CRTs
2.8CLASSIFICATION OF DISPLAYS
The rapid growth of electronic handling of numerical data has bought with it agreat delnand for simple systems to display the data in a readily understandableform. Display devices provide a visual display of numbers, letters, and symbolsin response to electrical input, and serve as constituents of an electronic displaysystem.
2.7DIGITAL DISPLAY SYSTEMAND INDICATORS
Adding a suitable multiplier converts the iron vane movement into a voltmeter;adding a shunt produces different current ranges. When an iron vane movement isused as an ac voltmeter, the frequency increases the impedance of the instrumentand therefore a lower reading is obtained for a given applied voltage. An ironvane voltmeter should therefore always be calibrated at the frequency at which itis to be used. The usual commercial instrument lnay be used within its accuracytolerance from 25-125 Hz.
38 Electron;c Instrumentat;on
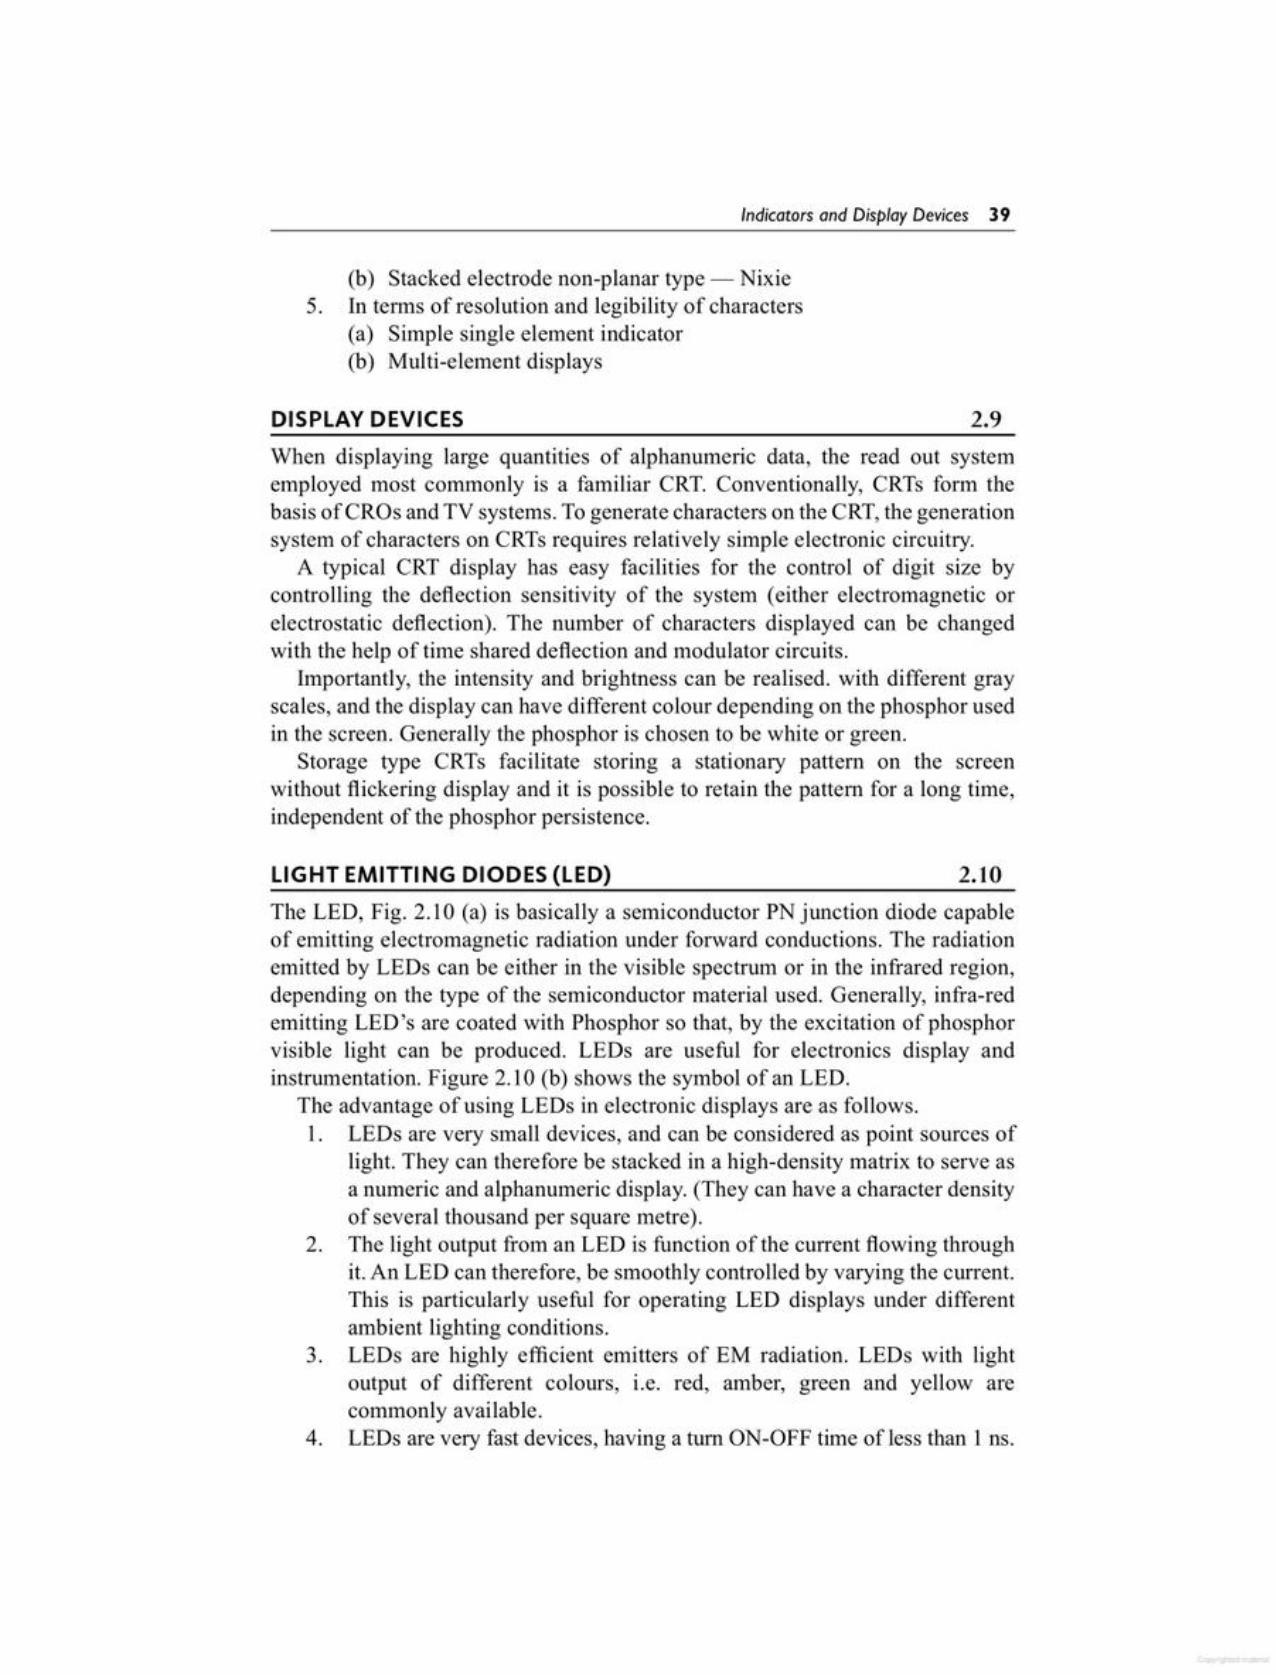
The LED, Fig. 2.10 (a) is basically a semiconductor PN junction diode capableof emitting electromagnetic radiation under forward conductions. The radiationemitted by LEOs can be either in the visible spectrum or in the infrared region,depending on the type of the semiconductor material used. Generally, infra-redemitting LEO's are coated with Phosphor so that, by the excitation of phosphorvisible light can be produced. LEOs are useful for electronics display andinstrumentation. Figure 2.10 (b) shows the symbol of an LEO.
The advantage of using LEOs in electronic displays are as follows.1. LEOs are very small devices, and can be considered as point sources of
light. They can therefore be stacked in a high-density matrix to serve asa numeric and alphanumeric display. (They can have a character densityof several thousand per square metre).
2. The light output from an LED is function of the current flowing throughit. An LED can therefore, be smoothly controlled by varying the current.This is particularly useful for operating LED displays under differentambient lighting conditions.
3. LEOs are highly efficient emitters of EM radiation. LEOs with lightoutput of different colours, i.e. red, amber, green and yellow arecommonly available.
4. LEOs are very fast devices, having a tum ON-OFF time of less than 1ns.
2.10LIGHT EMITTING DIODES (LED)
When displaying large quantities of alphanumeric data, the read out systememployed most commonly is a familiar CRT. Conventionally, CRTs form thebasis ofCROs and TV systems. To generate characters on the CRT,the generationsystem of characters on CRTs requires relatively simple electronic circuitry.
A typical CRT display has easy facilities for the control of digit size bycontrolling the deflection sensitivity of the system (either electromagnetic orelectrostatic deflection). The number of characters displayed can be changedwith the help of time shared deflection and modulator circuits.
Importantly, the intensity and brightness can be realised. with different grayscales, and the display can have different colour depending on the phosphor usedin the screen. Generally the phosphor is chosen to be white or green.
Storage type CRTs facilitate storing a stationary pattern on the screenwithout flickering display and it is possible to retain the pattern for a long time,independent of the phosphor persistence.
2.9DISPLAY DEVICES
(b) Stacked electrode non-planar type - Nixie5. In terms of resolution and legibility of characters
(a) Simple single element indicator(b) Multi-element displays
Indicators and Display Devices 39
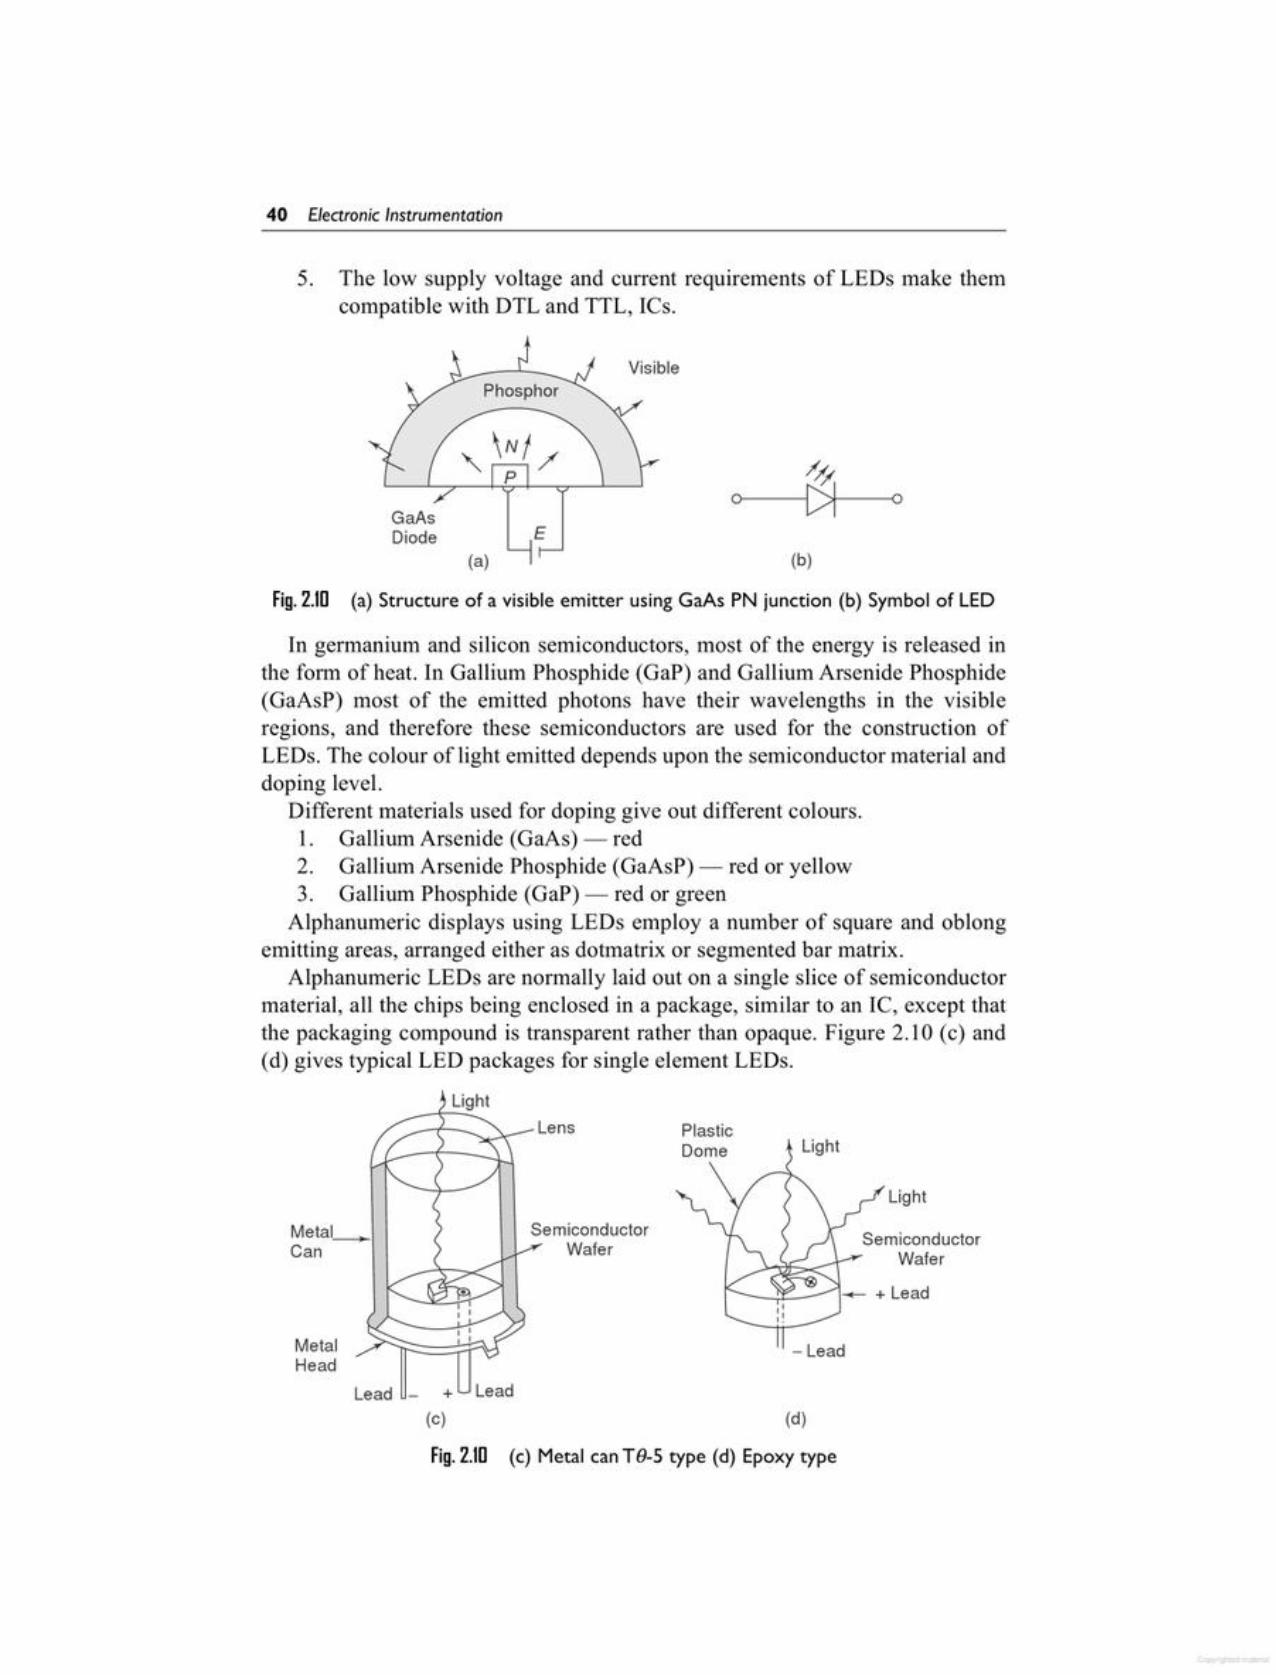
Fig.2.10 (c) Metal can T8-S type (d) Epoxy type
(d)Lead - + Lead
(c)
SemiconductorWafer
SemiconductorWafer
Light
PlasticDome Light
Light
Metal_Can
Fig. 2.10 (a) Structure of a visible emitter using GaAs PN junction (b) Symbol of LED
In germanium and silicon semiconductors, most of the energy is released inthe form of heat. In Gallium Phosphide (GaP) and Gallium Arsenide Phosphide(GaAsP) most of the emitted photons have their wavelengths in the visibleregions, and therefore these semiconductors are used for the construction ofLEDs. The colour of light emitted depends upon the semiconductor material anddoping level.
Different materials used for doping give out different colours.1. Gallium Arsenide (GaAs) - red2. Gallium Arsenide Phosphide (GaAsP) - red or yellow3. Gallium Phosphide (GaP) - red or greenAlphanumeric displays using LEDs employ a number of square and oblong
emitting areas, arranged either as dotmatrix or segmented bar matrix.Alphanumeric LEDs are normally laid out on a single slice of semiconductor
material, all the chips being enclosed in a package, similar to an IC, except thatthe packaging compound is transparent rather than opaque. Figure 2.10 (c) and(d) gives typical LED packages for single element LEDs.
Visible
/*0 N 0
GaAsDiode E
(a) (b)
5. The low supply voltage and current requirements of LEDs make themcompatible with DTL and TTL, ICs.
40 Electron;c Instrumentat;on

The most popular liquid crystal structure is the nematic liquid crystal (NLC).The liquid is normally transparent, but if it is subjected to a strong electric field,ions move through it and disrupt the well ordered crystal structure, causing theliquid to polarise and hence turn opaque. The removal of the applied field allowsthe crystals structure to reform and the material regains its transparency.
Basically, the LCD comprises of a thin layer of NLC fluid, about 10 11thick,sandwiched between two glass plates having electrodes, at least one of which istransparent.
(If both are transparent, the LCD is of the transmissive type, whereas areflective LCD has only one electrode transparent.)
The structure of a typical reflective LCD is shown in Fig. 2.12.The NLC material in Fig. 2.12 has a homogeneous alignment of molecules.
While the glass substrate supports the LCD andprovides the required transparency,the electrode facilitates electrical connections for the display. The insulatingspacers are the hermetic seal.
Fig.2.11 Liquid crystal materials (a) Ordinary liquids (b) Nematic liquid crystal(c) Cholesteric liquid crystal
(c)(b)(a)
~0888888800000000000000000000000000000000000
LCOs are passive displays characterised by very low power consumption andgood contrast ratio. They have the following characteristics in common.
1. They are light scattering.2. They can operate in a reflective or transmissive configuration.3. They do not actively generate light and depend for their operation on
ambient or back lighting.A transmissive LCD has a better visual characteristic than a reflective LCD.
The power required by an LCD to scatter or absorb light is extremely small, ofthe order of a few 11W/cm. LCOs operate at low voltages, ranging from 1-15 V.
The operation of liquid crystals is based on the utilisation of a class of organicmaterials which remain a regular crystal-like structure even when they havemelted. Two liquid crystal materials which are important in display technologyare nematic and cholesteric, as shown in Fig. 2.11.
2.11LIQUID CRYSTAL DISPLAY (LCD)
Indicators and Display Devices 41
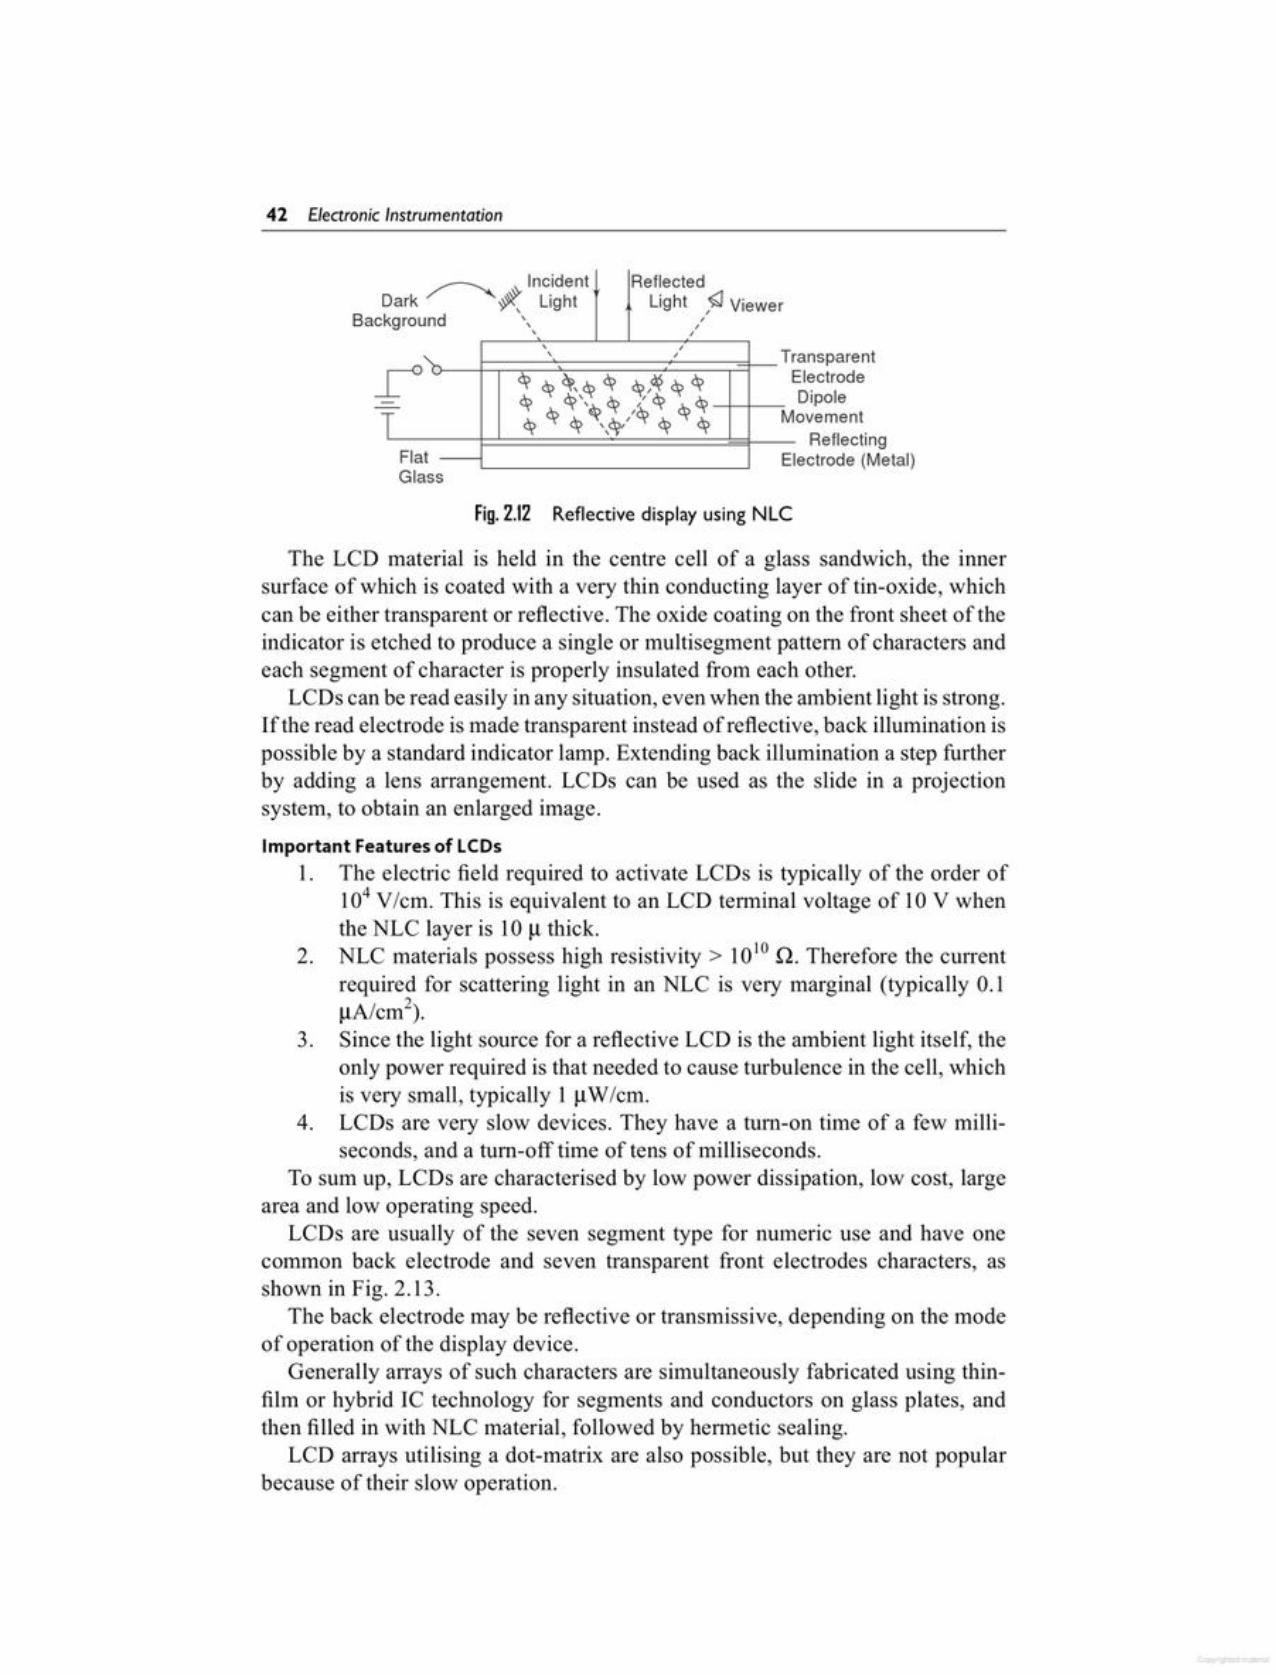
The LCD material is held in the centre cell of a glass sandwich, the innersurface of which is coated with a very thin conducting layer of tin-oxide, whichcan be either transparent or reflective. The oxide coating on the front sheet of theindicator is etched to produce a single or multisegment pattern of characters andeach segment of character is properly insulated from each other.
LCDs can be read easily in any situation, even when the ambient light is strong.lfthe read electrode ismade transparent instead of reflective, back illumination ispossible by a standard indicator lamp. Extending back illumination a step furtherby adding a lens arrangement. LCDs can be used as the slide in a projectionsystem, to obtain an enlarged image.Important Features of LeOs
1. The electric field required to activate LCDs is typically of the order of104 Vfcm. This is equivalent to an LCD terminal voltage of 10 V whenthe NLC layer is 10 11thick.
2. NLC materials possess high resistivity> 1010 Q. Therefore the currentrequired for scattering light in an NLC is very marginal (typically 0.1IlAfcm2).
3. Since the light source for a reflective LCD is the ambient light itself, theonly power required is that needed to cause turbulence in the cell, whichis very small, typically 1 11Wfcm.
4. LCDs are very slow devices. They have a tum-on time of a few milliseconds, and a tum-off time of tens of milliseconds.
To sum up, LCDs are characterised by low power dissipation, low cost, largearea and low operating speed.
LCDs are usually of the seven segment type for numeric use and have onecommon back electrode and seven transparent front electrodes characters, asshown in Fig. 2.13.
The back electrode may be reflective or transmissive, depending on the modeof operation of the display device.
Generally arrays of such characters are simultaneously fabricated using thinfilm or hybrid IC technology for segments and conductors on glass plates, andthen filled in with NLC material, followed by hermetic sealing.
LCD arrays utilising a dot-matrix are also possible, but they are not popularbecause of their slow operation.
Reflective display using NLCFig. 2.12
Sac
ansparentElectrodeDipoleovementReflecting
ectrode (Metal)Glass
~ Incident ReflectedDark ~ Light Light ,~ Viewerkground , ,, ,, ,, ,, , Tr
~ <\> ~'<\> <\> ~ ,Q? <\> <\>- <\> ~ <\> \~ ~ ,~<\> <\><\>T M<\> <\> \~,' <\> <\>
Flat EI
42 Electron;c Instrumentat;on
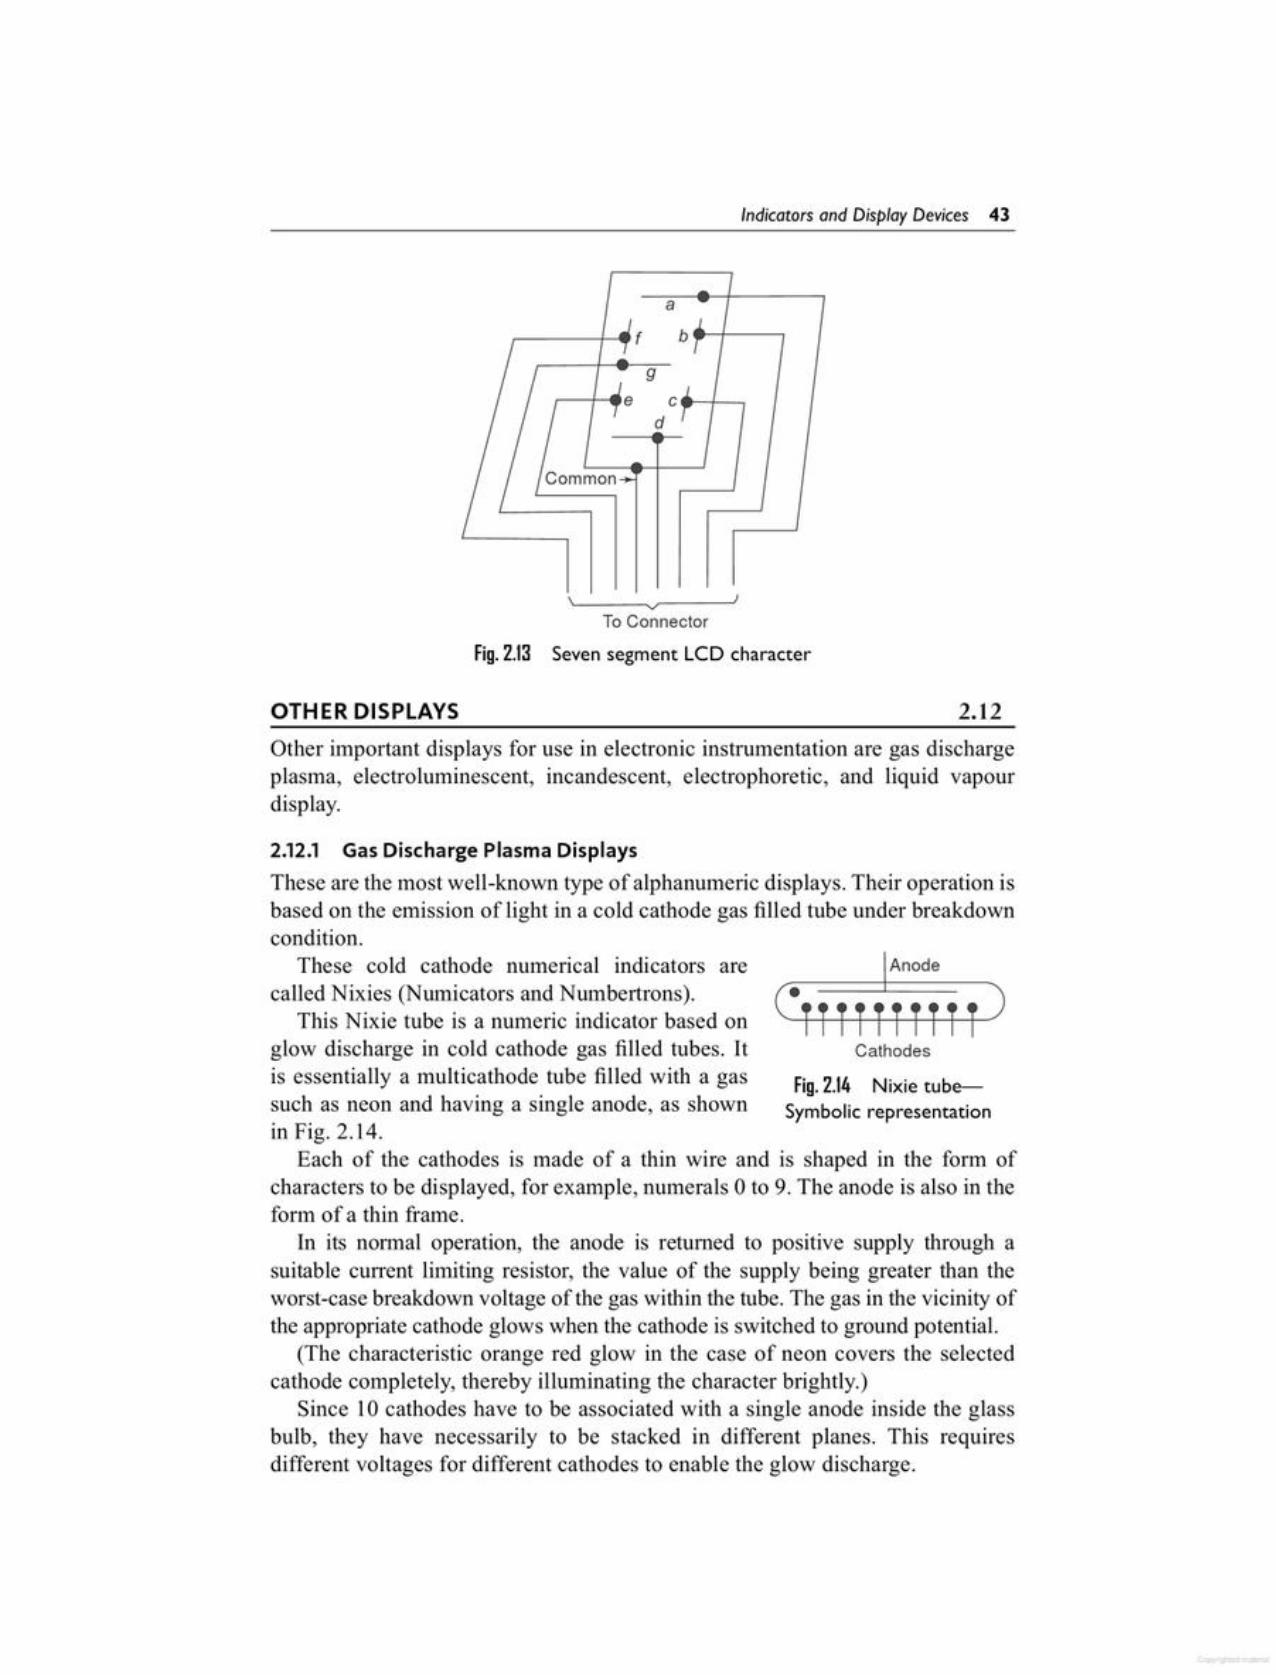
2.12.1 Gas Discharge Plasma DisplaysThese are the most well-known type of alphanumeric displays. Their operation isbased on the emission of light in a cold cathode gas filled tube under breakdowncondition.
These cold cathode numerical indicators are Anodecalled Nixies (Numicators and Numbertrons).
This Nixie tube is a numeric indicator based onglow discharge in cold cathode gas filled tubes. It Cathodes
is essentially a multicathode tube filled with a gas Fig.2.14 Nixie tube-such as neon and having a single anode, as shown Symbolic representationin Fig. 2.14.
Each of the cathodes is made of a thin wire and is shaped in the form ofcharacters to be displayed, for example, numerals 0 to 9. The anode is also in theform of a thin frame.
In its normal operation, the anode is returned to positive supply through asuitable current limiting resistor, the value of the supply being greater than theworst-case breakdown voltage of the gas within the tube. The gas in the vicinity ofthe appropriate cathode glows when the cathode is switched to ground potential.
(The characteristic orange red glow in the case of neon covers the selectedcathode completely, thereby illuminating the character brightly.)
Since 10 cathodes have to be associated with a single anode inside the glassbulb, they have necessarily to be stacked in different planes. This requiresdifferent voltages for different cathodes to enable the glow discharge.
Other important displays for use in electronic instrumentation are gas dischargeplasma, electroluminescent, incandescent, electrophoretic, and liquid vapourdisplay.
OTHER DISPLAYS 2.12
To Connector
Fig.2.13 Seven segment LCD character
a.-----~.f be-r---,
9
Indicators and Display Devices 43

4. Most Nixie tubes require de supply of 150-220 V, and the selectedcathode carries current in the range of 1-5 rnA.
Fig. 2.15 (a) Matrix operation of display panel using gas filled devices (b) and (c) nixie tube
(c)
SideView
(b)
Gas FilledEnvelopes
FrontView
(a)
H--t- Numeral Shaped --t-tElectrodes
X2__ +-__.- ~---.---- __
Y1 Y2X1 __ +-__.- ~---.---- __
Many Nixie tubes also possess dot-cathodes either on the left or right of thecharacter to serve as decimal points.
The standard Nixie is not the only format used with cold cathode technologyboth bar and dot matrix versions are available. The bar types have a cathodewhich forms the segment and operates in a fashion similar to the standard neontube. Identical supply voltage and drivers are required. In the dot type display,each dot is in matrix fashion and operates as an individual glow discharge lightsource. The required dots are selected by an X- Y addressing array of thin filmmetal lines, as shown in Fig. 2.15 (a).
Nixie tubes have the following important characteristics.1. The numerals are usually large, typically 15-30 mm high, and appear in
the same base line for in-line read-out.2. Nixie tubes are single digit devices with or without a decimal point.3. They are either side viewing or top viewing (as shown in Figs 2.15 (b)
and (cj).
44 Electron;c Instrumentat;on
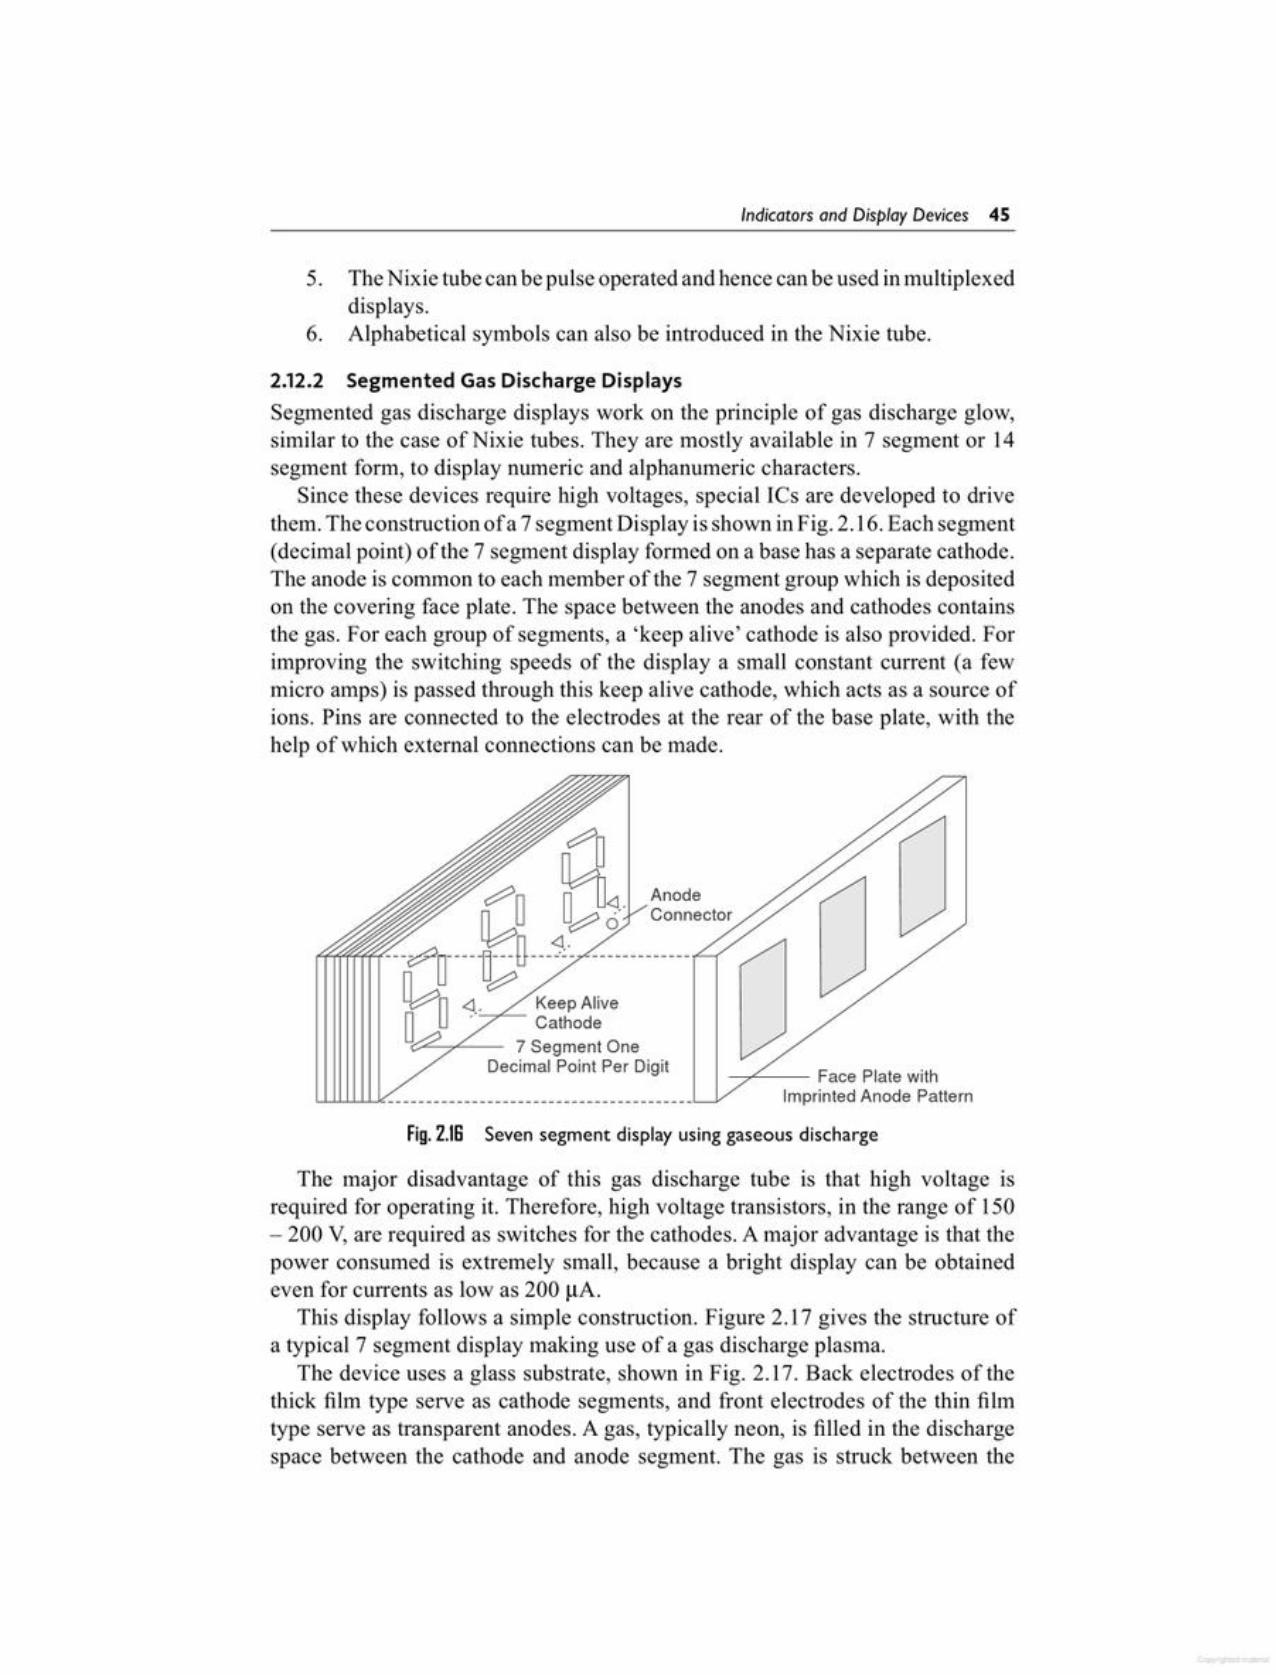
The major disadvantage of this gas discharge tube is that high voltage isrequired for operating it. Therefore, high voltage transistors, in the range of 150- 200 V, are required as switches for the cathodes. A major advantage is that thepower consumed is extremely small, because a bright display can be obtainedeven for currents as low as 200 JlA.
This display follows a simple construction. Figure 2.17 gives the structure ofa typical 7 segment display making use of a gas discharge plasma.
The device uses a glass substrate, shown in Fig. 2.17. Back electrodes of thethick film type serve as cathode segments, and front electrodes of the thin filmtype serve as transparent anodes. A gas, typically neon, is filled in the dischargespace between the cathode and anode segment. The gas is struck between the
Fig.2.16 Seven segment display using gaseous discharge
---7''''---- Face Plate withImprinted Anode Pattern~~~----------------------------------------
Keep Alive'~'-::>.G-- Cathode
-?<::"""".L-- 7 Segment OneDecimal Point Per Digit
AnodeConnector
2.12.2 Segmented Gas Discharge DisplaysSegmented gas discharge displays work on the principle of gas discharge glow,similar to the case of Nixie tubes. They are mostly available in 7 segment or 14segment form, to display numeric and alphanumeric characters.
Since these devices require high voltages, special ICs are developed to drivethem. The construction ofa 7 segment Display is shown inFig. 2.16. Each segment(decimal point) of the 7 segment display formed on a base has a separate cathode.The anode is common to each member of the 7 segment group which is depositedon the covering face plate. The space between the anodes and cathodes containsthe gas. For each group of segments, a 'keep alive' cathode is also provided. Forimproving the switching speeds of the display a small constant current (a fewmicro amps) is passed through this keep alive cathode, which acts as a source ofions. Pins are connected to the electrodes at the rear of the base plate, with thehelp of which external connections can be made.
5. The Nixie tube can be pulse operated and hence can be used inmultiplexeddisplays.
6. Alphabetical symbols can also be introduced in the Nixie tube.
Indicators and Display Devices 45
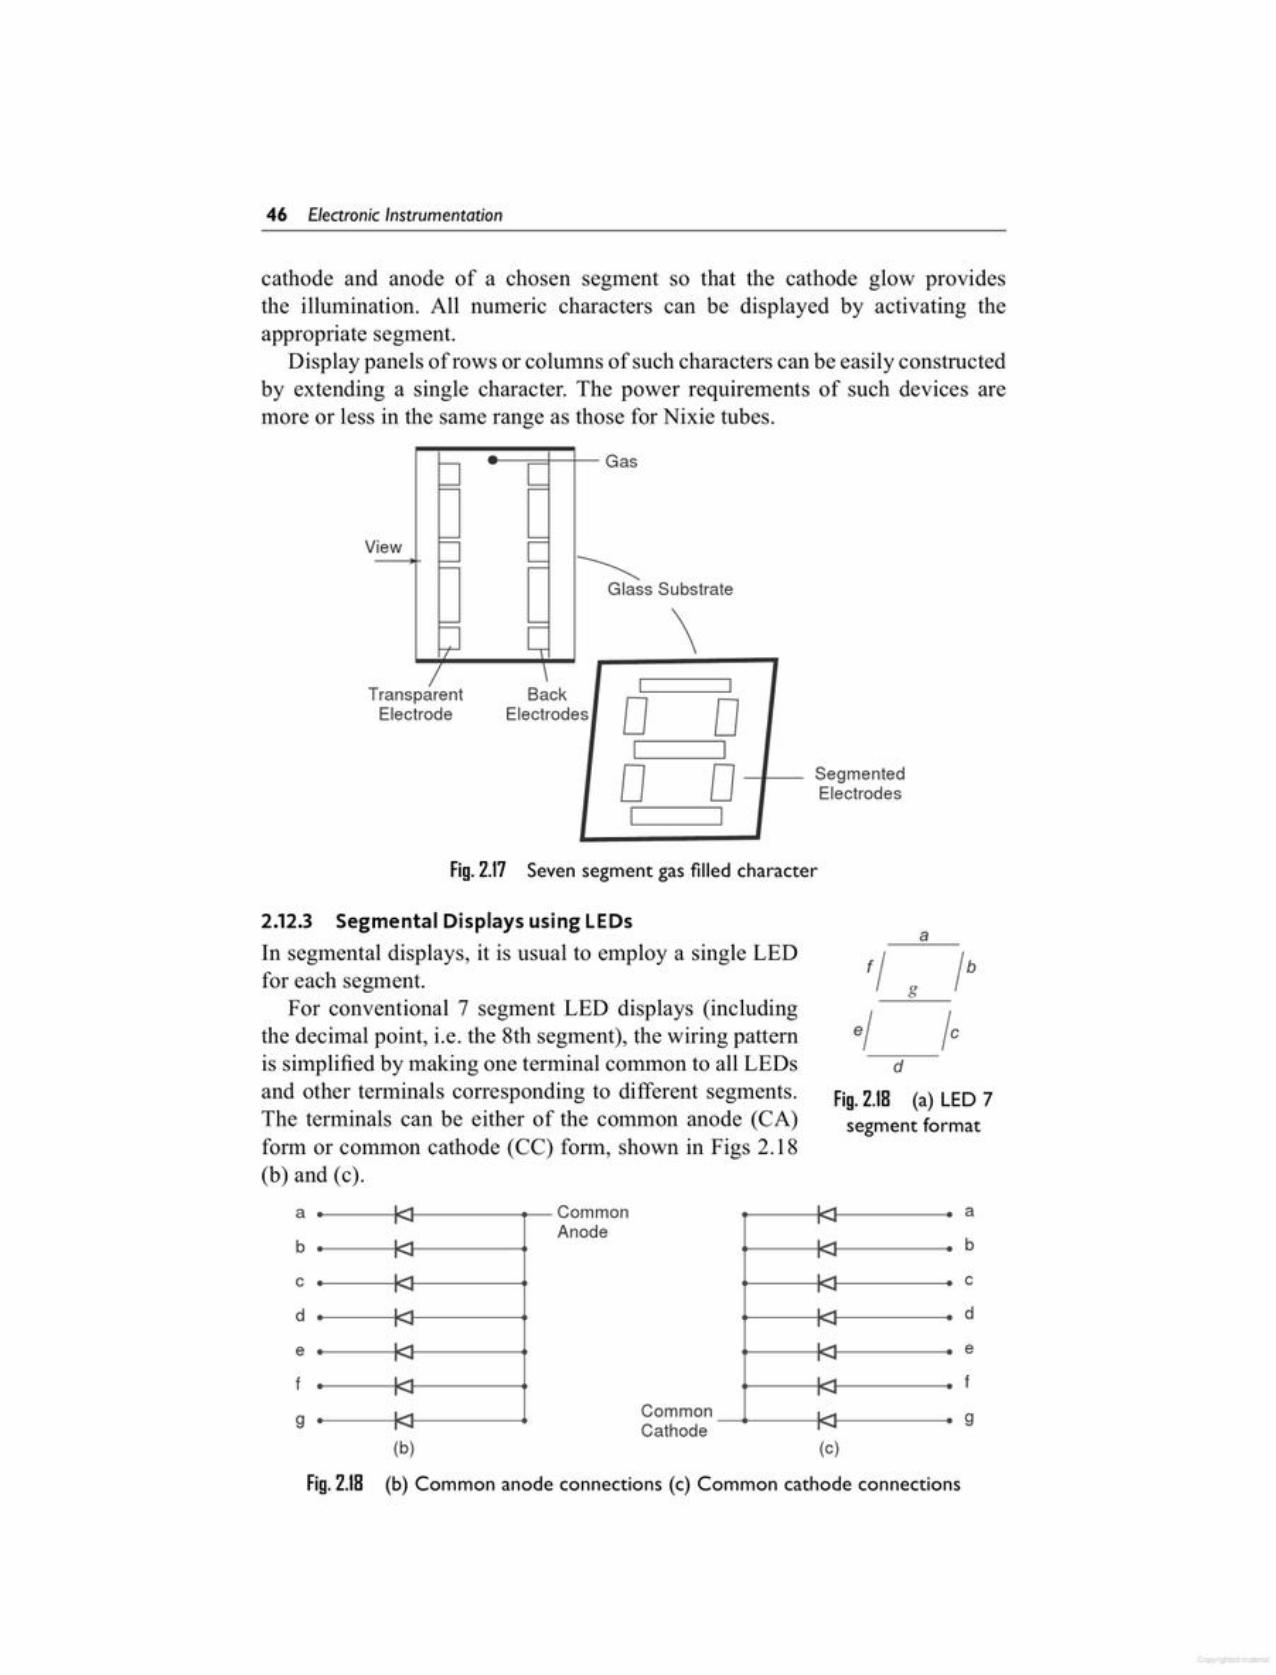
Fig.2.18 (b) Common anode connections (c) Common cathode connections
a I. ... Common ,.... a, ....
Anode, ....
b , ... , ... b,.... , ....C L.-1 L.-1 C,-.... ,-....d L .... L .... dr-.... r-....
e I..... I. ... e, .. , ..f ,.... , ... f, .... , ....g L.-1 Common L.-1 g,-.... Cathode ,-....
(b) (c)
d
Fig.2.18 (a) LED 7segment format
a2.12.3 Segmental Displays using LEOsIn segmental displays, it is usual to employ a single LEDfor each segment.
For conventional 7 segment LED displays (includingthe decimal point, i.e. the 8th segment), the wiring patternis simplified by making one terminal common to all LEDsand other terminals corresponding to different segments.The terminals can be either of the common anode (CA)form or common cathode (CC) form, shown in Figs 2.18(b) and (c).
Fig.2.17 Seven segment gas filled character
O 0 --J'----- SegmentedElectrodes
BackElectrodes 0 0
'I --____::;-I
TransparentElectrode
\~
Glass Substrate
View
cathode and anode of a chosen segment so that the cathode glow providesthe illumination. All numeric characters can be displayed by activating theappropriate segment,
Display panels of rows or columns of such characters can be easily constructedby extending a single character. The power requirements of such devices aremore or less in the same range as those for Nixie tubes.
46 Electron;c Instrumentat;on
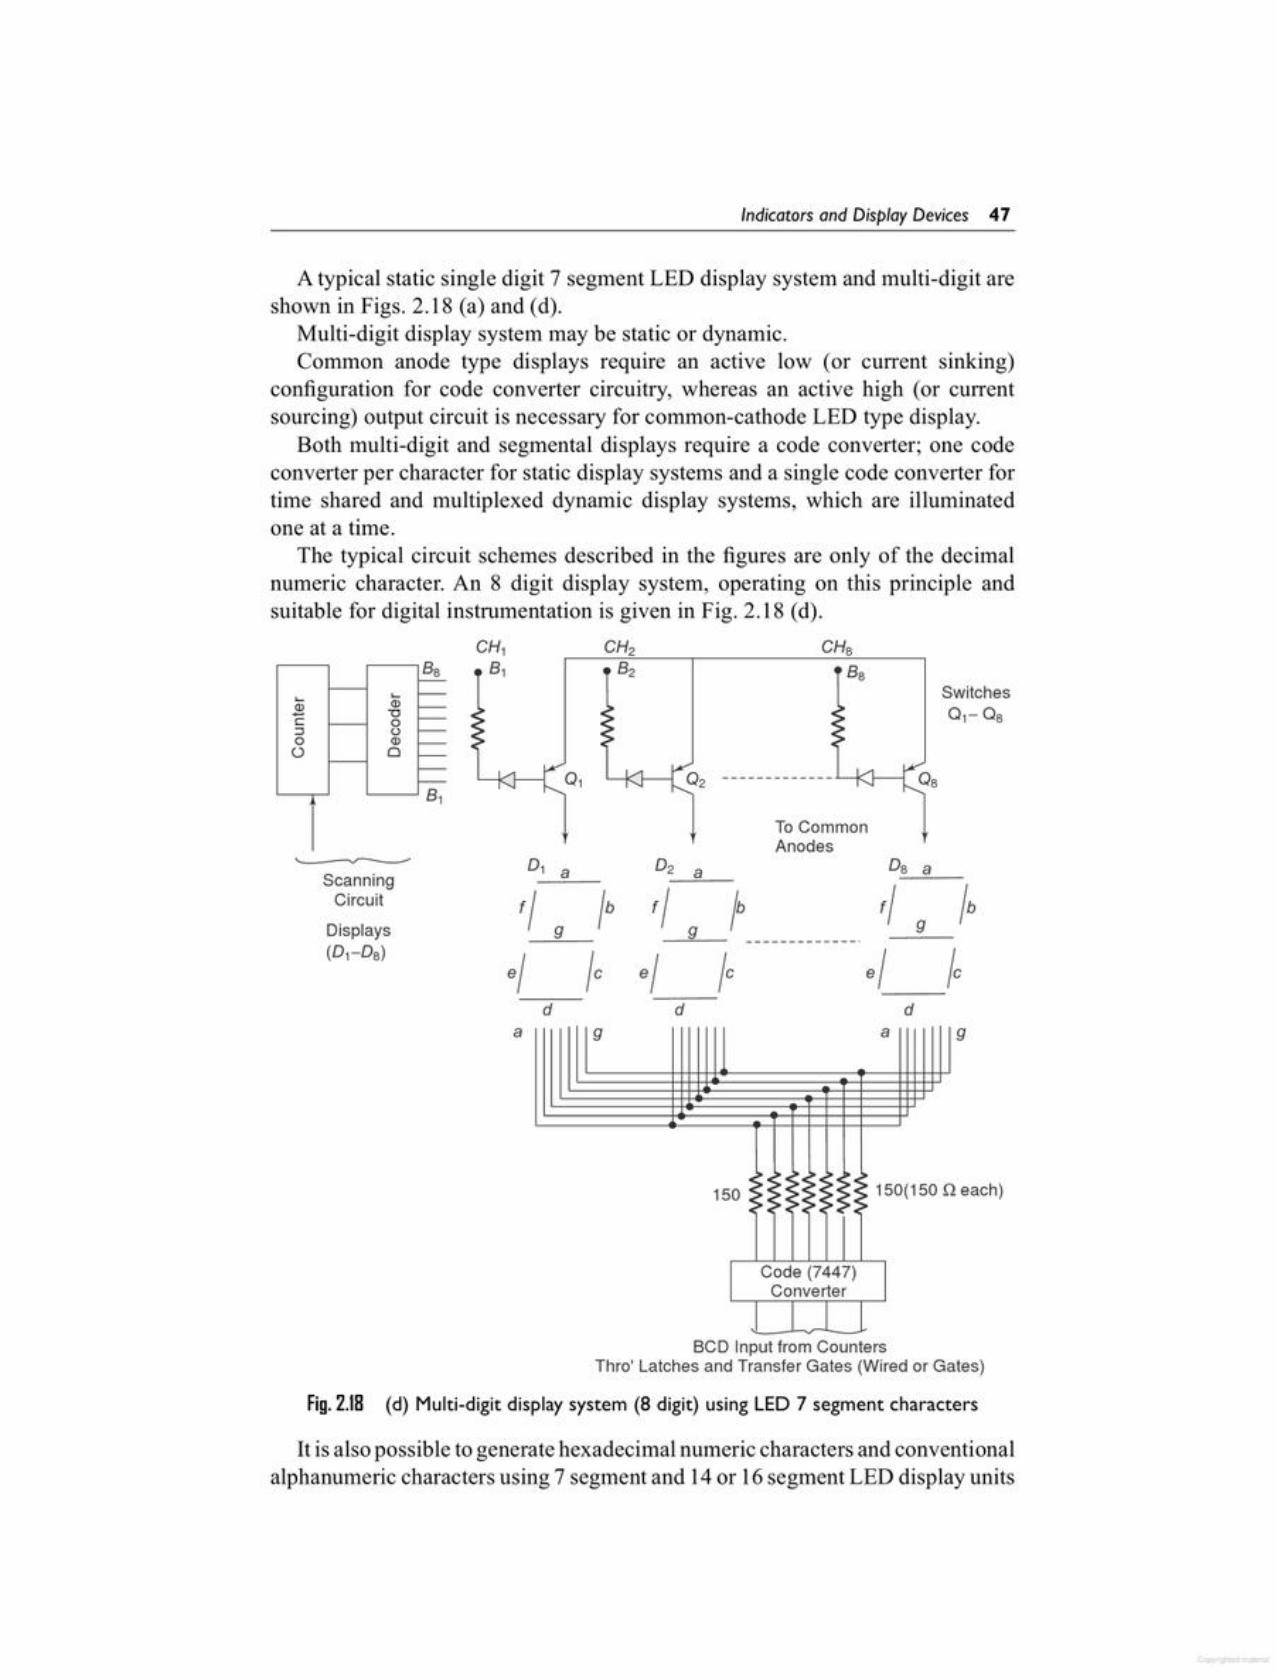
It is also possible to generate hexadecimal numeric characters and conventionalalphanumeric characters using 7 segment and 14or 16segment LED display units
Fig. 2.18 (d) Multi-digit display system (8 digit) using LED 7 segment characters
BCD Input from CountersThro' Latches and Transfer Gates (Wired or Gates)
each)
99 a
•;.~c;~:.~.~:>150 ~~:>:~;~:~~~:~ 150(150 Q•> • • • -c•••• •
Code (7447)Converter
a
CH1 CH2 CHeBe B1 B2 Be
~ ~ SwitchesQ) Q)
01-0e- "c 0::J o0 Q)
0 0
01
ToCommonAnodes
01 a O2 a De aScanning
'/ '/ /bCircuit '/ /b /bDisplays 99 9 ------------_.(01-0e) e/ Ie e/ /e e/ /e
d d d
A typical static single digit 7 segment LED display system and multi-digit areshown in Figs. 2.18 (a) and (d).
Multi-digit display system may be static or dynamic.Common anode type displays require an active low (or current sinking)
configuration for code converter circuitry, whereas an active high (or currentsourcing) output circuit is necessary for common-cathode LED type display.
Both multi-digit and segmental displays require a code converter; one codeconverter per character for static display systems and a single code converter fortime shared and multiplexed dynamic display systems, which are illuminatedone at a time.
The typical circuit schemes described in the figures are only of the decimalnumeric character. An 8 digit display system, operating on this principle andsuitable for digital instrumentation is given in Fig. 2.18 (d).
Indicators and Display Devices 47

2.12.4 Dot Matrix DisplaysExcellent alphanumeric characters can be displayed by using dot matrix LEOswith an LED at each dot location. Commonly used dot matrices for the displayof prominent characters are 5 x 7, 5 x 8, and 7 x 9, of which 5 x 7 shown in
Fig.2.19 (c) Segments driving circuits for LCD,using phase shift method
Reference Phase V~ -.I
off
onThe basic operation of the
phase shift method for driving thesegment is shown in Fig. 2.19 (c).In this circuit, ac voltages of thesame amplitude and frequency(not necessarily same phase) aresupplied to the common electrodeas well as the segments.
There will be a finite voltagedrop between a segment and thecommon electrode only when theac voltages applied are out of phase, and thus the selected segment is energised.On the other hand, when in-phase voltages are present, the voltage drop betweena segment and the common electrode is zero, leading to the off state.
Fig.2.19 (a) Segments driving circuits for LCD, switching method common electrode(b) Segments Driving circuits for LCD, switching method
(b)Vac
RR
S-off
Soon
(a)Vac
R
S-off
Soon
respectively, with a proper code converter. Both static and dynamic displays canbe realised using LCOs, either in a common fonnat (7 segment) or in single ormulti character.
A chopped dc supply may be used, for simplicity, but conventionally an acvoltage is applied either to the common electrode or to the segment. Varioussegmental LCD driver circuits are displayed in Fig. 2.19.
Referring to Figs 2.19 (a) and (b), it is seen that an ac voltage (Vac) is applied toeither the common electrode or to the segment. High value resistances (R > 1M)are included in the circuit, as shown. The code converter controls the switches(S). Vac is present across the selected segment and the common electrode whenS is ON, and the voltage between any other segment (S-OFF) and the commonelectrode is zero. Hence the desired segments are energised, provided Vac has amagnitude greater than or equal to the operating voltage of the LCD.
48 Electron;c Instrumentat;on
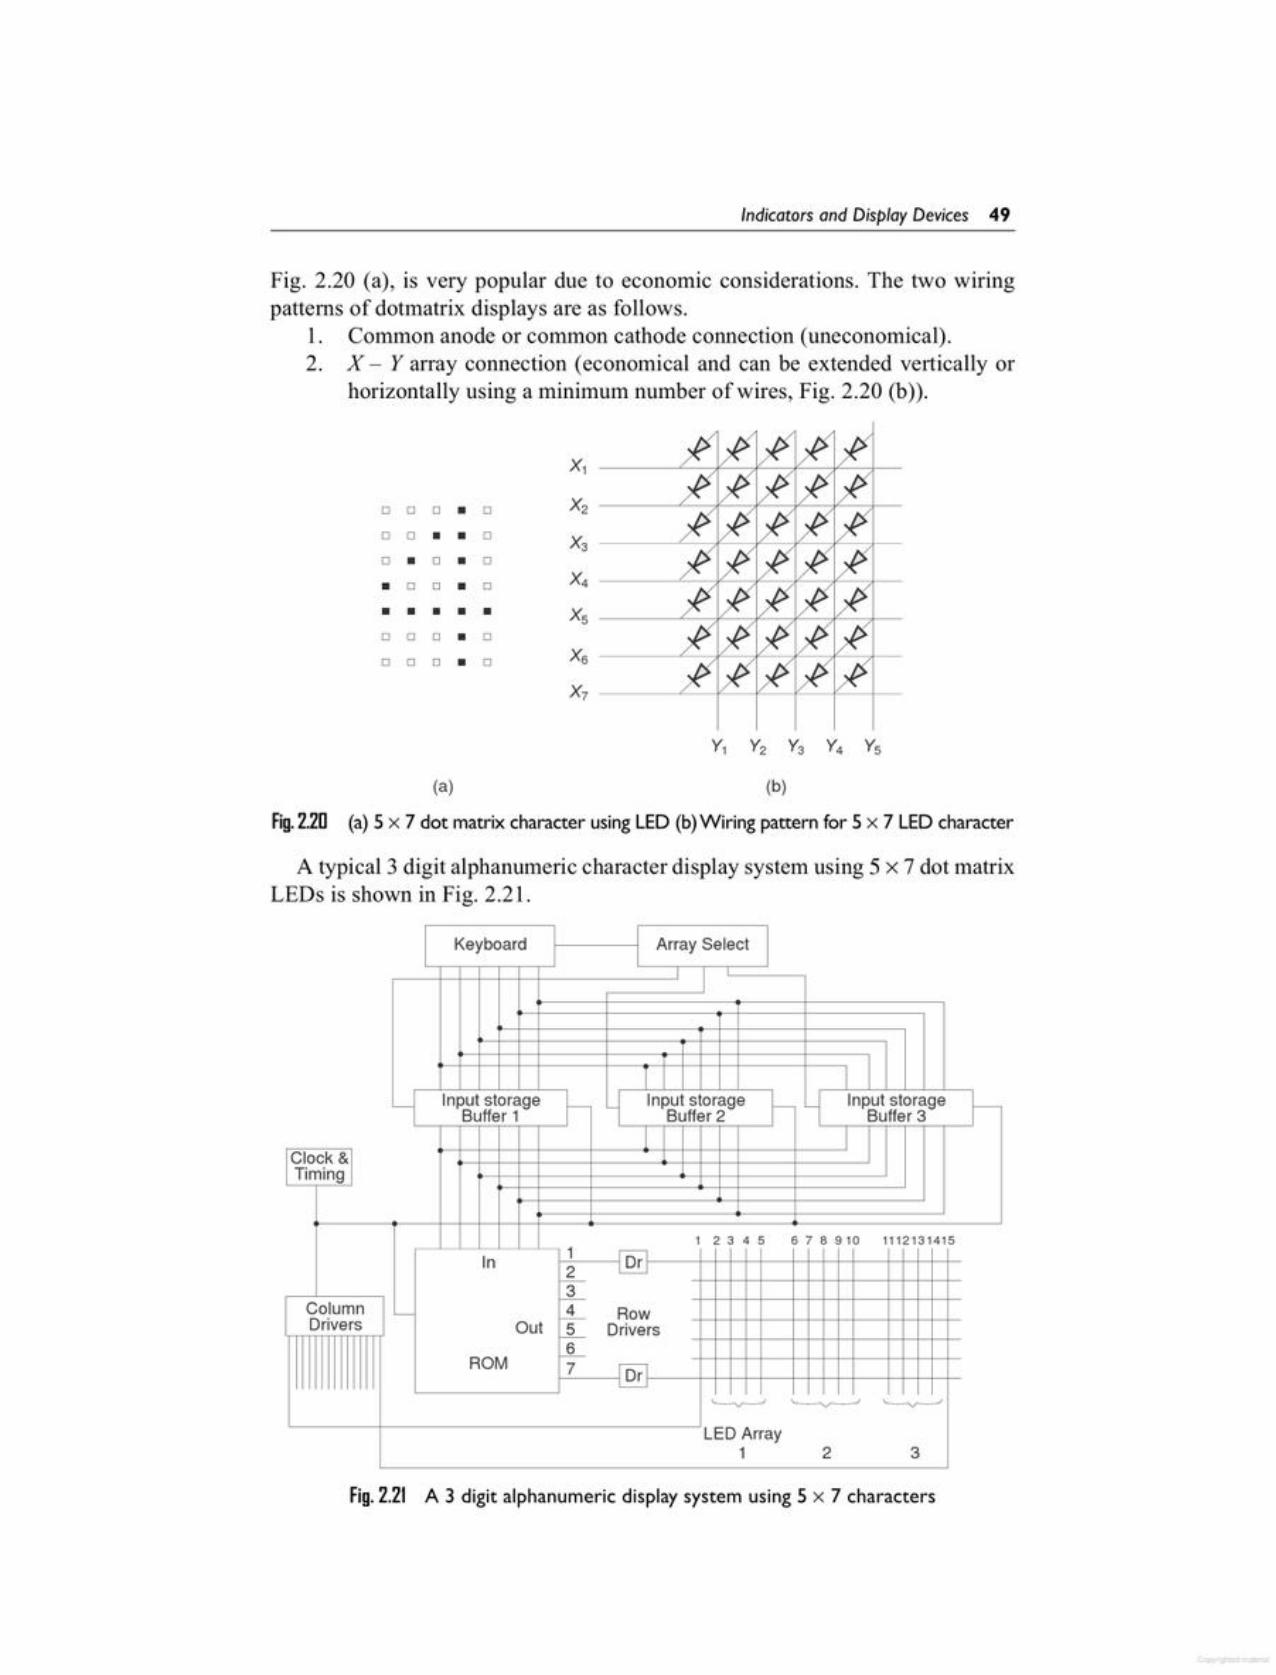
Fig.2.21 A 3 digit alphanumeric display system using 5 x 7 characters
Keyboard Array Select
I IY Input storage
~ ~Input storage
~y Input storage
~Buffer 1 Buffer 2 Buffer 31 I
Clock &Timing
1 2 3 4 5 6 7 8 910 1112131415
In 1 Dr~..L
Column '-- 4- RowDrivers Out _Q_ Drivers
ROM_§_7 Dr
'----y---J '---v---' '---v---'
LED Array1 2 3
A typical 3 digit alphanumeric character display system using 5 x 7 dot matrixLEDs is shown in Fig. 2.21.
Fig.2.20 (a) 5 x 7 dot matrix character using LED (b)Wiring pattern for 5 x 7 LEDcharacter
Xl
0 0 0 • 0 X20 0 • • 0 X30 • 0 • 0
• 0 0 • 0 X4
• • • • • X50 0 0 • 0
0 0 0 • 0 X6
X7
Y1 Y2 Y3 Y4 Ys
(a) (b)
Fig. 2.20 (a), is very popular due to economic considerations. The two wiringpatterns of dotmatrix displays are as follows.
1. Common anode or common cathode connection (uneconomical).2. X - Yarray connection (economical and can be extended vertically or
horizontally using a minimum number of wires, Fig. 2.20 (b)).
Indicators and Display Devices 49
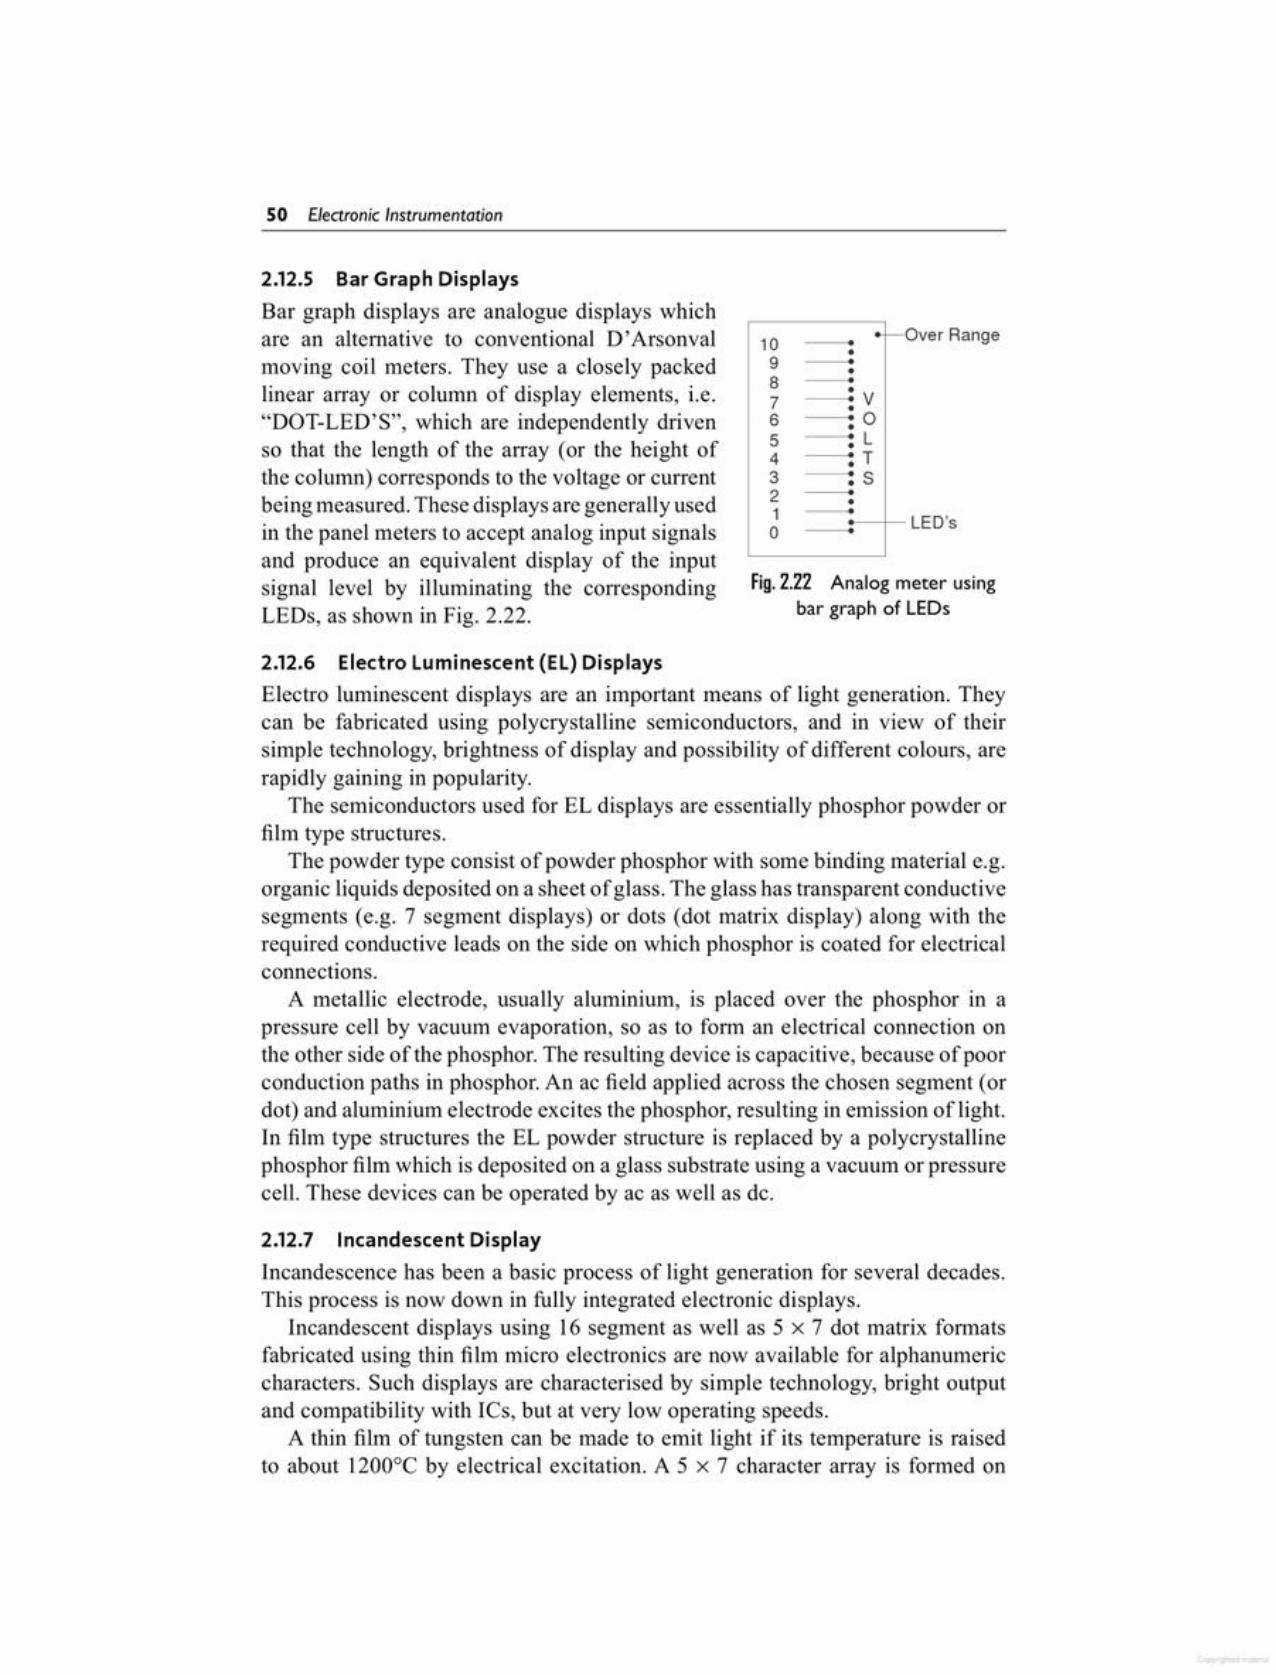
2.12.7 Incandescent DisplayIncandescence has been a basic process of light generation for several decades.This process is now down in fully integrated electronic displays.
Incandescent displays using 16 segment as well as 5 x 7 dot matrix formatsfabricated using thin film micro electronics are now available for alphanumericcharacters. Such displays are characterised by simple technology, bright outputand compatibility with ICs, but at very low operating speeds.
A thin film of tungsten can be made to emit light if its temperature is raisedto about 1200°C by electrical excitation. A 5 x 7 character array is formed on
Fig.2.22 Analog meter usingbar graph of LEDs
10 •rOver Range•9 •8 •
7 V•6 .05 • L4 • T3 • S2 •1 LED's0
2.12.5 Bar Graph DisplaysBar graph displays are analogue displays whichare an alternative to conventional D'Arsonvalmoving coil meters. They use a closely packedlinear array or column of display elements, i.e."DOT-LED'S", which are independently drivenso that the length of the array (or the height ofthe column) corresponds to the voltage or currentbeing measured. These displays are generally usedin the panel meters to accept analog input signalsand produce an equivalent display of the inputsignal level by illuminating the correspondingLEDs, as shown in Fig. 2.22.
2.12.6 Electro Luminescent (EL) DisplaysElectro luminescent displays are an important means of light generation. Theycan be fabricated using polycrystalline semiconductors, and in view of theirsimple technology, brightness of display and possibility of different colours, arerapidly gaining in popularity.
The semiconductors used for EL displays are essentially phosphor powder orfilm type structures.
The powder type consist of powder phosphor with some binding material e.g.organic liquids deposited on a sheet of glass. The glass has transparent conductivesegments (e.g. 7 segment displays) or dots (dot matrix display) along with therequired conductive leads on the side on which phosphor is coated for electricalconnections.
A metallic electrode, usually aluminium, is placed over the phosphor in apressure cell by vacuum evaporation, so as to form an electrical connection onthe other side of the phosphor. The resulting device is capacitive, because of poorconduction paths in phosphor. An ac field applied across the chosen segment (ordot) and aluminium electrode excites the phosphor, resulting in emission of light.In film type structures the EL powder structure is replaced by a polycrystallinephosphor film which is deposited on a glass substrate using a vacuum or pressurecell. These devices can be operated by ac as well as de.
SO Electron;c Instrumentat;on

The basic principle; fabrication and operating characteristics of a reflectivetype Electrophoretic linage Display (EPID) panel are as follows. These displaysare characterised by large character size, low power dissipation and internalmemory.
The relatively slow speed of these displays is a major limitation, particularlyfor use as a dynamic display. The life span of an EPID is a few thousand hoursonly.
The EPID panel makes use of the electrophoretic migration of charged pigmentparticles in a supension. The suspension, 25 - 100 f..I. thick, which largely containsthe pigment particles and a suspending liquid, is sandwiched between a pair ofelectrodes, one of which is transparent.
The application of a dc electric field, across the electrodes, as shown inFig. 2.24 moves the particles electrophoretic ally towards either electrode, themovement depending mainly on the polarity of the charge on the particles. Thereflective colour of the suspension layer changes on account of this migration.
DC Voltage:r:. Source
Glass PlateTransparentElectrode
Fi!l.2.24 Structure of an EPID
ElectrodeSegments
BlackWhiteElectrophoreticPigmentParticle ..........j--.._ , -+-s
.l, -~~~~~-~~~~-~-------------.-
~~~~~~O~U!~~~~i9~~~I~~~c~l~~~.:-
-, -------------------------_.000000000000
...L Base Plate 1
2.12.8 Electrophoretic Image Display (EPID)Electrophoresis is the movement of charged pigment particles suspended ina liquid under the influence of an electric field. This pheonomenon has beenutilised in electrophoretic image displays, as shown in Fig. 2.24.
Considering the filament dimensions and the dimensions of commonlyavailable substrates, an array of three characters can be located on a 2.5 emceramic substrate.
16 segment incandescent displays are also available, but their display is slow,because of the large thermal time constant associated with the filaments.
Fi!l.2.23 Tungsten filamentsuitable for incandescent
display
a ceramic substrate employing such films in amatrix form and isused as an integrated electronicdisplay unit. Figure 2.23 gives a typical tungstenfilm or filament suitable for a dot location in thedisplay.
An array of such filaments can be formed onceramic substrates using conventional thin filmtechnology commonly used in semiconductorfabrication.
Indicators and Display Devices 51
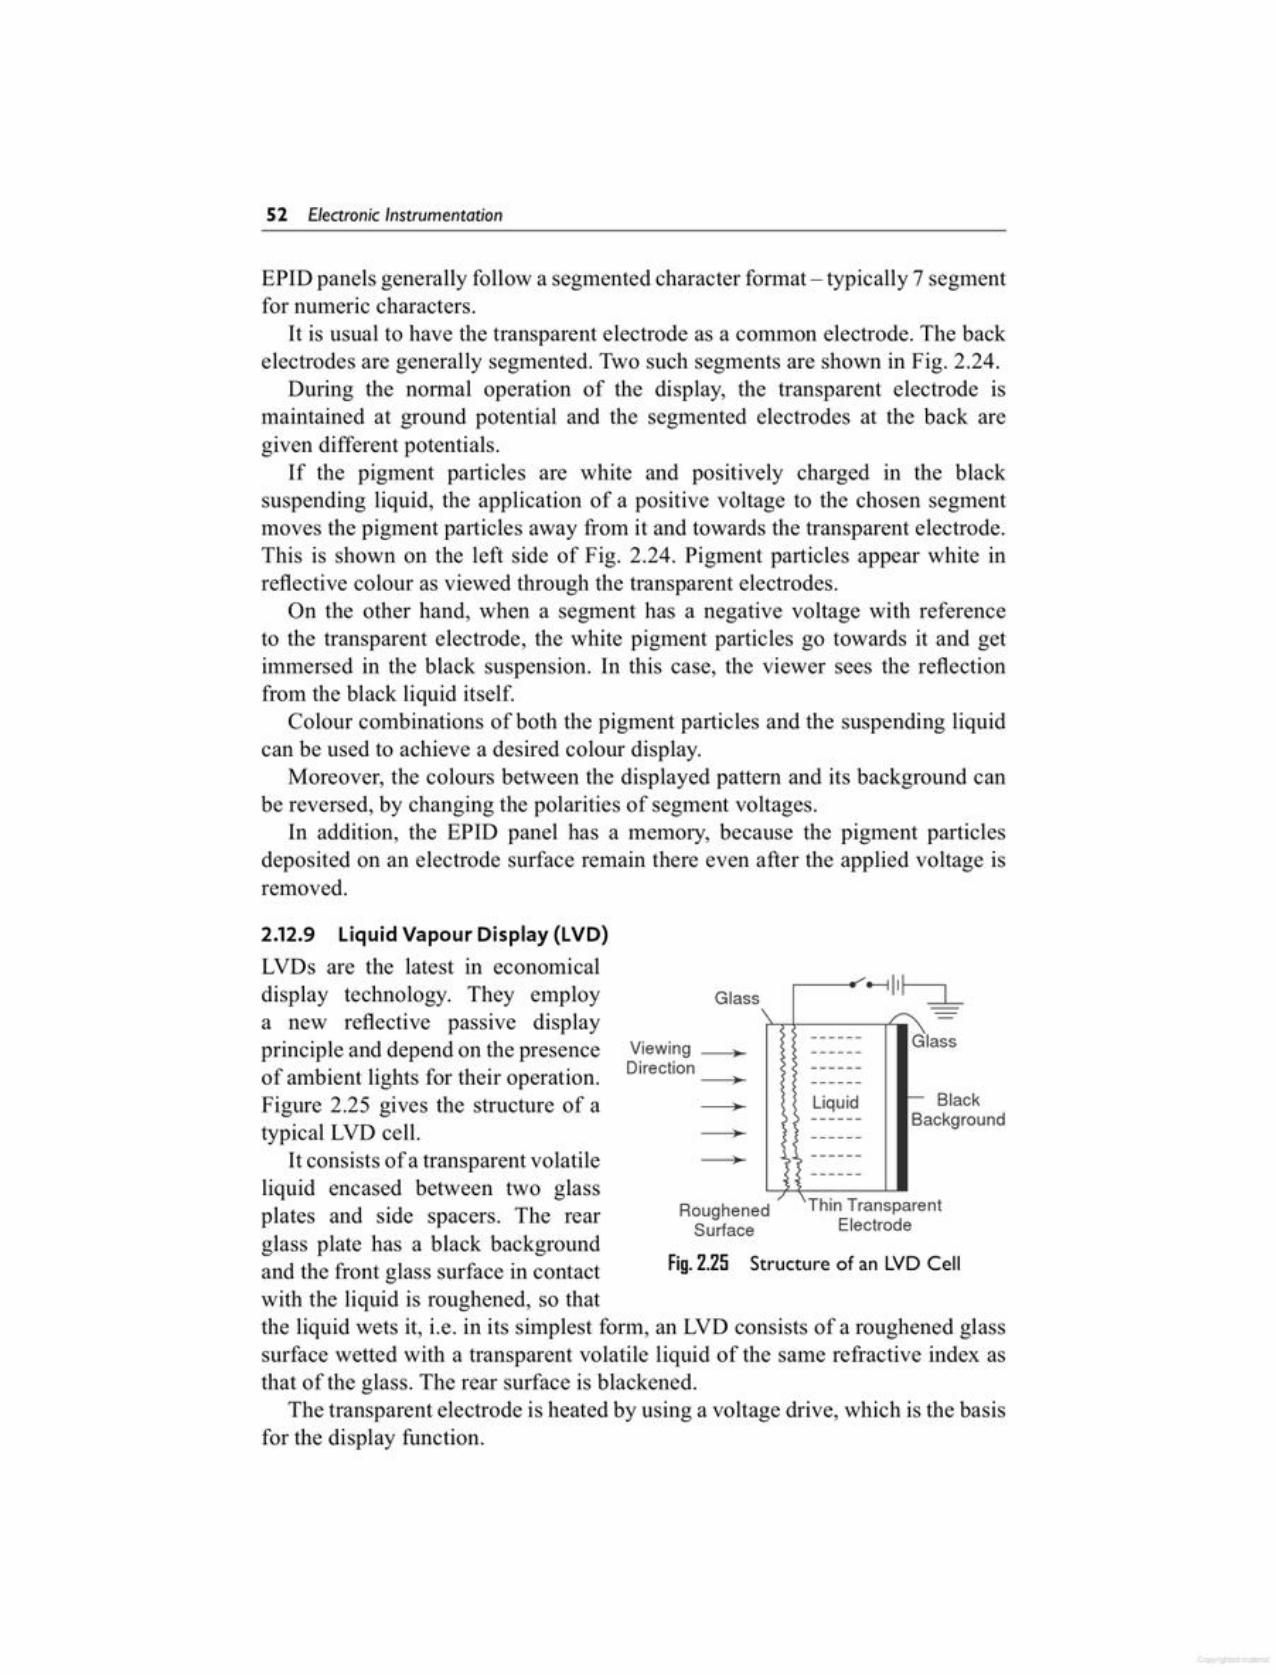
Fig.2.25 Structure of an LVD Cell
Thin TransparentElectrode
RoughenedSurface
ackgroundBlack
lass
I~/~ I
\ id------------------------
Liquid f------- B------------------
/ \.
Glass
2.12.9 Liquid Vapour Display (LVD)LVDs are the latest in economicaldisplay technology. They employa new reflective passive displayprinciple and depend on the presence Viewing_~
Directionof ambient lights for their operation. -~Figure 2.25 gives the structure of atypical LVD cell.
It consists of a transparent volatileliquid encased between two glassplates and side spacers. The rearglass plate has a black backgroundand the front glass surface in contactwith the liquid is roughened, so thatthe liquid wets it, i.e. in its simplest form, an LVD consists of a roughened glasssurface wetted with a transparent volatile liquid of the same refractive index asthat of the glass. The rear surface is blackened.
The transparent electrode is heated by using a voltage drive, which is the basisfor the display function.
EPID panels generally follow a segmented character format - typically 7 segmentfor numeric characters.It is usual to have the transparent electrode as a common electrode. The back
electrodes are generally segmented. Two such segments are shown in Fig. 2.24.During the nOlmal operation of the display, the transparent electrode is
maintained at ground potential and the segmented electrodes at the back aregiven different potentials.
If the pigment particles are white and positively charged in the blacksuspending liquid, the application of a positive voltage to the chosen segmentmoves the pigment particles away from it and towards the transparent electrode.This is shown on the left side of Fig. 2.24. Pigment particles appear white inreflective colour as viewed through the transparent electrodes.
On the other hand, when a segment has a negative voltage with referenceto the transparent electrode, the white pigment particles go towards it and getimmersed in the black suspension. In this case, the viewer sees the reflectionfrom the black liquid itself.
Colour combinations of both the pigment particles and the suspending liquidcan be used to achieve a desired colour display.
Moreover, the colours between the displayed pattern and its background canbe reversed, by changing the polarities of segment voltages.
In addition, the EPID panel has a memory, because the pigment particlesdeposited on an electrode surface remain there even after the applied voltage isremoved.
52 Electronic Instrumentation
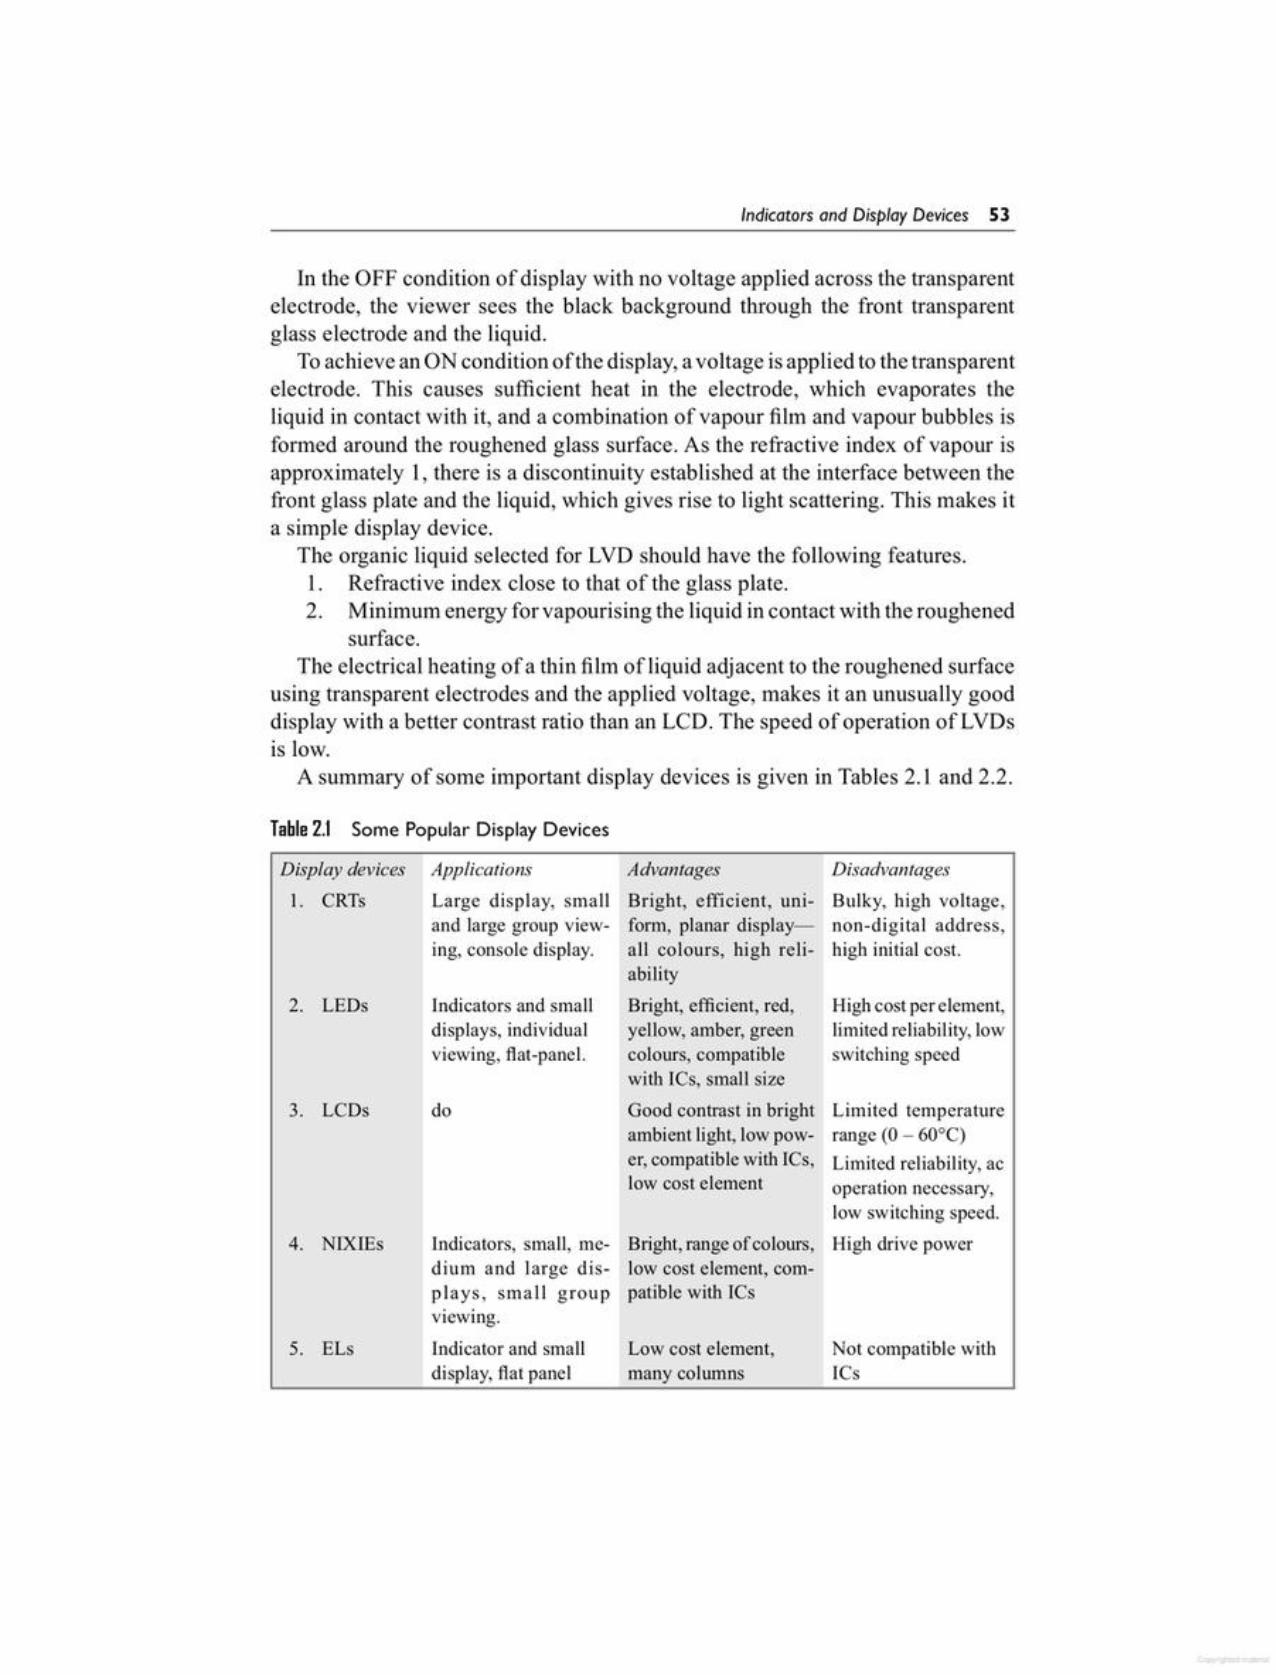
Table 2.1 Some Popular Display Devices
Display devices Applications Advantages Disadvantages
1. CRTs Large display, small Bright, efficient, uni- Bulky, high voltage,and large group view- form, planar display- non-digital address,ing, console display. all colours, high reli- high initial cost.
ability
2. LEDs indicators and small Bright, efficient, red, High cost per element,displays, individual yellow, amber, green limited reliability, lowviewing, flat-panel. colours, compatible switching speed
with ICs, small size
3. LCDs do Good contrast in bright Limited temperatureambient light, low pow- range (0 - 60°C)er, compatible with ICs, Limited reliability, aclow cost element operation necessary,
low switching speed.
4. NIXIEs Indicators, small, me- Bright, range of colours, High drive powerdium and large dis- low cost element, com-plays, small group patible with ICsviewing,
5. ELs indicator and small Low cost element, Not compatible withdisplay, flat panel many columns ICs
In the OFF condition of display with no voltage applied across the transparentelectrode, the viewer sees the black background through the front transparentglass electrode and the liquid.
To achieve an ON condition of the display, a voltage is applied to the transparentelectrode. This causes sufficient heat in the electrode, which evaporates theliquid in contact with it, and a combination of vapour film and vapour bubbles isformed around the roughened glass surface. As the refractive index of vapour isapproximately 1, there is a discontinuity established at the interface between thefront glass plate and the liquid, which gives rise to light scattering. This makes ita simple display device.
The organic liquid selected for LVD should have the following features.1. Refractive index close to that of the glass plate.2. Minimum energy for vapourising the liquid in contact with the roughened
surface.The electrical heating of a thin film of liquid adjacent to the roughened surface
using transparent electrodes and the applied voltage, makes it an unusually gooddisplay with a better contrast ratio than an LCD. The speed of operation of LVDsis low.
A summary of some important display devices is given in Tables 2.1 and 2.2.
Indicators and Display Devices 53
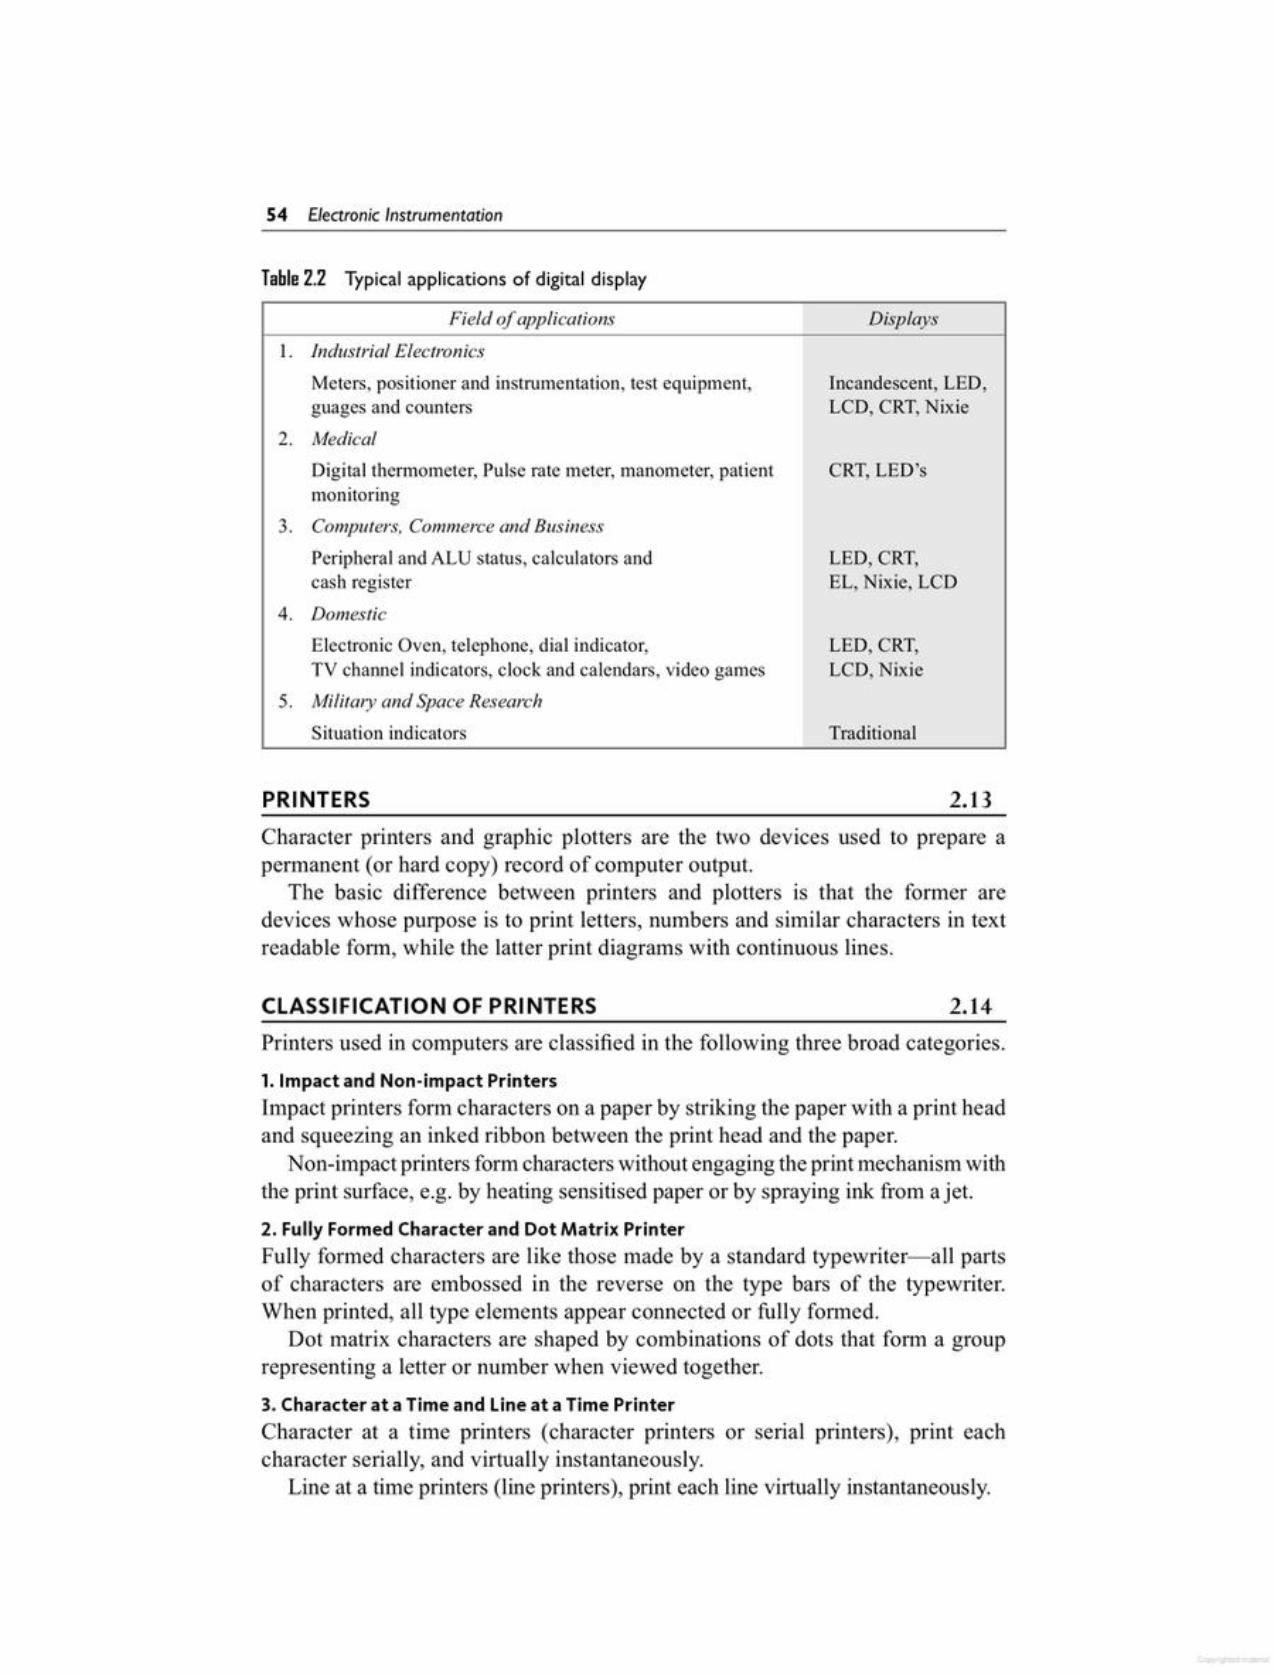
Printers used in computers are classified in the following three broad categories.1. Impact and Non-impact PrintersImpact printers form characters on a paper by striking the paper with a print headand squeezing an inked ribbon between the print head and the paper.
Non-impact printers form characters without engaging the print mechanism withthe print surface, e.g. by heating sensitised paper or by spraying ink from a jet.2. Fully Formed Character and Dot Matrix PrinterFully formed characters are like those made by a standard typewriter-all partsof characters are embossed in the reverse on the type bars of the typewriter.When printed, all type elements appear connected or fully formed.
Dot matrix characters are shaped by combinations of dots that form a grouprepresenting a letter or number when viewed together.3. Character at a Time and Line at a Time PrinterCharacter at a time printers (character printers or serial printers), print eachcharacter serially, and virtually instantaneously.
Line at a time printers (line printers), print each line virtually instantaneously.
2.14CLASSIFICATION OF PRINTERS
Character printers and graphic plotters are the two devices used to prepare apermanent (or hard copy) record of computer output.
The basic difference between printers and plotters is that the former aredevices whose purpose is to print letters, numbers and similar characters in textreadable form, while the latter print diagrams with continuous lines.
2.13PRINTERS
2. Medical
Digital thermometer, Pulse rate meter, manometer, patient CRT, LED'smonitoring
3. Computers, Commerce and Business
Peripheral and ALU status, calculators and LED, CRT,cash register EL, Nixie, LCD
4. Domestic
Electronic Oven, telephone, dial indicator, LED, CRT,TV channel indicators, clock and calendars, video games LCD, Nixie
5. Military and Space Research
Situation indicators Traditional
Incandescent, LED,LCD, CRT, Nixie
I. Industrial Electronics
Meters, positioner and instrumentation, test equipment,guages and counters
DisplaysField of applications
Table 2.2 Typical applications of digital display
S4 Electron;c Instrumentat;on

Fig. 2.26 (a) Drum wheel printer
••
CylinderPaper
Ribbon
\r-t- =-~Printer
MechanismMovement
CHARACTER AT A TIME IMPACT PRINTERS FOR FULLY FORMEDCHARACTERS (DRUM WHEEL) 2.16The typewriter is the classic example of this printer, with characters fully formedbecause they are embossed on each type bar.
Ordinary type bar typewriters cannot be used with computers, because theylack a computer coding interface for easy communications.
(The classic printer used with mini and micro computers in the past wasthe Teletype Model 33 printer. The ready availability and low cost of theseprinters, plus their relatively easy interfacing, made them natural for use in smallcomputers. The model 33 prints at a rate of 10 characters per second which isslow compared to today's printer of 55 characters per second for similar printers.)The print mechanism is a vertical cylinder. Characters are embossed in severalrows and columns around the cylinder, as shown in Fig. 2.26 (a).
Most printers used with mini or micro computers use ASCII codes. Printers arespecified as using the 48 character set, the 64 character set, the 96 character setor the 128 character set.
The 48 and 64 character sets include commonly used special symbols,numbers, a space, and upper case (capital) English alphabets.
The 96 ASCII character set includes the lower case English alphabet andseveral additional special symbols. Of the 96 characters, 'space' and 'delete' donot print, leaving only 94 printable characters.
The entire 128 character ASCII set contains 32 characters normally used forcommunication and control. These characters usually do not print, but correspondto expandable functions, such as communication and control.
2.15PRINTER CHARACTER SET
(Some advanced printers, e.g. those using lasers and xerographic methods,print lines so rapidly that they virtually print a page at a time, and are thereforecalled page printers. They are rarely used inmini computers and microcomputers,for special purposes like phototype setting.)
Indicators and Display Devices 55

Fig.2.26 (b) Daisy wheel printer
A daisy wheel print head is mounted on a rotating disk with flexible flowerlike petals similar to a daisy flower. Each petal contains the embossed characterin reverse. As the daisy wheel spins, a hammer strikes the desired flexible petalcontaining the character, in turn impacting the paper with the embossed characterthrough an inked ribbon.
To print a letter, the wheel is rotated until the desired letter is in position overthe paper. A solenoid driven hammer then hits the petal against the ribbon to printthe letter.
Daisy wheel printers are slow, with a speed of about 50 characters per second(cps). The advantage of the daisy wheel mechanism is high print quality, andinterchangeable fonts.
Character at a time printing follows the following sequence of steps; left toright printing to the end of the line, stop, return carriage and start a second line,and again print left to right. It is unidirectional.
Spinning wheel printers are capable of bidirectional printing. The secondline is stored in a buffer memory within the printer control circuitry and can beprinted in either direction, depending on which takes the least printer time.
Total of 96 Characters
,!\ \\ //
Printer '., <., ./'//Mechanism ._-_._.-"\Movement
•
....-://ii,
i
i
CharactersEmbossed onTip of Arm
The ASCII character code sent to the printer, is translated into motion thatrotates the cylinder, so that the column containing the desired character faces thepaper. The cylinder is then raised or lowered (depending on the ASCII code) topresent the column containing the desired character to be printed directly to thepaper. A hammer mechanism propels (hits) the cylinder towards the paper, whereonly the positioned character strikes the ribbon, creating the printed impressionof the character on the paper.
These printers are interfaced with small computers by a 20 - 60 rnA cun-entused to transmit ASCII coded bits serially.
Another type of fully formed character printer, designed for computer use, hascharacters mounted on the periphery of a spinning print head, known as a daisywheel printer, and is shown in Fig. 2.26 (b).
S6 Electron;c Instrumentat;on
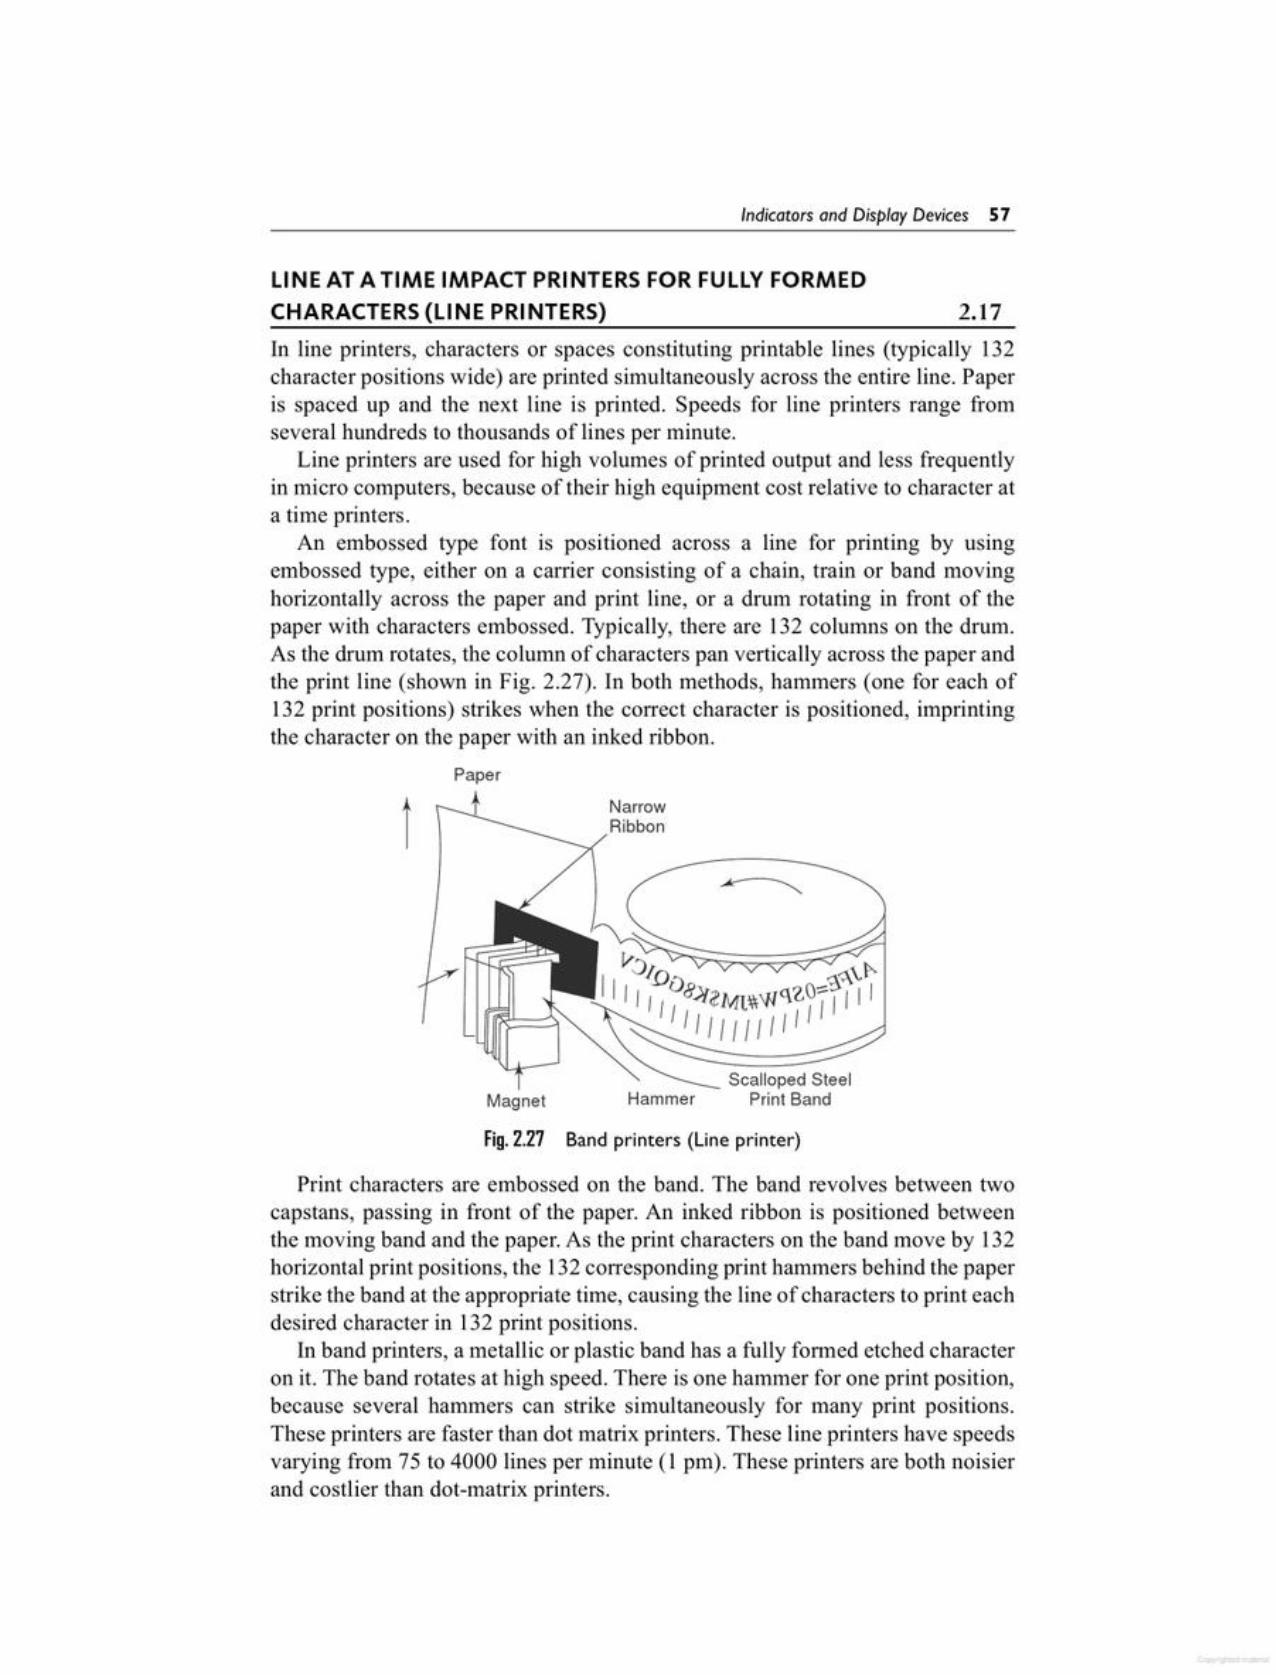
Print characters are embossed on the band. The band revolves between twocapstans, passing in front of the paper. An inked ribbon is positioned betweenthe moving band and the paper. As the print characters on the band move by 132horizontal print positions, the 132corresponding print hammers behind the paperstrike the band at the appropriate time, causing the line of characters to print eachdesired character in 132 print positions.
Inband printers, a metallic or plastic band has a fully formed etched characteron it. The band rotates at high speed. There is one hammer for one print position,because several hammers can strike simultaneously for many print positions.These printers are faster than dot matrix printers. These line printers have speedsvarying from 75 to 4000 lines per minute (1 pm). These printers are both noisierand costlier than dot-matrix printers.
Fig.2.27 Band printers (Line printer)
Scalloped SteelHammer Print BandMagnet
tPaper
LINE AT A TIME IMPACT PRINTERS FOR FULLY FORMEDCHARACTERS (LINE PRINTERS) 2.17In line printers, characters or spaces constituting printable lines (typically 132character positions wide) are printed simultaneously across the entire line. Paperis spaced up and the next line is printed. Speeds for line printers range fromseveral hundreds to thousands of lines per minute.
Line printers are used for high volumes of printed output and less frequentlyin micro computers, because of their high equipment cost relative to character ata time printers.
An embossed type font is positioned across a line for printing by usingembossed type, either on a carrier consisting of a chain, train or band movinghorizontally across the paper and print line, or a drum rotating in front of thepaper with characters embossed. Typically, there are 132 columns on the drum.As the drum rotates, the column of characters pan vertically across the paper andthe print line (shown in Fig. 2.27). In both methods, hammers (one for each of132 print positions) strikes when the correct character is positioned, imprintingthe character on the paper with an inked ribbon.
Indicators and Display Devices 57

Fig.2.2B Drum printers
Paper
Hammers
Figure 2.28 illustrates a drum printer. Each of the 64 or 96 characters used isembossed in 132 columns around the drum, corresponding to the print positions.The drum rotates in front of the paper and ribbon. Print hammers strike thepaper, imprinting characters from the drum through the ribbon and forming animpression on the paper.
The drum printer uses a cylindrical drum which contains characters embossedaround it. There is one complete character set for each print position. To printcharacters, magnetically driven hammers in each character position strike thepaper and ribbon against the spinning drum. An entire line of characters can beprinted during each rotation of the drum. Printing speeds of drum printers varyfrom 200 - 300 lpm. The drawbacks of drum printers are that the fonts are noteasily changeable, and the print lines may be wavy.
2.18DRUM PRINTER
A band always contains more than one character set. This reduces access timeneeded to match the characters, thereby reducing the printing time. Below the characters are the timing marks which are sensed by the printers electronic circuitry. Itcompares the character to be printed with the character corresponding to the timingmark, senses it and if a match occurs, fires the corresponding hammer.
A chain printer is similar to a band printer, except that in the former thecharacters sets are held in a metal or rubber chain and rotated across the paperalong a print line.
A chain revolves in front of the ribbon and paper. Each link in the chain isdesigned to hold a pallet on which type characters are embossed. Hammers arelocated behind the paper and each of 132 hammers strikes the moving type palletwhen the desired character passes the position in which it is timed to print.
58 Electron;c Instrumentat;on

Fig.2.30 Impact dot matrix print head
Sequence of DolGenerationMoving Malrix Head --
..... . . .. .....1 2 3 4 5 6 7 8 9 10
- . .- _. .--•• • •• •
•••
••• • • • •• • • •
•••
Paper
••
•
The print head for an impact dot matrix character is usually composed for anarray of wires (or pins) arranged in a tabular form, that impact the characterthrough an inked ribbon, as shown in Fig. 2.30. For this reason, these printers aresometimes also called wire printers.
Needle MI.a nxActuators Needles
CHARACTER AT A TIME DOT-MATRIX IMPACT PRINTER 2.20
Dot-matrix printers can print any combination of dots with all available printpositions in the matrix. The character is printed when one of 128 ASCII codesis signalled and controlled by the ROM (read only memory) chip, which in tumcontrols the patterns of the dots. By changing the ROM chip a character set forany language or graphic character set can be used by the printer.
• • • •• • • • • • • •• • • •• (5 x 7) • • (9 x 7) •Fig.2.29 Dot matrix sizes
• •uI II II II I
Dot matrix characters are formed by printing a group of dots to form a letter,number or other symbol. This method is widely used with mini and microcomputers.
Dots are formed both by impact and non impact print methods and are bothcharacter at a time and line at a time printers.
Figure 2.29 shows the letter 'A' formed by a dot-matrix, five dots wide andseven dots high (5 x 7) and in a 9 x 7 matrix. A 5 x 7 dot-matrix is frequentlyused when all letters are acceptable, in upper case.
Full Pitch Half Pitch,..-A---..
2.19DOT-MATRIX PRINTERS
Indicators and Display Devices 59
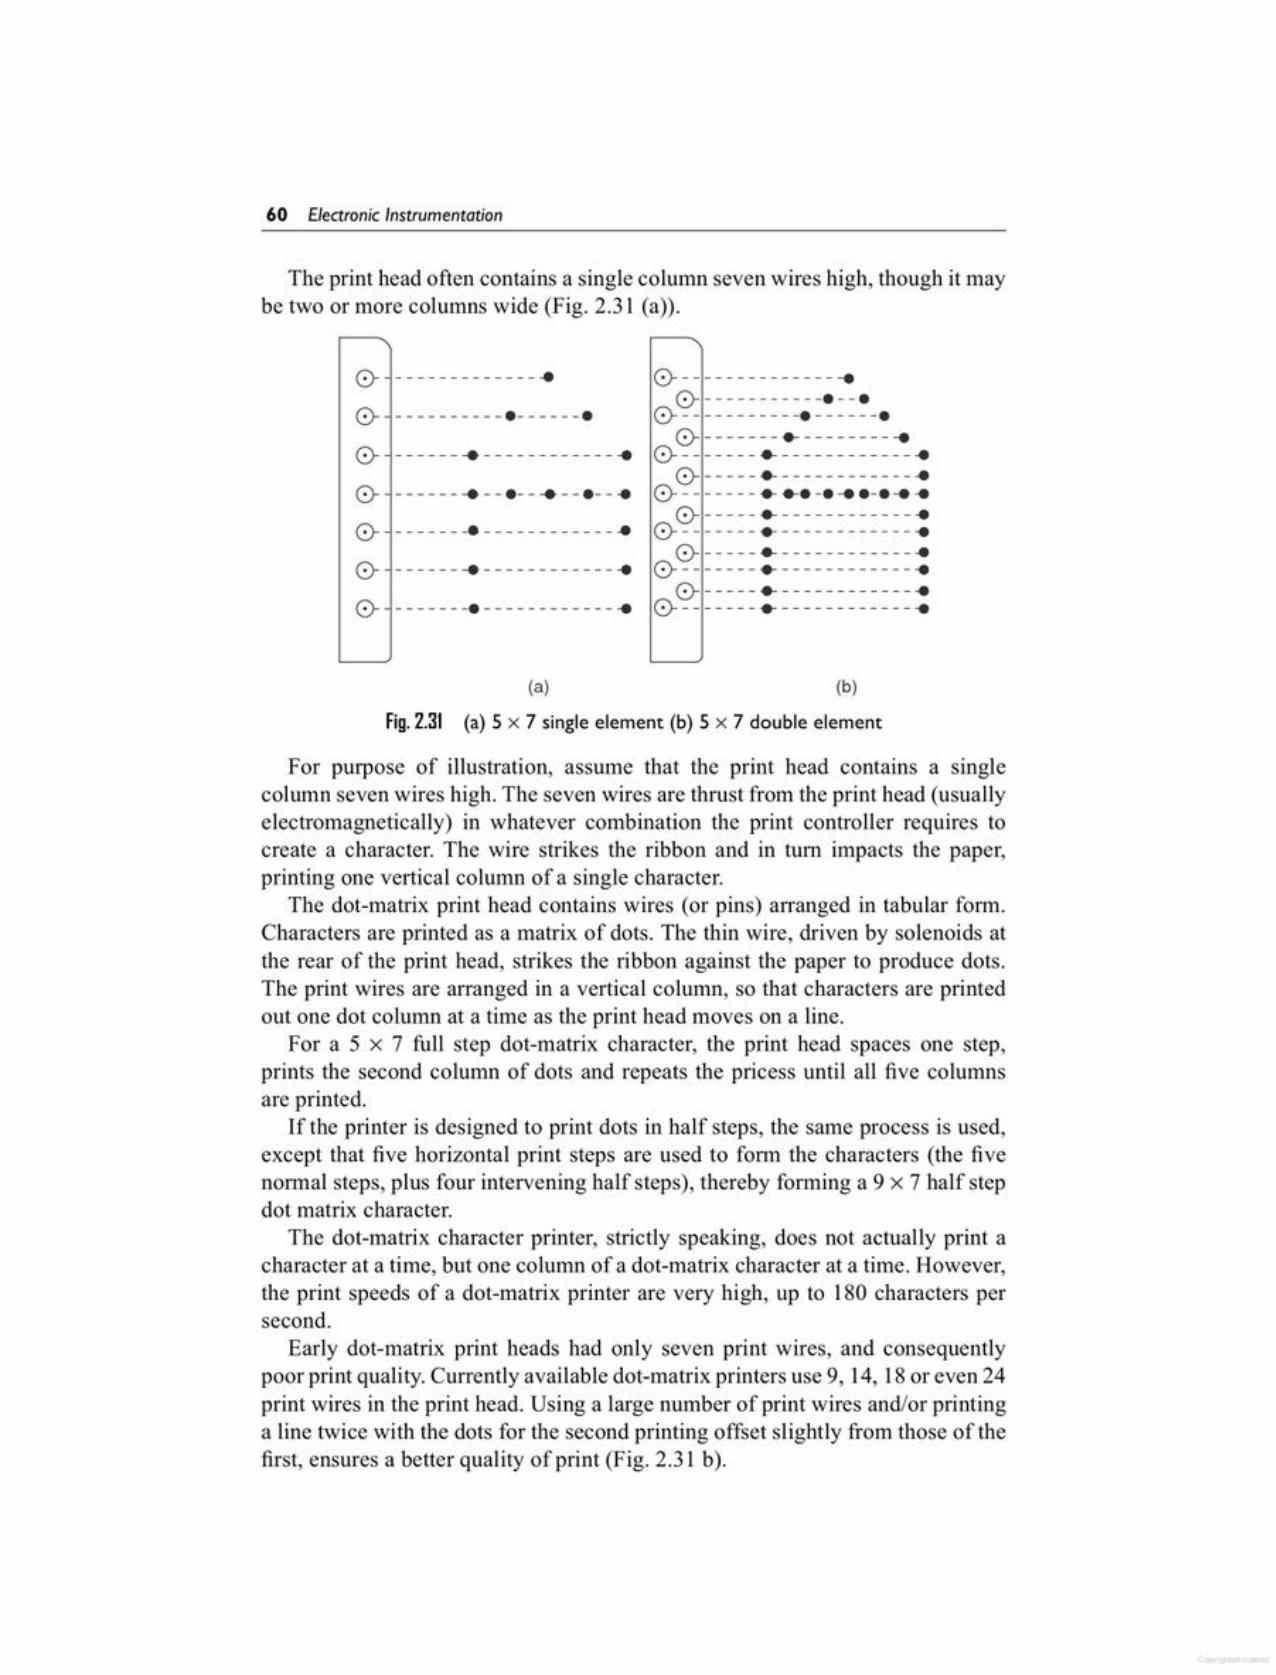
Fig. 2.31 (a) 5 X 7 single element (b) 5 X 7 double element
For purpose of illustration, assume that the print head contains a singlecolumn seven wires high. The seven wires are thrust from the print head (usuallyelectromagnetically) in whatever combination the print controller requires tocreate a character. The wire strikes the ribbon and in tum impacts the paper,printing one vertical column of a single character.
The dot-matrix print head contains wires (or pins) arranged in tabular form.Characters are printed as a matrix of dots. The thin wire, driven by solenoids atthe rear of the print head, strikes the ribbon against the paper to produce dots.The print wires are arranged in a vertical column, so that characters are printedout one dot column at a time as the print head moves on a line.
For a 5 x 7 full step dot-matrix character, the print head spaces one step,prints the second column of dots and repeats the pricess until all five columnsare printed.
If the printer is designed to print dots in half steps, the same process is used,except that five horizontal print steps are used to form the characters (the fivenormal steps, plus four intervening half steps), thereby forming a 9 x 7 half stepdot matrix character.
The dot-matrix character printer, strictly speaking, does not actually print acharacter at a time, but one column of a dot-matrix character at a time. However,the print speeds of a dot-matrix printer are very high, up to 180 characters persecond.
Early dot-matrix print heads had only seven print wires, and consequentlypoor print quality. Currently available dot-matrix printers use 9, 14, 18 or even 24print wires in the print head. Using a large number of print wires and/or printinga line twice with the dots for the second printing offset slightly from those of thefirst, ensures a better quality of print (Fig. 2.31 b).
(b)(a)
0----------------.0------------.--.0------------.------.0--------.-------- ....
0--------.------------ ..0- -----.- ----- ---- --..
0- ------- ••• -. -•• -.......0- -----.- ----- ---- --..0--------.------------ ..0- -----.- --- -- ---- --..0--------.------------ ..0- -----.- --- -- ---- --..0--------.------------ ..
0- ------------- ..0- ----------.------.0- ------ ------------ ..0- ---- -- --.- -....--.- -..0- -------.------------ ..0-- ------ ....------------ ..0- ---- -- -. ---- -- ------..
The print head often contains a single column seven wires high, though it maybe two or more columns wide (Fig. 2.31 (a».
60 Electron;c Instrumentat;on
1. Explain the basic principle of aD' Arsonval movement.
2. Draw and explain the construction ofa PMMC movement.
3. State the functions of counterweightsin a PMMC movement,
4. Describe the operation of a practicalPMMC movement.
5. Explain the basic construction of ataut band movement.
6. Compare a PMMC movement with ataut band movement.
7. State the operating principle of aneJectrodynamometer (EDM).
8. Describe the operation of an electrodynamometer.
9. Why is an electrodynamometer calleda square law device?
10. What is a transfer instrument? Whyis an electrodynamorneter referred toas a transfer instrument?
11. State the principle of a moving irontype instrument.
Review lluastiens I------------------------------12. Describe with a diagram the construe-
tion of a radial vane type movement.13. Explain the operation of a repulsion
type ac meter.14. Describe with a diagram the con
struction of a concentric vane repulsion type movement. Explain theoperation of a concentric vane repulsion type movement,
15. Differentiate between moving ironand moving coil movement.
16. State the difference between radialand concentric vane movement
17. How can an electrodynamometer beconverted into an ammeter? How canan electrodynamometer be convertedinto a voltmeter? How can an electrodynamorneter be converted into awattmeter?
18. State the difference between analogand digital indicators.
19. How are the displays classified. Listdifferent types of display devices.
Non-impact dot-matrix printers cause amark without directly touching the paper.They are therefore quiet compared to impact printers.
They cannot make carbon copies, however, as there is no force to impress thecharacter through multiple carbon copies. NIDM printers are useful for printingsingle copies of computer output, for recording the output of printing calculatorsand video displays, and for logging industrial data.
There are four types ofNIDM printers thermal, electrosensitive, electrostatic,and ink jet.
2.21NON-IMPACT DOT-MATRIX (NIDM) PRINTERS
Common speeds of dot-matrix printers range from 50 - 200 cps, but printerswith speed as high as 300 cps are also available.
The dot-matrix codes of the characters are stored in EPROM. The fonts orprint graphics can be changed under program control. This is the main advantageof dot-matrix printers.
The font of dot-matrix printers can be changed during printing by includingthe desired formats in RAM or ROM. Hence, it is possible to include standardASCII characters, italics, subscripts, etc. on the same line. Special graphics canalso be programmed into the printer.
Indicators and Display Devices 61
(iii) Bar graphs have unique role inelectronic display system.
39. What is an electro-luminscent display? Explain its operation.
40. Compare the relative performanceof the following displays in numericdisplay application:(i) Electrophoretic image display(ii) Liquid vapour display(iii) Nixie tube(iv) Flat panel alphanumeric CRT
41. Explain with a diagram the construction and working of an electrophoretic image display.
42. Describe with diagram the operationof a liquid vapour tube.
43. What are printers? Where are theyused? Describe different types ofprinters.
44. How is character-at-a-time printingdone?
45. How is line at a time printing done?46. What do you mean by impact and
non-impact printers?47. State thedifferentmethodsof character
at-a-time printing.48. Explain with a diagram how printing
is done using a drum wheel.49. Explain with a diagram the operation
of a band printer.50. Explain the principle of operation of
a dot matrix printer.51. Differentiate between (5 x 7) and
(9 x 7) matrix.52. Which matrix IS most commonly
used? Why?53. Describe with a diagram the opera
tion of an impact dot matrix printer.54. Explain in brief the working of a
non-impact dot matrix printer.55. What is a daisy wheel? Explain with a
diagram the operation of a daisy wheel.56. What are dot matrix printers? How is
printing done by them? How can thequality of printing be improved.
57. What are the main advantages of a dotmatrix printer over other printers.
58. What are half steps in a Dot matrix?Why are they used?
20. Draw the structure of an LED andexplain its operation.
21. What are the conditions to be satisfied by the device for emission ofvisible light?
22. State the advantages and disadvantages of using LED in electronic display.
23. List different materials used to radiate different colours.
24. Explain the construction and operation of a seven-segment display.
25. Discuss with a neat diagram, a method of realizing a 7-segment numericdisplay using LEDs.
26. Bring out the important differencesbetween the common anode andcommon cathode type circuit arrangements for a 7-segment numericdisplay using LEDs.
27. State the operating principle of LCDdisplay.
28. State different types of liquid crystalused for LCD display.
29. Explain with diagram the operationof a Nematic Liquid Crystal (NLC).
30. Explain the basic differences between transmissive and reflectivetype LCD.
31. Explain with a diagram the operationof a reflective display using NLC.
32. State the important features ofLCDs.
33. State the advantages of LCD displayover LED display.
34. Compare LCD and LED display.35. State the principle of a gas discharge
plasma display.36. What do you understand by Nixie?37. Explain with a diagram the operation
of a seven-segment display usinggaseous discharge.
38. Give reasons for the following:(i) Dot matrix presentation is more
popular than bar matrix in character generation in CRT.
(ii) Reflective LCDs have manyadvantages over transmissiveLCDs.
62 Electron;c Instrumentat;on
3. C. Louis Hohenstein, 'ComputerPeripherals for Mini Computer',Micro-processor and PC., McGrawHill, 1980.
4. A.K. Sawhney, Electronic and Electrical Measurements, Khanna Publishers.
1. B.S. Sonde, Transducers and DisplaySystems, Tata McGraw-Hill, 1979.
2. Philco Technological Centre, Electronic Precision Measurement Techniques and Experiment.
_F_u_rt_he_r_R_ea_d_in&g ~
4. A moving iron movement uses(a) ribbon(b) moving coil(c) electrodynamometer(d) radial vane
5. Less power is consumed by the following devices:(a) LED (b) LCD(c) neon lamps (d) nixie hlbe
6. LED is based on the principle of(a) scattering (b) illumination(c) absorption (d) transmission
7. The liquid used in LCDs are(a) nematic (b) tantalum(c) oil (d) electrolytic
1. AD' Arsonval movement is(a) taut band(b) PMMC(c) electrodynamometer(d) moving iron type
2. A PMMC uses a(a) taut band(b) moving coil(c) electrodynamometer(d) moving iron type.
3. A taut band movement uses a/an(a) ribbon(b) moving coil(c) electrodynarnorneter(d) moving iron type
_M_u_lt.ip_le_C_h_Di_ce__ Uu_e_st_iD_n_s ~
Indicators and Display Devices 63
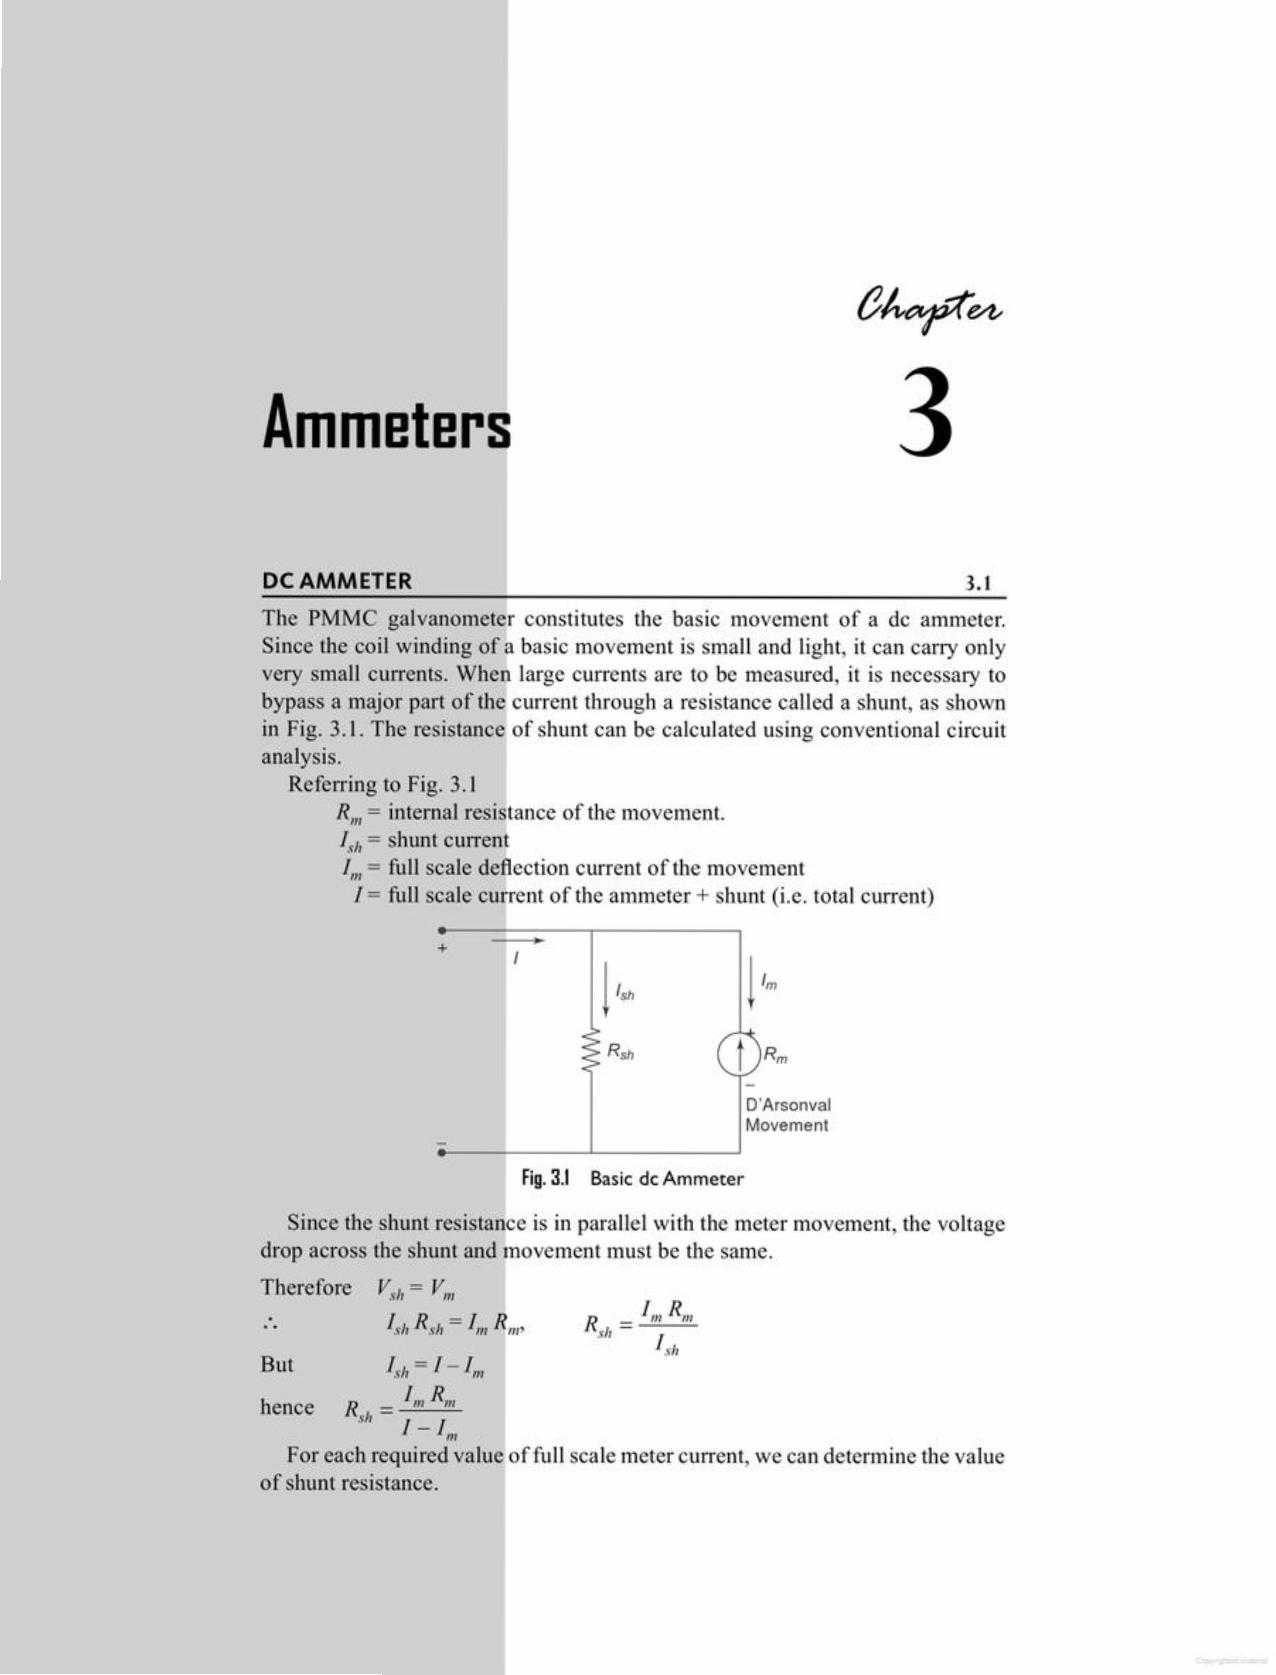
But Ish= I-1mhence R = 1m Rm
sit 1-1",
For each required value of full scale meter current, we can determine the valueof shunt resistance.
Since the shunt resistance is in parallel with the meter movement, the voltagedrop across the shunt and movement must be the same.
Therefore Vsh = Vm
+ I !'Sh !1mRsh
D'ArsonvalMovement
Fig. 3.1 Basic de Ammeter
The PMMC galvanometer constitutes the basic movement of a de ammeter.Since the coil winding of a basic movement is small and light, it can carry onlyvery small currents. When large currents are to be measured, it is necessary tobypass a major part of the current through a resistance called a shunt, as shownin Fig. 3.1. The resistance of shunt can be calculated using conventional circuitanalysis.
Referring to Fig. 3.1Rill = internal resistance of the movement.Ish = shunt currentI", = full scale deflection current of the movement1= full scale current of the ammeter + shunt (i.e. total current)
3.1DC AMMETER
Ammeters
500::: 0.50 n999
R _ Rm soonsh - (n - 1) - 1000 - 1
Step 2:
Step 1:
_ Rm(n -1)
Given:
Solution The shunt can also be determined by considering current I to be 'n'times larger than In/' This is called a multiplying factor and relates the totalcurrent and meter current.Therefore 1= n 1mTherefore the equation for
Example 3.1 (b) A 100 flA meter movement with an internal resistance of500 Q is to be used in a 0 - 100 mA Ammeter. Find the value oj' the requiredshunt.
RSh ::: 1mRm ::: 1mA X 100 n :::100 mAn :::100 n::: 1.01 n1 - 1m 99 rnA 99 rnA 99
The shunt resistance used with a basic movement may consist of a lengthof constant temperature resistance wire within the case of the instrument.Alternatively, there may be an external (manganin or constantan) shunt havingvery low resistance.
The general requirements of a shunt are as follows.1. The temperature coefficients of the shunt and instrument should be low
and nearly identical.2. The resistance of the shunt should not vary with time.3. It should carry the current without excessive temperature rise.4. It should have a low thermal emf.Manganin is usually used as a shunt for de instruments, since it gives a low
value of thermal emf with copper.Constantan is a useful material for ac circuits, since it's comparatively high
thermal emf, being unidirectional, is ineffective on the these circuits.Shunt for low current are enclosed in the meter casing, while for currents
above 200 A, they are mounted separately.
Solution Given Rm = 100 n, 1m = 1 rnA, 1 = 100 rnA
Example 3.1 (a) AlmA meter movement with an internal resistance of100 Q is to be converted into a 0 - 100 rnA. Calculate the value of shuntresistance required.
Ammeters 65
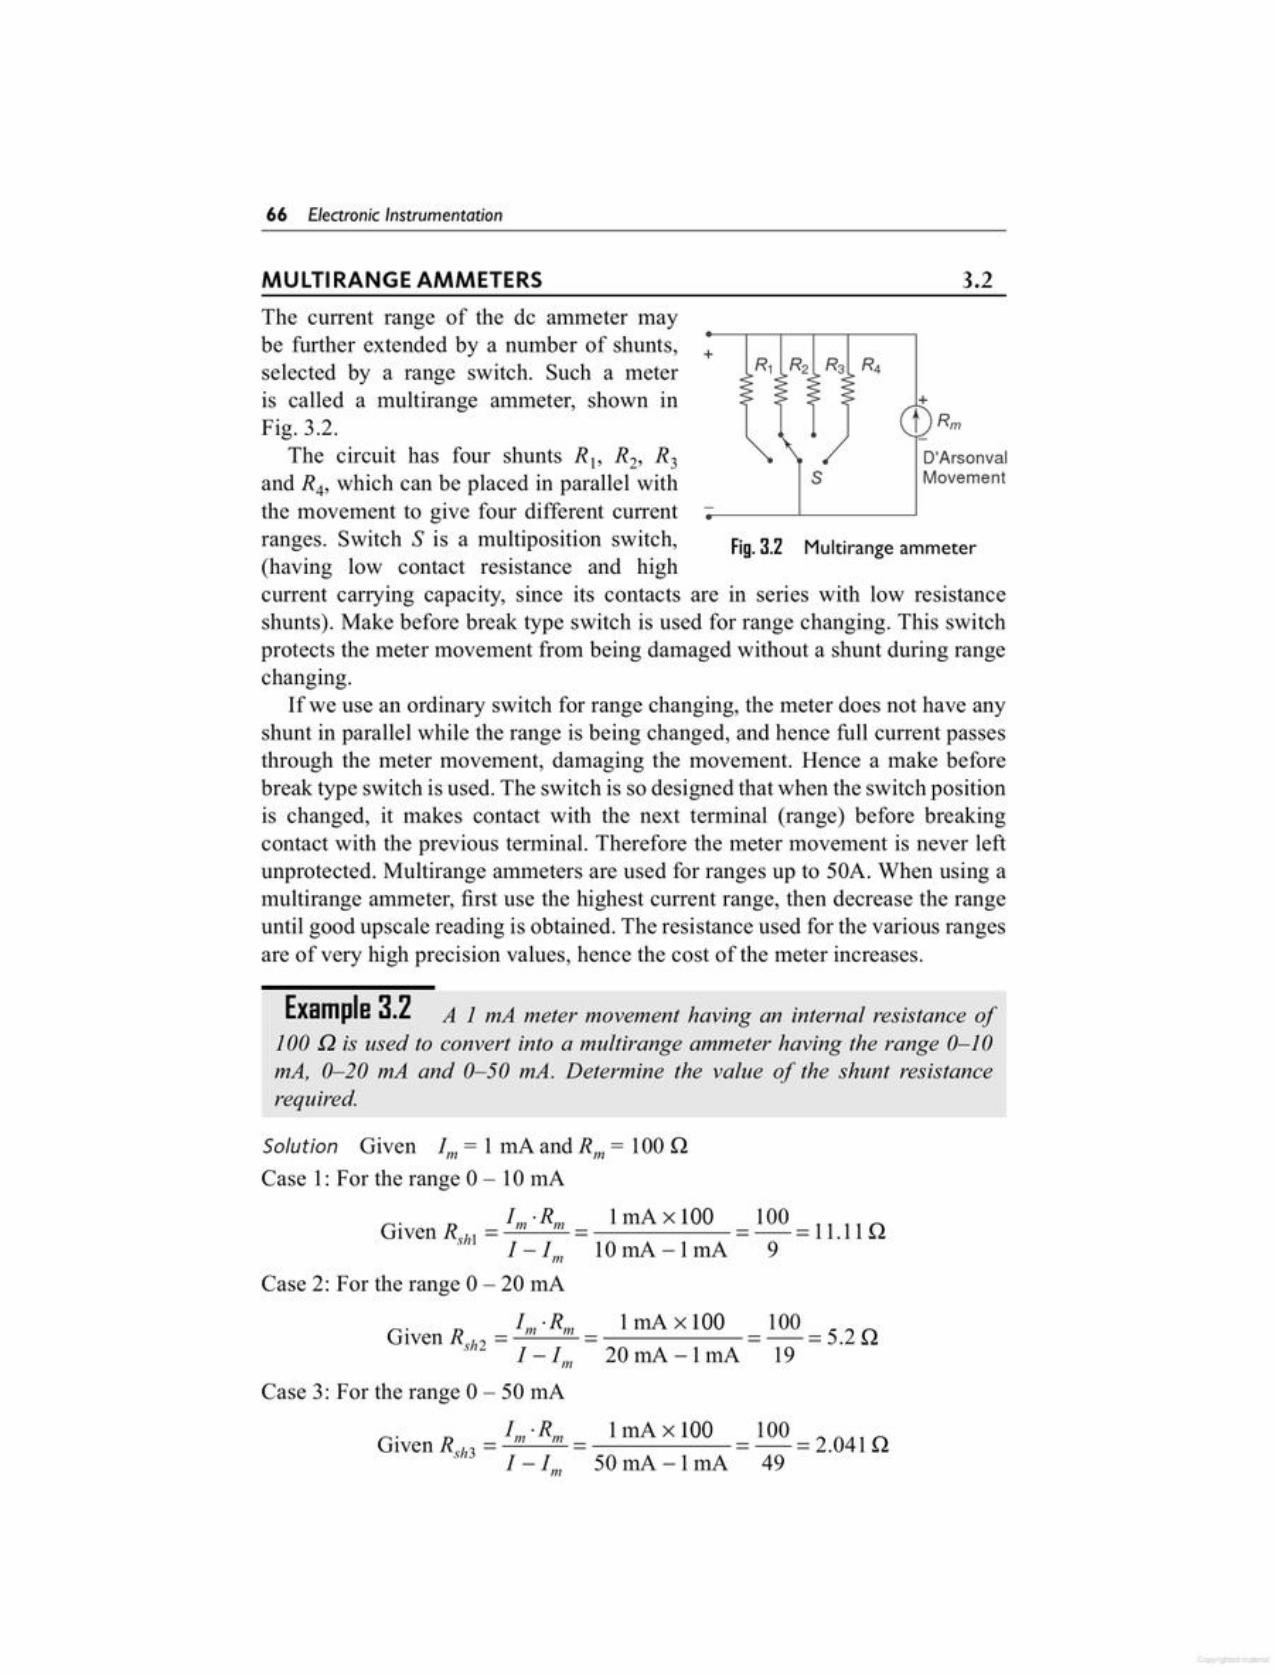
100 =5.2Q19
Case 2: For the range a - 20 rnA
I·R 1 rnA x 100Given R = m 111
sh2 I - 111/ - 20 rnA - 11nA
Case 3: For the range 0 - 50 rnA
Given R = 1m·R1I1 = 1rnA x 100 = 100 = 2.041 Qs"3 I - 1", 50 rnA - 1rnA 49
GivenR. = II1/·RIII _ lrnAx100 = 100 =11.11Q~hl I - I 10 rnA -1 rnA 9
111
Solution Given 1m = 1 rnA and Rm = 100 QCase 1: For the range 0 - lOrnA
Example 3.2 AlmA meter movement having an internal resistance oj'100 .Q is used to convert into a multirange ammeter having the range 0-10mA, 0-20 mA and 0-50 mAo Determine the value of the shunt resistancerequired.
Fig. 3.2 Multirange ammeter
D'ArsonvalMovements
+t Rm
The current range of the dc ammeter maybe further extended by a number of shunts, +selected by a range switch, Such a meteris called a multirange ammeter, shown inFig. 3.2.
The circuit has four shunts RI, R2, R3and R4, which can be placed in parallel withthe movement to give four different currentranges. Switch S is a multiposition switch,(having low contact resistance and highcurrent carrying capacity, since its contacts are in series with low resistanceshunts). Make before break type switch is used for range changing. This switchprotects the meter movement from being damaged without a shunt during rangechanging.
Ifwe use an ordinary switch for range changing, the meter does not have anyshunt in parallel while the range is being changed, and hence full current passesthrough the meter movement, damaging the movement. Hence a make beforebreak type switch is used. The switch is so designed that when the switch positionis changed, it makes contact with the next terminal (range) before breakingcontact with the previous terminal. Therefore the meter movement is never leftunprotected. Multirange ammeters are used for ranges up to 50A. When using amulti range ammeter, first use the highest current range, then decrease the rangeuntil good upscale reading is obtained. The resistance used for the various rangesare of very high precision values, hence the cost of the meter increases.
3.2MULTI RANGE AMMETERS
66 Electron;c Instrumentat;on
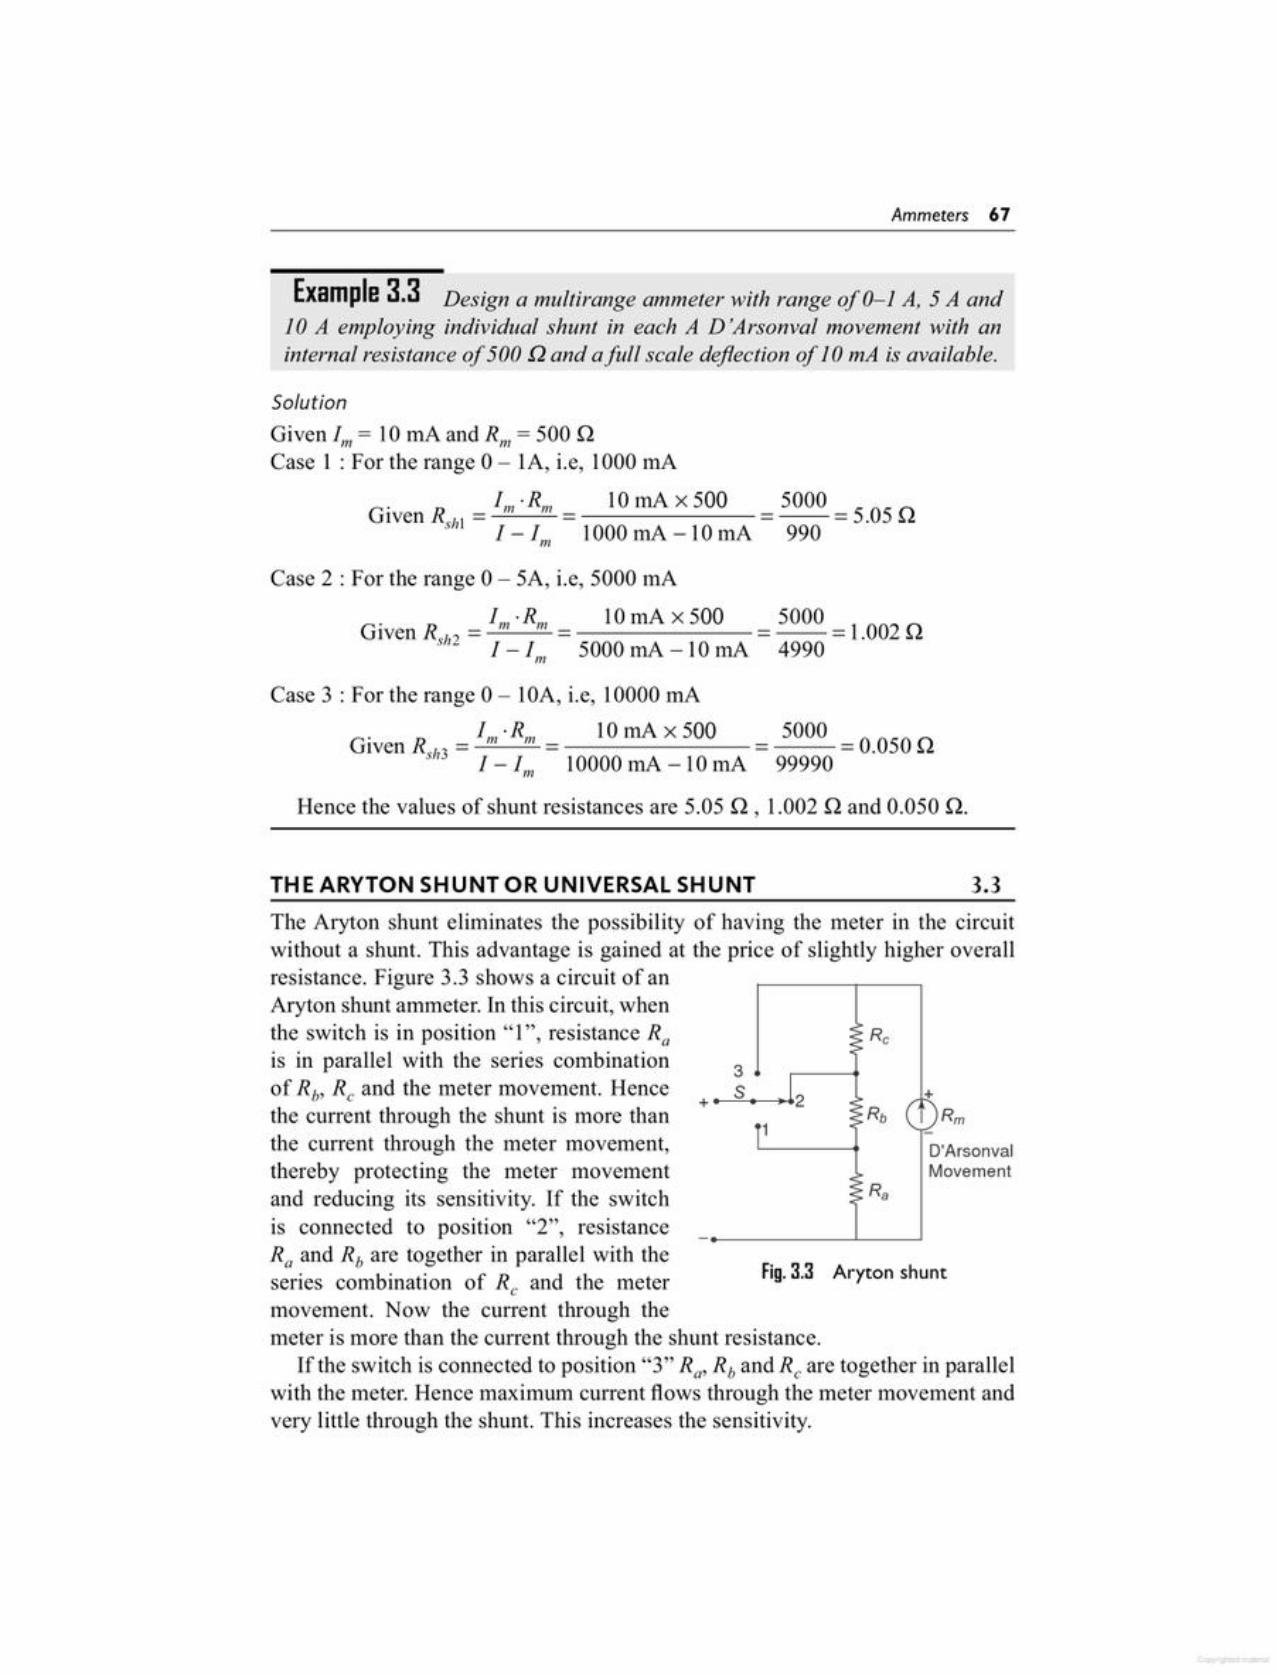
Fig.3.3 Aryton shunt
O'ArsonvalMovement
The Aryton shunt eliminates the possibility of having the meter in the circuitwithout a shunt. This advantage is gained at the price of slightly higher overallresistance. Figure 3.3 shows a circuit of anAryton shunt ammeter. In this circuit, whenthe switch is in position "1", resistance Rais in parallel with the series combination 3of Rb, R; and the meter movement. Hence + _____"s,,--_.12the current through the shunt is more thanthe current through the meter movement,thereby protecting the meter movementand reducing its sensitivity. If the switchis connected to position "2", resistanceRa and Rb are together in parallel with theseries combination of Rc and the metermovement. Now the current through themeter is more than the current through the shunt resistance.
If the switch is connected to position "3" Ra, Rb and Rc are together in parallelwith the meter. Hence maximum current flows through the meter movement andvery little through the shunt. This increases the sensitivity.
3.3THE ARYTON SHUNT OR UNIVERSAL SHUNT
Hence the values of shunt resistances are 5.05 n, 1.002 nand 0.050 n.
Case 3 : For the range 0 - lOA, i.e, 10000 rnA
Given R. = 1m ·Rm 10 rnA X 500 = 5000 =0.050 Qsll3 1- 1 10000 rnA -10 rnA 99990m
Case 2 : For the range 0 - SA, i.e, 5000 InA
I ·R 10 rnA x 500 5000Given R. = III m _ = = 1.002 n»a 1-1 5000 rnA -10 rnA 4990
III
SolutionGiven 1m = 10 rnA and Rill = 500 nCase 1 : For the range 0 - lA, i.e, 1000 rnA
Given R, = 1m ·R", 10 InA X 500 = 5000 = 5.05 nsill 1- I 1000 rnA - lOrnA 990m
Example 3.3 Design a multirange ammeter with range of 0-1 A, 5A and10 A employing individual shunt in each A D 'Arson val movement with aninternal resistance of 500 !2and afull scale deflection of I 0 mA is available.
Ammeters 67
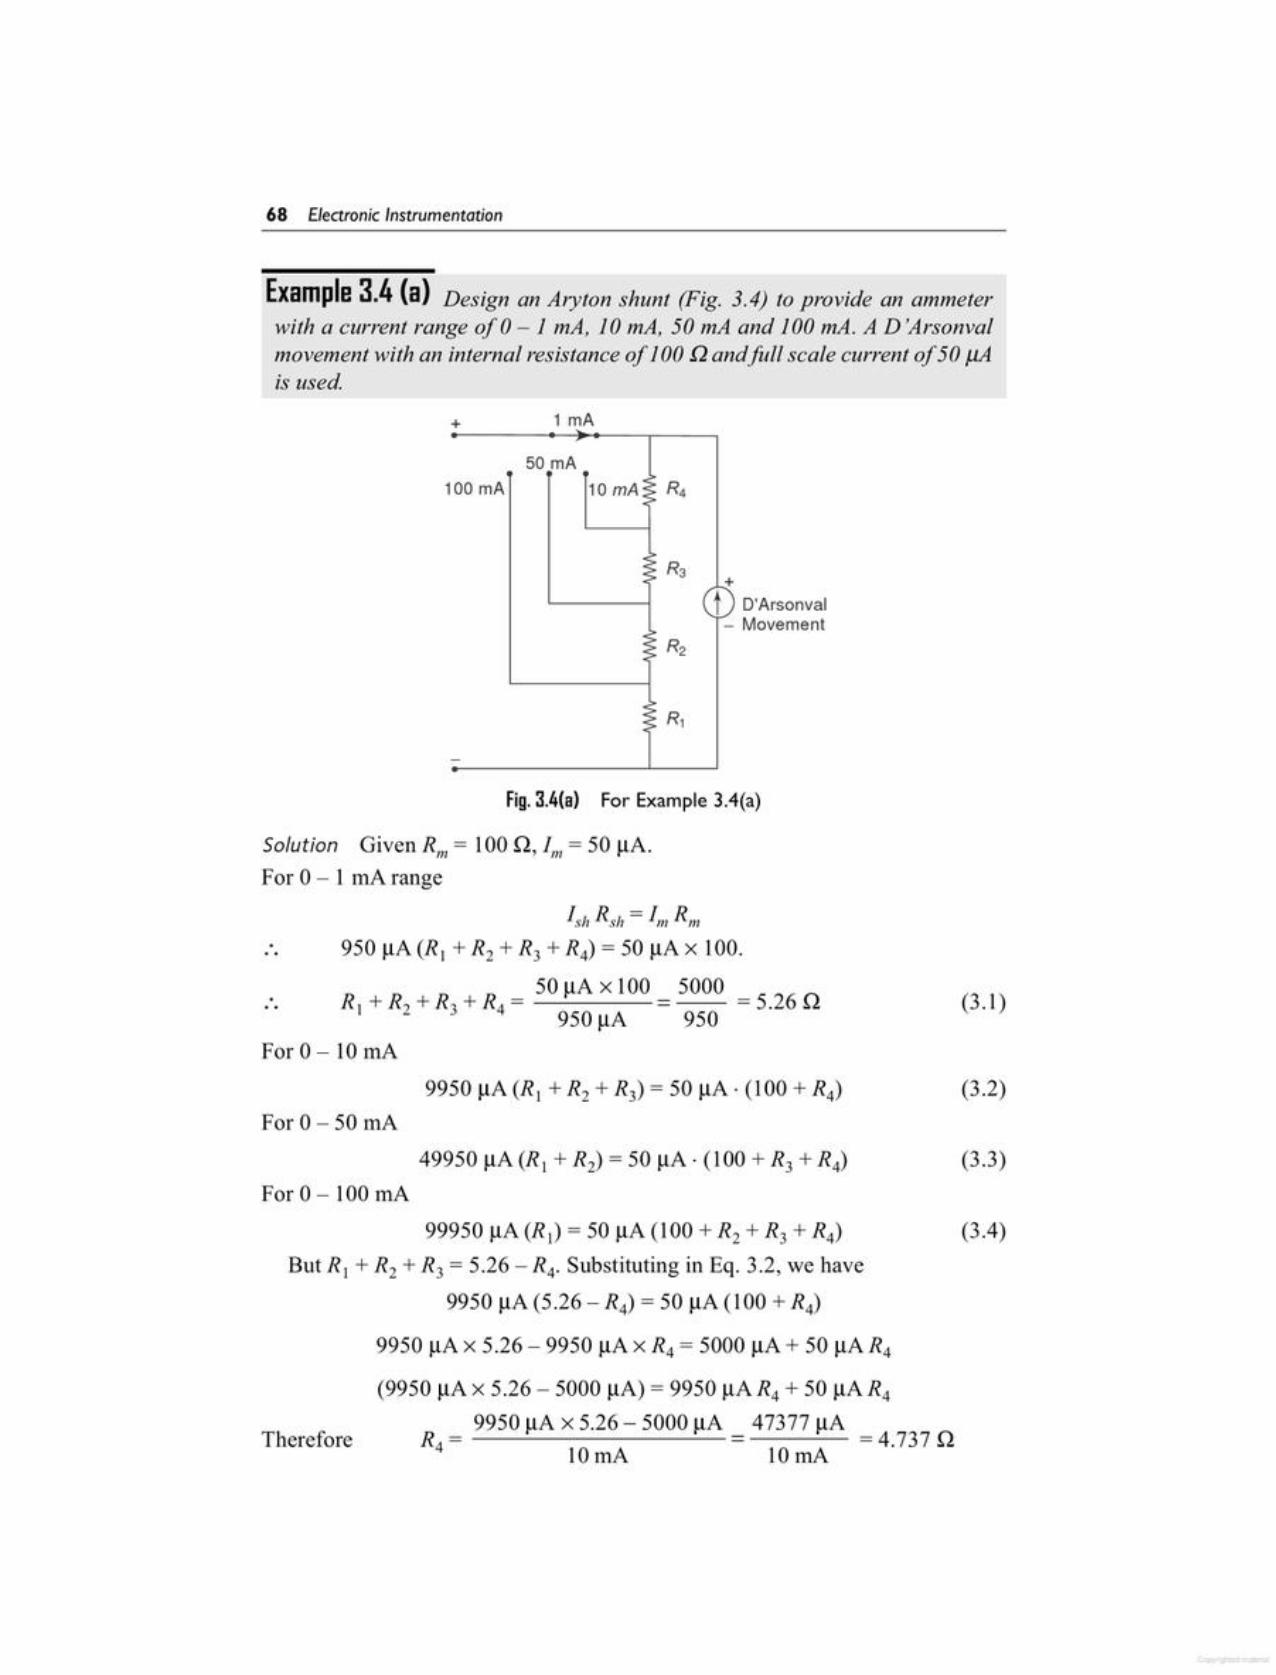
(3.4)99950 flA (R,) = 50 flA (100 +R2 + R3 + R4)
But R, + R2 + R3 = 5.26 - R4. Substituting in Eq. 3.2, we have
9950 fl·A(5.26 - R4) = 50 fl·A(100 + R4)
9950 flA X 5.26 - 9950 flA x R4 = 5000 flA + 50 flA R4
(9950 flA x 5.26 - 5000 flA) = 9950 flA R4 + 50 flA R49950 flA x 5.26 - 5000 flA 47377 fl·A
R4= lOrnA = lOrnA =4.7370Therefore
For 0 - 100 m.A(3.3)
For 0 - 50 InA(3.2)
ForO-lOrnA
(3.1 )
fsh Rsh = t; s;950 flA (R, + R2 + R3 + R4) = 50 flA X 100.
R + R + R + R = 50 flA X 100 = 5000 = 5.26 0, 2 3 4 950 flA 950
Solution Given R", = 1000, 1m = 50 u.A.For 0 - 1 rnA range
Fig.3.4(a) For Example 3.4(a)
D'ArsonvalMovement
...,50 rnA
00 rnA 10 mA: ~ R4<>
<>:~ R3 +
t<~
-:~ R2
<~
:> R1
-
1
1 rnA+
Example 3.4 (a) Design an Aryton shunt (Fig. 3.4) to provide an ammeterwith a current range of 0 -1 mA, 10 rnA, 50 rnA and 100 rnA.A D''Arsonvalmovement with an internal resistance of 100Qandfull scale current of 50 j.iAis used.
68 Electron;c Instrumentat;on
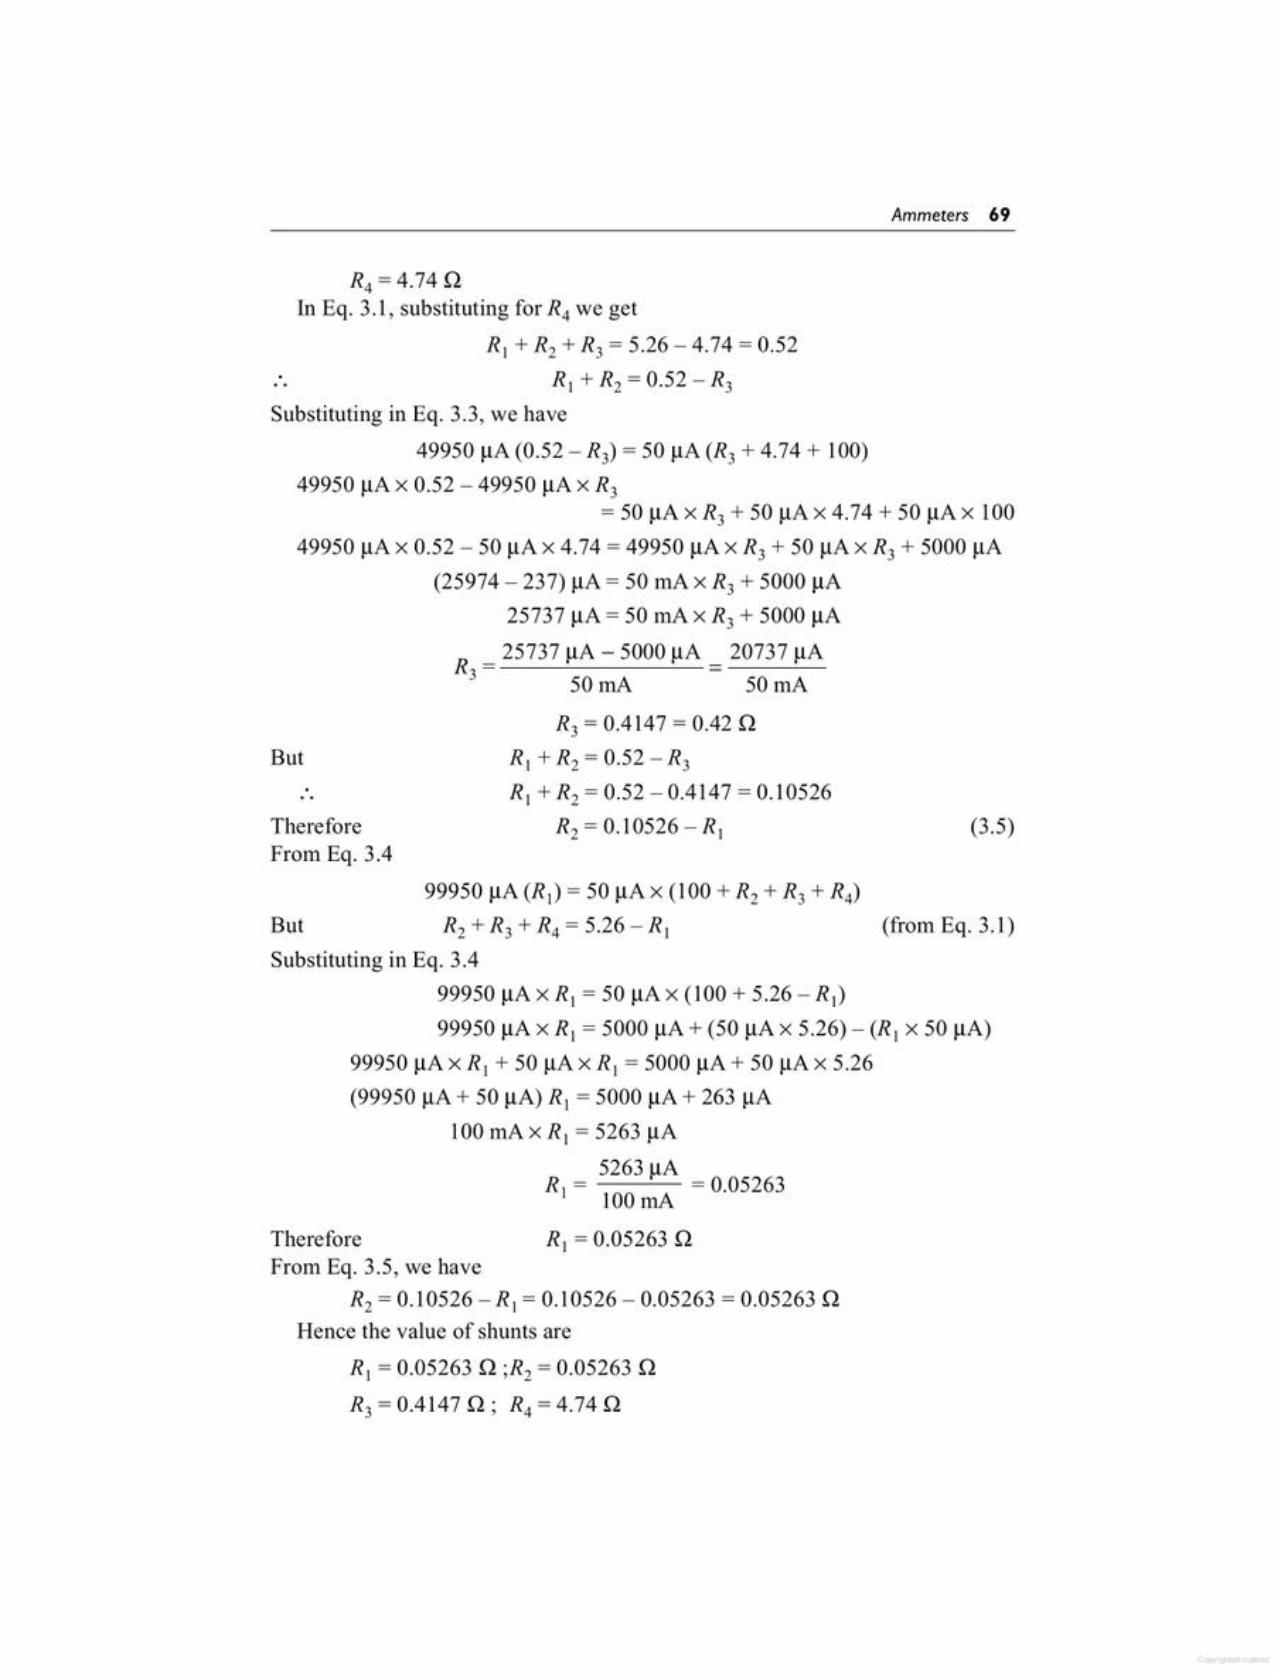
R, = 0.05263 n ;R2 = 0.05263 nR3 = 0.4147 n; R4 = 4.74 n
From Eq. 3.5, we haveR2 = 0.10526 - R, = 0.10526 - 0.05263 = 0.05263 n
Hence the value of shunts are
Therefore
Substituting in Eq. 3.499950 IlA x R, = 50 IlA x (100 + 5.26 - R,)99950 IlA x R, = 5000 IlA + (50 IlA x 5.26) - (R, x 50 IlA)
99950 IlA x R, + 50 IlA X R, = 5000 IlA + 50 IlA x 5.26(99950 IlA + 50 IlA) R, = 5000 IlA + 263 IlA
100 rnA x R, = 5263 IlA
R = 5263 IlA = 0.05263, 100 InA
R, = 0.05263 n
(from Eq. 3.1)99950 IlA (R,) = 50 IlA x (100 + R2 + R3 + R4)R2 + R3 + R4 = 5.26 - R,But
(3.5)ThereforeFrom Eq. 3.4
Substituting in Eq. 3.3, we have
49950 IlA (0.52 - R3) = 50 IlA (R3 + 4.74 + 100)49950 IlA x 0.52 - 49950 IlA x R3
= 50 IlA X R3 + 50 IlA x 4.74 + 50 IlA x 10049950 IlA x 0.52 - 50 IlA x 4.74 = 49950 IlA x R3 + 50 IlA X R3 + 5000 IlA
(25974 - 237) IlA = 50 InA X R3 + 5000 IlA25737 IlA = 50 rnA x R3 + 5000 IlA
R = 25737 IlA - 5000 IlA _ 20737 IlA3 50mA - 50mA
R3 = 0.4147 = 0.42 nR, + R2 = 0.52 -R3R, + R2 = 0.52 - 0.4147 = 0.10526
But
R4 = 4.74 nInEq. 3.1, substituting for R4 we get
R, + R2 +R3 = 5.26 - 4.74 = 0.52R, + R2 = 0.52 - R3
Ammeters 69
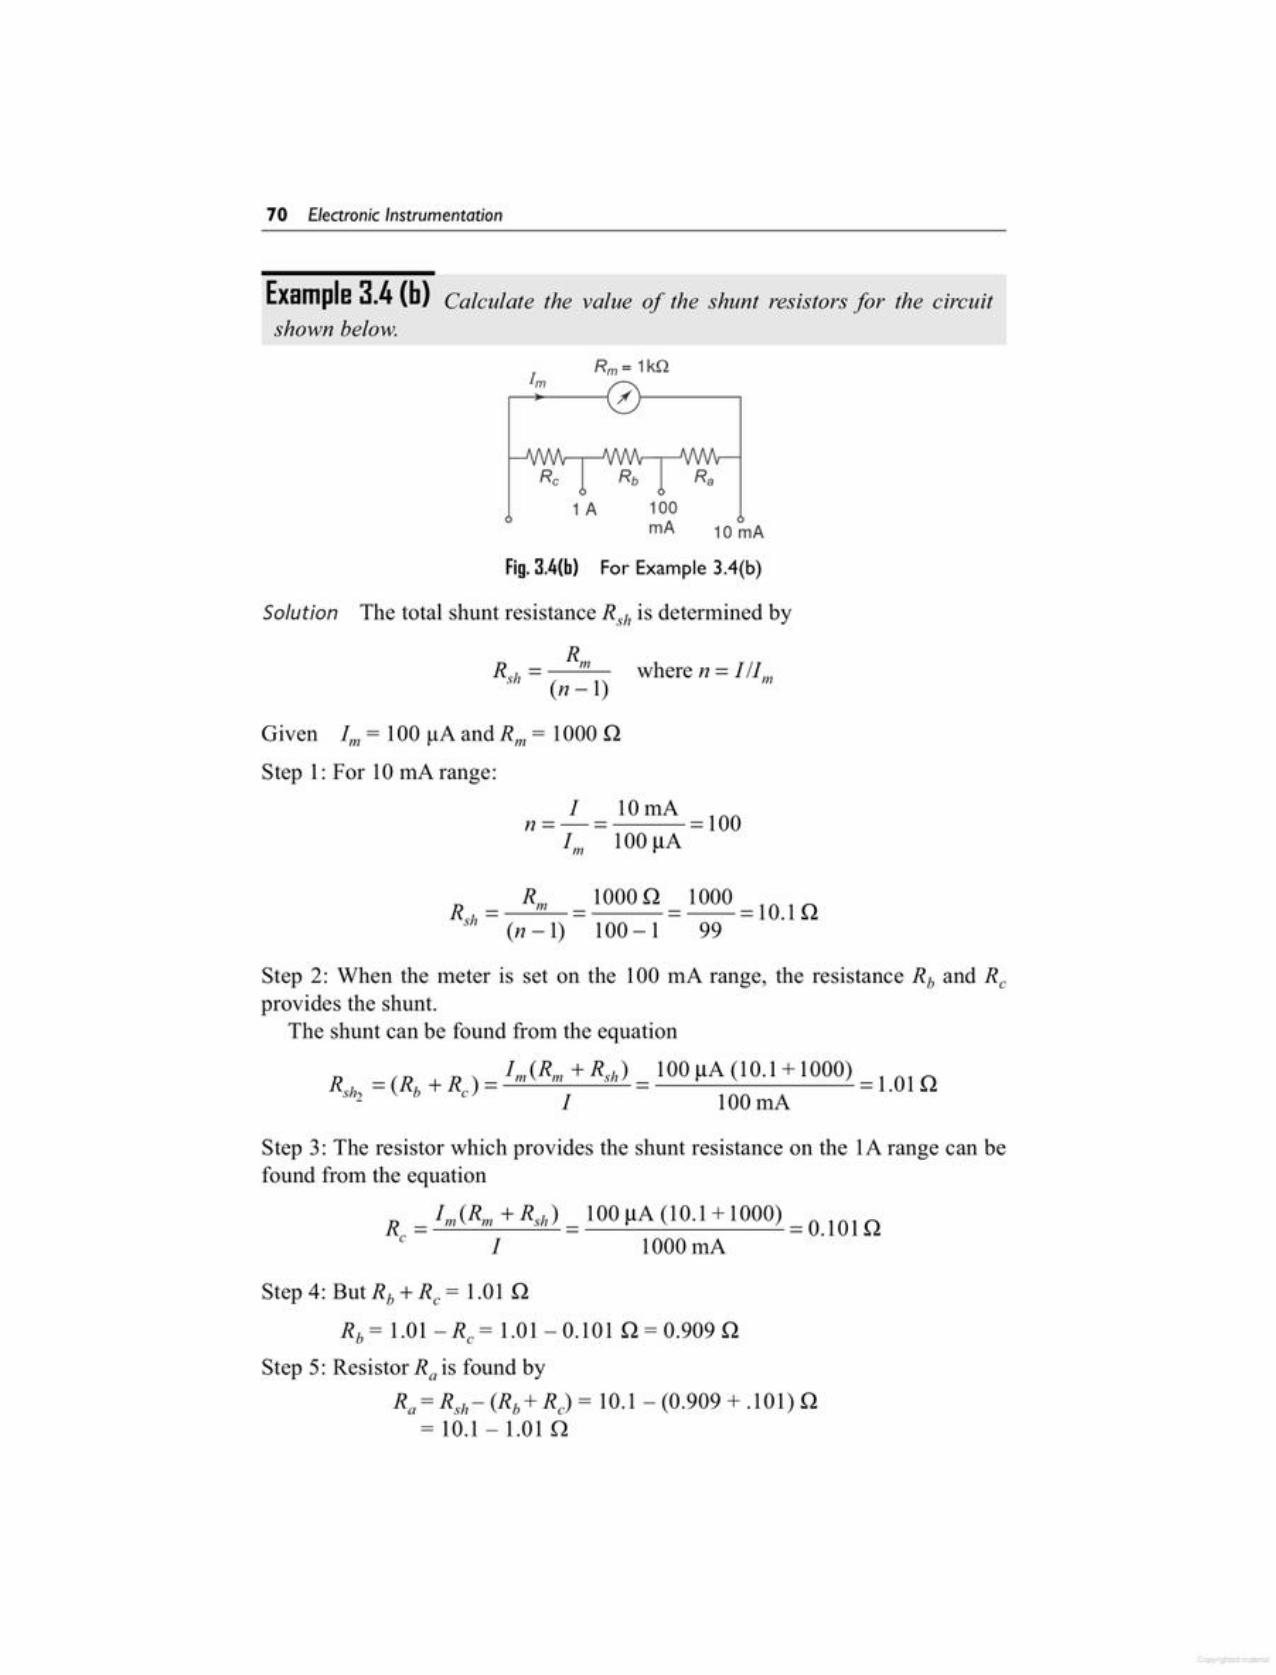
Step 4: But Rb +R; = 1.01 nRb = 1.01-Rc= 1.01- 0.101 n = 0.909 n
Step 5: Resistor Ra is found bys,= Rsh- (Rb + Rc) = 10.1- (0.909 + .101)n
= 10.1 - 1.01n
Step 3: The resistor which provides the shunt resistance on the lA range can befound from the equation
R; = IIJ1(Rm + Rsh) = 100 JlA (10.1 + 1000) =0.101 n1 1000 lnA
100 IlA (10.1+ 1000) = 1.01n100 rnA
Step 2: When the meter is set on the 100 rnA range, the resistance Rb and R;provides the shunt.
The shunt can be found from the equation
RSh= Rm = 1000n = 1000 = 10.1n(n -1) 100 - 1 99
n =_!_ = lOrnA =100fIJI 100 JlA
Given 1m= 100 f.!Aand Rm = 1000nStep 1: For 10 rnA range:
Rm IRsil = where n = 1 I"l
(n -1)
Solution The total shunt resistance Rsh is determined by
Fig.3.4(b) For Example 3.4(b)
Rc Rb e,1 A 100
mA 10 mA
Rm= 1kQ
.--------{;(}------,
Example 3.4 (b) Calculate the value of the shunt resistors for the circuitshown below.
70 Electron;c Instrumentat;on

Note that the range of the basic meter movement cannot be lowered. (For example, if a 100 !lAmovement with 100 scale division is used to measure 1 !lA,the meter will deflect by only one division. Hence ranges lower than the basicrange are not practically possible.)
Fig. 3.5 Extending of ammeters
TestLeadsMeter Set
to: ExternalLowest :
Current :~ShuntRange
The range of an ammeter can be extended to measure high current values byusing external shunts connected to the basic meter movement (usually the lowestcurrent range), as given in Fig. 3.5.
3.5EXTENDING OF AMMETER RANGES
The type of material that should be used to join the shunts should have two mainproperties.
1.Minimum Thermo Dielectric Voltage DropSoldering of joint should not cause a voltage drop.
2. SolderabilityResistance of different sizes and values must be soldered with minimum changein value.
The following precautions should be observed when using an ammeter formeasurement.
1. Never connect an ammeter across a source of emf. Because of its lowresistance it would draw a high current and destroy the movement.Always connect an ammeter in series with a load capable of limiting thecurrent.
2. Observe the correct polarity. Reverse polarity causes the meter to deflectagainst the mechanical stopper, which may damage the pointer.
3. When using a multirange meter, first use the highest current range, thendecrease the current range until substantial deflection is obtained. Toincrease the accuracy use the range that will give a reading as near fullscale as possible.
3.4REQUIREMENTS OF A SHUNT
= 9.090Hence Ra= 9.09 0 .R, = 0.9090 and R; = 0.101 0
Ammeters 71
Separate Heater Type (Fig. 3.6 (c» In this arrangement, the thermocouple is heldnear the heater, but insulated from it by a glass bead. This makes the instrumentsluggish and also less sensitive because of temperature drop in the glass bead. Theseparate type is useful for celia in applications, like RF current measurements. Toavoid loss of heat by radiation, the thermocouple arrangement is placed in avacuum in order to increase its sensitivity.
Bridge Type (Fig. 3.6 (d» This has the high sensitivity of the mutual type and yetavoids the shunting effect of the microarmneter.
The sensitivity of a thermocouple is increased by placing it in a vacuum sinceloss of heat by conduction is avoided, and the absence of oxygen permits operationat a much higher temperature. A vacuum thermocouple can be designed to give afull scale deflection of approximately 1 InA. A similar bridge arrangement in airwould require about 100 rnA for full scale deflection.
3.6.2 Different Typesof ThermocouplesIn a thermocouple instrument, the current to be measured is used to heat thejunction of two metals. These two metals form a thermocouple and they have theproperty that when the junction is heated it produces a voltage proportional to theheating effect. This output voltage drives a sensitive de microammeter, giving areading proportional to the magnitude of the ac input.
The alternating current heats the junction; the heating effect is the same forboth half cycles of the ac, because the direction of potential drop (or polarity) isalways be the same. The various types of thermocouples are as follows.
Mutual Type (Fig. 3.6 (a» In this type, the alternating current passes through thethermocouple itself and not through a heater wire. It has the disadvantages thatthe meter shunts the thermocouple.
Contact Type (Fig. 3.6 (b» This is less sensitive than the mutual type. In thecontact type there are separate thermocouple leads which conduct away the heatfrom the heater wire.
3.6.1 Thermocouple InstrumentsThermocouples consists of a junction of two dissimilar wires, so chosen that avoltage is generated by heating the junction. The output of a thermocouple isdelivered to a sensitive de microarmneter.
(Calibration is made with dc or with a low frequency, such as 50 cycles, andapplies for all frequencies for which the skin effect in the heater is not appreciable.Thermocouple instruments are the standard means for measuring current at radiofrequencies. )
The generation of de voltage by heating the junction is called thermoelectricaction and the device is called a thermocouple.
3.6RF AMMETER (THERMOCOUPLE)
72 Electron;c Instrumentat;on

Following are the limitations of thermocouples1. Heaters can stand only small overload.2. A rise in temperature (higher operating temperatures) causes a change in
the resistance of the heater.3. Presence of harmonics changes meter reading, because the heating effect
is proportional to the square of current.This can be understood by the following example.
3.7LIMITATIONS OF THERMOCOUPLES
Material commonly used to form a thermocouple are constantan againstcopper, manganin or a platinum alloy. Such a junction gives a thermal emf ofapproximately 45 ).1V/oC.
The heating elelnent of open air heaters is typically a non-corroding platinumalloy. Carbon filament heaters are used in vacuum type.
Thermocouple heaters operate so close to the burnout point under normalconditions, that they can withstand only small overloads without damage,commonly up to 50%. This is one of the limitations of the thermocoupleinstrument.
(Commonly used metal combinations are copper-constantan, iron-constantan,chromeI-constantan, chromel-alumel, andplatinum-rhodium. Tables are availablethat show the voltages produced by each of the various metal combination atspecific temperatures.)
Fig.3.S (a) Mutual type (b) Contact type (c) Separate heater type(d) Bridge type thermocouple
(d)(c)
.------/ / )------,
Ammeter
Ammeter // Ammeter
aThermocouple
Element
Thermocouple(a)
(b)
Ammeters 73
2. Non-uniform Distribution of Current This occurs at frequencies where the heaterlength is of the order ofa fraction ofa wavelength (magnitude of one wavelength).
The frequency effect arises because of various factors such as:1. Skin effect2. Non uniform distribution of current along the heater wires3. Spurious capacitive currents
1. Skin Effect The skin effect causes a higher reading at higher frequencies,especially if the heater wire is small. A low current instrument with a circularcross-section, used in vacuum, may have a skin effect error of less than 1% atfrequencies up to 30,000 MHz. Ribbon heaters are often used for large currents,but they have larger skin effects. Solid wire, and better still hollow conductorsare ideal with a view to minimising the skin effect.
Calibration done with dc or low frequency as such as 50 Hz for which theskin effect of the heater is not appreciable. Accuracy can be as high as 1%for frequencies up to 50 MHz. For this reason, thermocouple instruments areclassified as RF instruments.
Above 50 MHz the skin effect forces the current to the outer surface of theconductor, increasing the effective resistance of the heating wire and reducing theinstrument's accuracy. For small currents of up to 3A, the heating wire should besolid and very thin. Above 3A the heating element should be hollow and tubularin design to reduce the skin effect.
3.8EFFECTOF FREQUENCY ON CALIBRATION
= 1[2+ 1[2= ~26 1[2= ~1.041[225 25
= 1.02 1[= 1[+ 0.021[But 0.02 = 2%. Hence 20% harmonics increase the error by 2%.
where 1[ is the fundamental12is second harmonic13is third harmonic
1[1f20% harmonics are present, then 12= s·
Therefore, the error in the current reading if 20% harmonics is present, iscalculated as follows. Therefore, effective value of input wave
The effective value of input wave is
~ 2 2 2 12=1[ +12 + 13+ 4 + ...
74 Electron;c Instrumentat;on
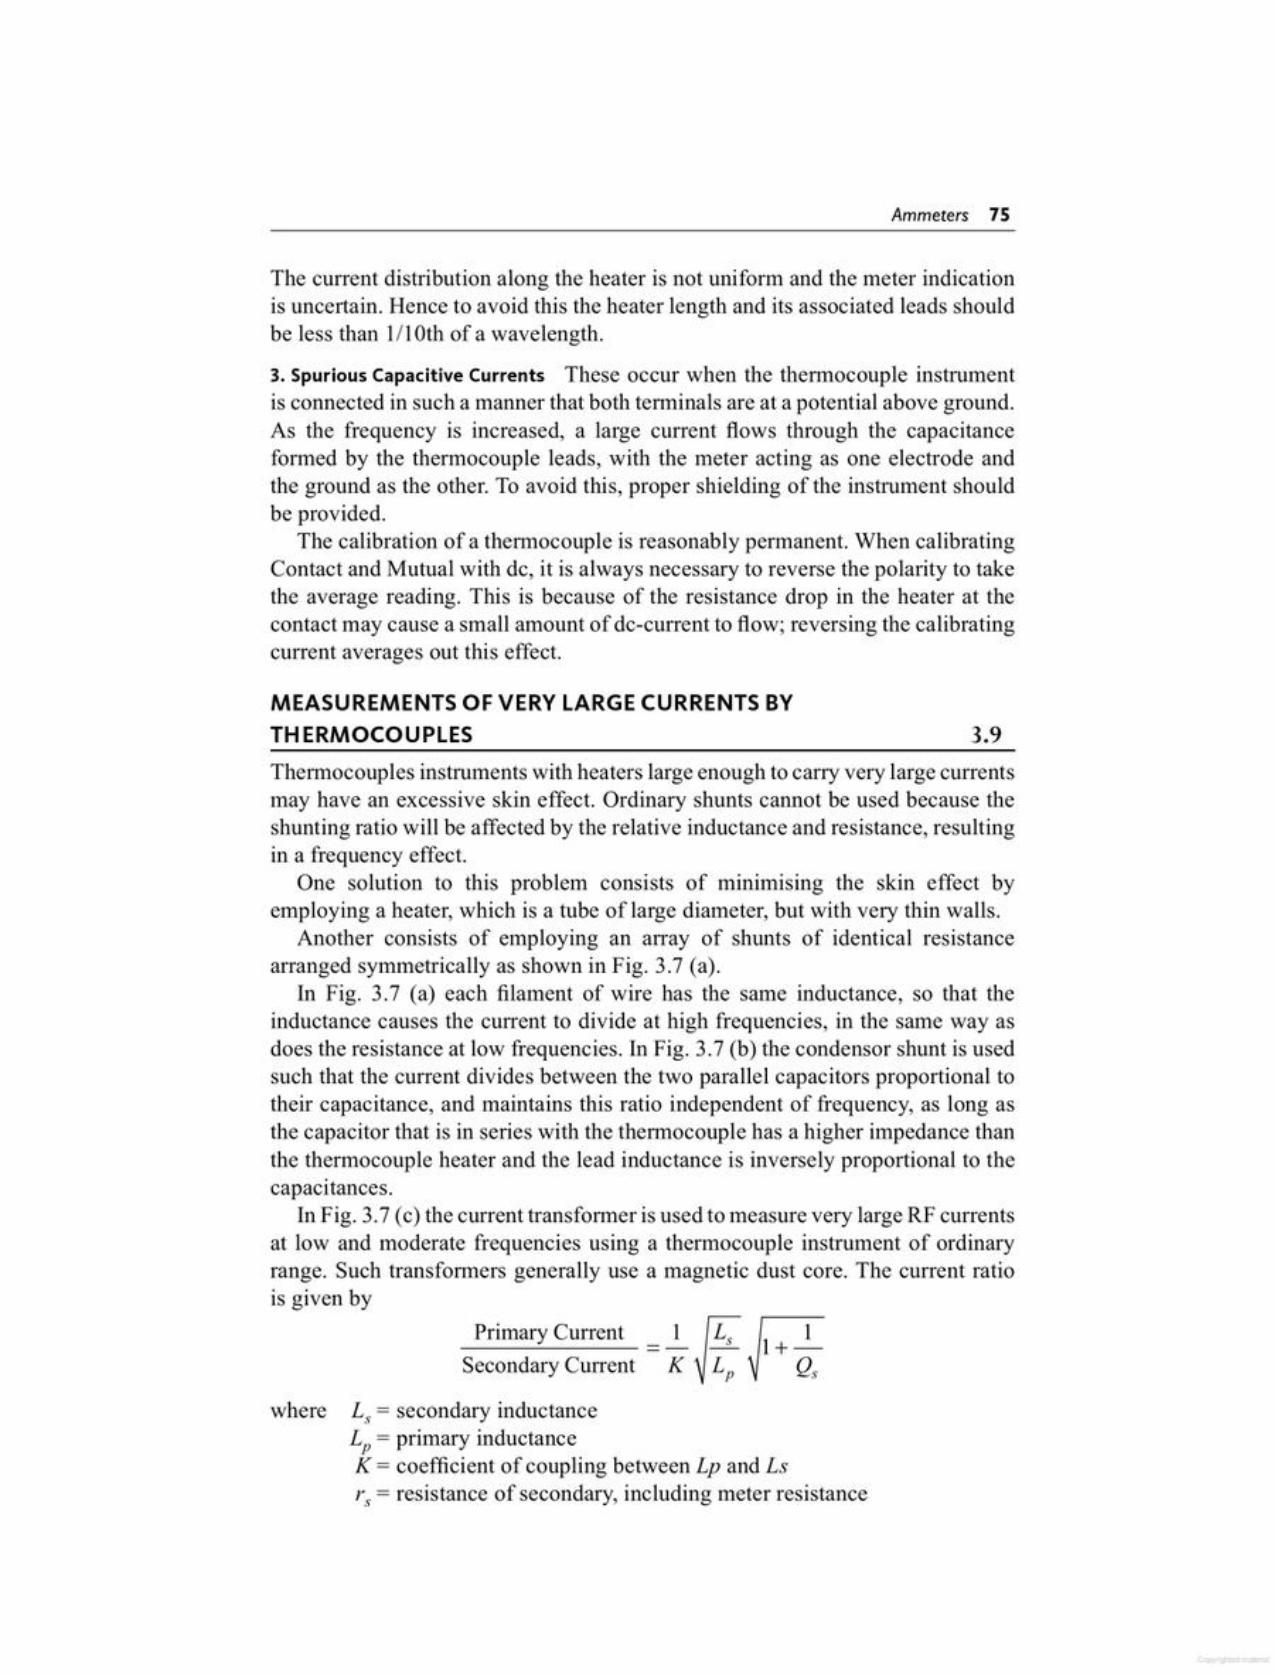
Primary Current _ 2_ K Jl + 1Secondary Current K ~ Lp Qs
where L,= secondary inductanceLp = primary inductanceK = coefficient of coupling between Lp and Lsrs = resistance of secondary, including meter resistance
Thermocouples instruments with heaters large enough to carry very large currentsmay have an excessive skin effect. Ordinary shunts cannot be used because theshunting ratio will be affected by the relative inductance and resistance, resultingin a frequency effect.
One solution to this problem consists of minimising the skin effect byemploying a heater, which is a tube of large diameter, but with very thin walls.
Another consists of employing an array of shunts of identical resistancearranged symmetrically as shown in Fig. 3.7 (a).
In Fig. 3.7 (a) each filament of wire has the same inductance, so that theinductance causes the current to divide at high frequencies, in the same way asdoes the resistance at low frequencies. In Fig. 3.7 (b) the condensor shunt is usedsuch that the current divides between the two parallel capacitors proportional totheir capacitance, and maintains this ratio independent of frequency, as long asthe capacitor that is in series with the thermocouple has a higher impedance thanthe thermocouple heater and the lead inductance is inversely proportional to thecapacitances.
In Fig. 3.7 (c) the current transformer is used to measure very large RF currentsat low and moderate frequencies using a thermocouple instrument of ordinaryrange. Such transformers generally use a magnetic dust core. The current ratiois given by
3.9MEASUREMENTS OF VERY LARGE CURRENTS BYTHERMOCOUPLES
3. Spurious Capacitive Currents These occur when the thermocouple instrumentis connected in such a manner that both terminals are at a potential above ground.As the frequency is increased, a large current flows through the capacitanceformed by the thermocouple leads, with the meter acting as one electrode andthe ground as the other. To avoid this, proper shielding of the instrument shouldbe provided.
The calibration of a thermocouple is reasonably permanent. When calibratingContact and Mutual with de, it is always necessary to reverse the polarity to takethe average reading. This is because of the resistance drop in the heater at thecontact may cause a small amount of de-current to flow; reversing the calibratingcurrent averages out this effect.
The current distribution along the heater is not uniform and the meter indicationis uncertain. Hence to avoid this the heater length and its associated leads shouldbe less than 1/10th of a wavelength.
Ammeters 75
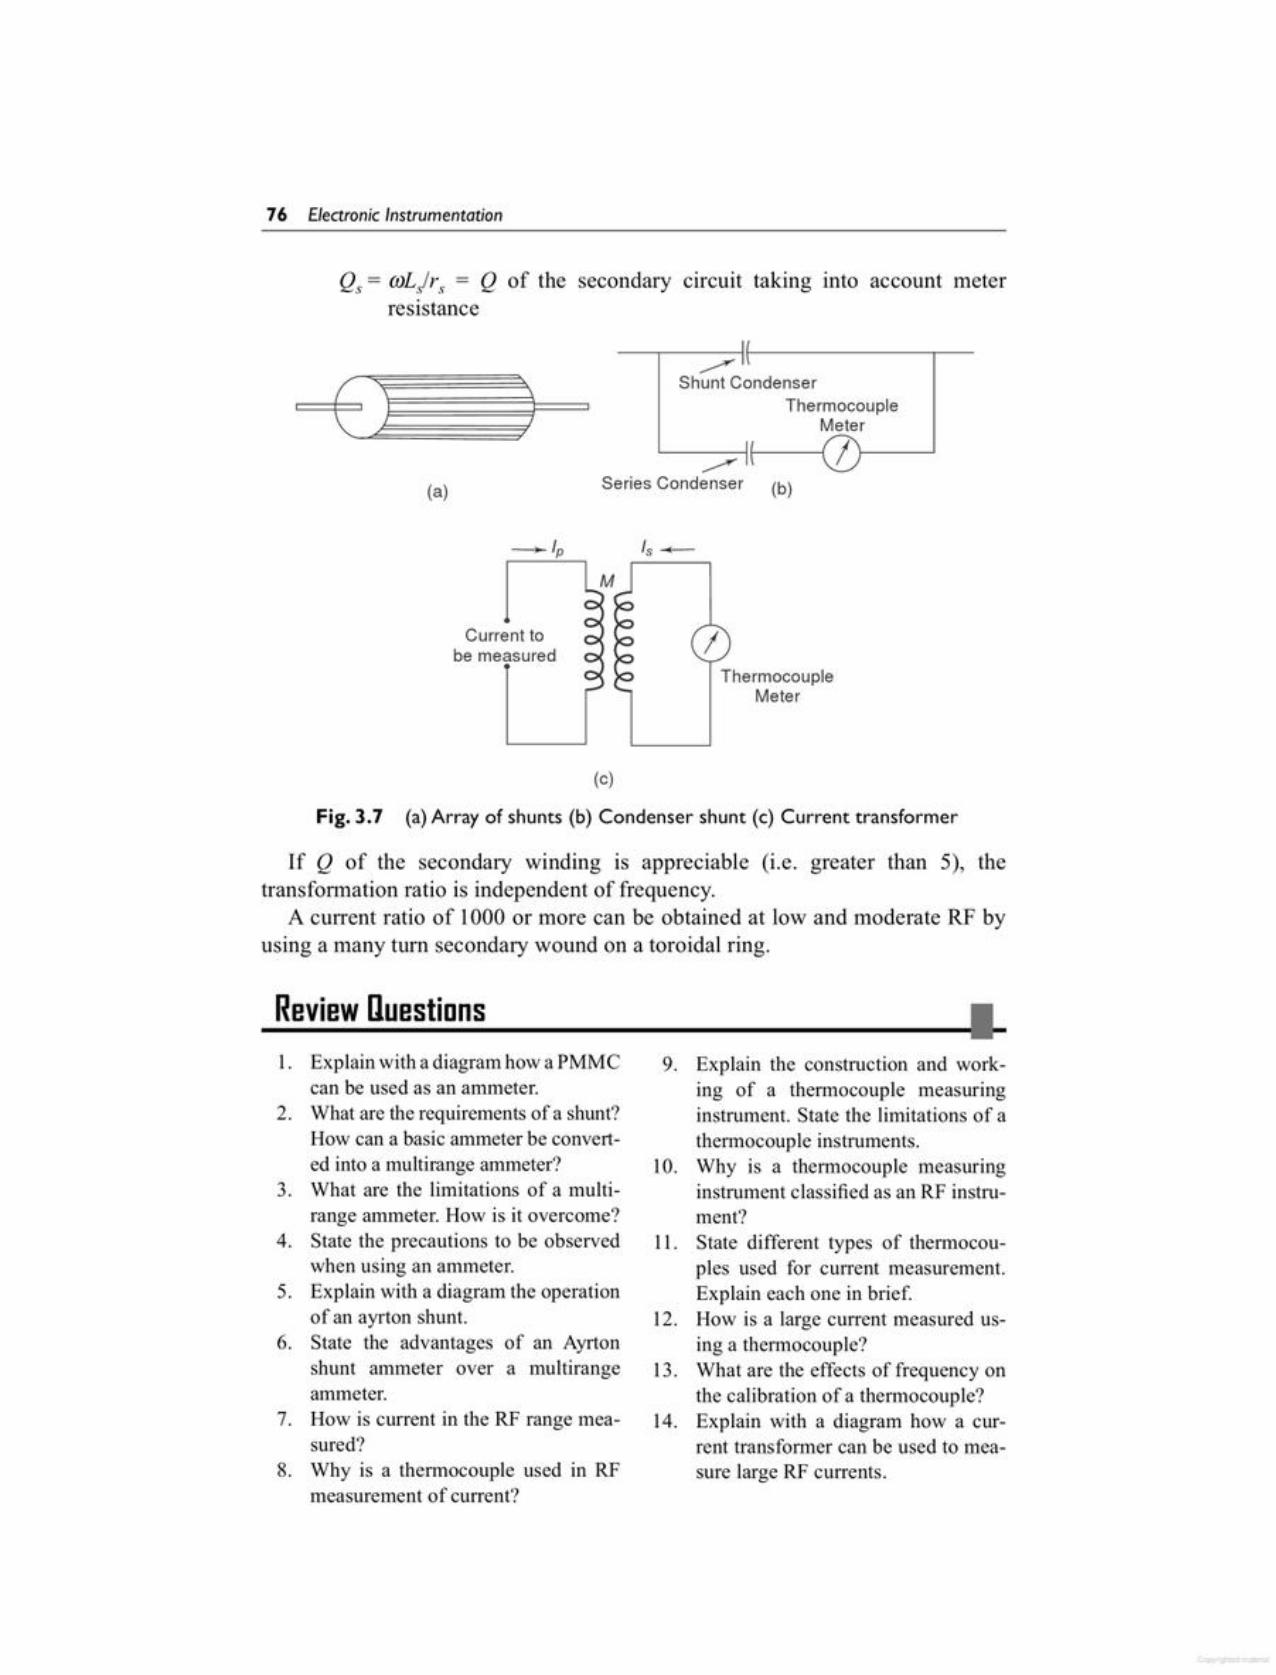
Explain the construction and working of a thermocouple measuringinstrument. State the limitations of athermocouple instruments.Why is a thermocouple measuringinstrument classified as an RF instrument?State different types of thermocouples used for current measurement.Explain each one in brief.How is a large current measured using a thermocouple?What are the effects of frequency onthe calibration of a thermocouple?Explain with a diagram how a current transformer can be used to measure large RF currents.
~~~~~----------------~~Review Ouestionsl. Explain with a diagram how a PMMC 9.
can be used as an ammeter.2. What are the requirements of a shunt?
How can a basic ammeter be convert-ed into a multirange ammeter? 10.
3. What are the limitations of a multi-range ammeter. How is it overcome?
4. State the precautions to be observed 1l.when using an ammeter.
5. Explain with a diagram the operationof an ayrton shunt. 12.
6. State the advantages of an Ayrtonshunt ammeter over a muitirange 13.ammeter.
7. How is current in the RF range mea- 14.sured?
8. Why is a thermocouple used in RFmeasurement of current?
If Q of the secondary winding is appreciable (i.e. greater than 5), thetransformation ratio is independent of frequency.
A current ratio of 1000 or more can be obtained at low and moderate RF byusing a many turn secondary wound on a toroidal ring.
Fig.3.7 (a)Array of shunts (b) Condenser shunt (c) Current transformer
ThermocoupleMeter
I
(c)
Current tobe measured
~Series Condenser (b)(a)
~Shunt Condenser
ThermocoupleMeter)
Q,= mL/rs = Q of the secondary circuit taking into account meterresistance
76 Electron;c Instrumentat;on
an internal resistance of 730 Q anda full scale current of 5 InA is available
5. Design an Ayrton shunt to provide anammeter with current ranges of 0-1rnA, 5 rnA, 20 rnA and 50 rnA, using aD' Arsonval movement havinginternal resistance of 50 Q and a fullscale current of 100 !lAo
6. Design an Ayrton shunt to provide anammeter with current ranges of 0-1rnA, lOrnA, 50 rnA and 100 rnA, using aD' Arsonval movement havinginternal resistance of 100 Q and afull scale current of 50 u.A.
7. Design an Ayrton shunt to providean ammeter with current ranges of0-100 rnA, 500 rnA, lA, using aD' Arsonval movement having internal resistance of 50Q and a full scalecurrent of lrnA.
1. Calculate the value of shunt resistance required for using a 50 fl.Ameter movement having an internalresistance of 100 Q for measuringcurrent in the range of 0-250 mAo
2. What value of shunt resistance is required for using 50 !lA meter movement having an internal resistance of250 Q for measuring current in therange of 0-500 mA?
3. Design a multirange ammeter withranges of 0-100 rnA, 0-200 rnA,0-500 rnA, 0-1 A employing individual shunts for each range. AD' Arsonval movement with an internal resistance of 500 Q and a fullscale current of 100 !lA is available.
4. Design a multirange ammeter withranges of 0-1 A, 5 A, 25 A, 125Aemploying individual shunts for eachrange. AD' Arsonval movement with
Practice Problems I------------------------------------
5. Current in the RF range is measured by(a) simple ammeter(b) ammeter using thermocouples.(c) multirange ammeters.(d) aryton shunt.
6. Large current inRF range at lowmoderate frequencies is measured by(a) simple ammeter(b) ammeter using thermocouples.(c) using a current transformer(d) using Aryton shunt.
7. To minimize skin effect at high RFrange(a) inductance is used(b) array of Shunts are used(c) dielectric material is used(d) aryton shunt is used
8. At low and moderate RF using a secondary wound on a torridal ring, acurrent ratio is obtained.(a) 500 (b) 1000(c) 2000 (d) 5000
1. The instrument required to measurecurrent is alan(a) voltmeter (b) ammeter(c) wattmeter (d) ohmmeter
2 AD' Arsonval movement is(a) taut band(b) plmmc(c) electrodynarnorneter(d) moving iron type
3. To select the range, a multirange ammeter uses a(a) double pole double throw switch(b) make before break type switch(c) single pole double throw switch(d) simple switch
4. To select a range, the Aryton shuntuses a(a) double pole double throw switch(b) make before break type switch(c) single pole double throw switch(d) simple switch
Multiple Choice Duestions I---~------------------------
Ammeters 77
4. Larry. D. Jones and A. Foster Chin,Electronic Instruments and Measurements, John Wiley and Sons, NewYork,1987.
5. W.D. Copper and A.D. Helfrick,Electronic Instrumentation and Measurements Techniques, 3rd Edition,Prentice-Hall of India, 1985.
1. Terman and Petit, Electronic Measurements, McGraw-Hill Book Co,New York, 1952.
2. Sol. D. Prensky, Electronic Instrumentation, Prentice-Hall of India,1963.
3. John. H. Fasal, Simplified ElectronicMeasurements, Hayden Book Co.Inc., Mumbai, 1971.
_F_u_rt_he_r_R_e_ad_in_g~ ~~
78 Electron;c Instrumentat;on
To use the basic meter as a de voltmeter, it is necessary to know the amount ofcurrent required to deflect the basic meter to full scale. This current is knownas full scale deflection current (I(sd)' For example, suppose a 50 J..lAcurrent isrequired for full scale deflection.
This full scale value will produce a voltmeter with a sensitivity of20,000 Q per VThe sensitivity is based on the fact that the full scale current of 50 J..lAresults
whenever 20,000 Q of resistance is present in the meter circuit for each voltageapplied.
4.2BASIC METER AS A DC VOLTMETER
The most commonly used dc meter is based on the fundamental principle of themotor. The motor action is produced by the flow of a small amount of currentthrough a moving coil which is positioned in a permanent magnetic field. Thisbasic moving system, often called the D' Arsonval movement, is also referred toas the basic meter.
Different instrument forms may be obtained by starting with the basic metermovement and adding various elements, as follows.
1. The basic meter movement becomes a de instrument, measuring(i) dc current, by adding a shunt resistance, forming a micro ammeter, a
milliammeter or an ammeter,(ii) de voltage, by adding a multiplier resistance, forming a milli
voltmeter, voltmeter or kilovoltmeter,(iii) resistance, by adding a battery and resistive network, forming an
ohmmeter.2. The basic meter movement becomes an ac instrument, measuring
(i) ac voltage or current, by adding a rectifier, forming a rectifier typemeter for power and audio frequencies.
(ii) RF voltage or current, by adding a thermocouple-type meter for RF.(iii) Expanded scale for power line voltage, by adding a thermistor in a
resistive bridge network, forming an expanded scale (100 - 140 V)ac meter for power line monitoring.
4.1INTRODUCTION
Voltmetens andMultimeters
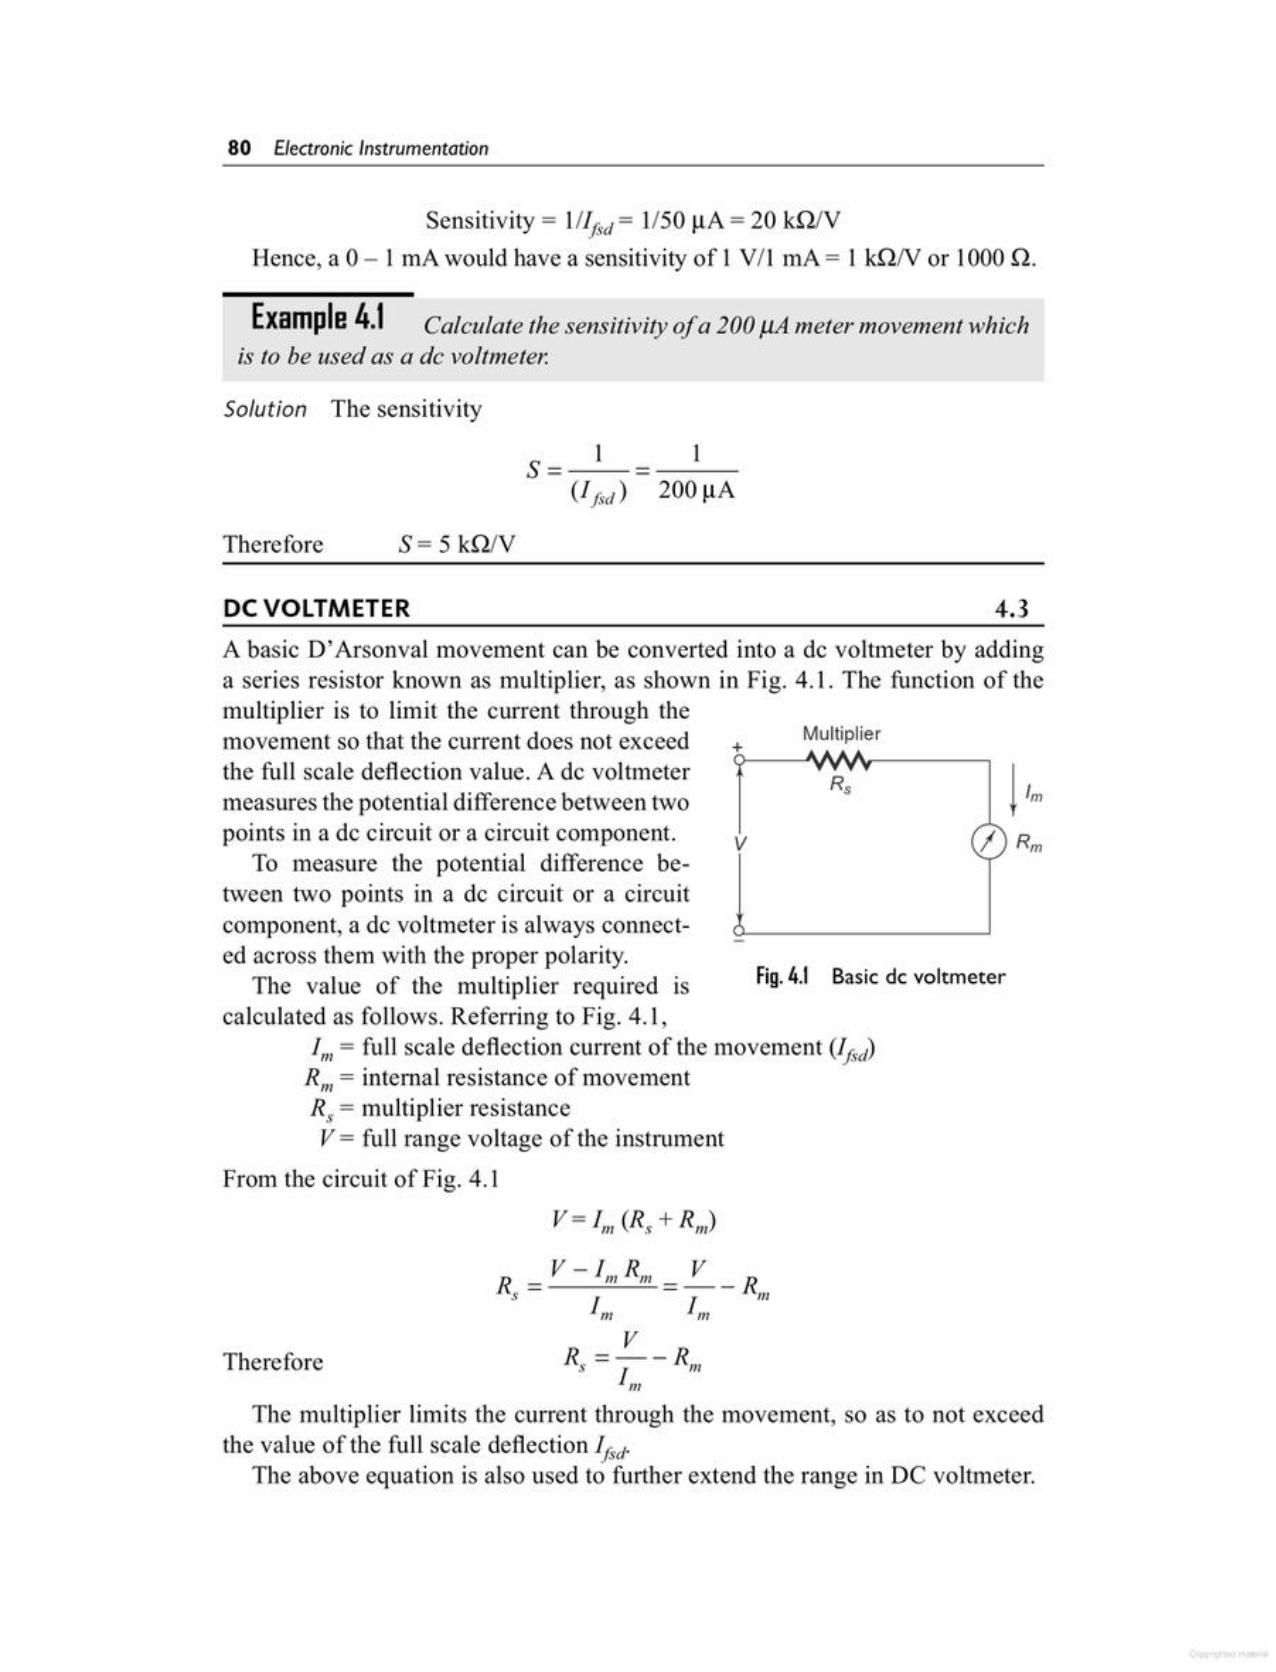
The multiplier limits the current through the movement, so as to not exceedthe value of the full scale deflection !(sd.
The above equation is also used to further extend the range in DC voltmeter.
Therefore
V= 1m (R, + Rm)
R = V - 1mRm = ~ _ Rs 11m
m m
From the circuit of Fig. 4.1
Basic de voltmeterFig. 4.1
v
Multiplier+
A basic D' Arsonval movement can be converted into a de voltmeter by addinga series resistor known as multiplier, as shown in Fig. 4.1. The function of themultiplier is to limit the current through themovement so that the current does not exceedthe full scale deflection value. A de voltmetermeasures the potential difference between twopoints in a de circuit or a circuit component.
To measure the potential difference between two points in a de circuit or a circuitcomponent, a dc voltmeter is always connected across them with the proper polarity.
The value of the multiplier required iscalculated as follows. Referring to Fig. 4.1,
1m= full scale deflection current of the movement (Ifsd)RII1= internal resistance of movementR, = multiplier resistanceV= full range voltage of the instrument
4.3DC VOLTMETER
s= 5 kQ/VTherefore
200~A1s= 1
(1jsd)
Solution The sensitivity
Example 4.1 Calculate the sensitivity of a 200 J1A meter movement whichis to be used as a de voltmeter.
Sensitivity = 1/1j~d= 1/50 ~A = 20 kQNHence, a 0 - 1 rnA would have a sensitivity of 1 VII rnA = 1 kQN or 1000 Q.
80 Electronic Instrumentation

Fig. 4.2 Multirange voltmeter
+
+ -------
As in the case of an ammeter, to obtain a multirange ammeter, a number of shuntsare connected across the movement with a multi-position switch. Similarly,a de voltmeter can be converted into a multi range voltmeter by connecting anumber of resistors (multipliers) alongwith a range switch to provide a greaternumber of workable ranges.
Figure 4.2 shows a multirangevoltmeter using a three position switchand three multipliers R1, R2, and R3 forvoltage values Vl' V2, and V3.
Figure 4.2 can be further modifiedto Fig. 4.3, which is a more practicalarrangement of the multiplier resistorsof a multirange voltmeter.
In this arrangement, the multipliers are connected in a series string, and therange selector selects the appropriate amount of resistance required in series withthe movement.
4.4MULTI RANGE VOLTMETER
SolutionStep 1: The sensitivity of 500 IlA Ineter movement is given by
S = 111m= 1/500 IlA = 2 kQ/V.Step 2: The value of the multiplier resistance can be calculated by
R, = S X range - RmR, = 2 kQ/V x 50 V - 1 kQ
= 100 k.Q - 1 kQ = 99 kQ
Example 4.2 (b) Calculate the value of multiplier resistance on the 50Vrange of a de voltmeter that uses a 500 fJ.Ameter movement with an internalresistance of 1k.Q.
V 10R = - -R = -500s 1m m 50 f..1A= 0.2 X 10⁶ - 500 = 200 k - 500= 199.5 k.Q
Solution Given
Example 4.2 (a) A basic D 'Arsonval movement with a full scale deflectionof 50 f.1A and internal resistance of500.Q is used as a voltmeter. Determine thevalue of the multiplier resistance needed to measure a voltage range of 0 - 10 V
Voltmeters and Multimeters 81
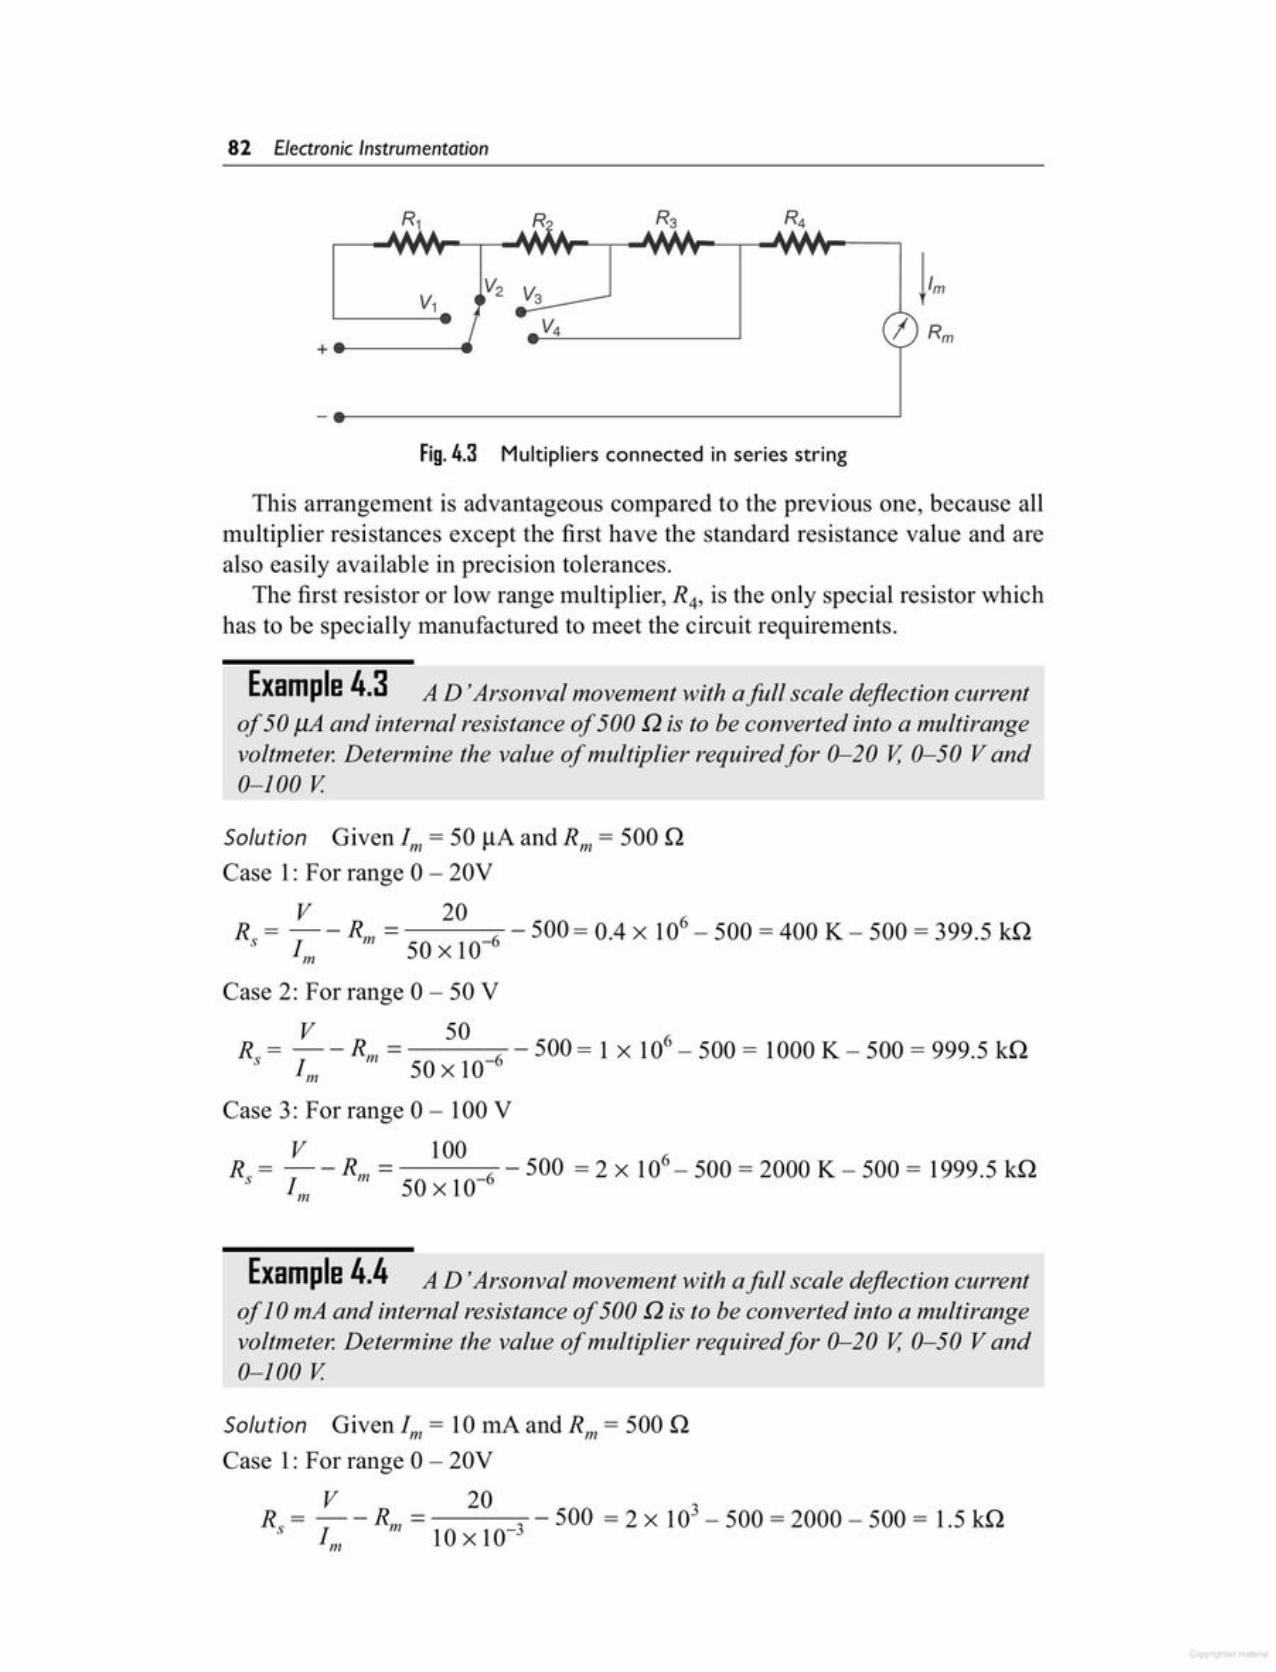
Solution Given 1m = 10 rnA and Rm = 500 QCase 1: For range 0 - 20V
V 20R = - - R = - 500 = 2 X 10³ - 500 = 2000 - 500 = 1.5 kQs 1m m lOx 10-3
Example 4.4 AD 'Arsonval movement with a full scale deflection current0/10 mA and internal resistance of 500 Q is to be converted into a multirangevoltmeter. Determine the value of multiplier required/or 0-20 V, 0-50 Vand0-100 V
Case 3: For range 0 - 100 V
V 100R, = 1-R1I1 - -6 - 500 = 2 X 10⁶- 500 = 2000 K - 500 = 1999.5 kQ
m 50 x 10
Solution Given 1m = 50 ~A and Rm = 500 QCase 1: For range 0 - 20V
R.= !'_-R = 20 -500=0.4x 10⁶-500=400K-500=399.5kQs 1m m 50 X 10-6
Case 2: For range 0 - 50 V
R =!._-R _ 50 -500=lx106-500=1000K-500=999.5kQS I m 50x10-6m
Example 4.3 AD' Arsonval movement with a full scale deflection current0/50 f.lA and internal resistance 0/500 Q is to be converted into a multirangevoltmeter. Determine the value of multiplier required/or 0-20 V, 0-50 Vand0-100 V
This arrangement is advantageous compared to the previous one, because allmultiplier resistances except the first have the standard resistance value and arealso easily available in precision tolerances.
The first resistor or low range multiplier, R4, is the only special resistor whichhas to be specially manufactured to meet the circuit requirements,
Fig. 4.3 Multipliers connected in series string
82 Electronic Instrumentation
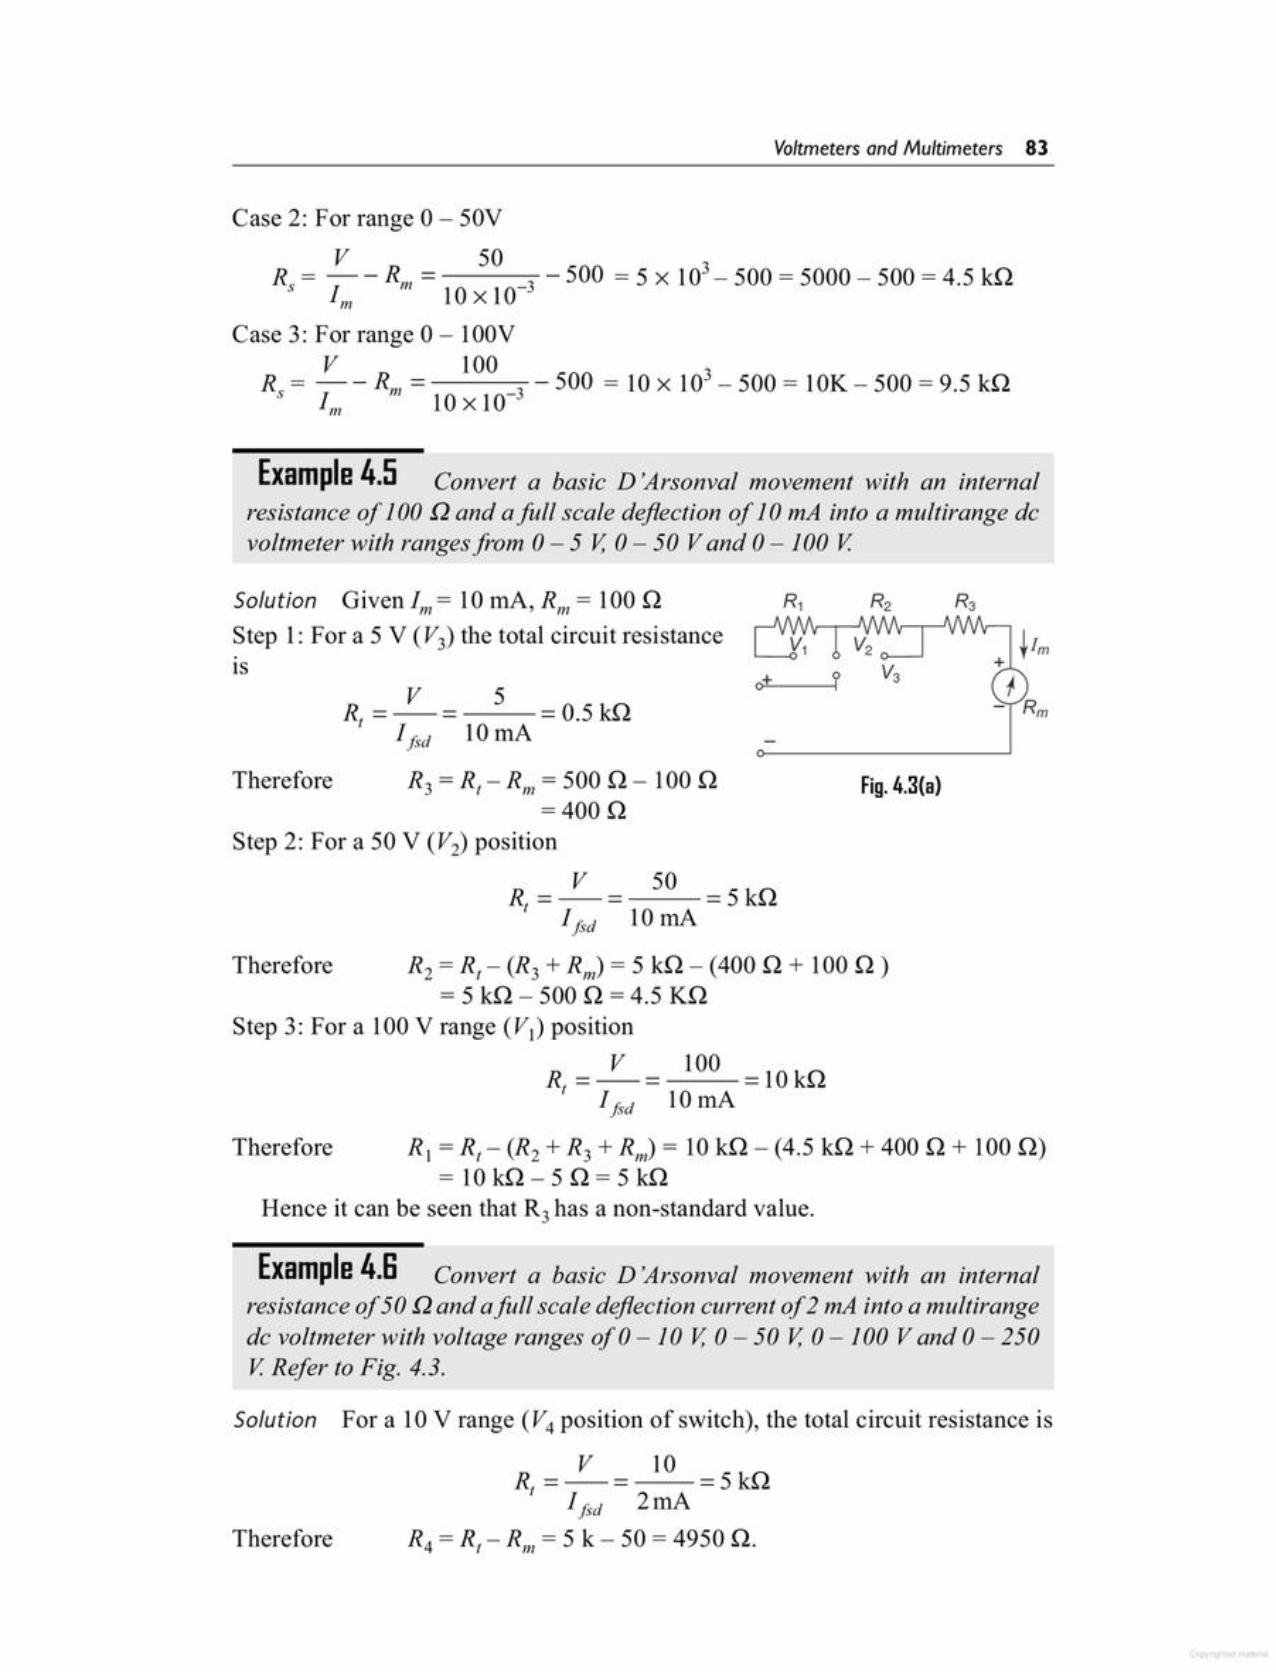
V 10R, = = =5 kQ
Ij~d 2rnATherefore R4 = R, - Rm = 5 k - 50 = 4950 Q.
Solution For a 10 V range (V4 position of switch), the total circuit resistance is
Example 4.6 Convert a basic D 'Arsonval movement with an internalresistance of 50 .Qand a full scale deflection current of 2 mA into a multirangede voltmeter with voltage ranges of a -10 V, a - 50 V, 0 -100 V and 0- 250V Refer to Fig. 4.3.
RI = R, - (R2 + R3 + Rm) = 10 kQ - (4.5 kQ + 400 Q + 100 Q)=10kQ-5Q=5kQ
Hence it can be seen that R3 has a non-standard value.
Therefore
R = V = 50 = 5 kQI
1j~d 10 rnA
R2 = R, - (R3 + Rm) = 5 kQ - (400 Q + 100 Q )= 5 kQ - 500 Q = 4.5 KQ
Step 3: For a 100 V range (VI) position
R = V = 100 = 10 kQ,Ifsd 10 rnA
Therefore
Fig.4.3(a)R3 = R, - Rm = 500 Q - 100 Q=400Q
Step 2: For a 50 V (V2) position
Therefore
V 5R, = = = 0.5 kQ
1fsd 10 rnA
Solution Given 1m= 10 InA, Rm = 100 QStep 1: For a 5 V (V3) the total circuit resistanceIS
Example 4.5 Convert a basic D 'Arsonval movement with an internalresistance of 100 .Q and a full scale deflection of 10 mA into a multirange devoltmeter with ranges from 0 - 5 V, 0 - 50 Vand 0 - 100 V
Case 3: For range 0 - 100VV 100 3R = --R - -500 = lOx 10 -500= IOK-500=9.5 kQ
S 1m 111 lOx 10-3
Case 2: For range 0 - 50V
V 50 3R = - - R - - 500 = 5 x 10 - 500 = 5000 - 500 = 4.5 kQS I m 10 X 10-3m
Voltmeters and Multimeters 83
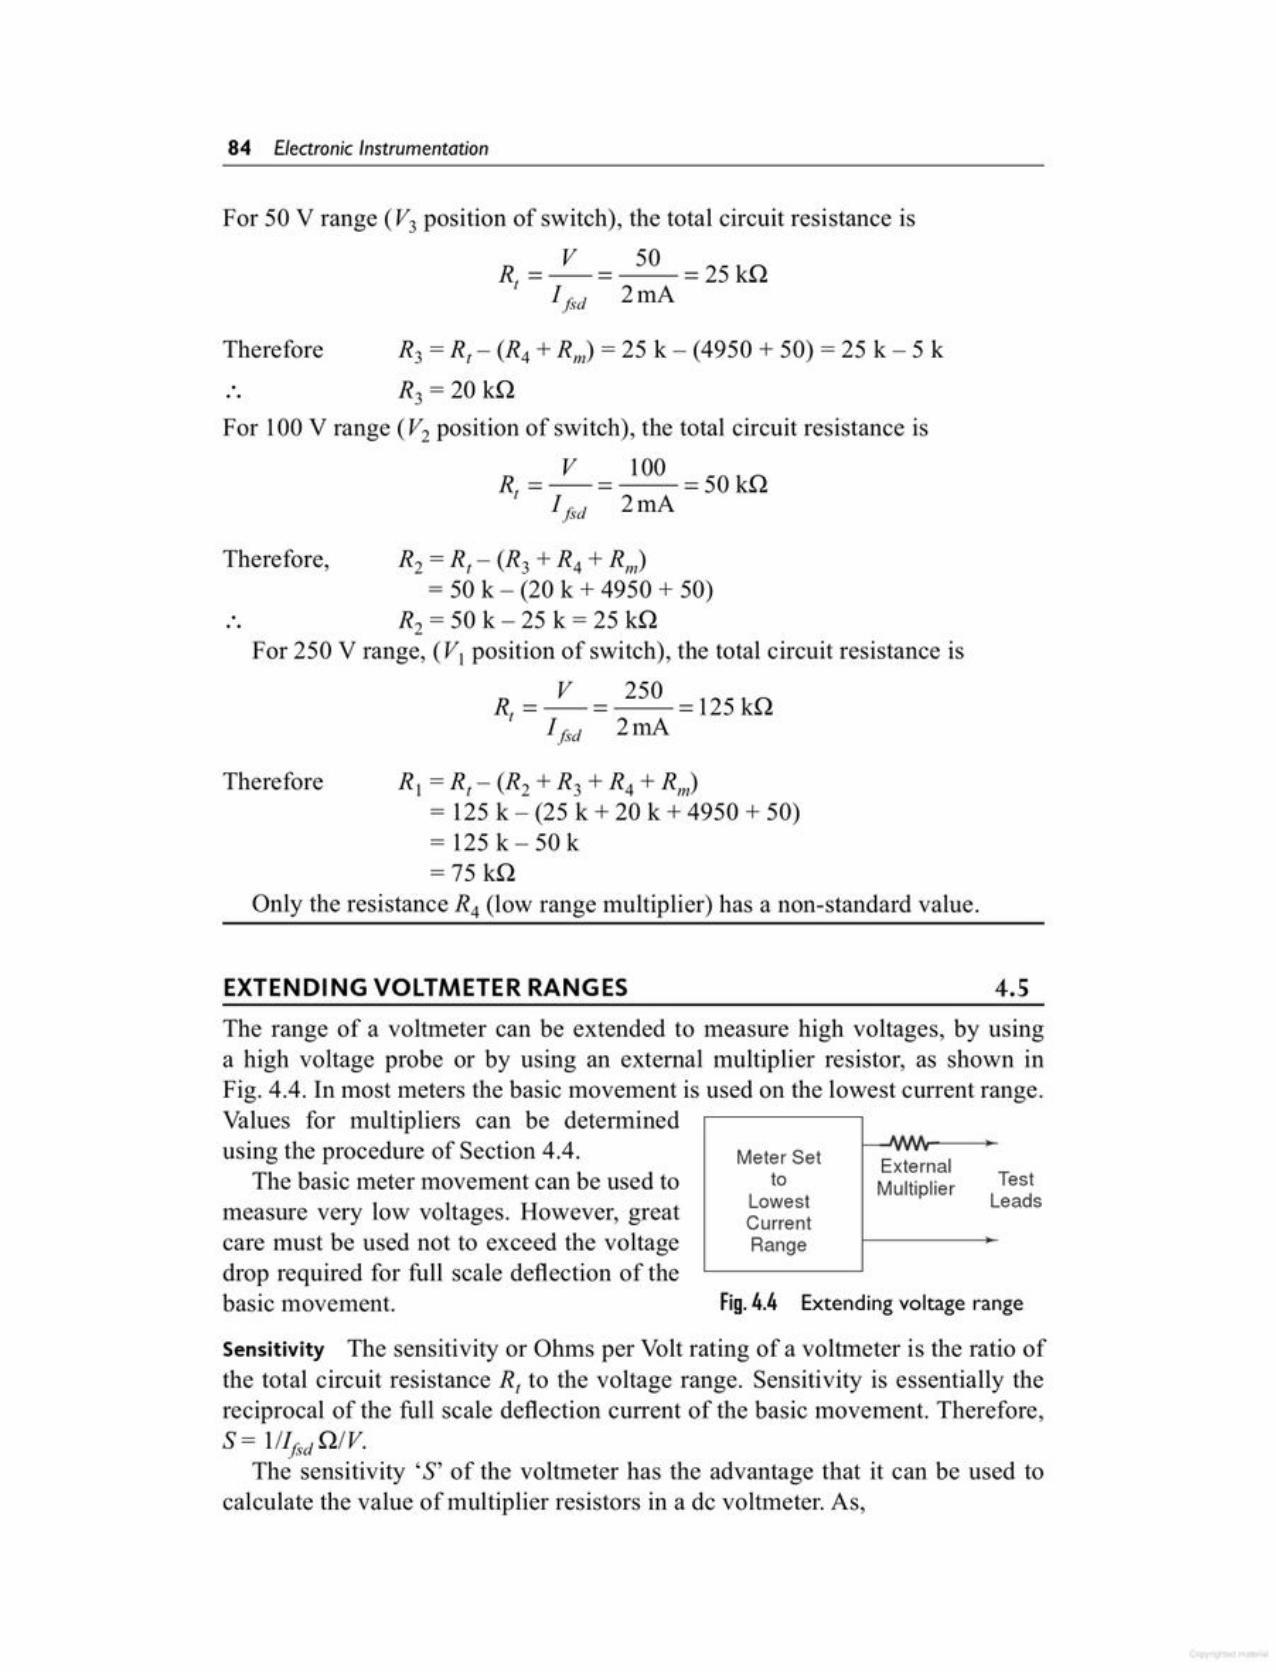
Sensitivity The sensitivity or Ohms per Volt rating of a voltmeter is the ratio ofthe total circuit resistance R, to the voltage range. Sensitivity is essentially thereciprocal of the full scale deflection current of the basic movement. Therefore,S= l/I{sd Q/V.
The sensitivity'S' of the voltmeter has the advantage that it can be used tocalculate the value of multiplier resistors in a de voltmeter. As,
Fig.4.4 Extending voltage range
LowestCurrentRange
TestLeads
YYY.
ExternalMultiplierto
AAAA
Meter Set
The range of a voltmeter can be extended to measure high voltages, by usinga high voltage probe or by using an external multiplier resistor, as shown inFig. 4.4. In most meters the basic movement is used on the lowest current range.Values for multipliers can be determinedusing the procedure of Section 4.4.
The basic meter movement can be used tomeasure very low voltages. However, greatcare must be used not to exceed the voltagedrop required for full scale deflection of thebasic movement.
4.5EXTENDING VOLTMETER RANGES
R I= R,- (R2 + R3 + R4 + R"J= 125 k - (25 k + 20 k + 4950 + 50)= 125 k- 50 k=75 kQ
Only the resistance R4 (low range multiplier) has a non-standard value.
Therefore
R2 = R, - (R3 + R4 + Rm)= 50 k - (20 k + 4950 + 50)
R2 = 50 k - 25 k = 25 kQFor 250 V range, (VI position of switch), the total circuit resistance is
R = V = 250 =125kQt Ifsd 21nA
Therefore,
For 100 V range (V2 position of switch), the total circuit resistance is
V 100R = = =50 kQtIfsd 2mA
R3 = R,- (R4 + Rm) = 25 k - (4950 + 50) = 25 k - 5 k
R3 = 20 ill...Therefore
For 50 V range (V3 position of switch), the total circuit resistance is
R = V = 50 = 25 kQt
Ifsd 2mA
84 Electronic Instrumentation
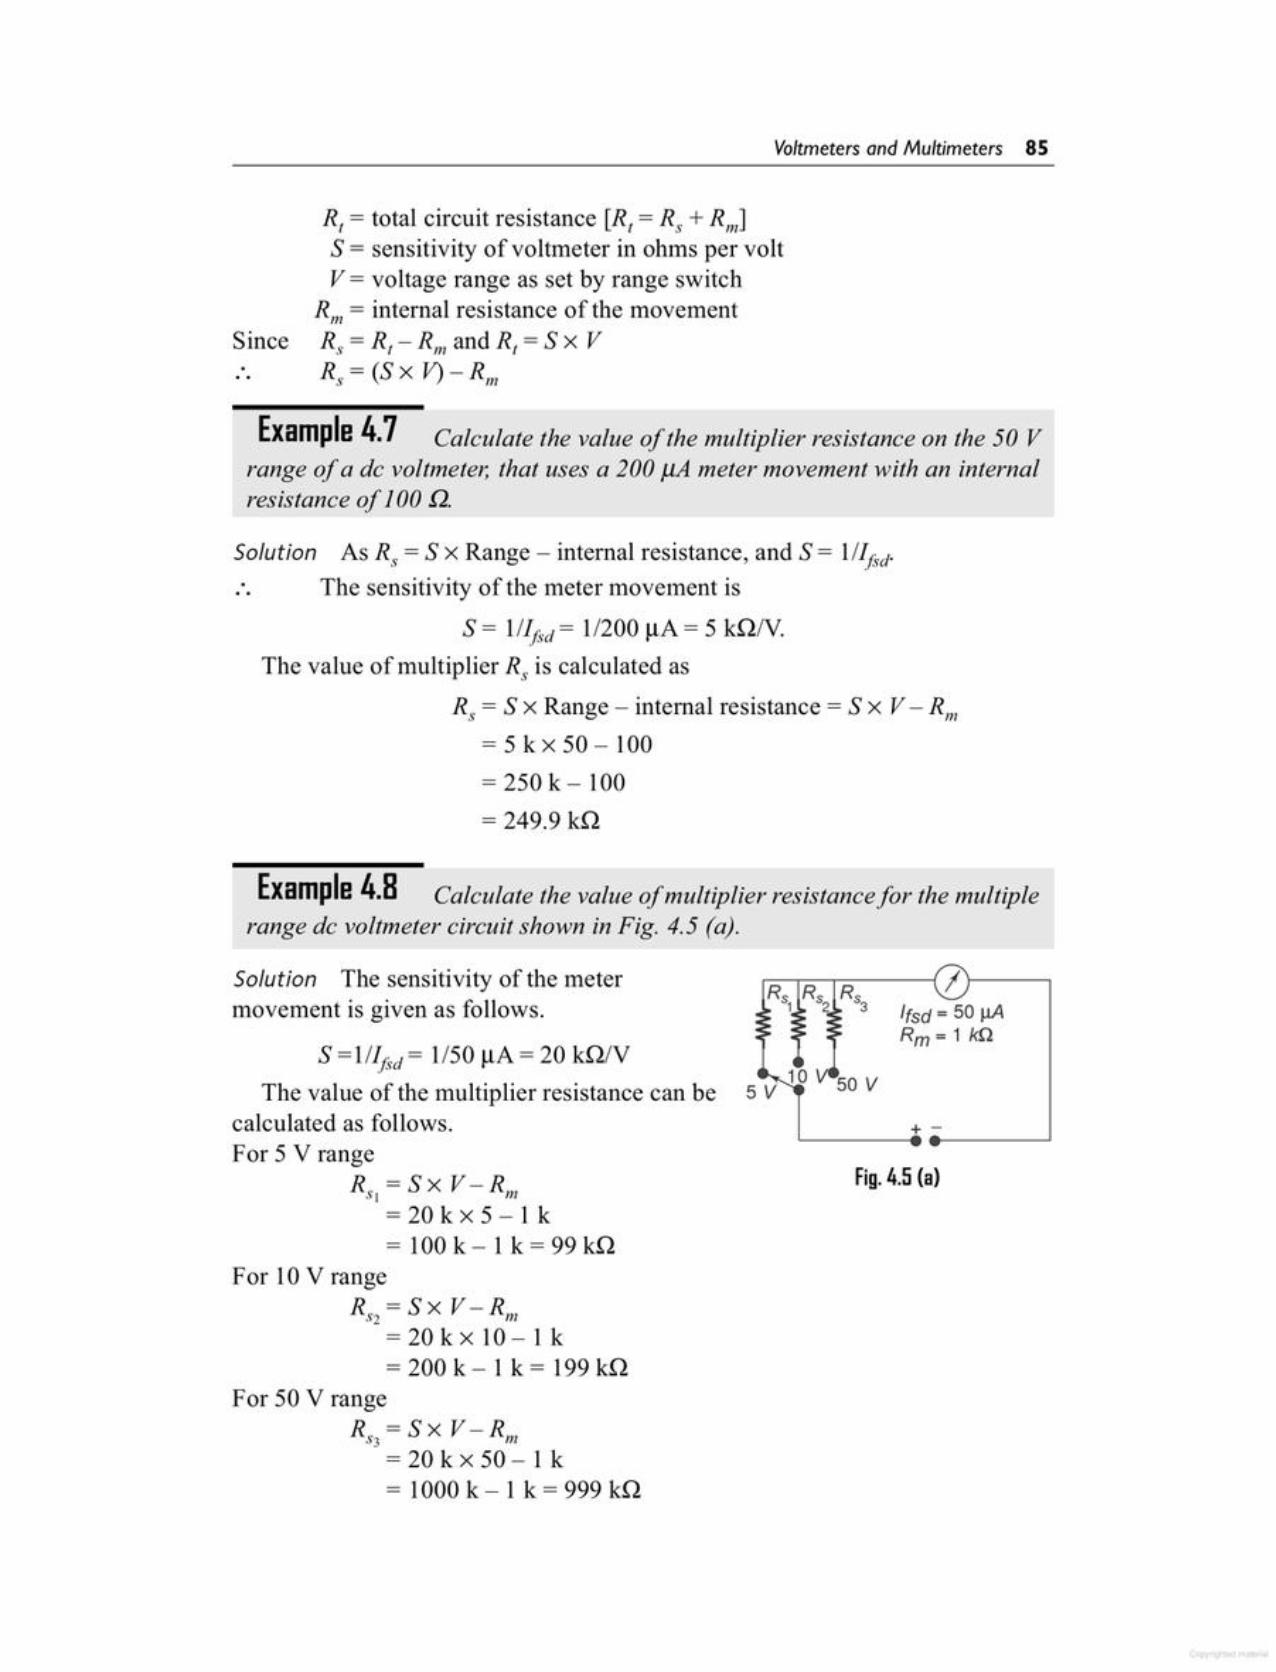
For 50 V rangeRS3 = Sx V -Rm
= 20 k x 50 - 1 k= 1000 k - 1 k = 999 kQ
For 10 V rangeRS2 = Sx V -Rm
= 20 k x 10 -1 k= 200k-1 k= 199kQ
Fig. 4.5 (a)
+ -
S=IIIf.~d= 1/50 ~A= 20 kQ/VThe value of the multiplier resistance can be
calculated as follows.For 5 V range
Rs, =Sx V-Rm= 20 k x 5-1 k= 100 k - 1 k = 99 kQ
r=--r=-..-=-----{ Il--------,Ifsd = 50 IJ.ARm = 1 kn
Solution The sensitivity of the metermovement is given as follows.
Example 4.8 Calculate the value of multiplier resistance for the multiplerange dc voltmeter circuit shown in Fig. 4.5 (a).
Solution As R, = Sx Range - internal resistance, and S= llIfsd.. The sensitivity of the meter movement is
S= 11Ifsd= 1/200 ~A= 5 kQN.The value of multiplier R, is calculated as
R, = Sx Range - internal resistance = Sx V- Rm= 5 k x 50 - 100= 250 k-100= 249.9 kQ
Example 4.7 Calculate the value of the multiplier resistance on the 50 Vrange of a de voltmeter, that uses a 200 f.1A meter movement with an internalresistance of 100 Q.
R, = total circuit resistance [Rt =R, +RmlS= sensitivity of voltmeter in ohms per voltV= voltage range as set by range switch
Rm = internal resistance of the movementR, = R, - Rm and R, =S x VR, = (S x V) - Rm
Since
Voltmeters and Multimeters 85
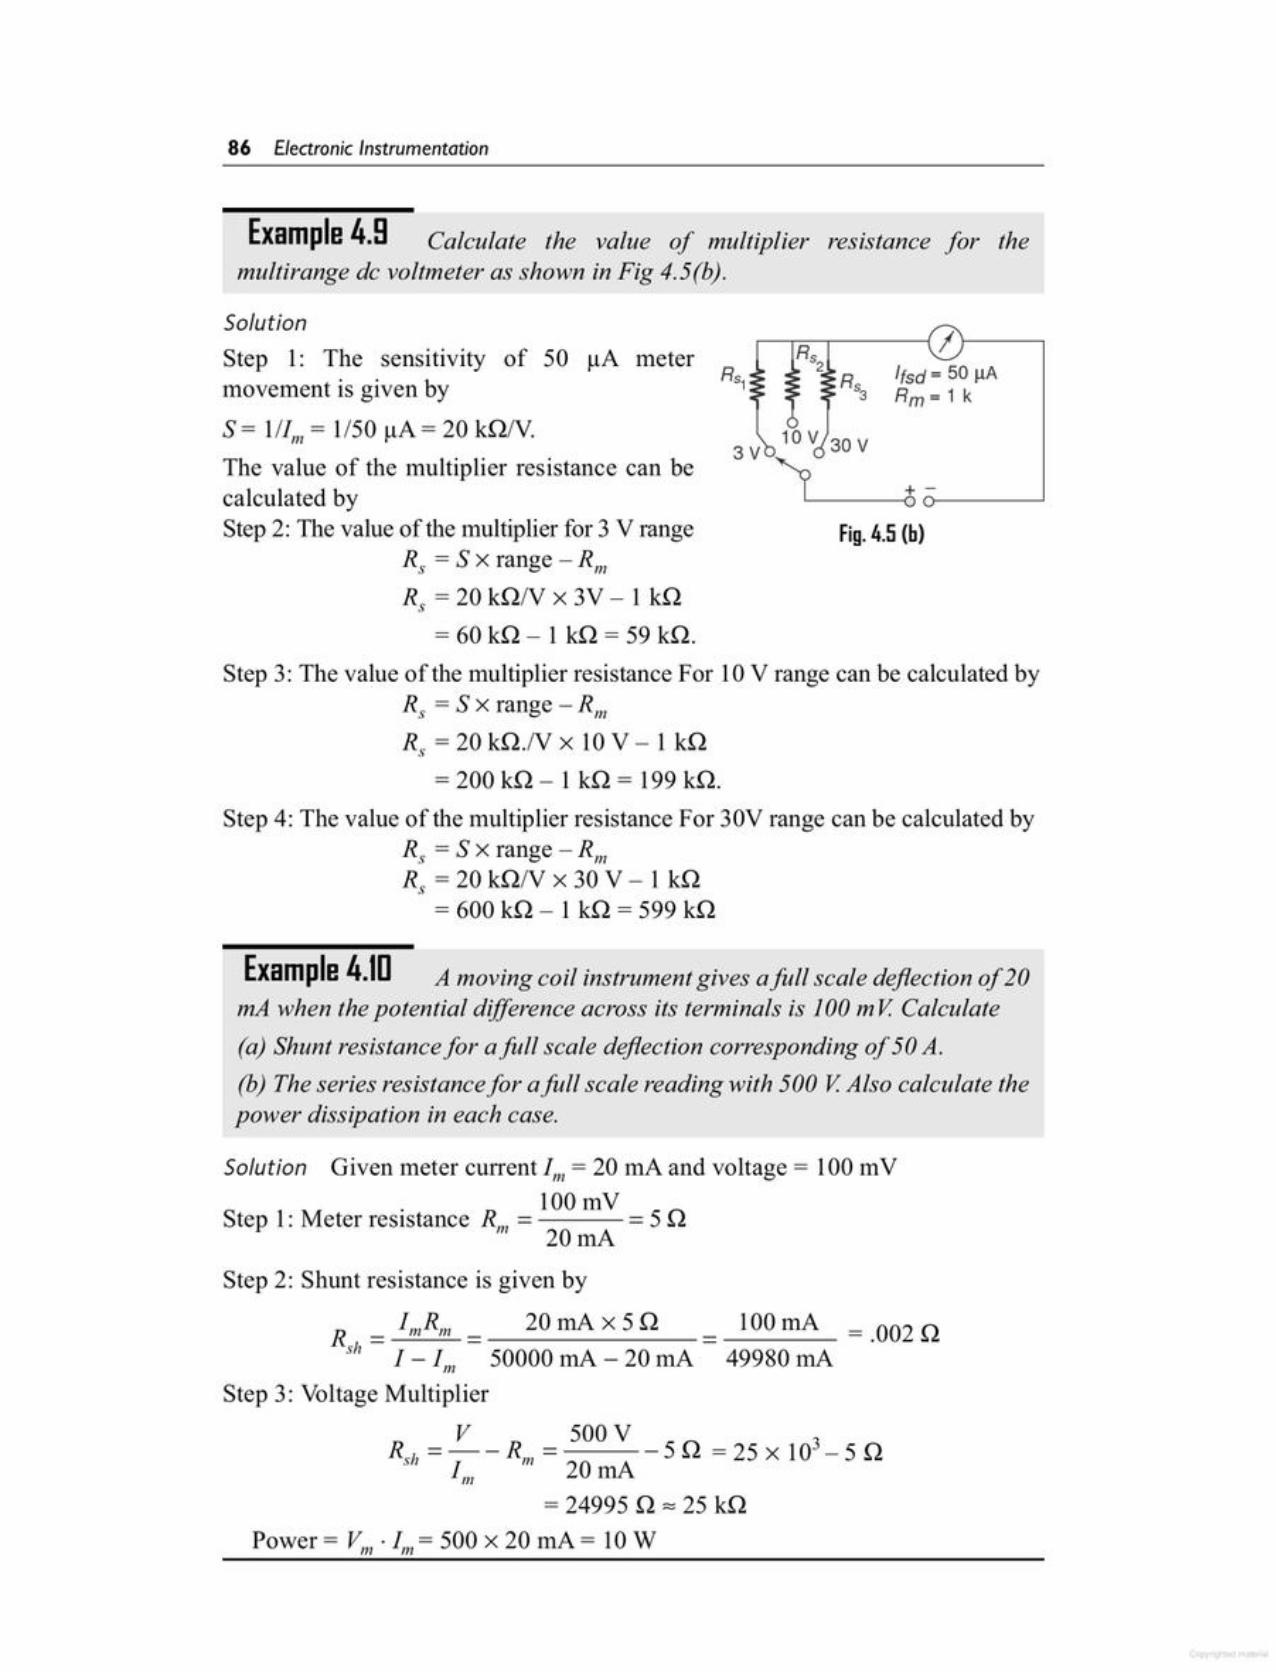
_ V _ 500 V 3Rsh - - - Rm - - 5 Q = 25 x 10 - 5 Q
t; 20 rnA= 24995 Q z 25 kQ
Power = Vm . 1m = 500 x 20 rnA = lOW
= .002 Q
Solution Given meter current 1m = 20 rnA and voltage = 100 InV. 100InV
Step 1: Meter resistance RII1 = = 5Q20 rnA
Step 2: Shunt resistance is given by
R _ ImRm _ 20 rnA x 5 Q _ 100 rnAsh - I - 1m 50000 rnA - 20 rnA 49980 rnA
Step 3: Voltage Multiplier
Example 4.1D A moving coil instrument gives afull scale deflection of 20mA when the potential difference across its terminals is 100 mV Calculate(a) Shunt resistance for afoil scale deflection corresponding of 50 A.(b) The series resistance for afull scale reading with 500 V Also calculate thepower dissipation in each case.
Step 4: The value of the multiplier resistance For 30V range can be calculated byR, = Sx range -RmR, = 20 kQ/V x 30 V - 1 kQ
=600kQ-1 kQ=599kQ
Fig. 4.5 (b)
3VThe value of the multiplier resistance can becalculated byStep 2: The value of the multiplier for 3 V range
R, = Sx range -RmR, = 20 kQ/V x 3V - 1 kQ
= 60 kQ - 1 ill = 59 kQ.Step 3: The value of the multiplier resistance For 10V range can be calculated by
R, = S x range - RmRs =20kQ.Nx 10V -1 kQ
= 200 kQ - 1 kQ = 199 kQ.
+ -L-- __ -() cr----'
.--..-=---.-------{ 11------,Rs
2 Rs lisd = 50 !-LA3 Rm = 1 k
SolutionStep 1: The sensitivity of 50 !-LAmetermovement is given by RSl
S= 111m = 1/50 !-LA= 20 kQN.
Example 4.9 Calculate the value of multiplier resistance for themultirange de voltmeter as shown in Fig 4.5(b).
86 Electronic Instrumentation
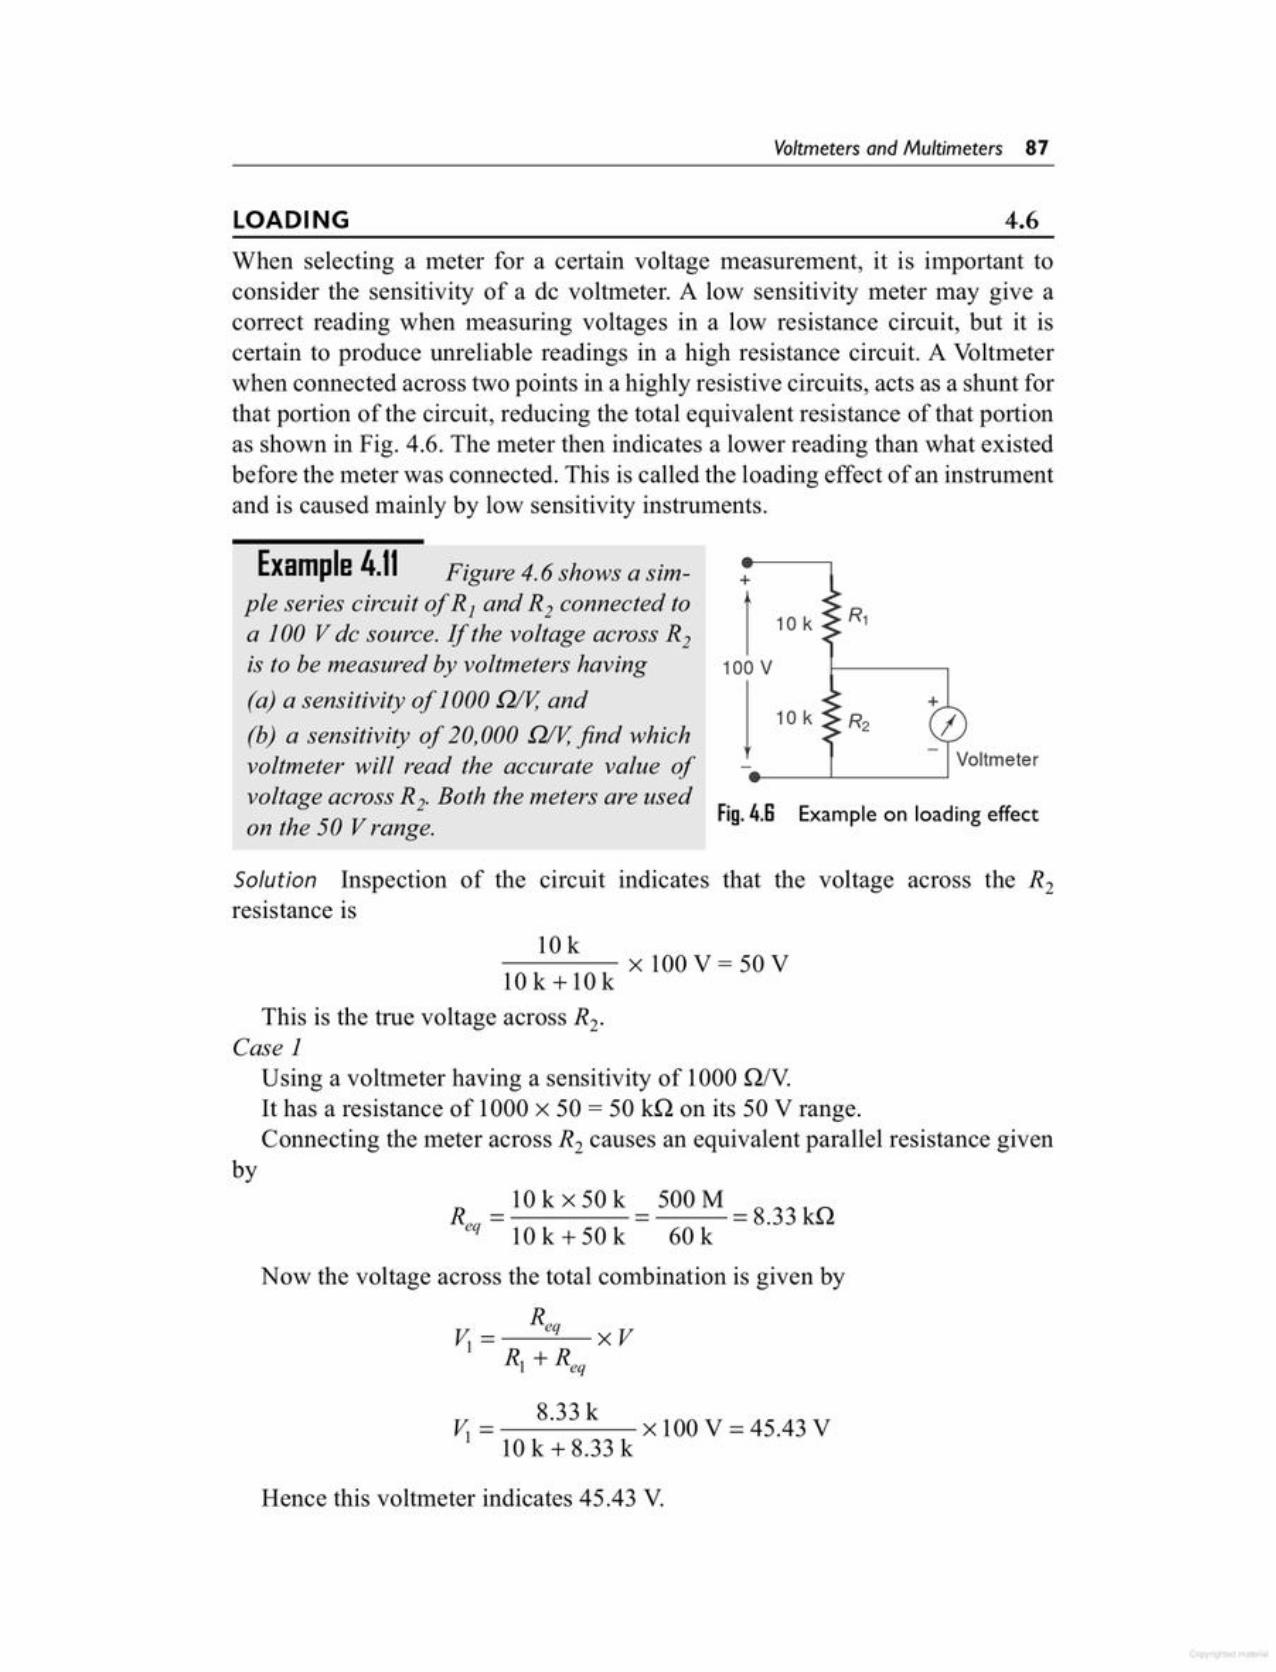
Hence this voltmeter indicates 45.43 V.
v. = 8.33 k x l 00 V = 45.43 V) 10 k + 8.33 k
R - 10 k x 50 k _ 500 M - 833 kQeq - 10 k + 50 k - 60 k - .
Now the voltage across the total combination is given by
ReqV;= xVR, + Req
10k+l0k xlOOV=50V
This is the true voltage across R2.
Case 1Using a voltmeter having a sensitivity of 1000 Q./VIt has a resistance of 1000 x 50 = 50 kQ on its 50 V range.Connecting the meter across R2 causes an equivalent parallel resistance given
by
10k
Solution Inspection of the circuit indicates that the voltage across the R2resistance is
Fig. 4.6 Example on loading effect
Voltmeter
+
+I 10 k R,
100 V
j 10 k R,
Example 4.11 Figure 4.6 shows a sim-ple series circuit of R, and R2 connected toa 100 V de source. If the voltage across R2is to be measured by voltmeters having(a) a sensitivity of 1000 Q/v, and(b) a sensitivity of 20,000 Q/v, find whichvoltmeter will read the accurate value ofvoltage across R 2. Both the meters are usedon the 50 V range.
When selecting a meter for a certain voltage measurement, it is important toconsider the sensitivity of a de voltmeter. A low sensitivity meter may give acorrect reading when measuring voltages in a low resistance circuit, but it iscertain to produce unreliable readings in a high resistance circuit. A Voltmeterwhen connected across two points in a highly resistive circuits, acts as a shunt forthat portion of the circuit, reducing the total equivalent resistance of that portionas shown in Fig. 4.6. The meter then indicates a lower reading than what existedbefore the meter was connected. This is called the loading effect of an instrumentand is caused mainly by low sensitivity instruments.
4.6LOADING
Voltmeters and Multimeters 87

Therefore, the voltage reading obtained with meter 1using the voltage dividerequation is
Req = _R_b_X_R_I1...:....1J= 5 k x 10 k = 3.33 kQs, +RmJ 5k+l0k
(ii) Starting with meter 1, having sensitivity S= 1 kQ/VTherefore the total resistance it presents to the circuit
Rm = Sx range = 1 kQ/V x 10 = 10 kQ1
The total resistance across Rb is, Rb in parallel with lneter resistance Rml
Solution (i) The voltage across the resistance Rb, without either meter connected,is calculated using the voltage divider formula.
5 k 150 kVRb = x 30 = = 5 V
25 k+5 k 30kTherefore,
Fig. 4.7
-v -'- 30 V
Example 4.12 Two different voltmeters are usedto measure the voltage across Rb in the circuit of Fig.4.7.The meters are as follows.Meter 1: S = 1 kQ/V, Rm = 0.2 k, range 10 VMeter 2: S = 20 kWV, Rm = 1.5k, range 10 VCalculate (i) voltage across Rb without any meteracross it, (if) voltage across Rb when the meter 1 isused (iii) voltage across Rb when the meter 2 is used,and (iv) error in the voltmeters.
Hence this voltmeter will read 49.74 V.This example shows that a high sensitivity voltmeter should be used to get
accurate readings.
Now the voltage across the total combination is given by
9.9 kV2 = xl00V=49.74V
10k+9.9k
R = 10kx1M _ 109 = 10k =9.9kQeq 10k+1M 1.01M 1.01
20,000 x 50 = 1000 k = 1MQThis voltmeter when connected across R2 produces an equivalent parallel
resistance given by
Case 2Using a voltmeter having a sensitivity of20,000 QN.Therefore it has a resistanceof
88 Electronic Instrumentation
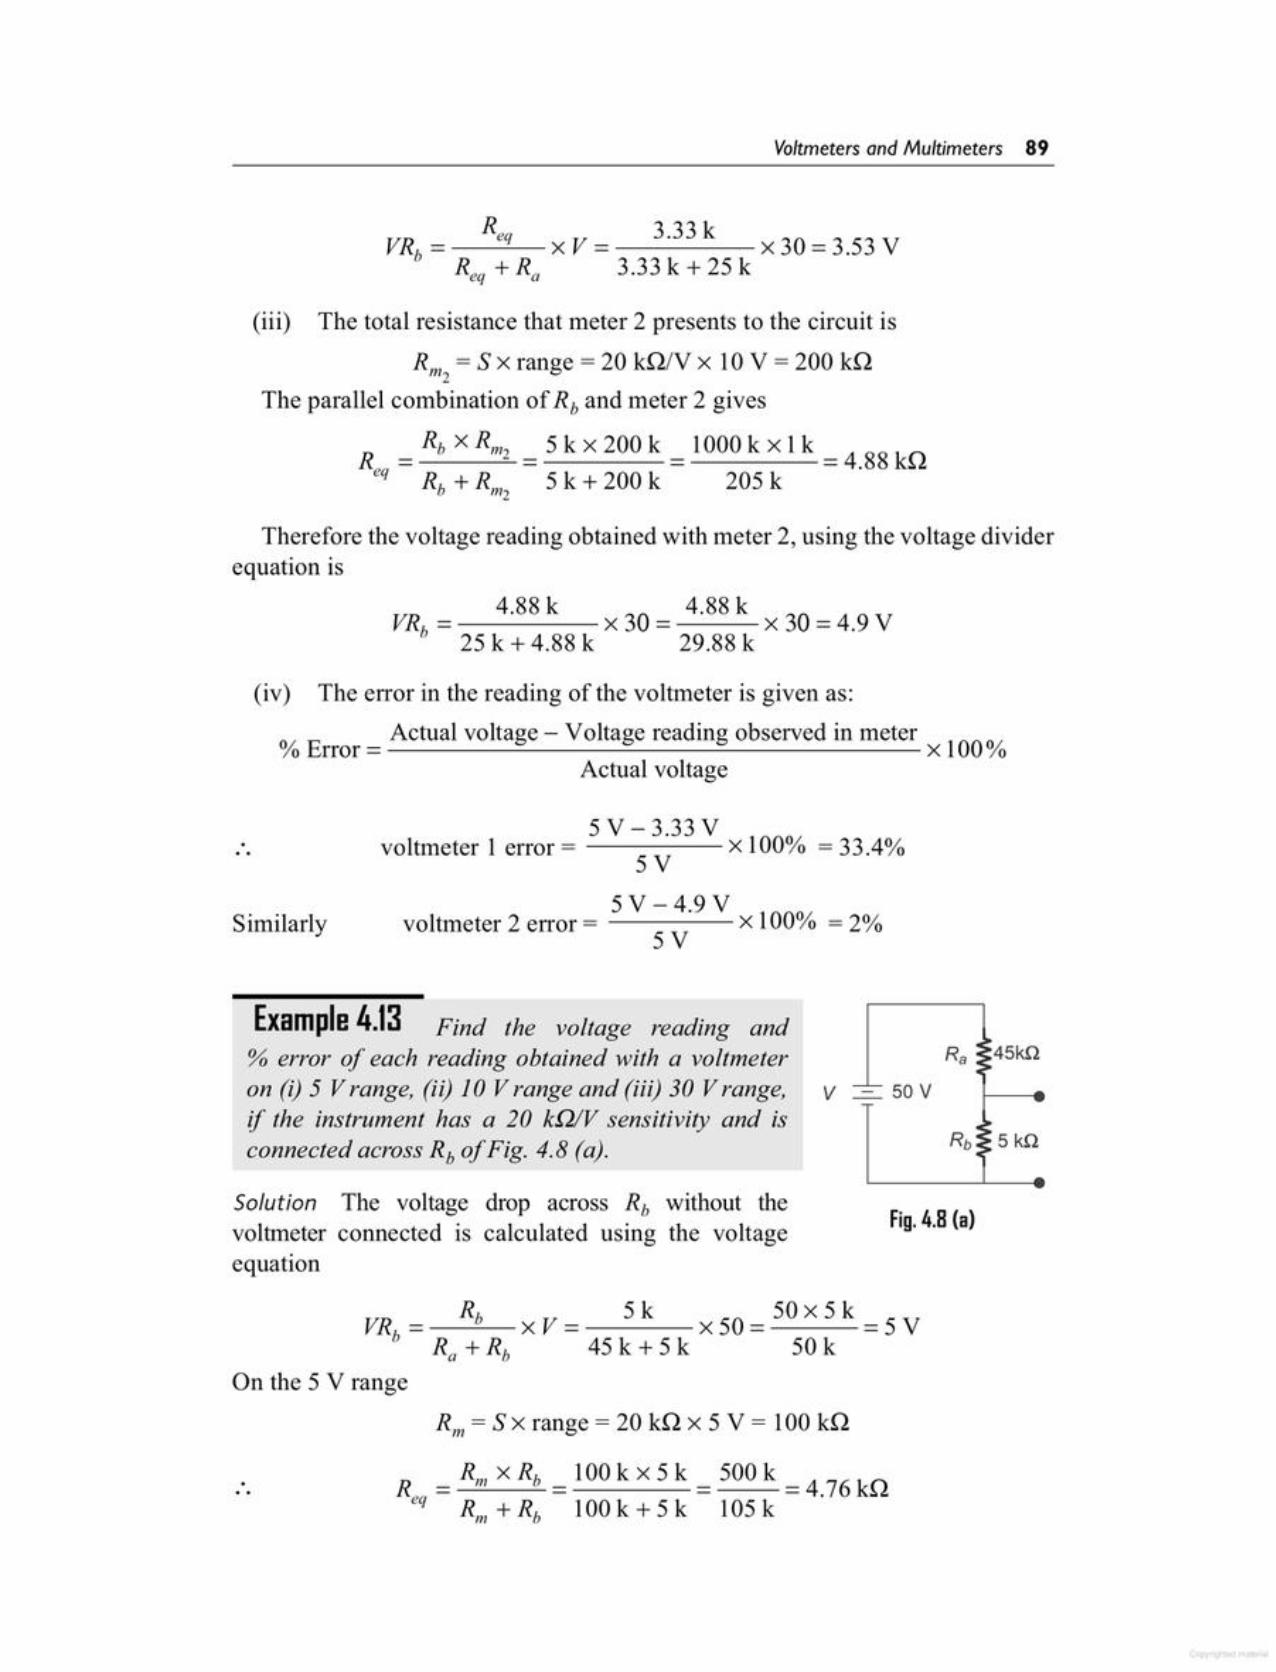
RII1 = Sx range = 20 kQ x 5 V = 100 kQ
Req = Rm x Rb = 100 k x 5 k = 500 k = 4.76 kQRm + Rb 100 k + 5 k 105 k
On the 5 V range
VRb = Rb X V = 5 k x 50 = 50 x 5 k = 5 VRa + Rb 45 k + 5 k 50 k
Fig. 4.8 (a)Solution The voltage drop across Rb without thevoltmeter connected is calculated using the voltageequation
V --::~ 50 V
Example 4.13 Find the voltage reading and% error oj' each reading obtained with a voltmeteron (i) 5 V range, (ii) 10 V range and (iii) 30 V range,if the instrument has a 20 kWV sensitivity and isconnected across Rb a/Fig. 4.8 (a).
Similarly
5 V - 3.33 Vvoltmeter 1 error = ----- x l 00% = 33 4%5V .
5V-4.9V 10001voltmeter 2 error = x 10 = 2%5V
.. .
(iv) The error in the reading of the voltmeter is given as:
01 E Actual voltage - Voltage reading observed in meter 1000110 rror = x 10Actual voltage
VR = 4.88 k x 30 = 4.88 k x 30 = 4.9 Vb 25k+4.88k 29.88k
Therefore the voltage reading obtained with meter 2, using the voltage dividerequation is
= 5 k x 200 k = 1000 k x 1k = 4.88 kQ5 k + 200 k 205 k
(iii) The total resistance that meter 2 presents to the circuit is
Rm = S x range = 20 kQ/V x 10 V = 200 kQ2
The parallel combination of Rb and meter 2 gives
Req 3.33 kVRb= xV= x30=3.53V
Req + s, 3.33 k + 25 k
Voltmeters and Multimeters 89

Example 4.14 A current meter that has an internal resistance of 100 .Qis used to measure the current thro resistor R3 in Fig 4.8(b) given below.Determine the % of the reading due to ammeter loading.
In the above example, the 30 V range introduces the least error due to loading.However, the voltage being measured causes only a 100/0full scale deflection,whereas on the 10 V range the applied voltage causes approximately a one thirdof the full scale deflection with less than 3% error.
The % error on the 30 V range
= 5 V - 4.95 V x 100 = 0.05 x 100 = 1%5V 5V
Req 4.95 kVRb = xV = x 50 = 4.95 V
Req + Ra 45 k + 4.95 k
Rill = S x range = 20 kQN x 30 V = 600 k
. Req = Rm x Rb = 600 k x 5 k = 3000 k x 1k = 4.95 kRill + Rb 600 k + 5 k 605 k
The voltmeter reading on the 30 V range
x 100 = 2.34%5 V - 4.88 V
5VThe % error on the 10 V range =
On 30 V range
R 4.87 kVRb = eq X V = x 50 = 4.88 V
Req + Ra 4.87 k + 45 k
Rm = S x range = 20 kQN x 10 V = 200 kQ
Req = Rill X Rb = 200 k x 5 k = 4.87 kQRm + Rb 200 k + 5 k
The voltmeter reading is
...
On 10 V range
=5V-4.782V X100=0.217V xlOO=4.34%5V 5V
The % error on the 5 V range is
0/ E Actual voltage - Voltage reading in meter/0 rror=--------~------~----~------
Actual voltage
The voltmeter reading is
R 4.76 kVRb = eq xV = x 50 = 4.782 V
Ra + Req 45 k + 4.76 k
90 Electronic Instrumentation

Direct coupled amplifiers are economical and hence used widely in generalpurpose low priced VTVM's. Figure 4.9 gives a simplified schematic diagram ofa de coupled amplifier with an indicating meter, The de input is applied to a rangeattenuator to provide input voltage levels which can be accommodated by the deamplifier. The input stage of the amplifier consists of a FET which provides highinput impedance to effectively isolate the meter circuit from the circuit undermeasurement. The input impedance of a FET is greater than 10 MQ. The bridgeis balanced, so that for zero input the dial indicates zero.
The two transistors, Q1 and Q2 forms a de coupled amplifier driving the metermovement. Within the dynamic range of the amplifier, the meter deflection isproportional to the magnitude of the applied input voltage. The input overloaddoes not bum the meter because the amplifier saturates, limiting the maximumcurrent through the meter. The gain of the de amplifier allows the instrumentto be used for measurement of voltages in the mV range. Instruments in the
4.7TRANSISTOR VOLTMETER (TVM)
The current thro the meter is 93.8% of the expected current, therefore themeter current caused a 6.2% error due to effects of loading.
1m = 0.938 xlTherefore
1 = 1.5 kQ = 1.5 k = 0.938111 1.5 kQ + 100 Q 1.6 k
Therefore
Step 2: The ratio of the meter current to the expected current is
1m _ Rt-_
Fig. 4.8
Looking back into terminals x and y and using Thevinin's equivalentresistance,
(a)
(b)
3V3V
R, = 1 kQ1 kQ
SolutionStep 1: The current meter will be connected in to the circuit as shown in Fig 4.8(a).
Voltmeters and Multimeters 91
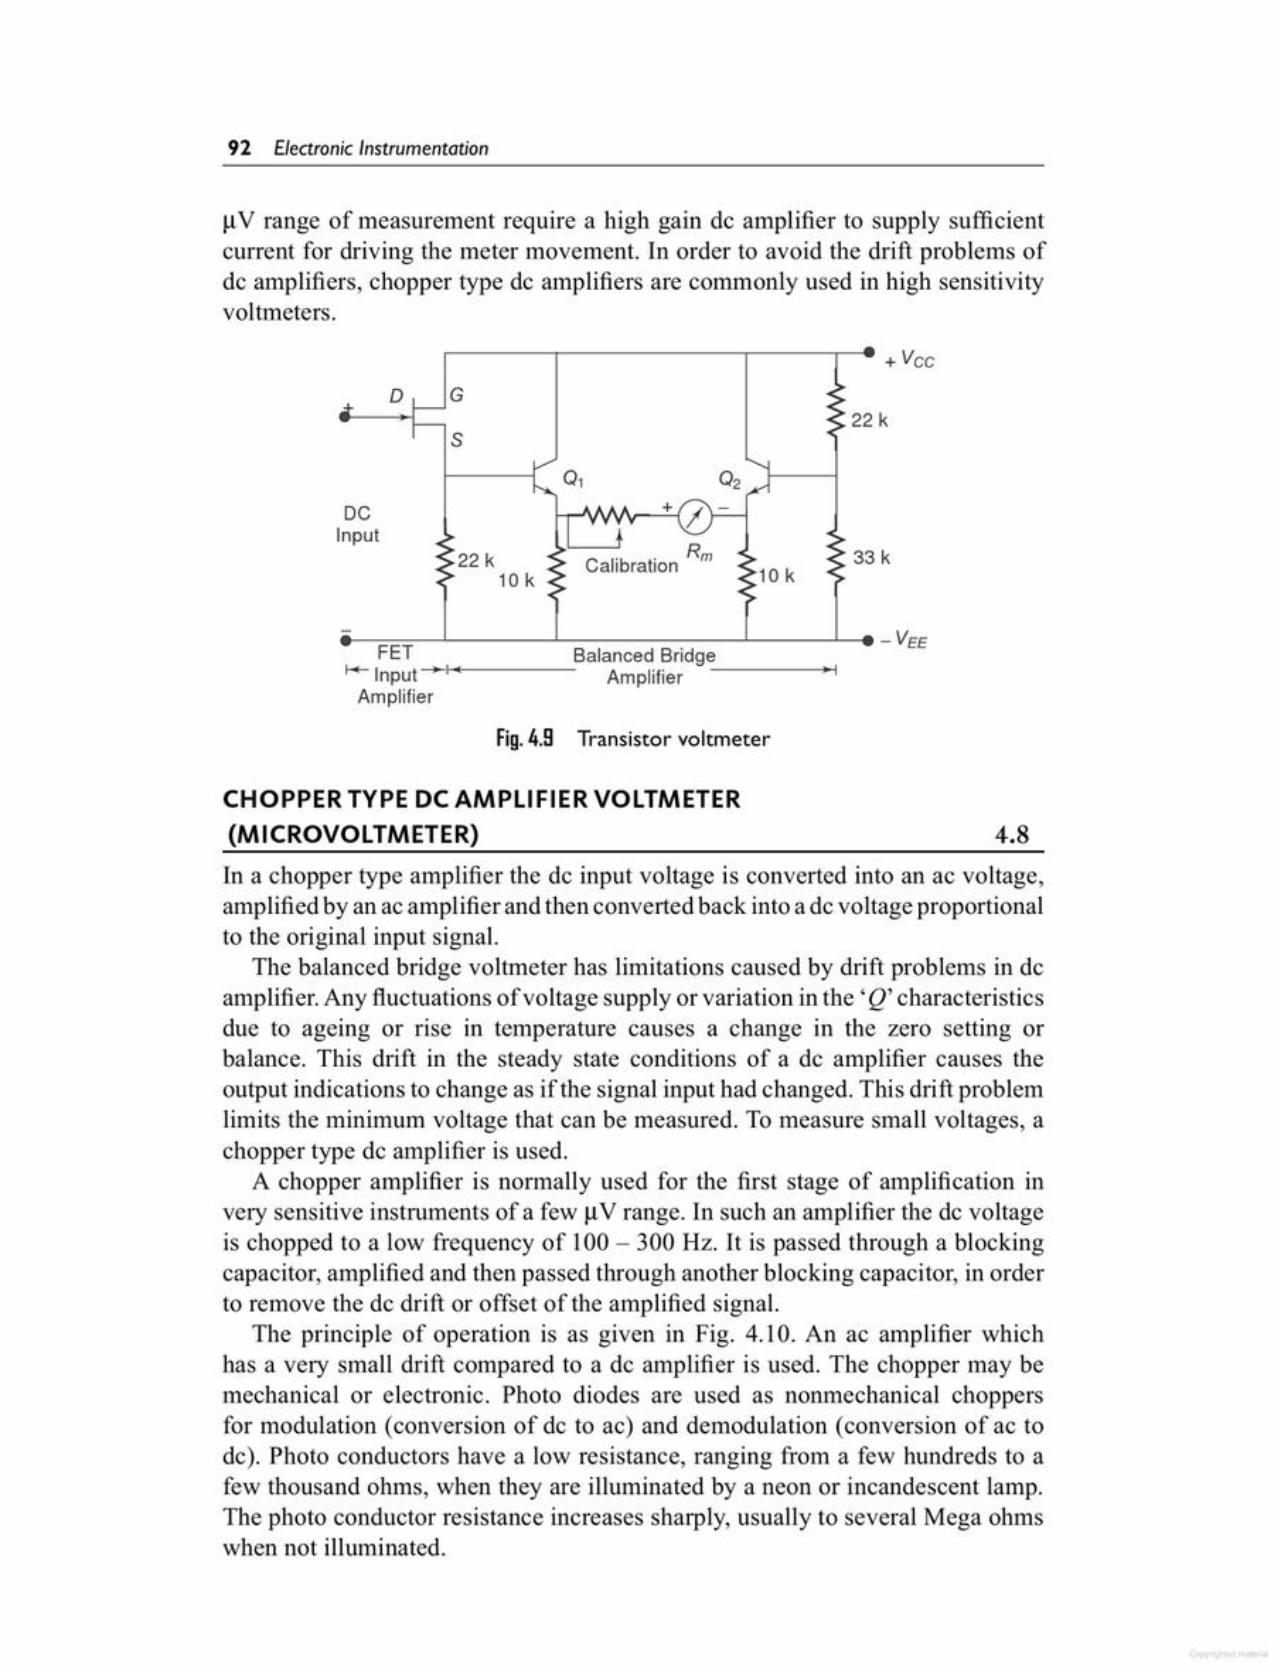
In a chopper type amplifier the de input voltage is converted into an ac voltage,amplified by an ac amplifier and then converted back into a de voltage proportionalto the original input signal.
The balanced bridge voltmeter has limitations caused by drift problems in deamplifier. Any fluctuations of voltage supply or variation in the' Q' characteristicsdue to ageing or rise in temperature causes a change in the zero setting orbalance. This drift in the steady state conditions of a de amplifier causes theoutput indications to change as if the signal input had changed. TIns drift problemlimits the minimum voltage that can be measured. To measure small voltages, achopper type de amplifier is used.
A chopper amplifier is normally used for the first stage of amplification invery sensitive instruments of a few 11V range. In such an amplifier the de voltageis chopped to a low frequency of 100 - 300 Hz. It is passed through a blockingcapacitor, amplified and then passed through another blocking capacitor, in orderto remove the de drift or offset of the amplified signal.
The principle of operation is as given in Fig. 4.10. An ac amplifier whichhas a very small drift compared to a de amplifier is used. The chopper may bemechanical or electronic. Photo diodes are used as nonmechanical choppersfor modulation (conversion of de to ac) and demodulation (conversion of ac tode). Photo conductors have a low resistance, ranging from a few hundreds to afew thousand ohms, when they are illuminated by a neon or incandescent lamp.The photo conductor resistance increases sharply, usually to several Mega ohmswhen not illuminated.
4.8CHOPPER TYPE DC AMPLIFIER VOLTMETER(MICROVOLTMETER)
Fig.4.9 Transistor voltmeter
e--=~~--------~------------~----~-e-VEEFET Balanced Bridge
I-+-Input---II--------- Amplifier --------lo-j
Amplifier
33 kRCalibration m22 k
10 k
DCInput
22 ko G
+ Vee
s
IlV range of measurement require a high gain de amplifier to supply sufficientcurrent for driving the meter movement. In order to avoid the drift problems ofde amplifiers, chopper type de amplifiers are commonly used in high sensitivityvoltmeters.
92 Electronic Instrumentation
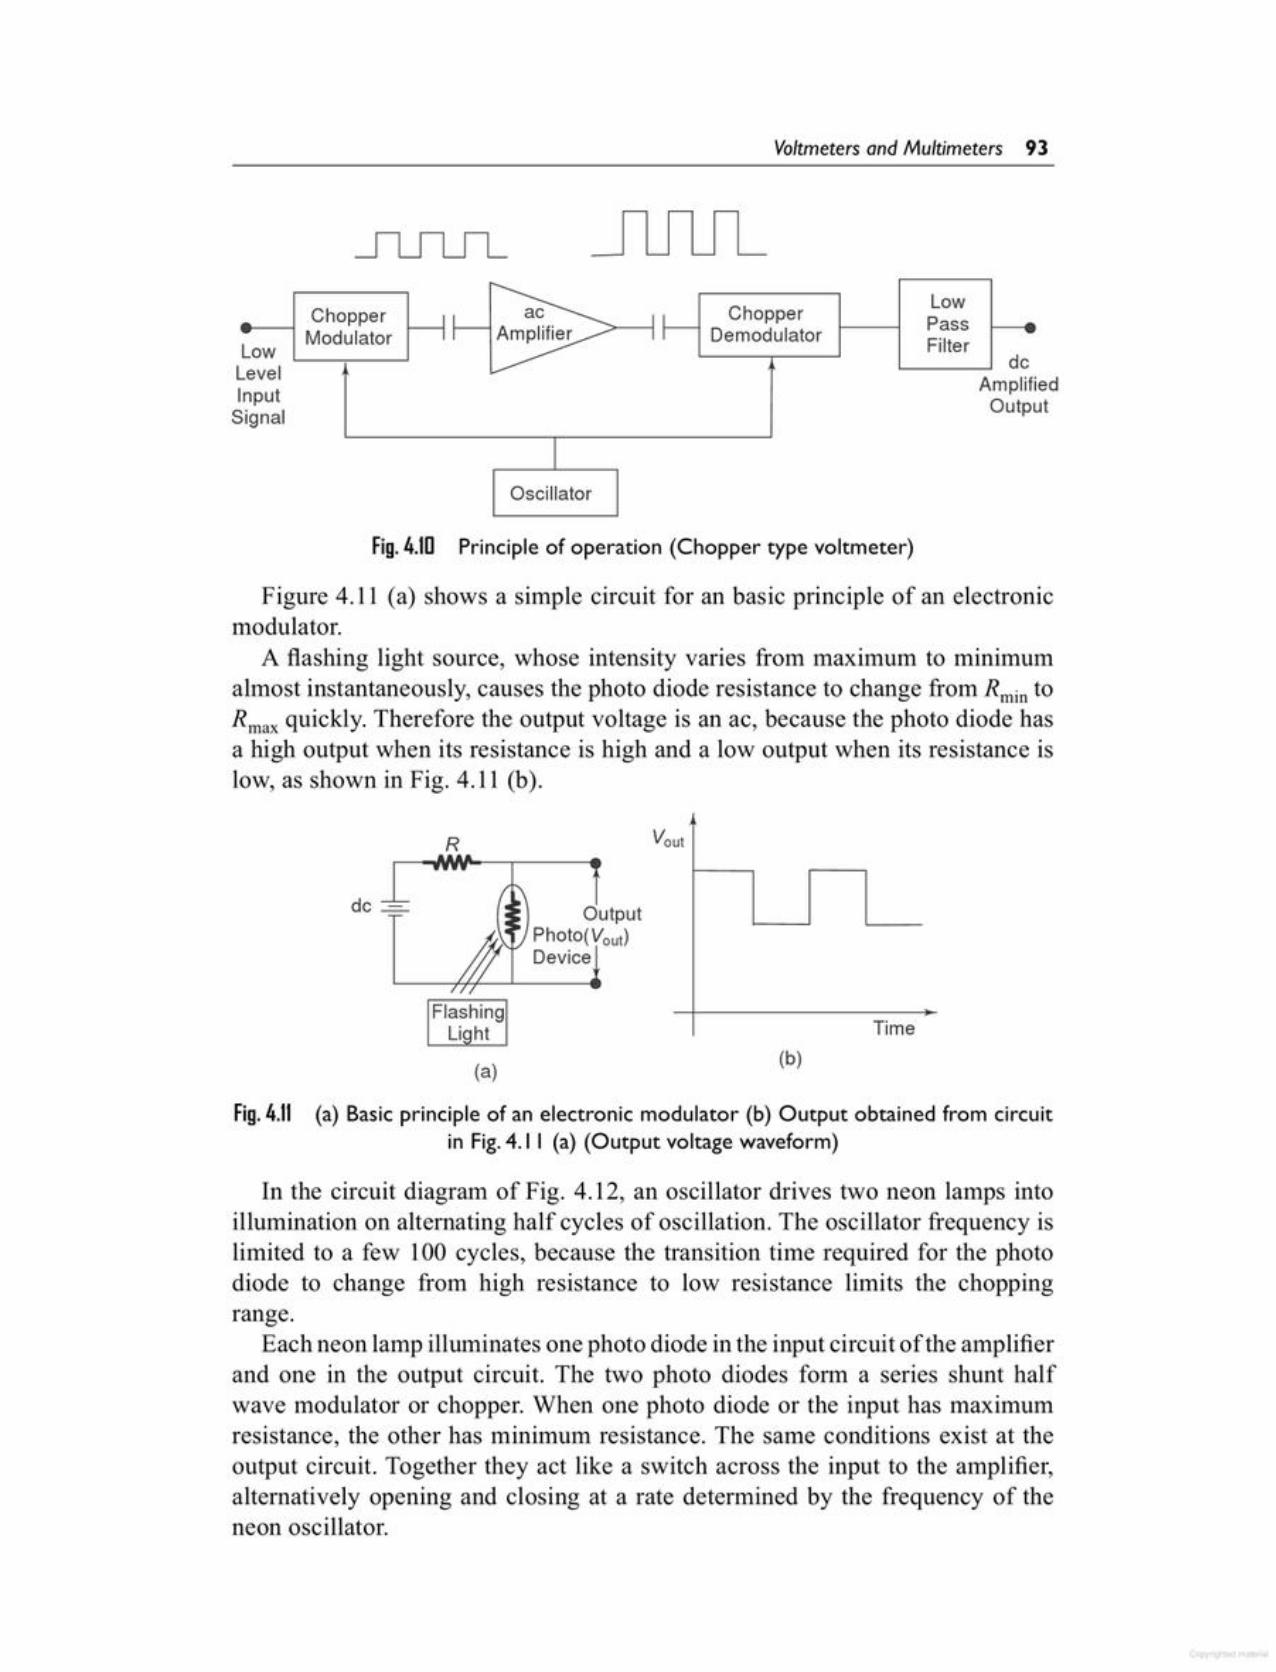
Fig. 4.11 (a) Basic principle of an electronic modulator (b) Output obtained from circuitin Fig.4.1 I (a) (Output voltage waveform)
In the circuit diagram of Fig. 4.12, an oscillator drives two neon lamps intoillumination on alternating half cycles of oscillation. The oscillator frequency islimited to a few 100 cycles, because the transition time required for the photodiode to change froIn high resistance to low resistance limits the choppingrange.
Each neon lamp illuminates one photo diode in the input circuit of the amplifierand one in the output circuit. The two photo diodes form a series shunt halfwave modulator or chopper. When one photo diode or the input has maximumresistance, the other has minimum resistance. The same conditions exist at theoutput circuit. Together they act like a switch across the input to the amplifier,alternatively opening and closing at a rate determined by the frequency of theneon oscillator.
(b)(a)
FlashingLi ht
OutputPhoto(Vout)Device
dc -=-
R ut
Time
Figure 4.11 (a) shows a simple circuit for an basic principle of an electronicmodulator.
A flashing light source, whose intensity varies from maximum to minimumalmost instantaneously, causes the photo diode resistance to change from Rmin toRmax quickly. Therefore the output voltage is an ac, because the photo diode hasa high output when its resistance is high and a low output when its resistance islow, as shown in Fig. 4.11 (b).
Fig.4.10 Principle of operation (Chopper type voltmeter)
sedut
~ Chopper LowChopper JI :f- PassModulator I I r>: Demodulator FilterLow dcevel AmplifiInput Outpignal
IOscillator
L
Voltmeters and Multimeters 93
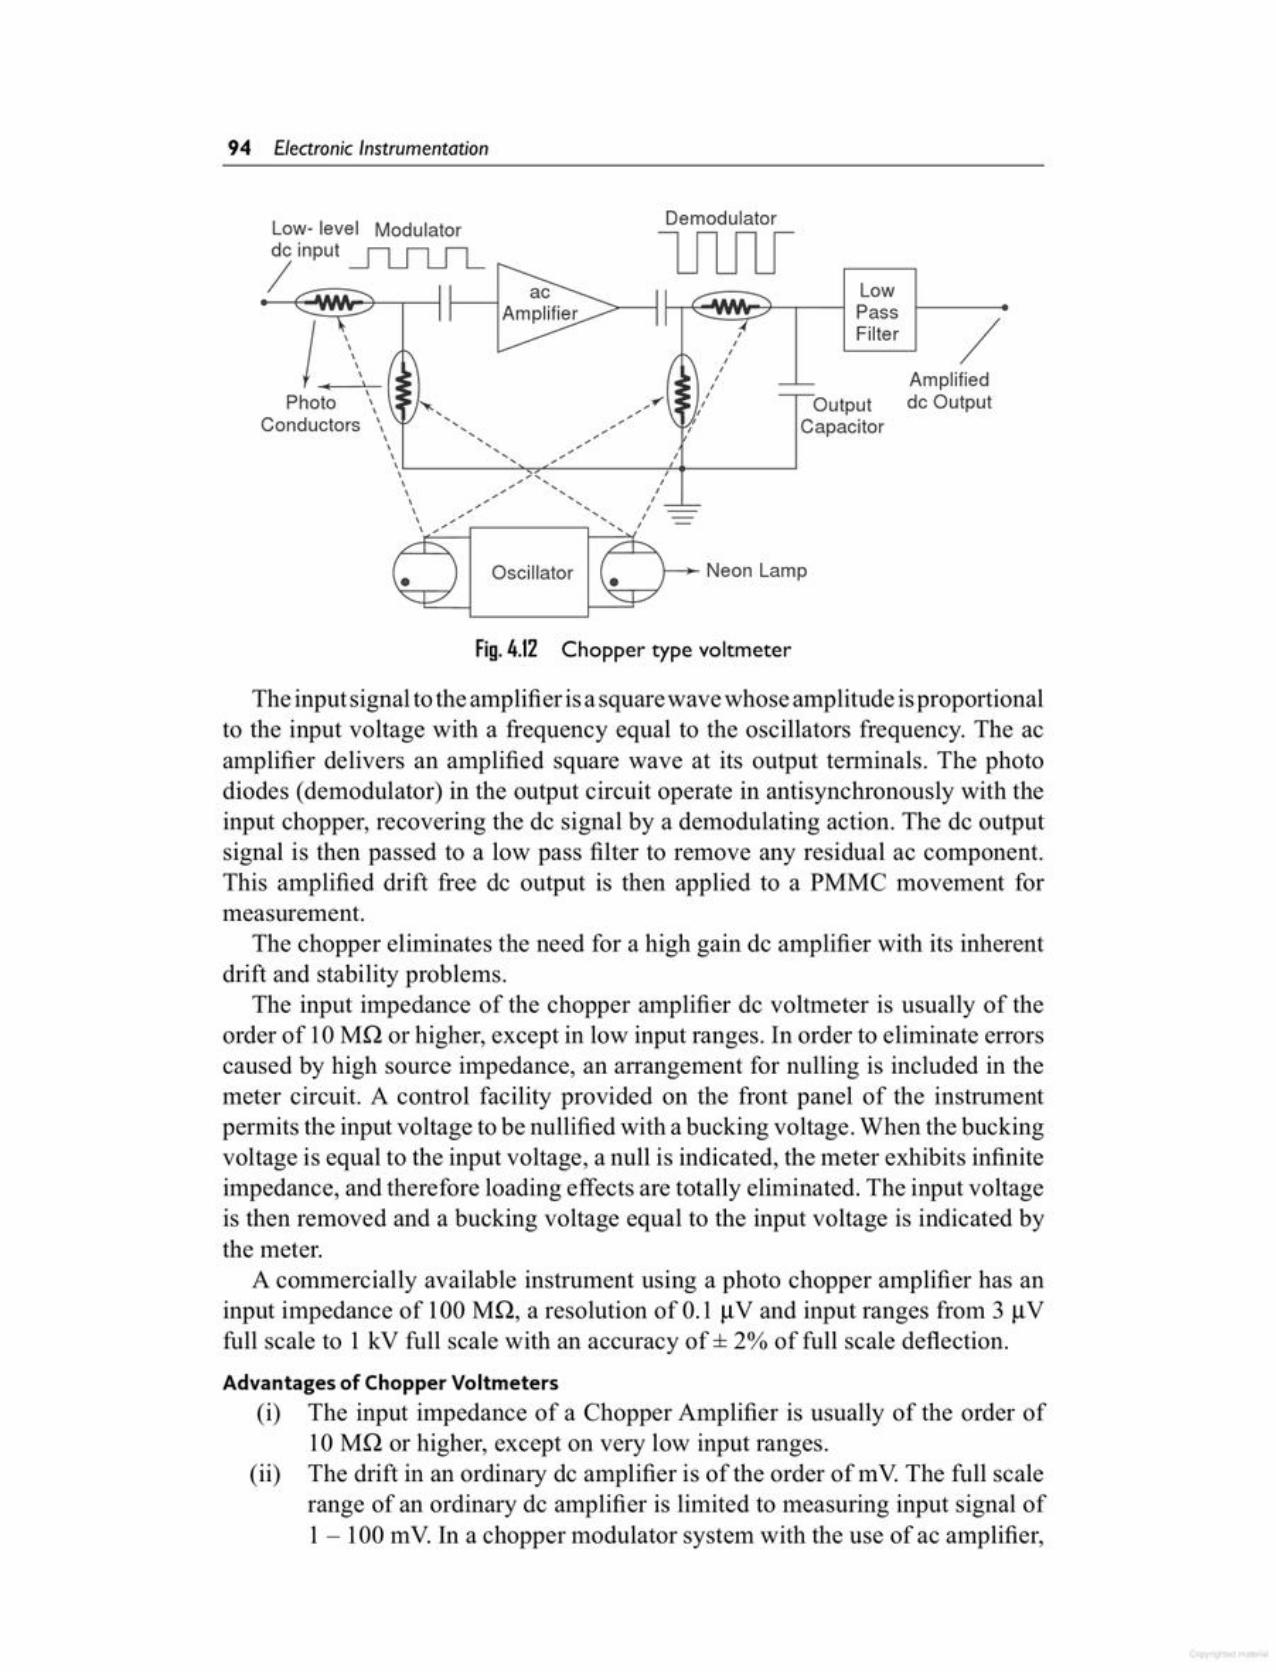
The inputsignal tothe amplifier isasquarewavewhoseamplitude isproportionalto the input voltage with a frequency equal to the oscillators frequency. The acamplifier delivers an amplified square wave at its output terminals. The photodiodes (demodulator) in the output circuit operate in antisynchronously with theinput chopper, recovering the dc signal by a demodulating action. The de outputsignal is then passed to a low pass filter to remove any residual ac component.This amplified drift free de output is then applied to a PMMC movement formeasurement.
The chopper eliminates the need for a high gain de amplifier with its inherentdrift and stability problems.
The input impedance of the chopper amplifier dc voltmeter is usually of theorder of 10MO or higher, except in low input ranges. In order to eliminate errorscaused by high source impedance, an arrangement for nulling is included in themeter circuit. A control facility provided on the front panel of the instrumentpermits the input voltage to be nullified with a bucking voltage. When the buckingvoltage is equal to the input voltage, a null is indicated, the meter exhibits infiniteimpedance, and therefore loading effects are totally eliminated. The input voltageis then removed and a bucking voltage equal to the input voltage is indicated bythe meter.
A commercially available instrument using a photo chopper amplifier has aninput impedance of 100 MO, a resolution of 0.1 j..lV and input ranges from 3 IlVfull scale to 1 kV full scale with an accuracy of ± 2% of full scale deflection.
Advantages of Chopper Voltmeters(i) The input impedance of a Chopper Amplifier is usually of the order of
10 MO or higher, except on very low input ranges.(ii) The drift in an ordinary dc amplifier is of the order of mV.The full scale
range of an ordinary de amplifier is limited to measuring input signal of1 - 100 mV. In a chopper modulator system with the use of ac amplifier,
Fig.4.12 Chopper type voltmeter
Neon LampOscillator
Amplifieddc OutputOutput
Capacitor
/IIIIIIIIII,
I
Photo
Demodulator
lI1JlILow- level Modulatordc input _lL_fl__Jl__/
94 Electronic Instrumentation
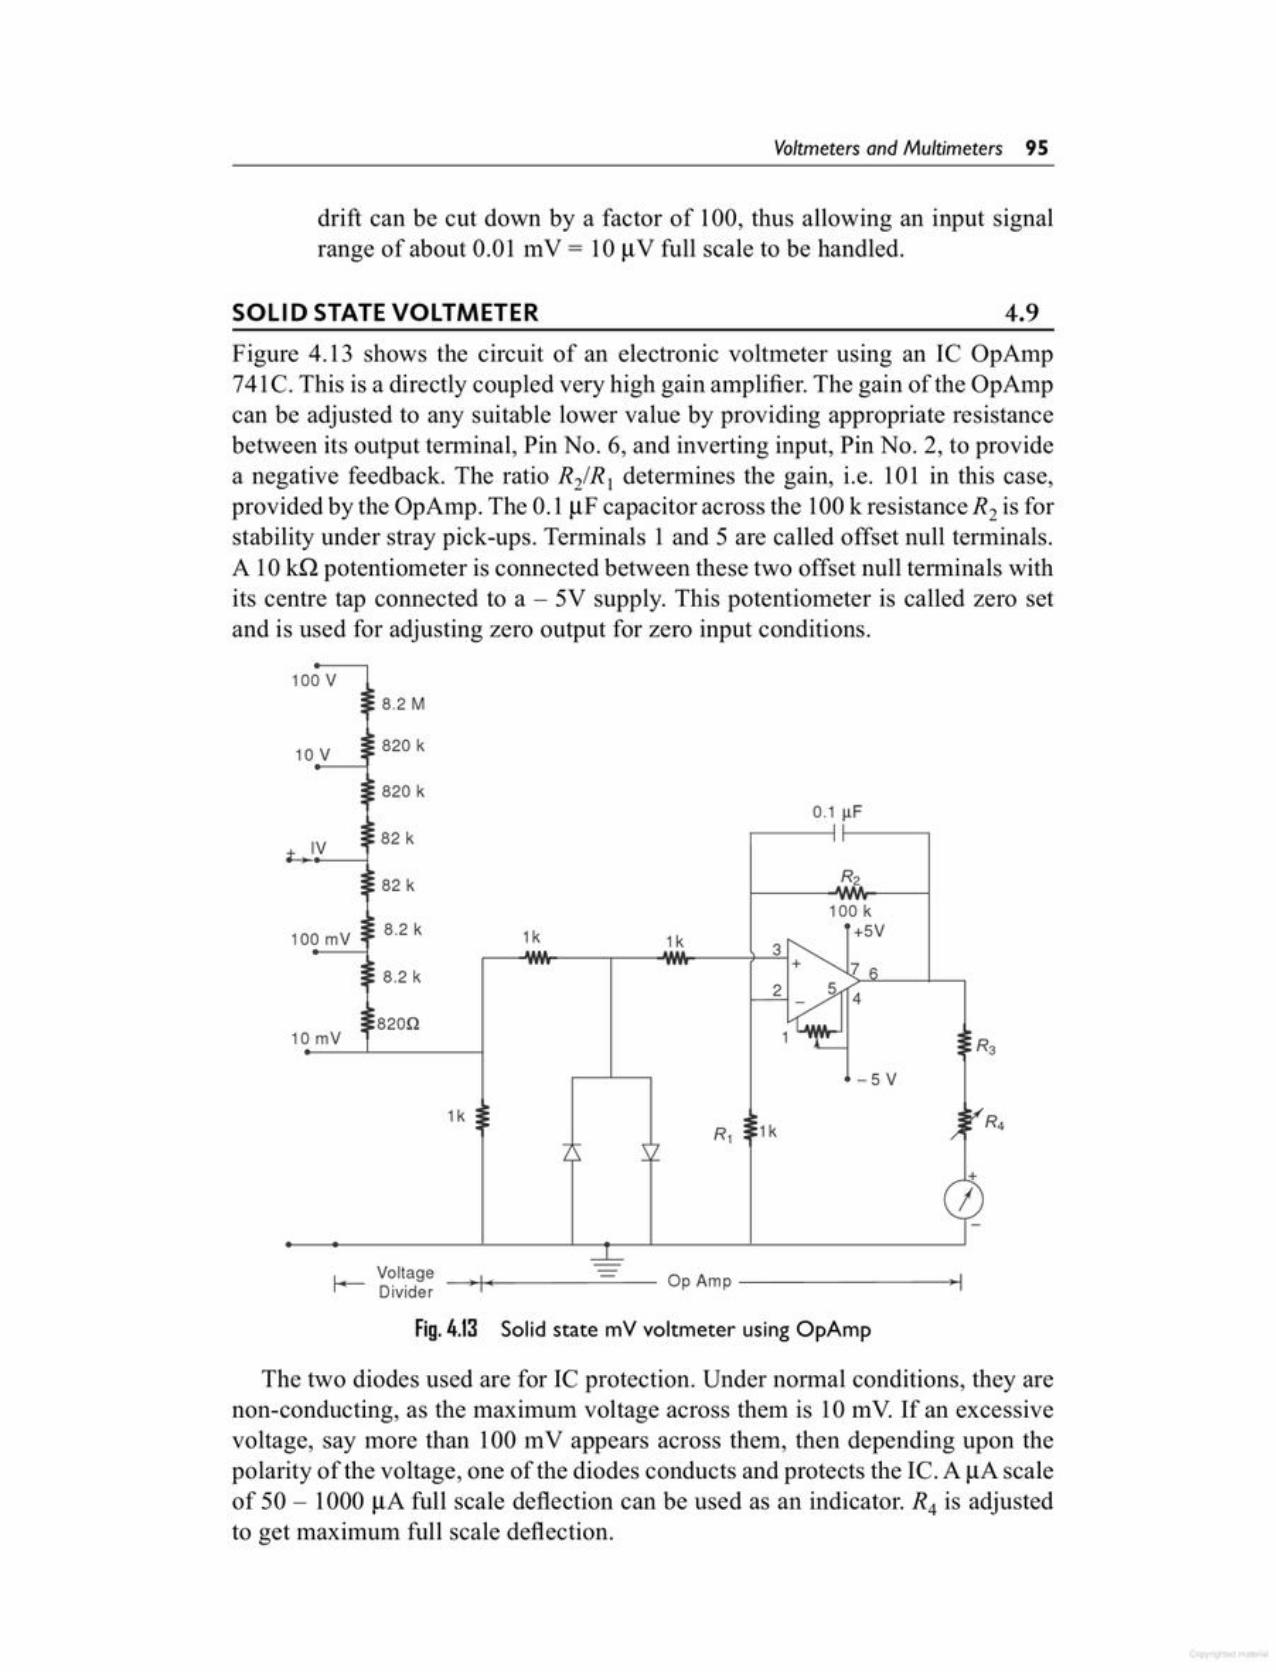
The two diodes used are for IC protection. Under normal conditions, they arenon-conducting, as the maximum voltage across them is 10m V. If an excessivevoltage, say more than 100 mV appears across them, then depending upon thepolarity of the voltage, one of the diodes conducts and protects the IC. A flA scaleof 50 - 1000 flA full scale deflection can be used as an indicator. R4 is adjustedto get maximum full scale deflection.
Fig. 4.13 Solid state mV voltmeter using OpAmp
L___ Voltage 0,..-----Divider p Amp --------.,
Figure 4.13 shows the circuit of an electronic voltmeter using an IC OpAmp741C. This is a directly coupled very high gain amplifier. The gain of the OpAmpcan be adjusted to any suitable lower value by providing appropriate resistancebetween its output terminal, Pin No.6, and inverting input, Pin No.2, to providea negative feedback. The ratio R21RI determines the gain, i.e. 101 in this case,provided by the OpAmp. The 0.1 flF capacitor across the 100 k resistance R2 is forstability under stray pick-ups. Terminals 1 and 5 are called offset null terminals.A 10 kQ potentiometer is connected between these two offset null terminals withits centre tap connected to a - 5V supply. This potentiometer is called zero setand is used for adjusting zero output for zero input conditions.
4.9SOLID STATE VOLTMETER
drift can be cut down by a factor of 100, thus allowing an input signalrange of about 0.01 mV = 10 flV full scale to be handled.
Voltmeters and Multimeters 95

Multifunction Laboratory InstrumentA basic de standard differential voltmeter can be operated in different modes.The three basic modes of operation are (i) as a de voltage standard, (ii) as a dedifferential voltmeter, and (iii) as a de voltmeter (conventional).
4.11DC STANDARD/DIFFERENCE VOLTMETER
Fig. 4.14 (b) Block diagram of an ac differential voltmeter
++ I c~
Input ac :;: 1 Vac Atten- ac to dc dc Reference
Input uator Amplifier Converter
ence source nor the unknown voltagesource, and hence the differential volt- Fig.4.14 (a) Basic differential voltmetermeter presents an infinite impedanceto the unknown source. (The null meter serves as an indicator only.)
To detect small differences the meter movement must be sensitive, but it neednot be calibrated, since only zero has to be indicated.
The reference source used is usually a 1 V dc standard source or a zenercontrolled precision supply. A high voltage reference supply is used for measuringhigh voltages.
The usual practice, however, is to employ voltage dividers or attenuatorsacross an unknown source to reduce the voltage. The input voltage divider hasa relatively low input impedance, especially for unknown voltages much higherthan the reference standard. The attenuation will have a loading effect and theinput resistance of voltmeter is not infinity when an attenuator is used.
In order to measure ac voltages, the ac voltage must be converted into de byincorporating a precision rectifier circuit. A block diagram of an ac differentialvoltmeter is shown in Fig. 4.14 (b).
ReferenceVoltage
;I
Unknown •; --::'::-
Voltage :'"
-r
PotentiometerNull Indicatormeter.In this method, the potentiometer
is varied until the voltage across itequals the unknown voltage, which isindicated by the null indicator readingzero. Under null conditions, the meterdraws current from neither the refer-
Basic Differential Measurement The differential voltmeter technique, is one ofthe most common and accurate methods of measuring unknown voltages. In thistechnique, the voltmeter is used to indicate the difference between known andunknown voltages, i.e., an unknown voltage is compared to a known voltage.
Figure 4.14 (a) shows a basic circuit of a differential voltmeter based on thepotentiometric method; hence it is sometimes also called a potentiometric volt-
4.10DIFFERENTIAL VOLTMETER
96 Electronic Instrumentation
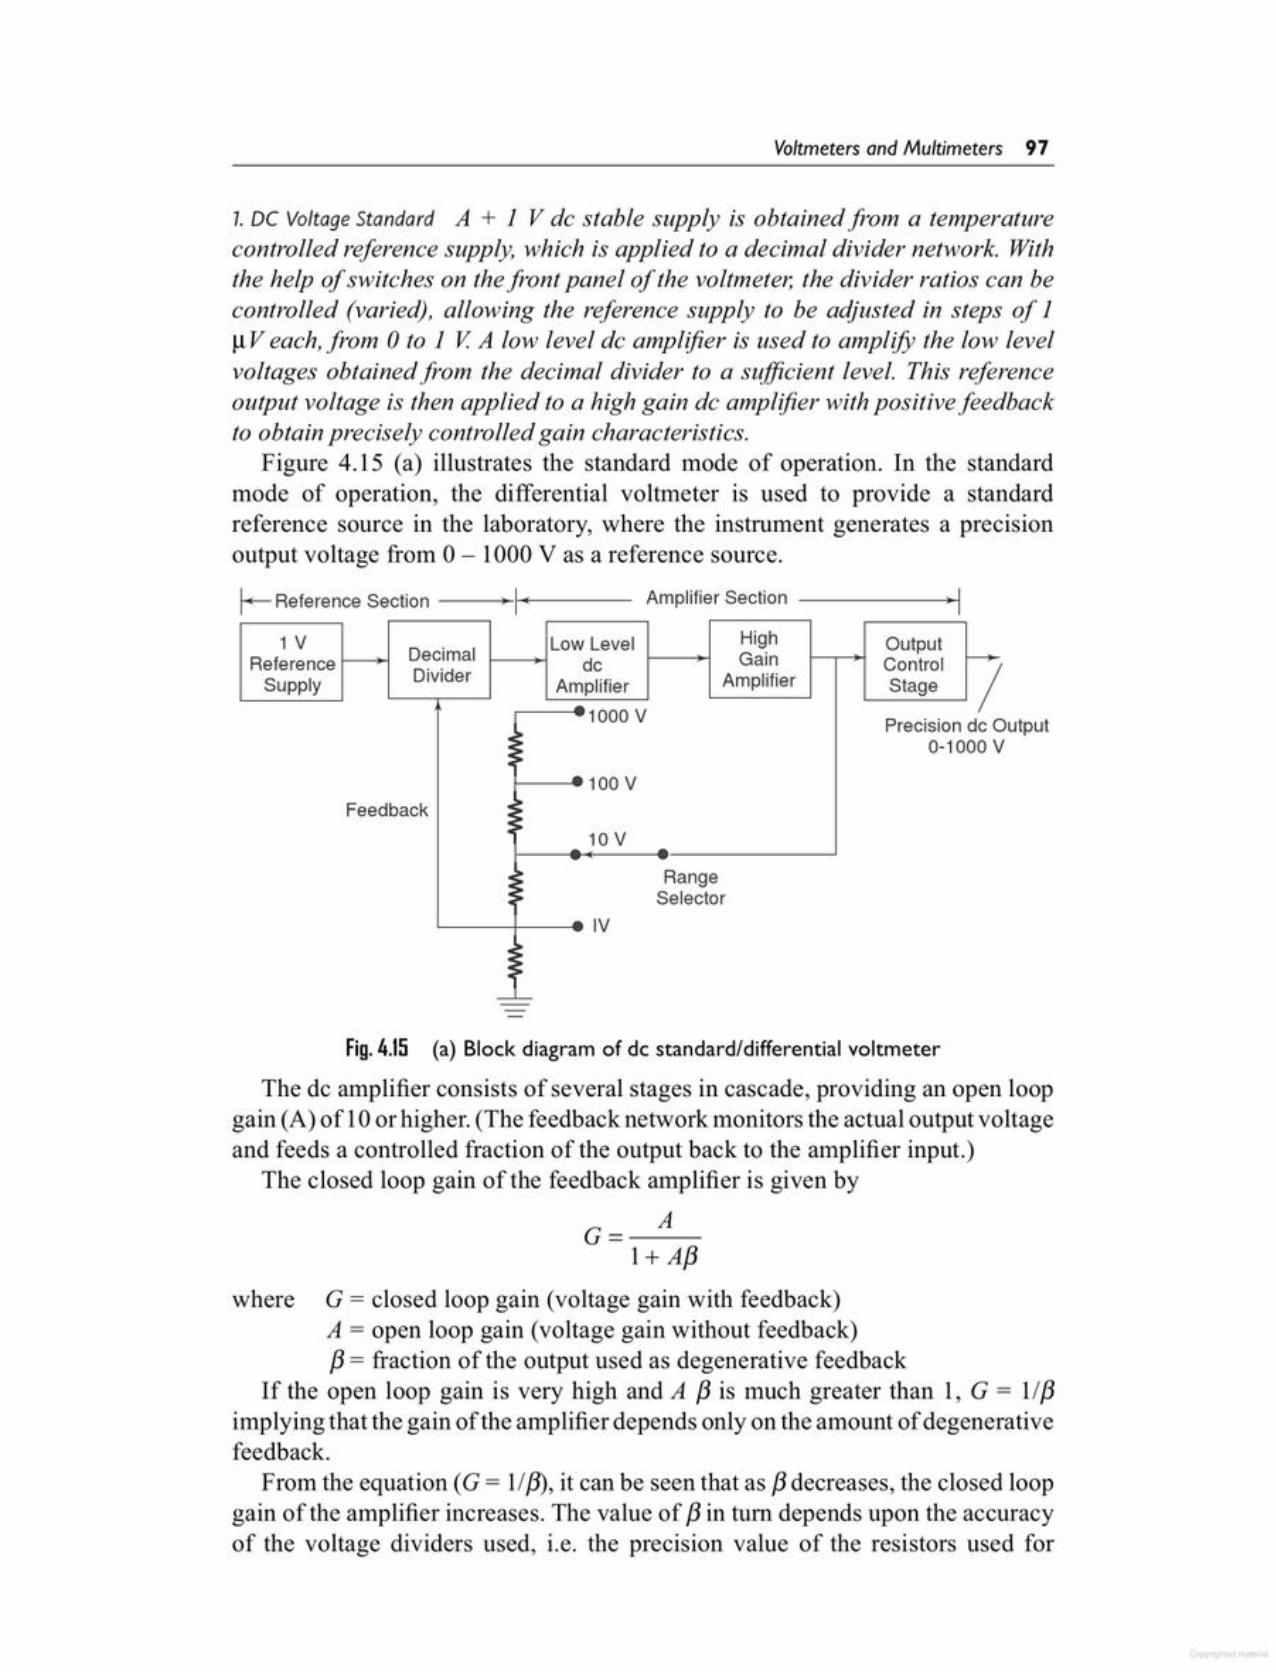
Fig. 4.15 (a) Block diagram of de standard/differential voltmeter
The de amplifier consists of several stages in cascade, providing an open loopgain (A) of 10 or higher. (The feedback network monitors the actual output voltageand feeds a controlled fraction of the output back to the amplifier input.)
The closed loop gain of the feedback amplifier is given by
G= A1+ A/3
where G = closed loop gain (voltage gain with feedback)A = open loop gain (voltage gain without feedback)/3 = fraction of the output used as degenerative feedback
If the open loop gain is very high and A f3 is much greater than 1, G = 1//3implying that the gain of the amplifier depends only on the amount of degenerativefeedback.
From the equation (G = 1//3), it can be seen that as /3 decreases, the closed loopgain of the amplifier increases. The value of /3 in turn depends upon the accuracyof the voltage dividers used, i.e. the precision value of the resistors used for
OutputV
/1 V Decimal Low Level High Output
Reference dc Gain Control ~
Supply Divider Amplifier Amplifier Stage61000 V
Precision dc:~ 0-1000::
-100 VFeedback :~::
10 V
:~ Range:: Selector
6 IV
:~::--
Amplifier Section -------+-1I--Reference Section ---++-+-----
7.DC Voltage Standard A + J V de stable supply is obtained from a temperaturecontrolled reference supply, which is applied to a decimal divider network. With. . .
the help of switches on thefront panel of the voltmeter, the divider ratios can becontrolled (varied), allowing the reference supply to be adjusted in steps of 1~V each, from 0 to 1 V A low level de amplifier is used to amplify the low levelvoltages obtainedfrom the decimal divider to a sufficient level. This referenceoutput voltage is then applied to a high gain de amplifier with positive feedbackto obtain precisely controlled gain characteristics.
Figure 4 .15 (a) illustrates the standard mode of operation. In the standardmode of operation, the differential voltmeter is used to provide a standardreference source in the laboratory, where the instrument generates a precisionoutput voltage from 0 - 1000 V as a reference source.
Voltmeters and Multimeters 97
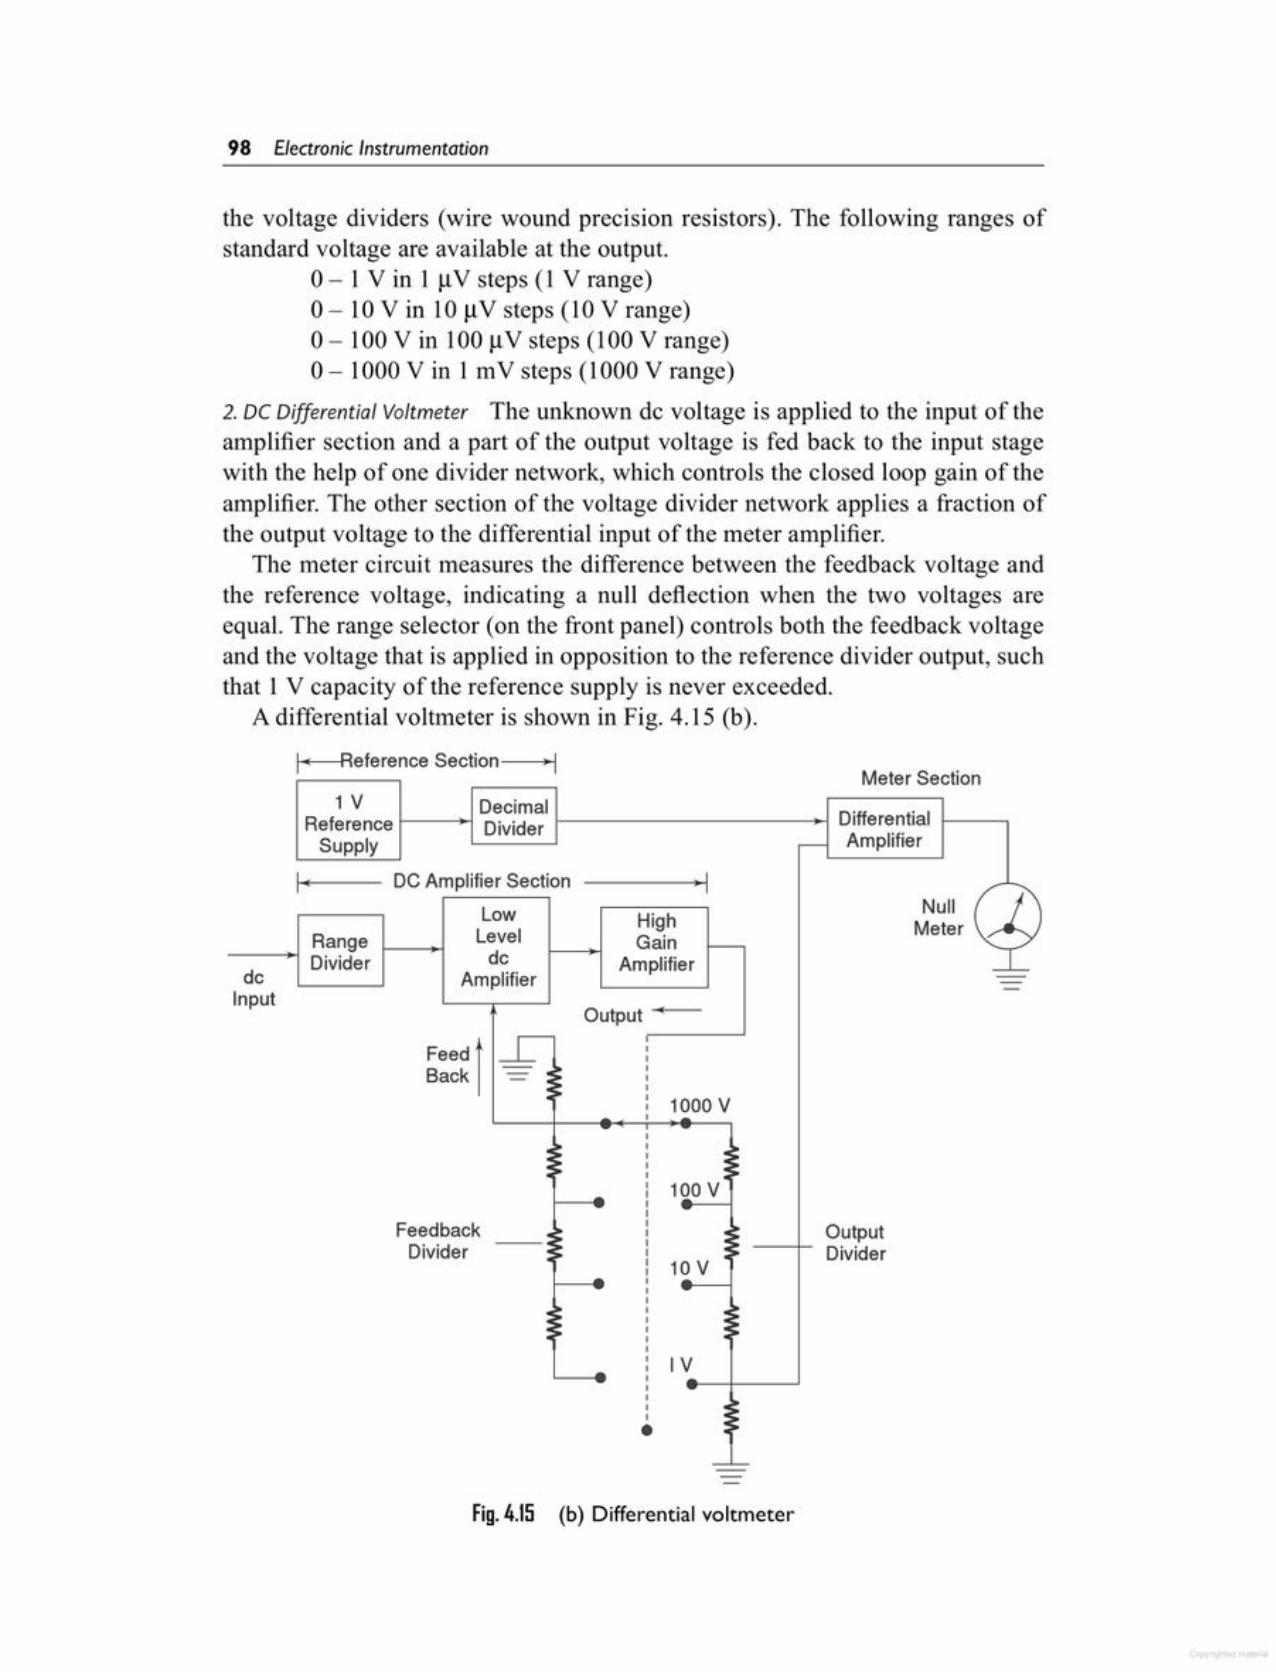
Output--+- Divider
NullMeter
Fig. 4.15 (b) Differential voltmeter
.: :;:~ • =.~12.0v'-- -
Feedback .: :;Divider :~ •:.~ 10 V •-
.: :;:: ::
- IV-:~• :~
1000 V
FeedIBack
Output,.-----'
RangeDivider
HighGain
Amplifier
:k---- DC Amplifier Section -------;...-1:
LowLeveldc
AmplifierdcInput
1 V DecimalReference I---~ Divider 1----------+-1 Differential 1----,Supply r- Amplifier
Meter SectionI • Reference Section
the voltage dividers (wire wound precision resistors). The following ranges ofstandard voltage are available at the output.
0-1 V in 1 IlV steps (1 V range)0- 10V in 10 IlV steps (10 V range)0- 100V in 100 IlV steps (100 V range)0- 1000V in 1mV steps (1000 V range)
2. DC Differential Voltmeter The unknown dc voltage is applied to the input of theamplifier section and a part of the output voltage is fed back to the input stagewith the help of one divider network, which controls the closed loop gain of theamplifier. The other section of the voltage divider network applies a fraction ofthe output voltage to the differential input of the meter amplifier.
The meter circuit measures the difference between the feedback voltage andthe reference voltage, indicating a null deflection when the two voltages areequal. The range selector (on the front panel) controls both the feedback voltageand the voltage that is applied in opposition to the reference divider output, suchthat 1V capacity of the reference supply is never exceeded.
A differential voltmeter is shown in Fig. 4.15 (b).
98 Electronic Instrumentation
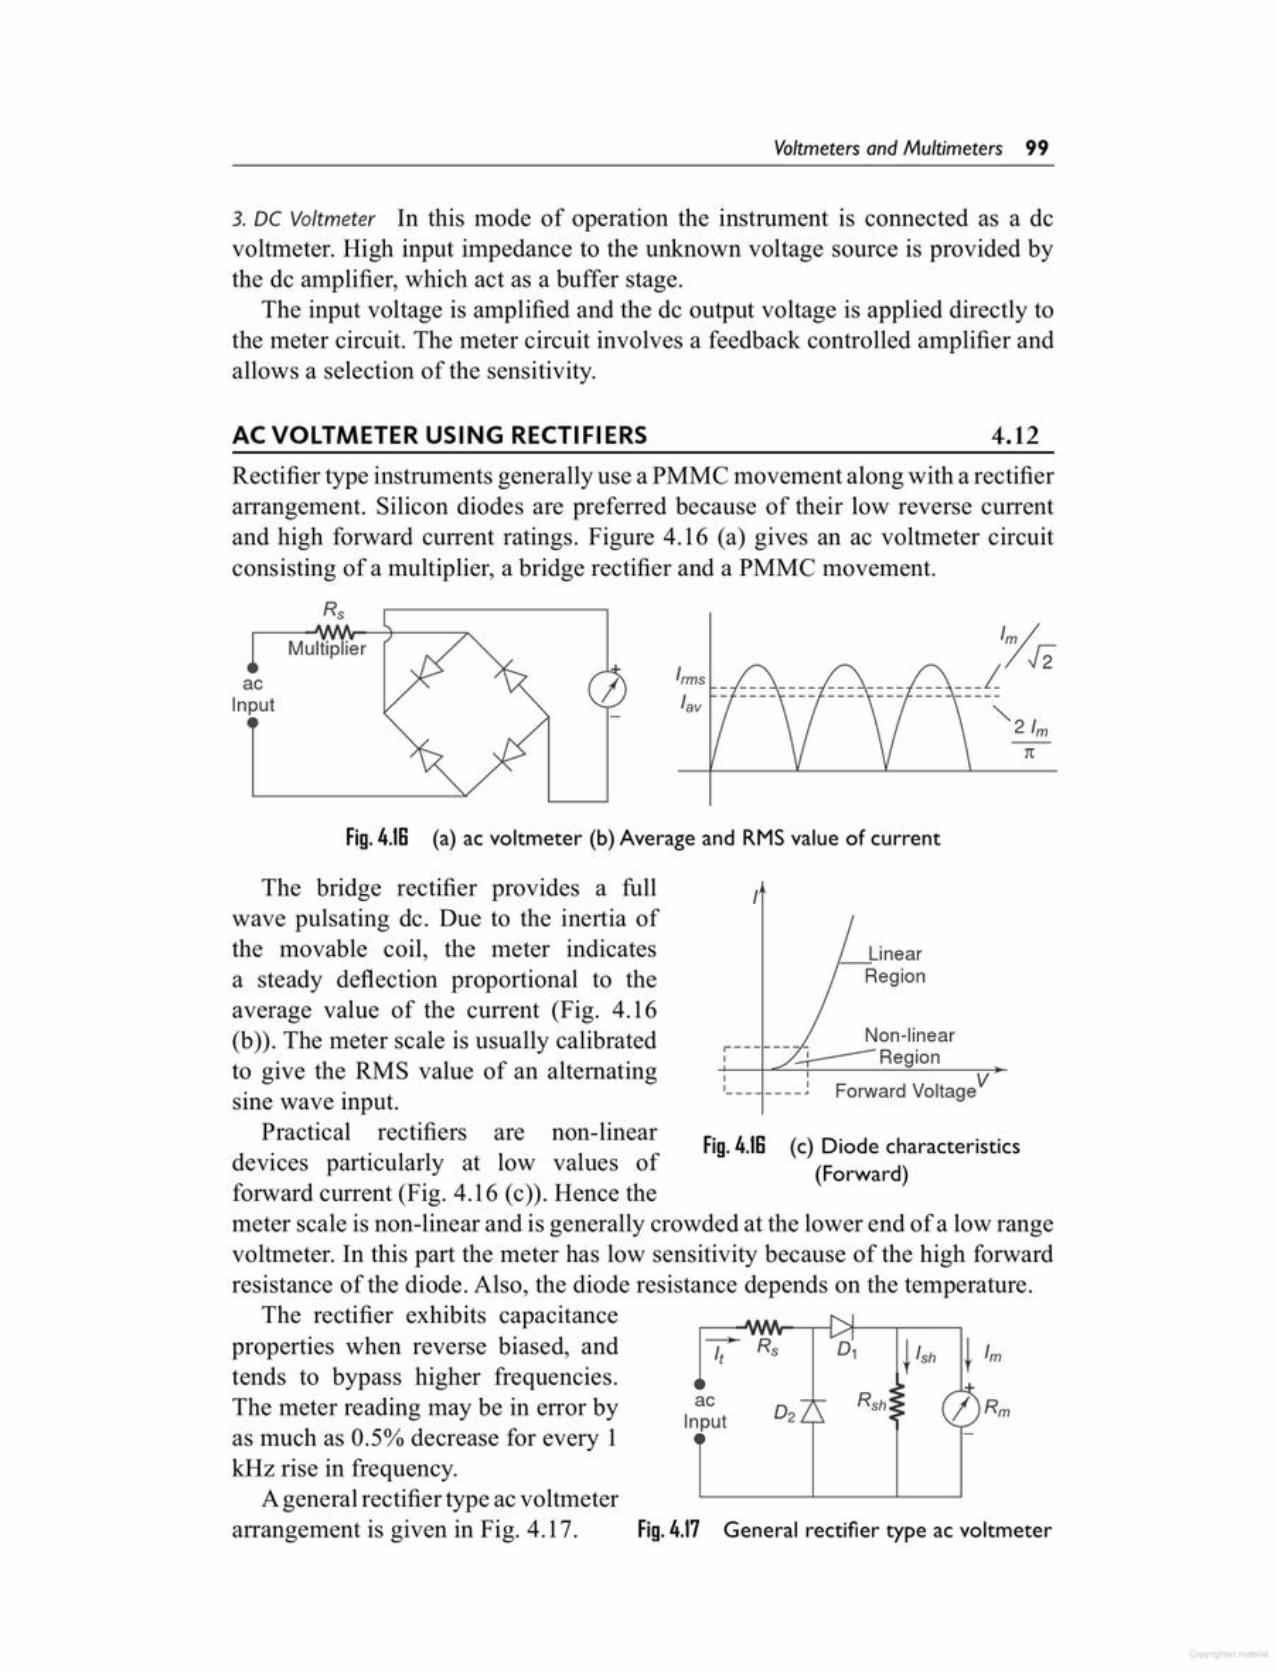
Fig. 4.17 General rectifier type ac voltmeter
acInput
(c) Diode characteristics(Forward)
Fig.4.1S
:--------- Forward VoltageV
Non-linear~------~Region
LinearRegion
IThe bridge rectifier provides a fullwave pulsating de. Due to the inertia ofthe movable coil, the meter indicatesa steady deflection proportional to theaverage value of the current (Fig. 4.16(b)). The meter scale is usually calibratedto give the RMS value of an alternatingsine wave input.
Practical rectifiers are non-lineardevices particularly at low values offorward current (Fig. 4.l6 (c)). Hence themeter scale is non-linear and is generally crowded at the lower end of a low rangevoltmeter. In this part the meter has low sensitivity because of the high forwardresistance of the diode. Also, the diode resistance depends on the temperature.
The rectifier exhibits capacitanceproperties when reverse biased, andtends to bypass higher frequencies.The meter reading may be in error byas much as 0.5% decrease for every 1kHz rise in frequency.
Ageneral rectifier type ac voltmeterarrangement is given in Fig. 4.17.
Fig.4.1S (a) ac voltmeter (b) Average and RMS value of current
-1t
Im//12
--- ---- --- ---~acInput
Rectifier type instruments generally use a PMMC movement along with a rectifierarrangement. Silicon diodes are preferred because of their low reverse currentand high forward current ratings. Figure 4.16 (a) gives an ac voltmeter circuitconsisting of a multiplier, a bridge rectifier and a PMMC movement.
4.12AC VOLTMETER USING RECTIFIERS
3. DC Voltmeter In this mode of operation the instrument is connected as a dcvoltmeter. High input impedance to the unknown voltage source is provided bythe de amplifier, which act as a buffer stage.
The input voltage is amplified and the de output voltage is applied directly tothe meter circuit. The meter circuit involves a feedback controlled amplifier andallows a selection of the sensitivity.
Voltmeters and Multimeters 99
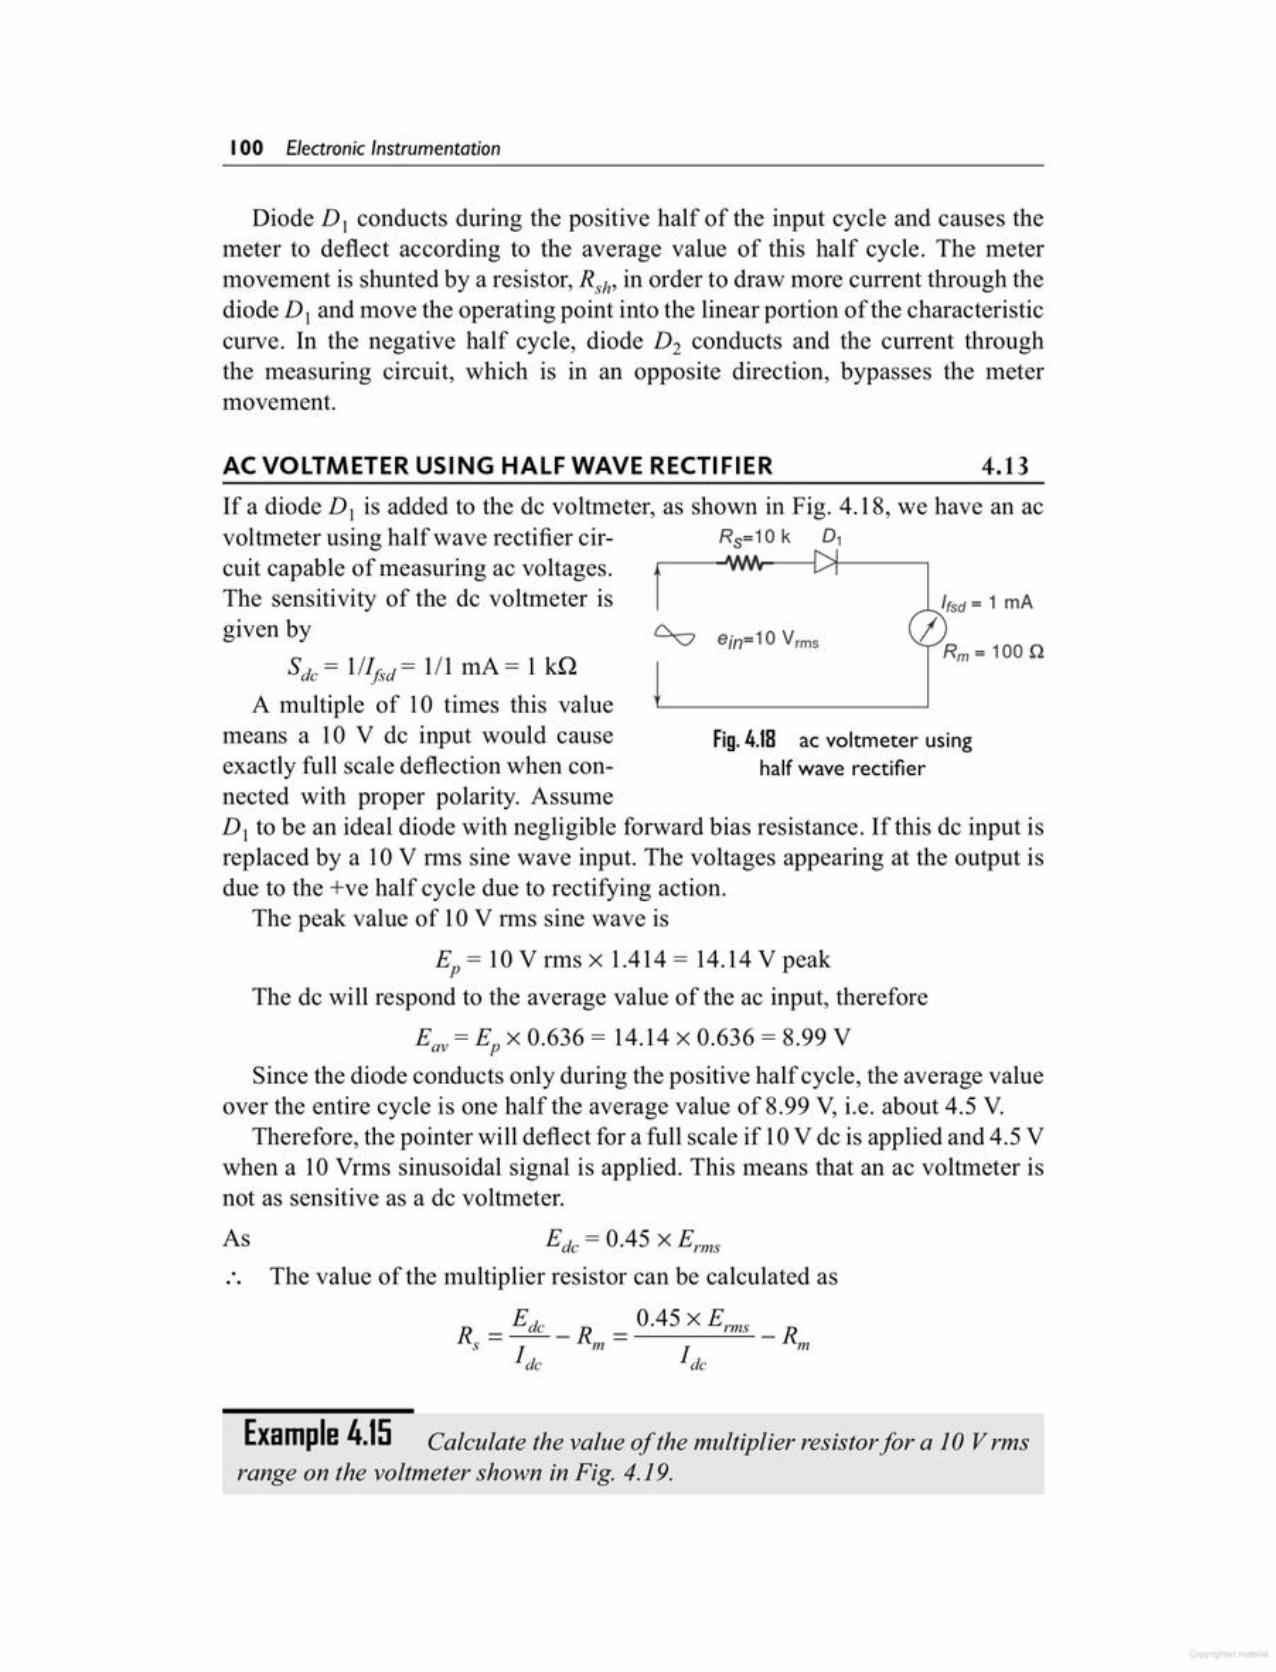
Example 4.15 Calculate the value of the multiplier resistor for a 10 Vrmsrange on the voltmeter shown in Fig. 4.19.
As Ede = 0.45 x Erms
The value of the multiplier resistor can be calculated as
Edc 0.45 x EnllsRs = -- - RI11 - Rm
Ide Ide
...
Ep = 10 V nns X 1.414 = 14.14 V peakThe de will respond to the average value of the ac input, therefore
Eav = Ep x 0.636 = 14.l4 x 0.636 = 8.99 VSince the diode conducts only during the positive half cycle, the average value
over the entire cycle is one half the average value of 8.99 V, i.e. about 4.5 V.Therefore, the pointer will deflect for a full scale if 10 V de is applied and 4.5 V
when a 10 Vrms sinusoidal signal is applied. This means that an ac voltmeter isnot as sensitive as a de voltmeter.
Fig. 4.18 ac voltmeter usinghalf wave rectifier
If a diode D, is added to the de voltmeter, as shown in Fig. 4.18, we have an acvoltmeter using half wave rectifier cir- Rs=10 k 01
cuit capable of measuring ac voltages. _:)f----,
The sensitivity of the de voltmeter isgiven by
Sde = llIjsd = III rnA = 1 kQA multiple of 10 times this value
means a 10 V de input would causeexactly full scale deflection when connected with proper polarity. AssumeD, to be an ideal diode with negligible forward bias resistance. If this dc input isreplaced by a 10 V lIDS sine wave input. The voltages appearing at the output isdue to the +ve half cycle due to rectifying action.
The peak value of 10V rms sine wave is
4.13AC VOLTMETER USING HALF WAVE RECTIFIER
Diode D, conducts during the positive half of the input cycle and causes themeter to deflect according to the average value of this half cycle. The metermovement is shunted by a resistor, Rsh' in order to draw more current through thediode D, and move the operating point into the linear portion of the characteristiccurve. In the negative half cycle, diode D2 conducts and the current throughthe measuring circuit, which is in an opposite direction, bypasses the metermovement.
100 Electronic Instrumentation
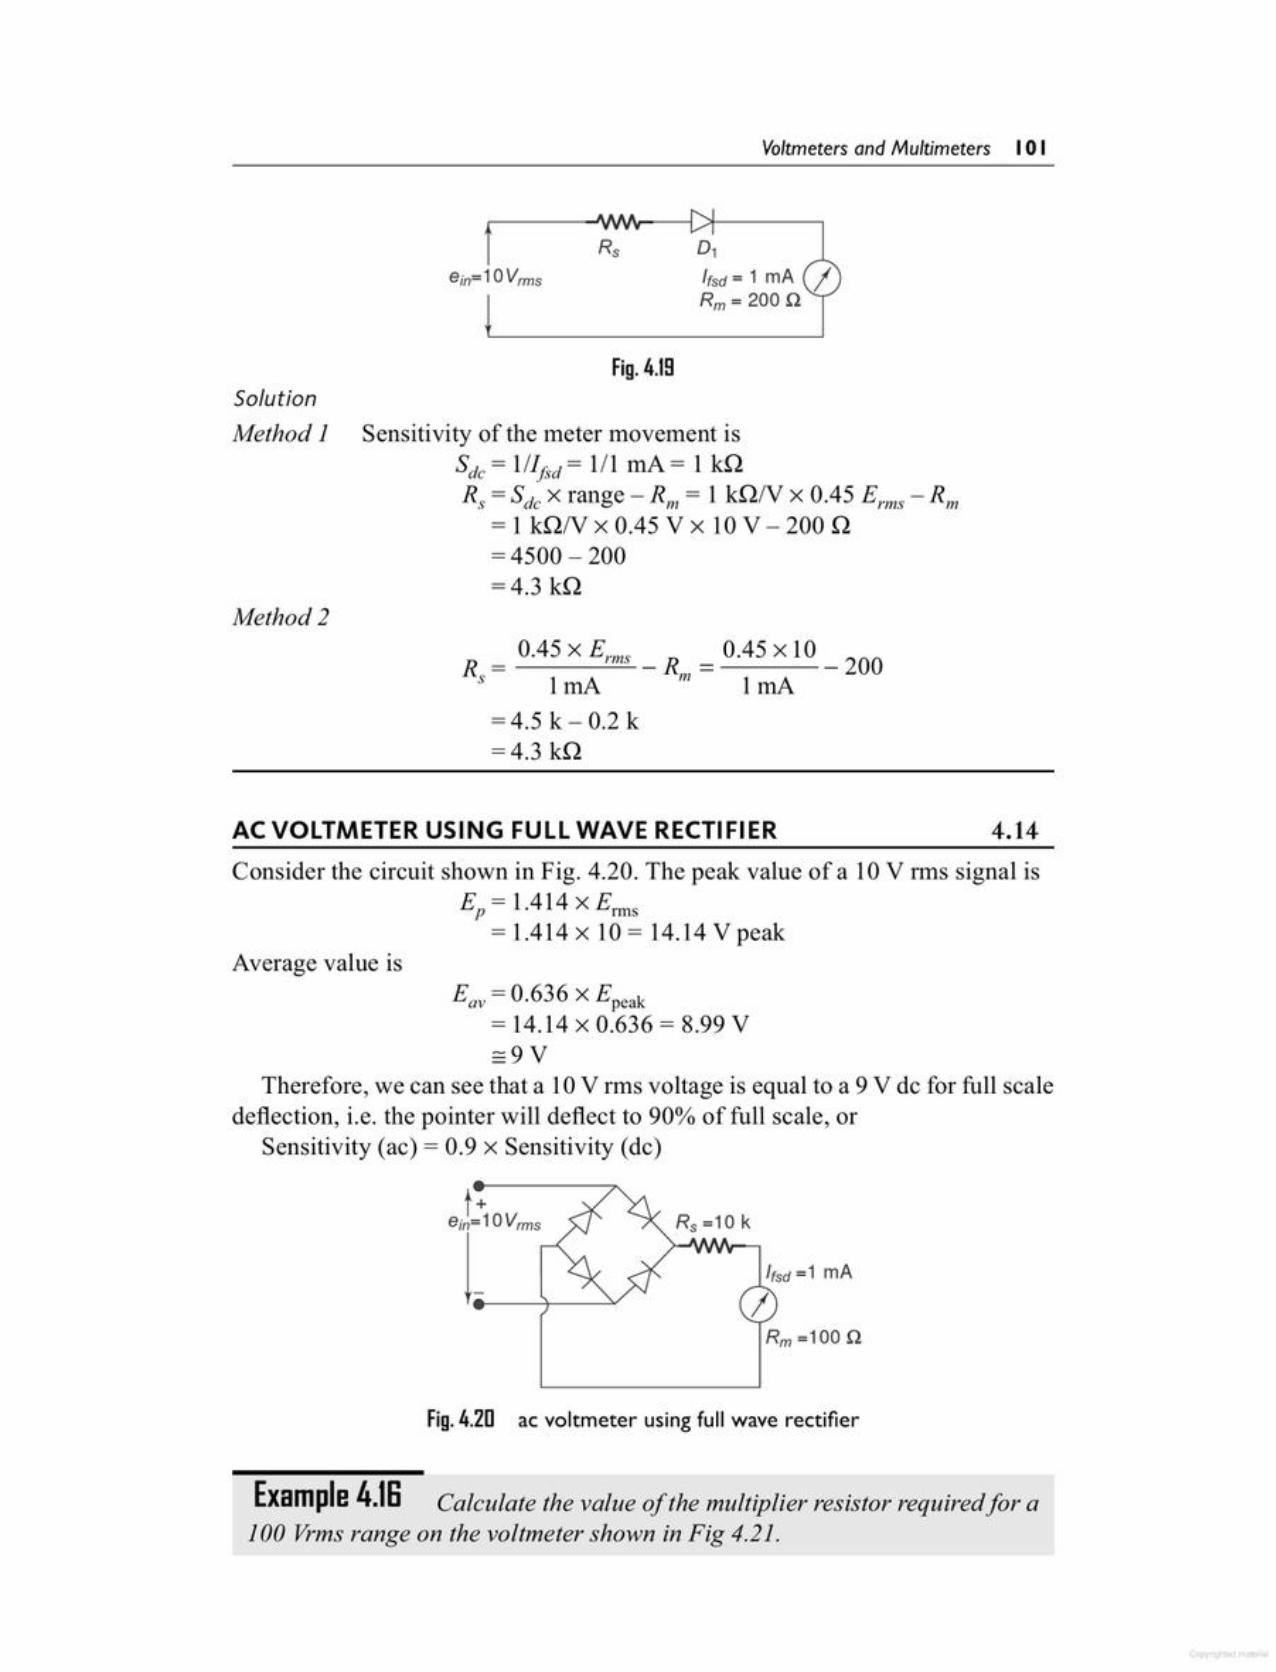
Example 4.18 Calculate the value ofthe multiplier resistor required for a100 Vrms range on the voltmeter shown in Fig 4,21.
Fig.4.2D ac voltmeter using full wave rectifier
Rm =100 n
Itsd =1 rnA
I
Rs =10 k
s.,= 0.636 x Epeak
= 14.14 x 0.636 = 8.99 V=9V
Therefore, we can see that a 10V rrns voltage is equal to a 9 V de for full scaledeflection, i.e. the pointer will deflect to 90% of full scale, or
Sensitivity (ac) = 0.9 x Sensitivity (de)
Average value is
Consider the circuit shown in Fig. 4.20. The peak value of a 10 V rms signal isEp = 1.414 x Erms
= 1.414 x 10 = 14.14 V peak
4.14AC VOLTMETER USING FULL WAVE RECTIFIER
0.45 x Erms 0.45 x 10R = - Rm = - 200sImA ImA=4.5 k- 0.2 k=4.3 kQ
Method 2
SolutionMethod 1 Sensitivity of the meter movement is
Sdc = 111[sd= III rnA = 1 kQR,= Sdc x range - Rm = 1 kQN x 0.45 Erms - Rm
= 1 kQN x 0.45 V x 10 V - 200 Q=4500 - 200=4.3 kQ
Fig.4.19
01
i{sd = 1 rnA IRm = 200 n
Voltmeters and Multimeters 101
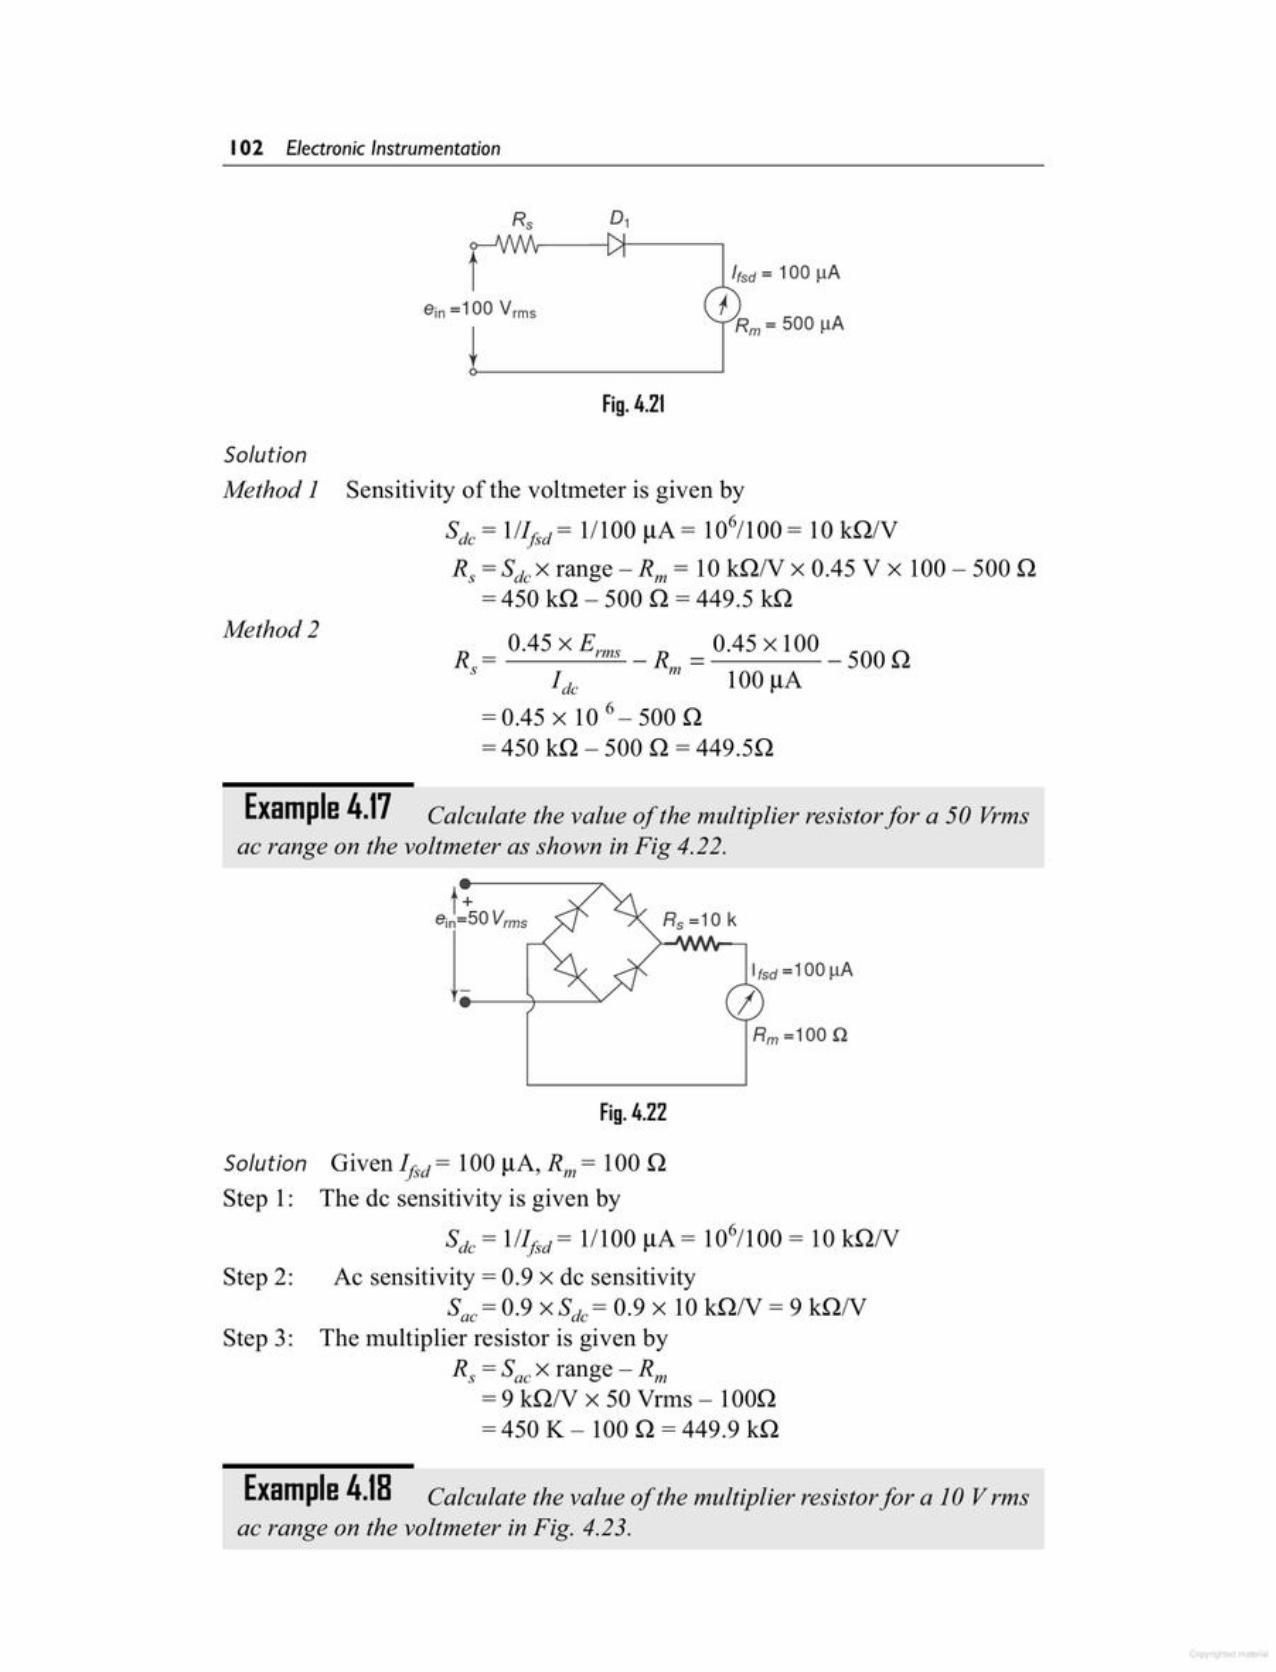
Example 4.18 Calculate the value of the multiplier resistor for a 10 Vrmsac range on the voltmeter in Fig. 4.23.
Solution Given Iffd = 100 JlA, Rm = 100 ,QStep 1: The de sensitivity is given by
Sdc = l/If~d= 1/100 JlA= 106/100 = 10 k,Q/VStep 2: Ae sensitivity = 0.9 x de sensitivity
Sac = 0.9 X Sdc = 0.9 x 10 k,Q/V = 9 k,Q/VStep 3: The multiplier resistor is given by
R, = Sac X range - Rm= 9 k,Q/V x 50 Vrms - lOO,Q=450 K - 100,Q = 449.9 k,Q
Fig. 4.22
Rm=100n
Example 4.17 Calculate the value of the multiplier resistor for a 50 Vrmsac range on the voltmeter as shown in Fig 4.22.
Method 2
Sensitivity of the voltmeter is given by
Sdc = l/Ijsd= 1/100 JlA= 106/100= 10 k,Q/VR, =SdcX range - Rm = 10 k,Q/V x 0.45 V x 100 - 500,Q
= 450 k,Q - 500 ,Q = 449.5 k,Q
R = 0.45 x Erms _ R = 0.45 x 100 _ 500,Qs I m 100 Ade Jl= 0.45 x 10⁶ - 500 ,Q=450 k,Q - 500,Q = 449.5,Q
SolutionMethod 1
Fig. 4.21
ein =100 V rms
I'Sd = 100 IlA
fRm = 500 IlA
102 Electronic Instrumentation
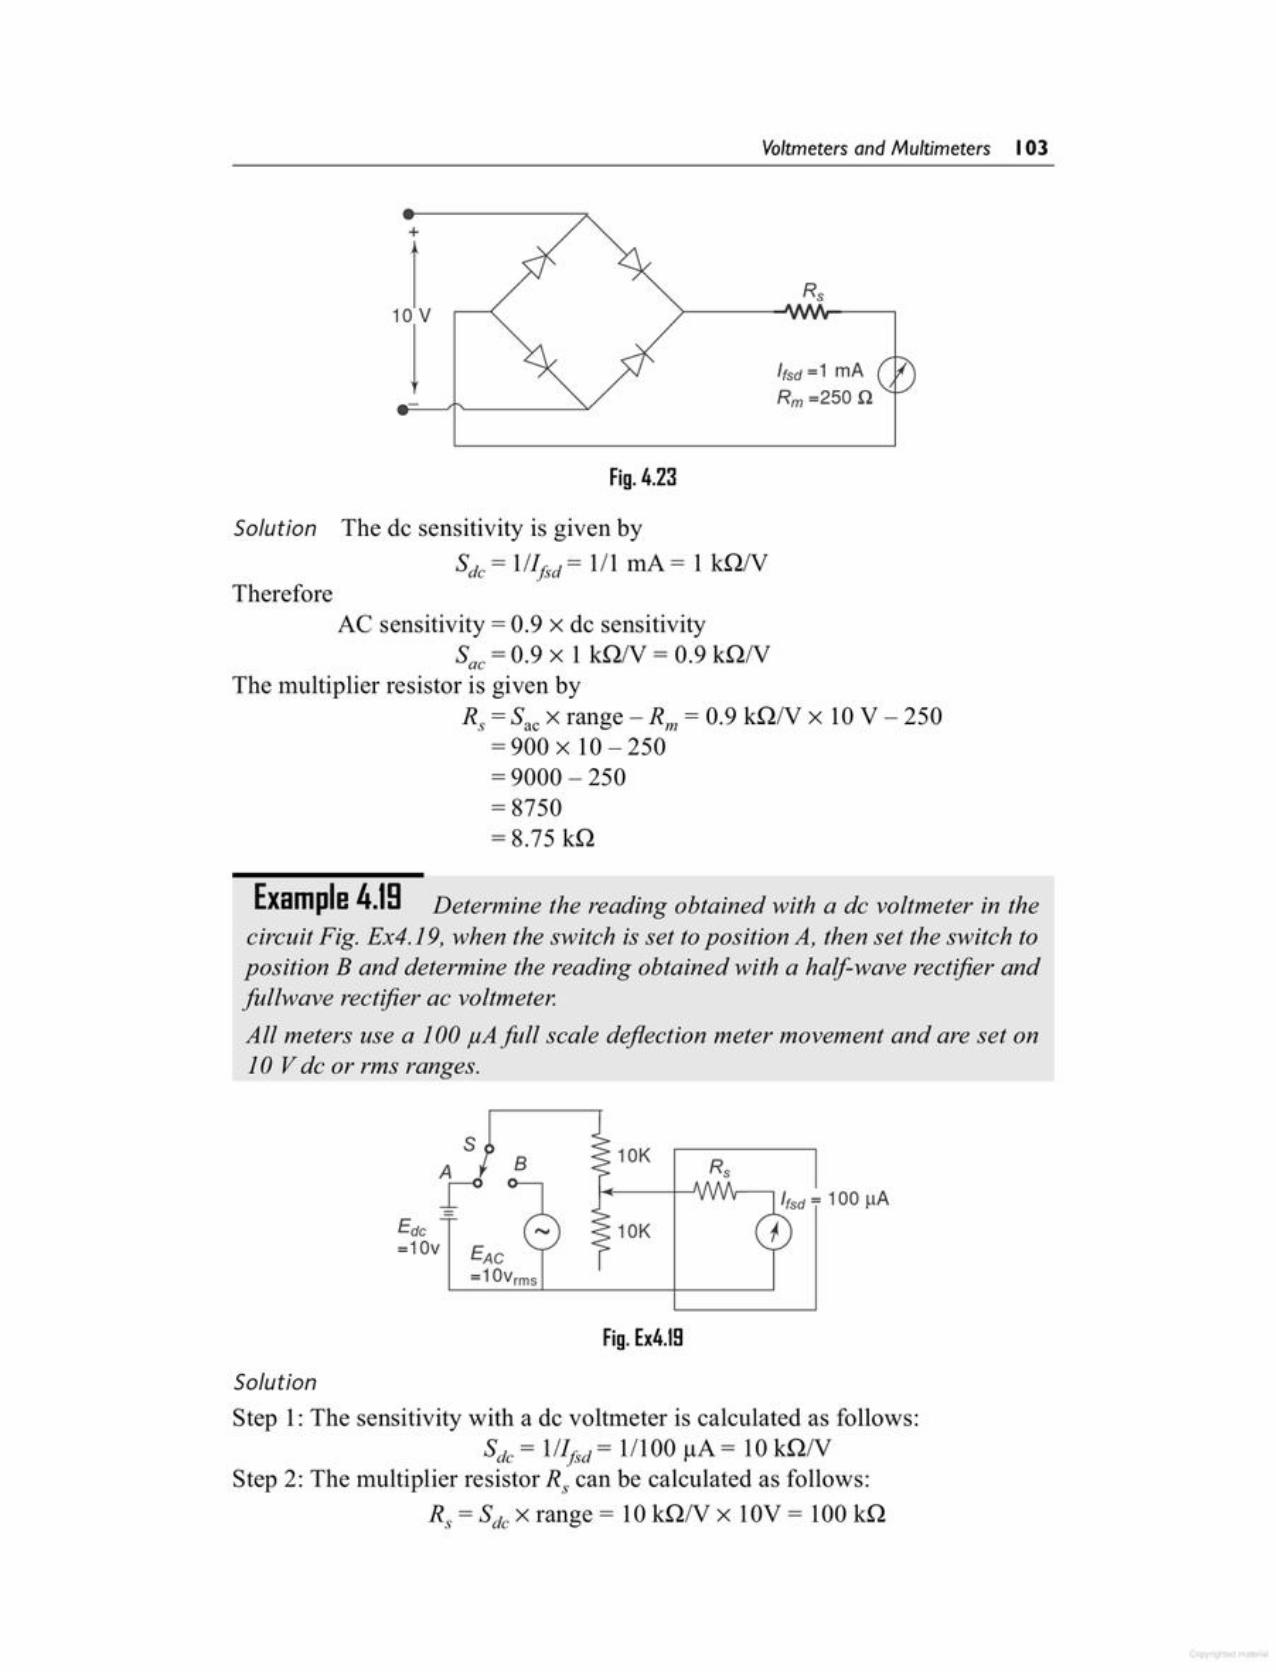
SolutionStep 1:The sensitivity with a de voltmeter is calculated as follows:
Sdc= lIIf~d= 1/100 j.tA= 10knNStep 2: The multiplier resistor R, can be calculated as follows:
R, = Sdc x range = 10 kQ/V x 10V = 100 kQ
Fig. Ex4.19
S 10K8 Rs
=Edc 10K=10v EAC
=1OVrms
Example 4.19 Determine the reading obtained with a de voltmeter in thecircuit Fig. Ex4.19, when the switch is set to position A, then set the switch toposition B and determine the reading obtained with a half-wave rectifier andfullwave rectifier ac voltmeter.All meters use a 100 JiAfull scale deflection meter movement and are set on10 V de or rms ranges.
AC sensitivity =0.9 x de sensitivitySac = 0.9 x 1 killV = 0.9 kQ/V
The multiplier resistor is given byR, =Sac x range -Rm = 0.9 kQN x 10V - 250
=900 x 10 - 250= 9000 - 250= 8750= 8.75 kQ
Therefore
Solution The de sensitivity is given bySdc = 11Ijsd= III rnA = 1 kQ/V
Fig. 4.23
Ifsd =1 mARm=250 n
+
,1j
Voltmeters and Multimeters 103
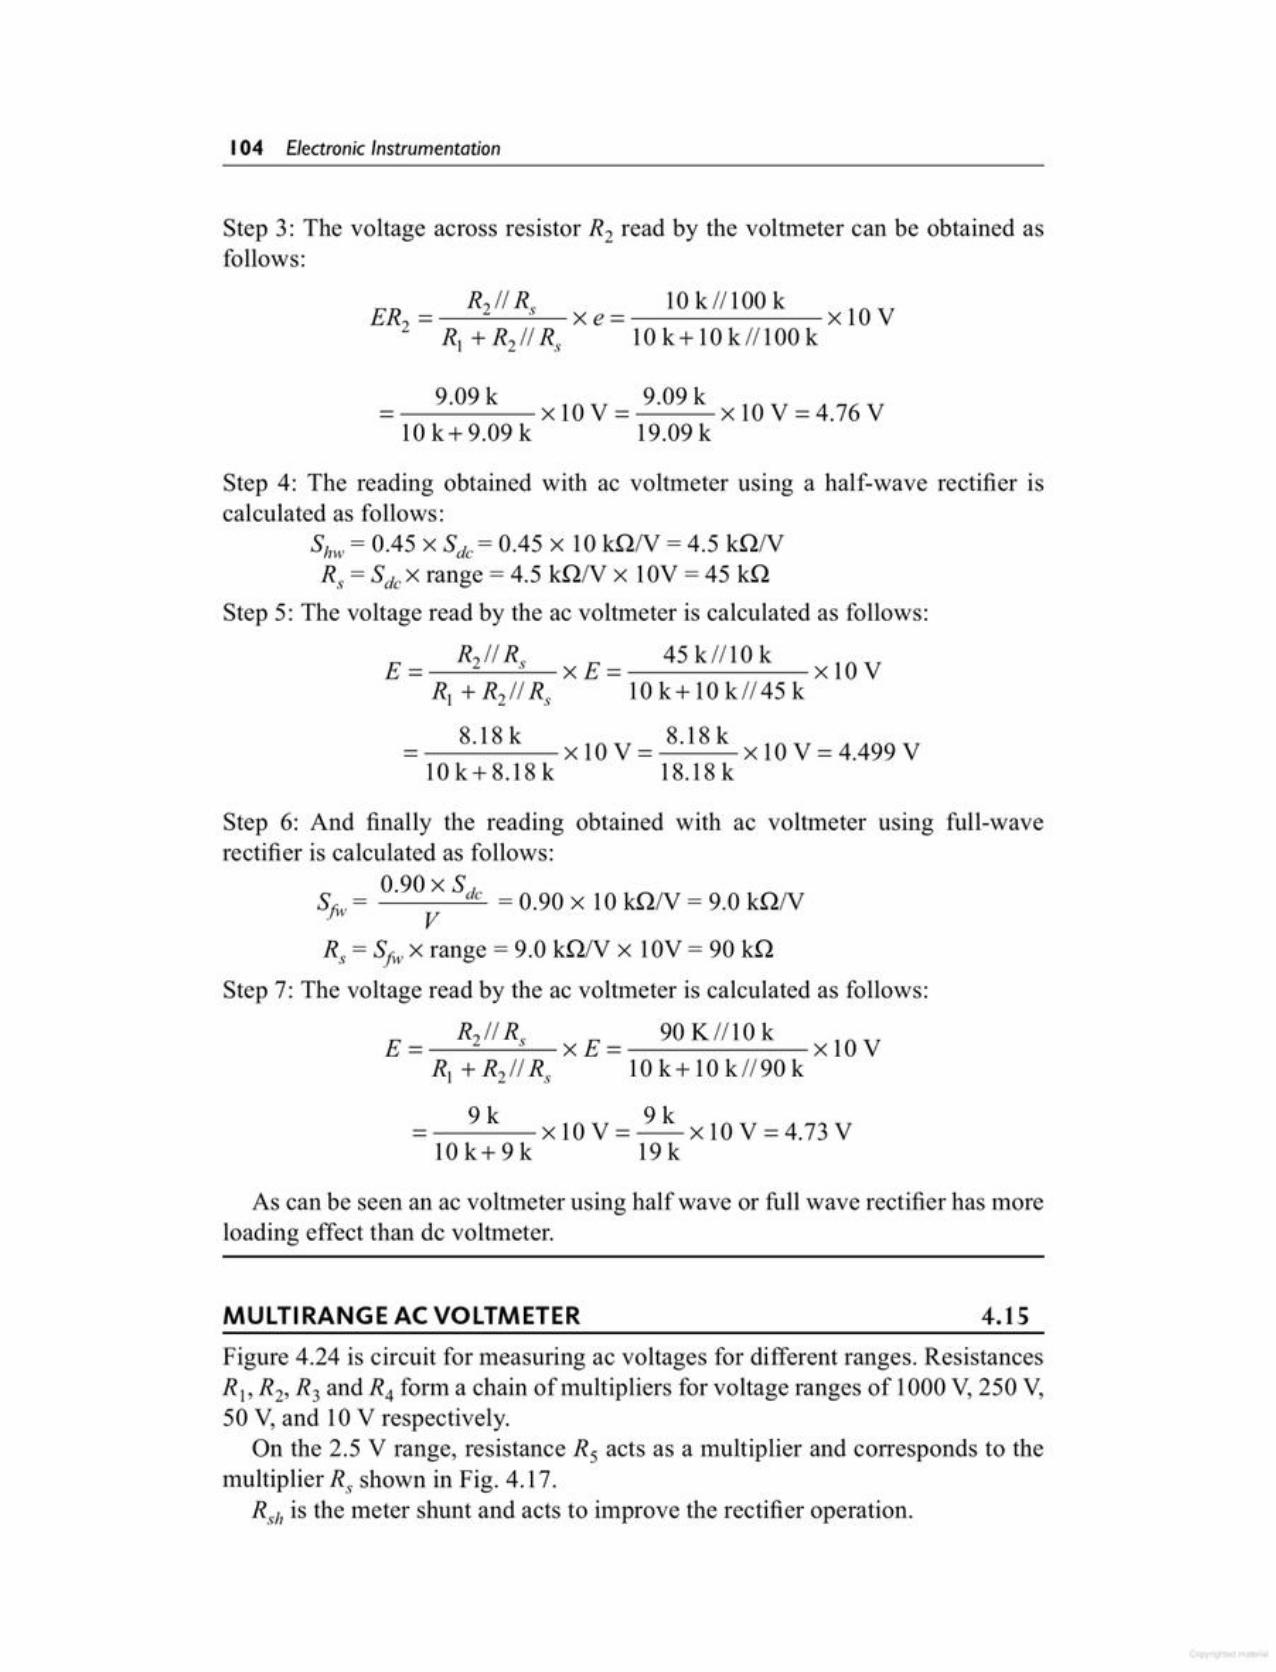
Figure 4.24 is circuit for measuring ac voltages for different ranges. ResistancesR1, Rz, R3 and R4 form a chain of multipliers for voltage ranges of 1000 V, 250 V,50 V, and 10 V respectively.
On the 2.5 V range, resistance R5 acts as a multiplier and corresponds to themultiplierx, shown in Fig. 4.17.
Rsh is the meter shunt and acts to improve the rectifier operation.
4.15MULTIRANGE AC VOLTMETER
As can be seen an ac voltmeter using half wave or full wave rectifier has moreloading effect than de voltmeter.
Step 6: And finally the reading obtained with ac voltmeter using full-waverectifier is calculated as follows:
Sfw = 0.90 X Sdc = 0.90 x 10 kQ/V = 9.0 kQNV
R, = Sfw x range = 9.0 kQ/V x 10V = 90 kQ
Step 7: The voltage read by the ac voltmeter is calculated as follows:
E= Rzi/Rs xE= 90KII10k xlOVR, + R2/1 s, 10 k + 10 k/190 k
9 k x 10 V = 9 k x 10 V = 4.73 VIOk+9k 19k
Step 4: The reading obtained with ac voltmeter using a half-wave rectifier iscalculated as follows:
Shw = 0.45 X Sdc = 0.45 x 10 kQN = 4.5 kQ/VR, = SdcX range = 4.5 kQ/V x 10V = 45 kQ
Step 5: The voltage read by the ac voltmeter is calculated as follows:
Rzi/ n, 45 kl/lO kE= xE= x10V
R, + Rz /1R, 10 k + 10 k /145 k
8.18 k x 10 V = 8.18 k x 10 V = 4.499 V10k+8.18k 18.18k
9.09k x10V= 9.09k x10V=4.76V10 k+ 9.09 k 19.09 k
ER z__ Rz// Rs 10 k 1/100 kxe= x10V
R, + R211s, 10 k+ 10 kll100 k
Step 3: The voltage across resistor Rz read by the voltmeter can be obtained asfollows:
104 Electronic Instrumentation
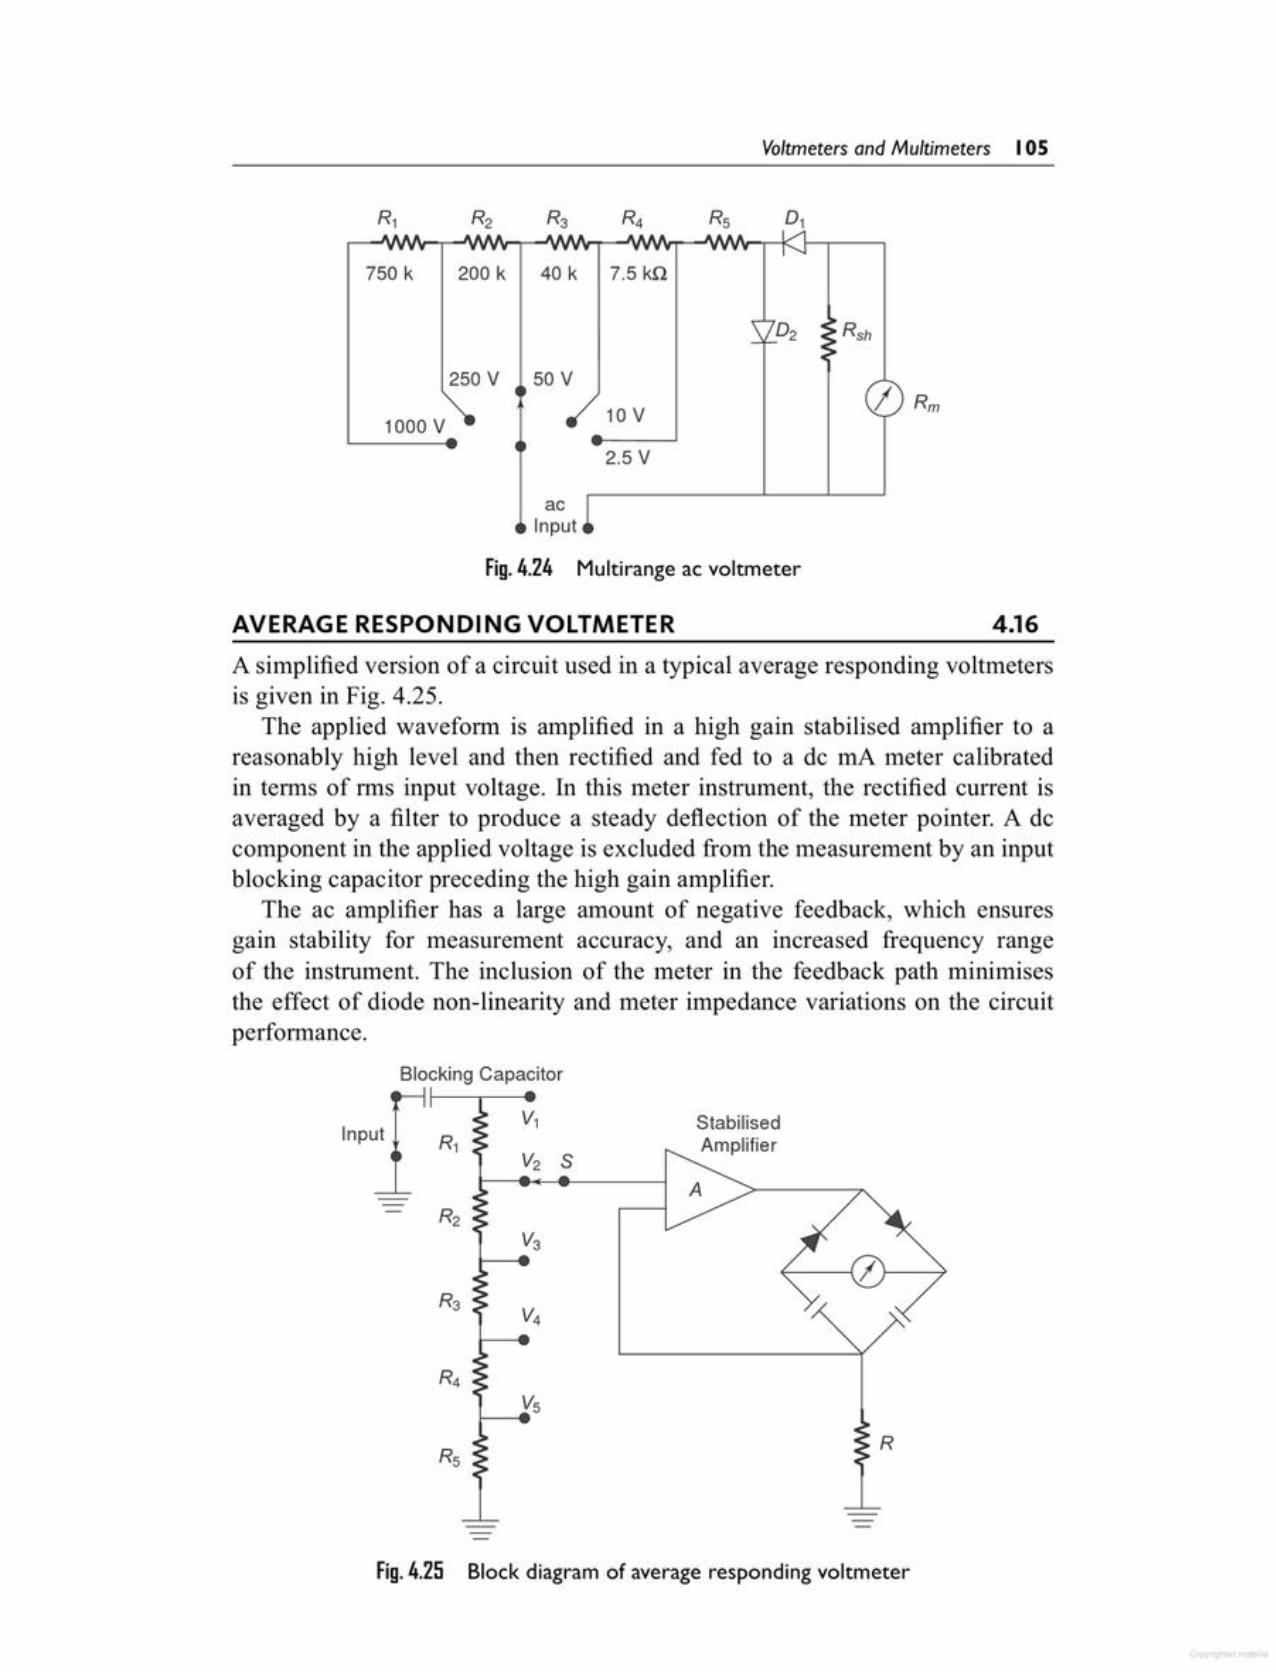
Block diagram of average responding voltmeter
R
Fig. 4.25
Rs
sStabilisedAmplifierInput
Blocking Capacitor
A simplified version of a circuit used in a typical average responding voltmetersis given in Fig. 4.25.
The applied waveform is amplified in a high gain stabilised amplifier to areasonably high level and then rectified and fed to a de InA meter calibratedin terms of rms input voltage. In this meter instrument, the rectified current isaveraged by a filter to produce a steady deflection of the meter pointer. A decomponent in the applied voltage is excluded from the measurement by an inputblocking capacitor preceding the high gain amplifier.
The ac amplifier has a large amount of negative feedback, which ensuresgain stability for measurement accuracy, and an increased frequency rangeof the instrument. The inclusion of the meter in the feedback path minimisesthe effect of diode non-linearity and meter impedance variations on the circuitperformance.
4.16AVERAGE RESPONDING VOLTMETER
acInput
Fig. 4.24 Multirange ac voltmeter
2.5 V
10 V1000 V
250 V 50 V
750 k 200 k 40 k 7.5 kn
Voltmeters and Multimeters 105

Figure 4.26 (a) shows a de coupled peak voltmeter, in which the capacitorcharges to the total peak voltage above ground reference. In this case the meterreading will be affected by the presence of de with ac voltage.
In Fig. 4.26 (b), an ac coupled peak voltmeter circuit is shown. In both thecircuits, the capacitor discharges very slowly through the high impedance inputof the dc amplifier, so that a negligible small amount of current supplied by thecircuit under test keeps the capacitor charged to the peak ac voltage. The deamplifier is used in the peak responding meter to develop the necessary metercurrent.
The primary advantage of a peak responding voltmeter is that the rectifyingdiode and the storage capacitor may be taken out of the instrument and placedin the probe when no ac pre-amplification is required. The measured ac signalthen travels no farther than the diode. The peak responding voltmeter is thenable to measure frequencies of up to 100s of MHz with a minimum of circuitloading. The disadvantage of peak responding voltmeters is the error causeddue to harmonic distortion in the input waveforms and limited sensitivity of theinstrument because of imperfect diode characteristics.
Fig. 4.28 Peak responding voltmeter
(b)(a)
deAmplifier
The basic difference between peak responding voltmeters and average respondingvoltmeters is the use of storage capacitors with the rectifying diode in the formercase. The capacitor charges through the diode to the peak value of the appliedvoltage and the meter circuit then responds to the capacitor voltage.
The two most common types of peak responding voltmeters are given in Figs4.26 (a) and (b).
4.17PEAK RESPONDING VOLTMETER
Capacitors in the meter circuit tend to act as storage or filter capacitors for therectifier diodes as well as coupling capacitors for the feedback signal. The diodesacts as switches to maintain unidirectional meter current despite changes in theinstantaneous polarity of the input voltage.
Errors in the reading of an average responding voltmeter may be due to theapplication of complex waveforms, i.e. a distorted or nonsinusoidal input or thepresence of hum or noise.
The accuracy with which an average responding voltmeter indicates the rmsvalue of a wave with harmonic content depends not only on the amplitude of theharmonic but also on the phase.
106 Electronic Instrumentation

There exists a fundamental difference between the readings on a normal ac meterand on a true rms meter. The first uses a D' Arsonval movement with a full or halfwave rectifier, and averages the values of the instantaneous rectified current.
4.19TRUE RMS METER
Fig.4.27 True RMS voltmeter (Block diagram)
The effect of non-linear behaviour of the thermocouple in the input circuit(measuring thermocouple) is cancelled by similar non-linear effects of thethermocouple in the feedback circuit (balancing thermocouple). The two couplesform part of a bridge in the input circuit of a de amplifier.
The unknown ac voltage is amplified and applied to the heating element of themeasuring thermocouple. The application of heat produces an output voltage thatupsets the balance of the bridge.
The de amplifier amplifies the unbalanced voltage; this voltage is fed back tothe heating element of the balancing thermocouple, which heats the thermocouple,so that the bridge is balanced again, i.e. the outputs of both the thermocouplesare the same. At this instant, the ac CUITentin the input thermocouple is equalto the dc current in the heating element of the feedback thermocouple. This decurrent is therefore directly proportional to the effective or rms value of the inputvoltage, and is indicated by the meter in the output circuit of the dc amplifier. Ifthe peak amplitude of the ac signal does not exceed the dynamic range of the acamplifier, the true lIDS value of the ac signal can be measured independently.
BalancingThermocouple
I_______ J
acAmplifier
dcAmplifier
acInput
Voltage 0---1L__ __j-t-, .:1--./,,
Same Thermal :Environment -:-,,,,,
•
MeasuringThermocouple,-----, ,---- ---------- ,.------,
Complex waveform are most accurately measured with an rms voltmeter. Thisinstrument produces a meter indication by sensing waveform heating power,which is proportional to the square of the nns value of the voltage. This heatingpower can be measured by amplifying and feeding it to a thermocouple, whoseoutput voltages is then proportional to the Erms'
However, thermocouples are non-linear devices. This difficulty can beovercome in some instruments by placing two thermocouples in the same thermalenvironment.
Figure 4.27 shows a block diagram of a true rms responding voltmeter.
TRUE RMS VOLTMETER 4.18
Voltmeters and Multimeters 107
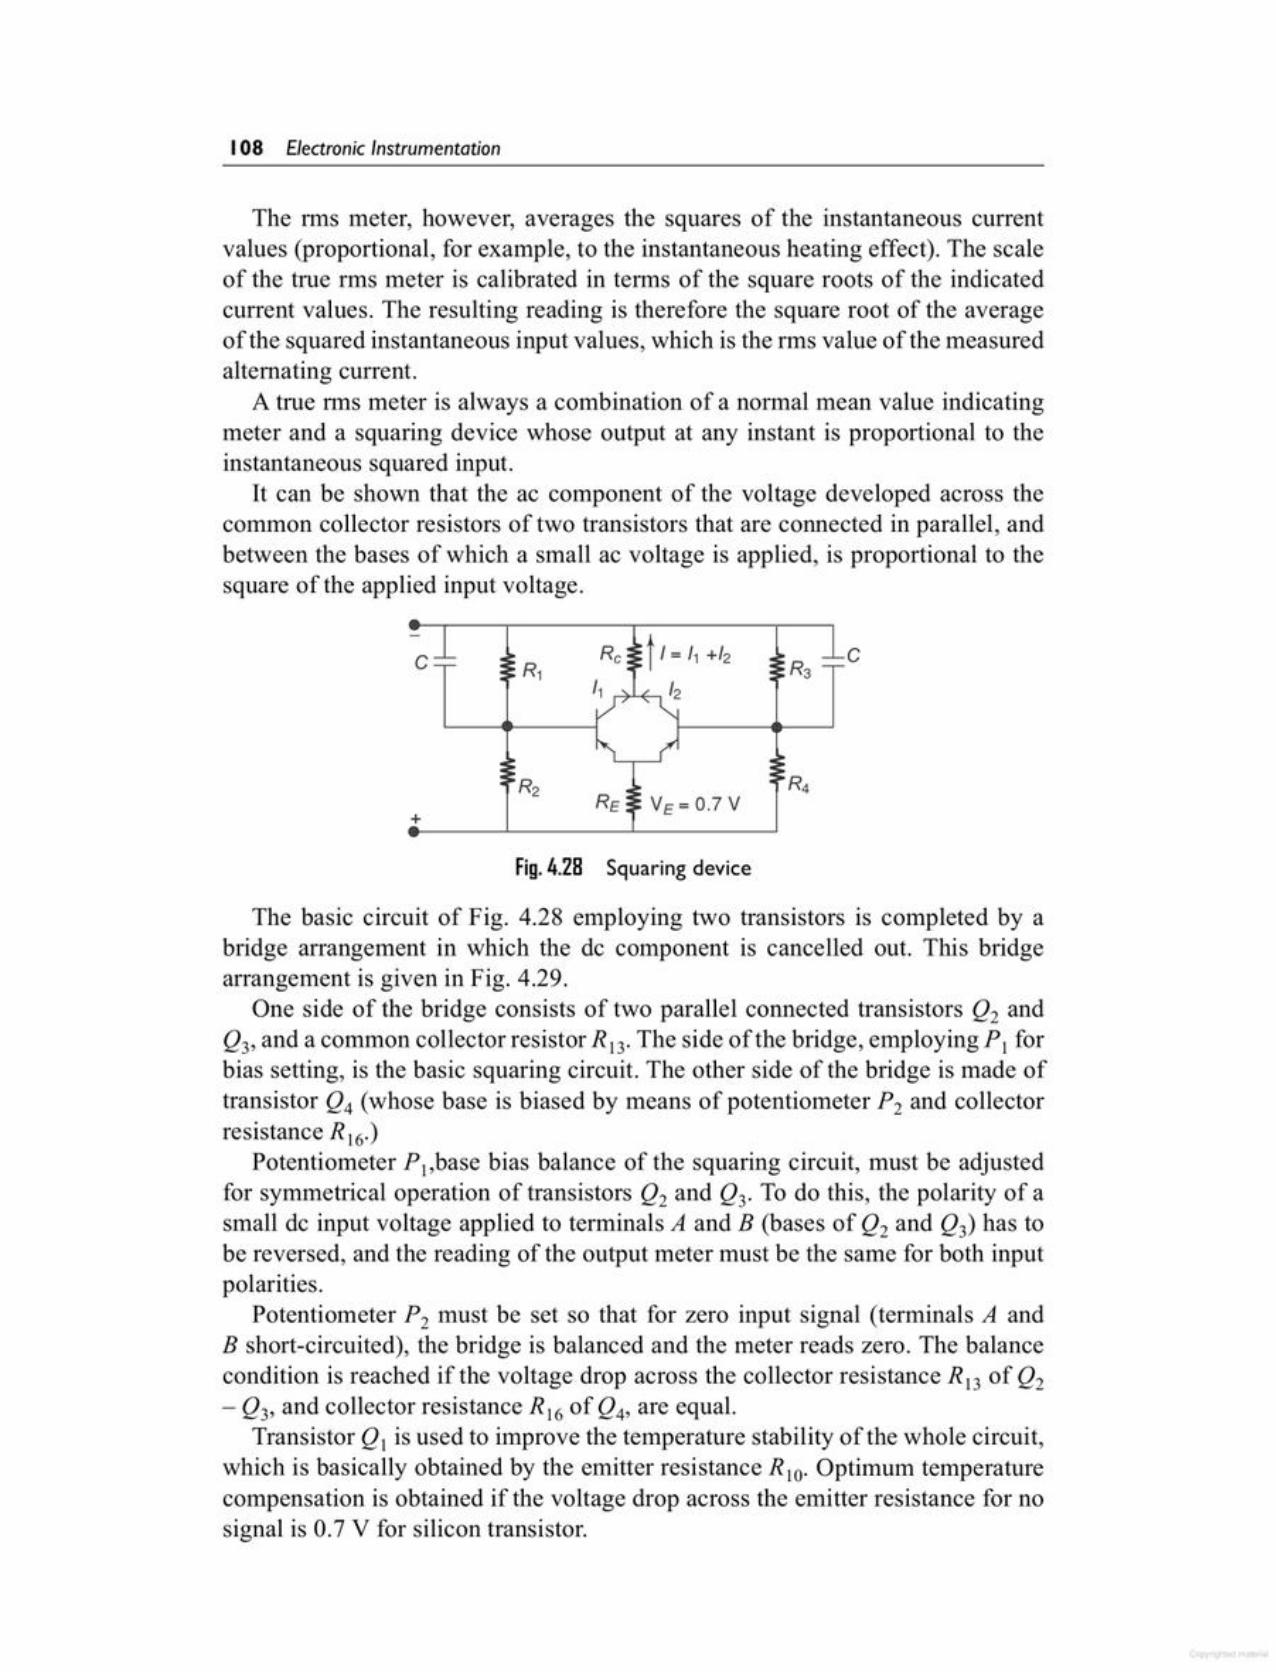
The basic circuit of Fig. 4.28 employing two transistors is completed by abridge arrangement in which the de component is cancelled out. This bridgearrangement is given in Fig. 4.29.
One side of the bridge consists of two parallel connected transistors Q2 andQ3' and a common collector resistor RJ3. The side of the bridge, employing P, forbias setting, is the basic squaring circuit. The other side of the bridge is made oftransistor Q4 (whose base is biased by means of potentiometer P2 and collectorresistance R 16')
Potentiometer P),base bias balance of the squaring circuit, must be adjustedfor symmetrical operation of transistors Q2 and Q3' To do this, the polarity of asmall de input voltage applied to terminals A and B (bases of Q2 and Q3) has tobe reversed, and the reading of the output meter must be the same for both inputpolarities.
Potentiometer P2 must be set so that for zero input signal (terminals A andB short-circuited), the bridge is balanced and the meter reads zero. The balancecondition is reached if the voltage drop across the collector resistance R 13of Q2- Q3' and collector resistance R)6 of Q4' are equal.
Transistor QI is used to improve the temperature stability of the whole circuit,which is basically obtained by the emitter resistance RIO' Optimum temperaturecompensation is obtained if the voltage drop across the emitter resistance for nosignal is 0.7 V for silicon transistor.
Fig.4.28 Squaring device
+
cc
The rms meter, however, averages the squares of the instantaneous currentvalues (proportional, for example, to the instantaneous heating effect). The scaleof the true rms meter is calibrated in terms of the square roots of the indicatedcurrent values. The resulting reading is therefore the square root of the averageof the squared instantaneous input values, which is the rms value of the measuredalternating current.
A true nns meter is always a combination of a normal mean value indicatingmeter and a squaring device whose output at any instant is proportional to theinstantaneous squared input.
It can be shown that the ac component of the voltage developed across thecommon collector resistors of two transistors that are connected in parallel, andbetween the bases of which a small ac voltage is applied, is proportional to thesquare of the applied input voltage.
108 Electronic Instrumentation
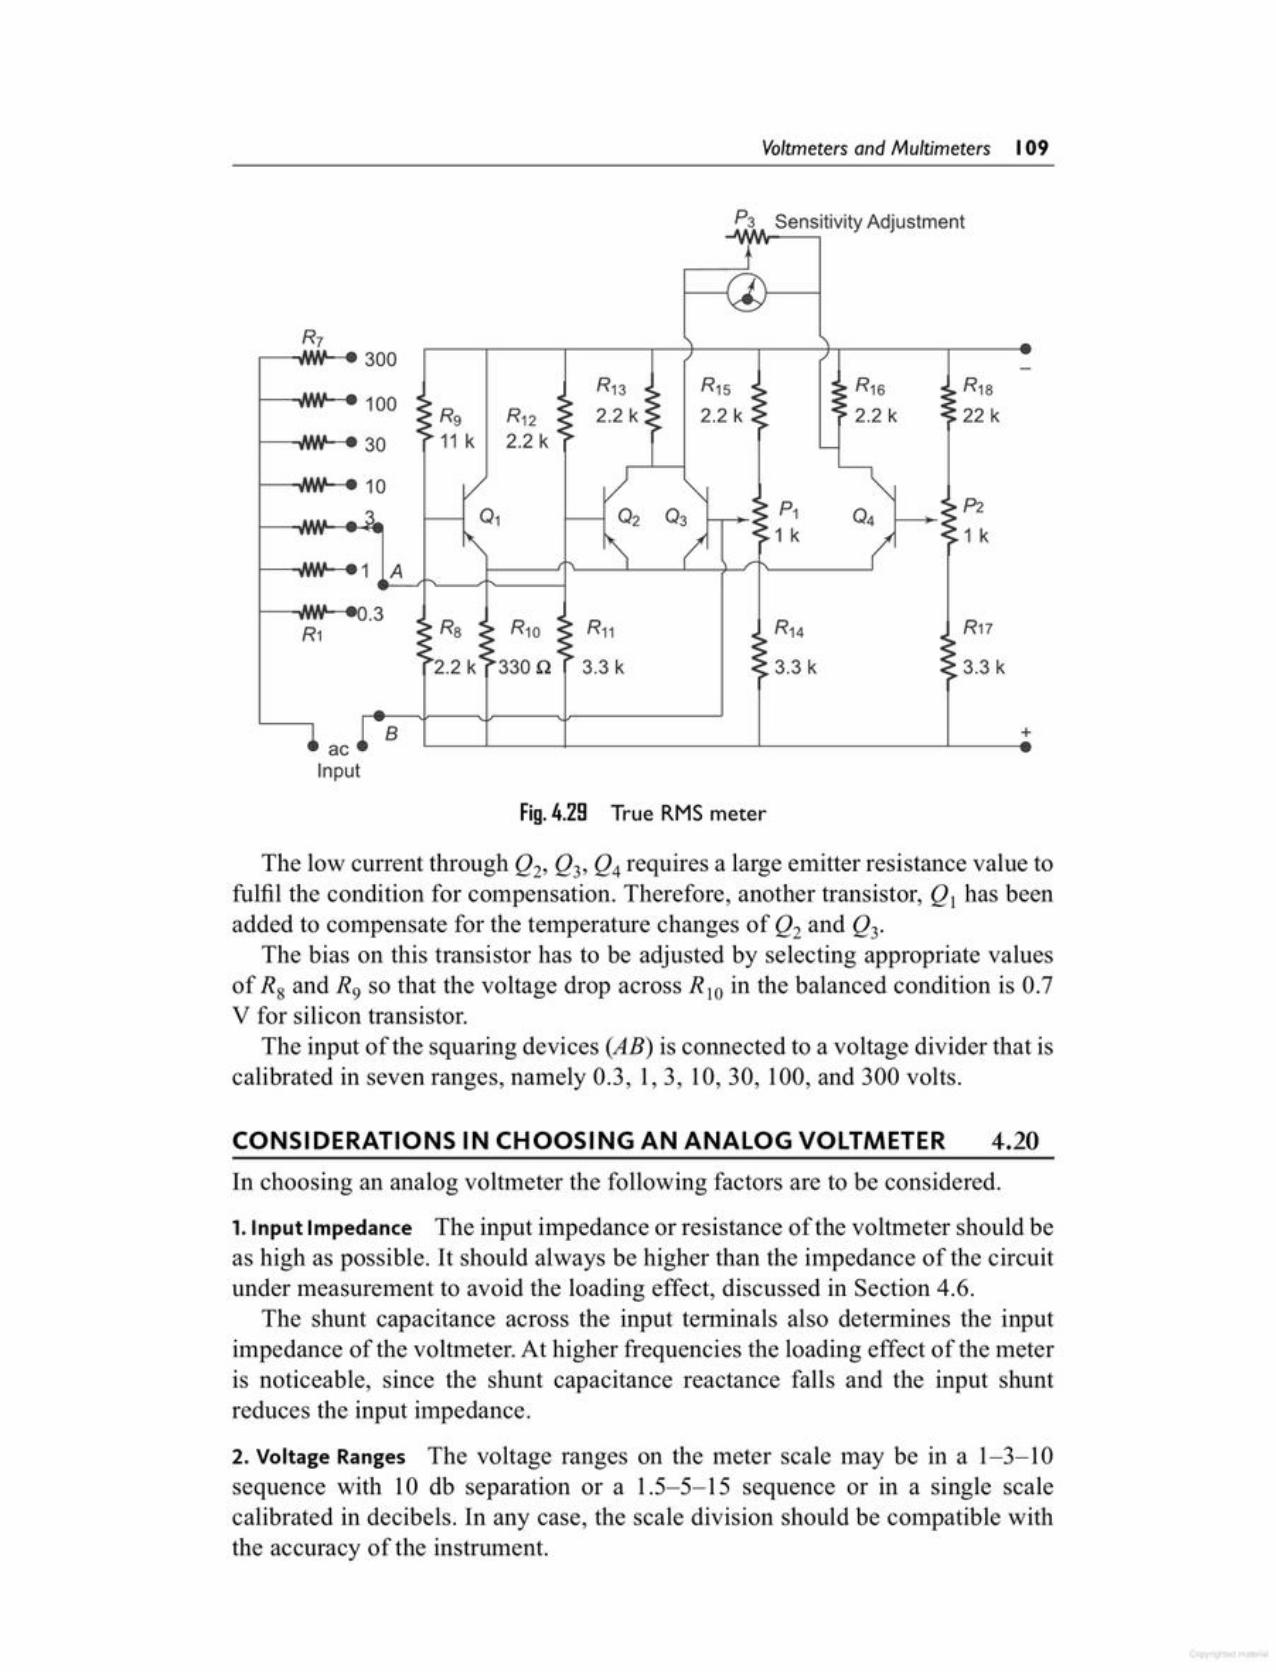
In choosing an analog voltmeter the following factors are to be considered.
1.lnput Impedance The input impedance or resistance of the voltmeter should beas high as possible. It should always be higher than the impedance of the circuitunder measurement to avoid the loading effect, discussed in Section 4.6.
The shunt capacitance across the input terminals also determines the inputimpedance of the voltmeter. At higher frequencies the loading effect of the meteris noticeable, since the shunt capacitance reactance falls and the input shuntreduces the input impedance.
2. Voltage Ranges The voltage ranges on the meter scale may be in a 1-3-10sequence with 10 db separation or a 1.5-5-15 sequence or in a single scalecalibrated in decibels. In any case, the scale division should be compatible withthe accuracy of the instrument.
CONSIDERATIONS IN CHOOSING AN ANALOG VOLTMETER 4.20
The low CUITentthrough Q2, Q3' Q4 requires a large emitter resistance value tofulfil the condition for compensation. Therefore, another transistor, QJ has beenadded to compensate for the temperature changes of Q2 and Q3'
The bias on this transistor has to be adjusted by selecting appropriate valuesof Rg and R9 so that the voltage drop across RIO in the balanced condition is 0.7V for silicon transistor.
The input of the squaring devices (AB) is connected to a voltage divider that iscalibrated in seven ranges, namely 0.3, 1,3, 10,30, 100, and 300 volts.
Fig.4.29 True RMS meter
acInput
+B
R7300
R13 R15 R18100 Rg R12 2.2 k 2.2 k 22 k30 11 k 2.2 k
10P1 04 P21 k 1 k
1 A
0.3Rs R10 R11 R14 R17R12.2 k 3300 3.3 k 3.3 k 3.3 k
P3 Sensitivity Adjustment
Voltmeters and Multimeters 109

AD' Arsonval movement is connected in series with a resistance R J and a batterywhich is connected to a pair of terminals A and B, across which the unknownresistance is connected. This forms the basic type of series ohmmeter, as shownin Fig. 4.30 (a).
The current flowing through the movement then depends on the magnitude ofthe unknown resistance. Therefore, the meter deflection is directly proportionalto the value of the unknown resistance.
Referring to Fig. 4.30 (a)RJ = current limiting resistanceR2 = zero adjust resistanceV= battery
RII1 = meter resistanceRx = unknown resistance
4.21OHMMETER (SERIES TYPE OHMMETER)
6. ACCurrent Measurements Current measurements can be made by a sensitiveac voltmeter and a series resistor.
To summarise, the general guidelines are as follows.(i) For de measurement, select the meter with the widest capability meeting
the requirements of the circuit.(ii) For ac measurements involving sine waves with less than 10% distortion,
the average responding voltmeter is most sensitive and provides the bestaccuracy.
(iii) For high frequency measurement (> 10 MHz), the peak respondingvoltmeter with a diode probe input is best. Peak responding circuits areacceptable if inaccuracies caused by distortion in the input waveform areallowed (tolerated).
(iv) For measurements where it is important to find the effective power ofwaveforms that depart from the true sinusoidal form, the rms respondingvoltmeter is the appropriate choice.
3. Decibels For measurements covering a wide range of voltages, the use of thedecibel scale can be very effective, e.g., in the frequency response curve of anamplifier, where the output voltage is measured as a function of the frequency ofthe applied input voltage.
4. Sensitivity vis Bandwidth Noise consists of unwanted frequencies. Since noiseis a function of the bandwidth, a voltmeter with a narrow bandwidth picks up lessnoise than a large bandwidth voltmeter,
Ingeneral, an instrument with a bandwidth of 10Hz-IO MHz has a sensitivityof 1 mV. Some voltmeters whose bandwidth extends up to 5 MHz may have asensitivity of 100 JlV.
5. Battery Operation A voltmeter (VTVM) powered by an internal battery isessential for field work.
I 10 Electronic Instrumentation
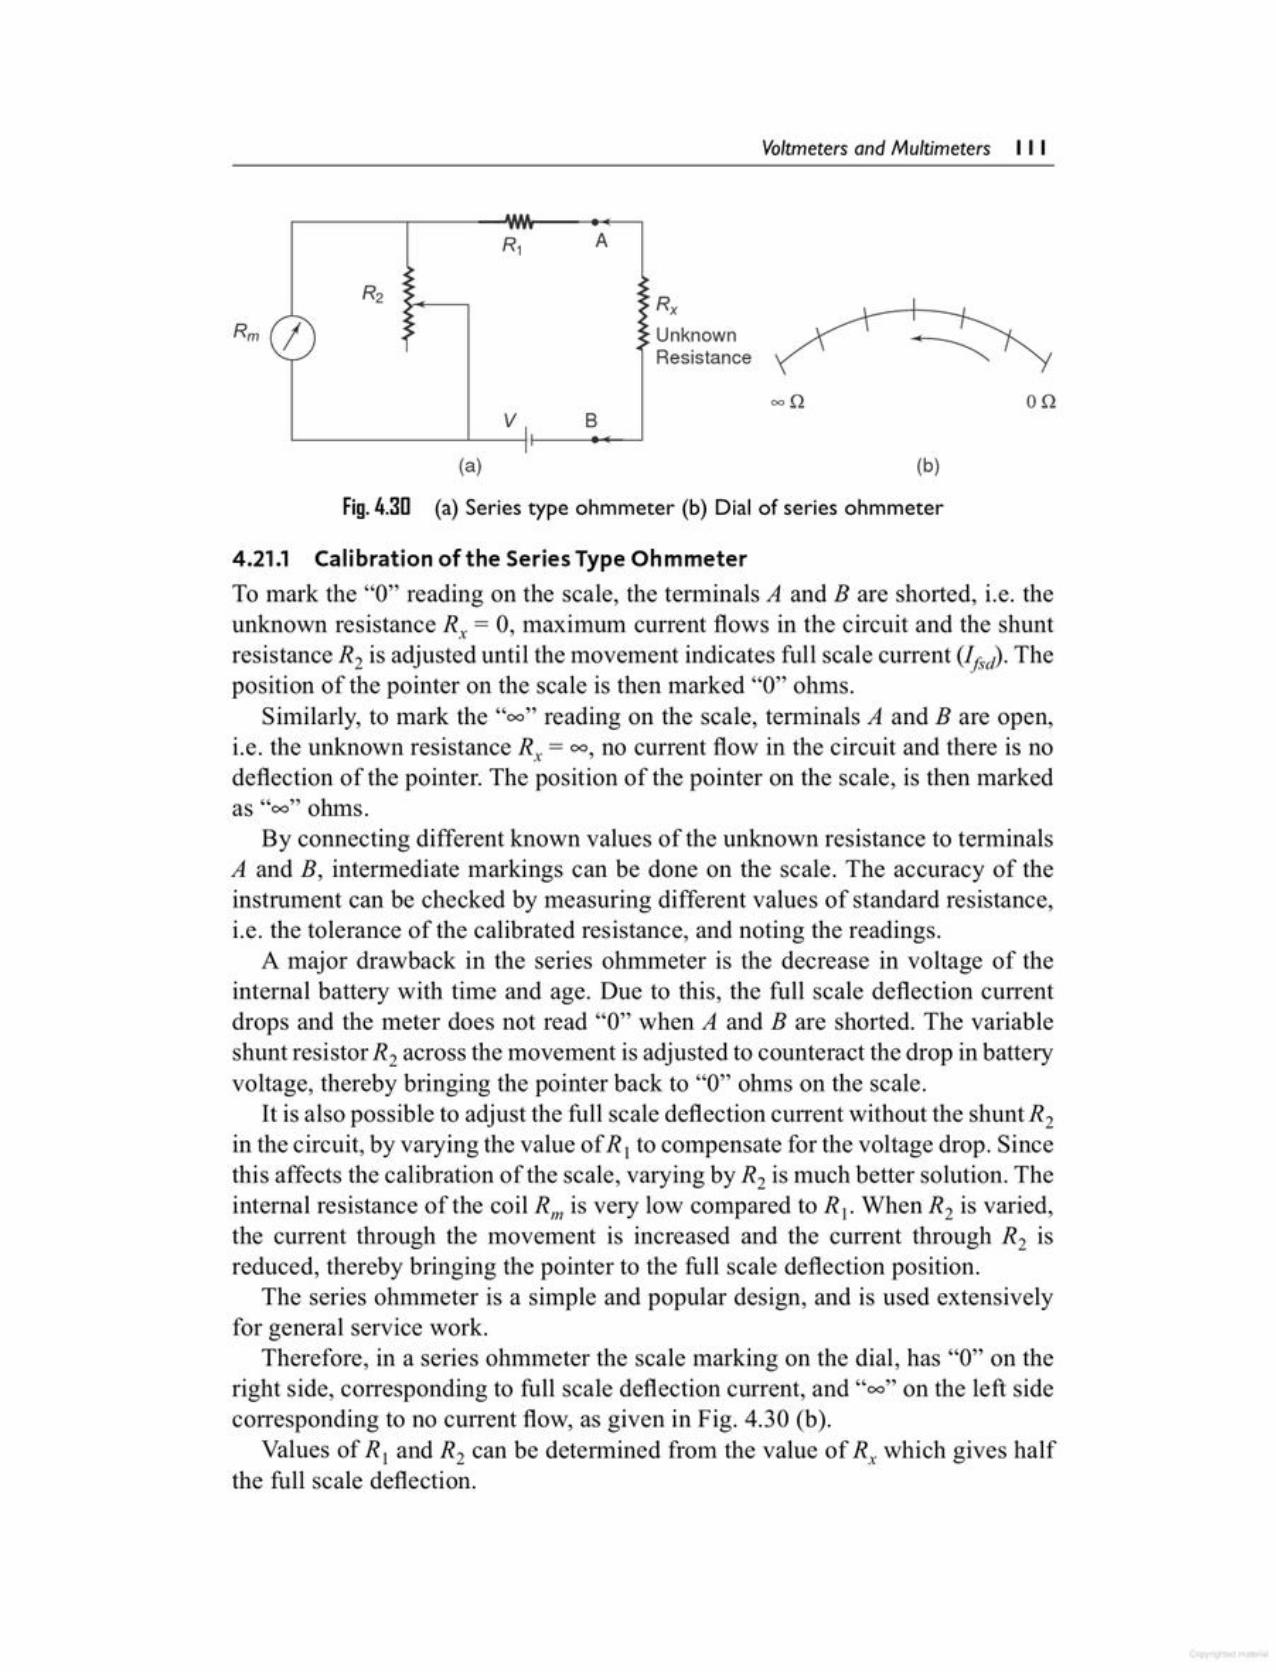
4.21.1 Calibration of the Series Type OhmmeterTo mark the "0" reading on the scale, the terminals A and B are shorted, i.e. theunknown resistance R; = 0, maximum current flows in the circuit and the shuntresistance R2 is adjusted until the movement indicates full scale current (I(sd). Theposition of the pointer on the scale is then marked "0" ohms.
Similarly, to mark the "00" reading on the scale, terminals A and B are open,i.e. the unknown resistance R; = 00, no current flow in the circuit and there is nodeflection of the pointer. The position of the pointer on the scale, is then markedas "00" ohms.
By connecting different known values of the unknown resistance to terminalsA and B, intermediate markings can be done on the scale. The accuracy of theinstrument can be checked by measuring different values of standard resistance,i.e. the tolerance of the calibrated resistance, and noting the readings.
A major drawback in the series ohmmeter is the decrease in voltage of theinternal battery with time and age. Due to this, the full scale deflection currentdrops and the meter does not read "0" when A and B are shorted. The variableshunt resistor R2 across the movement is adjusted to counteract the drop in batteryvoltage, thereby bringing the pointer back to "0" ohms on the scale.
It is also possible to adjust the full scale deflection current without the shuntR2
in the circuit, by varying the value ofR I to compensate for the voltage drop. Sincethis affects the calibration of the scale, varying by R2 is much better solution. Theinternal resistance of the coil Rill is very low compared to R I.When R2 is varied,the current through the movement is increased and the current through R2 isreduced, thereby bringing the pointer to the full scale deflection position.
The series ohmmeter is a simple and popular design, and is used extensivelyfor general service work.
Therefore, in a series ohmmeter the scale marking on the dial, has "0" on theright side, corresponding to full scale deflection current, and "00" on the left sidecorresponding to no current flow, as given in Fig. 4.30 (b).
Values of RI and R2 can be determined from the value of R; which gives halfthe full scale deflection.
Fig.4.3D (a) Series type ohmmeter (b) Dial of series ohmmeter
(b)(a)
on
RxUnknownResistance
....1.1•....AR1
~~R2 •~ :~
~! •1 ~
VI BI
Voltmeters and Multimeters I I I
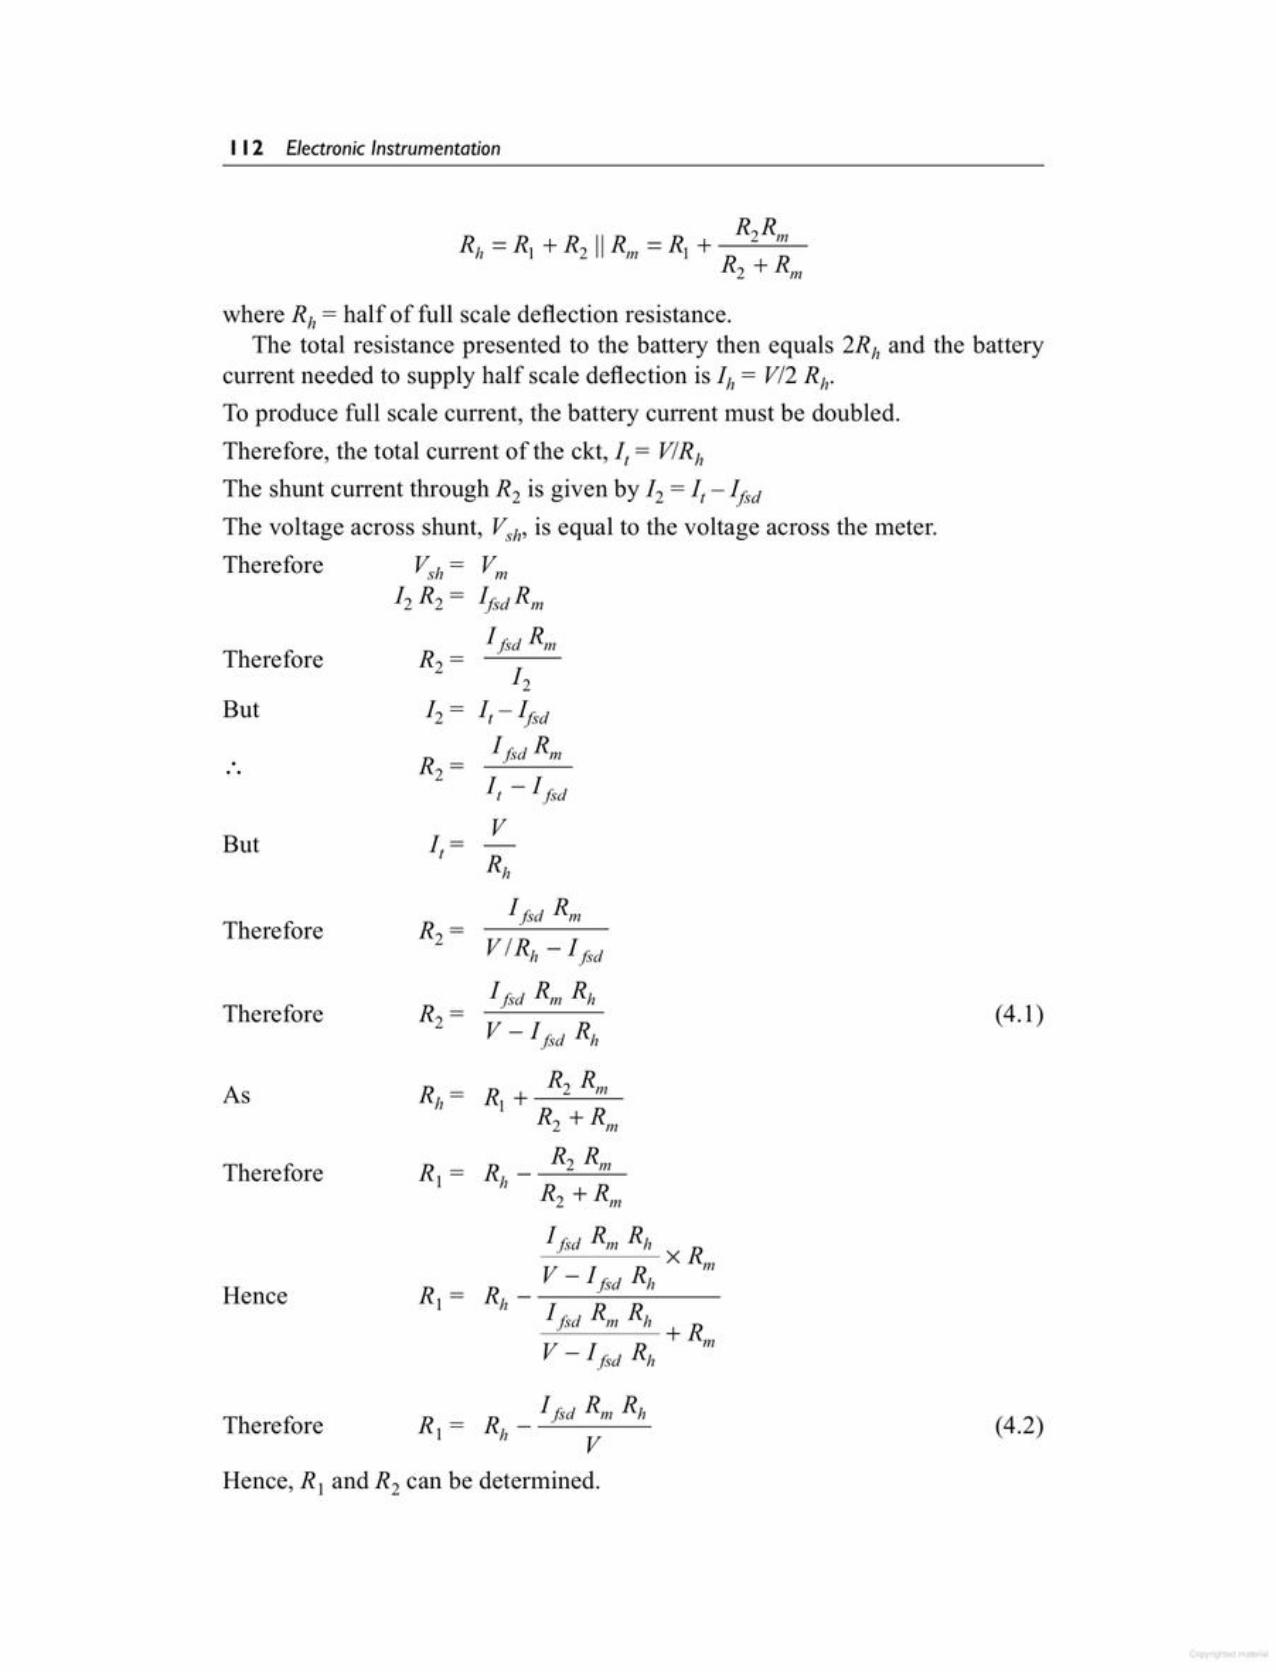
(4.2)Therefore_ Ifsd s; s,R) _ Rh _ __::_---
VHence, R[ and R2 can be determined.
(4.1)
Ifsd s;
If~d RmI, _ Ifsd
V
Rh
Hence
Therefore
As
Therefore
Therefore
1=tBut
But
Therefore
where Rh = half of full scale deflection resistance.The total resistance presented to the battery then equals 2Rh and the battery
current needed to supply half scale deflection is Ih = VI2 Rh.
To produce full scale current, the battery current must be doubled.Therefore, the total current of the ckt, I, = VIRh
The shunt current through R2 is given by 12 = It _ IjvdThe voltage across shunt, Vsh' is equal to the voltage across the meter.Therefore Vsh= Vm
12 R2 = Ij~d s;I/sd R",
12
It _ Ifsd
I I 2 Electronic Instrumentation

Hence R) = 2k_IrnAxl00x2k =2k- 200 =2k-66.63 3
R) = 2000 - 66.6 = 1933.3 Q
R2 = 1 rnA x 100 x 2 k = 200 = 200 Q3-lrnAx2k I
Therefore
Example 4.21 A 100 Q basic movement is to be used as an ohmmeterrequiring a full scale deflection of 1mA and internal battery voltage of 3 V Ahalf scale deflection marking of 2 k is desired. Calculate (i) value 0.1R I andR2, and (ii) The maximum value of R, to compensate for a 5% drop in batteryvoltage.
Solution (i) Using the equations for R) and R2 we have,
R2 = 52.36 Q
2.91 - 1 rnA x 1kQ_1_rnA_x_IO_O_x_l_kQ__ 100 = 100 =52.36Q
2.91-11.91
Step 3:(ii) The internal battery voltage is 3 V. 3% of 3 V is .09 V.Therefore, the battery voltage drop with 3% drop is 3 V - .09 V = 2.91V
1rnA x 100 x 1kQ _ 100 = 100 = 50 Q3-1mAxlkQ 3-1 2
Step 2:
1fsd X Rm x R; 1 rnA x 100 x 1kQR) =R, - =lkQ--------
1 V 3100
= 1kQ - -3- = 1000 Q - 33.3 Q= 966.7 Q
Example 4.2D A 100 Q basic movement is to be used as an ohmmeterrequiring full scale deflection of 1 mA and internal battery voltage of 3 V Ahalf scale deflection marking of 1kQ is required. Calculate
(i) the value of R I and R 2 (ii) Maximum value of R 2 to compensate for a 3%drop in battery voltage
Solution Given 1m= I rnA, Rm = 100 Q, Rh = I kQ, V = 3V(i) Tofind R1and R2
Step I:
Voltmeters and Multimeters 1 13

Therefore,
R; = (Rs + Rm) _ (R, + Rn.,)= (2.9 ill + 0.1 kQ) - (2.9 kQ + 0.1 ill)4 0.4
R = 3 ill 3 kQ = 7.5 ill - 3 kQ = 4.5 illx 0.4
Step 4: The value of R; with a 50% deflection is
(R +R ) 1 50R = s m -(.R +R ) where P=-=50%=-=0.5x P s· m 1 100
m
Step 3: The value of R; with a 40% deflection is
1 40where P=-=40%=-=0.4t; 100
R = (R, + Rm) _ (R R). x s + mP
= (2.9 kQ + 0.1 kQ) _ (2.9 kQ + 0.1 kQ)0.2
R,. = 3 kQ _ 3 kQ = 15 ill - 3 kQ = 12 kQA 0.2
Therefore,
Step 2: The value of R; with a 20% deflection is
1 20where P=-=20%=-=0.2
1m 100
Example 4.22 A 1 rnAfull scale deflection (fsd) current meter movementis to be used as an ohmmeter circuit. The meter movement has an internalresistance of 100Q and a 3 V battery will be used in the circuit. Mark off themeterface (dial)for reading resistance.
SolutionStep 1: The value of R, which will limit current to full scale deflection currentcan be calculated as
Rs =.!._ - s; = 3 -100 Q = 3 kQ -100 Q = 2.9 kQi; 1rnA
(ii) The internal battery voltage is 3 V, therefore 5% of 3 V is 0.15 V. Thebattery voltage with 5% drop is 3 V - 0.15 V = 2.85 V.
R2=ljsdXRhXRm= lrnAxlOOx2k =200=235.29QV - 1jsd X Rh 2.85 V - 1 rnA x 2 k 0.85
1 14 Electronic Instrumentation
Example 4.23 An ohmmeter is designed around a ImA meter movementand a 3V battery. If the battery voltage decays to 2.8 V because of aging,calculate the resulting error at the midrange on the ohmmeter scale.
Rx = (Rs +R",) _ (Rs + R/II) = (2.9 kQ + 0.1 kQ) _ (2.9 kQ + 0.1 kQ)P 1
R = 3 kQ _ 3 kQ = 3 kQ - 3 kQ = 0x 1
Therefore,
R = (Rs + Rm) _ (R + R )x P s m
Step 7: The value of R; with a 100% deflection is
I 100where P=-=100%=-=1
i; 100
Therefore,
R; = (Rs +Rm) _ (R, + RIIJ = (2.9 kQ + 0.1 kQ) - (2.9 kQ + 0.1 kQ)P 0.90
R, = 3kQ -3kQ=3.333kQ-3kQ=0.333kQ0.90
R = (Rs + Rm) _ (R R)x P s+ 111
Step 6: The value of R, with a 90% deflection is
I 90where P=-=90%=-=0.90
i; 100
Therefore,
R; = (Rs +Rm) _ (R, + RI11) = (2.9 kQ + 0.1 kQ) _ (2.9 kQ + 0.1 kQ)P 0.75
R; = 3 kQ _ 3 kQ = 4 ill - 3 kQ = 1kQ0.75
Therefore,
n, = (Rs ; Rm) _ (Rs + RI11) = (2.9 kQO~50.1kQ) - (2.9 kQ + 0.1 kQ)
R = 3kQ -3kQ=6kQ-3kQ=3kQx 0.5
Step 5: The value of R; with a 75% deflection is
(R + R ) I 75R = S /II -(R +R ) where P=-=75%=-=0.75x P s m I 100m
Voltmeters and Multimeters I I 5
R( = 2000 Q - 200 x 1-00-= 2000 Q _ 200 = 2000 - 66.6 = 1933.4 Q300- 3
R[ = 1933.4 Q that is series resistance
Therefore,
Step 2: The internal resistance of the ohmmeter is equal to half scale resistance.Therefore,
R2 = 1mRmRh = 1rnA x 100 x 2 kQ = 200 = 200 QE - ImRh 3 - 1 rnA x 2 kQ 3 - 2
Example 4.24 Design a series type ohmmeter. The movement requires a1 mA .for full scale deflection and has an internal resistance of 100 Q. Theinternal battery used has a voltage of 3 V The desired value for half scaledeflection is 2000 Q. Calculate(a) the values of R, and R2. (b) range ofR2 if the battery voltage varies from2.8 V to 3.1 V (R, is the same as in (a).
Solution Value of R I and R2 can be calculated asStep 1
SolutionStep 1: The total internal resistance of the ohmmeter is
R =Ell = 3/1 InA = 3 Jill,Step 2: The Ohmmeter scale should be marked as 3 kQ at the midrange. Anexternal resistance of 3 kQ would cause the pointer to deflect to its midscalerange.Step 3: When the battery voltage decreases to 2.8 V, the ohmmeter is adjustedfor full scale deflection by reducing Rs' the total internal resistance of theOhmmeter.
Therefore, R, = Ell = 2.8/1 rnA = 2.8 kQStep 4: If a 2.8 kQ resistor is now measured with the ohmmeter, we would expectless than midscale deflection, however the pointer will deflect to midscale whichis marked as 3 kQ. the aging of the battery has caused an incorrect reading.Step 5: The % error of this reading is given by
% Error = 3 kQ - 2.8 Jill x 100 = 0.2 kQ x 100 = 20 x 100 = 6.66%3 kQ 3 kQ 3
1 16 Electronic Instrumentation
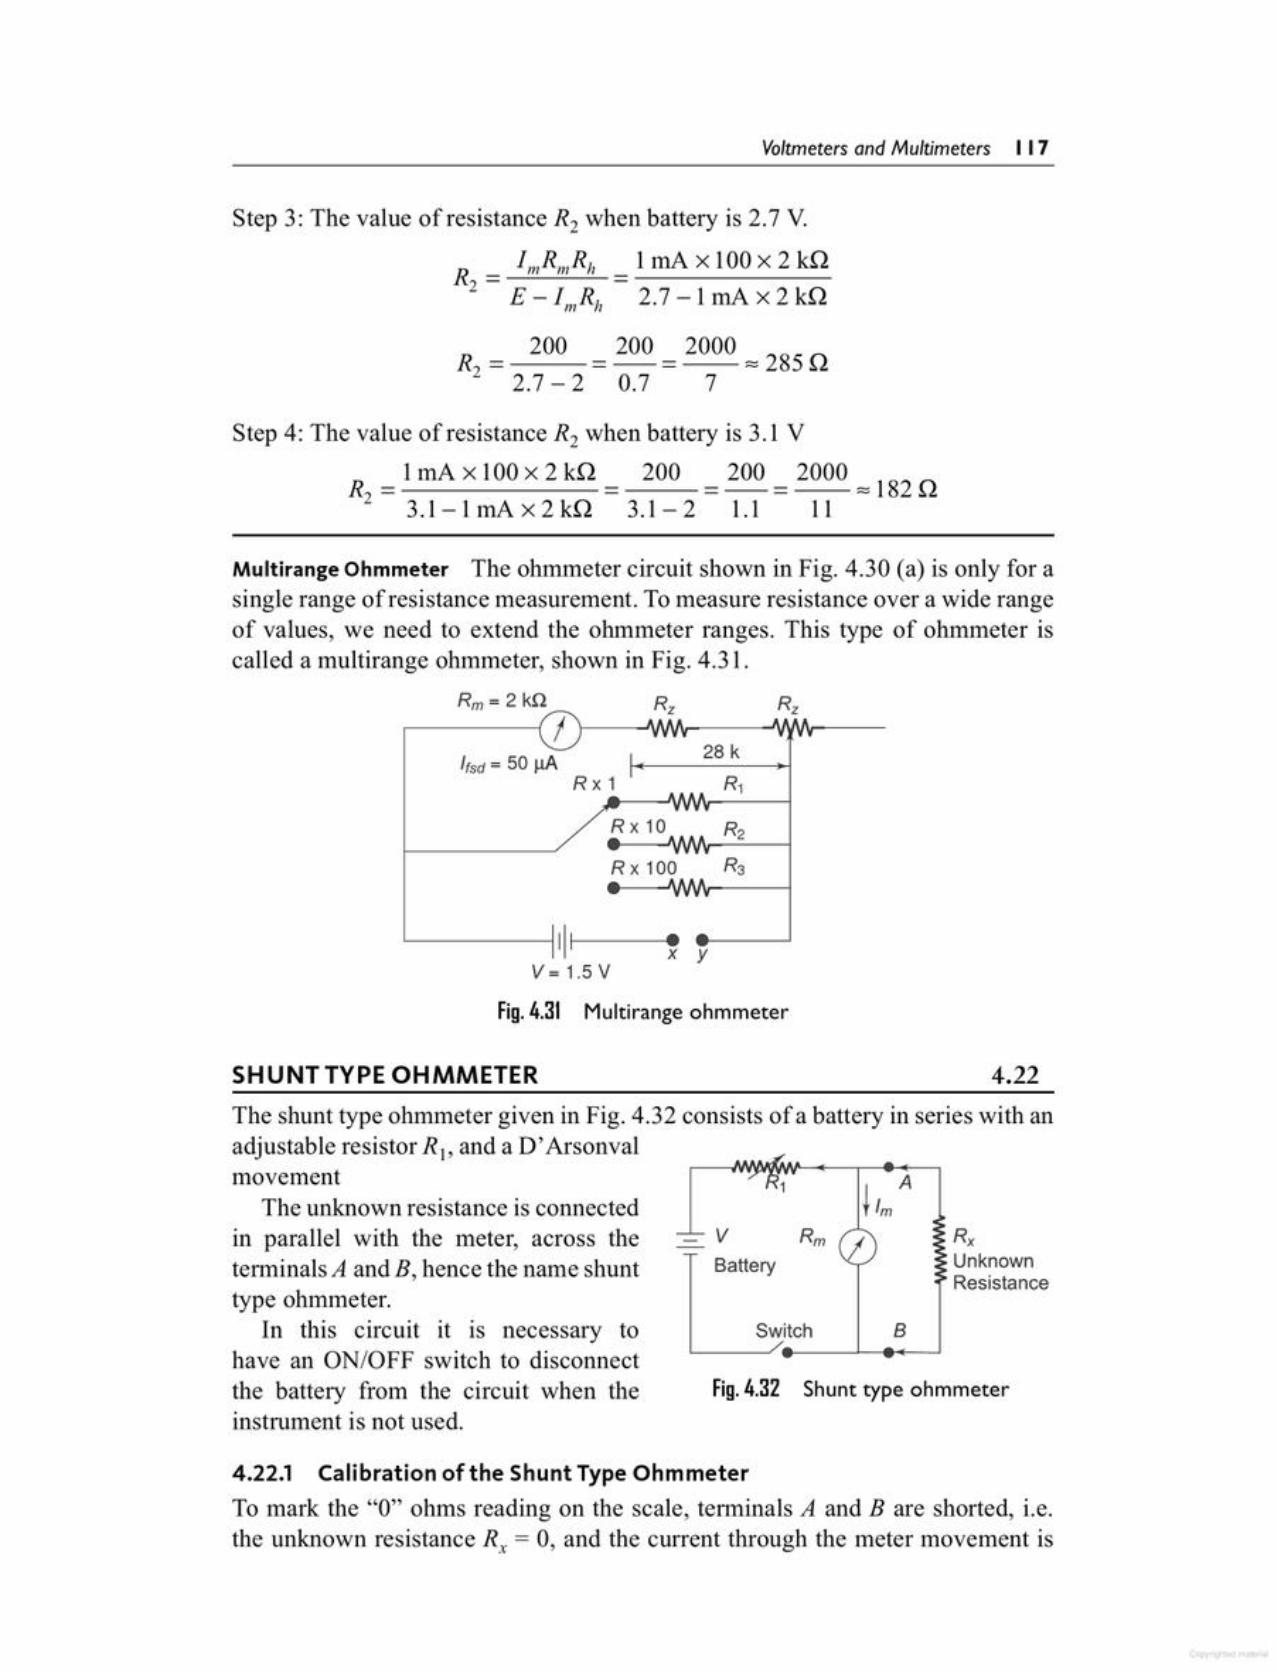
4.22.1 Calibration of the Shunt Type OhmmeterTo mark the "0" ohms reading on the scale, terminals A and B are shorted, i.e.the unknown resistance Rx = 0, and the current through the meter movement is
Fig. 4.32 Shunt type ohmmeter
timA
- V Rm RxBattery Unknown
Resistance
Switch B
The shunt type ohmmeter given in Fig. 4.32 consists of a battery in series with anadjustable resistor R1, and a D' Arsonvalmovement
The unknown resistance is connectedin parallel with the meter, across theterminals A and B, hence the name shunttype ohmmeter.
In this circuit it is necessary tohave an ON/OFF switch to disconnectthe battery from the circuit when theinstrument is not used.
SHUNTTYPE OHMMETER 4.22
Fig. 4.31 Multirange ohmmeter
'------1 II f-I ---e.x yV = 1.5 V
Rz Rz
Ifsd = 50 ~28 k
Rx 1 R1
R x 10 R2
R x 100 R3
Multirange Ohmmeter The ohmmeter circuit shown in Fig. 4.30 (a) is only for asingle range of resistance measurement. To measure resistance over a wide rangeof values, we need to extend the ohmmeter ranges. This type of ohmmeter iscalled a multirange ohmmeter, shown in Fig. 4.31.
Step 4: The value of resistance R2 when battery is 3.1V
R = 1mA x 100x 2 kQ = 200 = 200 = 2000 "" 182Q2 3.1-1 rnA x 2 kQ 3.1- 2 l.1 11
R2 = 200 = 200 = 2000 ""285Q2.7 - 2 0.7 7
Step 3: The value of resistance R2 when battery is 2.7 V.
ImRmRh 1InA x 100x 2 kQR2 = - -------E-1mRh 2.7-1mAx2kQ
Voltmeters and Multimeters I I 7
Step 5: Current through the shunt = Ish = Ix - 1m
I~h = 25 mA- 5 mA= 20 mAStep 6: Therefore, the value of shunt resistance
250lIlVRh= =12.50s 20rnA
Example 4.25 A shunt-type ohmmeter uses a 10 mA basic D 'Arsonalmovement with an internal resistance of 50 Q. The battery voltage is 3 V Itis desired to modify the circuit by adding appropriate shunt resistance acrossthe movement so that the instrument indicates 10 .Q at the midpoint scale.Calculate(a) the value of shunt resistance (b) value of current limiting resistance R I.
SolutionStep 1: For half scale definition
Ih = 0.5 mAxIm = 0.5 mAx 10 mA= 5 mAStep 2: The voltage across the movement
Vm =II7,Rm = 5 mAx 50 0= 250 mVStep 3: From the circuit diagram of a shunt-type ohmmeter it is seen that
voltage across unknown resistance = Voltage across meter movementStep 4: Therefore, current through the unknown resistance
I = ~11 = 250 IIlV = 25 rnAx Rh 100
00o00 mark at the right side of the scale,corresponding to full scale deflection current Fig.4.33 Dial of shunt type ohmmeteras shown in Fig. 4.33.
The shunt type ohmmeter is particularly suited to the measurement of lowvalues of resistance. Hence it is used as a test instrument in the laboratory forspecial low resistance applications.
zero, since it is bypassed by the short-circuit. This pointer position is marked as"0" ohms.
Similarly, to mark "00" on the scale, the terminals A and B are opened, i.e.Rx = 00, and full current flows through the meter movement; by appropriateselection of the value of R 1, the pointer can be made to read full scale deflectioncurrent. This position of the pointer is marked "00" ohms. Intermediate markingcan be done by connecting known values of standard resistors to the terminalsA andB.
This ohmmeter therefore has a zeromark at the left side of the scale and an
I 18 Electronic Instrumentation
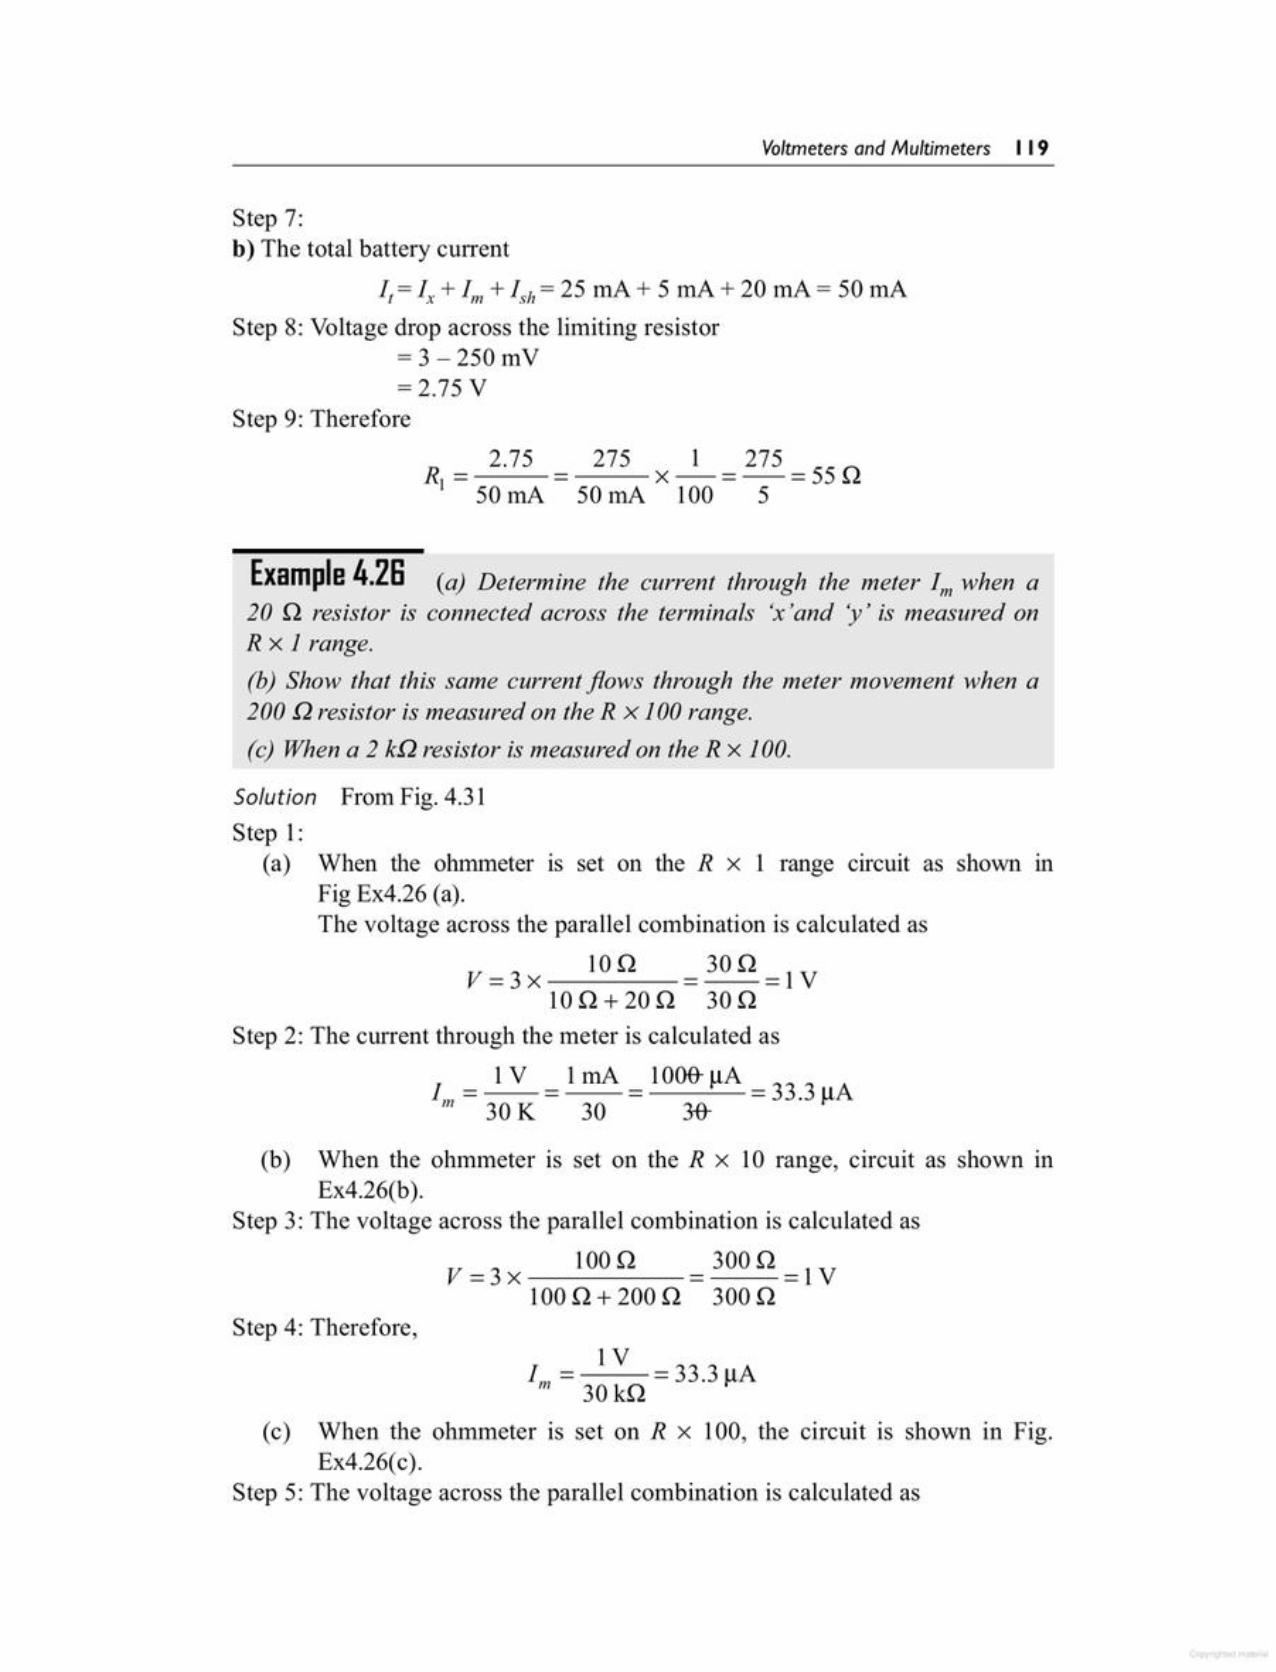
IV1m = = 33.3 J.lA
30kQ(c) When the ohmmeter is set on R x 100, the circuit is shown in Fig.
Ex4.26(c).Step 5: The voltage across the parallel combination is calculated as
Step 4: Therefore,
(b) When the ohmmeter is set on the R x 10 range, circuit as shown inEx4.26(b).
Step 3: The voltage across the parallel combination is calculated as
V = 3 x 100 Q = 300 Q = 1V100 Q + 200 Q 300 Q
Example 4.28 (a) Determine the current through the meter 1m when a20 Q resistor is connected across the terminals 'x'and y' is measured onR x J range.(b) Show that this same current flows through the meter movement when a200 Q resistor is measured on the R X J 00 range.(c) When a 2 kQ resistor is measured on the R x J 00.
Solution From Fig. 4.31Step 1:
(a) When the ohmmeter is set on the R x 1 range circuit as shown mFig Ex4.26 (a).The voltage across the parallel combination is calculated as
10Q 30 QV=3x = =IV
10Q+20Q 30QStep 2: The current through the meter is calculated as
1 = 1V = 1rnA = 10OB-J.lA=33.3 AIn 30 K 30 3-& J.l
Step 7:b) The total battery current
It=lx + 1m+ Ish= 25 rnA + 5 rnA + 20 mA= 50 rnAStep 8: Voltage drop across the limiting resistor
= 3 - 250 mV= 2.75 V
Step 9: Therefore
RI = 2.75 = 275 x _1_= 275 = 55 Q50 rnA 50 rnA 100 5
Voltmeters and Multimeters 1 19

An ohmmeter is generally considered to be an instrument of moderate accuracyand low precision. A rough calibration may be done by measuring a standardresistance and noting the readings on the ohmmeter. Doing this for several pointson the ohmmeter scale and on several ranges allows one to obtain an indicationof the accuracy of the instrument.
4.24
Fig.4.34 Calibration of voltmeter
VoltmeterUnder Test
Source
!
StandardMeter
R
tRegulated
de
CALIBRATION OF OHMMETER
The process of calibration involves the comparison of a given instrument with astandard instrument, to determine its accuracy. A de voltmeter may be calibratedwith a standard, or by comparison with a potentiometer. The circuit in Fig. 4.34is used to calibrate a de voltmeter;where a test voltmeter reading V iscompared to the voltage drop acrossR. The voltage drop across R is accurately measured with the help of astandard meter. A rheostat, shown inFig. 4.34, is used to limit the current.
A voltmeter tested with this methodcan be calibrated with an accuracy of±0.01%.
4.23CALIBRATION OF DC INSTRUMENT
Therefore,
V=3x IOOOQ =3000Q=IV1000 Q + 2000 Q 3000 Q
IV1m= = 33.3 flA
30kQ
Fig.Ex4.26
Rs= 28 kQ
Rs= 28 kQ
Rs= 2 kQ
(c)
E = 3V= 1 kQ
(b)
=E=3V200Q
(a)
=E =3V20Q
Rs= 2 kQ
Rs= 28 kQ
120 Electronic Instrumentation
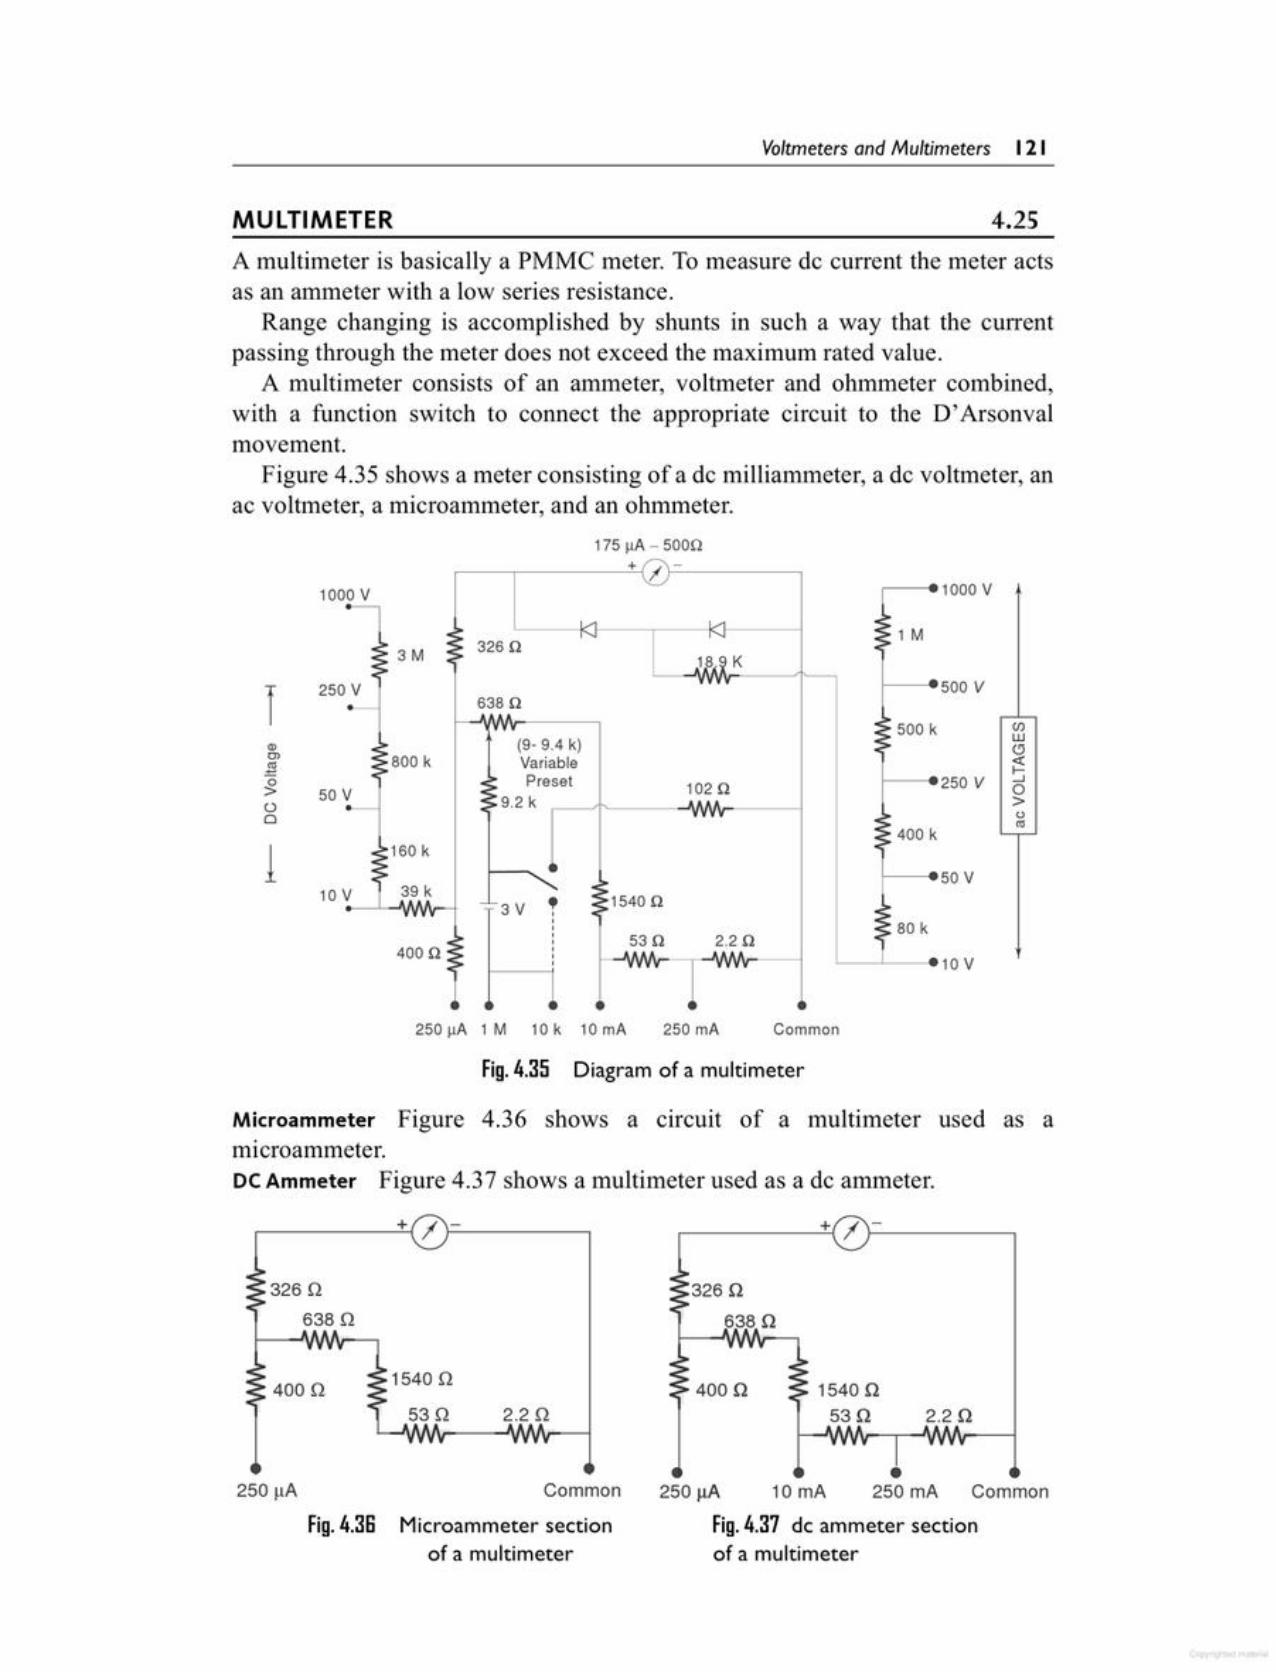
•250 rnA Common
2.2Q1540 Q53Q
10 rnA250llA
Fig. 4.37 dc ammeter sectionof a multimeter
Common
Microammeter sectionof a multimeter
326Q
638 Q
,...------------'-{+ .I )--------,
250llA
Fig.4.3G
2.204000 15400
530
,-------'+~ .I )--;__--------,
Microammeter Figure 4.36 shows a circuit of a multimeter used as amicroammeter.DCAmmeter Figure 4.37 shows a multi meter used as a de ammeter,
'---'----10 V
1----50 V
400 k
1----250 V
(/)w(!J
~o>oro
500 k
1----500 V
1 M
80 k
.----1000 V
Fig. 4.35 Diagram of a multimeter
Common250mA250~IA 1M 10k 10mA
•3 V ,,,,,,,,
~
530 2.20
IWv\
15400
1020
18 K
(9- 9.4 k)Variable
6380
~--I~--~-~I------I3260
175j.lA- 5000.----,------'--{+ / }-- --.
4000
10V,._...l.-.r...NIfv--I
39 k
160k1
800 k
.-250 V
T
3M
1000V
A multimeter is basically a PMMC meter. To measure dc current the meter actsas an ammeter with a low series resistance.
Range changing is accomplished by shunts in such a way that the currentpassing through the meter does not exceed the maximum rated value.
A multimeter consists of an ammeter, voltmeter and ohmmeter combined,with a function switch to connect the appropriate circuit to the D' Arsonvalmovement.
Figure 4.35 shows a meter consisting of a de milliammeter, a de voltmeter, anac voltmeter, a micro ammeter, and an ohmmeter.
MULTIMETER 4.25
Voltmeters and Multimeters 121
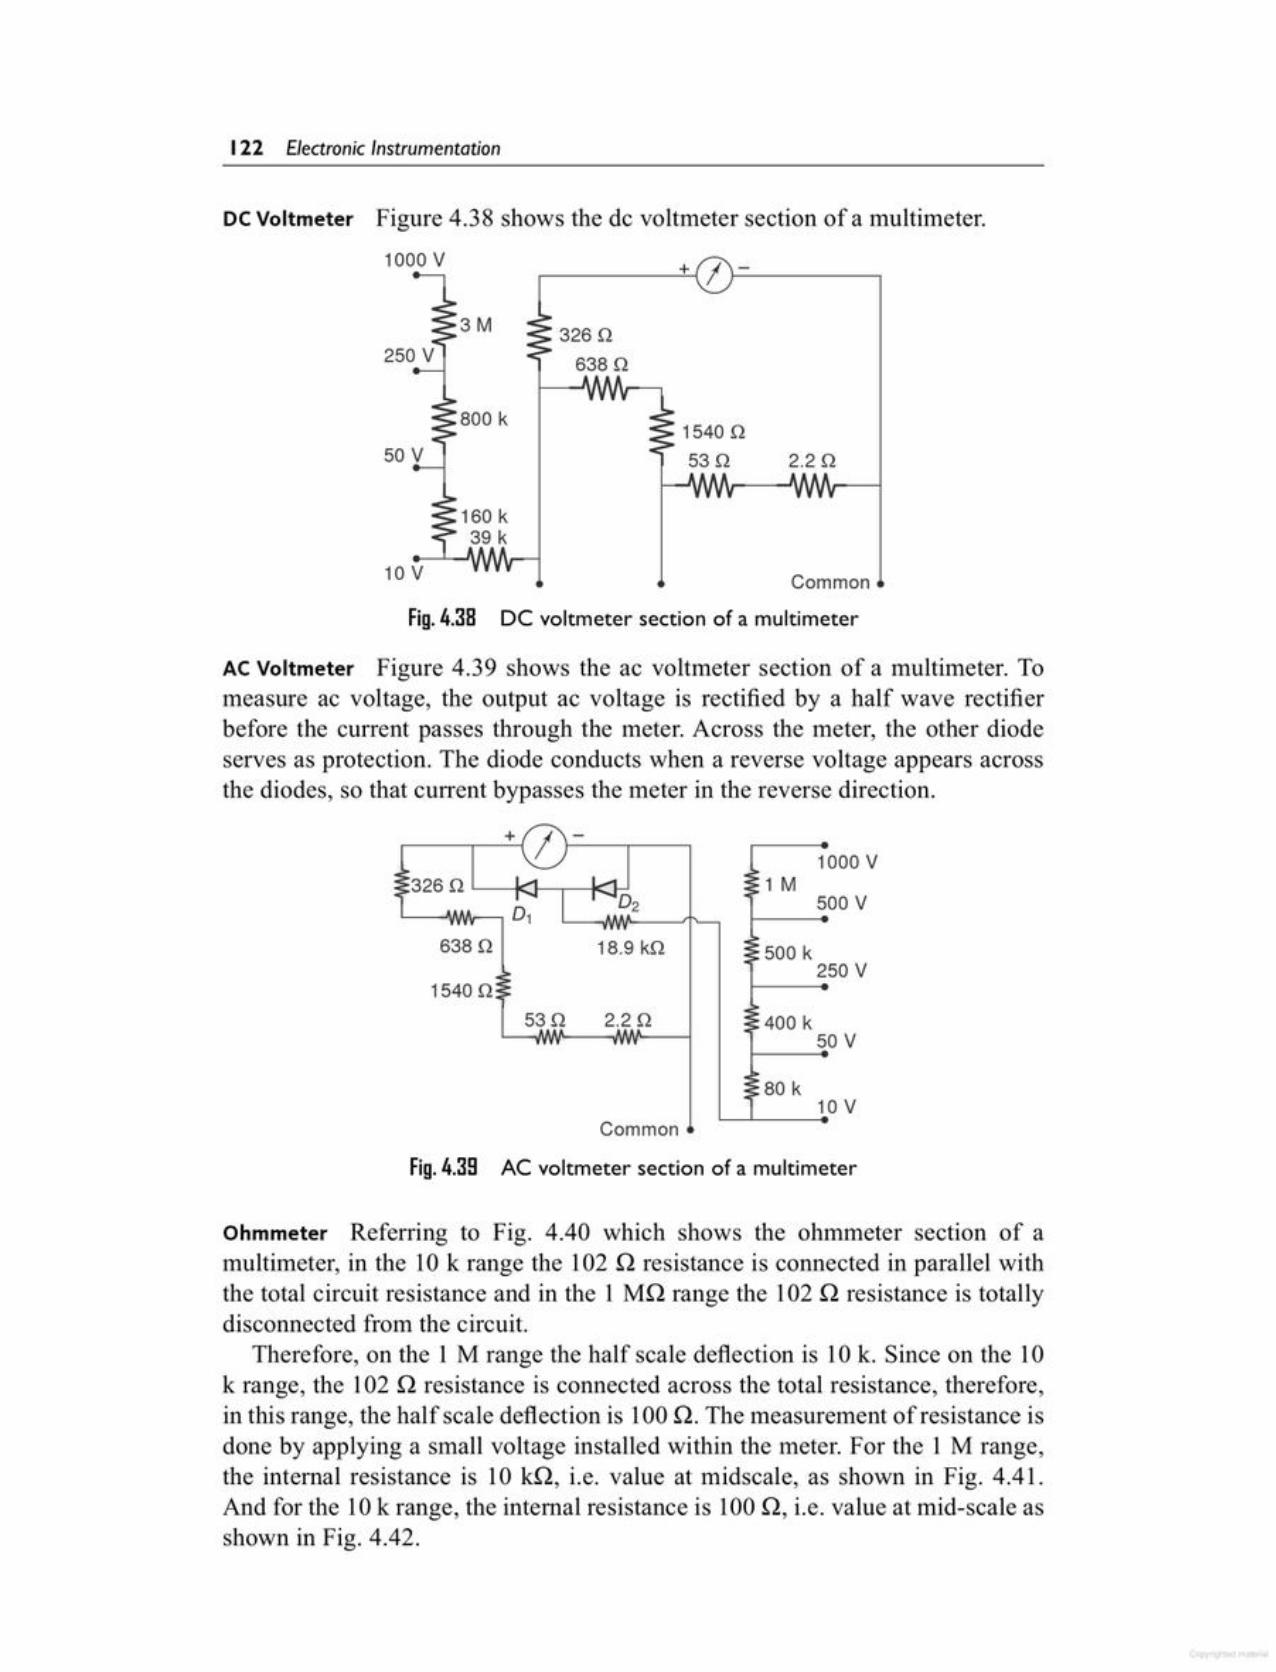
Ohmmeter Referring to Fig. 4.40 which shows the ohmmeter section of amultimeter, in the 10 k range the 102 .0 resistance is connected in parallel withthe total circuit resistance and in the 1 MQ range the 102 .0 resistance is totallydisconnected from the circuit.
Therefore, on the 1 M range the half scale deflection is 10 k. Since on the 10k range, the 102 .0 resistance is connected across the total resistance, therefore,in this range, the half scale deflection is 100Q. The measurement of resistance isdone by applying a small voltage installed within the meter. For the 1 M range,the internal resistance is 10 kQ, i.e. value at midscale, as shown in Fig. 4.41.And for the 10 k range, the internal resistance is 100.0, i.e. value at mid-scale asshown in Fig. 4.42.
Fig.4.39 AC voltmeter section of a multimeter
10 VL..._..l..___
80 k
400 k50 Vf---- .....
1000 V
500 V1 M
500 k250 V
Common
1540 Q53 Q 2.2 Q
638 Q 18.9 kQ
Common
DC voltmeter section of a multimeter
AC Voltmeter Figure 4.39 shows the ac voltmeter section of a multimeter. Tomeasure ac voltage, the output ac voltage is rectified by a half wave rectifierbefore the current passes through the meter. Across the meter, the other diodeserves as protection. The diode conducts when a reverse voltage appears acrossthe diodes, so that current bypasses the meter in the reverse direction.
Fig.4.38
10 V
160 k39 k
1000 V+ I -
3M 326 Q638 Q
800 k 1540 Q53Q 2.2Q
DCVoltmeter Figure 4.38 shows the de voltmeter section of a multimeter.
122 Electronic Instrumentation

The combination volt-ohm-milliammeter is a basic tool in any electroniclaboratory. The proper use of this instrument increases its accuracy and life. Thefollowing precautions should be observed.
4.26MULTIMETER OPERATING INSTRUCTIONS
The range of an ohmmeter can be changed byconnecting the switch to a suitable shunt resistance. By using different values ofshunt resistance, different ranges can be obtained.
By increasing the battery voltage and using a suitable shunt, the maximumvalues which the ohmmeter reads can be changed.
~100 Q
Fig. 4.42 Half scaledeflection is 100Q on 10krangeFig. 4.41 Equivalentresistanceon I MQ range
500 Q102 Q0.8 k
9.2 k
0.8 k9.2 k
~10 k
9.2 k
326 Q
319Q 319Q 1540Q 53Q 2.2Q
500 Q
Equivalent Resistance
fI
3V.=. I
H1 M 10 k
Fig. 4.40 Ohmmeter section of a multimeter
102 Q
9.2 k 1540 Q53 Q 2.2 Q
326 Q638Q
500 Q
Voltmeters and Multimeters 123

What are the drawbacks of a transistor voltmeter?
11. Explain why an FET is used at theinput stage of a transistor voltmeter.
12. Explain why a transistor voltmetercannot be used for measurement inthe !-LVrange.
13. Describe with a diagram how voltagein j..lV range is measured.
14. Explain the principle of operation ofa chopper. Explain the use of a chopper in microvoltmeter.
15. Describe with a diagram the operationof a chopper type microvoltrneter.
16. Describe the operation of an electronic voltmeter using an IC OPAMP.
17. Explain the functions of a diode usedin an electronic voltmeter. Explainthe function of offset used in an electronic voltmeter.
18. Explain with diagram the operationof a de differential voltmeter.
1. Explain how a PMMC can be used asa basic voltmeter.
2. Explain with a diagram the operationof a multirange voltmeter. State thelimitations of a multirange voltmeter.
3. Explain the operation of an Ayrtonshunt.
4. Compare a multirange voltmeterwith the Ayrton shunt voltmeter.
5. State the drawbacks of using an Aryton shunt.
6. Why is an Ayrton shunt called a universal shunt.
7. Define sensitivity of voltmeters.What is the significance of sensitivity in voltmeters?
8. State the effects of using a voltmeterof low sensitivity.
9. Explain the above with examples ofloading effect.
10. Explain with a diagram the workingof a Transistor Voltmeter (TVM).
Review lluestlens I-------------------------------------
1. To prevent meter overloading and possible damage when checkingvoltage or current, start with the highest range of the instrument andmove down the range successively.
2. For higher accuracy, the range selected should be such that the deflectionfalls in the upper half on the meter scale.
3. For maximum accuracy and minimum loading, choose a voltmeterrange such that the total voltmeter resistance (ohms per volt x full scalevoltage) is at least 100 times the resistance of the circuit under test.
4. Make all resistance readings in the uncrowded portion on the meterscale, whenever possible.
S. Take extra precautions when checking high voltages and checkingcurrent in high voltage circuits.
6. Verify the circuit polarity before making a test, particularly whenmeasuring dc current or voltages.
7. When checking resistance in circuits, be sure power to the circuit isswitched off, otherwise the voltage across the resistance may damagethe meter.
8. Renew ohmmeter batteries frequently to insure accuracy of the resistancescale.
9. Recalibrate the instrument at frequent intervals.10. Protect the instrument from dust, moisture, fumes and heat.
124 Electronic Instrumentation
(b) V / Q(d) Q /1
3. To select the range, a multirangevoltmeter uses(a) double pole double throw switch(b) make before break type switch(c) single pole double throw switchd) simple switch
4. The sensitivity of a voltmeter is defined as(a) Q / V(c) 1/ Q
1. The instrument required to measurevoltage is(a) ohmmeter (b) ammeter(c) voltmeter (d) wattmeter
2. AD' Arsonval movement is(a) taut band(b) PMMC(c) e1ectrodynamometer(d) moving iron type
Multiple Choice Iluestions I-
19. Explain how a PMMC can be used as 33. What is the need of using a squaringan ac voltmeter. device in a true RMS meter? Explain
20. State why silicon diodes are pre- with a diagram the operation of aferred as rectifiers in ac voltmeter. squaring device.
21. Explain the operation of a full wave 34. Compare a true RMS meter with anrectifier type ac voltmeter. average responding meter.
22. Explain with a diagram the operation 35. Explain with a diagram the operationof a half wave rectifier type ac volt- of a series type ohmmeter. Explainmeter. with a diagram how an ohmmeter is
23. Why is a PMMC movement shunted calibrated.by a resistor when used as an ac volt- 36. Why is there a '0' mark on the right-meter? hand side for a series type ohmmeter?
24. Compare sensitivity of an ac voltme- How can you estimate the internalter with that of the de voltmeter. resistance of a series type ohmmeter
25. Compare sensitivity of an ac voltme- from its dial?ter using FWR with that of a HWR. 37. Explain with a diagram the operation
26. Explain with a diagram how a multi- of a shunt type ohmmeter.range ac voltmeter can be construct- 38. Compare series type and shunt typeed using a PMMC. ohmmeters.
27. Explain with a diagram the opera- 39. How can you distinguish between ations of an average responding volt- series type ohmmeter and ashunt typemeter. Where is it used? ohmmeter from dial calibration?
28. Explain with a diagram the opera- 40. Define sensitivity of a multimeter.tions of a peak responding voltmeter. 41. Explain with the help of a diagram,Where is it used? the working of a simple multimeter.
29. Compare average responding volt- 42. Explain with the help of a diagrammeters with peak responding voltme- the various sections of a multimeter.ters. 43. Draw a practical multimeter.
30. Explain the operating principle of a 44. Explain with a diagram how a multi-true RMS voltmeter. meter can be used as a volrmeter and
31. Explain with diagram the operation ammeter.of true RMS voltmeter. 45. Explain with a diagram how a mul-
32. Compare a true RMS voltmeter with timeter can be used for measuringan ac voltmeter. resistance.
Voltmeters and Multimeters 125
500 Q is available. It is to be!verted into a 0-1 V, 0-5 V, 0-20 V,0-100 V multirange voltmeter usingindividual multipliers for each range.Calculate the values of the individualresistor.
4. A basic D' Arsonval movement witha full scale deflection of 50 !-LAandan internal resistance of 1800 Q isavailable. It is to be converted intoa 0-1 V, 0-5 V, 0-25 V and 0-225 Vmultirange voltmeter using individual
11. To move the operating point of rectifier used in an ac voltmeter in the linear region, the meter is shunted by(a) capacitor (b) diode(c) inductor (d) resistor
12. A true RMS voltmeter measures(a) average value(b) instantaneous value(c) RMS value(d) peak value
13. The ohms per volt rating on ac ranges as compared to the same rating onde ranges is(a) less(b) more(c) equal(d) none of the above
14. In a 20 kQ / V sensitivity multimeter,the input resistance for measuring acvoltage in 10 V fsd is(a) 200 kQ (b) 20 kQ(c) 10 ill (d) 2 kQ
15. Ac measurement is achieved by connecting alan in series with a PMMC.(a) resistor (b) diode(c) inductor (d) capacitor
16. The internal resistance of an ohmmeter can be estimated from(a) 0 deflection(b) full scale deflection(c) half scale deflection(d) quarter deflection
1. What series resistance must be usedto extend the 0-200 V range of a20000 ON meter to a 2000 V? Whatmust be the power of this resistor?
2. Calculate the value of a series resistor used to extend the 0-100 V rangeof a 20 kQ / V Voltmeter to a 500 Vrange. Calculate the power of the resistor.
3. A basic D'Arsonval movement witha full scale deflection of 50 !-LAandhaving an internal resistance of
Practice Problems
5. Loading effect in a voltnleter can beavoided by(a) using an accurate and precise in-
strument(b) using a low sensitivity voltmeter(c) using a high sensitivity voltmeter(d) using high voltage range
6. The input stage ofTVM consists of(a) UlT stage (b) FET stage(c) BlT stage (d) SCR stage
7. TVM is used to measure(a) de InV (b) de !-LV(c) aC!-LV (d) ac InV
8. Chopper type voltrneter is used tomeasure(a) de f..I.V, (b) de mV,(c) ac !-LV, (d) ac InV.
9. A diode used as rectifier in ac voltmeter should have(a) high forward current and low
reverse currents(b) high forward current and high
reverse current(c) low forward current and high
reverse current(d) low forward current and low
reverse current10. The ac voltmeter using PMMC
measures(a) true RMS voltage(b) peak voltage(c) average voltage(d) instantaneous voltage
126 Electronic Instrumentation
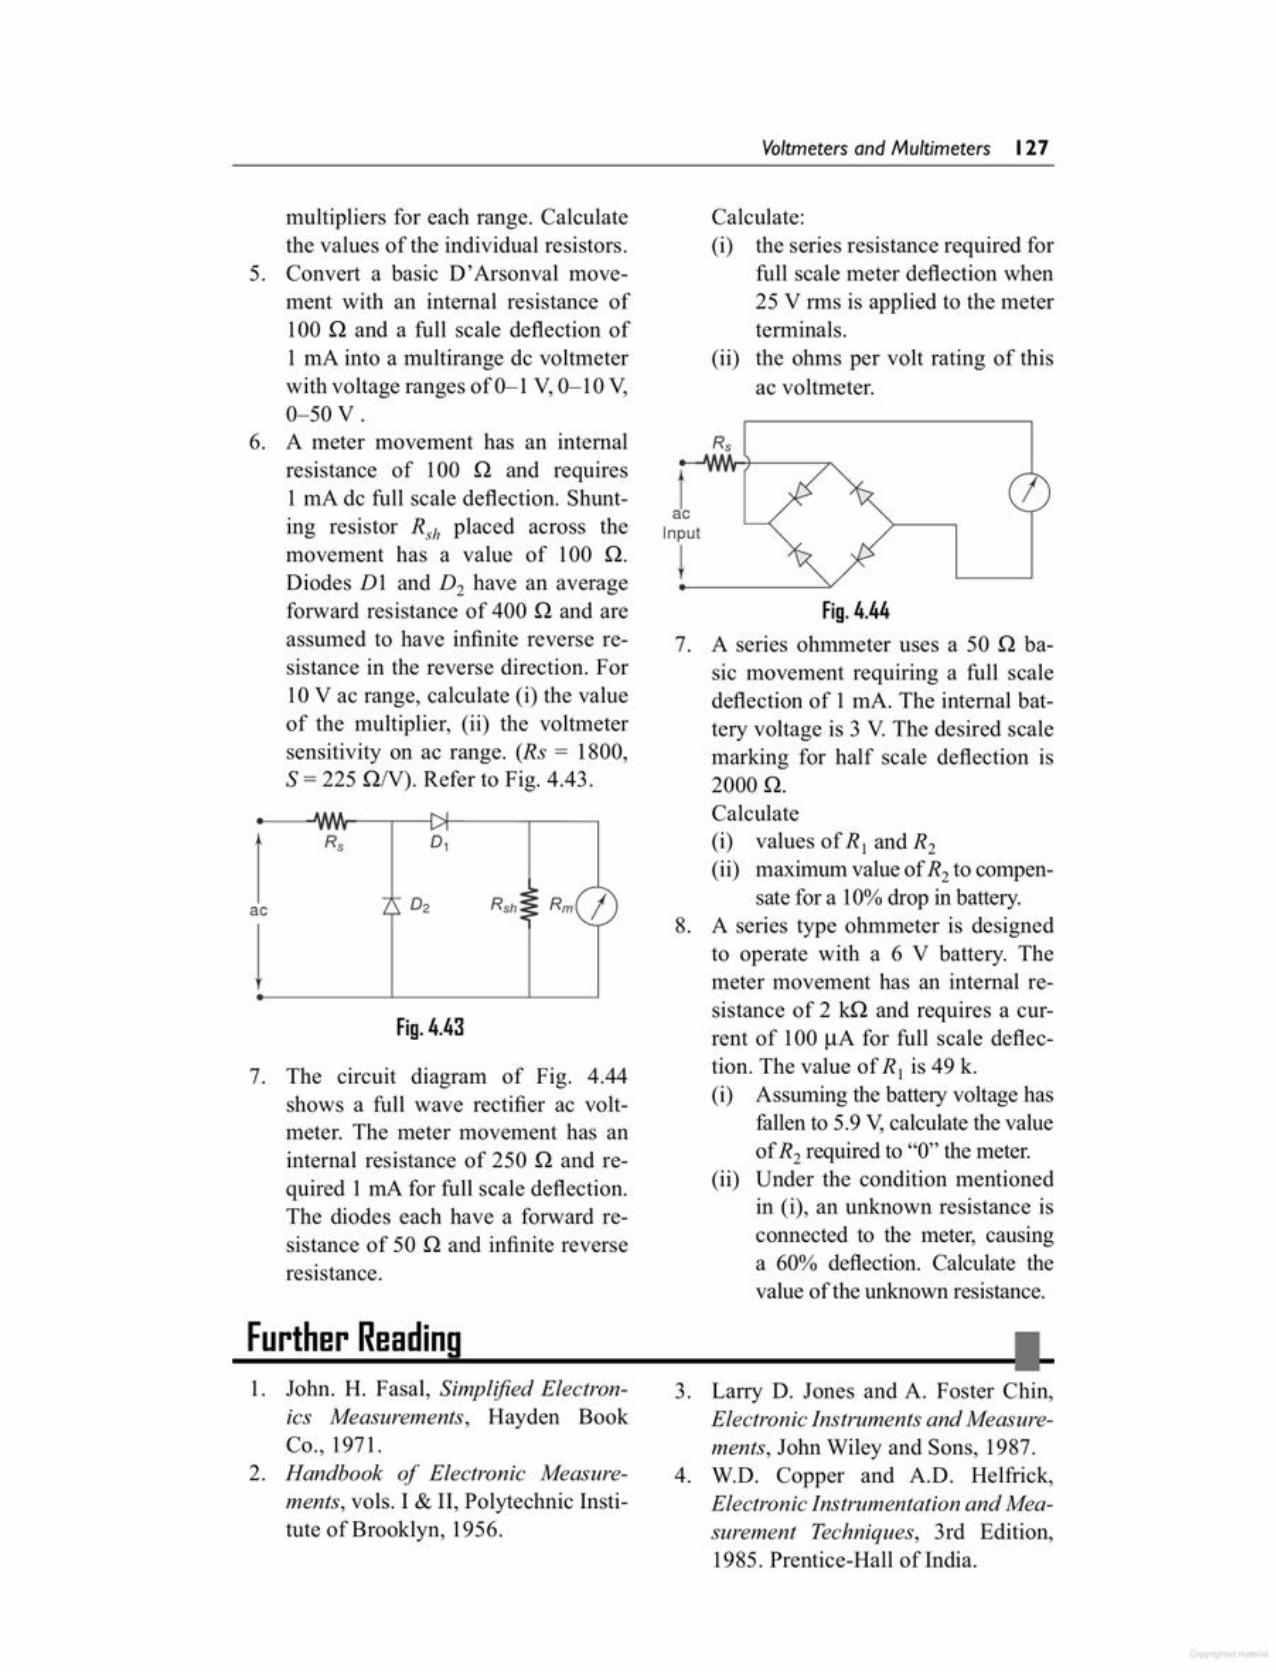
3. Larry D. Jones and A. Foster Chin,Electronic Instruments and Measurements, John Wiley and Sons, 1987.
4. W.D. Copper and A.D. Helfrick,Electronic Instrumentation and Measurement Techniques, 3rd Edition,1985. Prentice-Hall of India.
1. John. H. Fasal, Simplified Electronics Measurements, Hayden BookCo., 1971.
2. Handbook of Electronic Measurements, vols. I & II, Polytechnic Institute of Brooklyn, ] 956.
_F_u_rt_he_r_R_ea_d_in~g ~~
Fig.4.447. A series ohmmeter uses a 50 Q ba
sic movement requiring a full scaledeflection of 1 rnA. The internal battery voltage is 3 V. The desired scalemarking for half scale deflection is2000 Q.Calculate(i) values of R 1 and R2(ii) maximum value ofR2 to compen
sate for a 10% drop in battery.8. A series type ohmmeter is designed
to operate with a 6 V battery. Themeter movement has an internal resistance of 2 ill and requires a current of 100 !-LA for full scale deflection. The value of R I is 49 k.(i) Assuming the battery voltage has
fallen to 5.9 V, calculate the valueof R2 required to "0" the meter.
(ii) Under the condition mentionedin (i), an unknown resistance isconnected to the meter, causinga 60% deflection. Calculate thevalue of the unknown resistance.
JcInput
~
Calculate:(i) the series resistance required for
full scale meter deflection when25 V rms is applied to the meterterminals.
(ii) the ohms per volt rating of thisac voltmeter.
7. The circuit diagram of Fig. 4.44shows a full wave rectifier ac voltmeter. The meter movement has aninternal resistance of 250 Q and required 1 rnA for full scale deflection.The diodes each have a forward resistance of 50 Q and infinite reverseresistance.
Fig.4.43
IacI
multipliers for each range. Calculatethe values of the individual resistors.
5. Convert a basic D'Arsonval movement with an internal resistance of100 Q and a full scale deflection of1 InA into a multirange dc voltmeterwith voltage ranges of 0-1 V, 0-10 V,0-50V.
6. A meter movement has an internalresistance of 100 Q and requires1 rnA de full scale deflection. Shunting resistor Rsh placed across themovement has a value of 100 Q.Diodes Dl and D2 have an averageforward resistance of 400 Q and areassumed to have infinite reverse resistance in the reverse direction. For10 V ac range, calculate (i) the valueof the multiplier, (ii) the voltmetersensitivity on ac range. (Rs = 1800,S= 225 Q/V). Refer to Fig. 4.43.
Voltmeters and Multimeters 127
Digital voltmeters (DVMs) are measuring instruments that convert analog voltagesignals into a digital or numeric readout. This digital readout can be displayed onthe front panel and also used as an electrical digital output signal.
Any DVM is capable of measuring analog de voltages. However, withappropriate signal conditioners preceding the input of the DVM, quantitiessuch as ac voltages, ohms, dc and ac current, temperature, and pressure can bemeasured. The common element in all these signal conditioners is the de voltage,which is proportional to the level of the unknown quantity being measured. Thisde output is then measured by the DVM.
DVMs have various features such as speed, automation operation and program-ability. There are several varieties of DVM which differ in the following ways:
1. Number of digits2. Number of measurements3. Accuracy4. Speed of reading5. Digital output of several types.The DVM displays ac and de voltages as discrete numbers, rather than as a
pointer on a continuous scale as in an analog voltmeter. A numerical readout isadvantageous because it reduces human error, eliminates parallax error, increasesreading speed and often provides output in digital form suitable for furtherprocessing and recording. With the development of IC modules, the size, powerrequirements and cost of DVMs have been reduced, so that DVMS compete withanalog voltmeters in portability and size. Their outstanding qualities are theiroperating and performance characteristics, as detailed below.
1. Input range from + 1.000 V to + 1000 V with automatic range selectionand overload indication
2. Absolute accuracy as high as ±0.005% of the reading3. Resolution 1 part in million (1 Jl,Vreading can be read or measured on
1 V range)4. Input resistance typically 10 MQ, input capacitance 40 pF5. Calibration internally from stabilised reference sources, independent of
measuring circuit
5.1INTRODUCTION
Digital Voltmeters
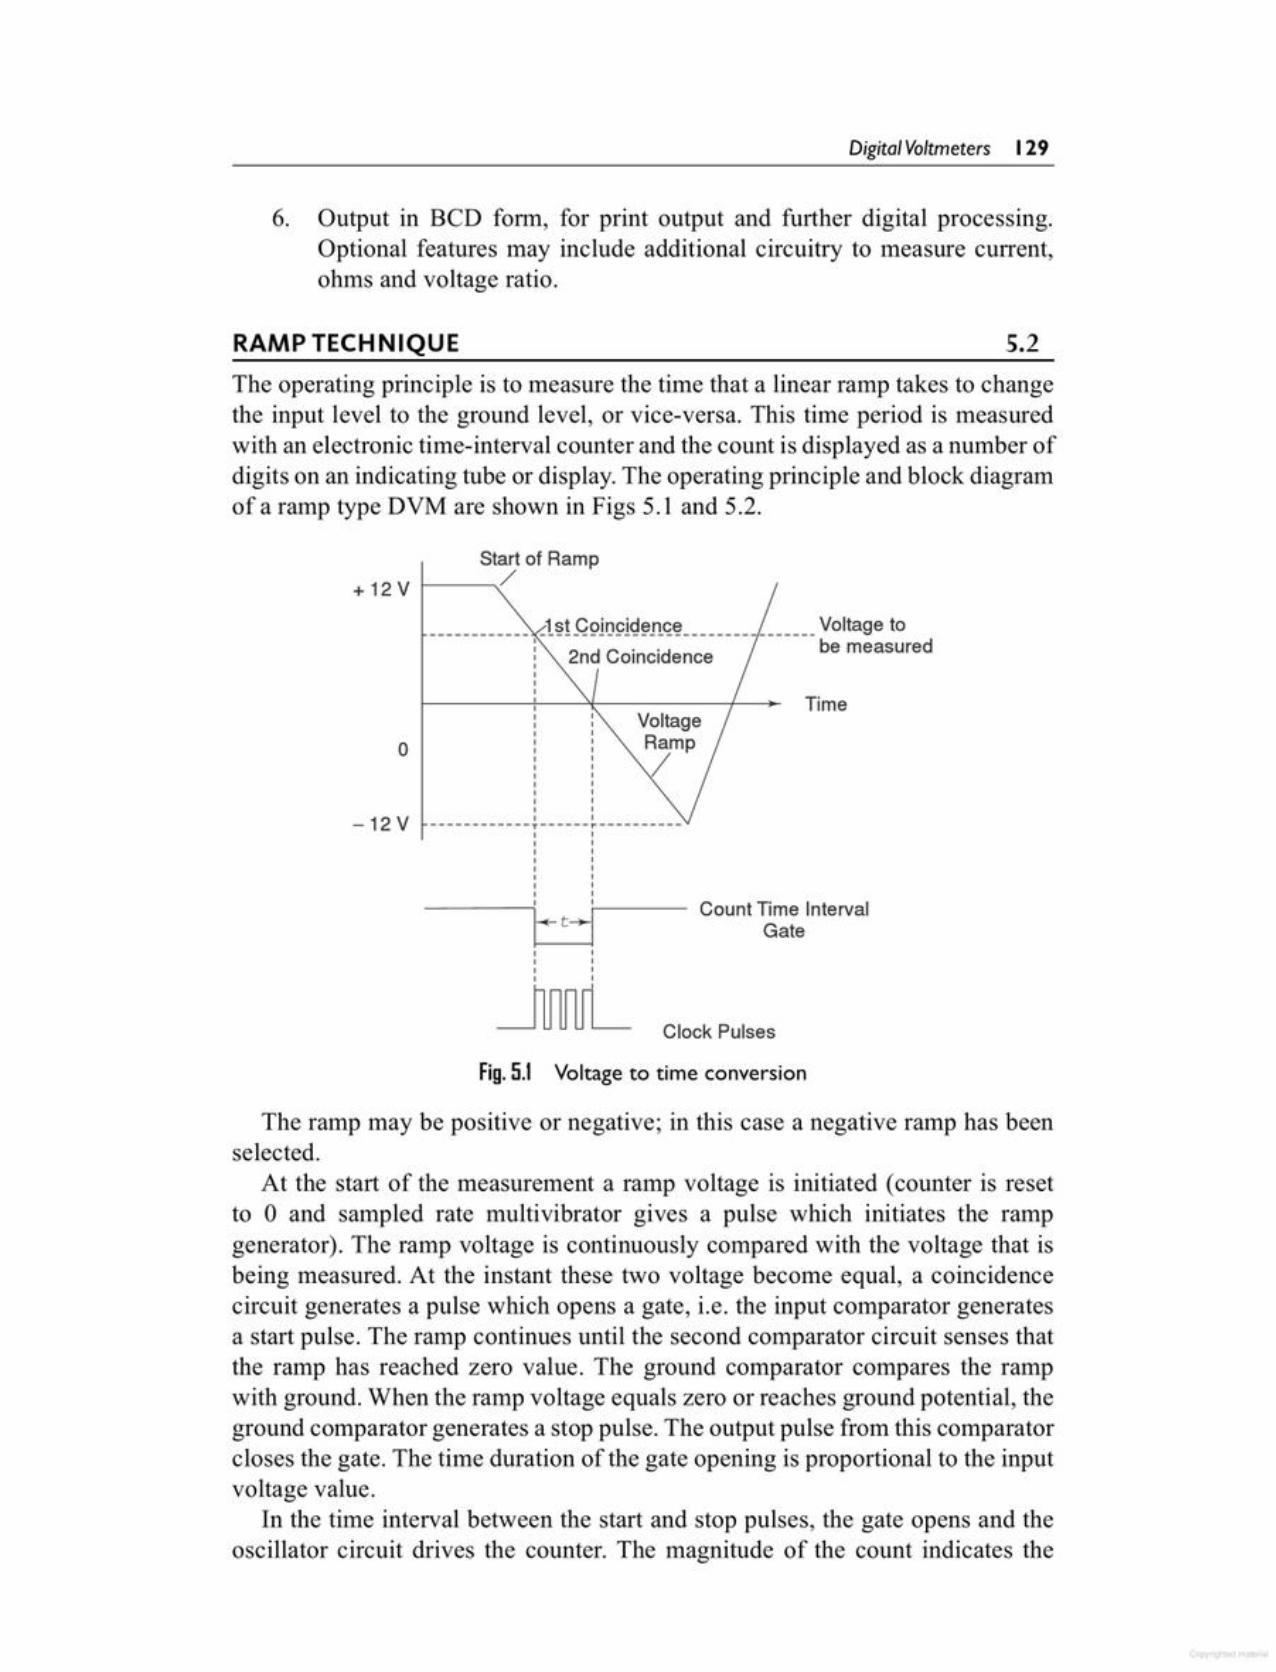
The ramp may be positive or negative; in this case a negative ramp has beenselected.
At the start of the measurement a ramp voltage is initiated (counter is resetto 0 and sampled rate multivibrator gives a pulse which initiates the rampgenerator). The ramp voltage is continuously compared with the voltage that isbeing measured. At the instant these two voltage become equal, a coincidencecircuit generates a pulse which opens a gate, i.e. the input comparator generatesa start pulse. The ralllp continues until the second comparator circuit senses thatthe ramp has reached zero value. The ground comparator compares the rampwith ground. When the ramp voltage equals zero or reaches ground potential, theground comparator generates a stop pulse. The output pulse from this comparatorcloses the gate. The time duration of the gate opening is proportional to the inputvoltage value.
In the time interval between the start and stop pulses, the gate opens and theoscillator circuit drives the counter. The magnitude of the count indicates the
Fig. 5.1 Voltage to time conversion
------------T------r----------, ,, ,,,,,,,----;' i---- Count Time IntervalI-+-tj Gate
, ,, ,, ,, ,_mm__Clock Pulses
-12 V
TimeVoltageRamp
2nd Coincidence
____________J!?!_g911J~lg~!!.~~ Voltage tobe measured
o
Start of Ramp+ 12 V 1---"""",'/
The operating principle is to measure the time that a linear ramp takes to changethe input level to the ground level, or vice-versa. This time period is measuredwith an electronic time-interval counter and the count is displayed as a number ofdigits on an indicating tube or display. The operating principle and block diagramof a ramp type DVM are shown in Figs 5.1 and 5.2.
5.2RAMP TECHNIQUE
6. Output in BCD form, for print output and further digital processing.Optional features may include additional circuitry to measure current,ohms and voltage ratio.
Digital Voltmeters 129
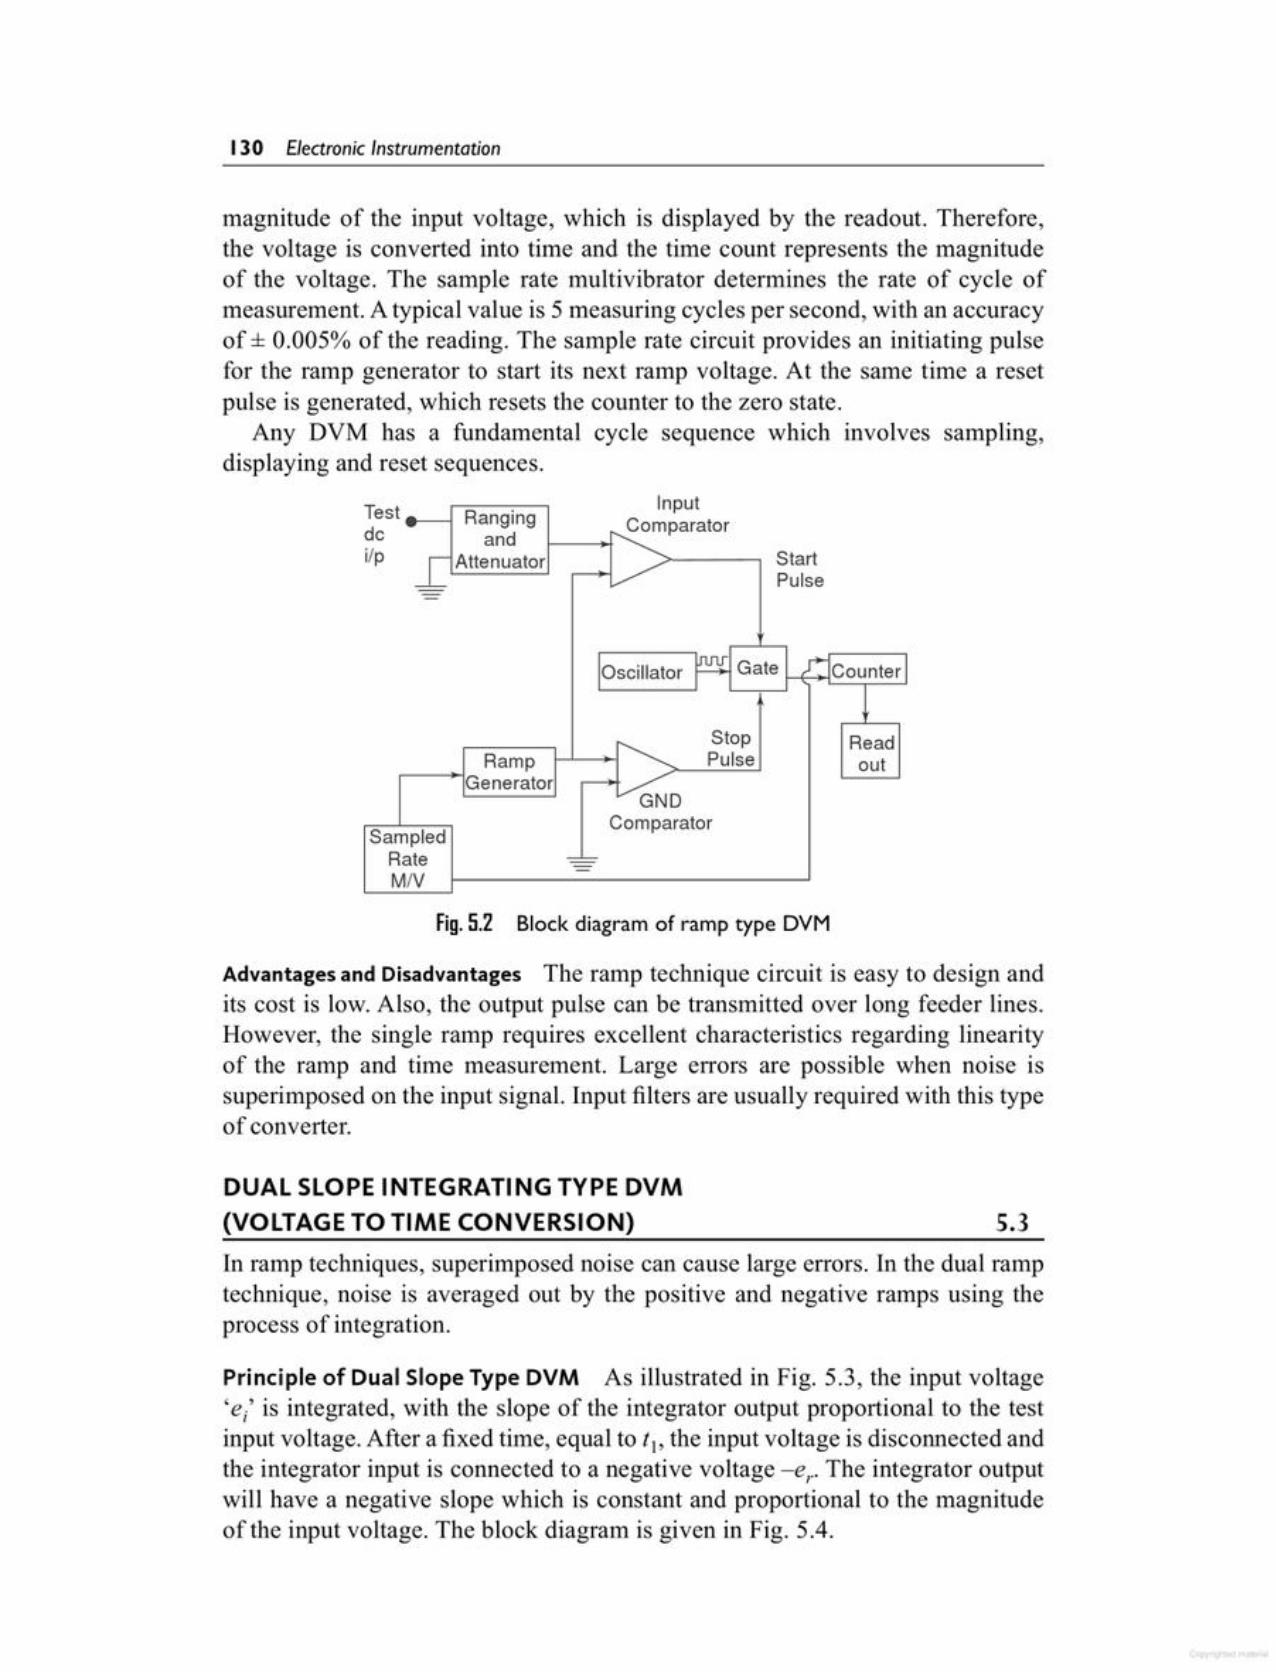
Principle of Dual Slope Type DVM As illustrated in Fig. 5.3, the input voltage'e/ is integrated, with the slope of the integrator output proportional to the testinput voltage. After a fixed time, equal to t., the input voltage is disconnected andthe integrator input is connected to a negative voltage -er. The integrator outputwill have a negative slope which is constant and proportional to the magnitudeof the input voltage. The block diagram is given in Fig. 5.4.
In ramp techniques, superimposed noise can cause large errors. In the dual ramptechnique, noise is averaged out by the positive and negative ramps using theprocess of integration.
5.3DUAL SLOPE INTEGRATING TYPE DVM(VOLTAGE TO TIME CONVERSION)
Advantages and Disadvantages The ramp technique circuit is easy to design andits cost is low. Also, the output pulse can be transmitted over long feeder lines.However, the single ramp requires excellent characteristics regarding linearityof the ramp and time measurement. Large errors are possible when noise issuperimposed on the input signal. Input filters are usually required with this typeof converter.
Fig. 5.2 Block diagram of ramp type DVM
tTest Rangingnpu
dc and ~paratori/p _[ Attenuator Start/ Pulse-
Oscillator ~ Gate ;j"Counter I
r-. Stop ReadRamp Pulse out
Generator~DComparator
SampledRate ==-M/V
magnitude of the input voltage, which is displayed by the readout. Therefore,the voltage is converted into time and the time count represents the magnitudeof the voltage. The sample rate multivibrator determines the rate of cycle ofmeasurement. A typical value is 5 measuring cycles per second, with an accuracyof ± 0.005% of the reading. The sample rate circuit provides an initiating pulsefor the ramp generator to start its next ramp voltage. At the same time a resetpulse is generated, which resets the counter to the zero state.
Any DVM has a fundamental cycle sequence which involves sampling,displaying and reset sequences.
130 Electronic Instrumentation
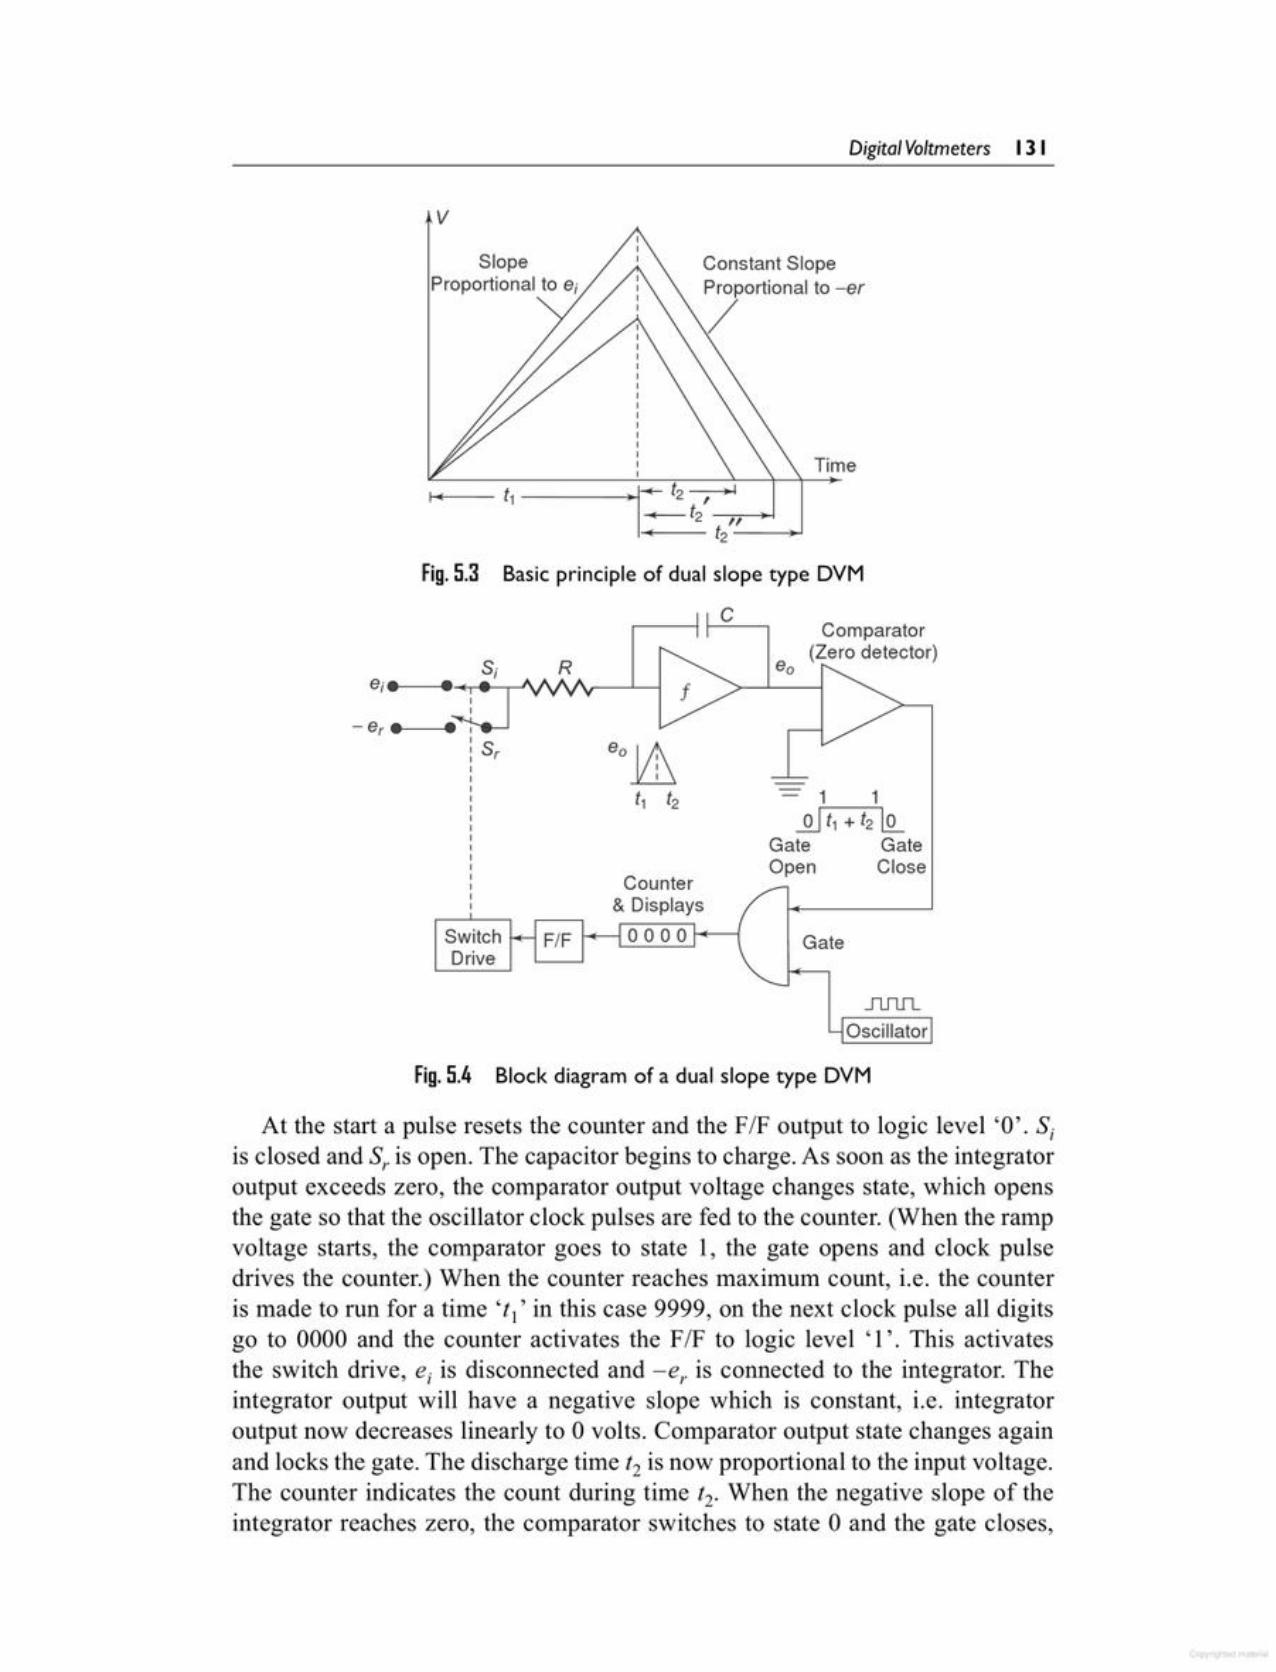
At the start a pulse resets the counter and the FIF output to logic level '0'. S,is closed and S, is open. The capacitor begins to charge. As soon as the integratoroutput exceeds zero, the comparator output voltage changes state, which opensthe gate so that the oscillator clock pulses are fed to the counter. (When the rampvoltage starts, the comparator goes to state 1, the gate opens and clock pulsedrives the counter.) When the counter reaches maximum count, i.e. the counteris made to run for a time 't)' in this case 9999, on the next clock pulse all digitsgo to 0000 and the counter activates the FIF to logic level '1'. This activatesthe switch drive, ei is disconnected and -er is connected to the integrator. Theintegrator output will have a negative slope which is constant, i.e. integratoroutput now decreases linearly to 0 volts. Comparator output state changes againand locks the gate. The discharge time t2 is now proportional to the input voltage.The counter indicates the count during time t2• When the negative slope of theintegrator reaches zero, the comparator switches to state 0 and the gate closes,
Fig. 5.4 Block diagram of a dual slope type DVM
JlJlI1_
Oscillator
GateSwitchDrive
1 1~
Gate GateOpen Close
Counter& Displays
F/F 0000
ei. •
Comparator(Zero detector)
C
~---~--------~·I~~,. t2---.-.,,---+-1---- t2--~
Fig. 5.3 Basic principle of dual slope type DVM
Time
Constant SlopeProportional to -er
/Slope
Proportional to ei
v
Digital Voltmeters 13 1

The principle of operation of an integrating type DVM is illustrated in Fig. 5.5.
5.4INTEGRATING TYPE DVM (VOLTAGE TO FREQUENCYCONVERSION)
eNow, n1 and e; are constants. Let K, = u: .Then ej =K, n2 (5.4)n1
From Eq. 5.3 it is evident that the accuracy of the measured voltage isindependent of the integrator time constant. The times tI and t2 are measured bythe count of the clock given by the numbers nl and n2 respectively. The clockoscillator period equals T and if n, and e, are constants, then Eq. 5.4 indicatesthat the accuracy of the method is also independent of the oscillator frequency.
The dual slope technique has excellent noise rejection because noise andsuperimposed ac are averaged out in the process of integration. The speed andaccuracy are readily varied according to specific requirements; also an accuracyof ± 0.05% in 100 ms is available.
n21.e. ei= -er
n1...
(5.3)12e·=e-I r t
IIf the oscillator period equals T and the digital counter indicates n I and n2
counts respectively,
(5.2)
t,1 J- d e, t2e = -e t=--'--.=_
o RC r RCoSubtracting Eqs 5.2 from 5.1 we have
(5.1)During discharging
i.e. the capacitor C is now discharged with a constant slope. As soon as thecomparator input (zero detector) finds that eo is zero, the counter is stopped. Thepulses counted by the counter thus have a direct relation with the input voltage.
During charging
132 Electronic Instrumentation
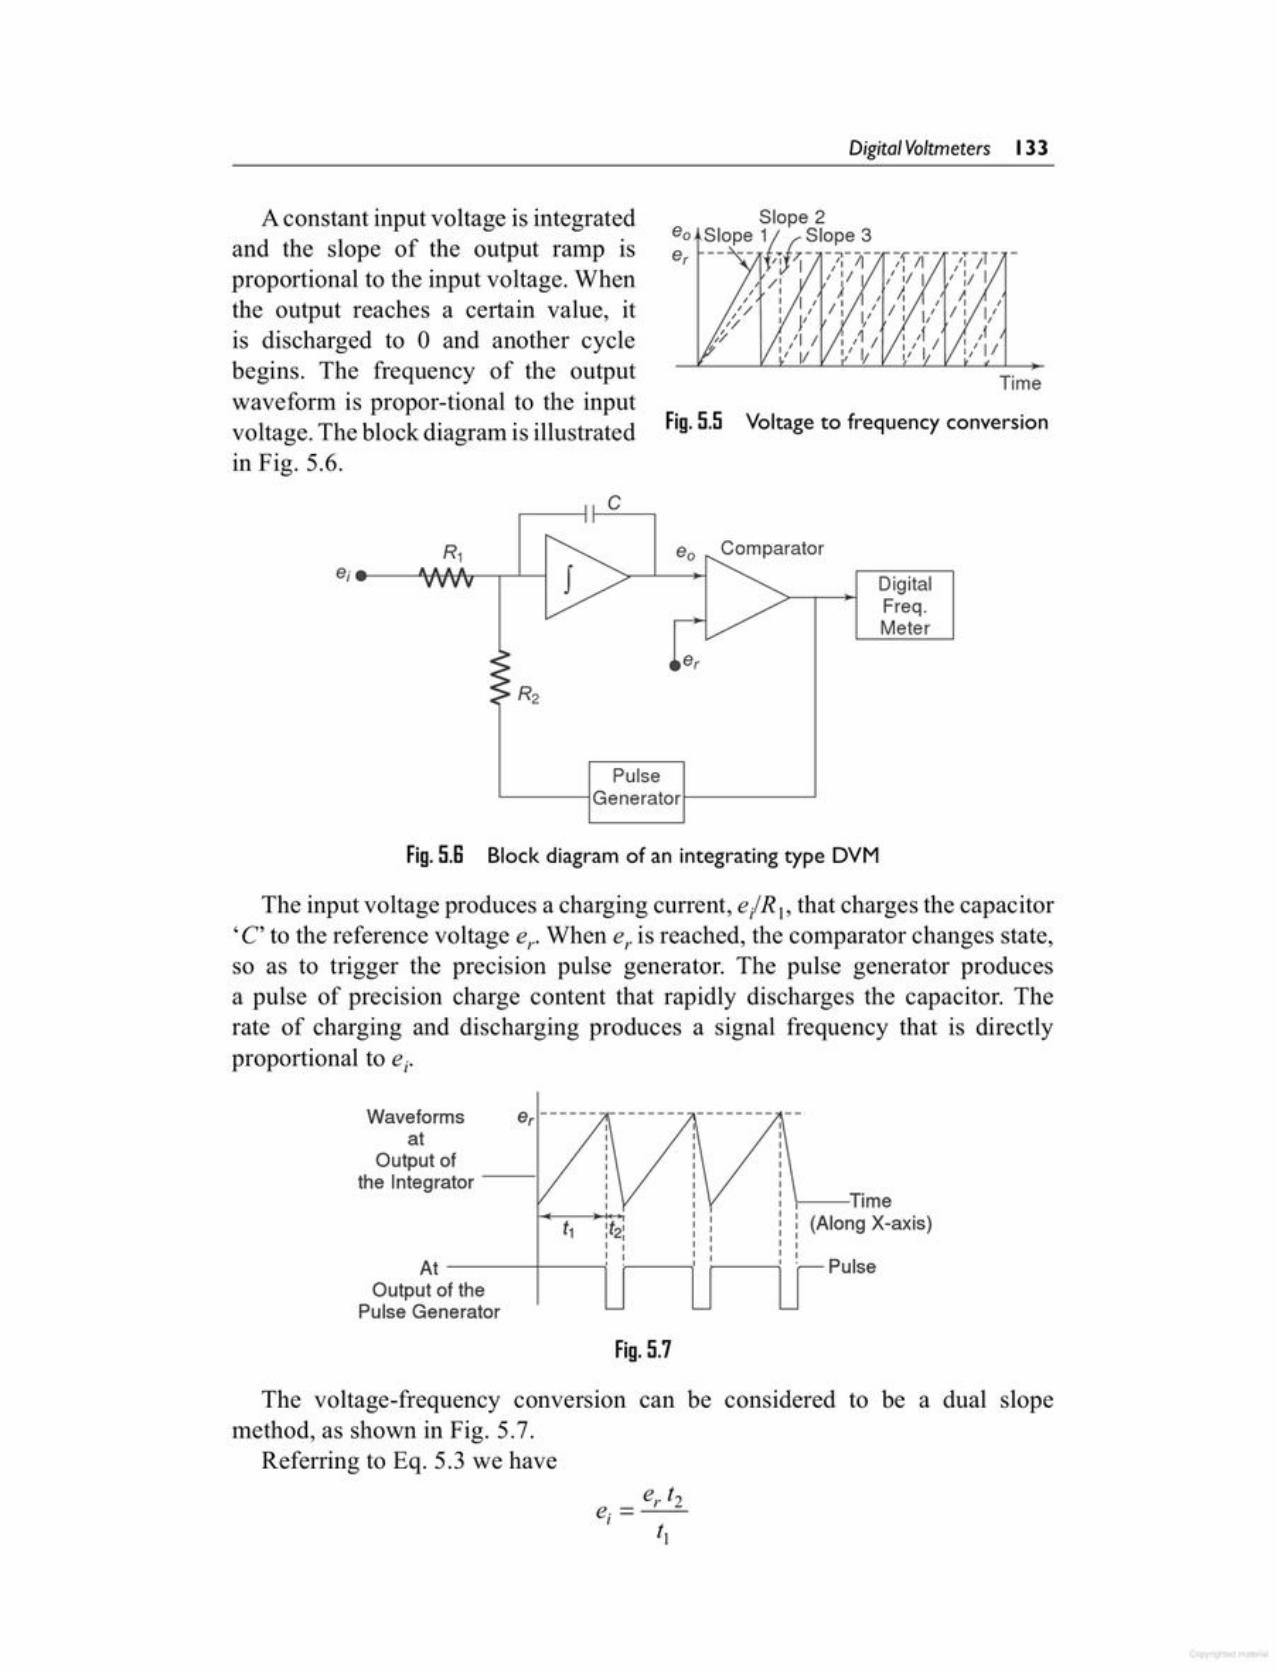
er t2e· = _:_.::..I t
I
The voltage-frequency conversion can be considered to be a dual slopemethod, as shown in Fig. 5.7.
Referring to Eq. 5.3 we have
Pulse
\---Time(Along X-axis)
Fig. 5.7
e ------ -------r ,Waveformsat
Output ofthe Integrator
't2', ,, ,, ,At------~--~· 'r---~
Output of thePulseGenerator
The input voltage produces a charging current, e/R I, that charges the capacitor'C' to the reference voltage e,..When e, is reached, the comparator changes state,so as to trigger the precision pulse generator. The pulse generator producesa pulse of precision charge content that rapidly discharges the capacitor. Therate of charging and discharging produces a signal frequency that is directlyproportional to ei.
Fig.5.S Block diagram of an integrating type DVM
er
DigitalFreq.Meter
Comparator
Fig. 5.5 Voltage to frequency conversion
Time
Pulsel-----lGeneratorl------l
C
A constant input voltage is integratedand the slope of the output ramp isproportional to the input voltage. Whenthe output reaches a certain value, itis discharged to 0 and another cyclebegins. The frequency of the outputwaveform is propor-tional to the inputvoltage. The block diagram is illustratedin Fig. 5.6.
Digital Voltmeters 133
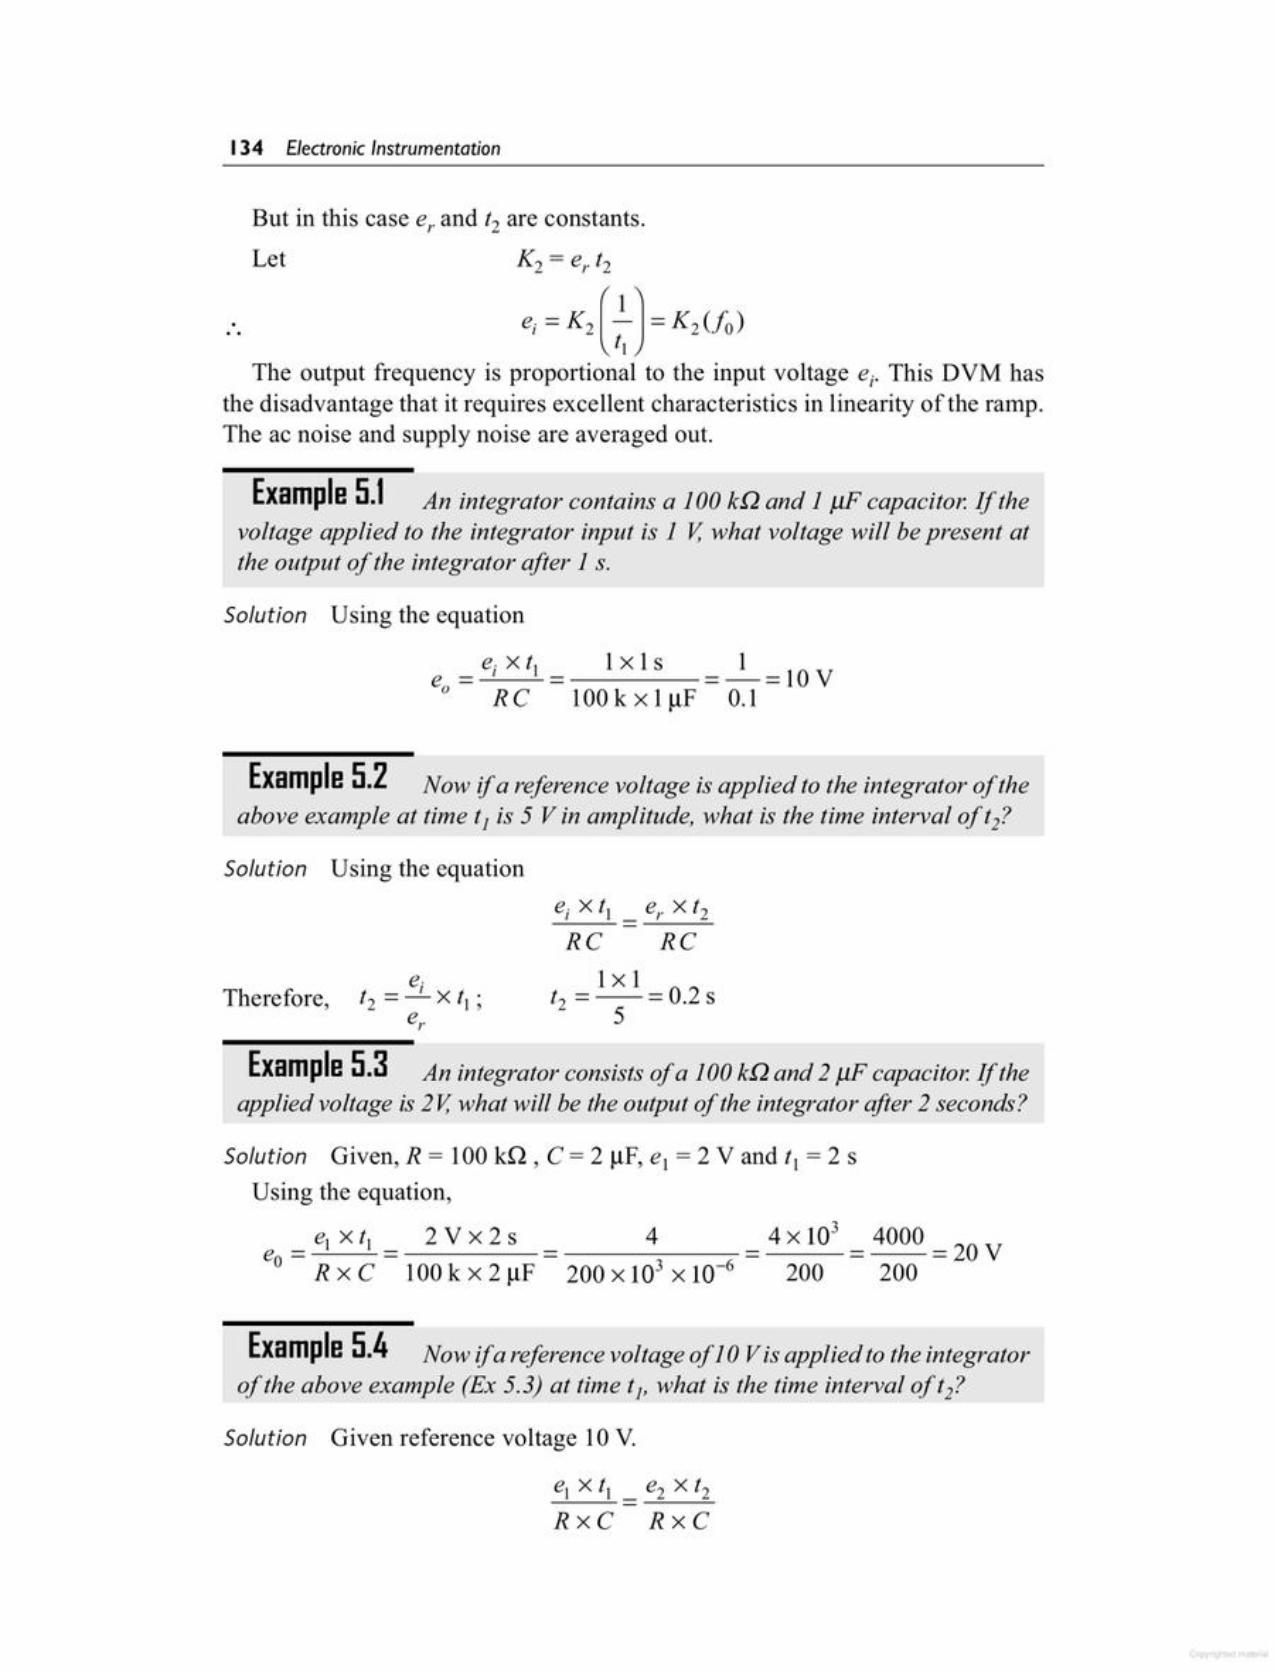
el x tl _ e2 x t2
RxC RxC
Solution Given reference voltage 10 V.
Example 5.4 Now ifa reference voltage of 10 Vis applied to the integratorof the above example (Ex 5.3) at time t], what is the time interval oft2?
Solution Given, R = 100 kQ, C= 2 IlF, el = 2 V and tl = 2 sUsing the equation,
e = e] x t, = 2 V x 2 s = 4 = 4 X 103 = 4000 = 20 Vo RxC 100kx21lF 200x103xlO-6 200 200
Example 5.3 An integrator consists of a 100 sa and 21JF capacitor. If theapplied voltage is 2V,what will be the output of the integrator after 2 seconds?
ej x tl _ er x t2
RC RC1x1
t2 = = 0.2 s5
e·Therefore, t2 = -' X tl ;
er
Solution Using the equation
Example 5.2 Now if a reference voltage is applied to the integrator of theabove example at time t] is 5 V in amplitude, what is the time interval oft2?
e = ej x tl _ 1xIs = _1_ = 10 Vo RC 100kx11lF 0.1
Solution Using the equation
Example 5.1 An integrator contains a 100 kQ and 1 IJF capacitor. If thevoltage applied to the integrator input is 1V, what voltage will be present atthe output of the integrator after 1s.
e, =K,G) = K,(!o)The output frequency is proportional to the input voltage ej• This DVM has
the disadvantage that it requires excellent characteristics in linearity of the ramp.The ac noise and supply noise are averaged out.
Let
But in this case e,. and t2 are constants.
134 Electronic Instrumentation

Fig. 5.9 Staircase waveform
0--1
DAC Output
~-S~rt ~-S~p
_J"'r------f/----. Gate Open
I Gate Close: Vi
Block diagram of a staircaseramp type
Fig. 5.8
v'L~a ra torRef.v. DACI . Voltage
~\Counter -- Display
Clock _)Reset / Start
Operation of the Circuit The clockgenerates pulses continuously.At the start of a measurement, thecounter is reset to 0 at time f 1 so thatthe output of the digital to analogconverter (DAC) is also O.If ~ is notequal to zero, the input comparatorapplies an output voltage that opensthe gate so that clock pulses arepassed on to the counter through thegate. The counter starts countingand the DAC starts to produce anoutput voltage increasing by one small step at each count of the counter. Theresult is a staircase voltage applied to the second input of the comparator, asshown in Fig. 5.9.
This process continues until the staircase voltage is equal to or slightlygreater than the input voltage ~. At that instant f2' the output voltage of the inputcomparator changes state or polarity, so that the gate closes and the counter isstopped.
The Staircase Ramp The basic principle is that the input signal ~ is comparedwith an internal staircase voltage, Vc> generated by a series circuit consisting ofa pulse generator (clock), a counter counting the pulses and a digital to analogconverter, converting the counteroutput into a de signal. As soon as Vcis equal to ~, the input comparatorcloses a gate between the clock andthe counter, the counter stops andits output is shown on the display.The basic block diagram is shownin Fig. 5.8.
5.5.1 Direct CompensationThe input signal is compared with an internally generated voltage which isincreased in steps starting from zero. The number of steps needed to reach thefull compensation is counted. A simple compensation type is the staircase ramp.
MOST COMMONLY USED PRINCIPLES OF ADC (ANALOG TO DIGITALCONVERSION) 5.5
therefore,
Digital Voltmeters 135

The successive approximation principle can be easily understood using a simpleexample; the determination of the weight of an object. By using a balance andplacing the object on one side and an approximate weight on the other side, theweight of the object is determined.
If the weight placed is more than the unknown weight, the weight is removedand another weight of smaller value is placed and again the measurement isperformed. Now if it is found that the weight placed is less than that of theobject, another weight of smaller value is added to the weight already present,and the measurement is performed. If it is found to be greater than the unknownweight the added weight is removed and another weight of smaller valueis added. In this manner by adding and removing the appropriate weight, theweight of the unknown object is determined. The successive approximationDVM works on the same principle. Its basic block diagram is shown inFig. 5.10. When the start pulse signal activates the control circuit, the successiveapproximation register (SAR) is cleared. The output of the SAR is 00000000.VOU! of the DIA converter is o. Now, if Vin> VOU! the comparator output is positive.During the first clock pulse, the control circuit sets the D7 to 1, and Voutjumps tothe half reference voltage. The SAR output is 10000000. If VOll!is greater thanVin, the comparator output is negative and the control circuit resets D7. However,if Vin is greater than VOU!' the comparator output is positive and the control circuitskeeps D7 set. Similarly the rest of the bits beginning from D7 to Do are set andtested. Therefore, the measurement is completed in 8 clock pulses.
5.6SUCCESSIVE APPROXIMATIONS
The display unit shows the result of the count. As each count corresponds toa constant dc step in the DAC output voltage, the number of counts is directlyproportional to Vc and hence to Vi.By appropriate choice of reference voltage,the step height of the staircase voltage can be determined. For example, eachcount can represent l mV and direct reading of the input voltage in volts can berealised by placing a decimal point in front of the 10 decade.
The advantages of a staircase type DVM are as follows:1. Input impedance of the DAC is high when the compensation is reached.2. The accuracy depends only on the stability and accuracy of the voltage
and DAC. The clock has no effect on the accuracy.The disadvantages are the following:1. The system measures the instantaneous value of the input signal at the
moment compensation is reached. This means the reading is ratherunstable, i.e. the input signal is not a pure de voltage.
2. Until the full compensation is reached, the input impedance is low,which can influence the accuracy.
136 Electronic Instrumentation
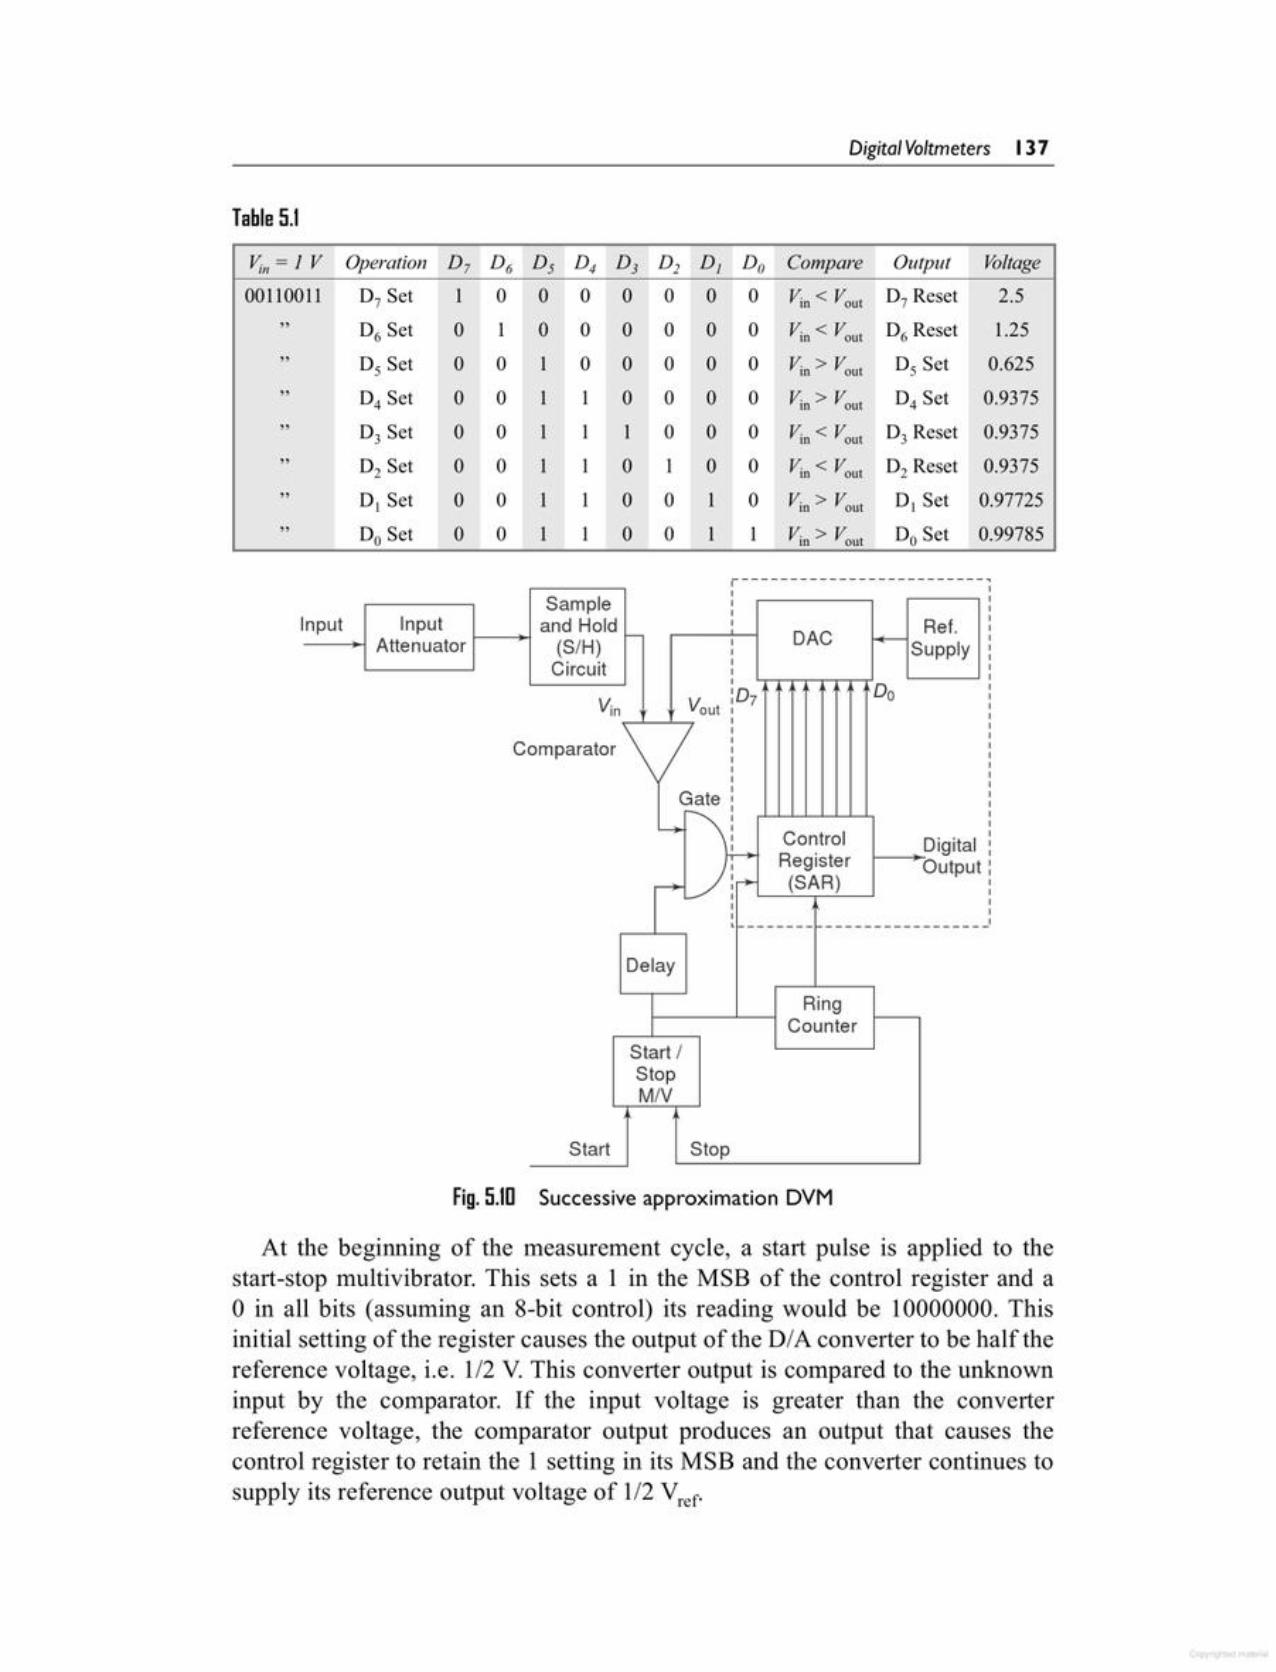
At the beginning of the measurement cycle, a start pulse is applied to thestart-stop multivibrator. This sets a 1 in the MSB of the control register and ao in all bits (assuming an 8-bit control) its reading would be 10000000. Thisinitial setting of the register causes the output of the DIA converter to be half thereference voltage, i.e. 1/2 V.This converter output is compared to the unknowninput by the comparator. If the input voltage is greater than the converterreference voltage, the comparator output produces an output that causes thecontrol register to retain the 1 setting in its MSB and the converter continues tosupply its reference output voltage of 1/2 Vref.
Fig.S.ID Successive approximation DVM
Start StopL_~ ~
Start IStopM/V
RingCounter
Delay
--------~----------------
Digital1-- Output
Do
Ref.SupplyDAC,,,,,
'0Vin Vout 7
Comparator \/
Gate
--~ Control}f-+- Register
-- __/ -+-c_______:.(S_Ar-R:...._)__J
nputSample
Input I--__.j and Hold _---+I Attenuator (S/H)
Circuit
r-------------------------~,,,,
V;1l = 1V Operation D7 D6 Dj D4 D3 D2 DJ Do Compare Output Voltage00110011 D7 Set 1 0 0 0 0 0 0 0 Vi" < VOlll D7 Reset 2.5
" D6 Set 0 1 0 0 0 0 0 0 Vi" < VOU! D6 Reset 1.25
" D, Set 0 0 1 0 0 0 0 0 Vi" > VOU! D, Set 0.625
" D4 Set 0 0 1 1 0 0 0 0 Vin> VOUI D4 Set 0.9375
" D3 Set 0 0 1 1 J 0 0 0 Vin < VOUI D3 Reset 0.9375
" D2 Set 0 0 I I 0 I 0 0 ViI!< VOlll D2 Reset 0.9375
" D, Set 0 0 I 1 0 0 I 0 Via> VOlll D, Set 0.97725
" Do Set 0 0 1 1 0 0 1 I Vin> VOlll Do Set 0.99785
Table S.1
Digital Voltmeters 137

Therefore, Vin nearly equals VOUI' i.e. Vin = 1 Vand Vout = 0.99785. The mainadvantage of this method is speed. At best it takes n clock pulses to producean n bit result. Even if the set, test, set or reset operation takes more than 1clock pulse, the SAR method is still considerably faster than the counter method.However the control circuit is more complex in design and cost is enhanced. Thisdigital voltmeter is capable of 1000 readings per second.
With input voltages greater than de, the input level changes during digitisationand decisions made during conversion are not consistent. To avoid this error, a
Fig. 5.11 Various output levels for each bit (a-Bit shows the voltage levelvery nearly equal to IV)
Final Reading- -- --- -----
I{}({)- 00_I{} Ol I'- I'- Ol,.... III 1'-- (j)(/)oOl (j) Ol (j),...:a: .(/)
0 0
6 7 8 Time
.... I{}LOQ) I{} 1'-- C")-C\lC/) C\j- C") Ol c» Ol
Q) ({)Ol (j)(/) o III'-a: .(/) .Ol
0 0 ,....a:2 3 4 5
1.5
2
ConverterVoltage 2.5Level
4
3
v
Example Suppose the converter can measure a maximum of 5 V, i.e. 5 Vcorresponds to the maximum count of 11111111. Ifthe test voltage ~n = 1 Vthefollowing steps will take place in the measurement. (Refer to Table 5.1 andFig. 5.11.)
The ring counter then advances one count, shifting a 1 in the second MSBof the control register and its reading becomes 11000000. This causes the DIAconverter to increase its reference output by 1 increment to 1/4 V, i.e. 1/2 V +1/4 V, and again it is compared with the unknown input. If in this case the totalreference voltage exceeds the unknown voltage, the comparator produces anoutput that causes the control register to reset its second MSB to O.The converteroutput then returns to its previous value of 1/2 V and awaits another input fromthe SAR. When the ring counter advances by 1, the third MSB is set to 1 and theconverter output rises by the next increment of 1/2 V + 1/8 V. The measurementcycle thus proceeds through a series of successive approximations. Finally, whenthe ring counter reaches its final count, the measurement cycle stops and thedigital output of the control register represents the final approximation of theunknown input voltage.
138 Electronic Instrumentation
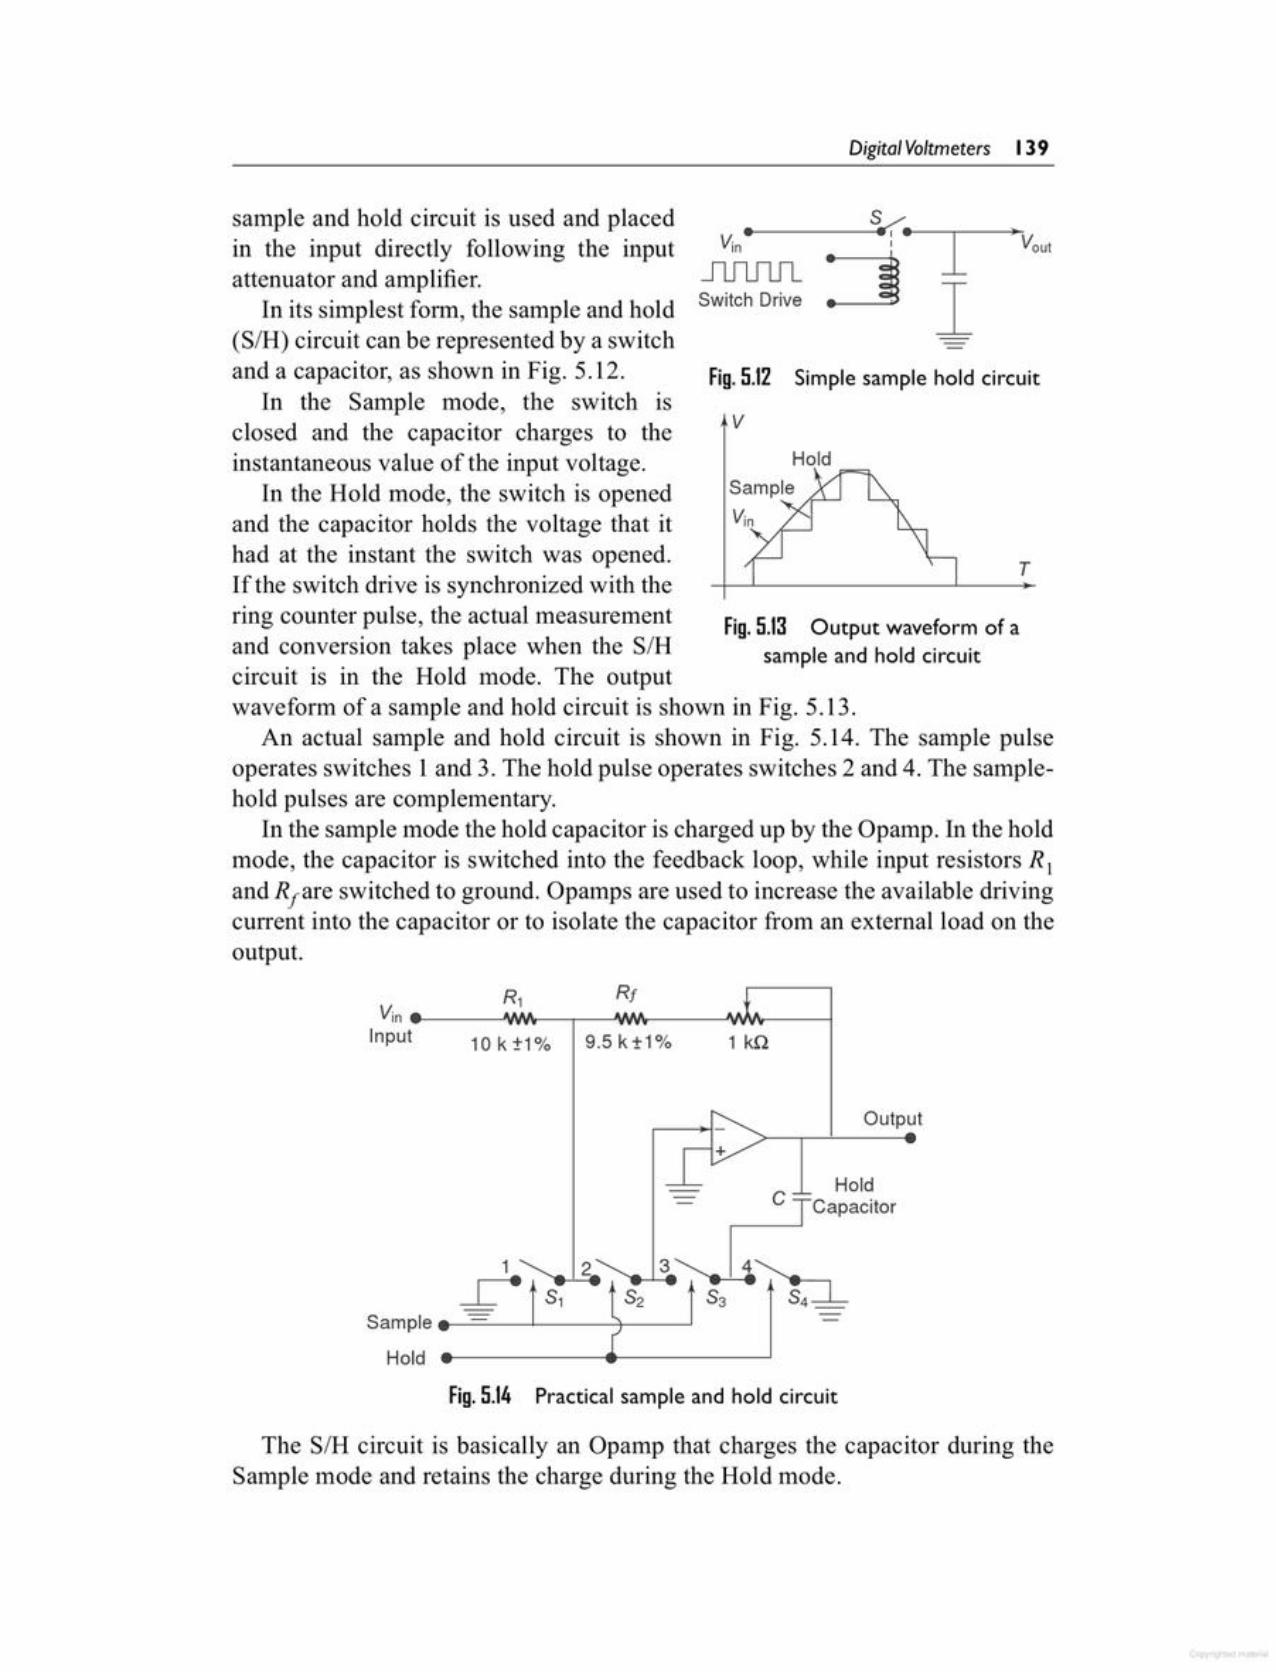
The SIH circuit is basically an Opamp that charges the capacitor during theSample mode and retains the charge during the Hold mode.
Fig.5.14 Practical sample and hold circuit
Output
1 kQ
Fig.5.13 Output waveform of asample and hold circuit
T
Hold
V
Simple sample hold circuitFig.5.12
•
Sample ._-=----1----+-----'Hold
e, RfVin e_----'V1N1r--.---'VWr---'l'IW'..-----iInput
sample and hold circuit is used and placedin the input directly following the inputattenuator and amplifier. JlJlJl.fL
Switch DriveIn its simplest form, the sample and hold(S/H) circuit can be represented by a switchand a capacitor, as shown in Fig. 5.12.
In the Sample mode, the switch isclosed and the capacitor charges to theinstantaneous value of the input voltage.
In the Hold mode, the switch is openedand the capacitor holds the voltage that ithad at the instant the switch was opened.If the switch drive is synchronized with thering counter pulse, the actual measurementand conversion takes place when the SIRcircuit is in the Hold mode. The outputwaveform of a sample and hold circuit is shown in Fig. 5.13.
An actual sample and hold circuit is shown in Fig. 5.14. The sample pulseoperates switches 1 and 3. The hold pulse operates switches 2 and 4. The samplehold pulses are complementary.
In the sample mode the hold capacitor is charged up by the Opamp. In the holdmode, the capacitor is switched into the feedback loop, while input resistors R Iand Rfare switched to ground. Opamps are used to increase the available drivingcurrent into the capacitor or to isolate the capacitor from an external load on theoutput.
Digital Voltmeters 139
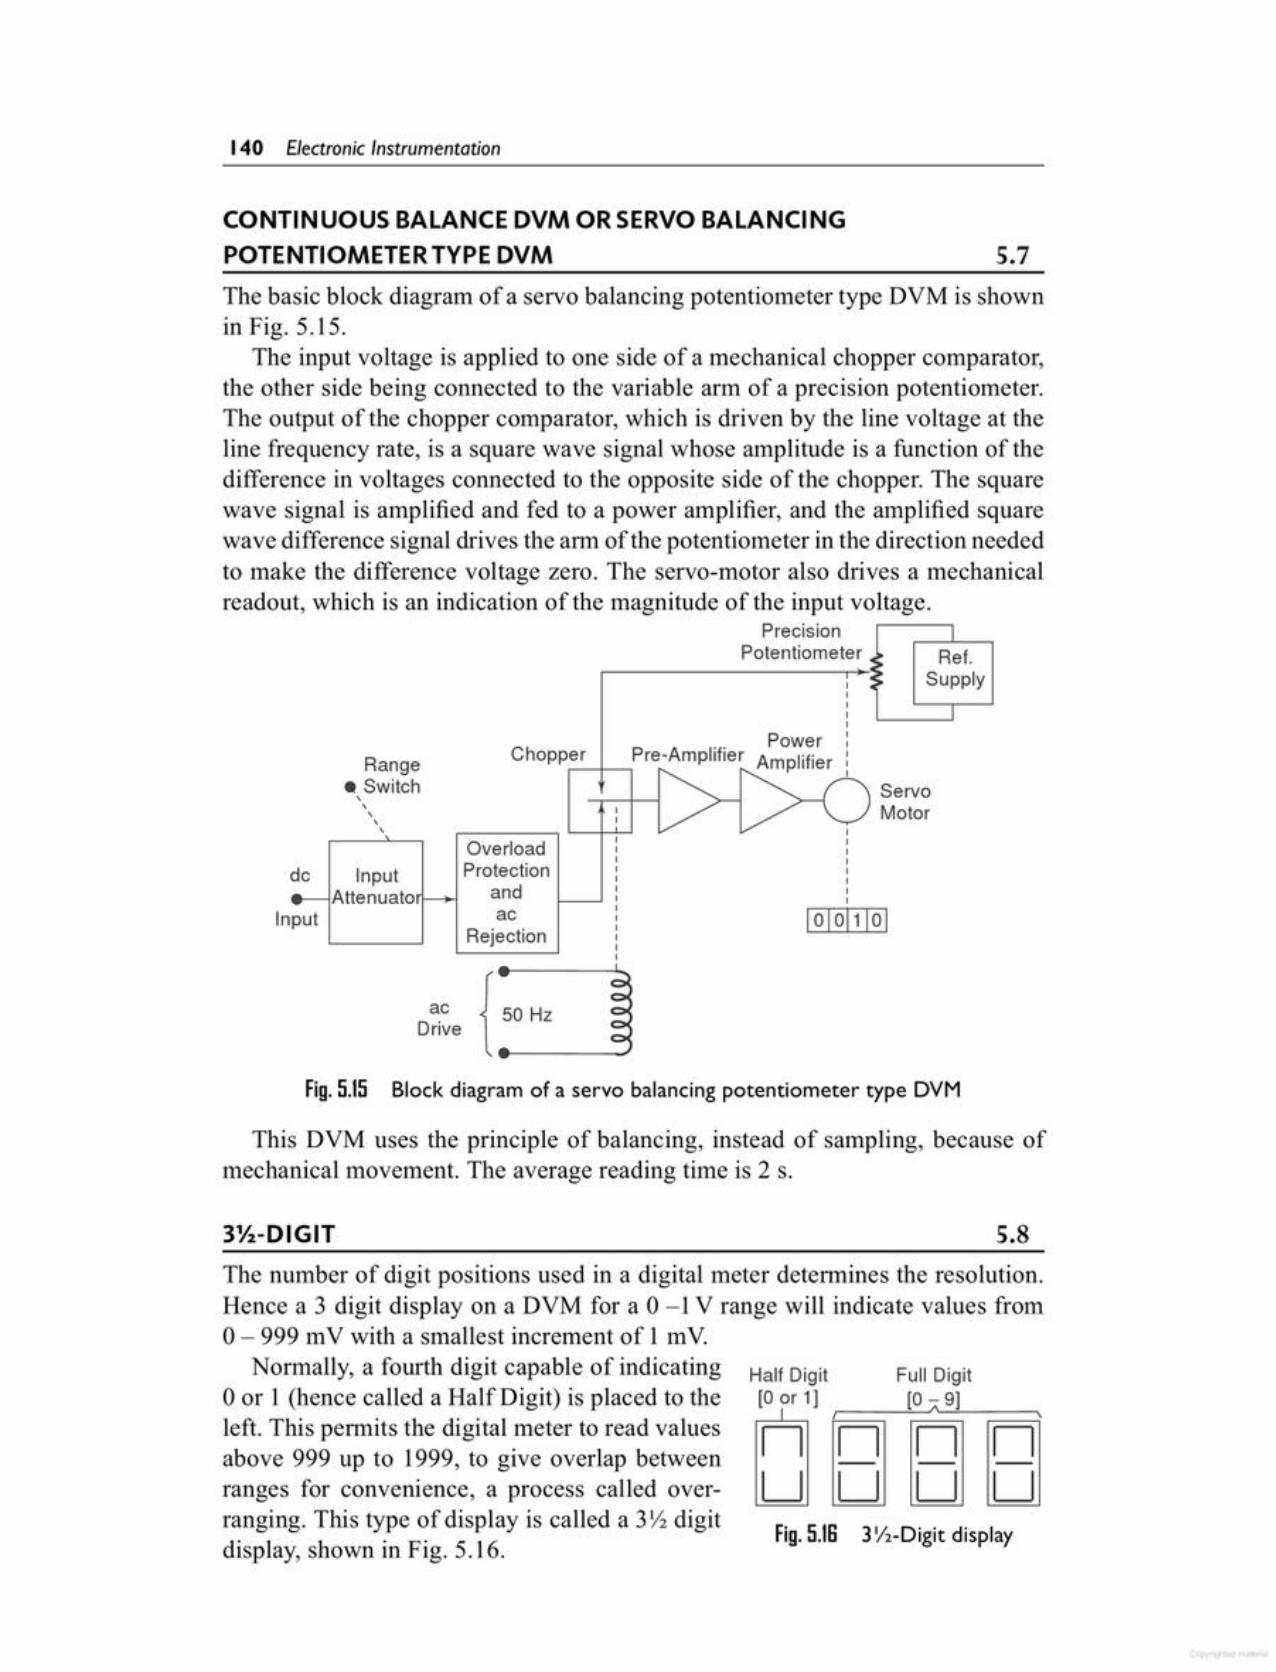
3Y2-DigitdisplayFig.5.IS
Full Digit[0 -9]A
n n n- - -U U U
Half Digit[0 or 1]
InU
The number of digit positions used in a digital meter determines the resolution.Hence a 3 digit display on a DVM for a 0 -1V range will indicate values fromo - 999 mV with a smallest increment of 1 mV.
Normally, a fourth digit capable of indicatingo or 1 (hence called a Half Digit) is placed to theleft. This permits the digital meter to read valuesabove 999 up to 1999, to give overlap betweenranges for convenience, a process called overranging. This type of display is called a 312digitdisplay, shown in Fig. 5.16.
5.83Yz-DIGIT
This DVM uses the principle of balancing, instead of sampling, because ofmechanical movement. The average reading time is 2 s.
Fig. 5.15 Block diagram of a servo balancing potentiometer type DVM
50 HzacDrive
Input
dc Input'--lA ttenuato rL..._....
ServoMotor
OverloadProtection
andac
Rejection
. . PowerChopp,-er---+----,Pre-AmpllflerAmplifierRange
• Switch,,,,,
Ref.Supply
PrecisionPotentiometer
The basic block diagram of a servo balancing potentiometer type DVM is shownin Fig. 5.15.
The input voltage is applied to one side of a mechanical chopper comparator,the other side being connected to the variable arm of a precision potentiometer.The output of the chopper comparator, which is driven by the line voltage at theline frequency rate, is a square wave signal whose amplitude is a function of thedifference in voltages connected to the opposite side of the chopper. The squarewave signal is amplified and fed to a power amplifier, and the amplified squarewave difference signal drives the ann of the potentiometer in the direction neededto make the difference voltage zero. The servo-motor also drives a mechanicalreadout, which is an indication of the magnitude of the input voltage.
5.7CONTINUOUS BALANCE DVM OR SERVO BALANCINGPOTENTIOMETER TYPE DVM
140 Electronic Instrumentation

Solution(i) Resolution = 1/1011 = 1/104 = 0.0001
where the number of full digits is n = 4(ii) There are 5 digit places in 4'li digits, therefore 12.98 would be displayed
as 12.980.Resolution on 1 V range is 1 V x 0.0001 = 0.0001Any reading up to the 4th decimal can be displayed.Hence 0.6973 will be displayed as 0.6973.
(iii) Resolution on 10 V range = 10 V x 0.0001 = 0.001 VHence decimals up to the 3rd decimal place can be displayed.Therefore on a 10 V range, the reading will be 0.697 instead of 0.6973.
Example 5.S A 412digit voltmeter is usedfor voltage measurements.(i) Find its resolution
(it) How would 12.98 V be displayed on a 10 V range?(iii) How would O.6973 be displayed on 1 V and 10 V ranges.
Solution Number of full digits is 3. Therefore, resolution is 1/l O"where n = 3.Resolution R = 1/103 = 1/1000 = 0.001
Hence the meter cannot distinguish between values that differ from each otherby less than 0.001 of full scale.
For full scale range reading of 1V, the resolution is 1 x 0.001 = 0.001 V.For full scale reading of 10 V range, the resolution is 10 V x 0.001 = 0.01 V.Hence on 10V scale, the meter cannot distinguish between readings that differ
by less than 0.01 V.
Example 5.5 What is the resolution of a 312digit display on 1 Vand 10 Vranges?
Sensitivity of Digital Meters Sensitivity is the smallest change in input whicha digital meter is able to detect. Hence, it is the full scale value of the lowestvoltage range multiplied by the meter's resolution.
Sensitivity S = (ft)min x Rwhere (fs)min= lowest full scale of the meter
R = resolution expressed as decimal
1 1R=-=-=O.OOI orO.1 %
1011 103Ifn = 3,
Resolution If n = number of full digits, then resolution (R) is 1/1011•
The resolution of a DVM is determined by the number of full or active digitsused,
5.9RESOLUTION AND SENSITIVITY OF DIGITAL METERS
Digital Voltmeters 141
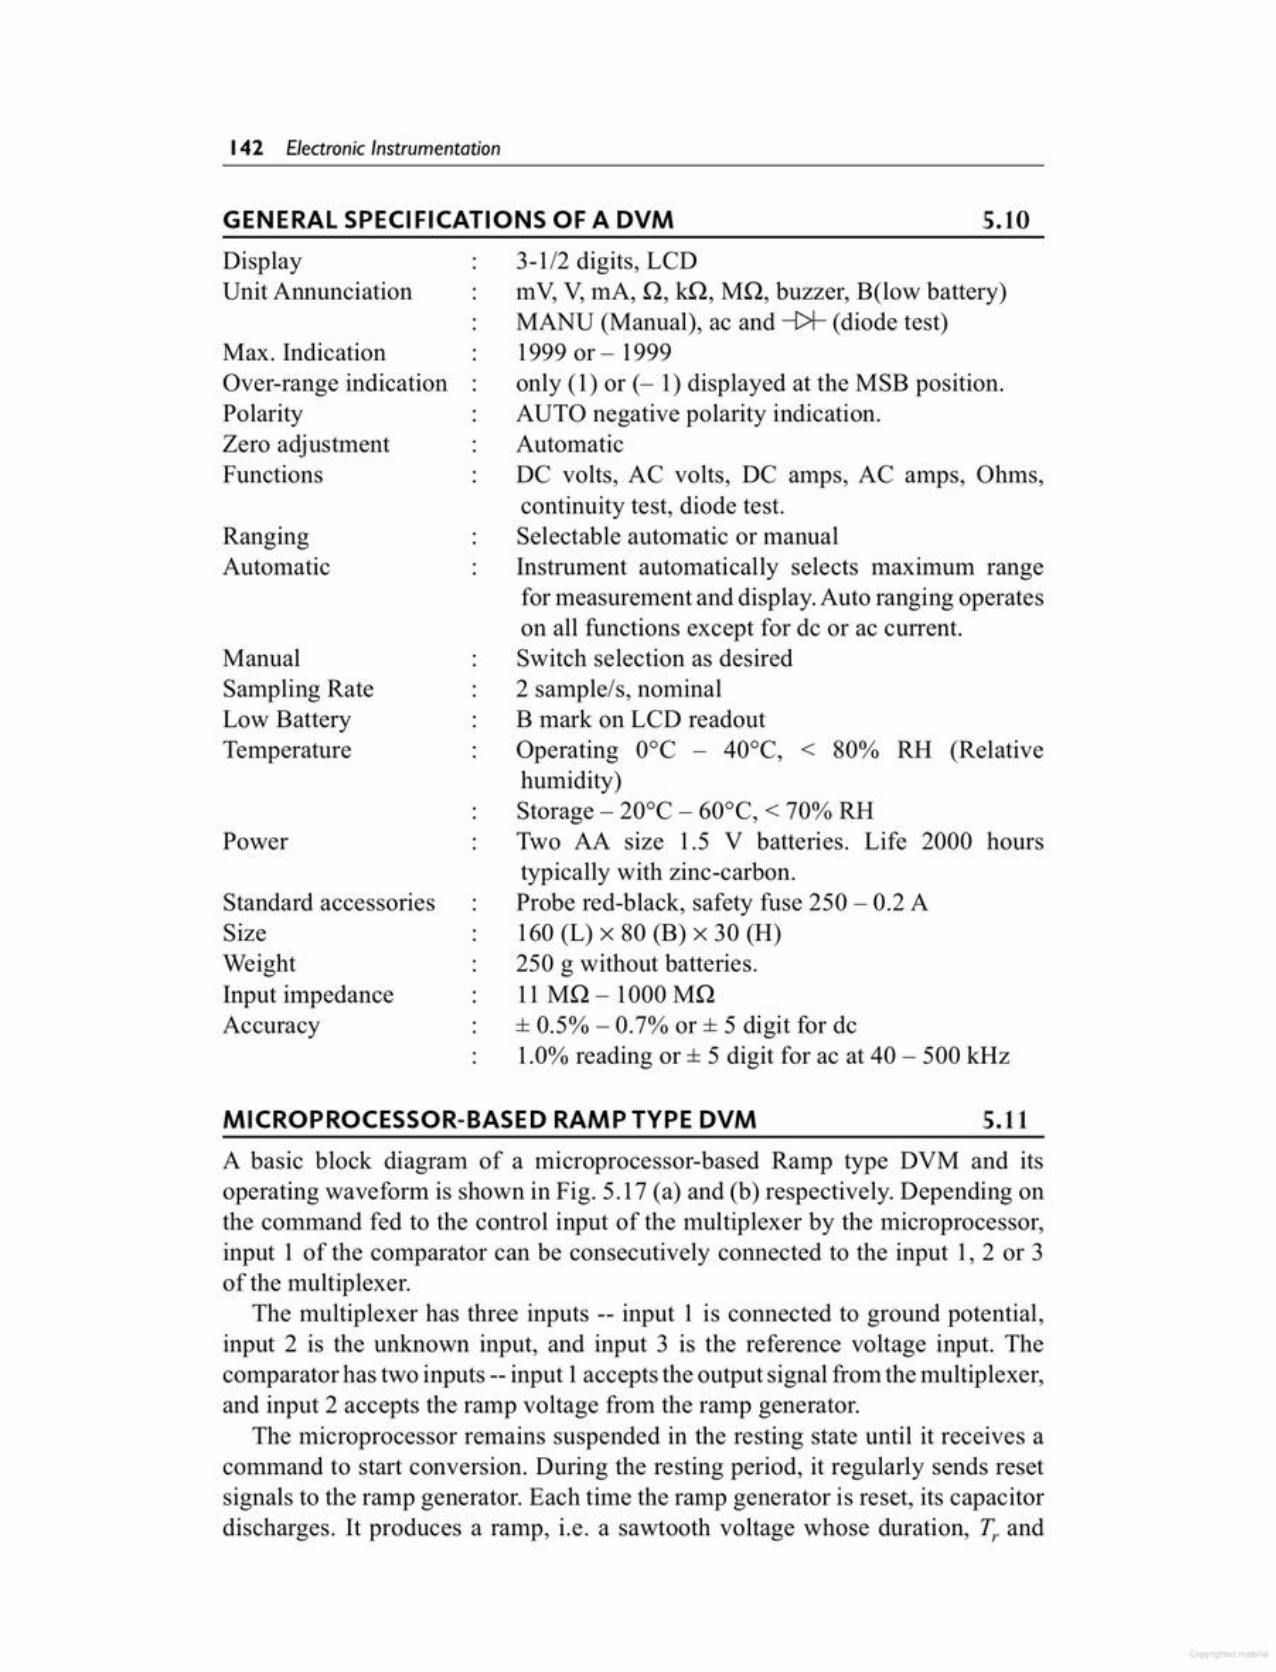
A basic block diagram of a microprocessor-based Ramp type DVM and itsoperating waveform is shown in Fig. 5.17 (a) and (b) respectively. Depending onthe command fed to the control input of the multiplexer by the microprocessor,input 1 of the comparator can be consecutively connected to the input 1, 2 or 3of the multiplexer.
The multiplexer has three inputs -- input 1 is connected to ground potential,input 2 is the unknown input, and input 3 is the reference voltage input. Thecomparator has two inputs -- input 1accepts the output signal from the multiplexer,and input 2 accepts the ramp voltage from the ramp generator.
The microprocessor remains suspended in the resting state until it receives acommand to start conversion. During the resting period, it regularly sends resetsignals to the ramp generator. Each time the ramp generator is reset, its capacitordischarges. It produces a ramp, i.e. a sawtooth voltage whose duration, T,. and
5.11MICROPROCESSOR-BASED RAMP TYPE DVM
Standard accessoriesSizeWeightInput impedanceAccuracy
Power
RangingAutomatic
Max. IndicationOver-range indicationPolarityZero adjustmentFunctions
3-1/2 digits, LCDmY, V, mA, 0, ill, MO, buzzer, B(low battery)MANU (Manual), ac and -1>1- (diode test)1999 or - 1999only (1) or (- 1) displayed at the MSB position.AUTO negative polarity indication.AutomaticDC volts, AC volts, DC amps, AC amps, Ohms,continuity test, diode test.Selectable automatic or manualInstrument automatically selects maximum rangefor measurement and display. Auto ranging operateson all functions except for de or ac current.Switch selection as desired2 sample/s, nominalB mark on LCD readoutOperating O°C - 40°C, < 80% RH (Relativehumidity)Storage - 20°C - 60°C, < 70% RHTwo AA size 1.5 V batteries. Life 2000 hourstypically with zinc-carbon.Probe red-black, safety fuse 250 - 0.2 A160 (L) x 80 (B) x 30 (H)250 g without batteries.11MO -1000 MO± 0.5% - 0.7% or ± 5 digit for de1.0% reading or ± 5 digit for ac at 40 - 500 kHz
ManualSampling RateLow BatteryTemperature
DisplayUnit Annunciation
5.10GENERAL SPECIFICATIONS OF A DVM
142 Electronic Instrumentation

Now, the next command from the microprocessor causes the comparator input1 to be connected to the input 3 of the multiplexer, which is the reference voltage(full scale voltage). The value of the reference voltage sets the upper limit of
Fig.5.17 (b) Operating waveform of a rp-based ramp type DVM
I I r I At II I I L.l 1 I~- - - ~ - - - - - - - ) I ~)o I ~ )0 II r I
: I 6t2I
VfSv,
~-- 6t3 -----;~,I
I I
Vm ---------------------"-------------- __-"~--_r-------------------- -
Fig.5.17 (a) Basic block diagram of a microprocessor-based ramp type DVM
Clock I, 7- v;Q t t
Input InputA llP ~ ReadSignal
~Multiplexer ~ System v OutConditioner 3 IClear
SignaltRamp 1
Reference ~ Voltage v,2 ComparatorVoltage Generator
amplitude, Vm remain constant. The time duration between the consecutive pulsesis sufficiently large enough for the capacitor to get discharged.
Whenever a conversion COlTIlTIandarrives at the microprocessor at a time t I,the multiplexer first connects input 1 of the comparator to its input 1 (i.e. groundpotential) and brings the former to ground potential.
The microprocessor pauses until another sawtooth pulse begins. When input2 voltage, arriving from the ramp generator beCOlTIeSequal to input 1 of thecomparator, the comparator sends a signal to the microprocessor, that rampvoltage is zero. The microprocessor lTIeaSUresthis time interval ~tl (shown inFig. 5.17 (bj), by counting the number of clock pulses supplied by the clockgenerator during this time interval. Let the count during this time be N1, whichis then stored by the microprocessor. A COlTIlTIandfrom the microprocessor nowcauses the comparator input 1 to be connected to input 2 of the multiplexer. Thisconnects the unknown voltage, r'_'( to the input 1 of the comparator. At an instant,when the ramp voltage equals the unknown voltage, the comparator sends asignal to the microprocessor that measure the time interval ~t2 (Fig. 5.17 (bj),The count N2, during this time interval is also stored.
Digital Voltmeters 143
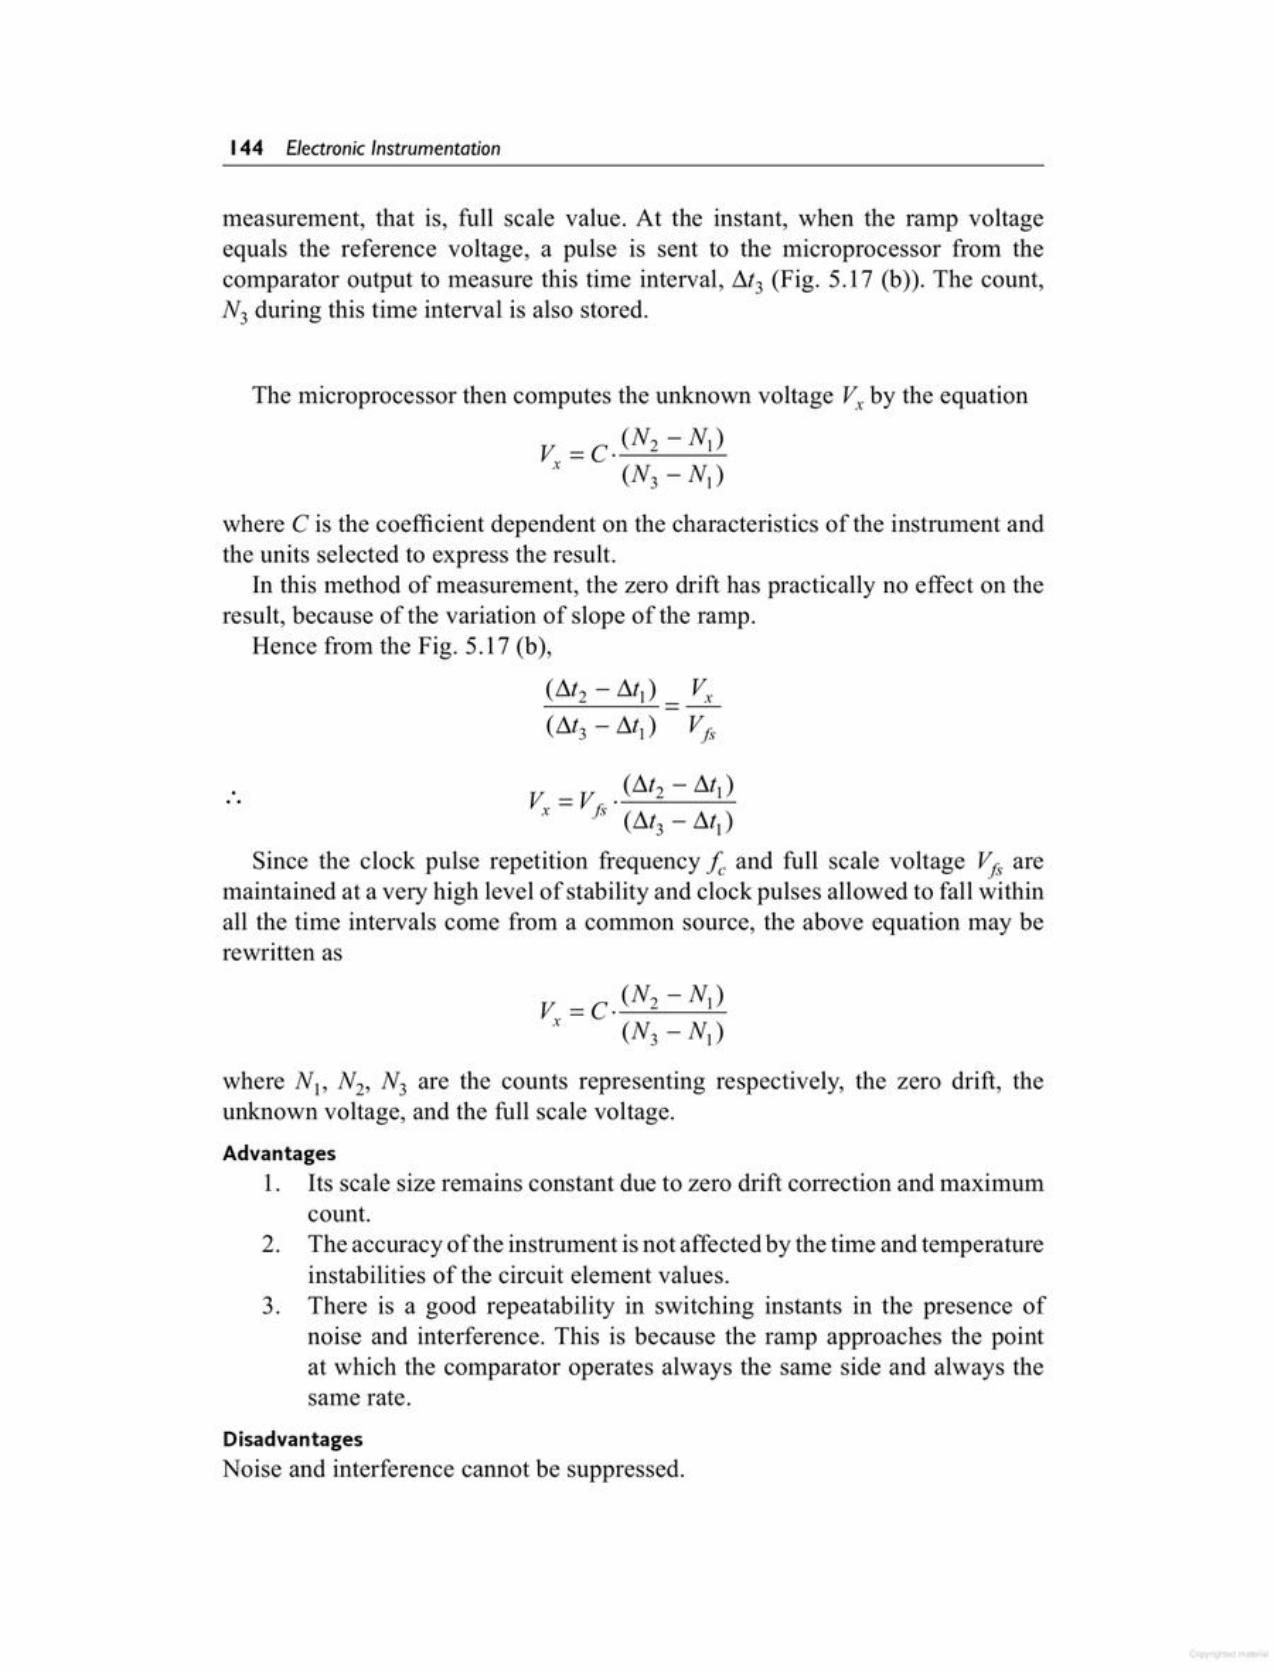
DisadvantagesNoise and interference cannot be suppressed.
where NI,N2, N3 are the counts representing respectively, the zero drift, theunknown voltage, and the full scale voltage.
Advantages1. Its scale size remains constant due to zero drift correction and maximum
count.2. The accuracy of the instrument is not affected by the time and temperature
instabilities of the circuit element values.3. There is a good repeatability in switching instants in the presence of
noise and interference. This is because the ralnp approaches the pointat which the comparator operates always the same side and always thesame rate.
rewritten as
... V =V . (I::.t2 - I::.t)x f~(I::.t3 - I::.t) )
Since the clock pulse repetition frequency fc and full scale voltage Vf~aremaintained at a very high level of stability and clock pulses allowed to fall withinall the time intervals come from a common source, the above equation may be
where C is the coefficient dependent on the characteristics of the instrument andthe units selected to express the result.
In this method of measurement, the zero drift has practically no effect on theresult, because of the variation of slope of the ramp.
Hence from the Fig. 5.17 (b),
(I::.t2 - I::.t) Vx(I::.t3 - I::.tl ) Vf~
The microprocessor then computes the unknown voltage Vx by the equation
V =c. (N2 - N1)
x (N3 - N1)
measurement, that is, full scale value. At the instant, when the ramp voltageequals the reference voltage, a pulse is sent to the microprocessor from thecomparator output to measure this time interval, I::.t3 (Fig. 5.17 (bj). The count,N3 during this time interval is also stored.
144 Electronic Instrumentation
3. The principle of voltage to time conversion is used in(a) dual slope type DVM(b) successive approximation type
DVM(c) integrating type DVM(d) none of the above
4. SAR type DVM uses the principle of(a) voltage to time conversion(b) voltage to frequency conversion(c) voltage to binary conversion(d) voltage to current conversion
1. Measurement in a ramp type DVM isperformed during the(a) negative slope(b) positive slope(c) both of the slope(d) none of the above
2. Measurement by dual slope DVM isperformed during(a) rising slope(b) falling slope(c) rising and falling slope(d) none of the slope
Multiple Choice Duestions •--~------------------------------~~
ramp type DVM.14. Explain with a diagram, the basic
principle of a successive approximation type DVM.
15. Describe with a diagram the operation of a SAR type DVM.
16. State features of a SAR type DVMover other DVMs. What are the advantages of a SAR type DVM overother DVMs?
17. State the principle of operation of acontinuous balance DVM.
18. Describe with a diagram the operation of a servo balancing potentiometer type DVM.
19. Define sensitivity of a digital meter.State significance of a half digit.
20. Define the term overrange and halfdigit. Define resolution of digitalmeter.
21. What is a sample hold circuit? Stateits significance. What is the advantage of using a sample hold circuit?
22. State some of the general features ofaDVM.
23. State the basic principle of a microprocessor based DVM.
24. Describe with a block diagram theoperation of a microprocessor basedDVM. State the advantages of a microprocessor based DVM.
1. State the advantages of a DVM overan analog meter.
2. How are DVMs classified?3. State the operating and performance
characteristics of a digital voltmeter.4. State distinguished features of digital
instruments as compared to analoginstruments.
5. Explain the operating principle of aramp type DVM.
6. Describe with a diagram the operation of ramp type DVM. State limitations of a ramp type DVM and howit is overcome.
7. Explain with the help of diagram theworking principle of dual slope typeDVM.
8. Describe with a diagram the operation of a dual slope type DVM.
9. State the advantages of a dual slopeDVM over a ramp type DVM.
10. Explain the operating principle ofVoltage to frequency type DVM.
11. Describe with the help of a blockdiagram the operation of integratingtype digital voltmeter.
12. State the principle of a staircase ramptype DVM.
13. Describe with a diagram the operation of a staircase ramp type DVM.State the advantages of a staircase
_R_e_v_ie_w_D_u_es_t_io_ns ~~
145Digital Voltmeters
3. E.O. Doebelin, Measurements Systems: Applications and Design, 4thEdition, McGraw-Hill, 1990.
1. A.J. Bouwens, Digital Instrumentation, McGraw-Hili, 1986.
2. KJ. Dean, Digital Instruments,Chapman and Hall, 1965.
Further Reading I-~~~~-------------------
5. A 3-1/2 digit voltmeter is used forvoltage measurement.(i) Find its resolution.(ii) How would 11.52 V be displayed
on the 10V range?(iii) How would .5234Vbe displayed
on 1V and 10 V ranges?6. Determine the binary equivalent of
2.567 V for a SAR type DVM having10 bits output and a reference voltage of+5 V.
7. Determine the binary equivalent of8.735 V for a SAR type DVM having10 bits output and a reference voltage of+12 V.
1. The lowest range on a 4-1/2 digitmultimeter is 10m V full scale. Determine the sensitivity of the meter.
2. The lowest range on a 3-1/2 digitmultimeter is 10m V full scale. Determine the sensitivity of the meter.
3. A 3-1/2 digit DVM is used for measuring voltage .Determine the resolution. How would a voltage of 14.42be displayed on 10 V range and 100V range.
4. A 3-1/2 digit DVM has an accuracyof +0.5% of reading +1 digit. Determine the possible error in V, whenthe instrument is reading 5 V in 10Vrange
Practice Problems I-----------------------------
(c) frequency to voltage conversion(d) voltage to current conversion
5. Dual slope operates on the principle of(a) voltage to time conversion(b) voltage to frequency conversion
146 Electronic Instrumentation

instrumentBuilding block of a digitalFig. 6.1
Analogto f---+
Signal M Display IDigital Processing
Converter
Digital instruments are rapidly replacing their analog counterparts. The parametersof interest in a laboratory environment are (i) voltage (ii) current (iii) power(iv) frequency, and (v) logic.
We shall consider digital systems which measure the above parameters. Toenable digital systems to recogniseinformation, inputs which are analogin nature must be converted to digitalform. Hence any digital instrumentwould invariably consist of an analogto digital converter in its input stage.The basic building block of a digitalinstrument is shown in Fig. 6.1.
The display block may be analog or digital in nature. If an analog readoutis desired, it becomes necessary to include a stage involving digital to analogconversion.
Digital systems may consist of the following components.1. Resistors2. Capacitors3. Transistors4. Linear ICs5. DigitalICs6. Display devices7. Analog to digital converters8. Digital to analog convertersThe digital form of measurement can be used to display the measured quantity
numerically instead of a deflection, as in conventional analog meters. Data indigital form facilitates various operations that are normally required in signalprocessing. An increase in the availability and type of computer facilitiesand a decrease in the cost of various modules required for digital systems isaccelerating the development of digital instrumentation for measurement andsignal processing.
6.1INTRODUCTION
Digital Instruments
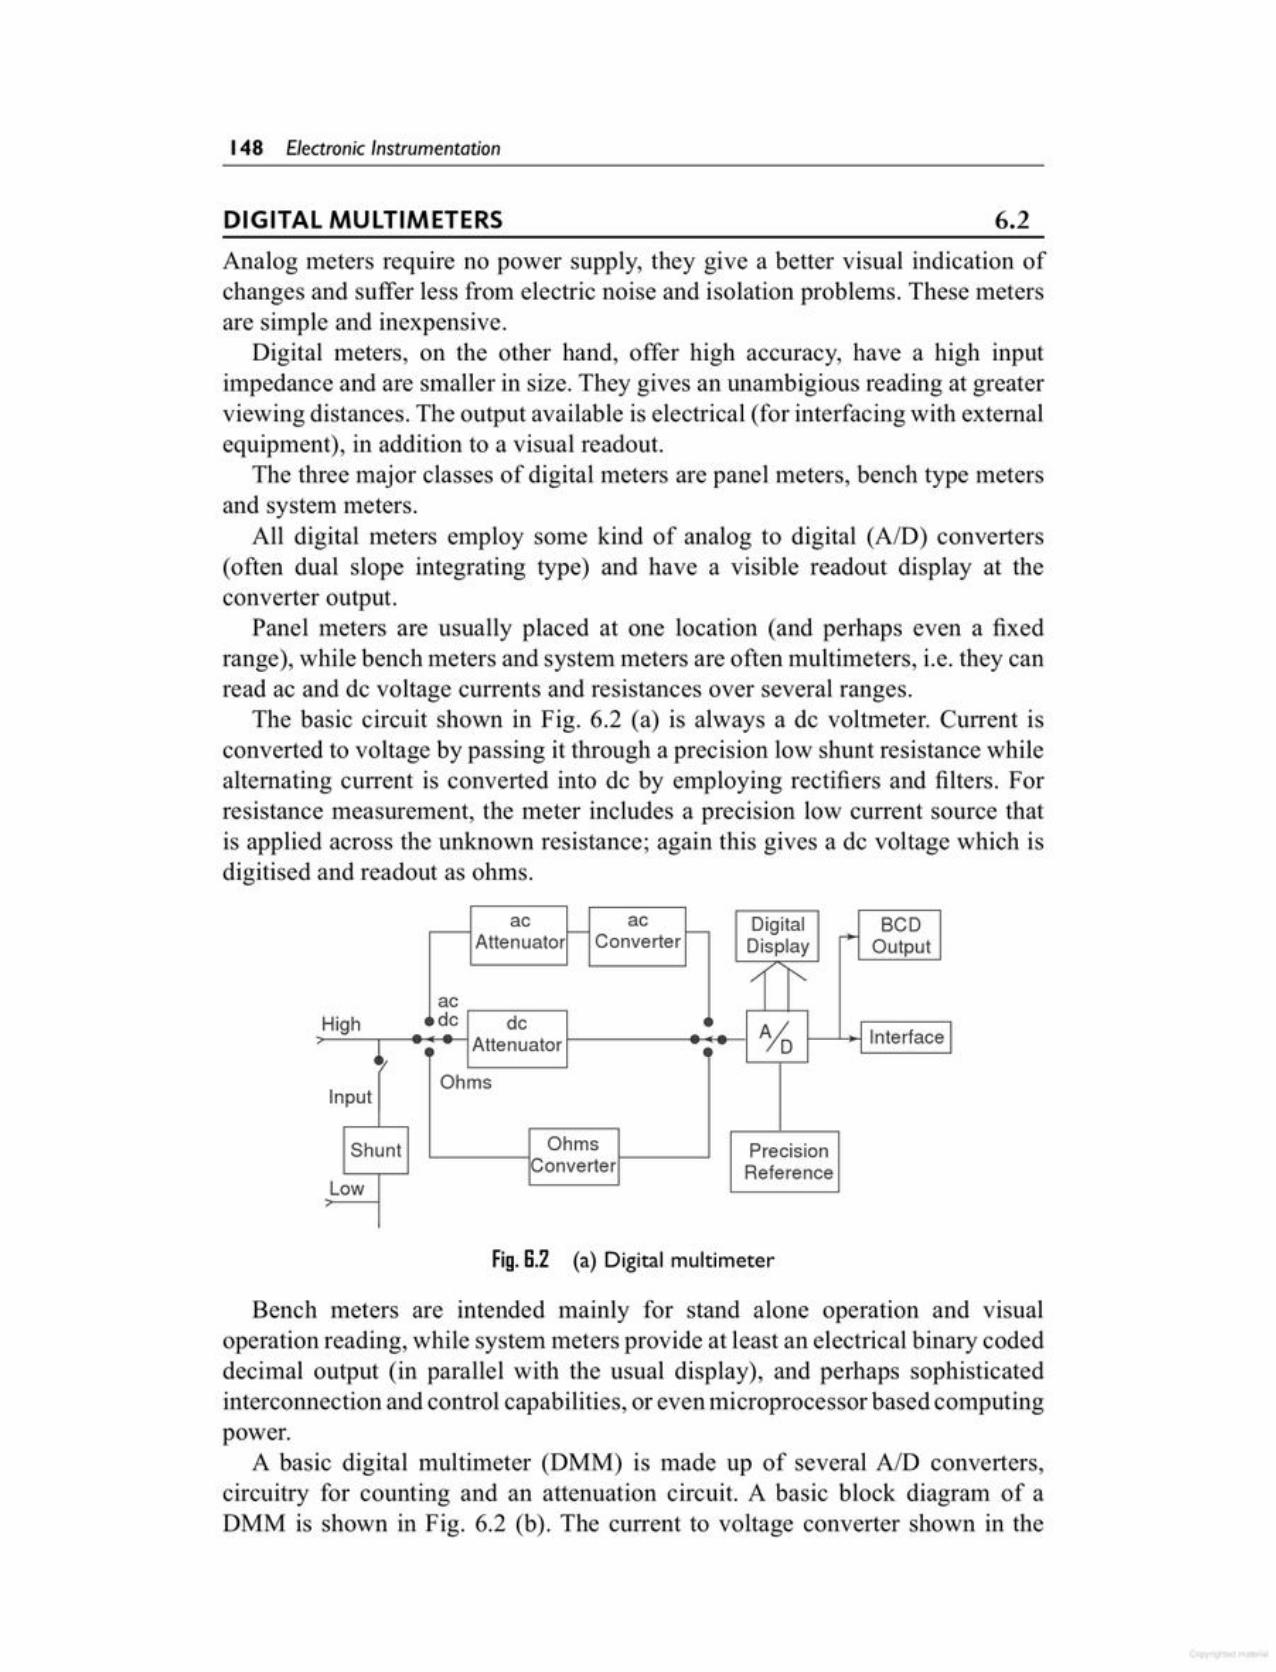
Fig. B.2 (a) Digital multimeter
Bench meters are intended mainly for stand alone operation and visualoperation reading, while system meters provide at least an electrical binary codeddecimal output (in parallel with the usual display), and perhaps sophisticatedinterconnection and control capabilities, or even microprocessor based computingpower.
A basic digital multimeter (DMM) is made up of several AID converters,circuitry for counting and an attenuation circuit. A basic block diagram of aDMM is shown in Fig. 6.2 (b). The current to voltage converter shown in the
ac ac Digital BCDAttenuator - Converter f- +Display Output
/ <,
acHigh
•• ~c IAtte~~atorl .'(. Alo I Interface I,1/
OhmsInput
Shunt Ohms PrecisionConverter Reference
Low
Analog meters require no power supply, they give a better visual indication ofchanges and suffer less from electric noise and isolation problems. These metersare simple and inexpensive.
Digital meters, on the other hand, offer high accuracy, have a high inputimpedance and are smaller in size. They gives an unambigious reading at greaterviewing distances. The output available is electrical (for interfacing with externalequipment), in addition to a visual readout.
The three major classes of digital meters are panel meters, bench type metersand system meters.
All digital meters employ some kind of analog to digital (AID) converters(often dual slope integrating type) and have a visible readout display at theconverter output.
Panel meters are usually placed at one location (and perhaps even a fixedrange), while bench meters and system meters are often multimeters, i.e. they canread ac and de voltage currents and resistances over several ranges.
The basic circuit shown in Fig. 6.2 (a) is always a de voltmeter. Current isconverted to voltage by passing it through a precision low shunt resistance whilealternating current is converted into de by employing rectifiers and filters. Forresistance measurement, the meter includes a precision low current source thatis applied across the unknown resistance; again this gives a de voltage which isdigitised and readout as ohms.
6.2DIGITAL MULTIMETERS
148 Electronic Instrumentation
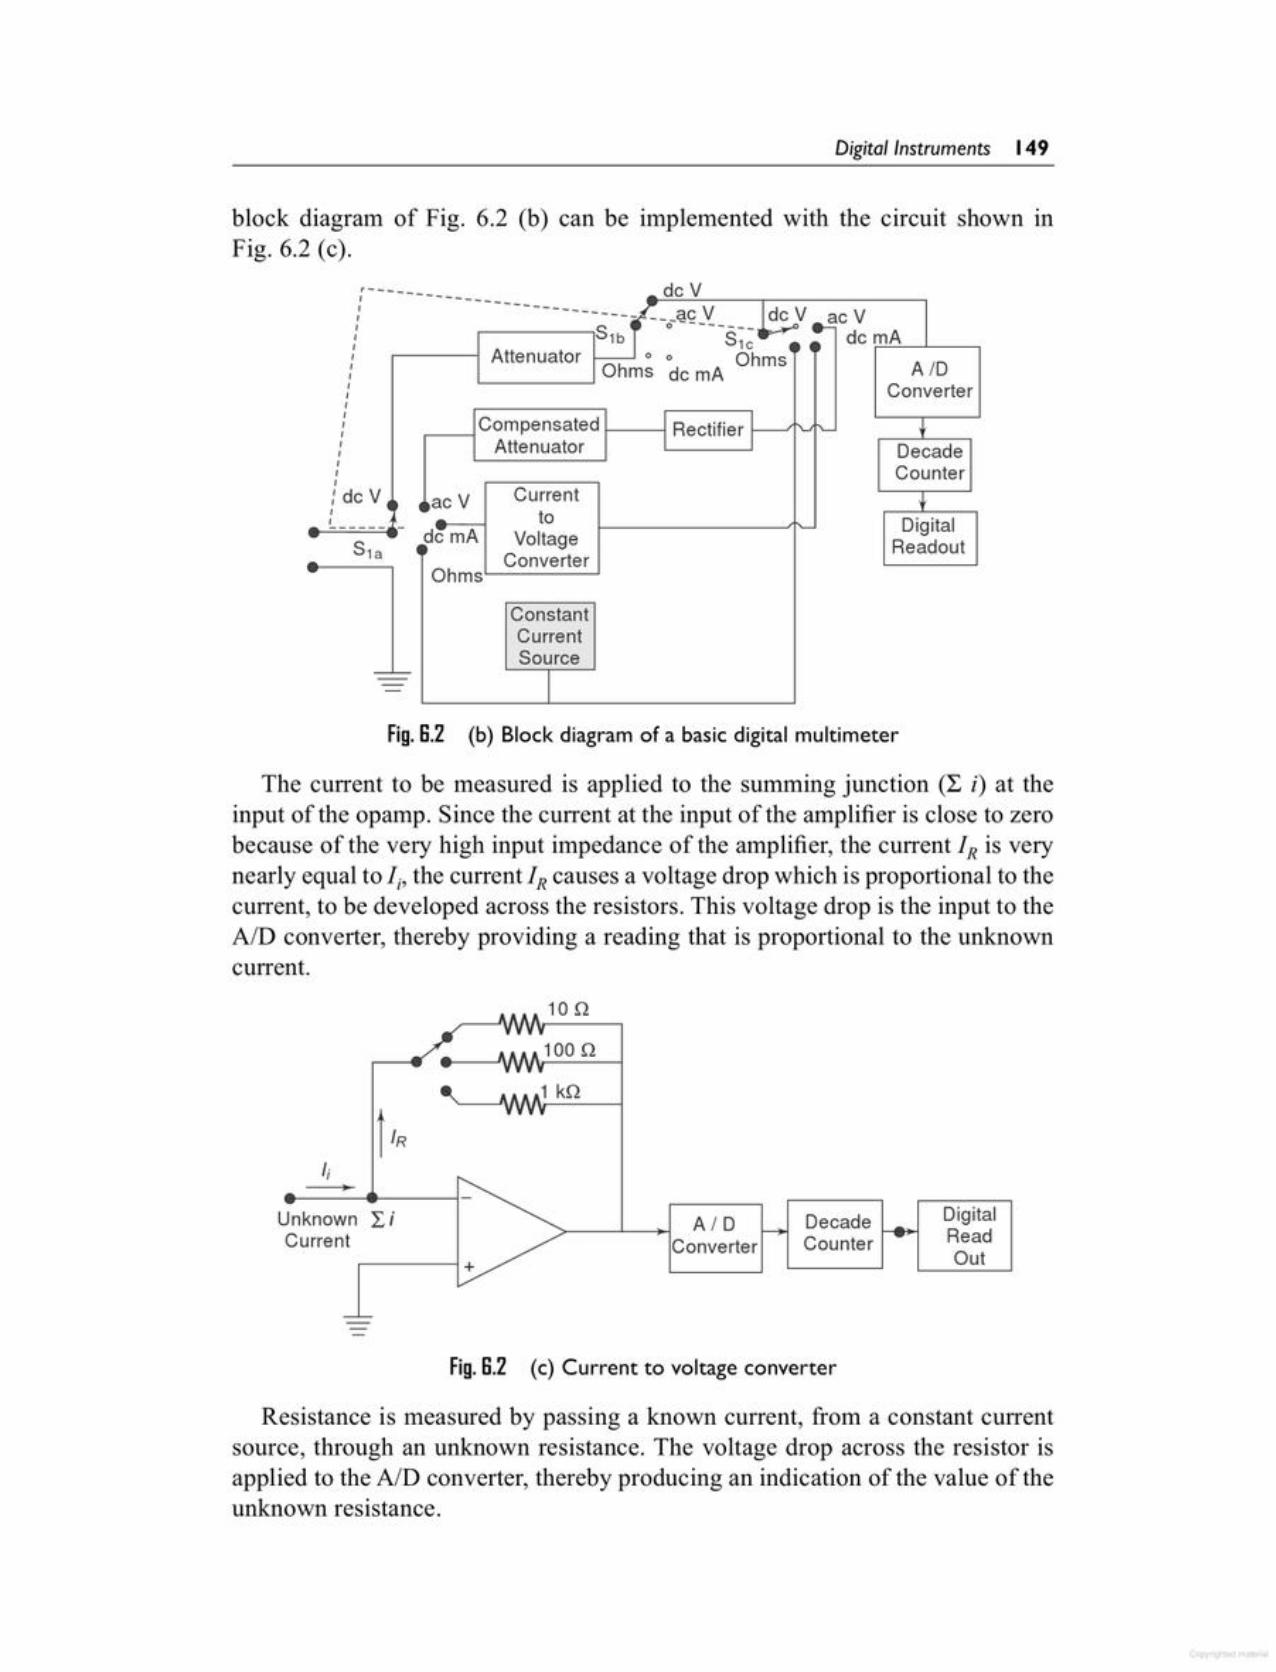
Resistance is measured by passing a known current, from a constant currentsource, through an unknown resistance. The voltage drop across the resistor isapplied to the AID converter, thereby producing an indication of the value of theunknown resistance.
Fig. S.2 (c) Current to voltage converter
DigitalReadOut
Decade ~~Counter
AIDConverter
t IRI;
Unknown 'LiCurrent
+
100n10n
The current to be measured is applied to the summing junction (1: i) at theinput of the opamp. Since the current at the input of the amplifier is close to zerobecause of the very high input impedance of the amplifier, the current IR is verynearly equal to Ii' the current Z, causes a voltage drop which is proportional to thecurrent, to be developed across the resistors. This voltage drop is the input to theAID converter, thereby providing a reading that is proportional to the unknowncurrent.
Fig. S.2 (b) Block diagram of a basic digital multimeter
DigitalReadout
DecadeCounter
AIDConverter
de V ac Vdc m;..:..:.:.-:A--,_--,
___ac VS1b, 0'----- ___ ,_.., ..=
S1C .-Attenuator 0 0 OhmsOhms dc mA
Compensated RectifierAttenuator
• ac V Currentto
dcmA Voltagen ConverterOhms
ConstantCurrentSource
I
de V,'-------- ---- ----, --------, --_,,,,,,,,,,,,,,,,,: dc V,,------ -
block diagram of Fig. 6.2 (b) can be implemented with the circuit shown inFig. 6.2 (c).
Digita!!nstruments 149
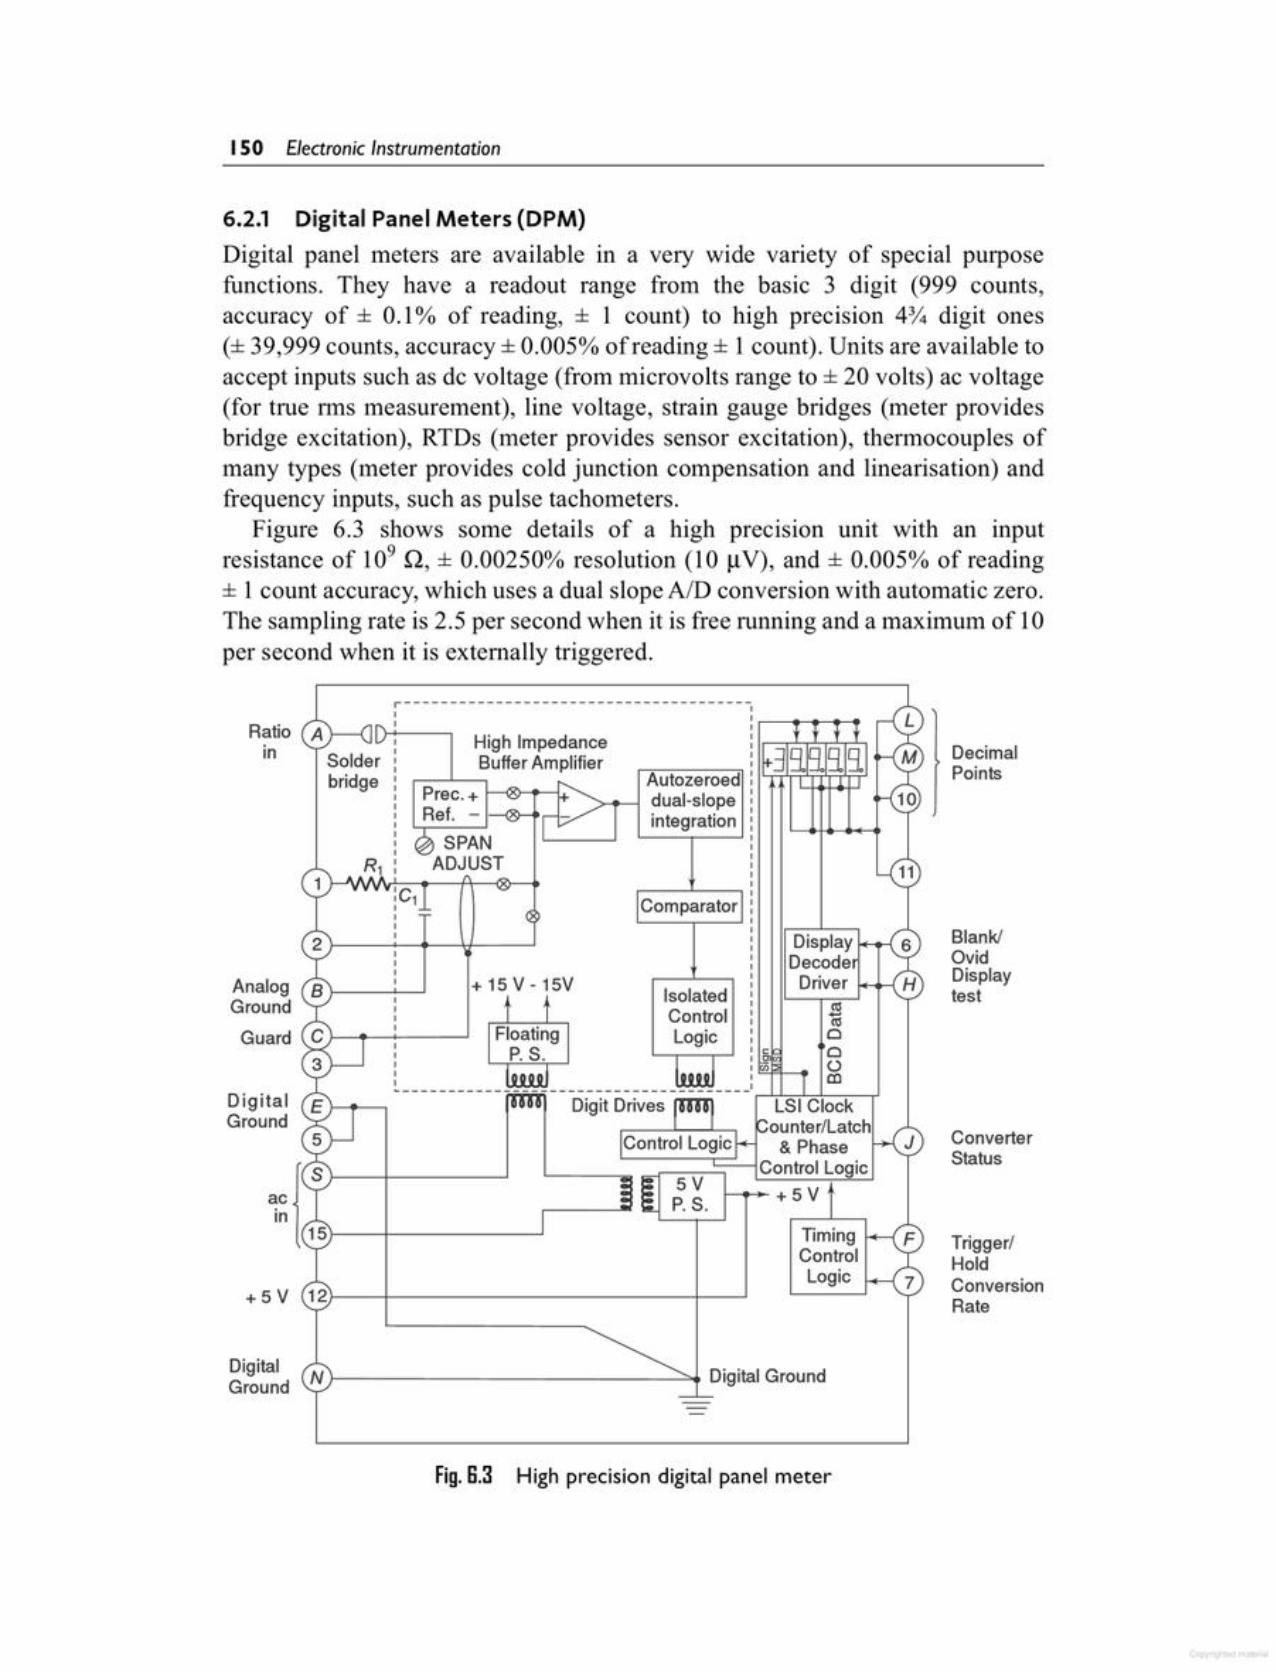
Trigger!HoldConversionRate
ConverterStatus
Blank!OvidDisplaytest
DecimalPoints
High precision digital panel meterFig. B.3
}-----------------""'+ Digital GroundDigitalGround
+5V
TimingControlLogic
5VP. S.ac
in
DigitalGround
+ 15 V - 15V
Comparator
IsolatedControlLogic
AnalogGround
Guard
Prec. +Ref. - 1-Q9-1'r-I-:v
SPANADJUST
Solderbridge
High ImpedanceBuffer Amplifier
r-------------------------------------~ :.----.-................: r=-:S:~-r='oI
Ratio Ain
6.2.1 Digital Panel Meters (DPM)Digital panel meters are available in a very wide variety of special purposefunctions. They have a readout range from the basic 3 digit (999 counts,accuracy of ± 0.1% of reading, ± 1 count) to high precision 40/..digit ones(± 39,999 counts, accuracy ± 0.005% of reading ± 1 count). Units are available toaccept inputs such as de voltage (from microvolts range to ± 20 volts) ac voltage(for true rms measurement), line voltage, strain gauge bridges (meter providesbridge excitation), RTDs (meter provides sensor excitation), thermocouples ofmany types (meter provides cold junction compensation and linearisation) andfrequency inputs, such as pulse tachometers.
Figure 6.3 shows some details of a high precision unit with an inputresistance of 109 Q, ± 0.00250% resolution (10 IlV), and ± 0.005% of reading± 1 count accuracy, which uses a dual slope AID conversion with automatic zero.The sampling rate is 2.5 per second when it is free running and a maximum of 10per second when it is externally triggered.
150 Electronic Instrumentation
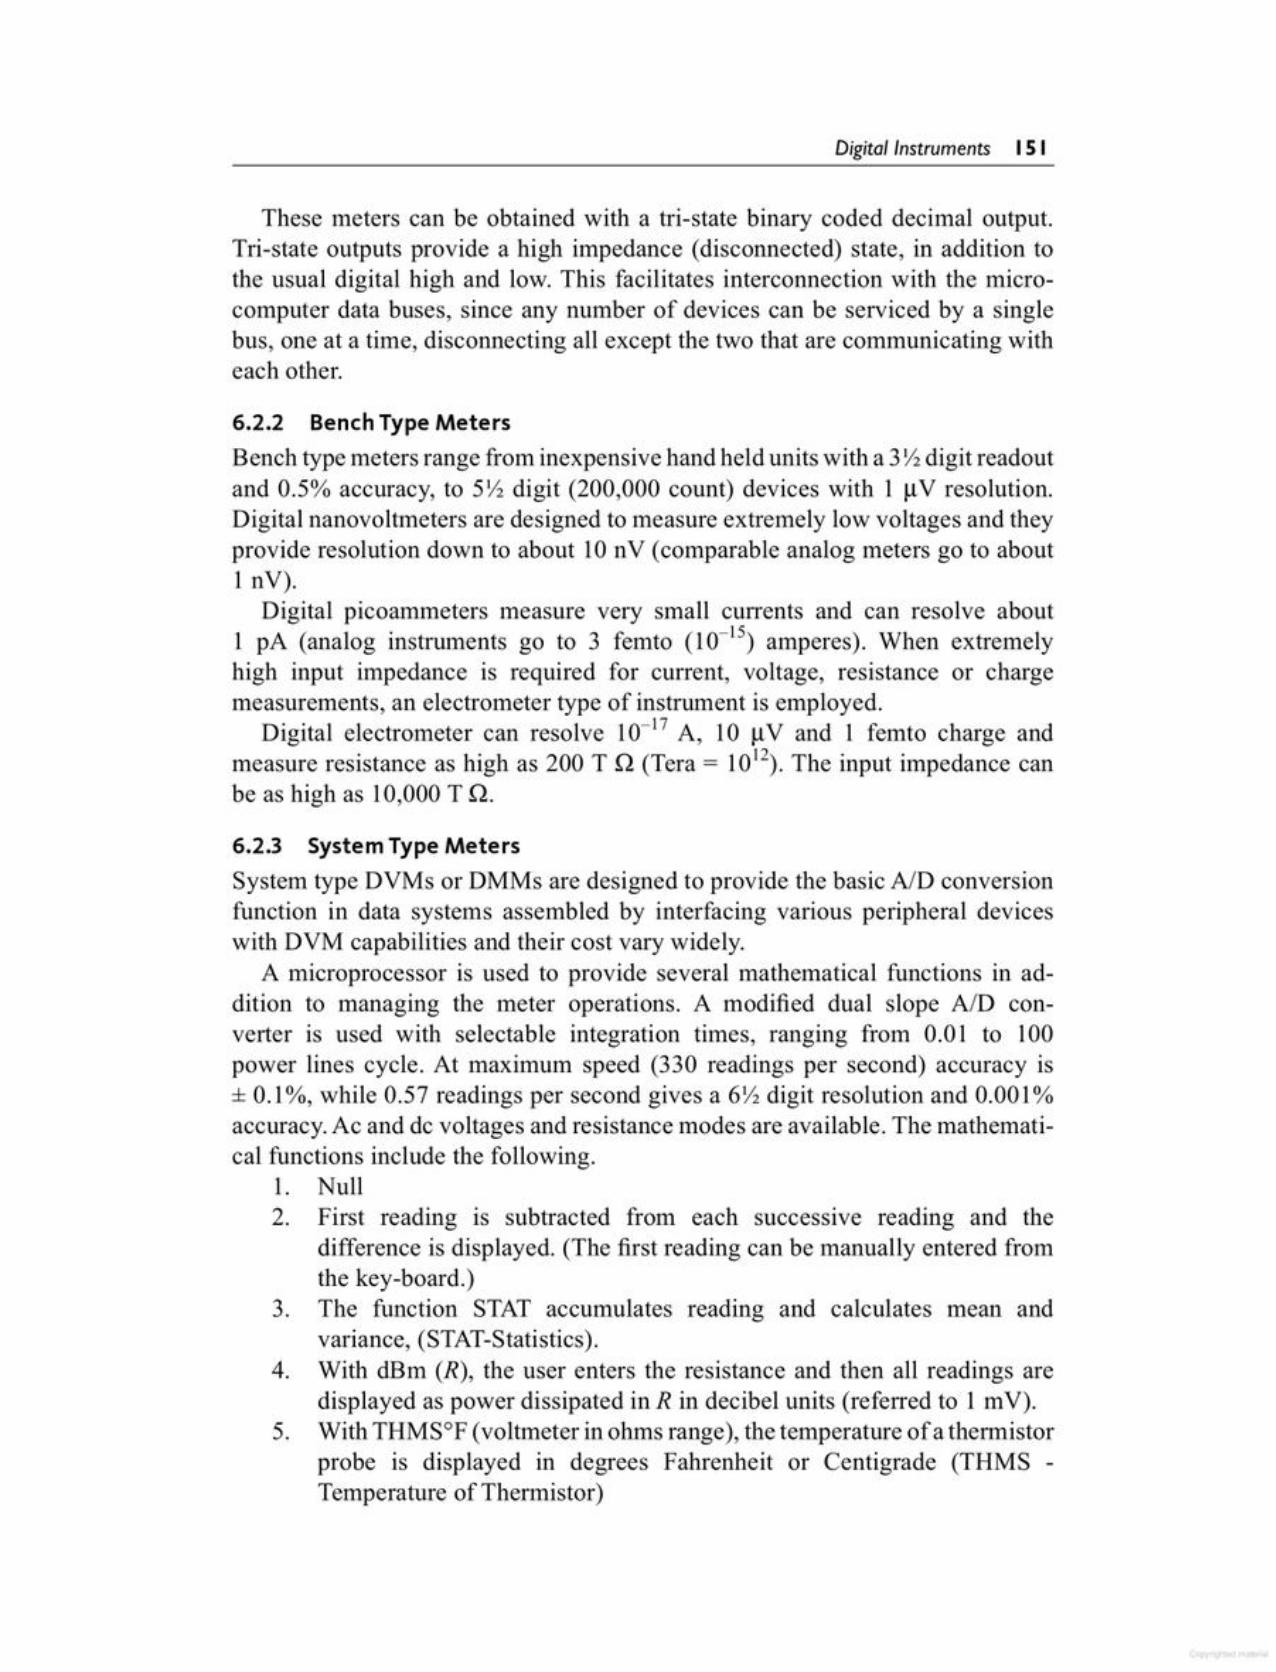
6.2.3 System Type MetersSystem type DVMs or DMMs are designed to provide the basic AID conversionfunction in data systems assembled by interfacing various peripheral deviceswith DVM capabilities and their cost vary widely.
A microprocessor is used to provide several mathematical functions in addition to managing the meter operations. A modified dual slope AID converter is used with selectable integration times, ranging from 0.01 to 100power lines cycle. At maximum speed (330 readings per second) accuracy is± 0.1%, while 0.57 readings per second gives a 6Y2digit resolution and 0.001%accuracy. Ac and de voltages and resistance modes are available. The mathematical functions include the following.
1. Null2. First reading is subtracted from each successive reading and the
difference is displayed. (The first reading can be manually entered fromthe key-board.)
3. The function STAT accumulates reading and calculates mean andvariance, (STAT-Statistics).
4. With dfsm (R), the user enters the resistance and then all readings aredisplayed as power dissipated in R in decibel units (referred to 1 mV).
5. With THMsoF (voltmeter inohms range), the temperature of a thermistorprobe is displayed in degrees Fahrenheit or Centigrade (THMS -Temperature of Thermistor)
6.2.2 Bench Type MetersBench type meters range from inexpensive hand held units with a 3 Y2digit readoutand 0.5% accuracy, to 5Y2digit (200,000 count) devices with 1 IlV resolution.Digital nanovoltmeters are designed to measure extremely low voltages and theyprovide resolution down to about IOn V (comparable analog meters go to about1 nV).
Digital picoammeters measure very small currents and can resolve about1 pA (analog instruments go to 3 femto (10-15) amperes). When extremelyhigh input impedance is required for current, voltage, resistance or chargemeasurements, an electrometer type of instrument is employed.
Digital electrometer can resolve 10-17 A, 10 IlV and 1 femto charge andmeasure resistance as high as 200 T n (Tera = 1012). The input impedance canbe as high as 10,000 Tn.
These meters can be obtained with a tri-state binary coded decimal output.Tri-state outputs provide a high impedance (disconnected) state, in addition tothe usual digital high and low. This facilitates interconnection with the microcomputer data buses, since any number of devices can be serviced by a singlebus, one at a time, disconnecting all except the two that are communicating witheach other.
Digita!!nstruments IS I
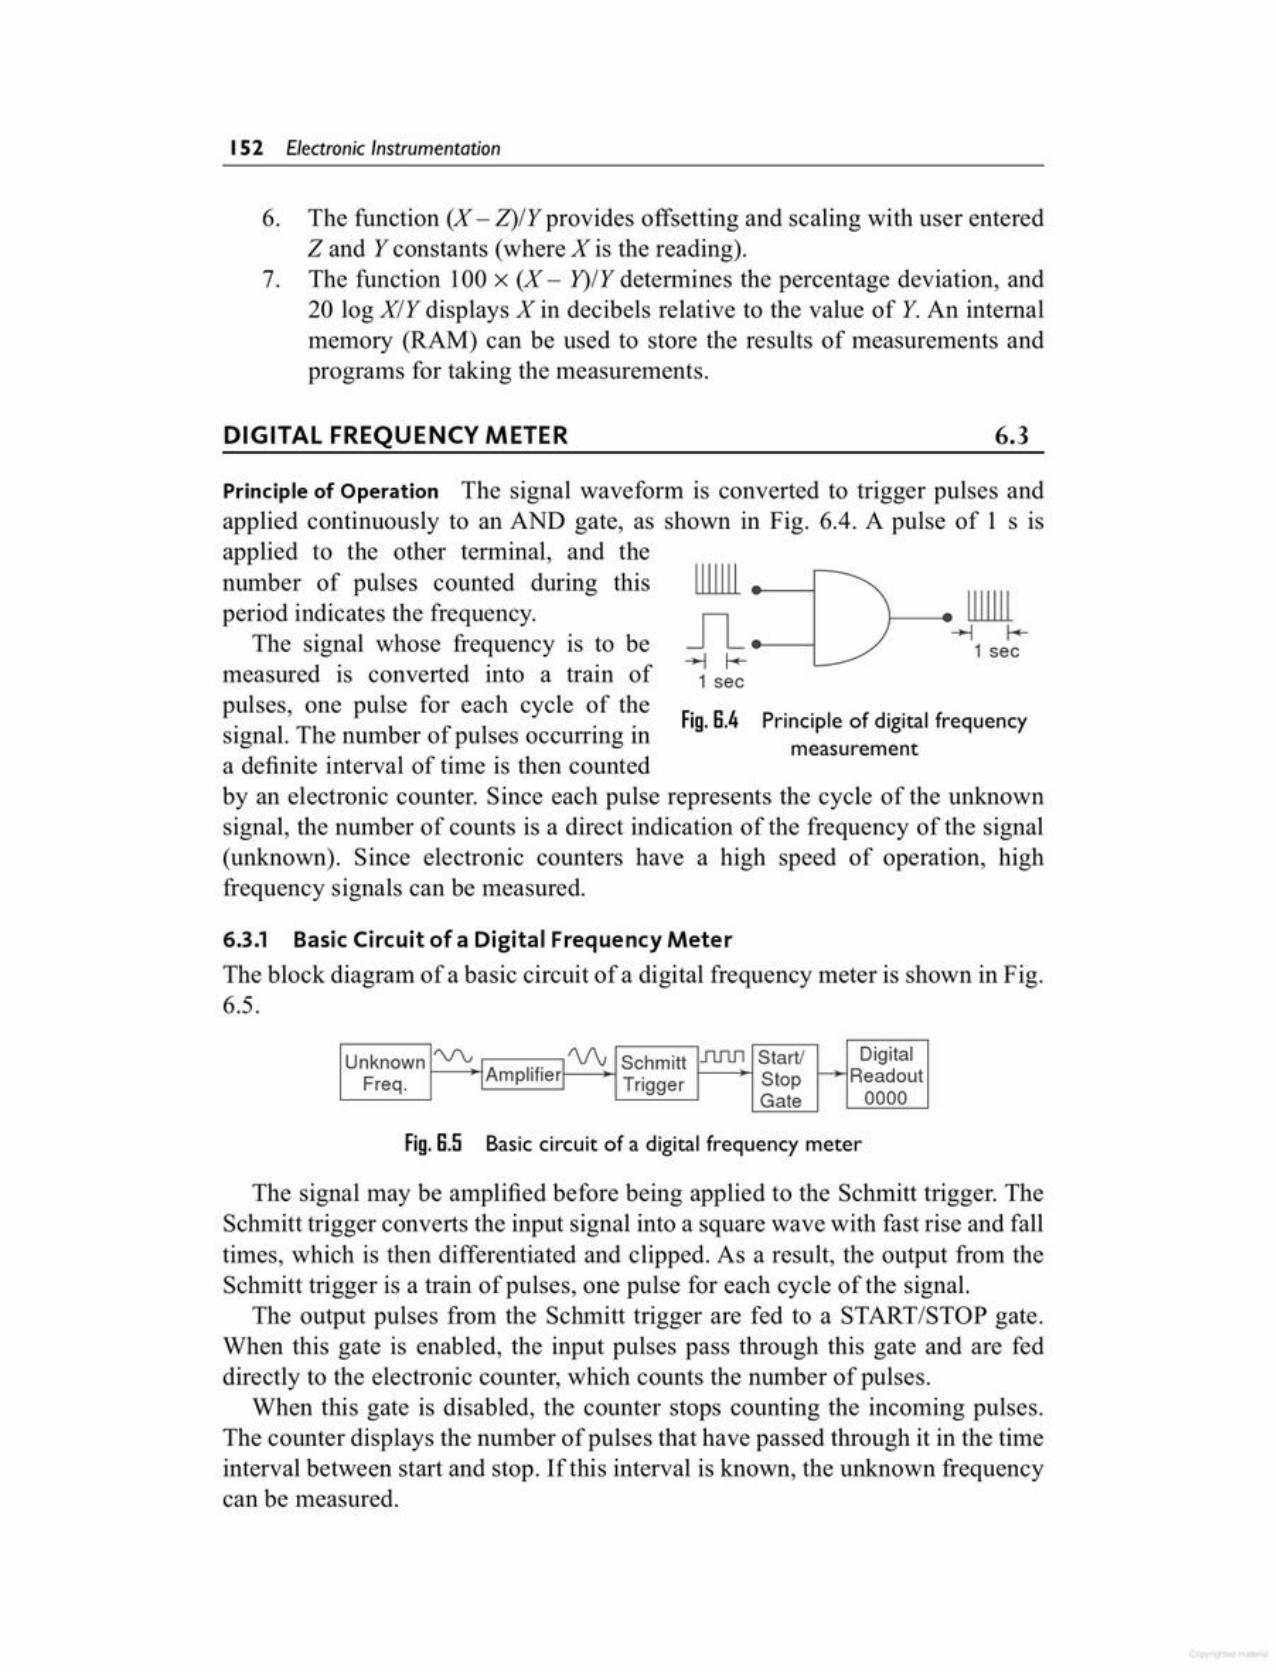
The signal may be amplified before being applied to the Schmitt trigger. TheSchmitt trigger converts the input signal into a square wave with fast rise and falltimes, which is then differentiated and clipped. As a result, the output from theSchmitt trigger is a train of pulses, one pulse for each cycle of the signal.
The output pulses from the Schmitt trigger are fed to a START/STOP gate.When this gate is enabled, the input pulses pass through this gate and are feddirectly to the electronic counter, which counts the number of pulses.
When this gate is disabled, the counter stops counting the incoming pulses.The counter displays the number of pulses that have passed through it in the timeinterval between start and stop. If this interval is known, the unknown frequencycan be measured.
Fig. 8.5 Basiccircuit of a digital frequency meter
Unknown <r: I\.J'v Schmitt .fU1Jl Start! DigitalFreq. . IAmplifier: Trigger Stop f-+ Readout
Gate 0000
6.3.1 Basic Circuit of a Digital Frequency MeterThe block diagram of a basic circuit of a digital frequency meter is shown in Fig.6.5.
by an electronic counter. Since each pulse represents the cycle of the unknownsignal, the number of counts is a direct indication of the frequency of the signal(unknown). Since electronic counters have a high speed of operation, highfrequency signals can be measured.
measurement
1 sec
m-t 1-+
1 sec
Principle of Operation The signal waveform is converted to trigger pulses andapplied continuously to an AND gate, as shown in Fig. 6.4. A pulse of 1 s IS
applied to the other terminal, and thenumber of pulses counted during thisperiod indicates the frequency.
The signal whose frequency is to bemeasured is converted into a train ofpulses, one pulse for each cycle of the Fig G4 Principle of digital frequencysignal. The number of pulses occurring in ..a definite interval of time is then counted
6.3DIGITAL FREQUENCY METER
6. The function (X - Z)/Y provides offsetting and scaling with user enteredZ and Y constants (where X is the reading).
7. The function 100 x (X - Y)/Y determines the percentage deviation, and20 log X/Y displays X in decibels relative to the value of Y. An internalmemory (RAM) can be used to store the results of measurements andprograms for taking the measurements.
152 Electronic Instrumentation
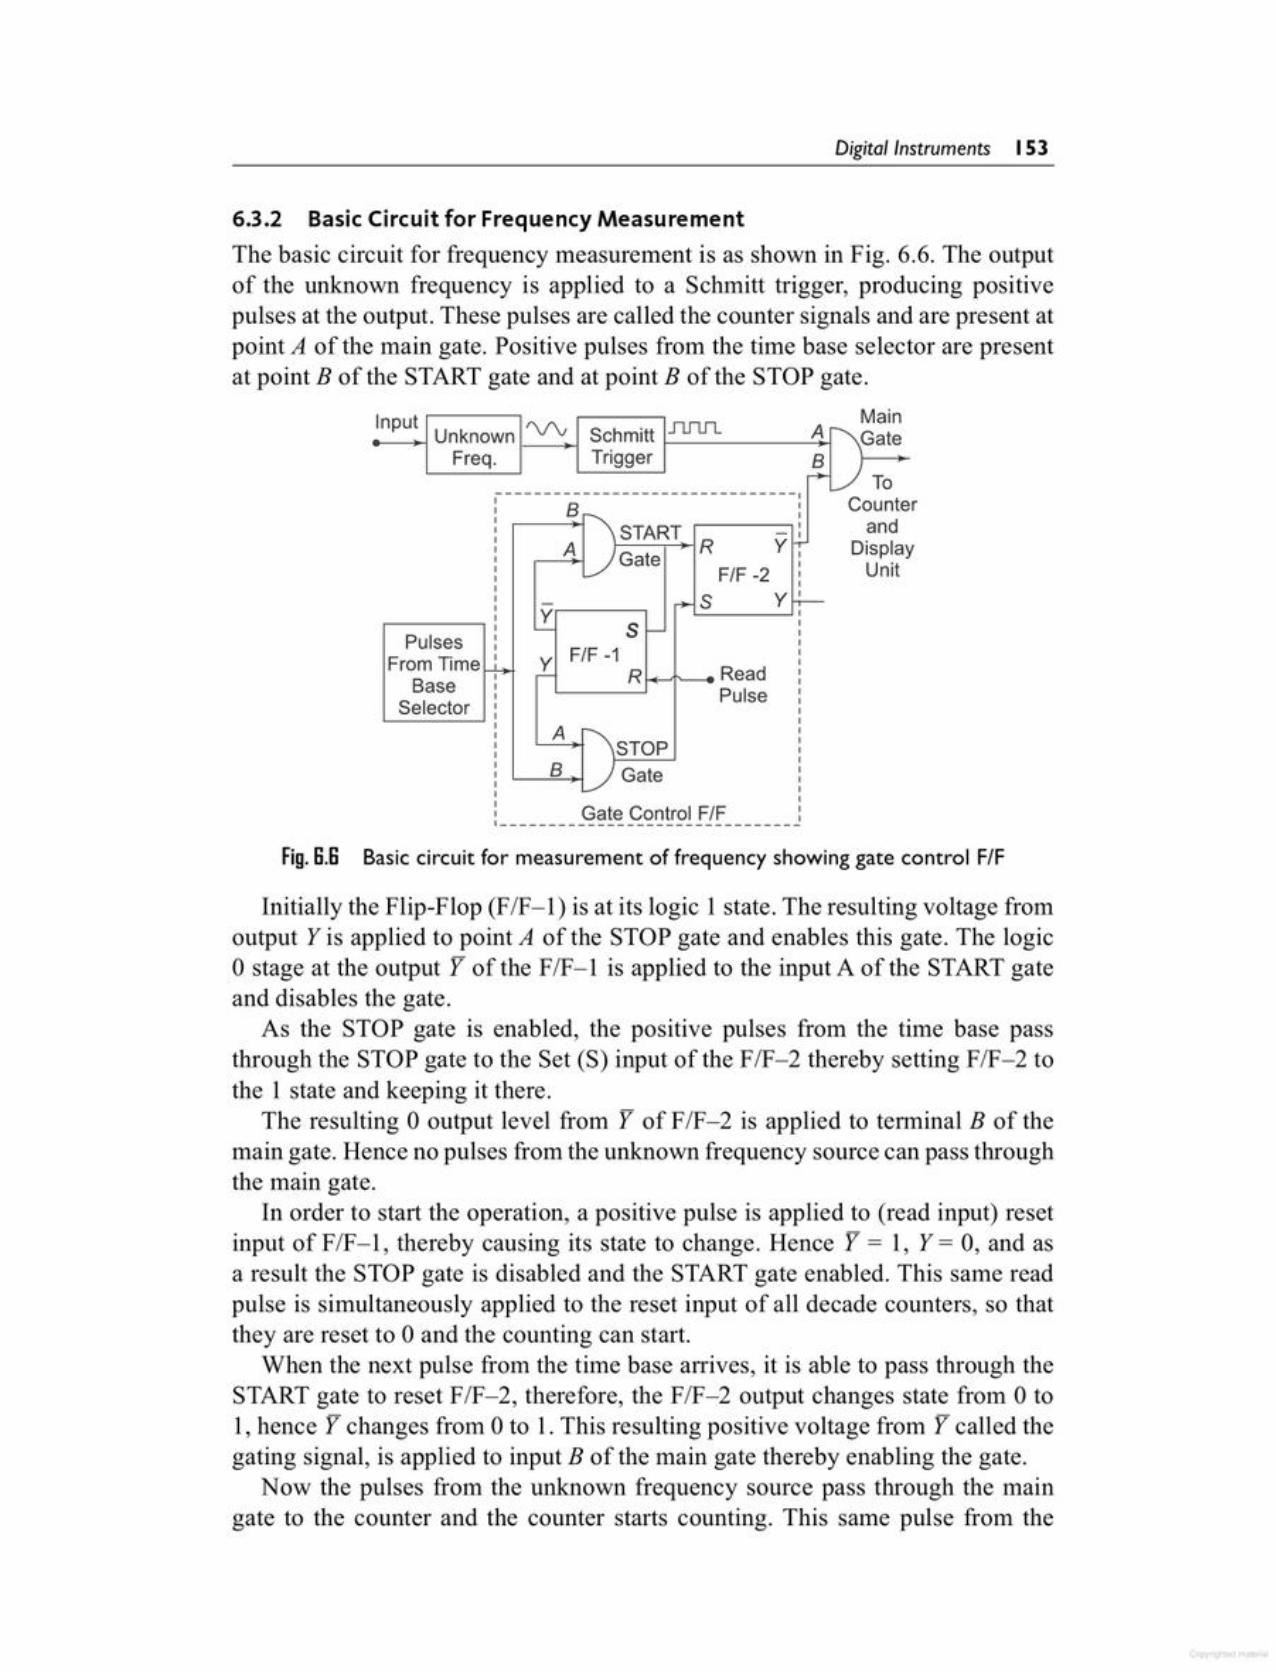
Initially the Flip-Flop (FIF-I) is at its logic 1 state. The resulting voltage fromoutput Y is applied to point A of the STOP gate and enables this gate. The logico stage at the output Y of the FIF-l is applied to the input A of the START gateand disables the gate.
As the STOP gate is enabled, the positive pulses from the time base passthrough the STOP gate to the Set (S) input of the FIF-2 thereby setting FIF-2 tothe 1 state and keeping it there.
The resulting 0 output level from Y of FIF-2 is applied to terminal B of themain gate. Hence no pulses from the unknown frequency source can pass throughthe main gate.
In order to start the operation, a positive pulse is applied to (read input) resetinput of FIF-l, thereby causing its state to change. Hence Y = 1, Y= 0, and asa result the STOP gate is disabled and the START gate enabled. This same readpulse is simultaneously applied to the reset input of all decade counters, so thatthey are reset to 0 and the counting can start.
When the next pulse from the time base arrives, it is able to pass through theSTART gate to reset FIF-2, therefore, the FIF-2 output changes state from 0 to1, hence Y changes from 0 to 1. This resulting positive voltage from Y called thegating signal, is applied to input B of the main gate thereby enabling the gate.
Now the pulses from the unknown frequency source pass through the maingate to the counter and the counter starts counting. This same pulse from the
Fig. S.S Basic circuit for measurement of frequency showing gate control F/F
Gate Control F/F
A ~STOP'----=B~_)Gate
~ ReadPulse
R~
-Y,------,- s-
F/F -1.rPulses
From Time~Base
Selector
I t Mainnpu Unknown rvv Schmitt nrLrL A ~Gate
Freq. Trigger B_______________________________,r+_/ To
B ' Counter.--+11\ START : and
.---:.A+J G tRY r DisplayL/ a e F/F -2: Unit,
+s Y":-
6.3.2 Basic Circuit for Frequency MeasurementThe basic circuit for frequency measurement is as shown in Fig. 6.6. The outputof the unknown frequency is applied to a Schmitt trigger, producing positivepulses at the output. These pulses are called the counter signals and are present atpoint A of the main gate. Positive pulses from the time base selector are presentat point B of the START gate and at point B of the STOP gate.
Digita!!nstruments I S3

The input signal is amplified and converted to a square wave by a Schmitttrigger circuit. In this diagram, the square wave is differentiated and clipped toproduce a train of pulses, each pulse separated by the period of the input signal.The time base selector output is obtained from an oscillator and is similarlyconverted into positive pulses.
The first pulse activates the gate control FIF. This gate control FIF provides anenable signal to the AND gate. The trigger pulses of the input signal are allowedto pass through the gate for a selected time period and counted. The secondpulse from the decade frequency divider changes the state of the control FIF andremoves the enable signal from the AND gate, thereby closing it. The decimalcounter and display unit output corresponds to the number of input pulsesreceived during a precise time interval; hence the counter display correspondsto the frequency.
Fig. 8.7 Block diagram of a digital frequency meter
+10I----+-i Schmitt I--~ +10Trigger
10J.lSr------, !\f\;,------=JlIL=--,
1 MHzCrystal
Oscillator+10
Time BaseSelector 1 sec
Schmitt~ Trigger I---~
and Display UnitGateF/F
START gate is applied to the set input ofFIF-l, changing its state from 0 to 1.This disables the START gate and enables the STOP gate. However, till the maingate is enabled, pulses from the unknown frequency continue to pass through themain gate to the counter.
The next pulse from the time base selector passes through the enabled STOPgate to the set input terminal ofFIF-2, changing its output back to 1 and Y = o.Therefore the main gate is disabled, disconnecting the unknown frequency signalfrom the counter. The counter counts the number of pulses occurring between twosuccessive pulses from the time base selector. If the time interval between thistwo successive pulses from the time base selector is 1 second, then the numberof pulses counted within this interval is the frequency of the unknown frequencysource, in Hertz.
The assembly consisting of two FIFs and two gates is called a gate controlFIF. The block diagram of a digital frequency meter is shown in Fig. 6.7.
Trigger PulseSchmitt 1111111111/D
>--+/ Trigger ---l 0 I 0 I 0 I 0 10 10 IDecimal Counter
154 Electronic Instrumentation
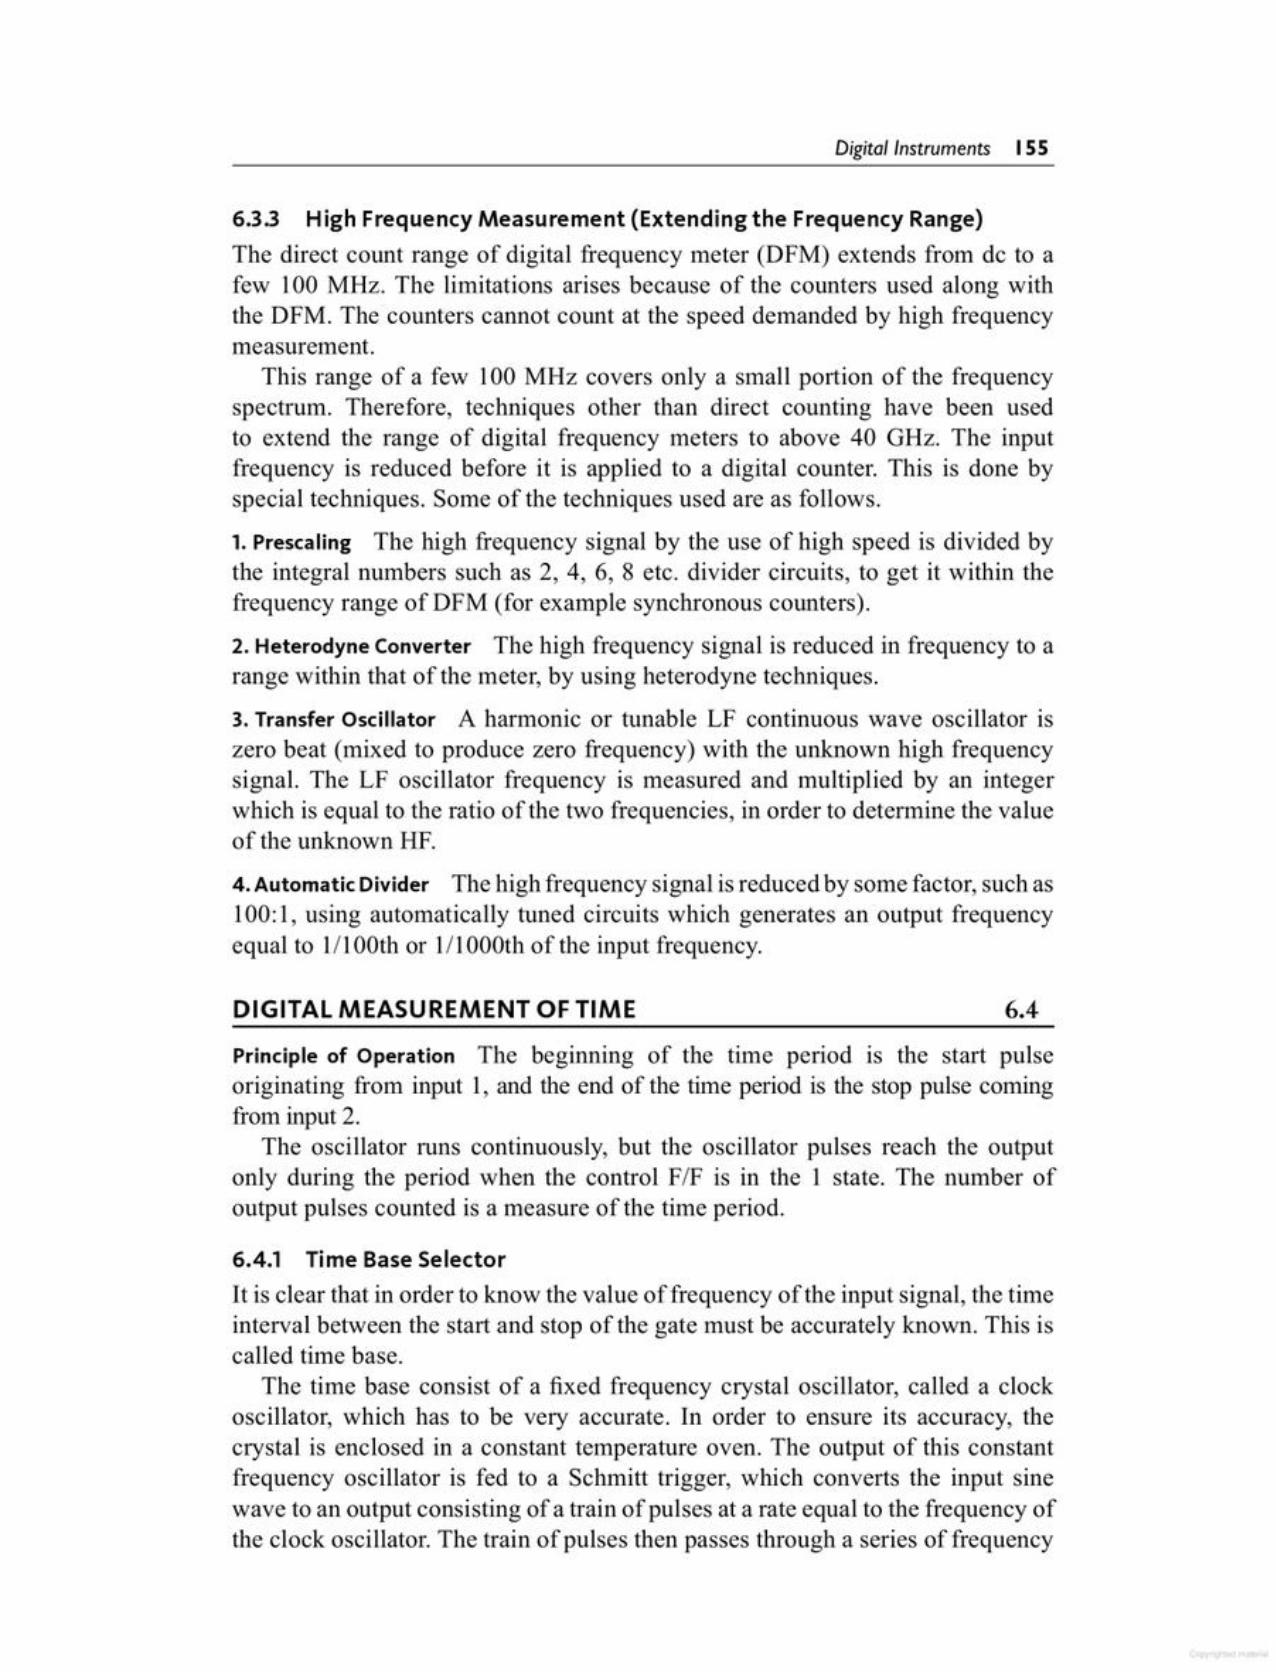
6.4.1 Time BaseSelectorIt is clear that in order to know the value offrequency of the input signal, the timeinterval between the start and stop of the gate must be accurately known. This iscalled time base.
The time base consist of a fixed frequency crystal oscillator, called a clockoscillator, which has to be very accurate. In order to ensure its accuracy, thecrystal is enclosed in a constant temperature oven. The output of this constantfrequency oscillator is fed to a Schmitt trigger, which converts the input sinewave to an output consisting of a train of pulses at a rate equal to the frequency ofthe clock oscillator. The train of pulses then passes through a series of frequency
Principle of Operation The beginning of the time period is the start pulseoriginating from input 1, and the end of the time period is the stop pulse comingfrom input 2.
The oscillator runs continuously, but the oscillator pulses reach the outputonly during the period when the control FIF is in the 1 state. The number ofoutput pulses counted is a measure of the time period.
6.4DIGITAL MEASUREMENT OF TIME
6.3.3 High Frequency Measurement (Extending the Frequency Range)The direct count range of digital frequency meter (DFM) extends from dc to afew 100 MHz. The limitations arises because of the counters used along withthe DFM. The counters cannot count at the speed demanded by high frequencymeasurement.
This range of a few 100 MHz covers only a small portion of the frequencyspectrum. Therefore, techniques other than direct counting have been usedto extend the range of digital frequency meters to above 40 GHz. The inputfrequency is reduced before it is applied to a digital counter. This is done byspecial techniques. Some of the techniques used are as follows.
1. Prescaling The high frequency signal by the use of high speed is divided bythe integral numbers such as 2, 4, 6, 8 etc. divider circuits, to get it within thefrequency range ofDFM (for example synchronous counters).
2. Heterodyne Converter The high frequency signal is reduced in frequency to arange within that of the meter, by using heterodyne techniques.
3. Transfer Oscillator A harmonic or tunable LF continuous wave oscillator iszero beat (mixed to produce zero frequency) with the unknown high frequencysignal. The LF oscillator frequency is measured and multiplied by an integerwhich is equal to the ratio of the two frequencies, in order to determine the valueof the unknown HF.
4. Automatic Divider The high frequency signal is reduced by some factor, such as100:1, using automatically tuned circuits which generates an output frequencyequal to 1/100th or 1/1000th of the input frequency.
Digita!!nstruments ISS

Fig. B.S Basic block diagram of time measurement
+10
2
Decimal Counterand Display Unit
StopInput
Input Atten-
6.4.2 Measurement of Time (Period Measurement)In some cases it is necessary to measure the time period rather than the frequency.This is especially true in the measurement of frequency in the low frequencyrange. To obtain good accuracy at low frequency, we should take measurementsof the period, rather than make direct frequency measurements. The circuit usedfor measuring frequency (Fig. 6.7) can be used for the measurement of timeperiod if the counted signal and gating signal are interchanged.
Figure 6.9 shows the circuit for measurement of time period. The gating signalis derived from the unknown input signal, which now controls the enablingand disabling of the main gate. The number of pulses which occur during oneperiod of the unknown signal are counted and displayed by the decade countingassemblies. The only disadvantage is that for measuring the frequency in the lowfrequency range, the operator has to calculate the frequency from the time byusing the equationf= liT.
Fig. B.B Time base selector
Time Base Selector
100 IJS
+10+10+10SchmittI---'-~ Trigger I-I-,..L+-j +1 0:\ '-_,
: _fU1_1 -----------------------------------------------_
SelectorSwitch
r-----------------------------------------------------
divider decade assemblies connected in cascade. Each decade divider consistsof a decade counter and divides the frequency by ten. Outputs are taken fromeach decade frequency divider by means of a selector switch; any output maybe selected.
The circuit of Fig. 6.8 consists of a clock oscillator having a 1 MHzfrequency. The output of the Schmitt trigger is 106 pulses per second and thispoint corresponds to a time of 1 microsecond. Hence by using a 6 decadefrequency divider, a time base with a range of 1 us - 10 us - 100 us - 1 ms -10 ms - 100 ms - 1 s can be selected using a selector switch.
156 Electronic Instrumentation

6.4.3 Ratio and Multiple Ratio MeasurementThe ratio measurement involves the measurement of the ratio of two frequencies.The measurement in effect is a period measurement. A low frequency is usedas gating signal while the high frequency is the counted signal. Hence the lowfrequency takes the place of the time base. The block diagram for the ratiomeasurements and multiple ratio is shown in Fig. 6.11.
The number of cycles of high frequency signal f which occur during the period of lower frequency signal z, are counted and displayed by the decimal counter and display unit. In multiple ratio measurements the period of low frequencysignal is extended by a factor of 10,100, etc. by using DDAs.
Decade Divider Assemblies
Fig. B.ID Block diagram of a single and multiple period (average) measurement
+10
,,Multiple :Period' ,
: Mult!ple Multiple Period Signal(Average): Period ~ ,Measurement: Trigger :
• - __ , I
1-8--8-9-1 :101-1:101--
Gated Signalsto the Counter
~Control
Fre ,<>nr'\11 CounterT er SignalL...-~:!""'-_J
"!:: Gating,..."...-:'.::---,Signal
.....,...----+-l AmplifierInputSignal
MainGate
For example, when measuring the period of a 60 Hz frequency, the electroniccounter might display 16.6673 ms, hence the frequency is
1 1f = - = = 59.9977 Hz.T 16.6673 x 10⁻³
The accuracy of the period measurement and hence offrequency can be greatlyincreased by using the multiple period average mode of operation. In this mode,the main gate is enabled for more than one period of the unknown signal. Thisis obtained by passing the unknown signal through one or more decade dividerassemblies (DDAs) so that the period is extended by a factor of 10,000 or more.
Hence the digital display shows more digital of information, thus increasingaccuracy. However, the decimal point location and measurement units are usuallychanged each time an additional decade divider is added, so that the display isalways in terms of the period of one cycle of the input signal, even though themeasurements may have lasted for 10,100 or more cycles.
Figure 6.10 show the multiple average mode of operation. In this circuit, fivemore decade dividing assemblies are added so that the gate is now enabled for amuch longer interval of time than it was with single DDA.
Digita!!nstruments 157
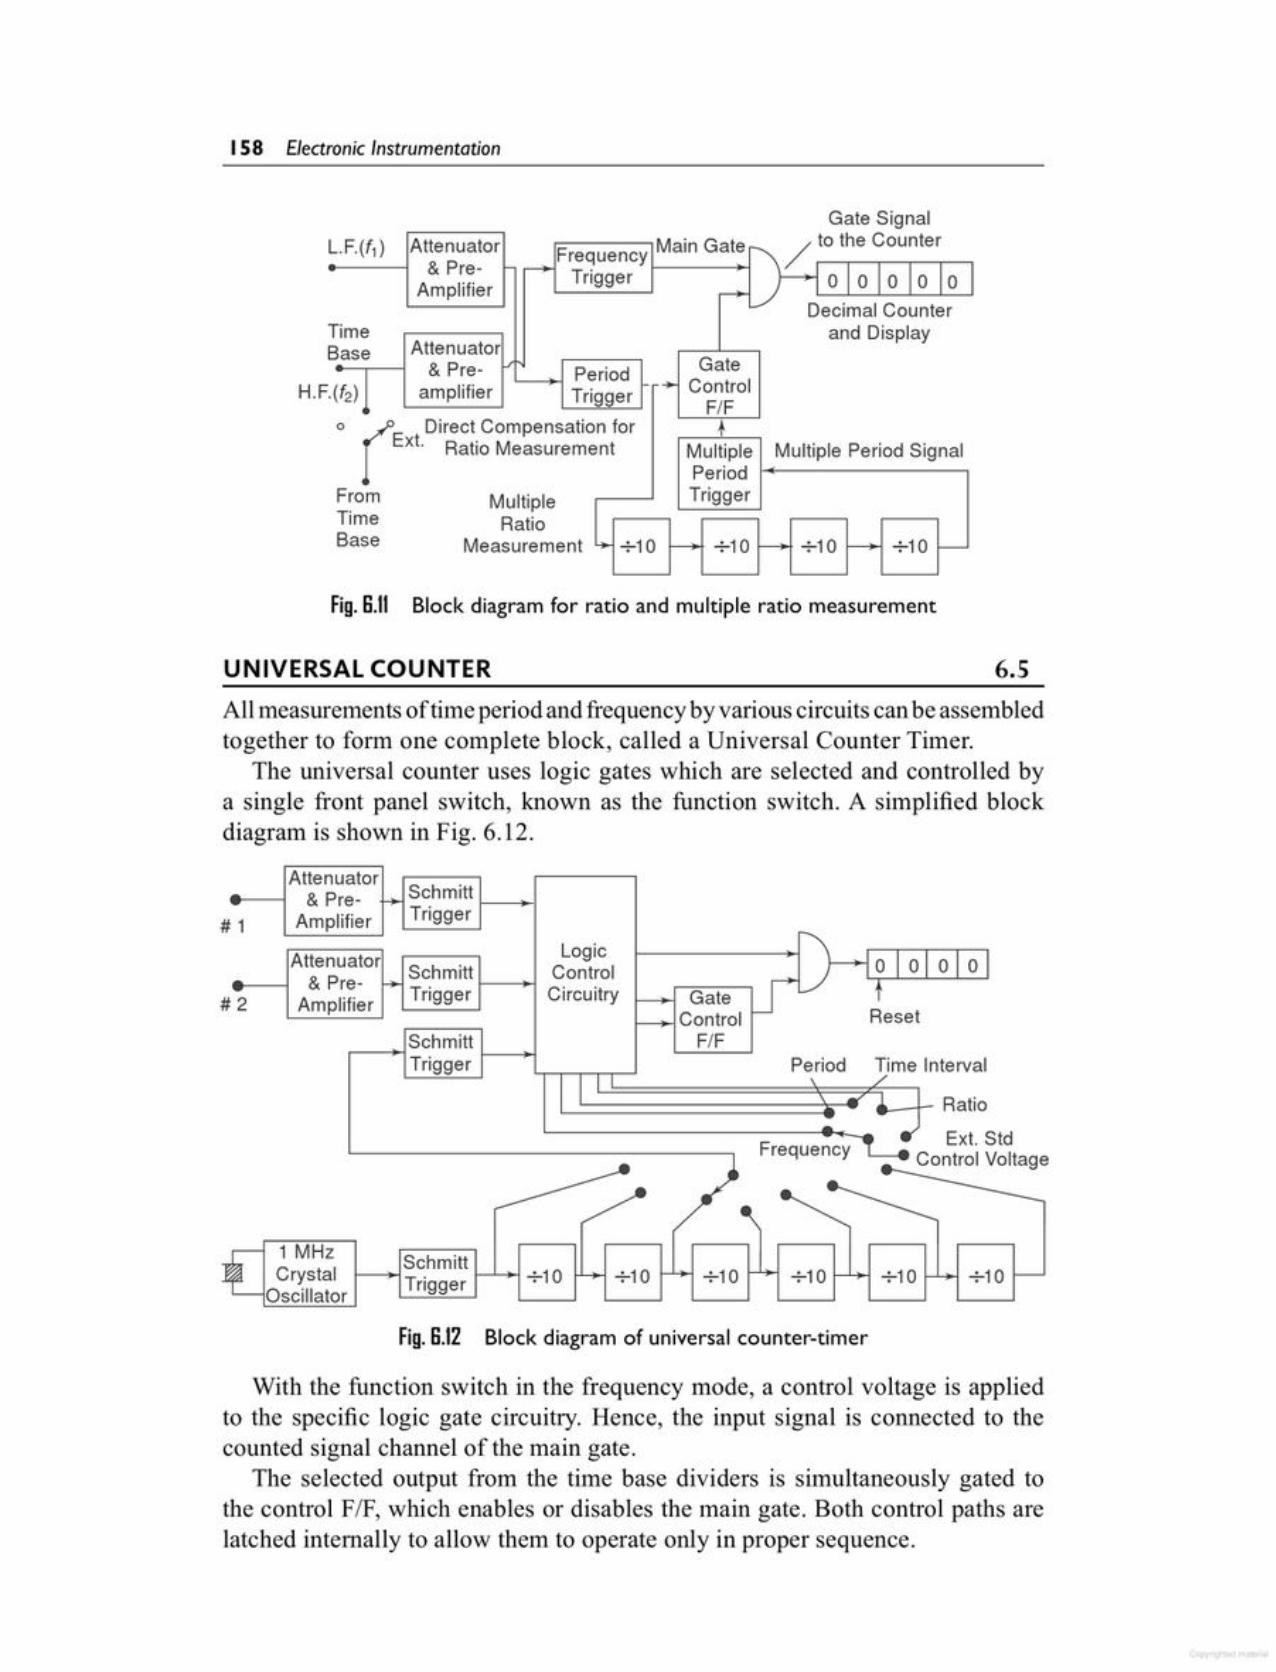
With the function switch in the frequency mode, a control voltage is appliedto the specific logic gate circuitry. Hence, the input signal is connected to thecounted signal channel of the main gate.
The selected output from the time base dividers is simultaneously gated tothe control FIF, which enables or disables the main gate. Both control paths arelatched internally to allow them to operate only in proper sequence.
Fig. S.12 Block diagram of universal counter-timer
AttenuatorSchmitt& Pre- f-+--
# 1 Amplifier Trigger
1\LogicA ttenuator : 0 10 0 01Schmitt Control
Gate u-LJ& Pre- f+ tTrigger Circuitry#2 Am -"."II-' III 1<:" ResetControlS..:hmitt F/FTr:~l:l~' Period ~ime Interval
I \
\ at' J. Ratio= --Frequency -, Ext. Std
/'Control Voltage..
If 1 MHz SchmittCrystal ITrigger +10 4- +10 f-~ +10 +- +10 --+- +10 -+- +10 -Oscillator
All measurements oftime period and frequency by various circuits can be assembledtogether to form one complete block, called a Universal Counter Timer.
The universal counter uses logic gates which are selected and controlled bya single front panel switch, known as the function switch. A simplified blockdiagram is shown in Fig. 6.12.
6.SUNIVERSAL COUNTER
Fig. S.l1 Block diagram for ratio and multiple ratio measurement
Measurement ~ +10 f---+- +10 ___. +10 f----+- +10 -
Multiple Period SignalMultiplePeriod I~----------,
Trigger
Gate-+- Control
F/Fo (E Direct Compensation for
xt. Ratio Measurement
F~om MultipleTime RatioBase
TimeBase
Attenuator&Pre
Amplifier
Gate SignalMain Gate ~/ to the Counter
Frequency I \,.- Trigger I----r--+--+il} I 0 0 0 10 0
L./ Decimal Counterand Display
Attenuator& Pre- f.I PeriodL._-+j
amplifier Trigger
158 Electronic Instrumentation

The outputs of the FIF Band D are high (equal to binary 1) after 10 pulseshave been applied to the counter. Therefore, the output signal of the decadecounter is 1010. This output has to be reset on the very next pulse which is doneby the use of an AND gate that resets all FIF's to 0, when the outputs ofB and Dare 1. The waveform shown in Fig. 6.13 (b) shows the pulse train applied to thetrigger input (clock) of the decade counter (shown in Fig. 6.13(a)) and the outputwaveform of each FIF.
At the beginning all the FIFs are reset to 0000. The clock pulse is applied tothe trigger input T of the FIF. Since this is a negative edged triggered FIF, at thenegative edge or falling edge of the trigger input the FIF A will toggle, and hencethe output of F/F A changes to level 1; all other FlFs undergo no change. Theoutputs from the FIFs will be 0001. At the next clock pulse the FIF A will toggleback to 0, and the output of FIF A falls from 1 to 0 and is applied to the T inputof the next FIF B, toggling it. The output of the FIF B changes to 1and the outputof the decade counter goes to 0010.
Fig.S.13 (a) Decade counter
CIIn
•-~ ~vee (" ./
" -,ock_ '\
- S A - L- S B f- - S C - - S 0 r-put- T - T - T - T
t-- R r+' R r- R - R
A B C 04
+
A decade counter is a circuit offlip-flops (F/Fs) in cascade, which counts in thebase 10 (decimal number system). This means that there is a sequence of tendistinct counts in increasing order. Three F/Fs used in cascade progress through 8distinct states (binary numbers from 000 to 111),while 4 FIFs in cascade progressthrough 16 distinct states (binary numbers 0000 to 1111). Hence to get a countof 10, a minimum of 4 F/Fs are required (because 8 distinct states are less while16 are too many for a decade counter). This problem can be overcome by using4 FIFs in cascade and resetting the output of each FIF to 0 after the desired 10counts. Figure 6.13 (a) shows a decade counter using 4 negative edged triggeredF/Fs in cascade .
6.6DECADE COUNTER
When the function switch is on the period mode, the control voltage isconnected to proper gates of the logic circuitry, which connects the time basesignals to the counted signal channel of the main gate. At the same time thelogic circuitry connects the input to the gate control for enabling or disabling themain gate. The other function switches, such as time interval ratio and externalstandards perform similar functions. The exact details of switching and controlprocedures vary from instrument to instrument.
Digita!!nstruments I S9
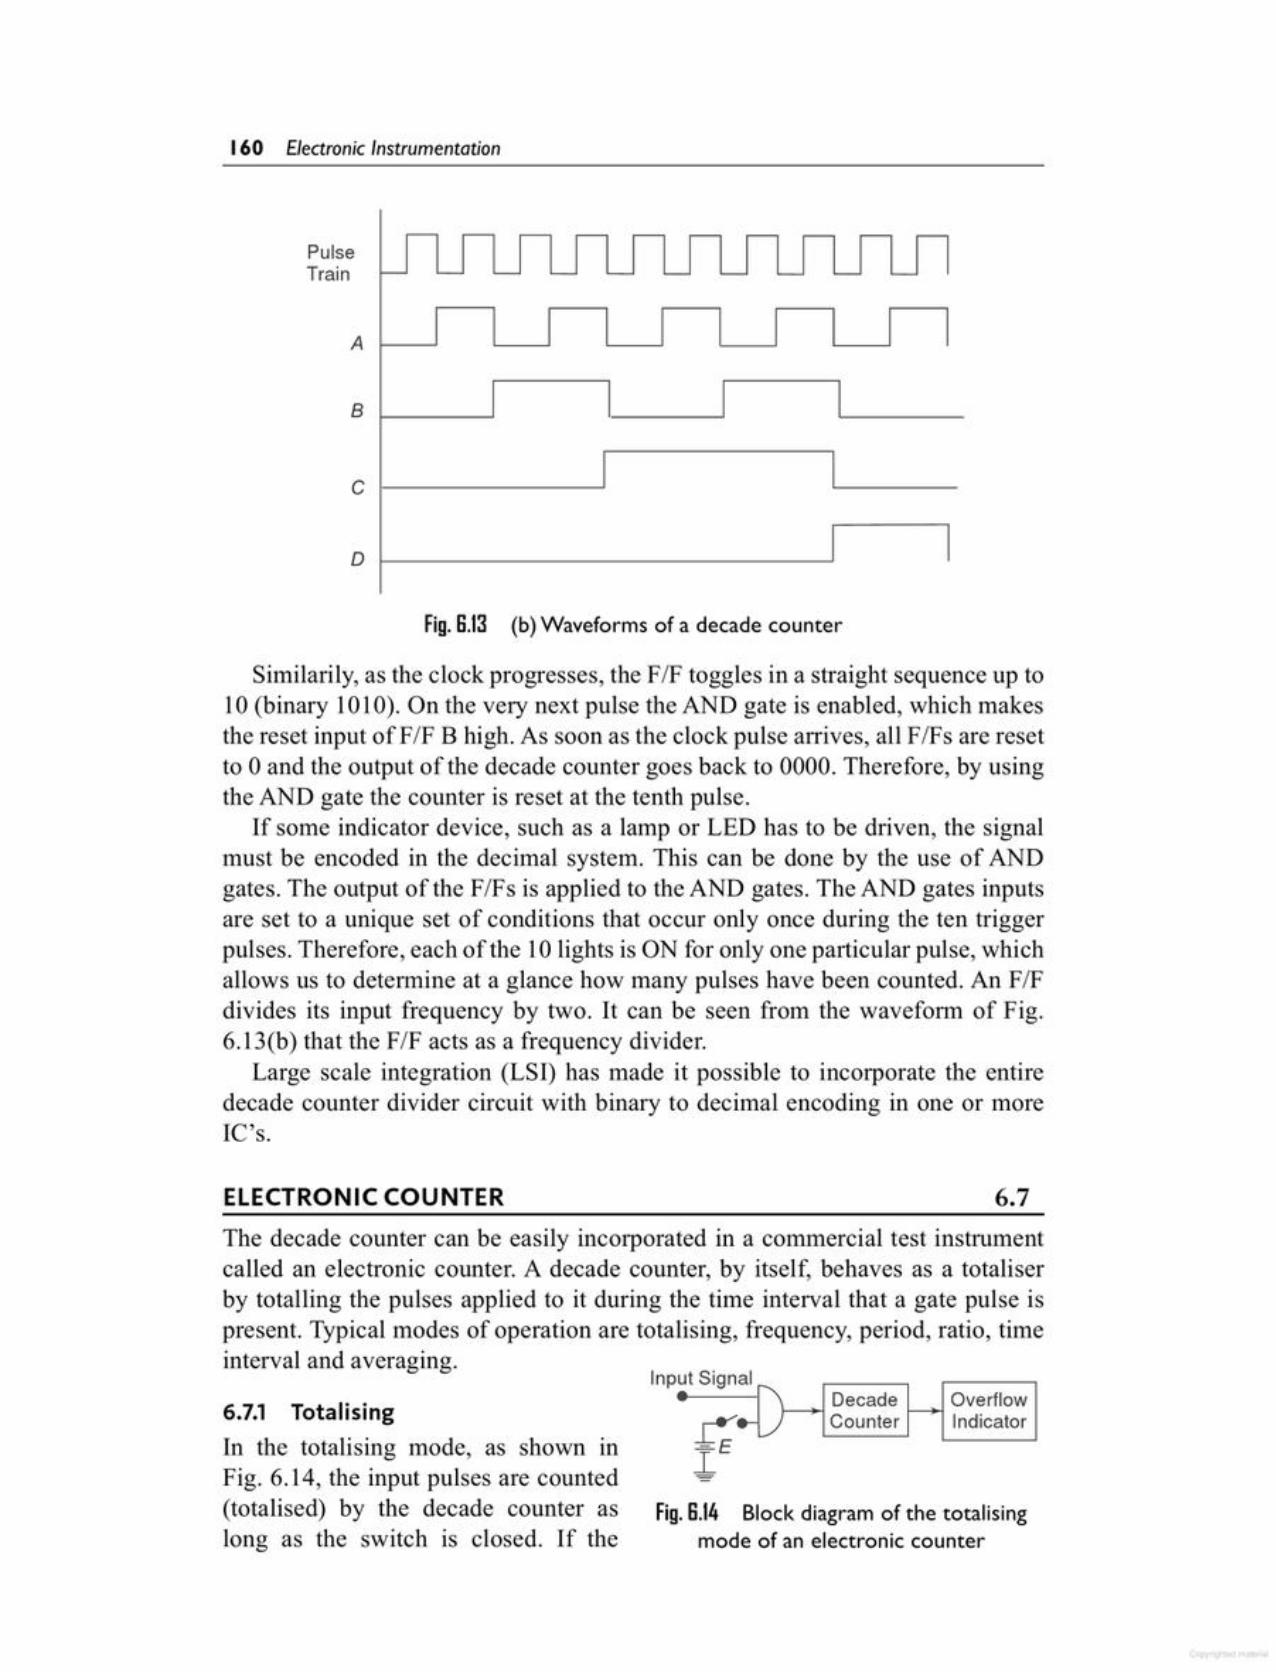
Fig.6.14 Block diagram of the totalisingmode of an electronic counter
OverflowIndicator
DecadeI---~Counter
Input Signal•6.7.1 TotalisingIn the totalising mode, as shown inFig. 6.14, the input pulses are counted(totalised) by the decade counter aslong as the switch is closed. If the
The decade counter can be easily incorporated in a commercial test instrumentcalled an electronic counter. A decade counter, by itself, behaves as a totaliserby totalling the pulses applied to it during the time interval that a gate pulse ispresent. Typical modes of operation are totalising, frequency, period, ratio, timeinterval and averaging.
6.7ELECTRONIC COUNTER
Similarily, as the clock progresses, the PIP toggles in a straight sequence up to10 (binary 1010). On the very next pulse the AND gate is enabled, which makesthe reset input of PIP B high. As soon as the clock pulse arrives, all F/Fs are resetto 0 and the output of the decade counter goes back to 0000. Therefore, by usingthe AND gate the counter is reset at the tenth pulse.
If some indicator device, such as a lamp or LED has to be driven, the signalmust be encoded in the decimal system. This can be done by the use of ANDgates. The output of the PIPs is applied to the AND gates. The AND gates inputsare set to a unique set of conditions that occur only once during the ten triggerpulses. Therefore, each of the 10 lights is ON for only one particular pulse, whichallows us to determine at a glance how many pulses have been counted. An F/Fdivides its input frequency by two. It can be seen from the waveform of Fig.6.13(b) that the F/P acts as a frequency divider.
Large scale integration (LSI) has made it possible to incorporate the entiredecade counter divider circuit with binary to decimal encoding in one or moreIe's.
Fig. 6.13 (b) Waveforms of a decade counter
o
B
A
PulseTrain
- - .--- - .--- .--- .--- .--- - .---r-- - '-- - '-- - - '-- - '--
Ic
160 Electronic Instrumentation
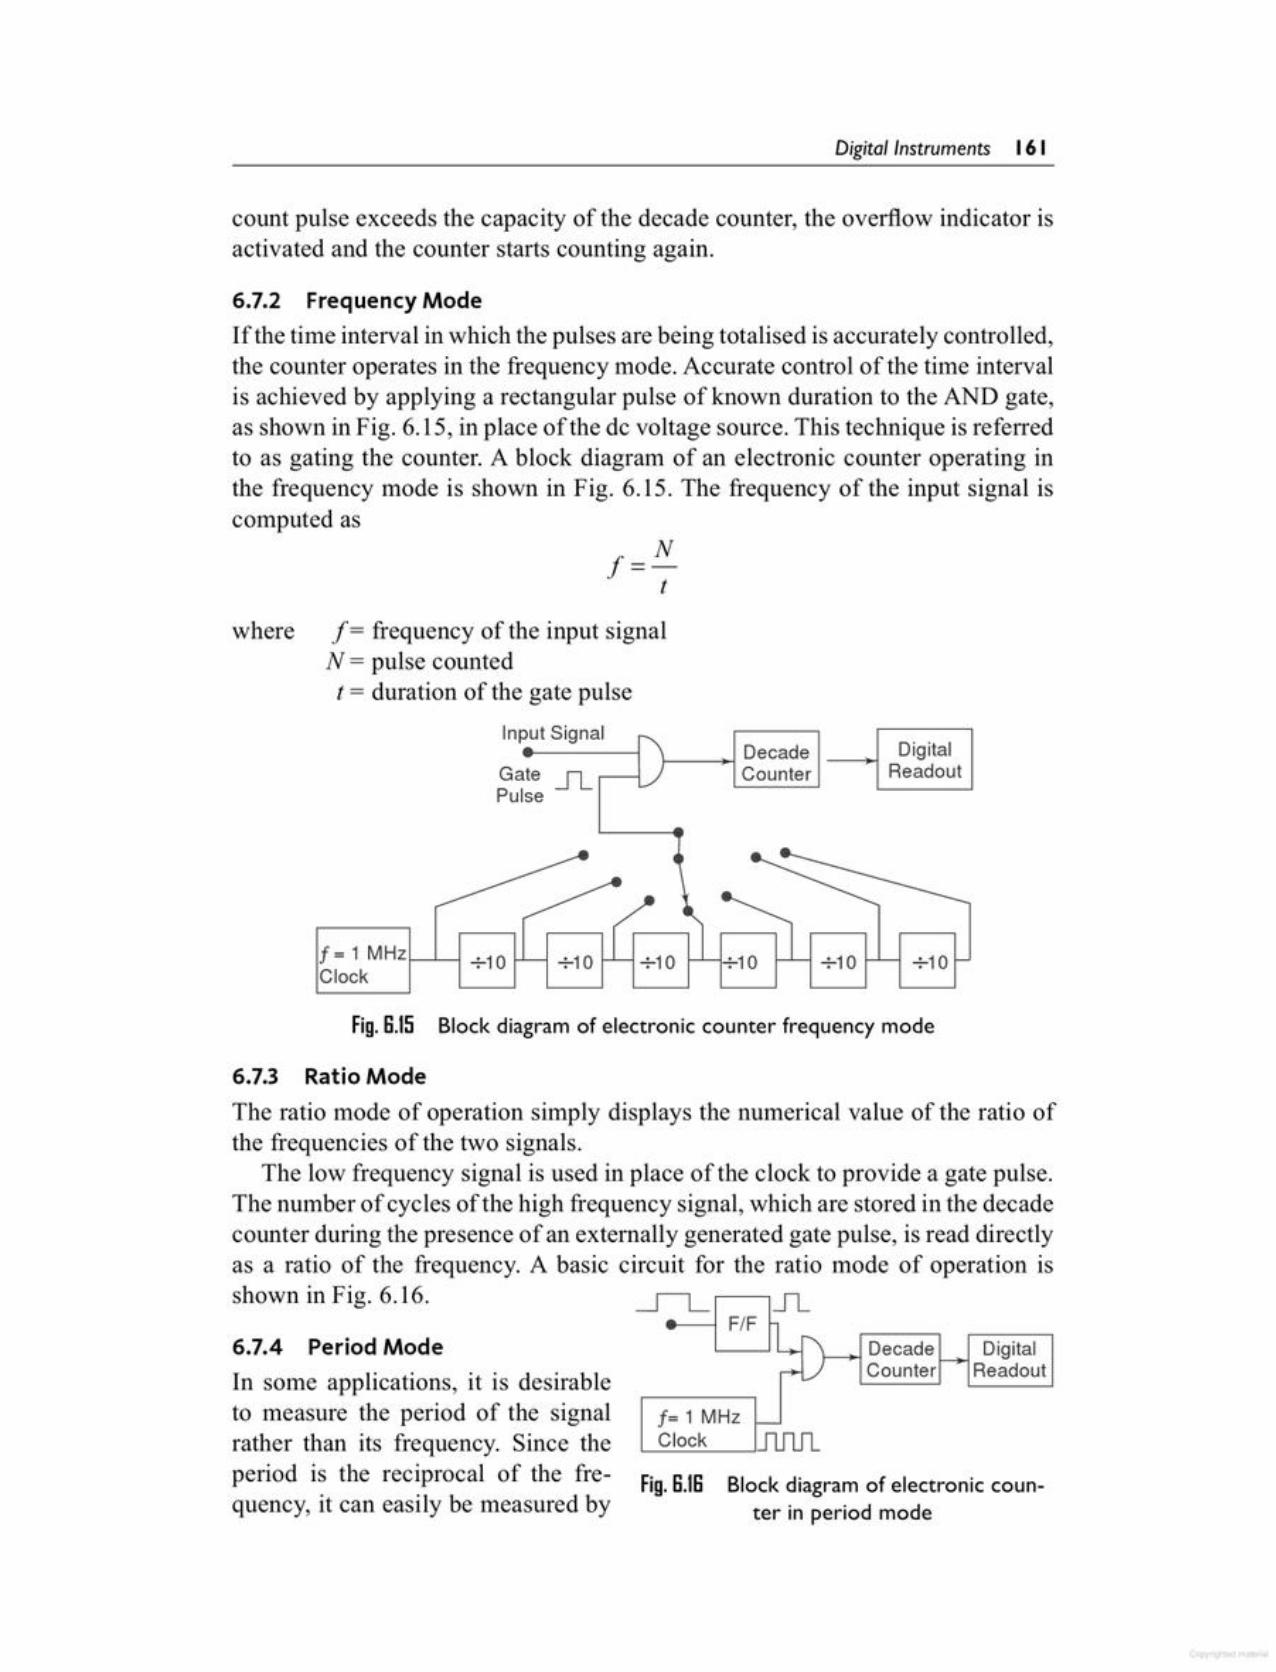
Fig. S.IS Block diagramof electronic counter in period mode
_n_ .n,F/F IL"\
Decade Digital---+
-__) Counter Readout
f= 1 MHz 1-Clock JUlJl
6.7.4 Period ModeIn some applications, it is desirableto measure the period of the signalrather than its frequency. Since theperiod is the reciprocal of the frequency, it can easily be measured by
6.7.3 Ratio ModeThe ratio mode of operation simply displays the numerical value of the ratio ofthe frequencies of the two signals.
The low frequency signal is used in place of the clock to provide a gate pulse.The number of cycles of the high frequency signal, which are stored in the decadecounter during the presence of an externally generated gate pulse, is read directlyas a ratio of the frequency. A basic circuit for the ratio mode of operation isshown in Fig. 6.16.
Fig. S.IS Block diagramof electronic counter frequency mode
+10+10+10 +10
f---~ DecadeCounter
DigitalReadout
f = 1 MHzf---L.......J+10Clock
Gate _ll_.----1Pulse
f=Nt
where f= frequency of the input signalN = pulse countedt = duration of the gate pulse
Input Signal
6.7.2 Frequency ModeIf the time interval in which the pulses are being totalised is accurately controlled,the counter operates in the frequency mode. Accurate control of the time intervalis achieved by applying a rectangular pulse of known duration to the AND gate,as shown in Fig. 6.15, in place of the de voltage source. This technique is referredto as gating the counter. A block diagram of an electronic counter operating inthe frequency mode is shown in Fig. 6.15. The frequency of the input signal iscomputed as
count pulse exceeds the capacity of the decade counter, the overflow indicator isactivated and the counter starts counting again.
Digita!!nstruments 161
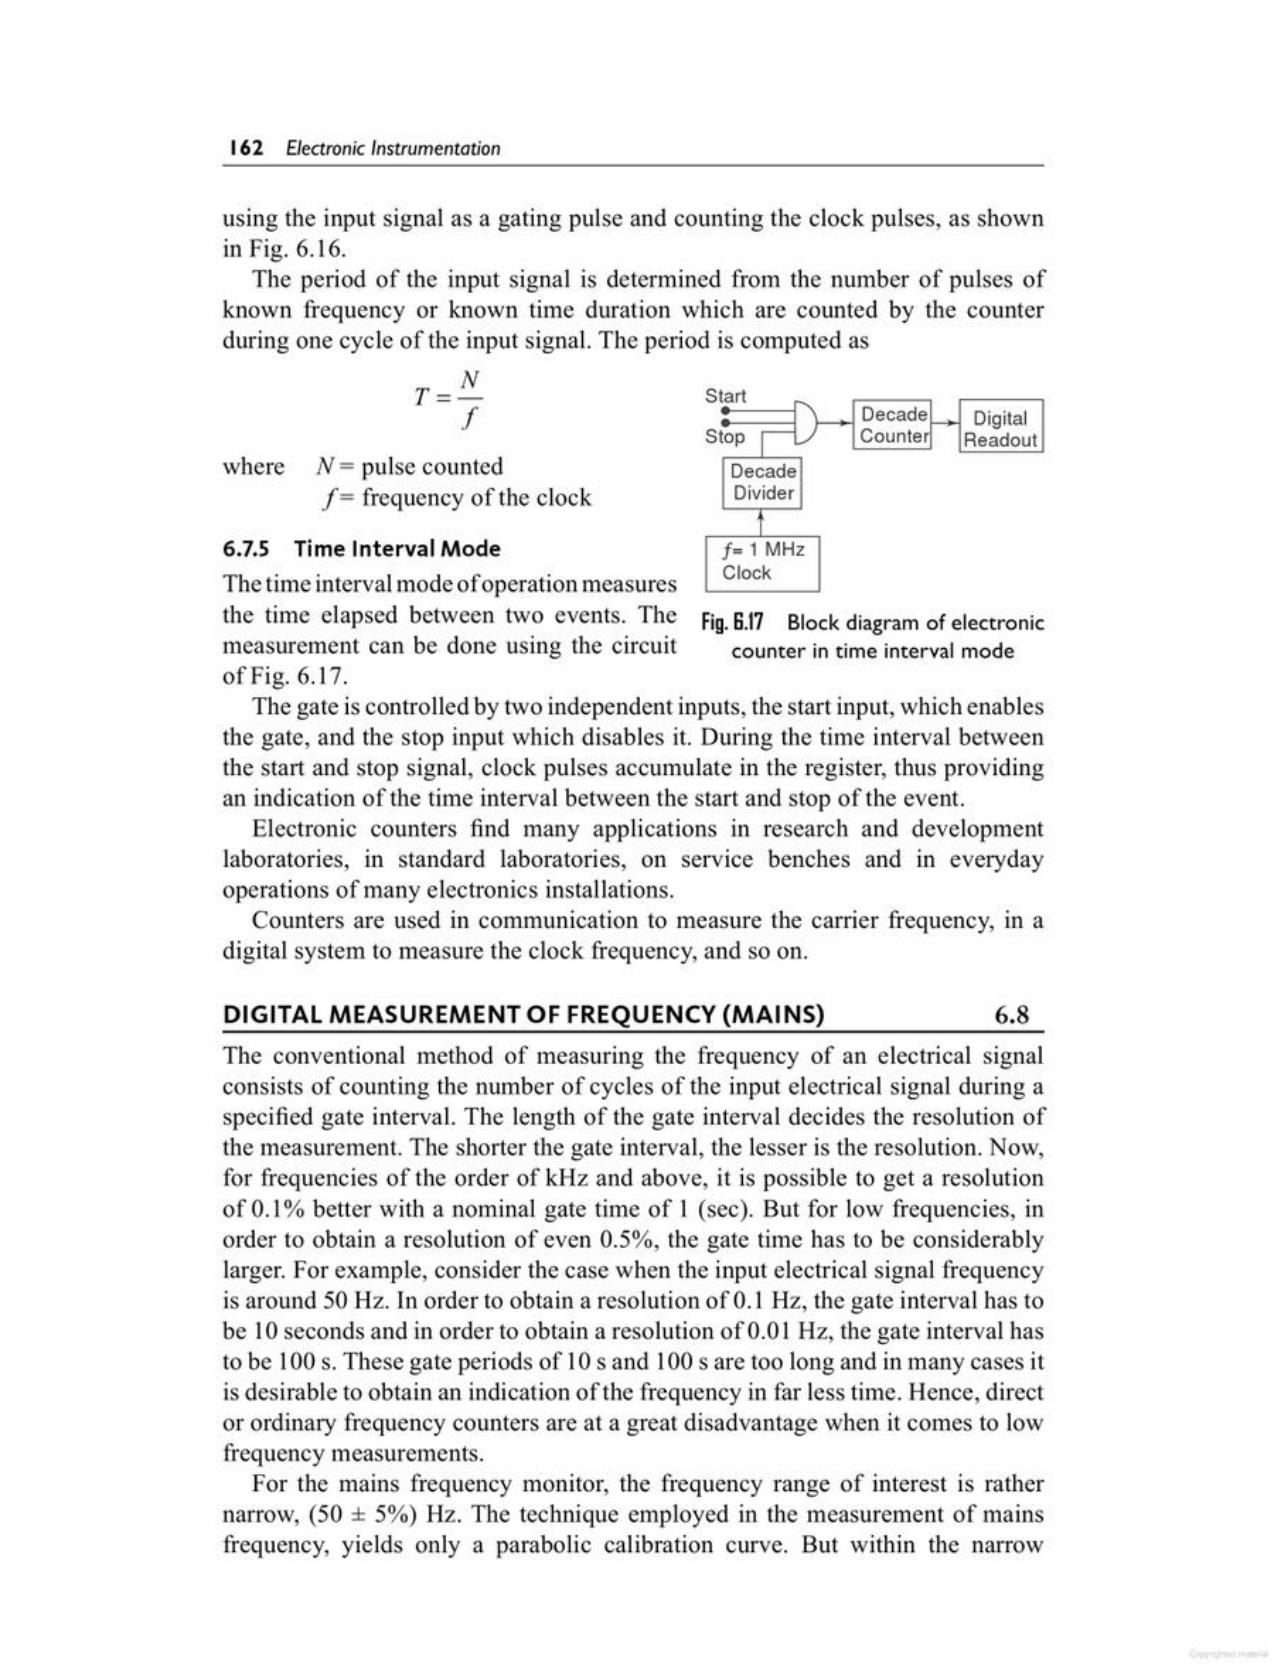
The conventional method of measuring the frequency of an electrical signalconsists of counting the number of cycles of the input electrical signal during aspecified gate interval. The length of the gate interval decides the resolution ofthe measurement. The shorter the gate interval, the lesser is the resolution. Now,for frequencies of the order of kHz and above, it is possible to get a resolutionof 0.1% better with a nominal gate time of 1 (sec). But for low frequencies, inorder to obtain a resolution of even 0.5%, the gate time has to be considerablylarger. For example, consider the case when the input electrical signal frequencyis around 50 Hz. In order to obtain a resolution of 0.1 Hz, the gate interval has tobe 10 seconds and in order to obtain a resolution of 0.01 Hz, the gate interval hasto be 100 s. These gate periods of lOs and 100 s are too long and in many cases itis desirable to obtain an indication of the frequency in far less time. Hence, director ordinary frequency counters are at a great disadvantage when it comes to lowfrequency measurements.
For the mains frequency monitor, the frequency range of interest is rathernarrow, (50 ± 5%) Hz. The technique employed in the measurement of mainsfrequency, yields only a parabolic calibration curve. But within the narrow
6.8DIGITAL MEASUREMENT OF FREQUENCY (MAINS)
6.7.5 Time Interval ModeThe time interval mode of operation measuresthe time elapsed between two events. The Fig. B.l7 Block diagramof electronicmeasurement can be done using the circuit counter in time interval modeof Fig. 6.17.
The gate is controlled by two independent inputs, the start input, which enablesthe gate, and the stop input which disables it. During the time interval betweenthe start and stop signal, clock pulses accumulate in the register, thus providingan indication of the time interval between the start and stop of the event.
Electronic counters find many applications in research and developmentlaboratories, in standard laboratories, on service benches and in everydayoperations of many electronics installations.
Counters are used in communication to measure the carrier frequency, in adigital system to measure the clock frequency, and so on.
a1\ Decade f--+ Digital
Stop iLJ Counter ReadoutDecadeDivider
tf= 1 MHzClock
where N = pulse countedf = frequency of the clock
St rt
using the input signal as a gating pulse and counting the clock pulses, as shownin Fig. 6.16.
The period of the input signal is determined from the number of pulses ofknown frequency or known time duration which are counted by the counterduring one cycle of the input signal. The period is computed as
T=Nf
162 Electronic Instrumentation
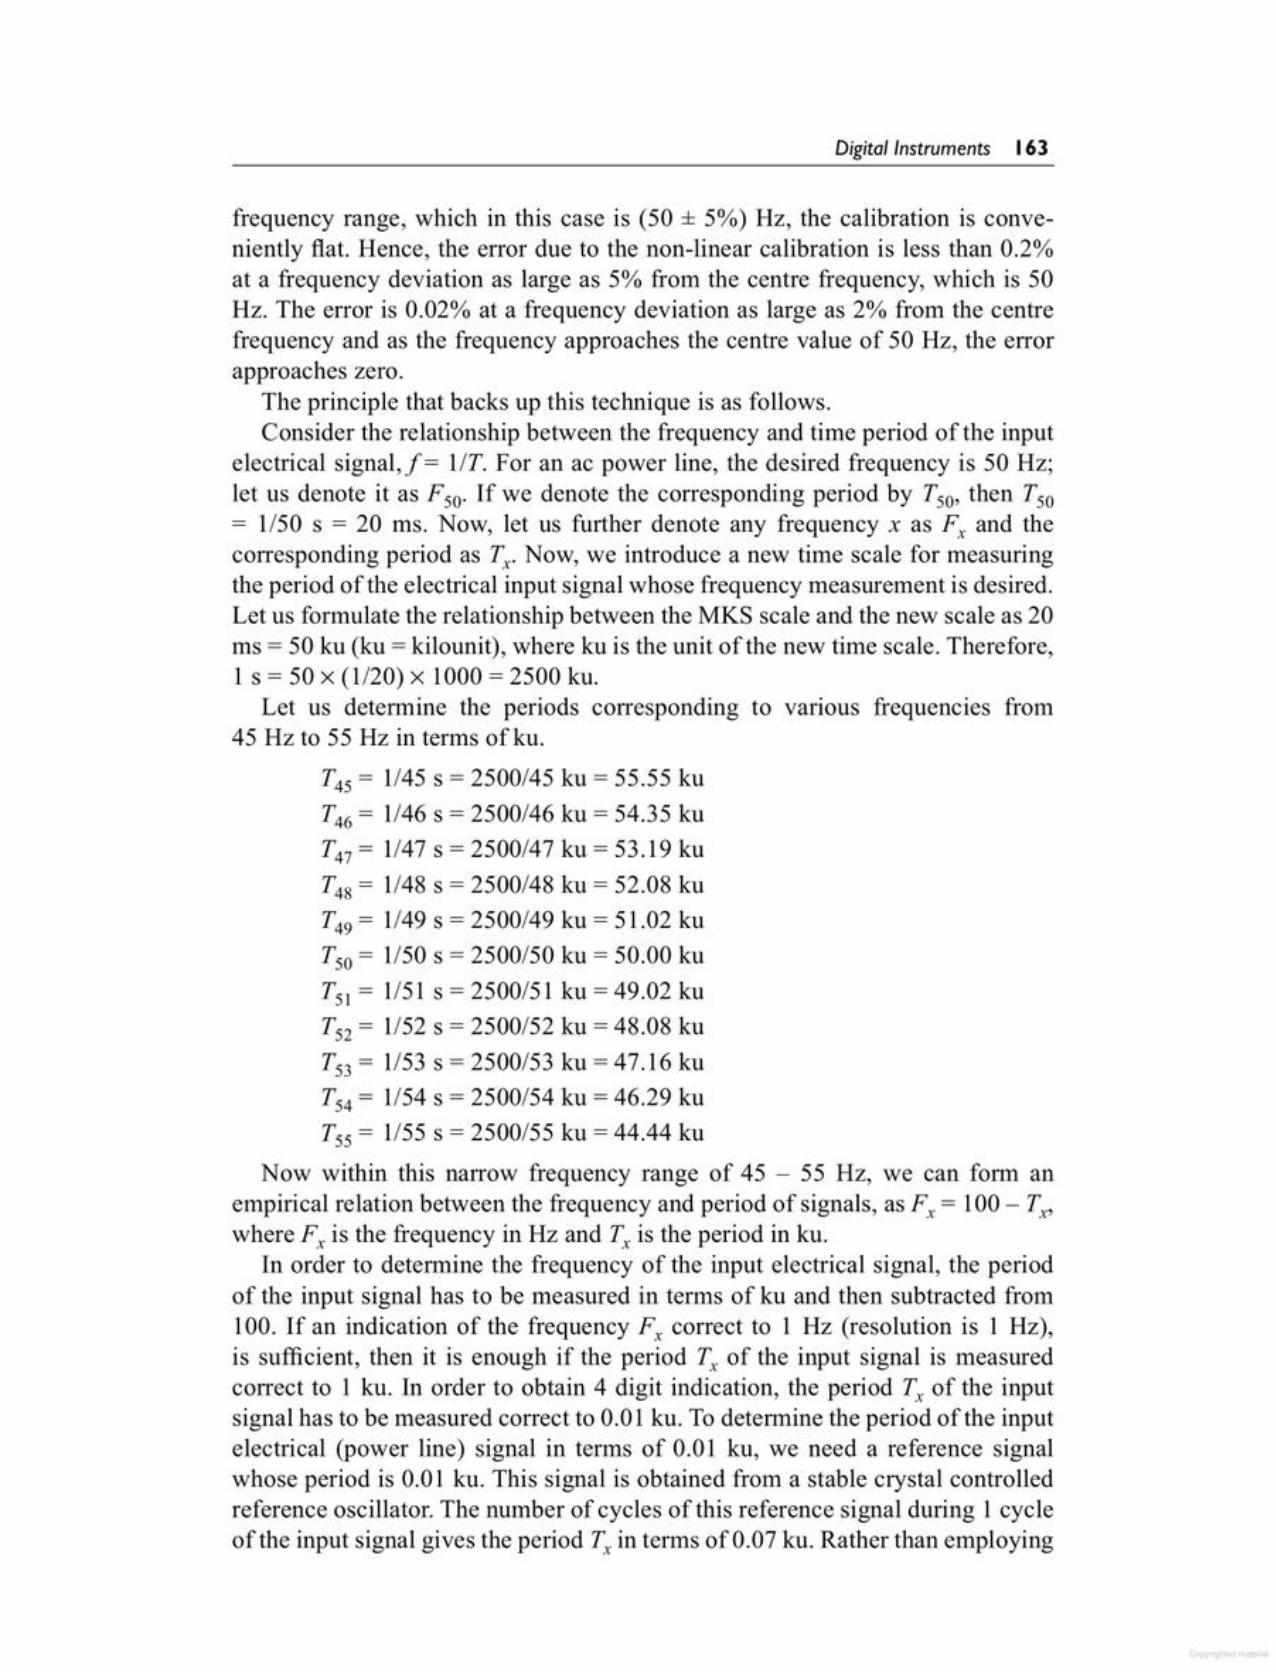
frequency range, which in this case is (50 ± 5%) Hz, the calibration is conveniently fiat. Hence, the error due to the non-linear calibration is less than 0.2%at a frequency deviation as large as 5% from the centre frequency, which is 50Hz. The error is 0.02% at a frequency deviation as large as 2% from the centrefrequency and as the frequency approaches the centre value of 50 Hz, the errorapproaches zero.
The principle that backs up this technique is as follows.Consider the relationship between the frequency and time period of the input
electrical signal,/= liT. For an ac power line, the desired frequency is 50 Hz;let us denote it as Fso. If we denote the corresponding period by Tso, then Tso= 1/50 s = 20 ms. Now, let us further denote any frequency x as F; and thecorresponding period as Tx. Now, we introduce a new time scale for measuringthe period of the electrical input signal whose frequency measurement is desired.Let us formulate the relationship between the MKS scale and the new scale as 20ms = 50 ku (ku = kilounit), where ku is the unit of the new time scale. Therefore,1 s = 50 x (1/20) x 1000 = 2500 ku.
Let us determine the periods corresponding to various frequencies from45 Hz to 55 Hz in terms ofku.
T4S = 1/45 s = 2500/45 ku = 55.55 kuT46 = 1/46 s = 2500/46 ku = 54.35 kuT47 = 1/47 s = 2500/47 ku = 53.19 kuT48 = 1/48 s = 2500/48 ku = 52.08 kuT49 = 1/49 s = 2500/49 ku = 51.02 kuTso = 1/50 s = 2500/50 ku = 50.00 kuTSI = 1/51 s = 2500/51 ku = 49.02 kuTS2 = 1/52 s = 2500/52 ku = 48.08 kuTS3 = 1/53 s = 2500/53 ku =47.16 kuTS4 = 1/54 s = 2500/54 ku = 46.29 kuTss = 1/55 s = 2500/55 ku = 44.44 ku
Now within this narrow frequency range of 45 - 55 Hz, we can form anempirical relation between the frequency and period of signals, as F, = 100 - Tx,
where F; is the frequency in Hz and T,is the period in ku.In order to determine the frequency of the input electrical signal, the period
of the input signal has to be measured in terms of ku and then subtracted from100. If an indication of the frequency F; correct to 1 Hz (resolution is 1 Hz),is sufficient, then it is enough if the period T'; of the input signal is measuredcorrect to 1 ku. In order to obtain 4 digit indication, the period T; of the inputsignal has to be measured correct to 0.01 ku. To determine the period of the inputelectrical (power line) signal in tenns of 0.01 ku, we need a reference signalwhose period is 0.01 ku. This signal is obtained from a stable crystal controlledreference oscillator. The number of cycles of this reference signal during 1 cycleof the input signal gives the period T; in terms of 0.07 ku.Rather than employing
Digita!!nstruments 163
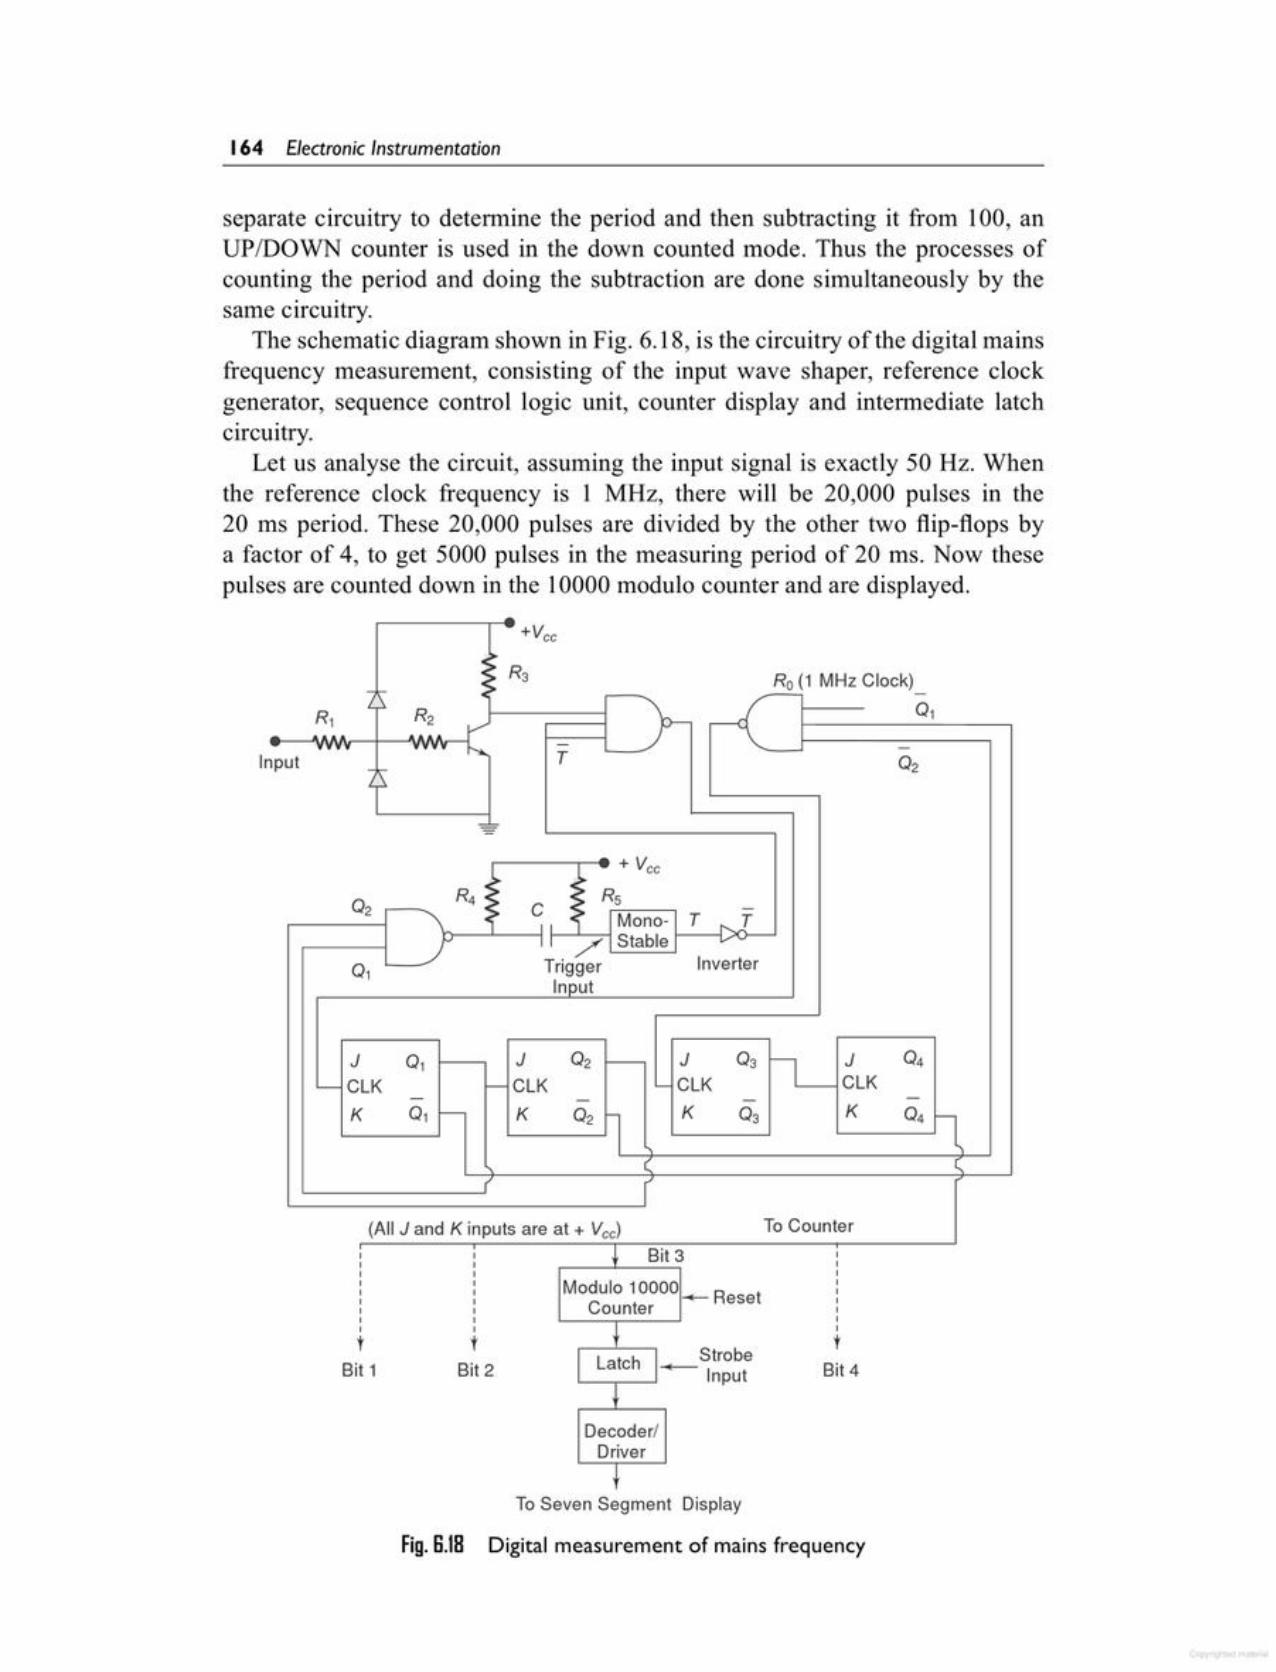
+To Seven Segment Display
Fig. S.18 Digital measurement of mains frequency
IIIIIIIII
tBit 4
DriverDecoder/
latch I_Strobel Input
tBit 2
Modulo 10000 ResetCounter
: tIIIIIII
t
IIIIIIIII
tBit 1
(All J and K inputs are at + Vee) To Counter
Bit 3
(
0, -
01J- ClK
K
J-ClK
K
0,
,---..,...... .. + Vee? -?-
R4 '$ C ~ Rr.5-;-----, _-?' 1 1 <' Mono- T .1
)'1:1---'---11 1 / Stable I--iv/O-'
...._....... Trigger InverterInput
Input
J 03 II J 04'- ClK ClK
- -K 03 K
04~
( C.(
Ro (1 MHz Clock)-+.
separate circuitry to determine the period and then subtracting it from 100, anUP/DOWN counter is used in the down counted mode. Thus the processes ofcounting the period and doing the subtraction are done simultaneously by thesame circuitry.
The schematic diagram shown in Fig. 6.18, is the circuitry of the digital mainsfrequency measurement, consisting of the input wave shaper, reference clockgenerator, sequence control logic unit, counter display and intermediate latchcircuitry.
Let us analyse the circuit, assuming the input signal is exactly 50 Hz. Whenthe reference clock frequency is 1 MHz, there will be 20,000 pulses in the20 ms period. These 20,000 pulses are divided by the other two flip-flops bya factor of 4, to get 5000 pulses in the measuring period of 20 ms. Now thesepulses are counted down in the 10000 modulo counter and are displayed.
164 Electronic Instrumentation
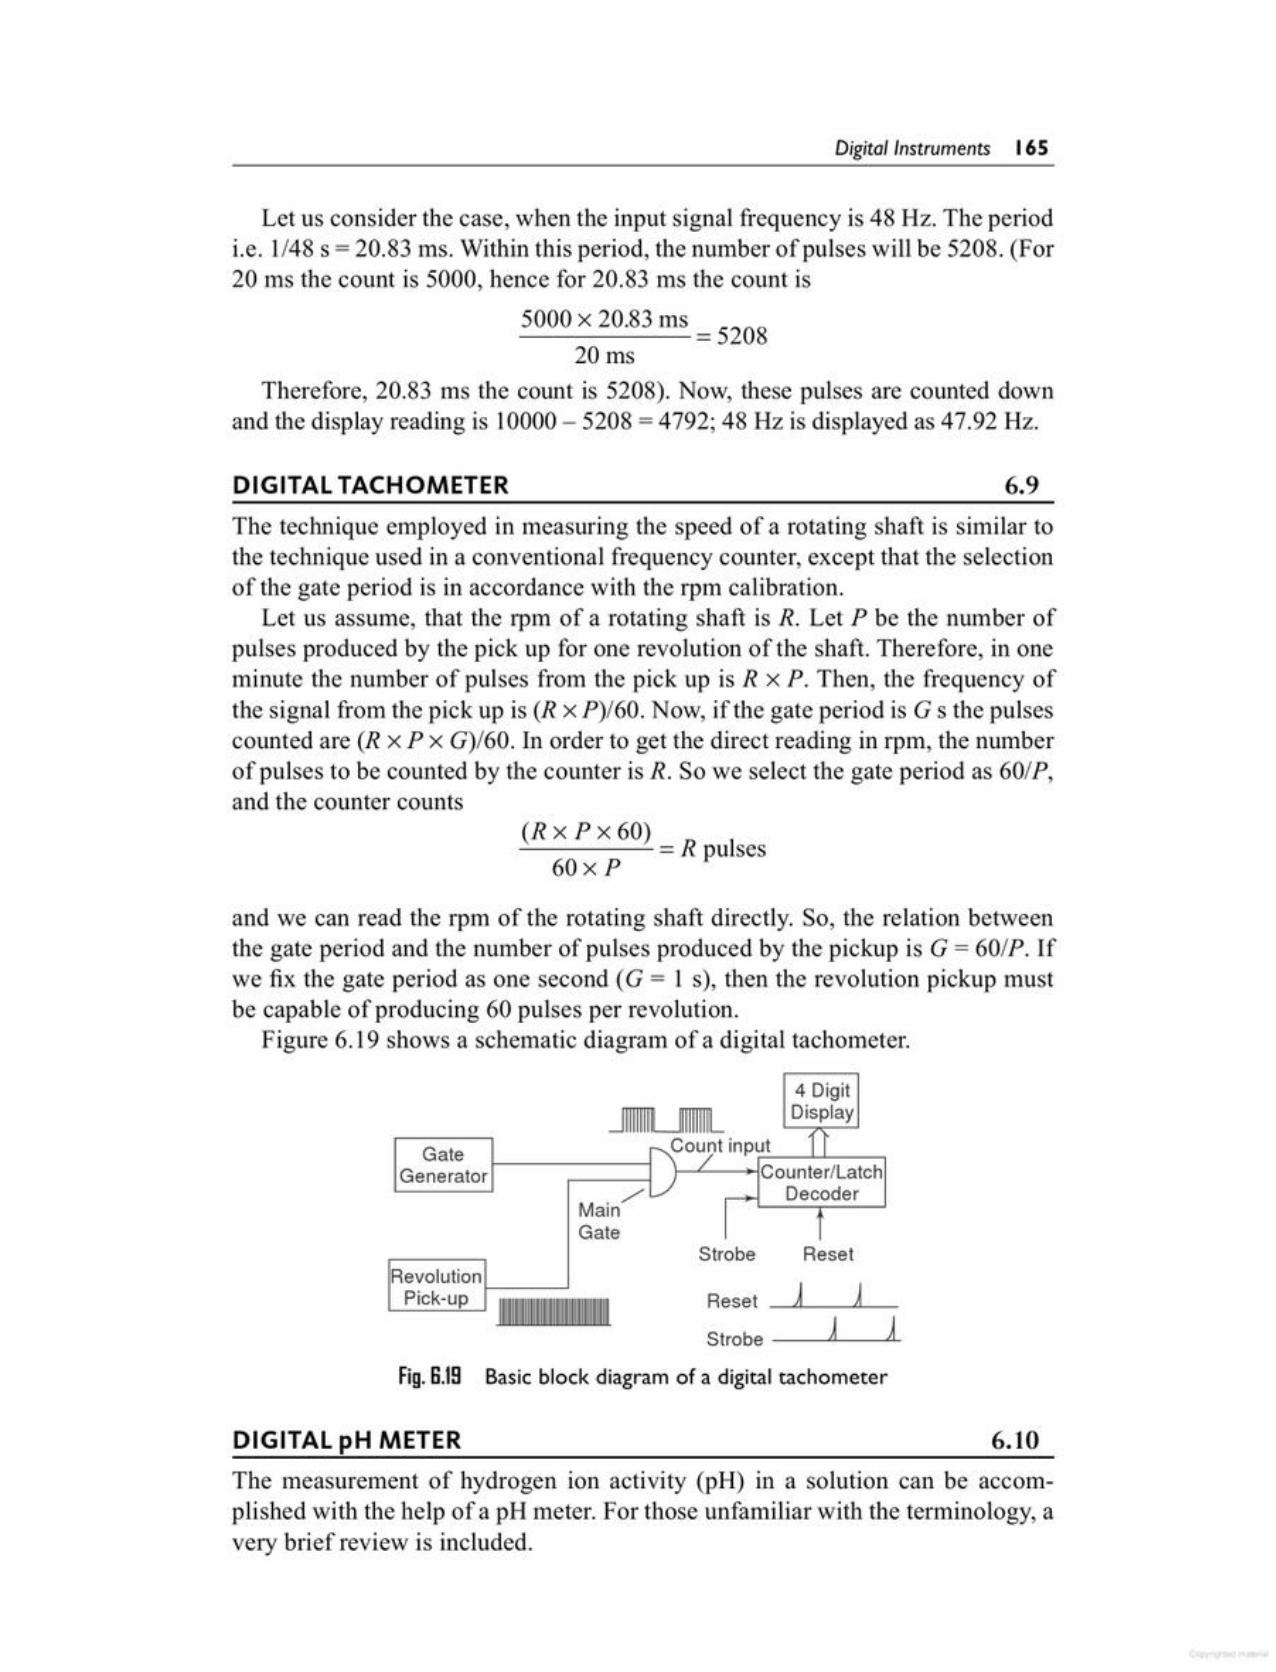
DIGITAL pH METER 6.10The measurement of hydrogen ion activity (pH) in a solution can be accomplished with the help of a pH meter. For those unfamiliar with the terminology, avery brief review is included.
Fig. G.l9 Basic block diagram of a digital tachometer
4 Digit
~Display
GateGenerator Counter/Latch
M' /' Decoderam
GateStrobe Reset
RevolutionA APick-up Reset
Strobe A ~
and we can read the rpm of the rotating shaft directly. So, the relation betweenthe gate period and the number of pulses produced by the pickup is G = 60/P. Ifwe fix the gate period as one second (G = 1 s), then the revolution pickup mustbe capable of producing 60 pulses per revolution.
Figure 6.19 shows a schematic diagram of a digital tachometer.
(R x P x 60) R I= pu ses60xP
The technique employed in measuring the speed of a rotating shaft is similar tothe technique used in a conventional frequency counter, except that the selectionof the gate period is in accordance with the rpin calibration.
Let us assume, that the rpm of a rotating shaft is R. Let P be the number ofpulses produced by the pick up for one revolution of the shaft. Therefore, in oneminute the number of pulses from the pick up is R x P. Then, the frequency ofthe signal from the pick up is (R x P)/60. Now, if the gate period is G s the pulsescounted are (R x P x G)/60. In order to get the direct reading in rpm, the numberof pulses to be counted by the counter is R. So we select the gate period as 60/P,and the counter counts
6.9DIGITAL TACHOMETER
Let us consider the case, when the input signal frequency is 48 Hz. The periodi.e. 1/48 s = 20.83 ms. Within this period, the number of pulses will be 5208. (For20 Ins the count is 5000, hence for 20.83 ms the count is
5000 x 20.83 ms = 520820ms
Therefore, 20.83 ms the count is 5208). Now, these pulses are counted downand the display reading is 10000 - 5208 = 4792; 48 Hz is displayed as 47.92 Hz.
Digita!!nstruments 165
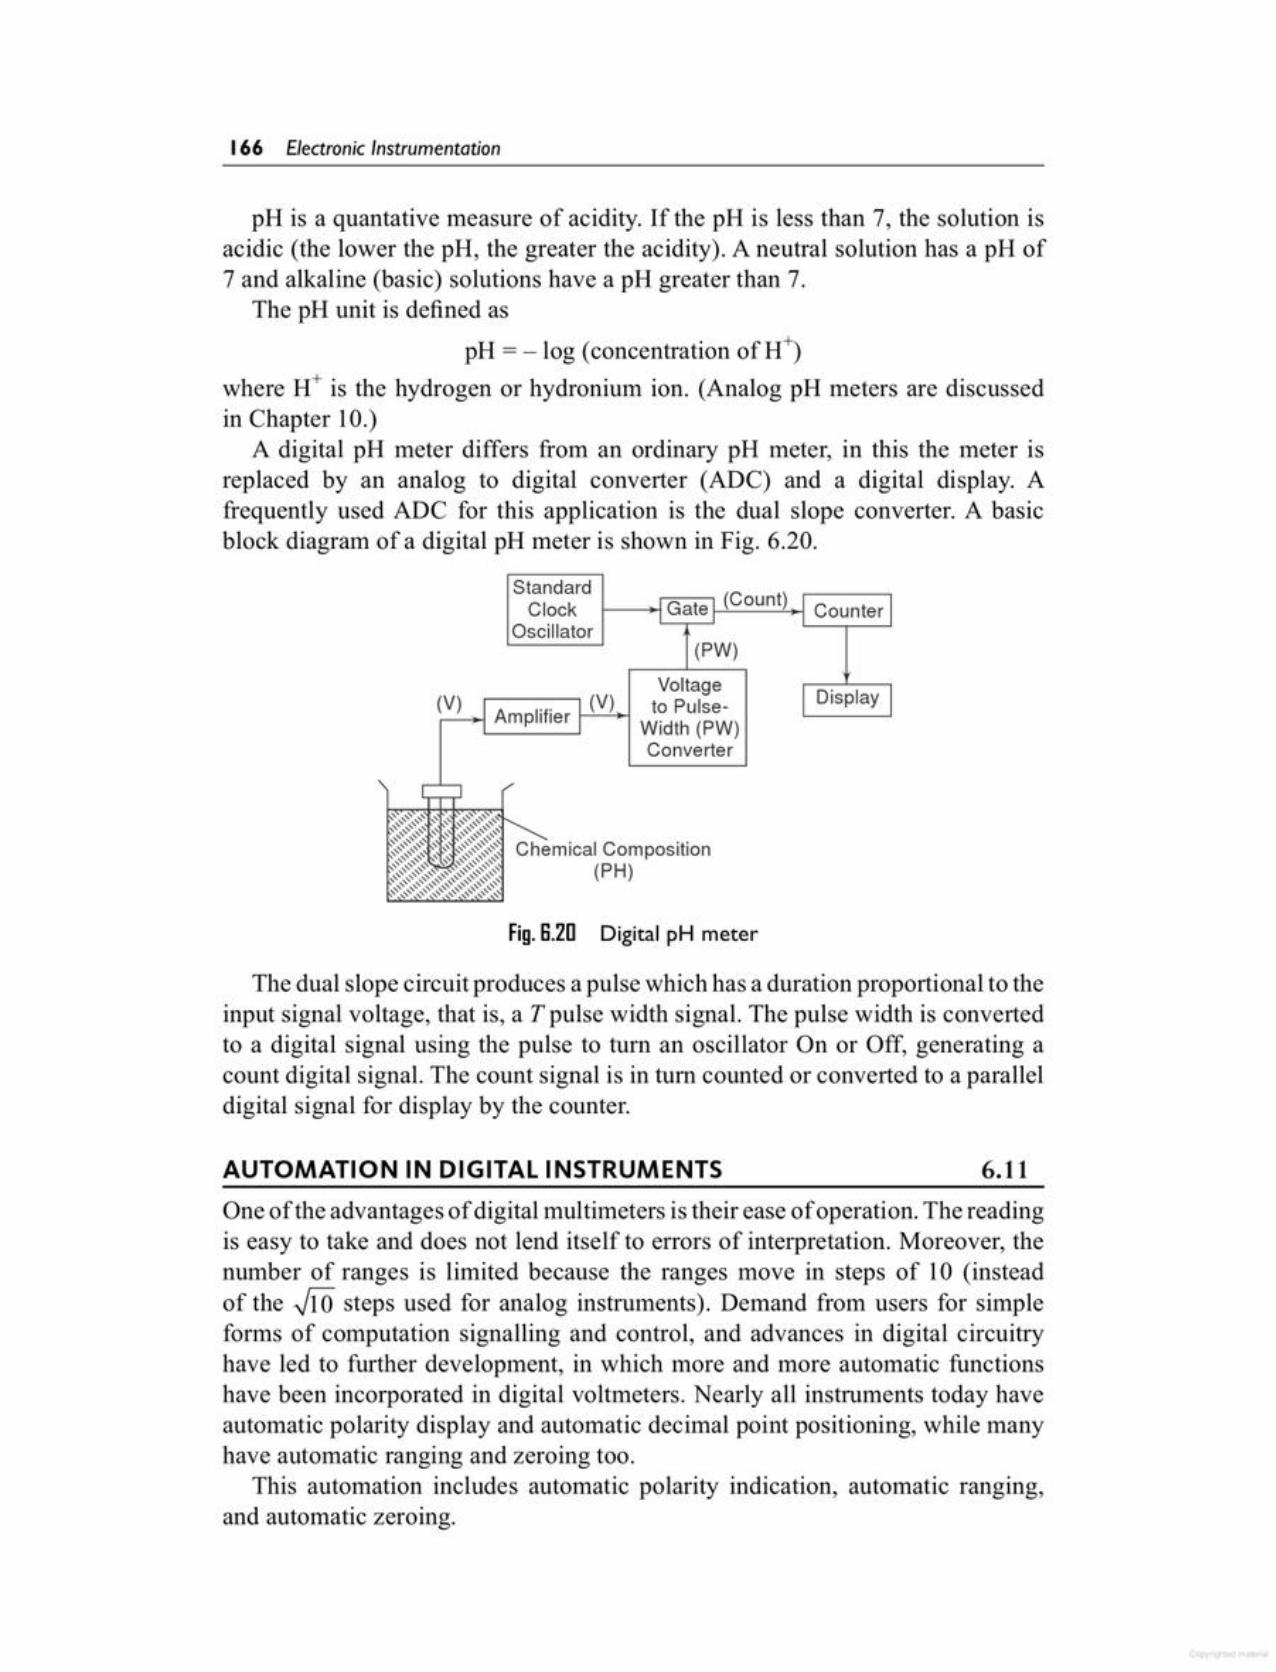
One of the advantages of digital multi meters is their ease of operation. The readingis easy to take and does not lend itself to errors of interpretation. Moreover, thenumber of ranges is limited because the ranges lTIOVein steps of 10 (insteadof the J10 steps used for analog instruments). Demand from users for simpleforms of computation signalling and control, and advances in digital circuitryhave led to further development, in which more and more automatic functionshave been incorporated in digital voltmeters. Nearly all instruments today haveautomatic polarity display and automatic decimal point positioning, while manyhave automatic ranging and zeroing too.
This automation includes automatic polarity indication, automatic ranging,and automatic zeroing.
6.11AUTOMATION IN DIGITAL INSTRUMENTS
The dual slope circuit produces a pulse which has a duration proportional to theinput signal voltage, that is, a T pulse width signal. The pulse width is convertedto a digital signal using the pulse to tum an oscillator On or Off, generating acount digital signal. The count signal is in tum counted or converted to a paralleldigital signal for display by the counter.
Fig.6.2D Digital pH meter
Standard(Count) J C t IClock ·lGate I oun er
Oscillator(PW)
Voltage(V) I Amplifier I (V) I Display Ito Pulse-
Width (PW)Converter
,/I
... ," ,-, ,'"
'2hemical Composition,...'" ,...'" ..."' v' ,...' ,-,'" ,-''';
,\"~,,, ,,1:'--:- ",~",:.."c- ......,'" ,... ,"""", " ....x r:-~...x ~~ " ...",,......",...,...x x..." ~ ...' x-,x x......", ,...x...'- ... ,':~~...... " (PH)... "", ,"'''' -,", ... ,...x "", ,...'"":",,,,,\,"\"'\"~"~,"\...,...'",......","...-,"~"",,-,,,,,,,~,
pH is a quantative measure of acidity. lfthe pH is less than 7, the solution isacidic (the lower the pH, the greater the acidity). A neutral solution has a pH of7 and alkaline (basic) solutions have a pH greater than 7.
The pH unit is defined as
pH =- log (concentration of H+)where H+ is the hydrogen or hydronium ion. (Analog pH meters are discussedin Chapter 10.)
A digital pH meter differs from an ordinary pH meter, in this the meter isreplaced by an analog to digital converter (ADC) and a digital display. Afrequently used ADC for this application is the dual slope converter. A basicblock diagram of a digital pH meter is shown in Fig. 6.20.
166 Electronic Instrumentation
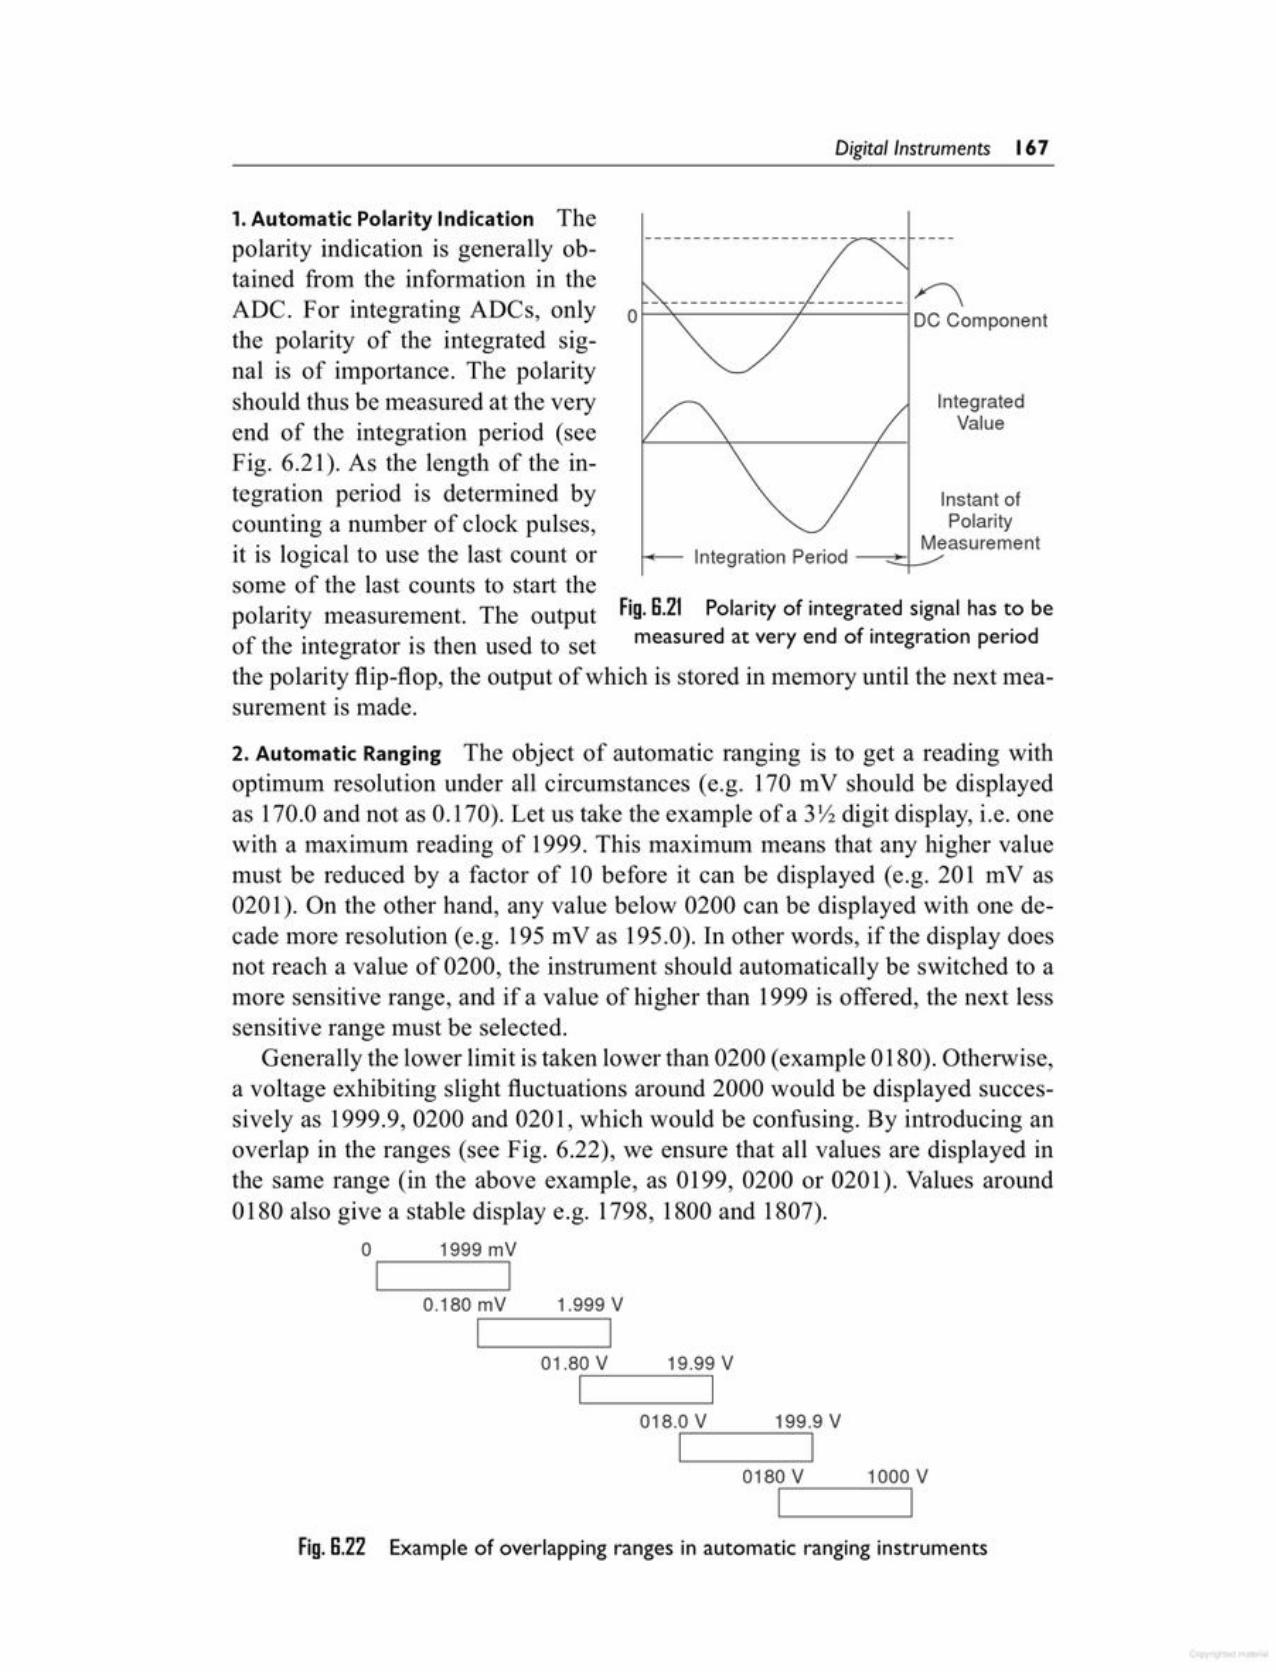
Fig. 8.22 Example of overlapping ranges in automatic ranging instruments
0180 V 1000 Vrl-~'-'-,I
199.9 V
I018.0 V
I
19.99 V
I01.80 V
1
0.180mV 1.999V1'---'1
2. Automatic Ranging The object of automatic ranging is to get a reading withoptimum resolution under all circumstances (e.g. 170 mV should be displayedas 170.0 and not as 0.170). Let us take the example of a 312digit display, i.e. onewith a maximum reading of 1999. This maximum means that any higher valuemust be reduced by a factor of 10 before it can be displayed (e.g. 201m V as0201). On the other hand, any value below 0200 can be displayed with one decade more resolution (e.g. 195 mVas 195.0). In other words, if the display doesnot reach a value of 0200, the instrument should automatically be switched to amore sensitive range, and if a value of higher than 1999 is offered, the next lesssensitive range must be selected.
Generally the lower limit is taken lower than 0200 (example 0180). Otherwise,a voltage exhibiting slight fluctuations around 2000 would be displayed successivelyas 1999.9,0200 and 0201, which would be confusing. By introducing anoverlap in the ranges (see Fig. 6.22), we ensure that all values are displayed inthe same range (in the above example, as 0199, 0200 or 0201). Values around0180 also give a stable display e.g. 1798, 1800 and 1807).
o 1999mV
1 1
polarity measurement. The output Fig. 8.21 Polarity of integrated signal has to beof the integrator is then used to set measured at very end of integration period
the polarity flip-flop, the output of which is stored in memory until the next measurement is made.
Instant ofPolarity
Measurement1-*-- Integration Period --::t:j__...
------------------------.Y\DC Componento
IntegratedValue
1.Automatic Polarity Indication Thepolarity indication is generally obtained from the information in theADC. For integrating ADCs, onlythe polarity of the integrated signal is of importance. The polarityshould thus be measured at the veryend of the integration period (seeFig. 6.21). As the length of the integration period is determined bycounting a number of clock pulses,it is logical to use the last count orsome of the last counts to start the
Digita!!nstruments 167
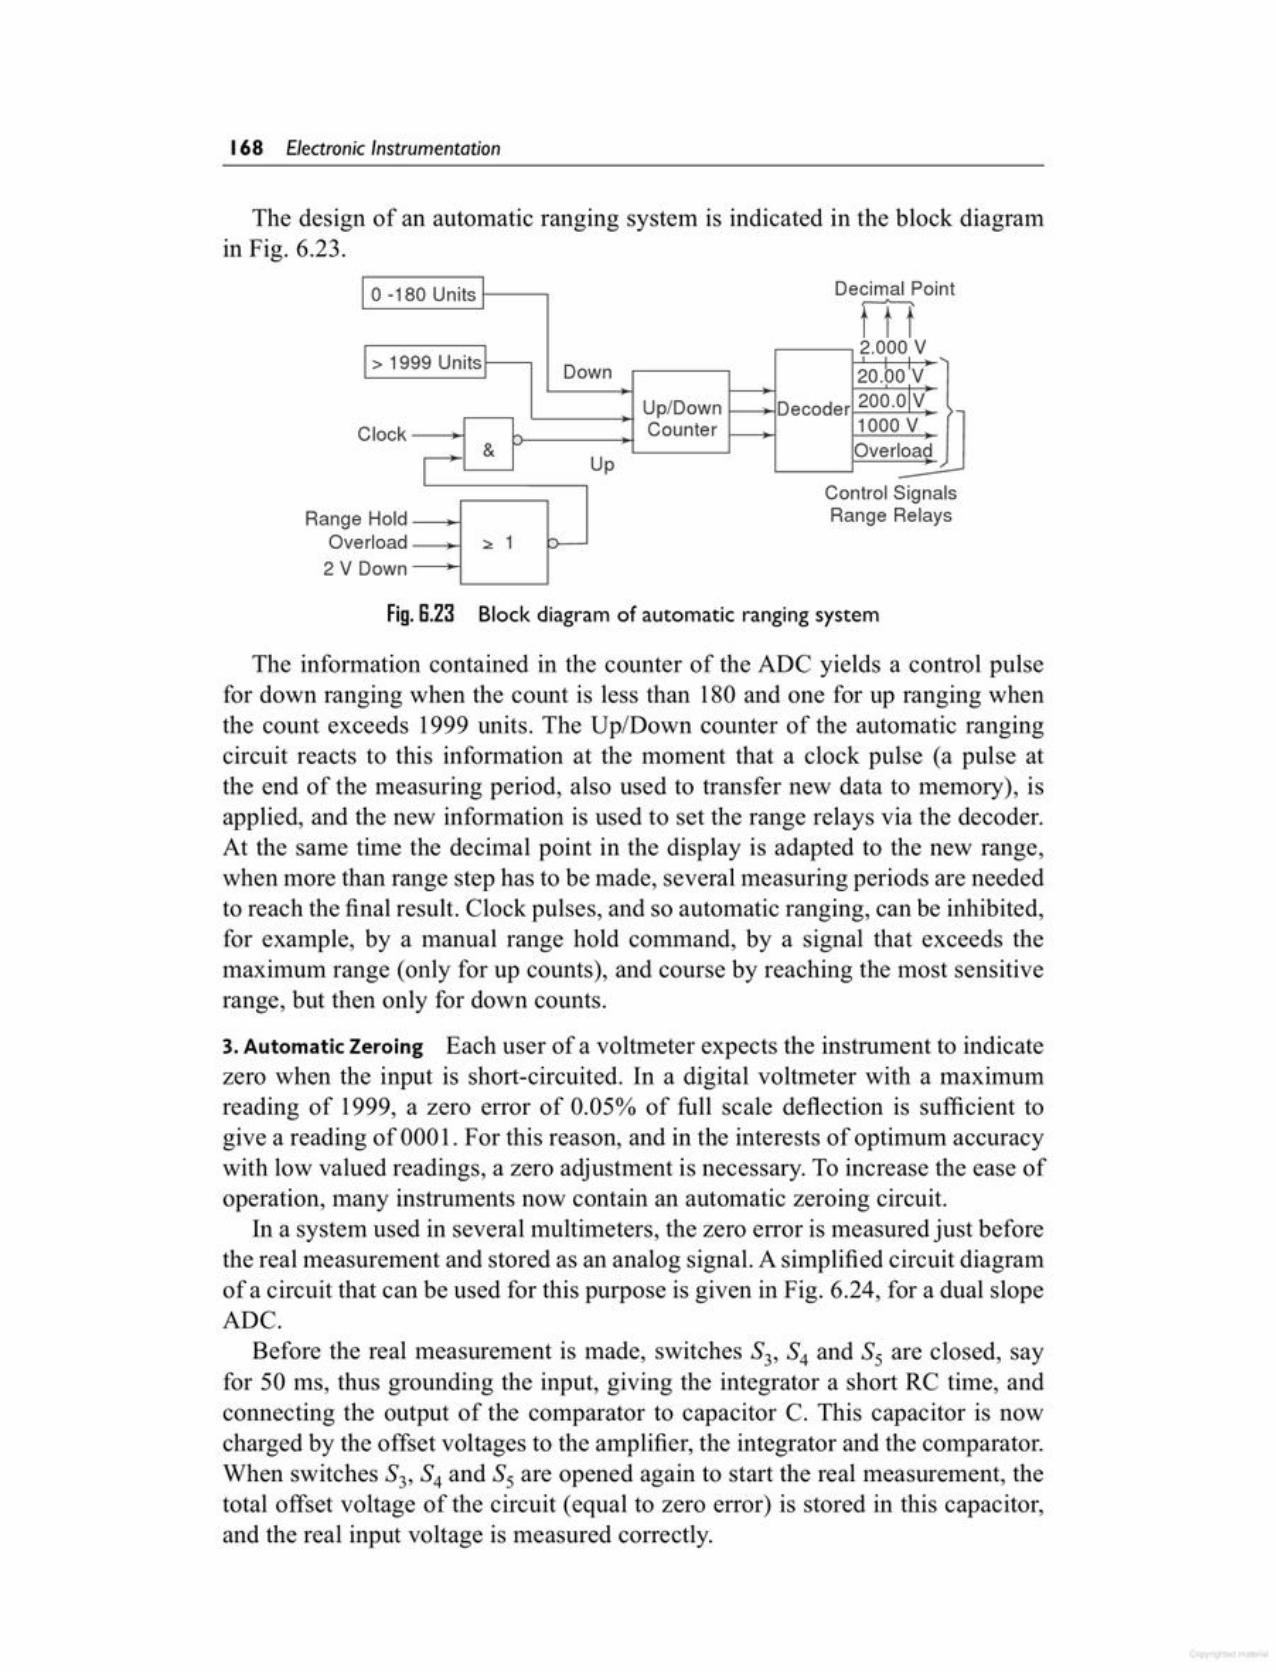
The information contained in the counter of the ADC yields a control pulsefor down ranging when the count is less than 180 and one for up ranging whenthe count exceeds 1999 units. The Up/Down counter of the automatic rangingcircuit reacts to this information at the moment that a clock pulse (a pulse atthe end of the measuring period, also used to transfer new data to memory), isapplied, and the new information is used to set the range relays via the decoder.At the same time the decimal point in the display is adapted to the new range,when more than range step has to be made, several measuring periods are neededto reach the final result. Clock pulses, and so automatic ranging, can be inhibited,for example, by a manual range hold command, by a signal that exceeds themaximum range (only for up counts), and course by reaching the most sensitiverange, but then only for down counts.
3. Automatic Zeroing Each user of a voltmeter expects the instrument to indicatezero when the input is short-circuited. In a digital voltmeter with a maximumreading of 1999, a zero error of 0.05% of full scale deflection is sufficient togive a reading of 000 1. For this reason, and in the interests of optimum accuracywith low valued readings, a zero adjustment is necessary. To increase the ease ofoperation, many instruments now contain an automatic zeroing circuit.
In a system used in several multimeters, the zero error is measured just beforethe real measurement and stored as an analog signal. A simplified circuit diagramof a circuit that can be used for this purpose is given in Fig. 6.24, for a dual slopeADC.
Before the real measurement is made, switches S3' S4 and S5 are closed, sayfor 50 ms, thus grounding the input, giving the integrator a short RC time, andconnecting the output of the comparator to capacitor C. This capacitor is nowcharged by the offset voltages to the amplifier, the integrator and the comparator.When switches S3' S4 and S5 are opened again to start the real measurement, thetotal offset voltage of the circuit (equal to zero error) is stored in this capacitor,and the real input voltage is measured correctly.
Fig. 6.23 Block diagram of automatic ranging system
RangeOve2V
s
I 0 -180 Units: Decimal Point
t t tI> 1999 Units!
2.0,00VDown 20.bo V
Up/Down Decoder 200.01V
lock Counter 1000 V& Overload
I UpControl Signal
Hold Range Relaysrload ::. 1 h
Down
C
The design of an automatic ranging system is indicated in the block diagramin Fig. 6.23.
168 Electronic Instrumentation
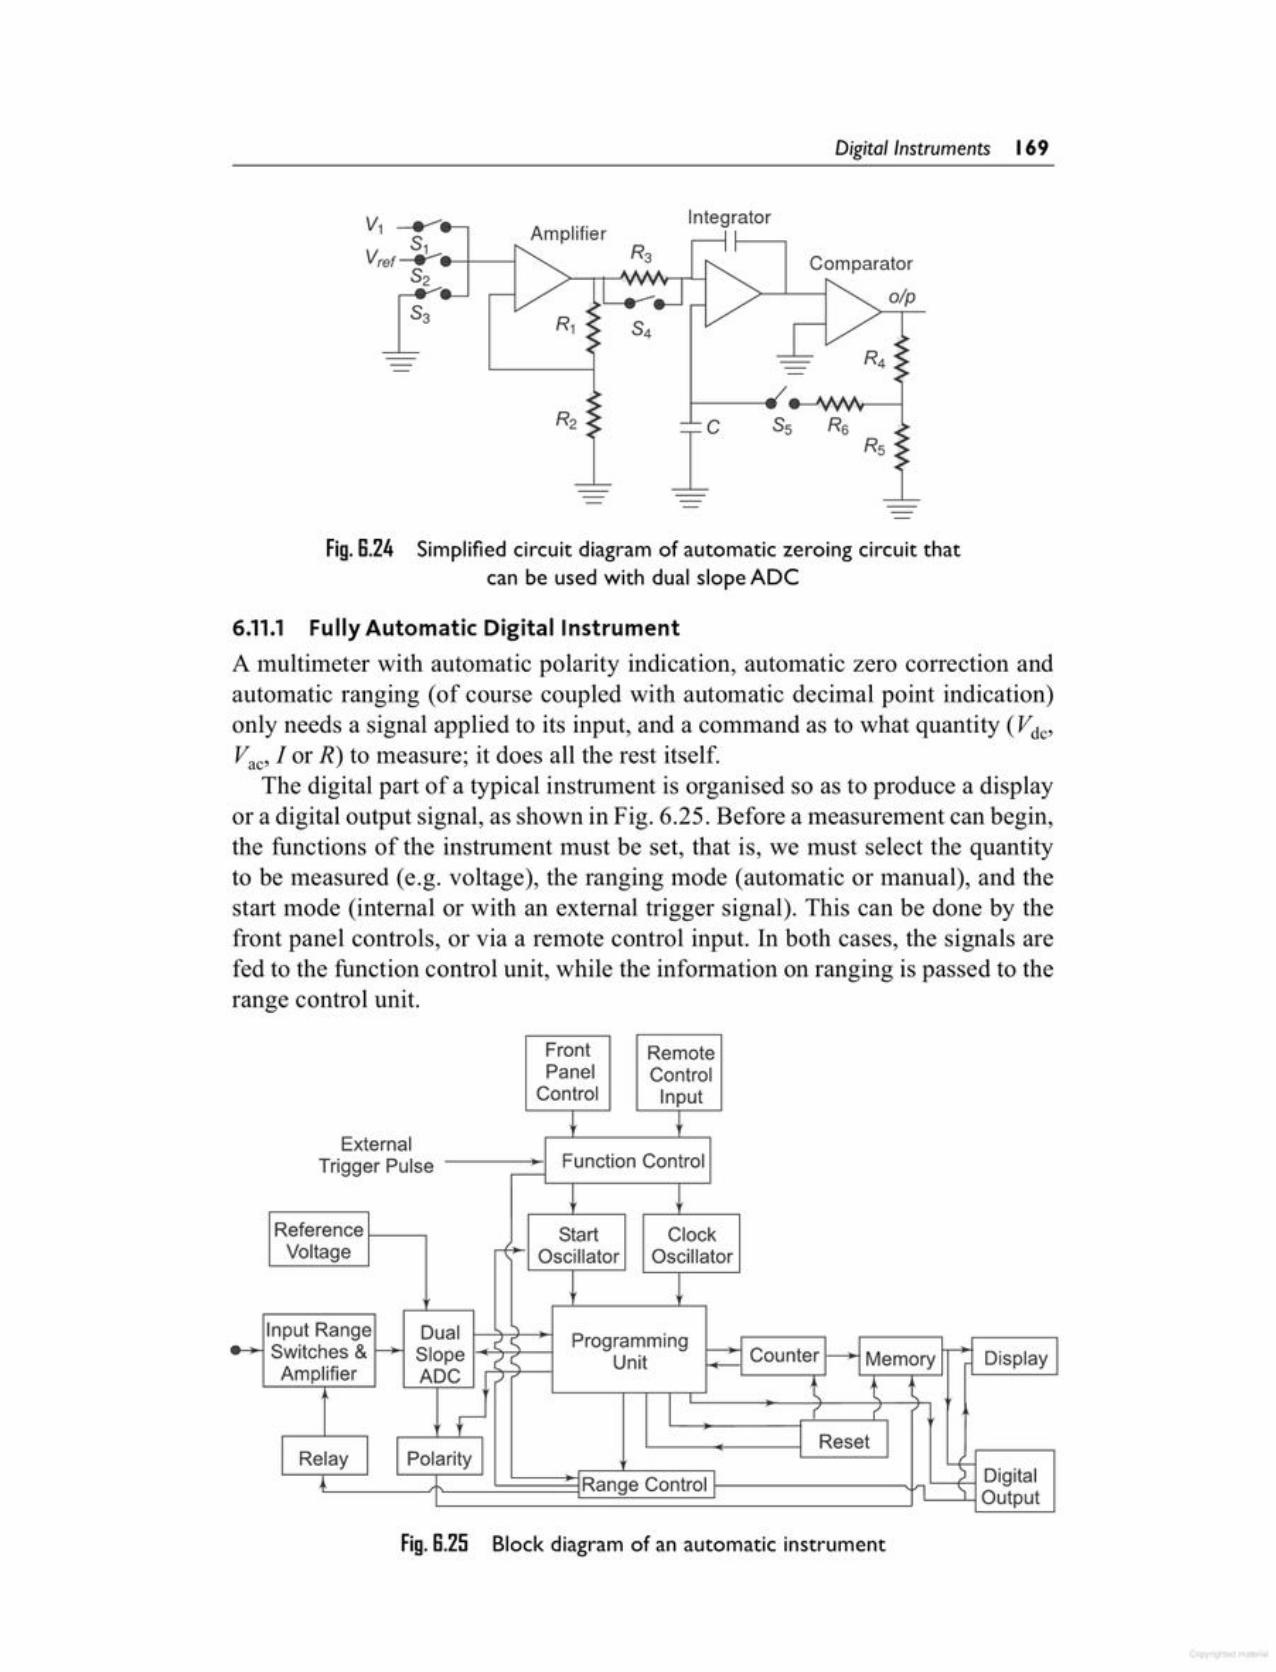
Fig. 8.25 Block diagram of an automatic instrument
Front RemotePanel ControlControl Input
i- tExternal
Trigger Pulse Function Control-
t tReference Start ClockVoltage ~~ Oscillator Oscillator
t lInput Range Dual Programming..Switches & ---+- Slope
('c._~ Counter 1- - Display("(. Unit Memory
Amplifier ADC .) 1 tIt r r
ResetRelay Polarity + Digital... ,.k Range Control i I '1 Output
6.11.1 Fully Automatic Digital InstrumentA multimeter with automatic polarity indication, automatic zero correction andautomatic ranging (of course coupled with automatic decimal point indication)only needs a signal applied to its input, and a command as to what quantity (Vdc'
Vac' lor R) to measure; it does all the rest itself.The digital part of a typical instrument is organised so as to produce a display
or a digital output signal, as shown in Fig. 6.25. Before a measurement can begin,the functions of the instrument must be set, that is, we must select the quantityto be measured (e.g. voltage), the ranging mode (automatic or manual), and thestart mode (internal or with an external trigger signal). This can be done by thefront panel controls, or via a remote control input. In both cases, the signals arefed to the function control unit, while the information on ranging is passed to therange control unit.
Fig.8.24 Simplified circuit diagram of automatic zeroing circuit thatcan be used with dual slope ADC
Rs
Comparator
olp
Amplifier
Digita!!nstruments 169

It will be clear that as the number of measurements per second increases,the integration time must be reduced and that it is useful to increase the clockfrequency at the same time to maintain good resolution. To select the desiredcombination, information on the number of measurements per second must befed to the start oscillator and clock oscillator. The latter constantly supplies clockpulses to the programming unit. The former is free running when the DVM is setfor internal start, but it waits for an external trigger signal when the DVM is setfor external control. Let us now follow (see Fig. 6.25) the various steps involvedin the performance of a measurement, for the case that the instrument is set forautomatic ranging and external triggering.
An incoming trigger pulse causes the start oscillator to deliver a pulse tothe programming unit, and a measurement is started. The programming unitstarts both the counter and the ADC. The ADC is connected to the input. Thecounter counts the clock pulses to determine the integration time and sends twosignals back to the programming unit, one just before the end of the integrationperiod, and the other at the end of this period. The first signal is used by theprogramming unit to activate the polarity detector, which determines the polarityof the integrated signal, while the second serves to switch theADC input from thereference signal. At the same time, the counter is reset to zero and starts countingthe down integration time of the ADC until it is stopped by the zero-detectorsignal of the ADC. At that moment, the programming unit compares the counterreading with the automatic ranging limits, and passes an up or down signal tothe range control, if necessary. This unit switches the input range switches via arelay and triggers the start oscillator for a new measurement in a more sensitiveor less sensitive range. In the meantime, the programming unit will also havereset the counter. This process continues until a measurement which is within theautomatic ranging limits has been made, The programming unit then transfers thenew data from the counter to the memory, together with the polarity informationso as to make them available to the display unit and the digital output. Finally,the programming unit delivers a transfer pulse to the digital output, to warn aninstrument connected to this output (e.g. a printer) that new data has been madeavailable.
Clock FrequencyMeasurements Integration Time200 kHz1MHz1MHz
4 100ms20 20 ms200 2 ms
Table 8.1
Let us assume that in the instrument in question, the ADC is of the dual slopeintegration type, and that a choice can be made between the combinations givenin Table 6.1.
170 Electronic Instrumentation

As the Po input signal increases in the positive half cycle, the zero crossingdetector changes its state when the input crosses zero (0) giving a high (1) levelat the output. This causes the J-K FIF-l to be set (1), that is, the output (Q) ofFIF-l goes high. This high output from the FIF-l enables the AND gate, andpulses from the clock are fed directly to the counter. The counter starts countingthese pulses. Also this high output level ofFIF-1 is applied to the clear input ofFIF-2 which makes the output of the FIF-2 go to zero (0).
Now as the input P,which has a phase difference with respect to Po, crosseszero (0) in the positive half cycle, the zero detector is activated, causing itsoutput to go high (1). This high input in tum toggles the J-K FIF-2, makingits output go high. This output (Q) of FIF-2 is connected to the clear input ofFIF-l forcing the F/F-l to reset. Hence the output ofFIF-l goes to zero (0). TheAND gate is thus disabled, and the counter stops counting.
The number of pulses counted while enabling and disabling the AND gateis in direct proportion to the phase difference, hence the display unit gives adirect readout of the phase difference between the two inputs having the samefrequencyj.
Fig. S.2S Digital phase meter
V\ Pre- r J Q -P~ v Amplifier Zero
Crossing ClK F/F-1&Attenuator Detector K C Q Main Gate
}r-
V\ Pre- I J Q_I V ZeroPx Amplifier -- Crossing ClK F/F-2
& DetectorC QAttenuator KI
[Clock]Counter andDisplay Unit 001010101
The simplest technique to measure the phase difference between two signalsemploys two flip-flops. The signals to be fed must be of the same frequency. First,the signals must be shaped to a square waveform without any change in theirphase positions, by the use of a zero crossing detector. The process of measuringthe phase difference can be illustrated by the schematic diagram shown in Fig.6.26.
The block diagram consists of two pairs of preamplifier's, zero crossingdetectors, J-K FIFs, and a single control gate. Two signals having phases Po andP; respectively are applied as inputs to the preamplifier and attenuation circuit.The frequency of the two inputs is the same but their phases are different.
6.12DIGITAL PHASE METER
Digita!!nstruments 171
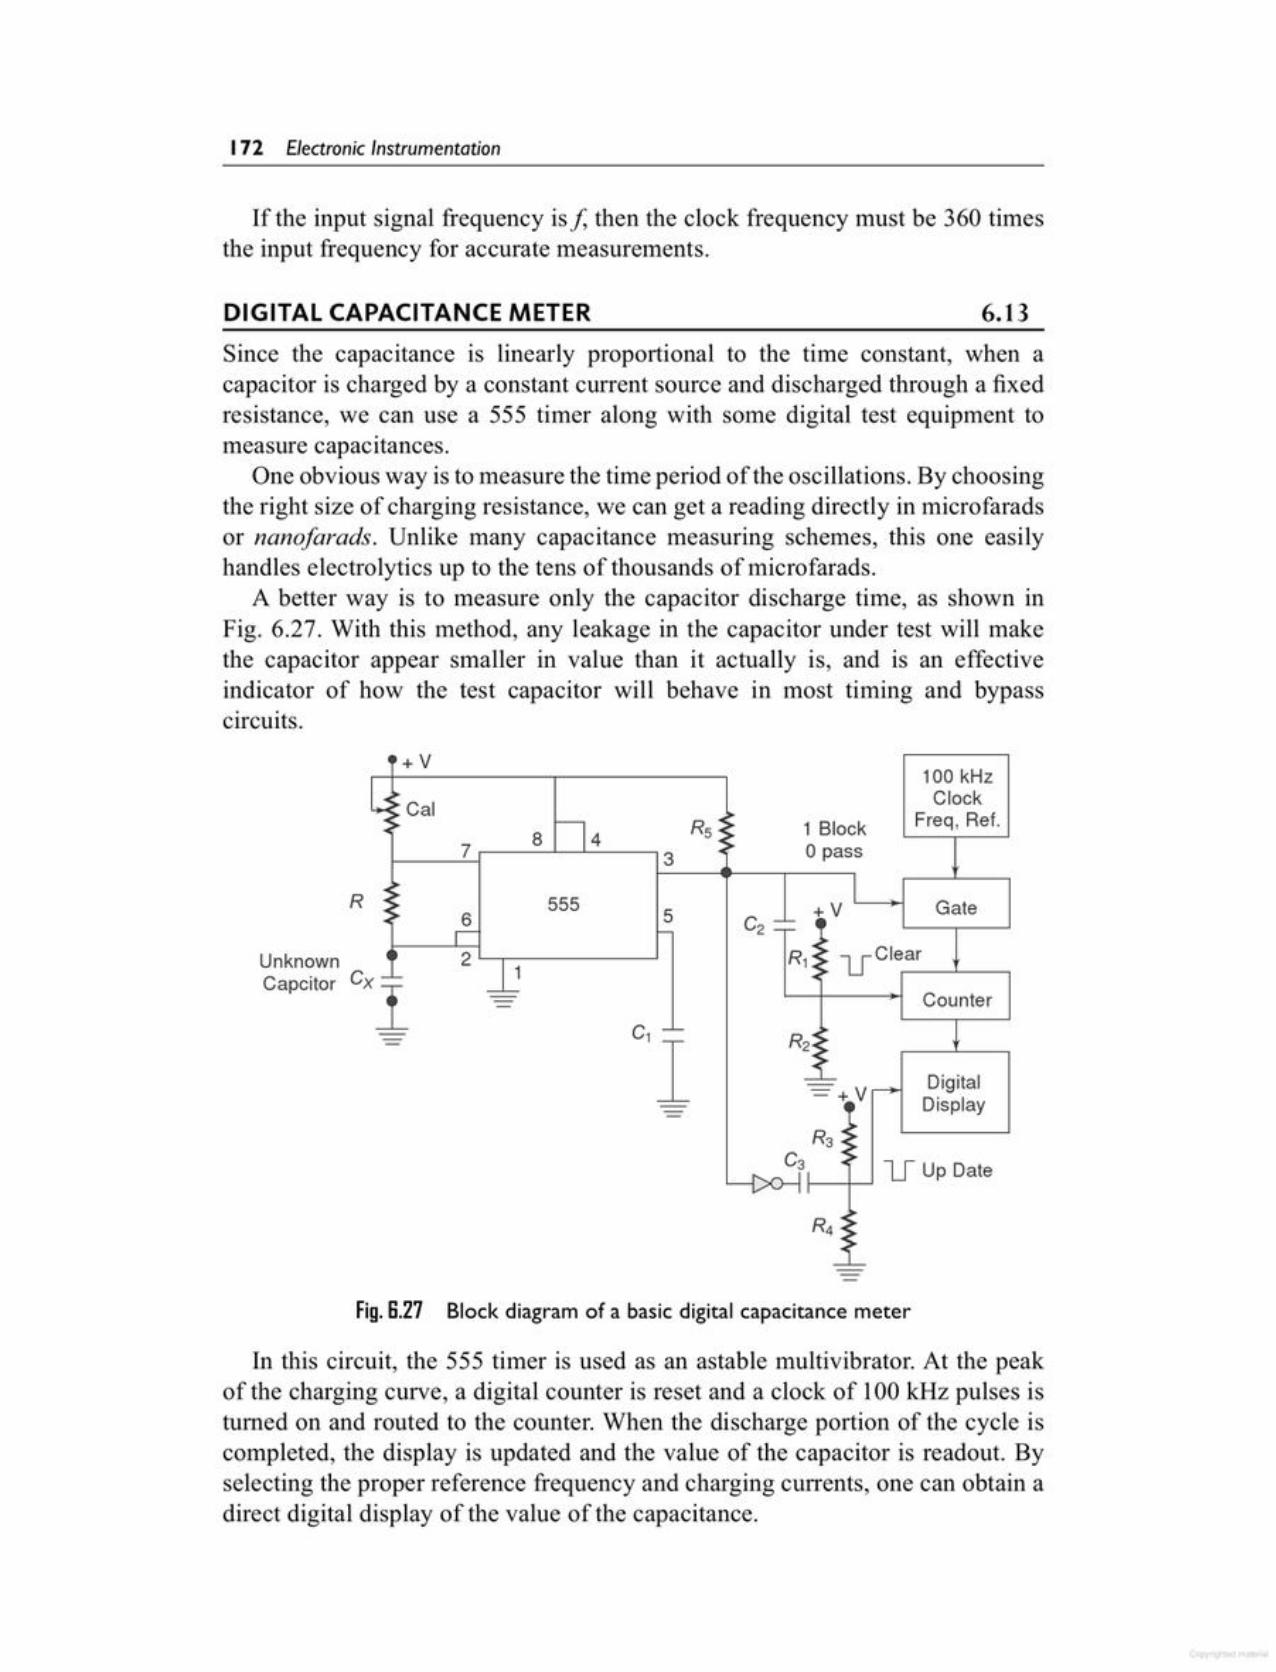
In this circuit, the 555 timer is used as an astable multivibrator. At the peakof the charging curve, a digital counter is reset and a clock of 100 kHz pulses isturned on and routed to the counter. When the discharge portion of the cycle iscompleted, the display is updated and the value of the capacitor is readout. Byselecting the proper reference frequency and charging currents, one can obtain adirect digital display of the value of the capacitance.
Fig. 8.27 Block diagram of a basic digital capacitance meter
UnknownCapcitor Cx
+vl: 100 kHz
~ Clock:CalR :: Freq, Ref.:~ 14 1 Block
7 8 5.~ o pass3 •
:: 555 I Gate:: 5 +v6 C2 =:= 4I r- Io-4 2J; R1:: uClear-'- '>I Counter-- c'l R2: ~---
~-:== ~ Digital
- - +.v Display--R3 ~:
C •: u Up Date--t>O-f, •,
R ::4 ...~...-J.......
R
Since the capacitance is linearly proportional to the time constant, when acapacitor is charged by a constant current source and discharged through a fixedresistance, we can use a 555 timer along with some digital test equipment tomeasure capacitances.
One obvious way is to measure the time period of the oscillations. By choosingthe right size of charging resistance, we can get a reading directly in microfaradsor nanofarads. Unlike many capacitance measuring schemes, this one easilyhandles electrolytics up to the tens of thousands of microfarads.
A better way is to measure only the capacitor discharge time, as shown inFig. 6.27. With this method, any leakage in the capacitor under test will makethe capacitor appear smaller in value than it actually is, and is an effectiveindicator of how the test capacitor will behave in most timing and bypasscircuits.
6.13DIGITAL CAPACITANCE METER
lfthe input signal frequency is f, then the clock frequency must be 360 timesthe input frequency for accurate measurements.
172 Electronic Instrumentation
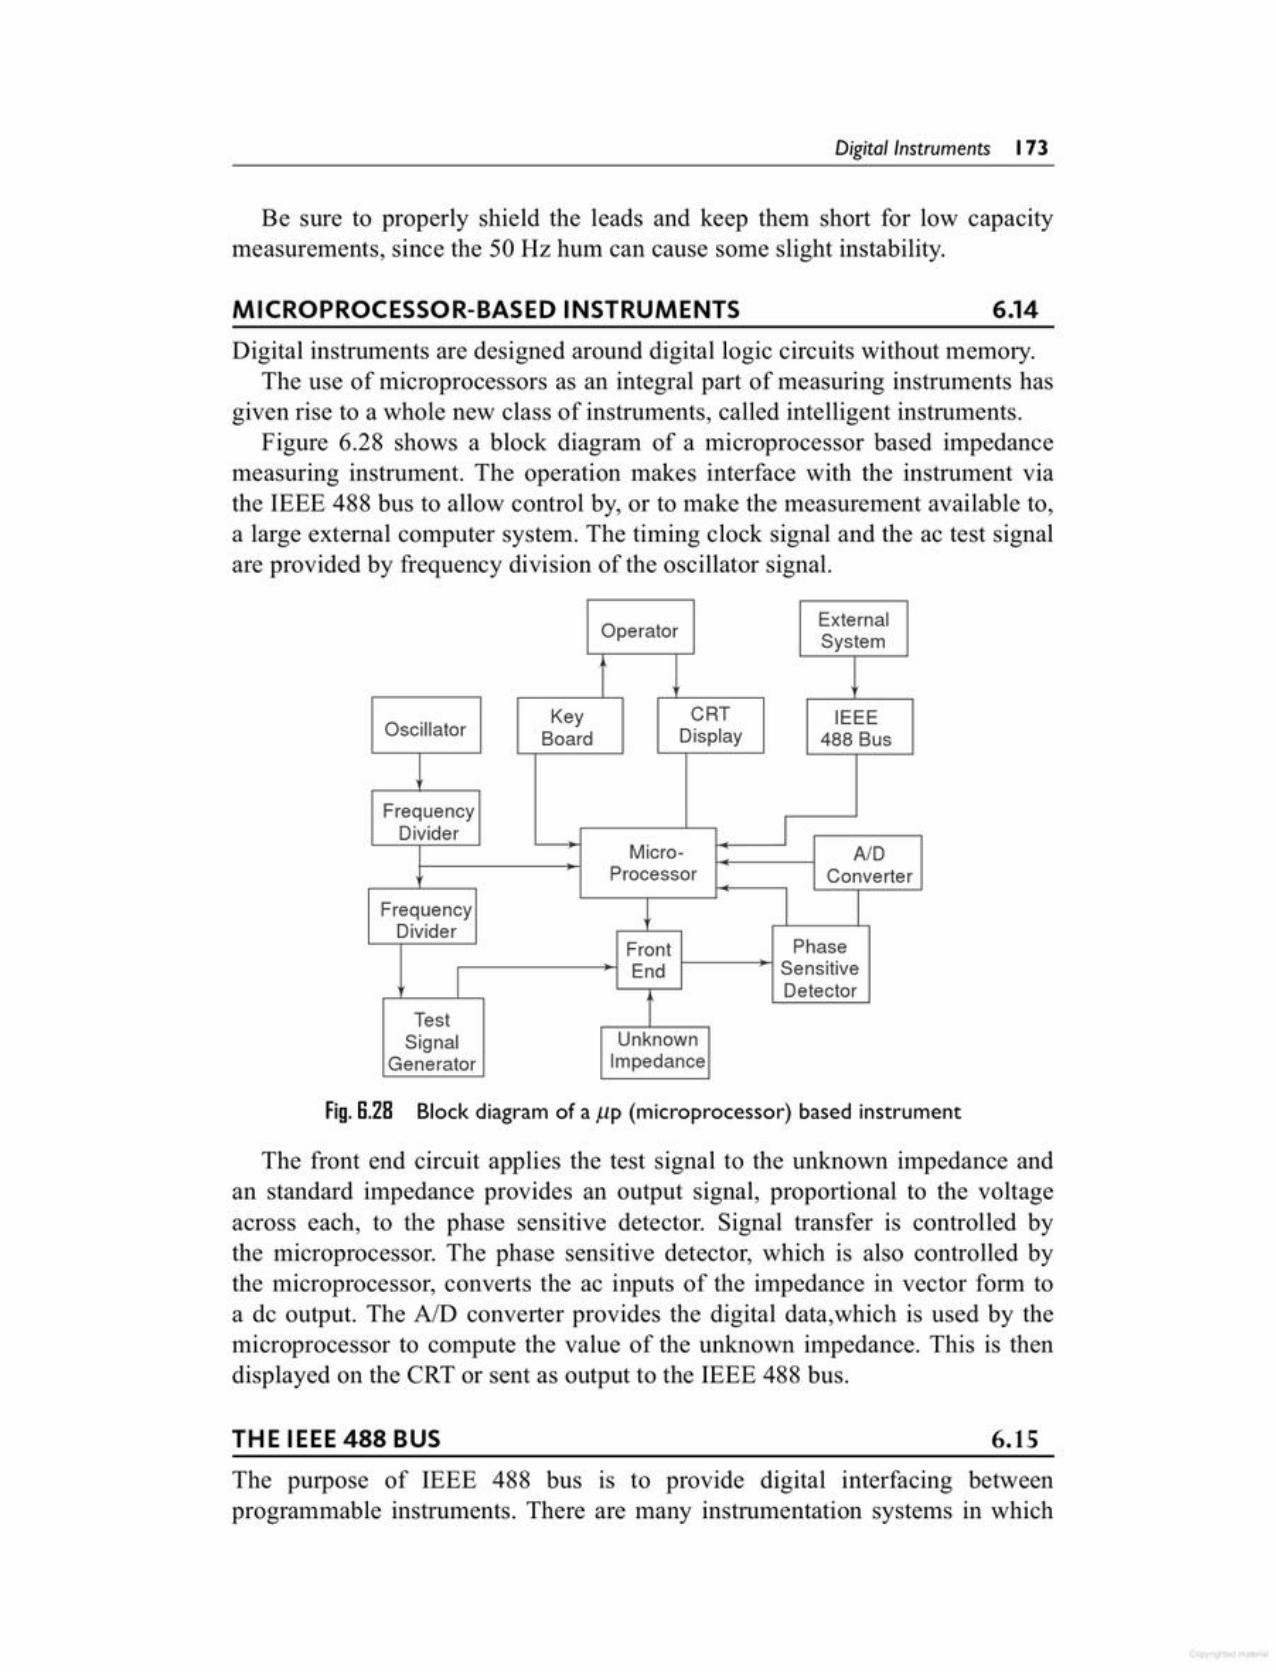
The purpose of IEEE 488 bus is to provide digital interfacing betweenprogrammable instruments. There are many instrumentation systems in which
6.15THE IEEE 488 BUS
The front end circuit applies the test signal to the unknown impedance andan standard impedance provides an output signal, proportional to the voltageacross each, to the phase sensitive detector. Signal transfer is controlled bythe microprocessor. The phase sensitive detector, which is also controlled bythe microprocessor, converts the ac inputs of the impedance in vector form toa de output. The AID converter provides the digital data,which is used by themicroprocessor to compute the value of the unknown impedance. This is thendisplayed on the CRT or sent as output to the IEEE 488 bus.
Fig. 8.28 Block diagram of a J.1P(microprocessor) based instrument
Operator ExternalSystem
Key CRT IEEEOscillator Board Display 488 Bus
FrequencyDivider
Micro- AIDProcessor Converter
FrequencyDivider
Front Phase
I End SensitiveDetector
TestSignal Unknown
Generator Impedance
Digital instruments are designed around digital logic circuits without memory.The use of microprocessors as an integral part of measuring instruments has
given rise to a whole new class of instruments, called intelligent instruments.Figure 6.28 shows a block diagram of a microprocessor based impedance
measuring instrument. The operation makes interface with the instrument viathe IEEE 488 bus to allow control by, or to make the measurement available to,a large external computer system. The timing clock signal and the ac test signalare provided by frequency division of the oscillator signal.
6.14MICROPROCESSOR-BASED INSTRUMENTS
Be sure to properly shield the leads and keep them short for low capacitymeasurements, since the 50 Hz hum can cause some slight instability.
Digita!!nstruments 173
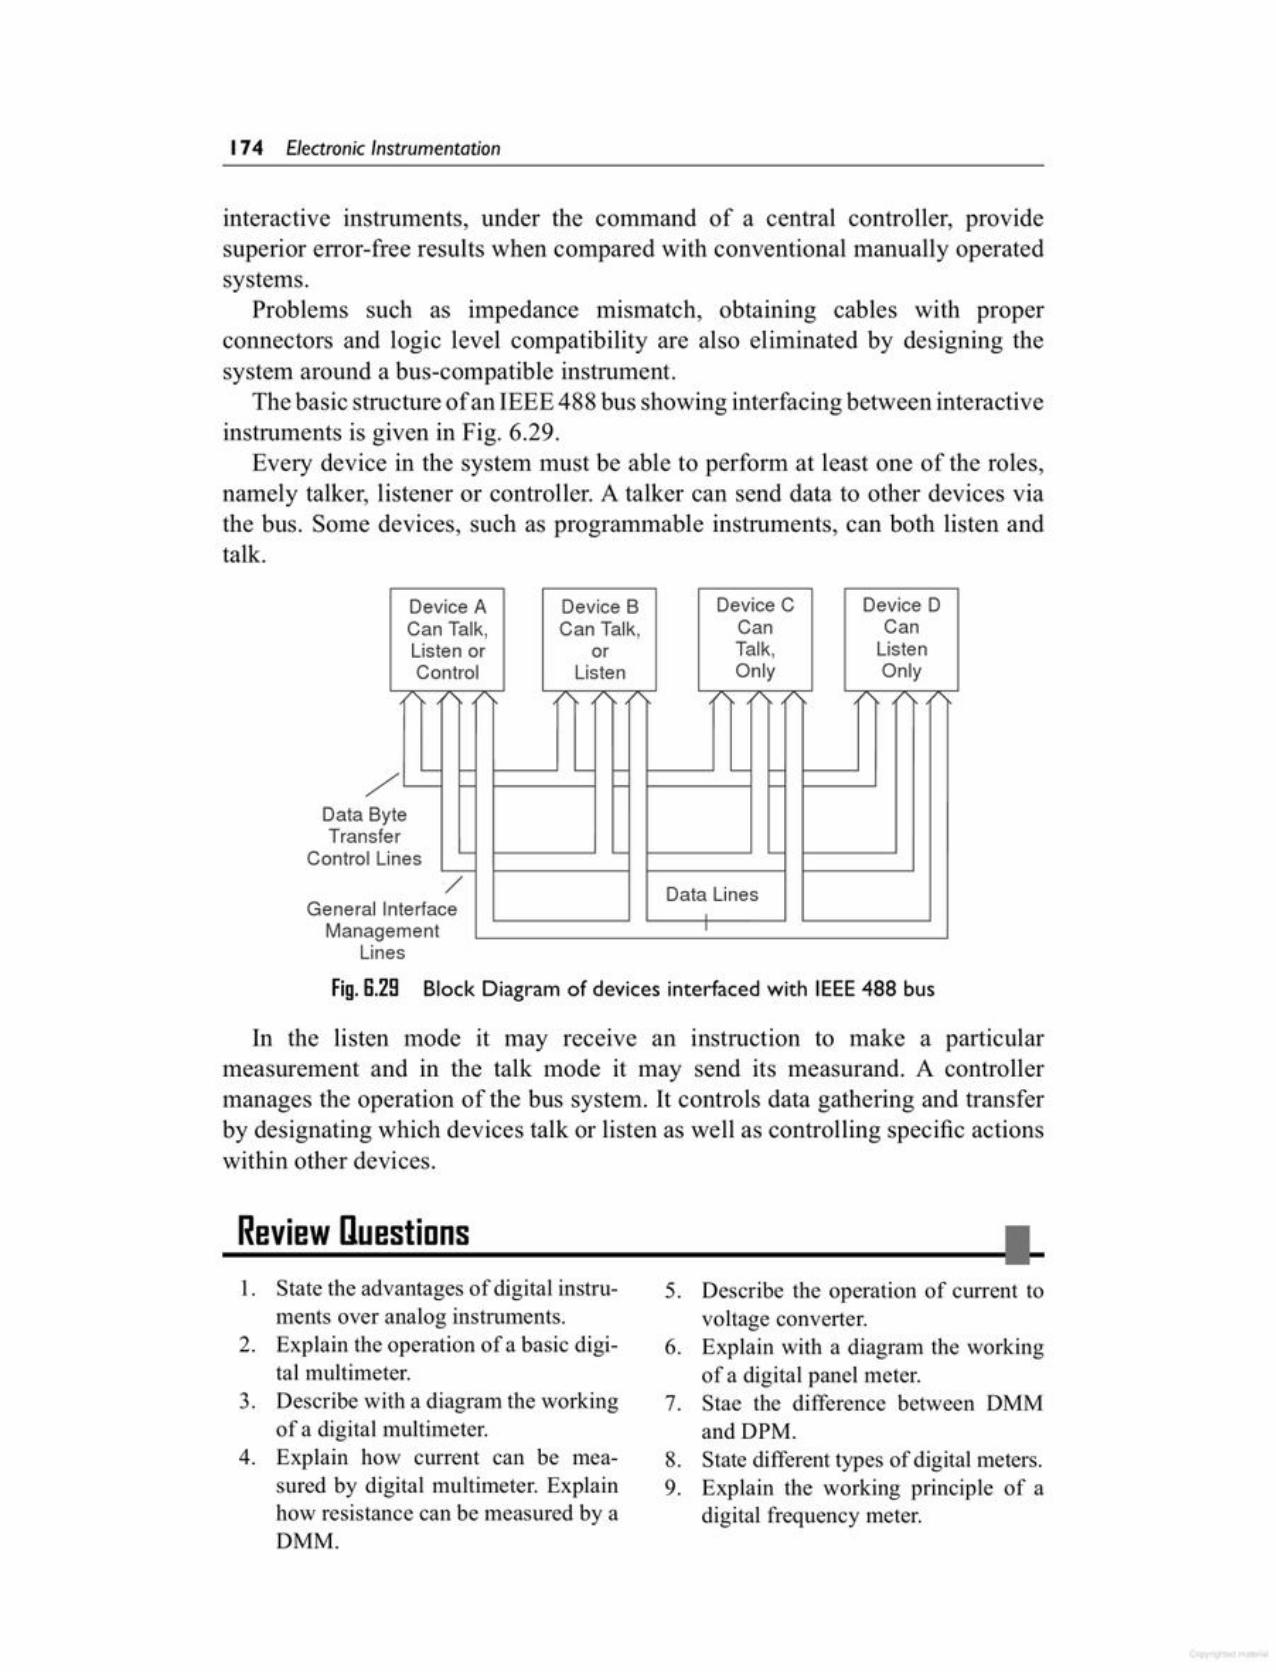
5. Describe the operation of current tovoltage converter.
6. Explain with a diagram the workingof a digital panel meter.
7. Stae the difference between DMMand DPM.
8. State different types of digital meters.9. Explain the working principle of a
digital frequency meter.
1. State the advantages of digital instruments over analog instruments.
2. Explain the operation of a basic digital multimeter.
3. Describe with a diagram the workingof a digital multimeter.
4. Explain how current can be measured by digital multimeter. Explainhow resistance can be measured by aDMM.
Review Duestions I-----------------------------~
In the listen mode it may receive an instruction to make a particularmeasurement and in the talk mode it may send its measurand. A controllermanages the operation of the bus system. It controls data gathering and transferby designating which devices talk or listen as well as controlling specific actionswithin other devices.
Fig.S.29 Block Diagram of devices interfaced with IEEE488 bus
GeneralManag
Lines
-:Data ByTransf
Control L
Device A Device B Device C Device DCan Talk, Can Talk, Can CanListen or or Talk, ListenControl Listen Only Only
- - - - - -- - -teerines - - -
/ Data LinesInterfaceement I
interactive instruments, under the command of a central controller, providesuperior error-free results when compared with conventional manually operatedsystems.
Problems such as impedance mismatch, obtaining cables with properconnectors and logic level compatibility are also eliminated by designing thesystem around a bus-compatible instrument.
The basic structure of an IEEE 488 bus showing interfacing between interactiveinstruments is given in Fig. 6.29.
Every device in the system must be able to perform at least one of the roles,namely talker, listener or controller. A talker can send data to other devices viathe bus. Some devices, such as programmable instruments, can both listen andtalk.
174 Electronic Instrumentation
3. Malmstadt, Enke and Others, Instrumentation for Scientist.
4. E.O. Doebelin, Measurement Systems: Applications and Design, 4thEdition, 1990, McGraw-Hill.
1. Malvino and Leach, Digital Principles, McGraw-Hill, New York.
2. Larry D. Jones and A. Foster Chin,Electronic Instruments and Measurements, John Wiley & Sons, 1987.
Further Reading I-----------&-------------------------
(b) 2(d) 20
sure(a) frequency(b) ratio(c) time interval(d) phase
5. Frequency dividers used in the frequency counter divide the frequencyby(a) 10(c) 100
(c) pulses(d) sawtooth wave.
4. A frequency meter is used to mea-
1. A time base selector is used to select(a) frequency (b) time(c) amplitude (d) voltage
2. A time base selector basically consists of(a) LC oscillator(b) RC oscillator(c) crystal oscillator(d) Wien bridge oscillator
3. Schmitt trigger used in digital measurement time converts input to(a) square wave(b) sine wave
Multiple Choice Iluestions I---~--------------------------------
(i) Totalising (ii) Frequency(iii) Period mode (iv) Ratio mode(v) Time interval mode,
19. Explain with a diagram the operationof a digital measurement of mainsfrequency.
20. On what principle does a digital tachometer operate? Explain with adiagram the working of a digital tachometer.
21. Explain with a diagram the working of a digital pH meter. How is pHmeasured?
22. On what principle does a digital capacitance meter operate? Describewith a diagram the operation of adigital capacitance meter.
23. How is automation in digital instruments obtained? Why are the rangesin digital instruments overlapped?
24. How can measurements of impedance be obtained using microprocessors?
10. Explain with the help of block diagram the operation of a DFM.
11. State the function and explain the operation of a gate control flip-flop.
12. State the function and explain the operation of a time base selector.
13. Explain with a diagram the basicprinciple of operation of digital timemeasurement.
14. Describe with the help of a blockdiagram the operation of digital timemeasurement.
15. Explain with a diagram the operationof period measurement.
16. What is a universal counter? How canit be used to measure the following:(i) Frequency (ii) Time(iii) Period (iv) Ratio
17. Describe with the help of a blockdiagram the operation of a universalcounter-timer.
18. What is an electronic counter? How canit be used to measure the following:
Digita!!nstruments 175

7.2.1 Electron BeamTo understand the principle of an oscilloscope, let us consider a torch which isfocussed on a piece of cardboard (held perpendicular to the torch). The light
7.2BASIC PRINCIPLE
The Cathode Ray Oscilloscope (CRO) is probably the most versatile tool for thedevelopment of electronic circuits and systems.
The CRO allows the amplitude of electrical signals, whether they are voltage,current, or power, to be displayed as a function of time.
The CRO depends on the movement of an electron beam, which is bombarded(impinged) on a screen coated with a fluorescent material, to produce a visiblespot. If the electron beam is deflected on both the conventional axes, i.e. X-axisand Y-axis, a two-dimensional display is produced.
The beam is deflected at a constant rate relative of time along the X-axis andis deflected along the Y-axis in response to an stimulus, such as a voltage. Thisproduces a time-dependent variation of the input voltage.
The oscilloscope is basically an electron beam voltmeter. The heart of theoscilloscope is the Cathode Ray Tube (CRT) which makes the applied signalvisible by the deflection of a thin beam of electrons. Since the electron haspractically no weight, and hence no inertia, therefore the beam of electrons canbe moved to follow waveforms varying at a rate of millions of times/second.Thus, the electron beam faithfully follows rapid variations in signal voltage andtraces a visible path on the CRT screen. In this way, rapid variations, pulsationsor transients are reproduced and the operator can observe the waveform as wellas measure amplitude at any instant of time.
Since it is completely electronic in nature, the oscilloscope can reproduceHF waves which are too fast for electro mechanical devices to follow. Thus, theoscilloscope has simplified many tests and measurements. It can also be usedin any field where a parameter can be converted into a proportional voltage forobservation, e.g. meteorology, biology, and medicine.
The oscilloscope is thus a kind of voltmeter which uses beam instead of apointer, and kind of recorder which uses an electron beam instead of a pen.
7.1INTRODUCTION
Oscilloscope
beam will make a bright spot where it strikes the cardboard or screen. Holdthe torch still, the spot remains still, move the torch, the spot also moves. If themovement is slow, the eye can follow the movement, buf if it is too fast for theeye to follow, persistence of vision causes the eye to see the pattern traced by thespot. Hence when we wave the torch from side to side, a horizontal line is traced;we can similarly have a vertical line or a circle. Hence, if the torch is movedin any manner at a very rapid rate, light would be traced, just like drawing orwriting.
A similar action takes place in the CRT of an oscilloscope. The torch isreplaced by an electron gun, the light beam by a narrow electron beam, and thecardboard by the external flat end of a glass tube, which is chemically coatedto form a fluorescent screen. Here the electron gun generates the beam whichmoves down the tube and strikes the screen. The screen glows at the point ofcollision, producing a bright spot.
When the beam is deflected by means of an electric or magnetic field, the spotmoves accordingly and traces out a pattern.
The electron gun assembly consists of the indirectly heated cathode with itsheater, the control grid, and the first and second anodes.
The control grid in the CRT is cylindrical, with a small aperture in line withthe cathode. The electrons emitted from the cathode emerge from this apertureas a slightly divergent beam. The negative bias voltage applied to the grid,controls the beam current. The intensity (or brightness) of the phosphorescentspot depends on the beam current. Hence this control grid bias knob is called orlabelled as intensity.
The diverging beam of electrons is converged and focussed on the screen bytwo accelerating anodes, which form an electronic lens. Further ahead of thegrid cylinder is another narrow cylinder, the first anode. It is kept highly positivewith respect to the cathode. The second anode is a wider cylinder following thefirst. Both the cylinders have narrow apertures in line with the electron beam.The second anode is operated at a still higher positive potential and does most ofthe accleration of the beam. The combination of the first anode cylinder and thewider second anode cylinder produces an electric field that focuses the electronbeam on the screen, as a lens converges a diverging beam of light.
The electronic lens action is controlled by the focus control. If this controlis turned to either side of its correct focussing position, the spot on the screenbecomes larger and blurred. Bringing it back to its correct position brightens andconcentrates the spot. With this proper focus, the small spot can be deflected toproduce sharp narrow lines that trace the pattern on the CRT screen.
The electron beam may be deflected transversely by means of an electric field(electrostatic deflection) or a magnetic field (electromagnetic deflection).
Most oscilloscopes use electrostatic deflection, since it permits high frequencyoperation and requires negligible power. Electromagnetic deflection is mostcommon in TV picture tubes.
Electrons are negatively charged particles, they are attracted by a positivecharge or field and repelled by a negative charge. Since the electron beam is a
Oscilloscope 177
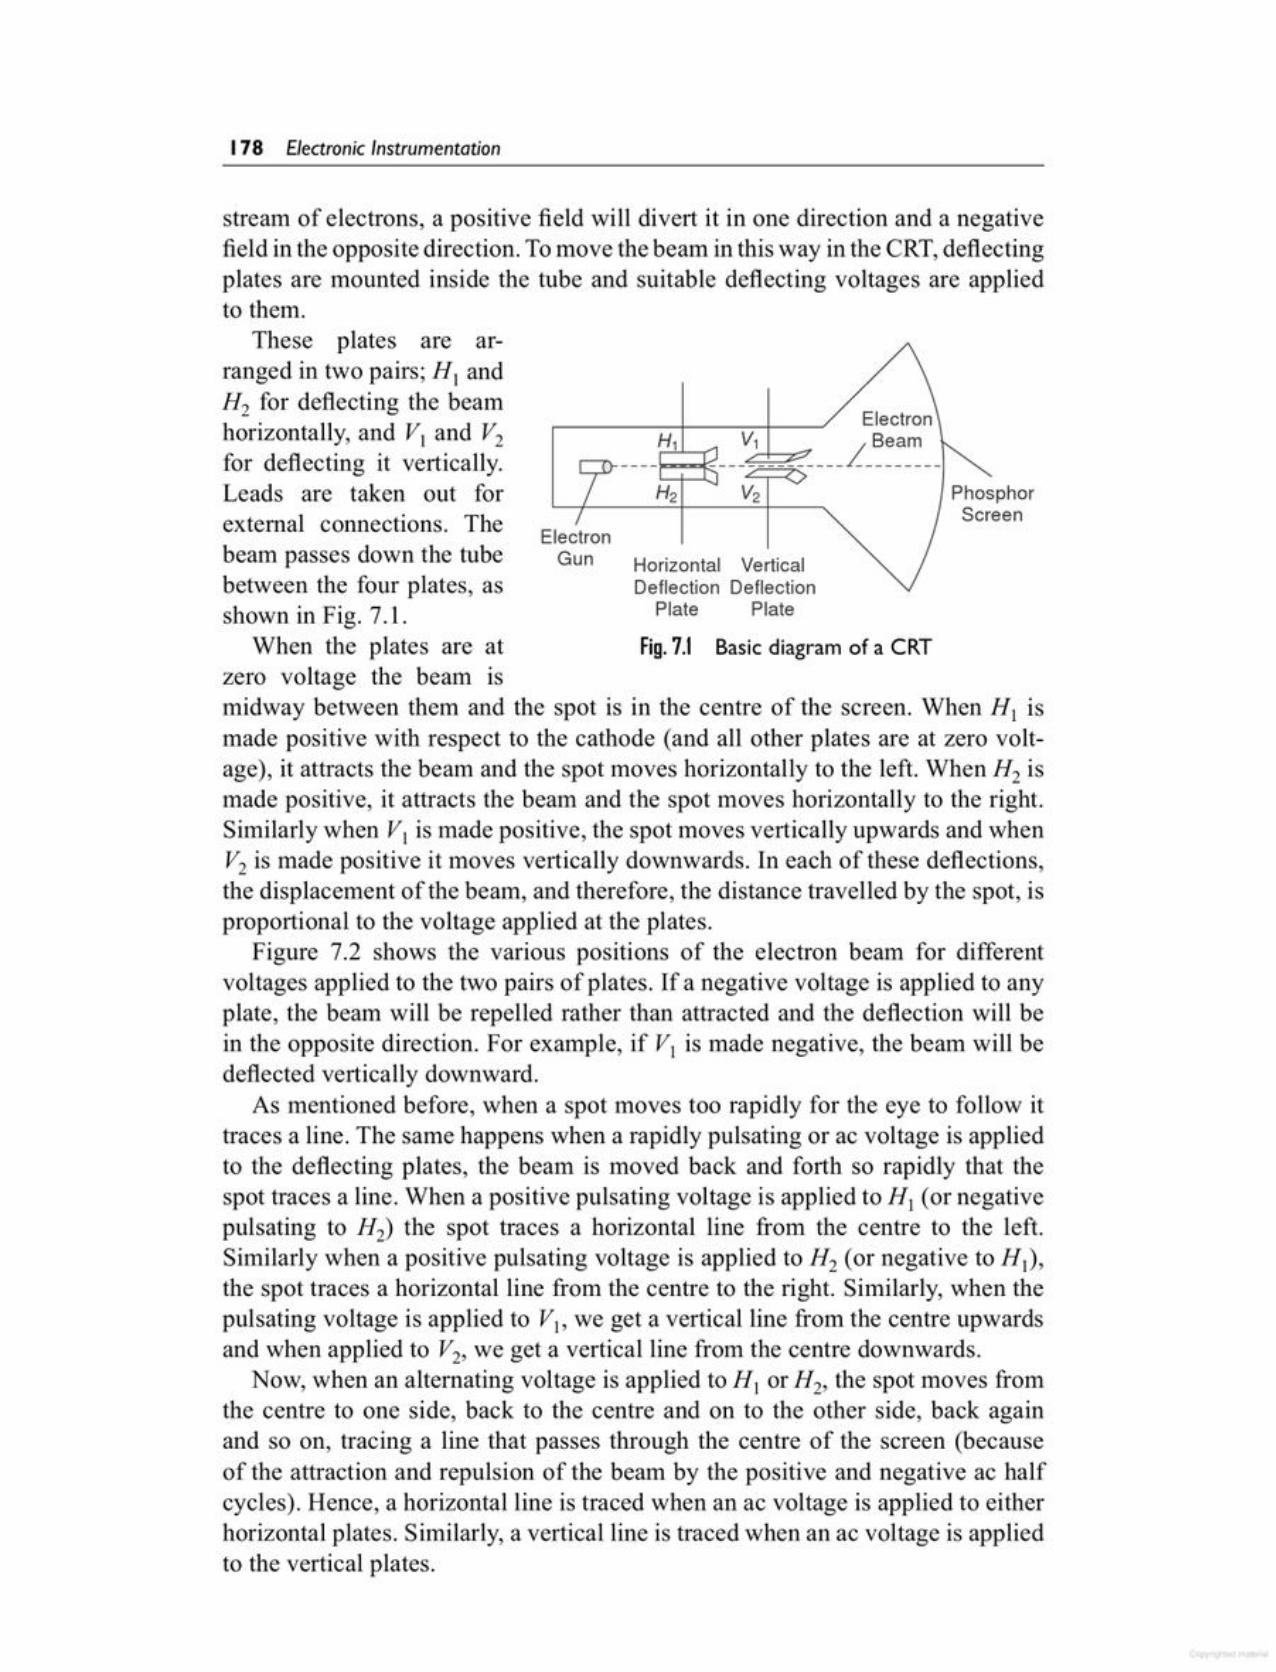
Fig. 7.1 Basic diagram of a CRT
Horizontal VerticalDeflection Deflection
Plate Plate
external connections. The Electronbeam passes down the tube Gunbetween the four plates, asshown in Fig. 7.1.
When the plates are atzero voltage the beam ismidway between them and the spot is in the centre of the screen. When HI ismade positive with respect to the cathode (and all other plates are at zero voltage), it attracts the beam and the spot moves horizontally to the left. When H2 ismade positive, it attracts the beam and the spot moves horizontally to the right.Similarly when VI is made positive, the spot moves vertically upwards and whenV2 is made positive it moves vertically downwards. In each of these deflections,the displacement of the beam, and therefore, the distance travelled by the spot, isproportional to the voltage applied at the plates.
Figure 7.2 shows the various positions of the electron beam for differentvoltages applied to the two pairs of plates. If a negative voltage is applied to anyplate, the beam will be repelled rather than attracted and the deflection will bein the opposite direction. For example, if VI is made negative, the beam will bedeflected vertically downward.
As mentioned before, when a spot moves too rapidly for the eye to follow ittraces a line. The same happens when a rapidly pulsating or ac voltage is appliedto the deflecting plates, the bealTI is moved back and forth so rapidly that thespot traces a line. When a positive pulsating voltage is applied to HI (or negativepulsating to H2) the spot traces a horizontal line from the centre to the left.Similarly when a positive pulsating voltage is applied to H2 (or negative to HI)'the spot traces a horizontal line from the centre to the right. Similarly, when thepulsating voltage is applied to VI' we get a vertical line from the centre upwardsand when applied to V2, we get a vertical line from the centre downwards.
Now, when an alternating voltage is applied to HI or H2, the spot moves fromthe centre to one side, back to the centre and on to the other side, back againand so on, tracing a line that passes through the centre of the screen (becauseof the attraction and repulsion of the beam by the positive and negative ac halfcycles). Hence, a horizontal line is traced when an ac voltage is applied to eitherhorizontal plates. Similarly, a vertical line is traced when an ac voltage is appliedto the vertical plates.
ElectronHl V1 Beamt:t:i§--------------~--------H2 V2 Phosphor
Screen
stream of electrons, a positive field will divert it in one direction and a negativefield in the opposite direction. Tomove the beam in this way in the CRT, deflectingplates are mounted inside the tube and suitable deflecting voltages are appliedto them.
These plates are arranged in two pairs; HI andH2 for deflecting the beamhorizontally, and VI and V2
for deflecting it vertically.Leads are taken out for
178 Electronic Instrumentation
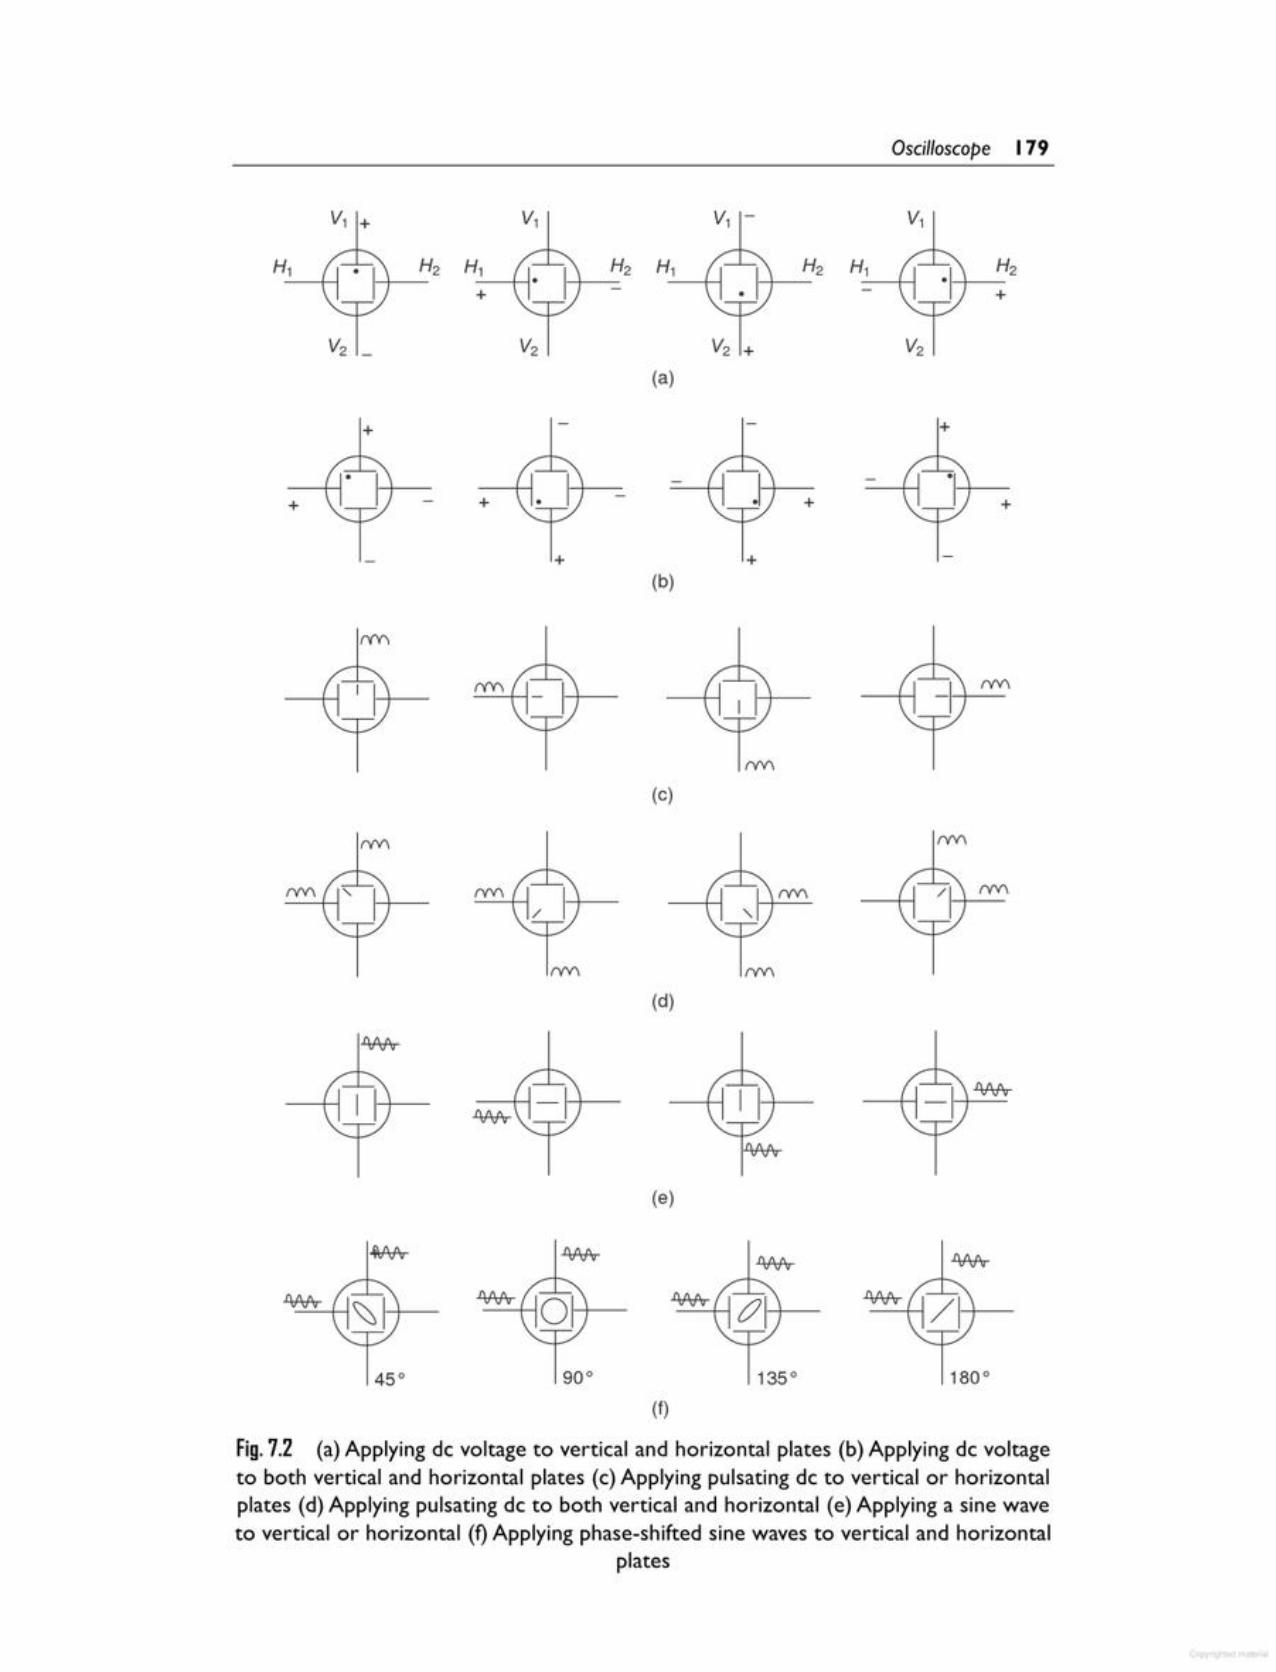
(f)
Fig. 7.2 (a) Applying de voltage to vertical and horizontal plates (b) Applying de voltageto both vertical and horizontal plates (c) Applying pulsating de to vertical or horizontalplates (d) Applying pulsating de to both vertical and horizontal (e) Applying a sine waveto vertical or horizontal (f)Applying phase-shifted sine waves to vertical and horizontal
plates
45°
(e)
(d)
(c)
(b)++
++ ++
V1 V1 V1 - V1+
Hl H2 H, H2 Hl H2 Hl H2+ +
V2 - V2 V2 + V2
(a)
+ +
Oscilloscope 179
Electrostatic CRTs are available in a number of types and sizes to suit individualrequirements. The important features of these tubes are as follows.
1. Size Size refers to the screen diameter. CRTs for oscilloscopes are availablein sizes of 1, 2, 3, 5, and 7 inches. 3 inches is most cornrnon for portableinstruments.
For example a CRT having a number 5GPl. The first number 5 indicates thatit is a 5 inch tube.
Both round and rectangular CRTs are found in scopes today. The verticalviewing size is 8 ern and horizontal is 10 cm.
2. Phosphor The screen is coated with a fluorescent material called phosphor.This material determines the colour and persistence of the trace, both of whichare indicated by the phosphor.
7.3CRT FEATURES
Now, letus see whathappens to the beam when voltage is applied simultaneouslyto both vertical and horizontal plates.
When voltage is applied to the vertical and horizontal plates simultaneously,the deflection of the beam is proportional to the resultant of the two voltagesand the position of the beam is inbetween the horizontal and vertical axis of thescreen.
Suppose a steady voltage is applied to one horizontal and one vertical plate.When these two deflection voltages are equal, the position of the spot is 45°.The angle is greater than 45° (spot close to V-axis) when the vertical voltage isgreater than the horizontal, and less than 45° (spot close to the .H-axis) when thehorizontal voltage is greater than the vertical voltage. When the two voltages arereversed in polarity, the deflection is in the opposite direction.
If instead of a steady voltage a pulsating positive voltage is applied to thesame plates as before, a tilt of 45° is obtained from the horizontal if the twovoltages are equal and in phase. The tilt is greater than 45° if the vertical voltageis greater than the horizontal voltage, and less than 45° if the horizontal voltageis greater than the vertical voltage. When a negative voltage is applied to bothplates, the trace extends in the opposite direction. When an alternating voltagein phase is applied to the plates, the tilt of the trace is 45° from the horizontalwhen the two voltages are equal, it traces a straight line at an angle of 45 degrees.Again the tilt is greater than 45° if the vertical voltage is greater, and less than45° if the horizontal voltage is greater.
The ac trace has equal length from the centre of screen to either tip, when theac is symmetrical. When it is asymmetrical, the shorter part corresponds to thelower voltage half cycle.
A single trace is obtained only when the phase angles are 0°, 180°, or 360°. Atother phase angles a double line trace is obtained at equal voltages, the patternbecomes an ellipse with a right tilt for angle between 0-90°, a circle at 90° andan ellipse with a left tilt between 90-180°. Again, a left tilt between 180-270°, acircle at 270°, an ellipse with lift tilt between 270-360°.
180 Electronic Instrumentation

7.3.1 Basic Principle of Signal Display (Function of the Sweep Generator)The amplitude of a voltage may be directly measured on a calibrated viewingscreen from the length of the straight line trace it produces. This is entirelysatisfactory for de voltage.
4. Deflection Voltages Either ac or de voltage will deflect the beam. The distancethrough which the spot moves on the screen is proportional to the de, or peak acamplitude. The deflection sensitivity of the tube is usually stated as the de voltage(or peak ac voltage) required for each em of deflection of the spot on the screen.
5. Viewing Screen The viewing screen is the glass face plate, the inside wallof which is coated with phosphor. The viewing screen is a reetangular screenhaving graticules marked on it. The standard size used nowadays is 8 cm x 10 ern(8 ern on the vertical and 10 em on horizontal). Each centimeter on the graticulecorresponds to one division (div). The standard phosphor colour used nowadaysis blue.
The trace colours in electrostatic CRTs for oscilloscopes are blue, green andblue green. White is used in TVs, and blue-white, orange, and yellow are usedfor radar.
Persistence is expressed as short, medium and long. This refers to the lengthof time the trace remains on the screen after the signal has ended.
The phosphor of the oscilloscope is designated as follows.PI Green mediumP2 Blue green mediumP5 Blue very shortPll Blue short
These designations are combined in the tube type number. Hence 5GP 1 is a 5inch tube with a medium persistence green trace.
Medium persistence traces are mostly used for general purpose applications.Long persistence traces are used for transients, since they keep the fast
transient on the screen for observation after the transient has disappeared.Short persistence is needed for extremely high speed phenomena, to prevent
smearing and interference caused when one image persists and overlaps with thenext one.
P 11 phosphor is considered the best for photographing from the CRT screen.
3. Operating Voltages The CRT requires a heater voltage of 6.3 volts ac or de at600 rnA.
Several de voltages are listed below. The voltages vary with the type of tubeused.
(i) Negative grid (control) voltage - 14 V to - 200 V.(ii) Positive anode no. 1 (focusing anode) - 100 V to - 1100 V(iii) Positive anode no. 2 (accelerating anode) 600 V to 6000 V(iv) Positive anode no. 3 (accelerating anode) 200 V to 20000 V in some
cases
Oscilloscope I 81
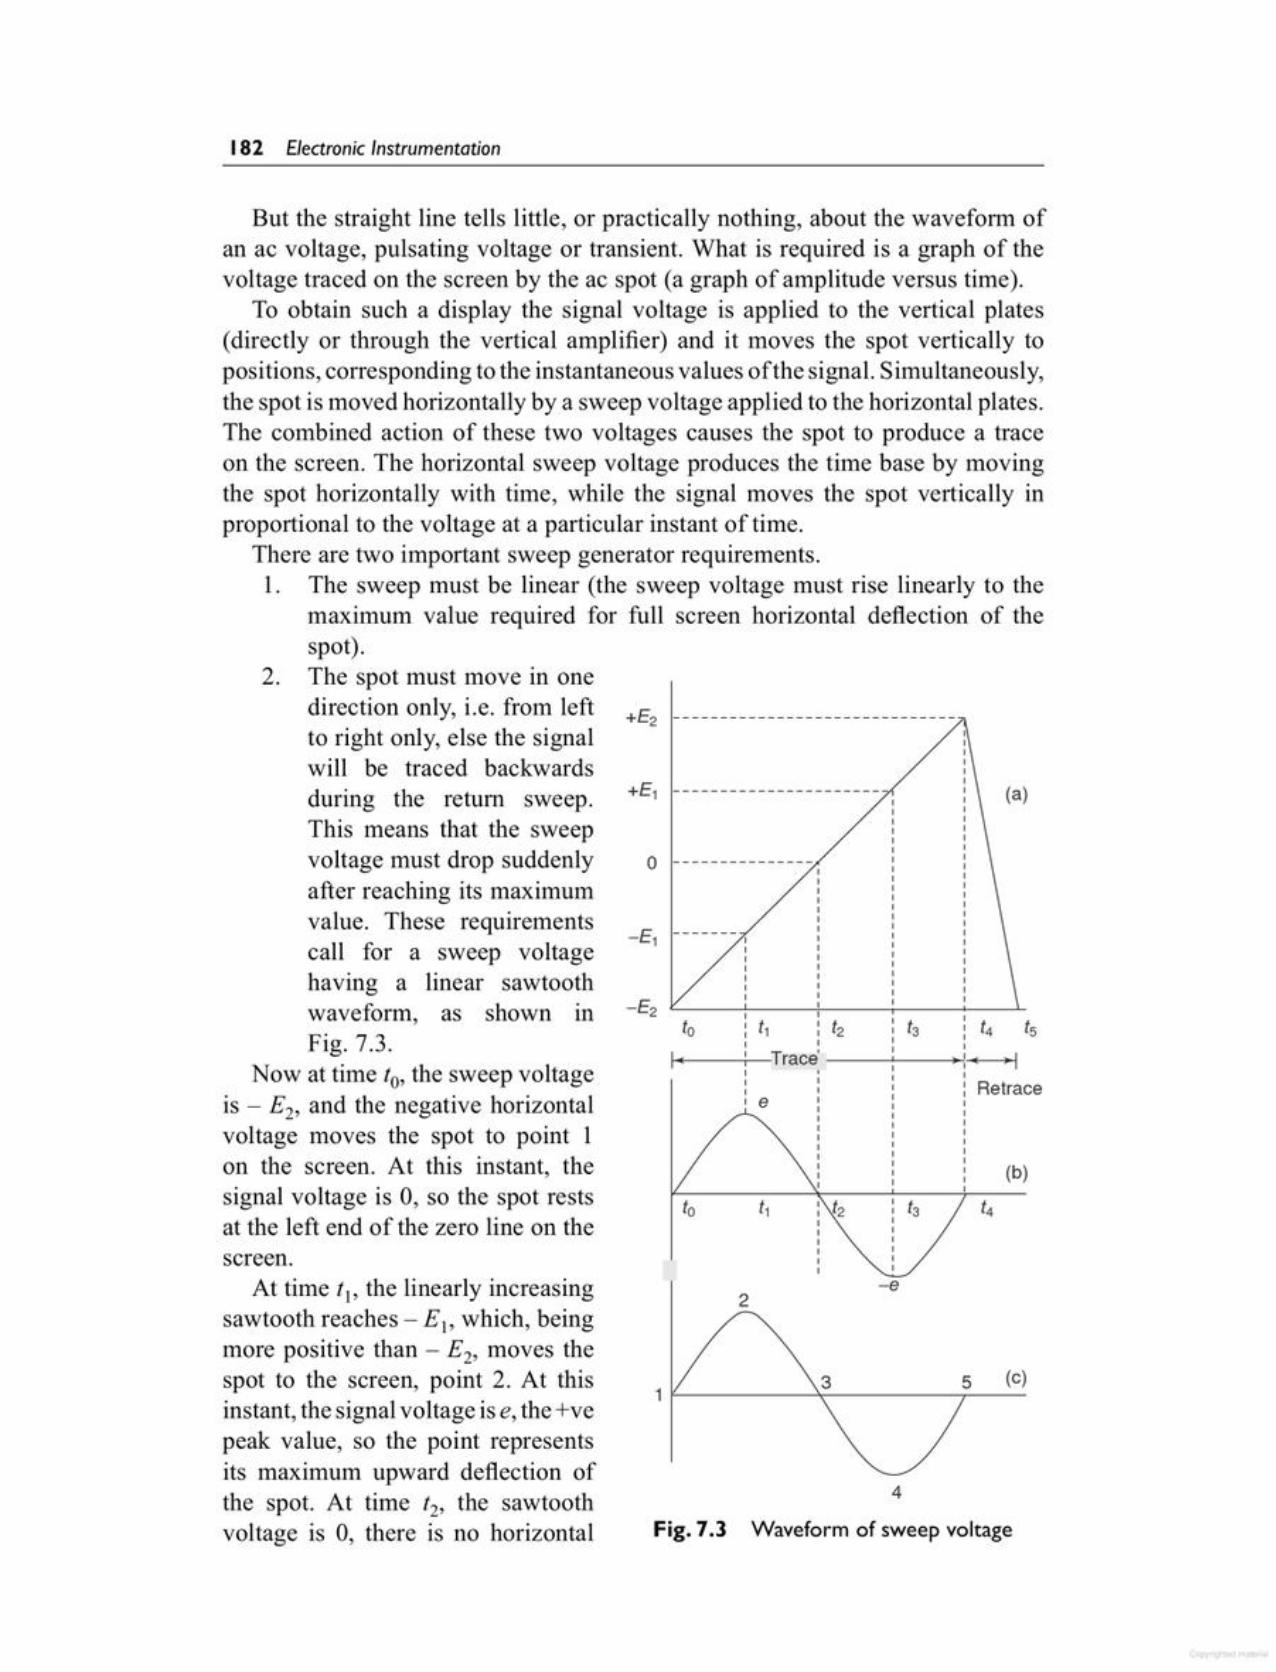
4
Waveform of sweep voltageFig. 7.3
3 5 (c)1jL------\--------,--
2-e
(b)
(a)
o ---------------
+El ----------------------
+E2 ----- -- - - -- - - -- -- - - -- - - -- -----
screen.At time tl, the linearly increasing
sawtooth reaches - E 1,which, beingmore positive than - E2, moves thespot to the screen, point 2. At thisinstant, the signal voltage is e, the +vepeak value, so the point representsits maximum upward deflection ofthe spot. At time t2, the sawtoothvoltage is 0, there is no horizontal
But the straight line tells little, or practically nothing, about the waveform ofan ac voltage, pulsating voltage or transient. What is required is a graph of thevoltage traced on the screen by the ac spot (a graph of amplitude versus time).
To obtain such a display the signal voltage is applied to the vertical plates(directly or through the vertical amplifier) and it moves the spot vertically topositions, corresponding to the instantaneous values of the signal. Simultaneously,the spot is moved horizontally by a sweep voltage applied to the horizontal plates.The combined action of these two voltages causes the spot to produce a traceon the screen. The horizontal sweep voltage produces the time base by movingthe spot horizontally with time, while the signal moves the spot vertically inproportional to the voltage at a particular instant of time.
There are two important sweep generator requirements.1. The sweep must be linear (the sweep voltage must rise linearly to the
maximum value required for full screen horizontal deflection of thespot).
2. The spot must move in onedirection only, i.e. from leftto right only, else the signalwill be traced backwardsduring the return sweep.This means that the sweepvoltage must drop suddenlyafter reaching its maximumvalue. These requirementscall for a sweep voltagehaving a linear sawtoothwaveform, as shown inFig. 7.3.
Now at time to, the sweep voltageis - E2, and the negative horizontalvoltage moves the spot to point 1on the screen. At this instant, thesignal voltage is 0, so the spot restsat the left end of the zero line on the
182 Electronic Instrumentation
4.Triggered Sweep Ina recurrent mode, the pattern is repeated again and again. Inthis mode the voltage rises to a maximum and then suddenly falls to a minimum.The electron beam moves slowly from left to right, retraces rapidly to the left andthe pattern is repeated. The horizontal sweep action takes place whether the inputsignal is applied to the oscilloscope or not, and a horizontal line is displayed onthe scope screen.
A triggered sweep, on the other hand, does not start unless initiated by a triggervoltage, generally derived from an incoming signal. In the absence of the inputsignal, the sweep is held off and the CRT screen is blanked.
The continuous or recurrent sweep uses a free running multivibrator (m/v)which covers a wide frequency range and can be locked into synchronisation byan input signal. Sync takes place when the sweep frequency and the input signalfrequency are the same or when the former is a multiple of the latter.
deflection and the spot is at the centre, point 3. At this instant, the signal voltageis 0, so there is no vertical deflection either. At time t3, the sawtooth voltage is+E1, moving the spot to point 4.
At this instant, the signal is - e, the -ve peak value, so point 4 is the maximumdownward deflection of the spot. At time t4, the sawtooth voltage is +E2, movingthe spot to point 5. Now the signal voltage is 0, so the spot is not verticallydeflected. Between t4 and t5, the sawtooth voltage falls quickly through 0 to itsinitial value of - E2, snapping the spot back to point 1, in time to sweep forwardon the next cycle of signal voltage. When sweep and signal frequencies are equal,a single cycle appears on the screen, when the sweep is lower than the signal,several cycles appear (in the ratio of the two frequencies), and when sweep ishigher than signal, less than one cycle appears. The display is stationary onlywhen the two frequencies are either equal or integral multiples of each other. Atother frequencies the display will drift horizontally. A sawtooth sweep voltage isgenerated by a multivibrator, relaxation oscillator or pulse generator. The upperfrequency generated by internal devices in the oscilloscope is 50-100 kHz inaudio instruments, 500-1000 kHz in TV service instruments and up to severalMHz in high quality laboratory instruments. In some oscilloscopes the sweep iscalibrated in Hz or kHz, and in others it is calibrated in time units (us, Ins, s). Thedifferent types of sweep generated are as follows:
1. Recurrent Sweep When the sawtooths, being an ac voltage alternates rapidly,the display occurs repetitively, so that a lasting image is seen by the eye. Thisrepeated operation is recurrent sweep.
2. Single Sweep The signal under study produces a trigger signal, which in tumproduces a single sweep.
3. Driven Sweep The sawtooth oscillator is a free running generator whenoperated independently. There is a chance that the sweep cycle may start afterthe signal cycle, thereby missing a part of the signal. Driven sweep removes thispossibility because it is fixed by the signal itself. The sweep and signal cyclesstart at the same time.
Oscilloscope I 83
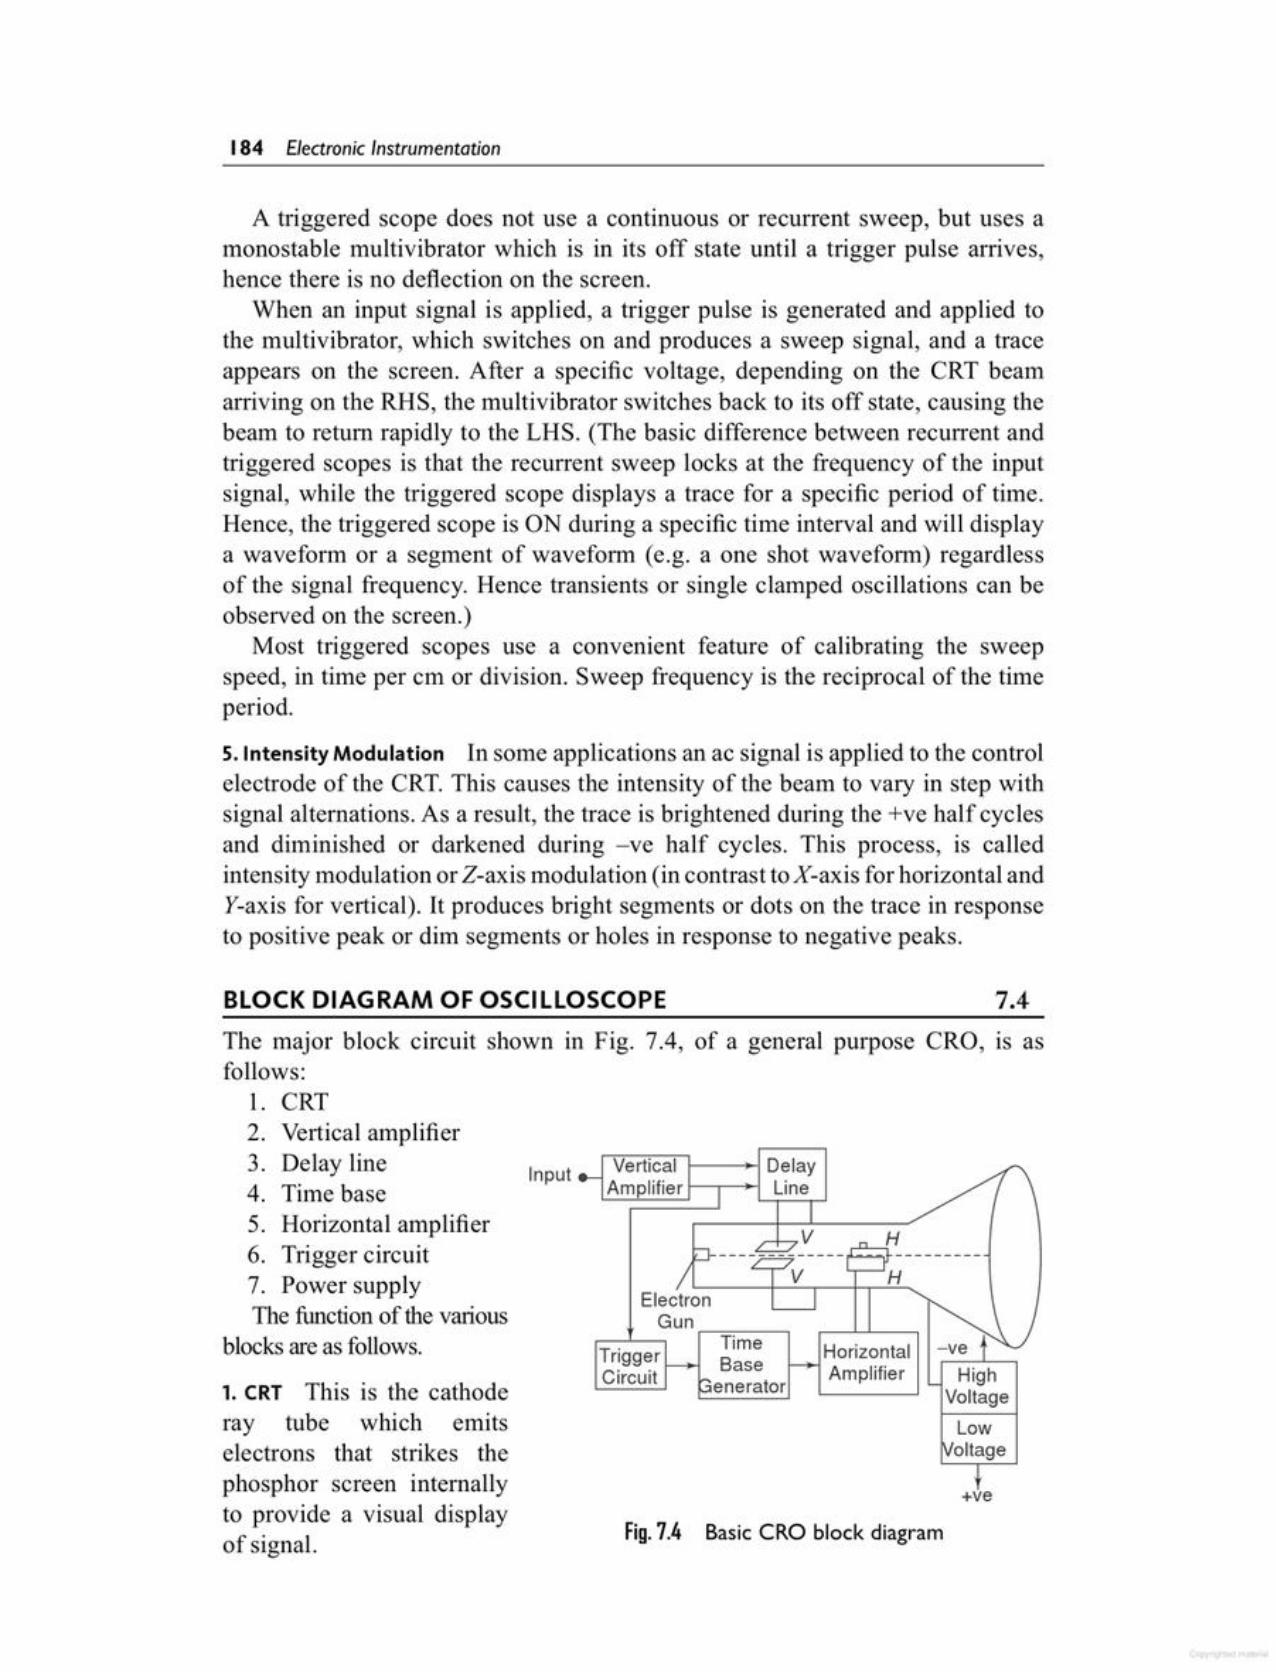
Fig.7.4 Basic eRO block diagram
+ve
HorizontalAmplifier High
Voltage
Gun ....--:::------.,-...L.._-, TimeTrigger BaseCircuit enerator
H
5. Horizontal amplifier6. Trigger circuit7. Power supplyThe function of the various
blocks are as follows.
1. CRT This is the cathoderay tube which emitselectrons that strikes thephosphor screen internallyto provide a visual displayof signal.
vElectron
f'vlhe;rirtITCic:aallI----~DelayAmplifier I-..-~ Line
Input
in Fig. 7.4, of a general purpose CRO, is asThe major block circuit shownfollows:
1. CRT2. Vertical amplifier3. Delay line4. Time base
7.4BLOCK DIAGRAM OF OSCILLOSCOPE
A triggered scope does not use a continuous or recurrent sweep, but uses amonostable multivibrator which is in its off state until a trigger pulse arrives,hence there is no deflection on the screen.
When an input signal is applied, a trigger pulse is generated and applied tothe multivibrator, which switches on and produces a sweep signal, and a traceappears on the screen. After a specific voltage, depending on the CRT beamarriving on the RHS, the multivibrator switches back to its off state, causing thebeam to return rapidly to the LHS. (The basic difference between recurrent andtriggered scopes is that the recurrent sweep locks at the frequency of the inputsignal, while the triggered scope displays a trace for a specific period of time.Hence, the triggered scope is ON during a specific time interval and will displaya waveform or a segment of waveform (e.g. a one shot waveform) regardlessof the signal frequency. Hence transients or single clamped oscillations can beobserved on the screen.)
Most triggered scopes use a convenient feature of calibrating the sweepspeed, in time per em or division. Sweep frequency is the reciprocal of the timeperiod.
5. Intensity Modulation In some applications an ac signal is applied to the controlelectrode of the CRT. This causes the intensity of the beam to vary in step withsignal alternations. As a result, the trace is brightened during the +ve half cyclesand diminished or darkened during -ve half cycles. This process, is calledintensity modulation or Z-axis modulation (in contrast toX-axis for horizontal andY-axis for vertical). It produces bright segments or dots on the trace in responseto positive peak or dim segments or holes in response to negative peaks.
184 Electronic Instrumentation
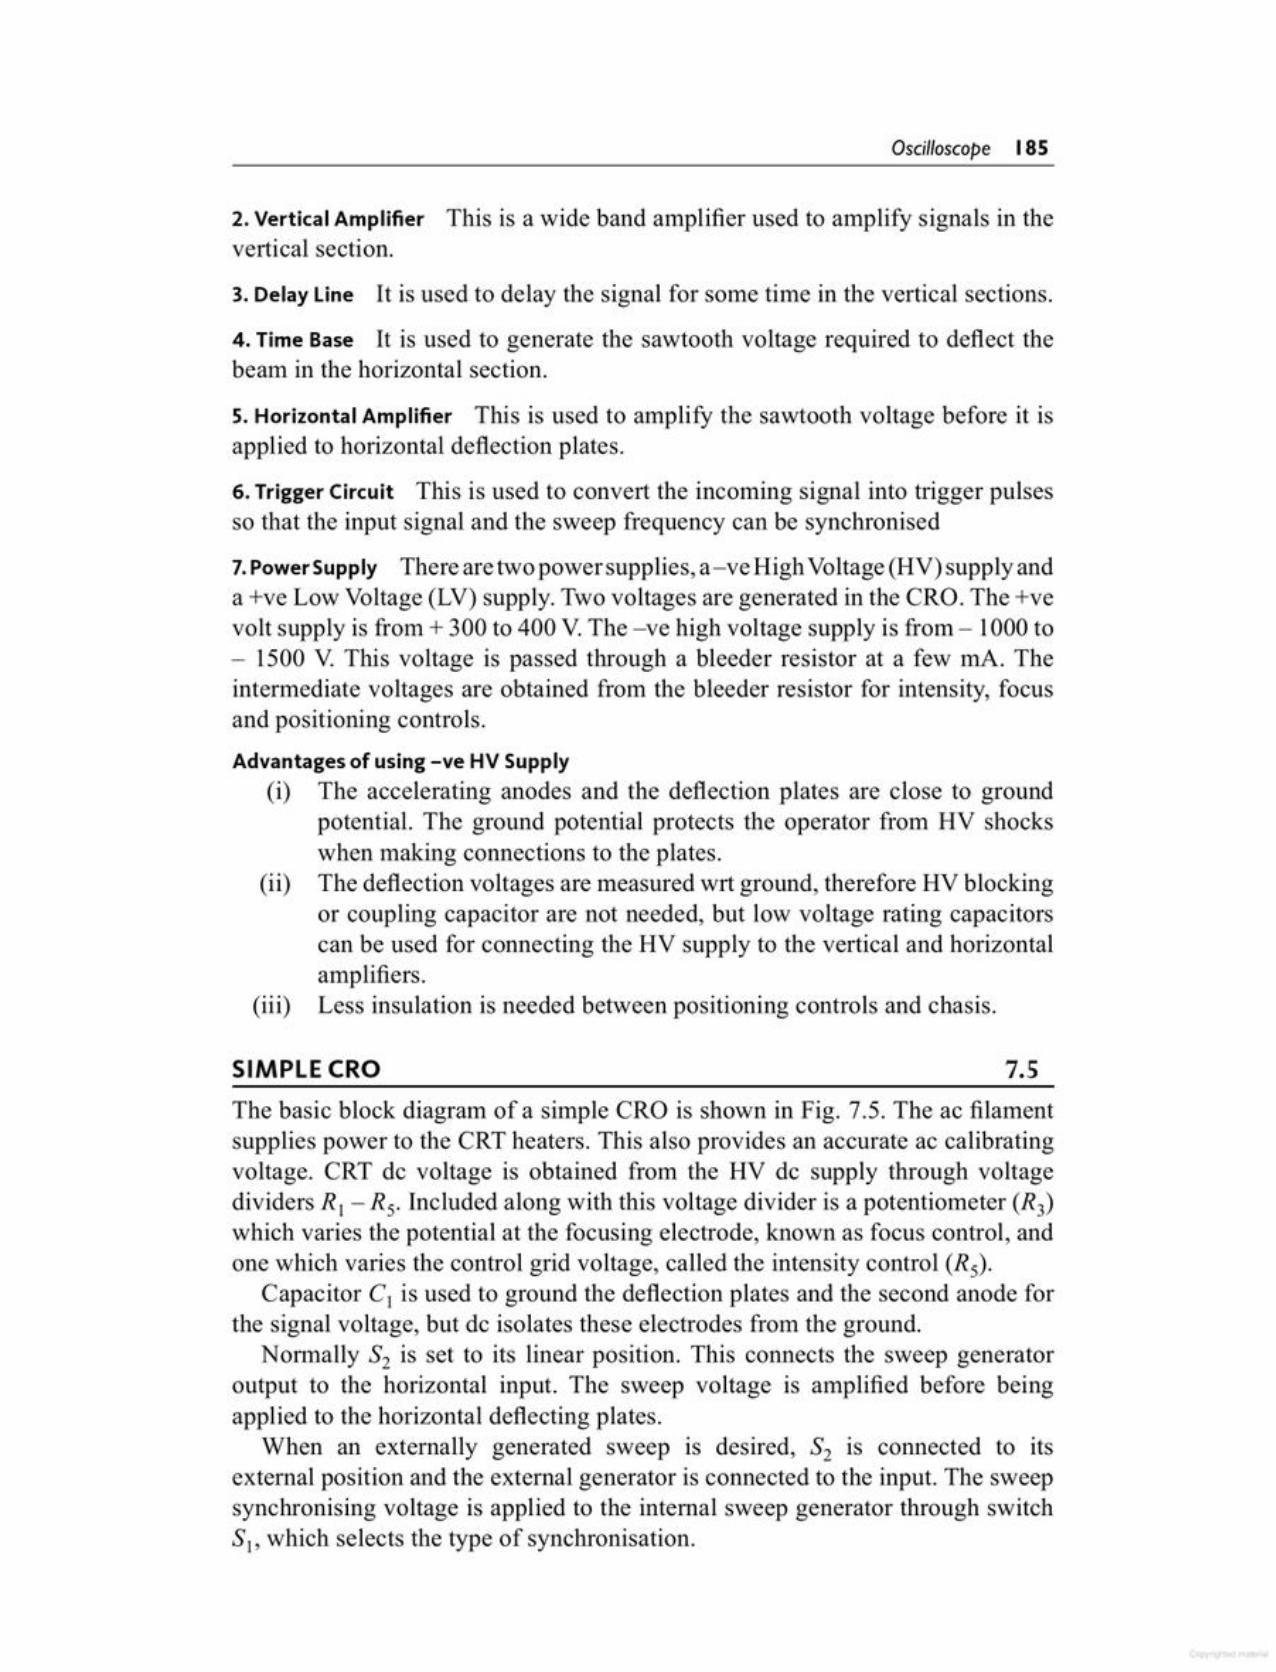
The basic block diagram of a simple CRO is shown in Fig. 7.5. The ac filamentsupplies power to the CRT heaters. This also provides an accurate ac calibratingvoltage. CRT dc voltage is obtained from the HV de supply through voltagedividers R, - Rs. Included along with this voltage divider is a potentiometer (R3)which varies the potential at the focusing electrode, known as focus control, andone which varies the control grid voltage, called the intensity control (Rs).
Capacitor C, is used to ground the deflection plates and the second anode forthe signal voltage, but de isolates these electrodes from the ground.
Normally S2 is set to its linear position. This connects the sweep generatoroutput to the horizontal input. The sweep voltage is amplified before beingapplied to the horizontal deflecting plates.
When an externally generated sweep is desired, S2 is connected to itsexternal position and the external generator is connected to the input. The sweepsynchronising voltage is applied to the internal sweep generator through switchS" which selects the type of synchronisation.
7.5SIMPLE eRO
5. Horizontal Amplifier This is used to amplify the sawtooth voltage before it isapplied to horizontal deflection plates.
6. Trigger Circuit This is used to convert the incoming signal into nigger pulsesso that the input signal and the sweep frequency can be synchronised
7.Power Supply There are two powersupplies, a-ve High Voltage (HV) supply anda +ve Low Voltage (LV) supply. Two voltages are generated in the CRO. The +vevolt supply is from + 300 to 400 V.The -ve high voltage supply is from - 1000 to- 1500 V. This voltage is passed through a bleeder resistor at a few m.A. Theintermediate voltages are obtained from the bleeder resistor for intensity, focusand positioning controls.
Advantages of using -ve HV Supply(i) The accelerating anodes and the deflection plates are close to ground
potential. The ground potential protects the operator from HV shockswhen making connections to the plates.
(ii) The deflection voltages are measured WIt ground, therefore HV blockingor coupling capacitor are not needed, but low voltage rating capacitorscan be used for connecting the HV supply to the vertical and horizontalamplifiers.
(iii) Less insulation is needed between positioning controls and chasis.
3. Delay Line It is used to delay the signal for some time in the vertical sections.
4. Time Base It is used to generate the sawtooth voltage required to deflect thebeam in the horizontal section.
2. Vertical Amplifier This is a wide band amplifier used to amplify signals in thevertical section.
Oscilloscope 185
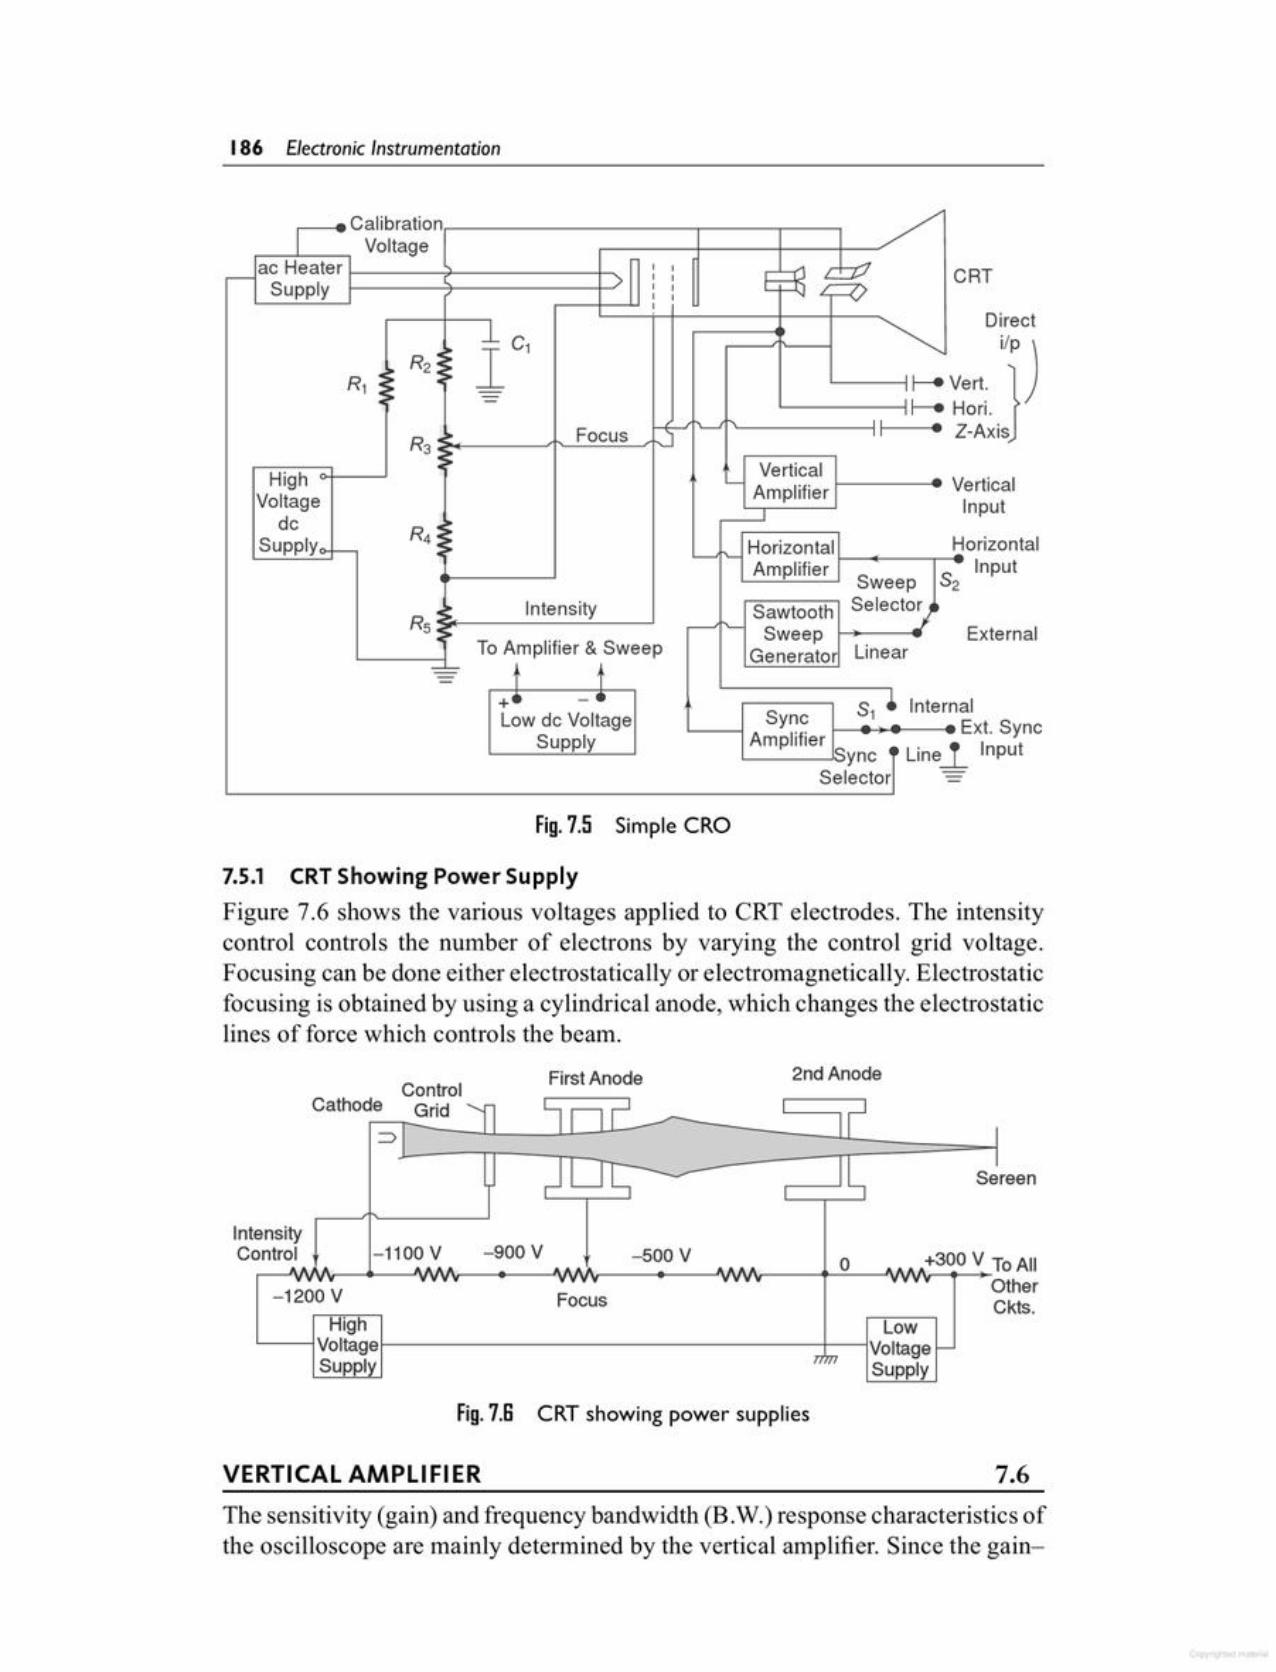
The sensitivity (gain) and frequency bandwidth (B.W.) response characteristics ofthe oscilloscope are mainly determined by the vertical amplifier. Since the gain-
7.6VERTICAL AMPLIFIER
CRT showing power suppliesFig.7.S
Focus-1200 V"-';H""ig=h-' Low
L..._-----jVoltage1-----------------+---iVoltageSup~ Supp~
+300V ToAllOtherCkts.
o-900 V -500 VIntensityControl -1100 V
Sereen
2ndAnodeFirstAnodeControlCathode Grid
=>
Fig. 7.5 Simple CRO
7.5.1 CRT Showing Power Supply
Figure 7.6 shows the various voltages applied to CRT electrodes. The intensitycontrol controls the number of electrons by varying the control grid voltage.Focusing can be done either electrostatically or electromagnetically. Electrostaticfocusing is obtained by using a cylindrical anode, which changes the electrostaticlines of force which controls the beam.
alExt. Sync
~ Input
External
orizontalInput
erticalInput
Direct
i/P)
ert. }on.
Z-Axis
CRT
Calibration -:I Voltageac Heater I I -u L Vr- ( ) I ISupply I I _ll L -oI I
Iic, ~:R2:Rl :; : : f---e V•
=-- :I-e H• -
: I• Focus ']I~ •
R3• :: VerticalHigh - "'VVoltage Amplifier
IdcR4:;Supply ~ Horizontal H• ~ ~
Amplifier Sweep $2
•~ Intensity Sawtooth SelectorRs.~ Sweep .I
• ToAmplifier & Sweep Generator Linear-==-
+ - InternLow dc Voltage Sync $1
Supply Amplifier l~1Lineync
Selector --
186 Electronic Instrumentation
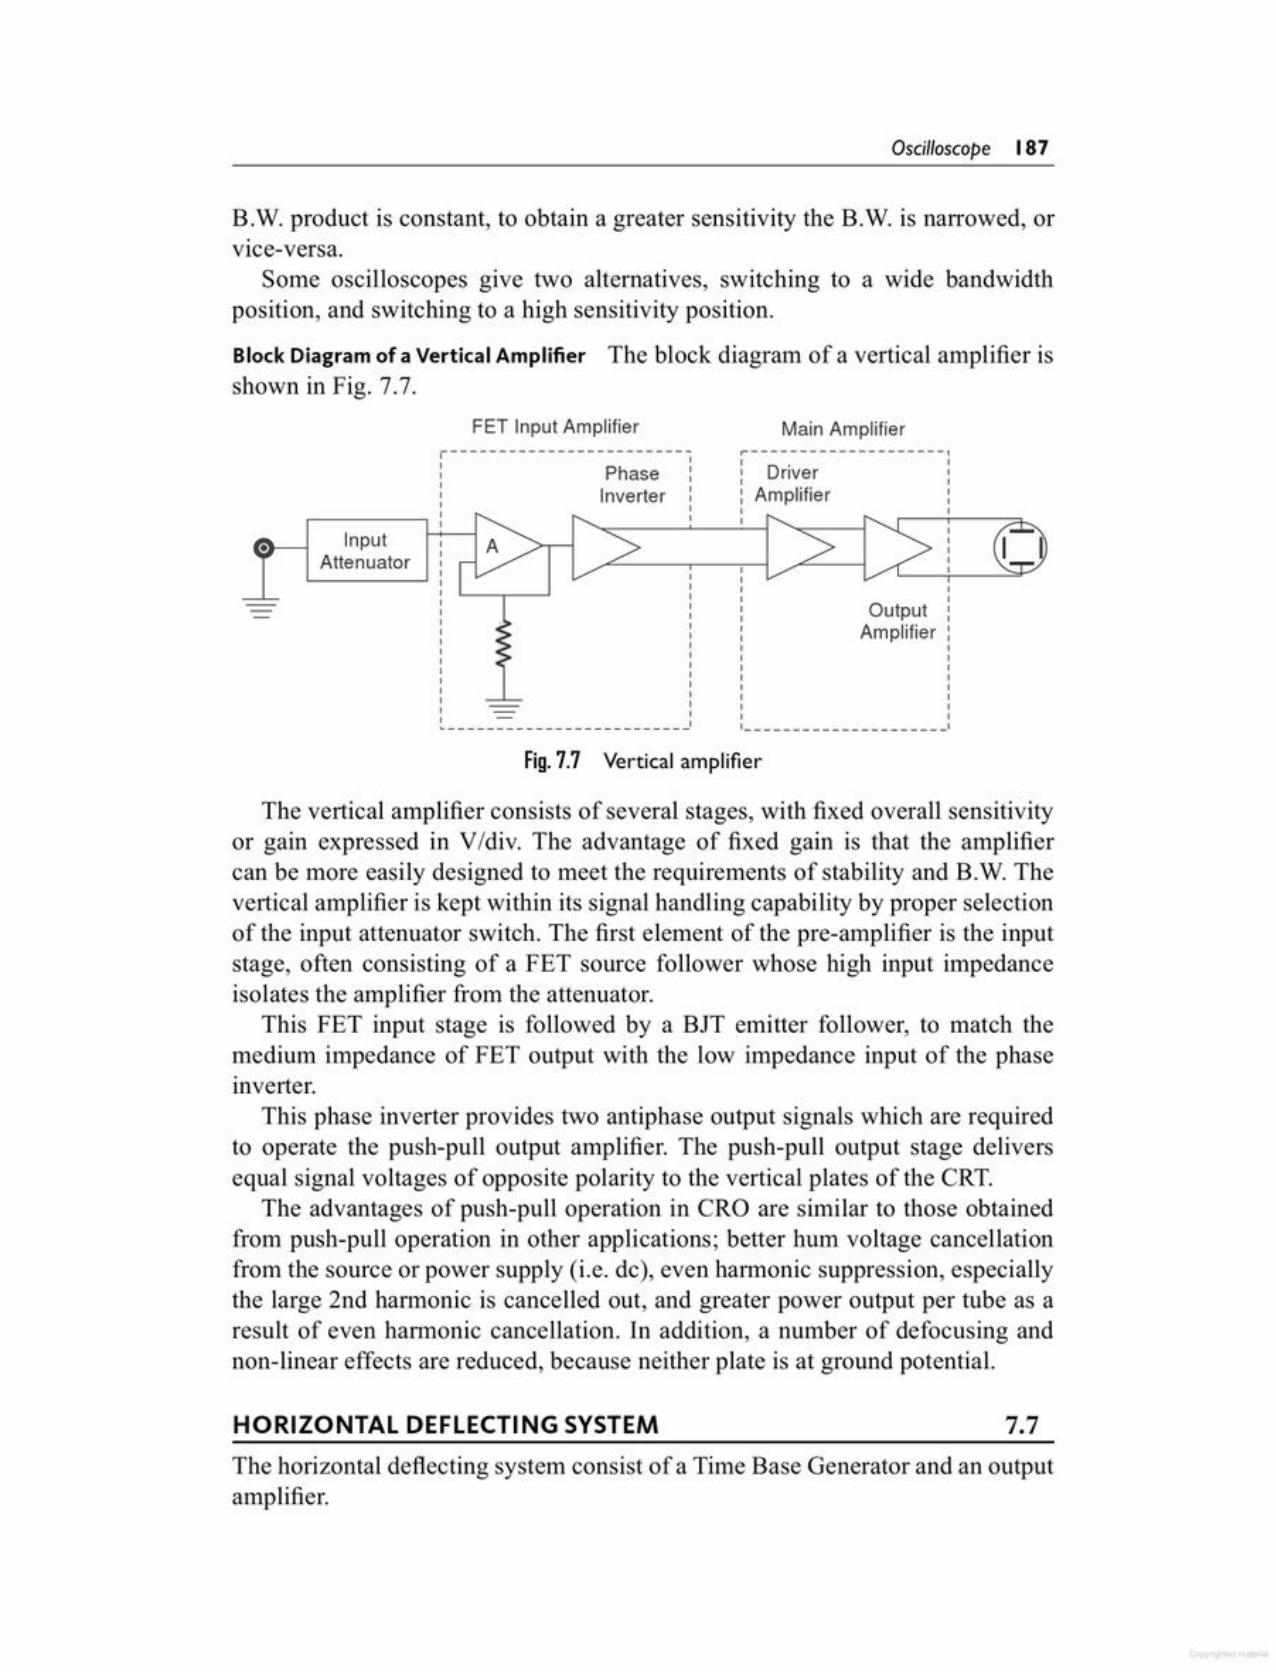
The horizontal deflecting system consist of a Time Base Generator and an outputamplifier.
7.7HORIZONTAL DEFLECTING SYSTEM
The vertical amplifier consists of several stages, with fixed overall sensitivityor gain expressed in VIdiv. The advantage of fixed gain is that the amplifiercan be more easily designed to meet the requirements of stability and B.W. Thevertical amplifier is kept within its signal handling capability by proper selectionof the input attenuator switch. The first element of the pre-amplifier is the inputstage, often consisting of a FET source follower whose high input impedanceisolates the amplifier from the attenuator.
This FET input stage is followed by a BIT emitter follower, to match themedium impedance of FET output with the low impedance input of the phaseinverter.
This phase inverter provides two antiphase output signals which are requiredto operate the push-pull output amplifier. The push-pull output stage deliversequal signal voltages of opposite polarity to the vertical plates of the CRT.
The advantages of push-pull operation in CRO are similar to those obtainedfrom push-pull operation in other applications; better hum voltage cancellationfrom the source or power supply (i.e. de), even harmonic suppression, especiallythe large 2nd harmonic is cancelled out, and greater power output per tube as aresult of even harmonic cancellation. In addition, a number of defocusing andnon-linear effects are reduced, because neither plate is at ground potential.
Fig. 7.7 Vertical amplifier~------------------------~
II
Output :Amplifier:
IIIIIIIIIIIIIIII I1_- I
InputAttenuator
: Driver: Amplifier
,--------------------1IIIIII
r-------------------------: PhaseII InverterI
,-----, :
Main AmplifierFET Input Amplifier
B.W. product is constant, to obtain a greater sensitivity the B.W. is narrowed, orVIce-versa.
Some oscilloscopes give two alternatives, switching to a wide bandwidthposition, and switching to a high sensitivity position.
Block Diagram of a Vertical Amplifier The block diagram of a vertical amplifier isshown in Fig. 7.7.
Oscilloscope 187
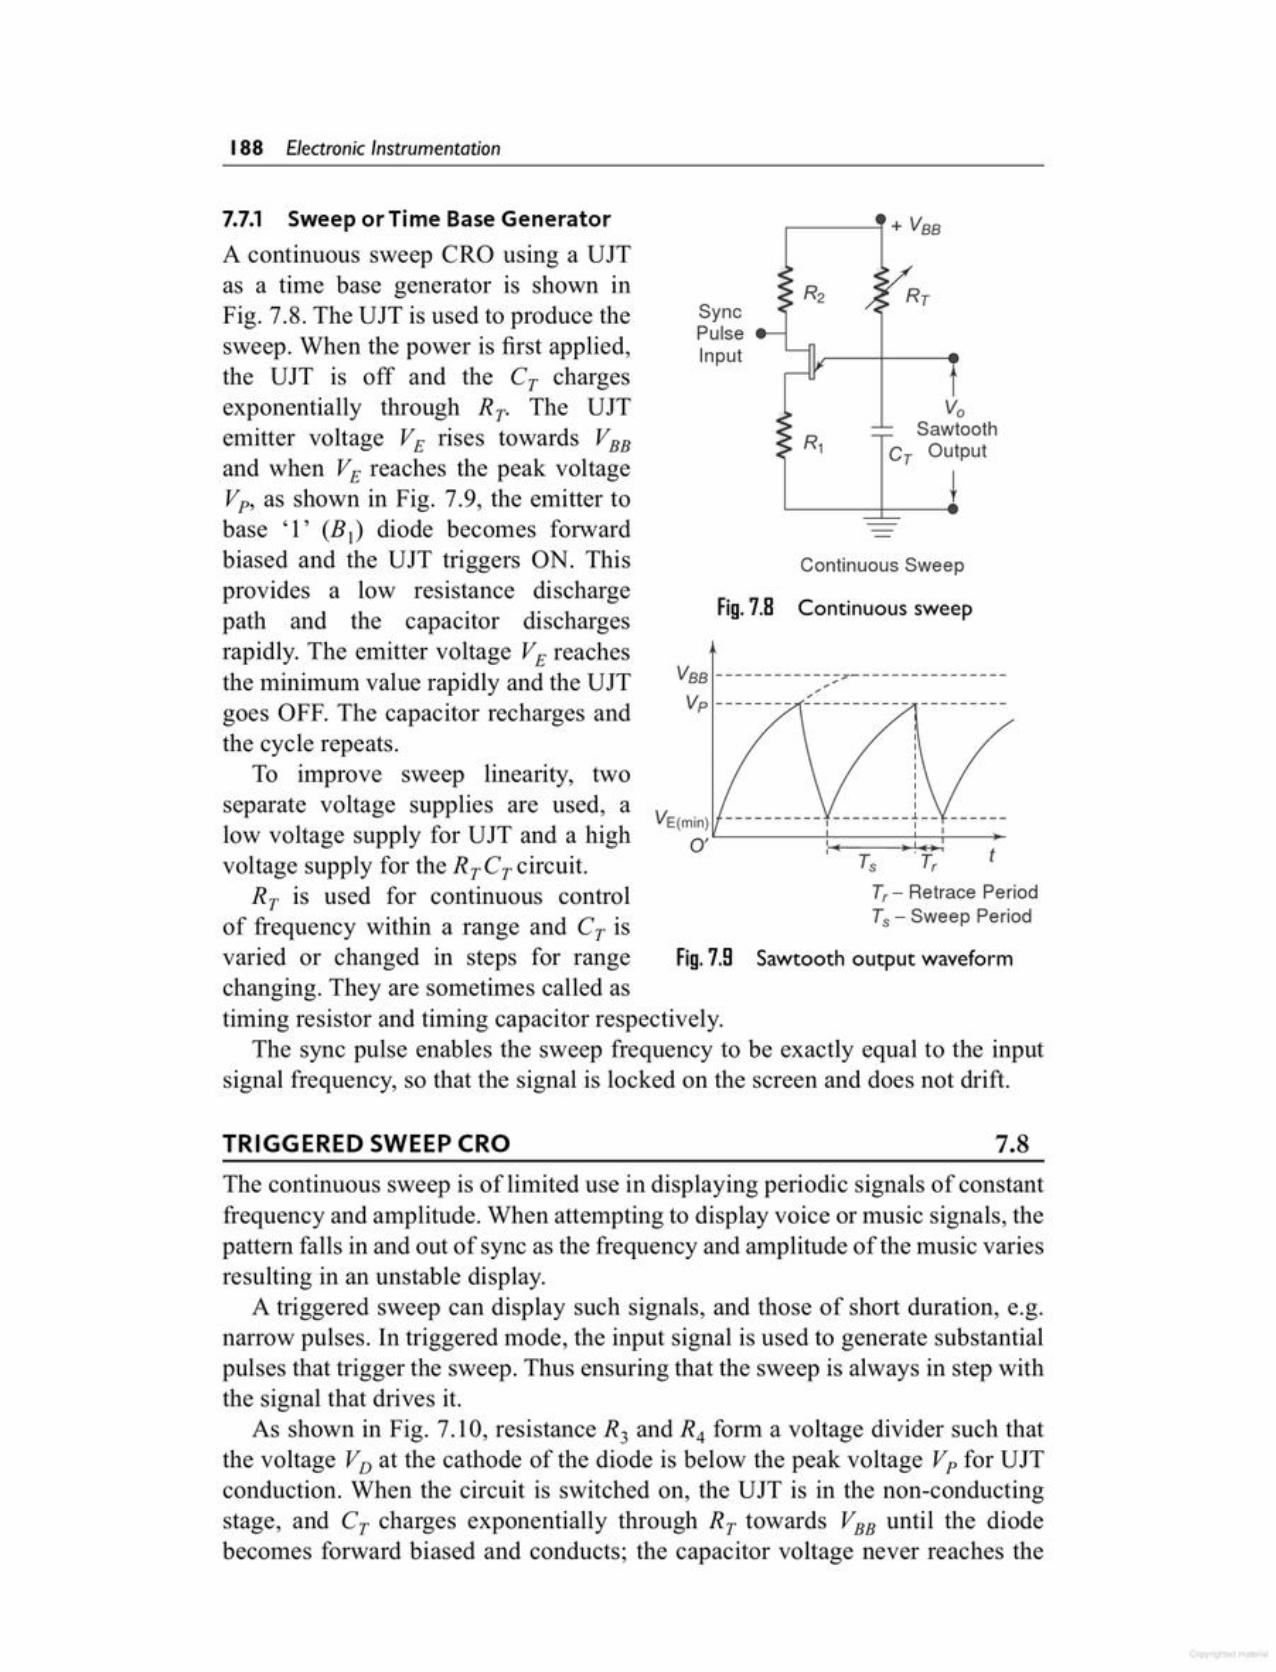
The continuous sweep is of limited use in displaying periodic signals of constantfrequency and amplitude. When attempting to display voice or music signals, thepattern falls in and out of sync as the frequency and amplitude of the music variesresulting in an unstable display.
A triggered sweep can display such signals, and those of short duration, e.g.narrow pulses. In triggered mode, the input signal is used to generate substantialpulses that trigger the sweep. Thus ensuring that the sweep is always in step withthe signal that drives it.
As shown in Fig. 7.10, resistance R3 and R4 form a voltage divider such thatthe voltage VD at the cathode of the diode is below the peak voltage Vp for UJTconduction. When the circuit is switched on, the UJT is in the non-conductingstage, and Cr charges exponentially through Rr towards VBB until the diodebecomes forward biased and conducts; the capacitor voltage never reaches the
7.8TRIGGERED SWEEP eRO
Sawtooth output waveformFig. 7.9
T,- Retrace PeriodTs - Sweep Period
Vee -----------~;7---------------Vp -------- ~~--------- ---------
Continuous sweepFig. 7.8
Continuous Sweep
VaSawtooth
c- Output
tSyncPulseInput
7.7.1 Sweep orTime Base GeneratorA continuous sweep Ck.O using a UJTas a time base generator is shown inFig. 7.8. The UJT is used to produce thesweep. When the power is first applied,the UJT is off and the CT chargesexponentially through s; The UJTemitter voltage VE rises towards VBB
and when VE reaches the peak voltageVp, as shown in Fig. 7.9, the emitter tobase '1' (B I) diode becomes forwardbiased and the UJT triggers ON. Thisprovides a low resistance dischargepath and the capacitor dischargesrapidly. The emitter voltage VE reachesthe minimum value rapidly and the UJTgoes OFF. The capacitor recharges andthe cycle repeats. :
To improve sweep linearity, two :separate voltage supplies are used, a VE(min) 1__low voltage supply for UJT and a high o,IL....-_-::' ;:::::==~';j'~--;-voltage supply for the RrCT circuit. r, t, t
RT is used for continuous controlof frequency within a range and Cr isvaried or changed in steps for rangechanging. They are sometimes called astiming resistor and timing capacitor respectively.
The sync pulse enables the sweep frequency to be exactly equal to the inputsignal frequency, so that the signal is locked on the screen and does not drift.
188 Electronic Instrumentation
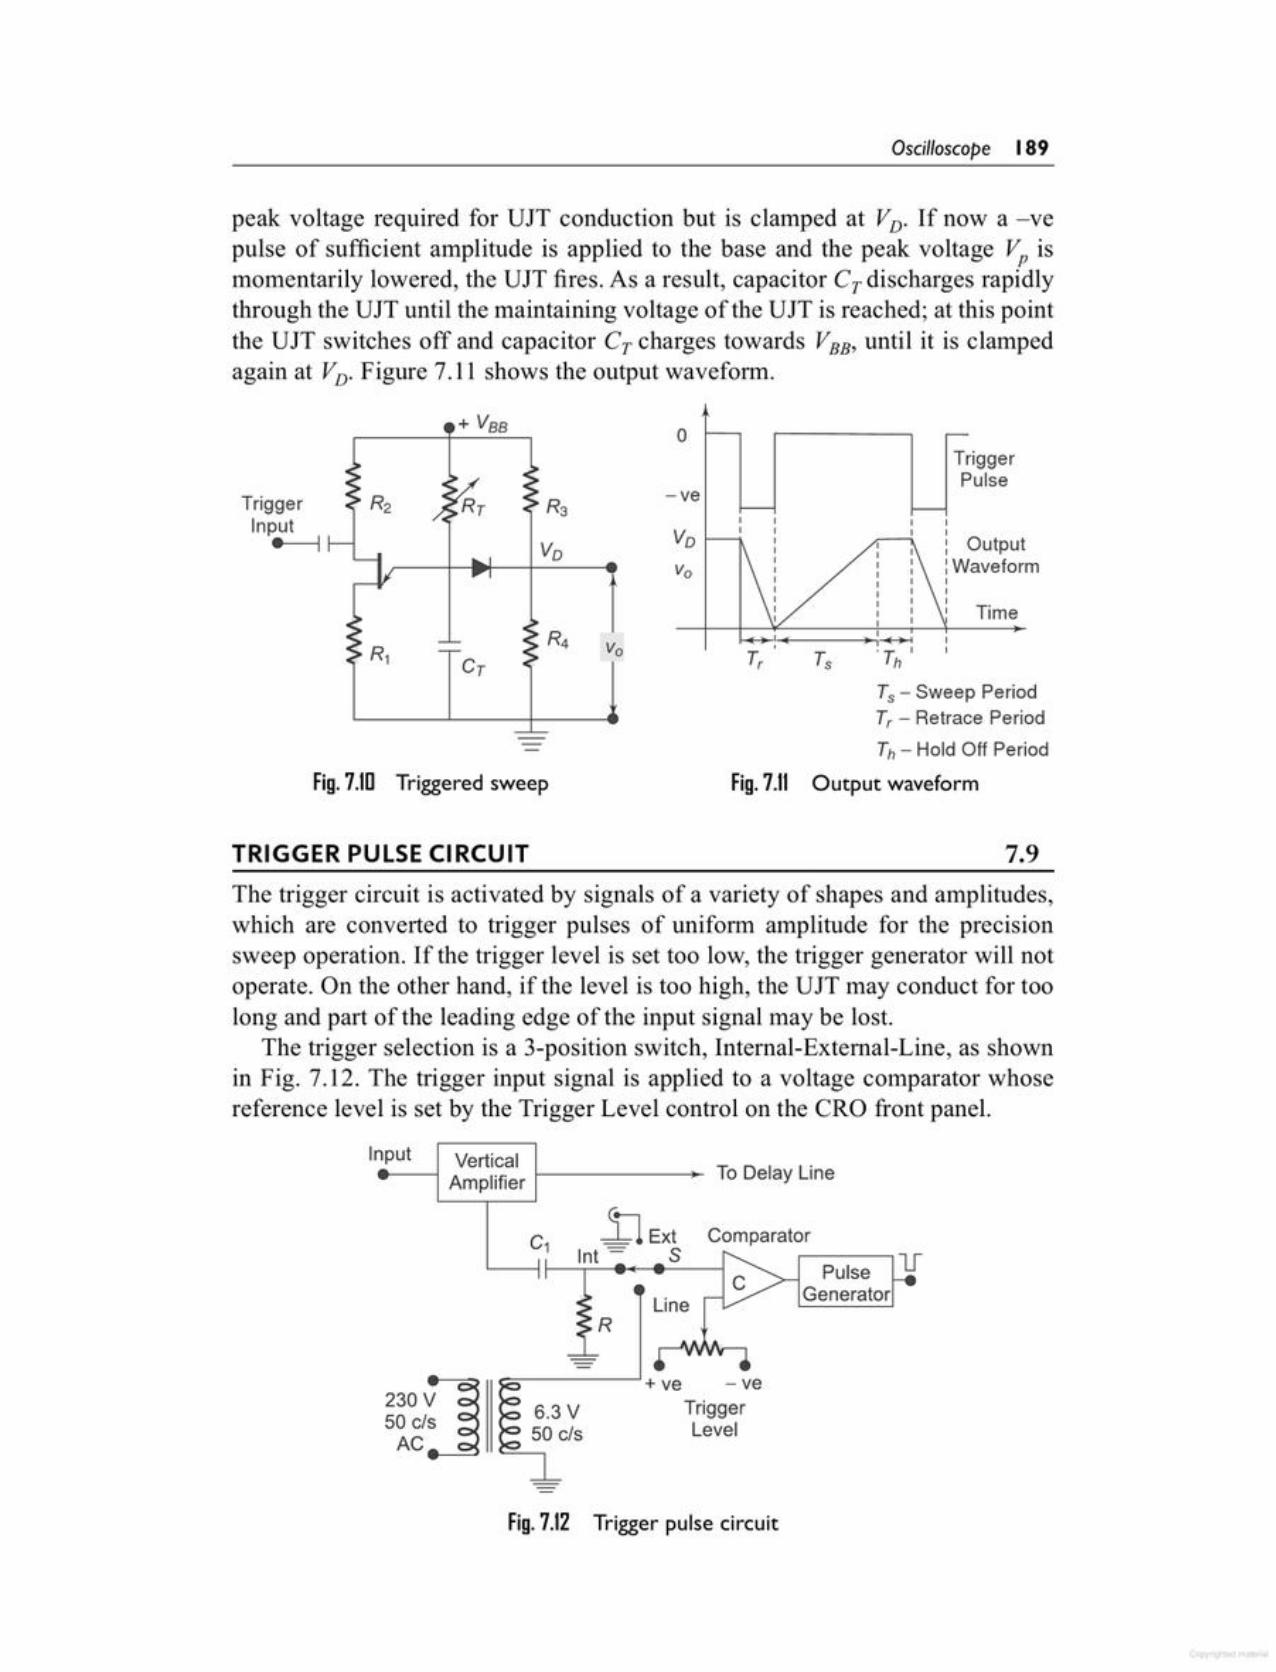
Fig. 7.12 Trigger pulse circuit
6,3 V
~ ___J+ ve - veTriggerLevel
GeneratorLine
1fPulse
R
Comparator-t1ExtInt -= S
Input VerticalAmplifier 1-----_ To Delay Line
The trigger circuit is activated by signals of a variety of shapes and amplitudes,which are converted to trigger pulses of uniform amplitude for the precisionsweep operation. If the trigger level is set too low, the trigger generator will notoperate. On the other hand, if the level is too high, the UJT may conduct for toolong and part of the leading edge of the input signal may be lost.
The trigger selection is a 3-position switch, Internal-External-Line, as shownin Fig. 7.12. The trigger input signal is applied to a voltage comparator whosereference level is set by the Trigger Level control on the eRO front panel.
7.9TRIGGER PULSE CIRCUIT
+ vaa 0TriggerPulse
R3 -veI
Vo I
Vo I I OutputI I
Vo I :Waveform
tIIII TimeII I
R4 Vo'~
Cr t, Ts 'Th I
Ts - Sweep PeriodT, - Retrace Period
Th - Hold Off Period
Fig. 7.10 Triggered sweep Fig. 7.11 Output waveform
TriggerInput•
peak voltage required for UJT conduction but is clamped at VD. If now a -vepulse of sufficient amplitude is applied to the base and the peak voltage Vp ismomentarily lowered, the UJT fires. As a result, capacitor CT discharges rapidlythrough the UJT until the maintaining voltage of the UJT is reached; at this pointthe UJT switches off and capacitor CT charges towards VBB, until it is clampedagain at VD' Figure 7.11 shows the output waveform.
Oscilloscope 189

Part ofSignal Lost
/'
Figure 7.14 indicates the amplitude of the signal wrt time and the relativeposition of the sweep generator output signal. The diagram shows that whenthe delay line is not used, the initial part of the signal is lostand only part of the signal is displayed. To counteract thisdisadvantage the signal is not applied directly to the verticalplates but is passed through a delay line circuit, as shownin Fig. 7.13. This gives time for the sweep to start at thehorizontal plates before the signal has reached the verticalplates. The trigger pulse is picked off at a time to after thesignal has passed through the main amplifier. The sweepgenerator delivers the sweep to the horizontal amplifier andthe sweep starts at the HDP at time to + 80 ns. Hence the Fig.7.14 Delay linesweep starts well in time, since the signal arrives at the VDP waveformat time to + 200 ns.
Fig.7.13 Delay line circuit
nput r-. Am;:ierignal Delay
Pre-y > l-• Amplifier to = time Line- V V td = 200 ns I- /-
Trigger \ / time = to + 80 nsPick-Off
~
SweepGenerator
IS
to + 200 nsMain
Figure 7.13 shows a delay line circuit.
7.10DELAY LINE IN TRIGGERED SWEEP
The comparator circuit C produces a change in the output whenever the triggerinput exceeds the present trigger levels. The pulse generator that follows thecomparator produces -ve trigger pulses each time the comparator output crossesits quiescent level, which in tum triggers the sweep generator to start the nextsweep. The trigger sweep generator contains the stability or sync control, whichprevents the display from jittering or running on the screen. Stability is securedby proper adjustments of the sweep speed. Sweep speed is adjustable by meansof a sweep rate control and its multiplier, i.e. range control. The timing resistanceRr is used for sweep rate control and timing capacitor Cr is changed in steps forsweep rate control.
190 Electronic Instrumentation

Figure 7.16 shows various controls and CRT connections.The following controls are available on CRO panel.
1. Intensity It controls the magnitude of emission of the electron beam, i.e.the electron beam is adjusted by varying the cathode-to-grid bias voltage. Thisadjustment is done by the 500 kQ potentiometer,
2. Focus The focusing anode potential is adjusted with respect to the first andfinal accelerating anodes. This is done by the 2 MQ potentiometer. It adjusts thenegative voltage on the focus ring between -500 V and -900 V.
3. Astigmatism It adjusts the voltage on the acceleration anode with respect tothe VDP of the CRT. This arrangement forms a cylindrical lens that corrects anydefocusing that might be present. This adjustment is made to obtain the roundestspot on the screen.
4. X-shift or Horizontal Position Control The X-position of the spot is adjusted byvarying the voltage between the horizontal plates. When the spot is in the centerposition, the two horizontal plates have the same potential.
5. Y-shift or Vertical Position Control The Y-position of the spot is adjusted byvarying the voltage between the vertical plates. When the spot is in the centerposition, the two vertical plates have the same potential.
6. Time Base Control This is obtained by varying the Cr and Rr of the time basegenerator.
7. Sync Selector It can synchronise the sweep to signals coming internally fromthe vertical amplifier or an external signal or the line supply i.e. the Int-Ext-Lineswitch.
TYPICAL CRT CONNECTIONS 7.12
Fig. 7.15 Sync selector
6.3 VLine 230 VSupply 50 cis
ac -........:=
HorizontalSweep
Generator
put VerticalAmplifier
nExt Sync ToInt -= S- Pulse-Line Generator
In
The sync selector is a 3-position switch, Int-Ext-Line. Therefore horizontal sweepcan be synchronised with the signals coming from any of the three sources, asshown in Fig. 7.15.
SYNC SELECTOR FOR CONTINUOUS SWEEP CRO 7.11
Oscilloscope I 9 I
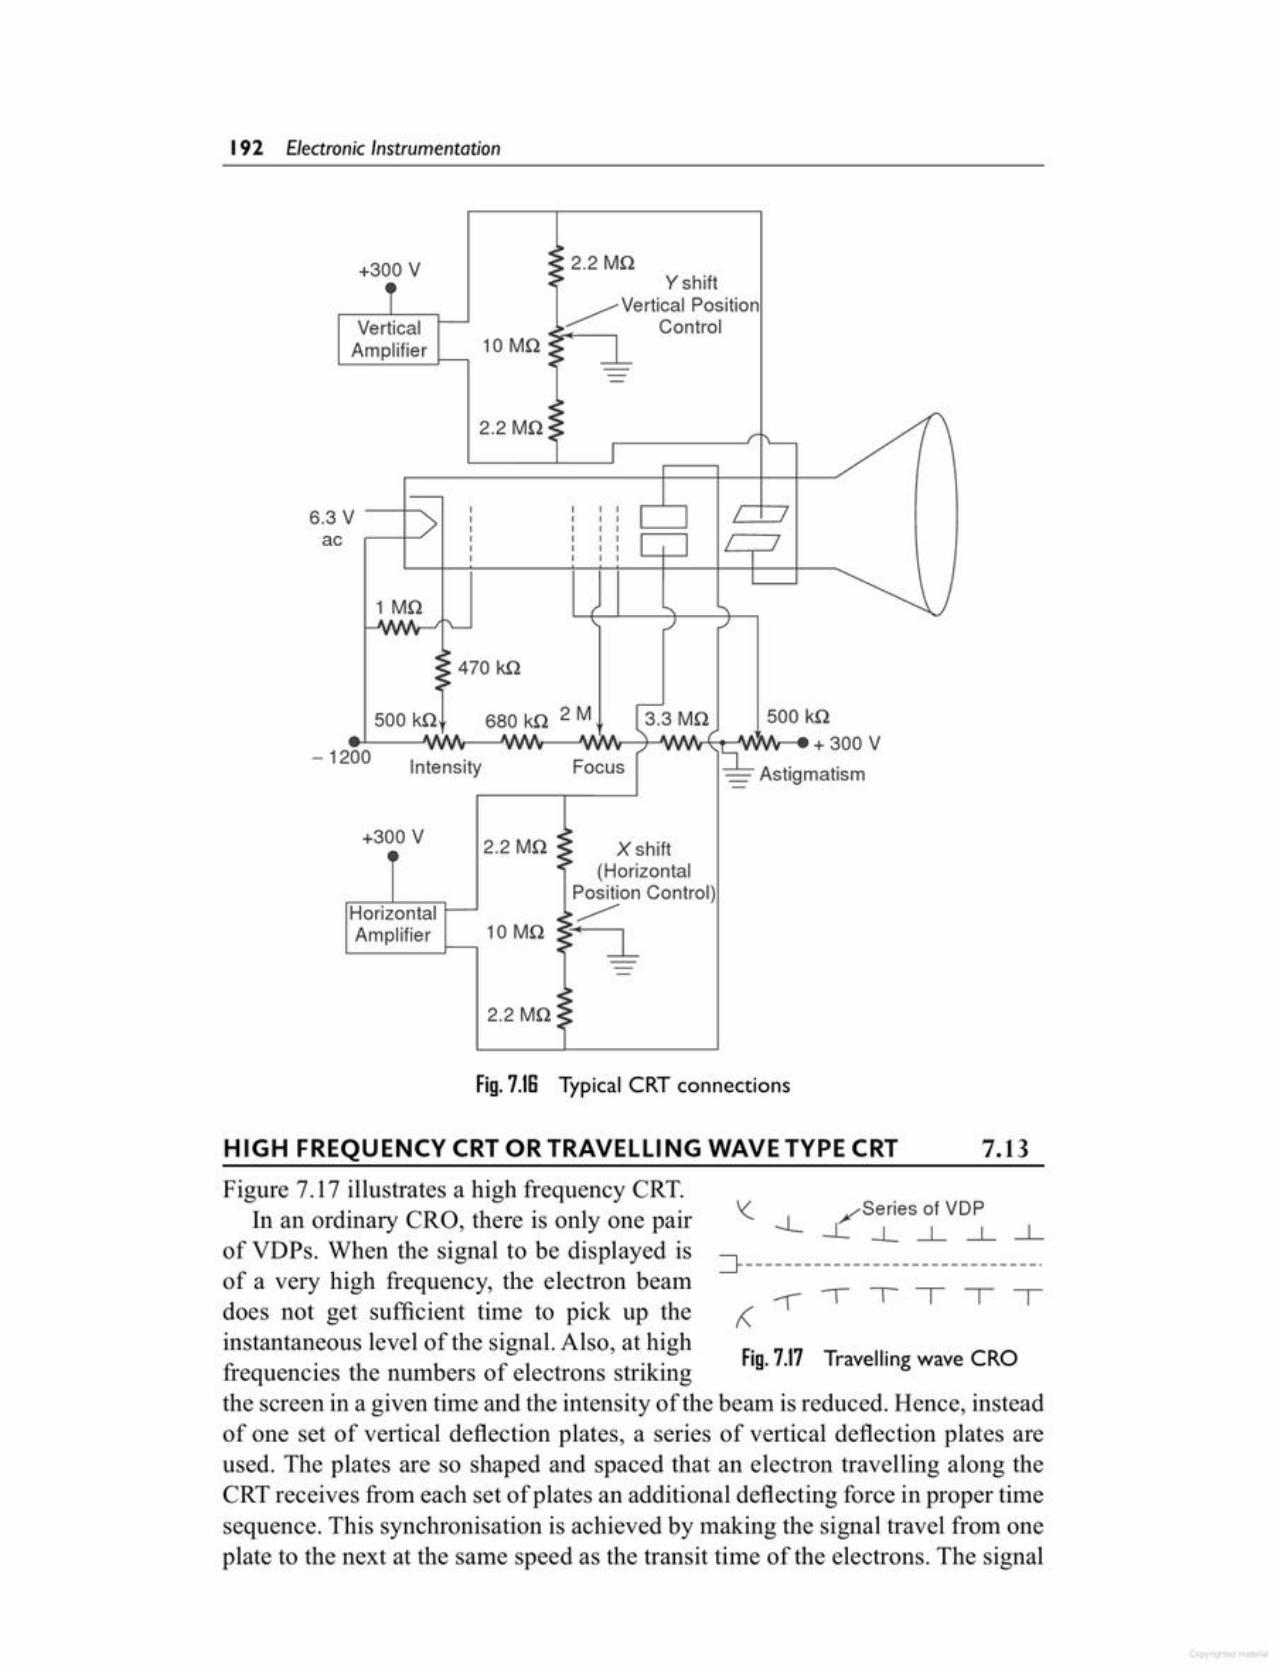
Fig.7.17 Travelling wave CRO
'<. /Series of VDP-L_[__J___L__L__L
==t------------------------------.(-rillil
Figure 7.17 illustrates a high frequency CRT.In an ordinary CRO, there is only one pair
of VDPs. When the signal to be displayed isof a very high frequency, the electron beamdoes not get sufficient time to pick up theinstantaneous level of the signal. Also, at highfrequencies the numbers of electrons strikingthe screen in a given time and the intensity of the beam is reduced. Hence, insteadof one set of vertical deflection plates, a series of vertical deflection plates areused. The plates are so shaped and spaced that an electron travelling along theCRT receives from each set of plates an additional deflecting force in proper timesequence. This synchronisation is achieved by making the signal travel from oneplate to the next at the same speed as the transit time of the electrons. The signal
HIGH FREQUENCY CRT OR TRAVELLING WAVE TYPE CRT 7.13
Fig.7.IS Typical CRT connections
...:2.2 MQ::
Horizontal -Amplifier
L-- __ _J-
c:2.2 MQ :. X shift.> (HorizontalPosition Control)e__......-
10 MQ <>~(---,~l
+300 V~
\(1 MQ
..AA"A ~yyyy
:~ 470 kQ.>
500 kQ 680 kQ 2 M f3.3 MQ 500 kQ- AA lA AA"A. "AAA ~ ......&&&& ( && ,& -- 300 V-1200 Y·Y'. YY.. • .•• / YYY. IL,Y'YY -+
Intensity Focus I~ Astigmatism
1-6.3 V I I I I I / _j> I I I I
I I I Iac I I I I I I / /I I I II I I I I
1
Vertical f-Amplifier f--
+300 V
T
...:
.--_....:::::::2=.2=M=Q=~:=~~I===~;;;~=~r+IL--_t-__/A"
.;~ 2.2 MQ.> Y shift
~ Vertical Position.~ Control
10 MQ:= ~
192 Electronic Instrumentation
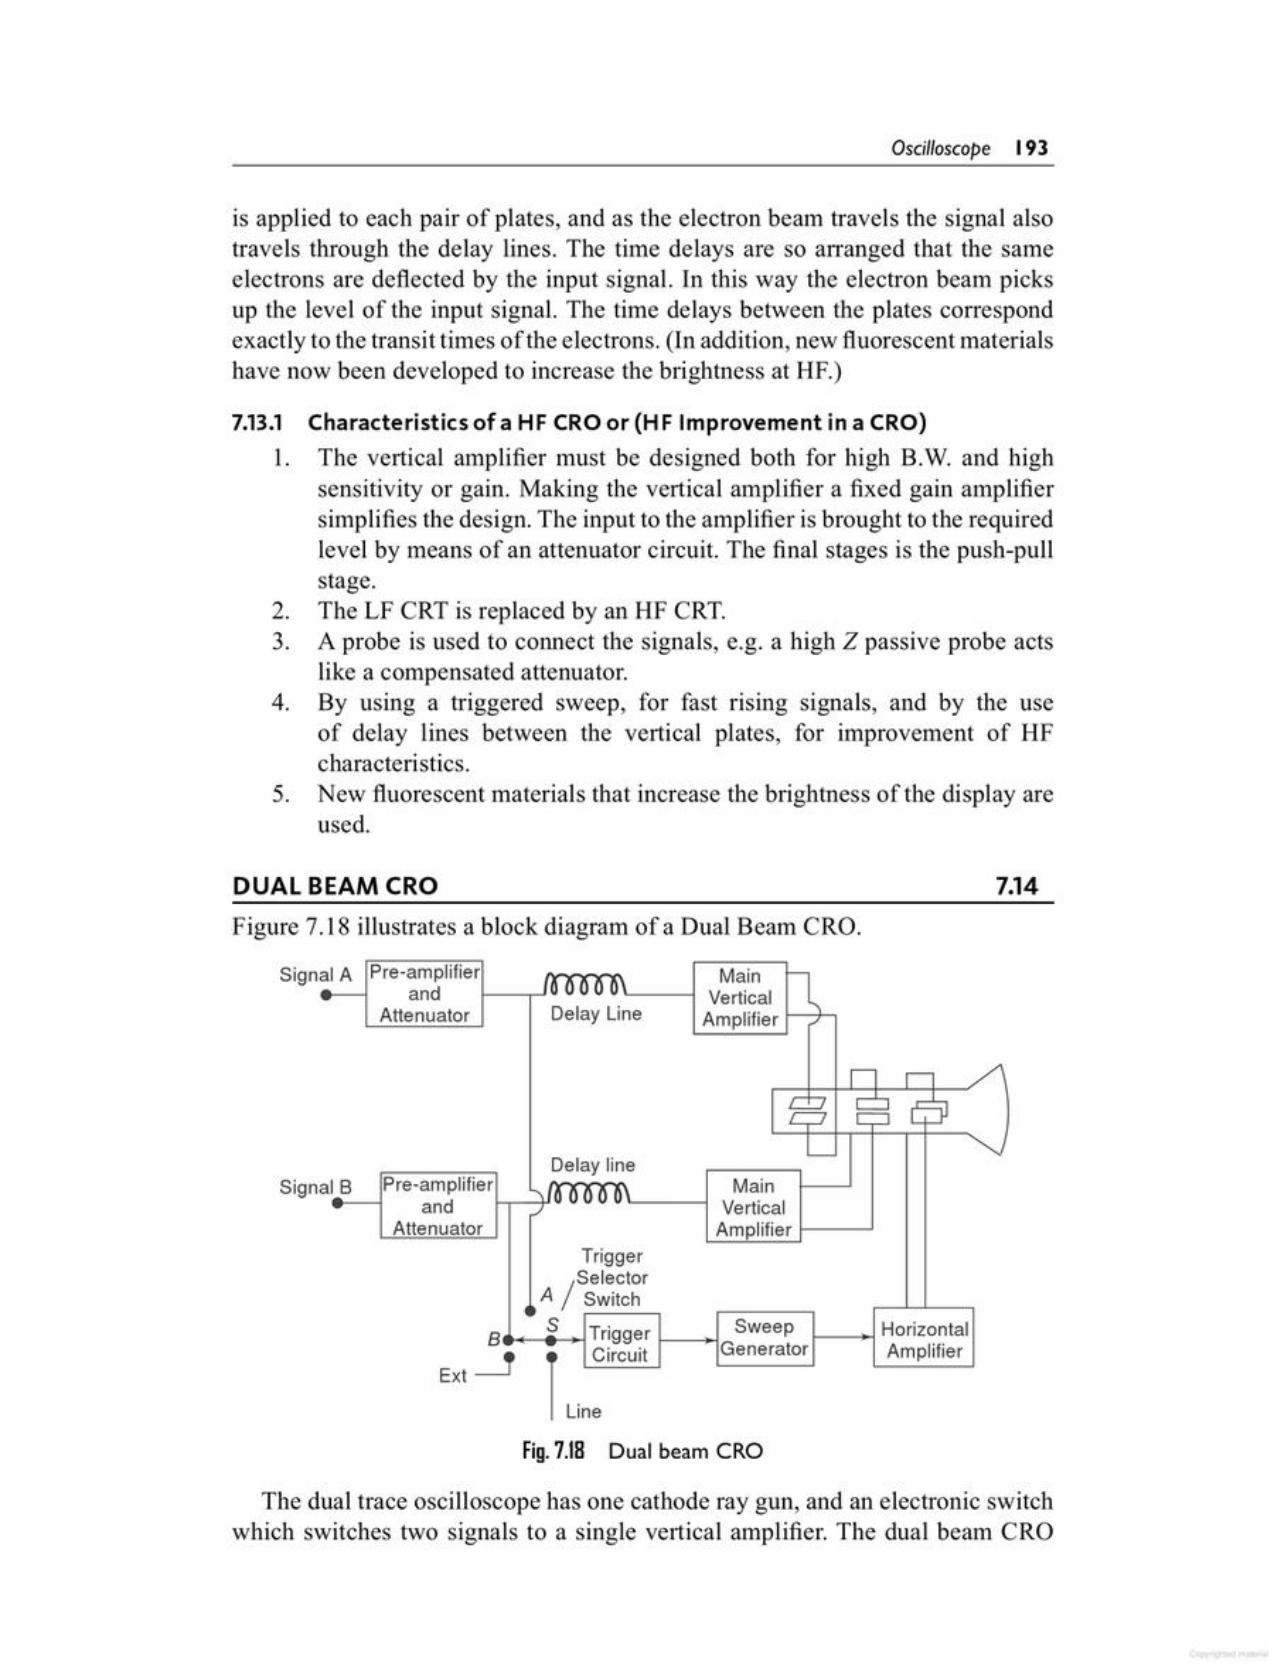
The dual trace oscilloscope has one cathode ray gun, and an electronic switchwhich switches two signals to a single vertical amplifier. The dual beam CRO
Fig. 7.18 Dual beam eRO
MainVerticalAmplifier
Trigger
/selector
A Switch
B~-eS~Trigger 1---+-1 Sweep I------+i Horizontal
rCircuit Generator Amplifier
Ext__'
Line
Signal B Pre-amplifierand I-r---+'
Attenuator
Delay line
MainVerticalAmplifier f--+.
Signal A Pre-amplifierand t--.-'
Attenuator Delay Line
Figure 7.18 illustrates a block diagram of a Dual Beam CRO.
7.14DUAL BEAM eRO
5.
4.
2.3.
Characteristics of a HF CRO or (H F Improvement in a CRO)The vertical amplifier must be designed both for high B.W. and highsensitivity or gain. Making the vertical amplifier a fixed gain amplifiersimplifies the design. The input to the amplifier is brought to the requiredlevel by means of an attenuator circuit. The final stages is the push-pullstage.The LF CRT is replaced by an HF CRT.A probe is used to connect the signals, e.g. a high Z passive probe actslike a compensated attenuator.By using a triggered sweep, for fast rising signals, and by the useof delay lines between the vertical plates, for improvement of HFcharacteristics.New fluorescent materials that increase the brightness of the display areused.
7.13.11.
is applied to each pair of plates, and as the electron beam travels the signal alsotravels through the delay lines. The time delays are so arranged that the sameelectrons are deflected by the input signal. In this way the electron beam picksup the level of the input signal. The time delays between the plates correspondexactly to the transit times of the electrons. (In addition, new fluorescent materialshave now been developed to increase the brigbtness at HF.)
Oscilloscope 193
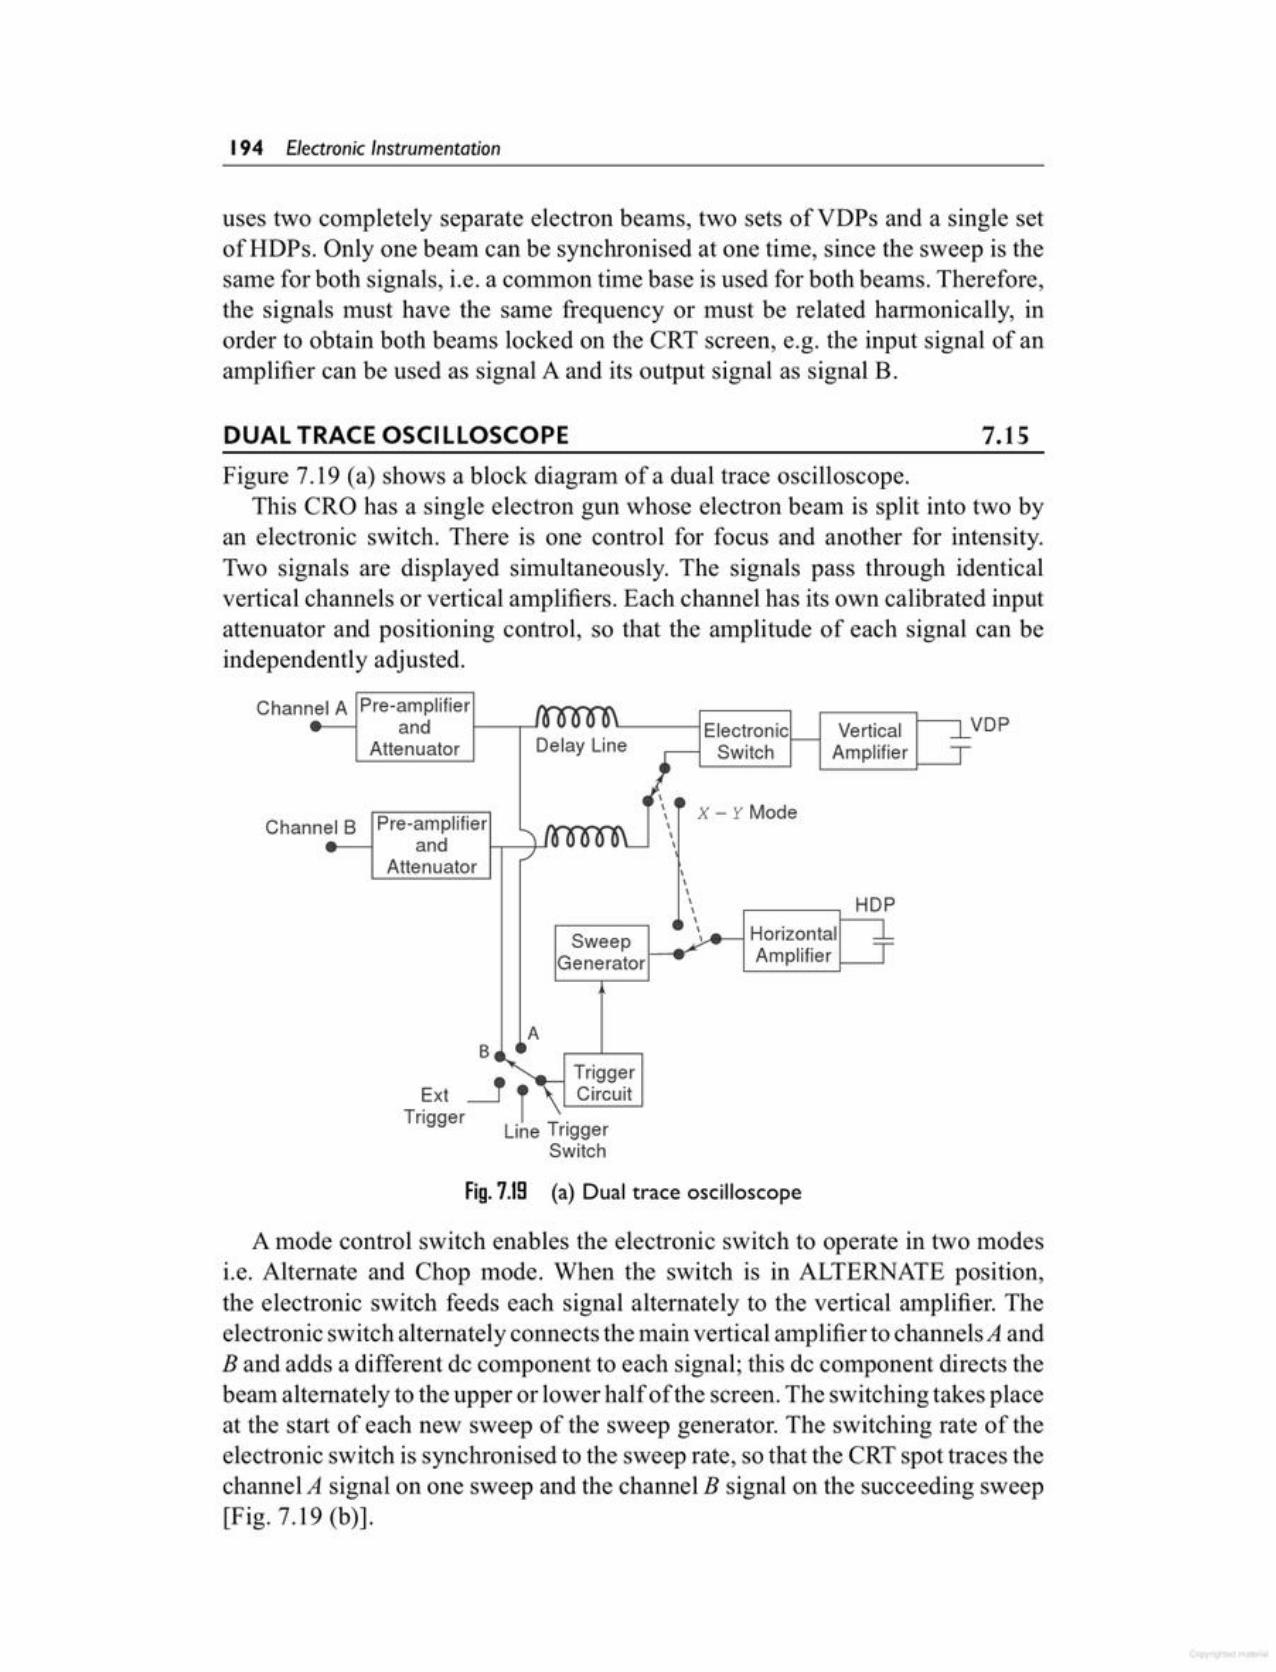
Fig.7.19 (a) Dual trace oscilloscope
A mode control switch enables the electronic switch to operate in two modesi.e. Alternate and Chop mode. When the switch is in ALTERNATE position,the electronic switch feeds each signal alternately to the vertical amplifier. Theelectronic switch alternately connects the main vertical amplifier to channels A andB and adds a different dc component to each signal; this de component directs thebeam alternately to the upper or lower half of the screen. The switching takes placeat the start of each new sweep of the sweep generator. The switching rate of theelectronic switch is synchronised to the sweep rate, so that the CRT spot traces thechannel A signal on one sweep and the channel B signal on the succeeding sweep[Fig. 7.19 (b)].
A
HOP
\\\\\\
Sweep \........-1HorizontalGeneratorl--illr Amplifier
Channel B Pre-amplifierand h---t-J
Attenuator
x - Y Mode
BTrigger
Ext _j T CircuitTrigger .Line Trigger
Switch
I.V:-e-:-rti:-ca--:lt------,V0 PAmplifier
Channel A Pre-amplifierand 1----.-' '----1 Electronic
Attenuator Delay Line Switch
Figure 7.19 (a) shows a block diagram ofa dual trace oscilloscope.This CRO has a single electron gun whose electron beam is split into two by
an electronic switch. There is one control for focus and another for intensity.Two signals are displayed simultaneously. The signals pass through identicalvertical channels or vertical amplifiers. Each channel has its own calibrated inputattenuator and positioning control, so that the amplitude of each signal can beindependently adjusted.
7.15DUAL TRACE OSCI LLOSCOPE
uses two completely separate electron beams, two sets ofVDPs and a single setofHDPs. Only one beam can be synchronised at one time, since the sweep is thesame for both signals, i.e. a common time base is used for both beams. Therefore,the signals must have the same frequency or must be related harmonically, inorder to obtain both beams locked on the CRT screen, e.g. the input signal of anamplifier can be used as signal A and its output signal as signal B.
194 Electronic Instrumentation
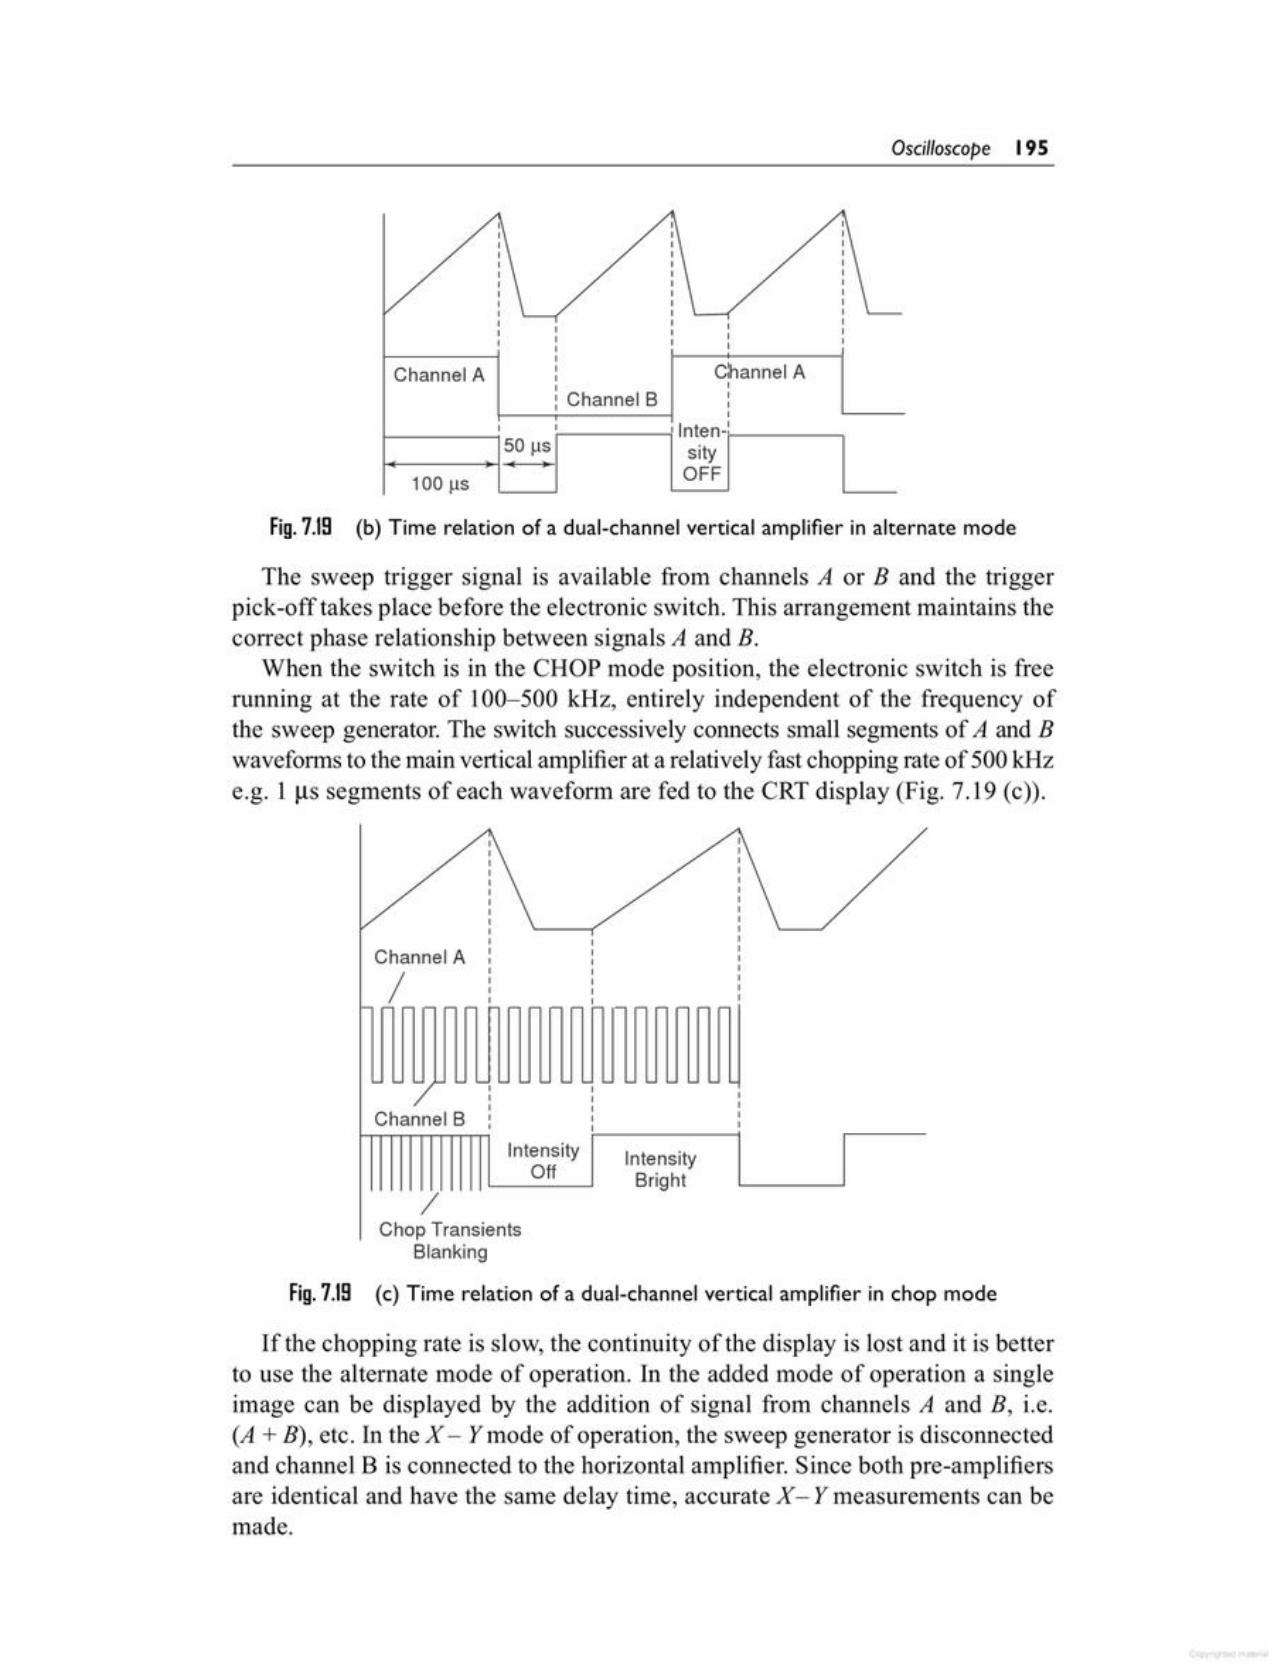
If the chopping rate is slow, the continuity of the display is lost and it is betterto use the alternate mode of operation. In the added mode of operation a singleimage can be displayed by the addition of signal from channels A and B, i.e.(A +B), etc. In the X - Ymode of operation, the sweep generator is disconnectedand channel B is connected to the horizontal amplifier, Since both pre-amplifiersare identical and have the same delay time, accurate X - Y measurements can bemade.
/Chop Transients
Blanking
Fig.7.18 (c) Time relation of a dual-channel vertical amplifier in chop mode
IntensityBright
IntensityOff
ChannelB
Channel A
/
The sweep trigger signal is available from channels A or B and the triggerpick-off takes place before the electronic switch. This arrangement maintains thecorrect phase relationship between signals A and B.
When the switch is in the CHOP mode position, the electronic switch is freerunning at the rate of 100-500 kHz, entirely independent of the frequency ofthe sweep generator. The switch successively connects small segments of A and Bwaveforms to the main vertical amplifier at a relatively fast chopping rate of 500 kHze.g. 1 us segments of each waveform are fed to the CRT display (Fig. 7.19 (c)).
LIIIIIII
: Channel BChannel A Channel A
IIII
i---------l' lnten-];----,50 us sity
~----~~~~~I OFF100 IlS
Fig.7.18 (b) Time relation of a dual-channel vertical amplifier in alternate mode
Oscilloscope 195
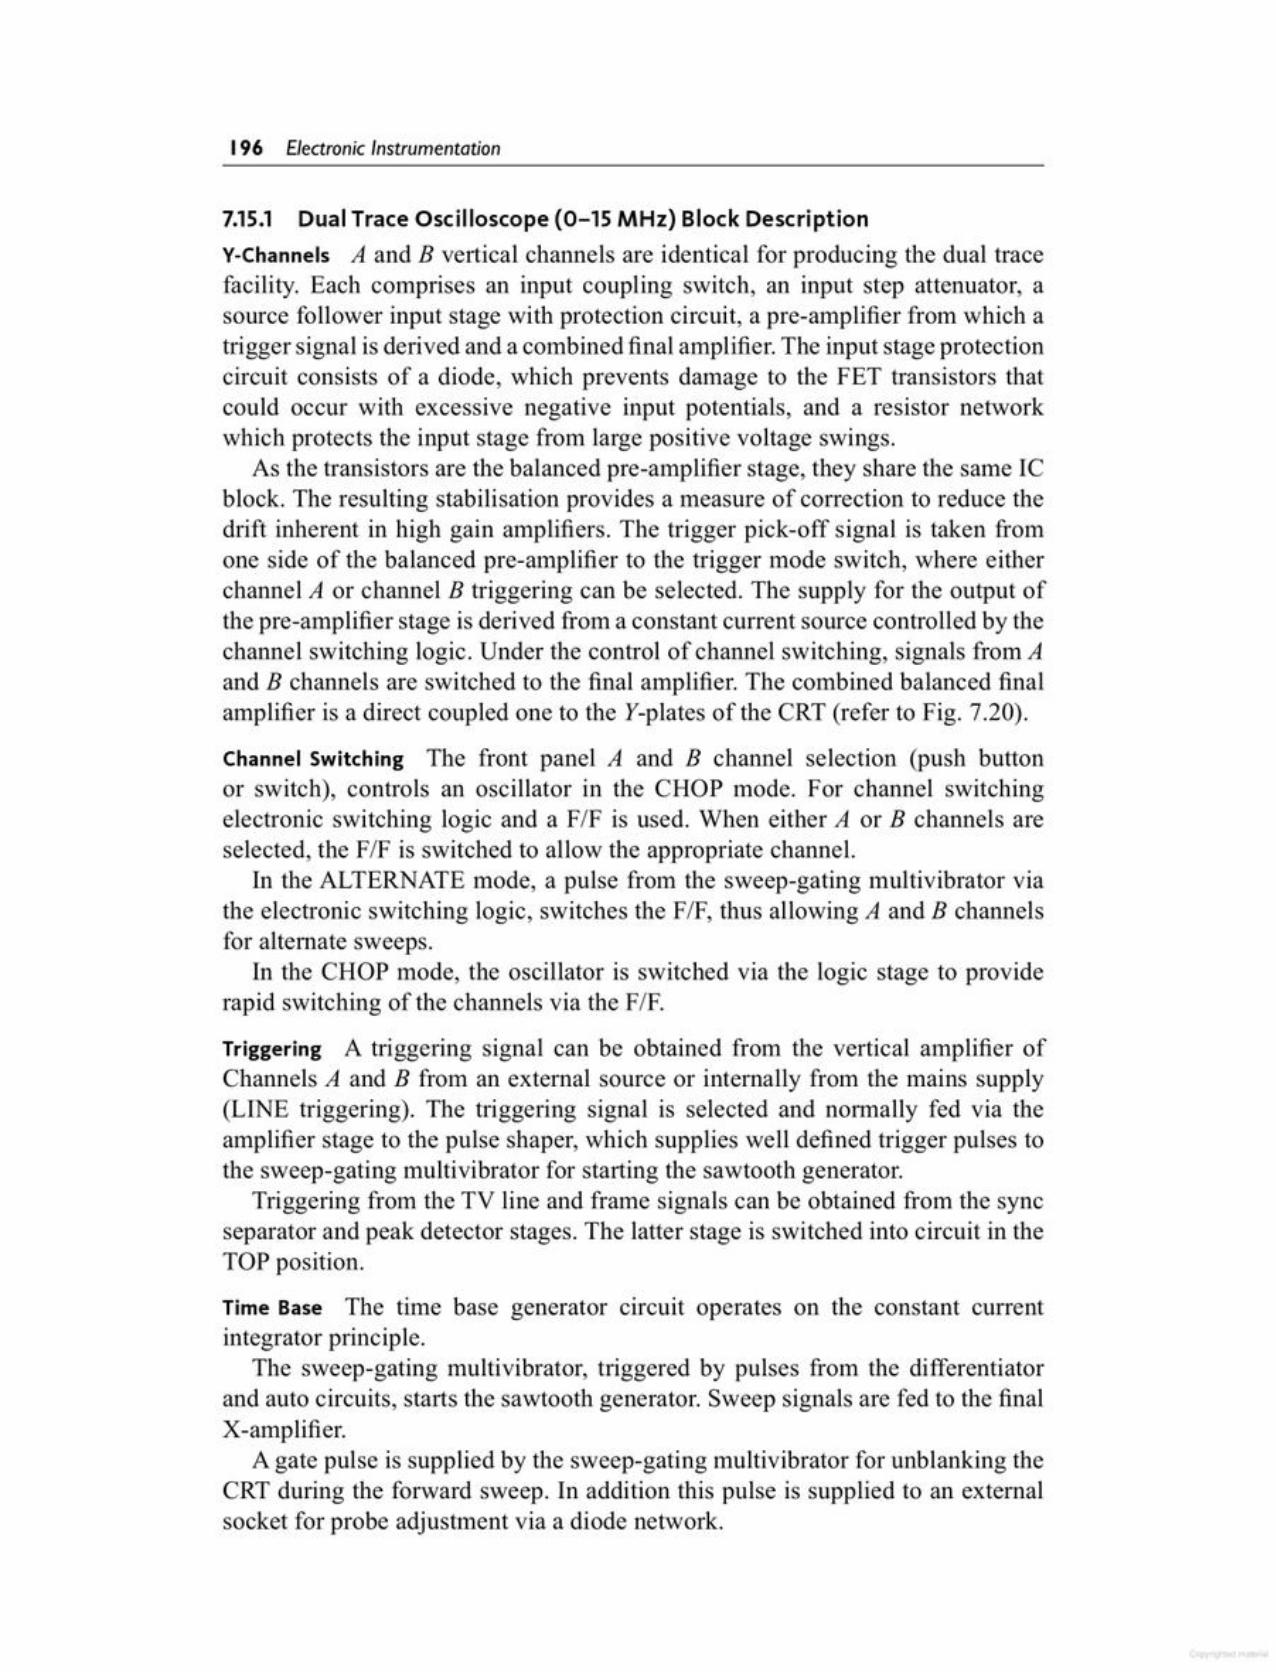
7.15.1 Dual Trace Oscilloscope (0-15 MHz) Block DescriptionY-Channels A and B vertical channels are identical for producing the dual tracefacility. Each comprises an input coupling switch, an input step attenuator, asource follower input stage with protection circuit, a pre-amplifier from which atrigger signal is derived and a combined final amplifier. The input stage protectioncircuit consists of a diode, which prevents damage to the FET transistors thatcould occur with excessive negative input potentials, and a resistor networkwhich protects the input stage from large positive voltage swings.
As the transistors are the balanced pre-amplifier stage, they share the same ICblock. The resulting stabilisation provides a measure of correction to reduce thedrift inherent in high gain amplifiers. The trigger pick-off signal is taken fromone side of the balanced pre-amplifier to the trigger mode switch, where eitherchannel A or channel B triggering can be selected. The supply for the output ofthe pre-amplifier stage is derived from a constant current source controlled by thechannel switching logic. Under the control of channel switching, signals from Aand B channels are switched to the final amplifier. The combined balanced finalamplifier is a direct coupled one to the Y-plates of the CRT (refer to Fig. 7.20).
Channel Switching The front panel A and B channel selection (push buttonor switch), controls an oscillator in the CHOP mode. For channel switchingelectronic switching logic and a FIF is used. When either A or B channels areselected, the FIF is switched to allow the appropriate channel.
In the ALTERNATE mode, a pulse from the sweep-gating multivibrator viathe electronic switching logic, switches the FIF, thus allowing A and B channelsfor alternate sweeps.
In the CHOP mode, the oscillator is switched via the logic stage to providerapid switching of the channels via the FIF.
Triggering A triggering signal can be obtained from the vertical amplifier ofChannels A and B from an external source or internally from the mains supply(LINE triggering). The triggering signal is selected and normally fed via theamplifier stage to the pulse shaper, which supplies well defined trigger pulses tothe sweep-gating multi vibrator for starting the sawtooth generator.
Triggering from the TV line and frame signals can be obtained from the syncseparator and peak detector stages. The latter stage is switched into circuit in theTOP position.
Time Base The time base generator circuit operates on the constant currentintegrator principle.
The sweep-gating multi vibrator, triggered by pulses from the differentiatorand auto circuits, starts the sawtooth generator. Sweep signals are fed to the finalX-amplifier.
A gate pulse is supplied by the sweep-gating multivibrator for unblanking theCRT during the forward sweep. In addition this pulse is supplied to an externalsocket for probe adjustment via a diode network.
196 Electronic Instrumentation
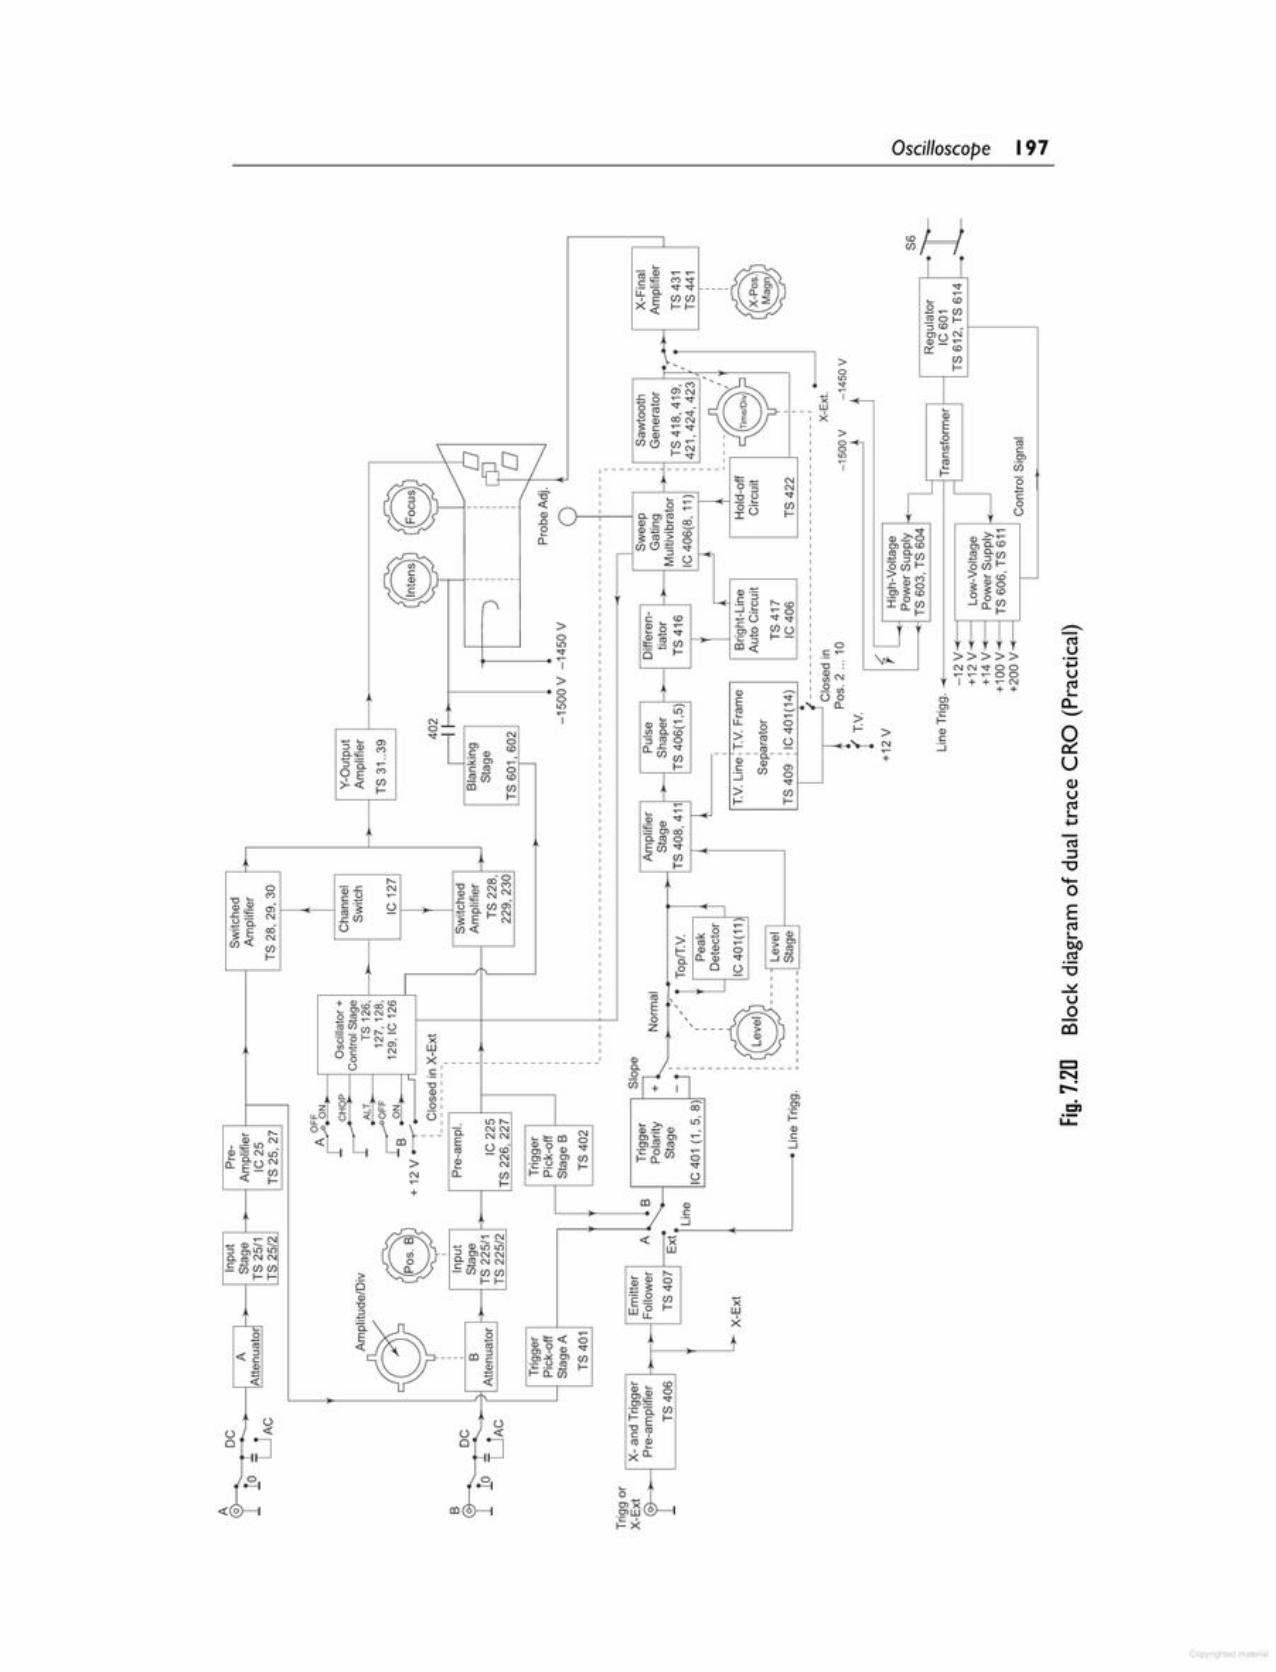
~:::J-0.....oE~I...no.~-0~Uoco
+ +0101
~ec::;
»,_; >....... '"~+
r r..,.~ ;;;B~CI)CIlOI-"3 CD w
OlU N"'-~0: '"(/)
I-
~ Ia;E~
~ J2 OJ'" cc '"s (jj
!I e! c
0o.,~~ Cl>~::01 0.<0
'" a. '"., a.(/) CIla. (/):::J~ ~~I-~ (/) . 5 ....co ~l:~g '""0.2> ~ (0 ~"'"..J 0 (/)J:o.(/) 0.1-I-
U ;iiii"" NN-.;tOO...............001+ + <r"'" N
1 >0.......
;i ,.WX
>s....~,
I
+
on ...Ii NN NE NN ~11:[]) 0u", "'0., -eCIl g~ rne -N (/)
N -c 2 <7J I-0. (/) 1-0.I-
., ~E ,s..!!' ~I.L .9 ~» ~ u_,_; CIl-- ---0.---~ Q) (7).- en 0..J "'1-:> (/),_; I-
>ll==~_~~"I
>~ -4~
"I
'0:~N.Q",uo0.
Q):'!::c... c ::> .... '",_ "-oJ .~ ~o,.!.u ......'5,0 (/)u'c - 1--[])~ 0.E _.
.-------,,,,
~ _, -------,
~-~"~~rn-~ -...co N ,i~... ~.... ,(/) ~ ,I-N 'r------~,L__...__....:...J ,------_.
«0
! + '0... 'O~<O("')0 -.c N Q)Q)~NM ., o ~-gjJ c_ '5 ~ (/)a)0) i'~ ~ -o.~N£~ N .c(/)'" E N~~ oi o (/)«
~« '"(/)I-
~______"\-L CJ 7m~------' ~e
0.
197Oscilloscope
0.2 s/Div to 0.5 s/Div in 2 x 9calibrated steps (1-2-5 sequence) with5 x magnifier, max. 0.1 us/DivUncalibrated continuous control1 : > 2,5
Coefficient error : + 5%Additional error for x 5 magnifier : + 2%
Deflection accuracyInput impedanceMaximum rated input voltageChopper frequencyTime BaseTilue coefficients
A, A and B, B (chopped in IUS)
(alternated in us)ACIDCBandwidth DC - 0 - 15 MHz (- 3db)AC - 10 Hz - 15 MHz (- 3db)
: +5%: 1MQ/35 pF: 400 V (de + ac peak) (no damage)120 kHz approximately
Input coupling
: 8x 10Div(1 cm= 1Div):B310r3B12kV
Measuring areaScreen typeTotal acceleration voltageVertical AmplifierDisplay modes
7.15.2 Dual Trace eRO SpecificationsMaximum sensitivity : 5 mV/div and B.W. 15 MHzOperating temperature : + 5° to 40°CCRT
Cathode-Ray Tube Circuit and Power Supply The high voltages required for theCRT, which has an acceleration potential of 1.5 kV, are generated by a voltagemultiplier circuit controlled by a stabilised power supply. The CRT beam currentis controlled by:
The intensity potentials network across the Extra High Tension (EHT) supply.During flyback (movement of electron beam from right to left) by the blankingpulses coming from the sawtooth generator via the beam blanking stages to blankthe trace during right to left movement of the electron.
Regulation of the mains input voltage is achieved by a diode clipper networkcontrolled by a signal fed back from an LED in the + 14 V rectifier supply.
X-Channel Under the control of diode switching from the TIME/DIV switch, theX-amplifier receives its input signal from either the time base sawtooth generatoror from an external source (X-EXT input socket via the X and trigger preamplifier). The X-MAGN (x 5) circuit is incorporated in the X-final amplifier.The output of this amplifier is direct coupled to the horizontal deflection platesof the CRT.
198 Electronic Instrumentation
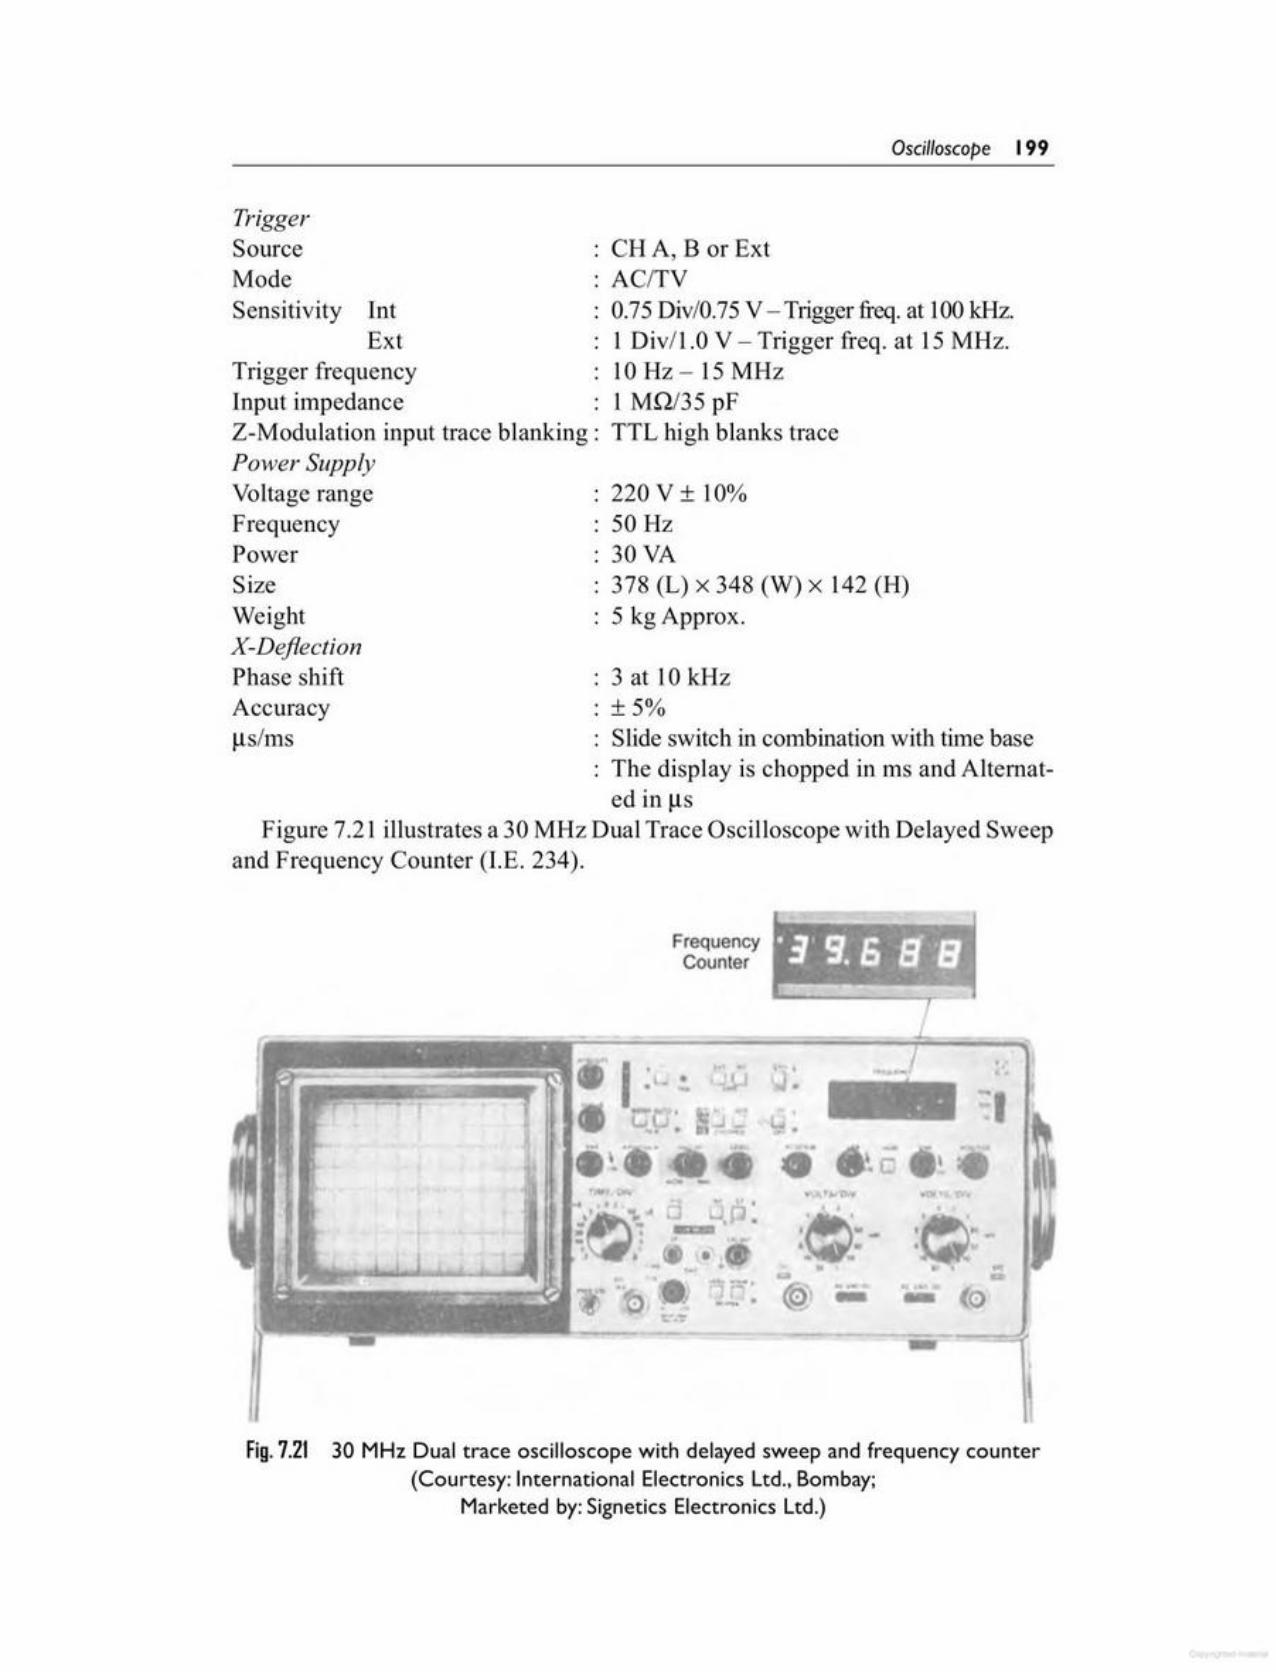
Fig.7.21 30 MHz Dual trace oscilloscope with delayed sweep and frequency counter(Courtesy: International Electronics Ltd., Bombay;
Marketed by:Signetics Electronics Ltd.)
(0~..-
'" r~., ~
--
~'fr.." '.__I. •• •li '"' .~. ~........~-
•
FrequencyCounter
: +5%: Slide switch in combination with time base: The display is chopped in ms and ALternated in Ils
Figure 7.21 illustrates a 30 MHz Dual Trace Oscilloscope with Delayed Sweepand Frequency Counter (I.E. 234).
Accuracyus/ms
3 at 10kHz
220 V + 10%50Hz30 VA378 (L) x 348 (W) x 142 (H)5 kg Approx.
SizeWeightX-DeflectionPhase shift
0.75Div/0.75V - Trigger freq. at 100kHz.1 Div/1.0 V - Trigger freq. at 15 MHz.10 Hz-IS MHz1MQ/35 pFTTL high blanks trace
: CHA, B or Ext: AC/TV
TriggerSourceModeSensitivity Int
ExtTrigger frequencyInput impedanceZ-Modulation input trace blanking:Power SupplyVoltage rangeFrequencyPower
Oscilloscope 199
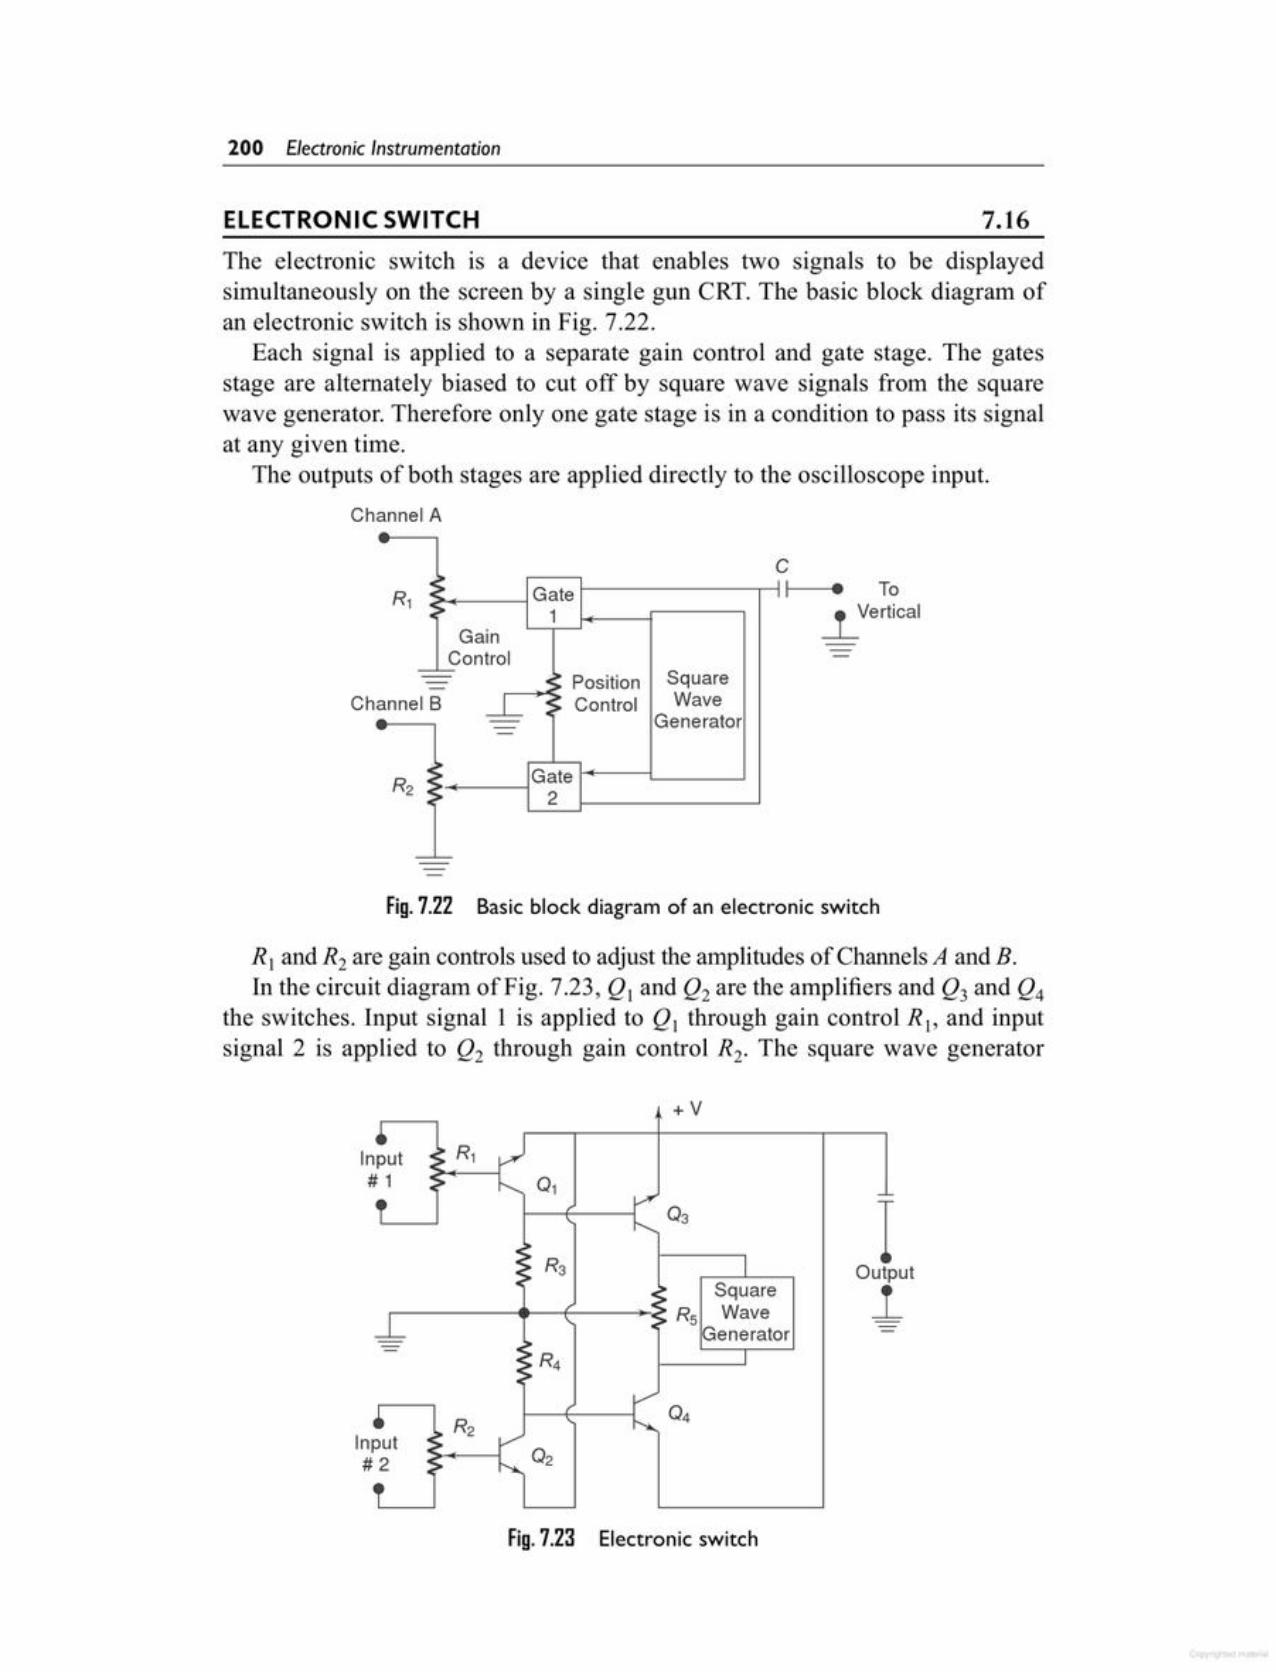
Fig.7.23 Electronic switch
+V
Input# 1 01
03 IR3 Output
Square j_R5 Wave
GeneratorR4
04Input#2
RJ and R2 are gain controls used to adjust the amplitudes of Channels A and B.In the circuit diagram of Fig. 7.23, QJ and Q2 are the amplifiers and Q3 and Q4
the switches. Input signal 1 is applied to Q! through gain control R!, and inputsignal 2 is applied to Q2 through gain control R2. The square wave generator
Fig.7.22 Basic block diagram of an electronic switch
CI • To
_l_Verticalc~
I
R1 : Gate I
> 1•Gain
Control== c~ Position Square--annel B j..._ ~:: Control Wave
Generator--
R : : Gate2 ..> 2•
- -
Ch
The electronic switch is a device that enables two signals to be displayedsimultaneously on the screen by a single gun CRT. The basic block diagram ofan electronic switch is shown in Fig. 7.22.
Each signal is applied to a separate gain control and gate stage. The gatesstage are alternately biased to cut off by square wave signals from the squarewave generator. Therefore only one gate stage is in a condition to pass its signalat any given time.
The outputs of both stages are applied directly to the oscilloscope input.
Channel A
7.16ELECTRONIC SWITCH
200 Electronic Instrumentation
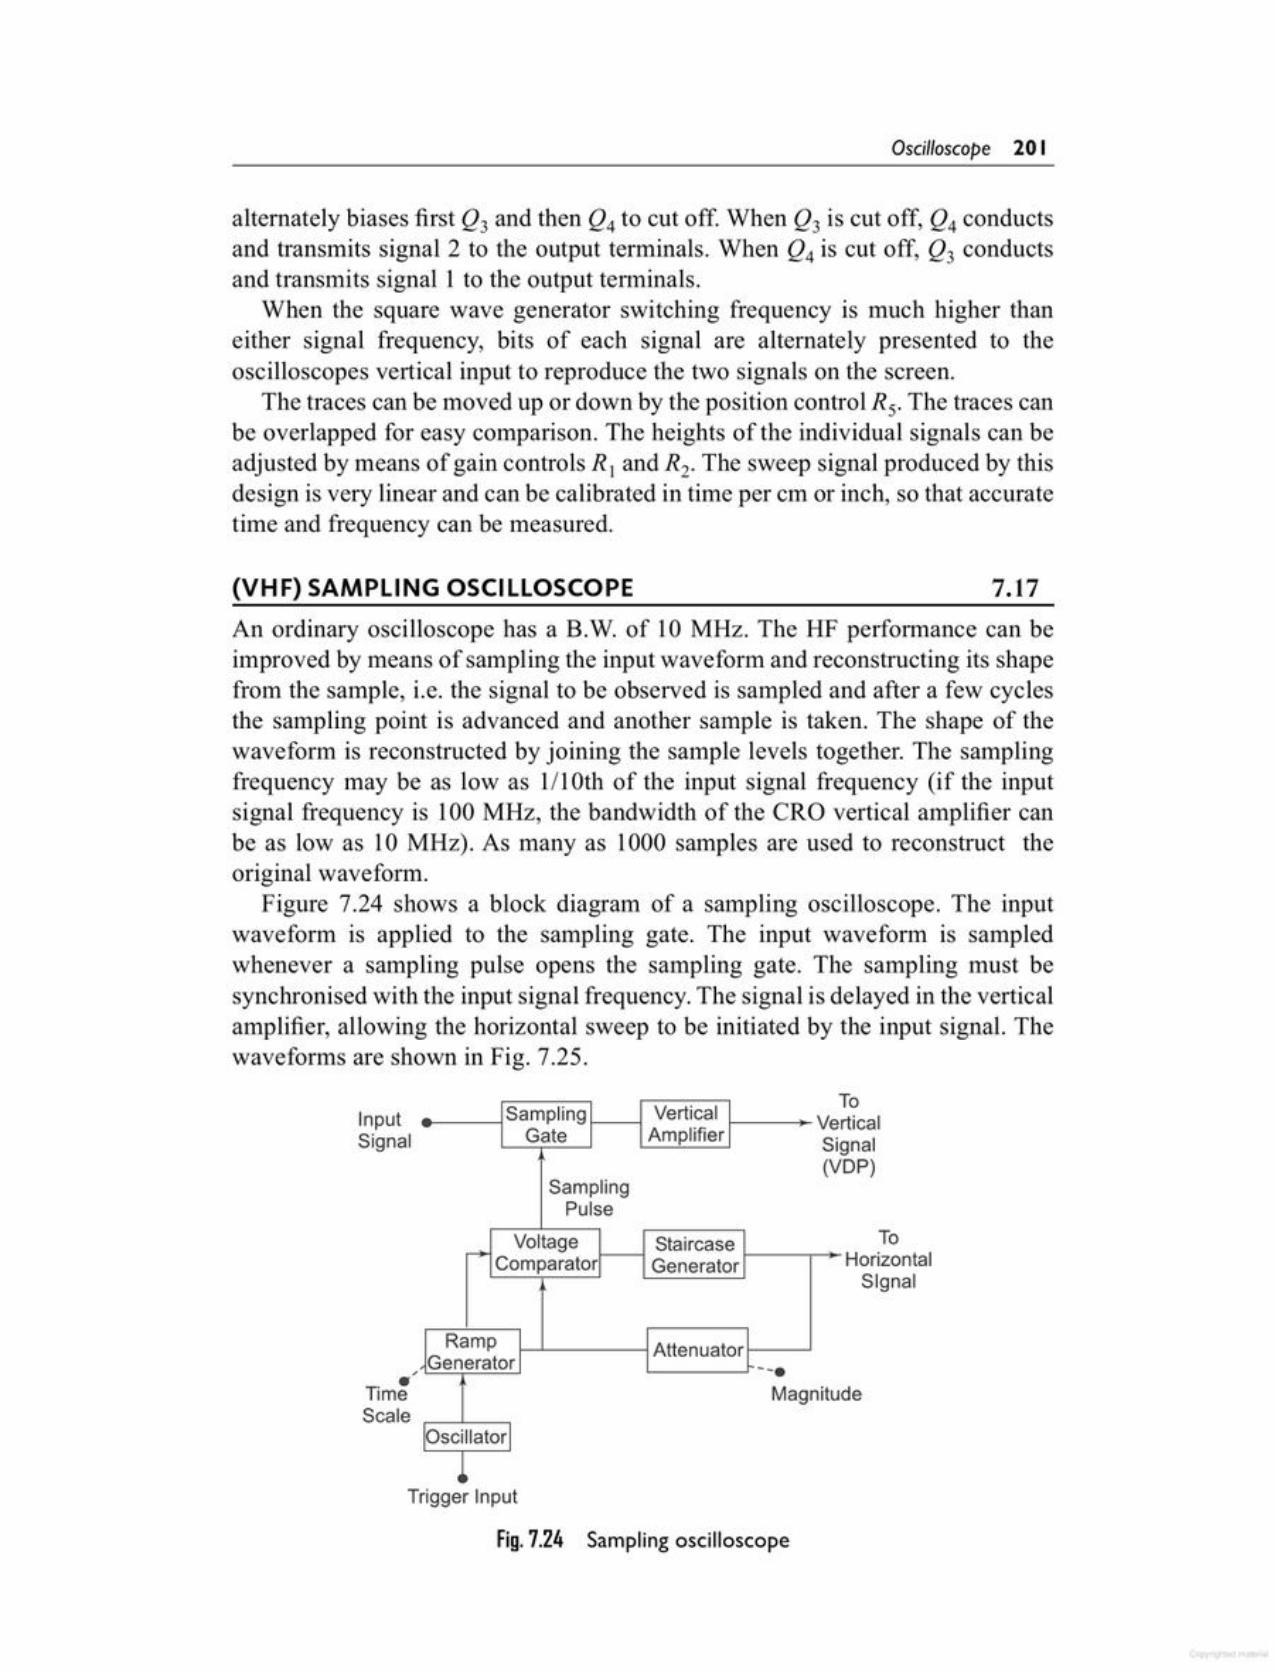
Trigger Input
Fig.7.24 Sampling oscilloscope
de
ToHorizontalSignal
InputSignal
TorticalgnalDP)
Sampling Vertical VeGate Amplifier Si
(VSamplingPulse- Voltage Staircase
Comparator Generator
Ramp AttenuatorGenerator --.Magnitu
Oscillator I~
,•TimeScale
An ordinary oscilloscope has a B.W. of 10 MHz. The HF performance can beimproved by means of sampling the input waveform and reconstructing its shapefrom the sample, i.e. the signal to be observed is sampled and after a few cyclesthe sampling point is advanced and another sample is taken. The shape of thewaveform is reconstructed by joining the sample levels together. The samplingfrequency may be as low as 1II Oth of the input signal frequency (if the inputsignal frequency is 100 MHz, the bandwidth of the eRO vertical amplifier canbe as low as 10 MHz). As many as 1000 samples are used to reconstruct theoriginal waveform.
Figure 7.24 shows a block diagram of a sampling oscilloscope. The inputwaveform is applied to the sampling gate. The input waveform is sampledwhenever a sampling pulse opens the sampling gate. The sampling must besynchronised with the input signal frequency. The signal is delayed in the verticalamplifier, allowing the horizontal sweep to be initiated by the input signal. Thewaveforms are shown in Fig. 7.25.
7.17(VHF) SAMPLING OSCILLOSCOPE
alternately biases first Q3 and then Q4 to cut off. When Q3 is cut off, Q4 conductsand transmits signal 2 to the output terminals. When Q4 is cut off, Q3 conductsand transmits signal 1 to the output terminals.
When the square wave generator switching frequency is much higher thaneither signal frequency, bits of each signal are alternately presented to theoscilloscopes vertical input to reproduce the two signals on the screen.
The traces can be moved up or down by the position control Rs. The traces canbe overlapped for easy comparison. The heights of the individual signals can beadjusted by means of gain controls R 1 and R2. The sweep signal produced by thisdesign is very linear and can be calibrated in time per CIU or inch, so that accuratetime and frequency can be measured.
Oscilloscope 20 I
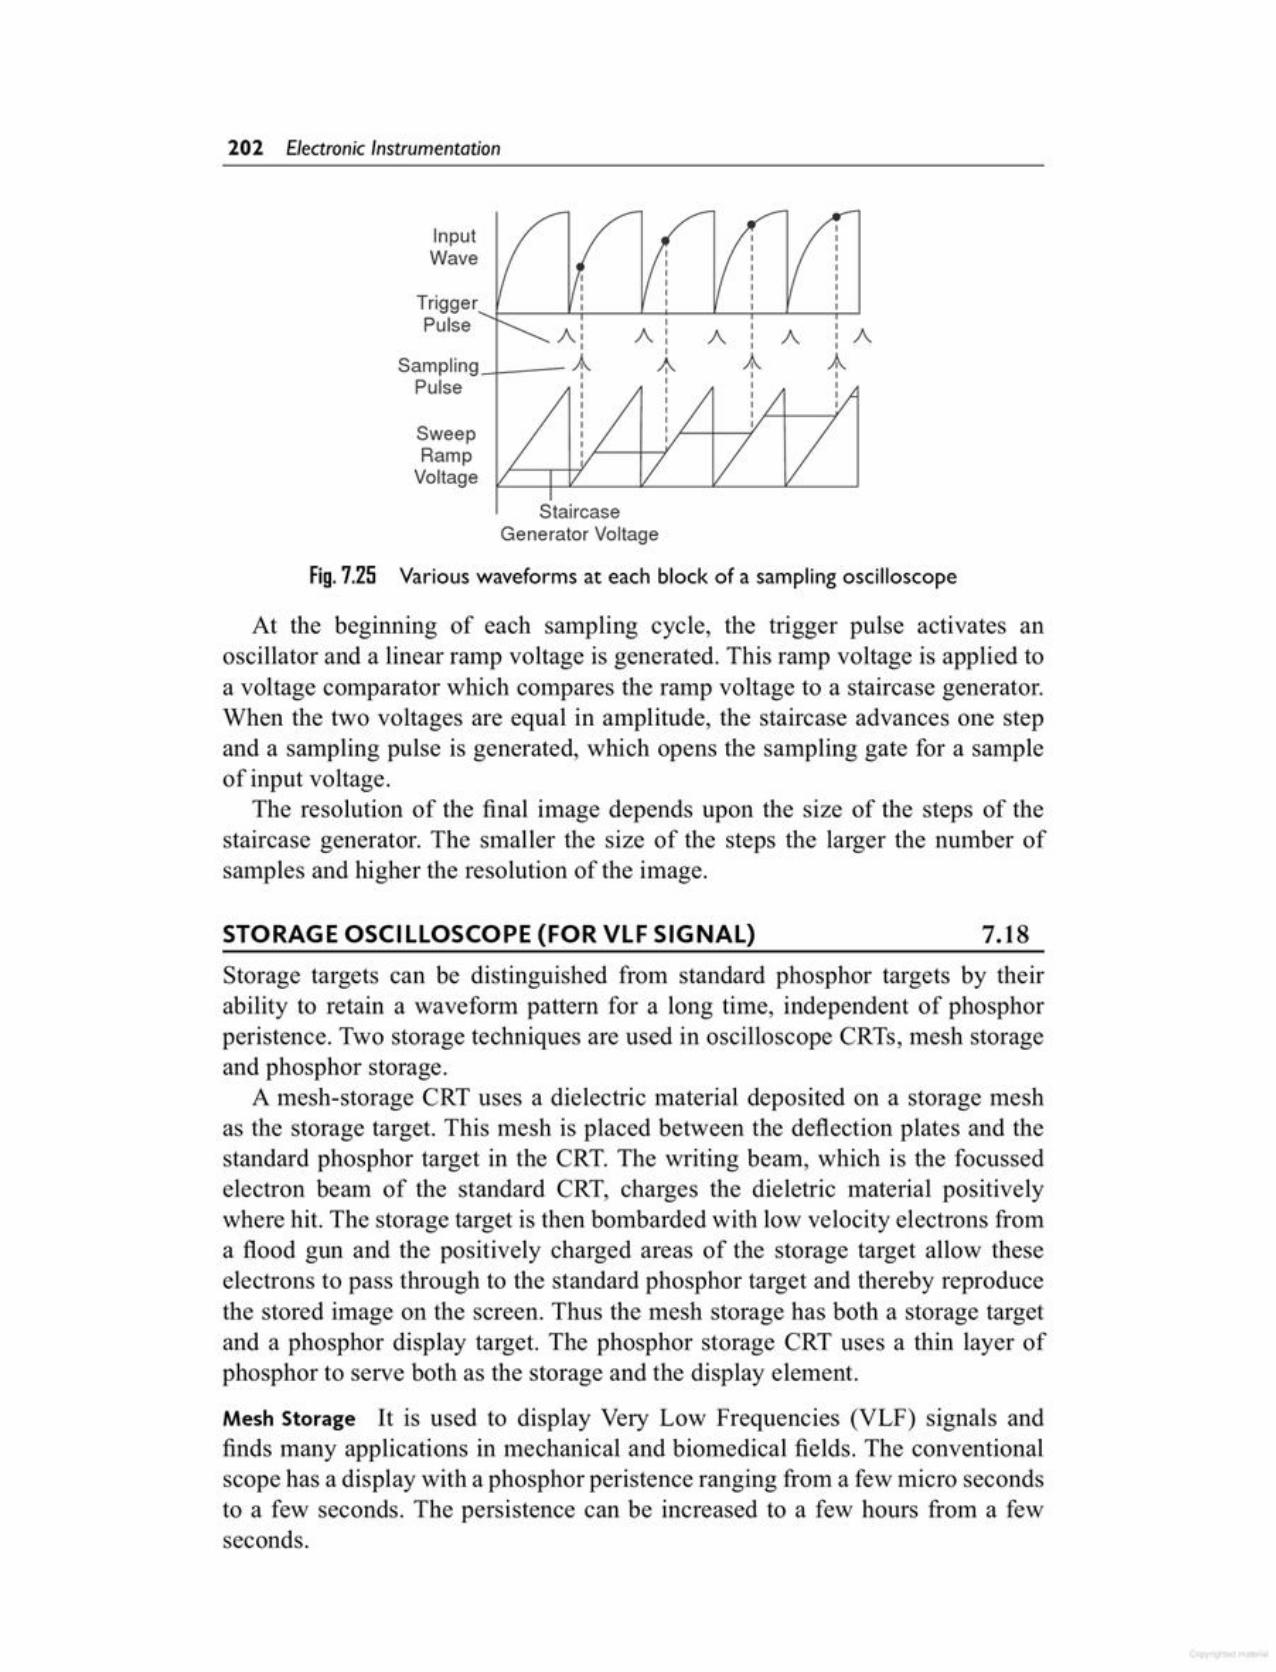
Storage targets can be distinguished from standard phosphor targets by theirability to retain a waveform pattern for a long time, independent of phosphorperistence. Two storage techniques are used in oscilloscope CRTs, mesh storageand phosphor storage.
A mesh-storage CRT uses a dielectric material deposited on a storage meshas the storage target. This mesh is placed between the deflection plates and thestandard phosphor target in the CRT. The writing beam, which is the focussedelectron beam of the standard CRT, charges the dieletric material positivelywhere hit. The storage target is then bombarded with low velocity electrons froma flood gun and the positively charged areas of the storage target allow theseelectrons to pass through to the standard phosphor target and thereby reproducethe stored image on the screen. Thus the mesh storage has both a storage targetand a phosphor display target. The phosphor storage CRT uses a thin layer ofphosphor to serve both as the storage and the display element.
Mesh Storage It is used to display Very Low Frequencies (VLF) signals andfinds many applications in mechanical and biomedical fields. The conventionalscope has a display with a phosphor peristence ranging from a few micro secondsto a few seconds. The persistence can be increased to a few hours from a fewseconds.
7.18STORAGE OSCILLOSCOPE (FOR VLF SIGNAL)
At the beginning of each sampling cycle, the trigger pulse activates anoscillator and a linear ramp voltage is generated. This ramp voltage is applied toa voltage comparator which compares the ramp voltage to a staircase generator.When the two voltages are equal in amplitude, the staircase advances one stepand a sampling pulse is generated, which opens the sampling gate for a sampleof input voltage.
The resolution of the final image depends upon the size of the steps of thestaircase generator. The smaller the size of the steps the larger the number ofsamples and higher the resolution of the image.
Fig. 7.25 Various waveforms at each block of a sampling oscilloscope
StaircaseGenerator Voltage
:AI
AA A
ASampling-l- __Pulse
InputWave
SweepRampVoltage
202 Electronic Instrumentation
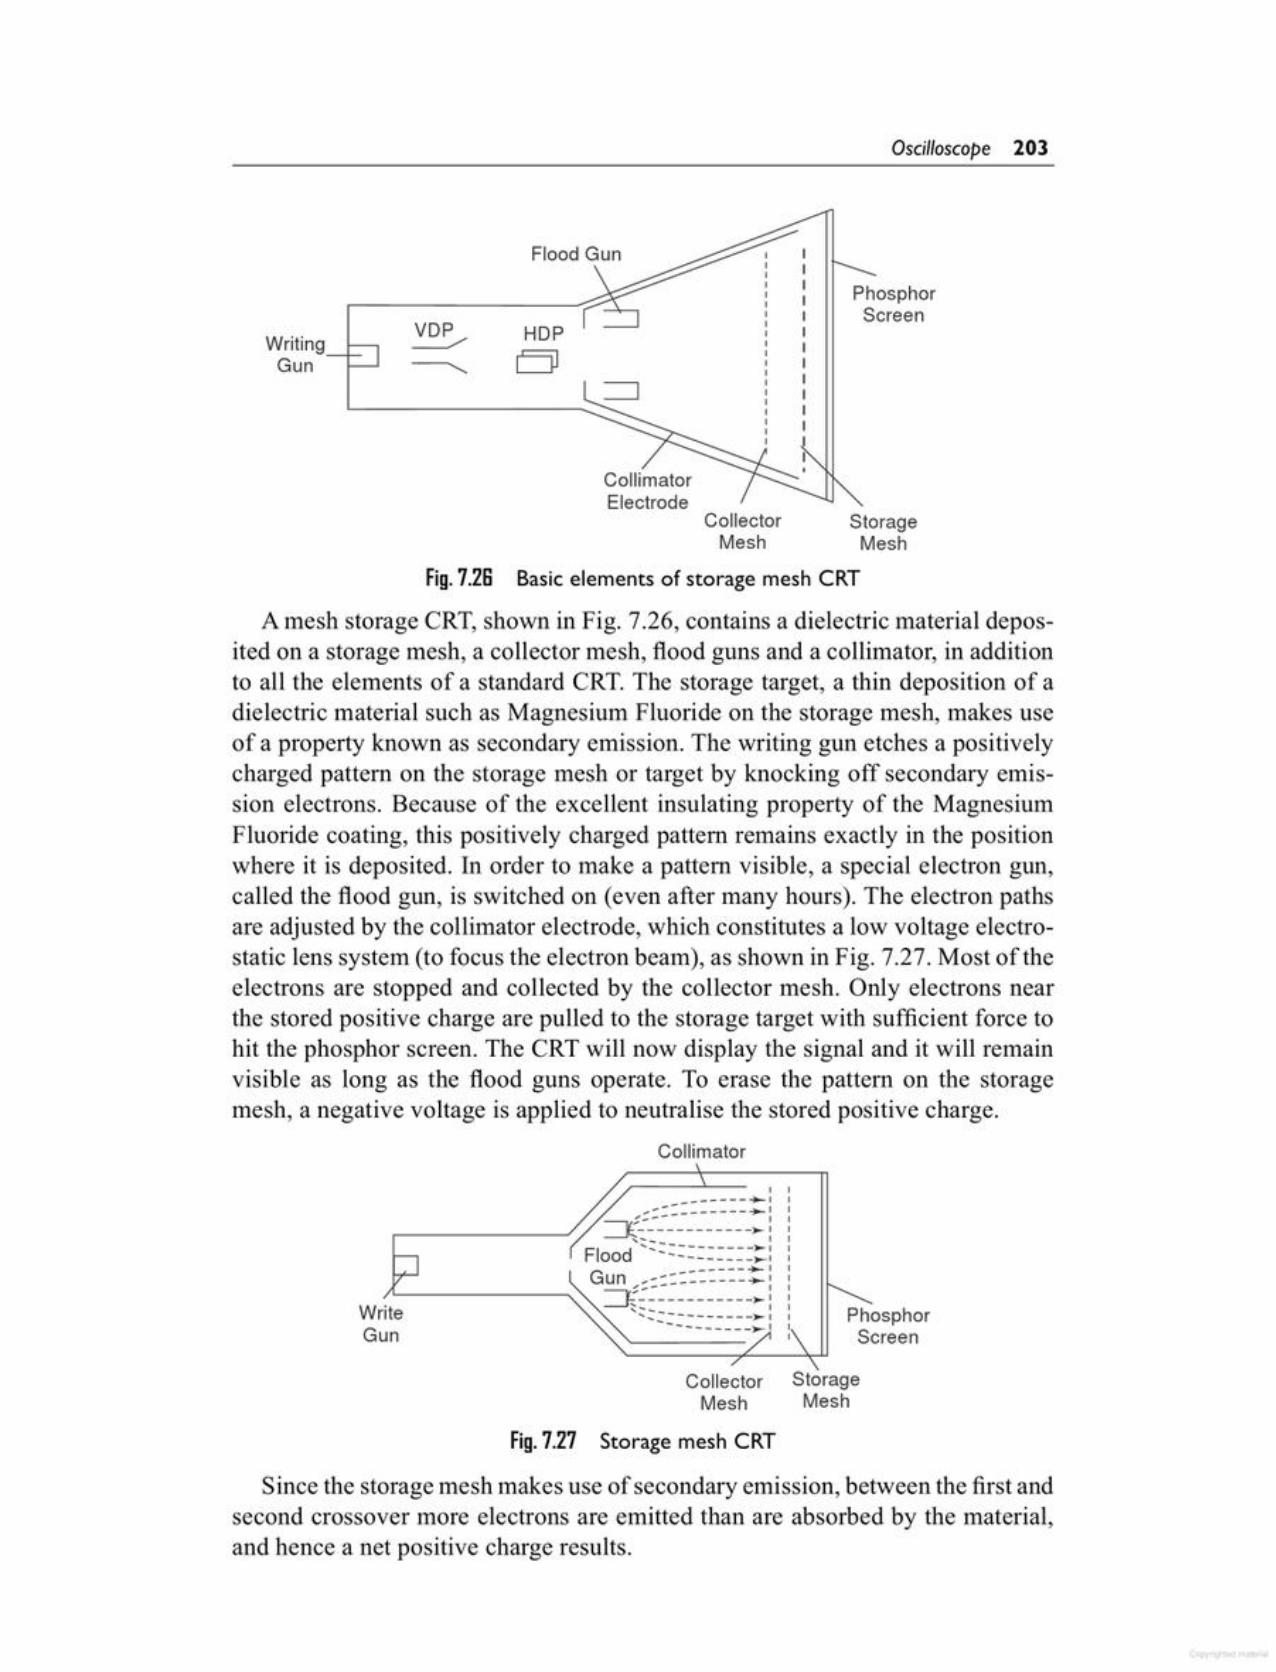
Fig. 7.27 Storage mesh CRT
Since the storage mesh makes use of secondary emission, between the first andsecond crossover more electrons are emitted than are absorbed by the material,and hence a net positive charge results.
Collector StorageMesh Mesh
WriteGun
,_--------+-1, ... --- - ... 1
:_-- I~------------~,~...... I......----------~IFlood ----------.,...,_____*" IGun ,~::::::------:~------------~,~..._ I
"'-:::::::::::::~: PhosphorScreen
Collimator
Fig. 7.2S Basic elements of storage mesh CRT
A mesh storage CRT, shown in Fig. 7.26, contains a dielectric material deposited on a storage mesh, a collector mesh, flood guns and a collimator, in additionto all the elements of a standard CRT. The storage target, a thin deposition of adielectric material such as Magnesium Fluoride on the storage mesh, makes useof a property known as secondary emission. The writing gun etches a positivelycharged pattern on the storage mesh or target by knocking off secondary emission electrons. Because of the excellent insulating property of the MagnesiumFluoride coating, this positively charged pattern remains exactly in the positionwhere it is deposited. In order to make a pattern visible, a special electron gun,called the flood gun, is switched on (even after many hours). The electron pathsare adjusted by the collimator electrode, which constitutes a low voltage electrostatic lens system (to focus the electron beam), as shown in Fig. 7.27. Most of theelectrons are stopped and collected by the collector mesh. Only electrons nearthe stored positive charge are pulled to the storage target with sufficient force tohit the phosphor screen. The CRT will now display the signal and it will remainvisible as long as the flood guns operate. To erase the pattern on the storagemesh, a negative voltage is applied to neutralise the stored positive charge.
StorageMesh
CollectorMesh
CollimatorElectrode
HOPoWritingGun
PhosphorScreen
Flood Gun
Oscilloscope 203
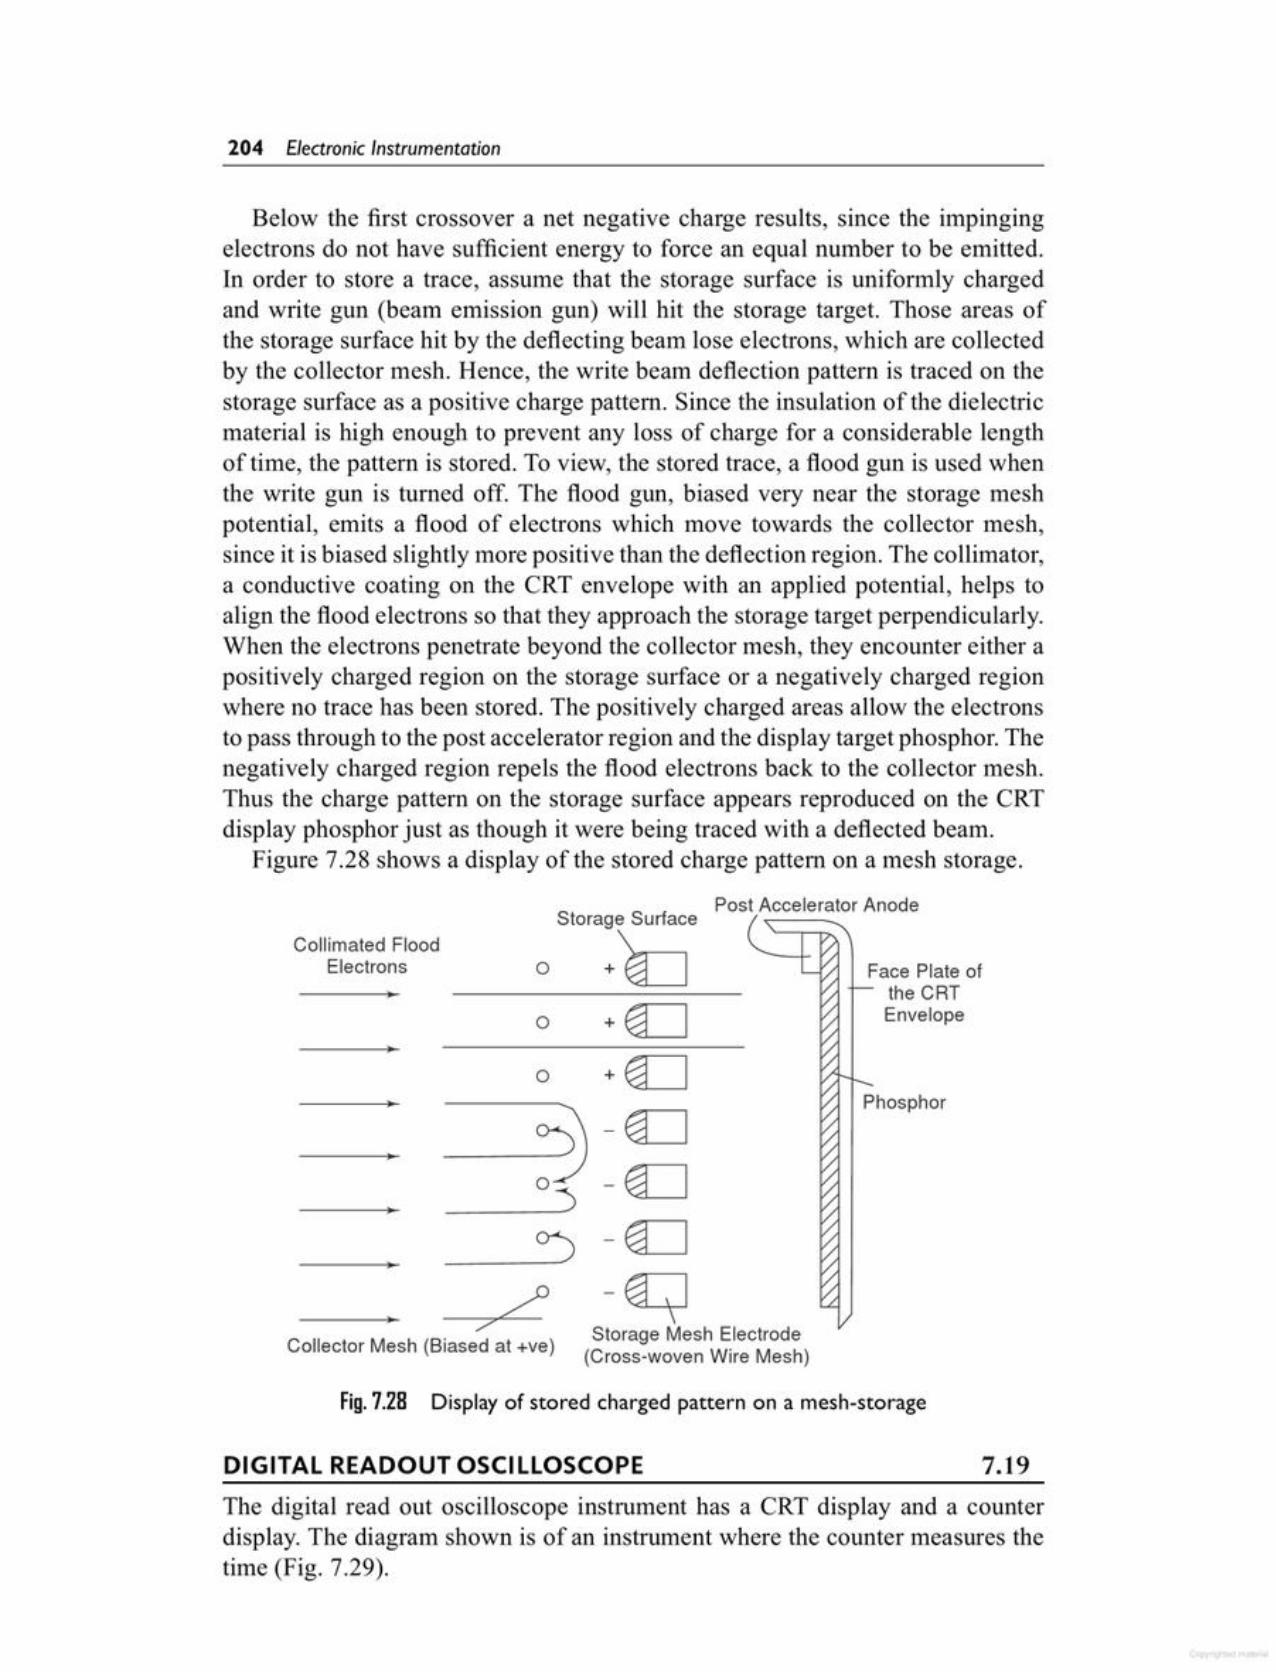
The digital read out oscilloscope instrument has a CRT display and a counterdisplay. The diagram shown is of an instrument where the counter measures thetime (Fig. 7.29).
7.19DIGITAL READOUT OSCI LLOSCOPE
Fig. 7.28 Displayof stored charged pattern on a mesh-storage
+~
-~
-~
-~
-~Storage Mesh Electrode(Cross-woven Wire Mesh)
;;Collector Mesh (Biased at -ve)
o
Face Plate ofthe CRTEnvelopeo
Collimated FloodElectrons
Post Accelerator Anode
Below the first crossover a net negative charge results, since the impingingelectrons do not have sufficient energy to force an equal number to be emitted.In order to store a trace, assume that the storage surface is uniformly chargedand write gun (beam emission gun) will hit the storage target. Those areas ofthe storage surface hit by the deflecting beam lose electrons, which are collectedby the collector mesh. Hence, the write beam deflection pattern is traced on thestorage surface as a positive charge pattern. Since the insulation of the dielectricmaterial is high enough to prevent any loss of charge for a considerable lengthof time, the pattern is stored. To view, the stored trace, a flood gun is used whenthe write gun is turned off. The flood gun, biased very near the storage meshpotential, emits a flood of electrons which move towards the collector mesh,since it is biased slightly more positive than the deflection region. The collimator,a conductive coating on the CRT envelope with an applied potential, helps toalign the flood electrons so that they approach the storage target perpendicularly.When the electrons penetrate beyond the collector mesh, they encounter either apositively charged region on the storage surface or a negatively charged regionwhere no trace has been stored. The positively charged areas allow the electronsto pass through to the post accelerator region and the display target phosphor. Thenegatively charged region repels the flood electrons back to the collector mesh.Thus the charge pattern on the storage surface appears reproduced on the CRTdisplay phosphor just as though it were being traced with a deflected beam.
Figure 7.28 shows a display of the stored charge pattern on a mesh storage.
204 Electronic Instrumentation

Fig. 7.30 Voltage to time conversion
_/]_0% StartVoltage ComparatorMemory
,/ LinearClock uuSampled 1 MHz
Gate 0000 RampSignal Clock I GeneratorCounter./ Clock
PulseVoltage s4- 1000/0 _/]_. ,
11111 Voltage Stop~ .._ComparatorTime Memory
Fig, 7,29 Block diagram of a digital readout oscilloscope when measuring voltage
The input waveform is sampled and the sampling circuit advances thesampling position in fixed increments, a process called strobing, The equivalenttime between each sample depends on the numbers of sample taken per em andon the sweep time/ern, e.g. a sweep rate of 1 nano-sec/cm and a sampling rate of100 samples/em gives a time of 10 pico-sec/sample.
Figure 7,29 shows a block diagram of a digital read out oscilloscope whenmeasuring voltage,
Two intensified portions of the CRT trace identify 0% and 100% zonesposition, Each zone can be shifted to any part of the display, The voltage dividertaps between the 0% and 1000/0memory voltage are set for start and stop timing.The coincidence of any of the input waveforms with the selected percentagepoint is sensed by this voltage comparator, The numbers of the clock pulse whichcorrespond to the actual sample taken are read out digitally in a Nixie displaytube in ns, us, ms or seconds.
Figure 7.30 shows a block diagram of a digital readout CRO when used forvoltage to time conversion.
StopComparator
CloseGate
Counter
Clock JlJl l 0 0 0 0 IGate
OpenGate
100%
Voltage _MemoryCircuit
StartComparator
Sampled t-'-~Signal
Time >I /,Interval ~.-+-___J
u~I ,
0%Voltage 1------,
Memory
Oscilloscope 205

7.20.1 Measurement ProcedureSet up the oscilloscope and switch off the internal sweep (change to Ext).Switch off sync control. Connect the signal source as given in Fig. 7.33. Setthe horizontal and vertical gain control for the desired width and height of thepattern. Keep frequency f~constant and vary frequency fh, noting that the patternspins in alternate directions and changes shape. The pattern stands still whenevert; and fh are in an integral ratio (either even or odd). The t.=fh pattern stands stilland is a single circle or ellipse. When fv = 2111' a two loop horizontal pattern isobtained as shown in Fig. 7.31.
To determine the frequency from any Lissajous figure, count the number ofhorizontal loops in the pattern, divide it by the number of vertical loops andmultiply this quantity by fh (known or standard frequency).
In Fig. 7.31 (g), there is one horizontal loop and 3 vertical loops, giving a fractionof 1/3. The unknown frequency Iv is therefore 1/3 fh. An accurately calibrated,variable frequency oscillator will supply the horizontal search frequency forfrequency measurement. For the case where the two frequencies are equal and inphase, the pattern appears as a straight line at an angle of 45° with the horizontal.As the phase between the two alternating signals changes, the pattern changes
MEASUREMENT OF FREQUENCY BY LISSAJOUS METHOD 7.20The oscilloscope is a sensitive indicator for frequency and phase measurements.The techniques used are simple and dependable, and measurement may be madeat any frequency in the response range of the oscilloscope.
One of the quickest methods of determining frequency is by using Lissajouspatterns produced on a screen. This particular pattern results when sine wavesare applied simultaneously to both pairs of the deflection plates. If one frequencyis an integral multiple (harmonic) of the other, the pattern will be stationary, andis called a Lissajous figure.
In this method of measurement a standard frequency is applied to one set ofdeflection plates of the CRT tube while the unknown frequency (of approximatelythe same amplitude) is simultaneously applied to the other set of plates. However,the unknown frequency is presented to the vertical plates and the known frequency(standard) to the horizontal plates. The resulting patterns depend on the integraland phase relationship between the two fi·equencies. (The horizontal signal isdesignated as/h and the vertical signal asfv.)
Typical Lissajous figures are shown in Figs 7.31 and 7.32 for sinusoidalfrequencies which are equal, integral and in ratio.
The CRT display is obtained by sampling the 0% reference voltage as chosenby the memory circuit. A linear ramp generator produces a voltage; when theramp voltage equals the 0% reference the gate opens. When the ralnp equals100% reference the gate closes. The number of clock pulses that activate thecounter is directly proportional to the voltage between the selected reference andis read out in mV or volts by the Nixie tube display.
206 Electronic Instrumentation
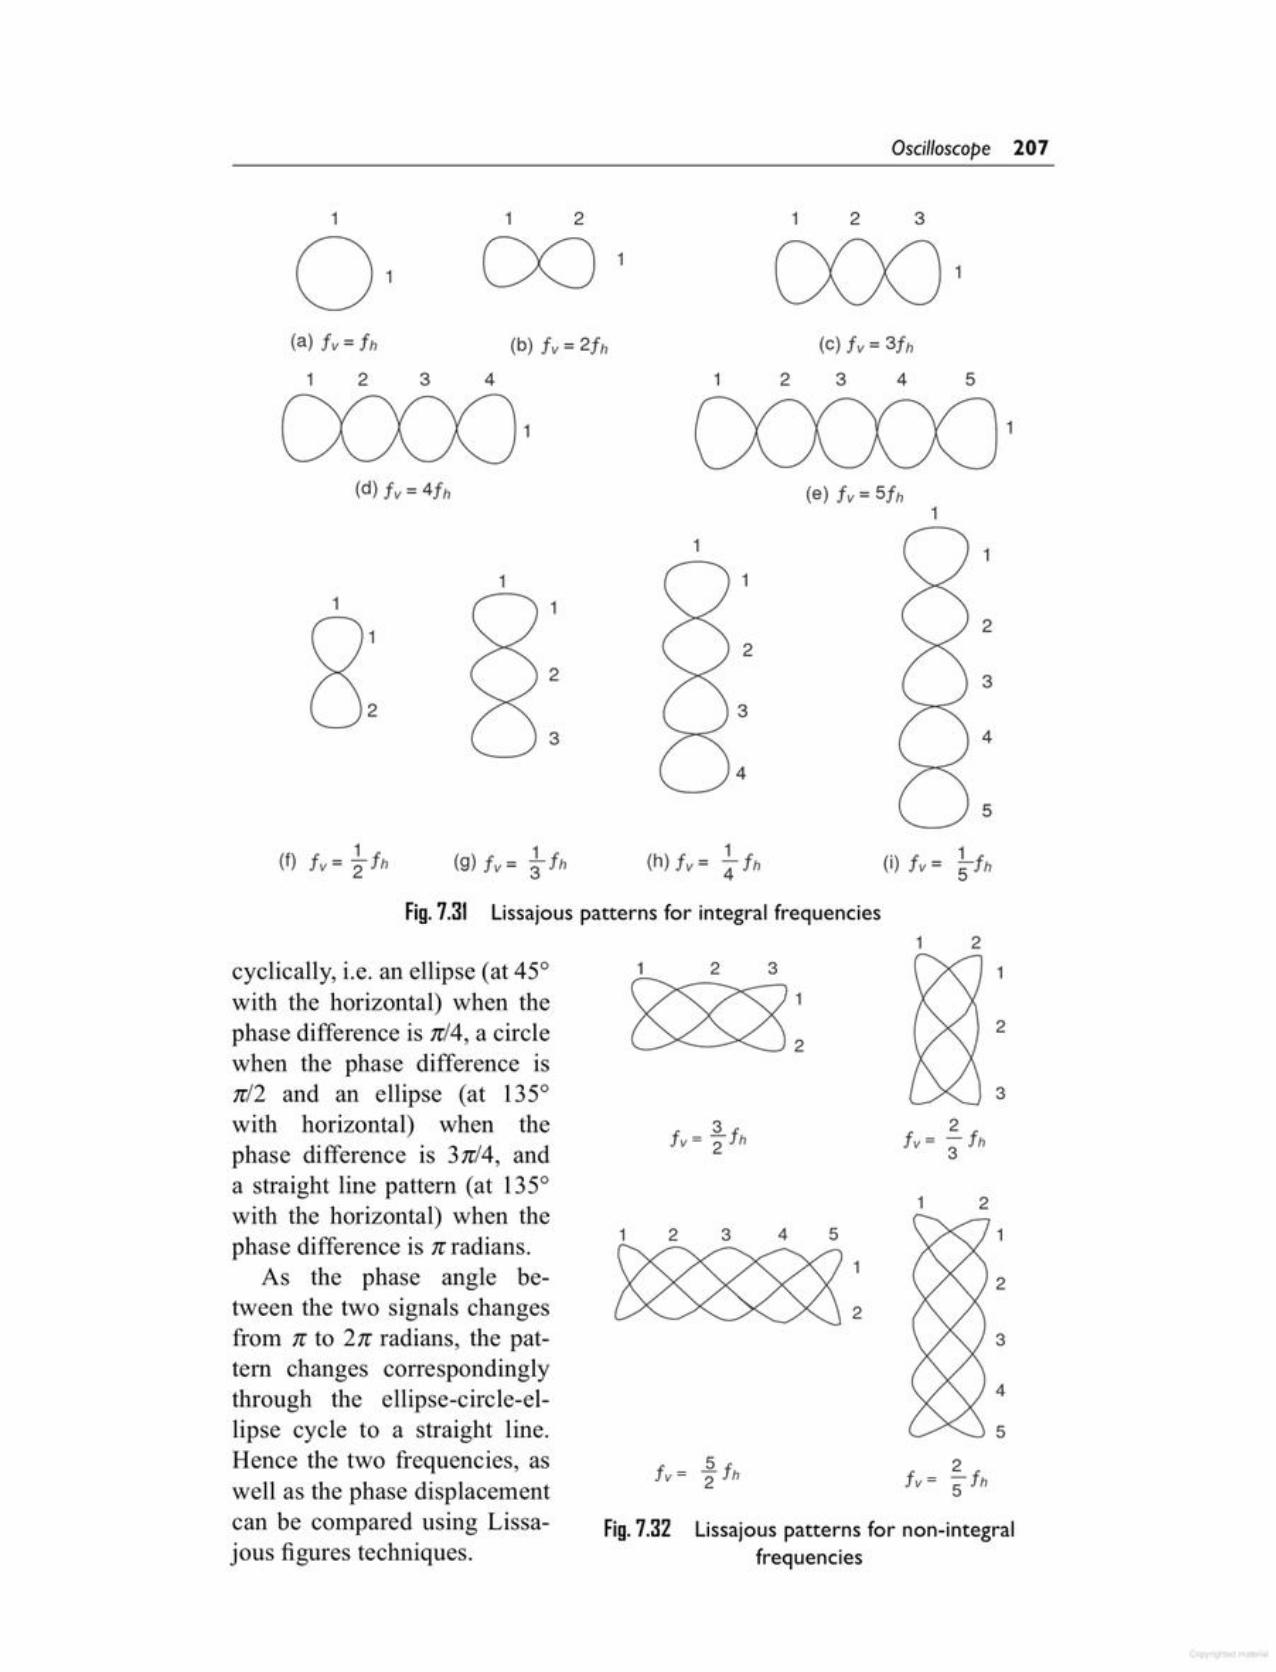
22
321cyclically, i.e. an ellipse (at 450with the horizontal) when thephase difference is n14,a circlewhen the phase difference isnl2 and an ellipse (at 1350with horizontal) when thephase difference is 3n14, anda straight line pattern (at 1350with the horizontal) when thephase difference is n radians.
As the phase angle between the two signals changesfrom n to 2n radians, the pattern changes correspondinglythrough the ellipse-circle-ellipse cycle to a straight line.Hence the two frequencies, aswell as the phase displacementcan be compared using Lissajous figures techniques.
1
1
1 2
Fig. 7.31 Lissajous patterns for integral frequencies
(i) tv= ~th1(h)tv= -th4
5
32
2
1
11
(e) tv = 5th1
1 11
22
33
4
4
1
(d) tv = 4th
1 1 2 1 2 3
0 CXJ 111
(a) tv = th (b) tv = 2th (c) tv = 3th1 2 3 4 1 2 3 4 5
1 1
Oscilloscope 207
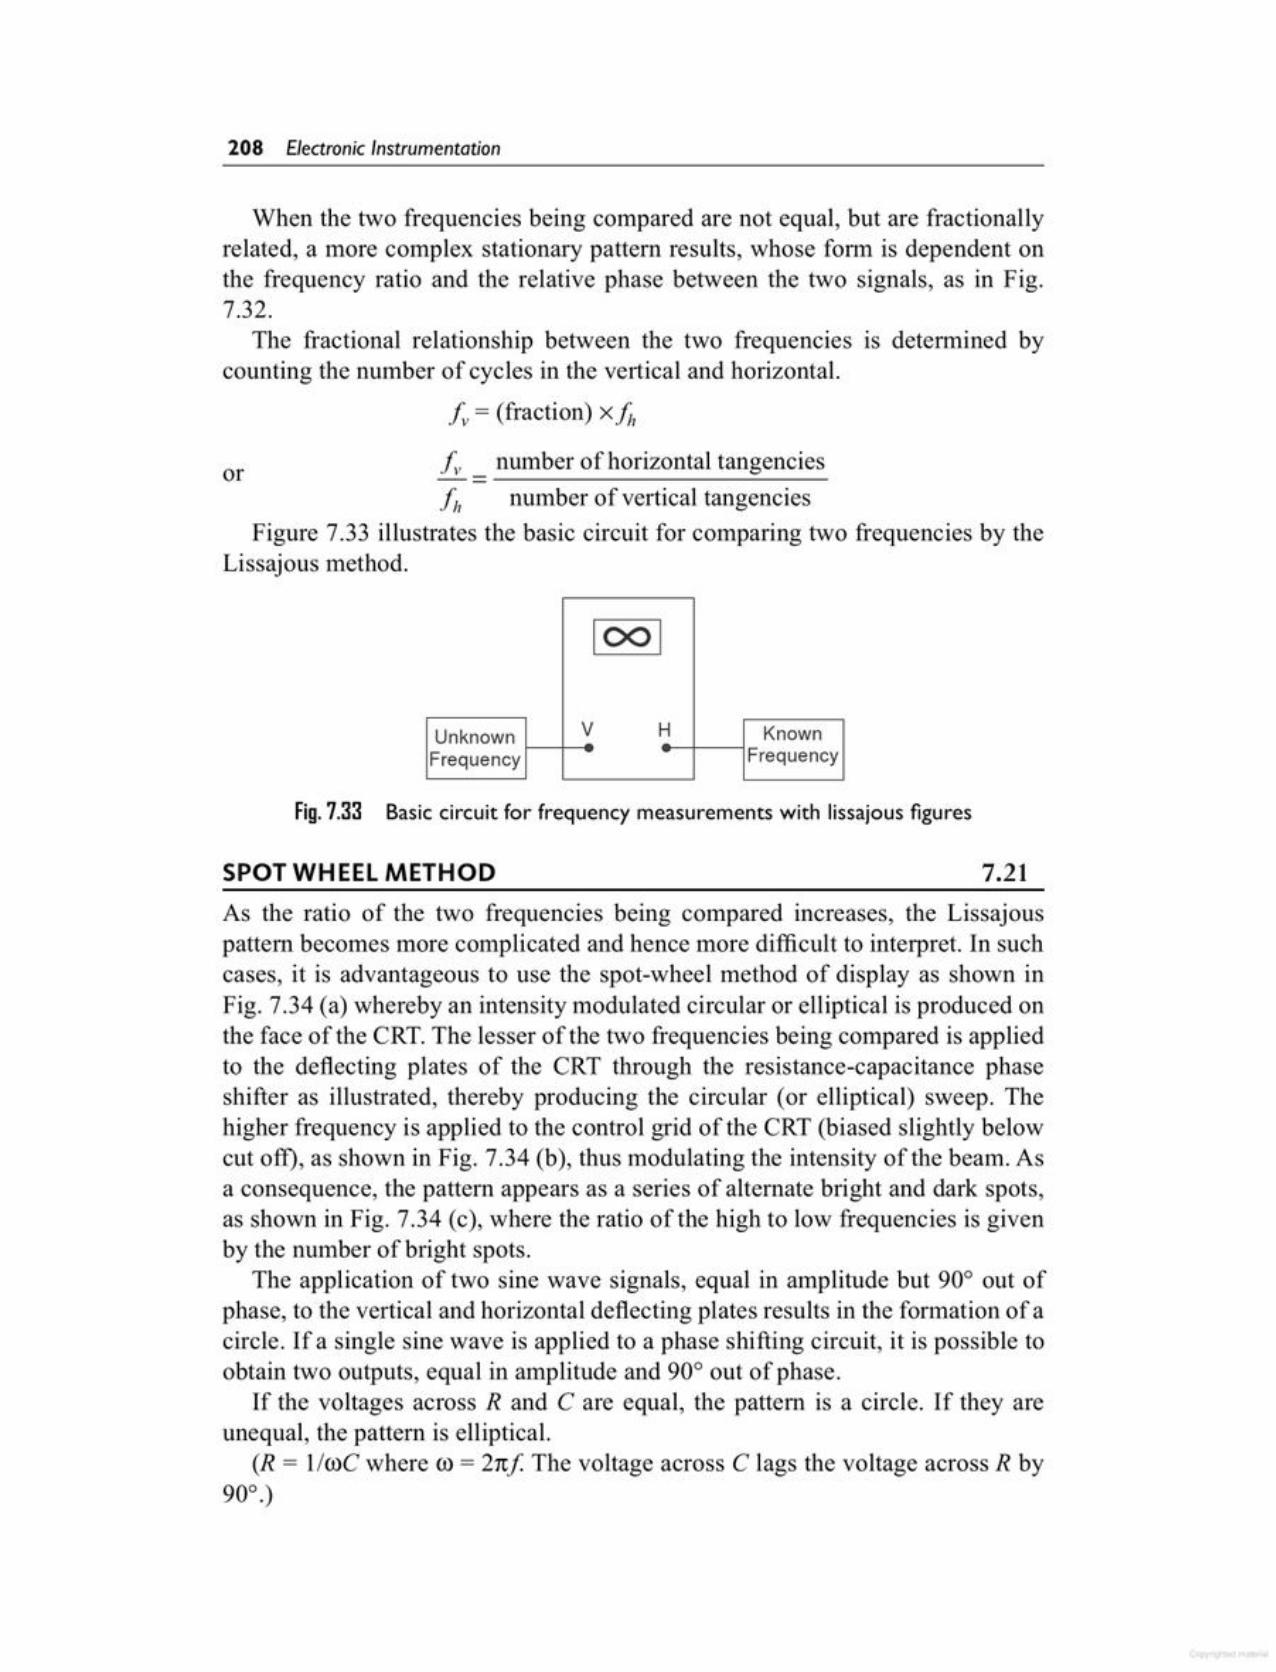
As the ratio of the two frequencies being compared increases, the Lissajouspattern becomes more complicated and hence more difficult to interpret. In suchcases, it is advantageous to use the spot-wheel method of display as shown inFig. 7.34 (a) whereby an intensity modulated circular or elliptical is produced onthe face of the CRT. The lesser of the two frequencies being compared is appliedto the deflecting plates of the CRT through the resistance-capacitance phaseshifter as illustrated, thereby producing the circular (or elliptical) sweep. Thehigher frequency is applied to the control grid of the CRT (biased slightly belowcut oft), as shown in Fig. 7.34 (b), thus modulating the intensity of the beam. Asa consequence, the pattern appears as a series of alternate bright and dark spots,as shown in Fig. 7.34 (c), where the ratio of the high to low frequencies is givenby the number of bright spots.
The application of two sine wave signals, equal in amplitude but 90° out ofphase, to the vertical and horizontal deflecting plates results in the formation of acircle. If a single sine wave is applied to a phase shifting circuit, it is possible toobtain two outputs, equal in amplitude and 90° out of phase.
If the voltages across Rand C are equal, the pattern is a circle. If they areunequal, the pattern is elliptical.
(R = l/roC where ro= 21t/ The voltage across C lags the voltage across R by90°.)
7.21SPOT WHEEL METHOD
Fig.7.33 Basic circuit for frequency measurements with lissajous figures
1001
Unknown V H KnownFrequency Frequency
I, number of vertical tangenciesFigure 7.33 illustrates the basic circuit for comparing two frequencies by the
Lissajous method.
Iv number of horizontal tangenciesor
When the two frequencies being compared are not equal, but are fractionallyrelated, a more complex stationary pattern results, whose fOIIDis dependent onthe frequency ratio and the relative phase between the two signals, as in Fig.7.32.
The fractional relationship between the two frequencies is determined bycounting the number of cycles in the vertical and horizontal.
Iv = (fraction) xfh
208 Electronic Instrumentation

When a Lissajous figure contains a large number of loops, accurate countingbecomes difficult. Figure 7.35 shows a test method that uses a modulated ringpattern in place of the looped figure and permits a higher count. This pattern isalso called a Gear wheel or toothed wheel, because of its shape. The unknown
7.22GEAR WH EELMETHOD
Varying the grid-cathode potential changes the density of the electron streamwithin the CRT and determines the intensity. When the grid bias of the CRTreaches cut off potential, there is no electron stream and fluorescence at thescreen cannot occur. This property is used for the comparison of two frequencies,provided their ratio is an integer.
The high frequency signal is applied to the grid. Sufficient grid bias must bepresent so that the negative peaks of the sine wave cuts off the electron beam.The high frequency signal does not have to be a pure sine wave, it can be a squarewave.
In Fig. 7.34 (c), the frequency is 20 : 1 and there are 20 blanks in the pattern.
Fig.7.34 (a) Basic circuit of a spot wheel method for frequency measurement(b) Input circuit to the control grid (c) Spot wheel pattern
(c)(b)
20: 1
/
-,-,\
- 20 I//
/
II fHighI\ fLow-,<,
High1Frequency
, ,L........ Phase Shifter
(a)
,
Low (\)Freq. (. V
,-------------.,
Oscilloscope 209

7.22.1 Measurement ProcedureSet up the oscilloscope. Switch off the Internal and Sync control. Connect thecircuit as in Fig. 7.36, and temporarily switch off signal B.
Switch on signal source A and adjust R to obtain a ring pattern on the screen.Adjust the horizontal and vertical gain controls to spread the ring over the screenas much as possible.
Switch on signal source B, noting that the ring becomes toothed by the signal.Adjust the known frequency j~to stop the ring from rotating. Adjust the amplitudeof.h to obtain a distinct teeth pattern. The unknown frequency is then given byJh = nf.; where Jh is an integral multiple (odd or even) ofIv. The wheel rotates orspins ifJh is not an exact multiple oflv. Therefore, adjust the known frequency tostop the wheel from rotating.
A voltage from the unknown frequency source modulates this ring. When thevoltages across Rand C are unequal, the pattern is elliptical. If they are equal,the pattern is a circle. The unknown frequency must be higher than the knownfrequency and the amplitude of the unknown must be below that of the knownto prevent distortion.
Fig. 7.38 Setup for gear wheel method for frequency measurement
DKnown UnknownFreq.
V i/p H i/pFreq.
Signal SignalSource fv 1 ...._-----------. fh Source
A - -c r- B-,..-
R~~~>
Fig. 7.35 Gear wheel pattern
Ratio21 : 2
Ratio21 : 1
frequency is determined by multiplying the known frequency by the numberof teeth in the pattern. Figure. 7.36 shows the test set up. Here, a phase shiftnetwork (RC) introduces a 90° phase shift between the horizontal and verticalchannels of the oscilloscope, which is needed to produce a ring or circle patternwith the known frequency Iv.
210 Electronic Instrumentation

Capacitance may be measured from a capacitor discharge curve. This requires adc oscilloscope with a triggered single sweep that is of the storage type.
Figure 7.38 (a) shows the test setup. C is the capacitor under test, and E is1.5 V battery for charging the capacitor. R[ is the precision 1 W non-inductiveresistor. (R [ should be 100 K for testing capacitances from 10 pf - 0.1 uf, 10 K
BASIC MEASUREMENT OF CAPACITANCE AND INDUCTANCE 7.24
Fig.7.37 (a) Setup for diode testing (b) Displaypattern for diode testing
In this case the internal sweep is not used. Horizonal deflection is obtainedby connecting the 6.3 V source directly to the horizontal input and switching thesweep control to horizontal amplifier. This provides an horizontal trace that isproportional to the applied voltage and represents the input signal.
The diode current flowing through the 1 kQ resistance will develop avoltage across the resistance, which is applied to the vertical input terminals.This represents the rectified signal current, since the voltage drop across R isproportional to the diode current.
If the diode being tested is good, the current through it will be unidirectional,causing the curve to rise vertically from its flat portion. The flat portion representslittle or no current in the reverse direction. If the active portion of the curvepoints downwards, the diode connections should be reversed. The angle betweenthe active and the flat portions of the curve represents the condition of the diodeas shown in Fig. 7.37 (b).
(b)
(b) Open Diode (c) Indicatesa Partiallyor Shorted
Diode
(a) Shows a HignForward to Reverse
Current andIndicates a Good
Diode
(a)
EB
'-+-....V He-+-'
The voltage-current characteristics curve of a crystal diode may be observedusing the circuit given in Fig. 7.37 (a).
220 V ~ 1:6.3 V -& D50 Hz c> I..: -,"""ac c> ac 1----,
7.23CHECKING OF DIODES
Oscilloscope 2 I I
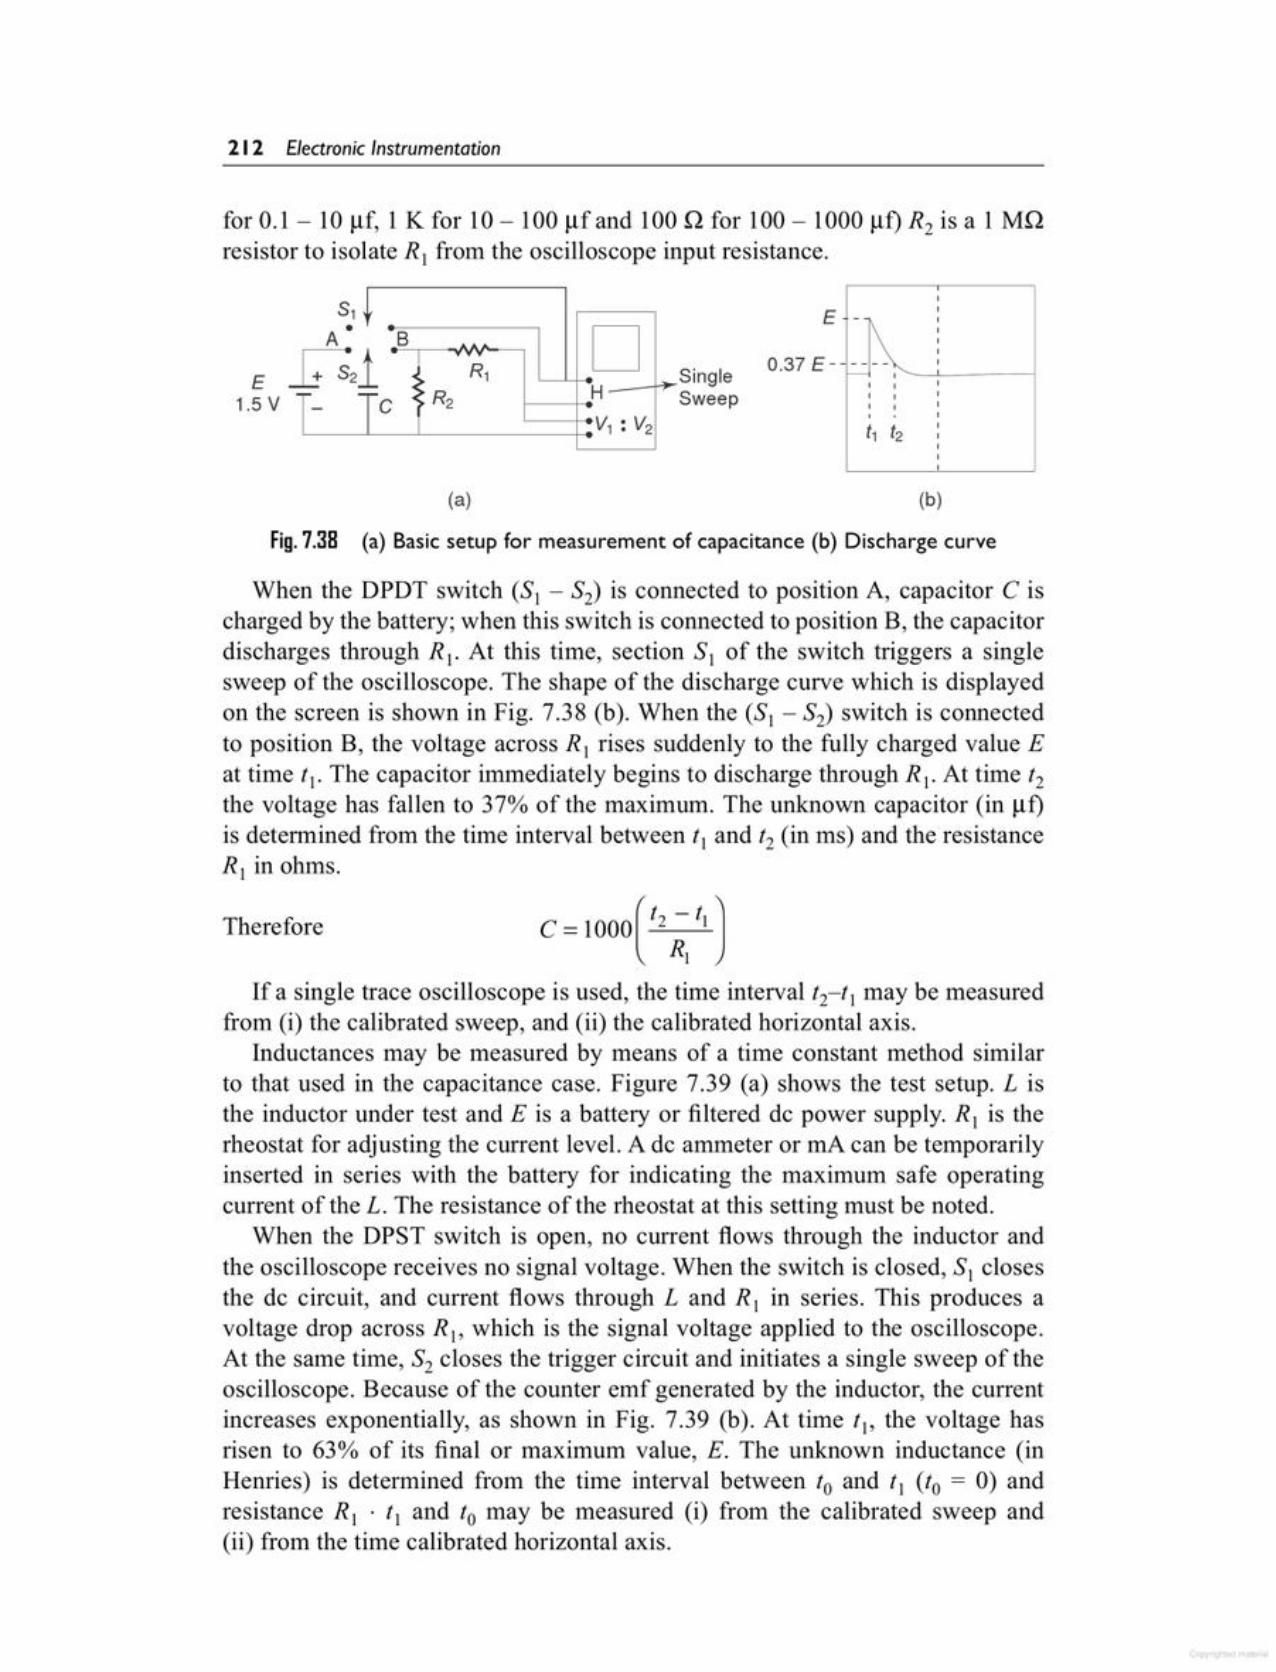
Therefore C = 1000( I, ;, I, )
If a single trace oscilloscope is used, the time interval t2-t Imay be measuredfrom (i) the calibrated sweep, and (ii) the calibrated horizontal axis.
Inductances may be measured by means of a time constant method similarto that used in the capacitance case. Figure 7.39 (a) shows the test setup. L isthe inductor under test and E is a battery or filtered de power supply. R[ is therheostat for adjusting the current level. A dc ammeter or rnA can be temporarilyinserted in series with the battery for indicating the maximum safe operatingcurrent of the L. The resistance of the rheostat at this setting must be noted.
When the DPST switch is open, no current flows through the inductor andthe oscilloscope receives no signal voltage. When the switch is closed, SI closesthe de circuit, and current flows through Land R I in series. This produces avoltage drop across Rj, which is the signal voltage applied to the oscilloscope.At the same time, S2 closes the trigger circuit and initiates a single sweep of theoscilloscope. Because of the counter emf generated by the inductor, the currentincreases exponentially, as shown in Fig. 7.39 (b). At time fl' the voltage hasrisen to 63% of its final or maximum value, E. The unknown inductance (inHeruies) is determined from the time interval between to and tj (to = 0) andresistance R I . t I and to may be measured (i) from the calibrated sweep and(ii) from the time calibrated horizontal axis.
When the DPDT switch (S1 - S2) is connected to position A, capacitor Cischarged by the battery; when this switch is connected to position B, the capacitordischarges through R l: At this time, section SI of the switch triggers a singlesweep of the osci lloscope, The shape of the discharge curve which is displayedon the screen is shown in Fig. 7.38 (b). When the (SI - S2) switch is connectedto position B, the voltage across R [ rises suddenly to the fully charged value Eat time t I. The capacitor immediately begins to discharge through R I.At time t2
the voltage has fallen to 370/0of the maximum. The unknown capacitor (in uf)is determined from the time interval between tI and t2 (in ms) and the resistanceRI in ohms.
Fig. 7.38 (a) Basic setup for measurement of capacitance (b) Discharge curve
(b)(a)
E -
0.37 E - r=-:I\'-._...L.-._--lSingleSweep
s,• DA B AAI·I .V
+ S2 } R,- -,...C {R2 H- •·V, : V2
E~1.5 V
for 0.1 - 10 uf, 1K for 10 - 100 uf and 100 Q for 100 - 1000 uf) R2 is a 1 MQresistor to isolate R, from the oscilloscope input resistance.
21 2 Electronic Instrumentation
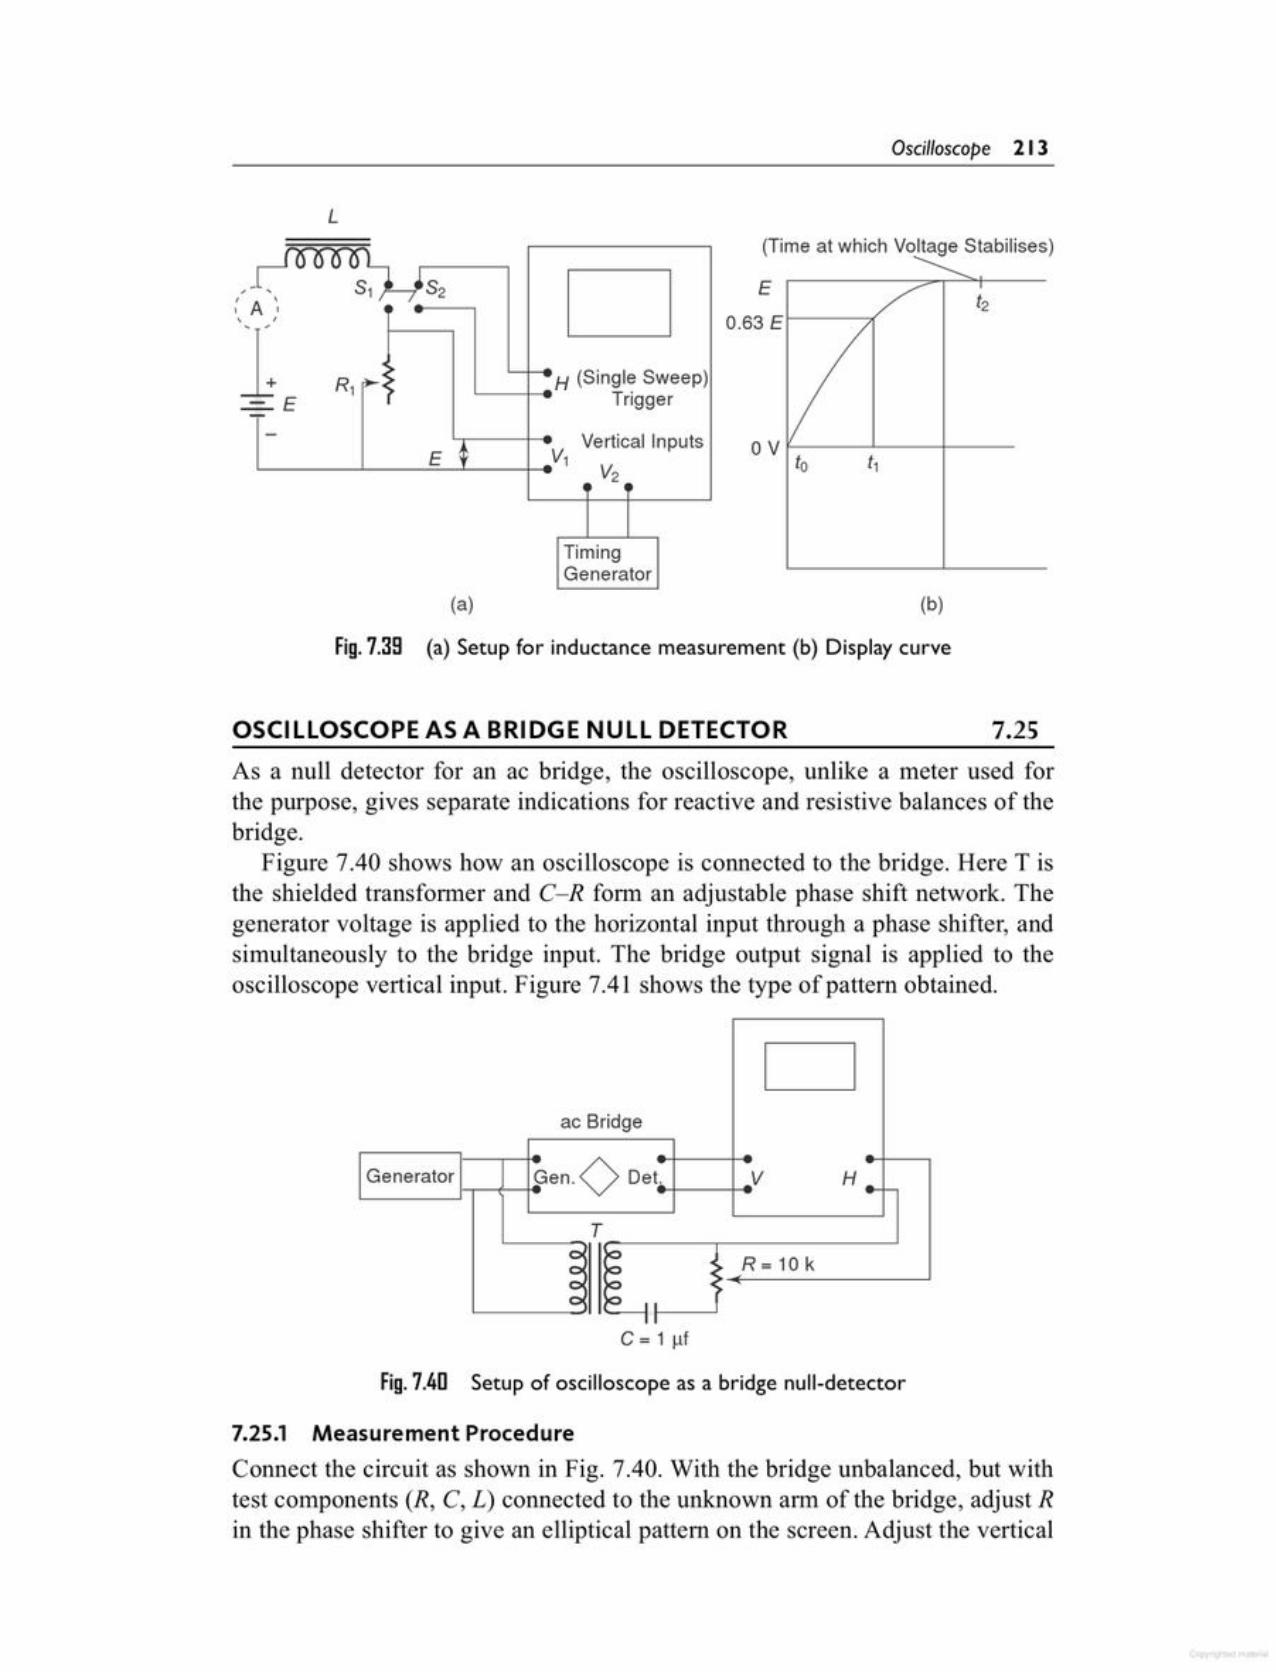
7.25.1 Measurement ProcedureConnect the circuit as shown in Fig. 7.40. With the bridge unbalanced, but withtest components (R, C, L) connected to the unknown arm of the bridge, adjust Rin the phase shifter to give an elliptical pattern on the screen. Adjust the vertical
Fig. 7.4l1 Setup of oscilloscope as a bridge null-detector
C = 1 uf
Dac Bridge
Generator Gen.O Det. V H ... l-
T
~ ~ :~. R = 10 k
~ ~•~
I II I
As a null detector for an ac bridge, the oscilloscope, unlike a meter used forthe purpose, gives separate indications for reactive and resistive balances of thebridge.
Figure 7.40 shows how an oscilloscope is connected to the bridge. Here T isthe shielded transformer and C-R form an adjustable phase shift network. Thegenerator voltage is applied to the horizontal input through a phase shifter, andsimultaneously to the bridge input. The bridge output signal is applied to theoscilloscope vertical input. Figure 7.41 shows the type ofpattem obtained.
7.25OSCILLOSCOPE AS A BRIDGE NULL DETECTOR
Fig. 7.39 (a) Setup for inductance measurement (b) Display curve
(b)(a)
o V to
E0.63EI----;(
,,,
(Time at which Voltage Stabilises)0000
7~S2- S1r,A ",-
•~ H (Single Sweep)+ R1 ~~
E~ Trigger
- Vertical InputsE ~ Vj
V2
TimingGenerator
,
1
L
Oscilloscope 2 I 3

lcolUnknown V H KnownFrequency Frequency
USEOF LISSAJOUS FIGURES FOR PHASE MEASUREMENT 7.26When two signals are applied simultaneously to an oscilloscope without internalsweep, one to the horizontal channel and the other to the vertical channel, the resulting pattern is a Lissajous figure that shows a phase differencebetween the two signals. Suchpatterns result from the sweepingof one signal by the other.
Figure 7.42 shows the test setupfor phase measurement by meansof Lissajous figures. Figure 7.43shows patterns corresponding to Fig.7.42 Setup for phase measurement
A simpler but less effective way of using an oscilloscope as a null detector isto connect the bridge output to the vertical terminals and use the oscilloscope asa voltmeter to give its lowest reading at null.
(f)Same as (d)
(e)Complete NullResistance and
Reactance Balanced
Fig.7.41 Oscilloscope patterns
(d)Resistance Balanced
Reactance Unbalanced
(c)Same as (a)
(b)Reactance Balanced
Resistance Unbalanced
(a)Reactance andResistanceUnbalanced
and horizontal gain controls to obtain an ellipse of suitable height. Adjust thereactance control of the bridge, noting whether the ellipse tilts to the right or theleft. When reactance balance is complete, i.e. reactance = 0, the ellipse will behorizontal.
Adjust the resistance (power factor, dissipation factor, or Q) control of thebridge, noting that the ellipse closes. At complete null (reactance and resistance,both balanced), a straight horizontal line is obtained. If the resistance is balancedwhile the reactance is not, tilted ellipse collapses, giving a single line trace tiltedto the right or left.
214 Electronic Instrumentation
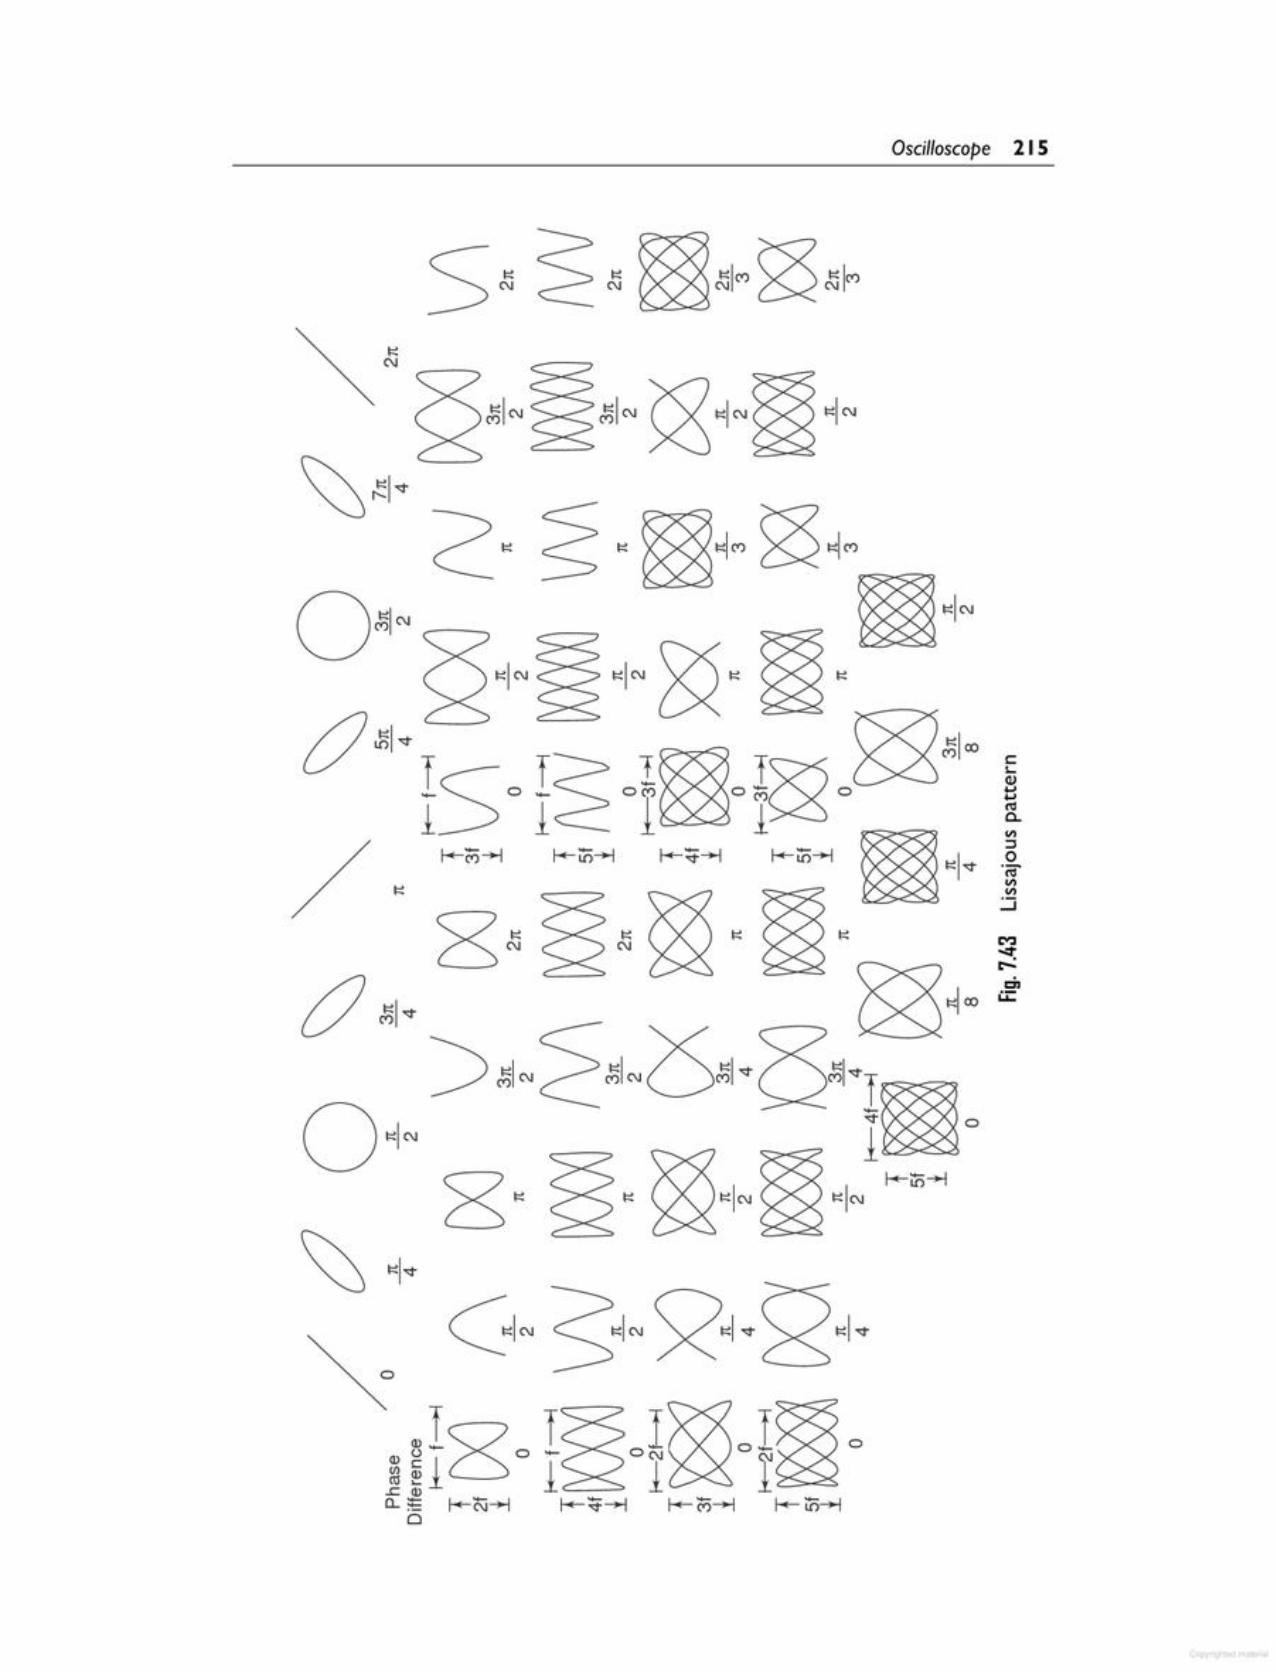
""><-~v!~0r+-U'i-+l
~Iv
~ Jil C\J «]~I C\J ~I C\JJil C\J ><:___ XJ
" ~"IN~IC\J _____
VJ1lv f? 01~oI~0 !ISo T2 1 1 ___,~~Iv .~I .t ___, f<-., •.t _~ f<-v ~r+-LO--,...,
215Oscilloscope ___ ________:_:_
de - 2 MHz (- 3 db)100 mV and 0.5 V/Div
Horizontal AmplifierBandwidthSensitivity
External trigger level
SourcePolarityMaximum trigger inputInput impedanceInternal trigger level
Free running in the absence of a trigger signal.Triggers to the input signal automatically.Continuously adjustable on the + ve and - vegoing slopes to trigger signal. Level adjustableover 8 Divs.Internal-External-LinePositive or negative250 V (de + ac peak) short term1MQ/30 pf3 Div from 2 Hz to 20 MHz(1 Div, 30 Hz to 20 MHz in Auto mode)3 V peak to peak, 2 Hz to 20 MHz(1 V, 30 Hz to 20 MHz in Auto mode)
Level
AccuracyMagnificationTriggeringAuto mode
0.1 us/Div. to 0.5 s/Div. in 21 calibrated steps in a1, 2, 5 sequence. Continuous uncalibrated controlbetween steps extending slowest speed to 1.5 s/Div,±5%5 times. Takes the highest speed to 20 ns/Div.
Time BaseSweep ranges
Rise timeInput ImpedanceMaximum input voltageSignal delay
AccuracyBandwidth
5 mV/Div. to 20 V/Div. in 12 calibrated steps in a1, 2, 5 sequence.Continuous control (uncalibrated) between steps,reduces the sensitivity by a minimum of2.5 times.±3%de to 20 MHz (- 3 db), de coupling0.5 Hz to 20 MHz (- 3 db) ac couplingBetter than 18 ns1 MQ/40 pf400 V (de + ac peak)Built in delay line sufficient to displayleading edge of the waveform
Vertical AmplifierSensitivity
7.27STANDARD SPECIFICATIONS OF A SINGLE BEAM CRO
certain phase difference angles, when the two signal voltages are sinusoidal,equal in amplitude and frequency.
A simple way to find the correct phase angle (whether leading or lagging) is tointroduce a small, known phase shift to one of the inputs. The proper angle maybe then deduced by noting the direction in which the pattern changes.
216 Electronic Instrumentation
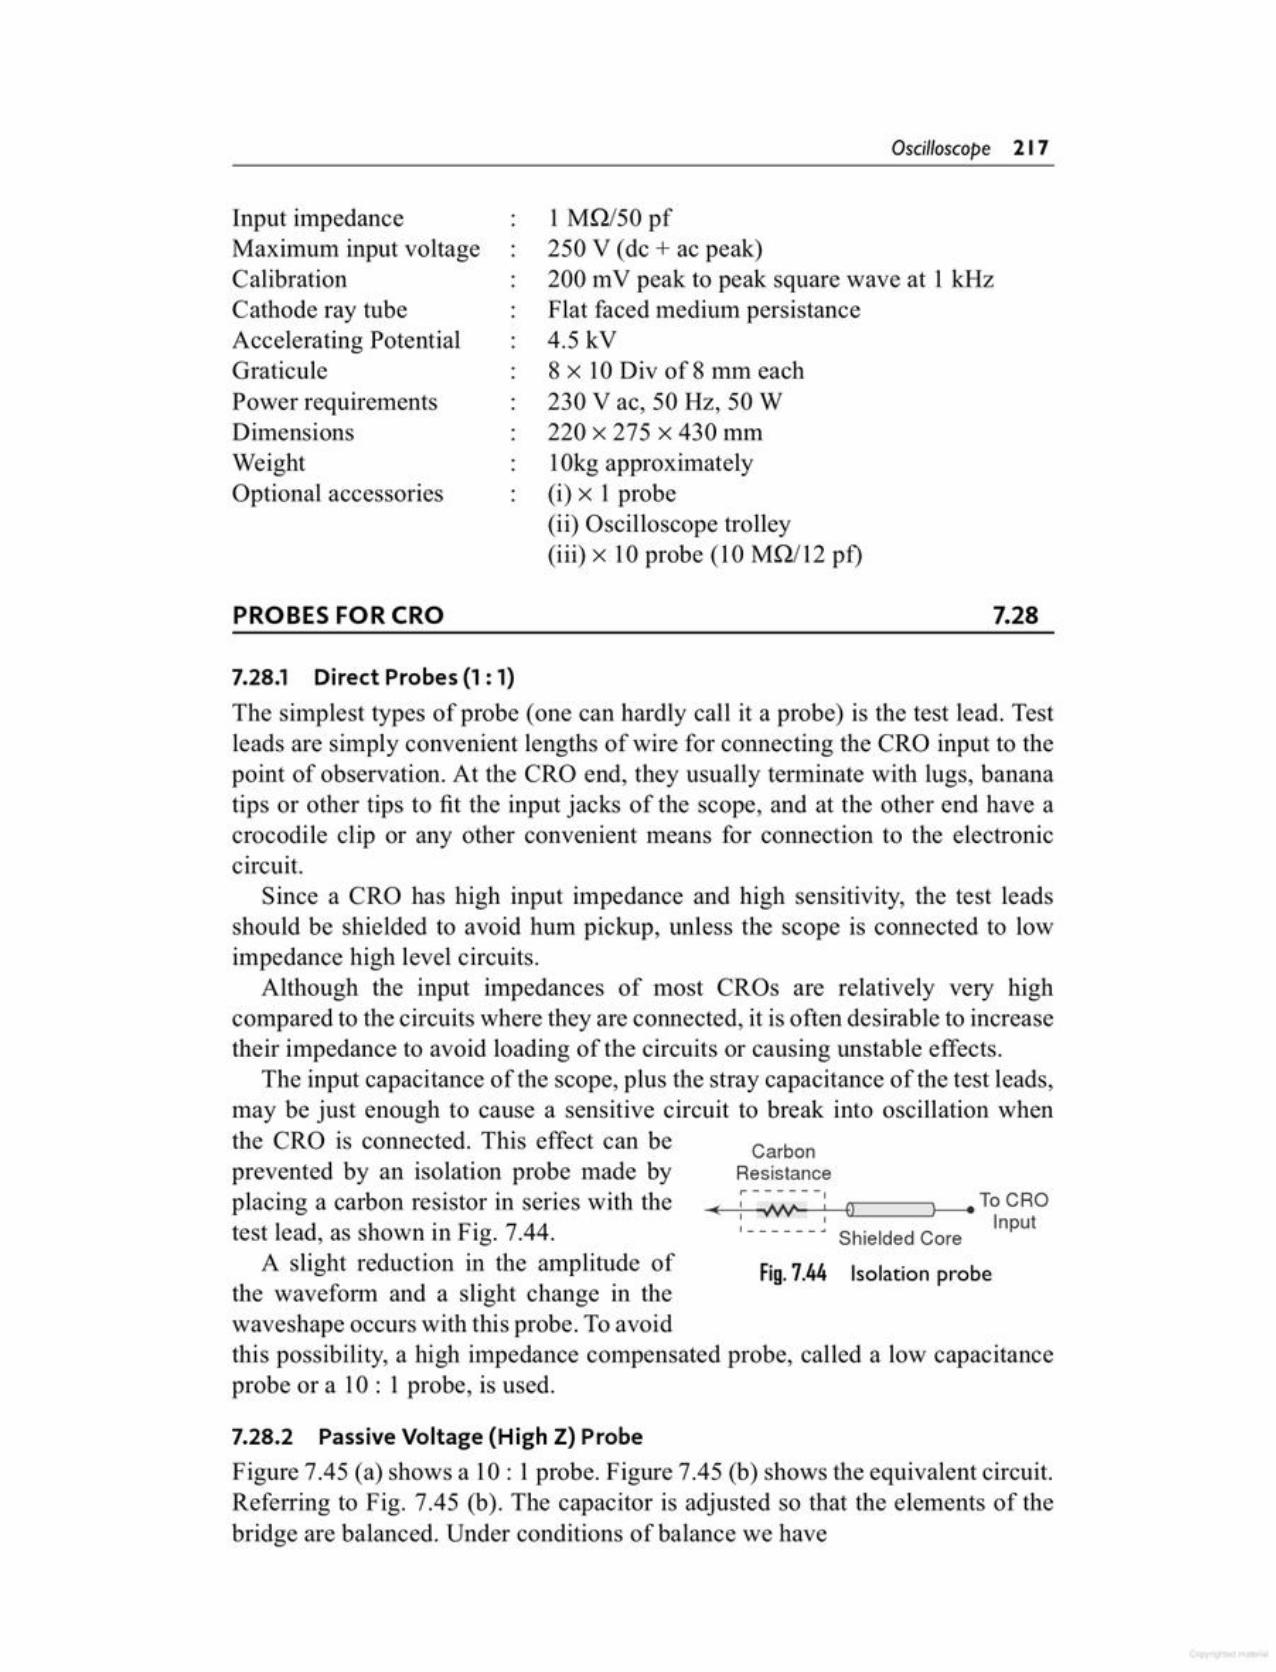
7.28.2 Passive Voltage (High Z)ProbeFigure 7.45 (a) shows a 10 : 1 probe. Figure 7.45 (b) shows the equivalent circuit.Referring to Fig. 7.45 (b). The capacitor is adjusted so that the elements of thebridge are balanced. Under conditions of balance we have
Fig.7.44 Isolation probe
~~:_-~-~-~-_--~:~====~__ ToCROInput
I - - - - - - ~ Shielded Core
Resistanceprevented by an isolation probe made byplacing a carbon resistor in series with thetest lead, as shown in Fig. 7.44.
A slight reduction in the amplitude ofthe waveform and a slight change in thewaveshape occurs with this probe. To avoidthis possibility, a high impedance compensated probe, called a low capacitanceprobe or a 10 : 1 probe, is used.
Carbon
The simp lest types of probe (one can hardly call it a probe) is the test lead. Testleads are simply convenient lengths of wire for connecting the CRO input to thepoint of observation. At the CRO end, they usually terminate with lugs, bananatips or other tips to fit the input jacks of the scope, and at the other end have acrocodile clip or any other convenient means for connection to the electroniccircuit.
Since a CRO has high input impedance and high sensitivity, the test leadsshould be shielded to avoid hum pickup, unless the scope is connected to lowimpedance high level circuits.
Although the input impedances of most CROs are relatively very highcompared to the circuits where they are connected, it is often desirable to increasetheir impedance to avoid loading of the circuits or causing unstable effects.
The input capacitance of the scope, plus the stray capacitance of the test leads,may be just enough to cause a sensitive circuit to break into oscillation whenthe CRO is connected. This effect can be
7.28.1 Direct Probes (1: 1)
7.28PROBES FOR eRO
1MQ/50 pf250 V (de + ac peak)200 InV peak to peak square wave at 1 kHzFlat faced medium persistance4.5 kV8 x 10 Div of8 mm each230 V ac, 50 Hz, 50 W220 x 275 x 430 mm10kg approximately(i) x 1 probe(ii) Oscilloscope trolley(iii) x 10 probe (10 MQ/12 pi)
Input impedanceMaximum input voltageCalibrationCathode ray tubeAccelerating PotentialGraticulePower requirementsDimensionsWeightOptional accessories
Oscilloscope 2 I 7
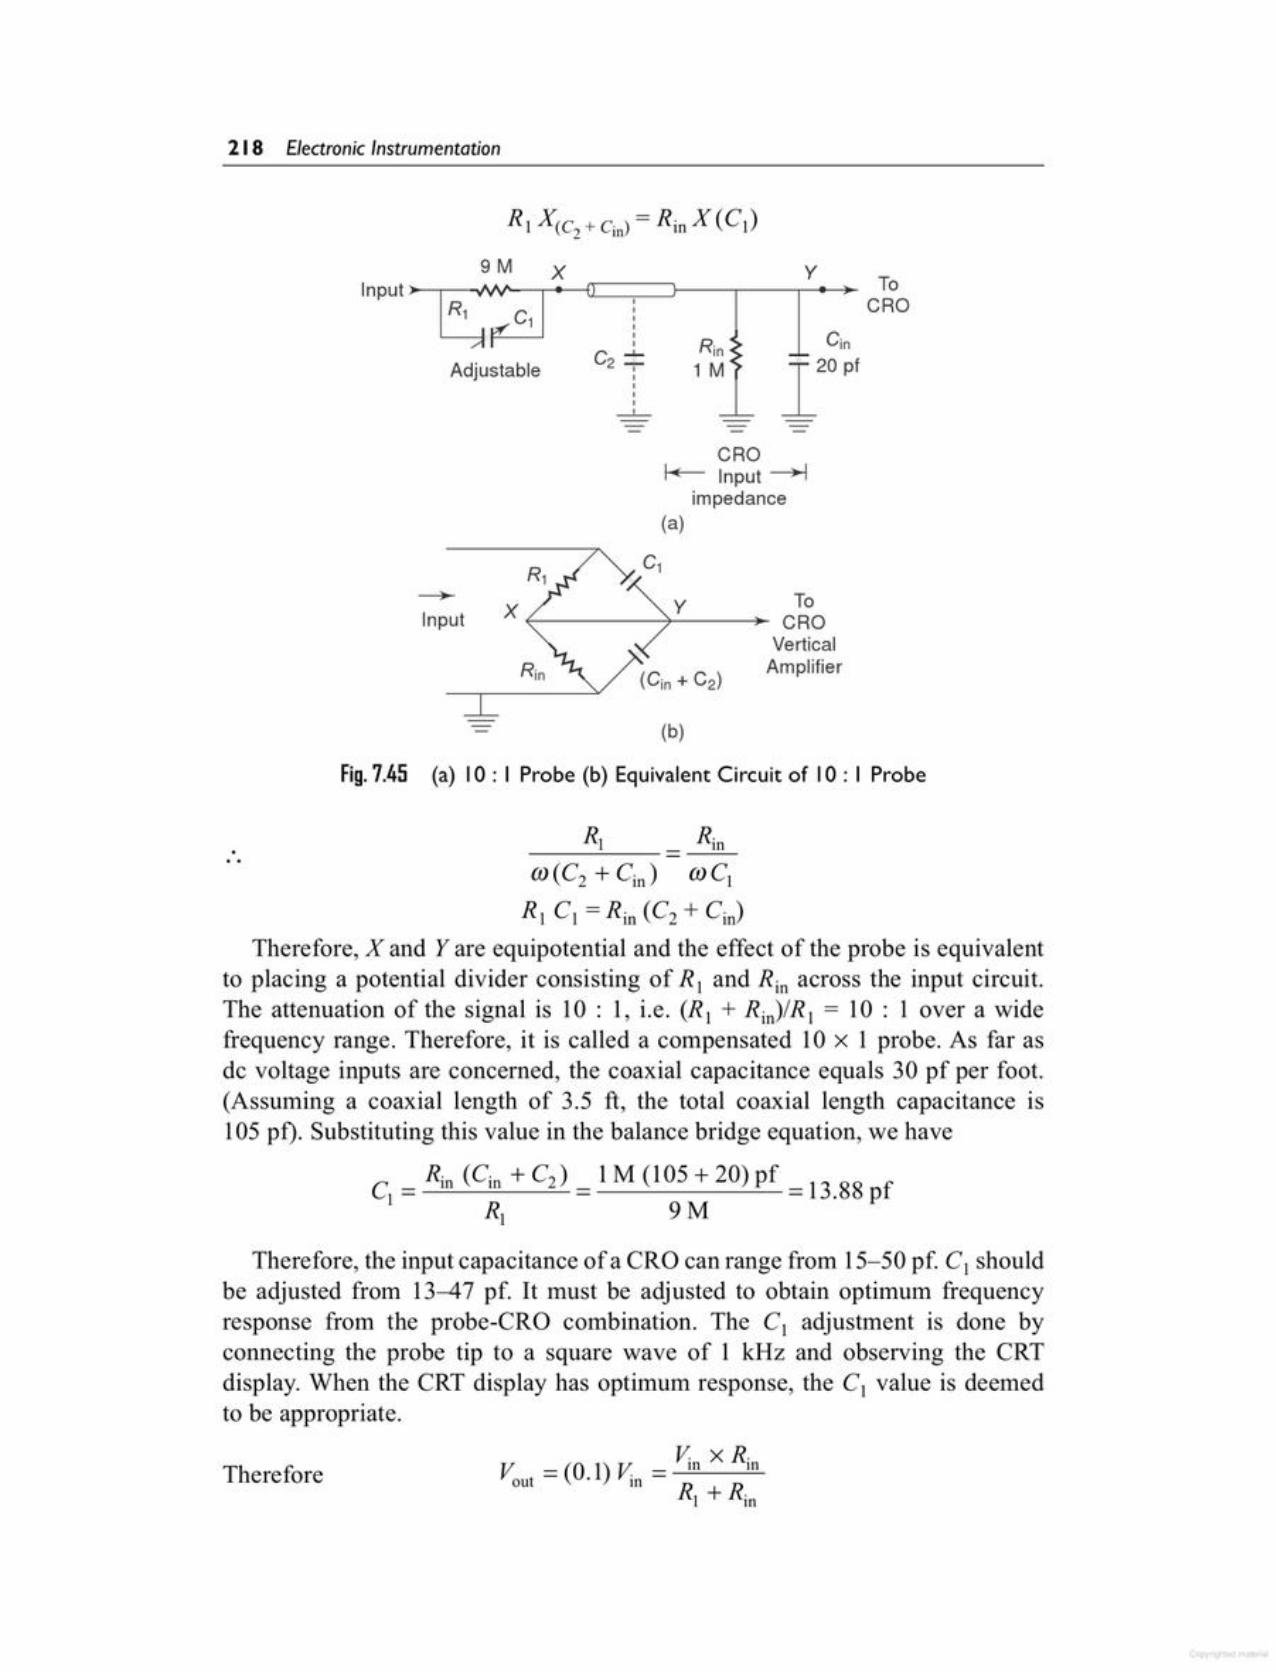
Therefore
Therefore, the input capacitance ofa CRO can range from 15-50 pf. C1 shouldbe adjusted from 13-47 pf. It must be adjusted to obtain optimum frequencyresponse from the probe-CRO combination. The Cl adjustment is done byconnecting the probe tip to a square wave of 1 kHz and observing the CRTdisplay. When the CRT display has optimum response, the C} value is deemedto be appropriate.
Cl = Rill (Cill + C2) = 1M (105 + 20) pf = 13.88 pfR) 9M
... Rl Rin
m(C2 + Cin) mCIs, C1 =Rin (C2 + Cin)
Therefore, X and Yare equipotential and the effect of the probe is equivalentto placing a potential divider consisting of R, and Rio across the input circuit.The attenuation of the signal is 10 : 1, i.e. (R) + Rill)/ R) = 10 : lover a widefrequency range. Therefore, it is called a compensated lOx 1 probe. As far asde voltage inputs are concerned, the coaxial capacitance equals 30 pf per foot.(Assuming a coaxial length of 3.5 ft, the total coaxial length capacitance is105 pf). Substituting this value in the balance bridge equation, we have
Fig. 7.45 (a) 10 : I Probe (b) Equivalent Circuit of 10 : I Probe
(b)
Y ToX f-------7------_+_ CRO
VerticalAmplifier
~
Input
eROf+-- Input---+l
impedance(a)
,,,,-'-
Adjustable
ToCRO
y
218 Electronic Instrumentation

-10 V
Fig. 7.46 FET probe
100 k
Input
10 M
1 k
100 k
100 k
+10 V
7.28.3 Active ProbesActive probes are designed to provide an efficient method of coupling highfrequency, fast rise time signals to the eRO input. Usually active probes havevery high input impedance, with less attenuation than passive probes. Activedevices may be diodes, FETs, BJTs, etc.
Active probes are more expensive and bulky than passive probes, but they areuseful for small signal measurements, because their attenuation is less.
Active Probes Using FETs Figure 7.46 shows a basic circuit of an active probeusing a FET.
The FET is used as the active element to amplify the input signal. Althoughthe voltage gain of the FET follower circuit shown is unity, the follower circuitprovides a power gain so that the input impedance can be increased. To beeffective the FET must be mounted directly in the voltage probe tip, so thatthe capacitance of the interconnecting cable can be eliminated. This requiresthat the power for the FET be supplied from the oscilloscope to the FET in theprobe tip. The FET voltage follower drives a coaxial cable, but instead of thecable connecting directly to the high input impedance of the oscilloscope, it isterminated in its characteristic impedance.
There is no signal attenuation between the FET Amplifier and the probe tip.The range of the signals that can be handled by the FET probe is limited tothe dynamic range of the FET amplifier and is typically less than a few volts.To handle a larger dynamic range, external attenuators are added at the probetip. Active probes have limited use because the FET probe effectively becomesan FET attenuator. Therefore, oscilloscopes are typically used with a 10 to 1attenuator probe.
Oscilloscope 2 I 9
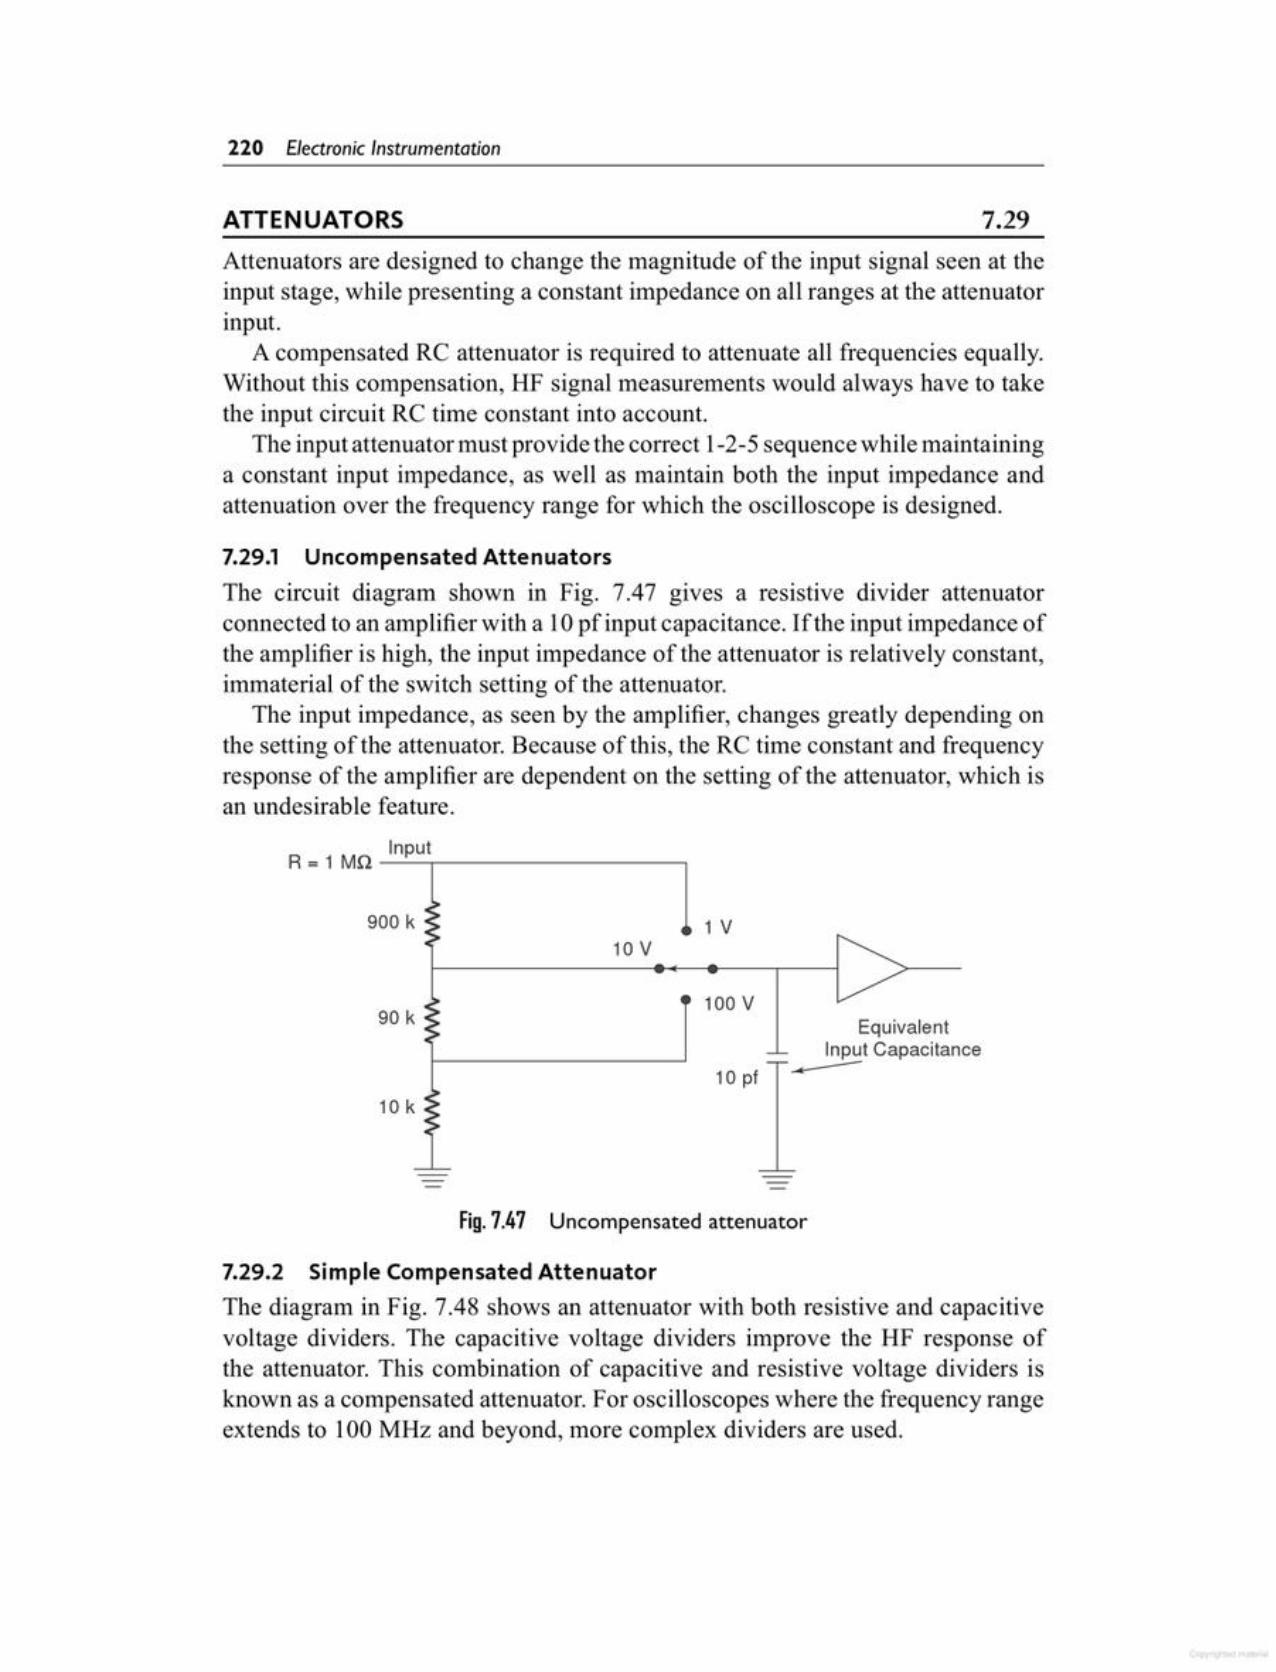
7.29.2 Simple CompensatedAttenuatorThe diagram in Fig. 7.48 shows an attenuator with both resistive and capacitivevoltage dividers. The capacitive voltage dividers improve the HF response ofthe attenuator. This combination of capacitive and resistive voltage dividers isknown as a compensated attenuator. For oscilloscopes where the frequency rangeextends to 100 MHz and beyond, more complex dividers are used.
Fig.7.47 Uncompensated attenuator
900 k 1 V10 V
90 k100 V
EquivalentInp~t Capacitance
10 pf ..04;
10 k
R = 1 Mn _I_:np_u-,t----------,
7.29.1 Uncompensated AttenuatorsThe circuit diagram shown in Fig. 7.47 gives a resistive divider attenuatorconnected to an amplifier with a 10 pf input capacitance. If the input impedance ofthe amplifier is high, the input impedance of the attenuator is relatively constant,immaterial of the switch setting of the attenuator.
The input impedance, as seen by the amplifier, changes greatly depending onthe setting of the attenuator. Because of this, the RC time constant and frequencyresponse of the amplifier are dependent on the setting of the attenuator, which isan undesirable feature.
Attenuators are designed to change the magnitude of the input signal seen at theinput stage, while presenting a constant impedance on all ranges at the attenuatorinput.
A compensated RC attenuator is required to attenuate all frequencies equally.Without this compensation, HF signal measurements would always have to takethe input circuit RC time constant into account.
The input attenuator must provide the correct 1-2-5 sequence while maintaininga constant input impedance, as well as maintain both the input impedance andattenuation over the frequency range for which the oscilloscope is designed.
7.29ATTENUATORS
220 Electronic Instrumentation
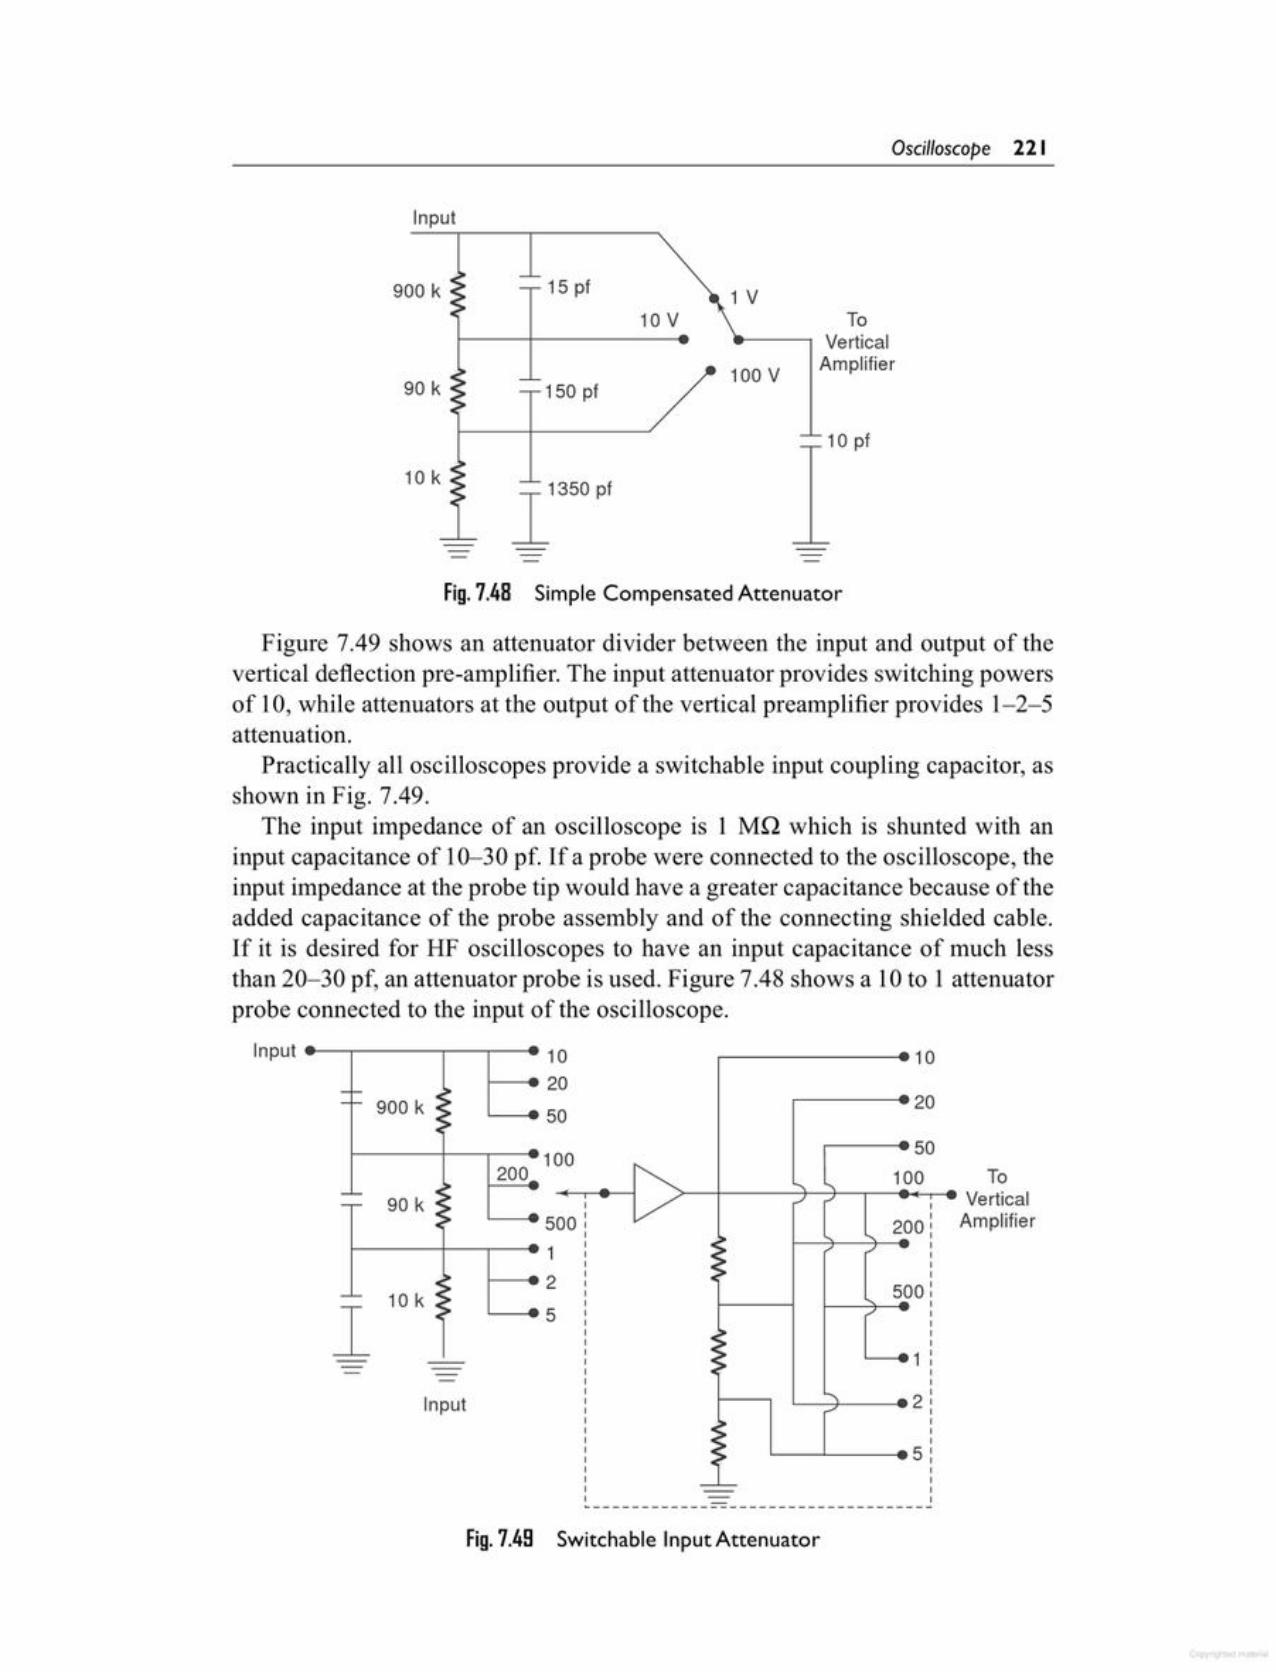
Fig.7.49 Switchable Input Attenuator
512
5
ToVerticalAmplifier
100
200
5000
> '" '" 100r-' ,
00,
200': ,: r ,,~~
,,500:
r:::~ 1
""'\ -2./
:~:~ 5
1
102
5
Input
Input --= 900 k ::-
:~200
--90 k ::--
~•
c:-- 10 k :~I • ...
Figure 7.49 shows an attenuator divider between the input and output of thevertical deflection pre-amplifier. The input attenuator provides switching powersof 10,while attenuators at the output of the vertical preamplifier provides 1-2-5attenuation.
Practically all oscilloscopes provide a switchable input coupling capacitor, asshown in Fig. 7.49.
The input impedance of an oscilloscope is 1 MQ which is shunted with aninput capacitance of 10-30 pf. If a probe were connected to the oscilloscope, theinput impedance at the probe tip would have a greater capacitance because of theadded capacitance of the probe assembly and of the connecting shielded cable.If it is desired for HF oscilloscopes to have an input capacitance of much lessthan 20-30 pf, an attenuator probe is used. Figure 7.48 shows a 10 to 1 attenuatorprobe connected to the input of the oscilloscope.
Fig.7.48 Simple Compensated Attenuator
11350 pf
150 pf100 V
10 pf
10 V ToVerticalAmplifier
1 V15 pf
10 k
90 k
900 k
Input
Oscilloscope 221
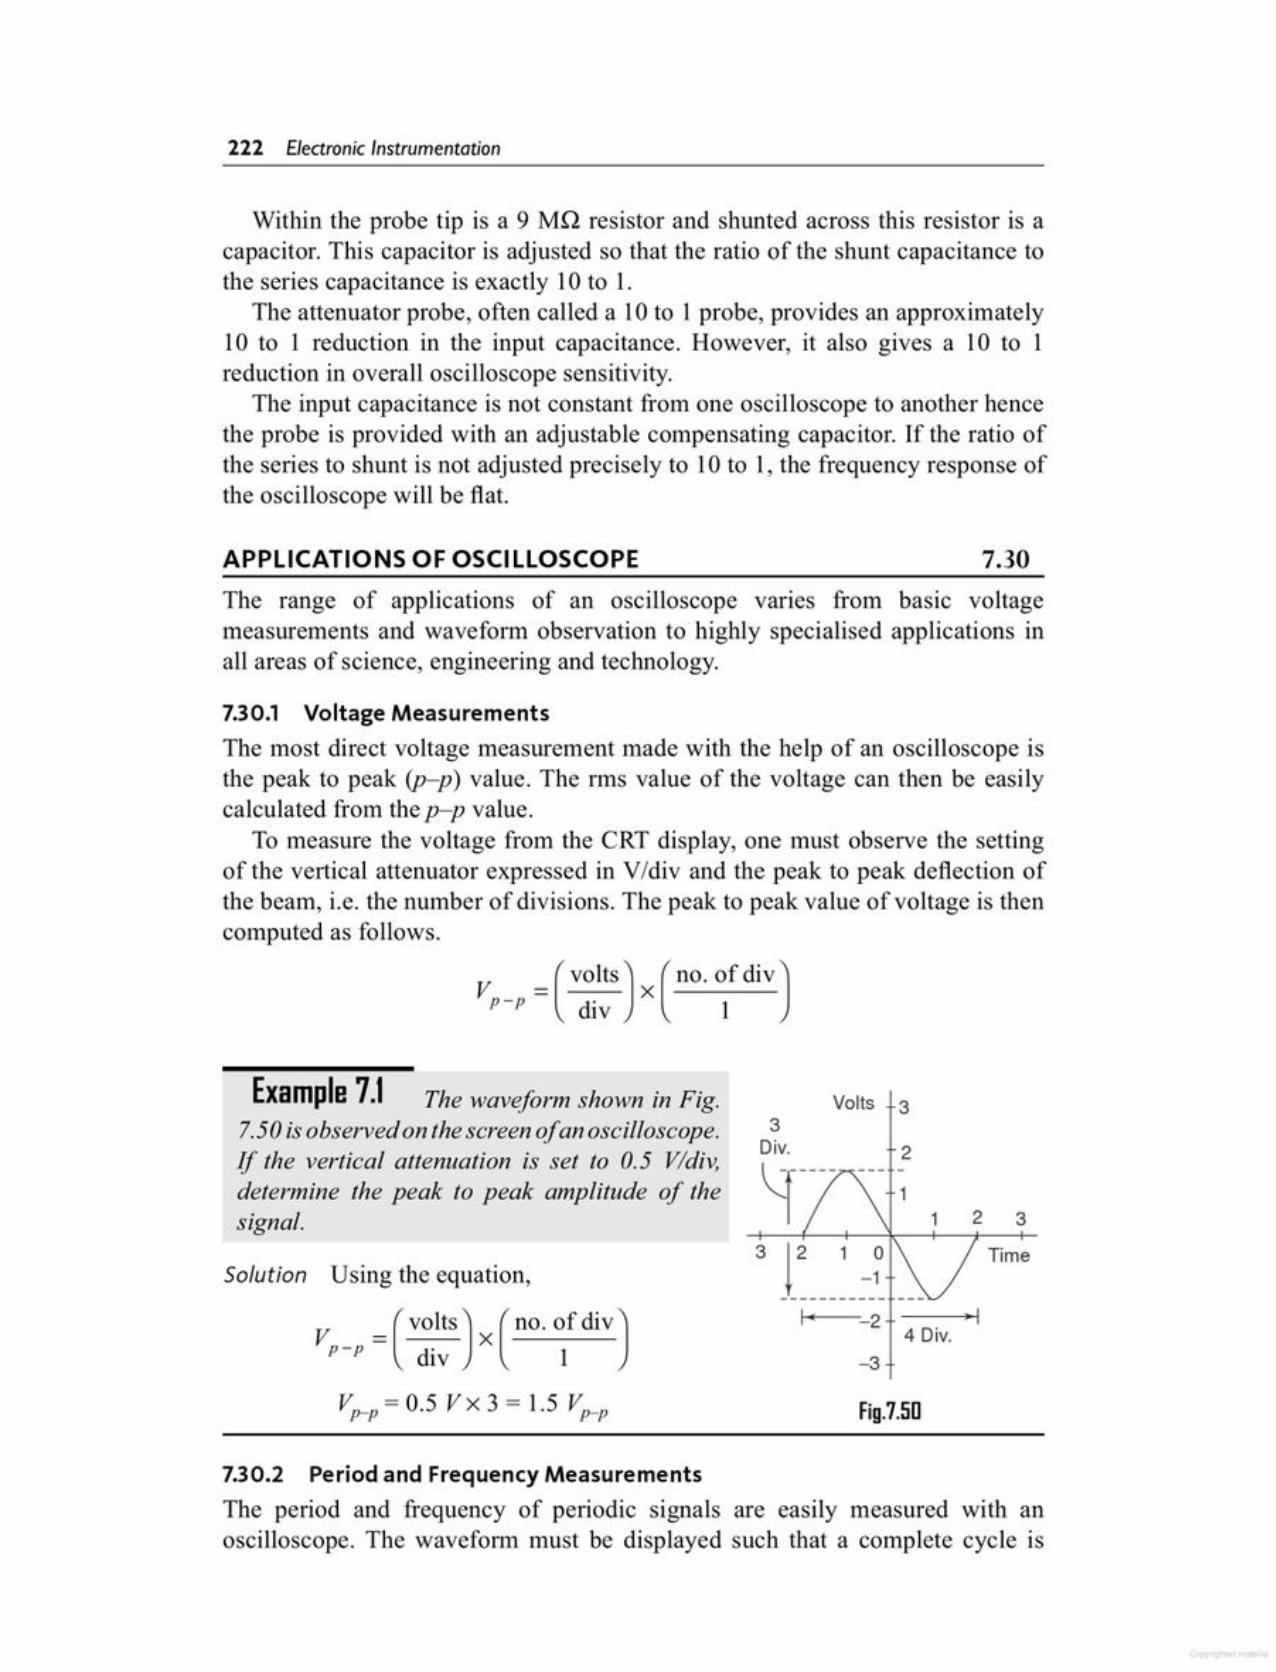
7.30.2 Period and Frequency MeasurementsThe period and frequency of periodic signals are easily measured with anoscilloscope. The waveform must be displayed such that a complete cycle is
Fig.7.50v.;= 0.5 Vx 3 = 1.5 Vp_p
-3
4 Div.2V = (VOltS) x (no. of diV)
p-p div 1
Solution Using the equation,
3
Time
Div. 2~r---- ---~3
Volts 3Example 7.1 The waveform shown in Fig.7.50 is observed on the screen of an oscilloscope.If' the vertical attenuation is set to 0.5 V/div,determine the peak to peak amplitude of thesignal.
V. = (VOltS) x (no. of diV)p-p div 1
7.30.1 Voltage MeasurementsThe lTIOStdirect voltage measurement made with the help of an oscilloscope isthe peak to peak (P-p) value. The rms value of the voltage can then be easilycalculated from the p-p value.
To measure the voltage from the CRT display, one must observe the settingof the vertical attenuator expressed in VIdiv and the peak to peak deflection ofthe beam, i.e. the number of divisions. The peak to peak value of voltage is thencomputed as follows.
The range of applications of an oscilloscope varies from basic voltagemeasurements and waveform observation to highly specialised applications inall areas of science, engineering and technology.
7.30APPLICATIONS OF OSCILLOSCOPE
Within the probe tip is a 9 Mn resistor and shunted across this resistor is acapacitor. This capacitor is adjusted so that the ratio of the shunt capacitance tothe series capacitance is exactly 10 to 1.
The attenuator probe, often called a 10 to 1 probe, provides an approximately10 to 1 reduction in the input capacitance. However, it also gives a 10 to 1reduction in overall oscilloscope sensitivity.
The input capacitance is not constant from one oscilloscope to another hencethe probe is provided with an adjustable compensating capacitor. If the ratio ofthe series to shunt is not adjusted precisely to 10 to 1, the frequency response ofthe oscilloscope will be flat.
222 Electronic Instrumentation
Many oscilloscopes of laboratory quality include a delayed sweep feature. Thisfeature increases the versatility of the instrument by making it possible to magnifya selected portion of an undelayed sweep, measure waveform jitter or rise time,and check pulse time modulation, as well as many other applications.
Delayed sweep is a technique that adds a precise amount of time betweenthe trigger point and the beginning of the scope sweep. When the scope isbeing used in the sweep mode, the start of the horizontal sweep can be delayed,typically from a few us to perhaps 10 seconds or more. Delayed sweepoperation allows the user to view a small segment of the waveform, e.g. anoscillation or ringing that occurs during a small portion of a low frequencywaveform.
The most common approaches used by oscilloscpe manufacturers for delayedsweep operations are, the following.
1. Normal triggering sweep after the desired time delay, which is set fromthe panel controls.
2. A Delay Plus Trigger mode, where a visual indication, such as light,indicates that the delay time has elapsed and the sweep is ready to betriggered.
3. Intensified sweep, where the delayed sweep acts as a positionalmagnifier.
7.31DELAYED SWEEP
T = 2 fls x 4 = 8 flsHence frequency is calculated as
f= 11T= 1/8 us = 125 kHz
T = (ti~e) x (NO. of diVJdlV cycle
Solution The period of the signal is calculated using the equation
Example 7.2 If the time/div control is set to 2j.1S/divwhen the waveformin Fig. Ex. 7.1 is displayed on the CRT screen, determine the frequency of thesignal.
The frequency is then calculated asf= liT.
T = (ti~e) x (NO. of diVJdiv cycle
displayed on the CRT screen. Accuracy is generally improved if a single cycledisplayed fills as much of the horizontal distance across the screen as possible.
The period is calculated as follows.
Oscilloscope 223
Digital storage oscilloscope are available in processing and non-processing types.Processing types include built in computing power, which takes advantage of thefact that all data is already in digital form.
The inclusion of interfacing and a microprocessor provides a complete systemfor information acquisition, analysis and output. Processing capability rangesfrom simple functions (such as average, area, rms, etc.) to complete Fast FourierTransform (FFT) spectrum analysis capability.
(Units with built in hard copy plotters are particularly useful, since they canserve as digital scope high speed recorders, tabular printers and X- Y plotters, allin one unit, with computing power and an 81'2"x 11" paper/ink printout.)
Non-processing digital scopes are designed as replacements for analoginstruments for both storage and non-storage types. Their many desirable featuresmay lead to replace analog scopes entirely (within the Bandwidth range wheredigitization in feasible).
The basic principle of a digital scope is given in Fig. 7.51. The scope operatingcontrols are designed such that all confusing details are placed on the back sideand one appears to be using a conventional scope. However, some digital scopepanels are simpler also, most digital scopes provide the facility of switchingselectable to analog operation as one of the operating modes.
The basic advantage of digital operation is the storage capability, the storedwaveform can be repetitively read out, thus making transients appear repetitivelyand allowing their convenient display on the scope screen. (The CRT used indigital storage is an ordinary CRT, not a storage type CRT.)
Furthermore, the voltage and time scales of display are easily changed afterthe waveform has been recorded, which allows expansion (typically to 64 times)of selected portions, to observe greater details.
A cross-hair cursor can be positioned at any desired point on the waveformand the voltage/time values displayed digitally on the screen, and/or readoutelectrically.
Some scopes use 12 bit converters, giving 0.025% resolution and 0.1%accuracy on voltage and time readings, which are better than the 2-5% of analogscopes.
Split screen capabilities (simultaneously displaying live analog traces andreplayed stored ones) enable easy comparison of the two signals.
Pretrigger capability is also a significant advantage. The display of stored datais possible in both amplitude versus time and X- Y modes. In addition to the fastmemory readout used for CRT display, a slow readout is possible for producinghard copy with external plotters.
When more memory than the basic amount (typically 4096 points/words) isneeded, a magnetic disk accessory allows expansion to 32,000 points.
All digital storage scopes are limited in bandwidth by the speed of their A/Dconverters. However, 20 MHz digitizing rates available on some scopes yield a5 MHz bandwidth, which is adequate for most applications.
7.32DIGITAL STORAGE OSCILLOSCOPE (DSO)
224 Electronic Instrumentation

The analog input voltage is sampled at adjustable rates (up to 100,000 samplesper second) and data points are read onto the memory. A maximum of 4096points are storable in this particular instrument. (Sampling rate and memorysize are selected to suit the duration and waveform of the physical event beingrecorded.)
Once the sampled record of the event is captured in memory, many usefulmanipulations are possible, since Inemory can be read out without being erased.
If the memory is read out rapidly and repetitively, an input event which wasa single shot transient becomes a repetitive or continuous waveform that can beobserved easily on an ordinary scope (not a storage scope). The digital memoryalso may be read directly (without going through DAC) to, say, a computer wherea stored program can manipulate the data in almost any way desired.
Pre-triggering recording allows the input signal preceding the trigger points tobe recorded. In ordinary triggering the recording process is started by the rise ofthe input (or some external triggering) above some preset threshold value.
As in digital recorder, DSO can be set to record continuously (new data cominginto the memory pushes out old data, once memory is full), until the trigger
Fig.7.51 Digital storage eRO
External Trigger
4
3
2
In
DigitalOutput 10 Bit 12 Bit
DAC DAC
Amplifiers
Attenuator I'l Output Controlputs
& -V 10 BitOffset AID
1024 1024 1024 1024Word Word Word Word
Attenuator -[> Memory Memory Memory Memory10 Bit& r--
Offset AID4
Attenuator r-[> Record Control& 10 Bit
Offset AID __..
InternalAttenuator 1-[>& 10 Bit Timing
Offset AID Trigger &Circuit Mode
t Loaic
1
Analog Outputs (To CRO),.--J'-o.
Consider a single channnel of Fig. 7.51. The analog voltage input signal isdigitised in a 10 bit ND converter with a resolution of 0.1% (1 part in 1024)and frequency response of 25 kHz. The total digital memory storage capacity is4096 for a single channel, 2048 for two channels each and 1024 for four channelseach.
Oscilloscope 225

The familiar CRT oscilloscope has an extremely HF response, but permanentrecords, normally photography of the screen, cannot be taken, since they are timelimited to one sweep.
By combining a special fibre optic CRT with an oscillograph type paper drive(which passes the paper over the CRT face, where it is exposed by light from theCRT phosphor), a recording oscilloscope with uniquely useful characteristicsis obtained. If the paper is held still, conventional CRO operation allows singlesweep, i.e. amplitude versus time and X-Y recording of signals from de to 1
7.33FIBRE OPTIC CRT RECORDING OSCILLOSCOPE
The IE-522 Digital Storage Oscilloscopes (DSO) has the following features.1. Sampling rate 20 Mega-samples per second per channel. Max.
(simultaneous) capture of both channels.2. Pre-trigger: 25%, 50%, 75%, for Single Shot, Roll normal.3. Roll mode: (Continuous and Single Shot with Pre-trigger of25%, 50%,
75%)4. Single Shot (0.5 us Single shot @ 10 pts.ldiv resolution with pre-trigger
25%,50%, 75%)5. Digital Sweep rate: 0.5 us/ern to 50 sec/em, (event as long as 8.33
minutes can be captured)6. Computer built in Interface: (RS 232 Serial port and Centronics Parallel
interface) .
Fig. 7.52 25 MHz digital storage oscilloscope (IE-522) with computer interfacing[Courtesy: Inernational Electronics Ltd; Marketed: Signetics Electronics Ltd. Bombay]
- - - - - ~ - - - -
7.32.1 Commercial DSOIE-522 shown in illustration Fig. 7.52, is a 25 MHz analog digital storage dualtrace four display oscilloscope with computer interface.
signal is received; then the recording is stopped, thus freezing data received priorto the trigger signal in the memory.
An adjustable trigger delay allows operator control of the stop point, so that thetrigger may occur near the beginning, middle or end of the stored information.
226 Electronic Instrumentation
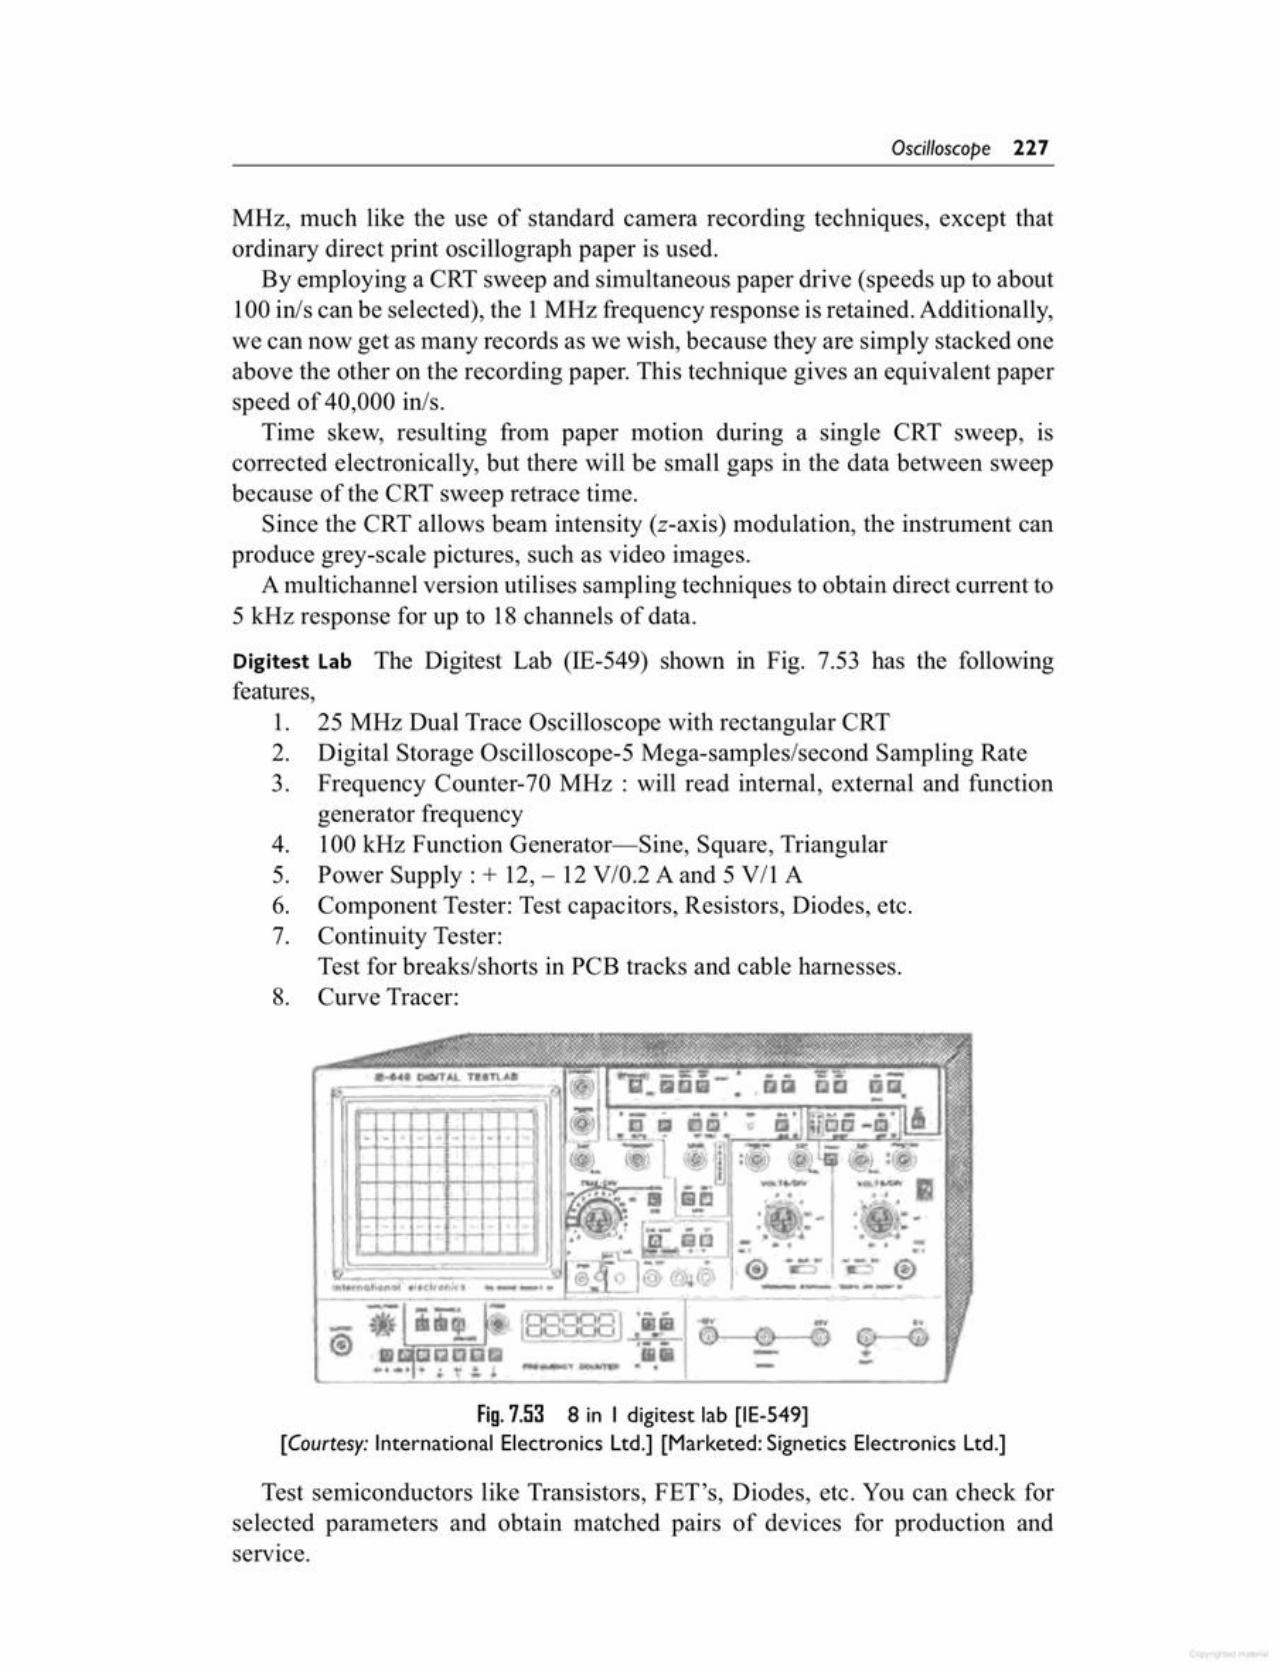
Test semiconductors like Transistors, FET's, Diodes, etc. You can check forselected parameters and obtain matched pairs of devices for production andservice.
Fig. 7.53 8 in I digitest lab [IE-549][Courtesy: International Electronics Ltd.] [Marketed: Signetics Electronics Ltd.]
--_ ....... _ __.....~"'---''''t,",''' ~.<t,.t""" -...
MHz, much like the use of standard camera recording techniques, except thatordinary direct print oscillograph paper is used.
By employing a CRT sweep and simultaneous paper drive (speeds up to about100 inls can be selected), the 1MHz frequency response is retained. Additionally,we can now get as many records as we wish, because they are simply stacked oneabove the other on the recording paper. This technique gives an equivalent paperspeed of 40,000 in/so
Time skew, resulting from paper motion during a single CRT sweep, iscorrected electronically, but there will be small gaps in the data between sweepbecause of the CRT sweep retrace time.
Since the CRT allows beam intensity (z-axis) modulation, the instrument canproduce grey-scale pictures, such as video images.
A multichannel version utilises sampling techniques to obtain direct current to5 kHz response for up to 18 channels of data.
Digitest Lab The Digitest Lab (IE-549) shown in Fig. 7.53 has the followingfeatures,
1. 25 MHz Dual Trace Oscilloscope with rectangular CRT2. Digital Storage Oscilloscope-5 Mega-samples/second Sampling Rate3. Frequency Counter- 70 MHz : will read internal, external and function
generator frequency4. 100 kHz Function Generator-Sine, Square, Triangular5. Power Supply: + 12, - 12 V/O.2A and 5 V/I A6. Component Tester: Test capacitors, Resistors, Diodes, etc.7. Continuity Tester:
Test for breaks/shorts in PCB tracks and cable harnesses.8. Curve Tracer:
Oscilloscope 227
In addition to the general safety precautions, the following specific precautionsshould be observed when operating any type of oscilloscope. Most of theprecautions also apply to recorders.
1. Always study the instruction manual of any oscilloscope with whichyou are not familiar even if you have had considerable experience withoscilloscopes.
2. Use the procedure of Section 7.35 to place the oscilloscope in operation.It is a good practice to go through the procedures each time theoscilloscope is used. This is especially true when the oscilloscope is usedby other persons. The operator cannot be certain that position, focus and(especially) intensity control are at safe positions and the oscilloscopeCRT could be damaged by switching on immediately.
3. As for any cathode ray tube device (such as a TV receiver), the CRTspot should be kept moving on the screen. If the spot must remain in oneposition, keep the intensity control as low as possible.
4. Always keep the minimum intensity necessary for good viewing.5. If possible, avoid using the oscilloscope in direct sunlight or in a brightly
lighted room. This will permit a low intensity setting. If the oscilloscopemust be used in bright light, use the viewing hood.
6. Make all measurements in the centre area of the screen; even if the CRTis fiat, there is a chance of reading errors caused by distortion at theedges.
7. Use only shielded probes. Never allow your fingers to slip down to themetal probe tip when the probe is in contact with a hot circuit.
8. Avoid operating an oscilloscope in a strong magnetic field. Such fieldscan causes distortion of the display. Most quality oscilloscopes are wellshielded against magnetic interference. However, the face of the CRT isexposed and is subjected to magnetic interference.
9. Most oscilloscopes and their probes have some maximum input voltagespecified in the instruction manual. Do not exceed this maximum value.Also, do not exceed the maximum line voltage or use a different powerfrequency.
10. Avoid operating the oscilloscope with the shield or case removed.Besides the danger of exposing high voltage circuits (several thousandvolts are used on the CRT), there is the hazard of the CRTs implodingand scattering glass at high velocity.
11. Avoid vibration and mechanical shock. Like most electronic equipment,an oscilloscope is a delicate instrument.
12. If an internal fan or blower is used, make sure that it is operating. Keepventilation air filters clean.
13. Do not attempt repair of an oscilloscope unless you are a qualifiedinstrument technician. If you must adjust any internal circuits, followthe instruction manual.
7.34OSCILLOSCOPE OPERATING PRECAUTIONS
228 Electronic Instrumentation
After the setup instruction of the oscilloscope manual have been digested, theycan be compared with the following general or typical procedures.
1. Set the power switch to Off2. Set the internal recurrent sweep to OFF3. Set the focus, gain, intensity and sync controls to their lowest position
(usually fully counterclockwise)4. Set the sweep selector to External5. Set the vertical and horizontal position controls to their approximate
midpoint6. Set the power switch to ON. It is assumed that the power cord has been
connected.7. After a suitable warmup period (as recommended by the manual) adjust
the intensity control until the trace spot appears on the screen. If a spot isnot visible at any setting of the intensity control, the spot is probably offscreen (unless the oscillsocope is defective). If necessary, use the verticaland horizontal position controls to bring the spot into view. Always usethe longest setting of the intensity control needed to see the spot, so as toprevent burning of the oscilloscope screen.It should be noted that de oscilloscopes need longer warmup times than acoscilloscopes because of drift problems associated with de amplifiers.
8. Set the focus control for a sharp fine dot9. Set the vertical and horizontal position controls to centre the spot on the
screen10. Set the sweep selector to Internal. This should be the linear internal
sweep, if more than one internal sweep is available.11. Set the internal recurrent sweep to ON. Set the sweep frequency to any
frequency, or a recurrent rate higher than 100 Hz.12. Adjust the horizontal gain control and check that the spot is expanded
into a horizontal trace or line. The line length should be controllable byadjusting the horizontal gain control.
13. Return the horizontal gain control to zero, set the internal recurrentsweep to OFF.
14. Set the vertical gain control to its approximate midpoint, and touch thevertical input with you finger. The stray signal pickup should cause the
7.35PLACING AN OSCILLOSCOPE IN OPERATION
14. Study the circuit under test before making any test connections. Try tomatch the capability of the oscilloscope to the circuit under test. Forexample, if the circuit has a range of measurements to be made (ac,de, RF, pulse), you must use a wide-band DC oscilloscope, with a lowcapacitance probe and possibly a demodulator probe. Do not try tomeasure 3 MHz signals with a 100 kHz bandwidth oscilloscope. Onthe other hand, it is wasteful to use a dual trace 50 MHz laboratoryoscilloscope to check out the audio sections of transistor radios.
Oscilloscope 229
14. Explain with a diagram the operationof a triggered sweep generator.
15. List the advantages of using negativesupply in a CRO.
16. Define intensity, focus and astigmatism.
17. Describe with a diagram the operation of a vertical amplifier. State thefunction of using FET stage in thevertical amplifier.
18. State the advantages of dual traceover dual beam?
19. Describe with diagram the operationof a dual beam CRO.
20. Explain the working principle of adual trace CRO.
21. Describe with a diagram and waveforms the operation of a dual traceCRO in alternate and Chop mode.State the functions of each block.
22. How does alternate sweep comparewith chopped sweep? When wouldone method be selected over theother?
23. State the function of the electronicswitch. Explain with a diagram theworking of an electronic switch.
24. Explain with a diagram the operationof a dual trace in X-Y mode.
25. Compare dual beam and dual traceCRO.
26. Explain with diagram the operationof a delayed sweep CRO. State theadvantages of using delayed sweepCRO.
1. List the major components of aCRT.
2. What does the term phosphorescencemean?
3. Explain the principle of operation ofa single beam CRO.
4. Draw the basic block diagram of anoscilloscope and state the functionsof each block.
5. How is an electron beam focusedonto a fine spot on the face of theCRT.
6. Why are the operating voltages of aCRT arranged so that the deflectionplates are at nearly ground potential?
7. How is the vertical axis of an oscilloscope deflected? How does it differfrom the horizontal axis?
8. How does the X-shift and Y-shiftfunction.
9. Explain the function of a triggercircuit.
10. State the function of a delay line usedin the vertical section of an oscilloscope.
11. List the various controls on the frontpanel of a CRO. State the function ofvarious controls on the front panel ofaCRO.
12. State the need of a time basegenerator.
13. Describe with a diagram the operation of a continuous sweep generator.List the drawbacks of a continuoussweep generator.
_R_e_v_ie_w_O_u_es_t_iD_ns ~~
spot to be deflected vertically into a trace of line. Check that the linelength is controllable by adjustment of the vertical gain control.
15. Return the vertical gain control to zero (or its lowest setting).16. Set the internal recurrent sweep to ON. Advance the horizontal gain
control to expand the spot into a horizontal line.17. If required, connect a probe to the vertical input.18. The oscilloscope should now be ready for immediate use. Depending on
the test to be performed the oscilloscope may require calibration.
230 Electronic Instrumentation
(b) 5 Hz(d) 500 Hz
5. The distance between two peaksmeasured on the X-axis is 2 em, at1 ms/div. The frequency of the signal is(a) 50 Hz(c) 1kHz
(a) to match the horizontal sweep ratewith the frequency of the verticalsignal
(b) to start the horizontal sweep at thesame relative point on the verticalsignal
(c) to adjust the intensity control(d) to control the gain of the amplifier
4. The amplitude read on CRO set of 1V/div is 1.5 em on the vertical axis.The value of amplitude in V is(a)l.5V (b)5V(c) 1 V (d) O.15 V
1. Post deflection acceleration is usedto(a) enhance the intensity of the beam(b) focus the beamc) repel the electron beam(d) increase the velocity of the elec
tron beam2. Trigger pulses in the CRO are used
(a) to generate high voltage requiredfor the CRT
(b) to synchronise the input with thetime base generator
(c) to synchronise the input and thevertical amplifier
(d) to generate low voltages requiredfor the CRT
3. The function of the sync section inCRO is
_M_u_lt~ip_le_C_h_Di_ce_D_u_e_st_iD_ns ~~
frequency can be measured using agear wheel method.
36. Compare the spot wheel method withthat of the gear wheel method.
37. Explain with a diagram how CROcan be used to check diodes, inductors and capacitors.
38. State the standard specifications of asimple CRO.
39. State the function of a probe. Statethe function and explain with a diagram the operation of a 10:1probe.
40. Compare passive probes with activeprobes.
41. State the advantages of using aprobe.
42. State the function of attenuators inCRO.
43. What do you understand by compensation in attenuators? Explain witha diagram the operation of a simplecompensated attenuator.
44 State the various applications of anoscilloscope.
27. How does the sampling CRO Increase the apparent frequency response of an oscilloscope.
28. Describe with diagram the operationof a sampling CRO. State the function of the staircase generator used ina sampling CRO.
29. Explain with a diagram the principleof analog storage CRO.
30. What is the speciality of a storageCRO.
31. Describe with a diagram the operation of an analog storage CRO.
32. State the advantages and disadvantages of a phosphor storage oscilloscope.
33. Describe with a block diagram theoperation of a digital storage CRO.State the functions of each block.
34. Explain how frequency can be measured by a CRO using lissajous figures.
35. Explain with a diagram how frequency can be measured using spot wheelmethod. Explain with a diagram how
Oscilloscope 23 I
4. Oliver Cage, Electronic Measurements & Instrumentation, McGrawHill, 1975.
5. Rudolf F. Graf, ABCs of ElectronicTest Probes, Howard.W.Sams & Co.,1966.
6. Vestor Robinson, Handbook of Electronic Instrumentation Testing &Troubleshooting, D.B. TaraporewalaSons & CO., 1979.
1. Refuse P. Turner, Practical Oscilloscope Handbook, Vol. 2, D.B. Taraporewala Sons & Co., 1985.
2. John D. Lenk, Handbook of Oscilloscope: Theory and Application,Prentice-Hall of India, 1968.
3. John D. Lenk, Handbook of Electronic Meters (Theory and Applications), D.B. Taraporewala Sons &Co., Prentice-Hall, 1980)
_F_u_rt_he_r_R_ea_d_in_g ~~
Determine the frequency of verticalinput.
3. A CRO is set to a time base of 0.1rns/cm with a 10 cm amplitude.Sketch the display of the pulse signalwaveform with a pulse repetition rateof 2000 Hz and a duty cycle of 25%.
1. A CRO with a sensitivity of5 V/cm isused. An ac voltage is applied to they-input. A 10 em long straight line isobserved. Determine the ac voltage.
2. The Lissajous pattern on an CRO isstationary and has five horizontal andtwo vertical tangencies. The frequency of the horizontal input is 1000 Hz.
_P_r_ac_ti_ce__ Pr_D_bl_em_s ~~
8. An electronic switch is used in a(a) single beam CRO(b) dual beam CRO(c) dual Trace CRO(d) sampling CRO
9. A sampling CRO is used for(a) HF (b) VLF (c) VHF (d) LF
10. An analog storage CRO is used fordisplaying waveforms in the frequency range of(a) VHF (b) VLF (c) HF (d) LF
6. A dual beam CRO uses(a) electronic switch(b) two electron guns(c) one electron gun(d) two time base generator circuits
7. A dual trace CRO uses(a) one electron gun(b) two electron guns(c) two pairs ofVDPsCd)two pairs ofHDPs
232 Electronic Instrumentation
A signal generator is a vital component in a test setup, and in electronictroubleshooting and development, whether on a service bench or in a researchlaboratory. Signal generators have a variety of applications, such as checking thestage gain, frequency response, and alignment in receivers and in a wide rangeof other electronic equipment.
They provide a variety of waveforms for testing electronic circuits, usually atlow powers. The term oscillator is used to describe an instrument that providesonly a sinusoidal output signal, and the term generator to describe an instrumentthat provides several output waveforms, including sine wave, square wave,triangular wave and pulse trains, as well as an amplitude modulated waveform.Hence, when we say that the oscillator generates a signal, it is important to notethat no energy is created; it is simply converted from a de source into ac energyat some specific frequency.
There are various types of signal generator but several requirements arecommon to all types.
1. The frequency of the signal should be known and stable.2. The amplitude should be controllable from very small to relatively large
values.3. Finally, the signal should be distortion-free
The above mentioned requirements vary for special generators, such asfunction generators, pulse, and sweep generators.
Various kinds of signals, at both audio and radio frequencies, are requiredat various times in an instrumentation system. In most cases a particular signalrequired by the instrument is internally generated by a self-contained oscillator.The oscillator circuit commonly appears in a fixed frequency form (e.g. whenit provides a 1000 cis excitation source for an ac bridge). In other cases, suchas in a Q-meter, oscillators in the form of a variable frequency arrangementfor covering Q-measurements over a wide range of frequencies, from a few100 kHz to the MHz range, are used.
In contrast with self-contained oscillators that generate only the specific signalsrequired by the instrument, the class of generators that are available as separateinstruments to provide signals for general test purposes are usually designated as
8.1INTRODUCTION
Signal Generators
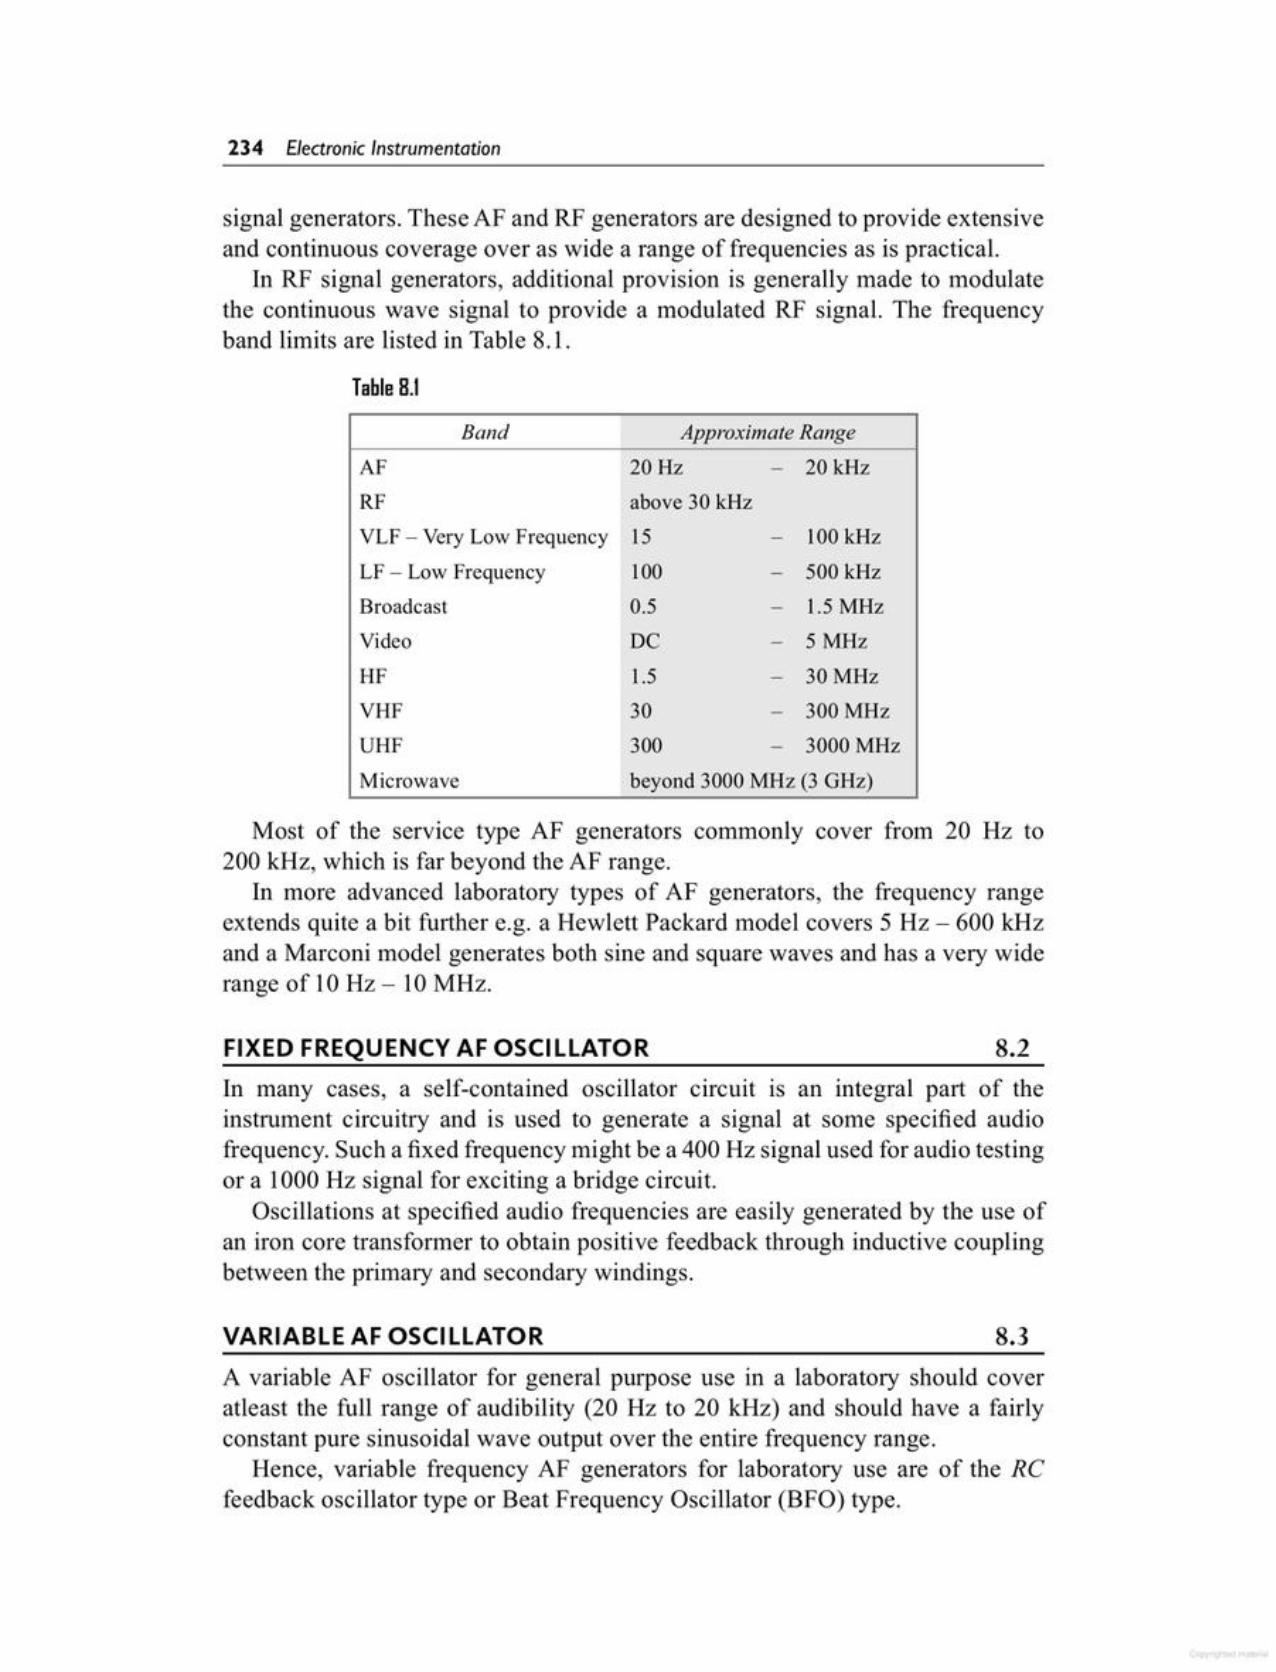
A variable AF oscillator for general purpose use in a laboratory should coveratleast the full range of audibility (20 Hz to 20 kHz) and should have a fairlyconstant pure sinusoidal wave output over the entire frequency range.
Hence, variable frequency AF generators for laboratory use are of the RCfeedback oscillator type or Beat Frequency Oscillator (BFO) type.
8.3VARIABLE AF OSCILLATOR
In many cases, a self-contained oscillator circuit is an integral part of theinstrument circuitry and is used to generate a signal at some specified audiofrequency. Such a fixed frequency might be a 400 Hz signal used for audio testingor a 1000 Hz signal for exciting a bridge circuit.
Oscillations at specified audio frequencies are easily generated by the use ofan iron core transformer to obtain positive feedback through inductive couplingbetween the primary and secondary windings.
8.2FIXED FREQUENCY AF OSCILLATOR
Most of the service type AF generators COlTIlTIOnlycover from 20 Hz to200 kHz, which is far beyond the AF range.
In more advanced laboratory types of AF generators, the frequency rangeextends quite a bit further e.g. a Hewlett Packard model covers 5 Hz - 600 kHzand a Marconi model generates both sine and square waves and has a very widerange of 10 Hz - 10 MHz.
IS - 100 kHz100 - SOOkHzO.S - 1.SMHzDC - SMHz1.S - 30 MHz30 - 300 MHz300 - 3000 MHzbeyond 3000 MHz (3 GHz)
20 Hz - 20 kHzabove 30 kHz
Microwave
AFRFVLF - Very Low FrequencyLF - Low FrequencyBroadcastVideo
HFVHFUHF
Approximate RangeBand
Table 8.1
signal generators. These AF and RF generators are designed to provide extensiveand continuous coverage over as wide a range of frequencies as is practical.
In RF signal generators, additional provision is generally made to modulatethe continuous wave signal to provide a modulated RF signal. The frequencyband limits are listed in Table 8.1.
234 Electronic Instrumentation
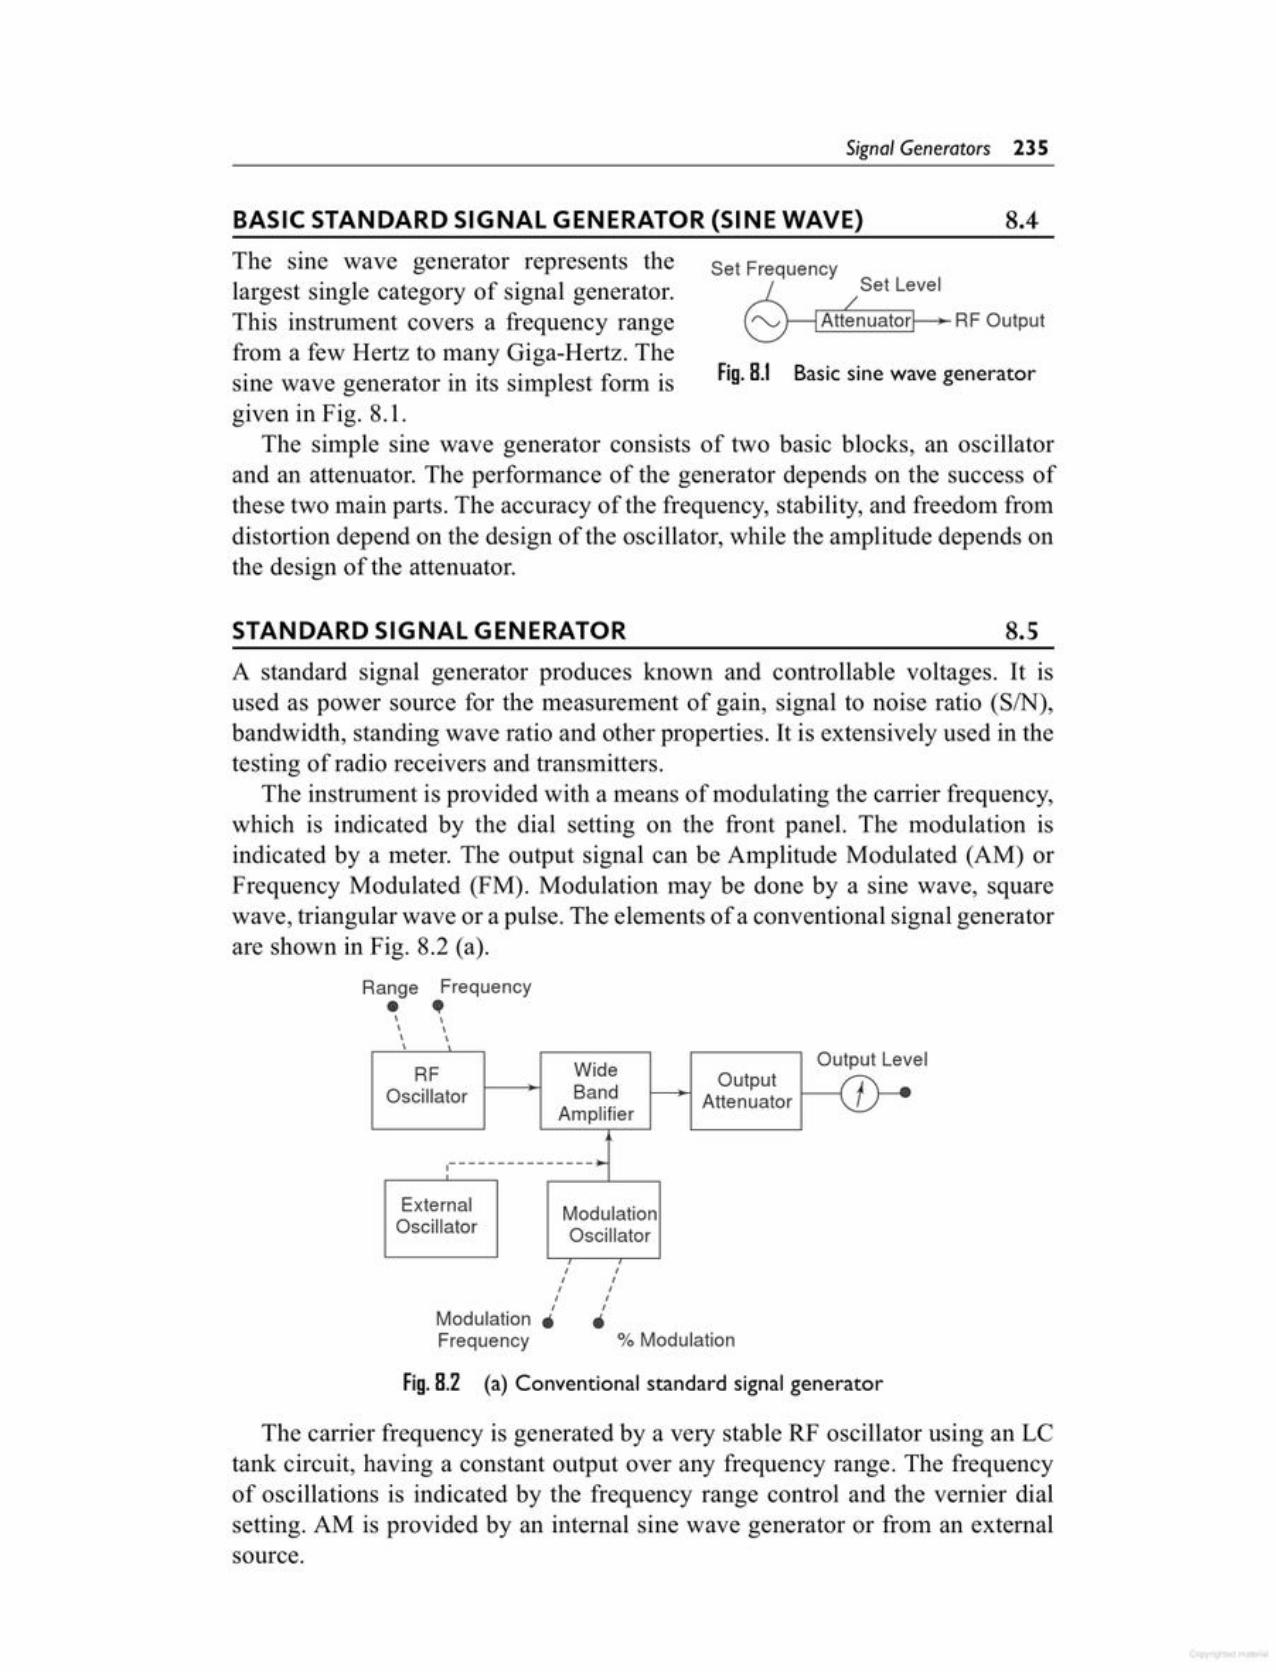
The carrier frequency is generated by a very stable RF oscillator using an LCtank circuit, having a constant output over any frequency range. The frequencyof oscillations is indicated by the frequency range control and the vernier dialsetting. AM is provided by an internal sine wave generator or from an externalsource.
Fig. 8.2 (a) Conventional standard signal generator
I II II II II I
Modulation. •Frequency % Modulation
el\ ,
RF Wide Output LevOutput
Oscillator Band fAttenuatorAmplifier
:---------------~External ModulationOscillator Oscillator
,
Range Frequency• •\ \\ \\ \
A standard signal generator produces known and controllable voltages. It isused as power source for the measurement of gain, signal to noise ratio (SIN),bandwidth, standing wave ratio and other properties. It is extensively used in thetesting of radio receivers and transmitters.
The instrument is provided with a means of modulating the carrier frequency,which is indicated by the dial setting on the front panel. The modulation isindicated by a meter. The output signal can be Amplitude Modulated (AM) orFrequency Modulated (PM). Modulation may be done by a sine wave, squarewave, triangular wave or a pulse. The elements of a conventional signal generatorare shown in Fig. 8.2 (a).
8.5STANDARD SIGNAL GENERATOR
Basic sine wave generatorFig. 8.1
The sine wave generator represents the Set Frequencylargest single category of signal generator. Set Level
This instrument covers a frequency rangefrom a few Hertz to many Giga-Hertz. Thesine wave generator in its simplest form isgiven in Fig. 8.1.
The simple sine wave generator consists of two basic blocks, an oscillatorand an attenuator. The performance of the generator depends on the success ofthese two main parts. The accuracy of the frequency, stability, and freedom fromdistortion depend on the design of the oscillator, while the amplitude depends onthe design of the attenuator.
BASIC STANDARD SIGNAL GENERATOR (SINE WAVE) 8.4
Signal Generators 235

To improve the frequency stability, a single master oscillator is optimallydesigned for the highest frequency range and frequency dividers are switched into produce lower ranges. In this manner the stability of the top range is impartedto all the lower ranges.
The master oscillator is made insensitive to temperature variations and alsoto the influence of the succeeding stages by careful circuit design. Temperaturecompensation devices are used for any temperature changes. The block diagramof the modem standard signal generator is given in Fig. 8.3.
The highest frequency range of 34 - 80 MHz, is passed through B I' anuntuned buffer amplifier, B2 and B3 are additional buffer amplifiers and A is themain amplifier. The lowest frequency range produced by the cascaded frequency
8.6MODERN LABORATORY SIGNAL GENERATOR
Fig. B.2 (b) Commercial I 10 MHzAM/FM Signal Generator (IE900A) along with aFrequency Counter [Courtesy: International Electronics Ltd., Bombay]
_.ro-I '"a;. OIITrv
•rI
~ ..tf" ,...".~..y •.4." ~
(Modulation is done in the output amplifier circuit. This amplifier delivers itsoutput, that is, modulation carrier, to an attenuator. The output voltage is read byan output meter and the attenuator output setting.)
Frequency stability is limited by the LC tank circuit design of the masteroscillator. Since range switcbing is usually accompl ished by selecting appropriatecapacitors, any change in frequency range upsets the circuit design to someextent and the instrument must be given time to stabilise at the new resonantfrequency.In high frequency oscillators, it is essential to isolate the oscillator circuit
from the output circuit. This isolation is necessary, so that changes occurring inthe output circuit do not affect the oscillator frequency, amplitude and distortioncharacteristics. Buffer amplifiers are used for this purpose.
Figure 8.2(b) illustrates a commercial AM/FM signal generator (IE900A)having a frequency range from 100 kHz - 110 MHz, along with a frequencycounter and TTL output.
236 Electronic Instrumentation
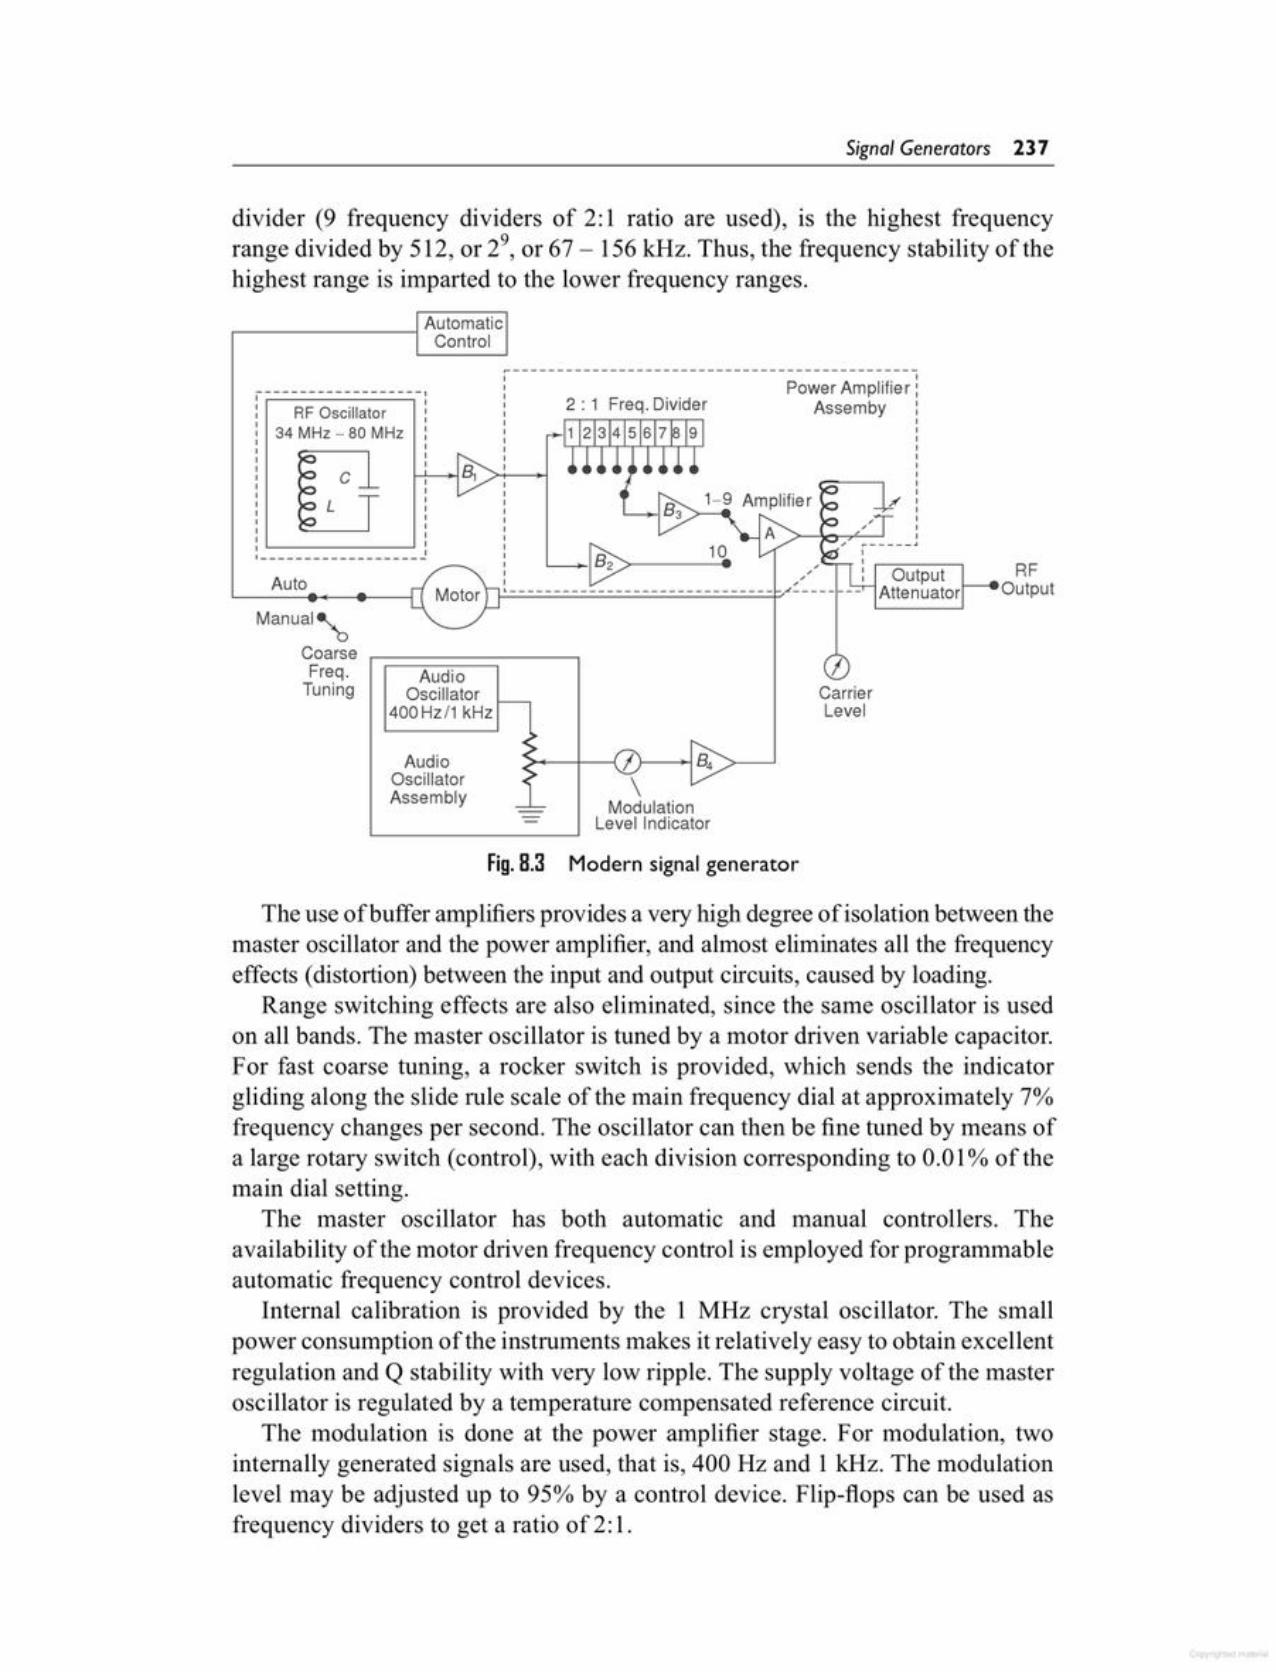
The use of buffer amplifiers provides a very high degree of isolation between themaster oscillator and the power amplifier, and almost eliminates all the frequencyeffects (distortion) between the input and output circuits, caused by loading.
Range switching effects are also eliminated, since the same oscillator is usedon all bands. The master oscillator is tuned by a motor driven variable capacitor.For fast coarse tuning, a rocker switch is provided, which sends the indicatorgliding along the slide rule scale of the main frequency dial at approximately 7%frequency changes per second. The oscillator can then be fine tuned by means ofa large rotary switch (control), with each division corresponding to 0.01% of themain dial setting.
The master oscillator has both automatic and luanual controllers. Theavailability of the motor driven frequency control is employed for programmableautomatic frequency control devices.
Internal calibration is provided by the 1 MHz crystal oscillator. The smallpower consumption of the instruments makes it relatively easy to obtain excellentregulation and Q stability with very low ripple. The supply voltage of the masteroscillator is regulated by a temperature compensated reference circuit.
The modulation is done at the power amplifier stage. For modulation, twointernally generated signals are used, that is, 400 Hz and 1 kHz. The modulationlevel may be adjusted up to 95% by a control device. Flip-flops can be used asfrequency dividers to get a ratio of 2: l.
Modern signal generatorFig. 8.3
ModulationLevel Indicator
fCarrierLevel
AudioOscillatorAssembly
Manual~
Coarse r;::=======:::::;---iFreq. AudioTuning Oscillator
400Hz/1 kHz
RFOutputAuto
1 ------------
/11111
L
Power Amplifie rAssemby2 : 1 Freq. Divider
9
c
.------------------1: RF OscillatorI
34 MHz - 80 MHz
,--------1 AutomaticControl
divider (9 frequency dividers of 2: 1 ratio are used), is the highest frequencyrange divided by 512, or 29, or 67 - 156 kHz. Thus, the frequency stability of thehighest range is imparted to the lower frequency ranges.
Signal Generators 237

The signal generator is called an oscillator. A Wien bridge oscillator is usedin this generator. The Wien bridge oscillator is the best for the audio frequencyrange. The frequency of oscillations can be changed by varying the capacitancein the oscillator. The frequency can also be changed in steps by switching inresistors of different values.
The output of the Wien bridge oscillator goes to the function switch. Thefunction switch directs the oscillator output either to the sine wave amplifier orto the square wave shaper, At the output, we get either a square or sine wave. Theoutput is varied by means of an attenuator.
The instrument generates a frequency ranging from 10Hz to 1 MHz,continuously variable in 5 decades with overlapping ranges. The output sinewave amplitude can be varied from 5 mV to 5 V (rms).The output is takenthrough a push-pull amplifier. For low output, the impedance is 600Q. The squarewave amplitudes can be varied from 0 - 20 V (peak). It is possible to adjust thesymmetry of the square wave from 30 - 700/0.The instrument requires only 7 Wof power at 220 V - 50 Hz.
The front panel of a signal generator consists of the following.1. Frequency selector It selects the frequency in different ranges and
varies it continuously in a ratio of 1 : 11. The scale is non-linear.2. Frequency multiplier It selects the frequency range over 5 decades,
from 10Hz to 1 MHz.3. Amplitude multiplier It attenuates the sine wave in 3 decades, x 1,
x 0.1 and x 0.01.4. Variableamplitude It attenuates the sine wave amplitude continuously.5. Symmetry control It varies the symmetry of the square wave from 30%
to 70%.6. Amplitude It attenuates the square wave output continuously.7. Function switch It selects either sine wave or square wave output.
Fig.8.4 AF sine and square wave generator
SquareSquare Amplifier OutputWave 1--1 Square AttenuatorShaper Wave I1J1
WienBridge
Oscillator /.'----------' / .
>--JA~t~te~n~ua~t~or~~~SineOutput
FunctionSwitch
Amplitude
The block diagram of an AF Sine-Square wave audio oscillator is illustrated inFig. 8.4.
8.7AF SINE AND SQUARE WAVE GENERATOR
238 Electronic Instrumentation
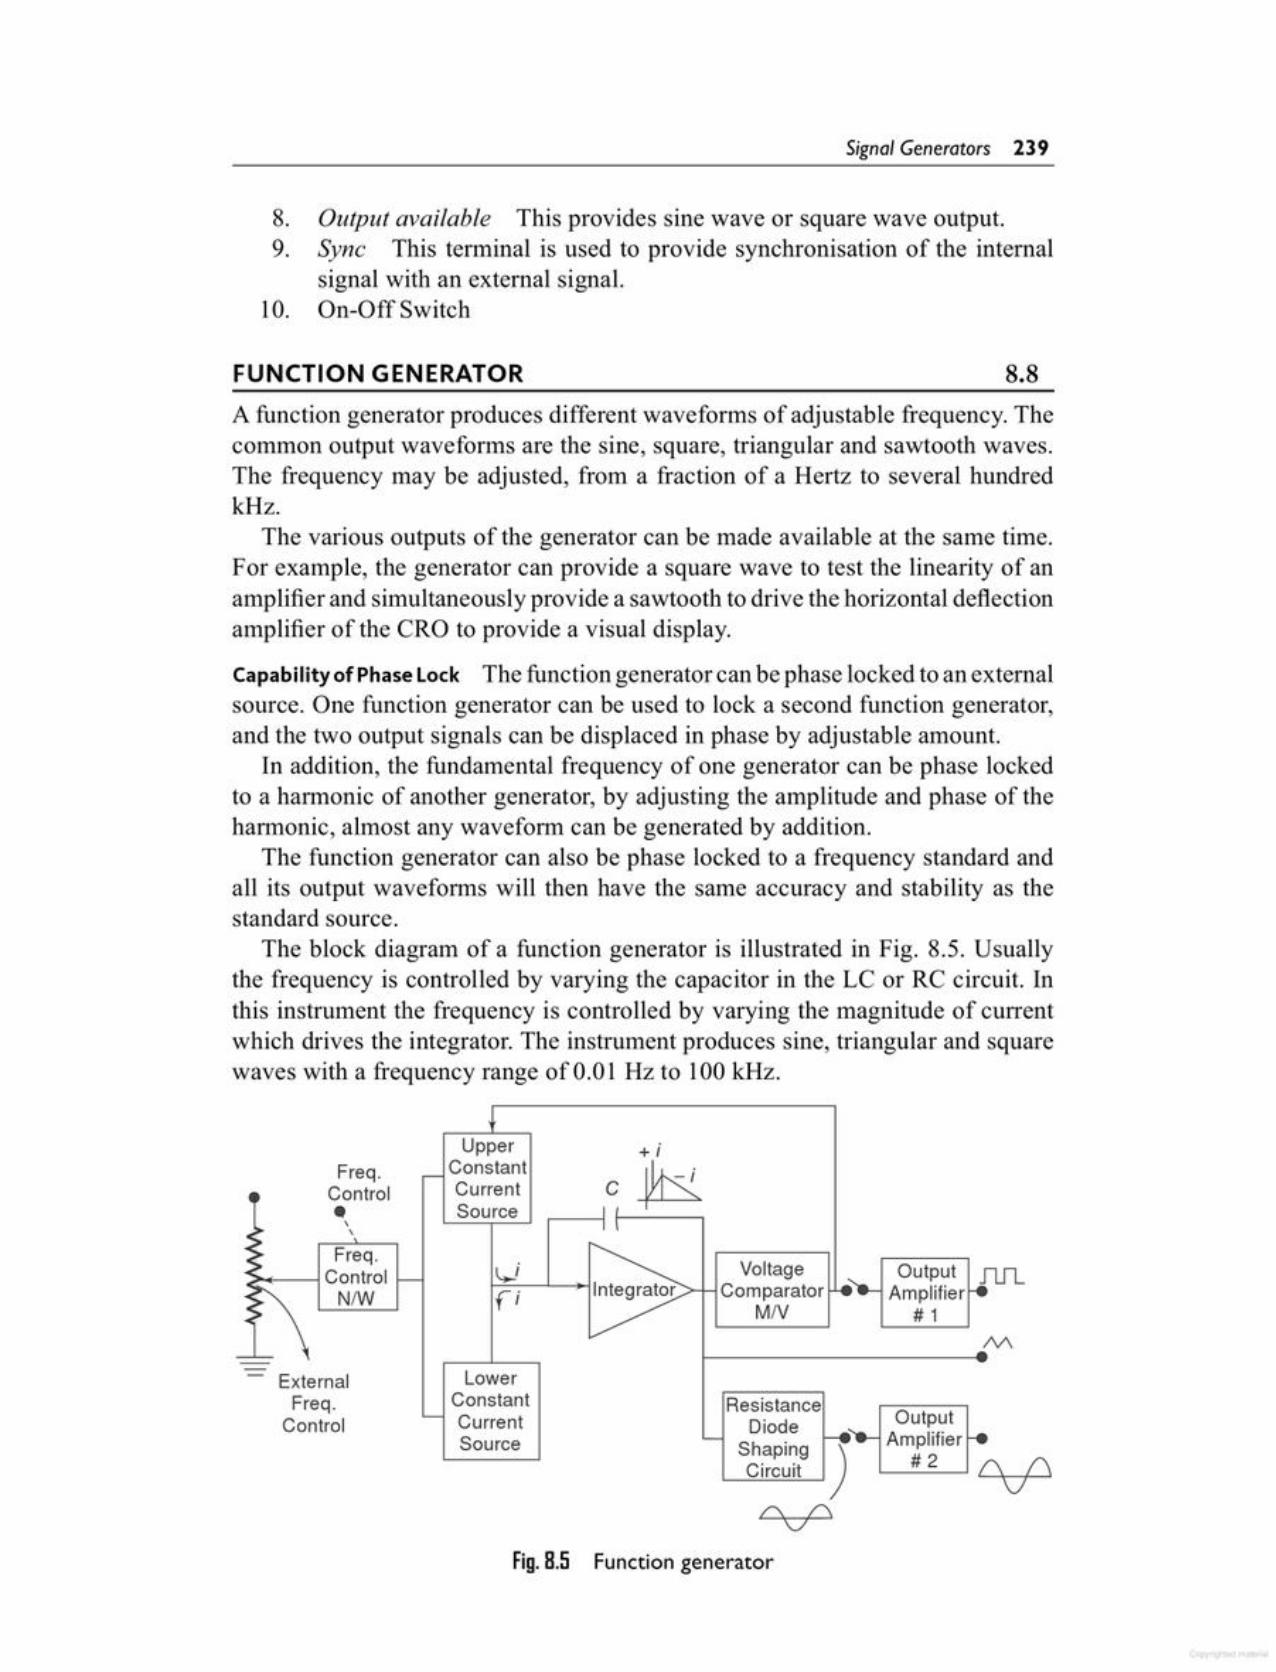
Fig. 8.5 Function generator
C\ /)V
)
I1Il.
tUpper +i
Freq. - Constant
~~ Control Current C• Source I I
~\ I \\
~ Freq.V Voltage OutputL.__
~ NIW f"i Integrator I- Comparator Amplifier re<' M/V # 1
~ -- Lower- ExternalFreq. Constant Resistance
Control - Current Diode OutputSource '--
Shaping 1'. Amplifier ....Circuit #2
A function generator produces different waveforms of adjustable frequency. Thecommon output waveforms are the sine, square, triangular and sawtooth waves.The frequency may be adjusted, from a fraction of a Hertz to several hundredkHz.
The various outputs of the generator can be made available at the same time.For example, the generator can provide a square wave to test the linearity of anamplifier and simultaneously provide a sawtooth to drive the horizontal deflectionamplifier of the CRO to provide a visual display.
Capability of Phase Lock The function generator can be phase locked to an externalsource. One function generator can be used to lock a second function generator,and the two output signals can be displaced in phase by adjustable amount.
In addition, the fundamental frequency of one generator can be phase lockedto a harmonic of another generator, by adjusting the amplitude and phase of theharmonic, almost any waveform can be generated by addition.
The function generator can also be phase locked to a frequency standard andall its output waveforms will then have the same accuracy and stability as thestandard source.
The block diagram of a function generator is illustrated in Fig. 8.5. Usuallythe frequency is controlled by varying the capacitor in the LC or RC circuit. Inthis instrument the frequency is controlled by varying the magnitude of currentwhich drives the integrator. The instrument produces sine, triangular and squarewaves with a frequency range of 0.01 Hz to 100 kHz.
8.8FUNCTION GENERATOR
8. Output available This provides sine wave or square wave output.9. Sync This terminal is used to provide synchronisation of the internal
signal with an external signal.10. On-Off Switch
Signal Generators 239

2.
8.9.11.
Requirements of a PulseThe pulse should have minimum distortion, so that any distortion, in thedisplay is solely due to the circuit under test.The basic characteristics of the pulse are rise time, overshoot, ringing,sag, and undershoot.The pulse should have sufficient maximum amplitude, if appreciableoutput power is required by the test circuit, e.g. for magnetic corememory. At the same time, the attenuation range should be adequateto produce small amplitude pulses to prevent over driving of some testcircuit.
3.
D Ipulse width
uty cyc e = -=-------pulse period
A square wave generator has a 500/0 duty cycle.
These generators are used as measuring devices in combination with a Ck.O.They provide both quantitative and qualitative information of the system undertest. They are made use of in transient response testing of amplifiers. Thefundamental difference between a pulse generator and a square wave generatoris in the duty cycle.
8.9SQUARE AND PULSE GENERATOR (LABORATORY TYPE)
1 f
eout = -- f idtCo
An increase or decrease in the current increases or decreases the slope of theoutput voltage and hence controls the frequency.
The voltage comparator multivibrator changes states at a pre-determinedmaximum level of the integrator output voltage. This change cuts off the uppercurrent supply and switches on the lower current supply.
The lower current source supplies a reverse current to the integrator, so that itsoutput decreases linearly with time. When the output reaches a pre-determinedminimum level, the voltage comparator again changes state and switches on theupper current source.
The output of the integrator is a triangular waveform whose frequency isdetermined by the magnitude of the current supplied by the constant currentsources.
The comparator output delivers a square wave voltage of the same frequency.The resistance diode network alters the slope of the triangular wave as itsamplitude changes and produces a sine wave with less than 1% distortion.
The frequency controlled voltage regulates two current sources. The uppercun·ent source supplies constant current to the integrator whose output voltagemcreases linearly with time, according to the equation of the output signalvoltage.
240 Electronic Instrumentation
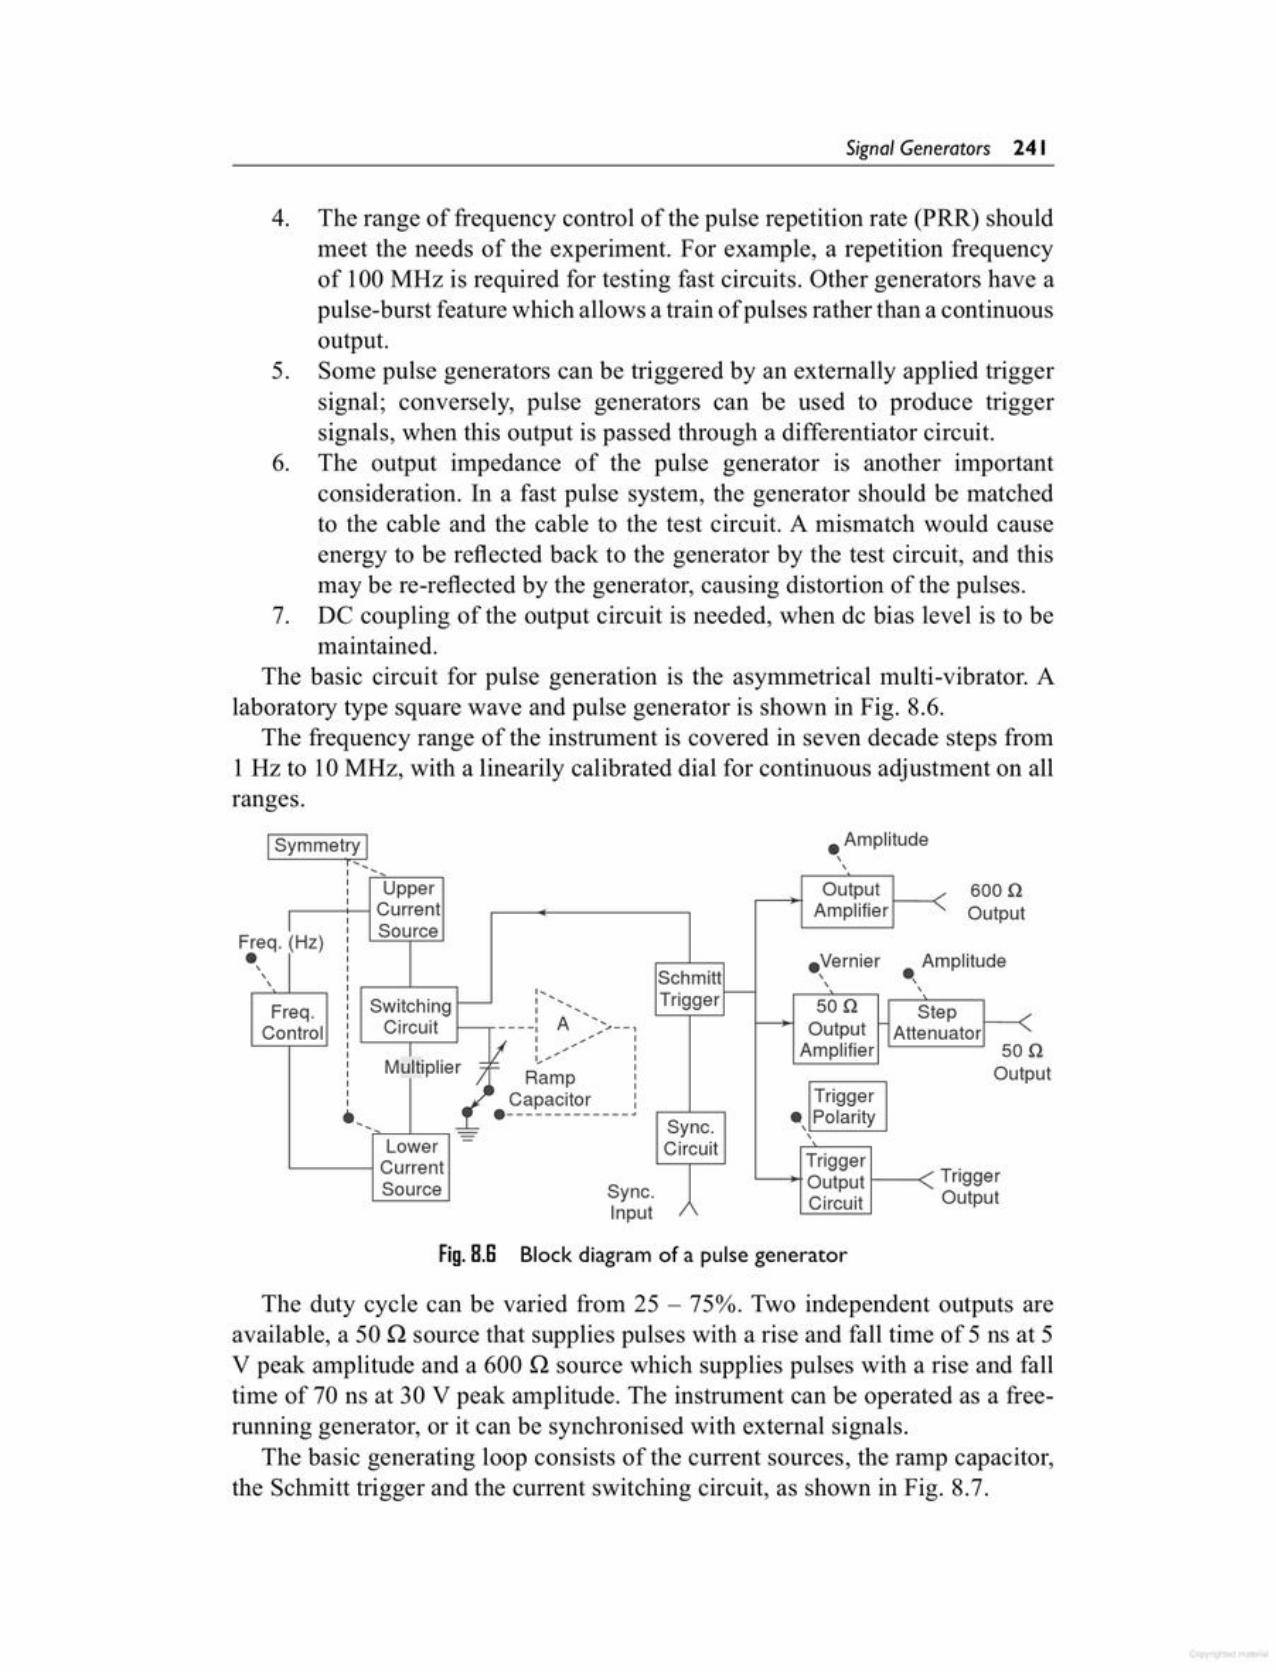
The duty cycle can be varied from 25 - 75%. Two independent outputs areavailable, a 50 Q source that supplies pulses with a rise and fall time of 5 ns at 5V peak amplitude and a 600 Q source which supplies pulses with a rise and falltime of 70 ns at 30 V peak amplitude. The instrument can be operated as a freerunning generator, or it can be synchronised with external signals.
The basic generating loop consists of the current sources, the ramp capacitor,the Schmitt trigger and the current switching circuit, as shown in Fig. 8.7.
p
Fig. B.S Block diagram of a pulse generator
nput
,,Upper Output 600nCurrent Amplifier Output
~HZ) Source.Vernier Amplitude
Schmitt , .,,I, f-- ,
Switching - 1 " Trigger 50neq. I ......... StepCircuit 1 A ,,
ntrol ----I .......--1 Output Attenuatort
1 ~~ 1
MulltiPlier ~1 ,~ 1 Amplifier 50I,~~ 1
1 OutRamp 11
Capacitor : Trigger., .-------------" • Polarity,- Sync. ,,Lower - CircuitCurrent Trigger
/ TriggerSource Sync. Output
In ut Circuit Output
FrCo
Freq.•,,,
• Amplitude,,ISymmetry I
4. The range of frequency control of the pulse repetition rate (PRR) shouldmeet the needs of the experiment. For example, a repetition frequencyof 100 MHz is required for testing fast circuits. Other generators have apulse-burst feature which allows a train of pulses rather than a continuousoutput.
5. Some pulse generators can be triggered by an externally applied triggersignal; conversely, pulse generators can be used to produce triggersignals, when this output is passed through a differentiator circuit.
6. The output impedance of the pulse generator is another importantconsideration. In a fast pulse system, the generator should be matchedto the cable and the cable to the test circuit. A mismatch would causeenergy to be reflected back to the generator by the test circuit, and thismay be re-reflected by the generator, causing distortion of the pulses.
7. DC coupling of the output circuit is needed, when de bias level is to bemaintained.
The basic circuit for pulse generation is the asymmetrical multi-vibrator. Alaboratory type square wave and pulse generator is shown in Fig. 8.6.
The frequency range of the instrument is covered in seven decade steps from1 Hz to 10 MHz, with a linearily calibrated dial for continuous adjustment on allranges.
Signal Generators 241
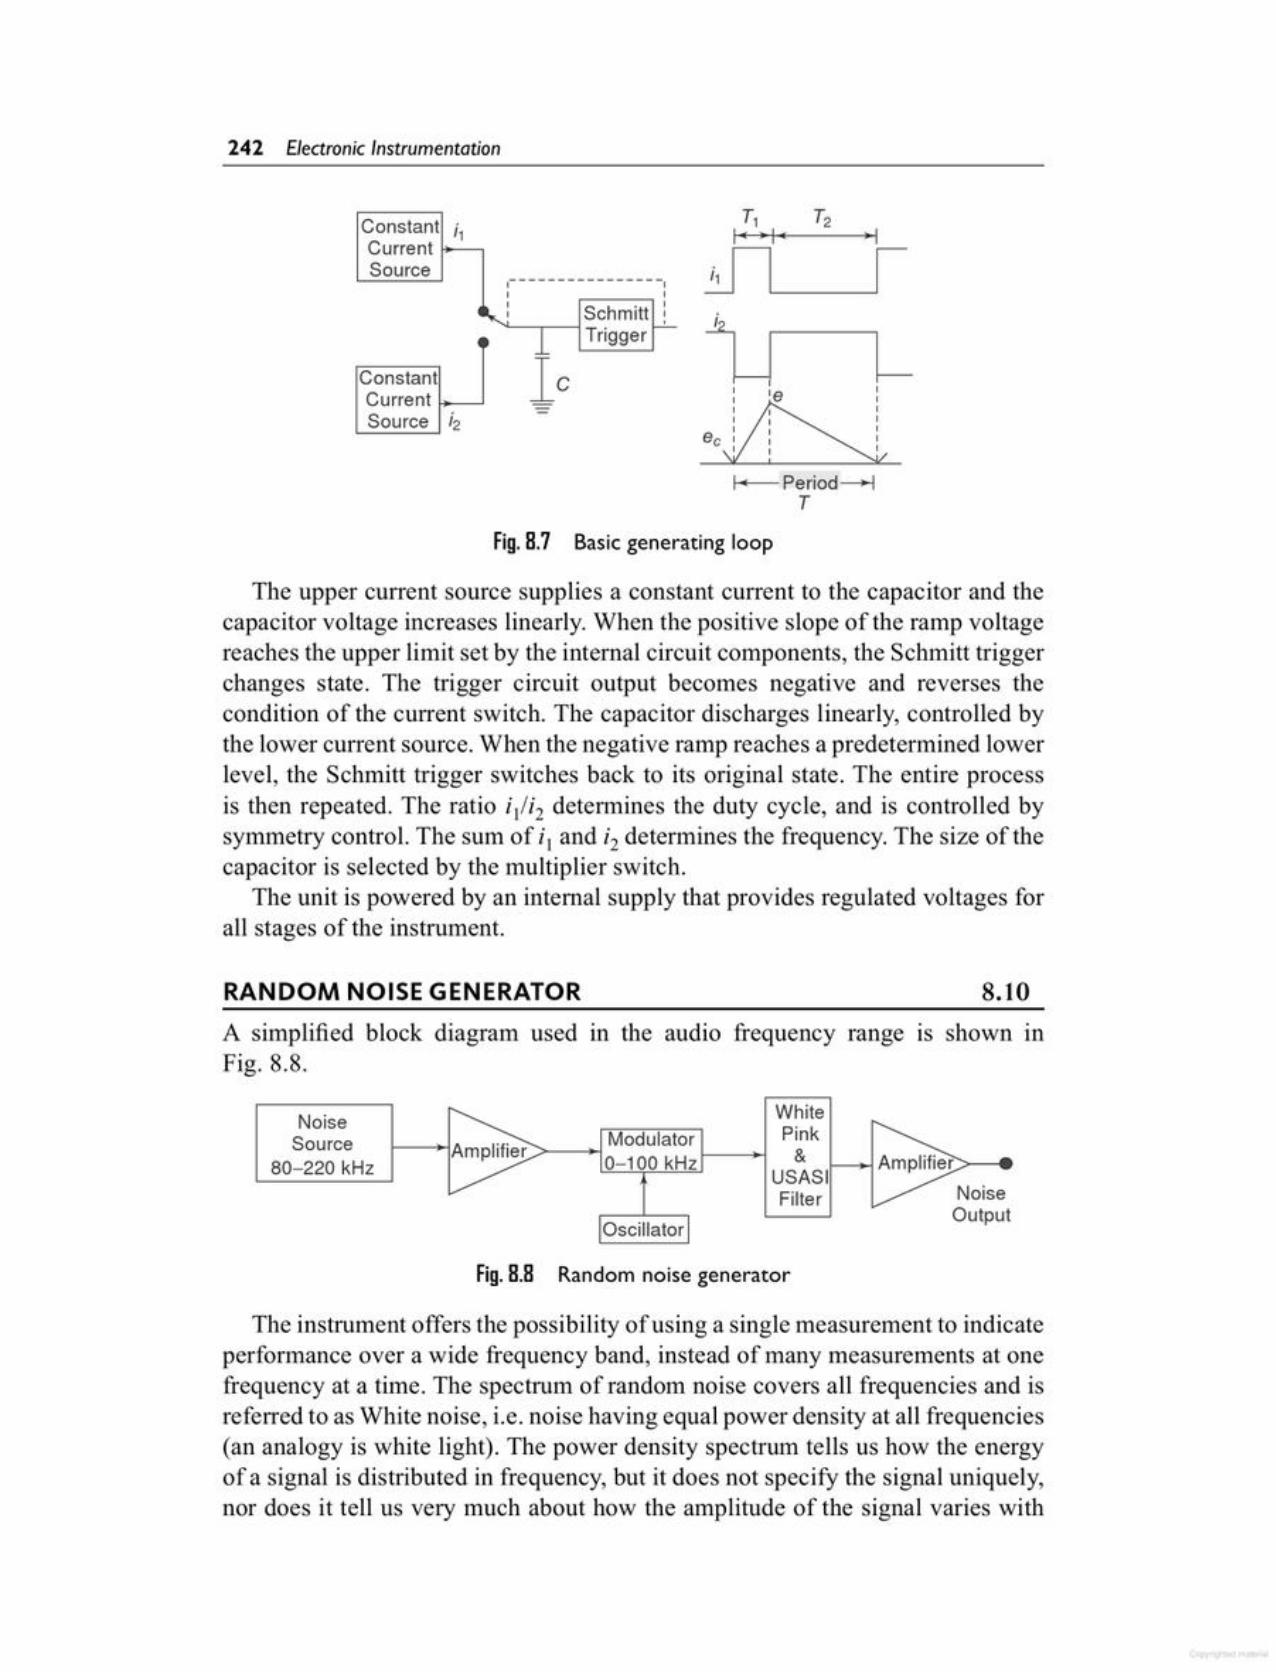
The instrument offers the possibility of using a single measurement to indicateperformance over a wide frequency band, instead of many measurements at onefrequency at a time, The spectrum of random noise covers all frequencies and isreferred to as White noise, i.e. noise having equal power density at all frequencies(an analogy is white light). The power density spectrum tells us how the energyof a signal is distributed in frequency, but it does not specify the signal uniquely,nor does it tell us very much about how the amplitude of the signal varies with
Fig.8.8 Random noise generator
NoiseOutput
Oscillator
WhiteModulator Pink
>------+10-100 kHz I--~ &USASIFilter
NoiseSource
80-220 kHz
A simplified block diagram used in the audio frequency range IS shown inFig. 8.8.
8.10RANDOM NOISE GENERATOR
The upper current source supplies a constant current to the capacitor and thecapacitor voltage increases linearly. When the positive slope of the ramp voltagereaches the upper limit set by the internal circuit components, the Schmitt triggerchanges state. The trigger circuit output becomes negative and reverses thecondition of the current switch. The capacitor discharges linearly, controlled bythe lower current source. When the negative ramp reaches a predetermined lowerlevel, the Schmitt trigger switches back to its original state. The entire processis then repeated. The ratio i/i2 determines the duty cycle, and is controlled bysymmetry control. The sum of i I and i2 determines the frequency. The size of thecapacitor is selected by the multiplier switch.
The unit is powered by an internal supply that provides regulated voltages forall stages of the instrument.
Fig.8.7 Basic generating loop
I ( Period---lT
IIIIIec II
I
'eConstantCurrent ~_J
Source i2
i
i1-
T1 T2I' • I ( , I
0-
Constant i1CurrentSource
I---------------- II II Schmitt
II I
1 Trigger....!-
242 Electronic Instrumentation
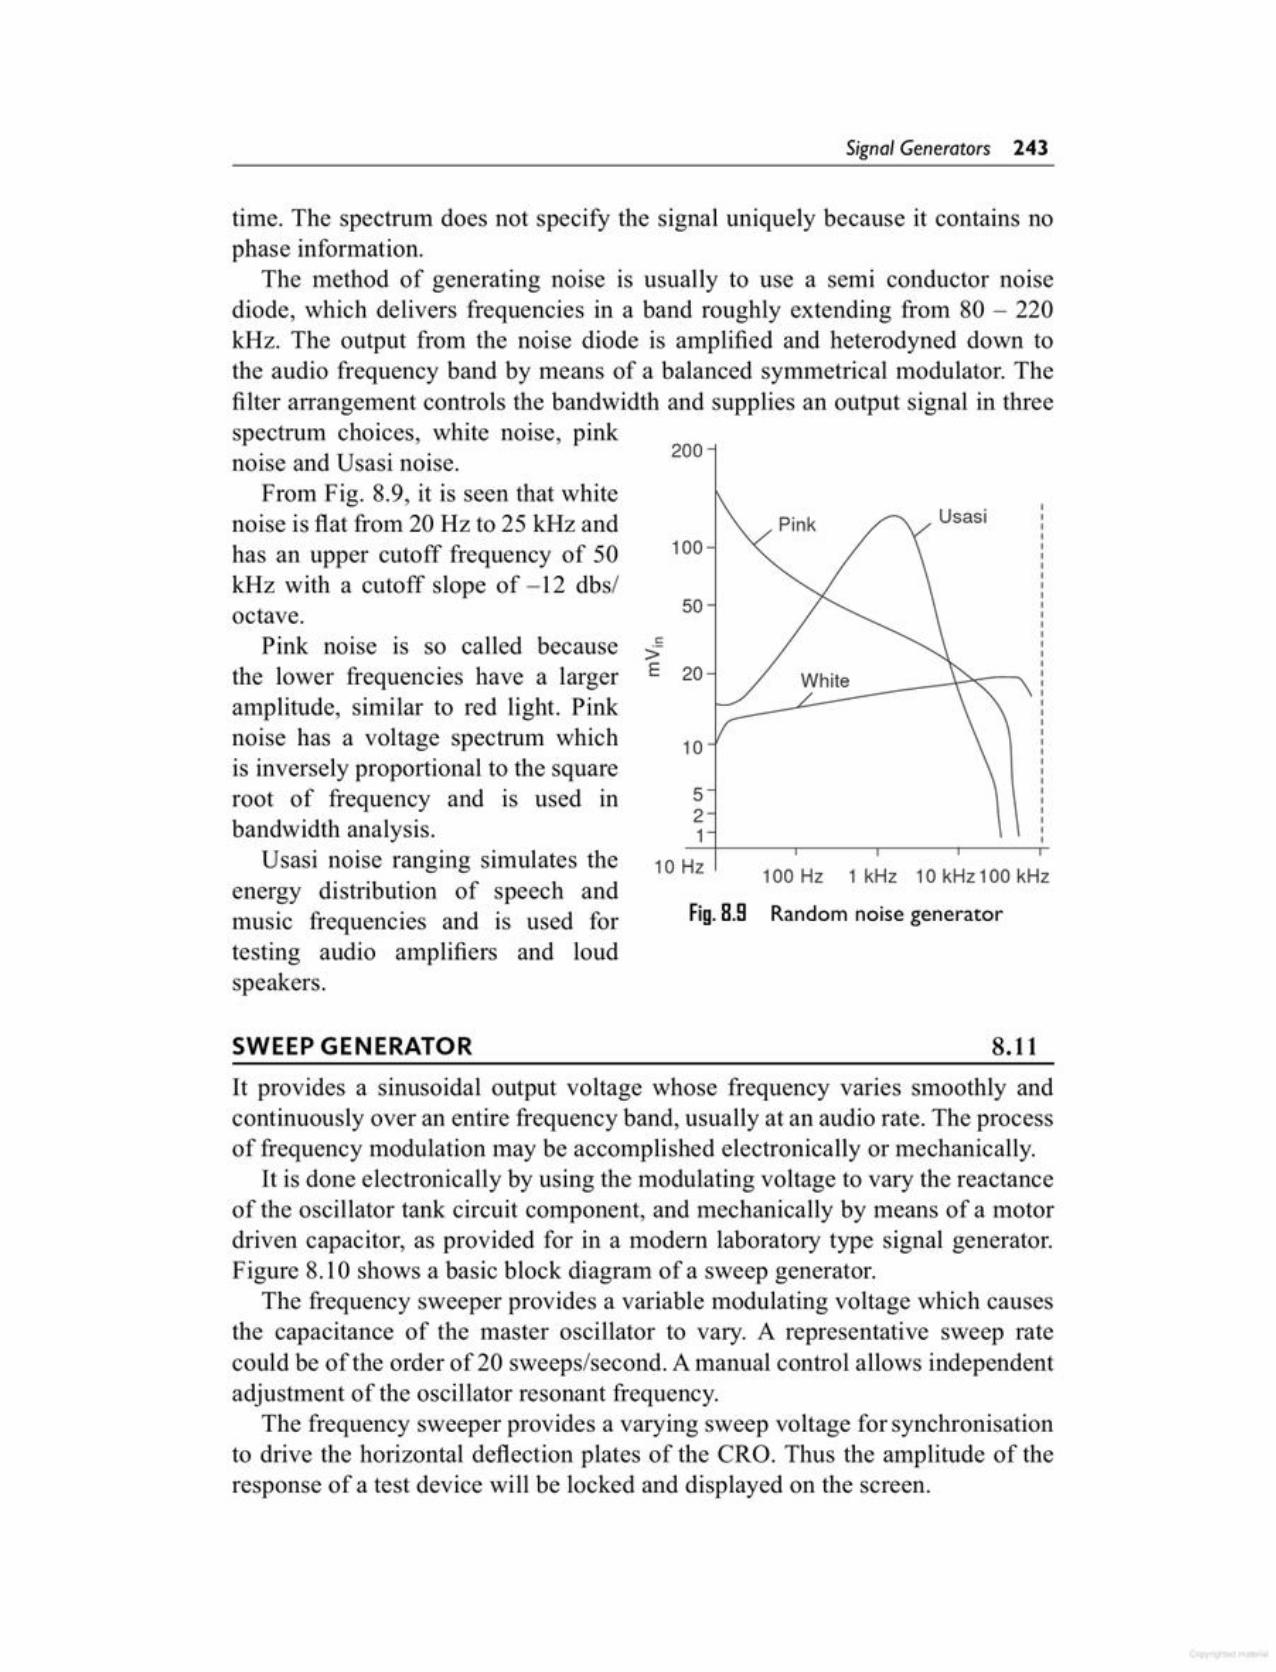
It provides a sinusoidal output voltage whose frequency varies smoothly andcontinuously over an entire frequency band, usually at an audio rate. The processof frequency modulation may be accomplished electronically or mechanically.
It is done electronically by using the modulating voltage to vary the reactanceof the oscillator tank circuit component, and mechanically by means of a motordriven capacitor, as provided for in a modem laboratory type signal generator.Figure 8.10 shows a basic block diagram of a sweep generator.
The frequency sweeper provides a variable modulating voltage which causesthe capacitance of the master oscillator to vary. A representative sweep ratecould be of the order of 20 sweeps/second. A manual control allows independentadjustment of the oscillator resonant frequency.
The frequency sweeper provides a varying sweep voltage for synchronisationto drive the horizontal deflection plates of the eRO. Thus the amplitude of theresponse of a test device will be locked and displayed on the screen.
Fig. 8.9
8.11
Random noise generator
100 Hz 1 kHz 10kHz 100 kHz10 Hz
White
521
10
.!:>E 20
50
100UsasiPink
200
SWEEP GENERATOR
time. The spectrum does not specify the signal uniquely because it contains nophase information.
The method of generating noise is usually to use a semi conductor noisediode, which delivers frequencies in a band roughly extending from 80 - 220kHz. The output from the noise diode is amplified and heterodyned down tothe audio frequency band by means of a balanced symmetrical modulator. Thefilter arrangement controls the bandwidth and supplies an output signal in threespectrum choices, white noise, pinknoise and Usasi noise.
From Fig. 8.9, it is seen that whitenoise is flat from 20 Hz to 25 kHz andhas an upper cutoff frequency of 50kHz with a cutoff slope of -12 dbs/octave.
Pink noise is so called becausethe lower frequencies have a largeramplitude, similar to red light. Pinknoise has a voltage spectrum whichis inversely proportional to the squareroot of frequency and is used inbandwidth analysis.
Usasi noise ranging simulates theenergy distribution of speech andmusic frequencies and is used fortesting audio amplifiers and loudspeakers.
Signal Generators 243
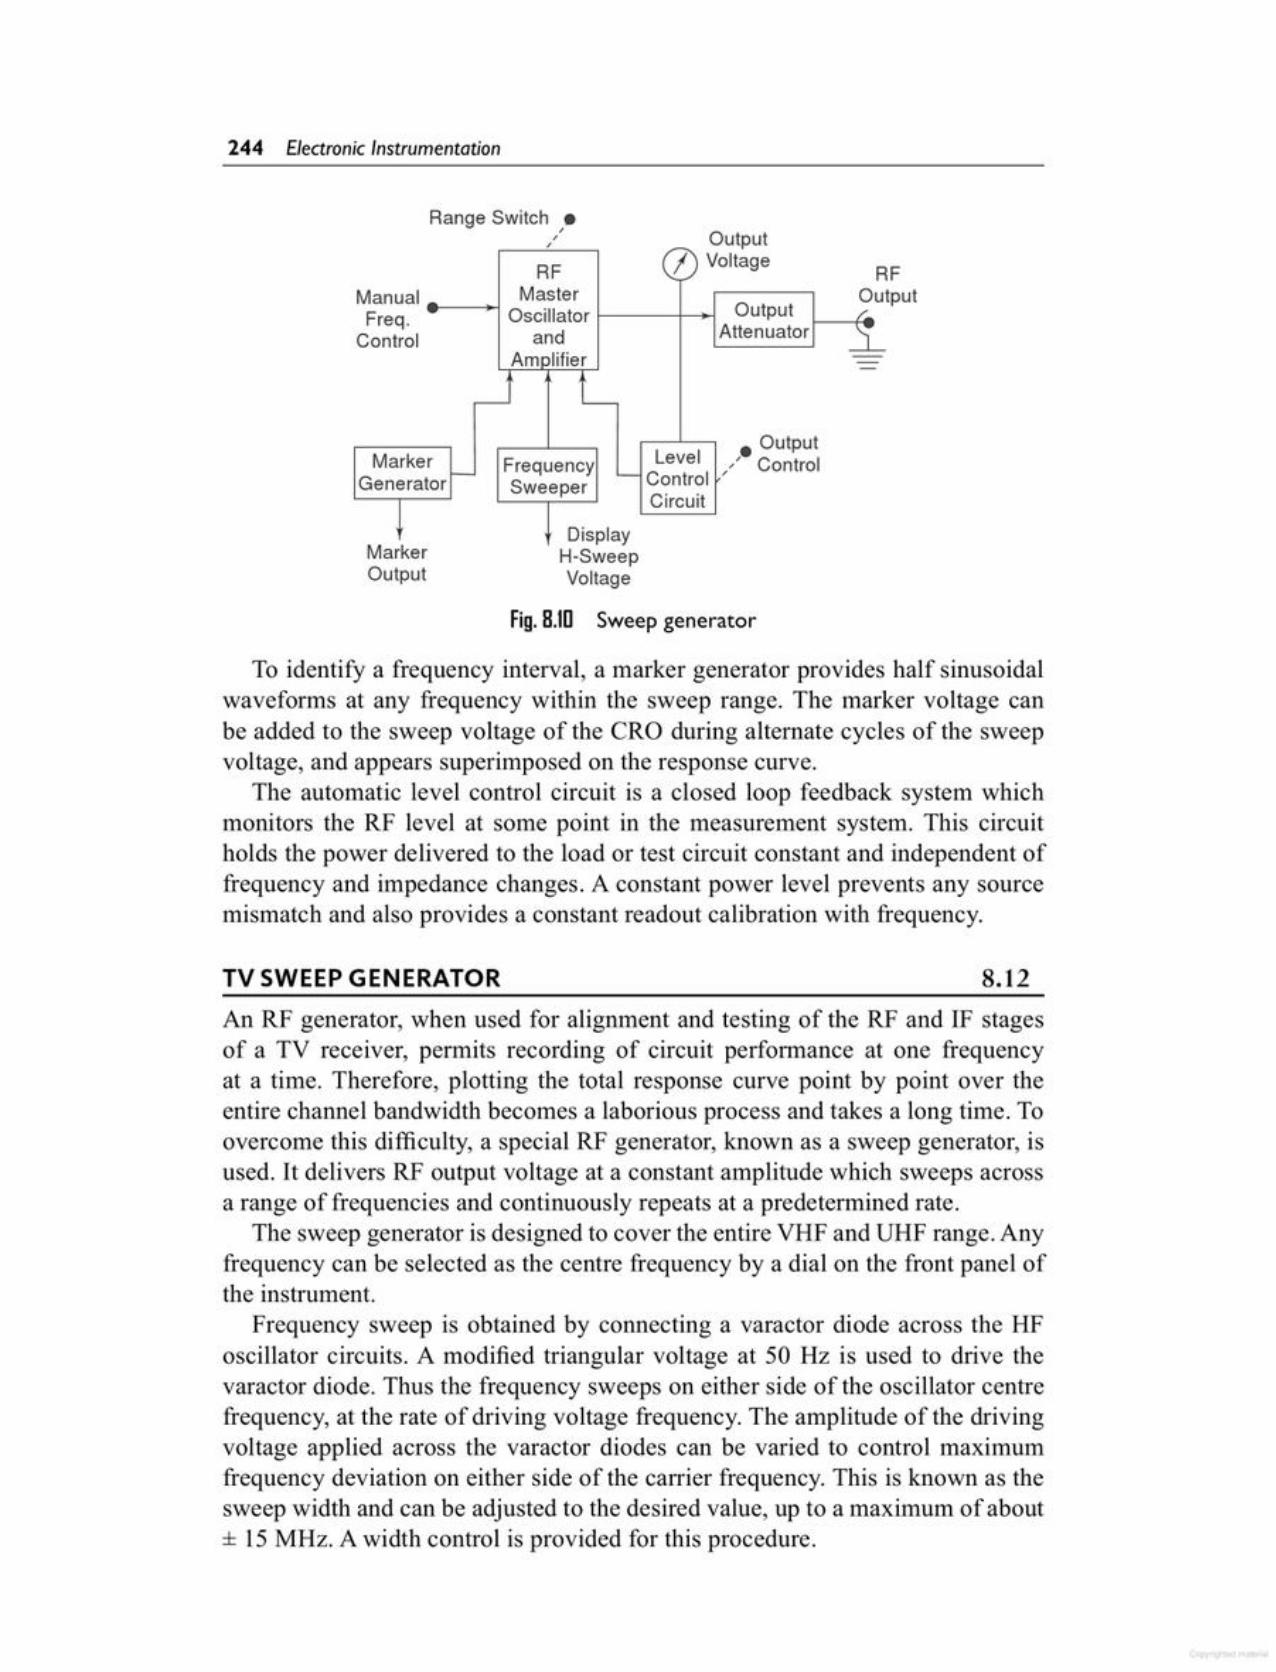
An RF generator, when used for alignment and testing of the RF and IF stagesof a TV receiver, permits recording of circuit performance at one frequencyat a time. Therefore, plotting the total response curve point by point over theentire channel bandwidth becornes a laborious process and takes a long time. Toovercome this difficulty, a special RF generator, known as a sweep generator, isused. It delivers RF output voltage at a constant amplitude which sweeps acrossa range of frequencies and continuously repeats at a predetermined rate.
The sweep generator is designed to cover the entire VHF and UHF range. Anyfrequency can be selected as the centre frequency by a dial on the front panel ofthe instrument.
Frequency sweep is obtained by connecting a varactor diode across the HFoscillator circuits. A modified triangular voltage at 50 Hz is used to drive thevaractor diode. Thus the frequency sweeps on either side of the oscillator centrefrequency, at the rate of driving voltage frequency. The amplitude of the drivingvoltage applied across the varactor diodes can be varied to control maximumfrequency deviation on either side of the carrier frequency. This is known as thesweep width and can be adjusted to the desired value, up to a maximum of about± 15MHz. A width control is provided for this procedure.
8.12TV SWEEP GENERATOR
To identify a frequency interval, a marker generator provides half sinusoidalwaveforms at any frequency within the sweep range. The marker voltage canbe added to the sweep voltage of the eRO during alternate cycles of the sweepvoltage, and appears superimposed on the response curve.
The automatic level control circuit is a closed loop feedback system whichmonitors the RF level at some point in the measurement system, This circuitholds the power delivered to the load or test circuit constant and independent offrequency and impedance changes. A constant power level prevents any sourcemismatch and also provides a constant readout calibration with frequency.
H-SweepVoltage
Fig. B.1O Sweep generator
MarkerOutput
Ftput
RF I VoltageR
Manual Master OuFreq. Oscillator Output /..
Control and Attenuator _i_Arnr lifier --
,-J L• Output
Marker LevelFrequency /' Control- '-- ControlGenerator SweeperCircuit
Display
OutputRange Switch •,,,
244 Electronic Instrumentation
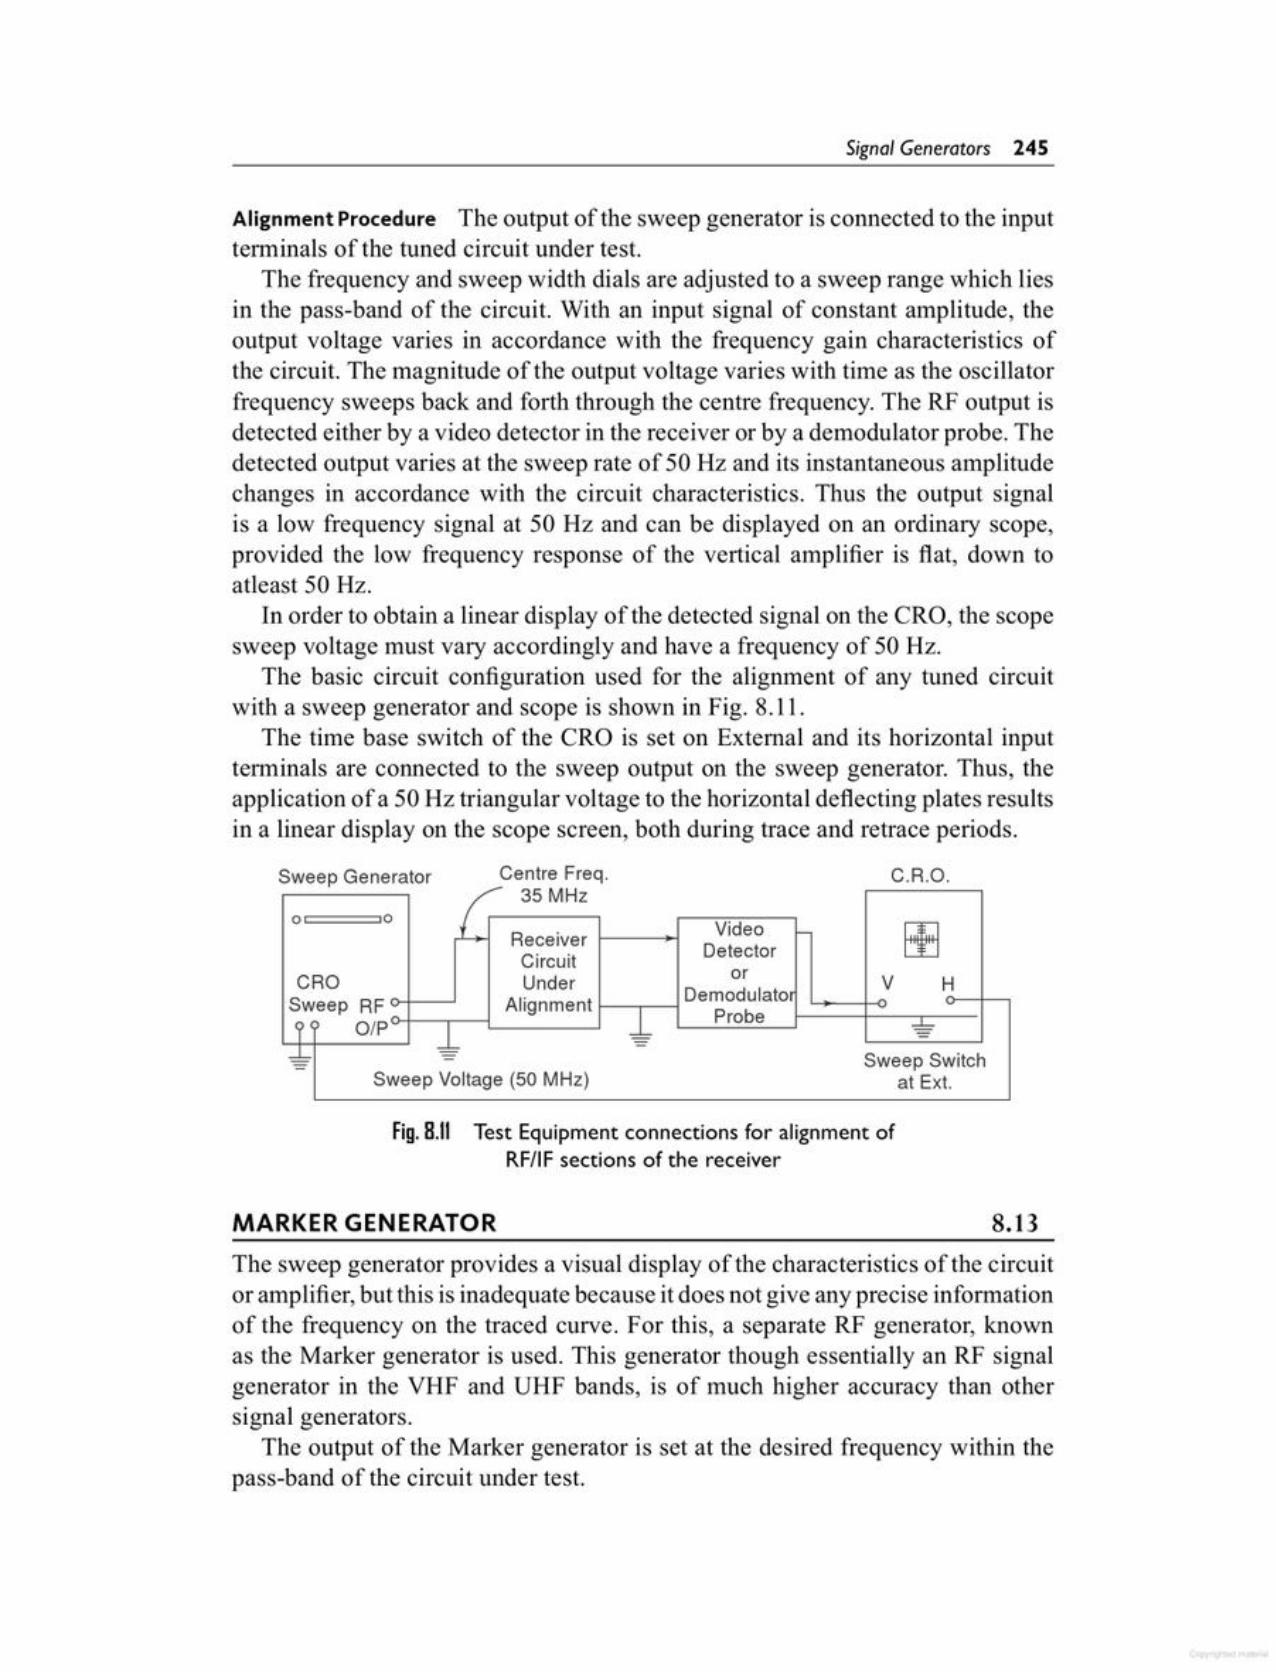
The sweep generator provides a visual display of the characteristics of the circuitor amplifier, but this is inadequate because it does not give any precise informationof the frequency on the traced curve. For this, a separate RF generator, knownas the Marker generator is used. This generator though essentially an RF signalgenerator in the VHF and UHF bands, is of much higher accuracy than othersignal generators.
The output of the Marker generator is set at the desired frequency within thepass-band of the circuit under test.
8.13MARKER GENERATOR
Fig.B.1I Test Equipment connections for alignment ofRFIIF sections of the receiver
35 MHz0 0 Video
~Receiver -Circuit Detector
CRO Under or V HDemodulatoSweep RF Alignment
~
ProbealP -::!:::-1-== Sweep SwitchSweep Voltage (50 MHz) at Ext.
C.R.O.Centre Freq.Sweep Generator
Alignment Procedure The output of the sweep generator is connected to the inputterminals of the tuned circuit under test.
The frequency and sweep width dials are adjusted to a sweep range which liesin the pass-band of the circuit. With an input signal of constant amplitude, theoutput voltage varies in accordance with the frequency gain characteristics ofthe circuit. The magnitude of the output voltage varies with time as the oscillatorfrequency sweeps back and forth through the centre frequency. The RF output isdetected either by a video detector in the receiver or by a demodulator probe. Thedetected output varies at the sweep rate of 50 Hz and its instantaneous amplitudechanges in accordance with the circuit characteristics. Thus the output signalis a low frequency signal at 50 Hz and can be displayed on an ordinary scope,provided the low frequency response of the vertical amplifier is fiat, down toatleast 50 Hz.
In order to obtain a linear display of the detected signal on the CRO, the scopesweep voltage must vary accordingly and have a frequency of 50 Hz.
The basic circuit configuration used for the alignment of any tuned circuitwith a sweep generator and scope is shown in Fig. 8.11.
The time base switch of the CRO is set on External and its horizontal inputterminals are connected to the sweep output on the sweep generator. Thus, theapplication of a 50 Hz triangular voltage to the horizontal deflecting plates resultsin a linear display on the scope screen, both during trace and retrace periods.
Signal Generators 245

The two signals are heterodyned to produce outputs at the sum and difference oftwo frequencies. These appear at the detector output and represent the amplitudecharacteristics of the circuit, because of the limited frequency response of the CROvertical amplifier, the sum and difference frequency signals are produced whenthe sweep frequency varies over a wide range. When no difference frequencyis produced, no vertical deflection is produced on the screen. However, as thefrequency approaches and just crosses the marker frequency, the differencefrequency signals which are produced, lie within the pass-band of the verticalamplifier. Thus, they produce a pip on the screen along the trace generated bythe low frequency output of the detector. In order to get a sharp pip, a suitablecapacitor is shunted across the vertical input terminals of the scope.
Since the pip is produced at the marker frequency, it can be shifted to anypoint on the response curve by varying the marker generator frequency.
The marker generator, besides providing dial controlled frequency, oftenhas a provision to generate crystal controlled fixed frequency outputs at severalimportant frequencies.
The additional frequency in a generator designed for a CCIR 625 lines systemconsists of the following.
31.4 MHz (Band-edge)31.9 MHz (Trap-frequency)33.4 MHz (Sound IF)34.47 MHz (Colour IF)36.15 MHz (Band centre)38.9 MHz (Picture IF)40.4 MHz (Trap frequency)41.4 MHz (Band-edge)
These birdy-type markers can be switched in, either individually orsimultaneously by the use of toggle switches on the front panel.
Fig.8.12 Marker generator
asNeeded
~CRO Sweep
Marker Marker MarkerGenerator ----::!:. Injection / Pip
(35 MHz)
'"t~xtSweep Demodulator
Generator I IF Section ProbeBias RF of the or V H
Voltage O/P Receiver Video Sweep1, Detector9 ~
~ Sweep 30 - 40 MHzAGCBias
As given in Fig. 8.12, the outputs frOIDtwo generators are mixed togetherbefore being applied to the input terminals of the circuit under test.
246 Electronic Instrumentation

A pattern generator provides video signals directly, and with RF modulation, onstandard TV channels for alignment, testing and servicing of TV receivers. Theoutput signal is designed to produce simple geometric patterns like vertical andhorizontal bars, checkerboard, cross-hatch, dots, etc.
8.16VIDEO PATTERN GENERATOR
Fig. 8.13 Basic block diagram of a wobbluscope
Output
Manual 2utputFreq. OutputRFControl Attenuator i
Marker t -Frequency Output•,-, Control, EB•Marker Frequency Level
,,r- L- /
Generator Sweeper Control CRO'- -OV H
LMarker To H-Sweep Voltage -
RFRange Switch ,.,,
This instrument combines a Sweep generator, a Marker generator, and anoscilloscope, as shown in Fig. 8.13. It is a very useful unit for the alignmentof RF, IF and video sections of a TV receiver. It may not have all the featuresof a high quality sweep generator but is an economical and compact piece ofequipment specially designed for TV servicing. The oscilloscope usually has aprovision for TV-V (vertical) and TV-H (horizontal) sweep modes. An RF output,down to 1 MHz, is available for video amplifier testing.
8.1SWOBBLUSCOPE
Sweep and Marker generators were earlier manufactured as separate units. Nowthe two instruments are combined into a single instrument known as a SweepMarker generator.
This includes a built-in Marker adder for post-injection of the marker signal.Also provided is a variable de bias source for feeding a fixed bias to the RF andIF sections of the receiver.
The frequency spectrum covered is in the VHF and UHF band ranges in bothmanual and auto modes. The RF output is about 0.5 V nus across a 75 Q witha continuously variable attenuator, up to 50 db or 0 - 60 db in 10 db steps. Themarker section provides crystal controlled output at all important frequencies.The output can be internally modulated with a 1 kHz tone when necessary. Ademondulator probe, a balun and special cables with matched terminations arethe additional accessories.
8.14SWEEP-MARKER GENERATOR
Signal Generators 247
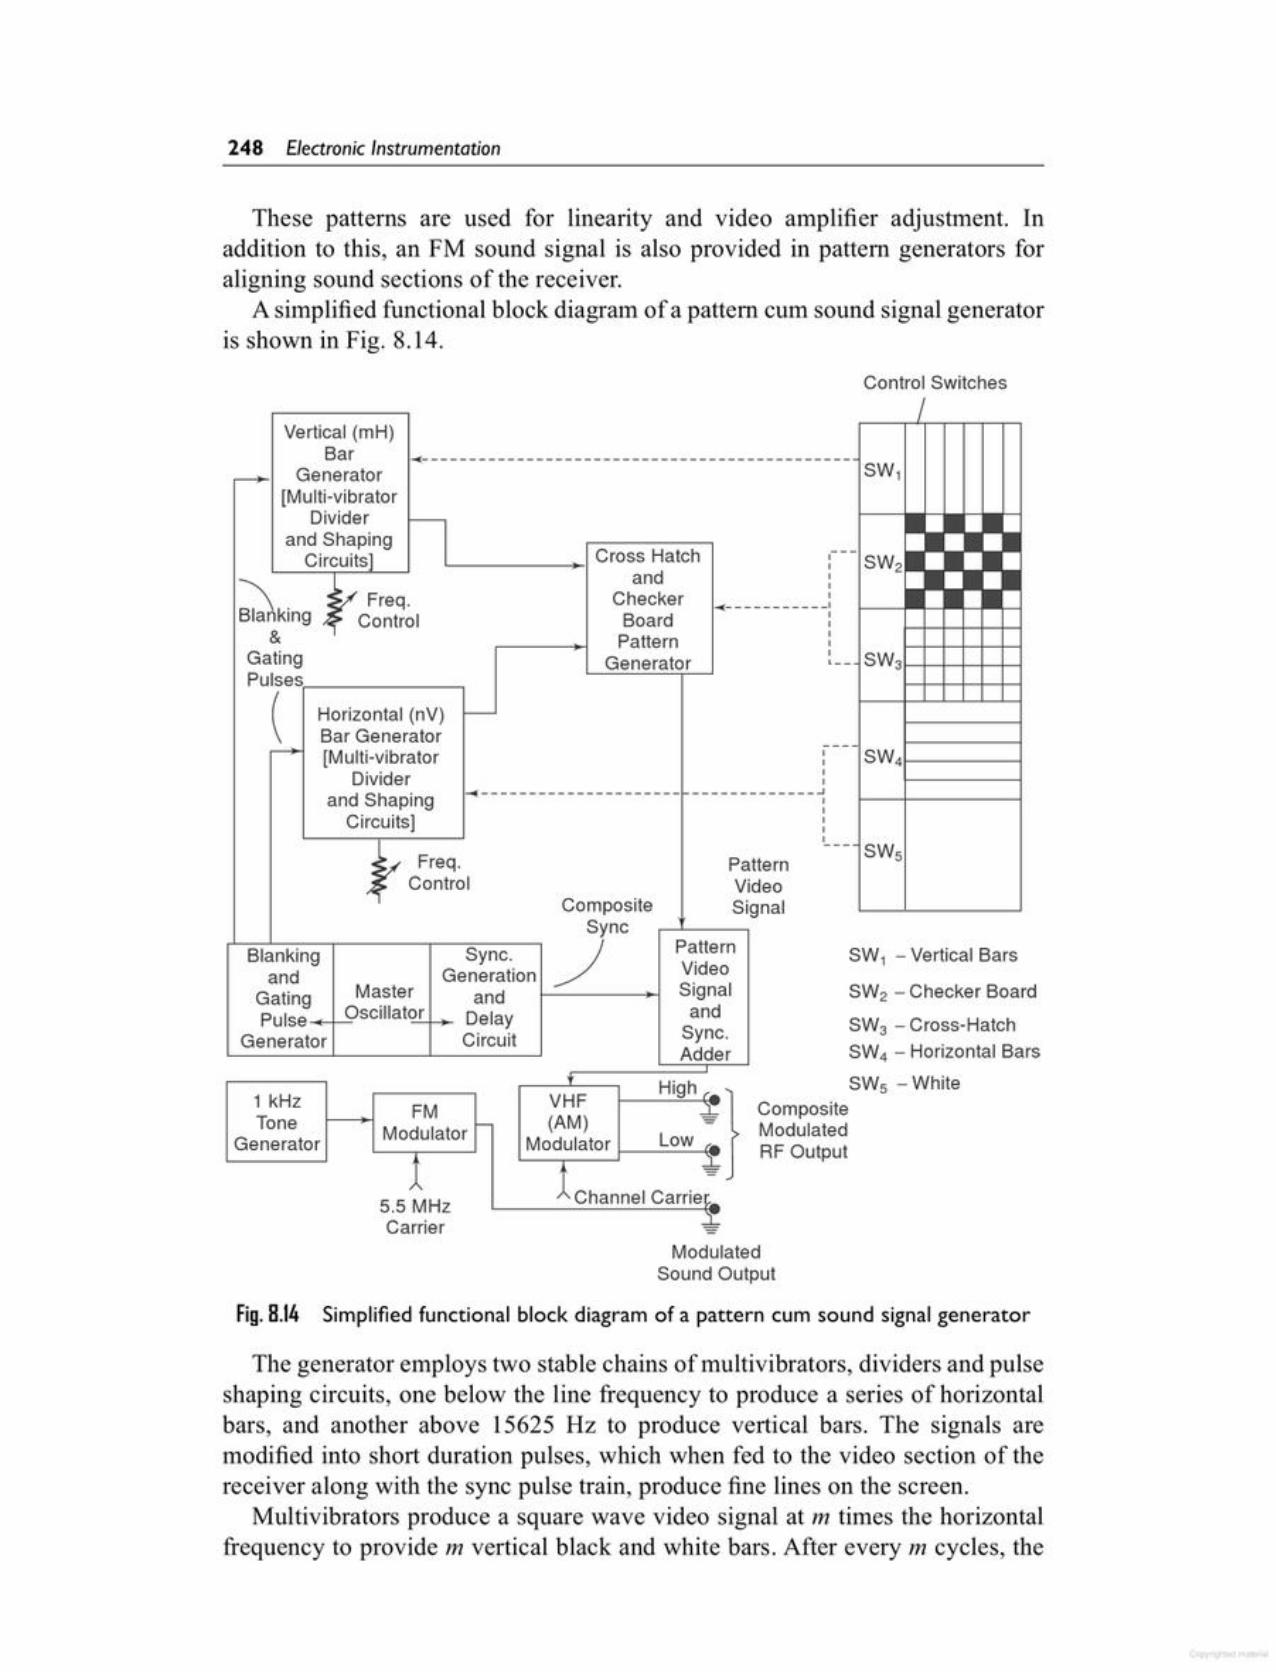
I
5.5 MHzCarrier
FMModulator -
CompositeModulatedRF Output
VHF(AM)
Modulator Low 1'. >
1Channel carne~
1 kHzTone
Generator
High r_'
~
The generator employs two stable chains of multivibrators, dividers and pulseshaping circuits, one below the line frequency to produce a series of horizontalbars, and another above 15625 Hz to produce vertical bars. The signals aremodified into short duration pulses, which when fed to the video section of thereceiver along with the sync pulse train, produce fine lines on the screen.
Multivibrators produce a square wave video signal at m times the horizontalfrequency to provide m vertical black and white bars. After every m cycles, the
ModulatedSound Output
Fig.8.14 Simplified functional block diagram of a pattern cum sound signal generator
PatternVideoSignalandSync.Adder
CompositeSync
Blanking Sync. )and Generation /
Gating Master and f------i~Pulse-++....::Oscillato':<!.r~Delay
Generator Circuit
SW4!------l
PatternVideoSignal
.~ Freq.j> Control
IIII
~--------------------- -------------~IIIII
Horizontal (nV)Bar Generator[Multi-vibrator
Dividerand Shaping
Circuits]
SW1 - Vertical Bars
SW2 - Checker Board
SW3 - Cross-HatchSW4 - Horizontal Bars
SW5 - White
~ ~.Freq.Blanking ~ Control
&GatingPulses,r- -,
(r+
1.------.., .....1Cross Hatchand
CheckerBoardPattern
Generator
,.....-. Generator[Multi-vibrator
Dividerand Shaping
Circuits]
~---------------------------------------------Vertical (mH)
Bar
Control Switches
:--- SW2III
...c:- -- - -- - -- __ IIIIII,-
These patterns are used for linearity and video amplifier adjustment. Inaddition to this, an FM sound signal is also provided in pattern generators foraligning sound sections of the receiver.
A simplified functional block diagram of a pattern cum sound signal generatoris shown in Fig. 8.14.
248 Electronic Instrumentation
The composite video signal at the output of a video detector consists of luminance Ysignals, the chrominance signal, the colour burst, sync pulses and blanking pulses.
The amplitude of the video signal varies continuously due to the changingpicture content, such a waveform is not useful for adjustment and troubleshooting purposes.
The colour bar generator acts as a substitute transmitter and supplies to thereceiver, a known constant amplitude colour pattern signal for alignment andservicmg purposes.
8.17COLOUR BAR GENERATOR
horizontal blanking pulse triggers the multivibrators for synchronising the barsignal on every line. A control on the front panel of the pattern generator enablesvariation of multi vibrators frequency to change the number of bars.
Similarly, square wave pulses derived either from 50 Hz mains or from themaster oscillator are used to trigger another set of multivibrator to generatesquare wave video signals that are n times the vertical frequency. On feeding thevideo amplifier these produce horizontal black and white bars. The number ofhorizontal bars can also be varied by a potentiometer that controls the switchingrate of the corresponding multivibrator. (The bar pattern signal is combined withthe sync and blanking pulses in the video adder to produce composite videosignals before being fed to the modulator). The provision of switches in thesignal path of the two multivibrators enables the generation of various patterns.If both mH and nV switches are off, a blank white raster is produced. With onlythe mH switch on, vertical bars are produced, and with only the nV switch on,horizontal bars are generated. With both switches on, a cross-hatch pattern willbe produced (Fig. 8.14).
The horizontal bar pattern is used for checking vertical linearity. These barsshould be equally spaced throughout the screen for linearity. Similarly, thevertical bar pattern can be used for checking and setting horizontal linearity.With the cross-hatch pattern formed by the vertical and horizontal lines, linearitycan be adjusted more precisely, because any unequal spacing of the lines can bediscerned.
Picture centering and aspect ratio can also be checked with the cross-hatchpattern by counting the number of squares on the vertical and horizontal sides ofthe screen.
The pattern generator can also be used for detecting any spurious oscillationsin the sweep generation circuits, interaction between the two oscillators, poorinterlacing, and barrel and pin cushion effects.
Modulated picture signals are available on limited channels for injecting intothe RF section of the receiver.
Similarly, an FM sound signal with a carrier frequency of 5.5 MHz ±100 kHz,modulated by a 1 kHz tone, is provided for aligning sound IF and discriminatorcircuits. A 75/300 Q VHF balun is usually available as a standard accessory withthe pattern generator.
Signal Generators 249
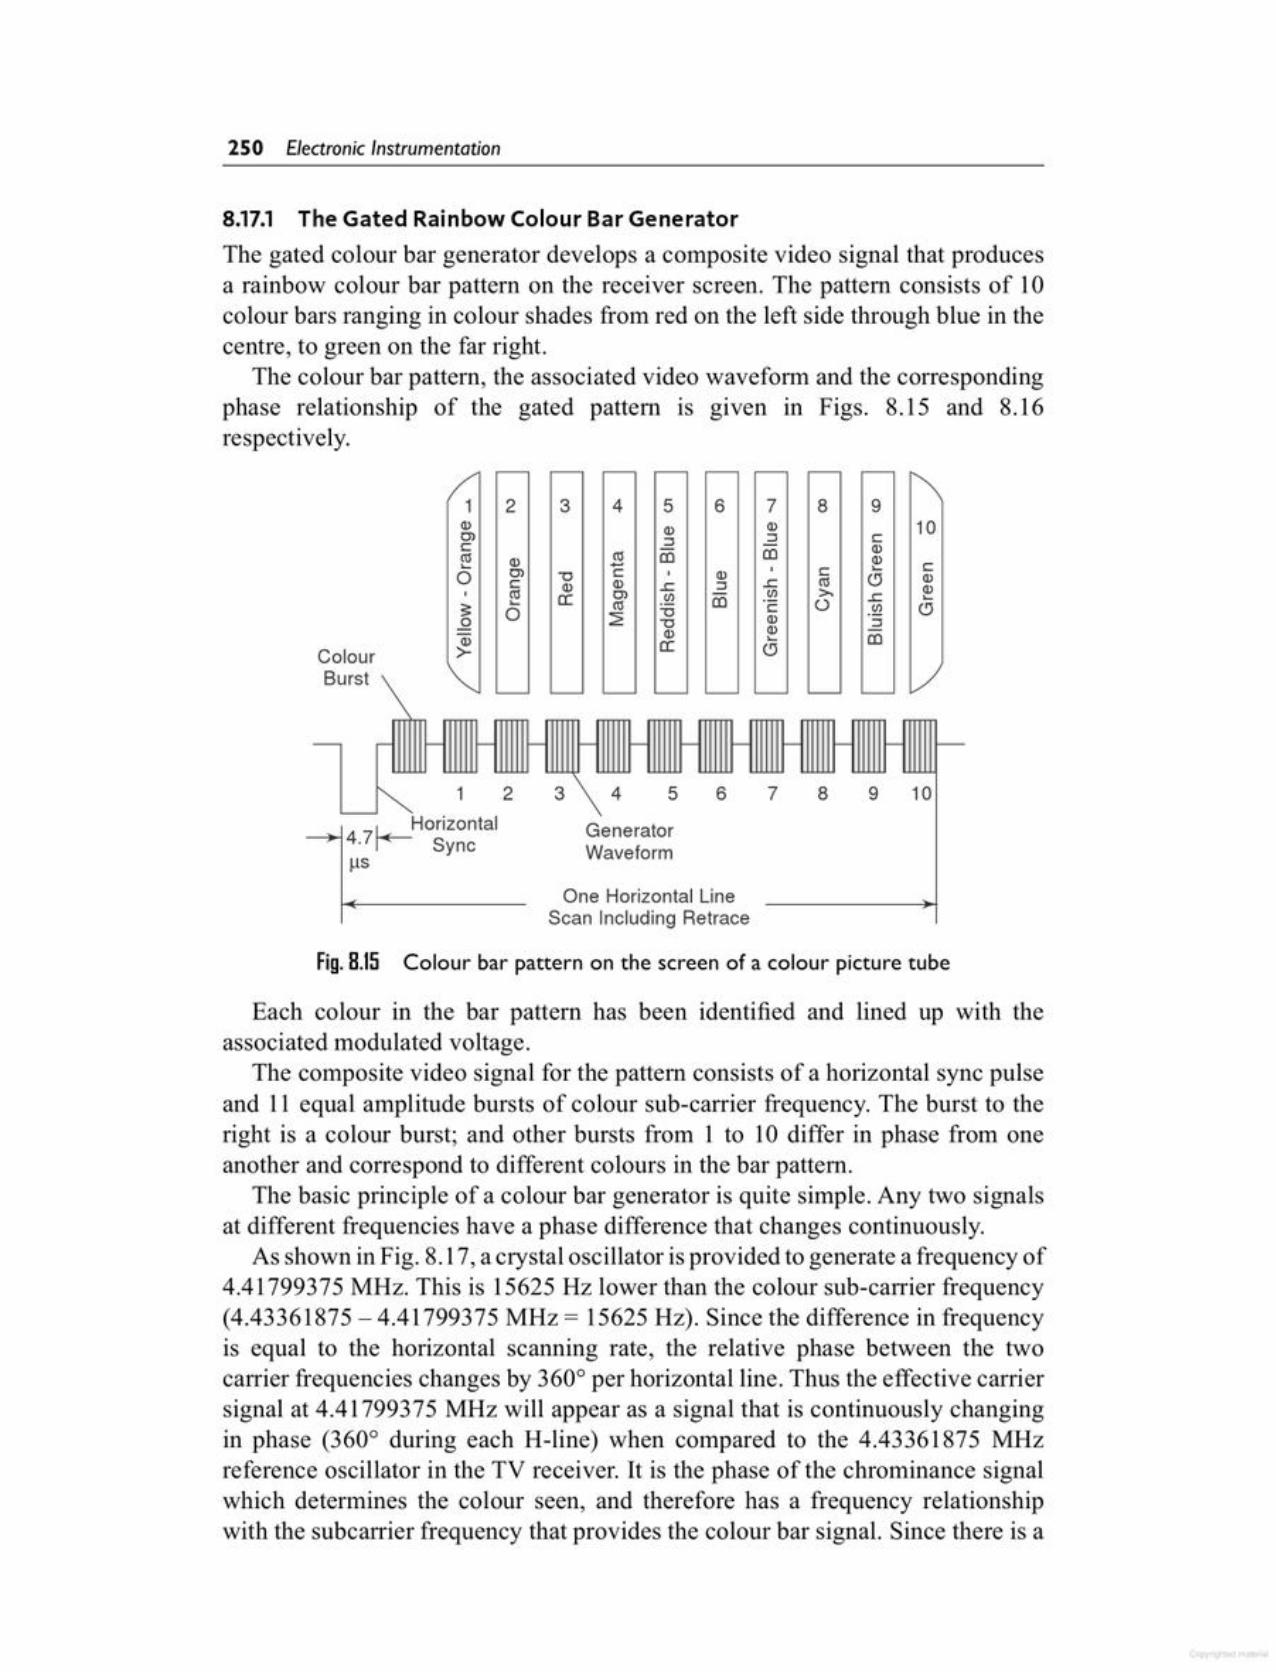
Each colour in the bar pattern has been identified and lined up with theassociated modulated voltage.
The composite video signal for the pattern consists of a horizontal sync pulseand 11 equal amplitude bursts of colour sub-carrier frequency. The burst to theright is a colour burst; and other bursts from 1 to 10 differ in phase from oneanother and correspond to different colours in the bar pattern.
The basic principle of a colour bar generator is quite simple. Any two signalsat different frequencies have a phase difference that changes continuously.
As shown in Fig. 8.17, a crystal oscillator isprovided to generate a frequency of4.41799375 MHz. This is 15625 Hz lower than the colour sub-carrier frequency(4.43361875 - 4.41799375 MHz = 15625 Hz). Since the difference in frequencyis equal to the horizontal scanning rate, the relative phase between the twocarrier frequencies changes by 360° per horizontal line. Thus the effective carriersignal at 4.41799375 MHz will appear as a signal that is continuously changingin phase (360° during each H-line) when compared to the 4.43361875 MHzreference oscillator in the TV receiver. It is the phase of the chrominance signalwhich determines the colour seen, and therefore has a frequency relationshipwith the subcarrier frequency that provides the colour bar signal. Since there is a
Fig.8.15 Colour bar pattern on the screen of a colour picture tube
One Horizontal LineScan Including Retrace
GeneratorWaveform
~ Horizontal4.71~ SyncIlS
9 10875 64321
1 2 3 4 5 6 7 8 9Q) Q) Q) 10OJ :::J ~ CC Q)!is Q) !is CD CD Q).... - .... c0 OJ '"0 C Q) C ('J Q)c Q) ..c :::J s: !is
!is Q)OJ III >. Q)a: III s: ....
~.... !is CD c o III ('J0 ::::2: '"0 Q)0 '"0 :::J
Q) Q)CD
~....
Colour a: ('J
Burst
8.17.1 The Gated Rainbow Colour Bar GeneratorThe gated colour bar generator develops a composite video signal that producesa rainbow colour bar pattern on the receiver screen. The pattern consists of 10colour bars ranging in colour shades from red on the left side through blue in thecentre, to green on the far right.
The colour bar pattern, the associated video waveform and the correspondingphase relationship of the gated pattern is given in Figs. 8.15 and 8.16respectively.
250 Electronic Instrumentation
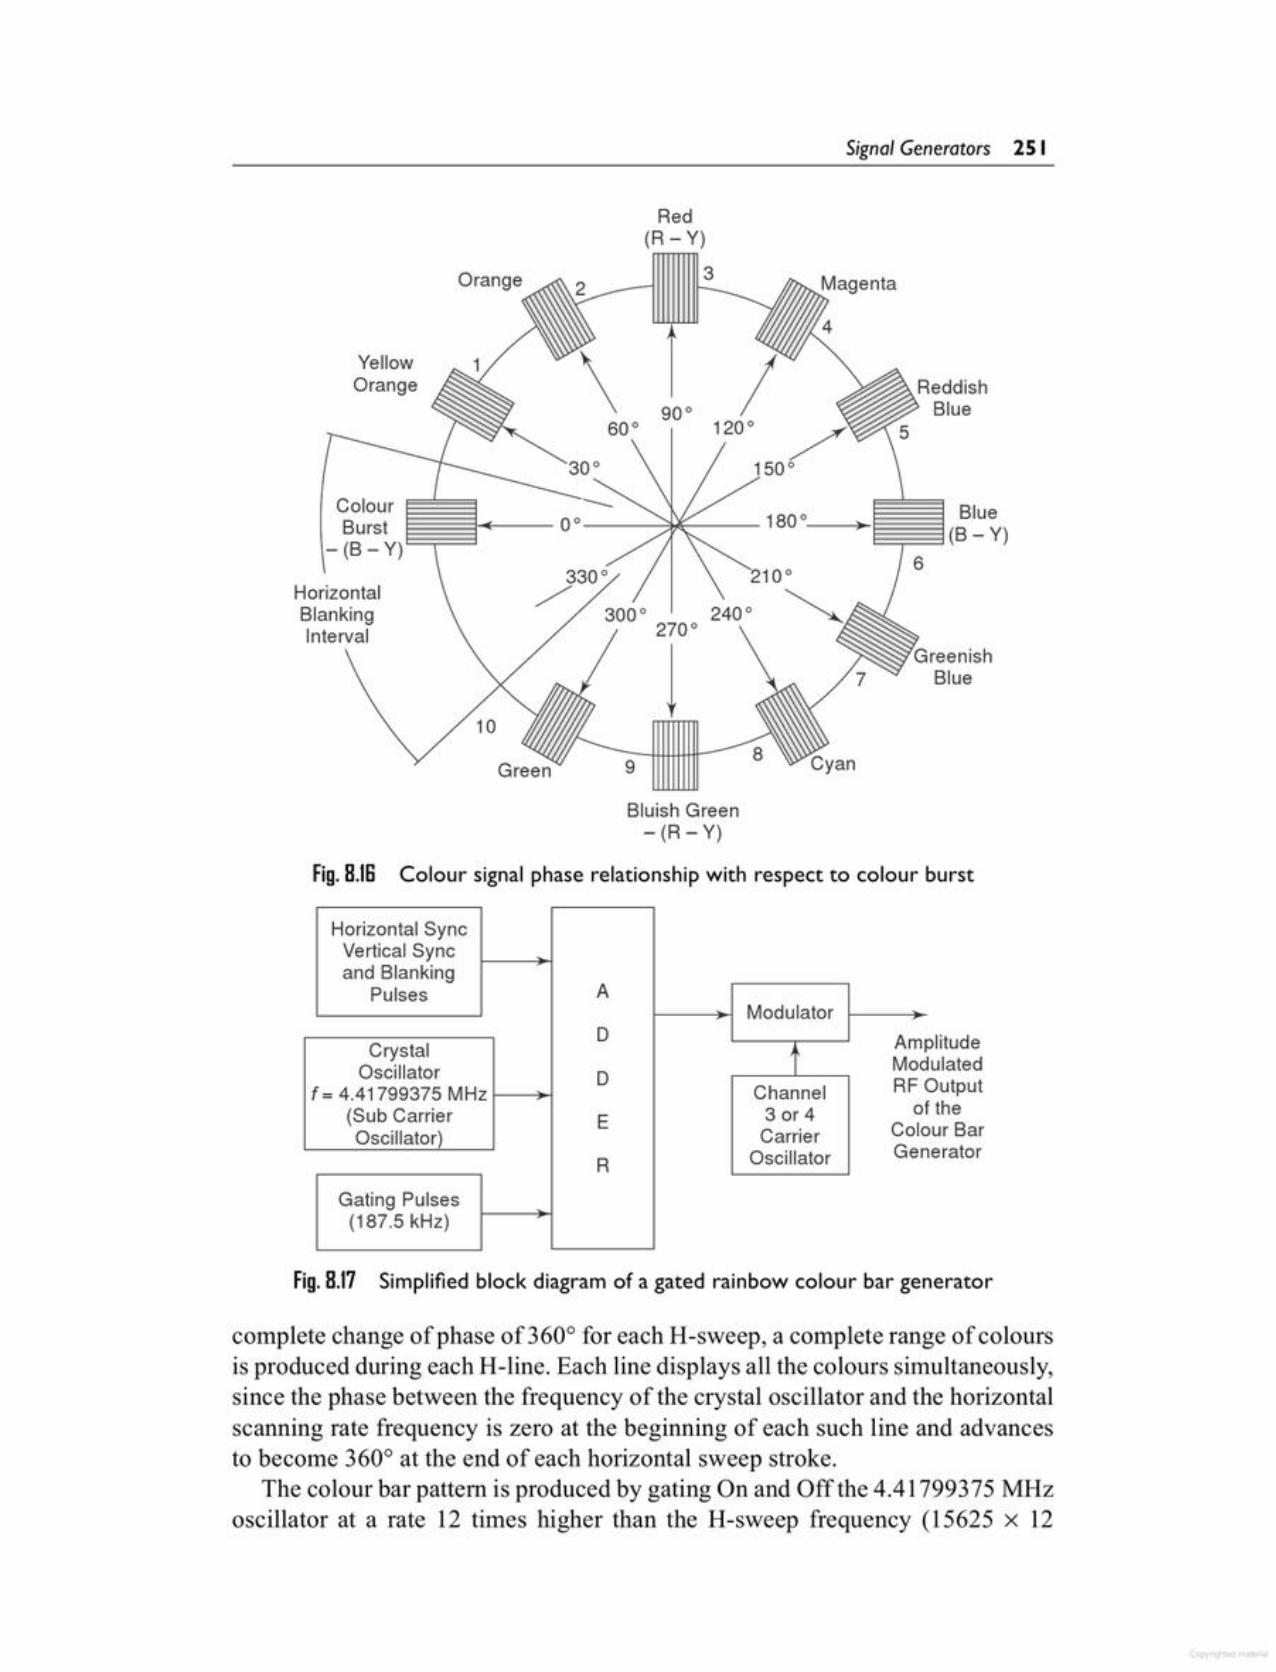
complete change of phase of 360° for each H-sweep, a complete range of coloursis produced during each H-line. Each line displays all the colours simultaneously,since the phase between the frequency of the crystal oscillator and the horizontalscanning rate frequency is zero at the beginning of each such line and advancesto become 360° at the end of each horizontal sweep stroke.
The colour bar pattern is produced by gating On and Off the 4.41799375 MHzoscillator at a rate 12 times higher than the H-sweep frequency (15625 x 12
Fig. 8.17 Simplified block diagram of a gated rainbow colour bar generator
plitudeulatedOutputtheur Barerator
Horizontal SyncVertical Syncand Blanking
Pulses AModulator
0 AmCrystal t ModOscillator 0 RFf = 4.41799375 MHz Channel,of(Sub Carrier E 3 or 4
Oscillator) Carrier Colo
R Oscillator Gen
Gating Pulses(187.5 kHz)
Fig. 8.IS Colour signal phase relationship with respect to colour burst
Bluish Green- (R - Y)
Green 9
10
3300-:HorizontalBlankingInterval
\ gt /"<. 600 1200 /
300 1500
YellowOrange
Orange
Red(R - Y)
Signal Generators 2S I
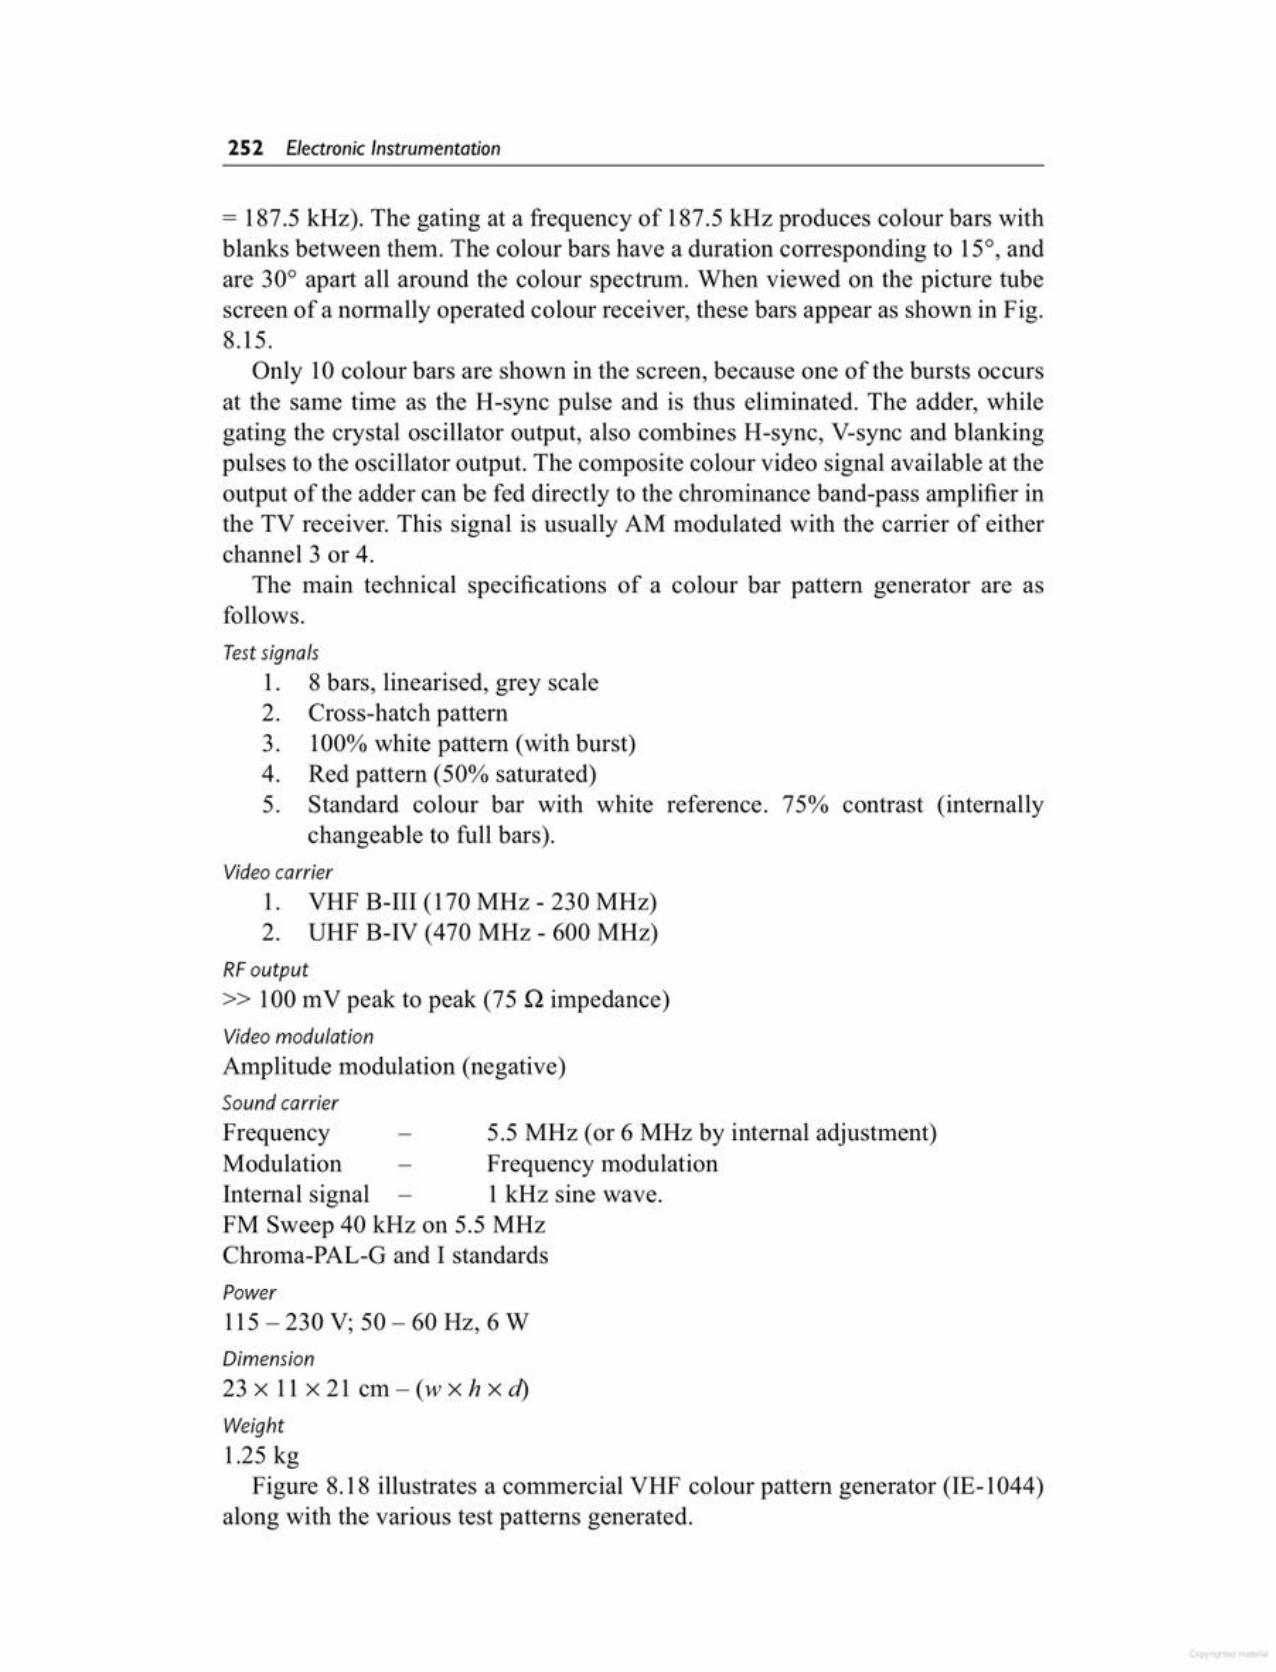
Dimension23 X 11 X 21 em - (w X h X d)Weight1.25 kg
Figure 8.18 illustrates a commercial VHF colour pattern generator (IE-I044)along with the various test patterns generated.
Power115 - 230 V; 50 - 60 Hz, 6 W
Test signals1. 8 bars, linearised, grey scale2. Cross-hatch pattern3. 100% white pattern (with burst)4. Red pattern (50% saturated)5. Standard colour bar with white reference. 75% contrast (internally
changeable to full bars).Video carrier
1. VHF B-III (170 MHz - 230 MHz)2. UHF B-IV (470 MHz - 600 MHz)
RFoutput» 100 mV peak to peak (75 Q impedance)Video modulationAmplitude modulation (negative)Sound carrierFrequency 5.5 MHz (or 6 MHz by internal adjustment)Modulation Frequency modulationInternal signal 1 kHz sine wave.FM Sweep 40 kHz on 5.5 MHzChroma-PAL-G and I standards
= 187.5 kHz). The gating at a frequency of 187.5 kHz produces colour bars withblanks between them. The colour bars have a duration corresponding to 15°, andare 30° apart all around the colour spectrum. When viewed on the picture tubescreen of a normally operated colour receiver, these bars appear as shown in Fig.8.15.
Only 10 colour bars are shown in the screen, because one of the bursts occursat the saIne time as the H-sync pulse and is thus eliminated. The adder, whilegating the crystal oscillator output, also combines H-sync, V-sync and blankingpulses to the oscillator output. The composite colour video signal available at theoutput of the adder can be fed directly to the chrominance band-pass amplifier inthe TV receiver. This signal is usually AM modulated with the carrier of eitherchannel 3 or 4.
The main technical specifications of a colour bar pattern generator are asfollows.
252 Electronic Instrumentation
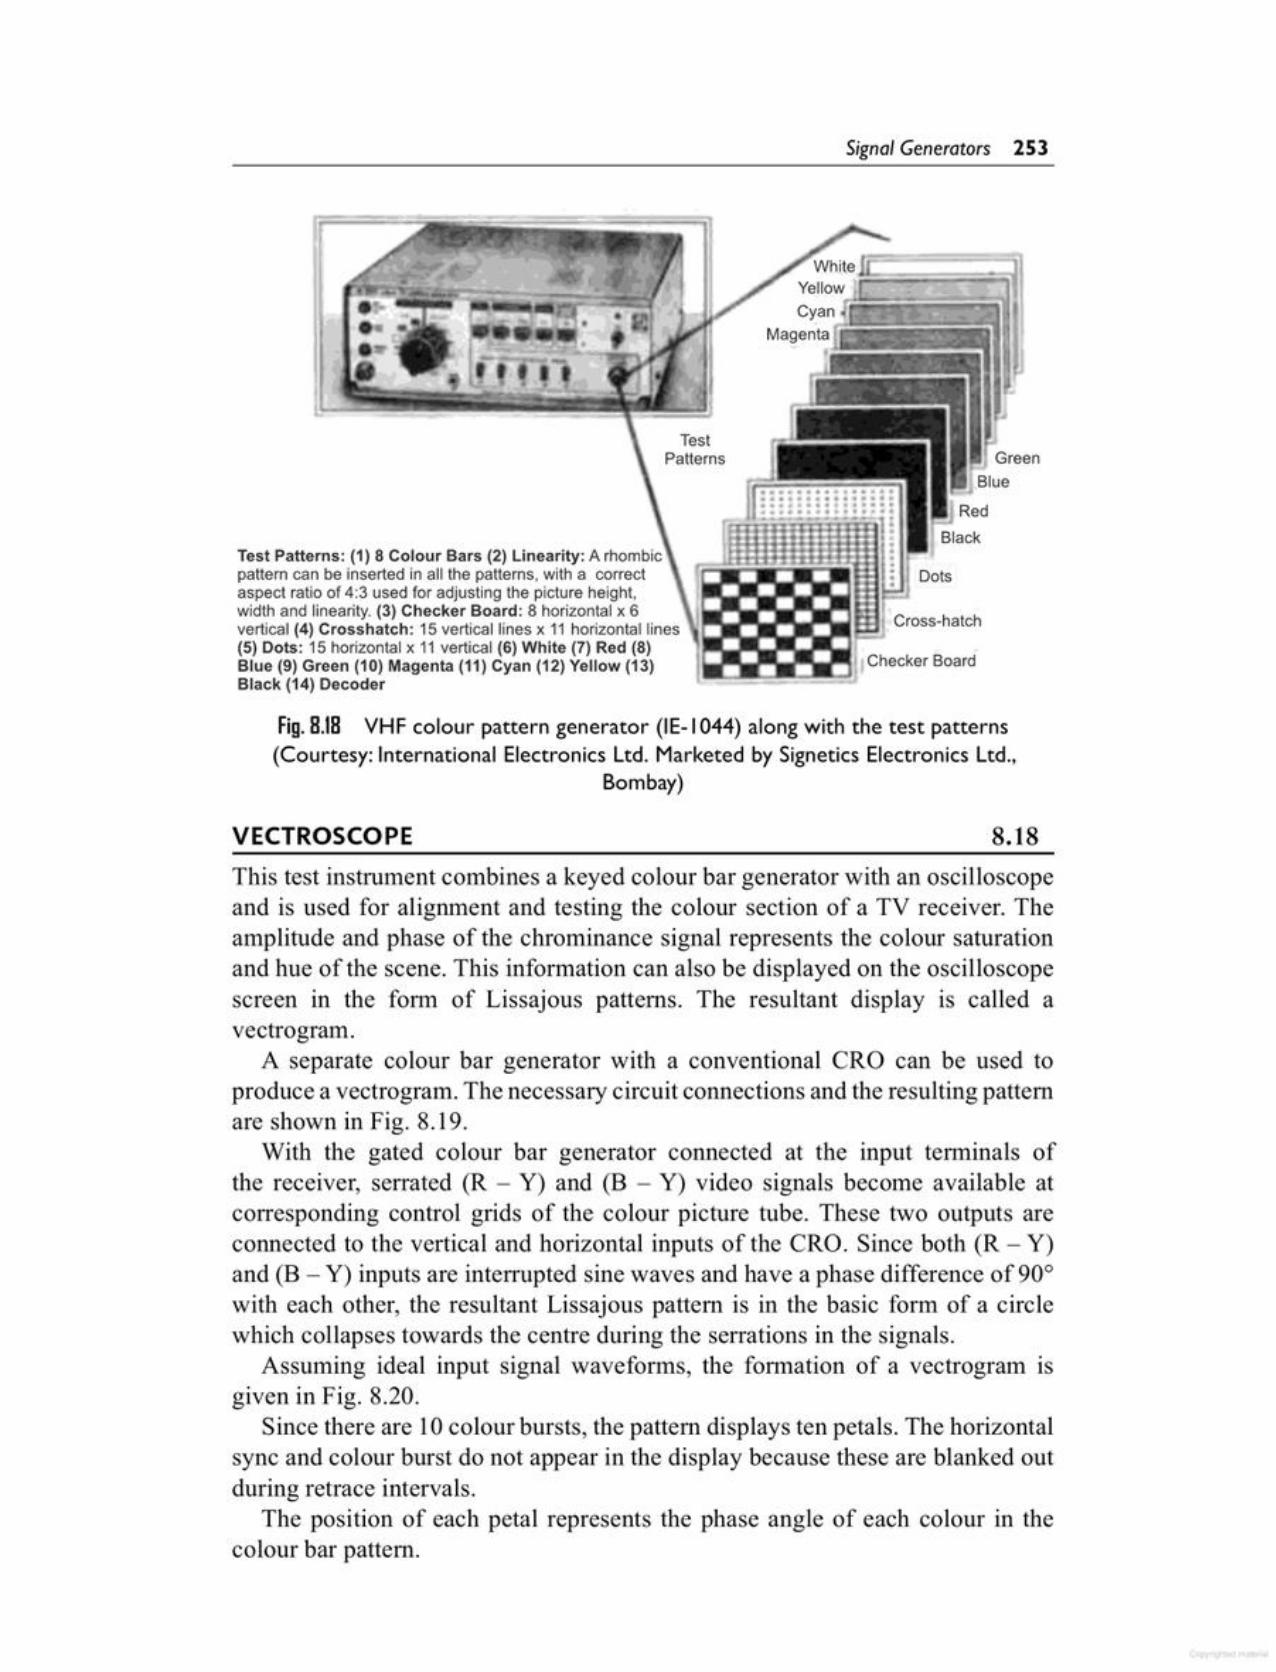
This test instrument combines a keyed colour bar generator with an oscilloscopeand is used for alignment and testing the colour section of a TV receiver. Theamplitude and phase of the chrominance signal represents the colour saturationand hue of the scene. This information can also be displayed on the oscilloscopescreen in the form of Lissajous patterns. The resultant display is called avectrogram.
A separate colour bar generator with a conventional CRO can be used toproduce a vectrogram. The necessary circuit connections and the resulting patternare shown in Fig. 8.19.
With the gated colour bar generator connected at the input terminals ofthe receiver, serrated (R - Y) and (B - Y) video signals become available atcorresponding control grids of the colour picture tube. These two outputs areconnected to the vertical and horizontal inputs of the CRO. Since both (R - Y)and (B - Y) inputs are interrupted sine waves and have a phase difference of 90°with each other, the resultant Lissajous pattern is in the basic form of a circlewhich collapses towards the centre during the serrations in the signals.
Assuming ideal input signal waveforms, the formation of a vectrogram isgiven in Fig. 8.20.
Since there are 10 colour bursts, the pattern displays ten petals. The horizontalsync and colour burst do not appear in the display because these are blanked outduring retrace intervals.
The position of each petal represents the phase angle of each colour in thecolour bar pattern.
8.18VECTROSCOPE
Fig. 8.18 VHF colour pattern generator (IE-I044) along with the test patterns(Courtesy: International Electronics Ltd. Marketed by Signetics Electronics Ltd.,
Bombay)
Checker Board
Cross-hatch
TestPatterns
Test Patterns: (1) 8 Colour Bars (2) linearity: A rhombicpattern can be inserted in all the patterns, with a correctaspect ratio of 4:3 used for adjusting the picture height,width and linearity. (3) Checker Board: 8 horizontal x 6vertical (4) Crosshatch: 15 vertical lines x 11horizontal lines(5) Dots: 15 horizontal x 11vertical (6) White (7) Red (8)Blue (9) Green (10) Magenta (11) Cyan (12) Yellow (13)Black (14) Decoder
Signal Generators 253

For example, petal 1,3, R - Y, 6, B - Y and 10 (0 - Y) correspond to angles30°,90°, 180°, and 360° respectively.
(8 - Y) Signal Applied toHorizontal Input of CRO(Trigger in Ext Mode)
Fig. 8.20 Lissajous pattern
8
(R - Y)Signal
Applied toVerticalInput ofCRO
6
5
9
t10
HorizontalSync
-:
ColourBurst
1
Fig. 8.19 Circuit connections for producing a vectrogram on the CRO
3
Ext Int
L._+-V-o ~ 0
o
H
7
14
Sweepo---:r"'---=----<o
(8 - Y) Signal ~
(8 - Y)Amplifier
____~ To (G - Y)Amplifier
ChromaSectionof the
Receiver
AntennaTerminals I
~----
RF Signalfrom the
Colour 8arGenerator
(R - Y)Amplifier
: TV Receiver,..------------------------------
IIII
~(R - Y) Signal
254 Electronic Instrumentation
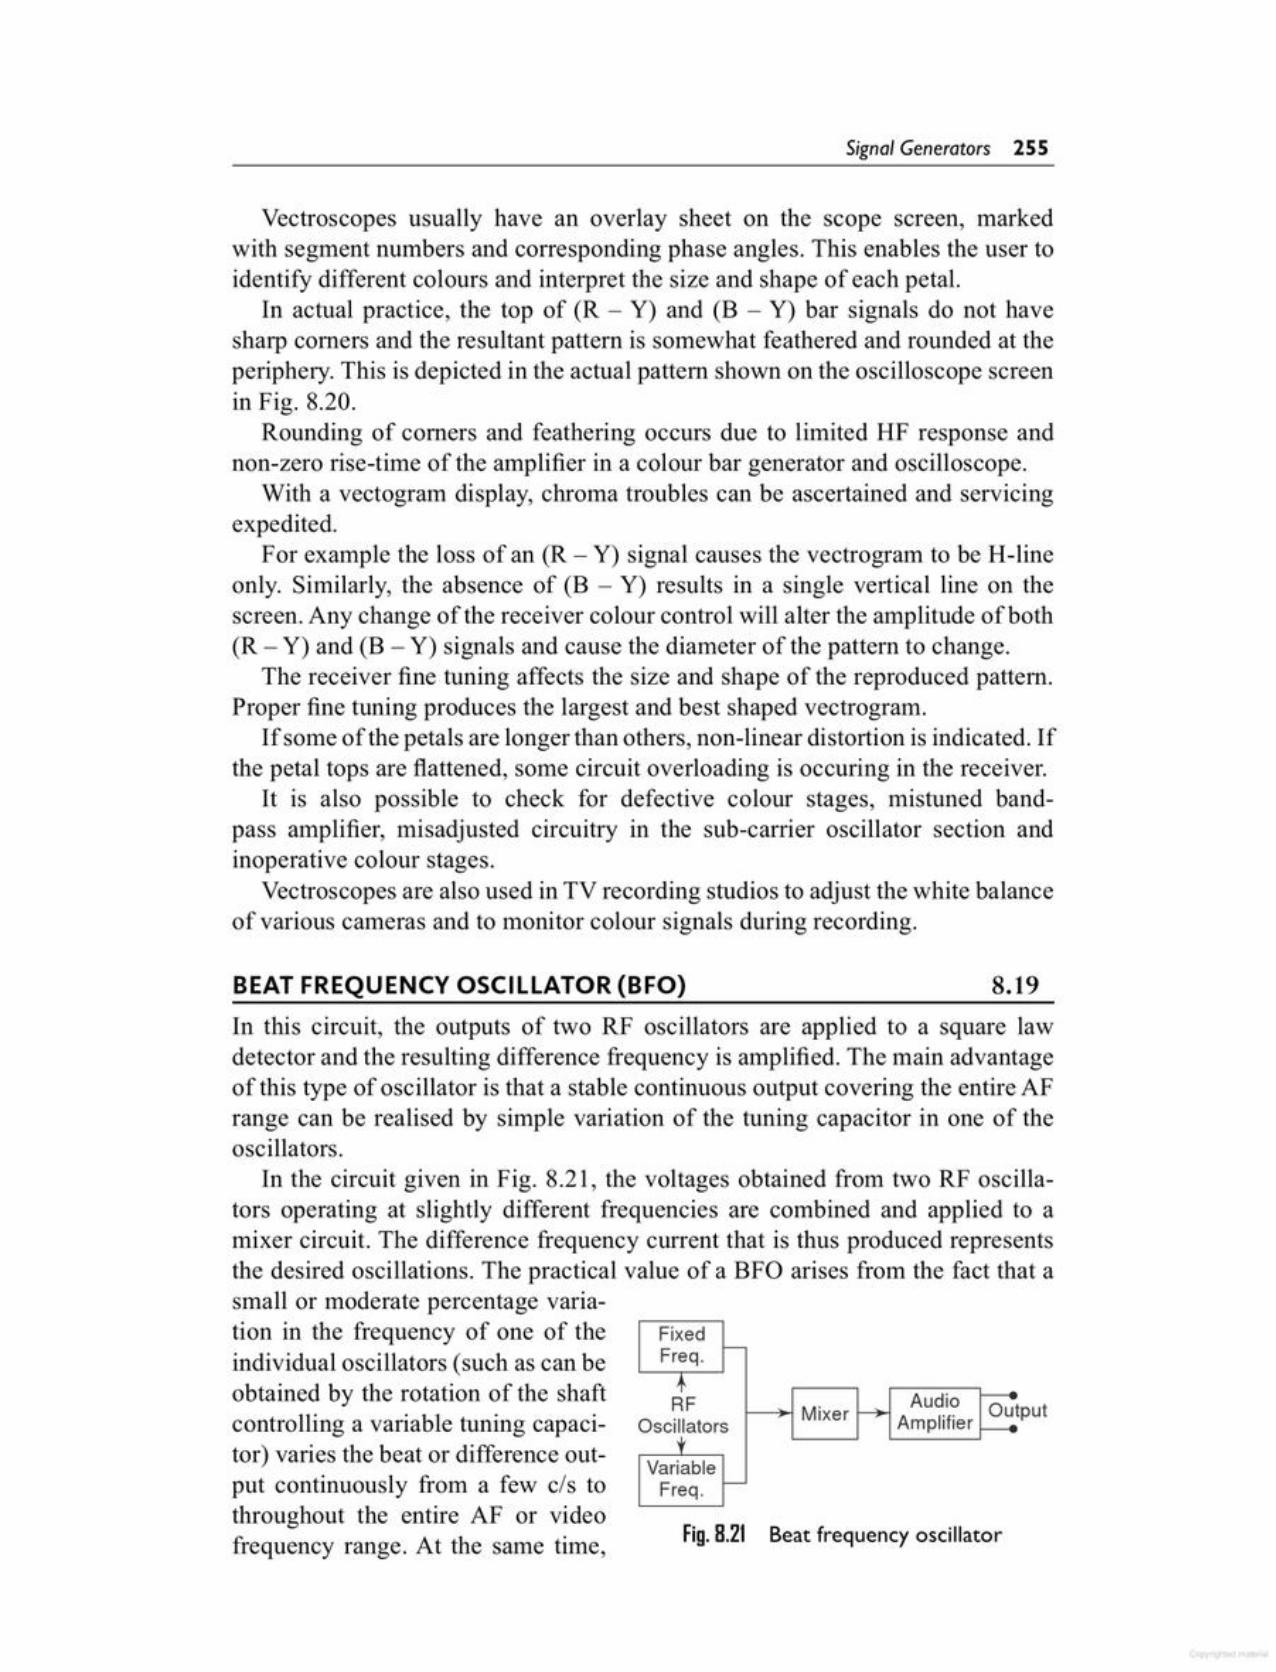
Fig.8.21 Beat frequency oscillator
tput
FixedFreq. I-
~F . Mixer ~Audio Ou
OSCi~ators Amplifier
VariableFreq. I-
In this circuit, the outputs of two RF oscillators are applied to a square lawdetector and the resulting difference frequency is amplified. The main advantageof this type of oscillator is that a stable continuous output covering the entire AFrange can be realised by simple variation of the tuning capacitor in one of theoscillators.
In the circuit given in Fig. 8.21, the voltages obtained from two RF oscillators operating at slightly different frequencies are combined and applied to amixer circuit. The difference frequency current that is thus produced representsthe desired oscillations. The practical value of a BFO arises from the fact that asmall or moderate percentage variation in the frequency of one of theindividual oscillators (such as can beobtained by the rotation of the shaftcontrolling a variable tuning capacitor) varies the beat or difference output continuously from a few cis tothroughout the entire AF or videofrequency range. At the same time,
8.19BEAT FREQUENCY OSCILLATOR (BFO)
Vectroscopes usually have an overlay sheet on the scope screen, markedwith segment numbers and corresponding phase angles. This enables the user toidentify different colours and interpret the size and shape of each petal.
In actual practice, the top of (R - Y) and (B - Y) bar signals do not havesharp comers and the resultant pattern is somewhat feathered and rounded at theperiphery. This is depicted in the actual pattern shown on the oscilloscope screenin Fig. 8.20.
Rounding of comers and feathering occurs due to limited HF response andnon-zero rise-time of the amplifier in a colour bar generator and oscilloscope.
With a vectogram display, chroma troubles can be ascertained and servicingexpedited.
For example the loss of an (R - Y) signal causes the vectrogram to be H-lineonly. Similarly, the absence of (B - Y) results in a single vertical line on thescreen. Any change of the receiver colour control will alter the amplitude of both(R - Y) and (B - Y) signals and cause the diameter of the pattern to change.
The receiver fine tuning affects the size and shape of the reproduced pattern.Proper fine tuning produces the largest and best shaped vectrogram.
If some of the petals are longer than others, non-linear distortion is indicated. Ifthe petal tops are flattened, some circuit overloading is occuring in the receiver.
It is also possible to check for defective colour stages, mistuned bandpass amplifier, misadjusted circuitry in the sub-carrier oscillator section andinoperative colour stages.
Vectroscopes are also used in TV recording studios to adjust the white balanceof various cameras and to monitor colour signals during recording.
Signal Generators 255

Less than 0.5% below 500 kHz, (less than 1% above 500 kHz),independentofloadirnpedance
Distortion
Frequency stability
± 2% under normal conditionsWithin ± 1 db (of a 1 kHz reference) over the entire frequencyrangeNegligible shift in output frequency for ± 10% line voltagevariation
Calibration accuracyFrequency response
SpecificationsProperties
Table 8.2
STANDARD SPECIFICATIONS OF A SIGNAL GENERATOR 8.20Table 8.2 gives the standard specifications of a signal generator
the amplitude of the difference frequency output is largely constant as frequencyis varied. The principal factors involved in the performance of a BFO are thefrequency stability of individual oscillators, the tendency of the oscillators tosynchronise at very low difference frequencies, the wave shape of the differencefrequency output, and the tendency for spurious beat notes to be produced.
Frequency stability of the individual oscillators is important, because a slightchange in their relative frequency would cause a relatively large change in thedifference frequency. To minimise the drift of the difference frequency withtime, the individual oscillators should have high inherent frequency stabilitywith respect to changes in temperature and to supply voltage variations, and theyshould be as alike electrically, mechanically and thermally, as possible.
In this way, frequency changes are minimised and the frequency changes thatdo take place tend to be the same in each of the individual oscillators and so havelittle effect on the difference in their frequencies.
The two RF oscillators must be completely isolated from each other. Ifcoupling of any type exists between them, they will synchronise when thedifference is small. Hence, low values of difference frequency are impossible toobtain, and in addition cause interaction between the oscillators that results in ahighly distorted wave shape.
(To ensure low distortion, one of the voltages applied to the mixer, preferablythe one derived from the fixed frequency oscillator, should be considerablysmaller than the voltage derived from the other oscillator, and preferably free ofharmonics.)
BFOs are commonly affected with spurious beat notes, sometimes calledwhistles. These effects are usually the result of cross-modulation in the AFamplifier between high order RF harmonics generated by the mixer. Thesespurious whistles often appear when the output frequency is high.
Whistles can be eliminated by operating the mixer so as to minimise theproduction of RF harmonics, and by using a filter and shielding to prevent theharmonics that are generated in the mixer from reaching the amplifier circuit.
256 Electronic Instrumentation
13. Define duty cycle. List the requirements of a pulse.
14. List the various control on the frontpanel of a pulse generator. Mentiontheir uses.
IS. State the function of symmetry control in a pulse generator.
16. State the function of frequencysweeper and marker generator in asweep generator.
17. Explain with diagram the working ofa marker generator. What is the necessity of using a marker generator?
18. State the application of a sweep generator.
19. Explain the term 'wobbluscope'.20. Describe with a diagram the opera
tion of a wobbluscope. State the applications of a wobbluscope.
21. Differentiate between a sweep generator and wobbluscope.
22. State the front panel controls of awobbluscope.
23. Describe the procedure of alignmentRF and IF sections using a wobbluscope.
24. Explain with a block diagram the operation of a pattern generator. Statethe various applications of a patterngenerator.
25. List the various controls on the frontpanel of a pattern generator. List thevarious patterns generated by a pattern generator.
26. Differentiate between a functiongenerator and pulse and square wavegenerator.
27. Compare a wobbluscope and sweepgenerator.
1. Explain the operation of a basic signal generator.
2. Explain the operating principle of amodern standard signal generator.
3. Describe with the help of a neat blockdiagram the working of a standardsignal Generator. State the limitationsof a standard signal generator.
4. Describe with the help of a neat blockdiagram the operation of a modernlaboratory signal generator. Explainthe technique used to improve its stability.
5. Explain the operation and use offrequency dividers.
6. Describe with diagram the operation of an AF sine and wave generator. State the various controls onthe front panels of a sine and squarewave generator.
7. Explain the operating principle of afunction generator.
8. Explain with the help of a block diagram the operation of a function generator.
9. Explain the method of producingsine waves in a function generator.Explain the operation of a resistancediode network.
10. Explain with the help of block diagram the working of a standardsweep generator.
11. How are broadband sweep frequenciesgenerated using a sweep generator?
12. State with a diagram the workingprinciple of a pulse generator.Describe with the help of a blockdiagram the operation of a pulsegenerator.
Review Duestions I----------------------------
May be obtained (at maximum output), with better than 1% balance, or may be operated single-ended (with low side grounded),at an internal impedance of 600 n, for any portion of outputattenuation
Balanced output
Signal Generators 2S 7
Multiple Choice Ouestions l-I. Modulation in modem signal gen- (c) pulse generator
erator is done internally by signals of (d) AF generatorsfrequency 7. In a function generator, the resistance(a) 400 Hz and 1000Hz diode network is used to produce(b) 600 Hz and 2000 Hz (a) square wave (b) sine wave(c) 100 Hz and 5000 Hz (c) triangularwave (d) pulse wave(d) 10000 Hz and 4000 Hz 8. The principle used in the operation
2. AF sine and square wave generator of a function generator is by usinghas an output impedance of an(a) 600 Q (b) 200 Q (a) LC oscillator (b) RC oscillator(c) 1000Q (d) 50Q. (c) integrator (d) derivation
3. A frequency divider used in a mod- 9. The frequency of a function genera-ern signal generator tor is varied by varying(a) divides the frequency by 2 (a) LC network(b) doubles the frequency (b) RCnetwork(c) divides the frequency by 10 (c) constant current sources(d) multiply the frequency by 2 (d) constant voltage sources
4. Internal calibration in a modern sig- 10. A pulse generator generating a squarenal generator is obtained by using wave has a duty cycle of(a) 2 MHz crystal oscillator (a) 25% (b) 50%(b) I MHz crystal oscillator (c) 75% (d) 40%(c) 5 MHz crystal oscillator 11. A pulse generating, generated a pulse(d) 5.5 MHz crystal oscillator waveform has a duty cycle of
5. Frequency dividers are obtained by (a) 25% (b) 40%the use of (c) 50% (d) 75%(a) LC network (b) AND gate 12. The comparator used in a function(c) flip-flop's (d) RC network generator produces
6. A Wien bridge oscillator is suitable (a) square wavefor (b) triangular wave(a) RF generator (c) sine wave(b) function generator (d) pulse wave
28. Explain in brief the alignment proce- 33. Explain with a diagram the operationdure of a TV receiver using a sweep of a vectroscope.generator. 34. How is the vectrogram produced on
29. What are the different methods of ob- the CRO? Explain with a diagram.taining colour bar patterns? How are 35. State the applications of a vectro-the colour bar patterns generated? scope.
30. Explain with block diagram the op- 36. Explain the working principle of aeration of a gated rainbow colour bar beat frequency oscillator. State itsgenerator. applications.
31. List the main technical specifications 37. Explain with a diagram the workingof a colour bar pattern generator. of a beat frequency oscillator.
32. What is a vectroscope? Where is itused?
258 Electronic Instrumentation
3. Larry D. Jones and A. Foster Chin,Electronic Instruments and Measurements, John Wiley & Sons, 1987.
1. Oliver Cage, Electronic Measurements and instrumentation, McGrawHill, 1975.
2. R.R. Gulati, Monochrome andColour TV,Wiley Eastern, 1983.
Further Reading I-----------------------------~
pared to the Wein bridge type oscillator because(a) it is obtained using piecewise lin
ear approximation(b) it uses crystal reactive element(c) inductor element used has a non
linear B-H relation18. A digital counter IC is to be checked
for it's performance up to 25 MHz. Itcan be done(a) RF signal generator(b) function generator(c) pulse generator(d) pattern generator
19. The number of colour burst generated by the colour bar pattern generated is(a) 10 (b) 20 (c) 5 (d) 15
20. If the number of colour bursts present are ten then the number of petalsdisplayed are(a) 15 (b) 10 (c) 20 (d) 5
13. The frequency sweeper provides themodulating voltage which varies the(a) inductance (b)capacitance(c) resistance (d) voltage
14. A sweep generator is used for(a) fault finding(b) frequency generation(c) amplification(d) alignment
15. Awobbluscope is used for alignmentofa/an(a) radio receiver (b) TV receiver(c) oscilloscope (d) wave analyzer
16. Picture centering and aspect ratiousing a pattern generator can bechecked by the pattern(a) horizontal bar(b) vertical bar(c) cross hatch(d) checker board
17. In a function generator, the spectralpurity of a sine wave is poor as com-
Signal Generators 259
It can be shown mathematically that any complex waveform is made up of afundamental and its harmonics.
It is often desired to measure the amplitude of each harmonic or fundamentalindividually. This can be performed by instruments called wave analyzers. Thisis the simplest form of analysis in the frequency domain, and can be performedwith a set of tuned filters and a voltmeter. Wave analyzers are also referred to asfrequency selective voltmeters, carrier frequency voltmeters, and selective levelvoltmeters. The instrument is tuned to the frequency of one component whoseamplitude is measured.
This instrument is a narrow band superheterodyne receiver, similar to aspectrum analyzer (discussed later). It has a very narrow pass-band. A meter isused for measurement, instead of a CRT. Wave analyzers are used in the low RFrange, below 50 MHz and down through the AF range. They provide a very highfrequency resolution.
Some wave analyzers have the facility of automatic frequency control,in which the tuning automatically locks to a signal. This makes it possible tomeasure the amplitude of signals that are drifting in frequency by amounts thatwould carry them outside the widest pass-band available.
When a sinusoidal signal is applied to the input of an ideal linear amplifier,it produces a sinusoidal output waveform. However, in most cases the outputwaveform is not an exact replica of the input signal because of different typesof distortion. The amount by which the output waveform of an amplifier differsfrom the input waveform is a measure of the distortion introduced by the inherentnon-linear characteristics of the active devices.
Harmonic distortion analyzers measure the total harmonic content in thewaveforms. It can be shown mathematically that an amplitude distorted sine waveis made up of pure sine wave components, including the fundamental frequencyf of the input signal, and harmonic multiples of the fundamental frequency, 2f,3f, 4fetc.
Harmonic distortion can be quantitatively measured very accurately with aharmonic distortion analyzer, generally called a distortion analyzer.
9.1INTRODUCTION
Wave Analyzers andHarmonic Distortion

The intermediate stage is a full wave rectifier, to obtain the average value ofthe input signal. The indicating device is a simple de voltmeter that is calibratedto read the peak value of the sinusoidal input voltage.
Since the LC circuit is tuned to a single frequency, it passes only the frequencyto which it is tuned and rejects all other fi·equencies. A number of tuned filters,connected to the indicating device through a selector switch, would be requiredfor a useful Wave analyzer.
Fig.9.1 (a) Basic wave analyzer
PrimaryDetector
IndicatingDevice
,,,,,,Rectifier'___________ 1
, ,.. _----------_ ..
--------~ --------------.-----.-1: I I-"L--. , .....'_,',__-7'.t !Input :Signal :,,,,
A basic wave analyzer is shown in Fig. 9.1(a). It consists ofa primary detector,which is a simple LC circuit. This LC circuit is adjusted for resonance at thefrequency of the particular harmonic component to be measured.
9.2BASIC WAVE ANALYZER
where Dz, D3, D 4 ... represent the second harmonic, third harmonic, etc.respectively.
The distortion analyzer measures the total harmonic distortion withoutindicating the amplitude and frequency of each component waves.
Signal analysis of both random and periodic signals in the frequency domainis used extensively in electronic and telecommunications. The frequency stabilityand spectral purity of signal sources can be measured by the use of these signalanalyzers.
These signal analyzers can be used along with a frequency generator or asource of white or pseudo-random noise to measure the frequency response ofamplifiers, filters or other networks.
The operational characteristics of a transreceiver and communication systemare determined by measuring various parameters, such as spectral purity of thecarrier wave, spectral power distribution of the amplitude or frequency modulatedwave, signal distortion, and the systems signal to noise ratio.
Such analysis is provided by a wave analyzer, distortion analyzer, spectrumanalyzer, and digital fourier analyzer.
The total harmonic distortion or factor is given by
~ 2 2 2D =D2 +D3 +D4 ...
Wave Analyzers and Harmonic Distortion 261

The complex wave to be analyzed is passed through an adjustable attenuatorwhich serves as a range multiplier and permits a large range of signal amplitudesto be analyzed without loading the amplifier.
The output of the attenuator is then fed to a selective amplifier, which amplifiesthe selected frequency. The driver amplifier applies the attenuated input signalto a high-Q active filter. This high-Q filter is a low pass filter which allows thefrequency which is selected to pass and reject all others. The magnitude of thisselected frequency is indicated by the meter and the filter section identifies thefrequency of the component. The filter circuit consists of a cascaded RC resonantcircuit and amplifiers. For selecting the frequency range, the capacitors generallyused are of the closed tolerance polystyrene type and the resistances used areprecision potentiometers. The capacitors are used for range changing and thepotentiometer is used to change the frequency within the selected pass-band,Hence this wave analyzer is also called a Frequency selective voltmeter.
The entire AF range is covered in decade steps by switching capacitors in theRC section.
The selected signal output from the final amplifier stage is applied to themeter circuit and to an untuned buffer amplifier. The main function of the buffer
Fig. 9.1 (b) Frequency selective wave analyzer
R - is Varied for frequency ControlC - is varied for frequency multiplication
Auxiliary Outputfor Secondary
Devices
High Q-Filter1 -------------------------------------------
Dial Output MeterVolt - Rangedb - Range
c
FilterAmplifier
InputSignal L.._A_tte_n_u_a_to_,r
MeterRange
Attenuator
Meter Amplifierand r.---..---<
Detector
RFilter
Amplifier
Input
r--------------------------------------------------C
The wave analyzer consists of a very narrow pass-band filter section which canbe tuned to a particular frequency within the audible frequency range (20 Hz _ 20kHz). The block diagram ofa wave analyzer is as shown in Fig. 9.l(b).
9.3FREQUENCY SELECTIVE WAVE ANALYZER
262 Electronic Instrumentation
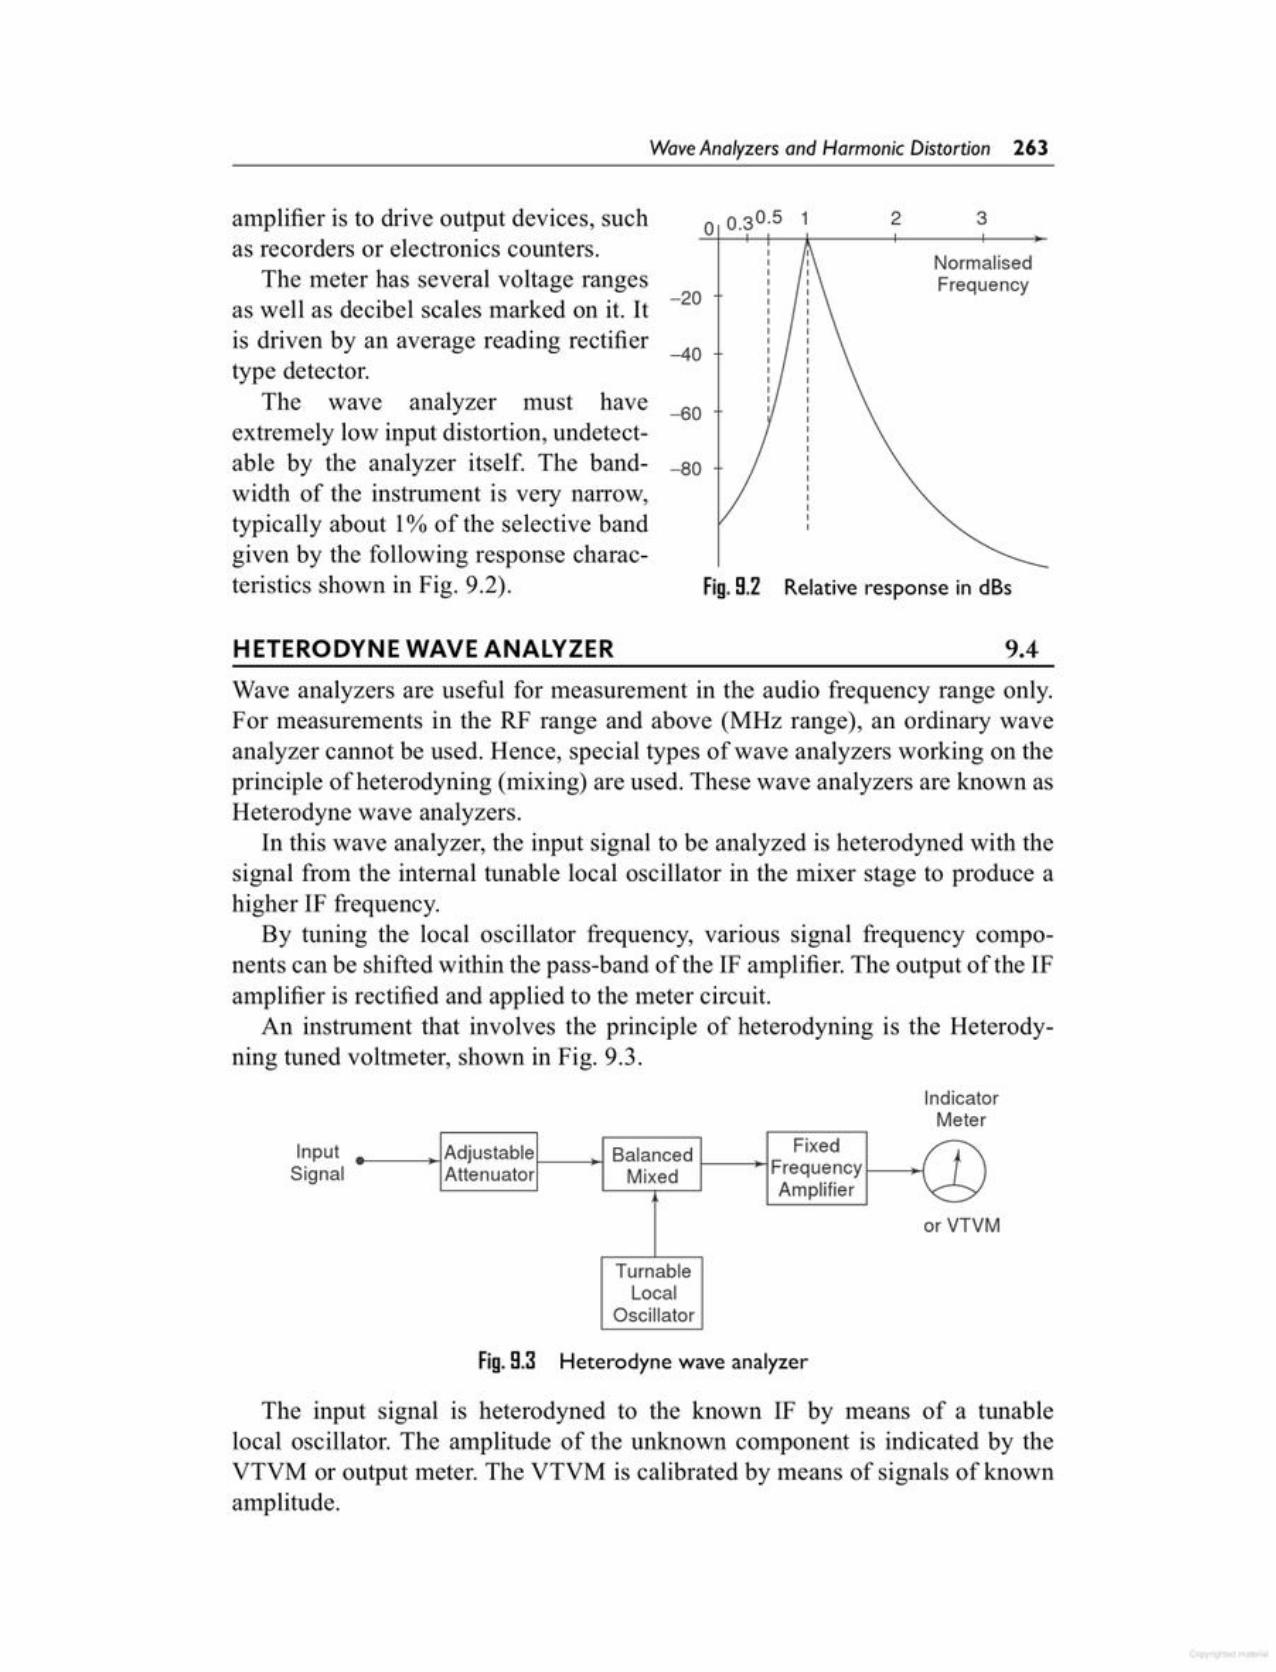
The input signal is heterodyned to the known IF by means of a tunablelocal oscillator. The amplitude of the unknown component is indicated by theVTVM or output meter. The VTVM is calibrated by means of signals of knownamplitude.
Fig.9.3 Heterodyne wave analyzer
M
InputSignal
Adjustable Balanced FixedFrequency WAttenuator Mixed \.-1Amplifier <:>
orVTV
TurnableLocal
Oscillator
IndicatorMeter
Wave analyzers are useful for measurement in the audio frequency range only.For measurements in the RF range and above (MHz range), an ordinary waveanalyzer cannot be used. Hence, special types of wave analyzers working on theprinciple of heterodyning (mixing) are used. These wave analyzers are known asHeterodyne wave analyzers.
In this wave analyzer, the input signal to be analyzed is heterodyned with thesignal from the internal tunable local oscillator in the mixer stage to produce ahigher IF frequency.
By tuning the local oscillator frequency, various signal frequency components can be shifted within the pass-band of the IF amplifier. The output of the IFamplifier is rectified and applied to the meter circuit.
An instrument that involves the principle of heterodyning is the Heterodyning tuned voltmeter, shown in Fig. 9.3.
9.4
Relative response in dBsFig.9.2
NormalisedFrequency
32° 0.30.5 1
-80
-60
-40
-20
HETERODYNE WAVE ANALYZER
amplifier is to drive output devices, suchas recorders or electronics counters.
The meter has several voltage rangesas well as decibel scales marked on it. Itis driven by an average reading rectifiertype detector.
The wave analyzer must haveextremely low input distortion, undetectable by the analyzer itself. The bandwidth of the instrument is very narrow,typically about 1% of the selective bandgiven by the following response characteristics shown in Fig. 9.2).
Wave Analyzers and Harmonic Distortion 263
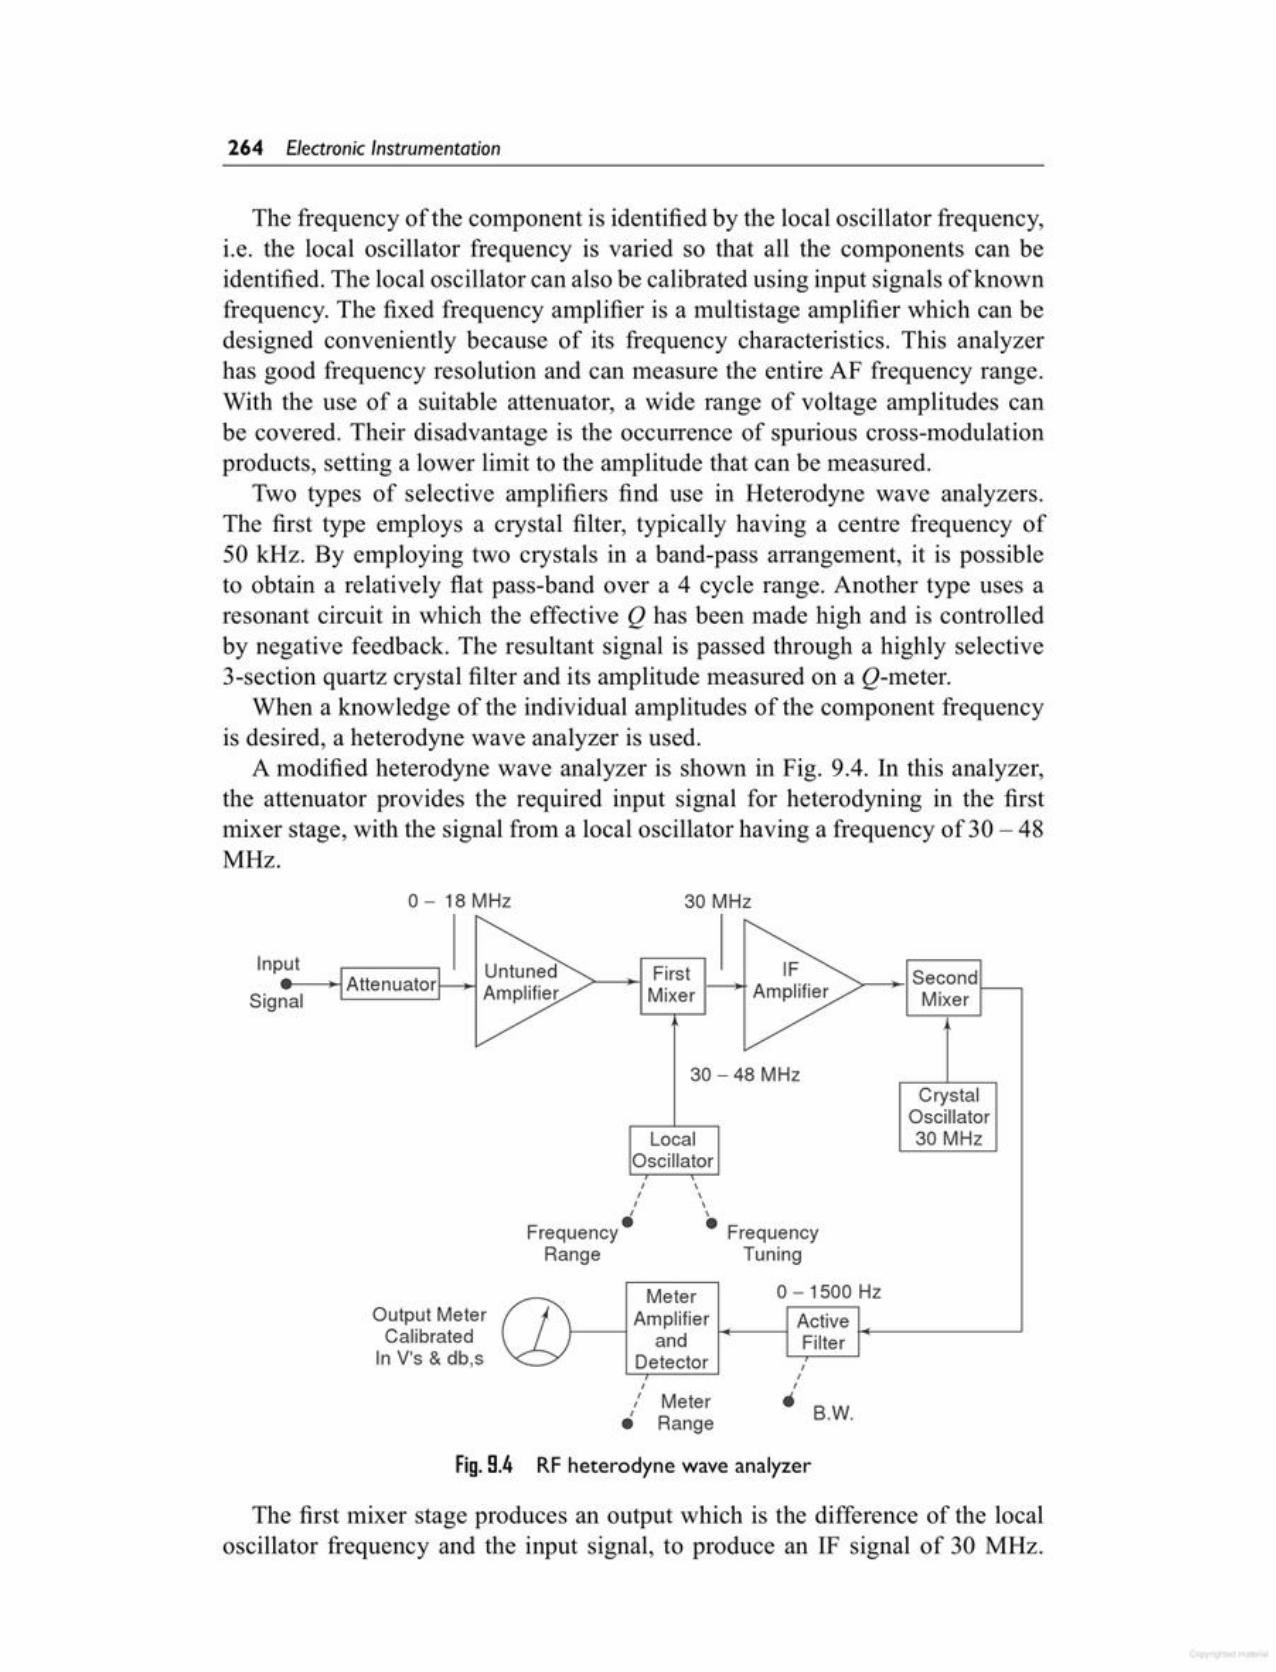
The first mixer stage produces an output which is the difference of the localoscillator frequency and the input signal, to produce an IF signal of 30 MHz.
III• B.W.
I
" MeterI• Range
Fig.9.4 RF heterodyne wave analyzer
Meter 0 - 1500 HzI---lAmplifier '----l Active '- ___J
and FilterDetector
Output MeterCalibratedIn V's & db,s
\\\\
• FrequencyTuning
III•Frequency
Range
LocalOscillator
CrystalOscillator30 MHz
30-48MHz
>-~I Second1--,Mixer
>--~I First IFMixer I-~ Amplifier
30 MHz0-18MHz
The frequency of the component is identified by the local oscillator frequency,i.e. the local oscillator frequency is varied so that all the components can beidentified. The local oscillator can also be calibrated using input signals of knownfrequency. The fixed frequency amplifier is a multistage amplifier which can bedesigned conveniently because of its frequency characteristics. This analyzerhas good frequency resolution and can measure the entire AF frequency range.With the use of a suitable attenuator, a wide range of voltage amplitudes canbe covered. Their disadvantage is the OCCUITenceof spurious cross-modulationproducts, setting a lower limit to the amplitude that can be measured.
Two types of selective amplifiers find use in Heterodyne wave analyzers.The first type employs a crystal filter, typically having a centre frequency of50 kHz. By employing two crystals in a band-pass arrangement, it is possibleto obtain a relatively fiat pass-band over a 4 cycle range. Another type uses aresonant circuit in which the effective Q has been made high and is controlledby negative feedback. The resultant signal is passed through a highly selective3-section quartz crystal filter and its amplitude measured on a Q-meter.
When a knowledge of the individual amplitudes of the component frequencyis desired, a heterodyne wave analyzer is used.
A modified heterodyne wave analyzer is shown in Fig. 9.4. In this analyzer,the attenuator provides the required input signal for heterodyning in the firstmixer stage, with the signal from a local oscillator having a frequency of 30 - 48MHz.
264 Electronic Instrumentation
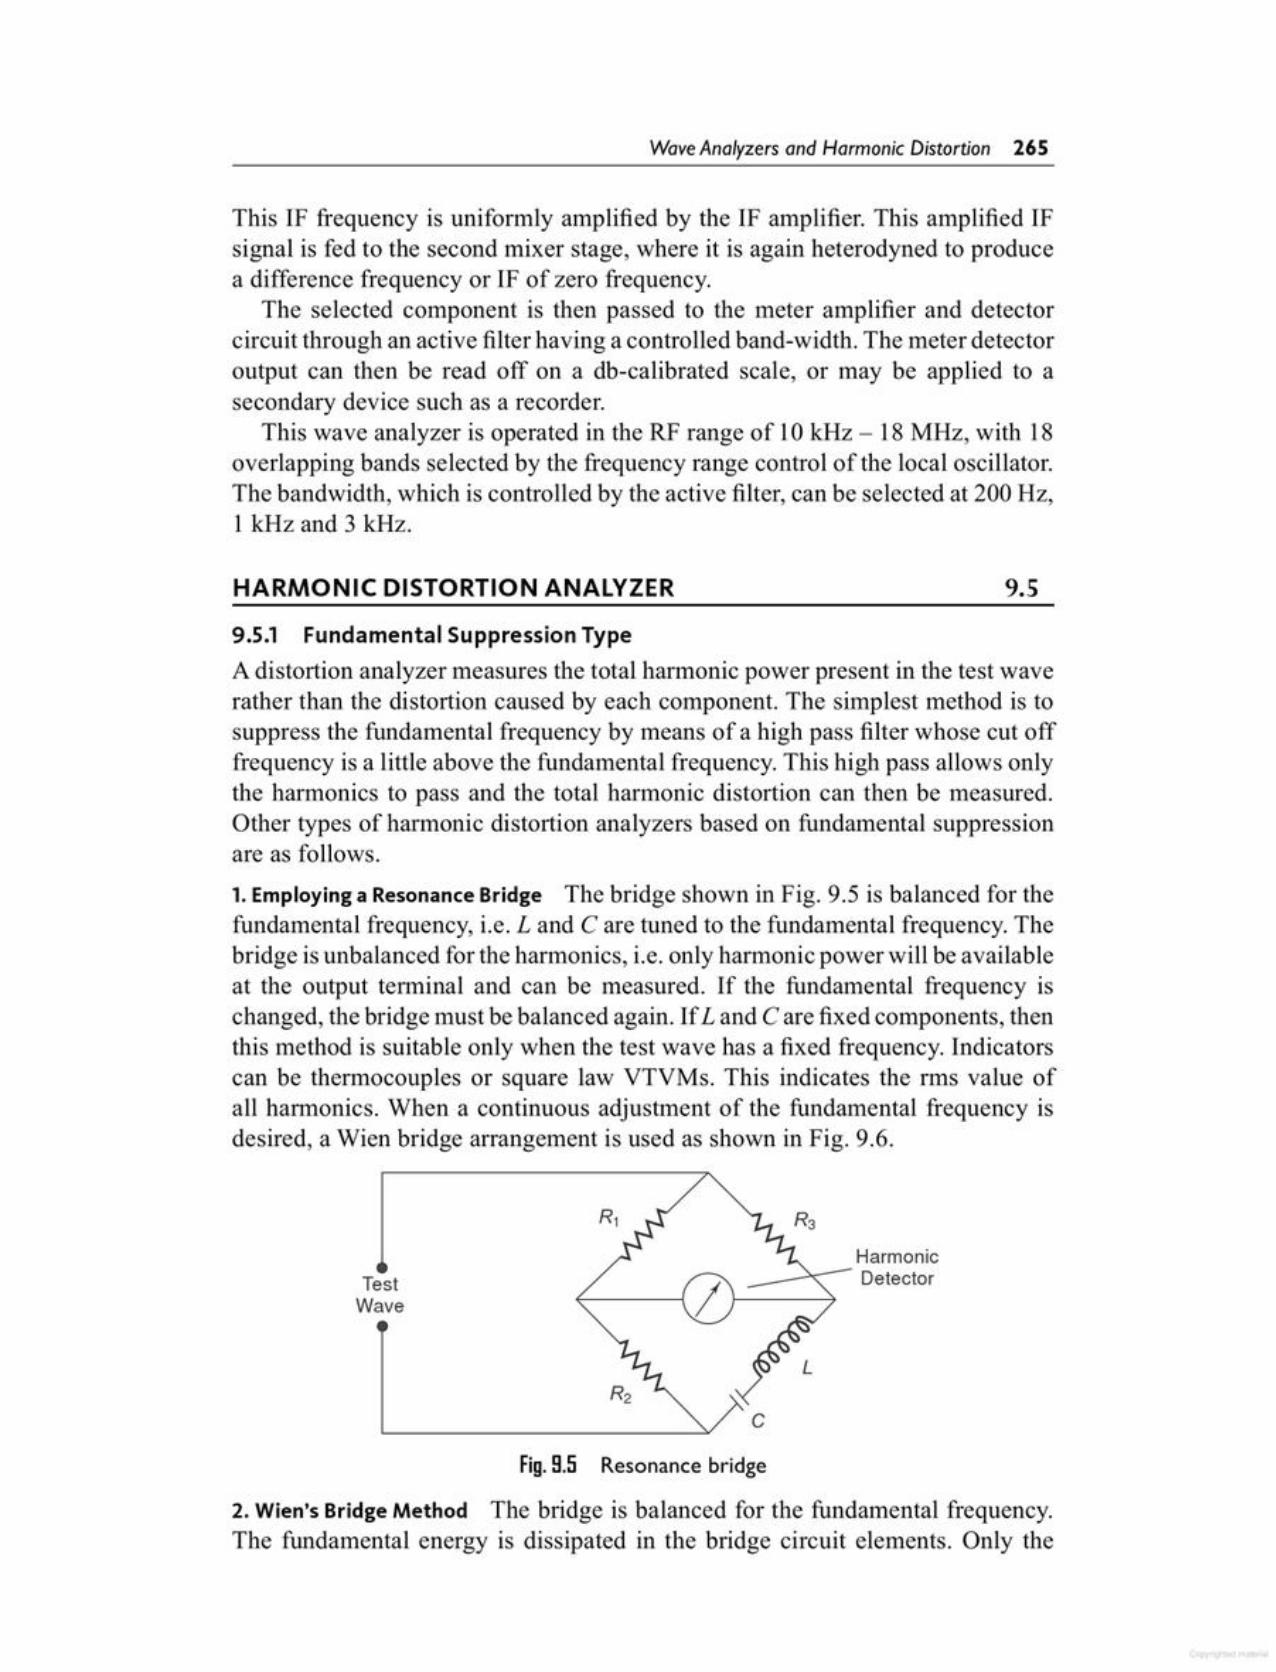
2. Wien's Bridge Method The bridge is balanced for the fundamental frequency.The fundamental energy is dissipated in the bridge circuit elements. Only the
Fig.8.5 Resonance bridge
c
Harmonic____~-:-- DetectorTest
Wave
9.5.1 Fundamental Suppression TypeA distortion analyzer measures the total harmonic power present in the test waverather than the distortion caused by each component. The simplest method is tosuppress the fundamental frequency by means of a high pass filter whose cut offfrequency is a little above the fundamental frequency. This high pass allows onlythe harmonics to pass and the total harmonic distortion can then be measured.Other types of harmonic distortion analyzers based on fundamental suppressionare as follows.
1. Employing a Resonance Bridge The bridge shown in Fig. 9.5 is balanced for thefundamental frequency, i.e. Land C are tuned to the fundamental frequency. Thebridge is unbalanced for the harmonics, i.e. only harmonic power will be availableat the output terminal and can be measured. If the fundamental frequency ischanged, the bridge must be balanced again. If Land C are fixed components, thenthis method is suitable only when the test wave has a fixed frequency. Indicatorscan be thermocouples or square law VTVMs. This indicates the rms value ofall harmonics. When a continuous adjustment of the fundamental frequency isdesired, a Wien bridge arrangement is used as shown in Fig. 9.6.
9.5HARMONIC DISTORTION ANALYZER
This IF frequency is uniformly amplified by the IF amplifier. This amplified IFsignal is fed to the second mixer stage, where it is again heterodyned to producea difference frequency or IF of zero frequency.
The selected component is then passed to the meter amplifier and detectorcircuit through an active filter having a controlled band-width. The meter detectoroutput can then be read off on a db-calibrated scale, or may be applied to asecondary device such as a recorder.
This wave analyzer is operated in the RF range of 10kHz - 18 MHz, with 18overlapping bands selected by the frequency range control of the local oscillator.The bandwidth, which is controlled by the active filter, can be selected at 200 Hz,1 kHz and 3 kHz.
Wave Analyzers and Harmonic Distortion 265
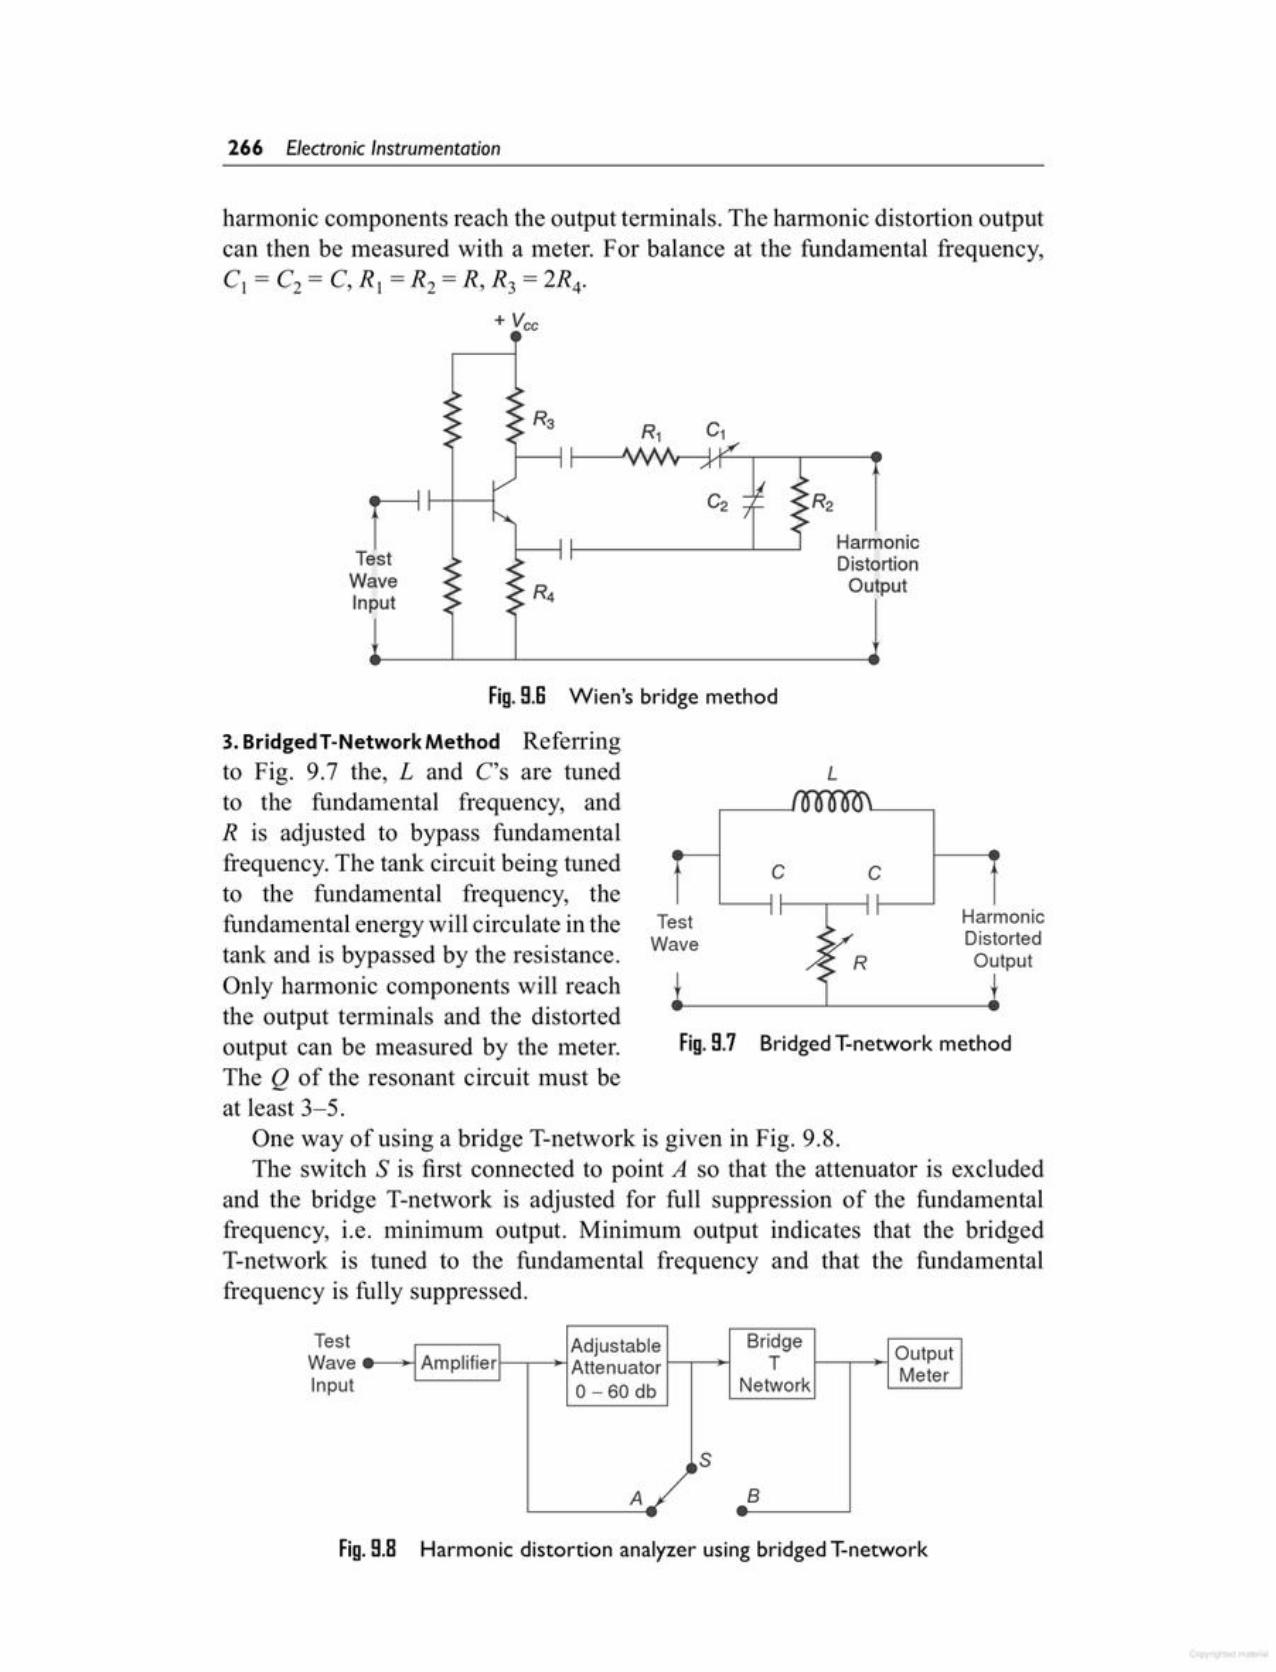
Fig.S.B Harmonic distortion analyzer using bridged T-network
Bridge:Amplifier:
Adjustable OutputAttenuator T Meter0-60 db Network
J~S
A ..8-
TestWaveInput
One way of using a bridge T-network is given in Fig. 9.8.The switch S is first connected to point A so that the attenuator is excluded
and the bridge T-network is adjusted for full suppression of the fundamentalfrequency, i.e. minimum output. Minimum output indicates that the bridgedT-network is tuned to the fundamental frequency and that the fundamentalfrequency is fully suppressed.
Fig.S.7 Bridged T-network method
Test HarmonicWave Distorted
R Output~ {
c c
L
Fig.S.B Wien's bridge method
3. BridgedT-NetworkMethod Referringto Fig. 9.7 the, Land C's are tunedto the fundamental frequency, andR is adjusted to bypass fundamentalfrequency. The tank circuit being tunedto the fundamental frequency, thefundamental energy will circulate in thetank and is bypassed by the resistance.Only harmonic components will reachthe output terminals and the distortedoutput can be measured by the meter.The Q of the resonant circuit must beat least 3-5.
HarmonicDistortionOutput
1TestWaveInput
+ vee
harmonic components reach the output terminals. The harmonic distortion outputcan then be measured with a meter. For balance at the fundamental frequency,C1 = C2 = C, RI =R2 =R, R3 = 2R4·
266 Electronic Instrumentation

9.6.1 Basic Spectrum Analyzer Using Swept Receiver DesignReferring to the block diagram of Fig. 9.9(b), the sawtooth generator providesthe sawtooth voltage which drives the horizontal axis element of the scope andthis sawtooth voltage is the frequency controlled element of the voltage tuned
Fig. 9.9 (a) Spectrum analyzer (Parallel filterbank analyzer)
Overlapping Filter Bankt
e
n ParallelFilters-- ------
Parallel Filter Bank Analyzer
r=:'---. Output'----I Filter
SimultaneousOutput to CRT
Display
Input.-+---l FilterV(t)
Outputr--i Filter
The most common way of observing signals is to display them on an oscilloscope,with time as the X-axis (i.e. amplitude of the signal versus time). This is thetime domain. It is also useful to display signals in the frequency domain. Theinstrument providing this frequency domain view is the spectrum analyzer.
A spectrum analyzer provides a calibrated graphical display on its CRT, withfrequency on the horizontal axis and amplitude (voltage) on the vertical axis.
Displayed as vertical lines against these coordinates are sinusoidal componentsof which the input signal is cornposed. The height represents the absolutemagnitude, and the horizontal location represents the frequency.
These instruments provide adisplay of the frequency spectrumover a given frequency band.Spectrum analyzers use eithera parallel filter bank or a sweptfrequency technique.
In a parallel filter bank analyzer,the frequency range is covered bya series of filters whose centralfrequencies and bandwidth are soselected that they overlap each Amplitudother, as shown in Fig. 9.9(a).
Typically, an audio analyzerwill have 32 of these filters, eachcovering one third of an octave.
For wide band narrow resolutionanalysis, particularly at RF ormicrowave signals, the swepttechnique is preferred.
9.6SPECTRUM ANALYZER
The switch is next connected to terminal B, i.e. the bridged T-network isexcluded. Attenuation is adjusted until the same reading is obtained on the meter.The attenuator reading indicates the total rms distortion. Distortion measurementcan also be obtained by means of a wave analyzer, knowing the amplitude andthe frequency of each component, the harmonic distortion can be calculated.However, distortion meters based on fundamental suppression are simpler todesign and less expensive than wave analyzers. The disadvantage is that theygive only the total distortion and not the amplitude of individual distortioncomponents.
Wave Analyzers and Harmonic Distortion 267
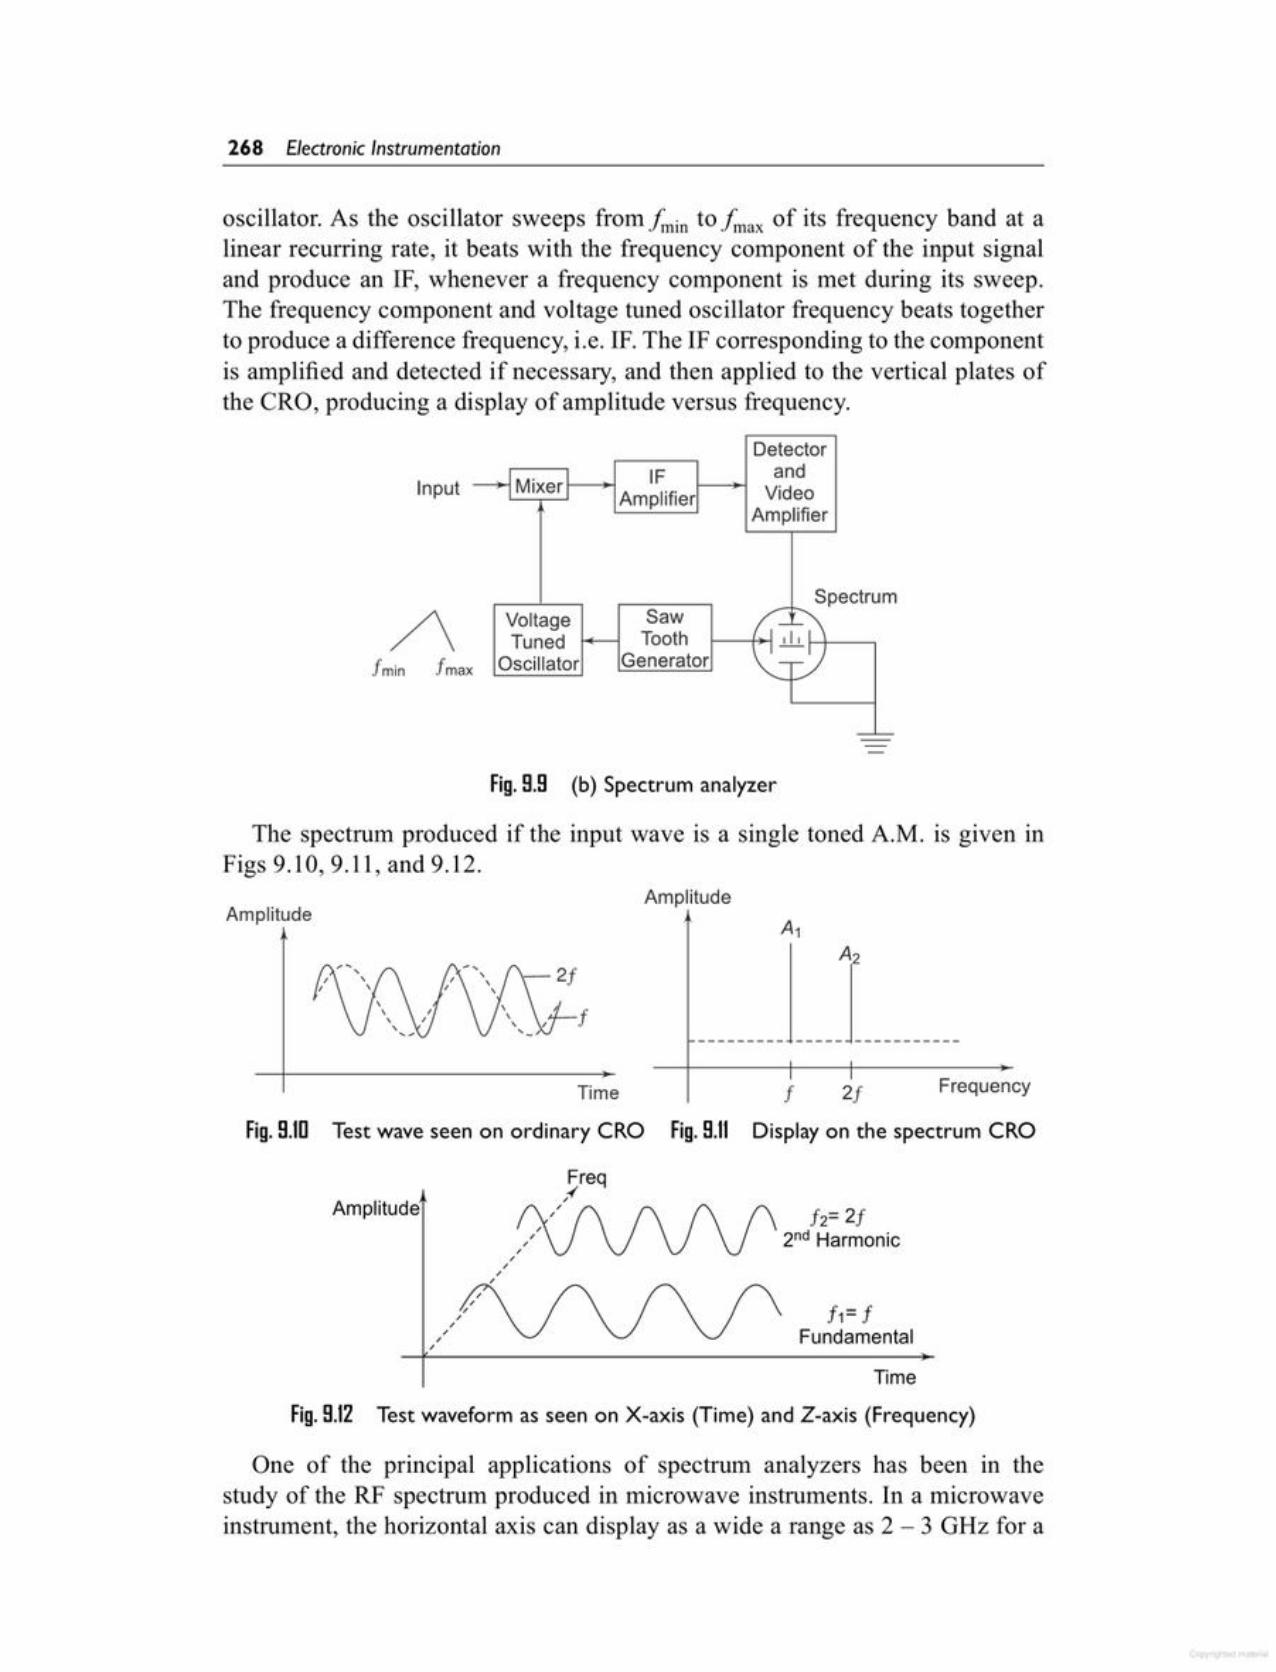
One of the principal applications of spectrum analyzers has been in thestudy of the RF spectrum produced in microwave instruments. In a microwaveinstrument, the horizontal axis can display as a wide a range as 2 - 3 GHz for a
Fig.9.12 Test waveform as seen on X-axis (Time) and Z-axis (Frequency)
Time
f1= fFundamental
f2= 2f2nd Harmonic
,,,,,,,,
Amplitude
Fig.9.ID Test wave seen on ordinary CRO Fig.9.11 Display on the spectrum CRO
Freq,~
fTime Frequency
______________'l _2f
f
AmplitudeAmplitude
The spectrum produced if the input wave is a single toned A.M. is given inFigs 9.10, 9.11, and 9.12.
Fig.9.9 (b) Spectrum analyzer
m
Detectorand
iMixerl IFAmplifier Video
Amplifier
SpectruVoltage Saw --Tuned Tooth 1 Ii I 1
Oscillator Generator 1_,-1
- '--
fmin fmax/\
Input
oscillator. As the oscillator sweeps from j~)in to fmax of its frequency band at alinear recurring rate, it beats with the frequency component of the input signaland produce an IF, whenever a frequency component is met during its sweep.The frequency component and voltage tuned oscillator frequency beats togetherto produce a difference frequency, i.e. IF. The IF corresponding to the componentis amplified and detected if necessary, and then applied to the vertical plates ofthe eRO, producing a display of amplitude versus frequency.
268 Electronic Instrumentation
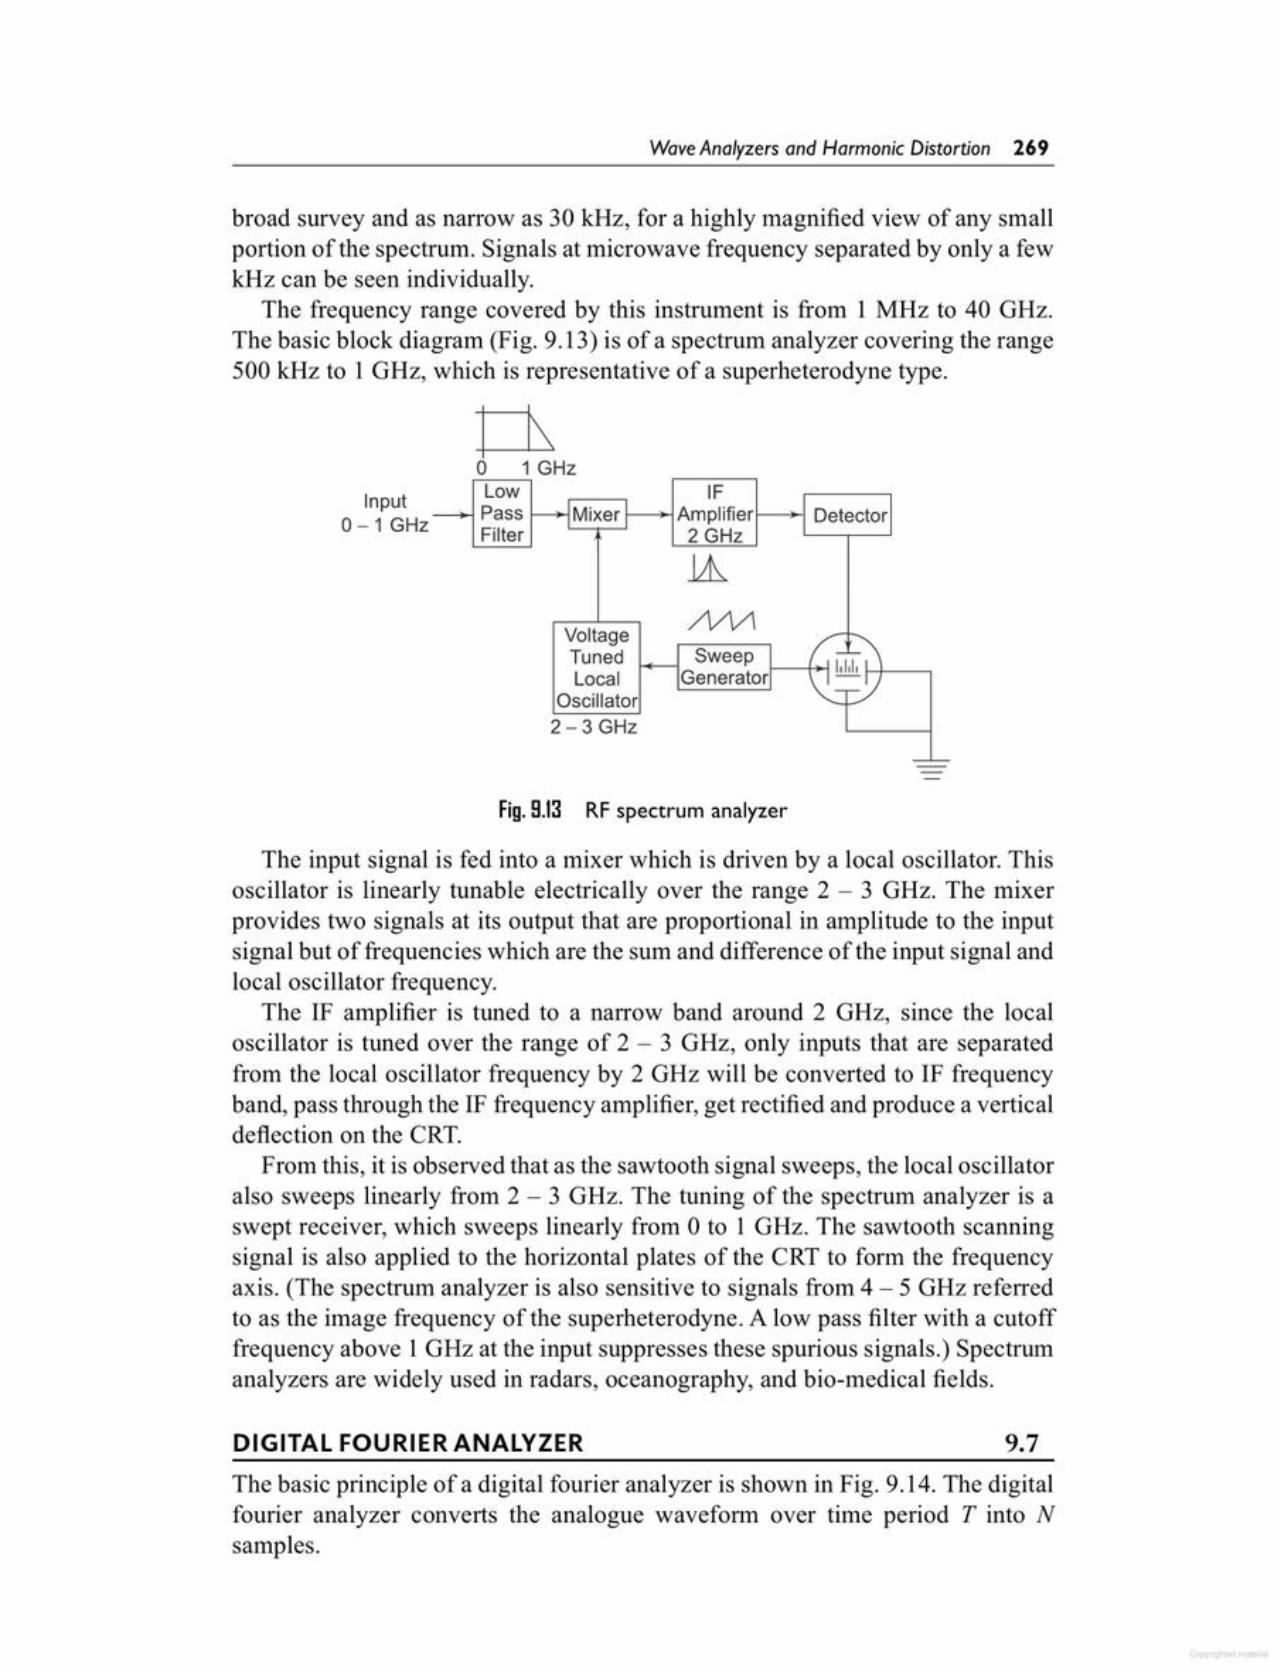
The basic principle of a digital fourier analyzer is shown in Fig. 9.14. The digitalfourier analyzer converts the analogue waveform over time period T into Nsamples.
9.7DIGITAL FOURIER ANALYZER
The input signal is fed into a mixer which is driven by a local oscillator. Thisoscillator is linearly tunable electrically over the range 2 - 3 GHz. The mixerprovides two signals at its output that are proportional in amplitude to the inputsignal but of frequencies which are the sum and difference of the input signal andlocal oscillator frequency.
The IF amplifier is tuned to a narrow band around 2 GHz, since the localoscillator is tuned over the range of 2 - 3 GHz, only inputs that are separatedfrom the local oscillator frequency by 2 GHz will be converted to IF frequencyband, pass through the IF frequency amplifier, get rectified and produce a verticaldeflection on the CRT.
From this, it is observed that as the sawtooth signal sweeps, the local oscillatoralso sweeps linearly from 2 - 3 GHz. The tuning of the spectrum analyzer is aswept receiver, which sweeps linearly from 0 to 1 GHz. The sawtooth scanningsignal is also applied to the horizontal plates of the CRT to form the frequencyaxis. (The spectrum analyzer is also sensitive to signals froIn4 - 5 GHz referredto as the image frequency of the superheterodyne. A low pass filter with a cutofffrequency above 1GHz at the input suppresses these spurious signals.) Spectrumanalyzers are widely used in radars, oceanography, and bio-medical fields.
Fig.9.13 RF spectrum analyzer
Low IFPass IMixerl Amplifier DetectorI' IFilter 2 GHz
1h/\/VIVoltage
Tuned Sweep --, 1,1,1, ILocal Generator \ I-I
Oscillator --2 - 3 GHz
- '--
Input0-1 GHz
ri,o 1 GHz
broad survey and as narrow as 30 kHz, for a highly magnified view of any smallportion of the spectrum. Signals at microwave frequency separated by only a fewkHz can be seen individually.
The frequency range covered by this instrument is from IMHz to 40 GHz.The basic block diagram (Fig. 9.13) is of a spectrum analyzer covering the range500 kHz to 1 GHz, which is representative of a superheterodyne type.
Wave Analyzers and Harmonic Distortion 269
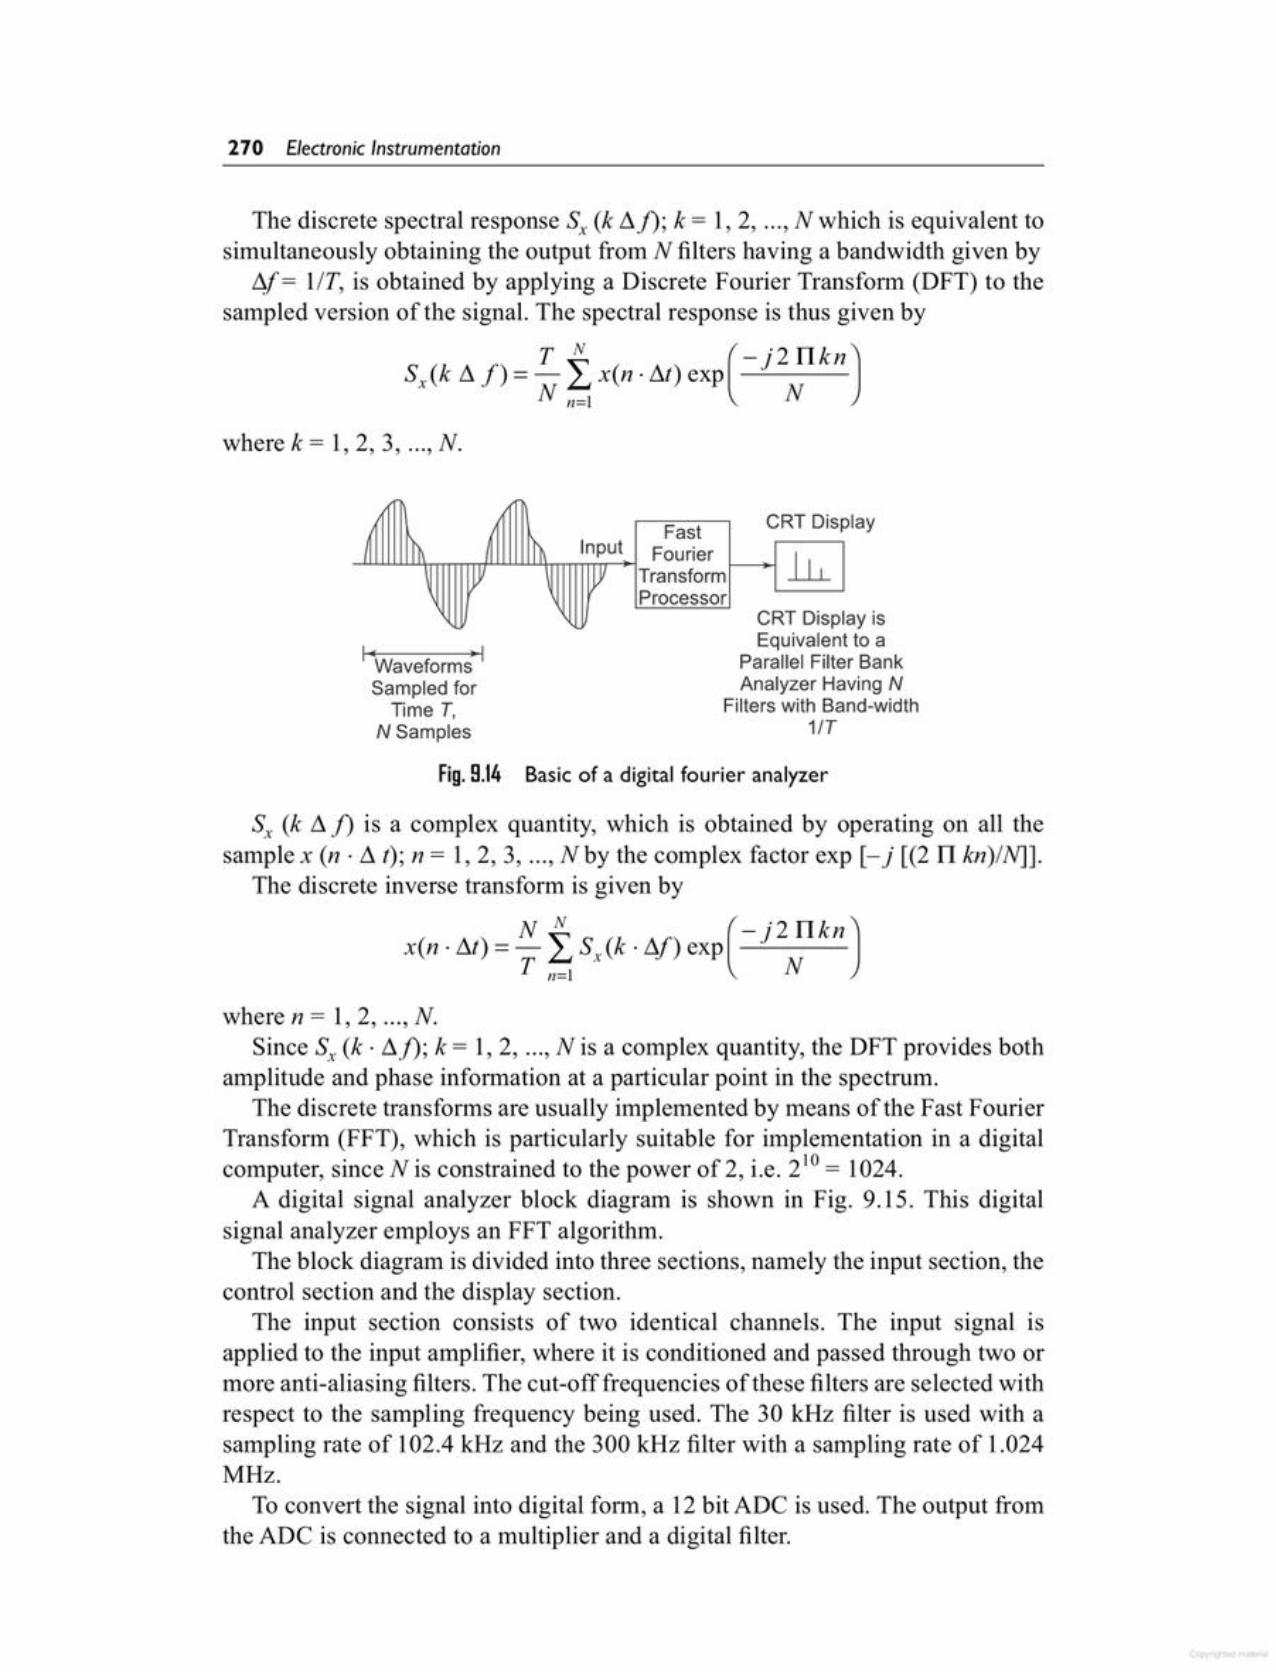
where n = 1,2, ...,N.Since Sx (k . tlj); k = 1, 2, ..., N is a complex quantity, the DFT provides both
amplitude and phase information at a particular point in the spectrum.The discrete transforms are usually implemented by means of the Fast Fourier
Transform (FFT), which is particularly suitable for implementation in a digitalcomputer, since N is constrained to the power of 2, i.e. 210 = 1024.
A digital signal analyzer block diagram is shown in Fig. 9.15. This digitalsignal analyzer employs an FFT algorithm.
The block diagram is divided into three sections, namely the input section, thecontrol section and the display section.
The input section consists of two identical channels. The input signal isapplied to the input amplifier, where it is conditioned and passed through two ormore anti-aliasing filters. The cut-off frequencies of these filters are selected withrespect to the sampling frequency being used. The 30 kHz filter is used with asampling rate of 102.4 kHz and the 300 kHz filter with a sampling rate of 1.024MHz.
To convert the signal into digital form, a 12 bitADC is used. The output fromthe ADC is connected to a multiplier and a digital filter.
NN (-·2TIknJx(n . tlt) =- L Sx(k . tlf) exp }T n=l N
S, (k tl j) is a complex quantity, which is obtained by operating on all thesample x (n· tl t); n = 1,2,3, ..., Nby the complex factor exp [- J [(2 TI kn)/N]].
The discrete inverse transform is given by
Basic of a digital fourier analyzerFig. 9.14
CRT Display isEquivalent to a
Parallel Filter BankAnalyzer Having N
Filters with Band-width1fT
I ( ~ IWaveformsSampled for
Time T,NSamples
CRT DisplayFastFourier I I
Transformf---*1 ...Ll..LProcessor L..___-'
where k = 1,2,3, ..., N.
The discrete spectral response S, (k tlj); k = 1,2, ..., N which is equivalent tosimultaneously obtaining the output from N filters having a bandwidth given by4[= liT, is obtained by applying a Discrete Fourier Transform (DFT) to the
sampled version of the signal. The spectral response is thus given by
T N (-J2TIknJSx(k tl f) = - L x(n· tlt) expN n=l N
270 Electronic Instrumentation
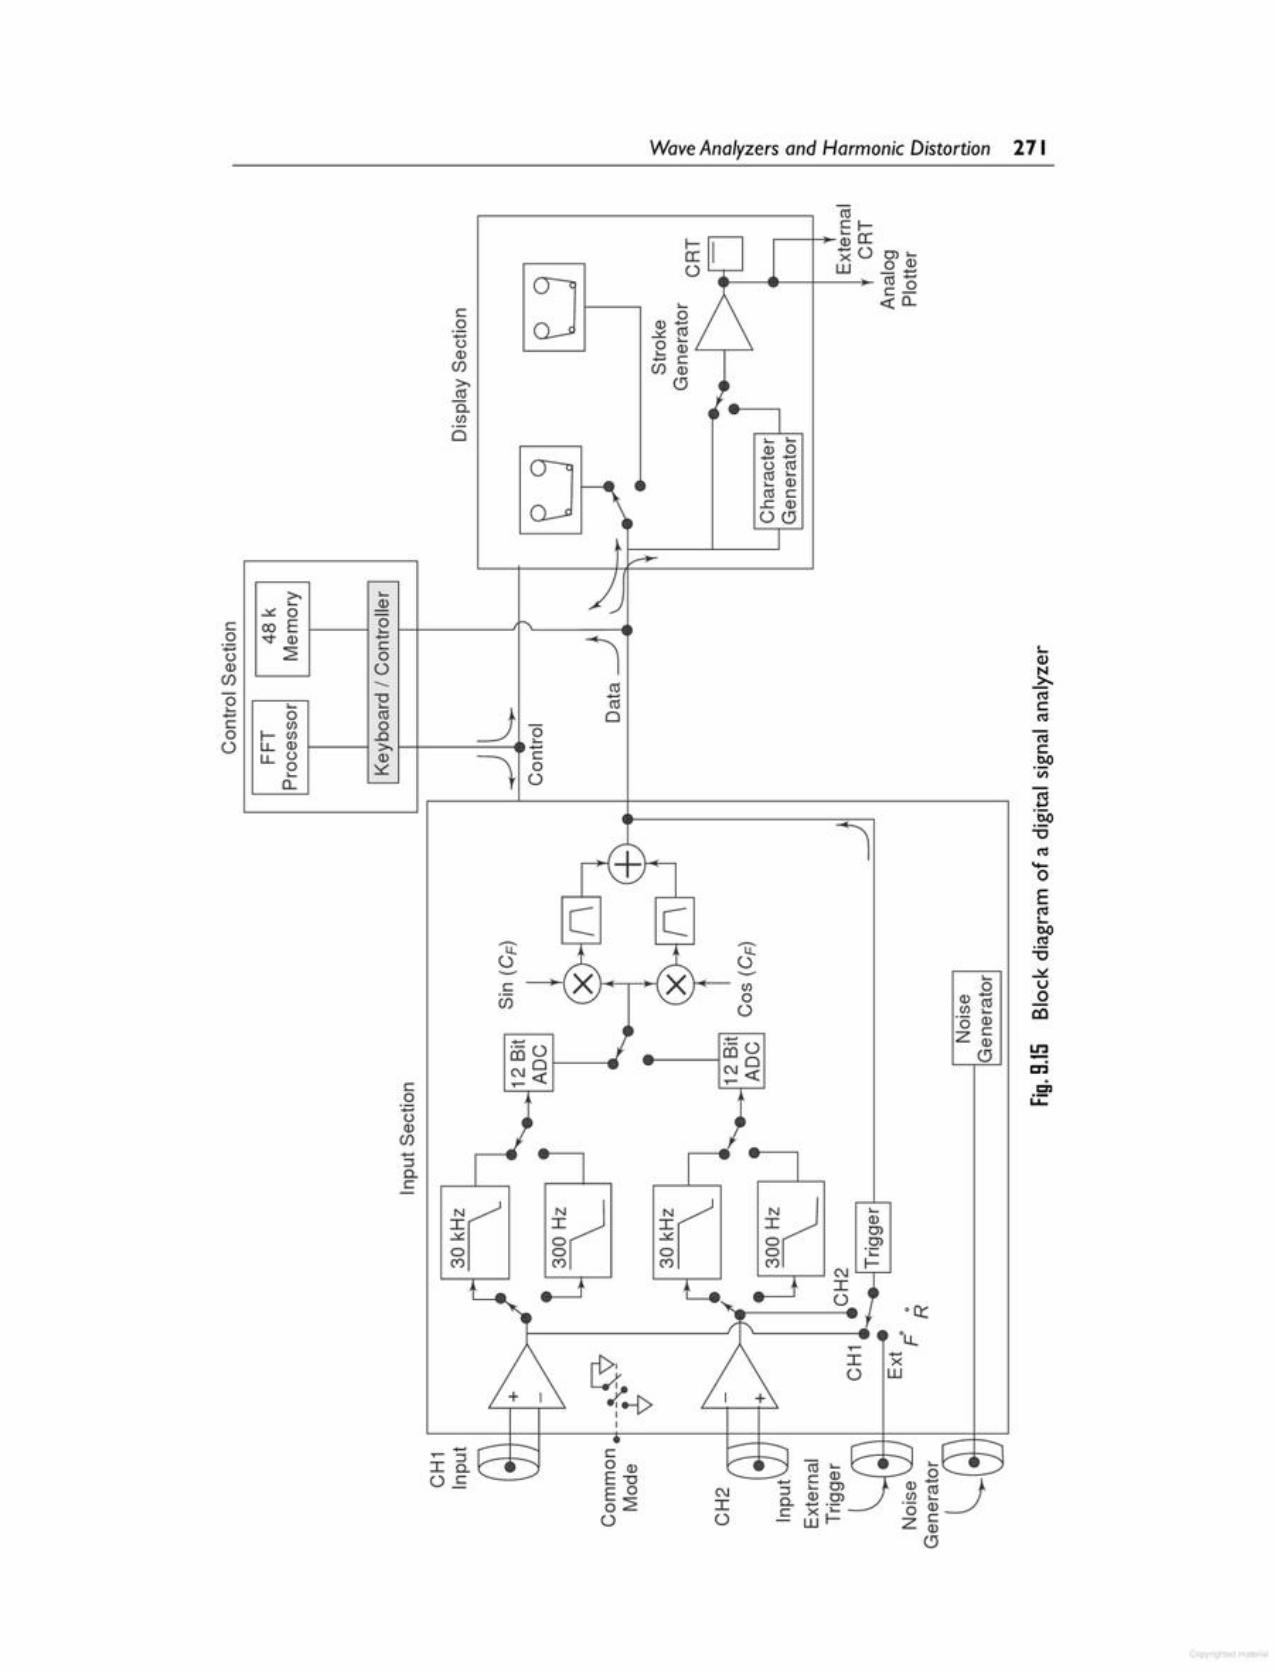
C\JIo
.....xwIo!\'0:::
-....-Q)0>0>·c
C\JJ:::;_~ ~
Ij
I
.....·-0.- __ --1ell 0
C\J«~
.....·-0ell 01-----_C\J«..-
t. ...."- _ +~
!--------__// ,'---------e_ - 'u,~
.....::::lc,C
co..,:;oQ)(/)
+
........Q) 0- .....~ ~..... Q)rn c..cQ)
00I
• __ -'1
t....Q)
~<1lC<1l(;lC1)0VI
s:§>"0<1l._0E<1lt....1)0.~"0
.... ~0 U
(l)- ..Q(/) ~ eo·0 (l)
z c(l)
0 In-C'Jen
L.i:
r-.....(l)
0 <,......... 1c00...... <1l-c .........
_)rnrn 0
0 0_c ....>- -(l)
~
c~ 0'-- 0
>-......:.:: 0c co E0 "<t Q):;:::: 2oQ)(/)
0.... ......... 0c (/)0 f- (/)
0 u.. (l)
u.. o0....a...
c.Qt3Q)(/)><1lo,(/)
o
Wave Analyzers and Harmonic Distortion 271
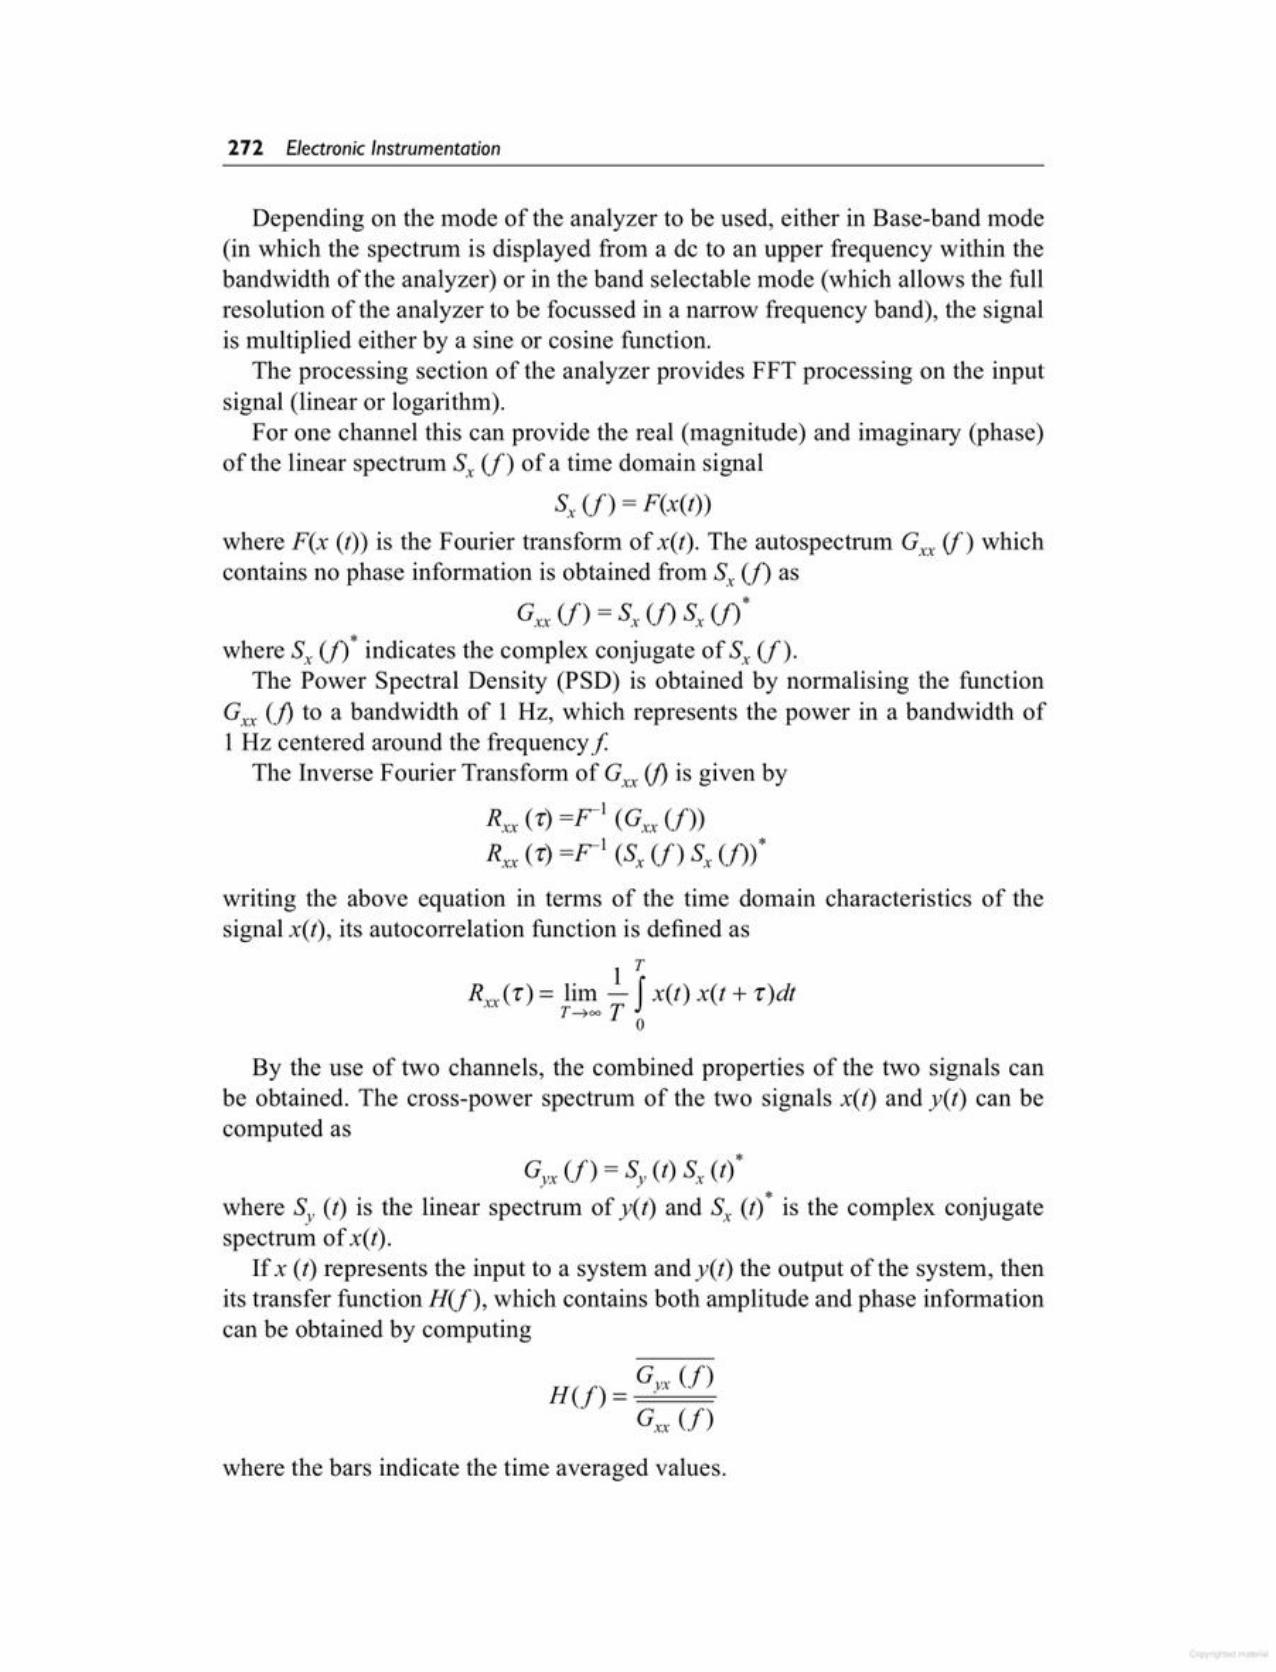
where the bars indicate the time averaged values.
H(f) = GyX (f)c, (f)
*Gyx (f) = Sy (t) s, (t)where Sy (t) is the linear spectrum of yet) and Sx (t) * is the complex conjugatespectrum of x(t).
If x (t) represents the input to a system and yet) the output of the system, thenits transfer function H(f), which contains both amplitude and phase informationcan be obtained by computing
By the use of two channels, the combined properties of the two signals canbe obtained. The cross-power spectrum of the two signals x(t) and yet) can becomputed as
writing the above equation in terms of the time domain characteristics of thesignal x(t), its autocorrelation function is defined as
1 TR,u(r) = lim - J x(t) x(t + r)dt
T-too T o
Depending on the mode of the analyzer to be used, either in Base-band mode(in which the spectrum is displayed from a de to an upper frequency within thebandwidth of the analyzer) or in the band selectable mode (which allows the fullresolution of the analyzer to be focussed in a narrow frequency band), the signalis multiplied either by a sine or cosine function.
The processing section of the analyzer provides FFT processing on the inputsignal (linear or logarithm).
For one channel this can provide the real (magnitude) and imaginary (phase)of the linear spectrum Sx (f) of a time domain signal
s, (f) = F(x(t))where F(x (t)) is the Fourier transform of x(t). The auto spectrum Gxx (j) whichcontains no phase information is obtained from Sx (j) as
*Gxx (f) =s, (j) s, (j)where S, (j)* indicates the complex conjugate of S, (f).
The Power Spectral Density (PSD) is obtained by normalising the functionGxx (J) to a bandwidth of 1 Hz, which represents the power in a bandwidth of1 Hz centered around the frequency f
The Inverse Fourier Transform of GX-T. (j) is given by
Rxx (-r) =Y' (Gxx (f))Rxx (-r) =Y' (Sx (f) s, (j))*
272 Electronic Instrumentation
PRACTICAL FFT SPECTRUM ANALYSIS USING A WAVEFORMPROCESSING SOFTWARE (SS-36) 9.8The Waveform Processing Software (SS-36) enables one to analyze waveformsvery easily. The waveform is captured on a Digital Storage Oscilloscope (DSO)and is transferred to a PC via an RS 232 Serial Interface, which may be in-builtin some DSOs.
Further, the software is programmed to work with almost any configurationof PC. The software automatically senses the system and configures itself for it(i.e. whether you are using a monochrome or colour monitor, whether you havea co-processor or not etc.).
Suppose a voltage and current waveform in a circuit, is captured on a DSO.If the voltage is multiplied with the current, power is obtained and if voltage
is divided by current, impedance is obtained. If this is done for all 1000 valuesof the voltage and the current captured on the DSO and plotted, a power andimpedance curve is obtained. This process is performed by the software itself.The software can also perform multiplication, division, addition, and subtractionof two simple waveforms, as shown in Fig. 9.16. Figures 9.16(d) and (e) showsone waveform can be added and subtracted by another waveform using FFTanalysis.
FFT spectrum analysis is also a very powerful tool. The conventional CROgives a display of voltage versus time, but by using FFT, the amplitudes of thevarious frequencies that constitute the waveform can be obtained. The voltageversus frequency plot then shows the spectral content of the waveform. Forinstance, if a mains voltage is captured and analyzed, its harmonic content canbe obtained.
The frequency range ofFFT spectrum analysis is froIn 0.002 Hz to 10 MHz.The minimum step or frequency resolution possible is 0.002 Hz. The display canbe linear or logarithmic.
Another example of waveform processing is of an amplitude modulated signal(100 kHz modulated by 8 kHz). This waveform, along with its fourier analysis,is illustrated in Fig. 9.17.
Figure 9.17(2a) shows aAM 100 kHz waveform modulated by 8 kHz, capturedon a digital storage oscilloscope and on a PC.
Figure 9.17(2b) and (2c) shows its FFT analysis (carrier and sidebands).Figure 9.17 (1a) illustrates the captured waveform of an electrical or mechanical
impulse.Figure 9.17( 1band 1c) shows the FFT spectral analysis.Figure 9.18 Shows a pictorial set up of FFT spectrum analysis.
The input signal used for such measurements is often the internal randomnoise generator.
Wave Analyzers and Harmonic Distortion 273
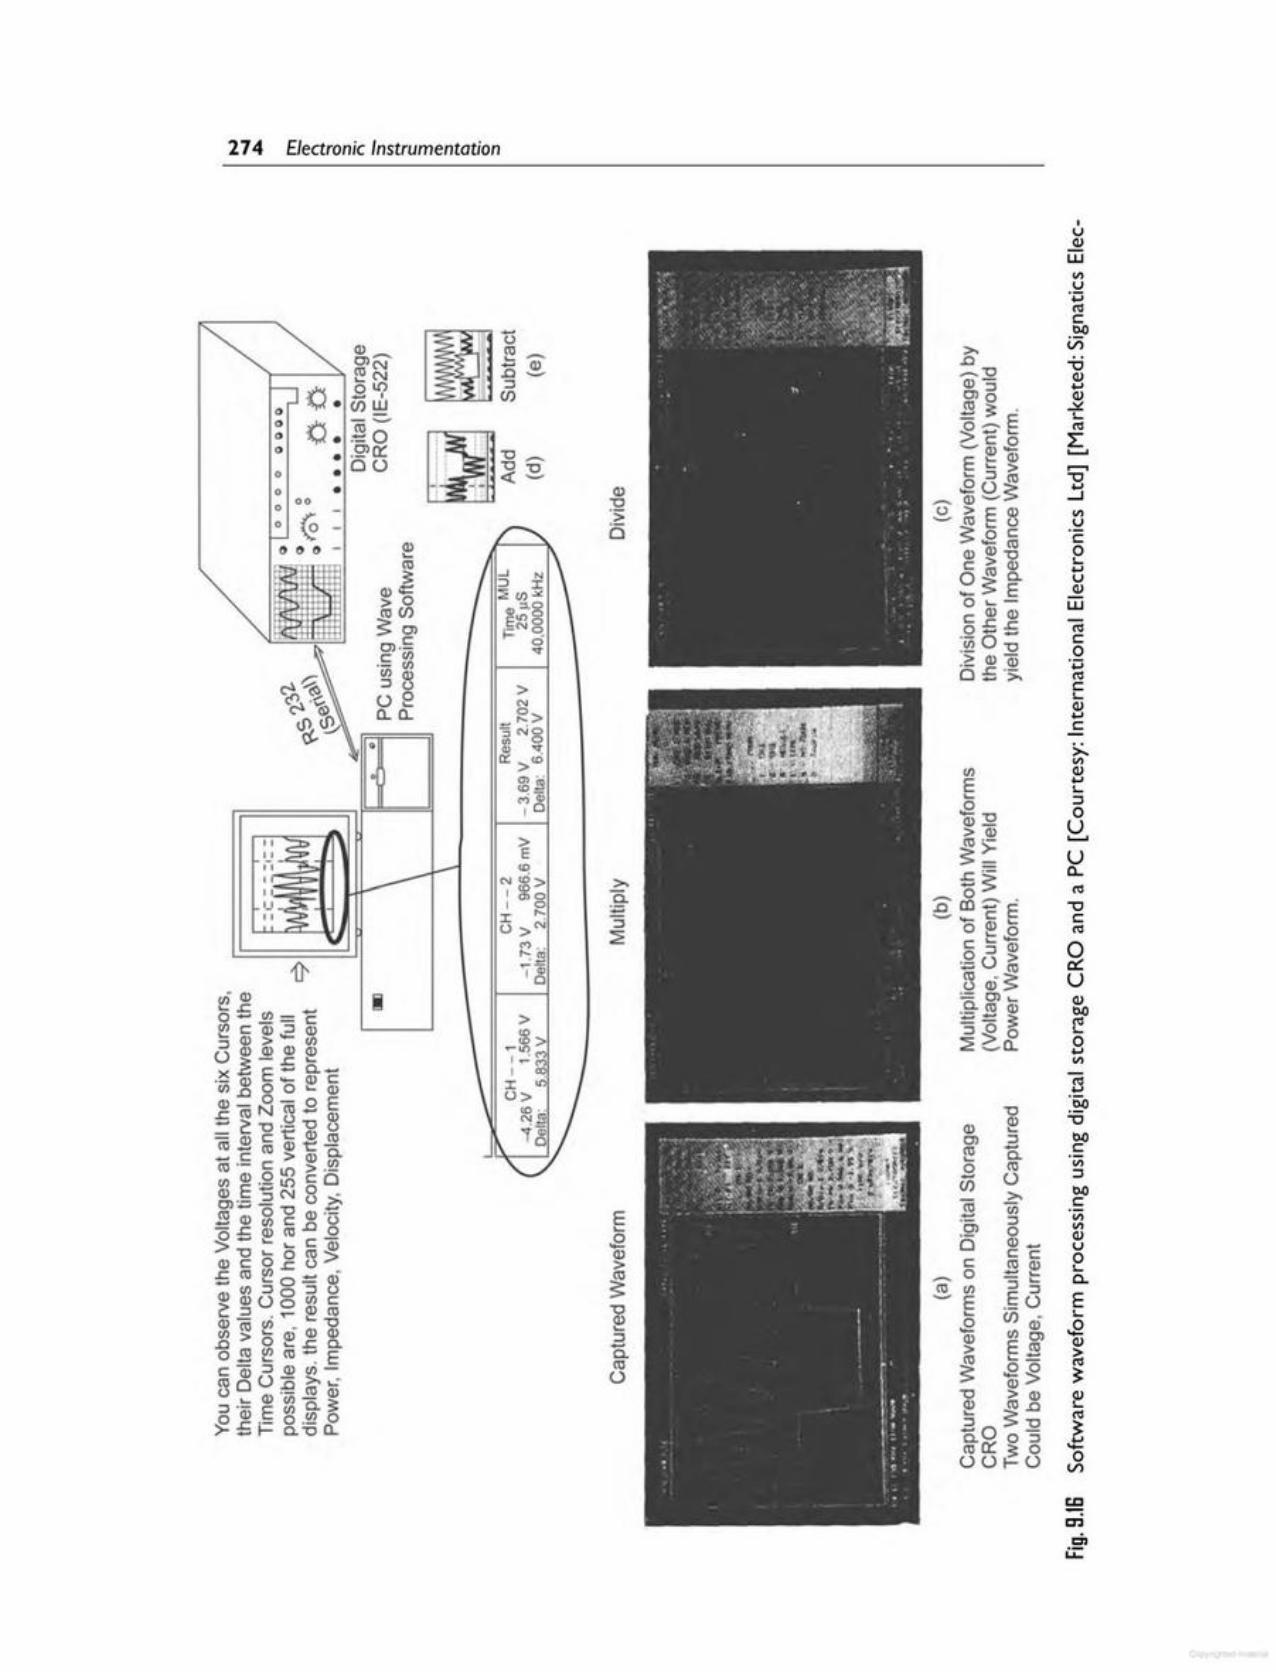
~
"0 :§>(l) "0
(l) ...._bO0) .2 eco a. 'Vi.... co0 :J- U(/) eo>- cco (ii 'Vi- :J'0) <II0 Q)Q Q)~ ue e 0c ro (l) ....0 :!:::t: Q.sn :J:JEE .S 0 ........ (/) - ..Q0 (l)-- mOl(l) E CO Q)>~
~'- :!!!.2g ~(l)
"0 > (l) Q)(l) co .0 ....:J ~'O
CIS~-003~g- 0:: ?: 0 0OOr-U V)
!:1=enL.i:
uCLCIS"0eCIS
2uQ)
~o....<II
•u(l)
W<IIU-pCISceoVi"0Q)
~~CISL..........--,"0_j<IIU-cetJQ)
w-;:;eo-pCISe'Q)....es,<IIQ)........:JoU........
E.....E(l)>~
~.aa.co(.)
>N:::>== NO::> 0
~ -0:0:: ><0
Ol --109'<5'70
~-~ (l).0 -:J(/)
""., -s_:--.:~.~~~u"
(l)....coQ)~>0co(/)~O)eOl,-ern,- m~~OeCl..Cl..
•00
oooe
e
"oe
274 Electronic Instrumentation

C1le:0.pC1l
0 e:::::I ....-0 (I).... 0 ....
0 ........ 2 e:en I-.... - ~ >-::::I 0 ..c0 ero Q) rr "CQ) .... Q) (I)enLL .... ....::::I~ LL en ::::Io.Q) _::.~ ....
o.e: uE-o E 0 ~::::I E e:- ..... «0= .... C1len a. en cU :E.- E ~:r:~« .- -0 >-Ole VIcU Q)
~C\J(I)
e: .... ....« ::::I 0 ....en !/) e: ::::II- cU .... 0 0LL Q) :J '';:::: ULL2 OcUN
~- - Io o ~ ..c- - E~ C\J GO 0>-ca..c .N "CI ....
....J~ VI
-0 0 .!:!e: 0 e:
Q) cU 0-0 .... "C ....0 Q) ....
.;:: (I) u2 .... .... (I)
ex: cU ~ W0 ::::I« Q) "C VIW 0 u..c: .pZ ..... E (I)__J en e:e: ~ :E .~0>.Q) s: <: VlcU-o (/) !'l >-- 0 !/) ..cg.2
!/).- Q) c:- "Cen..c C1lOC) ~o u ....
(I)
-0 cU- e: ~e Q)~__J -0 C1l ......... «.- ...c: C1lo e: tL:~ u :EQ).- (I)a. ........(/)@. LL..c: E "C..... ....:::::: ....J........ - C1l VI..c ..c u u- - ....~ C\J tJ e:
0(I) ....(I) ....u- (I)(I) wVI
::::Ic..Q) E.o Ne :r:cU .x:o CO eoc0 >. VI(/) ..c ::::Io- N VIe: cU :r: (I)o .::£ VI0·-
0 >-e-0 cU 0 C1lQ)..c: ...- e:.... (.)
-0 C1l.a Q)0.2
Q)C1l
cU 1U ....0-- ....
cU ::::I UQ) o -0 (I)cn'~ 0 c..- ..... 2 Vl::::I (.)o.Q)
2Ew t-« -a:i- - encU cU- - u::::~ C\J
Wave Analyzers and Harmonic Distortion 275
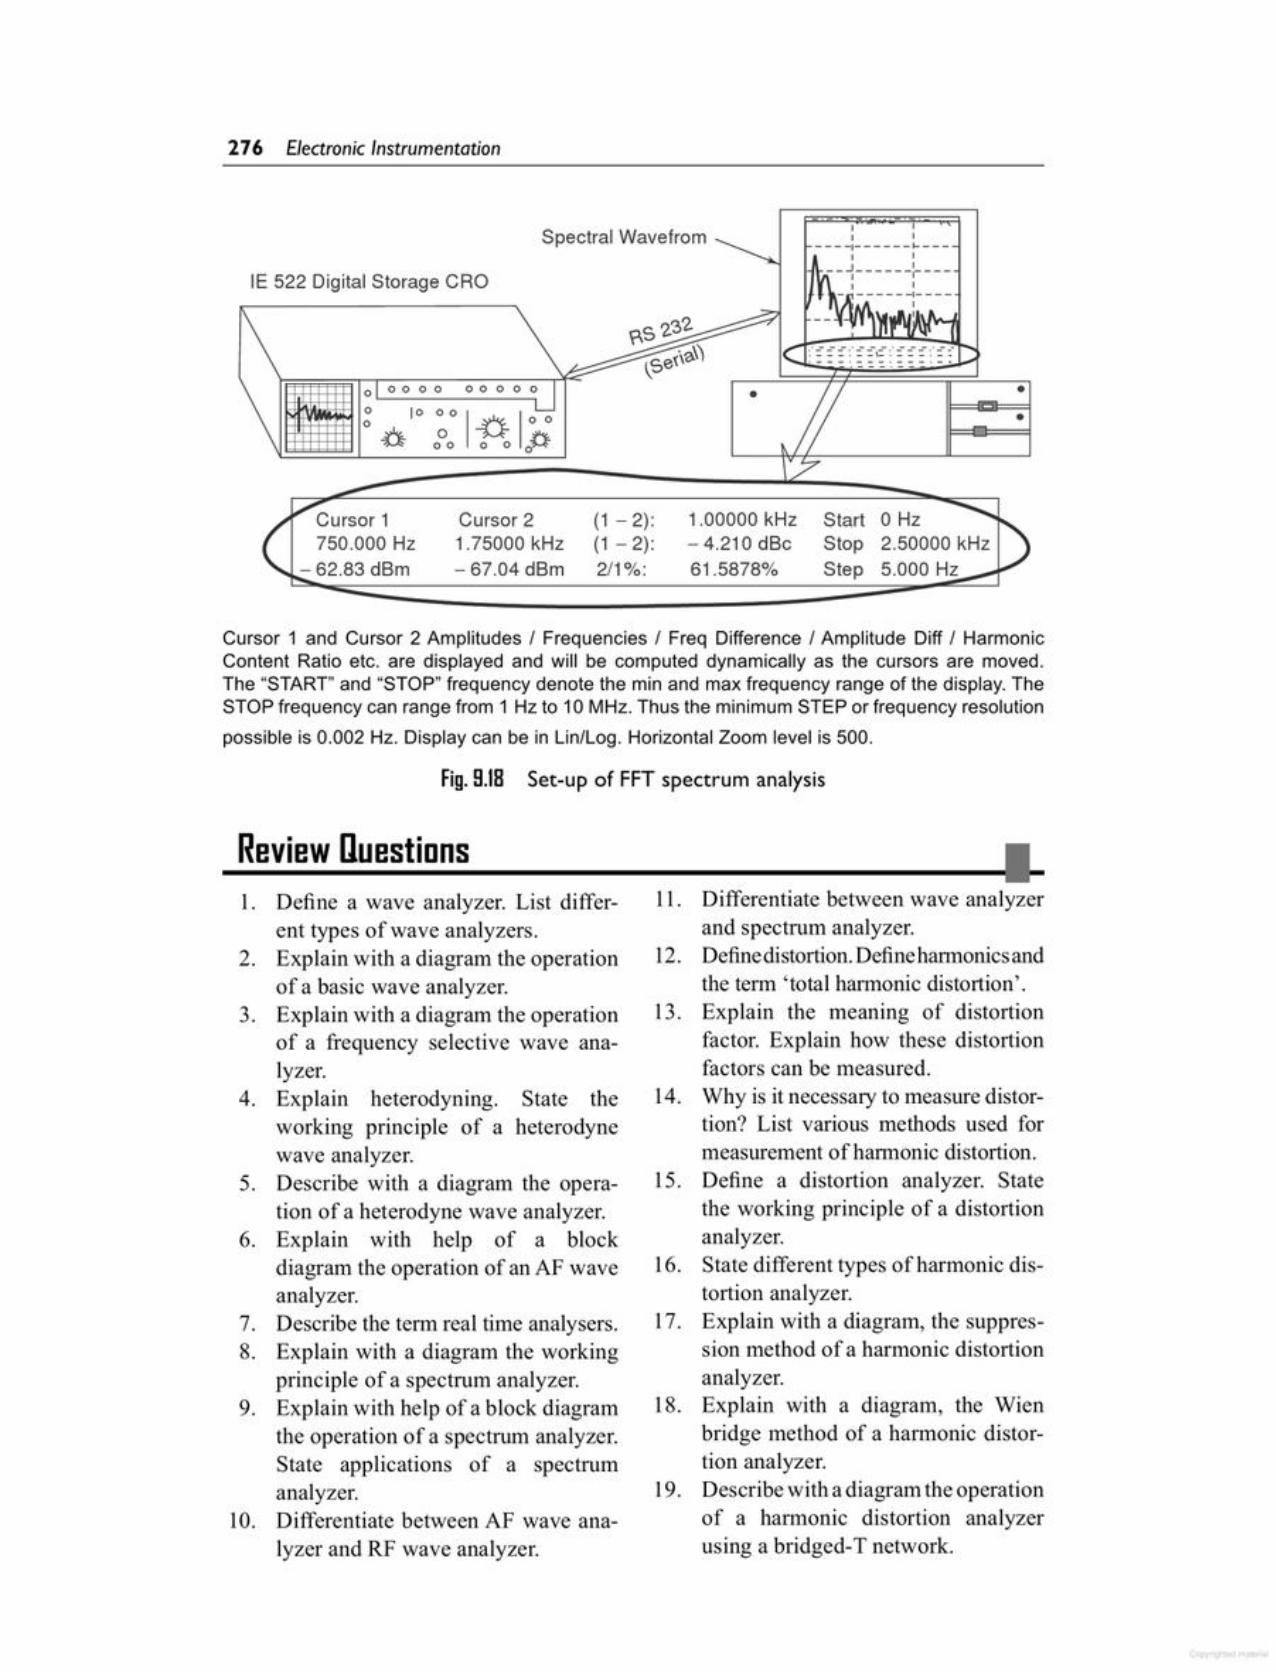
1. Define a wave analyzer. List different types of wave analyzers.
2. Explain with a diagram the operationof a basic wave analyzer.
3. Explain with a diagram the operationof a frequency selective wave analyzer.
4. Explain heterodyning. State theworking principle of a heterodynewave analyzer.
5. Describe with a diagram the operation of a heterodyne wave analyzer.
6. Explain with help of a blockdiagram the operation of anAF waveanalyzer.
7. Describe the term real time analysers.8. Explain with a diagram the working
principle of a spectrum analyzer.9. Explain with help of a block diagram
the operation of a spectrum analyzer.State applications of a spectrumanalyzer.
10. Differentiate between AF wave analyzer and RF wave analyzer.
Review Duestions I---------------------------~11. Differentiate between wave analyzerand spectrum analyzer.
12. Definedistortion.Defineharmonicsandthe term 'total harmonic distortion'.
13. Explain the meaning of distortionfactor. Explain how these distortionfactors can be measured.
14. Why is it necessary to measure distortion? List various methods used formeasurement ofhannonic distortion.
15. Define a distortion analyzer. Statethe working principle of a distortionanalyzer.
16. State different types of harmonic distortion analyzer.
17. Explain with a diagram, the suppression method of a harmonic distortionanalyzer.
18. Explain with a diagram, the Wienbridge method of a harmonic distortion analyzer.
19. Describe with a diagram the operationof a harmonic distortion analyzerusing a bridged-T network.
Set-up of FFT spectrum analysisFig. 9.18
Cursor 1 and Cursor 2 Amplitudes 1 Frequencies 1 Freq Difference / Amplitude Diff 1 HarmonicContent Ratio etc. are displayed and will be computed dynamically as the cursors are moved.The "START" and "STOP" frequency denote the min and max frequency range of the display. TheSTOP frequency can range from 1 Hz to 10 MHz. Thus the minimum STEP or frequency resolutionpossible is 0.002 Hz. Display can be in Lin/Log. Horizontal Zoom level is 500.
1.00000 kHz Start 0 Hz- 4.210 dBc Stop 2.50000 kHz61.5878% Step 5.000 Hz
•• •
I II I
- - - -1- - - - - - ....- --I I
__ .J 1 _I II I- ------1----
I
1~'•• l:'J U","0111
(1 - 2):(1 - 2):2/1 %:
Cursor 21.75000 kHz- 67.04 dBm
Cursor 1750.000 Hz
- 62.83 dBm
IE 522 Digital Storage CRO
Spectral Wavefrom
276 Electronic Instrumentation
1. Terman and Petit, Electronic Measurements, McGraw-Hill, 1952.
2. Jones, Instrument Technology, Vol.4, Instrumentation Systems, B.E.Notlingk Butterworth, 1987.
_F_u_rt_he_r_R_ea_d_in~g ~~
3. Handbook of Electronic Measurement, Volumes I & II, PolytechnicInst, of Brooklyn, 1956 (MicrowaveResearch Inst.).
4. Oliver Cage, Electronic Measurements and Instrumentation, McGrawHill, 1975.
II. A distortion is defined as(a) unwanted frequency(b) unwanted amplitude(c) change in shape of the waveform(d) unwanted signal
12. A distortion analyzer measures the total(a) average power (b) RMS power(c) peak power (d) dc power
(b)TVM(d) circuit
7. A spectrum analyzer works in(a) time domain (b) amplitude(c) frequency domain (d) phase
8. A spectrum analyzer uses at the output a(a) frequency meter(c) rectifier
9. The frequency axis in a spectrumanalyzer is the(a) X-axis (b) Y-axis (c) Z-axis
10. A spectrum analyzer is used to display(a) frequency band spectrum(b) amplitude(c) time (d) phase
5. A wave analyzer consists of(a) RC circuit (b) LC circuit(c) oscillator (d) rectifier
6. The bandwidth of a wave analyzer is(a) wide (b) narrow (c) medium
(b) amplification(d) subtraction
(a) amplitude and phase(b) phase and frequency(c) amplitude and frequency(d) frequency band
3. Wave analyzers are also called a(a) phase meters(b) frequency selective voltmeter(c) distortion analyzer(d) spectrum analyzer
4. A heterodyne wave analyzer operateson the principle(a) mixing(c) addition
2. Wave analyzers are used to measurethe
(b) UHF(d) higher RF
1. Wave analyzers are used in the frequency range of(a) VHF(c) lower RF
_M_u_lt_ip_le_C_h_Di_ce_U_u_e_st_iD_ns ~~
25. Explain the front panel controls andapplications of a distortion factormeter in trouble shooting.
26. Describe the causes of harmonic distortions.
27. Explain the basic principle of a digital Fourier analyzer.
28. Describe with diagram the operationof a digital Fourier analyzer.
29. Explain in brief the operation of apractical FFT spectrum analyzer.
20. Explain the procedure of measurement of a harmonic distortion analyzer using a bridged- T type.
21. Describe the operation of a distortionanalyzer using resonance to suppressthe fundamental frequency
22. Compare resonance bridge to a Wienbridge harmonic distortion analyzer.
23. Compare Wien Bridge to a bridged- Tnetwork type harmonic distortion analyzer.
24. State applications of a distortion factor meter.
Wave Analyzers and Harmonic Distortion 277

Fig.ID.I Output-meter circuit
The output power Wattmeter is designed to directly measure the output power inan arbitrary load. The instrument provides a set of resistive loads to be selectedfor power measurements. In addition to power, the output meter can be used tomeasure impedance and frequency response characteristics. A simple circuit isillustrated in Fig. 10.1.
10.2OUTPUT POWERMETERS
Meters and measuring instruments play an important role in all phasesof electronics. Meters helps us to determine how an electronic circuit, isperforming.
The most fundamental electrical measurements are those of voltage, currentand impedance. The instruments used in measuring these quantities formthe building blocks of more complex equipment used in power, frequency,attenuation, and other special measurements,
A measuring device converts a primary indication into some form of energythat can be easily displayed on a scale.
10.1INTRODUCTION
MeasuringInstruments
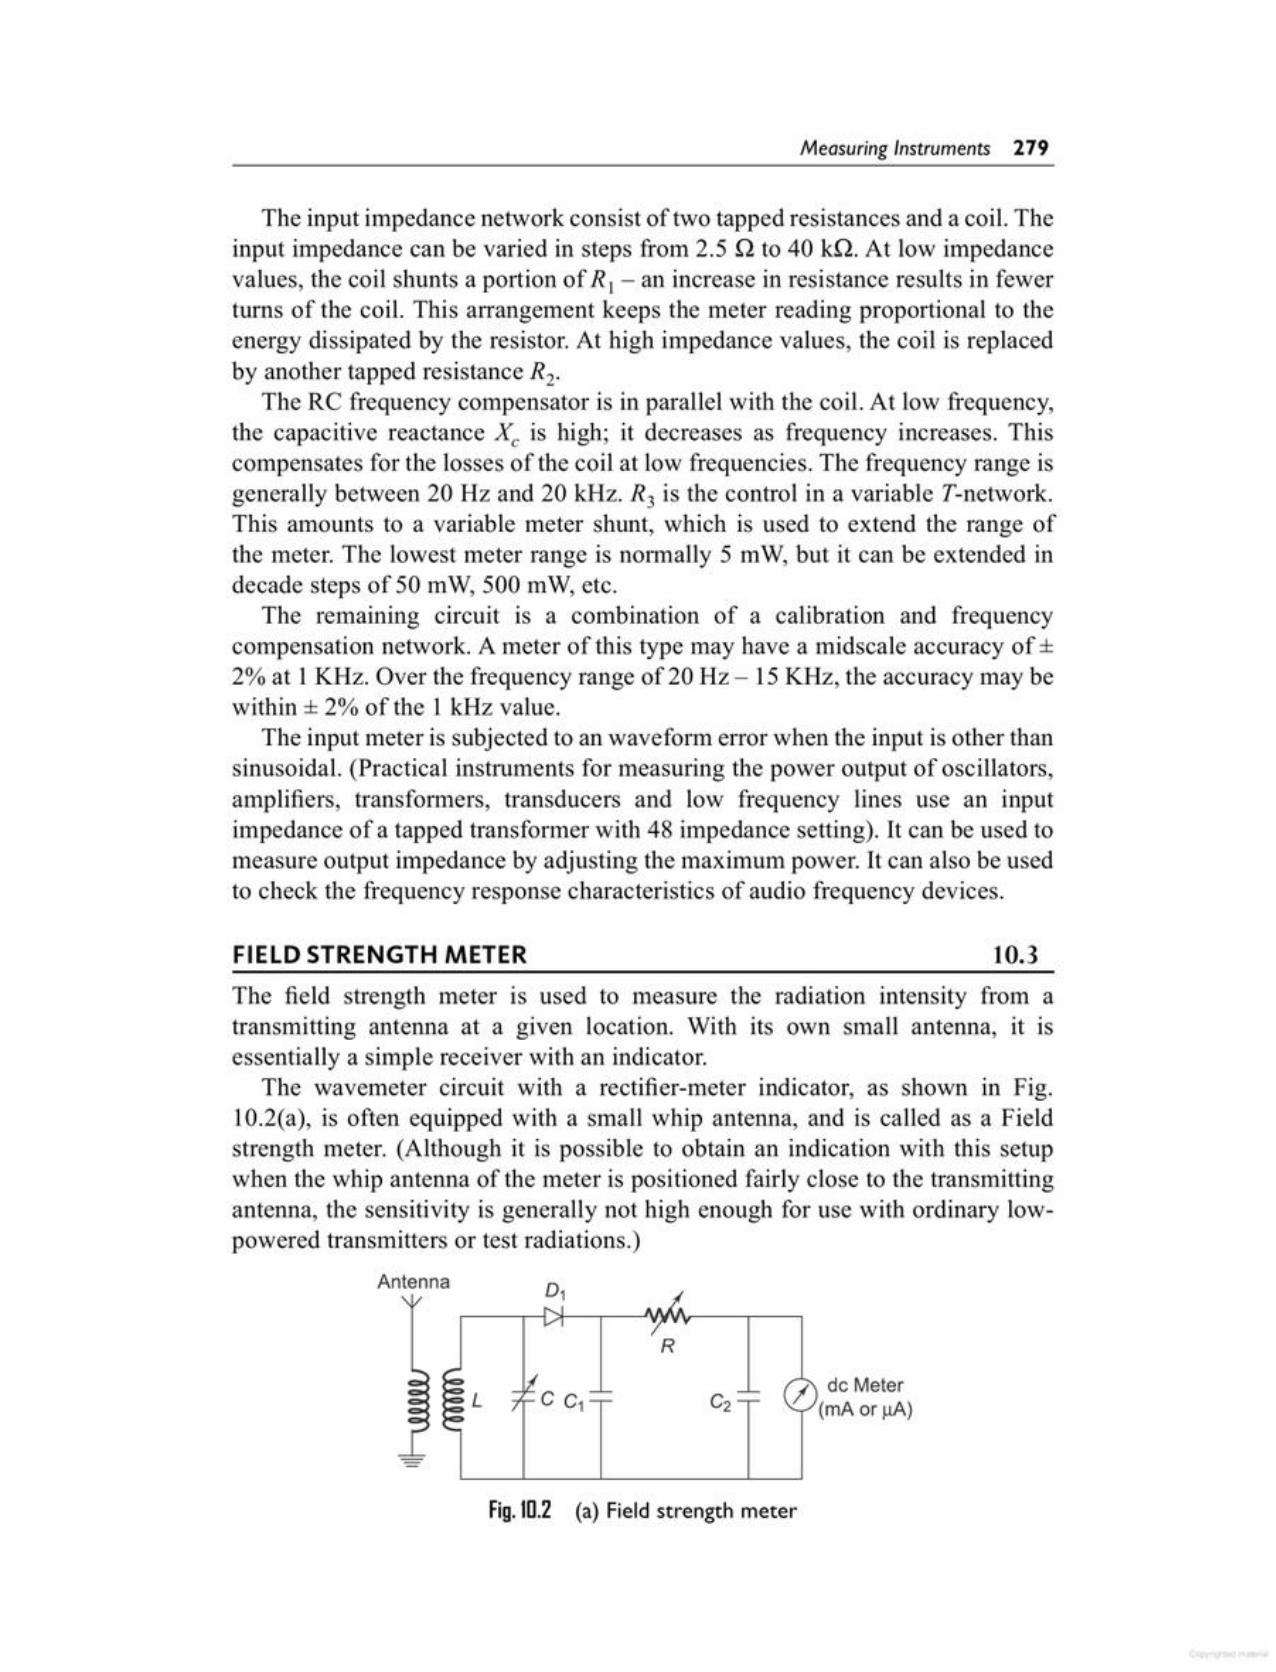
Fig. m.2 (a) Field strength meter
/ de Meter(mAor ~)
R
L
Antenna
The field strength meter is used to measure the radiation intensity from atransmitting antenna at a given location. With its own small antenna, it isessentially a simple receiver with an indicator.
The wavemeter circuit with a rectifier-meter indicator, as shown in Fig.10.2(a), is often equipped with a small whip antenna, and is called as a Fieldstrength meter. (Although it is possible to obtain an indication with this setupwhen the whip antenna of the meter is positioned fairly close to the transmittingantenna, the sensitivity is generally not high enough for use with ordinary lowpowered transmitters or test radiations.)
10.3FIELD STRENGTH METER
The input impedance network consist of two tapped resistances and a coil. Theinput impedance can be varied in steps from 2.5 Q to 40 ill. At low impedancevalues, the coil shunts a portion of R I - an increase in resistance results in fewerturns of the coil. This arrangement keeps the meter reading proportional to theenergy dissipated by the resistor. At high impedance values, the coil is replacedby another tapped resistance R2.
The RC frequency compensator is in parallel with the coil. At low frequency,the capacitive reactance Xc is high; it decreases as frequency increases. Thiscompensates for the losses of the coil at low frequencies. The frequency range isgenerally between 20 Hz and 20 kHz. R3 is the control in a variable T-network.This amounts to a variable meter shunt, which is used to extend the range ofthe meter. The lowest Ineter range is normally 5 mW, but it can be extended indecade steps of 50 mW, 500 mW, etc.
The remaining circuit is a combination of a calibration and frequencycompensation network. A meter of this type may have a midscale accuracy of ±2% at 1KHz. Over the frequency range of 20 Hz - 15 KHz, the accuracy may bewithin ± 2% of the 1 kHz value.
The input meter is subjected to an waveform error when the input is other thansinusoidal. (Practical instruments for measuring the power output of oscillators,amplifiers, transformers, transducers and low frequency lines use an inputimpedance of a tapped transformer with 48 impedance setting). It can be used tomeasure output impedance by adjusting the maximum power. It can also be usedto check the frequency response characteristics of audio frequency devices.
Measuring Instruments 279
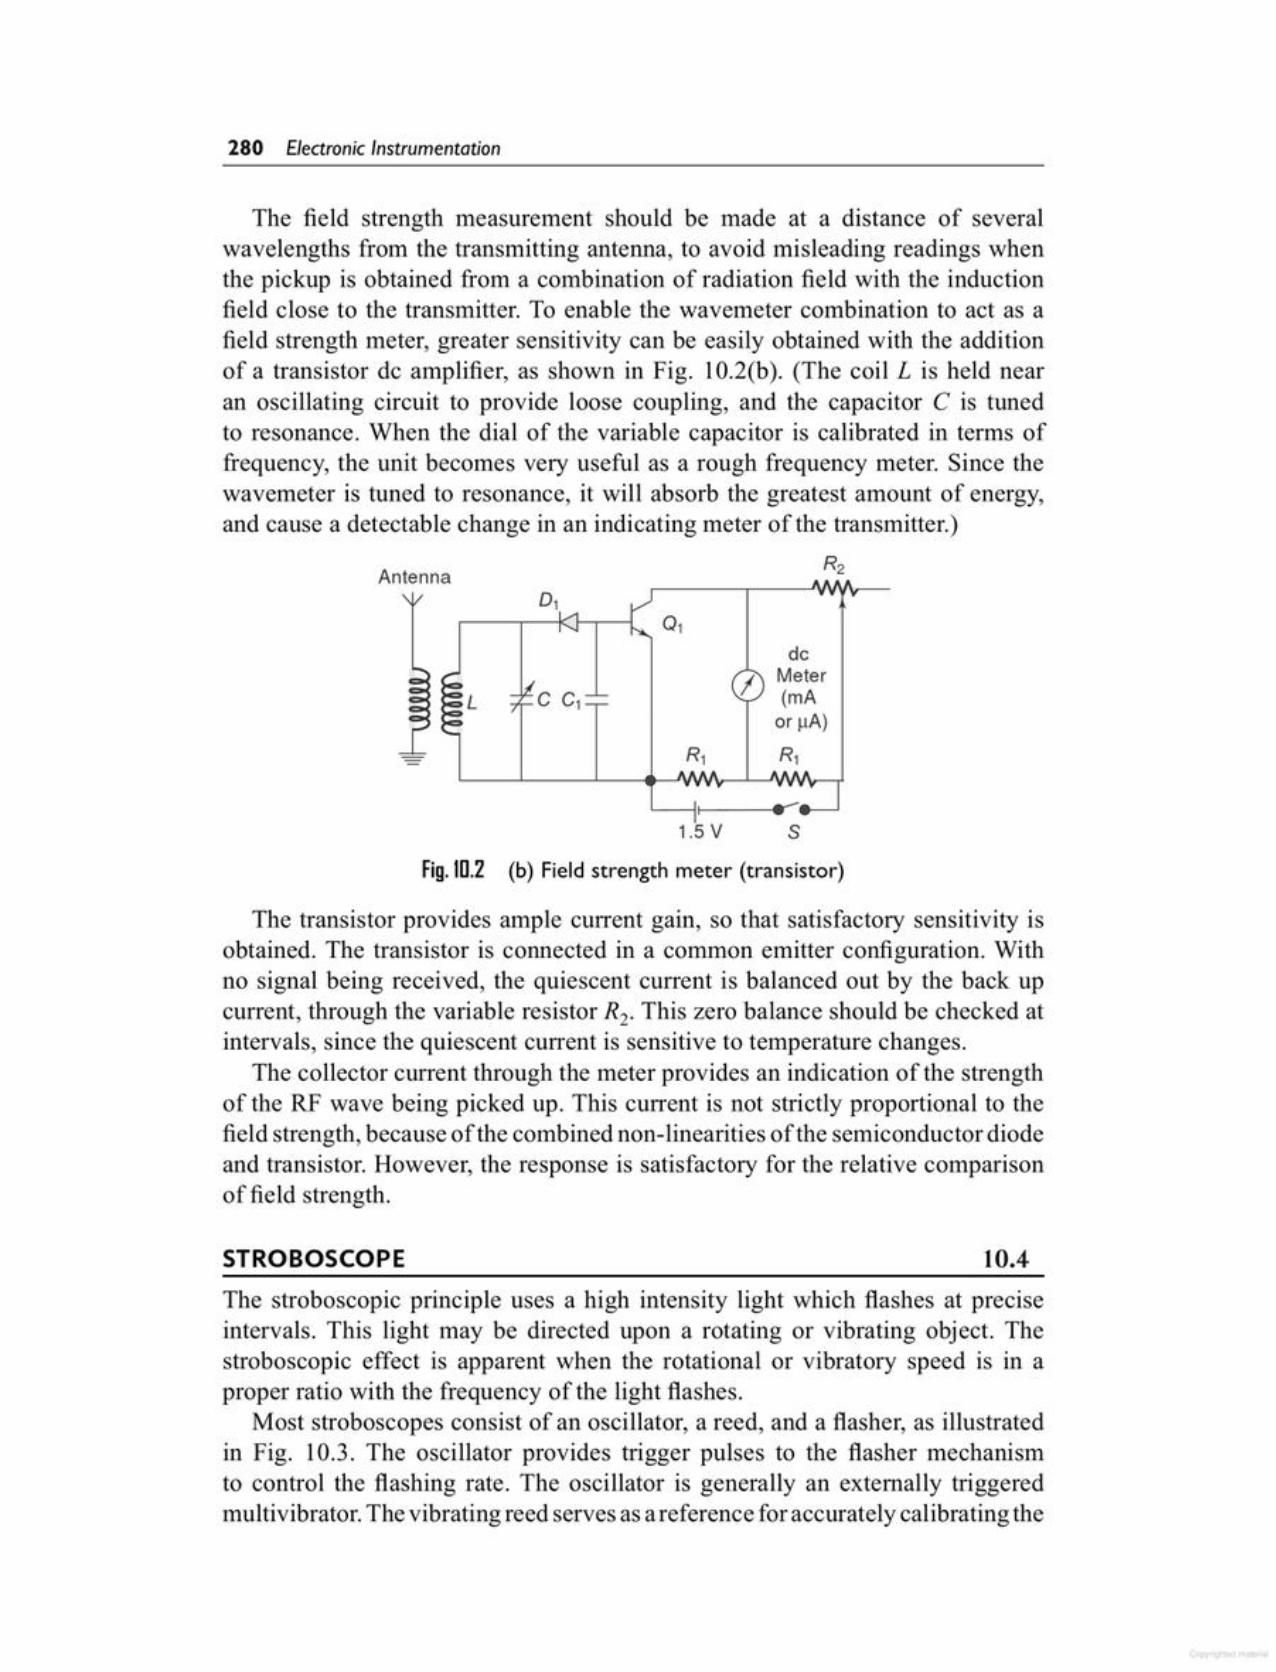
The stroboscopic principle uses a high intensity light which flashes at preciseintervals. This light may be directed upon a rotating or vibrating object. Thestroboscopic effect is apparent when the rotational or vibratory speed is in aproper ratio with the frequency of the light flashes.
Most stroboscopes consist of an oscillator, a reed, and a flasher, as illustratedin Fig. 10.3. The oscillator provides trigger pulses to the flasher mechanismto control the flashing rate. The oscillator is generally an externally triggeredmultivibrator. The vibrating reed serves as areference for accurately calibrating the
10.4STROBOSCOPE
Fig. 10.2 (b) Field strength meter (transistor)
The transistor provides ample current gain, so that satisfactory sensitivity isobtained. The transistor is connected in a common emitter configuration. Withno signal being received, the quiescent current is balanced out by the back upcurrent, through the variable resistor R2. This zero balance should be checked atintervals, since the quiescent current is sensitive to temperature changes.
The collector current through the meter provides an indication of the strengthof the RF wave being picked up. This current is not strictly proportional to thefield strength, because of the combined non-linearities of the semiconductor diodeand transistor. However, the response is satisfactory for the relative comparisonof field strength.
Antenna R2
01
01
de
I MeterL C C1 (mA
or 1lA)
- R1 R1
.--1.5 V S
The field strength measurement should be made at a distance of severalwavelengths from the transmitting antenna, to avoid misleading readings whenthe pickup is obtained from a combination of radiation field with the inductionfield close to the transmitter. To enable the wavemeter combination to act as afield strength meter, greater sensitivity can be easily obtained with the additionof a transistor de amplifier, as shown in Fig. 10.2(b). (The coil L is held nearan oscillating circuit to provide loose coupling, and the capacitor C is tunedto resonance. When the dial of the variable capacitor is calibrated in terms offrequency, the unit becomes very useful as a rough frequency meter. Since thewavemeter is tuned to resonance, it will absorb the greatest amount of energy,and cause a detectable change in an indicating meter of the transmitter.)
280 Electronic Instrumentation
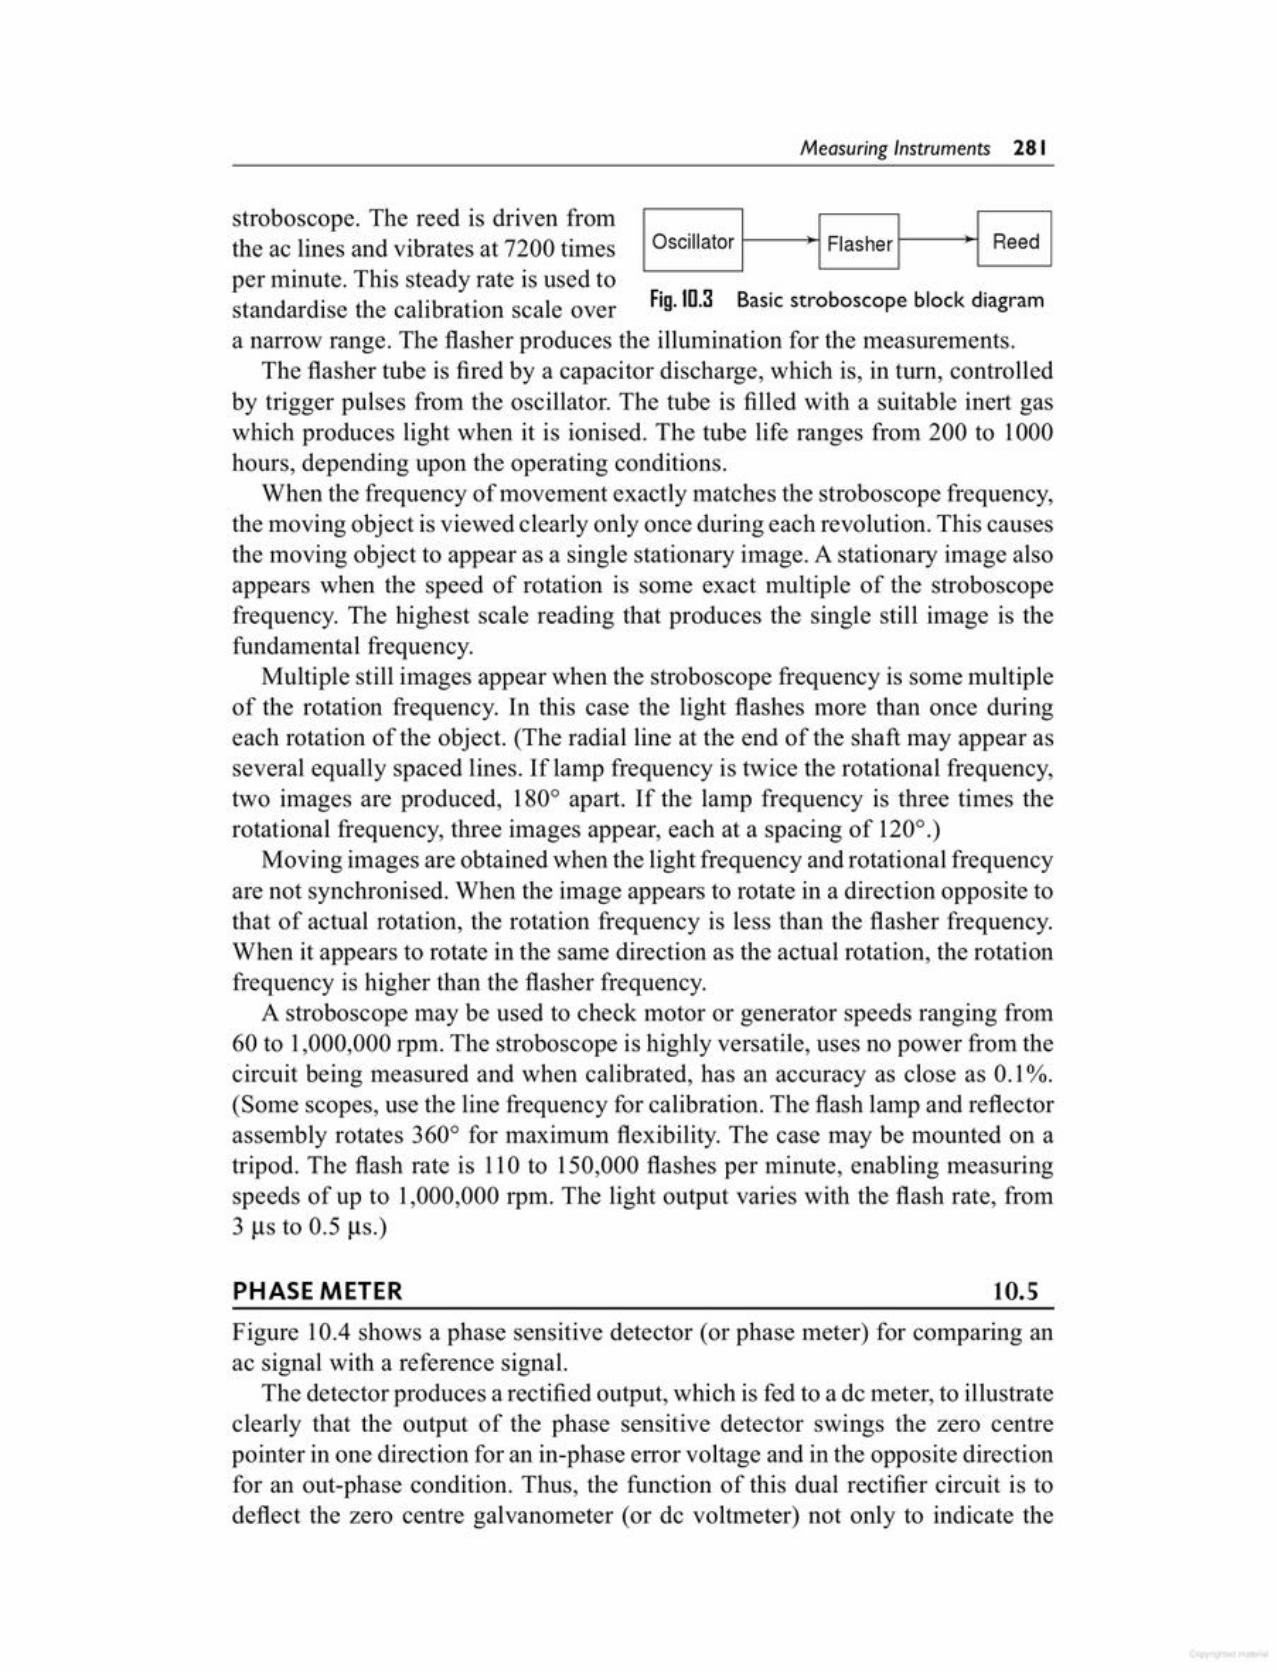
Figure 10.4 shows a phase sensitive detector (or phase meter) for comparing anac signal with a reference signal.
The detector produces a rectified output, which is fed to a de meter, to illustrateclearly that the output of the phase sensitive detector swings the zero centrepointer in one direction for an in-phase error voltage and in the opposite directionfor an out-phase condition. Thus, the function of this dual rectifier circuit is todeflect the zero centre galvanometer (or dc voltmeter) not only to indicate the
10.5PHASE METER
a narrow range. The flasher produces the illumination for the measurements.The flasher tube is fired by a capacitor discharge, which is, in turn, controlled
by trigger pulses from the oscillator. The tube is filled with a suitable inert gaswhich produces light when it is ionised. The tube life ranges from 200 to 1000hours, depending upon the operating conditions.
When the frequency of movement exactly matches the stroboscope frequency,the moving object is viewed clearly only once during each revolution. This causesthe moving object to appear as a single stationary image. A stationary image alsoappears when the speed of rotation is some exact multiple of the stroboscopefrequency. The highest scale reading that produces the single still image is thefundamental frequency.
Multiple still images appear when the stroboscope frequency is some multipleof the rotation frequency. In this case the light flashes more than once duringeach rotation of the object. (The radial line at the end of the shaft may appear asseveral equally spaced lines. If lamp frequency is twice the rotational frequency,two images are produced, 1800 apart. If the lamp frequency is three times therotational frequency, three images appear, each at a spacing of 1200.)
Moving images are obtained when the light frequency and rotational frequencyare not synchronised. When the image appears to rotate in a direction opposite tothat of actual rotation, the rotation frequency is less than the flasher frequency.When it appears to rotate in the same direction as the actual rotation, the rotationfrequency is higher than the flasher frequency.
A stroboscope may be used to check motor or generator speeds ranging from60 to 1,000,000 rpm. The stroboscope is highly versatile, uses no power from thecircuit being measured and when calibrated, has an accuracy as close as 0.1%.(Some scopes, use the line frequency for calibration. The flash lamp and reflectorassembly rotates 3600 for maximum flexibility. The case may be mounted on atripod. The flash rate is 110 to 150,000 flashes per minute, enabling measuringspeeds of up to 1,000,000 rpm. The light output varies with the flash rate, from3 us to 0.5 us.)
Fig. 10.3 Basic stroboscope block diagram
1Oscillator 1-1----+-1) I Flasher I-I-----;)HI Reed Istroboscope. The reed is driven fromthe ac lines and vibrates at 7200 timesper minute. This steady rate is used tostandardise the calibration scale over
Measuring Instruments 281

The circuits of Figs 10.4(a) and (b) follows the action for a signal voltage v.pwhich is in phase with the reference voltage v,., starting with an initial conditionwhen the input signal Vs is zero.
In Fig. 10.4(a), for the first half cycle the instantaneous polarity of the referencevoltage v,. causes the rectified current to flow through the conduction rectifier D"producing a positive voltage to ground across R) and a tendency for the meter todeflect to the right.
On the second half cycle, Fig. 10.4(b), the instantaneous polarity of thereference voltage v,., causes an equal rectified cun'ent to flow through diode D2,
producing an equal tendency for the meter to deflect to the left. Since these twoequal and opposite tendencies are averaged over the full cycle, the galvanometerreads zero over the full cycle, with input v..~= o.
When an input signal Vs is applied, it either aids or opposes the referencevoltage, depending upon whether it is in phase or out of phase with it. If Vs isin phase with v,., the signal voltage will aid the instantaneous ac voltage in theupper half of the transformer secondary, producing a larger current through D,
Fig.ID.4 Phase sensitive detector (a) Positive half (b) Negative half
• R1•
Vr~ I de Meter(Zero Centre)
-M+ R2Vs_)
O2 +de
(b)
(a)
01 + de
-y• R1
•V~
de Meter(Zero Centre)
Vs R2
value of the signal voltage Vs (that is, a measure of the error of imbalance), butalso the direction of this error, and the phase polarity of the error compared toa reference voltage. Phase polarity implies that the detector distinguishes onlybetween in phase and 1800 out of phase conditions, without regard for otherphase angles.
282 Electronic Instrumentation
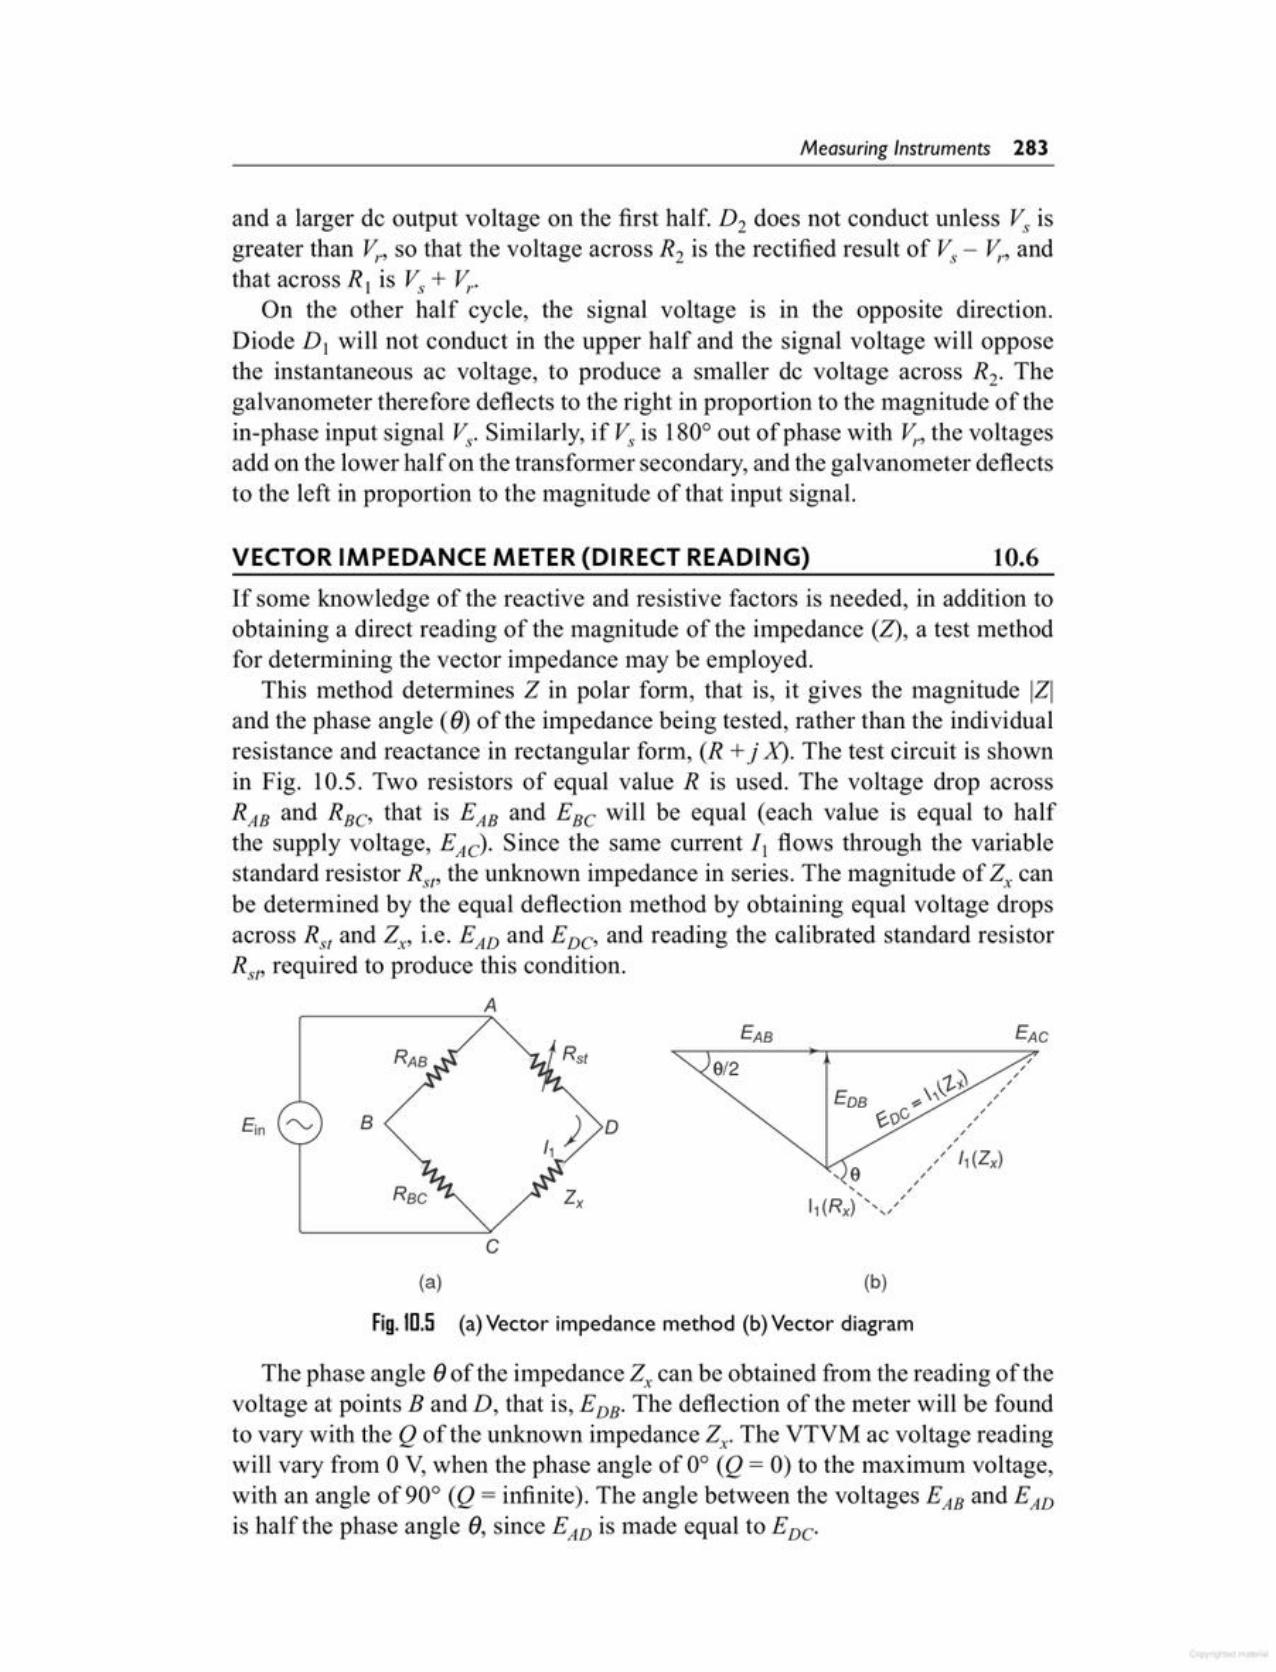
The phase angle e of the impedance Z, can be obtained [rOlTI the reading of thevoltage at points Band D, that is, EDB. The deflection of the meter will be foundto vary with the Q of the unknown impedance Zx- The YTYM ac voltage readingwill vary from 0 Y, when the phase angle of 0° (Q = 0) to the maximum voltage,with an angle of 90° (Q = infinite). The angle between the voltages EAB and EAD
is half the phase angle e, since EAD is made equal to EDC.
Fig.10.5 (a)Vector impedance method (b)Vector diagram
(b)(a)
c
o
9/2,,,,,,,,,,,,,
" 11 (Zx),,,, ,, ,11 (Rx) <.;
B
If some knowledge of the reactive and resistive factors is needed, in addition toobtaining a direct reading of the magnitude of the impedance (2), a test methodfor determining the vector impedance may be employed.
This method determines Z in polar form, that is, it gives the magnitude IZIand the phase angle (e) of the impedance being tested, rather than the individualresistance and reactance in rectangular form, (R +j X). The test circuit is shownin Fig. 10.5. Two resistors of equal value R is used. The voltage drop acrossRAB and RBC' that is EAB and EBC will be equal (each value is equal to halfthe supply voltage, EAC). Since the same current I, flows through the variablestandard resistor Rst' the unknown impedance in series. The magnitude of Z; canbe determined by the equal deflection method by obtaining equal voltage dropsacross Rs, and Zx, i.e. EAD and EDC' and reading the calibrated standard resistorRst' required to produce this condition.
10.6VECTOR IMPEDANCE METER (DIRECT READING)
and a larger de output voltage on the first half. D2 does not conduct unless Vs isgreater than v,., so that the voltage across R2 is the rectified result of Vs - v,., andthat across R, is v.~+ v,..
On the other half cycle, the signal voltage is in the opposite direction.Diode D, will not conduct in the upper half and the signal voltage will opposethe instantaneous ac voltage, to produce a smaller de voltage across R2. Thegalvanometer therefore deflects to the right in proportion to the magnitude of thein-phase input signal Vs' Similarly, if Vs is 180° out of phase with v,_, the voltagesadd on the lower half on the transformer secondary, and the galvanometer deflectsto the left in proportion to the magnitude of that input signal.
Measuring Instruments 283
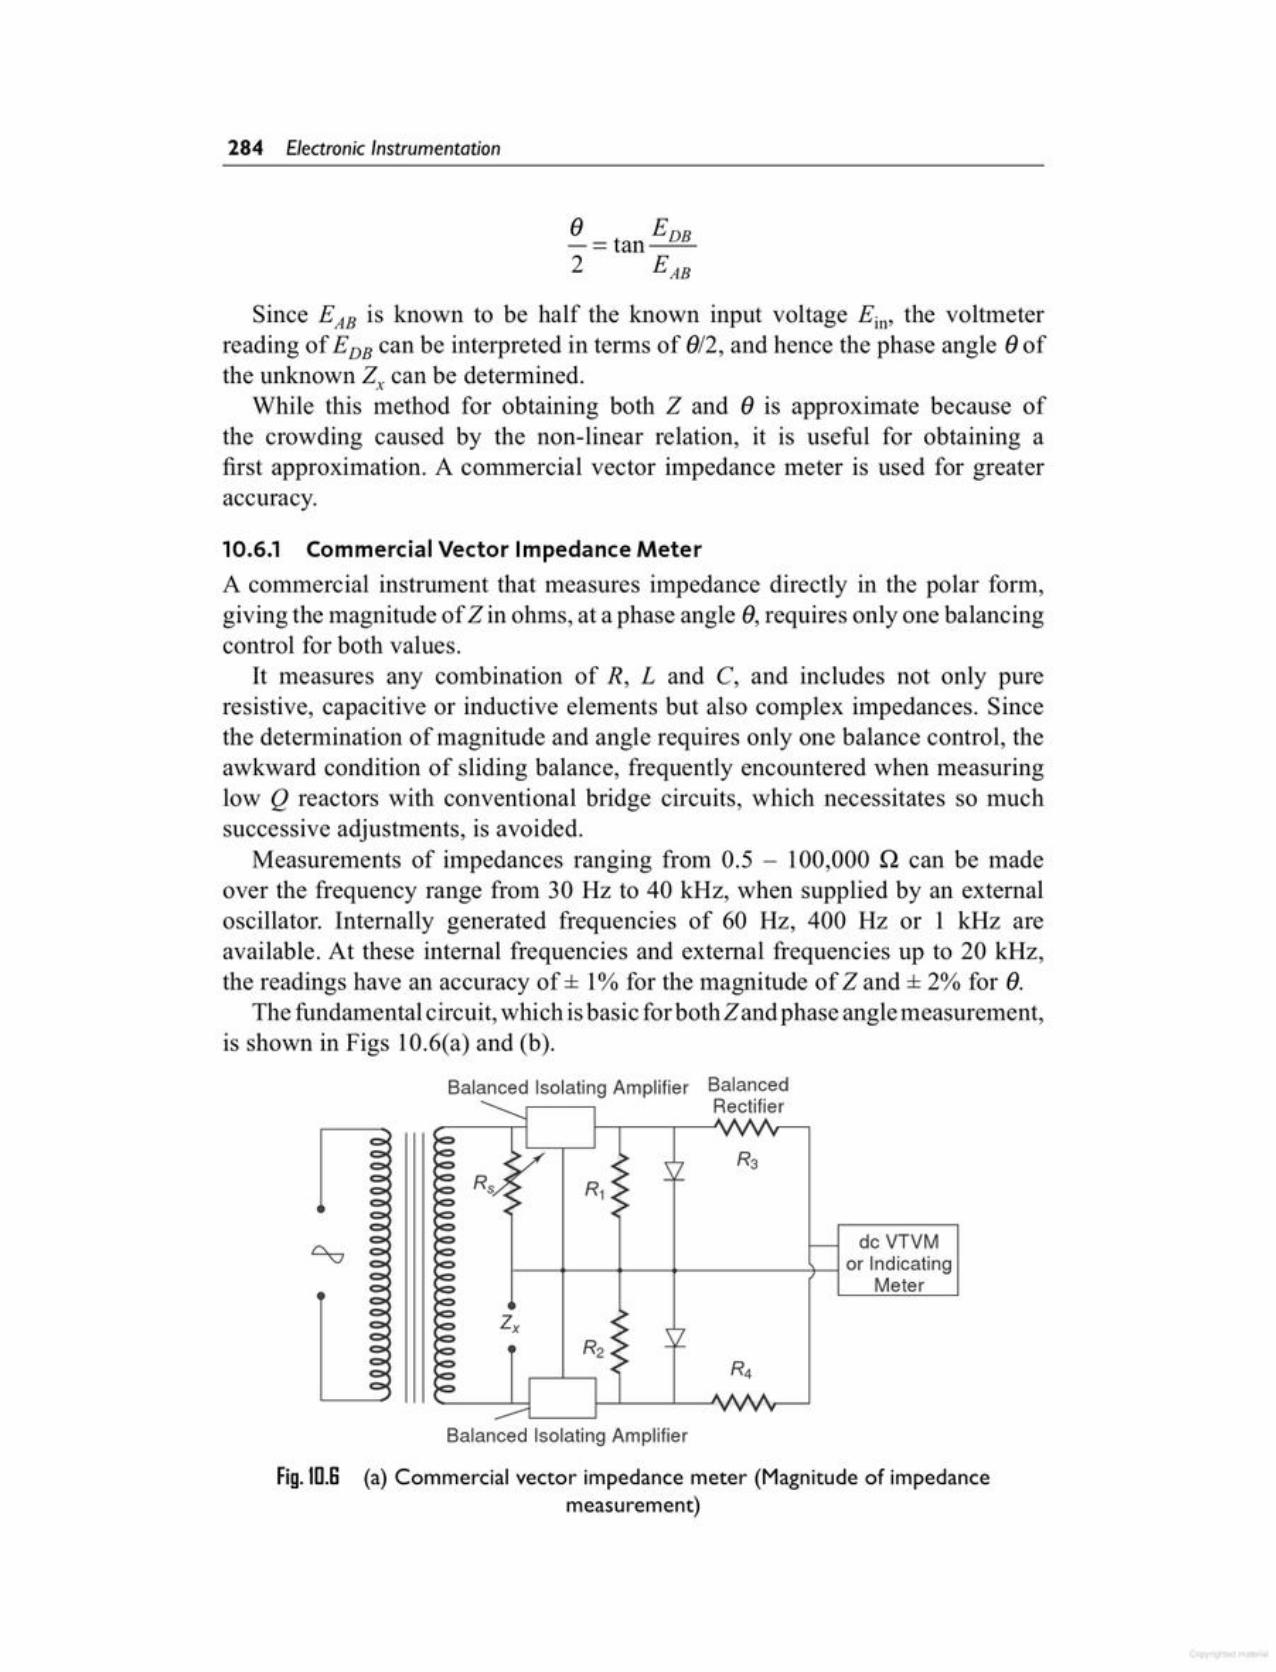
Balanced Isolating Amplifier
Fig. m.B (a) Commercial vector impedance meter (Magnitude of impedancemeasurement)
dc VTVMI-~--I--~----+---l or Indicating
Meter
Balanced Isolating Amplifier BalancedRectifier
10.6.1 Commercial Vector Impedance MeterA commercial instrument that measures impedance directly in the polar form,giving the magnitude of Z in ohms, at a phase angle e, requires only one balancingcontrol for both values.
It measures any combination of R, Land C, and includes not only pureresistive, capacitive or inductive elements but also complex impedances. Sincethe determination of magnitude and angle requires only one balance control, theawkward condition of sliding balance, frequently encountered when measuringlow Q reactors with conventional bridge circuits, which necessitates so muchsuccessive adjustments, is avoided.
Measurements of impedances ranging from 0.5 - 100,000 Q can be madeover the frequency range from 30 Hz to 40 kHz, when supplied by an externaloscillator. Internally generated frequencies of 60 Hz, 400 Hz or 1 kHz areavailable. At these internal frequencies and external frequencies up to 20 kHz,the readings have an accuracy of ± 1% for the magnitude of Z and ± 2% for e.
The fundamental circuit, which is basic for both Zand phase angle measurement,is shown in Figs 10.6(a) and (b).
e E_= tan DB2 EAB
Since EAB is known to be half the known input voltage Ein, the voltmeterreading of EDB can be interpreted in terms of e12,and hence the phase angle e ofthe unknown Z; can be determined.
While this method for obtaining both Z and e is approximate because ofthe crowding caused by the non-linear relation, it is useful for obtaining afirst approximation. A commercial vector impedance meter is used for greateraccuracy.
284 Electronic Instrumentation
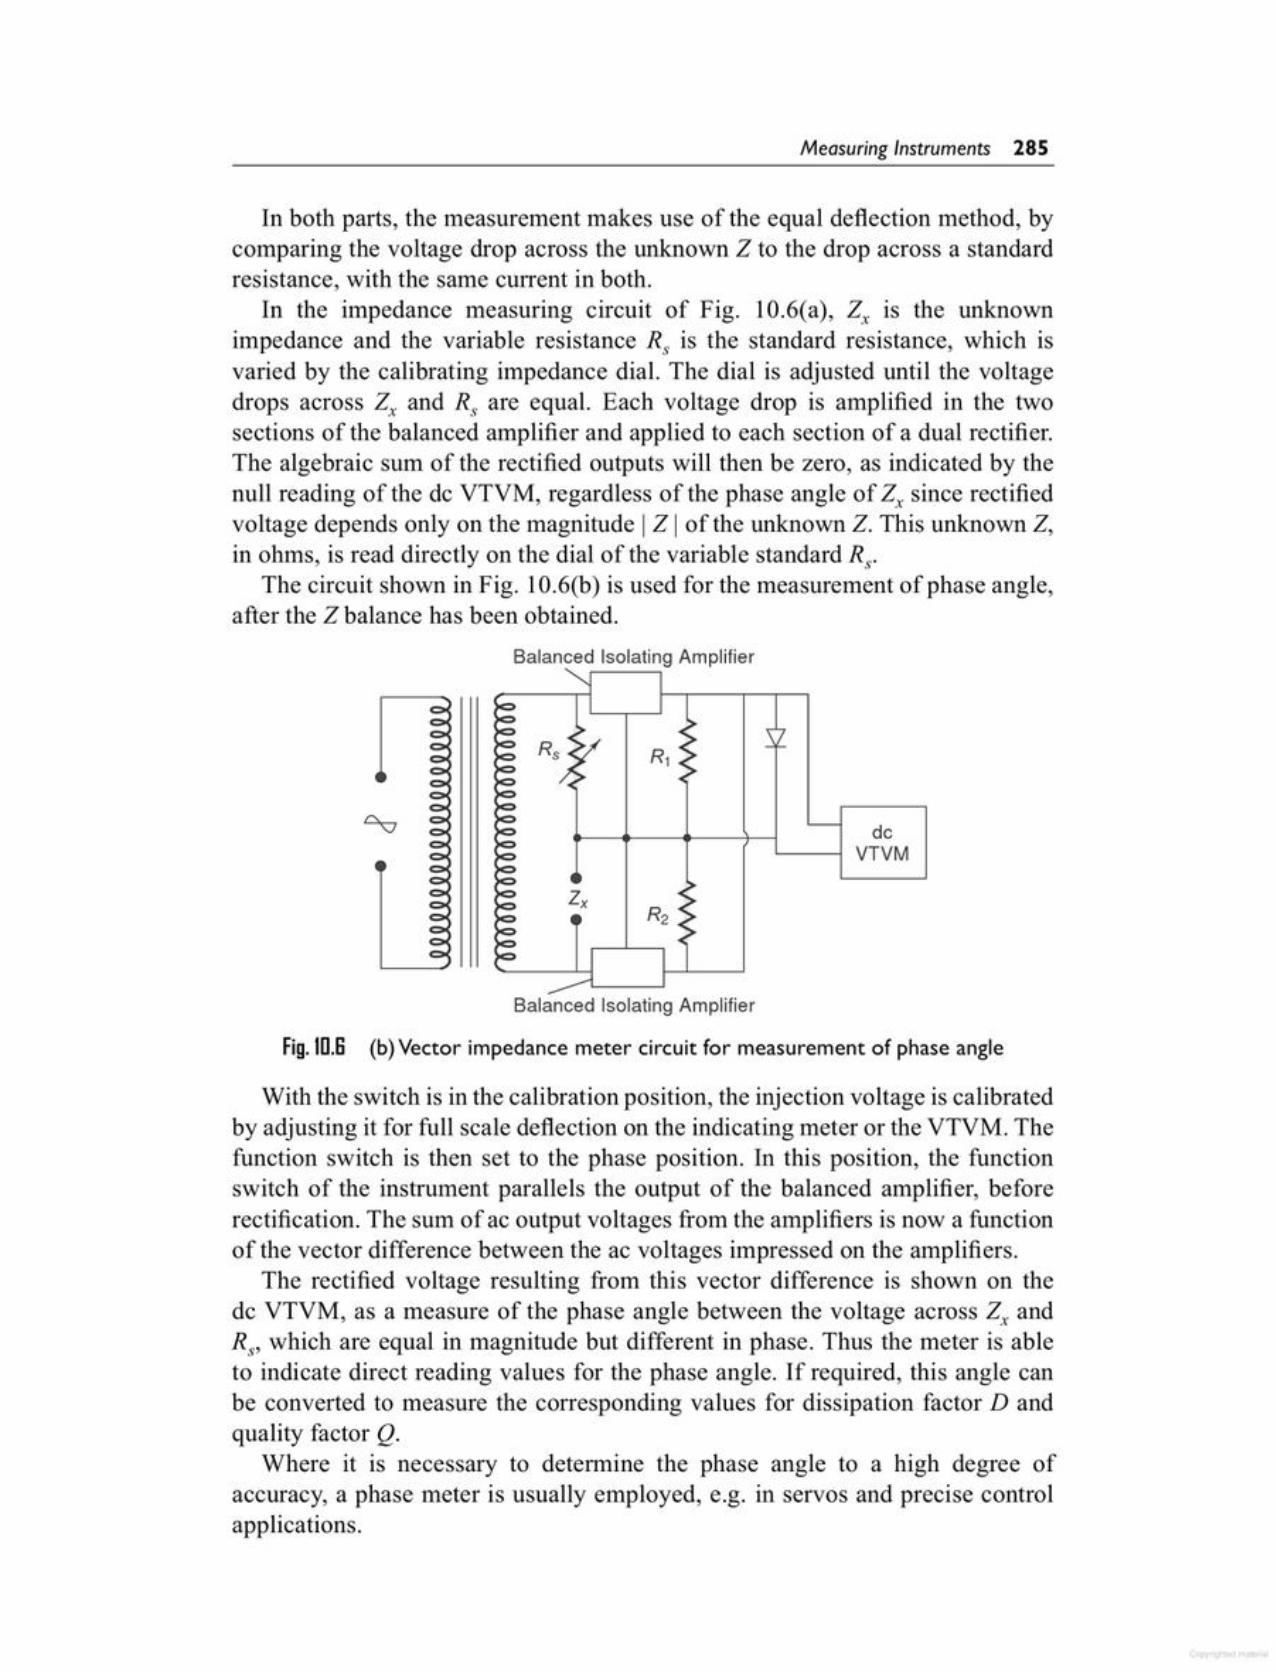
With the switch is in the calibration position, the injection voltage is calibratedby adjusting it for full scale deflection on the indicating meter or the VTVM. Thefunction switch is then set to the phase position. In this position, the functionswitch of the instrument parallels the output of the balanced amplifier, beforerectification. The sum of ac output voltages from the amplifiers is now a functionof the vector difference between the ac voltages impressed on the amplifiers.
The rectified voltage resulting from this vector difference is shown on thede VTVM, as a measure of the phase angle between the voltage across Z; andR.p which are equal in magnitude but different in phase. Thus the meter is ableto indicate direct reading values for the phase angle. If required, this angle canbe converted to measure the corresponding values for dissipation factor D andquality factor Q.
Where it is necessary to determine the phase angle to a high degree ofaccuracy, a phase meter is usually employed, e.g. in servos and precise controlapplications.
Balanced Isolating Amplifier
Fig.m.B (b)Vector impedance meter circuit for measurement of phase angle
dcVTVM
Balanced Isolating Amplifier
In both parts, the measurement makes use of the equal deflection method, bycomparing the voltage drop across the unknown Z to the drop across a standardresistance, with the same CUITentin both.
In the impedance measuring circuit of Fig. lO.6(a), Z; is the unknownimpedance and the variable resistance R, is the standard resistance, which isvaried by the calibrating impedance dial. The dial is adjusted until the voltagedrops across Z; and R, are equal. Each voltage drop is amplified in the twosections of the balanced amplifier and applied to each section of a dual rectifier.The algebraic sum of the rectified outputs will then be zero, as indicated by thenull reading of the de VTVM, regardless of the phase angle of Zx since rectifiedvoltage depends only on the magnitude I Z I of the unknown Z. This unknown Z,in ohms, is read directly on the dial of the variable standard R;
The circuit shown in Fig. 1O.6(b) is used for the measurement of phase angle,after the Z balance has been obtained.
Measuring Instruments 285

The wide range oscillator, with frequency range from 50 kHz to 50 MHz,delivers current to a resistance Rsh having a value of 0.02 Q. This shunt resistanceintroduces almost no resistance into the tank circuit and therefore represents avoltage source of a magnitude e with a small internal resistance. The voltageacross the shunt is measured with a thermocouple meter. The voltage acrossthe capacitor is measured by an electronic voltmeter corresponding to Ee andcalibrated directly to read Q.
The oscillator energy is coupled to the tank circuit. The circuit is tuned toresonance by varying C until the electronic voltmeter reads the maximum value.
Fig.1D.7 Circuit diagram of a Q-meter
RSh= 0.02 Q
CTuning
Ca LxCapactior
Circuit IQ Meter Ec
Oscillator eI Rx
From the above equation, ifE is kept constant the voltage across the capacitorcan be measured by a voltmeter calibrated to read directly in terms of Q.
A practical Q meter circuit is shown in Fig. 10.7.
Q _XL_Xc_Ec_-_- __ -R R E
Therefore
The overall efficiency of coils and capacitors intended for RF applications is bestevaluated using the Q value. The Q meter is an instrument designed to measuresome electrical properties of coils and capacitors. The principle of the Q meteris based on series resonance; the voltage drop across the coil or capacitor is Qtimes the applied voltage (where Q is the ratio of reactance to resistance, XLIR).If a fixed voltage is applied to the circuit, a voltmeter across the capacitor can becalibrated to read Q directly.
At resonance XL =Xc and EL=] XL, Ec =] Xc, E =I Rwhere E - applied voltage Ec - capacitor voltage
EL - inductive voltage XL - inductive reactanceXc - capacitive reactance R - coil resistance] - circuit current
10.7QMETER
286 Electronic Instrumentation
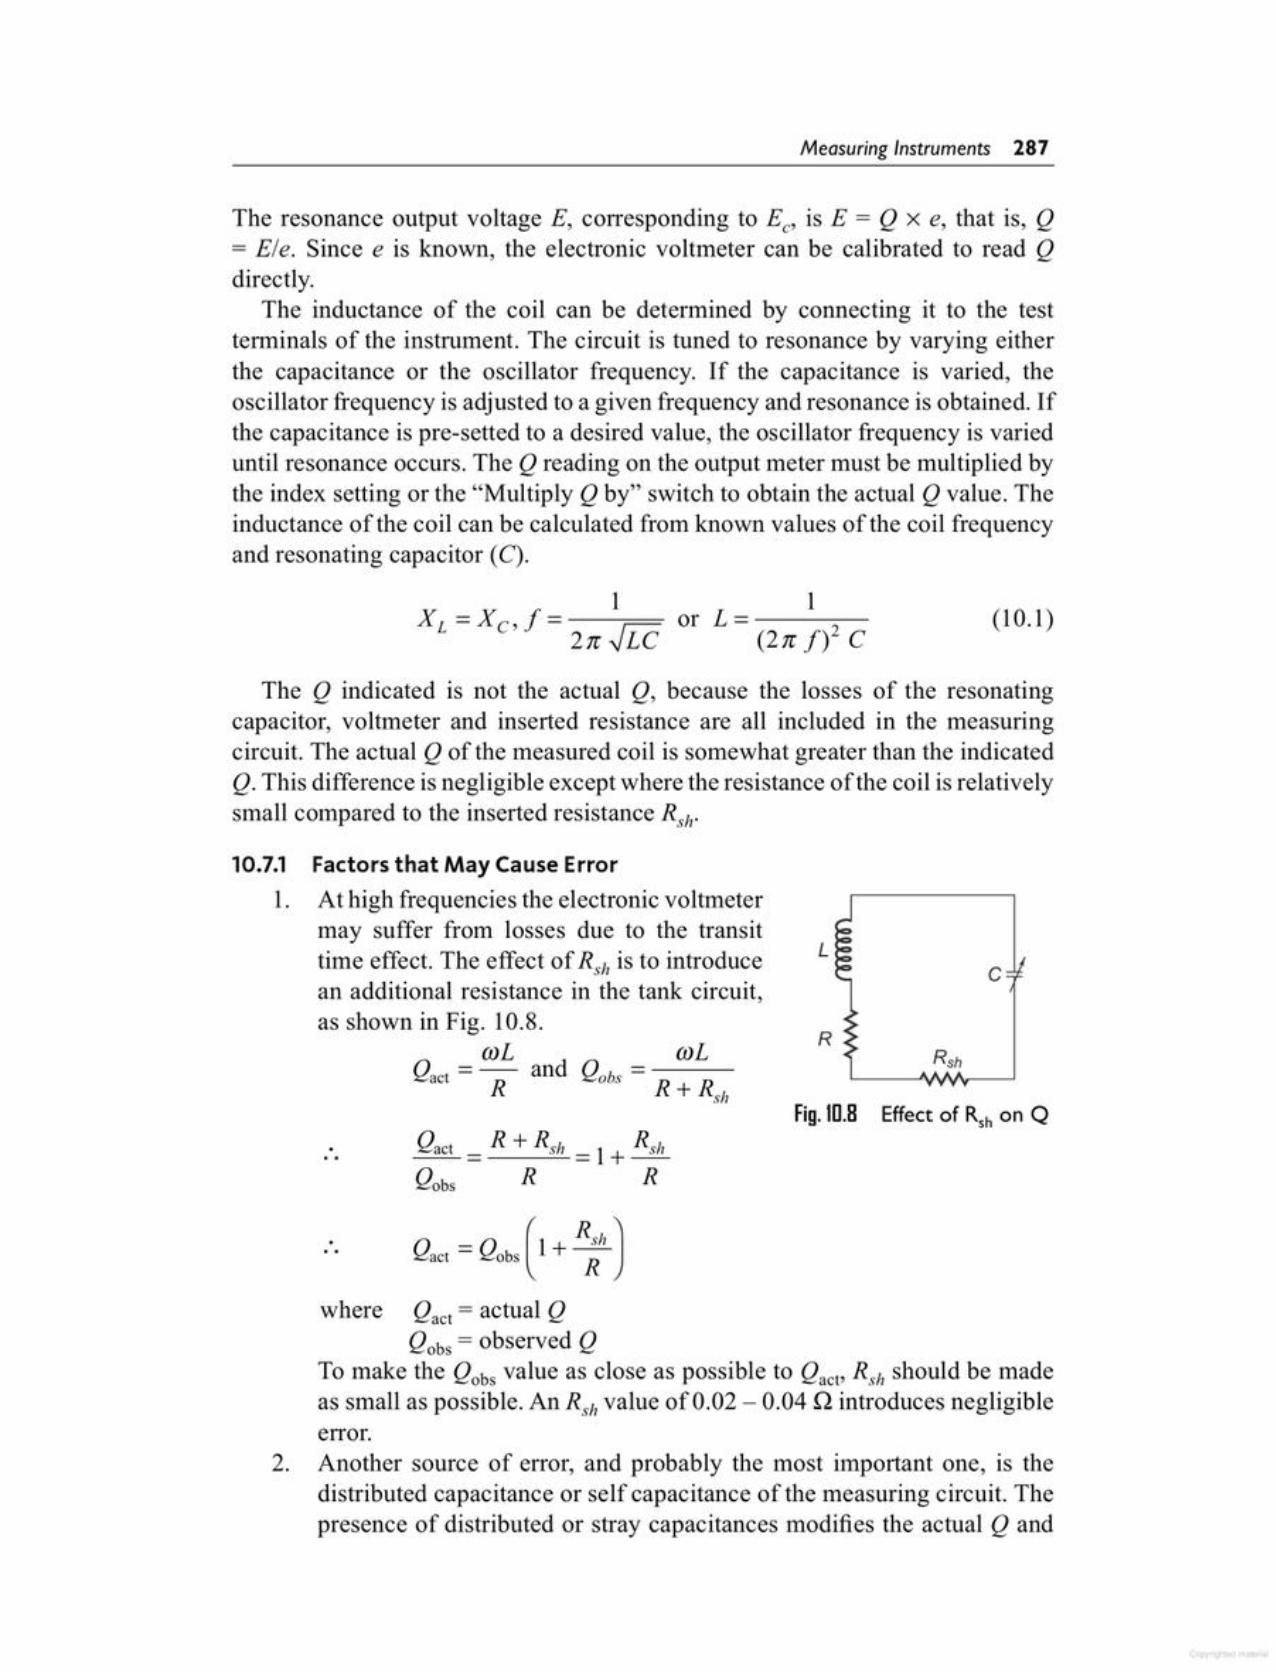
(. RSh)
Qact = Qobs 1+Rwhere Qact = actual Q
Qobs = observed QTo make the Qobs value as close as possible to Qact, Rsh should be madeas small as possible. An Rsh value of 0.02 - 0.04 Q introduces negligibleerror.
2. Another source of error, and probably the most important one, is thedistributed capacitance or self capacitance of the measuring circuit. Thepresence of distributed or stray capacitances modifies the actual Q and
Fig.ua Effect of Rsh on Q.. .
cL
(J)LQobs=---
R+Rsh
At high frequencies the electronic voltmetermay suffer from losses due to the transittime effect. The effect of Rsh is to introducean additional resistance in the tank circuit,as shown in Fig. 10.8.
(J)LQac!=- and
R
Factors that May Cause Error10.7.1
1.
The Q indicated is not the actual Q, because the losses of the resonatingcapacitor, voltmeter and inserted resistance are all included in the measuringcircuit. The actual Q of the measured coil is somewhat greater than the indicatedQ. This difference is negligible except where the resistance of the coil is relativelysmall compared to the inserted resistance Rsh.
(10.1)1
or L=---(2n f)2 C
The resonance output voltage E, corresponding to Eo is E = Q x e, that is, Q= E/e. Since e is known, the electronic voltmeter can be calibrated to read Qdirectly.
The inductance of the coil can be determined by connecting it to the testterminals of the instrument. The circuit is tuned to resonance by varying eitherthe capacitance or the oscillator frequency. If the capacitance is varied, theoscillator frequency is adjusted to a given frequency and resonance is obtained. Ifthe capacitance is pre-setted to a desired value, the oscillator frequency is varieduntil resonance occurs. The Q reading on the output meter must be multiplied bythe index setting or the "Multiply Q by" switch to obtain the actual Q value. Theinductance of the coil can be calculated from known values of the coil frequencyand resonating capacitor (C).
Measuring Instruments 287
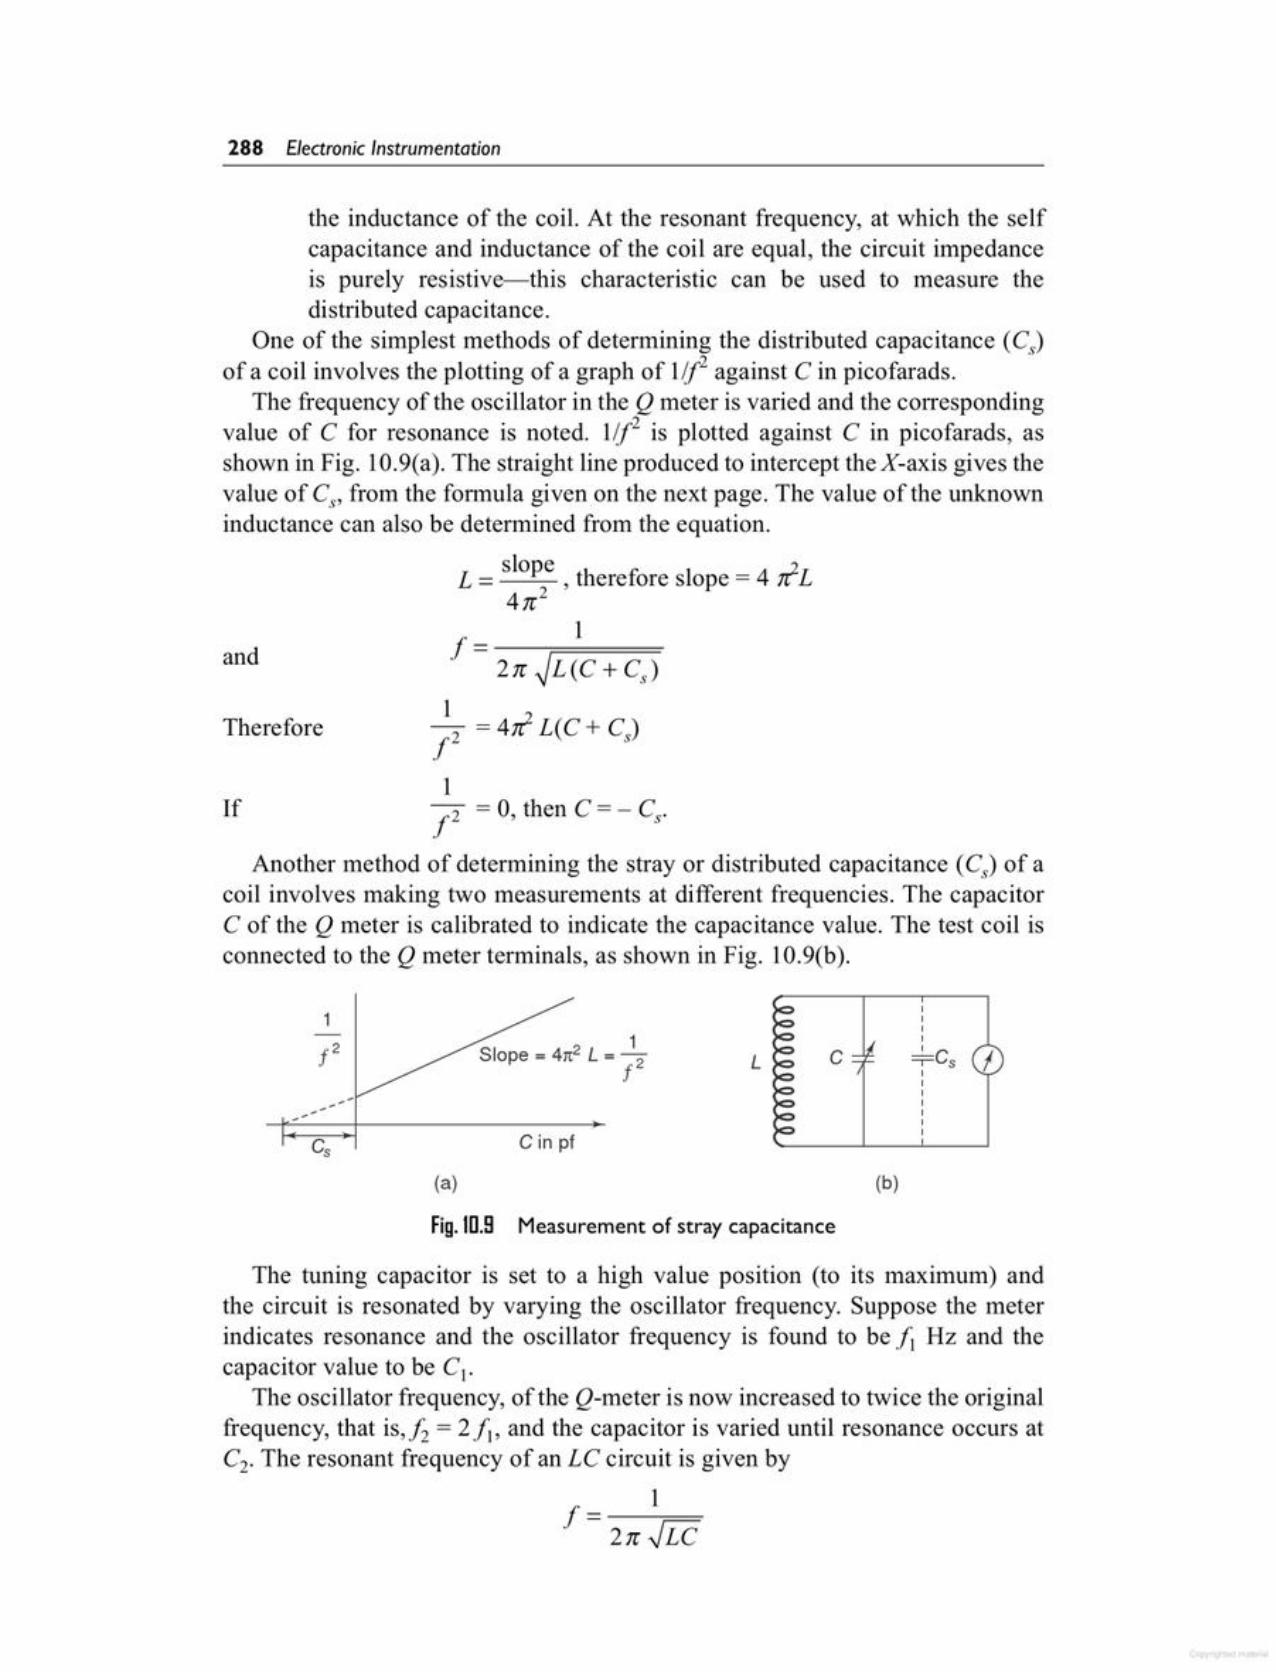
The tuning capacitor is set to a high value position (to its maximum) andthe circuit is resonated by varying the oscillator frequency. Suppose the meterindicates resonance and the oscillator frequency is found to be II Hz and thecapacitor value to be Cj•
The oscillator frequency, of the Q-meter is now increased to twice the originalfrequency, that is,!; = 2/1' and the capacitor is varied until resonance occurs atC2. The resonant frequency of an LC circuit is given by
11=2nJLC
Fig. 10.9 Measurement of stray capacitance
(a) (b)
C in pf
IIIII
=r=Cs IIIIIIII
CL1
Slope= 4n2 L = 2f
If112 = 0, then C = - C;
Another method of determining the stray or distributed capacitance (Cs) of acoil involves making two measurements at different frequencies. The capacitorC of the Q meter is calibrated to indicate the capacitance value. The test coil isconnected to the Q meter terminals, as shown in Fig. 10.9(b).
Therefore
and
the inductance of the coil. At the resonant frequency, at which the selfcapacitance and inductance of the coil are equal, the circuit impedanceis purely resistive-this characteristic can be used to measure thedistributed capacitance.
One of the simplest methods of determining the distributed capacitance (Cs)
of a coil involves the plotting of a graph of 1([2 against C in picofarads.The frequency of the oscillator in the Q meter is varied and the corresponding
value of C for resonance is noted. Ilf2 is plotted against C in picofarads, asshown in Fig. 10.9(a). The straight line produced to intercept the X-axis gives thevalue of Cs' from the formula given on the next page. The value of the unknowninductance can also be determined from the equation.
L = slope , therefore slope = 4 riL4n2
1= 12n ~L(C + Cs)
1 _212 =4nL(C+Cs)
288 Electronic Instrumentation
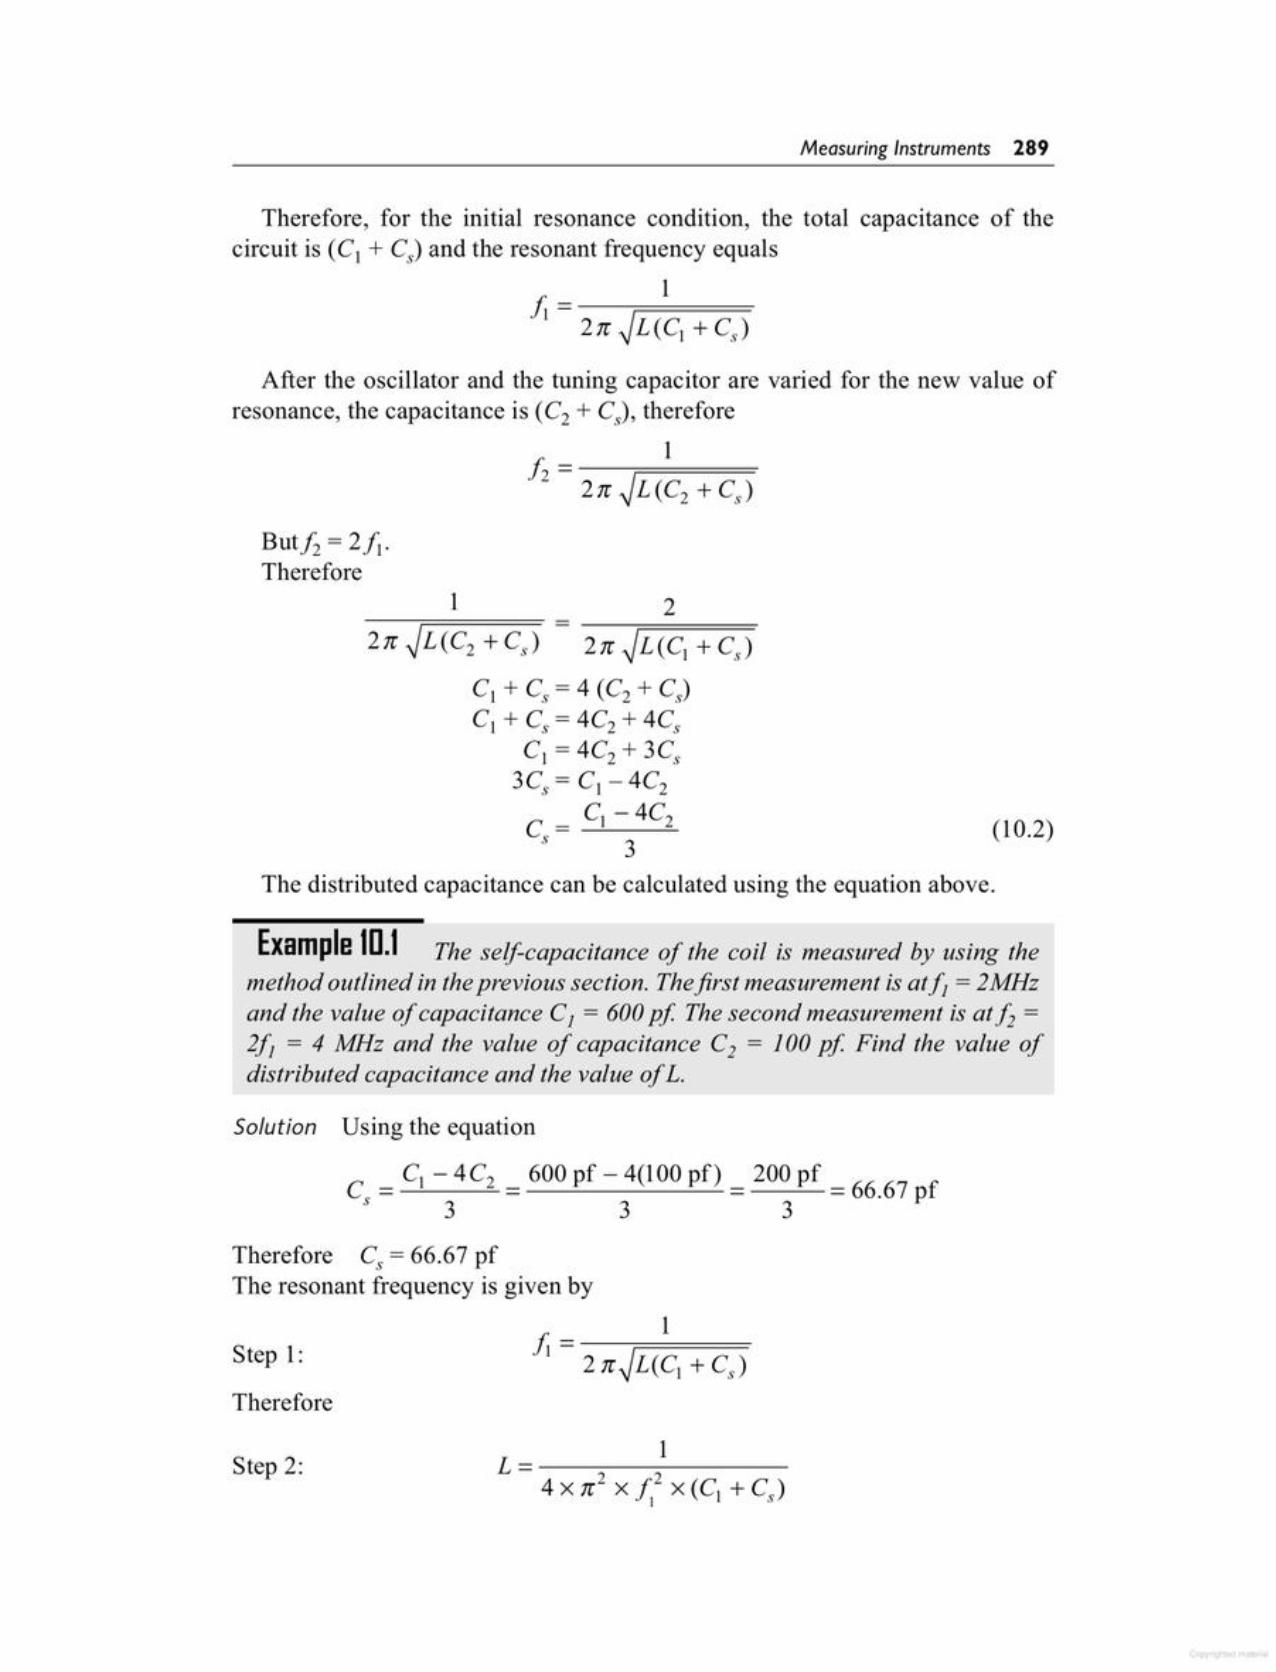
Step 2:
Therefore
Step 1:
C = C1 - 4C2 = 600 pf - 4(100 pf) = 200 pf = 66.67 pfs 3 3 3
Therefore C,= 66.67 pfThe resonant frequency is given by
Solution Using the equation
Example lD.1 The self-capacitance of the coil is measured by using themethod outlined in theprevious section. Thefirst measurement is atf,= 2MHzand the value of capacitance C] = 600 pi The second measurement is ath =
2f, = 4 MHz and the value of capacitance C2 = 100 pi Find the value ofdistributed capacitance and the value of L.
The distributed capacitance can be calculated using the equation above.
(10.2)
CI + C,= 4 (C2 + Cs)
C1 + C, = 4C2 + 4Cs
C1 = 4C2 + 3Cs
3Cs= CI-4C2
C = C1 - 4C2s 3
21
Butf2 = 2fl'Therefore
After the oscillator and the tuning capacitor are varied for the new value ofresonance, the capacitance is (C2 + Cs), therefore
112 = ------,=====. 2n~L(C2+Cs)
Therefore, for the initial resonance condition, the total capacitance of thecircuit is (CI+ C) and the resonant frequency equals
1J; = -----r====2n ~L(CI + c.,
Measuring Instruments 289
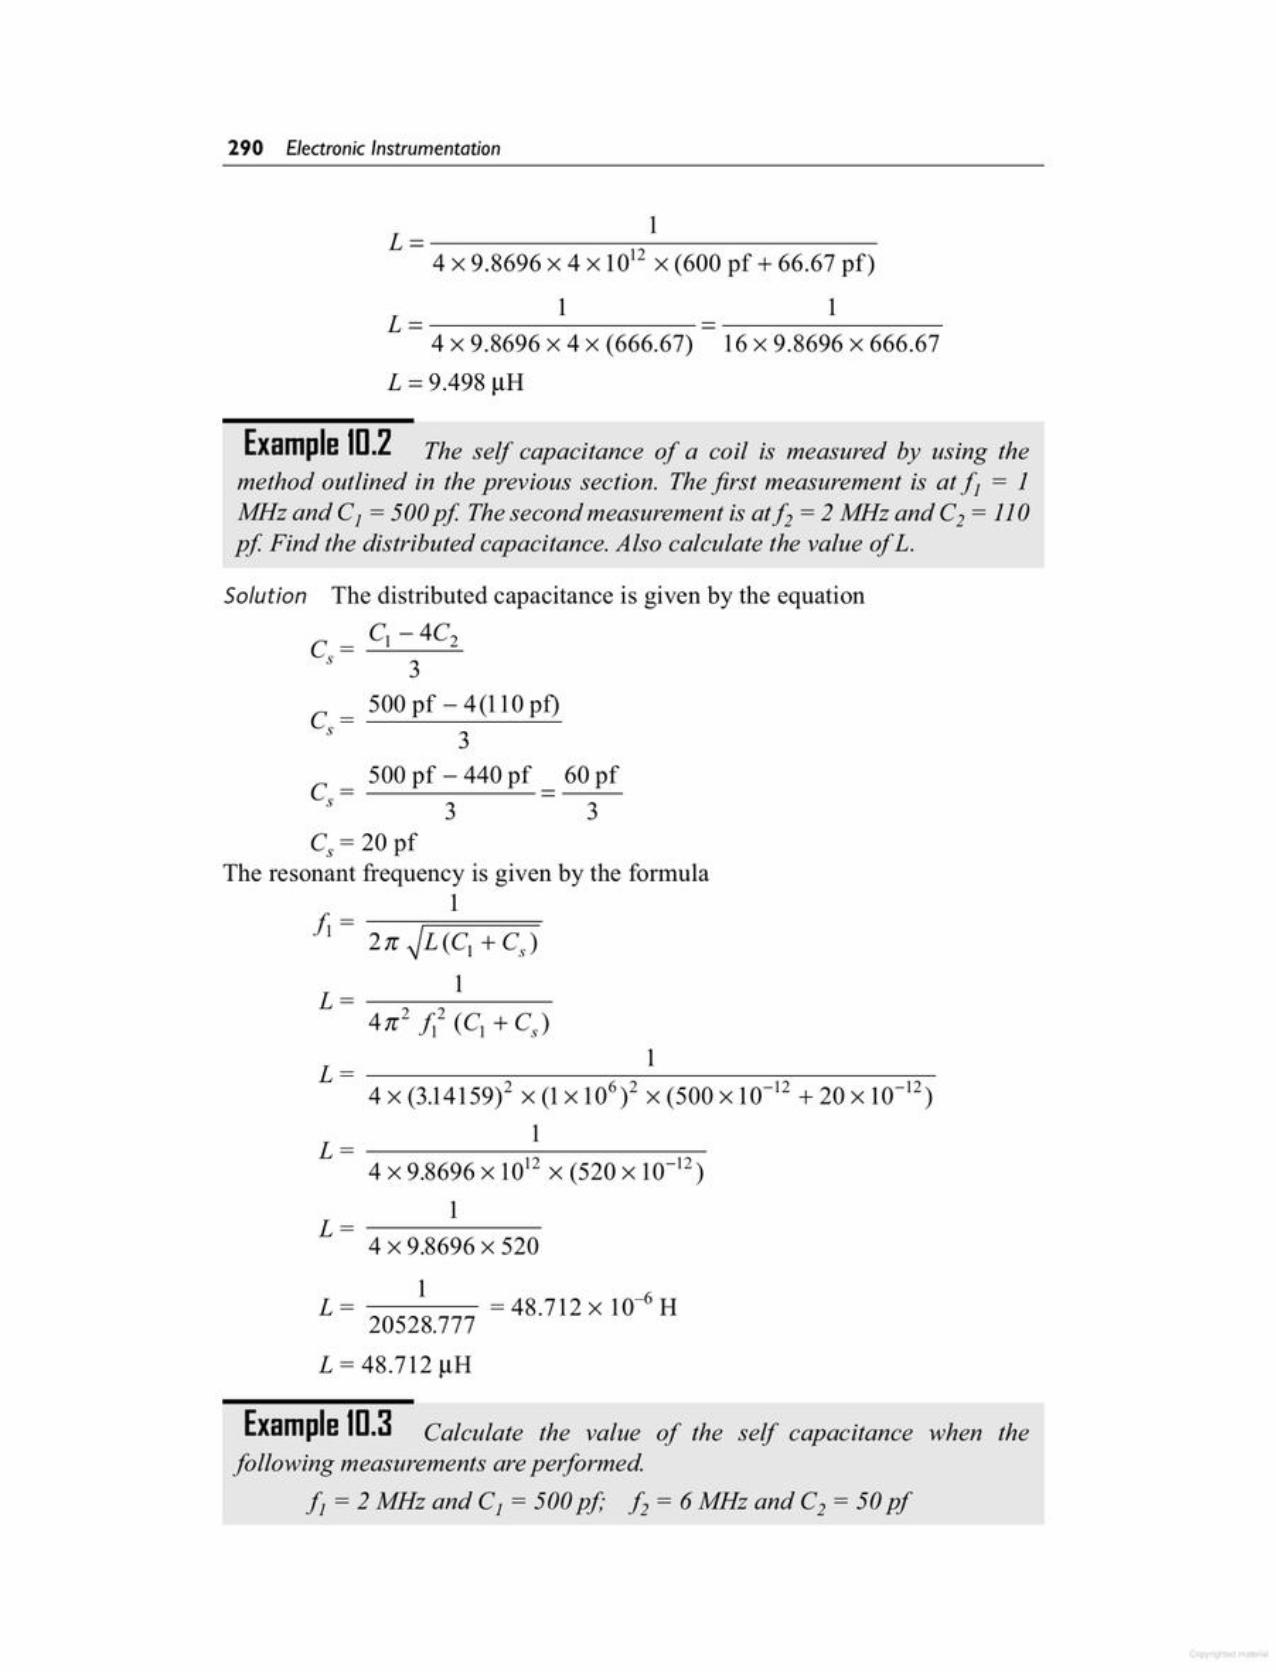
Example lD.3 Calculate the value of the self capacitance when thefollowing measurements are performed
f, = 2 MHz and C, = 500 pf; h = 6MHz and C2 = 50 pf
it = 2n ~L(CI + Cs)
1L = 2 2
4n It (Cl +Cs)
L= 14 X (3.14159)2 X (1X 106)2 X (500 X 10-12 + 20 X 10-12)
1L = -----...,....,.-------~4 X 9.8696 X 1012X (520 X 10-12)
1L=------4 X 9.8696 X 520
L= 1 =48.712x10⁻⁶H20528.777
L = 48.712 ~H
Solution The distributed capacitance is given by the equationCI - 4C2C = __:__----=-
s 3
C = 500 pf - 4(110 pf)s 3
C = 500 pf - 440 pf = 60 pfs 3 3
C,= 20 pfThe resonant frequency is given by the formula
1
Example lD.2 The self capacitance of a coil is measured by using themethod outlined in the previous section. The first measurement is at f1 = 1MHz and C1 = 500 pf The second measurement is ath = 2MHz and C2 = 110pj' Find the distributed capacitance. Also calculate the value ofL.
L= 14 X 9.8696 X 4 X 1012 X (600 pf + 66.67 pf)
1 1L = ---------- -------4 X 9.8696 X 4 X (666.67) 16 X 9.8696 X 666.67
L = 9.498 ~H
290 Electronic Instrumentation
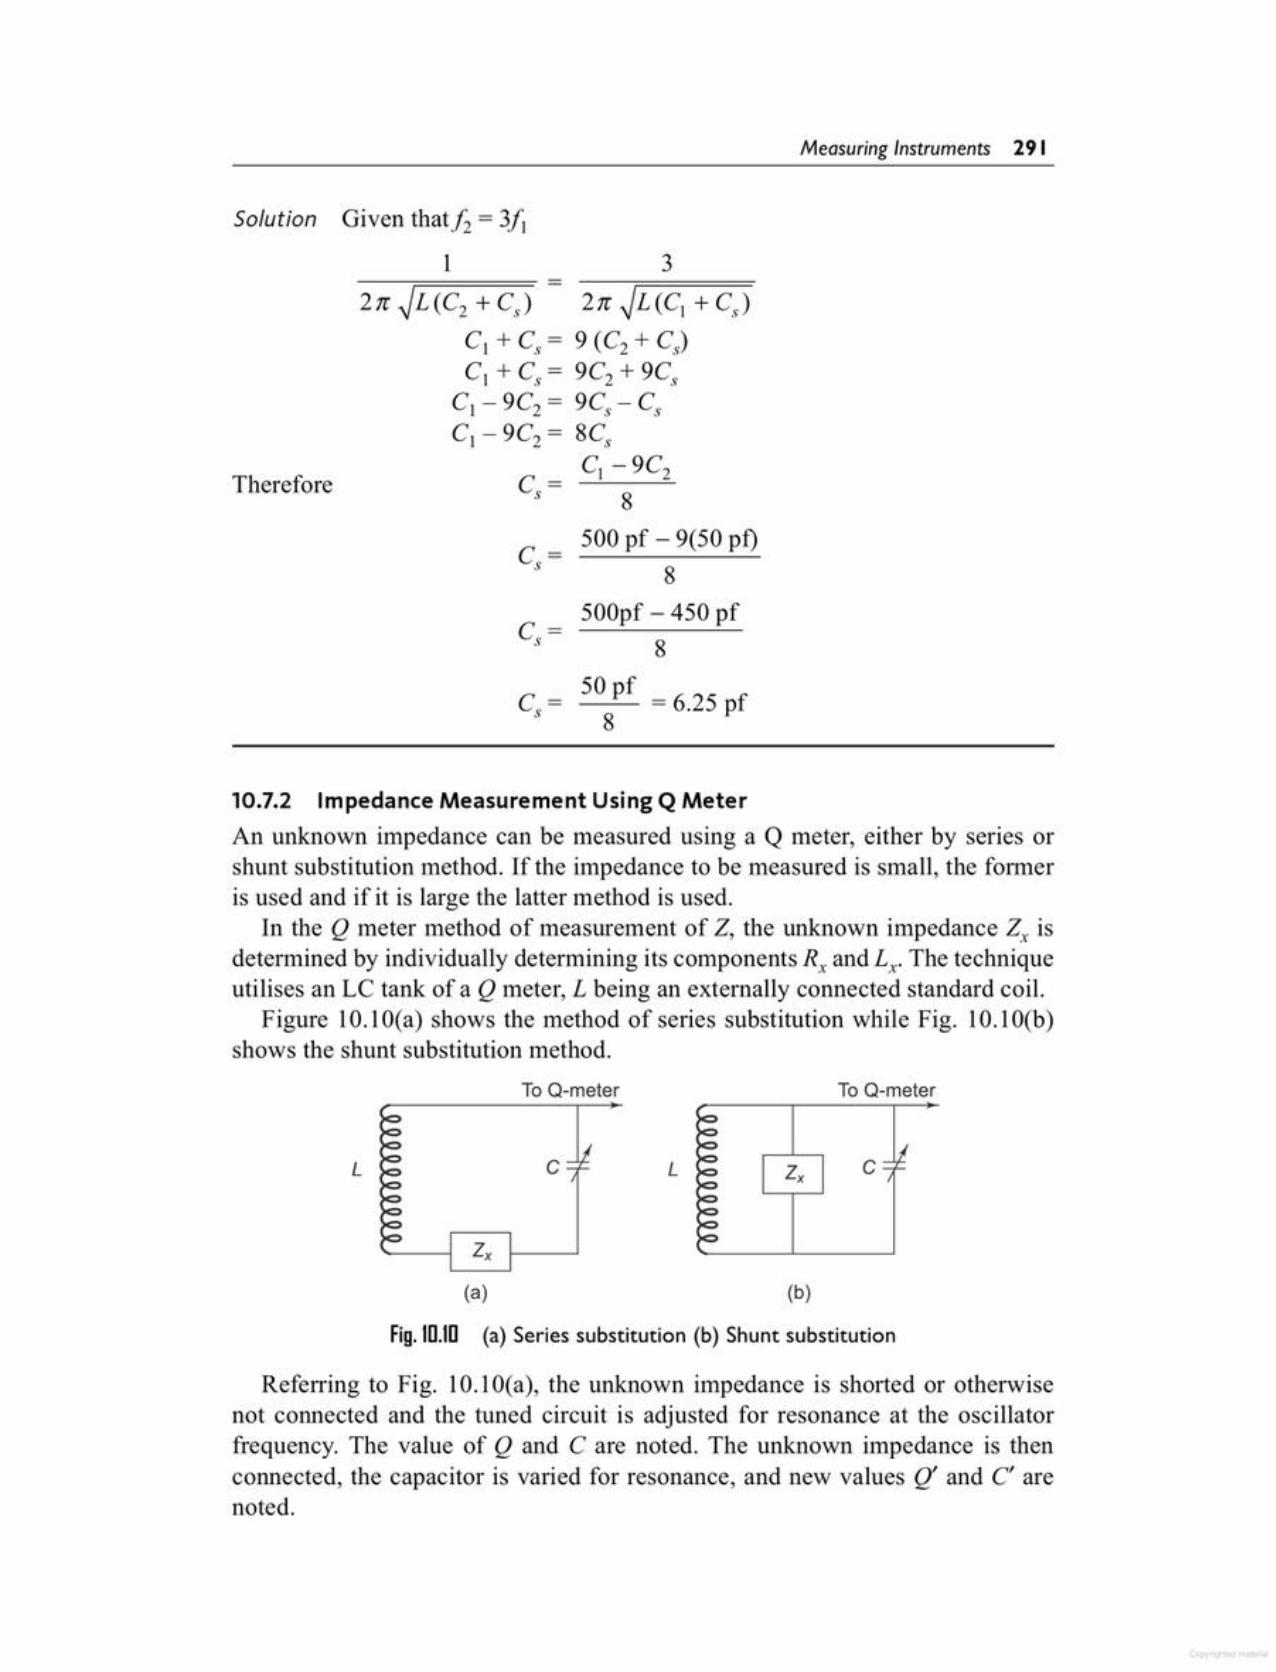
Referring to Fig. 10.1O(a), the unknown impedance is shorted or otherwisenot connected and the tuned circuit is adjusted for resonance at the oscillatorfrequency. The value of Q and C are noted. The unknown impedance is thenconnected, the capacitor is varied for resonance, and new values Q' and C' arenoted.
Fig.ID.ID (a) Series substitution (b) Shunt substitution
(b)(a)
cc LL
To Q-meterTo Q-meter
10.7.2 Impedance Measurement Using Q MeterAn unknown impedance can be measured using a Q meter, either by series orshunt substitution method. If the impedance to be measured is small, the formeris used and if it is large the latter method is used.
In the Q meter method of measurement of Z, the unknown impedance Z; isdetermined by individually determining its components R; and Lx. The techniqueutilises an LC tank of a Q meter, L being an externally connected standard coil.
Figure 10.10(a) shows the method of series substitution while Fig. 10.10(b)shows the shunt substitution method.
C = SOOpf- 4S0 pfs 8
C = SO pf = 6.2S pfs 8
8
C1 + C, = 9 (C2 + Cs)
C1 + C, = 9C2 + 9CsCl - 9C2 = 9Cs - C,C1 - 9C2 = 8Cs
C1 - 9C2C=s 8
C = SOO pf - 9(SO pi)s
Therefore
3
Solution Given thath = 3fl
1-----;===== -2n ~L(C2 + Cs)
Measuring Instruments 291
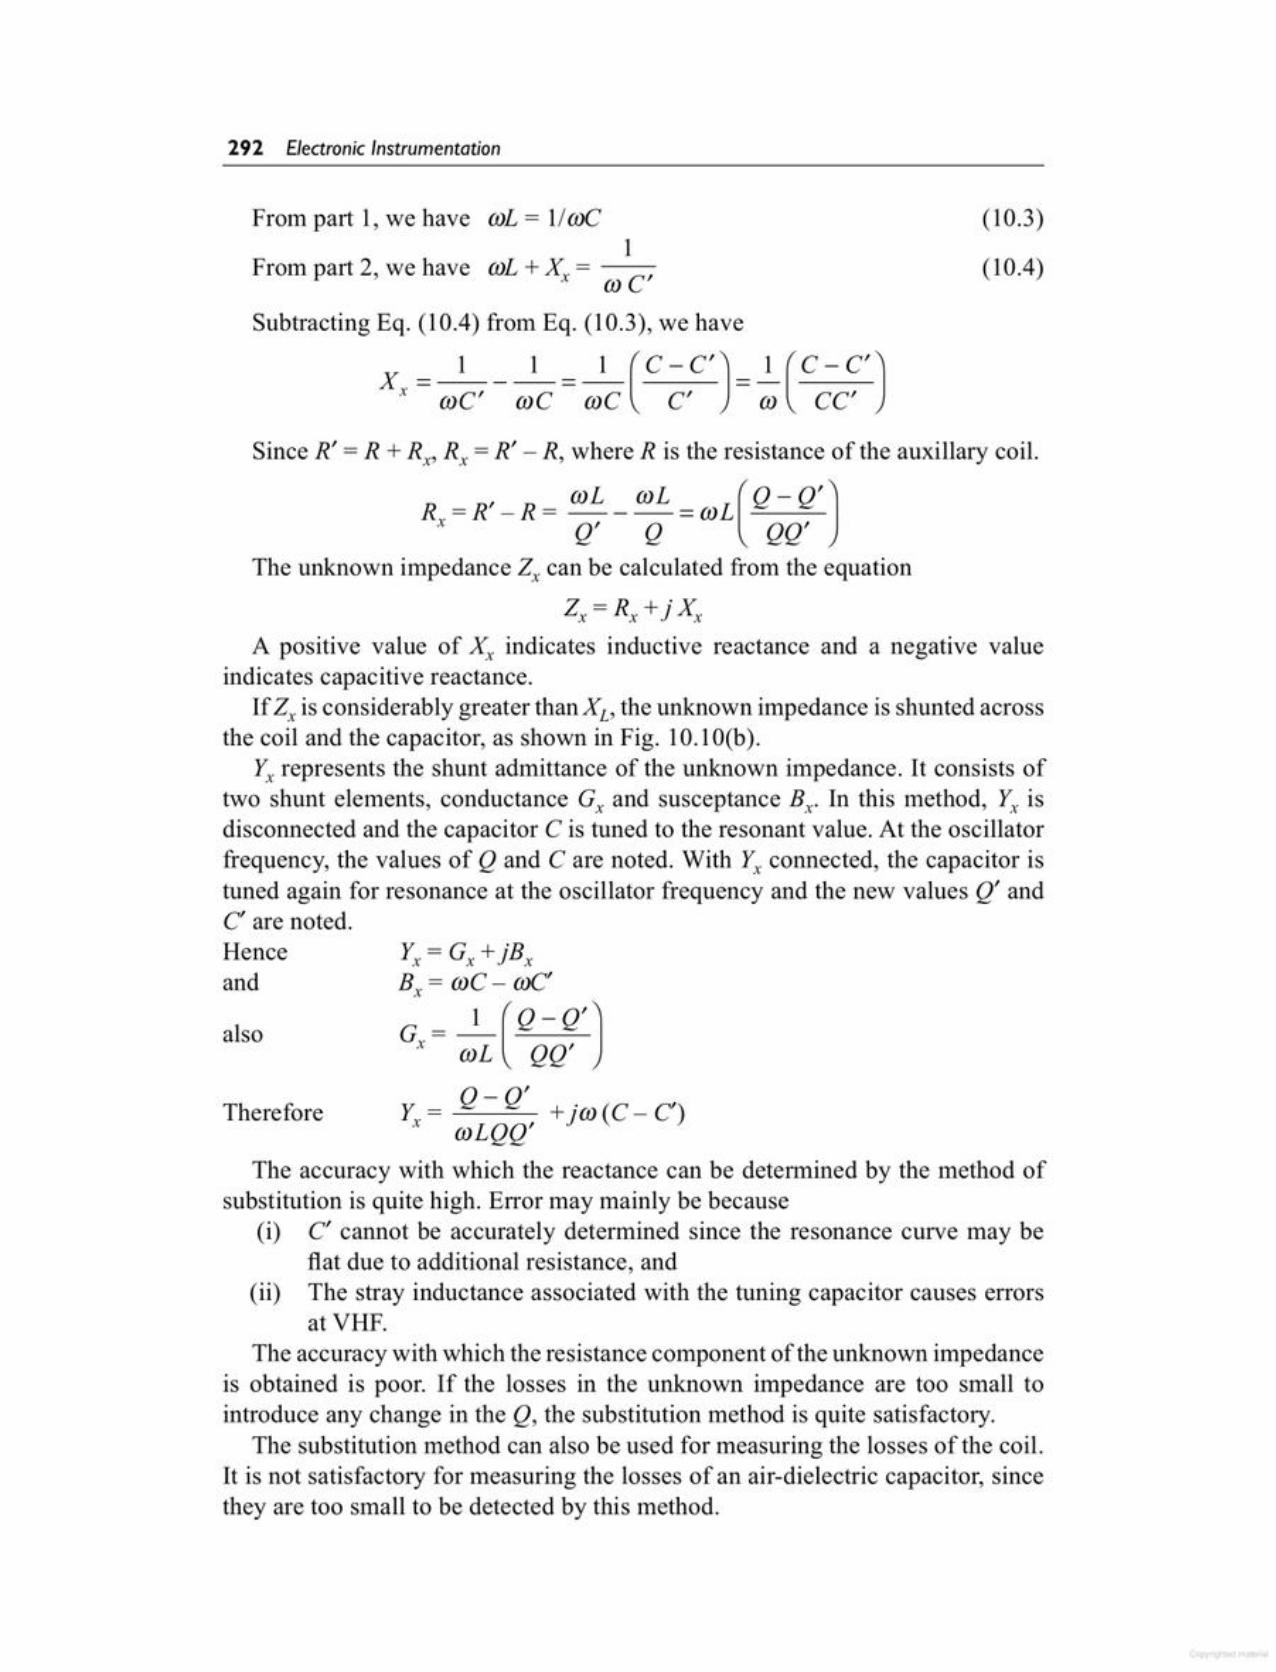
Therefore
also
Henceand
Yx = G, +jBxB = mC - mC'x
1 (Q - Q'Jo,= mL QQ'
Y. = Q - Q' +jt» (C - C')x mLQQ'
The accuracy with which the reactance can be determined by the method ofsubstitution is quite high. Error may mainly be because
(i) C' cannot be accurately determined since the resonance curve may beflat due to additional resistance, and
(ii) The stray inductance associated with the tuning capacitor causes errorsat VHF.
The accuracy with which the resistance component of the unknown impedanceis obtained is poor. If the losses in the unknown impedance are too small tointroduce any change in the Q, the substitution method is quite satisfactory.
The substitution method can also be used for measuring the losses of the coil.It is not satisfactory for measuring the losses of an air-dielectric capacitor, sincethey are too small to be detected by this method.
Since R' = R + Rx' R; =R' - R, where R is the resistance of the auxillary coil.
R =R'-R= mL_mL=mL(Q-Q'Jx Q' Q QQ'
The unknown impedance Zx can be calculated from the equation
Zx=Rx +j X,A positive value of Xx indicates inductive reactance and a negative value
indicates capacitive reactance.If Z; is considerably greater than XL' the unknown impedance is shunted across
the coil and the capacitor, as shown in Fig. 10.1O(b).Yx represents the shunt admittance of the unknown impedance. It consists of
two shunt elements, conductance Gx and susceptance Bx' In this method, Yx isdisconnected and the capacitor C is tuned to the resonant value. At the oscillatorfrequency, the values of Q and C are noted. With Y:t connected, the capacitor istuned again for resonance at the oscillator frequency and the new values Q' andC' are noted.
(10.3)
(10.4)
From part 1, we have mL = II mC1
From part 2,we have col. +Xx = ta C'
Subtracting Eq. (10.4) from Eq. (10.3), we have
X = 1 _ 1 = 1 (C - C' J = _!_ (C - C' Jx toe' mC mC C' ta CC'
292 Electronic Instrumentation
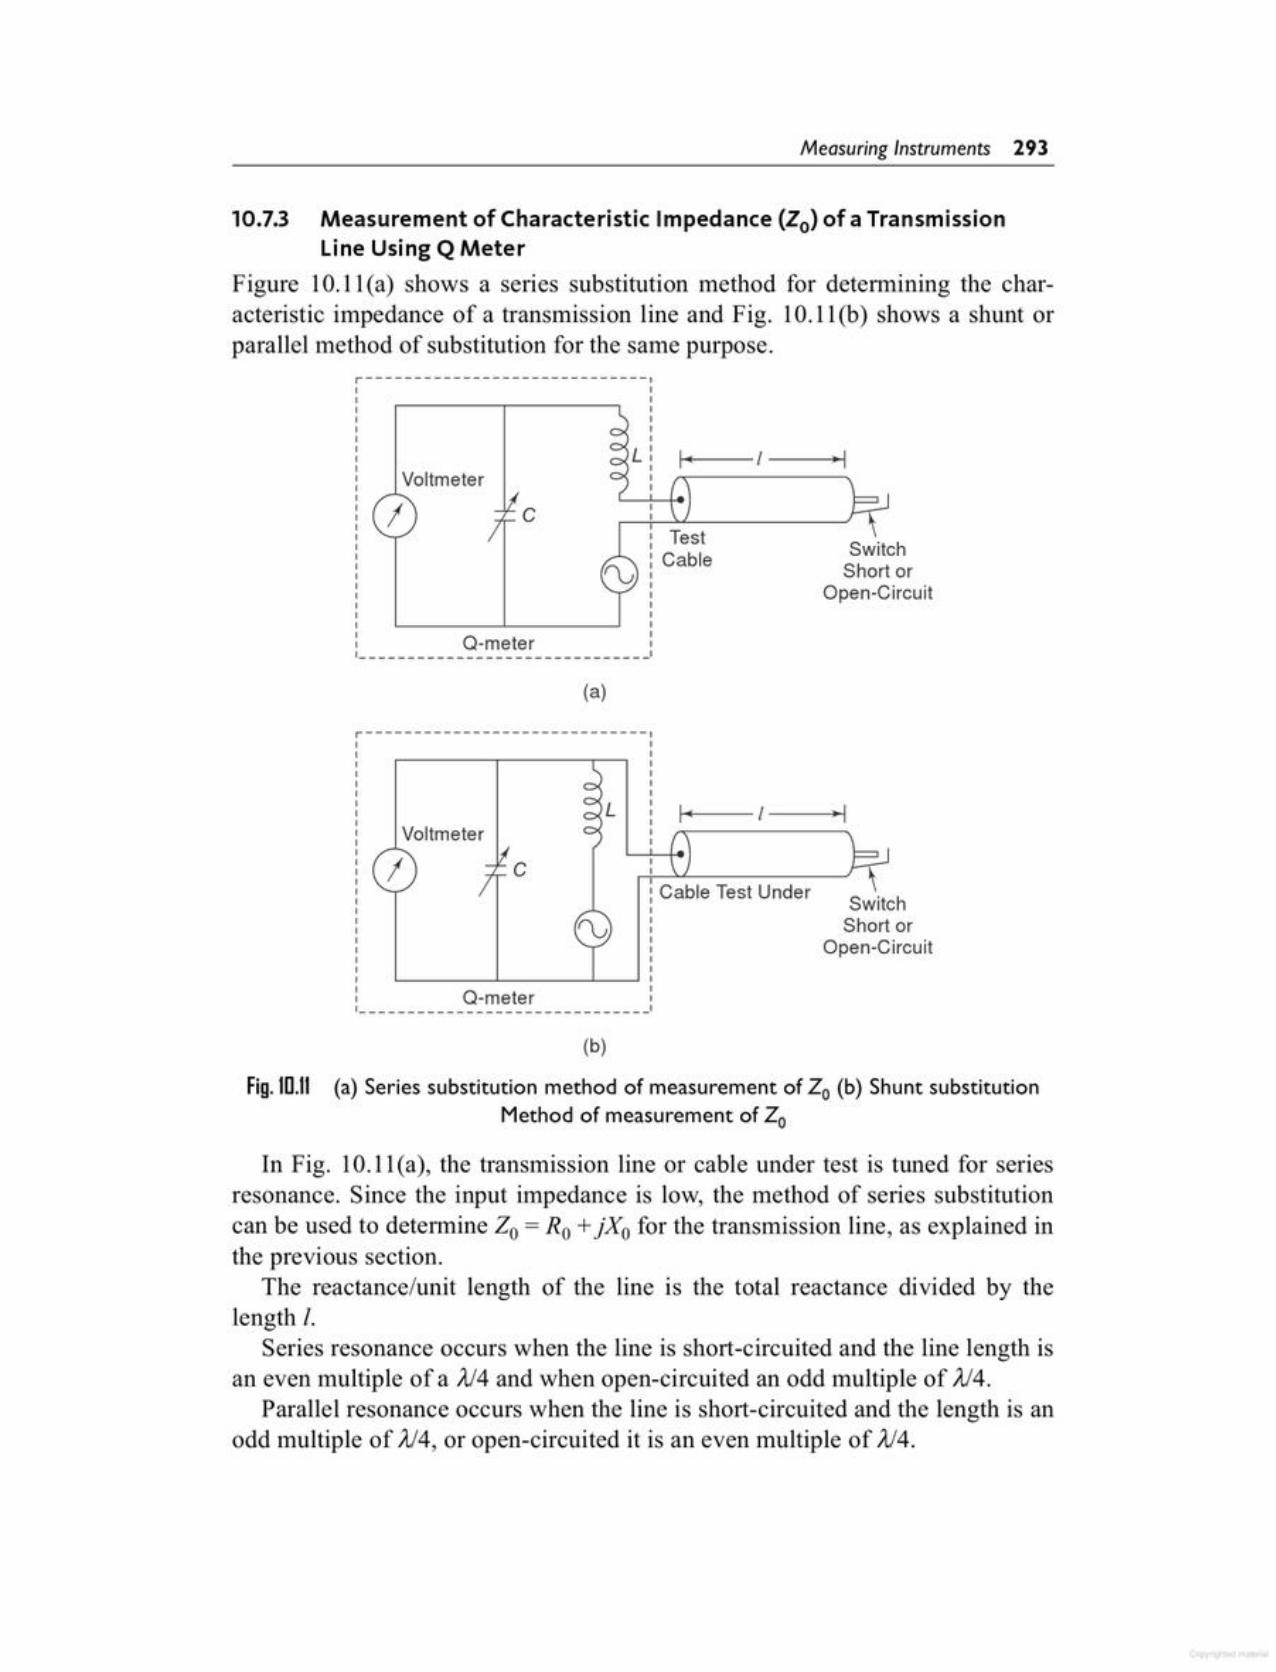
In Fig. 10.11(a), the transmission line or cable under test is tuned for seriesresonance. Since the input impedance is low, the method of series substitutioncan be used to determine Zo = Ro +jXo for the transmission line, as explained inthe previous section.
The reactance/unit length of the line is the total reactance divided by thelength I.
Series resonance occurs when the line is short-circuited and the line length isan even multiple of a Al4 and when open-circuited an odd multiple of Al4.
Parallel resonance occurs when the line is short-circuited and the length is anodd multiple of Al4, or open-circuited it is an even multiple of Al4.
Fig.ID.1I (a) Series substitution method of measurement of Zo (b) Shunt substitutionMethod of measurement of Zo
SwitchShort or
Open-Circuit
Cable Test Under
f-o!l "--l--~
SwitchShort or
Open-Circuit
TestCable
L I( I--~
(b)
Q-meter------------------------ 1
I c
LVoltmeter
r-----------------------------
(a)
Q-meter------------------------ 1
cVoltmeter
r-----------------------------
10.7.3 Measurement of Characteristic Impedance (Zo) of a TransmissionLine Using Q Meter
Figure 10.11(a) shows a series substitution method for determining the characteristic impedance of a transmission line and Fig. 10.II(b) shows a shunt orparallel method of substitution for the same purpose.
Measuring Instruments 293

(10.5)Therefore
CrTherefore
Q=--ca c, RBut... 1
i.e.
The points Ca, Cb and C, are closer together when coil Q is high (sharptuning) and far apart when Q is low (broad tuning). The value of Q can be thendetermined as follows.
Ca and Cb are the value of capacitances at the half power point and C,. is thevalue of the capacitance at resonance.:. XCa = 1/mCa and XCb = I/mCb
At half power pointscol. - 11m Ca = R and 11m Cb - mL = R
Adding the two equations, we have
1 1 = 2R mCa - mCb = 2R»c, »c, m2 c, c,Ca - Cb = 2Rmc, c,Ca -Cb___:::.....____:::._= 2»c.sc,
Fig.10.12 (a) Susceptance method of Q measurement (b) Response curve
(b)(a)
R
Voltage0.707
C
L
Capacitance
III___________ --_1_--
10.7.4 Measurement of Q by Susceptance MethodThe coil under test is connected in series with a calibrated low loss variablecapacitor. With the use of the meter as an indicator, the circuit is tuned forresonance to the oscillator frequency, by tuning the variable capacitor to a valueCr, as shown in Fig. 10.12(a). The capacitor is then detuned to a value Cb on thelow capacitance side of resonance at which the meter reading falls to 70.7% ofthe resonant voltage. Next, the capacitor is set on the higher capacitance side ofresonance to a value Ca, where the voltmeter deflection again drops to 70.7% ofthe resonant voltage, as shown in Fig. 1O.12(b).
294 Electronic Instrumentation
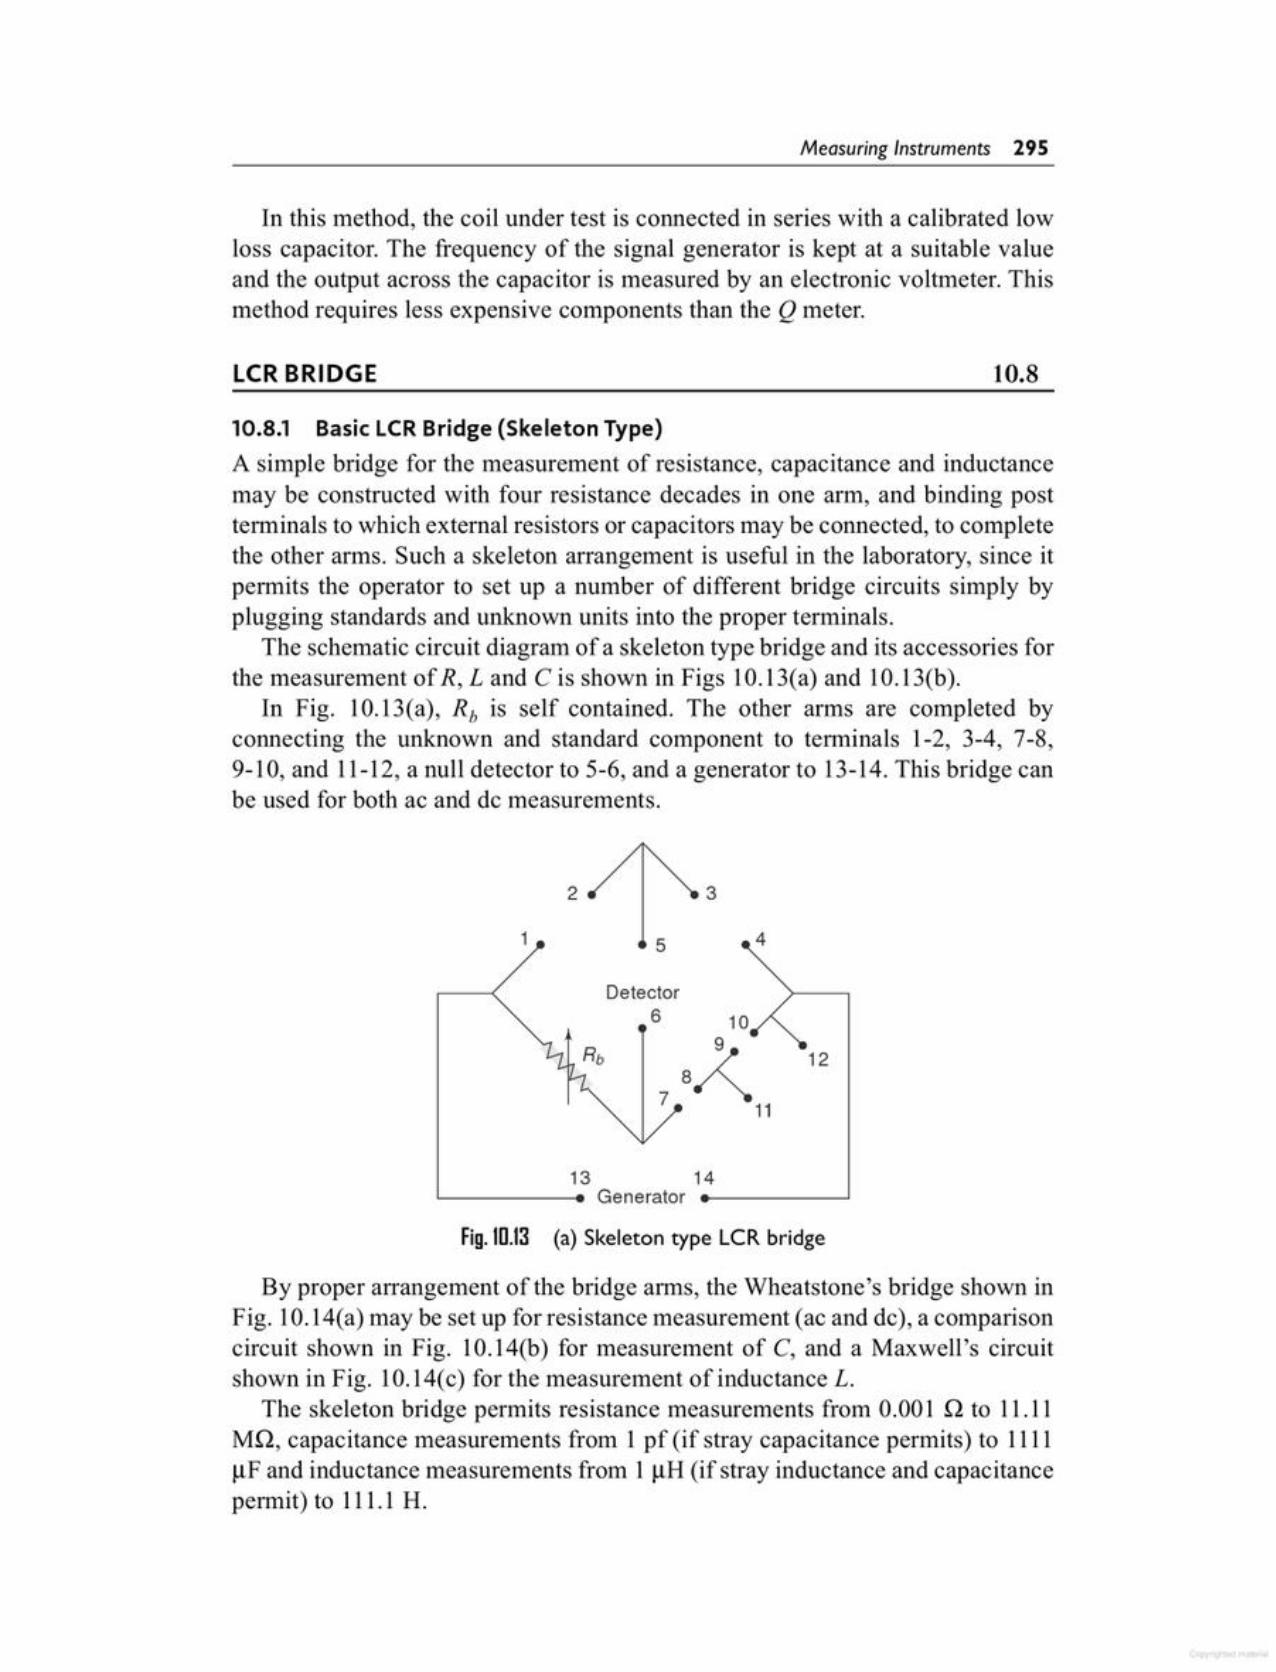
Fig. 10.13 (a) Skeleton type LCR bridge
By proper arrangement of the bridge arms, the Wheatstone's bridge shown inFig. 10.14(a) may be set up for resistance measurement (ac and de), a comparisoncircuit shown in Fig. 10.14(b) for measurement of C, and a Maxwell's circuitshown in Fig. 10.14( c) for the measurement of inductance L.
The skeleton bridge permits resistance measurements from 0.001 Q to 11.11MQ, capacitance measurements from 1 pf (if stray capacitance permits) to 1111IlF and inductance measurements from 1 IlH (if stray inductance and capacitancepermit) to 111.1 H.
13 14Generator
2 3
1 5
Detector6 108.z 12
11
10.S.1 Basic LCR Bridge (Skeleton Type)A simple bridge for the measurement of resistance, capacitance and inductancemay be constructed with four resistance decades in one ann, and binding postterminals to which external resistors or capacitors may be connected, to completethe other arms. Such a skeleton arrangement is useful in the laboratory, since itpermits the operator to set up a number of different bridge circuits simply byplugging standards and unknown units into the proper terminals.
The schematic circuit diagram of a skeleton type bridge and its accessories forthe measurement of R, Land C is shown in Figs 10.13(a) and 10.13(b).
In Fig. 10.13(a), Rb is self contained. The other arms are completed byconnecting the unknown and standard component to terminals 1-2, 3-4, 7-8,9-10, and 11-12, a null detector to 5-6, and a generator to 13-14. This bridge canbe used for both ac and de measurements.
10.8LCR BRIDGE
In this method, the coil under test is connected in series with a calibrated lowloss capacitor. The frequency of the signal generator is kept at a suitable valueand the output across the capacitor is measured by an electronic voltmeter. Thismethod requires less expensive components than the Q meter.
Measuring Instruments 295

The bridge accessories are shown in Fig. 10.13(b). There are two switchedresistance standard boxes (one 10- 100 - 1000 Q precision resistance and another1 - 10 - 100 - 1000 - 10000 Q precision resistance), one switched capacitorstandard box containing 0.001- 0.01- 0.1 ~F, a close tolerance capacitor, and fourmounted dial calibrated rheostats having values of 100 - 1 k - 10 k - 100 kQ.
For de measurements 1.5 - 7.5 V batteries are used and connected to terminals13 - 14. A centre zero 50 - 0 - 50 or 100 - 0 - 100 de microammeter is connectedto terminals 5 - 6.
For ac measurements of R, Land C connect a signal source or AF oscillatortuned to a frequency of 1 kHz to terminals 13 - 14 and a null detector (headphone, AC VTVM, CRO, etc) to terminal 5 - 6. The mode of operation for themeasurement of R, C and L are as follows.
Fig.ID.13 (b) Complete circuit of the skeleton bridge and accessories
Rheostat 2Rheostat 1
100,000 Q
Rheostat 4
10,000 Q
Rheostat 3
1000 Q100 Q
CapacitanceStandard
Resis
,....a
Resis
JGenerator
(~ . I 13 & 14)J0r ermma s -0r1 2 3 4 7 8 9 10 11 12
f----<!> • • i Lt • • i L iI l( (
I o ." 1 ." 2 IAA, 3 "" 4 "" 5 IAA 6 • IAA. 7 ." 8 ." 9 ..fIAAA 10HH ••H .... "" •••• •••• ".. •H. •••• ....
~
t;$a.~a'i:o.~o Thousandso 0
I,.... 0
.@ ... ." IAA, "" .... IAA IAA. ... ... ..fIAAA•••• .." .... HH "H .... "" HH HH ""tance Std. 1
t Hundreds
a ~. I _." _.... _A'" .... _.... _.... _. ... -". _'B JI ...
$a .~a.~o.~a vo" .... .... .... •H • ". ... H" ..H ....~~.~g .~g s g
+,.... ,.... 0
{ 0
®'-I Tens..fIA .. ..fIAA, "" lAA lAA -"AA. ..fIAAA
tance Std. 2 'YY' .. "" yy" .YO " . ." '" "YO ""
t Units@
ao,....
296 Electronic Instrumentation
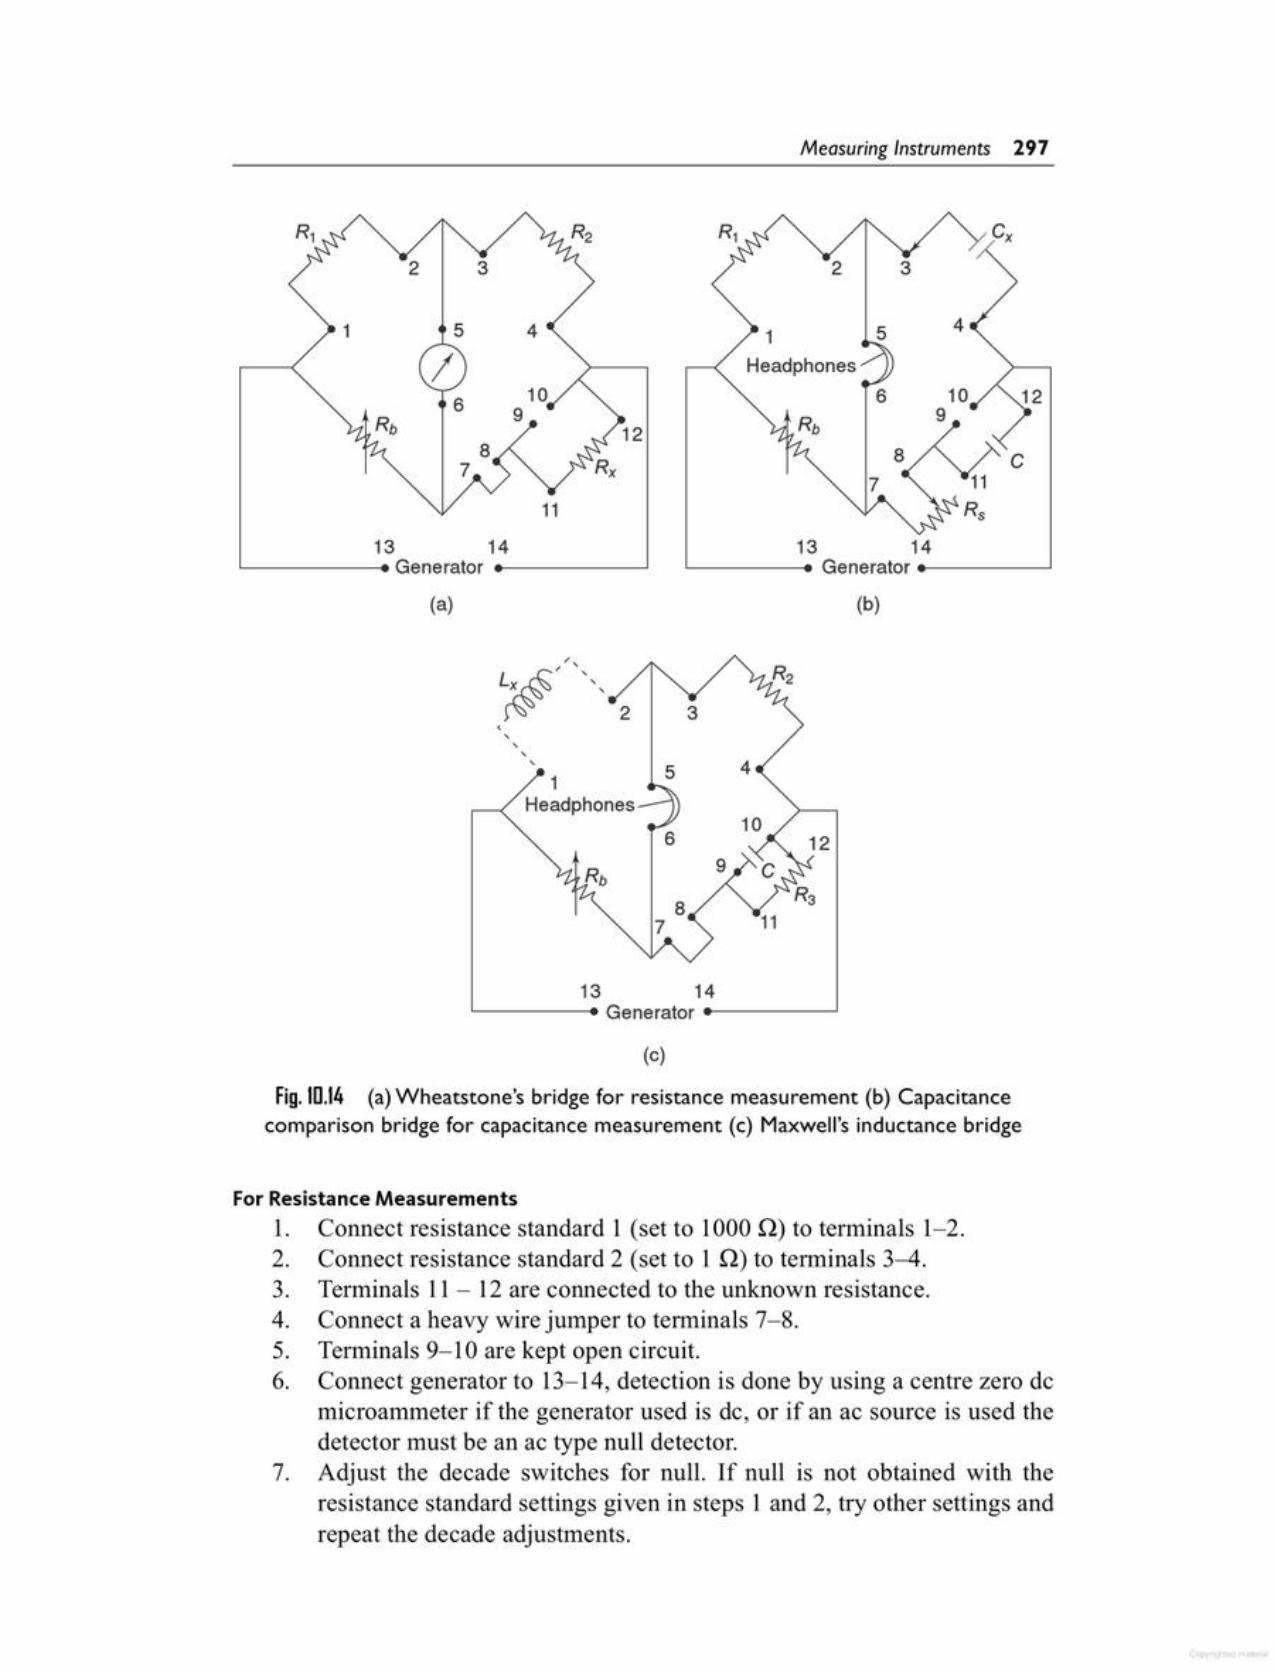
For Resistance Measurements1. Connect resistance standard 1 (set to 1000Q) to terminals 1-2.2. Connect resistance standard 2 (set to 1Q) to terminals 3-4.3. Terminals 11- 12 are connected to the unknown resistance.4. Connect a heavy wire jumper to terminals 7-8.5. Terminals 9-10 are kept open circuit.6. Connect generator to 13-14, detection is done by using a centre zero dc
microammeter if the generator used is de, or if an ac source is used thedetector must be an ac type null detector.
7. Adjust the decade switches for null. If null is not obtained with theresistance standard settings given in steps 1 and 2, try other settings andrepeat the decade adjustments.
Fig.IO.14 (a)Wheatstone's bridge for resistance measurement (b) Capacitancecomparison bridge for capacitance measurement (c) Maxwell's inductance bridge
(c)
13 14'----- .....Generator -------'
9
106
Headphones
,,,,
451
3
1 5 4 1 5
Headphones
6 10 6 129
12C
11
13 14 13 14Generator Generator
(a) (b)
33
Measuring Instruments 297

( 10.7)c = C Rb lIPx R .....
)
where R) and Rb are in ohms and C is in microfarads.
The possible ranges are given in Table 10.2.
For Capacitance Measurement1. Connect resistance standard 1 (set to 1 kQ) to terminals 1 - 2.2. Connect capacitor standard (set to 0.001 IlF) to terminals 11 - 12.3. Connect the unknown capacitance to terminals 3 - 4.4. Keep terminals 9 - 10 open-circuit.5. Connect the 100 Q rheostat to terminals 7 - 8.6. Connect an ac generator to terminals 13 - 14 and a headphone or ac null
detector to terminals 5 - 6.7. Adjust the decade switches for null. If null is not obtained with the
standard settings given in steps 1 and 2, try other standard resistance andcapacitor settings.
8. At null determination the value of the unknown capacitor is determinedfrom the readings of the decades Rb, resistance standard 1, and capacitorstandard (C) by using the following equation.
(10.6)
Table 1D.1
Resistance I (Q) Resistance 2 (Q) Range (Q)
1000 1 0.001- 1l.11
1000 10 .01-11l.11
1000 100 .1-1111
1000 1000 1.0- 11110
1000 10000 10.0 - 111100
100 10000 100.0 -1111000
10 10000 1000.0-11110000
R = R2 Rbx R)
The possible ranges are given in Table 10.1.
8. At null, determine the unknown resistance R; from the readings of thedecades (Rb), resistance standard 1 and resistance 2 using the followingequation.
298 Electronic Instrumentation
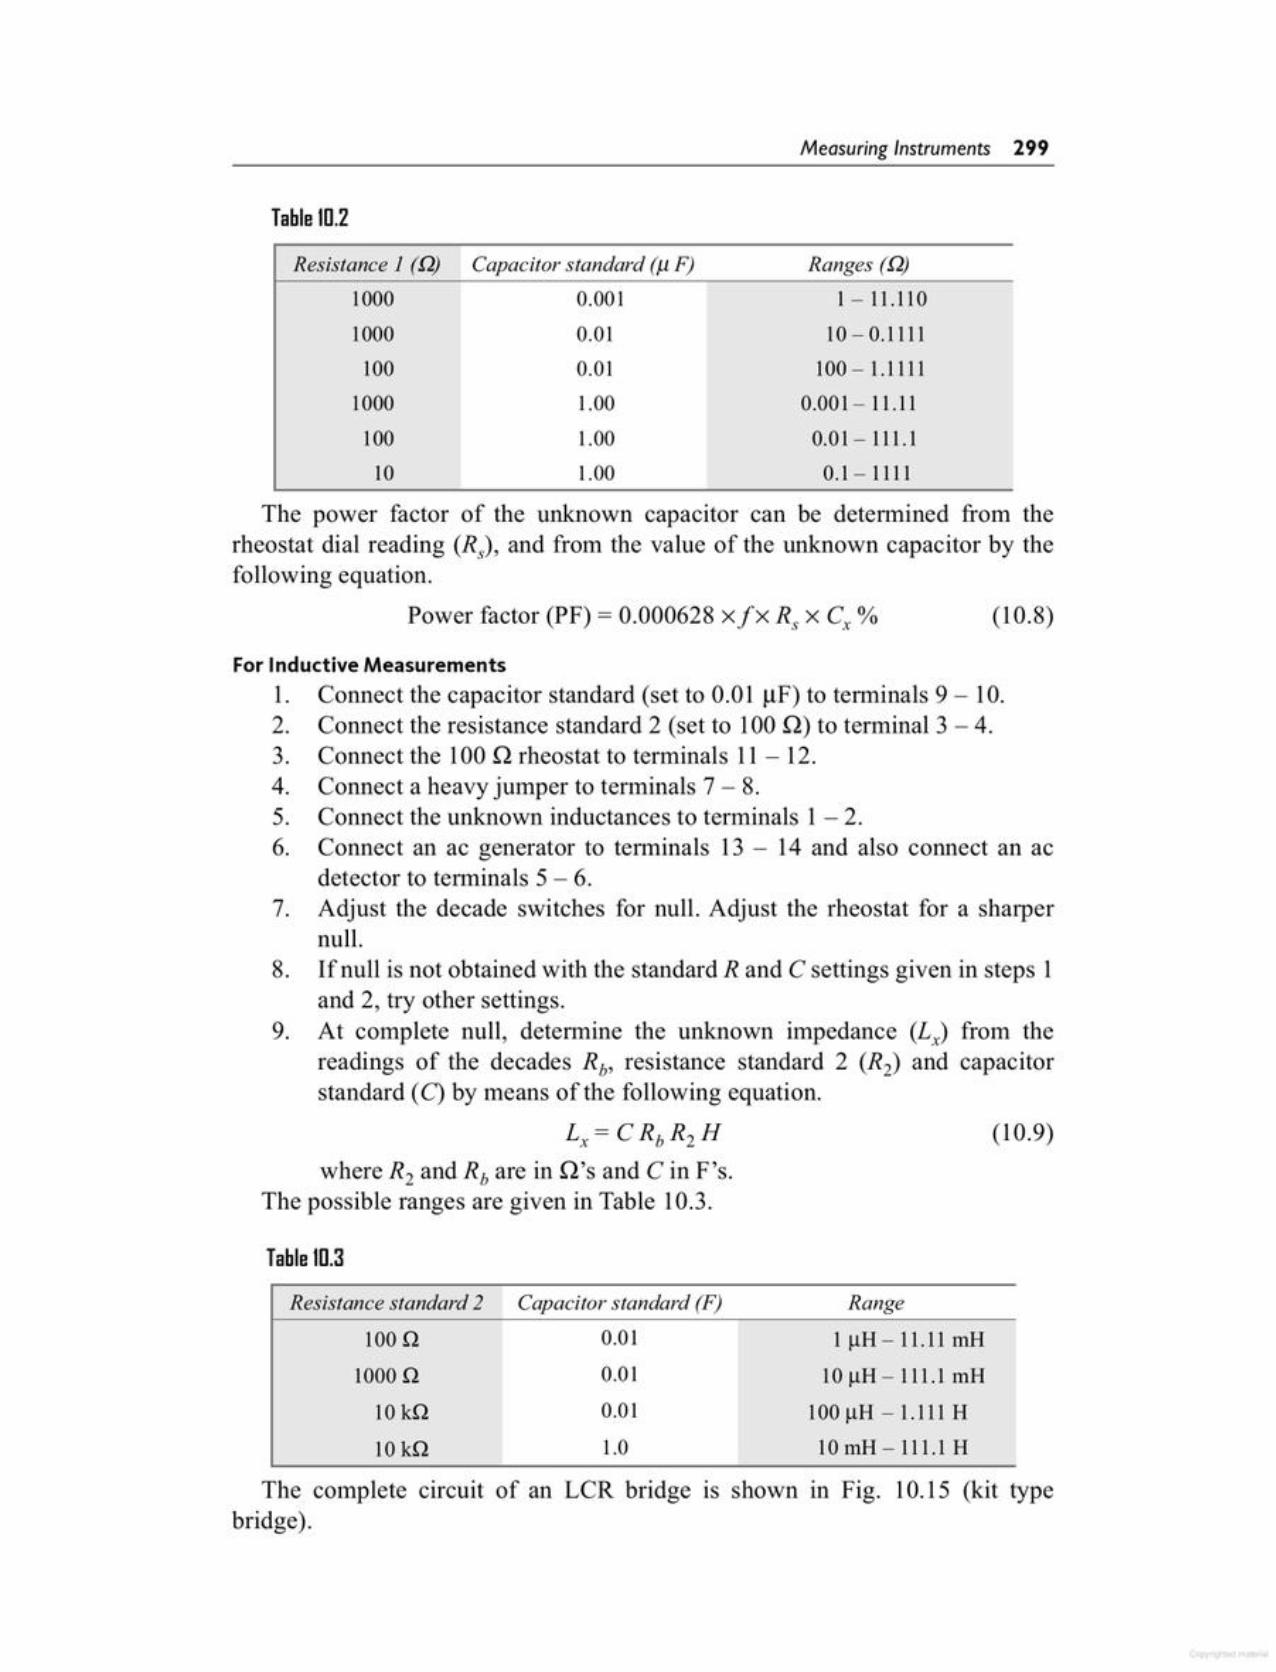
The complete circuit of an LCR bridge is shown in Fig. 10.15 (kit typebridge).
IIlH-l1.11 mH
10 IlH - 111.1 111H
100 IlH - 1.111H101nH-111.1 H
100.Q 0.01
1000.Q 0.01
10 k.Q 0.01
10k.Q 1.0
RangeResistance standard 2 Capacitor standard (F)
Table ID.3
For Inductive Measurementsl. Connect the capacitor standard (set to 0.01 j..LF)to terminals 9 - 10.2. Connect the resistance standard 2 (set to 100 Q) to terminal 3 - 4.3. Connect the 100 Q rheostat to terminals 11 -12.4. Connect a heavy jumper to terminals 7 - 8.5. Connect the unknown inductances to terminals 1 - 2.6. Connect an ac generator to terminals 13 - 14 and also connect an ac
detector to terminals 5 - 6.7. Adjust the decade switches for null. Adjust the rheostat for a sharper
null.8. Ifnull is not obtained with the standard Rand e settings given in steps 1
and 2, try other settings.9. At complete nun, determine the unknown impedance (Lx) from the
readings of the decades Rb, resistance standard 2 (R2) and capacitorstandard (C) by means of the following equation.
i,= es, R2 H (10.9)where R2 and s, are in Q's and e in F's.
The possible ranges are given in Table 10.3.
The power factor of the unknown capacitor can be determined from therheostat dial reading (Rs), and from the value of the unknown capacitor by thefollowing equation.
Power factor (PF) = 0.000628 xfx R, x ex % (10.8)
Table ID.2
Resistance 1 (.Q) Capacitor standard (1£ F) Ranges (.Q)1000 0.001 1- 11.110
1000 0.01 10-0.1111100 0.01 100- 1.11111000 1.00 0.001-11.11
100 1.00 0.01-111.110 1.00 0.1-1111
Measuring Instruments 299

A wide range of resistance (ac and de), inductance and capacitancemeasurements can be done using a Kit type impedance bridge.
This bridge measures inductance (L) from 1 IlH - 100 H, capacitance (C)from 10 IlIlF - 100 IlF, resistance (R) from 0.01 Qs - 10 MQ, dissipation factor(D) from 0.001 -1 and Q from 1- 1000. Resistance, capacitance and inductanceunits are read directly on the same dial scale, graduated 0 - 1, and are multipliedby settings of a multiplier switch.
Referring to Fig. 10.15, six inductance ranges are provided(i) 10-1001lH (ii) 501lH-10mH
(iii) 0.5 - 100 mR (iv) 5 lTIH- 1 H(v) 50 mR - 10 R (vi) 0.5 - 100 R
These ranges include all common inductances of coils of all types employedin electronics.
Also eight resistance ranges are provided.(i) 0.01 - 1Q (ii) 0.05 - 10 Q
(iii) 0.5 - 100 Q (iv) 5 - 1000 Q(v) 50 - 10,000 Q (vi) 500 - 100,000 Q
(vii) 5,000 - 1MQ (viii) 50,000 - 10 MQThere are six capacitance ranges provided:
(i) 10 - 1000 IlIlF (ii) 50 IlIlF - 0.01 IlF(iii) 0.0005 - 0.1 IlF (iv) 0.005 - 11lF(v) 0.05 - 10 IlF (vi) 0.5 - 100 IlF
The two pole, eight position Multiplier Switch sets the bridge to the desired R,Cor L range. This switch cuts the various precision resistors, R I to R9 in or out ofthe circuit. The dial settings of the multiplier switch show the various R, C and Lfactors by which the settings of the main control dial must be multiplied to obtainthe correct value of the component under test.
The function of the Detector Switch is to connect an appropriate null detectoracross the bridge output terminals. When this switch is thrown to its externalposition, the two terminals labelled external detector are connected across thebridge output, and an external null detector may be connected to these terminals.(Satisfactory external detectors are high resistance headphones, ac VTVMs,oscilloscopes, sensitive centre zero de galvanometers, etc.). The galvanometer isused only in resistance measurements when the internal 6 V battery (or a highervoltage external battery) is used to power the bridge.
When the detector switch is thrown to its galvanometer position, the selfcontained centre zero (100 - 0 - 100) de microammeter is connected, as a denull detector across the bridge output. When the detector switch is thrown to itsshunted galvanometer position, the micro ammeter is connected across the bridgeoutput, but in parallel with the 100 Q resistor RIO. This resistor decreases themicro ammeter sensitivity and acts to prevent meter damage when an unknownresistance is first checked.
Two self contained bridge power (signal) sources are employed. One isa General Radio 1000 Hz oscillator (an electromechanical type of oscillator)
300 Electronic Instrumentation
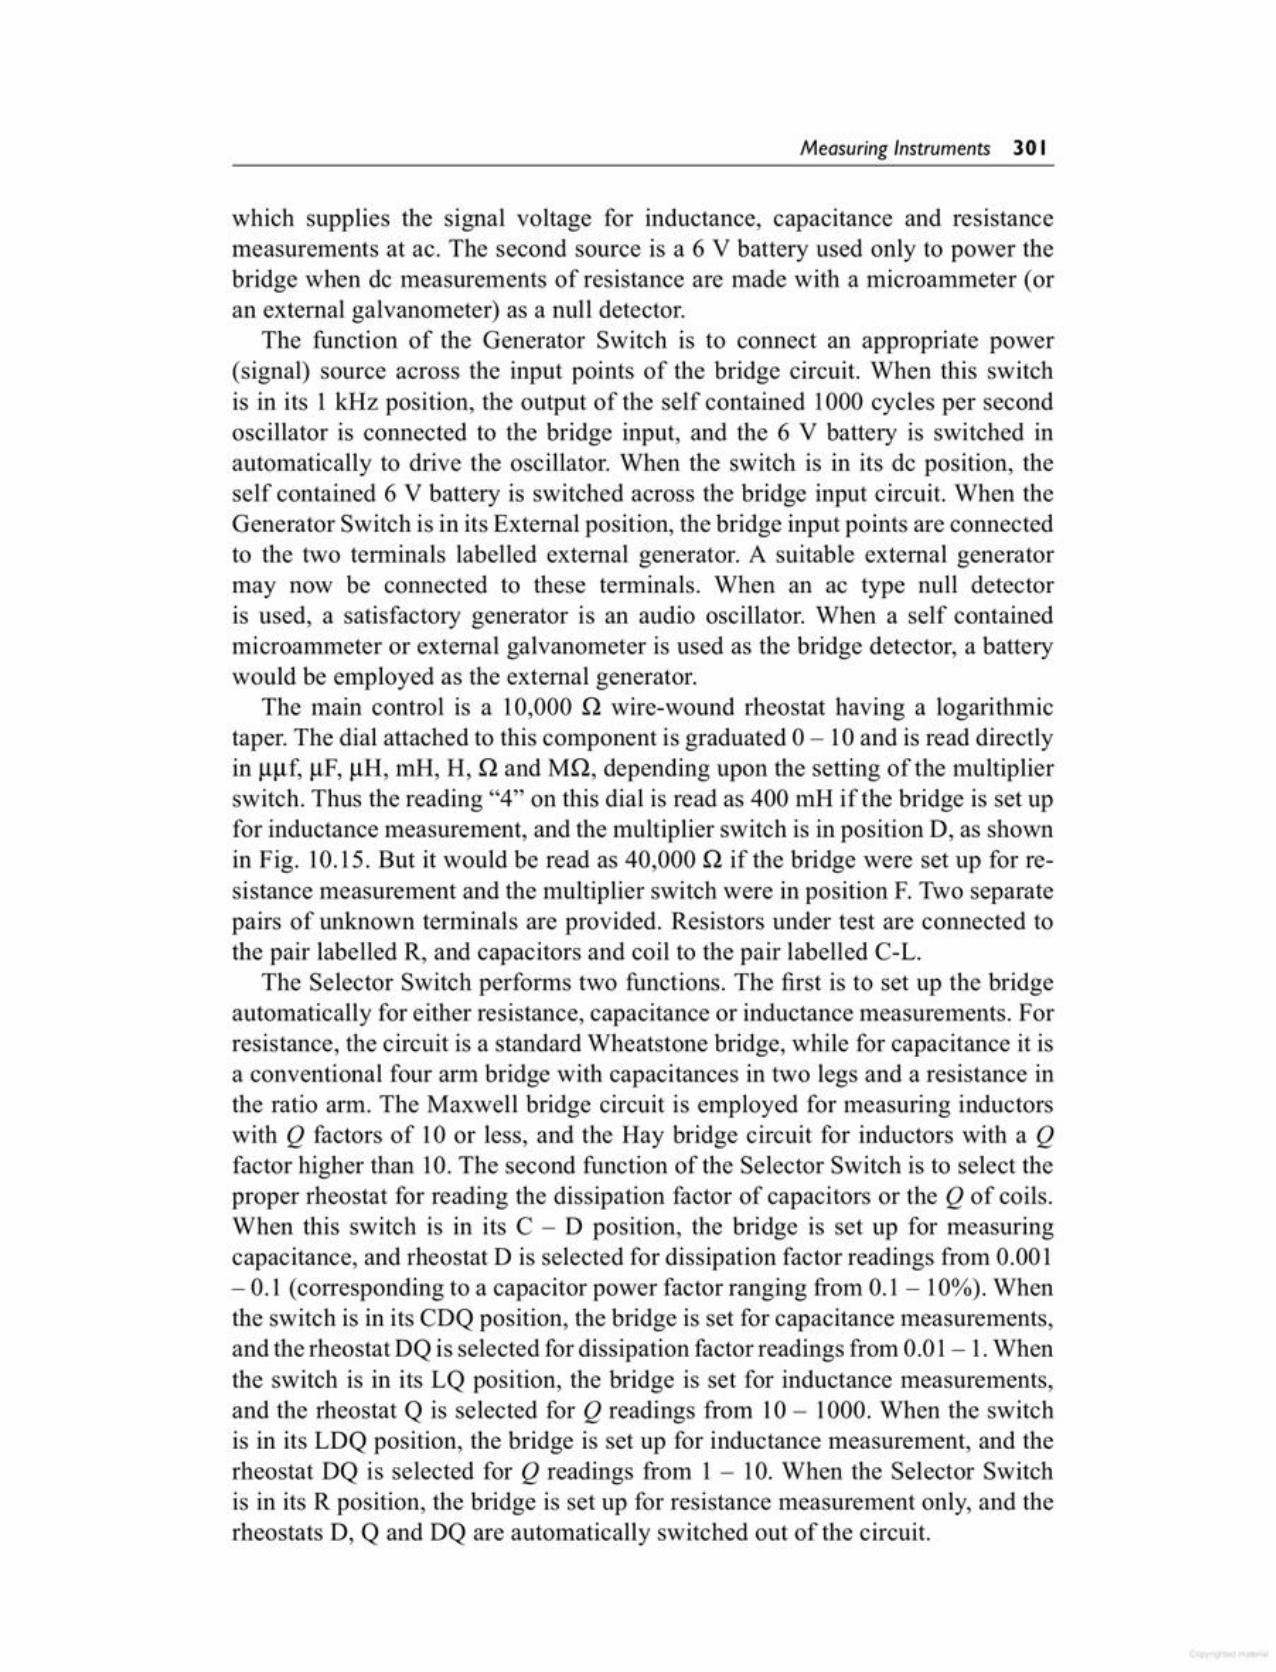
which supplies the signal voltage for inductance, capacitance and resistancemeasurements at ac. The second source is a 6 V battery used only to power thebridge when de measurements of resistance are made with a microammeter (oran external galvanometer) as a null detector.
The function of the Generator Switch is to connect an appropriate power(signal) source across the input points of the bridge circuit. When this switchis in its 1 kHz position, the output of the self contained 1000 cycles per secondoscillator is connected to the bridge input, and the 6 V battery is switched inautomatically to drive the oscillator. When the switch is in its de position, theself contained 6 V battery is switched across the bridge input circuit. When theGenerator Switch is in its External position, the bridge input points are connectedto the two terminals labelled external generator. A suitable external generatormay now be connected to these terminals. When an ac type null detectoris used, a satisfactory generator is an audio oscillator. When a self containedmicroammeter or external galvanometer is used as the bridge detector, a batterywould be employed as the external generator.
The main control is a 10,000 Q wire-wound rheostat having a logarithmictaper. The dial attached to this component is graduated 0 - 10 and is read directlyin uuf, IlF, IlR, ml-l, R, Q and MQ, depending upon the setting of the multiplierswitch. Thus the reading "4" on this dial is read as 400 mR if the bridge is set upfor inductance measurement, and the multiplier switch is in position D, as shownin Fig. 10.15. But it would be read as 40,000 Q if the bridge were set up for resistance measurement and the multiplier switch were in position F. Two separatepairs of unknown terminals are provided. Resistors under test are connected tothe pair labelled R, and capacitors and coil to the pair labelled C-L.
The Selector Switch performs two functions. The first is to set up the bridgeautomatically for either resistance, capacitance or inductance measurements. Forresistance, the circuit is a standard Wheatstone bridge, while for capacitance it isa conventional four arm bridge with capacitances in two legs and a resistance inthe ratio arm. The Maxwell bridge circuit is employed for measuring inductorswith Q factors of 10 or less, and the Hay bridge circuit for inductors with a Qfactor higher than 10. The second function of the Selector Switch is to select theproper rheostat for reading the dissipation factor of capacitors or the Q of coils.When this switch is in its C - D position, the bridge is set up for measuringcapacitance, and rheostat D is selected for dissipation factor readings from 0.001- 0.1 (corresponding to a capacitor power factor ranging from 0.1 - 10%). Whenthe switch is in its CDQ position, the bridge is set for capacitance measurements,and the rheostat DQ is selected for dissipation factor readings from 0.0 1- 1.Whenthe switch is in its LQ position, the bridge is set for inductance measurements,and the rheostat Q is selected for Q readings from 10 - 1000. When the switchis in its LDQ position, the bridge is set up for inductance measurement, and therheostat DQ is selected for Q readings from 1 - 10. When the Selector Switchis in its R position, the bridge is set up for resistance measurement only, and therheostats D, Q and DQ are automatically switched out of the circuit.
Measuring Instruments 30 I
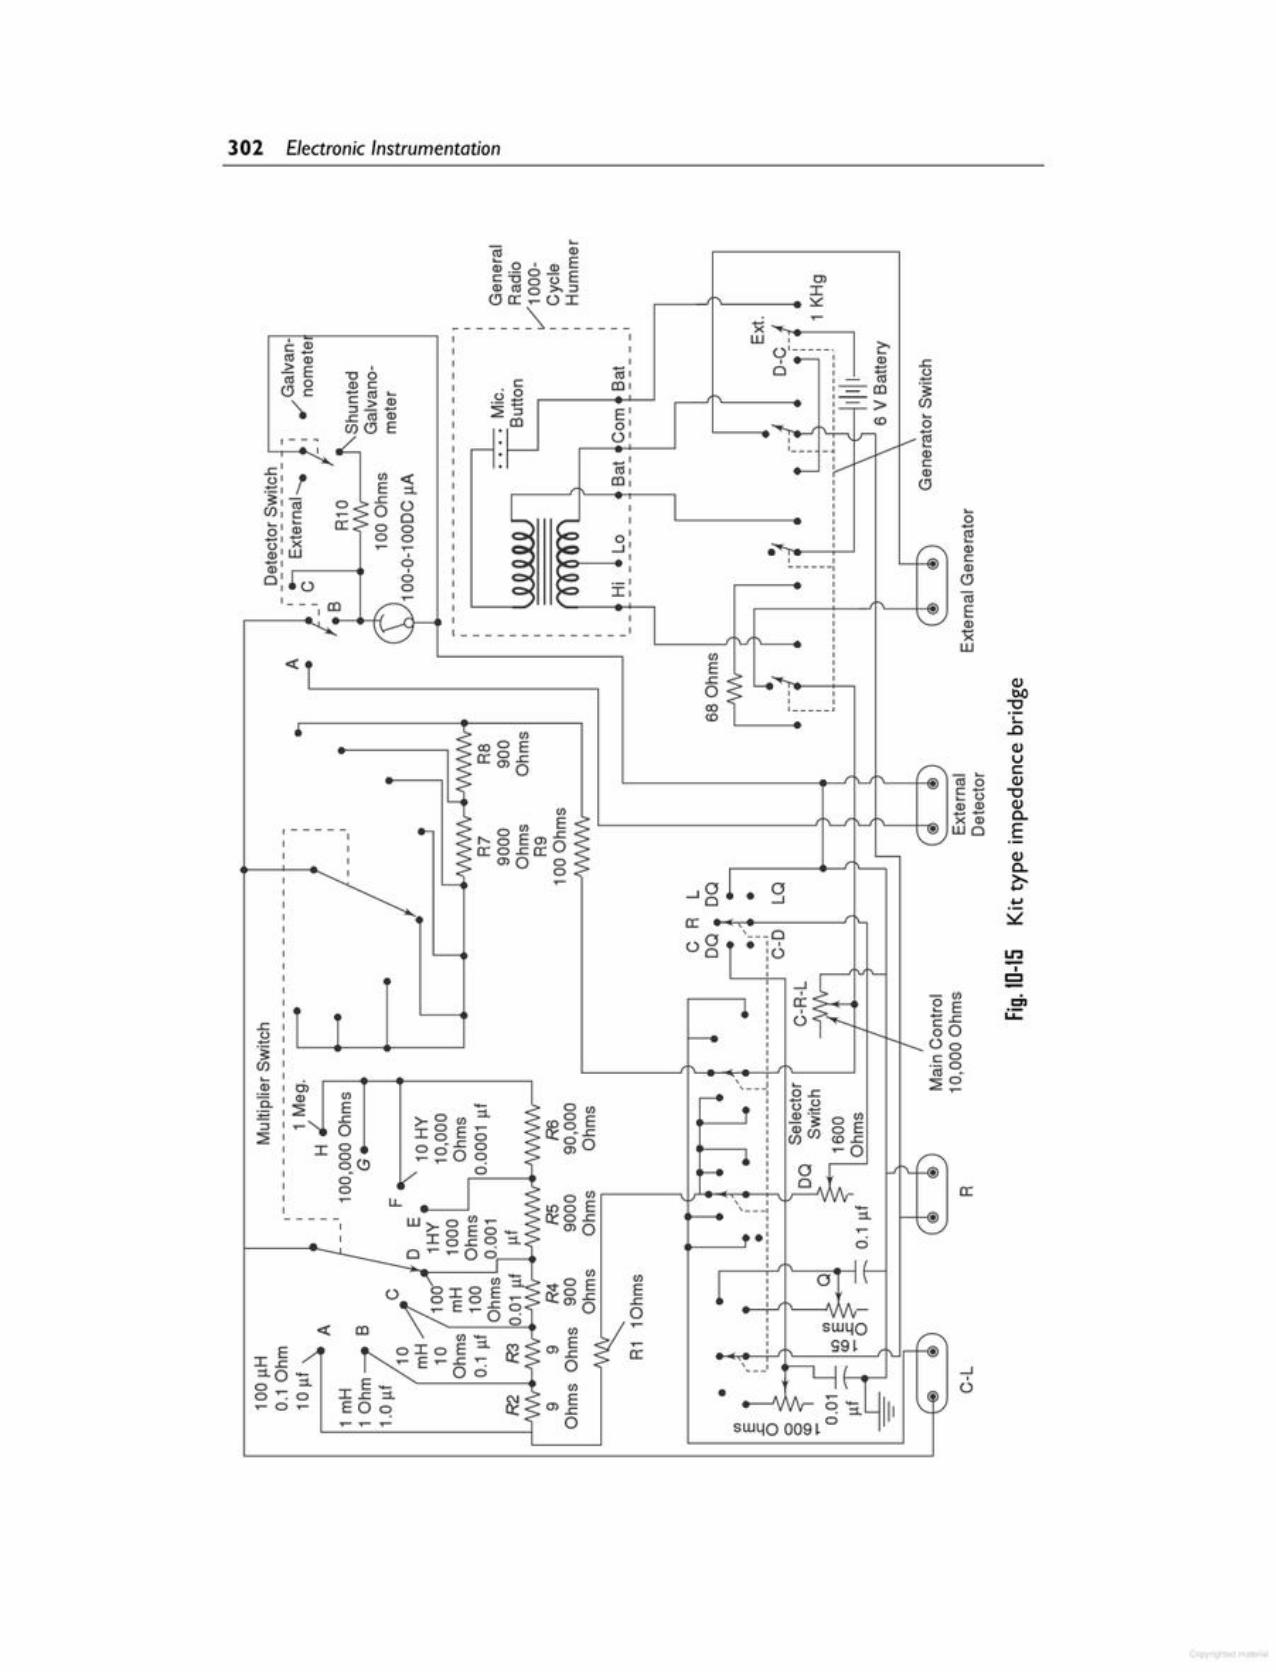
....Io
(j) o'-I-'
•
•a:
Q)b()
",_..0Q)U.... c:
iii 0 Q)c- "....0al al Q)-- o,x alLLJO E
Q)a..~....~
Ln-I52
Ul enE u::::s:00000~
....o~
~~~ al
CJ<'IIEalXW
..co-~
• ' 0 A ['-:!I--..(-'• ·VVV C! ~I....IIISW40 009~0
0"a :r
o
....o..c'OB..<J!'~ 0 Ulal(f)oE(f) <D s:
~Oa°..A'L,vvv _
::1.
rn
Cl Ulal:2 E~'-, s:
0J: 0
~(!)00~
....ala.E::I::2
S~'4099~
oo.:o,oooo
'---0• 0 0:()
oo
L,....---- .........rf'---
....I01. ao ....I
1'-'
--UlE..c~0>co<D
,,1 -
,------
~
;B J~----. I eI : Q)
o : _ ~::=m:-,- >o ....
~..... 0 <D 0L.___ .....;.. 0 r-« I ~ (ii
, Vr ....'-:_-~V ~
CJ
•,----- ,,
~TL- -,
,-------- 1
~ ~o
oo
oo~
:B f.~ <'II(f) c.... ....o al- xlil LLJ-alo ~()
- - -, m-H1"_...()--+'0
,(ii,
c m,00._ :::::2::1 E'rn 0'· ()'·c- ·I--· _,
<'II,m,
[ ,~
,~
0'~ ....I'
~
,
~
,._,C> I,
o alc_<'II CIl>E<'II 0CJc\,
....<'II al-0' mEal._ 0 - Ec-Oooal<'llo>'::1CJa:~()I
-----~-------
302 Electronic Instrumentation
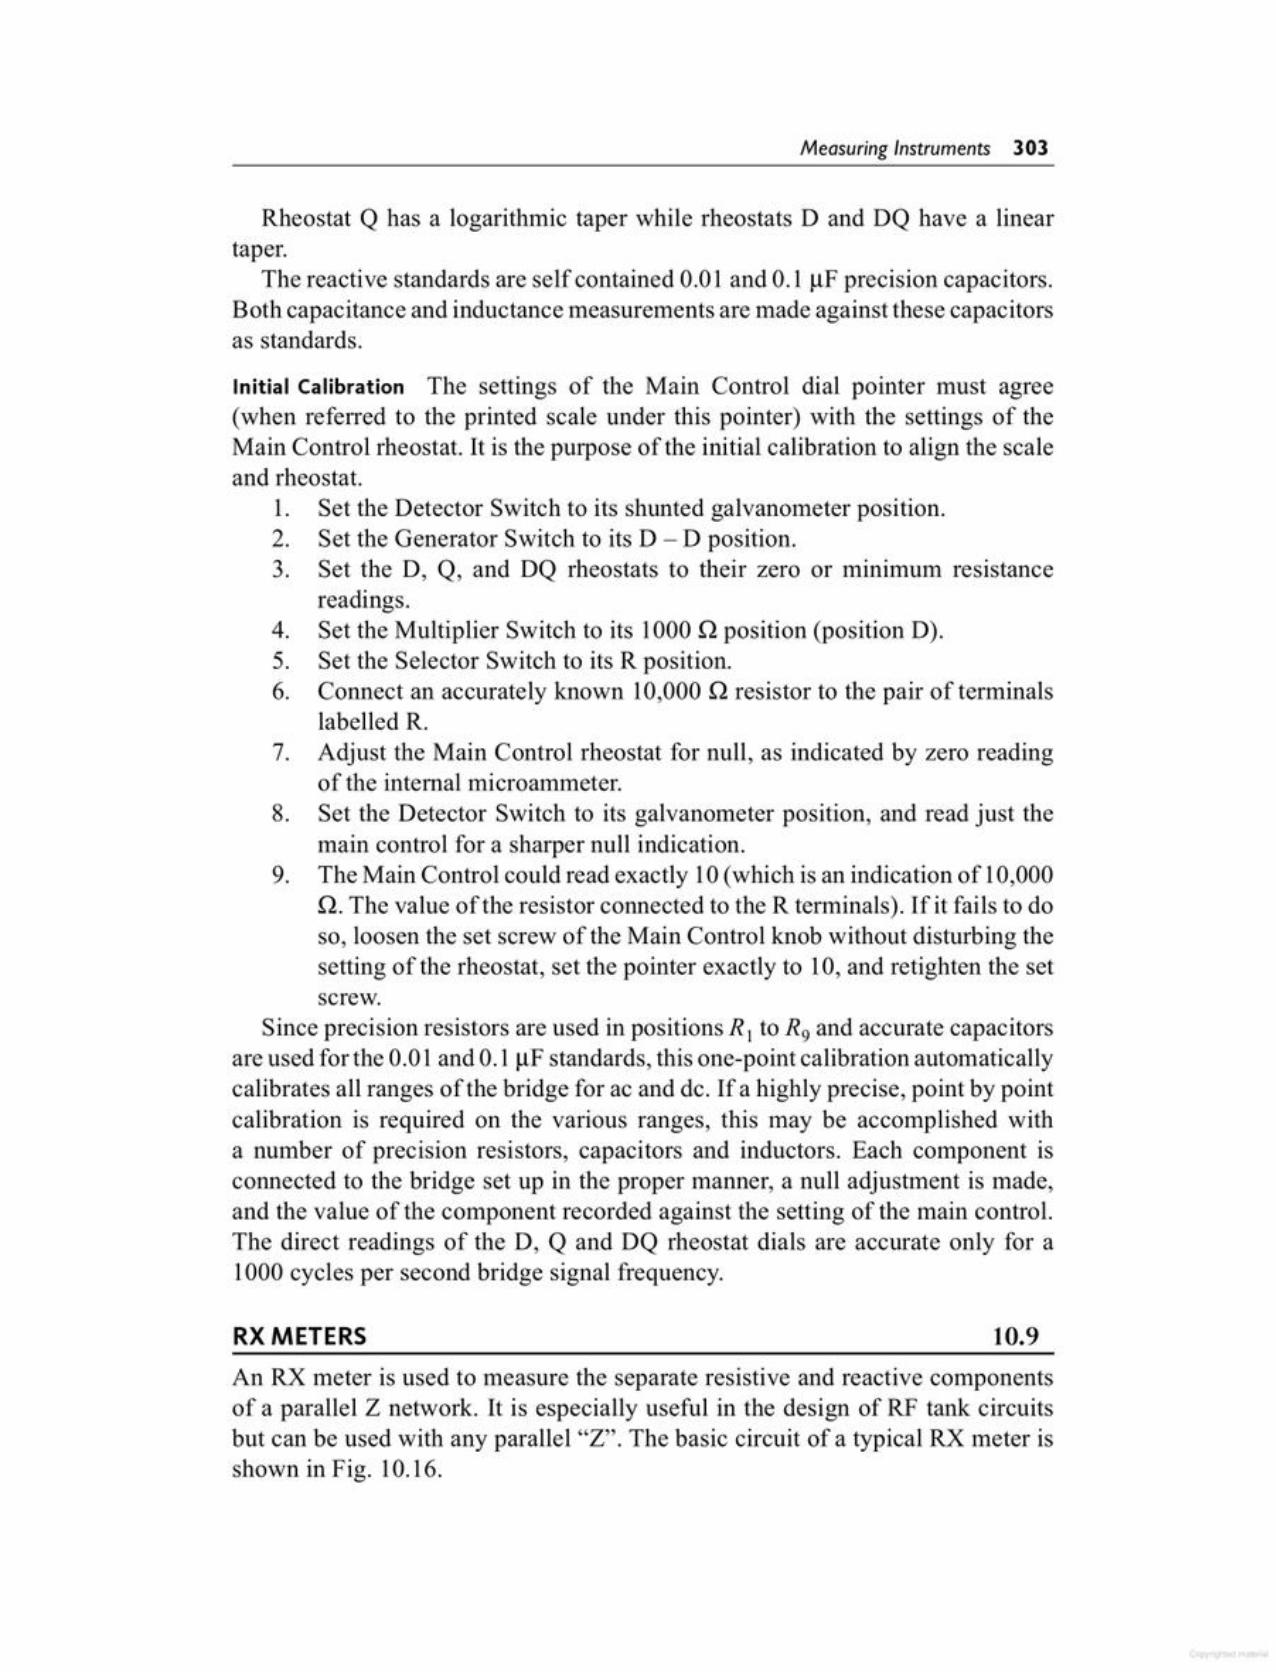
An RX meter is used to measure the separate resistive and reactive componentsof a parallel Z network. It is especially useful in the design of RF tank circuitsbut can be used with any parallel "Z". The basic circuit of a typical RX meter isshown in Fig. 10.16.
10.9RXMETERS
Initial Calibration The settings of the Main Control dial pointer must agree(when referred to the printed scale under this pointer) with the settings of theMain Control rheostat. It is the purpose of the initial calibration to align the scaleand rheostat.
1. Set the Detector Switch to its shunted galvanometer position.2. Set the Generator Switch to its D - D position.3. Set the D, Q, and DQ rheostats to their zero or minimum resistance
readings.4. Set the Multiplier Switch to its 1000 Q position (position D).5. Set the Selector Switch to its R position.6. Connect an accurately known 10,000 Q resistor to the pair of terminals
labelled R.7. Adjust the Main Control rheostat for null, as indicated by zero reading
of the internal microammeter.8. Set the Detector Switch to its galvanometer position, and read just the
main control for a sharper null indication.9. The Main Control could read exactly 10 (which is an indication of 10,000
Q. The value of the resistor connected to the R terminals), If it fails to doso, loosen the set screw of the Main Control knob without disturbing thesetting of the rheostat, set the pointer exactly to 10, and retighten the setscrew.
Since precision resistors are used in positions R 1 to R9 and accurate capacitorsare used for the 0.01 and O.IIlF standards, this one-point calibration automaticallycalibrates all ranges of the bridge for ac and de. If a highly precise, point by pointcalibration is required on the various ranges, this may be accomplished witha number of precision resistors, capacitors and inductors. Each component isconnected to the bridge set up in the proper manner, a null adjustment is made,and the value of the component recorded against the setting of the main control.The direct readings of the D, Q and DQ rheostat dials are accurate only for a1000 cycles per second bridge signal frequency.
Rheostat Q has a logarithmic taper while rheostats D and DQ have a lineartaper.
The reactive standards are self contained 0.01 and 0.1 IlF precision capacitors.Both capacitance and inductance measurements are made against these capacitorsas standards.
Measuring Instruments 303
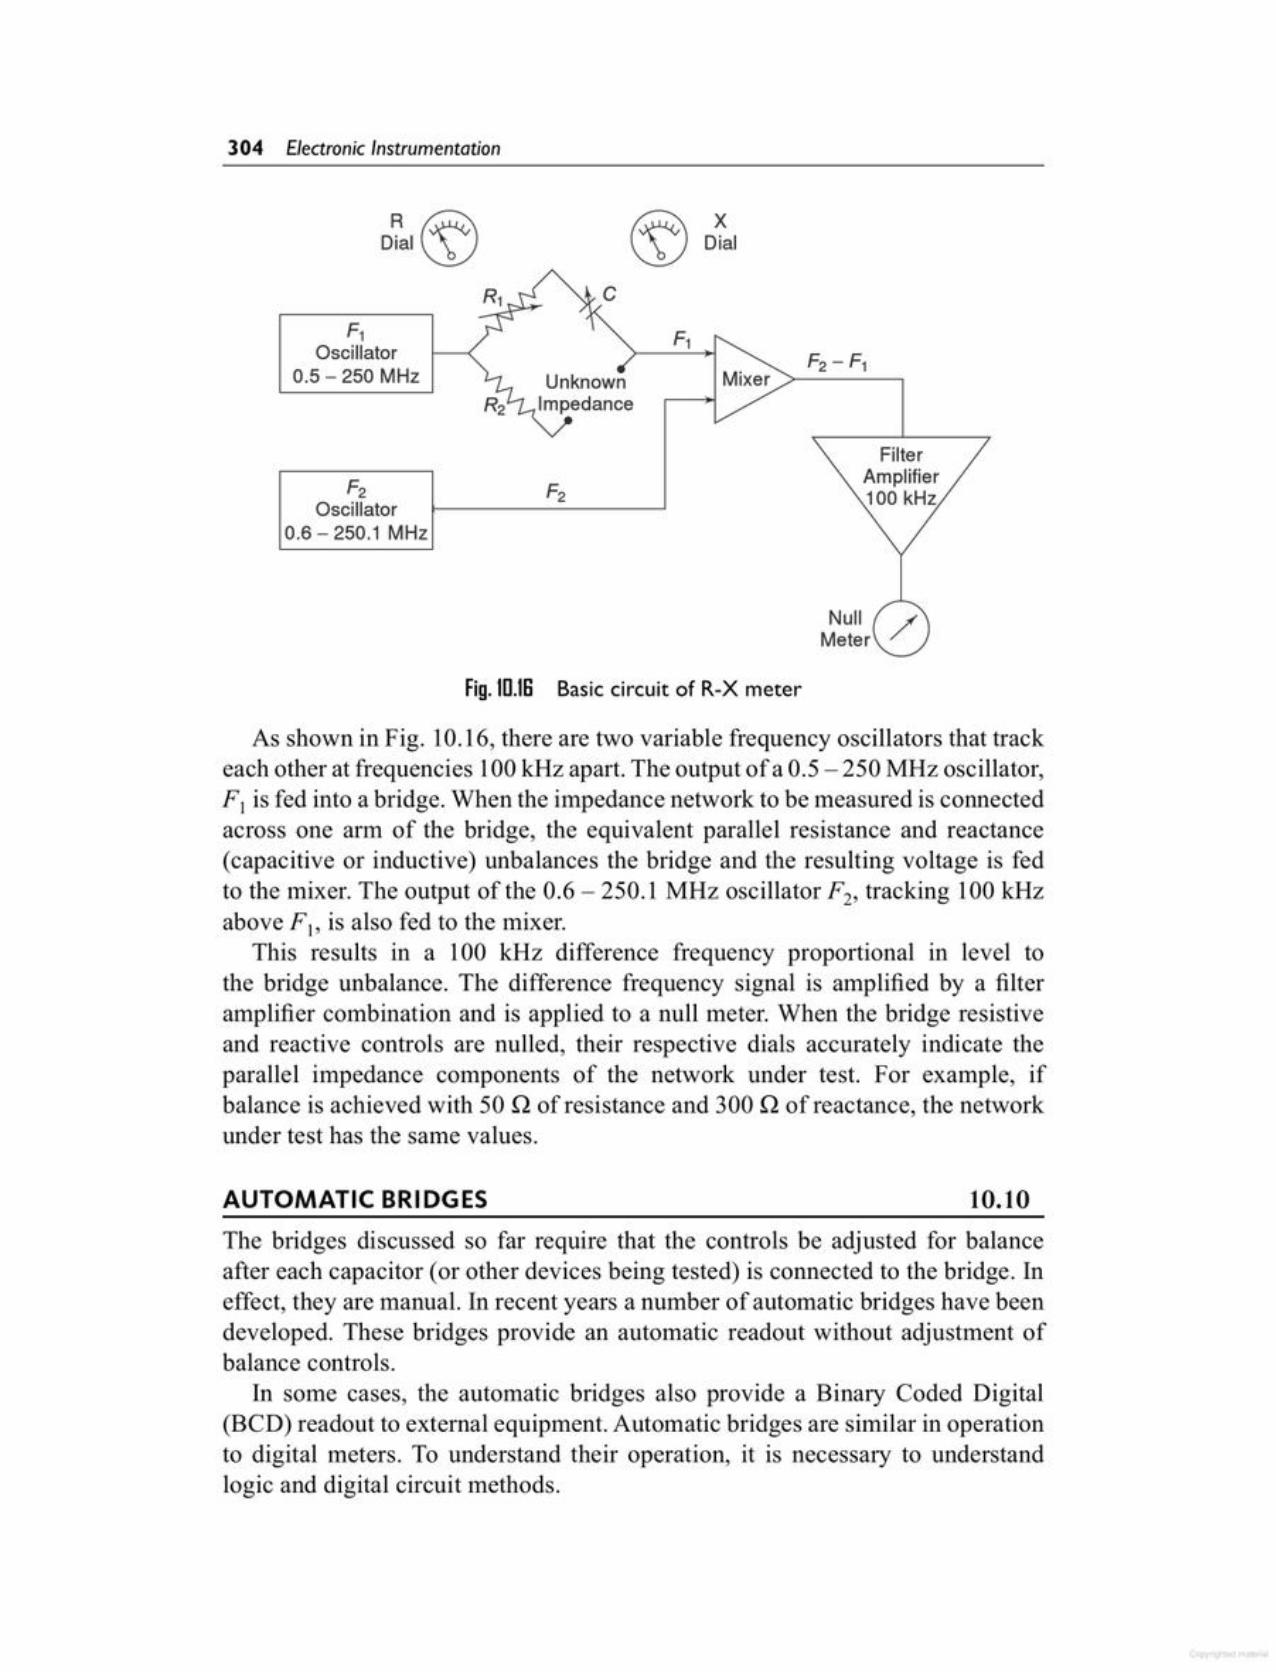
The bridges discussed so far require that the controls be adjusted for balanceafter each capacitor (or other devices being tested) is connected to the bridge. Ineffect, they are manual. In recent years a number of automatic bridges have beendeveloped. These bridges provide an automatic readout without adjustment ofbalance controls.
In some cases, the automatic bridges also provide a Binary Coded Digital(BCD) readout to external equipment. Automatic bridges are similar in operationto digital meters. To understand their operation, it is necessary to understandlogic and digital circuit methods.
10.10AUTOMATIC BRIDGES
As shown in Fig. 10.16, there are two variable frequency oscillators that trackeach other at frequencies 100 kHz apart. The output of a 0.5 - 250 MHz oscillator,FI is fed into a bridge. When the impedance network to be measured is connectedacross one arm of the bridge, the equivalent parallel resistance and reactance(capacitive or inductive) unbalances the bridge and the resulting voltage is fedto the mixer. The output of the 0.6 - 250.1 MHz oscillator F2, tracking 100 kHzabove FI, is also fed to the mixer.
This results in a 100 kHz difference frequency proportional in level tothe bridge unbalance. The difference frequency signal is amplified by a filteramplifier combination and is applied to a null meter. When the bridge resistiveand reactive controls are nulled, their respective dials accurately indicate theparallel impedance components of the network under test. For example, ifbalance is achieved with 50 Q of resistance and 300 Q of reactance, the networkunder test has the same values.
Fig.ID.1S Basic circuit of R-X meter
NullMeter
FilterAmplifier100 kHzF2
Oscillator0.6 - 250.1 MHz
UnknownImpedance
cFj
Oscillator0.5 - 250 MHz
XDial
304 Electronic Instrumentation
The term transistor tester (or analyser) used in this text is for instruments givingquantative measurements of transistor parameters. The tester should be able toprovide direct readings for atleast two important measurements, such as:
1. A value for the forward gain in the common emitter configuration (hp£for ac gain or hp£ for de gain), that is f3 gain.
2. A value for collector to base leakage current, with emitter open lebo.The latter measurement of C to B reverse current is generally regarded as most
significant to test for the ageing of a transistor. It is an comparatively difficultmeasurement because of the small currents involved (in IlA), and because of itsextreme temperature sensitivity.
10.11TRANSISTOR TESTER
This information is used by a decade counter that controls the voltage on thestandard capacitor through electronic switching circuits. The counter then countsin the direction which minimises the error signal, until a balance is reached. Atbalance, the value of the unknown is displayed on an in-line digital readout thatindicates capacitance. This information is also presented in BCD form for usewith printers and other data handling equipments.
Fig. 1D.17 Typical automatic bridge circuit
UnknownCx
PhaseDetector
C
Logic,.,I
Digital>=---1 Switching ~>-I
Circuits
Standard
VisualReadout
DJ[g][1][1]
~ ReversibleCounter
...
Clock Pulses
IIIIIIIIIII1--------------------------------------IIIIIII
A typical automatic bridge circuit is shown in Fig. 10.17. The circuit istransformer-ratio-arm bridge for the automatic measurement of capacity. Thecircuit is in balance when the currents through the standard capacitor and theunknown capacitor are equal, so that the current in the phase detector is zero.The range is chosen automatically by relays that select decade taps on the ratiotransformer. The phase detector determines whether the current passing throughthe unknown arm, of the bridge is higher or lower than that through the standardarm and produces an error signal that indicates whether more or less voltage isrequired on the standard capacitor to reach a balance.
Measuring Instruments 305
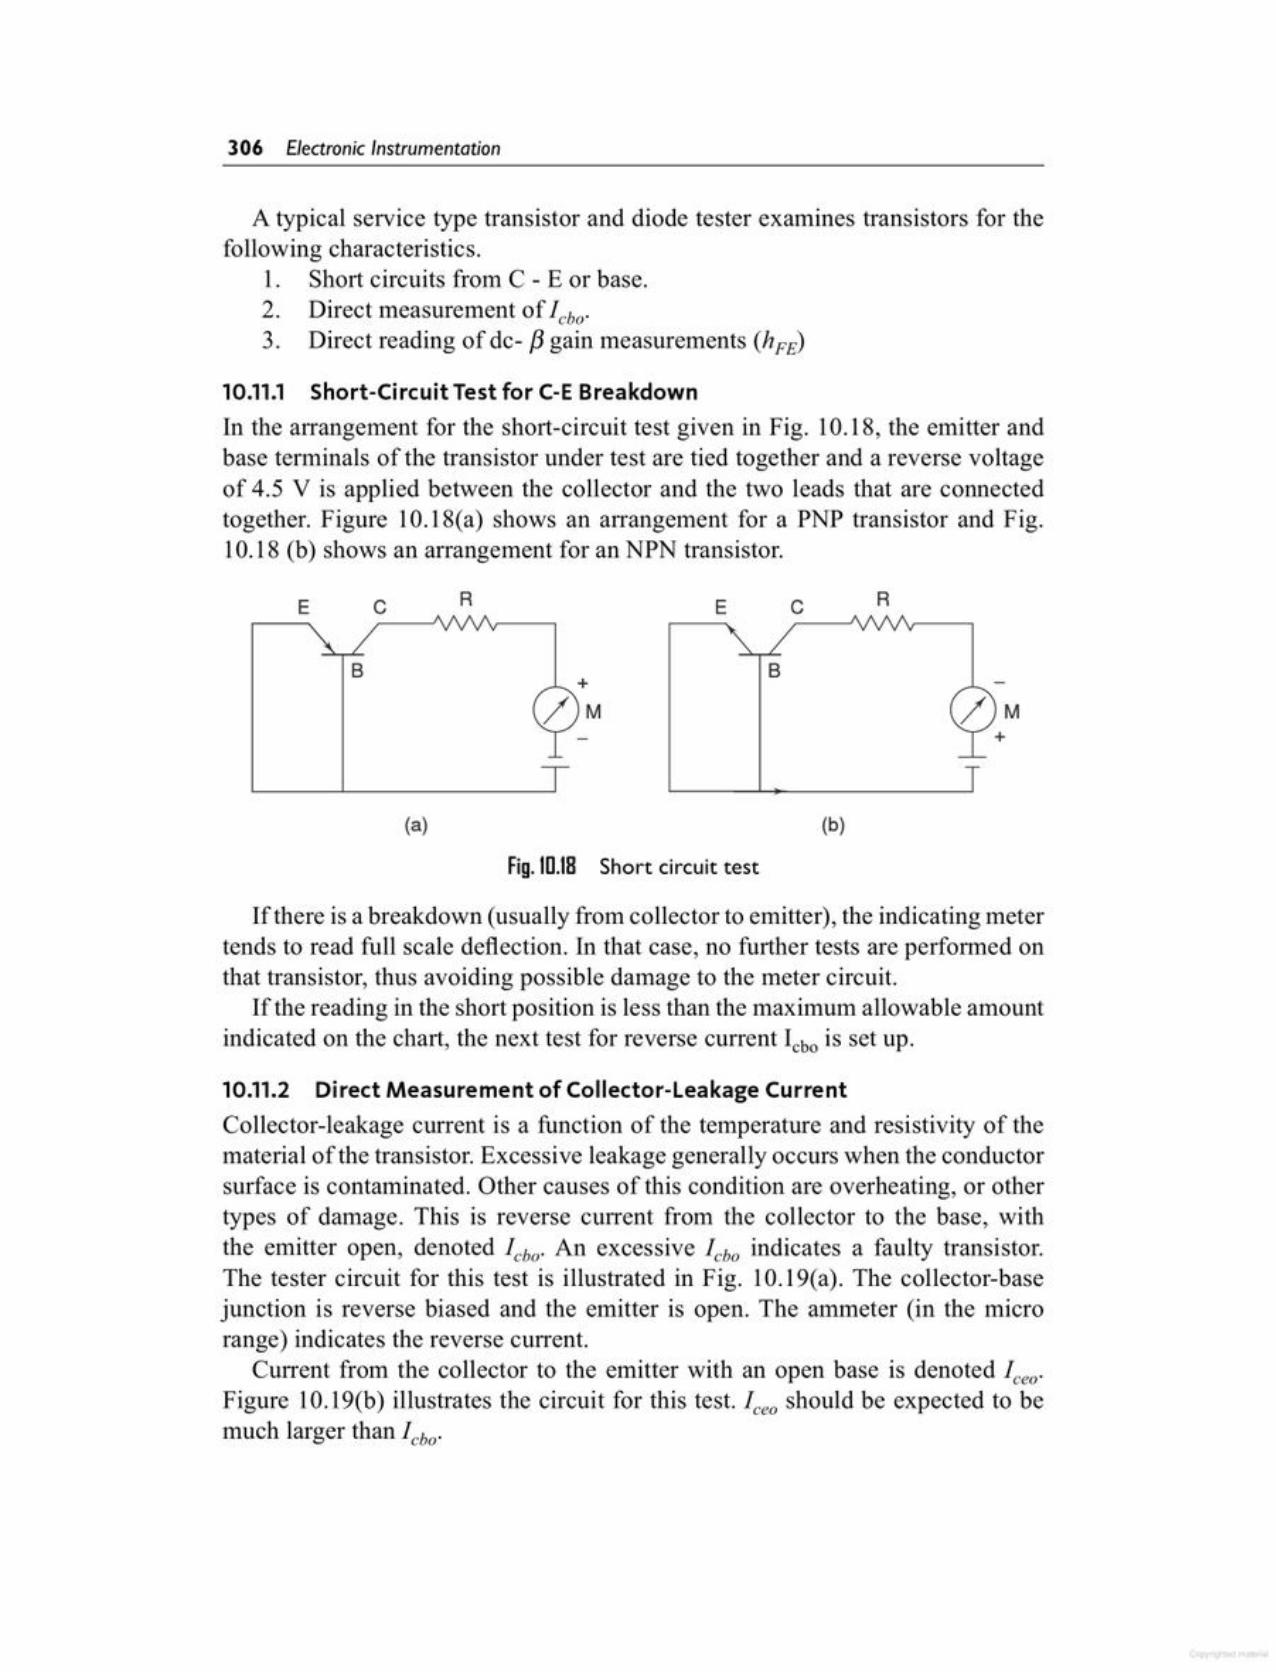
10.11.2 Direct Measurement of Collector-Leakage CurrentCollector-leakage current is a function of the temperature and resistivity of thematerial of the transistor. Excessive leakage generally occurs when the conductorsurface is contaminated. Other causes of this condition are overheating, or othertypes of damage. This is reverse current from the collector to the base, withthe emitter open, denoted lebo. An excessive lebo indicates a faulty transistor.The tester circuit for this test is illustrated in Fig. 10.19(a). The collector-basejunction is reverse biased and the emitter is open. The ammeter (in the microrange) indicates the reverse current.
Current from the collector to the emitter with an open base is denoted leeo.Figure 10.19(b) illustrates the circuit for this test. leeo should be expected to bemuch larger than lebo.
If there is a breakdown (usually from collector to emitter), the indicating metertends to read full scale deflection. In that case, no further tests are performed onthat transistor, thus avoiding possible damage to the meter circuit.
lfthe reading in the short position is less than the maximum allowable amountindicated on the chart, the next test for reverse current lebois set up.
Fig.1[1.18 Short circuit test
(b)(a)
BB
RcERcE
A typical service type transistor and diode tester examines transistors for thefollowing characteristics.
1. Short circuits from C - E or base.2. Direct measurement of lebo.3. Direct reading of de- f3 gain measurements (hpE)
10.11.1 Short-Circuit Test for C-E BreakdownIn the arrangement for the short-circuit test given in Fig. 10.18, the emitter andbase terminals of the transistor under test are tied together and a reverse voltageof 4.5 V is applied between the collector and the two leads that are connectedtogether. Figure 10.18(a) shows an arrangement for a PNP transistor and Fig.10.18 (b) shows an arrangement for an NPN transistor.
306 Electronic Instrumentation
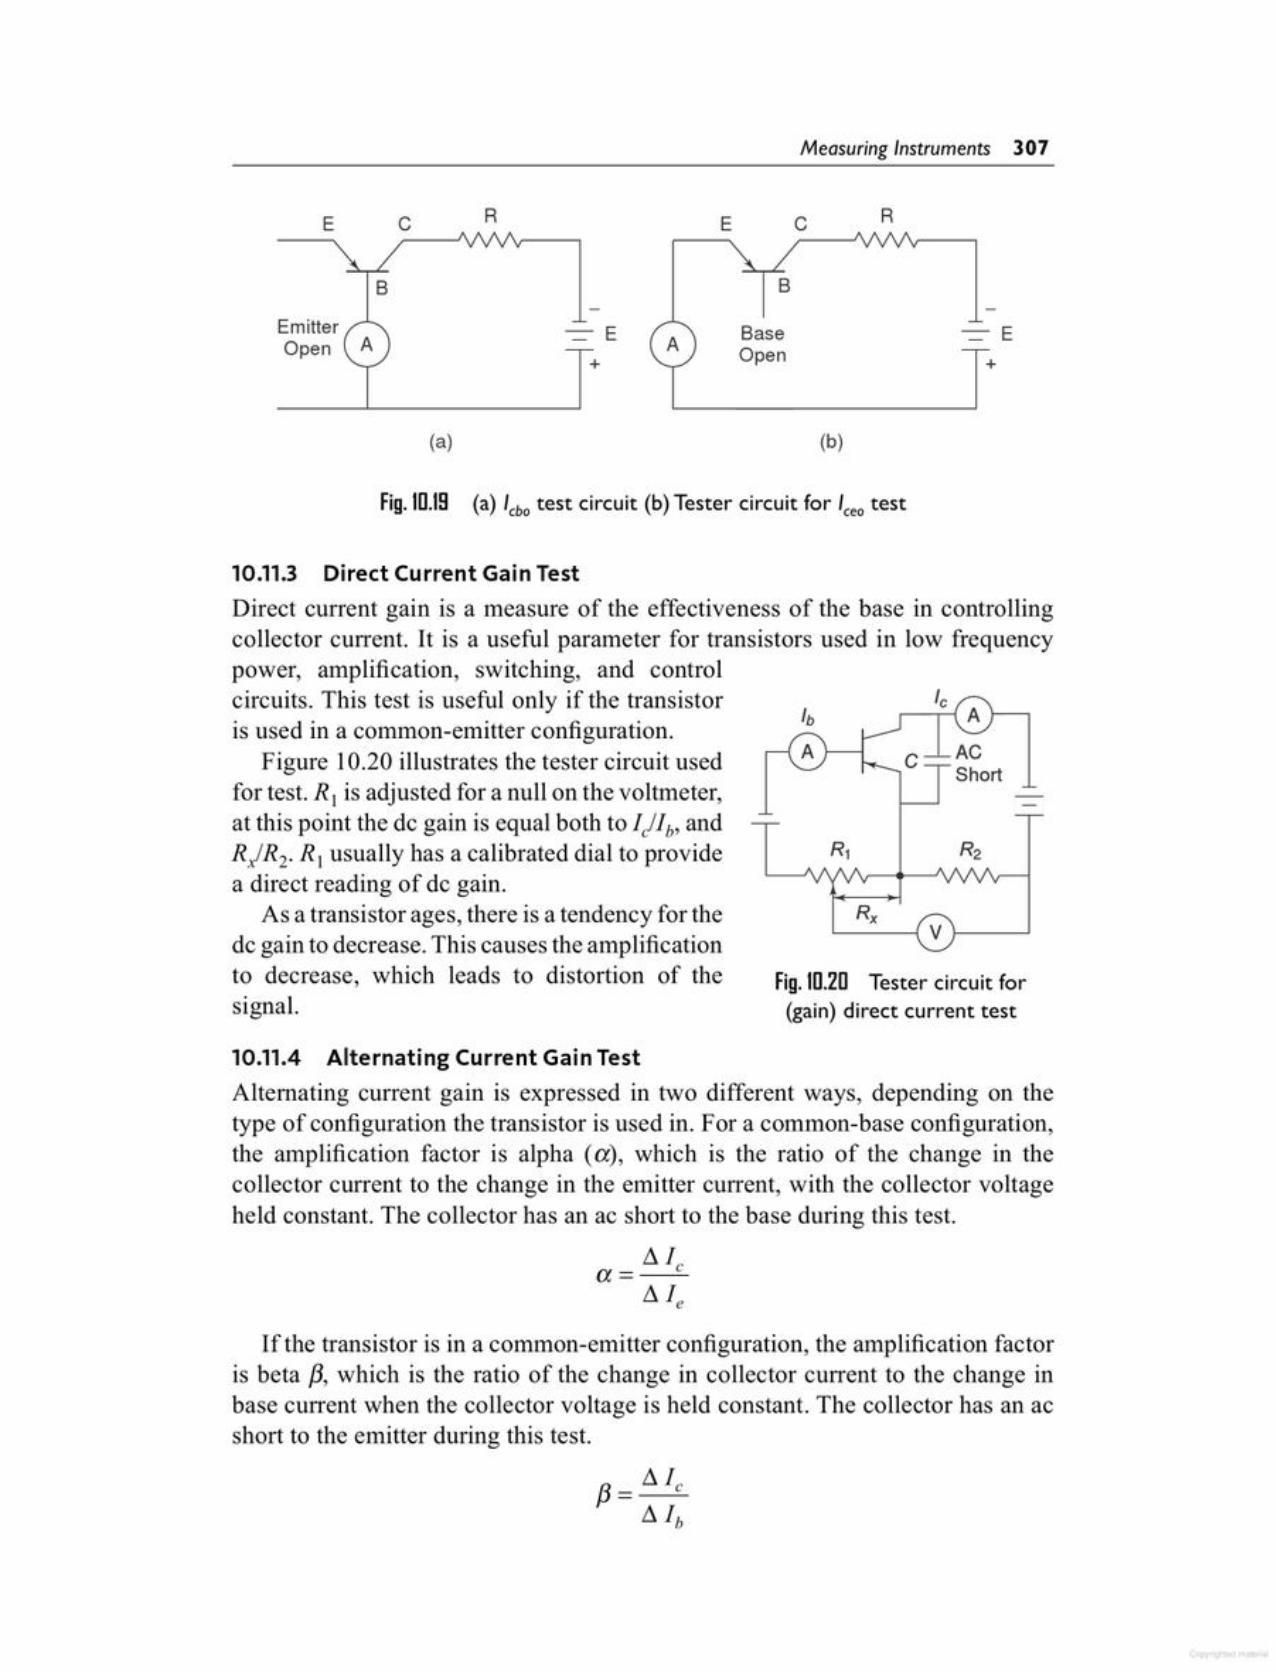
If the transistor is in a common-emitter configuration, the amplification factoris beta {3, which is the ratio of the change in collector current to the change inbase current when the collector voltage is held constant. The collector has an acshort to the emitter during this test.
10.11.4 Alternating Current Gain TestAlternating current gain is expressed in two different ways, depending on thetype of configuration the transistor is used in. For a common-base configuration,the amplification factor is alpha (ex), which is the ratio of the change in thecollector current to the change in the emitter current, with the collector voltageheld constant. The collector has an ac short to the base during this test.
11 t,ex=-~11 t,
Fig.IO.20 Tester circuit for(gain) direct current test
C-ACShort
10.11.3 Direct Current Gain TestDirect current gain is a measure of the effectiveness of the base in controllingcollector current. It is a useful parameter for transistors used in low frequencypower, amplification, switching, and controlcircuits. This test is useful only if the transistoris used in a common-emitter configuration.
Figure 10.20 illustrates the tester circuit usedfor test. R) is adjusted for a null on the voltmeter,at this point the de gain is equal both to IjIb' andRjR2. R, usually has a calibrated dial to providea direct reading of dc gain.
As a transistor ages, there is a tendency for thedc gain to decrease. This causes the amplificationto decrease, which leads to distortion of thesignal.
Fig.10.19 (a) lebo test circuit (b) Tester circuit for leeo test
(a) (b)
+-=-EBase
Open
c RE
-=-E
B
EmitterOpen
+
c RE
Measuring Instruments 307
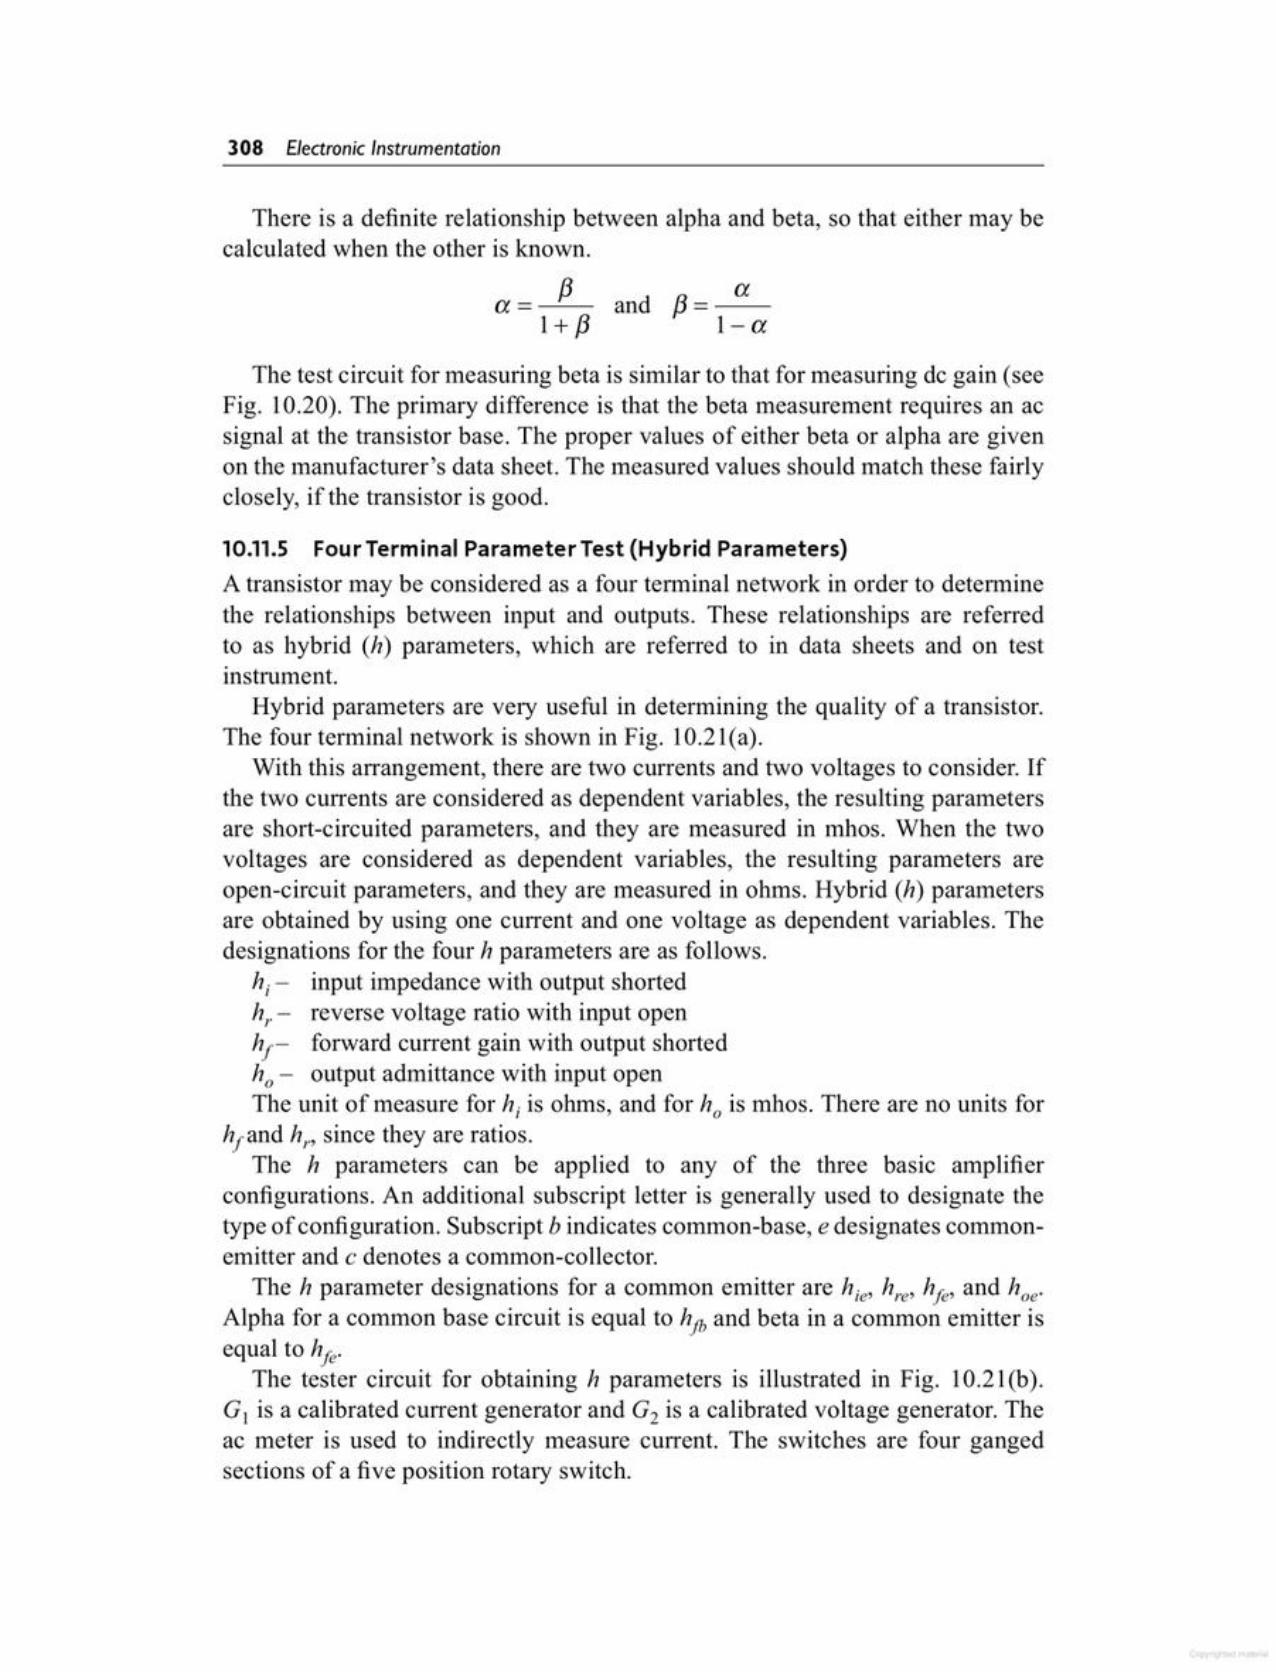
10.11.5 FourTerminal Parameter Test (Hybrid Parameters)A transistor may be considered as a four terminal network in order to determinethe relationships between input and outputs. These relationships are referredto as hybrid (h) parameters, which are referred to in data sheets and on testinstrument.
Hybrid parameters are very useful in determining the quality of a transistor.The four terminal network is shown in Fig. 10.21(a).
With this arrangement, there are two currents and two voltages to consider. Ifthe two currents are considered as dependent variables, the resulting parametersare short-circuited parameters, and they are measured in mhos. When the twovoltages are considered as dependent variables, the resulting parameters areopen-circuit parameters, and they are measured in ohms. Hybrid (h) parametersare obtained by using one current and one voltage as dependent variables. Thedesignations for the four h parameters are as follows.
hi - input impedance with output shortedh; - reverse voltage ratio with input openhf- forward current gain with output shortedho - output admittance with input openThe unit of measure for hi is ohms, and for ho is mhos. There are no units for
hfand hr' since they are ratios.The h parameters can be applied to any of the three basic amplifier
configurations. An additional subscript letter is generally used to designate thetype of configuration. Subscript b indicates common-base, e designates commonemitter and c denotes a common-collector,
The h parameter designations for a common emitter are hie, hre, hfe, and hoe.Alpha for a common base circuit is equal to hjb and beta in a common emitter isequal to hfe.
The tester circuit for obtaining h parameters is illustrated in Fig. 10.21 (b).G) is a calibrated current generator and G2 is a calibrated voltage generator. Theac meter is used to indirectly measure current. The switches are four gangedsections of a five position rotary switch.
The test circuit for measuring beta is similar to that for measuring de gain (seeFig. 10.20). The primary difference is that the beta measurement requires an acsignal at the transistor base. The proper values of either beta or alpha are givenon the manufacturer's data sheet. The measured values should match these fairlyclosely, if the transistor is good.
There is a definite relationship between alpha and beta, so that either may becalculated when the other is known.
/3 aa= and /3=--1+/3 I-a
308 Electronic Instrumentation
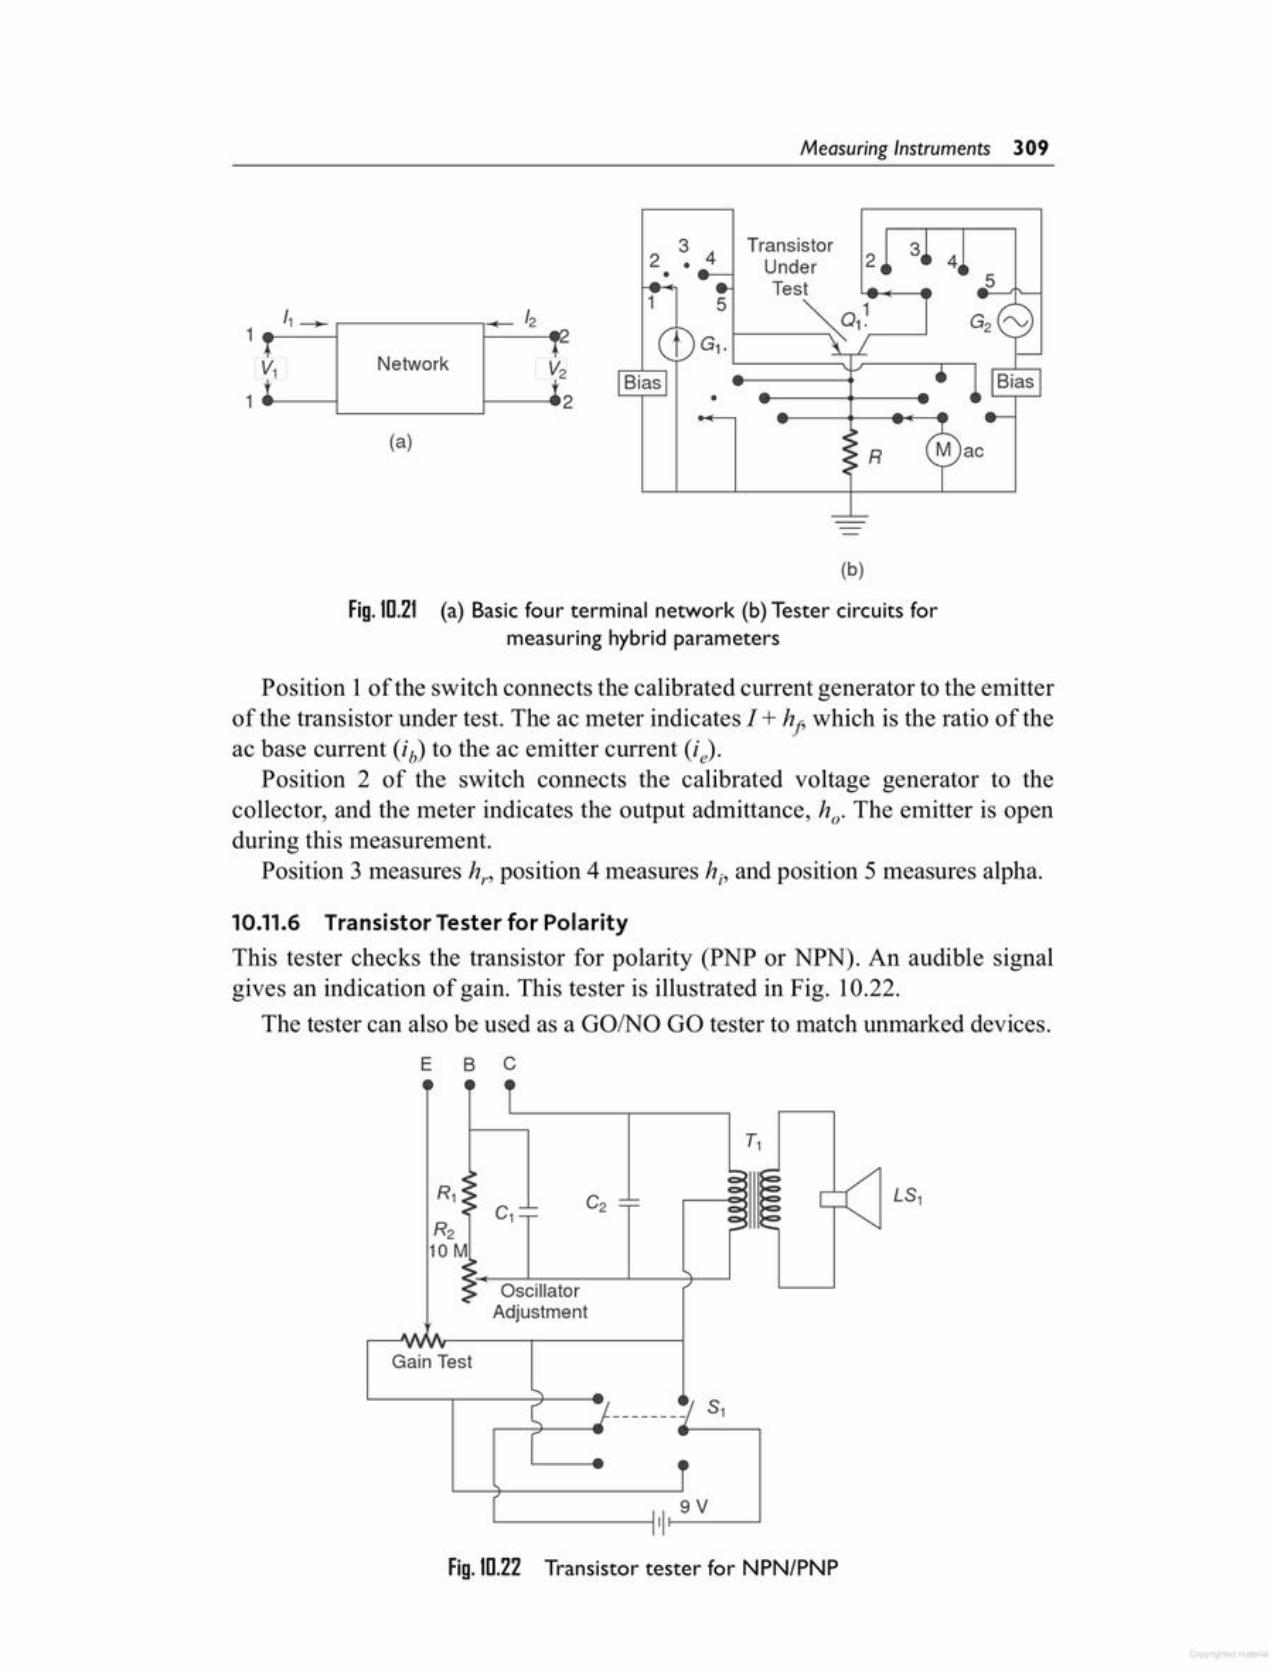
Fig.m.22 Transistor tester for NPN/PNP
L...- --111 9 V
OscillatorAdjustment
LS1C1
Gain Test
10.11.6 Transistor Tester for PolarityThis tester checks the transistor for polarity (PNP or NPN). An audible signalgives an indication of gain. This tester is illustrated in Fig. 10.22.
The tester can also be used as a GOINO GO tester to match unmarked devices.E B C
Position 1of the switch connects the calibrated current generator to the emitterof the transistor under test. The ac meter indicates 1 + hp which is the ratio of theac base current (ib) to the ac emitter current (ie)'
Position 2 of the switch connects the calibrated voltage generator to thecollector, and the meter indicates the output admittance, h; The emitter is openduring this measurement.
Position 3 measures h., position 4 measures hi' and position 5 measures alpha.
Fig. 10.21 (a) Basic four terminal network (b) Tester circuits formeasuring hybrid parameters
(b)
54
•
(a)
Network V2
1~--L_ j---~2
•3 42 •
TransistorUnder 2Test
5 f---__ ~Ql1.~ _ _'G1·
Measuring Instruments 309
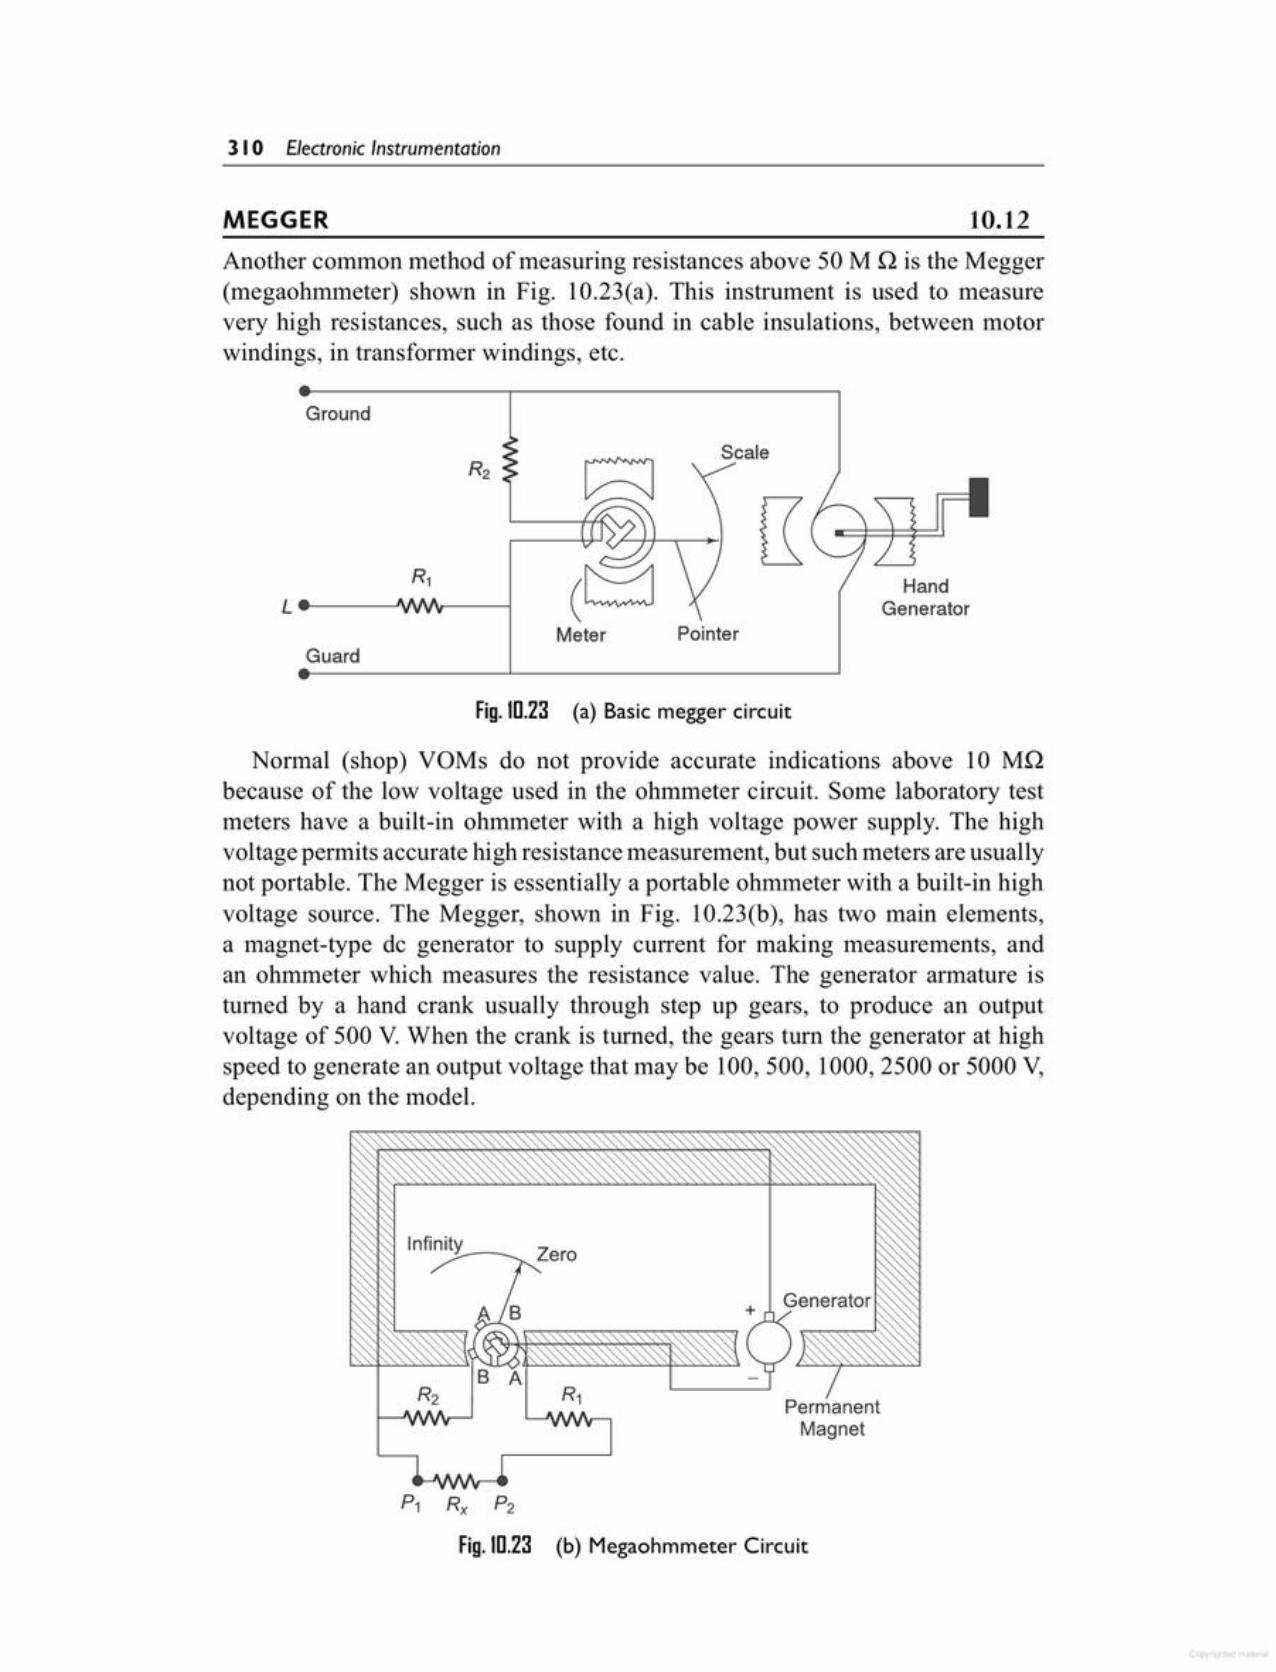
P1 Rx P2
Fig. 10.23 (b) Megaohmmeter Circuit
PermanentMagnet
Normal (shop) VOMs do not provide accurate indications above 10 MQbecause of the low voltage used in the ohmmeter circuit. Some laboratory testmeters have a built-in ohmmeter with a high voltage power supply. The highvoltage permits accurate high resistance measurement, but such meters are usuallynot portable. The Megger is essentially a portable olumneter with a built-in highvoltage source. The Megger, shown in Fig. 10.23(b), has two main elements,a magnet-type de generator to supply current for making measurements, andan ohmmeter which measures the resistance value. The generator armature isturned by a hand crank usually through step up gears, to produce an outputvoltage of 500 V. When the crank is turned, the gears tum the generator at highspeed to generate an output voltage that may be 100, 500, 1000,2500 or 5000 V,depending on the model.
Fig. 10.23 (a) Basic megger circuit
HandGenerator
PointerMeterGuard
Ground
Another common method of measuring resistances above 50 M Q is the Megger(megaohmmeter) shown in Fig. 10.23(a). This instrument is used to measurevery high resistances, such as those found in cable insulations, between motorwindings, in transformer windings, etc.
10.12MEGGER
3 I 0 Electronic Instrumentation
pH is defined as the negative logarithm of the active hydrogen ion. It is a measureof the acidity or alkalinity of an aqueous solution. The pH scale runs from 0 - 14,with pH 7, the neutral point, being the pH of pure water at 25°C. The lower thepH value, the more acidic the solution. Increasing pH values above 7.0, indicateincreasing alkalinity.
10.13ANALOG pH METER
The meter used differs slightly from the standard D' Arsonval movement, inthat it has two windings. One windings is in series with the reference R2 acrossthe output of the generator, and is wound in such a way as to move the pointertowards the high resistance end of the scale when the generator is in operation.The other winding coil (A) and resistance R, are connected in series between thenegative pole of the generator and the line terminal. This winding is so woundthat when current flows through it from the generator, it tends to move the pointertowards the zero end of the scale. The two coils are mounted on the same shaftbut at right angles to each other. Current is fed to both the coils by means offlexible connections that do not hinder the rotation of the element.
Coil A is the CUITentcoil with one terminal connected to the negative outputand the other connected in series with R, to the test lead P2' Test lead P, isconnected to the generator positive output. When the unknown resistance R; isconnected across P, and P2, current flows from the generator through coil A,resistances R 1 and Rx' The value of R 1 is so chosen so as to ensure that even if theline terminals are short-circuited, the current coil A is not damaged.
Coil B is the voltage coil and is connected across the generator output throughthe resistance R 2' If the test leads are left open, no current flows in coil A and coilB alone moves the pointer. Coil B take a position on the opposite side in the core,and the pointer indicates infinity or open.
When an extremely high resistance appears across the terminals, such as inan open circuit, the pointer reads infinity. On the other hand, when a resistanceof relatively low value appears across the test points, such as when the cableinsulation is wet, the current through the series winding causes the pointer tomove towards zero (resistance short-circuited). However, the pointer stops at apoint on the scale determined by the current through the series resistor, which inturn is governed by the value of the resistance being measured.
When an unknown resistance R; is connected across the test leads, the currentflows in coil A. The corresponding torque developed moves the pointer awayfrom the infinity position, into a field of gradually increasing strength, until thetorque fields between coils A and B are equal. Variations in the speed of the handcranked generator do not affect the Megaohmmeter readings, since charges ingenerator voltage affects both coils in the same manner.
Meggers may read resistances of several hundred or even thousands ofmegaohms. They have the advantage, as compared to an ordinary ohmmeter, ofapplying a high voltage to the circuit under test, and this voltage causes a CUITentif any electrical leakage exists.
Measuring Instruments 3 I I
10.13.1 pH Measurement Using Hydrogen ElectrodeThe hydrogen electrode comprises a platinum plate covered with platinum blackkept in a hydrogen element, where gaseous hydrogen at atmospheric pressureacts directly on this plate.
It consists of a hollow tube which is opened at the bottom end and immersedin the solution whose pH value is to be measured. The platinum plate is insertedinto this hollow tube and joined to the platinum wire which is welded to the glasstube. This platinum wire is joined to a copper lead, as shown in Fig. 10.24.
where Eo = potential of the electrode, when its active-ion concentration in thesolution is equal to unity.
t = temperature in degree centigraden = valency of the iona = active concentration of the ions of the metal in gram-equivalents
per litreInpractice, only the potential difference can be measured and so the pH always
has two elements; a measuring element, the potential of which depends on theconcentration of the hydrogen ions, and a comparison element, the potential ofwhich must remain constant. Two such elements connected electrically form agalvanic system, and by measuring the emf of this system we can drive the activeconcentration of the hydrogen ions in the solution under investigation.
The various electrodes used for pH measurements are as follows.1. Hydrogen electrode2. Calomel electrode3. Quinhydrone and antimony electrodes4. Glass electrodesWe now give some of the electrical methods used for measuring pH.
Usually the pH is measured by immersing a special glass electrode andreference electrode into the solution. There are two types of methods used tomeasure the pH, the colorimetric method and the electrical method.
The colorimetric method is based on the assumption that if an indicator hasthe same colour in two solutions, then the pH of both solutions is the same.However, in practice this assumption does not hold good always, since the colourdeveloped depends not only on the pH but also on other factors.
The electrical method is the most popular and is based upon a measurementof the electrode potential. The principle of this method is that when an electrodeis immersed in the solution, a potential arises at the electrode solution boundaryknown as the electrode potential. This electrode potential, at a given temperature,depends upon the concentrations of ions of the electrolyte which exist in thesolution. The electrode potential (in volts) of a metal immersed in a solution withions of the same metal can be expressed by the following relation.
E - E 0.0001982 (273 + t) I- 0 + oglO a
n
3 I 2 Electronic Instrumentation
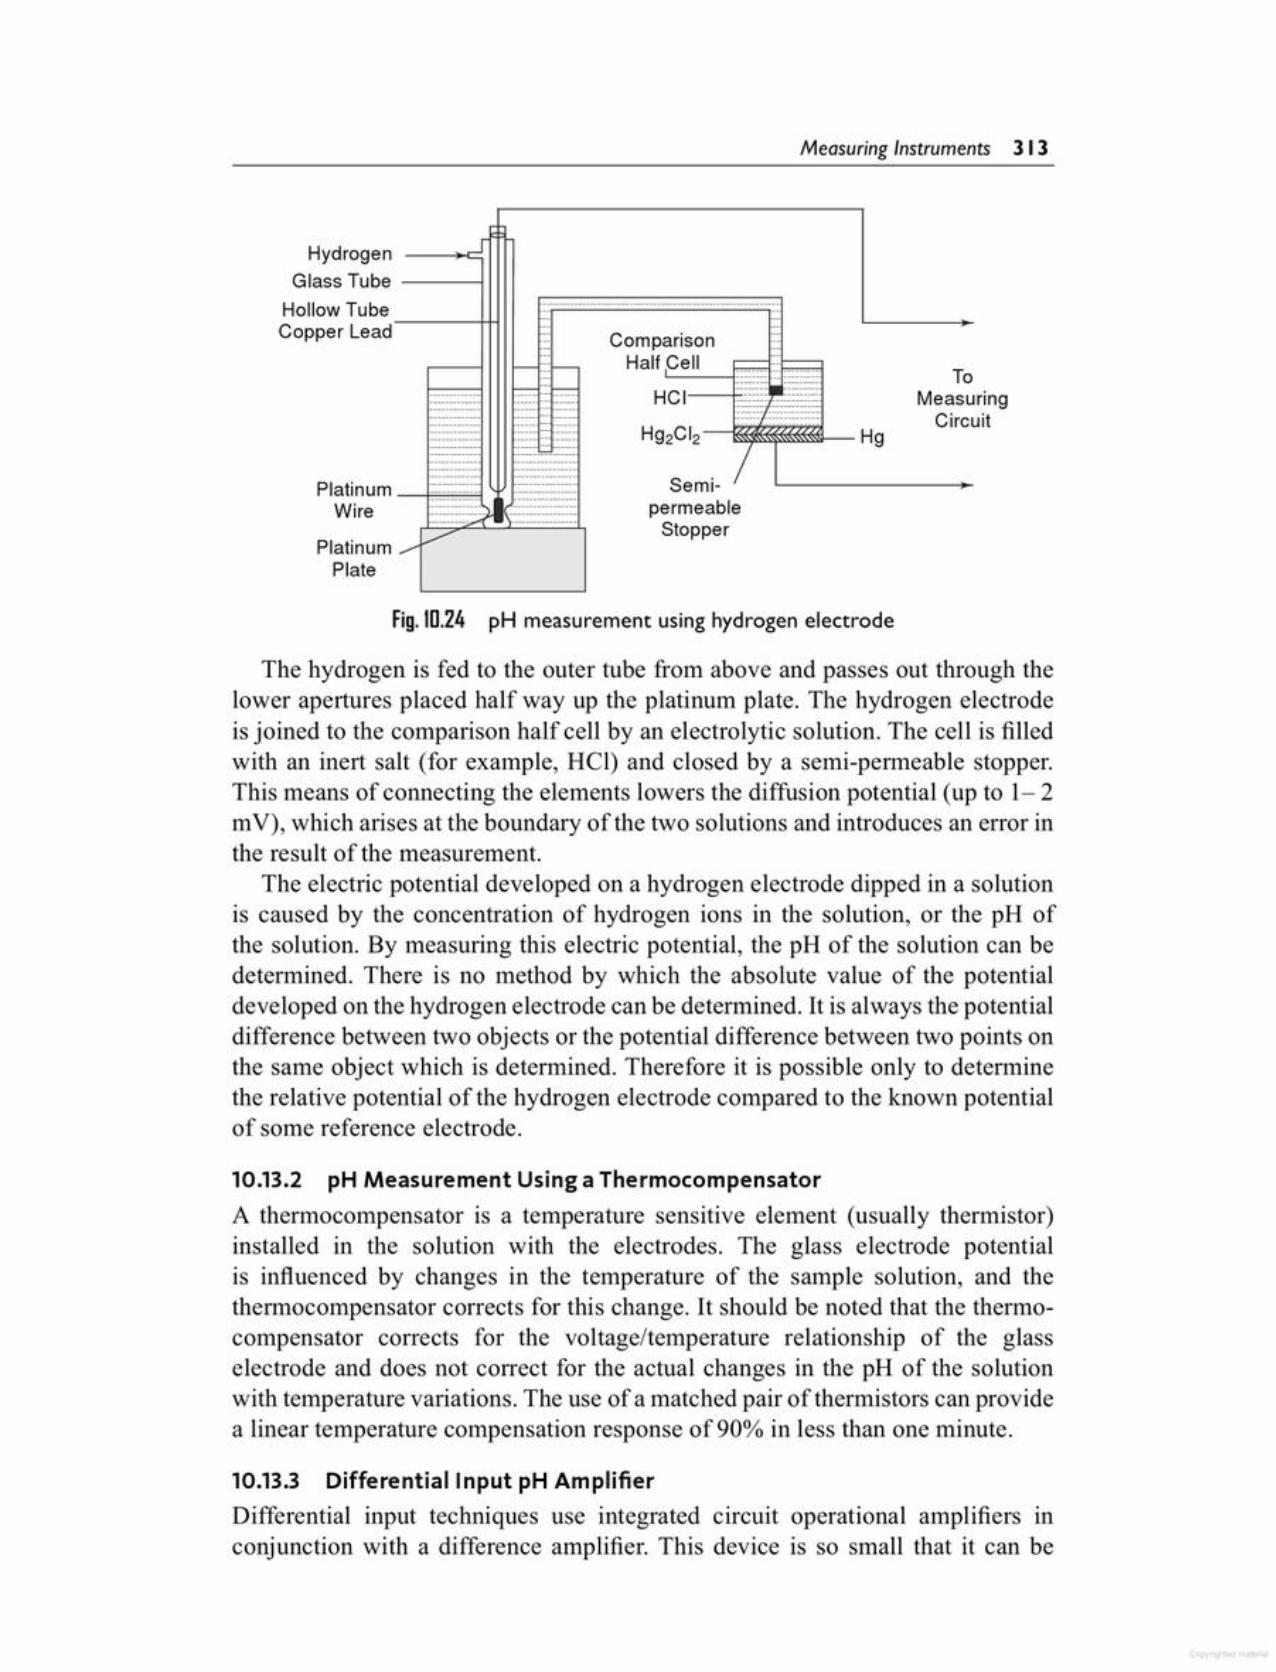
10.13.3 Differential Input pH AmplifierDifferential input techniques use integrated circuit operational amplifiers inconjunction with a difference amplifier. This device is so small that it can be
10.13.2 pH Measurement Using aThermocompensatorA thermocompensator is a temperature sensitive element (usually thermistor)installed in the solution with the electrodes. The glass electrode potentialis influenced by changes in the temperature of the sample solution, and thethermo compensator corrects for this change. It should be noted that the thermocompensator corrects for the voltage/temperature relationship of the glasselectrode and does not correct for the actual changes in the pH of the solutionwith temperature variations. The use of a matched pair of thermistors can providea linear temperature compensation response of 90% in less than one minute.
The hydrogen is fed to the outer tube from above and passes out through thelower apertures placed half way up the platinum plate. The hydrogen electrodeis joined to the comparison half cell by an electrolytic solution. The cell is filledwith an inert salt (for example, Hel) and closed by a semi-permeable stopper.This means of connecting the elements lowers the diffusion potential (up to 1-2mV), which arises at the boundary of the two solutions and introduces an error inthe result of the measurement.
The electric potential developed on a hydrogen electrode dipped in a solutionis caused by the concentration of hydrogen ions in the solution, or the pH ofthe solution. By measuring this electric potential, the pH of the solution can bedetermined. There is no method by which the absolute value of the potentialdeveloped on the hydrogen electrode can be determined. It is always the potentialdifference between two objects or the potential difference between two points onthe same object which is determined. Therefore it is possible only to determinethe relative potential of the hydrogen electrode compared to the known potentialof some reference electrode.
Fig. 1D.24 pH measurement using hydrogen electrode
PlatinumPlate
HydrogenGlass Tube
Hollow TubeCopper Lead
nnguit
.f
:: Comparison 1-:...
Half ,CellTo
HC, Measu
H92CI2Cire
Hg
Semi- /II permeable
-> Stopper-PlatinumWire
Measuring Instruments 3 13
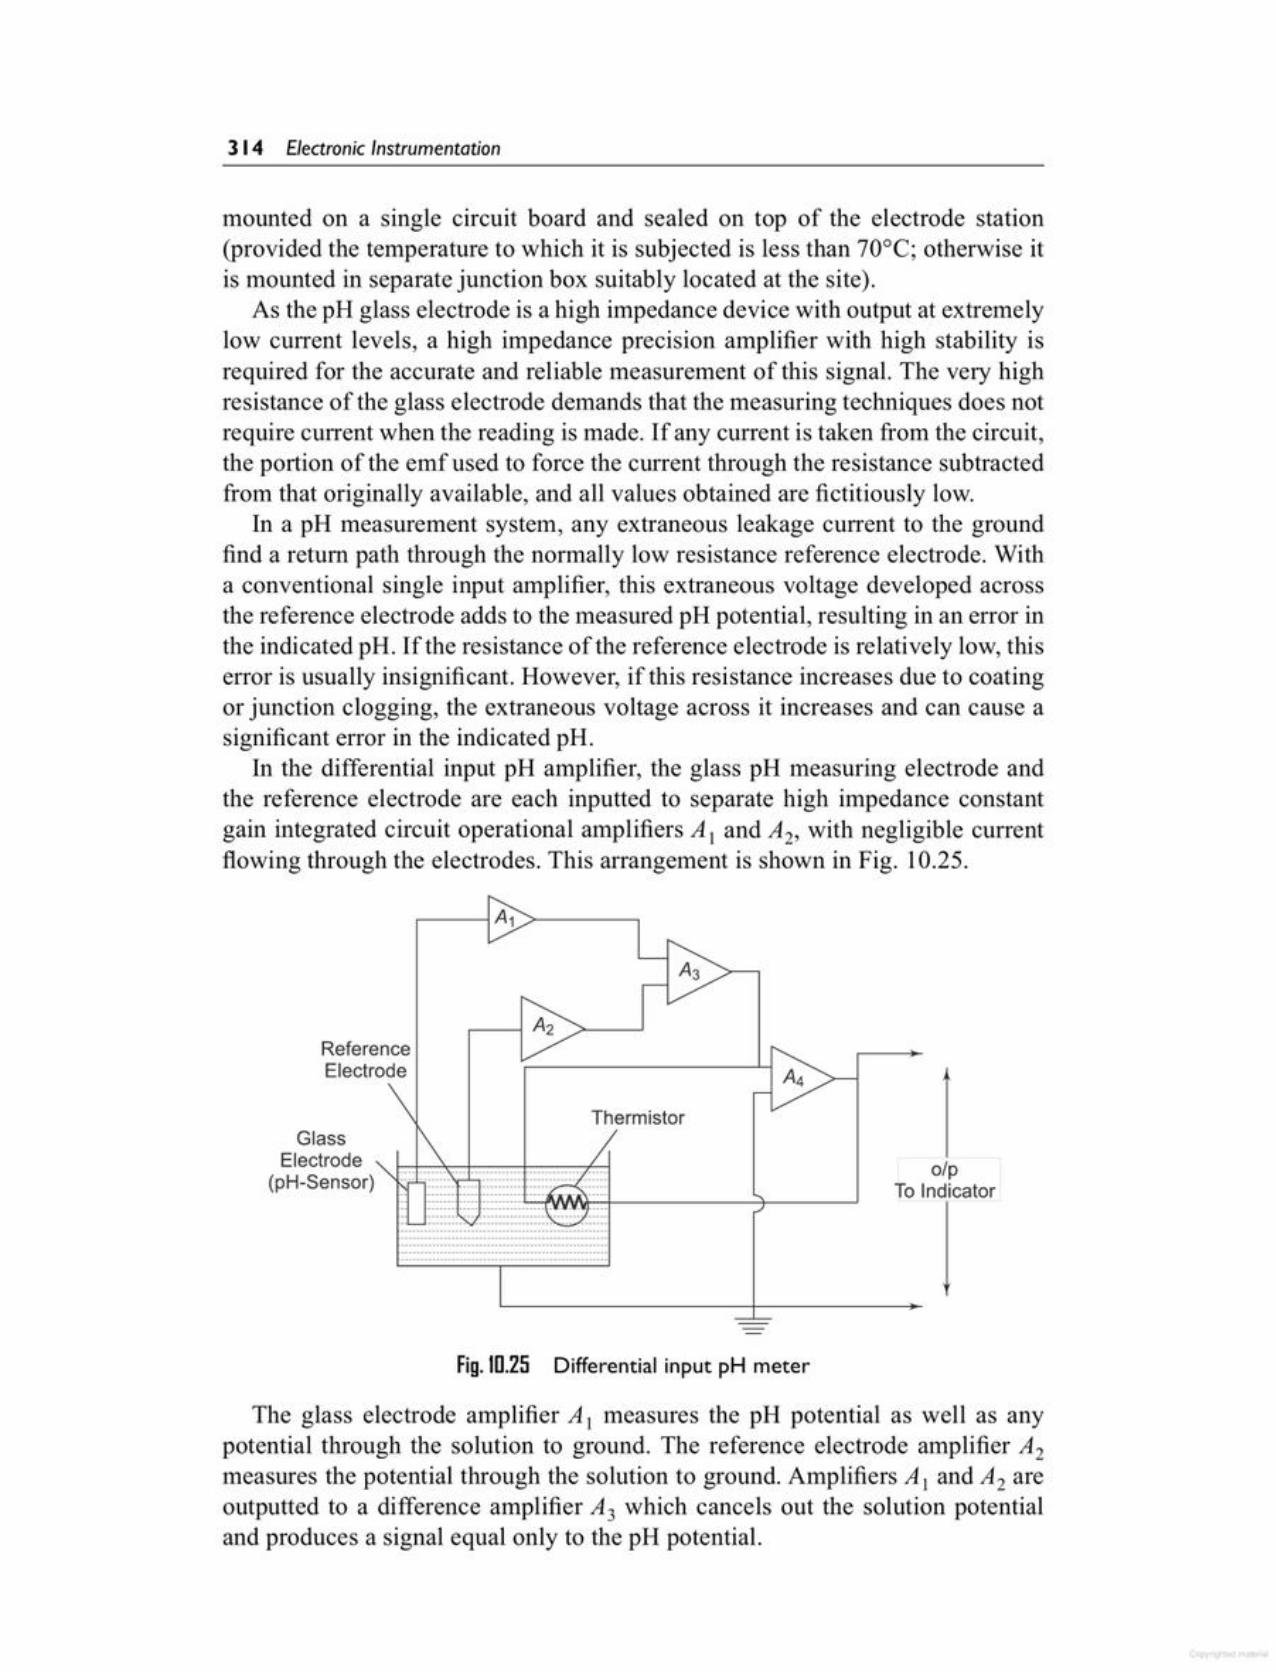
The glass electrode amplifier A I measures the pH potential as well as anypotential through the solution to ground. The reference electrode amplifier A2measures the potential through the solution to ground. Amplifiers AI and A2 areoutputted to a difference amplifier A3 which cancels out the solution potentialand produces a signal equal only to the pH potential.
Fig. 10.25 Differential input pH meter
.....................................................
o/pTo Indicator
ThermistorGlass
Electrode(pH-Sensor)
ReferenceElectrode
mounted on a single circuit board and sealed on top of the electrode station(provided the temperature to which it is subjected is less than 70°C; otherwise itis mounted in separate junction box suitably located at the site).
As the pH glass electrode is a high impedance device with output at extremelylow current levels, a high impedance precision amplifier with high stability isrequired for the accurate and reliable measurement of this signal. The very highresistance of the glass electrode demands that the measuring techniques does notrequire current when the reading is made. If any current is taken from the circuit,the portion of the emf used to force the current through the resistance subtractedfrom that originally available, and all values obtained are fictitiously low.
In a pH measurement system, any extraneous leakage current to the groundfind a return path through the normally low resistance reference electrode. Witha conventional single input amplifier, this extraneous voltage developed acrossthe reference electrode adds to the measured pH potential, resulting in an error inthe indicated pH. If the resistance of the reference electrode is relatively low, thiserror is usually insignificant. However, if this resistance increases due to coatingor junction clogging, the extraneous voltage across it increases and can cause asignificant error in the indicated pH.
In the differential input pH amplifier, the glass pH measuring electrode andthe reference electrode are each inputted to separate high impedance constantgain integrated circuit operational amplifiers A I and A2, with negligible currentflowing through the electrodes. This arrangement is shown in Fig. 10.25.
3 14 Electronic Instrumentation
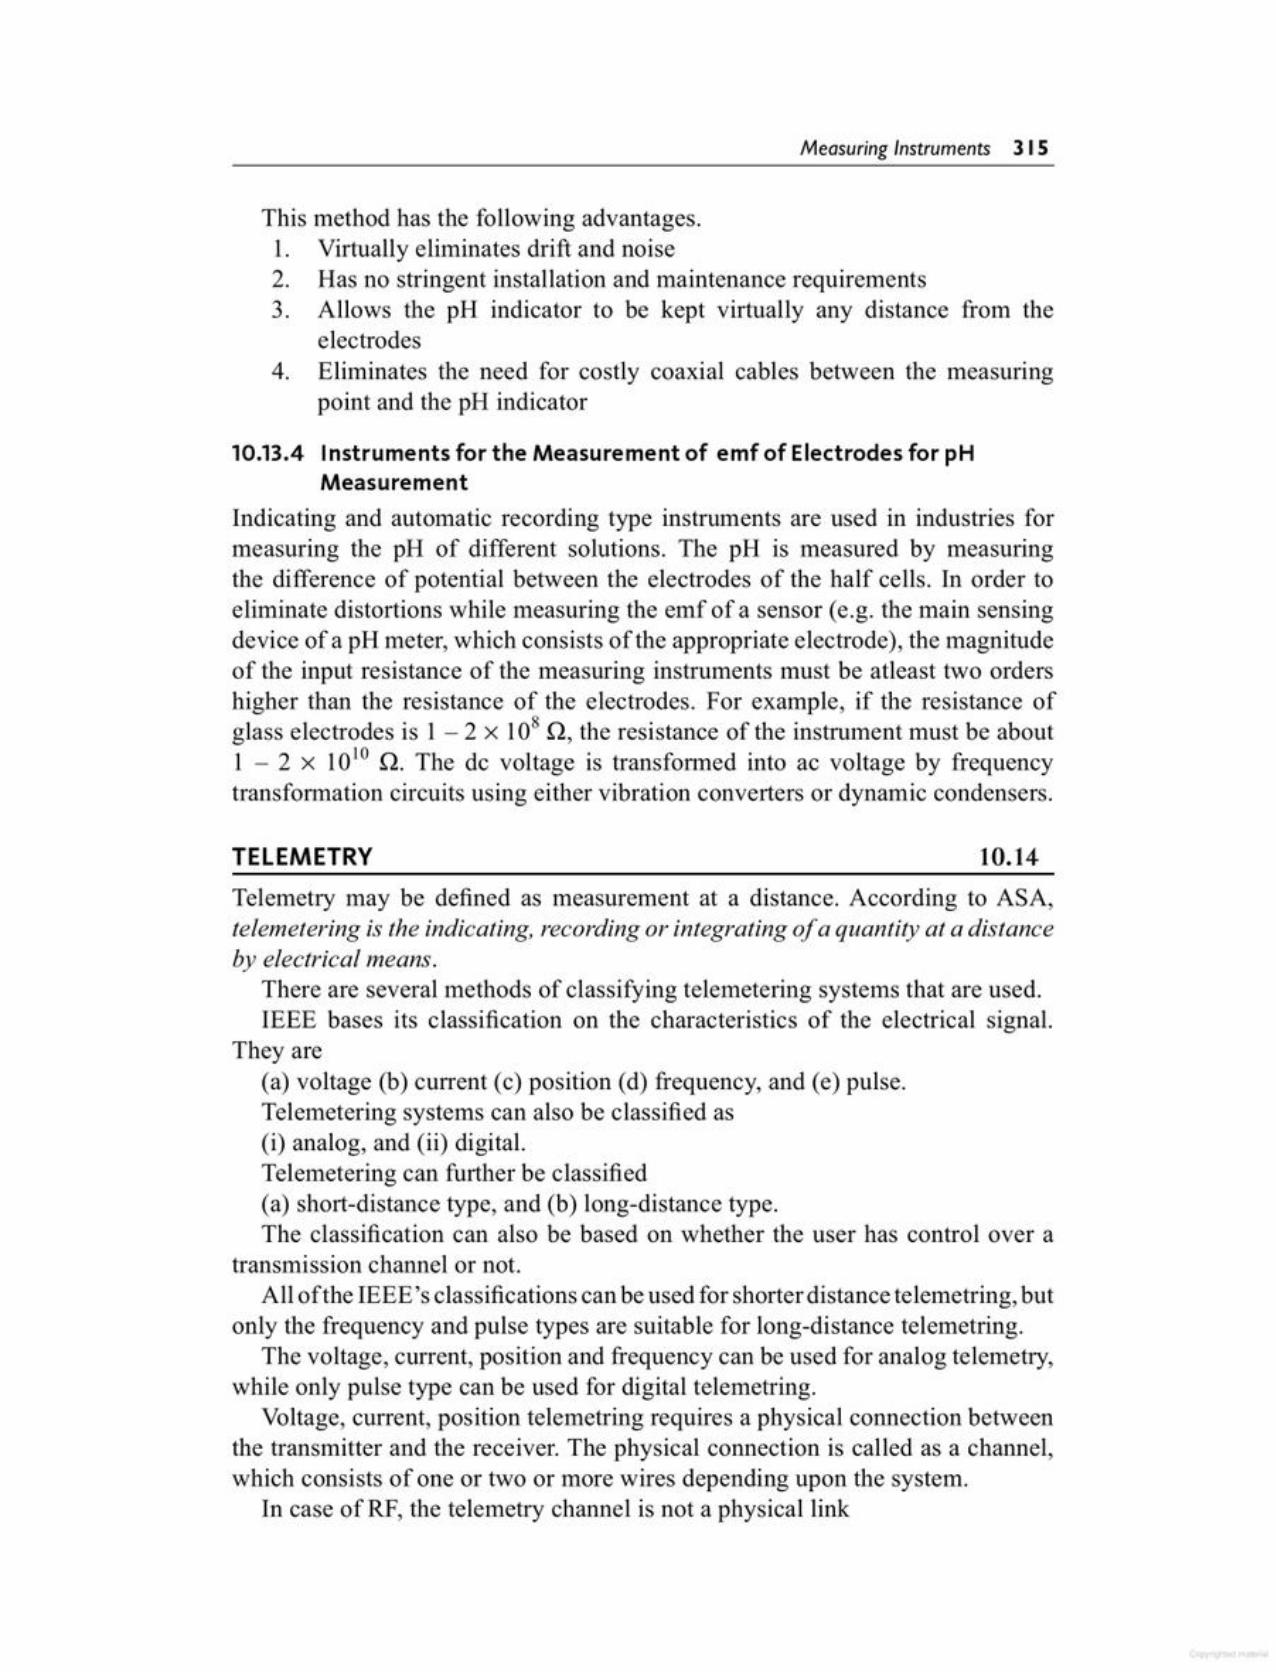
Telemetry may be defined as measurement at a distance. According to ASA,telemetering is the indicating, recording or integrating of a quantity at a distanceby electrical means.
There are several methods of classifying telemetering systems that are used.IEEE bases its classification on the characteristics of the electrical signal.
They are(a) voltage (b) current (c) position (d) frequency, and (e) pulse.Telemetering systems can also be classified as(i) analog, and (ii) digital.Telemetering can further be classified(a) short-distance type, and (b) long-distance type.The classification can also be based on whether the user has control over a
transmission channel or not.All of the IEEE's classifications can be used for shorter distance telemetring, but
only the frequency and pulse types are suitable for long-distance telemetring.The voltage, current, position and frequency can be used for analog telemetry,
while only pulse type can be used for digital telemetring.Voltage, current, position telemetring requires a physical connection between
the transmitter and the receiver. The physical connection is called as a channel,which consists of one or two or more wires depending upon the system.
In case ofRF, the telemetry channel is not a physical link
10.14TELEMETRY
10.13.4 Instruments for the Measurement of emf of Electrodes for pHMeasurement
Indicating and automatic recording type instruments are used in industries formeasuring the pH of different solutions. The pH is measured by measuringthe difference of potential between the electrodes of the half cells. In order toeliminate distortions while measuring the emf of a sensor (e.g. the main sensingdevice of a pH meter, which consists of the appropriate electrode), the magnitudeof the input resistance of the measuring instruments must be atleast two ordershigher than the resistance of the electrodes. For example, if the resistance ofglass electrodes is 1 - 2 x 10⁸ Q, the resistance of the instrument must be about1 - 2 X 10¹⁰ Q. The de voltage is transformed into ac voltage by frequencytransformation circuits using either vibration converters or dynamic condensers.
This method has the following advantages.1. Virtually eliminates drift and noise2. Has no stringent installation and maintenance requirements3. Allows the pH indicator to be kept virtually any distance from the
electrodes4. Eliminates the need for costly coaxial cables between the measuring
point and the pH indicator
Measuring Instruments 3 I 5
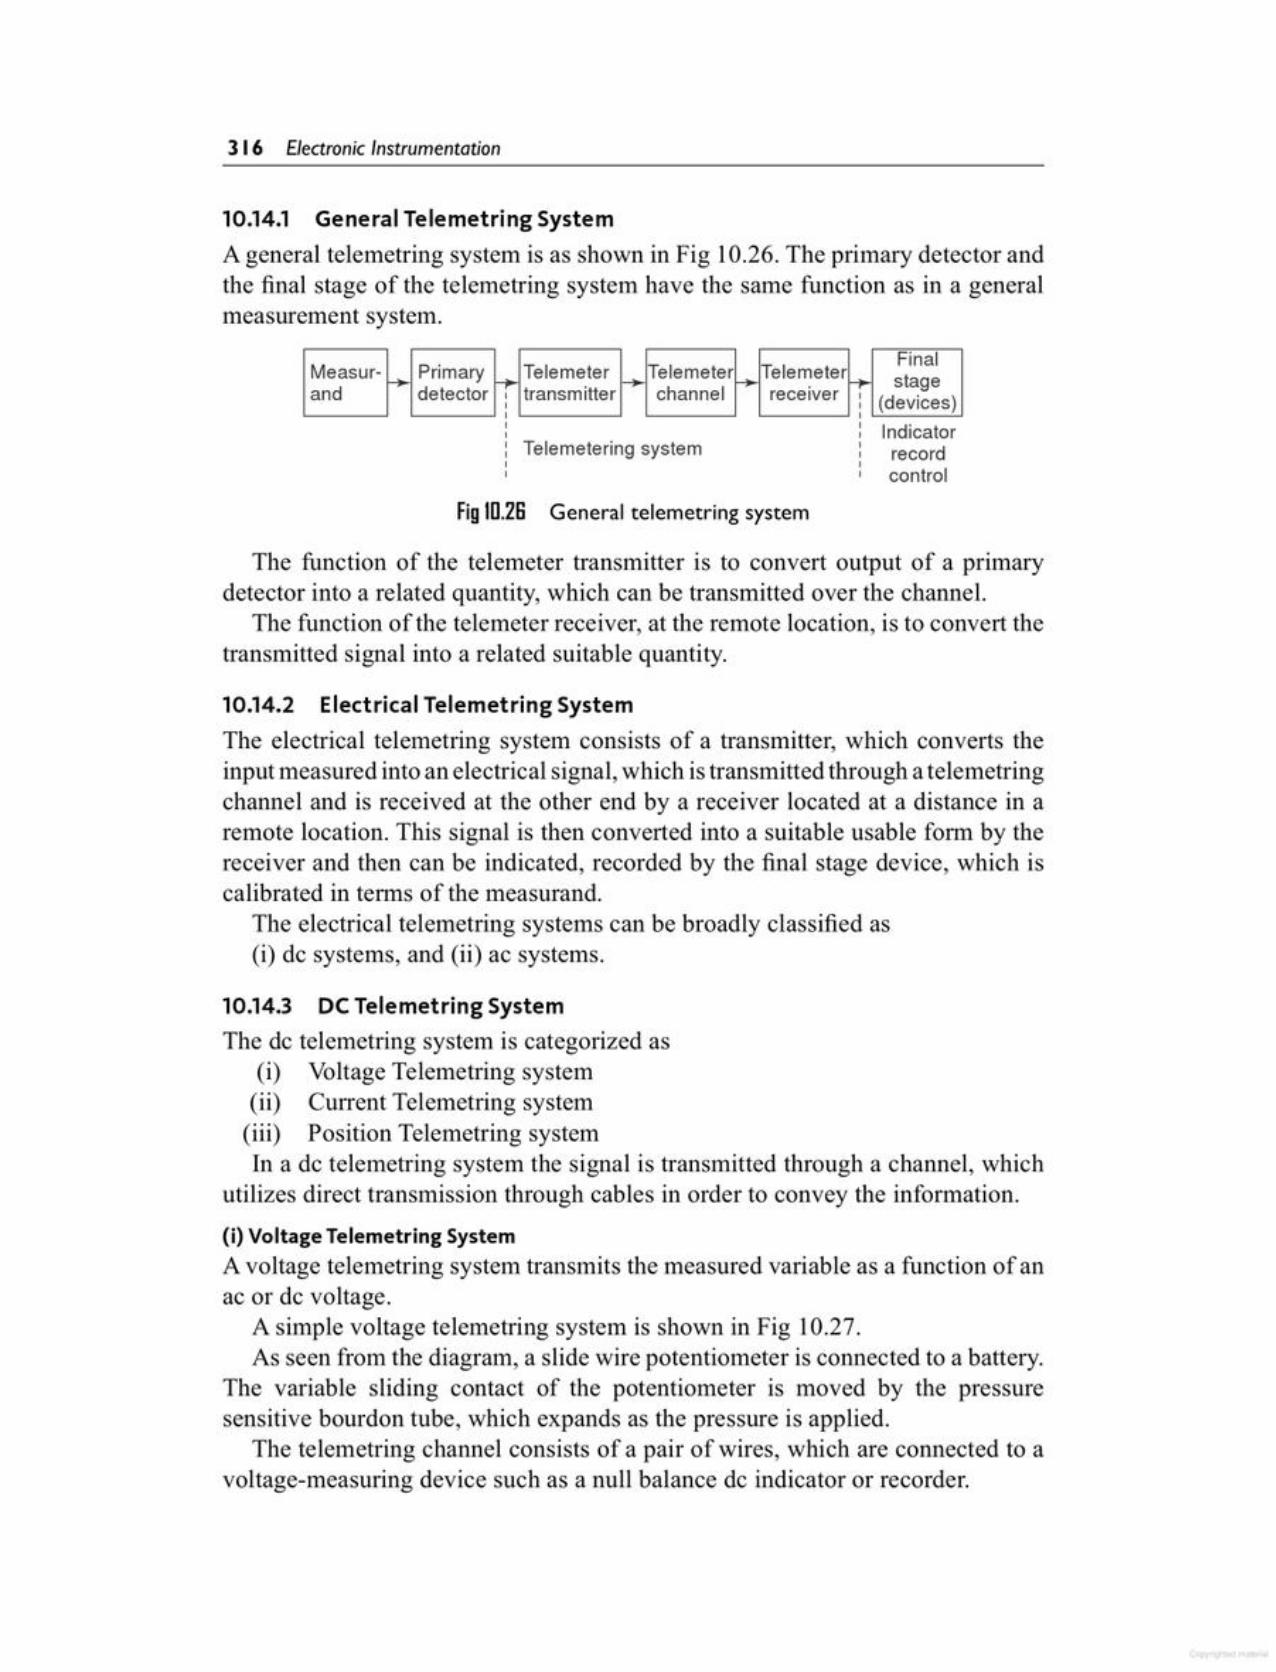
10.14.3 DCTelemetring SystemThe de telemetring system is categorized as
(i) Voltage Telemetring system(ii) Current Telemetring system(iii) Position Telemetring systemIn a de telemetring system the signal is transmitted through a channel, which
utilizes direct transmission through cables in order to convey the information.
(i) Voltage Telemetring SystemA voltage telemetring system transmits the measured variable as a function of anac or de voltage.
A simple voltage telemetring system is shown in Fig 10.27.As seen from the diagram, a slide wire potentiometer is connected to a battery.
The variable sliding contact of the potentiometer is moved by the pressuresensitive bourdon tube, which expands as the pressure is applied.
The telemetring channel consists of a pair of wires, which are connected to avoltage-measuring device such as a null balance dc indicator or recorder.
10.14.2 Electrical Telemetring SystemThe electrical telemetring system consists of a transmitter, which converts theinput measured into an electrical signal, which is transmitted through a telemetringchannel and is received at the other end by a receiver located at a distance in aremote location. This signal is then converted into a suitable usable form by thereceiver and then can be indicated, recorded by the final stage device, which iscalibrated in terms of the measurand.
The electrical telemetring systems can be broadly classified as(i) de systems, and (ii) ac systems.
The function of the telemeter transmitter is to convert output of a primarydetector into a related quantity, which can be transmitted over the channel.
The function of the telemeter receiver, at the remote location, is to convert thetransmitted signal into a related suitable quantity.
Fig 10.26 General telemetring system
Indicatorrecordcontrol
Telemetering system
. FinalMeasur- ~ Primary -+- Teleme.ter ~ Telemeterf+ Tele~eter~ stageand detector : transmitter channel receiver: (devices)
I I
10.14.1 General Telemetring SystemA general telemetring system is as shown in Fig 10.26. The primary detector andthe final stage of the telemetring system have the same function as in a generalmeasurement system.
3 16 Electronic Instrumentation
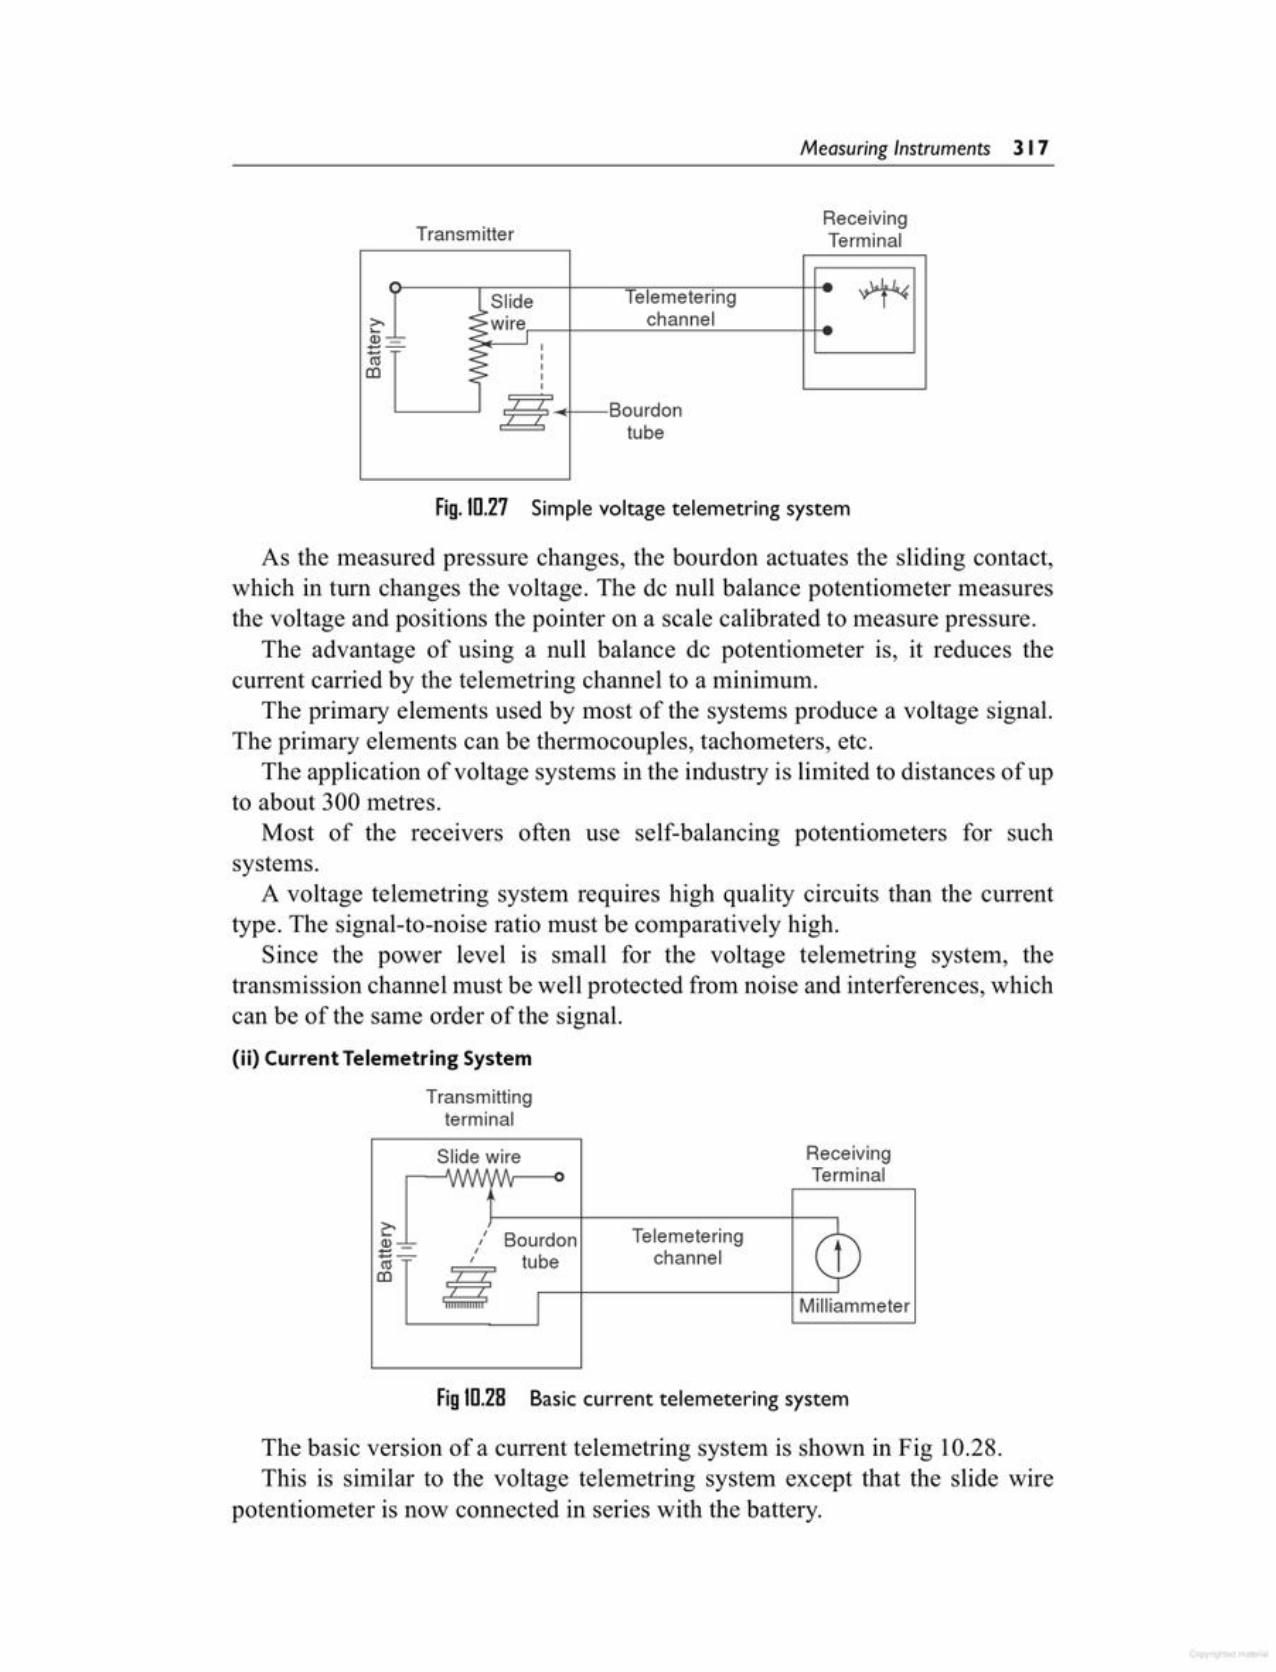
The basic version of a current telemetring system is shown in Fig 10.28.This is similar to the voltage telemetring system except that the slide wire
potentiometer is now connected in series with the battery.
Fig 1D.28 Basic current telemetering system
Slide wire ReceivingVWl/M Terminal
>,Telemetering cp.... I BourdonGl -_!:- I
::::- I channelIII I tubeCO iiI I Milliammeter
(ii) Current Telemetring System
Transmittingterminal
As the measured pressure changes, the bourdon actuates the sliding contact,which in tum changes the voltage. The de null balance potentiometer measuresthe voltage and positions the pointer on a scale calibrated to measure pressure.
The advantage of using a null balance de potentiometer is, it reduces thecurrent carried by the telemetring channel to a minimum.
The primary elements used by most of the systems produce a voltage signal.The primary elements can be thermocouples, tachometers, etc.
The application of voltage systems in the industry is limited to distances of upto about 300 metres.
Most of the receivers often use self-balancing potentiometers for suchsystems.
A voltage telemetring system requires high quality circuits than the currenttype. The signal-to-noise ratio must be comparatively high.
Since the power level is slTIall for the voltage telemetring system, thetransmission channel must be well protected from noise and interferences, whichcan be of the same order of the signal.
Fig. 1D.27 Simple voltage telemetring system
~>Slide Telemetering>, $.wirel channel"-Gl-...=---
~'
Iiii I
co III
Y, Bourdontube
ReceivingTerminalTransmitter
Measuring Instruments 3 I 7

Fig 10.30 Force balance current telemetering system
MilliammeterPowersupply
Telemeteringchannel"Ii
Bourdon [fiItube Magnet
Pri c.E«
ReceivingTerminal
Transmittingterminal
In this system, the bourdon tube is connected to the core of the LVDT. Whenpressure is applied to the bourdon tube, the bourdon tube expands causing adisplacement. This moves the core of the LVDT, thereby producing an outputvoltage, which is then amplified and rectified. This voltage produces a de currentof the order of 4 rnA to 20 mA in the telemetry channel and is measured by themilliammeter.
The scale of the milliammeter is directly calibrated in terms of pressure thatis being measured.
(b) Force Balance Systems A force balance systems is as shown in Fig. 10.30, a partof the current output is fed back to oppose the motion (movement) of the inputvariable.
Fig 10.29 Motion current telemetering system
Milliammetercalibratedin kn/m2
,- - - --II
//~::cr Primary~ (LVOT) Secondry
Telemeteringchannel
Cove
ReceivingTerminal
Transmittingterminal
The sliding contact of the potentiometer is connected to the pressure sensitivebourdon tube, which moves as the bourdon tube expands.
In this case, the telemetring channel consists of a pair of wires, which areconnected to a current measuring device.
As the pressure changes, the bourdon tube expands, which in tum changes theposition of the sliding contact on the (potentiometer) slide wire. This changes thecurrent flow in the circuit. This current is measured by a milliammeter, whosescale has been calibrated to read pressure directly.
The most commonly used current telemetring systems are the (a) motion, and(b) force balance types which are improved version of the basic type.
(a) Motion Balance System In a motion balance system, the potentiometer or theslide wire is replaced by a position detector, such as LVDT as shown in Fig.10.29.
3 18 Electronic Instrumentation
15. Describe with a diagram the operation of a Q-meter. List the factorsthat causes error in a Q-n1eter.
16. Explain how Q-meter can be used tomeasure the following:(a) dc resistance of a coil(b) stray capacitance(c) impedance of a circuit(d) characteristics impedance of a
transmission line.17. Explain the operation of a Q-meter
for measurement of stray capacitance.
18. Explain the operation of a Q-meterfor measurement of HF resistance.Explain the operation of a Q-meterfor measurement of low impedancevalue.
19. Explain the operation of a Q-meterfor measurement of high impedancevalue
20. How can Q be measured using susceptance method?
21. What is a LCR bridge? How can L, Cand R be measured using a skeletonLCR bridge?
22. State the features of a kit type LCRbridge.
23. Explain in brief the working of a kittype LCR bridge.
24. State the principle of R-X meters. Explain with a basic diagram the operation of an R-X meter.
25. Explain with a diagram the operationof an automatic bridge.
1. State the working principle of an output power meter.
2. Explain with a diagram the workingof an output power meter.
3. How is field strength measured? Explain the basic principle of a fieldstrength meter.
4. Explain with a diagram the workingof a basic field strength meter.
5. Explain with a diagram the workingof a field strength meter using transistors.
6. State the basic principle on which thestroboscope operates.
7. Explain with a diagram the operationof a stroboscope.
8. Explain how speed of a motor can bemeasured using a stroboscope.
9. Explain the principle of a phase meter or a phase-sensitive detector.
10. Explain with a diagram the workingof a phase-sensitive detector.
11. State the principle used in a basicvector impedance meter.
12. Explain with a diagram the workingof a vector impedance meter.
13. Explain with a diagram how impedance can be measured using a commercial vector impedance meter.Explain with a diagram how phaseangle can be measured using a commercial vector impedance meter,
14. Define Q-factor and resonance. Explain the working principle of a Qmeter.
_R_e_v_ie_w_O_u_es_t_iD_ns ~~
The bourdon tube operates the system which rotates the feedback force coil.This in turns changes the flux linkage between the primary and the secondary
coils.This change in flux linkages varies the amplitude of the amplifier. The output
signal is then fed back to the feedback force coil, which in tum produces a forceopposing the bourdon input.
A force balance system increases the accuracy, as smaller motions are requiredwhich results in better linearity.
Measuring Instruments 3 19
(c) Resistance / Impedance(d) Impedance / Resistance
8. A Q meter is used to measure(a) voltage (b) inductance(c) capacitance (d) resistance
9. The shunt resistance Rsh used in Qmeter has a value of(a) 0.02 Q to 0.04 Q(b) 2 Q to 4 Q(c) 0.2 Q to 0.4 Q(d)2kQto4kQ.
10. The applied voltage to the resonanttank circuit has a(a) very low value 0.02 V(b) high value 4 V(c) medium value 0.04 V(d) very high value 400 V
11. A megger is used to measure(a) conductance (b) reactance(c) impedance (d) resistance
12. The pH scale runs from(a) 0-14 (b) 10-14(c) 7-14 (d) 0-7
13. The neutral point of pH is(a) 0 (b) 14(c) 7 (d) 10
14. A thermocompensator is a(a) thermocouple (b) RTD(c) thermometer (d) thermsistor
1. The output power meter is designedto measure the output power(a) inversely (b) directly(c) squared (d) indirectly
2. The field strength meter is used tomeasure(a) voltage(b) frequency(c) current(d) radiation intensity
3. The stroboscopic principle uses a(a) flashing light (b) inductance(c) capacitance (d) resistance
4. The stroboscope is used to measure(a) voltage (b) frequency(c) current (d) speed
5. The phase meter is measured bycomparing(a) ac signal with reference signal(b) ac signal with dc signal(c) de signal with reference signal(d) de signal with ac signal
6. A vector impedance meter determines impedance in(a) magnitude form(b) polar form(c) exponential form(d) rectangular form
7. Q-factor is defined as(a) Reactance / Resistance(b) Resistance / Reactance
Multiple Choice Duestions I-----------------------------~
31. How can pH be measured? State thedifferent methods of pH measurement.
32. Explain with diagram pH measurement using hydrogen electrode.
33. Explain with diagram pH measurement using a thermocompensator,
34. Explain with diagram the operationof a differential input pH meter.
35. State the advantages of differentialinput pH meter.
36. Why is the necessity of using a thermocompensator for pH measurement?
26. What is a transistor tester?27. Explain with diagram how a transis
tor tester can be used for the measurement of the following:(i) Faulty transistor (ii) lebo(ii) lceo (iv) Beta gain
28. What is a megger? Explain with a diagram the working of a basic megger.
29. Explain with a diagram the workingof a megaohmmeter circuit.
30. What do you understand by pH? Define pH.
320 Electronic Instrumentation
4. Vestor Robinson, Handbook ofElectronic Instrumentation, Testing andTroubleshooting, D.B. TaraporevalaSons & Co, 1979.
5. Miles, Retter Sander (jr), ElectronicMeters Techniques and Troubleshooting, Reston Publishing Co, 1977.
6. John D. Lenk, Handbook 0.[ Electronic Test Equipment, Prentice-Hall,1971.
1. Handbook of Electronic Measurements, V01s.I & II, Polytechnic Institute of Brooklyn, 1956. (MicrowaveResearch Institute)
2. John D. Lenk, Handbook of Electronic Meters, Theory and Applications, Prentice-Hall, 1980.
3. Rugus, D. Turner, Basic ElectronicsTest Instruments, Rinehart Books,1953.
_F_u_rt_he_r_R_ea_d_in~g ~~
1. Determine the distributed stray capacitances for the following dataFirst measurement fi = 4 MHz andC, = 3.3 kpfSecond measurement f2 = 3fi = 12MHz and C2 = 1000 pfAlso calculate the value of inductance.
_P_r_ac_ti_ce__ Pr_D_bl_em_s ~~
2. The distributed capacitance wasfound to be 20 pf by use of a Q meter. The first resonance occurred atC, = 300 pf andfi was half the second resonance frequency. Determinethe value of C2 and h. at the secondresonance (given L = 40 IlH).
Measuring Instruments 321
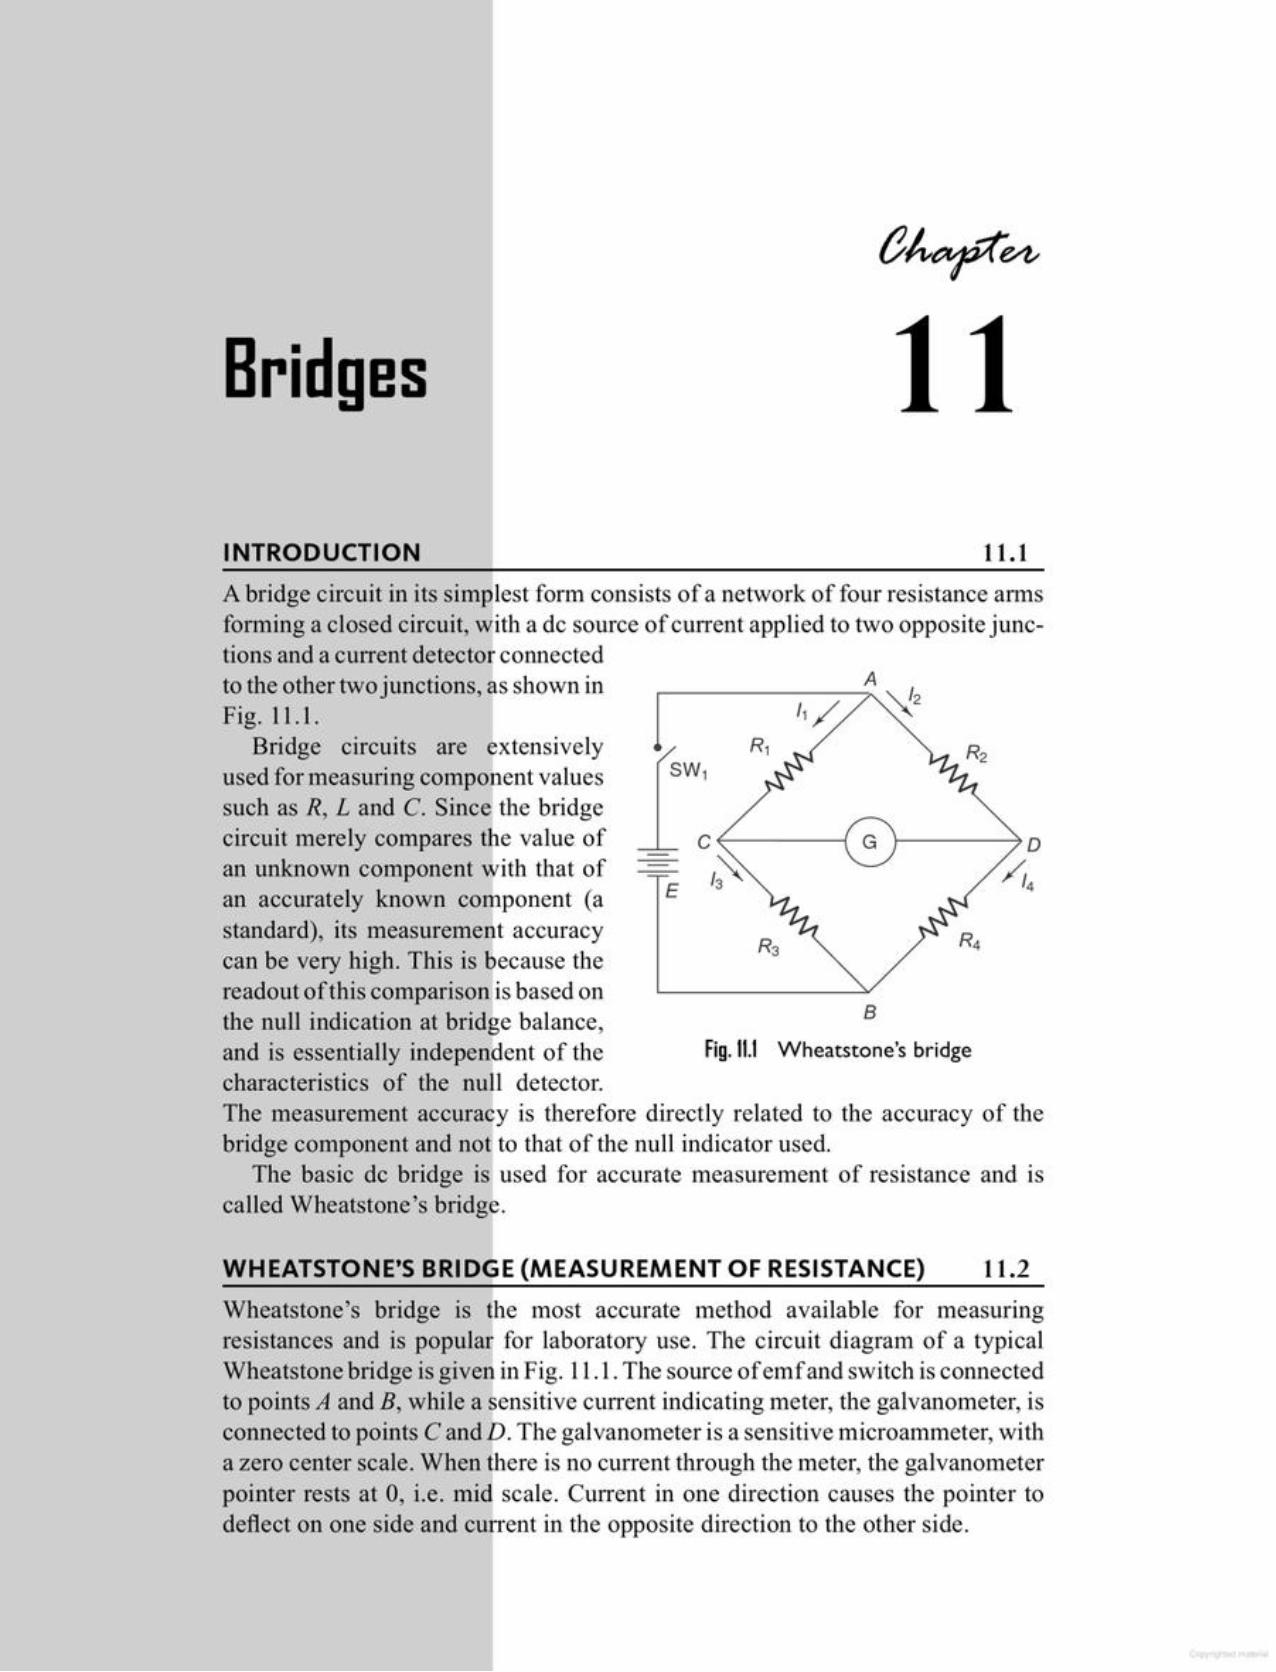
WHEATSTONE'S BRIDGE (MEASUREMENT OF RESISTANCE) 11.2
Wheatstone's bridge is the most accurate method available for measuringresistances and is popular for laboratory use. The circuit diagram of a typicalWheatstone bridge is given in Fig. 11.1.The source of emf and switch is connectedto points A and B, while a sensitive current indicating meter, the galvanometer, isconnected to points C and D.The galvanometer is a sensitive microammeter, witha zero center scale. When there is no current through the meter, the galvanometerpointer rests at 0, i.e. mid scale. Current in one direction causes the pointer todeflect on one side and current in the opposite direction to the other side.
Fig. 11.1 Wheatstone's bridge
B
E
1Ato the other two junctions, as shown in
Fig. 11.1.Bridge circuits are extensively
used for measuring component valuessuch as R, Land C. Since the bridgecircuit merely compares the value ofan unknown component with that ofan accurately known component (astandard), its measurement accuracycan be very high. This is because thereadout of this comparison is based onthe null indication at bridge balance,and is essentially independent of thecharacteristics of the null detector.The measurement accuracy is therefore directly related to the accuracy of thebridge component and not to that of the null indicator used.
The basic de bridge is used for accurate measurement of resistance and iscalled Wheatstone's bridge.
A bridge circuit in its simplest form consists of a network of four resistance armsforming a closed circuit, with a de source of current applied to two opposite junctions and a current detector connected
11.1INTRODUCTION
Bridges
11.2.1 Sensitivity of a Wheatstone BridgeWhen the bridge is in an unbalanced condition, current flows through thegalvanometer, causing a deflection of its pointer. The amount of deflection is a
= R2 R3 = 15 k x 40 k = 60 kQs, R 10 kJ
Therefore
Solution From the equation for bridge balance we have
RJ R4 = R2 R3, i.e. RJ R; =R2 R3
Example 11.1 Figure 11.1 consists a/the/allowing parameters. R, = 10 k,R2 = 15 k and R3 = 40 k. Find the unknown resistance R;
Ex RJ _ Ex R2RJ +R3 R2 +R4
R 1 X (R2 + R4) = (R 1+ R3) X R2Rl R2 + Rj R4 = Rj R2 + R3 R2
R _ R2 R34- Rj
This is the equation for the bridge to be balanced.In a practical Wheatstone's bridge, at least one of the resistance is made
adjustable, to permit balancing. When the bridge is balanced, the unknownresistance (normally connected at R4) may be determined from the setting of theadjustable resistor, which is called a standard resistor because it is a precisiondevice having very small tolerance.
Hence R = R2 R3 (11.4)x R
1
Substituting in Eq. (11.1)
(11.3)
(11.2)E
I[ =13=--R[ + R3
E12 =14 =--
R2 +R4
When SW 1 is closed, current flows and divides into the two arms at pointA, i.e. II and 12. The bridge is balanced when there is no current through thegalvanometer, or when the potential difference at points C and D is equal, i.e. thepotential across the galvanometer is zero.
To obtain the bridge balance equation, we have froIn the Fig. 11.1.
IIR[=I2R2 (11.1)For the galvanometer current to be zero, the following conditions should be
satisfied.
Bridges 323
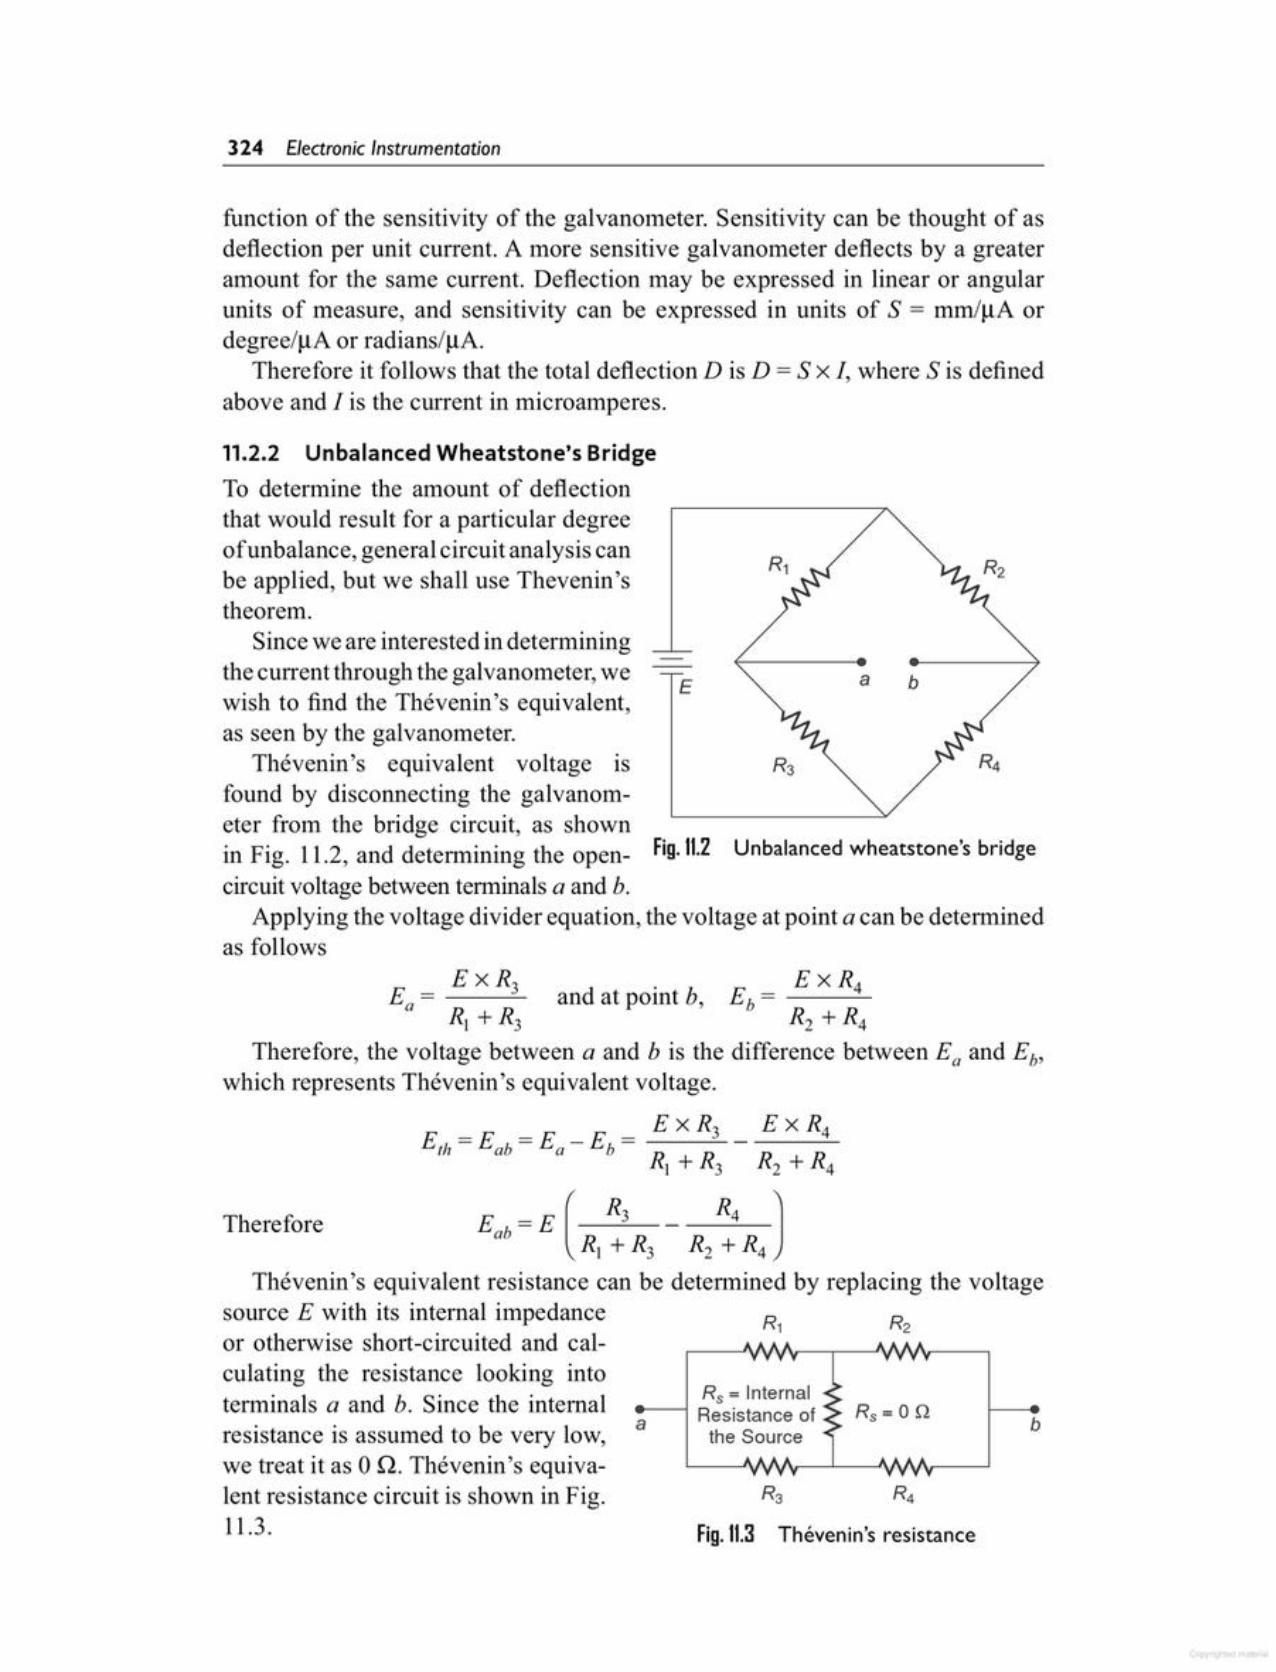
Fig.II.3 Thevenin's resistance
Rs = 0 QRs = Internal
·a---1 Resistance ofthe Source b
Thevenin's equivalent resistance can be determined by replacing the voltagesource E with its internal impedanceor otherwise short-circuited and calculating the resistance looking intoterminals a and b. Since the internalresistance is assumed to be very low,we treat it as 0 Q. Thevenin's equivalent resistance circuit is shown in Fig.11.3.
Therefore
Therefore, the voltage between a and b is the difference between Ea and Eb,
which represents Thevenin's equivalent voltage.
E =E = E _ E = E X R3 _ E X R4th ab a b R + R R + R
1 3 2 4
and at point b,
E ba
11.2.2 Unbalanced Wheatstone's BridgeTo determine the amount of deflectionthat would result for a particular degreeof unbalance, general circuit analysis canbe applied, but we shall use Thevenin'stheorem.
Since we are interested in determiningthe current through the galvanometer, wewish to find the Thevenin's equivalent,as seen by the galvanometer.
Theveniu's equivalent voltage isfound by disconnecting the galvanometer from the bridge circuit, as shownin Fig. 11.2, and determining the open- Fig.11.2 Unbalanced wheatstone's bridgecircuit voltage between terminals a and b.
Applying the voltage divider equation, the voltage at point a can be determinedas follows
function of the sensitivity of the galvanometer. Sensitivity can be thought of asdeflection per unit current. A more sensitive galvanometer deflects by a greateramount for the saIne current. Deflection may be expressed in linear or angularunits of measure, and sensitivity can be expressed in units of S = mmJI-LA ordegree/u.A or radians/u.A.
Therefore it follows that the total deflection Dis D =Sx I, where S is definedabove and I is the current in microamperes.
324 Electronic Instrumentation
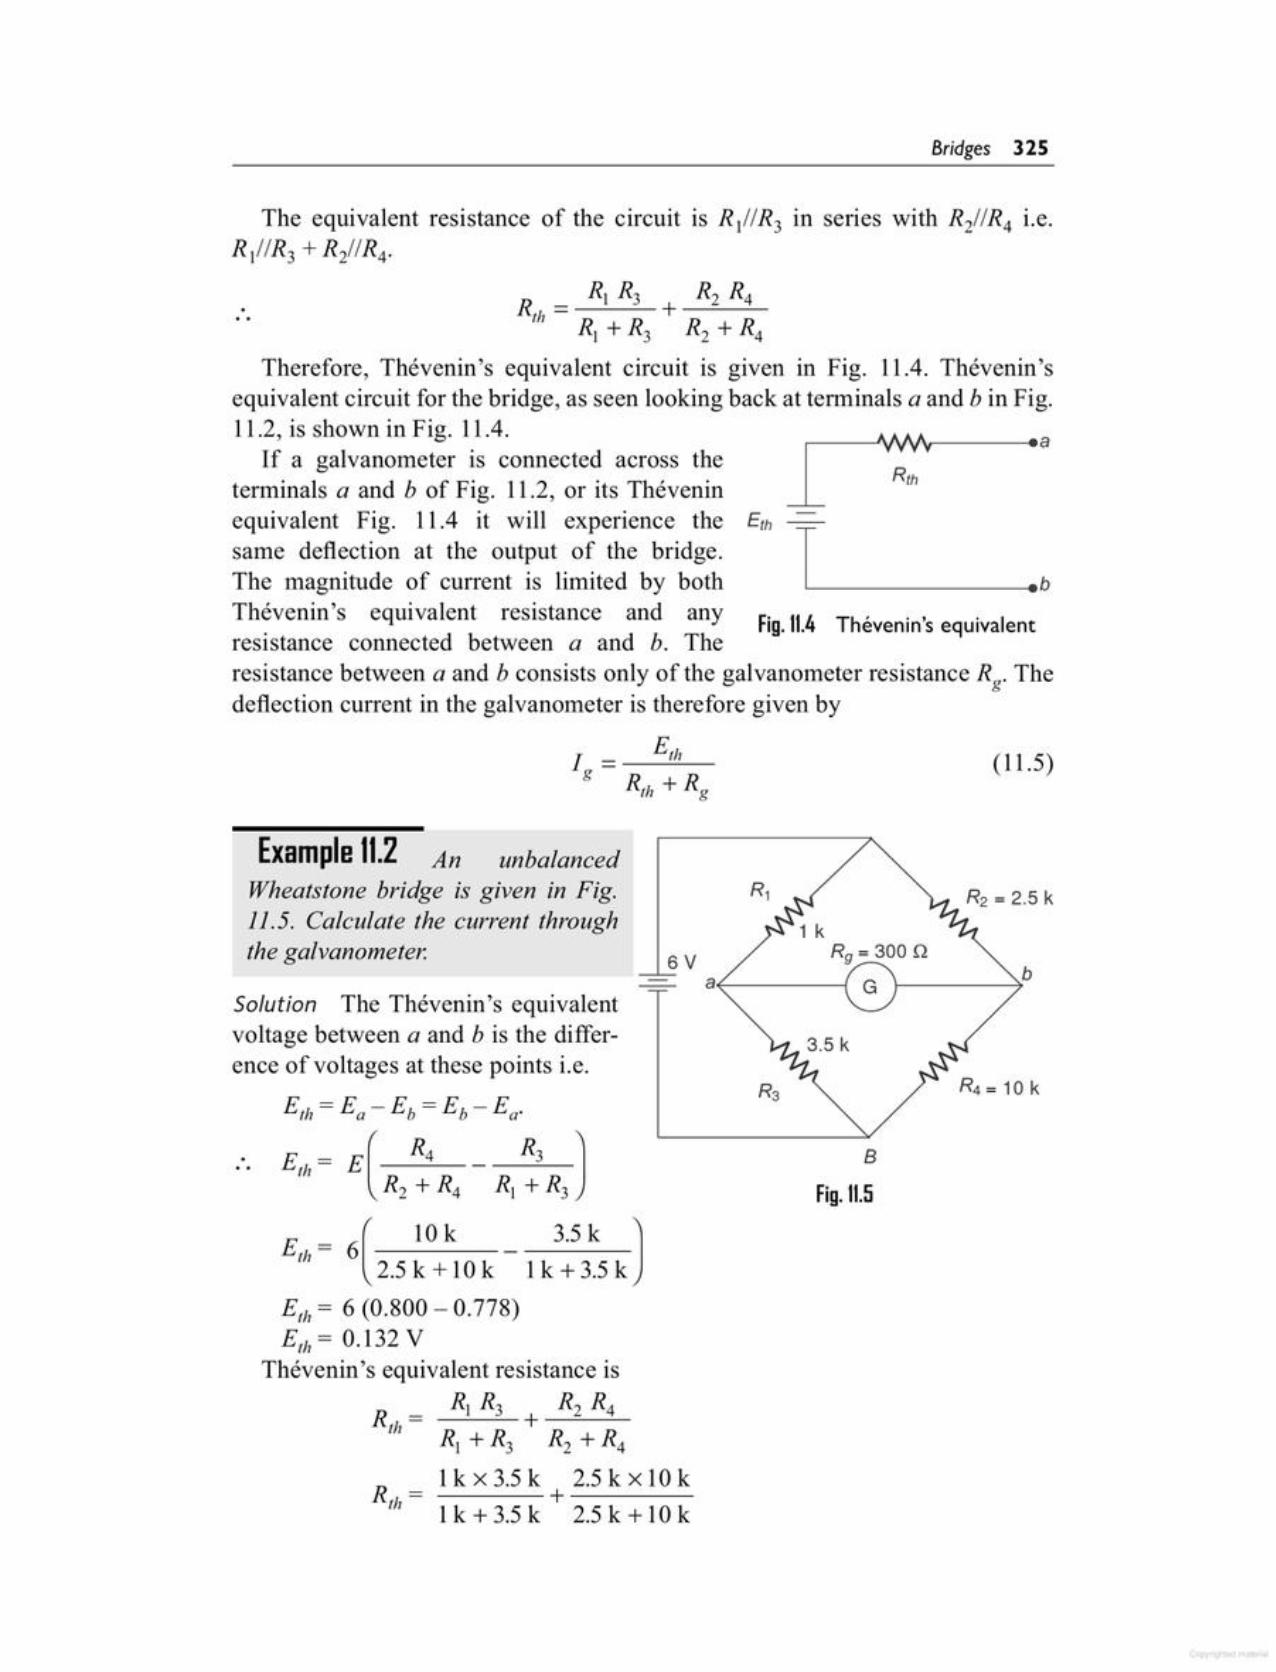
B
Fig.11.5
Solution The Thevenin's equivalentvoltage between a and b is the difference of voltages at these points i.e.
Eth = Ea - Eb = Eb - Ea·
E'h~ E( R,:4R4 R,; RJE'h= 6( 10k 3.5k J
2.5k+l0k lk+3.5kEth = 6 (0.800 - 0.778)E'h = 0.132 V
Thevenin's equivalent resistance isR, R3 R2 R4R th = + -=-----'---
R, + R3 R2 + R41k x 3.5 k 2.5 k x 10 k
Rth= +-----1k + 3.5 k 2.5 k + 10 k
a~----;6V
(11.5)
Example 11.2 An unbalancedWheatstone bridge is given in Fig.11.5. Calculate the current throughthe galvanometer.
Therefore, Thevenin's equivalent circuit is given in Fig. 11.4. Thevenin'sequivalent circuit for the bridge, as seen looking back at terminals a and b in Fig.11.2, is shown in Fig. 11.4.
If a galvanometer is connected across theterminals a and b of Fig. 11.2, or its Theveninequivalent Fig. 11.4 it will experience the Efh
same deflection at the output of the bridge. TThe magnitude of current is limited by both '-------- __.bThevenin's equivalent resistance and any Fig.II.4 Thevenin's equivalentresistance connected between a and b. Theresistance between a and b consists only of the galvanometer resistance Rg. Thedeflection current in the galvanometer is therefore given by
The equivalent resistance of the circuit is R/1R3 in series with R211R4 i.e.R,IIR3 + R211R4·
Bridges 325
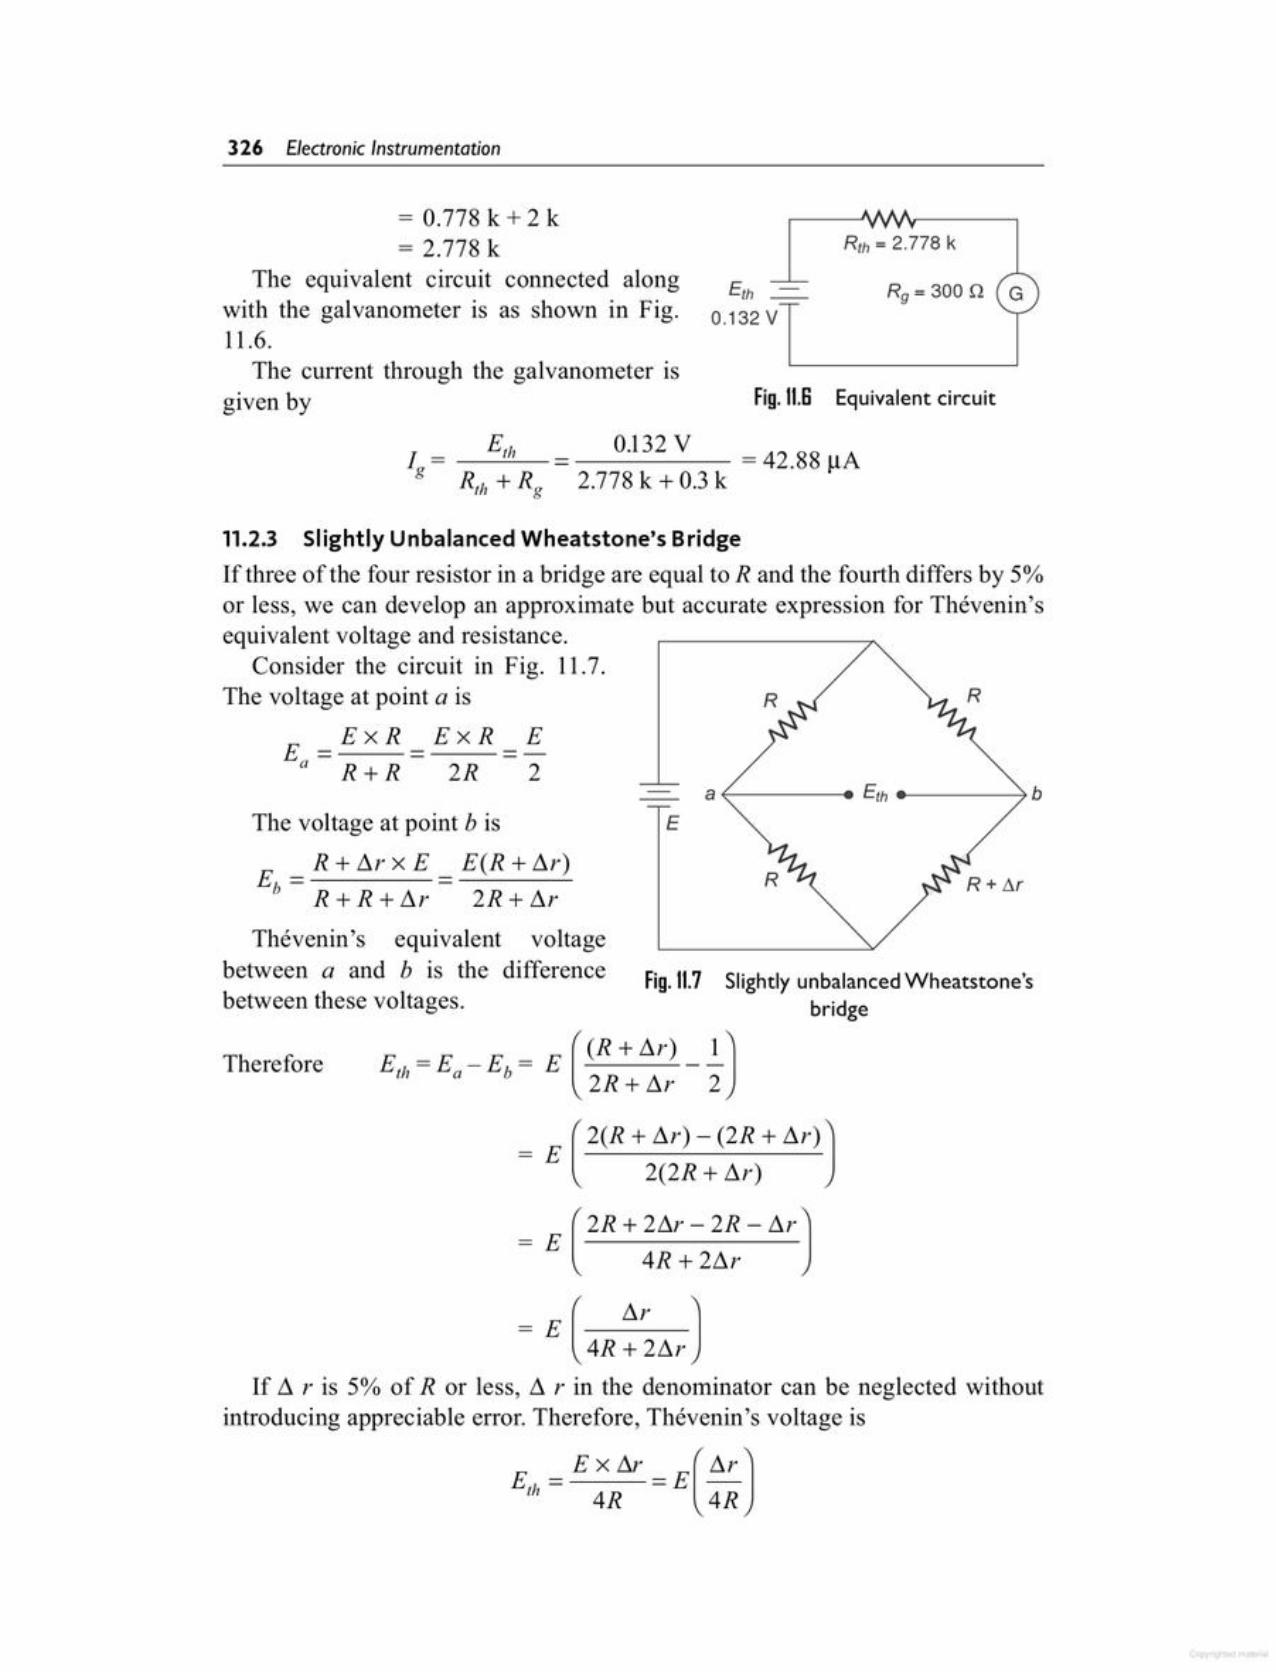
= E (2R + 2!:!'r - 2R - !:!.r]4R + 2!:!'r
- E (4R~~M]If !:!. r is 5% of R or less, !:!. r in the denominator can be neglected without
introducing appreciable error. Therefore, Thevenin's voltage is
E =EXt1r=E(!:!.r]th 4R 4R
Fig.lI.7 Slightly unbalanced Wheatstone'sbridge
Theveniu's equivalent voltagebetween a and b is the differencebetween these voltages.
Therefore E = E - E = E ((R + !:!.r) - _!_]th a b 2R + !:!.r 2
= E (2(R + !:!.r) - (2R + !:!.r)]2(2R + !:!.r)
The voltage at point b is E
E _ R + !:!.rx E _ E(R + !:!.r)b - R + R +!:!.r - 2R + !:!.r
11.2.3 Slightly Unbalanced Wheatstone's BridgeIf three of the four resistor in a bridge are equal to R and the fourth differs by 5%or less, we can develop an approximate but accurate expression for Thevenin'sequivalent voltage and resistance.
Consider the circuit in Fig. 11.7.The voltage at point a is
E =ExR=ExR=Ea R +R 2R 2
I = Elh _ 0.132 V . = 42.88 ~Ag Rrh+Rg 2.778k+0.3k
Fig. ItS Equivalent circuit
Eth -=-0.132 V
Rg = 300 Q
Rth = 2.778 k= 0.778 k + 2 k= 2.778 k
The equivalent circuit connected alongwith the galvanometer is as shown in Fig.11.6.
The current through the galvanometer isgiven by
326 Electronic Instrumentation
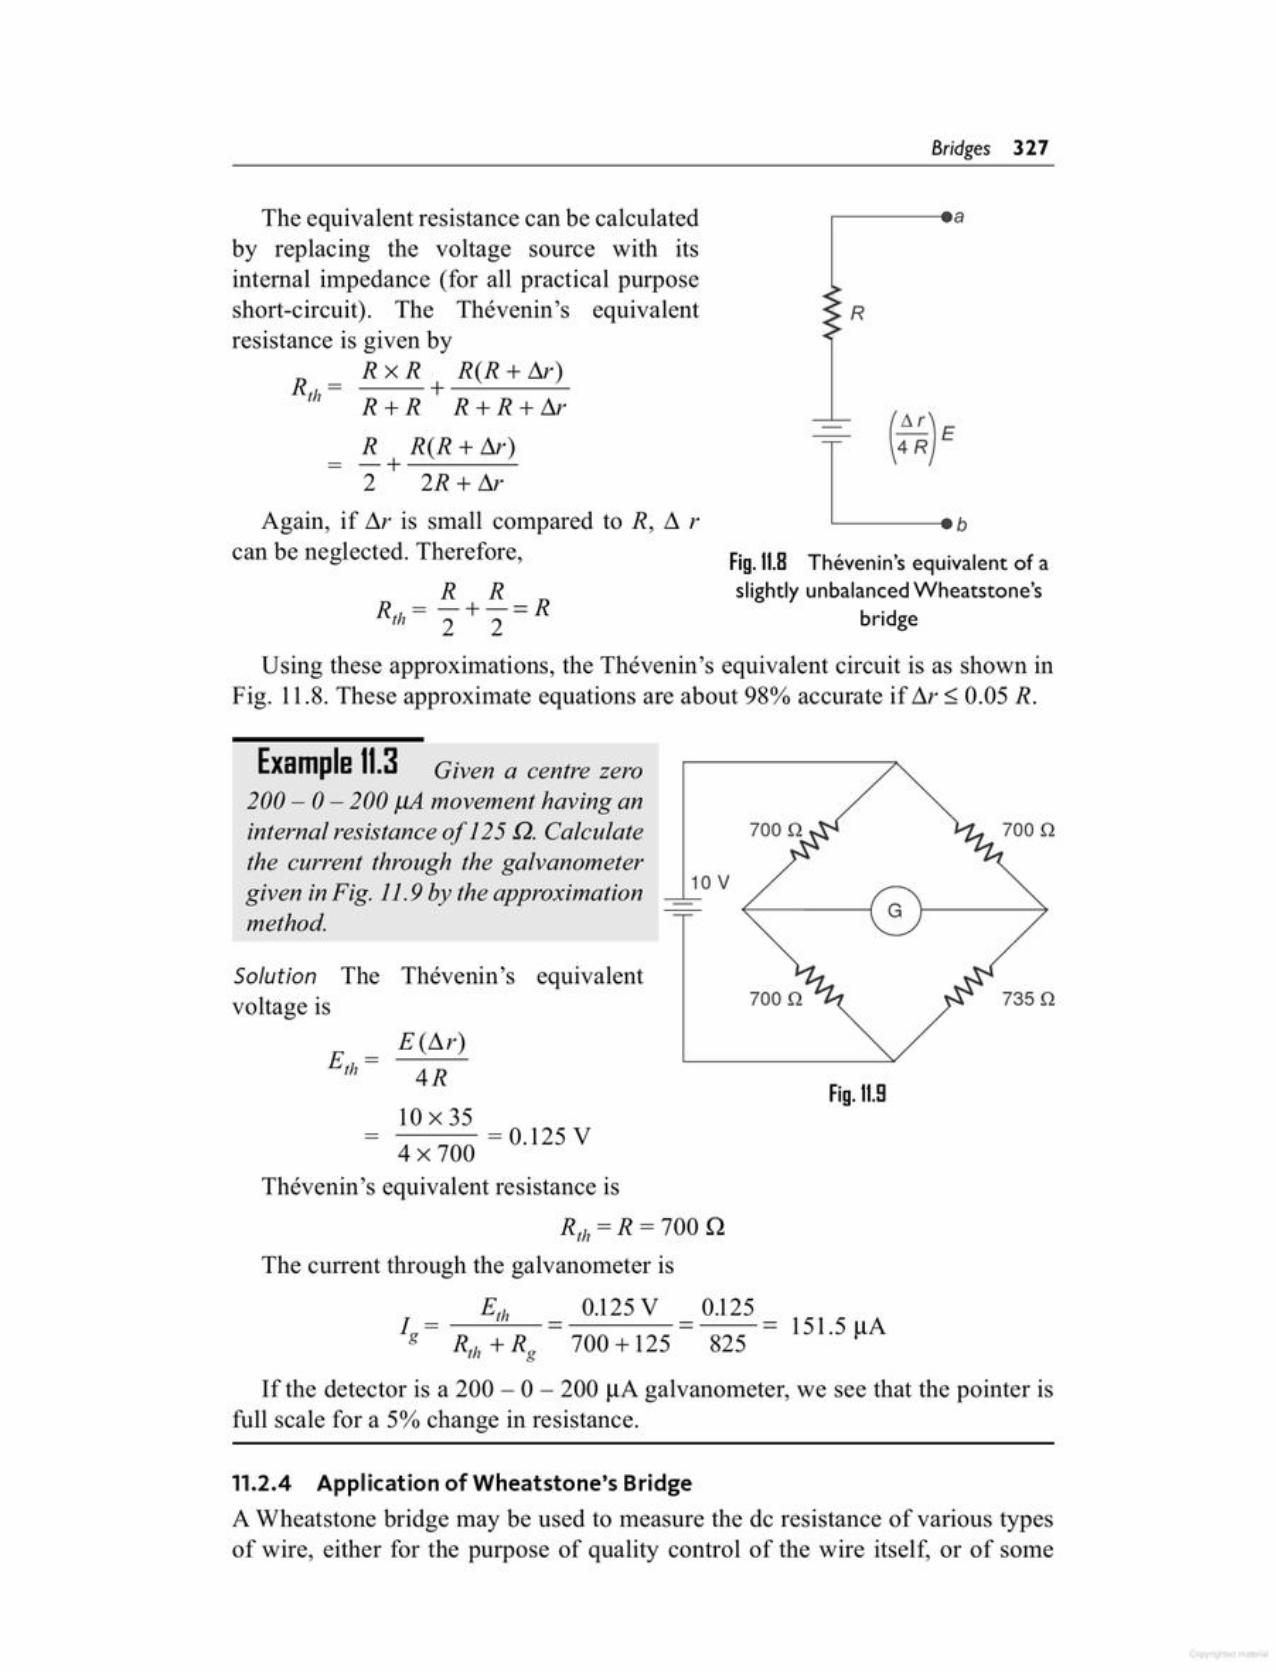
11.2.4 Application of Wheatstone's BridgeA Wheatstone bridge may be used to measure the de resistance of various typesof wire, either for the purpose of quality control of the wire itself, or of some
If the detector is a 200 - 0 - 200 JlA galvanometer, we see that the pointer isfull scale for a 5% change in resistance.
Thevenin's equivalent resistance is
Rth =R = 700 Q
The current through the galvanometer is
Erh 0.125 V 0.12519= - ---- 151.5 JlA
Rlh + Rg 700 + 125 825
Fig.11.9
Solution The Thevenin's equivalentvoltage is
10 V
735 Q
E (!1r)Eth = 4R
10 x 354 X 700 = 0.125 V
Example 11.3 Given a centre zero200 - 0- 200 J.lA movement having aninternal resistance of 125 fl. Calculatethe current through the galvanometergiven in Fig. 11.9 by the approximationmethod.
Using these approximations, the Thevenin's equivalent circuit is as shown inFig. 11.8. These approximate equations are about 98% accurate if Sr < 0.05 R.
L__-- b
Fig.II.8 Thevenin's equivalent of aslightly unbalanced Wheatstone's
bridge
R
,..---- aThe equivalent resistance can be calculatedby replacing the voltage source with itsinternal impedance (for all practical purposeshort-circuit). The Thevenin's equivalentresistance is given by
RxR R(R+!1r)Rlh = + -'-----'-
R+R R+R+!1rR R(R + !1r)- - + ___;__ --'-2 2R +!1r
Again, if !1r is small compared to R, !1 rcan be neglected. Therefore,
R RR = -+-=Rth 2 2
Bridges 327
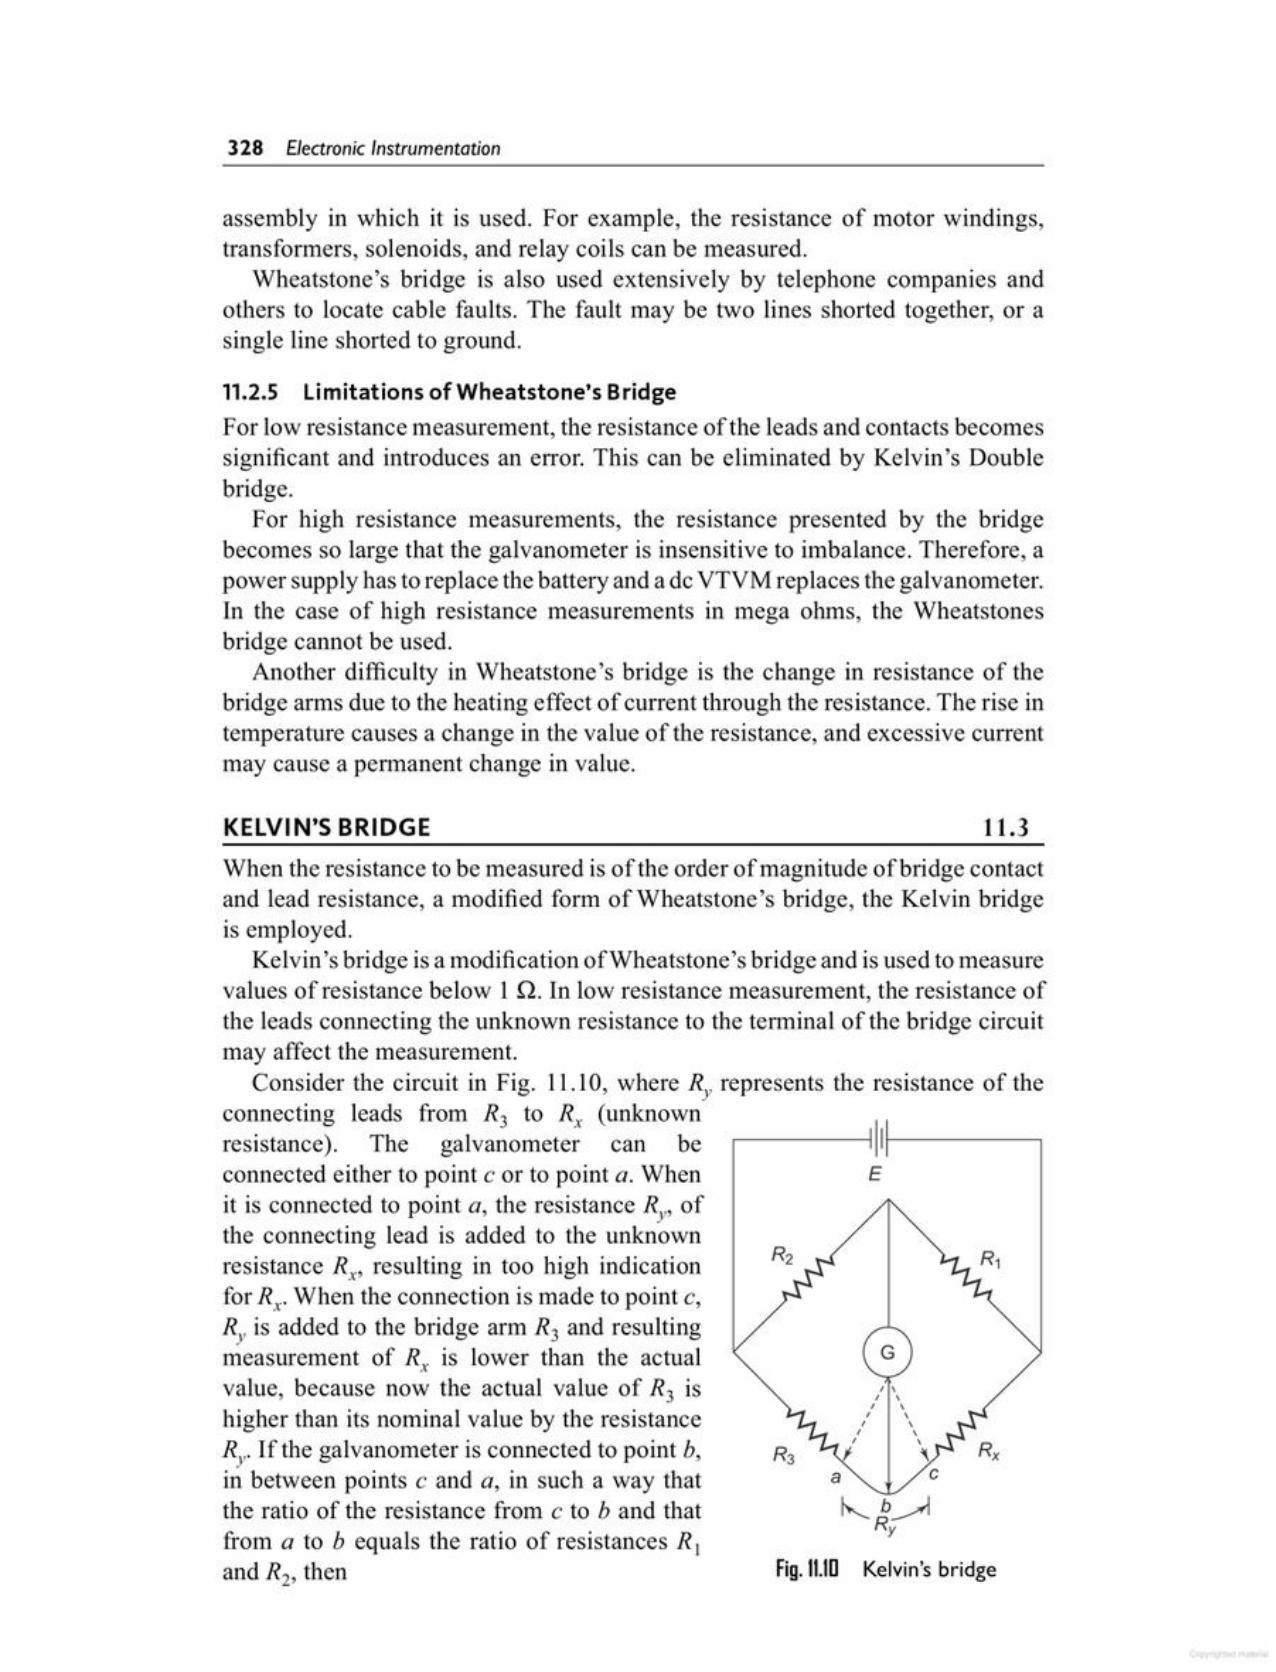
Fig. 11.10 Kelvin's bridge
ca
I \I \I \I \I \I \I \;- ,
G
Er-------t I11---------,
When the resistance to be measured is of the order of magnitude of bridge contactand lead resistance, a modified form of Wheatstone's bridge, the Kelvin bridgeis employed.
Kelvin's bridge is a modification of Wheatstone 's bridge and is used to measurevalues of resistance below 1Q. In low resistance measurement, the resistance ofthe leads connecting the unknown resistance to the terminal of the bridge circuitmay affect the measurement.
Consider the circuit in Fig. 11.10, where Ry represents the resistance of theconnecting leads from R3 to R; (unknownresistance). The galvanometer can beconnected either to point c or to point a.Whenit is connected to point a, the resistance Ry, ofthe connecting lead is added to the unknownresistance Rx, resulting in too high indicationfor Rx' When the connection is made to point c,Ry is added to the bridge arm R3 and resultingmeasurement of R; is lower than the actualvalue, because now the actual value of R3 ishigher than its nominal value by the resistanceRy If the galvanometer is connected to point b,in between points c and a, in such a way thatthe ratio of the resistance from c to b and thatfrom a to b equals the ratio of resistances R Iand R2, then
11.3KELVIN'S BRIDGE
11.2.5 Limitations of Wheatstone's BridgeFor low resistance measurement, the resistance of the leads and contacts becomessignificant and introduces an error. This can be eliminated by Kelvin's Doublebridge.
For high resistance measurements, the resistance presented by the bridgebecomes so large that the galvanometer is insensitive to imbalance. Therefore, apower supply has to replace the battery and a de VTVM replaces the galvanometer,In the case of high resistance measurements in mega ohms, the Wheats tonesbridge cannot be used.
Another difficulty in Wheatstone's bridge is the change in resistance of thebridge arms due to the heating effect of current through the resistance. The rise intemperature causes a change in the value of the resistance, and excessive currentmay cause a permanent change in value.
assembly in which it is used. For example, the resistance of motor windings,transformers, solenoids, and relay coils can be measured.
Wheatstone's bridge is also used extensively by telephone companies andothers to locate cable faults. The fault may be two lines shorted together, or asingle line shorted to ground.
328 Electronic Instrumentation
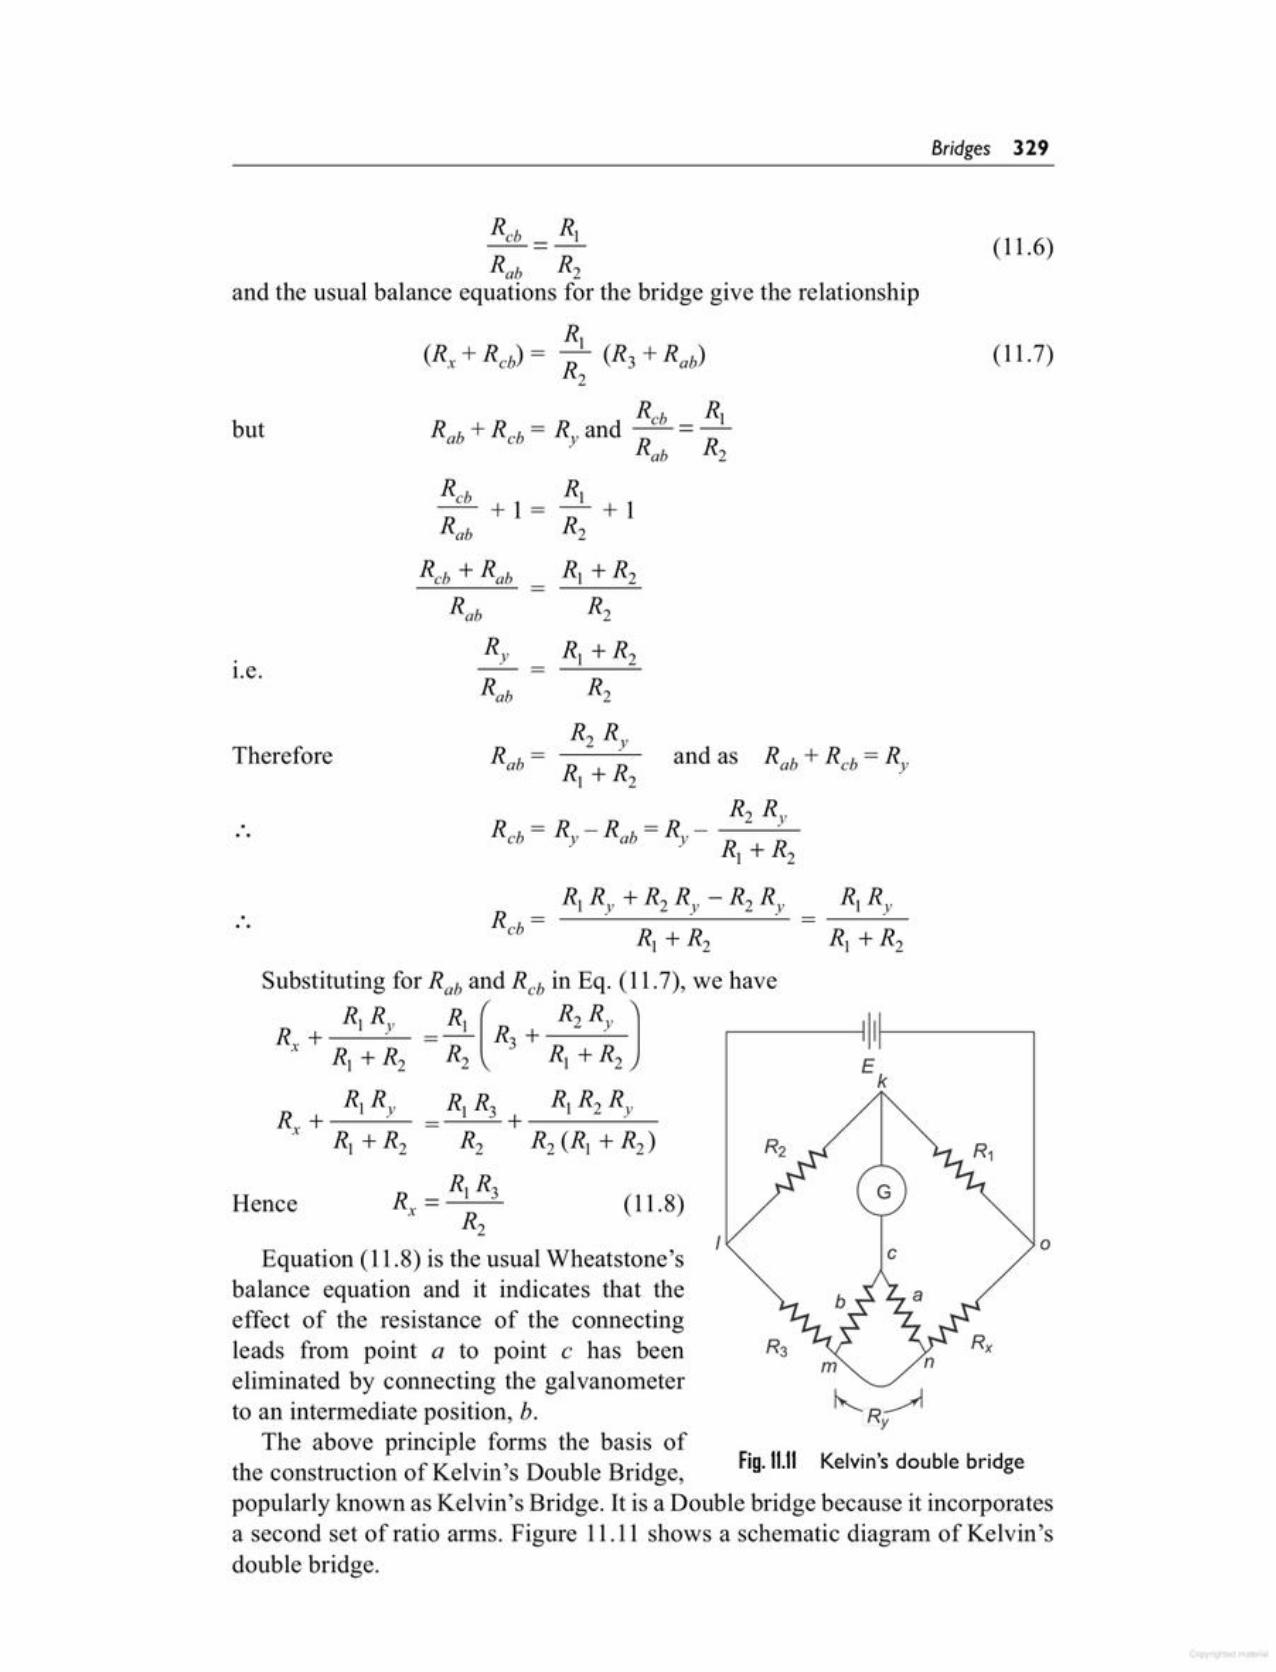
Kelvin's double bridgeFig. 11.11
~R_Ay
IEquation (11.8) is the usual Wheatstone's
balance equation and it indicates that theeffect of the resistance of the connectingleads from point a to point c has beeneliminated by connecting the galvanometerto an intermediate position, b.
The above principle forms the basis ofthe construction of Kelvin's Double Bridge,popularly known as Kelvin's Bridge. It is a Double bridge because it incorporatesa second set of ratio arms. Figure 11.11 shows a schematic diagram of Kelvin'sdouble bridge.
o
Hence
.---------lllf-----------,Ek
(11.8)
...
Therefore
Reb + RobRob
Ry-=r.e.
R)-+1R2
R) +R2R2
R) +R2R2
but
(11.7)
Rob R2and the usual balance equations for the bridge give the relationship
R)(Rx + Reb) = R2 (R3 + Rab)
( 11.6)
Bridges 329
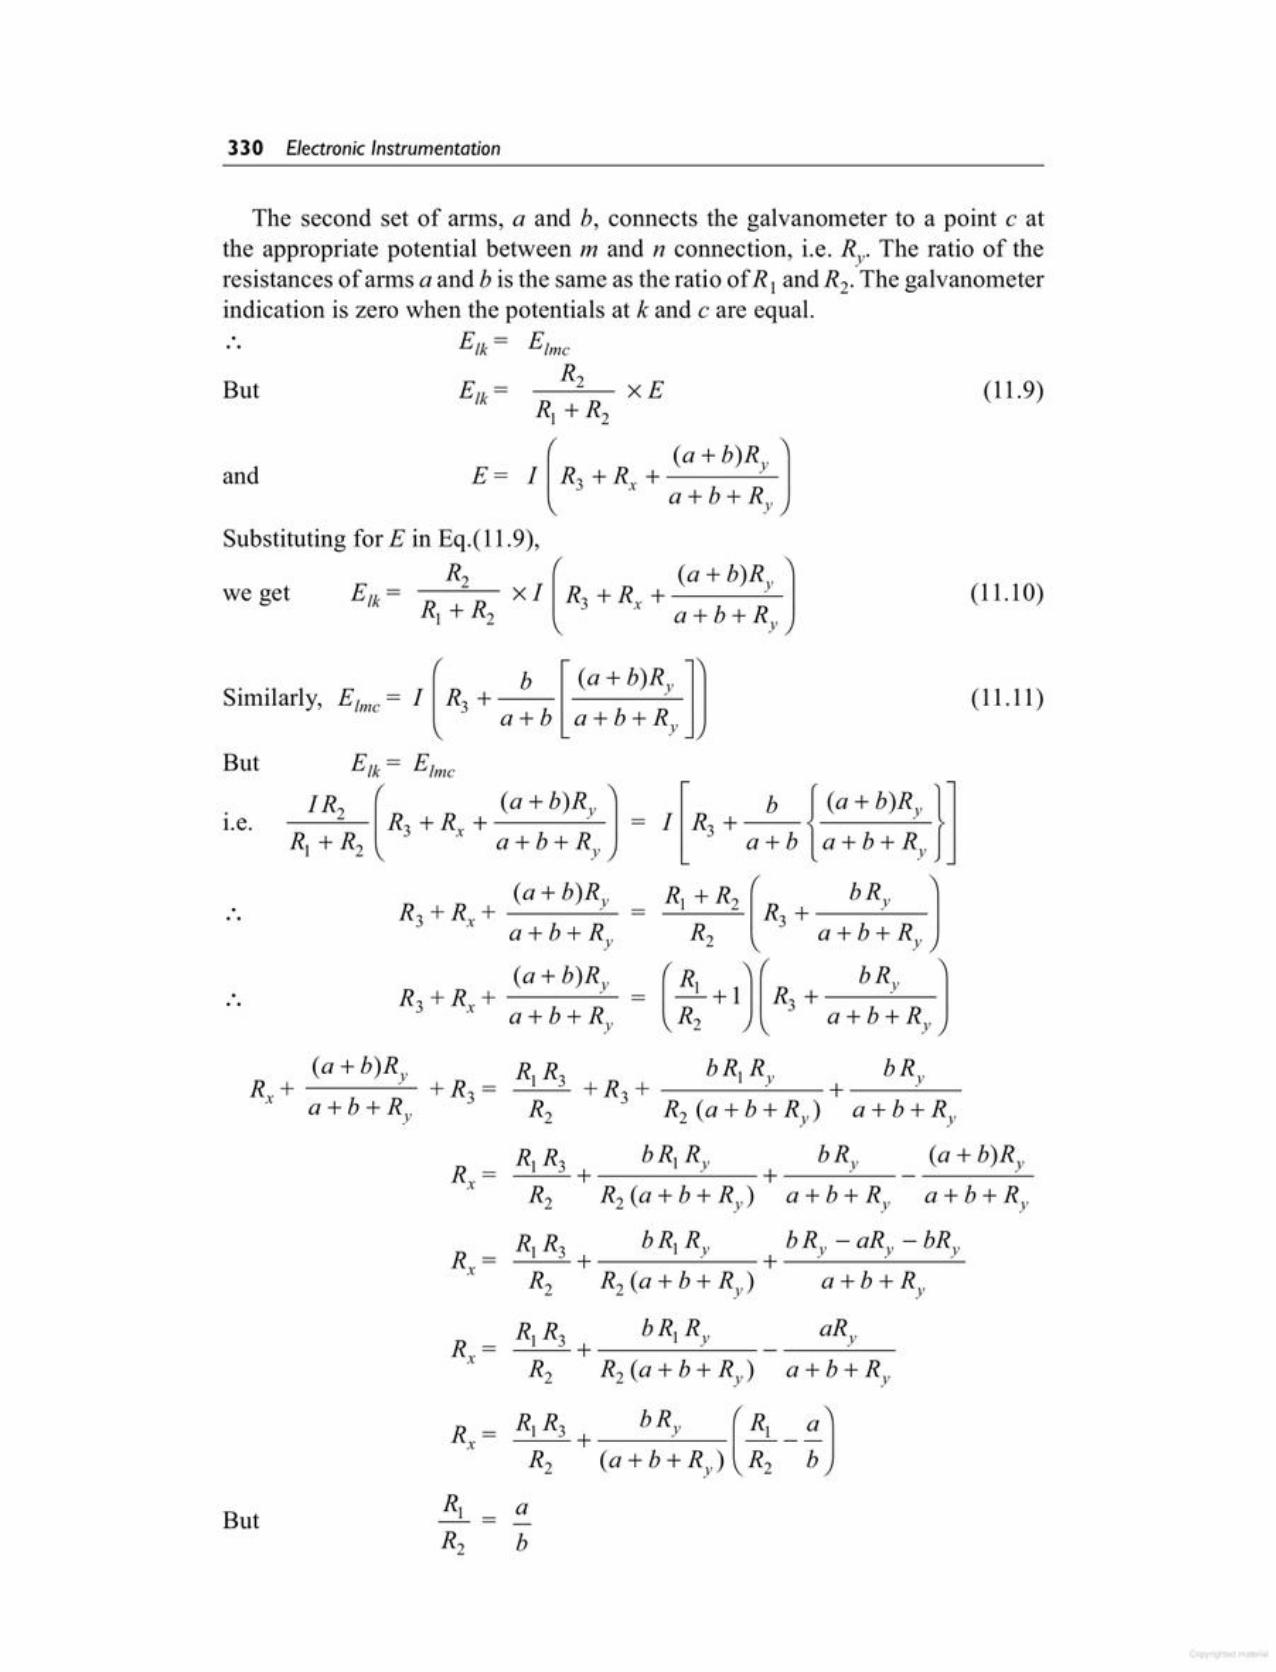
But
R =x
R =xR( R3 bR, Ry bRy - aRy - bRy---=-~+ +-...::....__.....::....__ ____::_R2 R2(a+b+Ry) a+b+Ry
RI R3 bR( Ry aRy---"-~+ ------'---R2 R2 (a + b + Ry) a + b + Ry
R, R3 b Ry ( R( a JR2 + (a + b + Ry) R2 - b
R =x
Rx+(a + b)Ry
+R3 =R( R3
+R3 +bR( Ry
+bRy
a +b + Ry R2 R2 (a+b+Ry) a + b + R;
R =R( R3 «e;«
+ -« (a + b)Ry+x R2 R2(a+b+Ry) a + b + Ry a + b + Ry
l.e.
But
(1l.11)b [(a+b)Ry]E .= I R +--lmc 3 a + b a + b +Ry
Similarly,
(11.10)
Substituting for E in Eq.(11.9),
R2 ( (a + b) R y Jwe get Elk = R R x I R3 + R, +__ ____:c..._
.+ 2 a + b + Ry
But (11.9)
E=and
The second set of arms, a and b, connects the galvanometer to a point c atthe appropriate potential between m and n connection, i.e. Ry- The ratio of theresistances of arms a and b is the same as the ratio ofR ( and R2. The galvanometerindication is zero when the potentials at k and c are equal.:. Elk = E/mc
R2_--=--- x E
330 Electronic Instrumentation
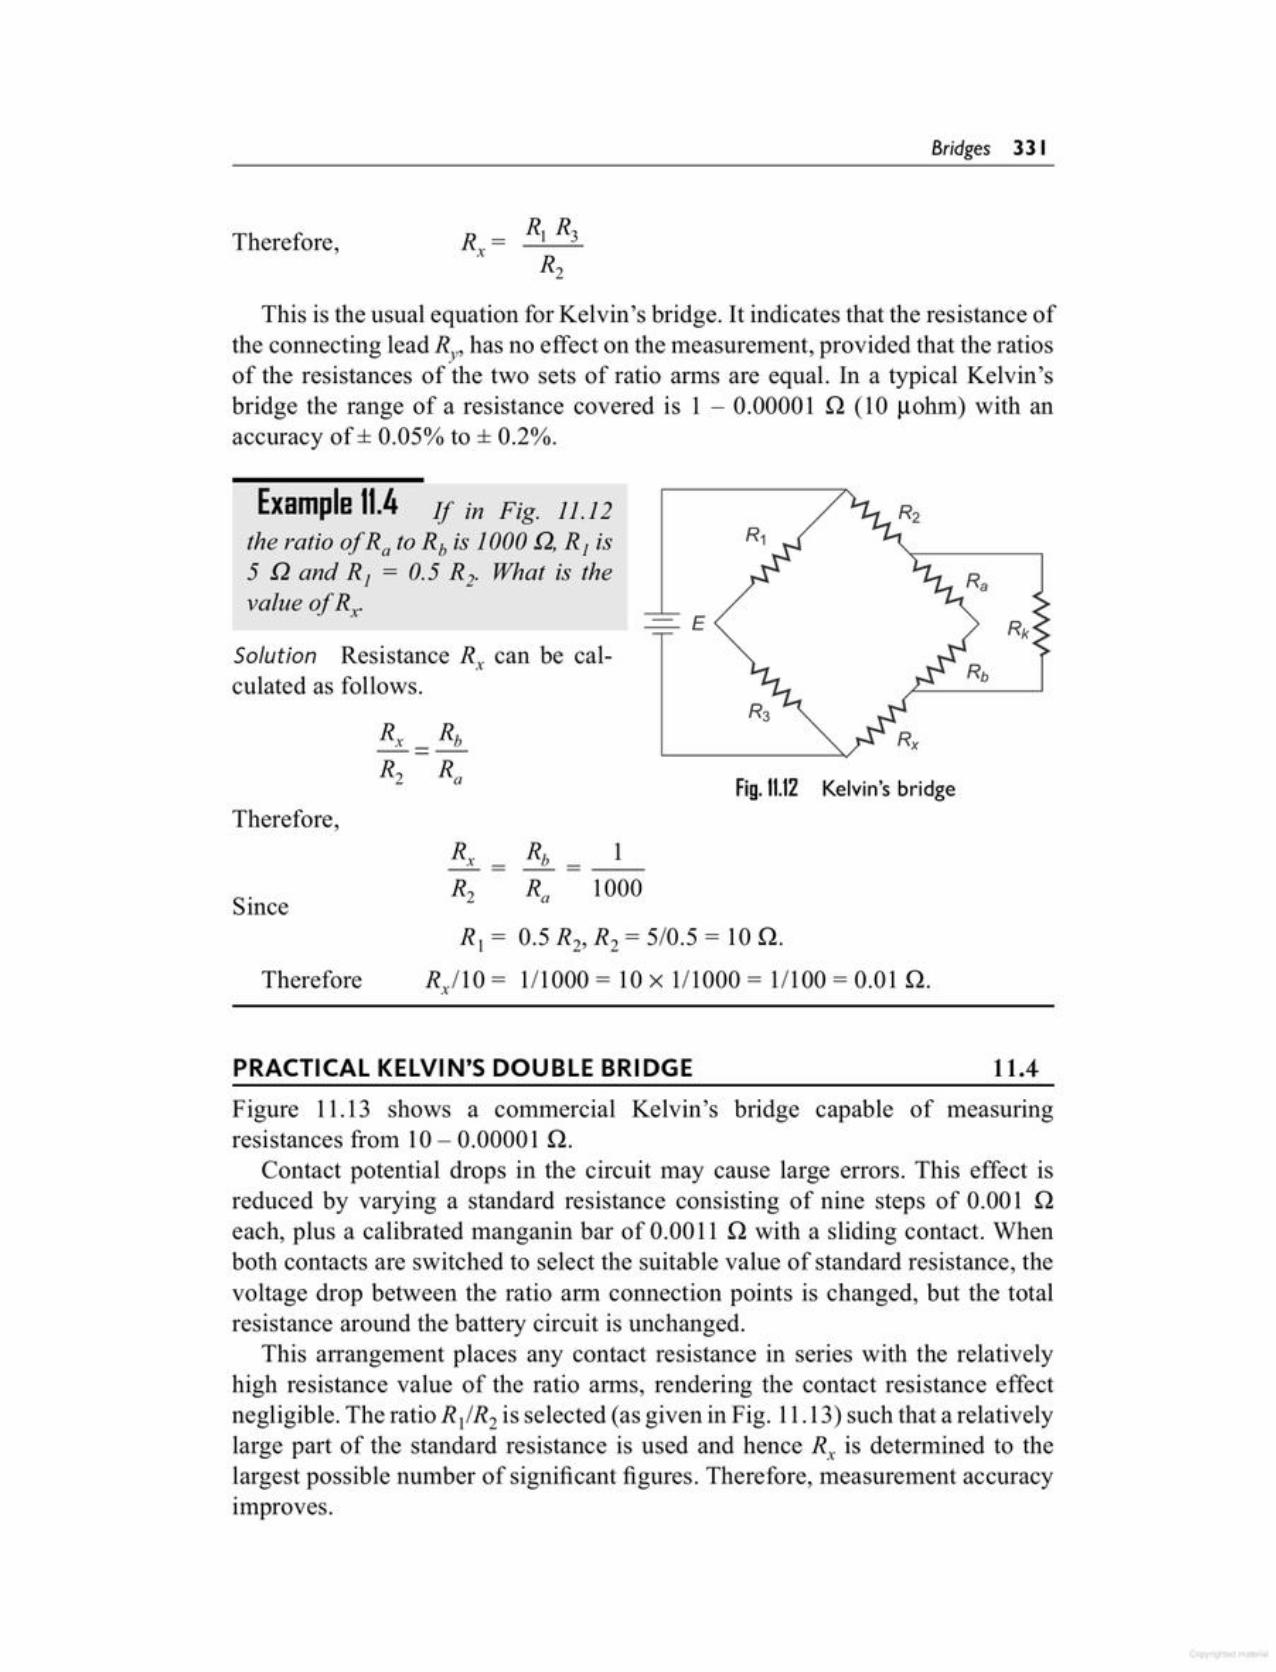
Figure 11.13 shows a commercial Kelvin's bridge capable of measuringresistances from 10 - 0.00001 Q.
Contact potential drops in the circuit may cause large errors. This effect isreduced by varying a standard resistance consisting of nine steps of 0.001 Qeach, plus a calibrated manganin bar of 0.0011 Q with a sliding contact. Whenboth contacts are switched to select the suitable value of standard resistance, thevoltage drop between the ratio arm connection points is changed, but the totalresistance around the battery circuit is unchanged.
This arrangement places any contact resistance in series with the relativelyhigh resistance value of the ratio arms, rendering the contact resistance effectnegligible. The ratio R /R2 is selected (as given in Fig. 11.13) such that a relativelylarge part of the standard resistance is used and hence R; is determined to thelargest possible number of significant figures. Therefore, measurement accuracyImproves.
11.4PRACTICAL KELVIN'S DOUBLE BRIDGE
R, = 0.5 R2, R2 = 5/0.5 = 10Q.
Rx/10 = 111000 = 10 x 1/1000 = 1/100 = 0.01 Q.Therefore
Since
Therefore,Fig. 11.12 Kelvin's bridge
Solution Resistance R; can be calculated as follows.
-==- E
Example 11.4 If in Fig. 11.12the ratio of Ra to Rb is 1000 Q,R J is5 Q and Rj = 0.5 R2. What is thevalue of R;
This is the usual equation for Kelvin's bridge. It indicates that the resistance ofthe connecting lead Ry, has no effect on the measurement, provided that the ratiosof the resistances of the two sets of ratio arms are equal. In a typical Kelvin'sbridge the range of a resistance covered is 1 - 0.00001 Q (10 uohm) with anaccuracy of ± 0.05% to ± 0.2%.
Therefore,
Bridges 331
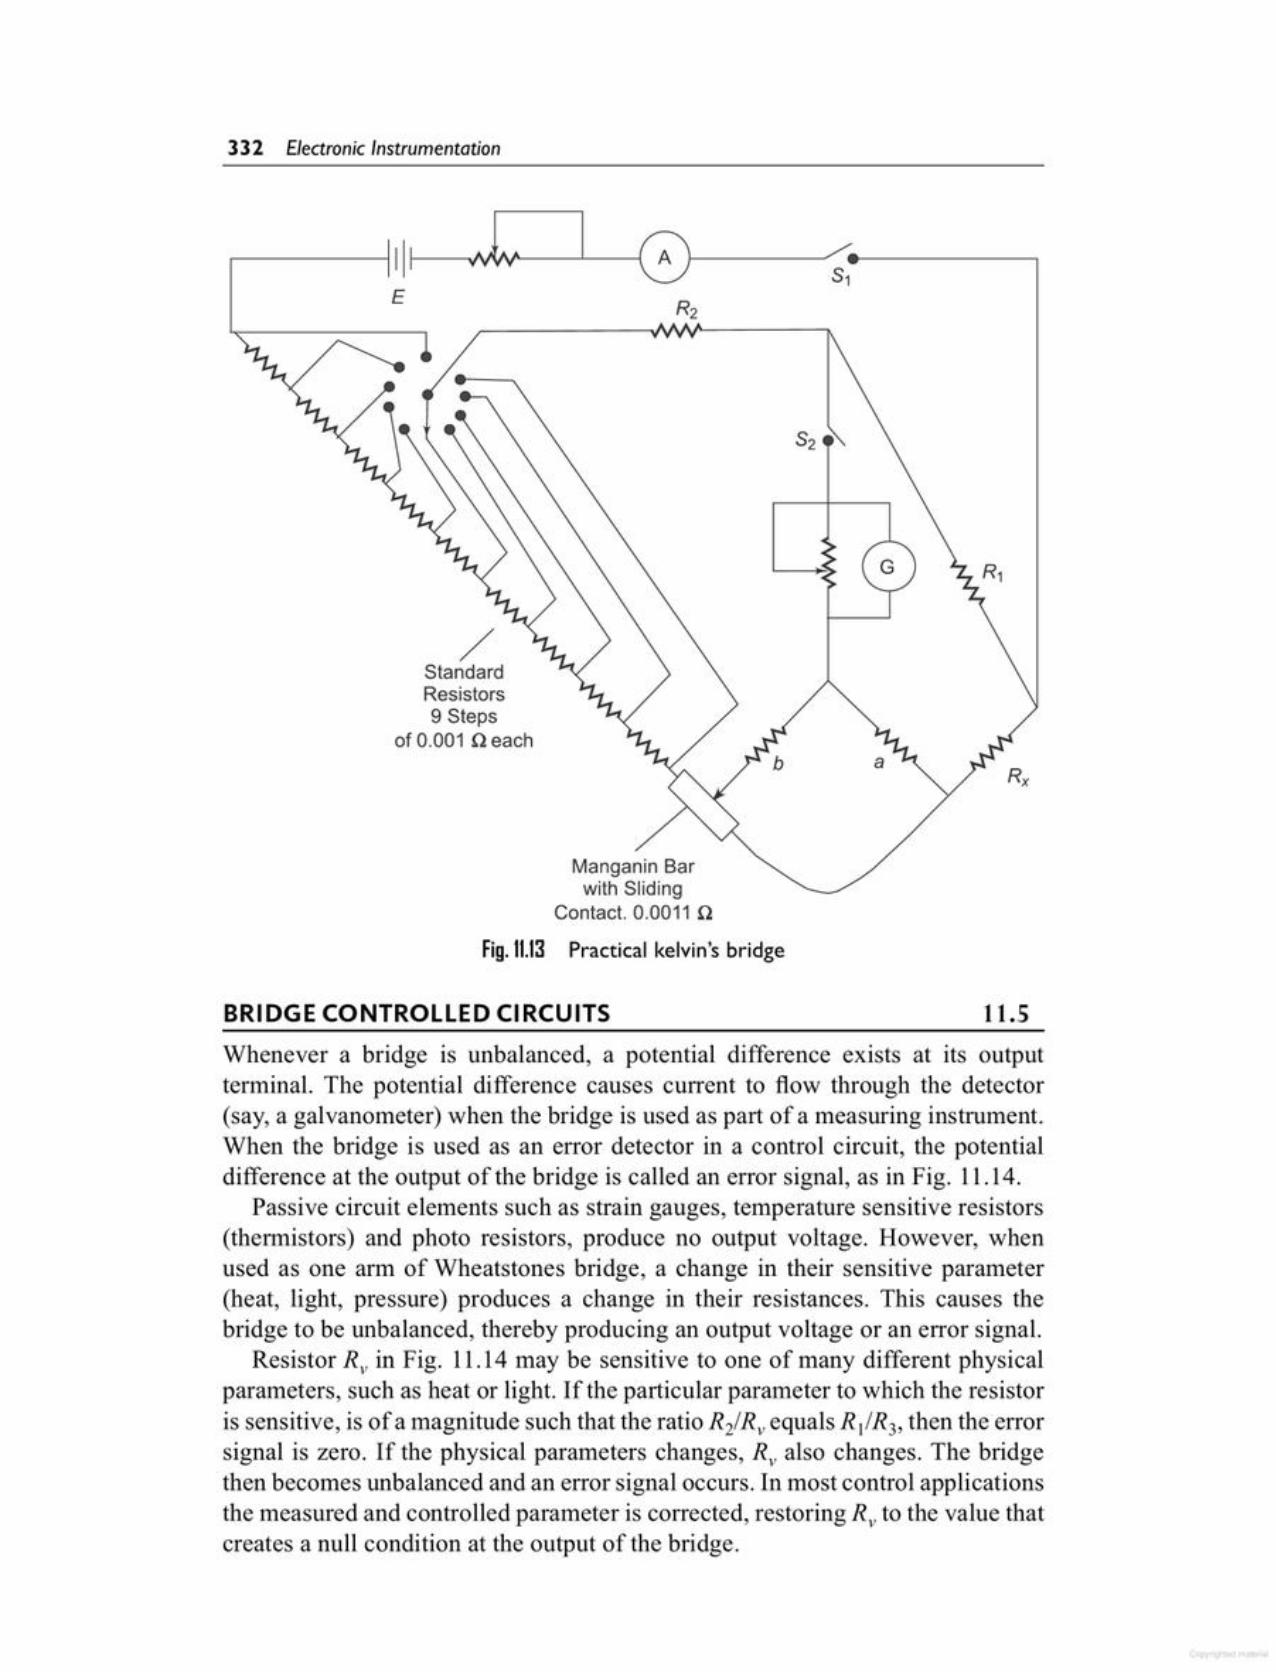
Whenever a bridge is unbalanced, a potential difference exists at its outputterminal. The potential difference causes current to flow through the detector(say, a galvanometer) when the bridge is used as part of a measuring instrument.When the bridge is used as an error detector in a control circuit, the potentialdifference at the output of the bridge is called an error signal, as in Fig. 11.14.
Passive circuit elements such as strain gauges, temperature sensitive resistors(thermistors) and photo resistors, produce no output voltage. However, whenused as one arm of Wheatstones bridge, a change in their sensitive parameter(heat, light, pressure) produces a change in their resistances. This causes thebridge to be unbalanced, thereby producing an output voltage or an error signal.
Resistor R; in Fig. 11.14 may be sensitive to one of many different physicalparameters, such as heat or light. If the particular parameter to which the resistoris sensitive, is of a magnitude such that the ratio R21Rv equals R11R3, then the errorsignal is zero. If the physical parameters changes, R; also changes. The bridgethen becomes unbalanced and an error signal occurs. In most control applicationsthe measured and controlled parameter is corrected, restoring R; to the value thatcreates a null condition at the output of the bridge.
11.5BRIDGE CONTROLLED CIRCUITS
Manganin Barwith Sliding
Contact. 0.0011nFig. 11.13 Practical kelvin's bridge
/StandardResistors9 Steps
of 0.001neach
.----1111--1 -L~--'----I81--_"'~--------'E
332 Electronic Instrumentation
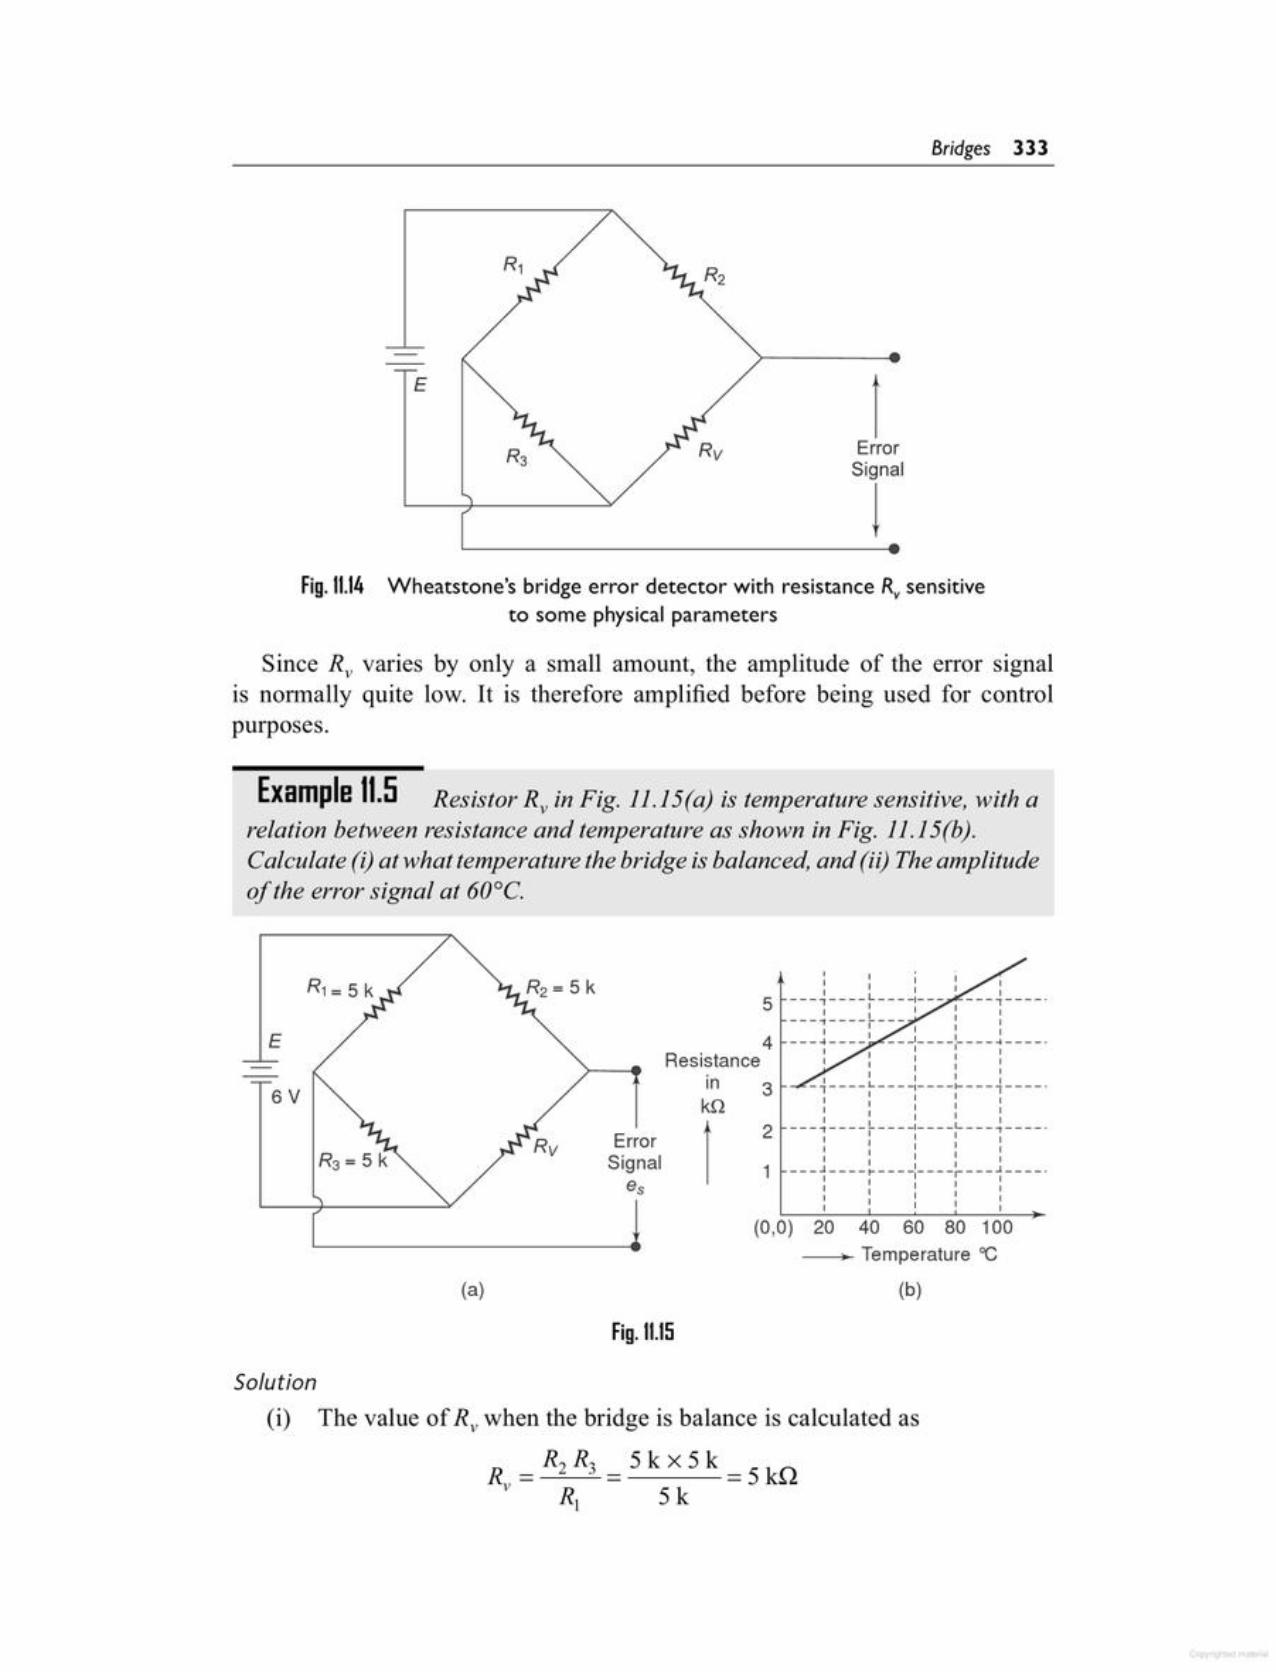
Solution(i) The value of R; when the bridge is balance is calculated as
R = R2 R3 = 5 k x 5 k = 5 kQv R 5 kI
Fig.11.15
(b)(a)
(0,0) 20 40 60 80 100-~ Temperature "C
E
,I II I---,----L----I--- ---,----.II I I
---~-------- II I I I I---4----' ---1----1---- ..-----
I I I II I I I I
I I II I , I :-,----~---~----~---,----.I I I II I I II I , I___ , L ~_---L_--,----.I I I I II I I I II I I I I
I I I---j----~--------r---j----·I I I I II I' II I I II I I I I
5
4Resistance
In 3kQ
Error 12
Signal 1es
6V
Example 11.5 Resistor R; in Fig. 11.15(a) is temperature sensitive, with arelation between resistance and temperature as shown in Fig. 11.15(b).Calculate (i) at what temperature the bridge is balanced, and (ii) The amplitudeof the error signal at 60°C.
Since R; varies by only a small amount, the amplitude of the error signalis normally quite low. It is therefore amplified before being used for controlpurposes.
Fig.11.14 Wheatstone's bridge error detector with resistance R; sensitiveto some physical parameters
1ErrorSignal
!
E
Bridges 333
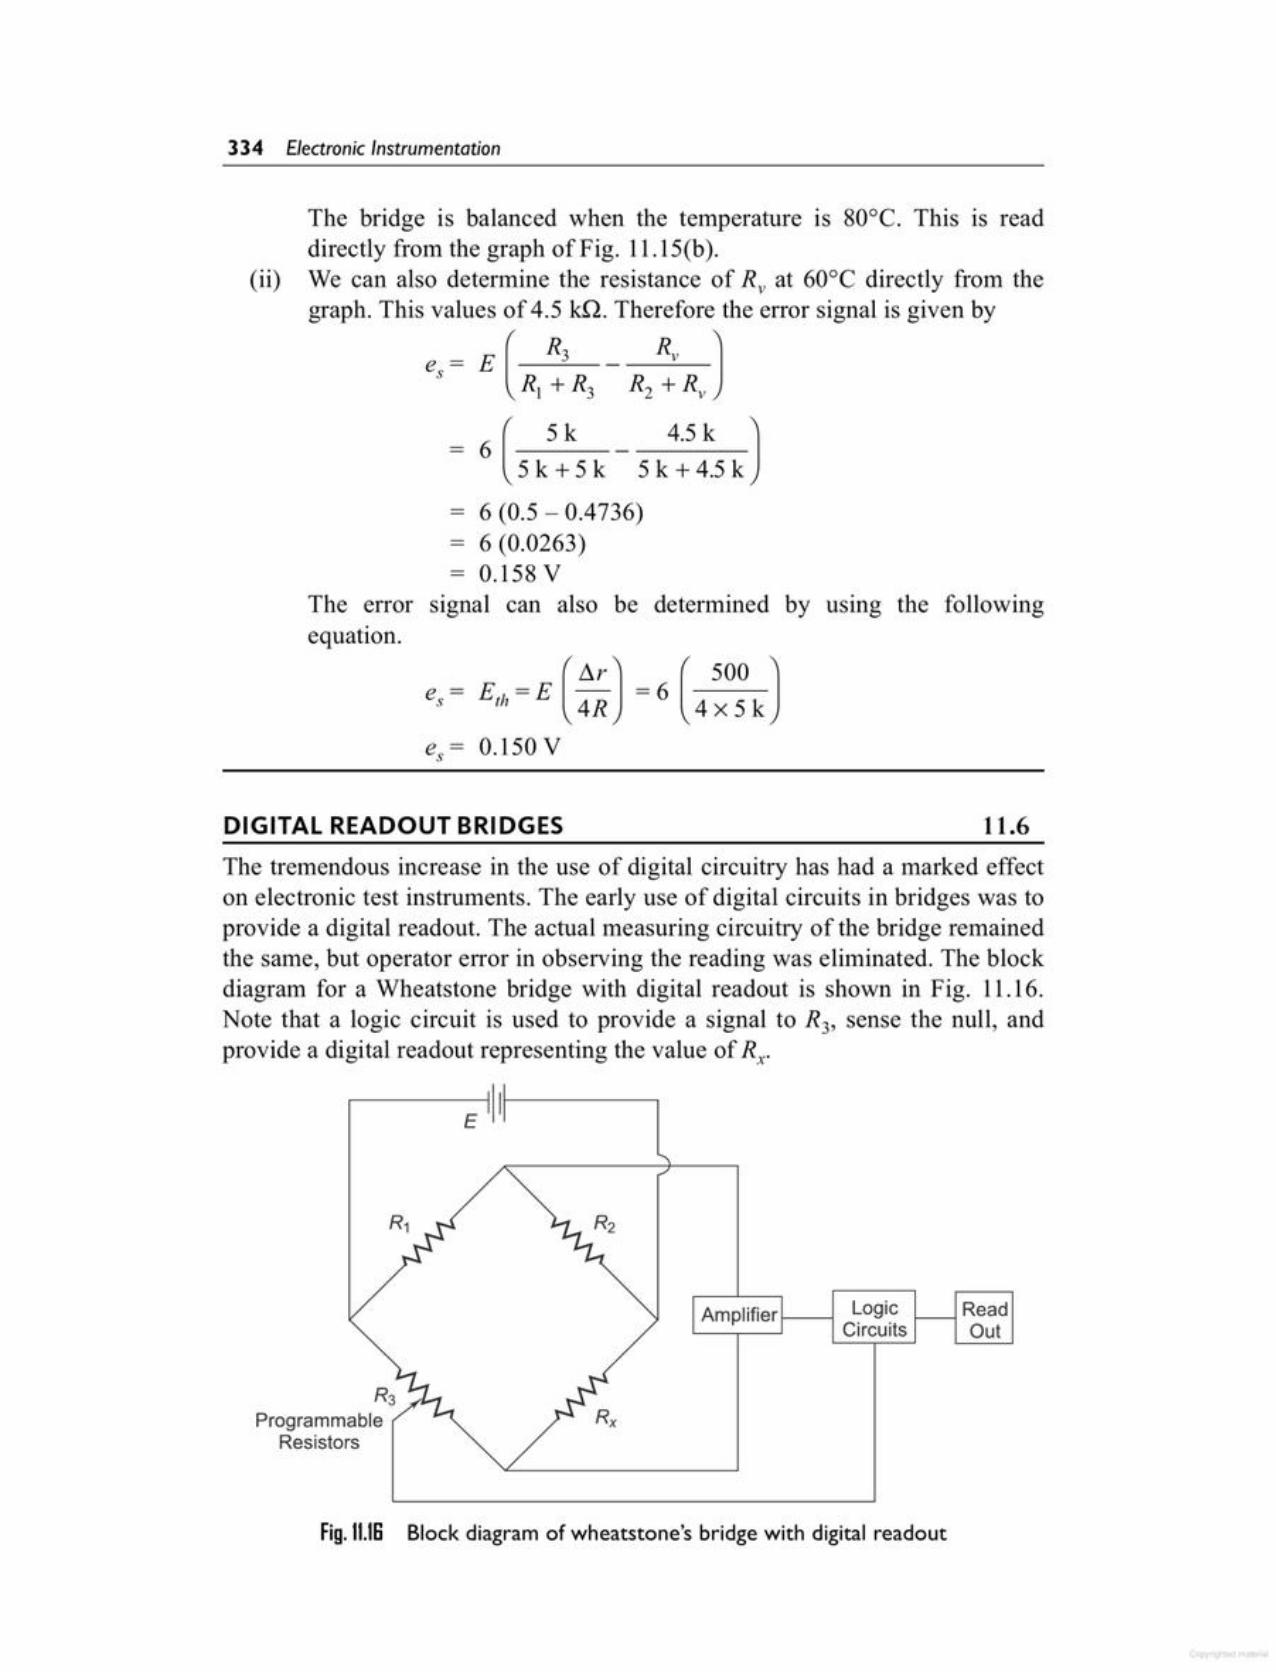
Fig. 11.18 Block diagram of wheatstone's bridge with digital readout
R3Programmable
Resistors
Amplifierl----i Logic f----l ReadCircuits Out
The tremendous increase in the use of digital circuitry has had a marked effecton electronic test instruments. The early use of digital circuits in bridges was toprovide a digital readout. The actual measuring circuitry of the bridge remainedthe same, but operator error in observing the reading was eliminated. The blockdiagram for a Wheatstone bridge with digital readout is shown in Fig. 11.16.Note that a logic circuit is used to provide a signal to R3, sense the null, andprovide a digital readout representing the value of Rx'
11.6DIGITAL READOUT BRIDGES
The bridge is balanced when the temperature is 80°C. This is readdirectly from the graph of Fig. 11.15(b).
(ii) We can also determine the resistance of R; at 60°C directly from thegraph. This values of 4.5 ill. Therefore the error signal is given by
e,~ E ( R, ; RJ R, ~ RJ_ 6 ( 5 k 4.5 k J
5 k + 5 k 5 k + 4.5 k
- 6 (0.5 - 0.4736)- 6 (0.0263)- 0.158 V
The error signal can also be determined by using the followingequation.
334 Electronic Instrumentation
Digital computers have been used in conjunction with test systems, bridges,and process controllers for several years. In these applications, computers wereused to give instructions and perform operations on the data measured. Whenmicroprocessors were first developed they were used in much the same way asdigital computers. However, real improvements in performance occurred when themicroprocessor was truly integrated into the instrument. With this accomplished,microprocessors cannot only give instructions about measurement, but also theycan change the way the measurements are taken. This innovation has given riseto a whole new class of instruments, called Intelligent Instruments.
The complexity and cost of making analog measurements can be reducedusing a microprocessor. This reduction of analog circuitry is important, even ifadditional digital circuitry must be added, because precision analog componentsare expensive. Also, adjusting, testing and troubleshooting analog circuits is timeconsuming and often expensive. Digital circuits can often replace analog circuitsbecause various functions can be done either way.
The following are some of the ways in which microprocessors are reducingthe cost and complexity of analog measurements.
1. Replacing sequential control logic with stored control programs.2. Eliminating some auxiliary equipment by handling interfacing,
programming and other system functions.3. Providing greater flexibility in the selection of measurement circuits,
thereby making it possible to measure one parameter and calculateanother paralneter of interest.
4. Reducing accuracy requirements by storing and applying correctionfactors.
Instruments in which microprocessors are an integral part can take the resultsof a measurement that is easiest to make in a given circuit, then calculate anddisplay the value of some other desired parameter, which may be much moredifficult to measure directly.
For example, conventional counters can measure the period of a lowfrequency waveform. This is then converted to frequency either manually, orusing extensive circuitry. On the other hand, such calculations are done veryeasily by a microprocessor. Measurements of resistance and conductance,which are reciprocals of each other offer another example. Some hybrid digital/analog bridges are designed to measure conductance by measuring current. Thismeasurement is then converted to a resistance value by rather elaborate circuitry.With a microprocessor based instrument, a resistance value is easily obtainedfrom the conductance measurement.
Many other similar examples could be presented. However, the importantthing to relnember is that the microprocessor is an integral part of the measuringinstrument. This results in an intelligent instrument that allows us to choose theeasiest method of measurement and requires only one measurement circuit toobtain various results. Specifically, one quantity can be measured in terms of
11.7MICROPROCESSOR CONTROLLED BRIDGES
Bridges 335
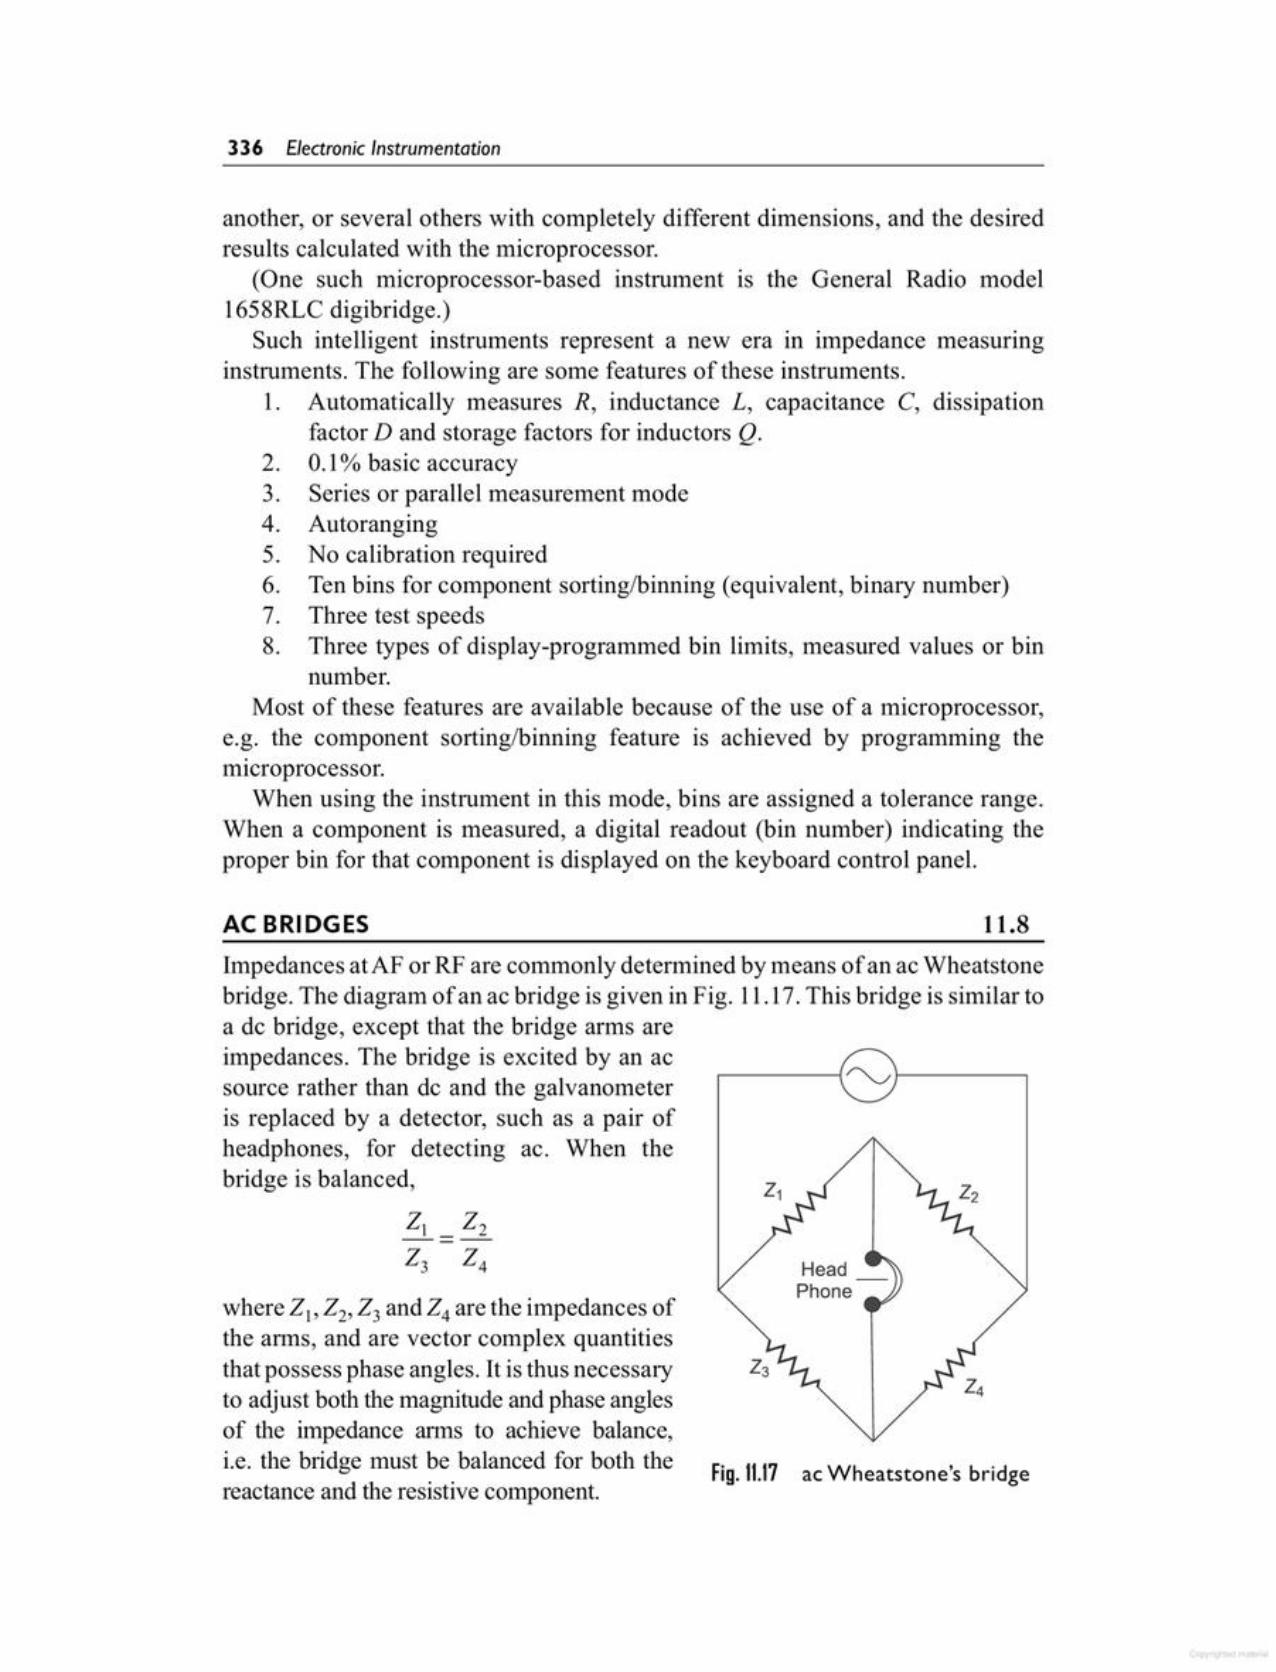
Fig. 11.17 acWheatstone's bridge
where 2" 22, 23 and 24are the impedances ofthe arms, and are vector complex quantitiesthat possess phase angles. It is thus necessaryto adjust both the magnitude and phase anglesof the impedance arms to achieve balance,i.e. the bridge must be balanced for both thereactance and the resistive component.
Impedances atAF or RF are commonly determined by means of an ac Wheatstonebridge. The diagram of an ac bridge is given in Fig. 11.17. This bridge is similar toa de bridge, except that the bridge arms areimpedances. The bridge is excited by an acsource rather than de and the galvanometeris replaced by a detector, such as a pair ofheadphones, for detecting ac. When thebridge is balanced,
11.8AC BRIDGES
another, or several others with completely different dimensions, and the desiredresults calculated with the microprocessor.
(One such microprocessor-based instrument is the General Radio model1658RLC digibridge.)
Such intelligent instruments represent a new era in impedance measuringinstruments. The following are some features of these instruments.
1. Automatically measures R, inductance L, capacitance C, dissipationfactor D and storage factors for inductors Q.
2. 0.1% basic accuracy3. Series or parallel measurement mode4. Autoranging5. No calibration required6. Ten bins for component sortingibinning (equivalent, binary number)7. Three test speeds8. Three types of display-programmed bin limits, measured values or bin
number.Most of these features are available because of the use of a microprocessor,
e.g. the component sortingibinning feature is achieved by programming themicroprocessor.
When using the instrument in this mode, bins are assigned a tolerance range.When a component is measured, a digital readout (bin number) indicating theproper bin for that component is displayed on the keyboard control panel.
336 Electronic Instrumentation
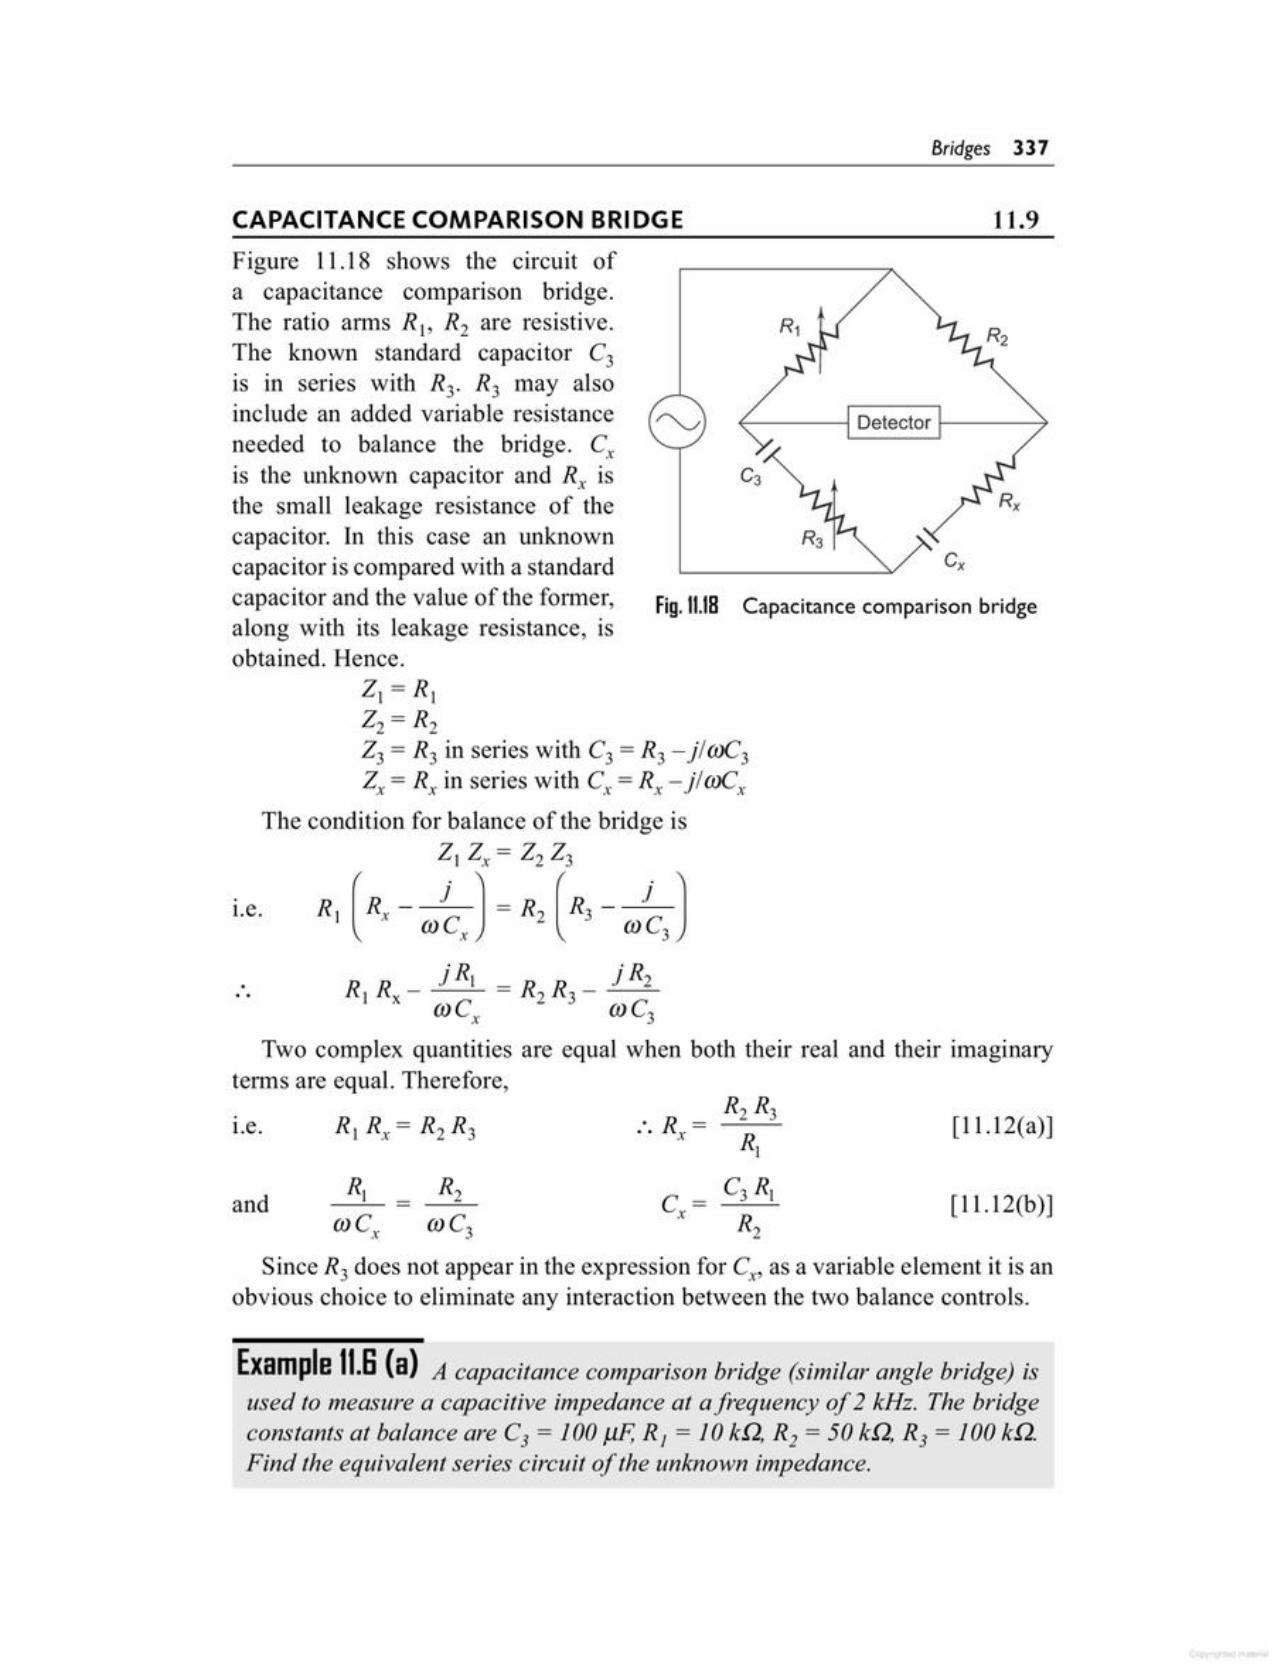
Example I1.S (a) A capacitance comparison bridge (similar angle bridge) isused to measure a capacitive impedance at afrequency of 2 kHz. The bridgeconstants at balance are C3 = 100 J1F, R, = 10 kQ, R2 = 50 kQ, R3 = 100 kQ.Find the equivalent series circuit of the unknown impedance.
Since R3 does not appear in the expression for Cx, as a variable element it is anobvious choice to eliminate any interaction between the two balance controls.
[11.12(b)]
[11.12(a)]
C=xand
l.e.
j RI j R2RI Rx - = R2 R3 - -~(J)C, (J)C3
Two complex quantities are equal when both their real and their imaginaryterms are equal. Therefore,
Capacitance comparison bridgeFig. 11.18
r.e.
Figure 11.l8 shows the circuit ofa capacitance comparison bridge.The ratio arms R1, R2 are resistive.The known standard capacitor C3
is in series with R3. R3 may alsoinclude an added variable resistanceneeded to balance the bridge. C;is the unknown capacitor and R; isthe small leakage resistance of thecapacitor. In this case an unknowncapacitor is compared with a standardcapacitor and the value of the former,along with its leakage resistance, isobtained. Hence.
ZI = RIZ2 = R2Z3 = R3 in series with C3 = R3 - jl(J)C3Z; = R, in series with C,= R; - jl (J)Cx
The condition for balance of the bridge isZI z,= Z2 Z3
( .) ( . )R_J - R_JRI x (J)Cx - R2 3 (J)C3
11.9CAPACITANCE COMPARISON BRIDGE
Bridges 337
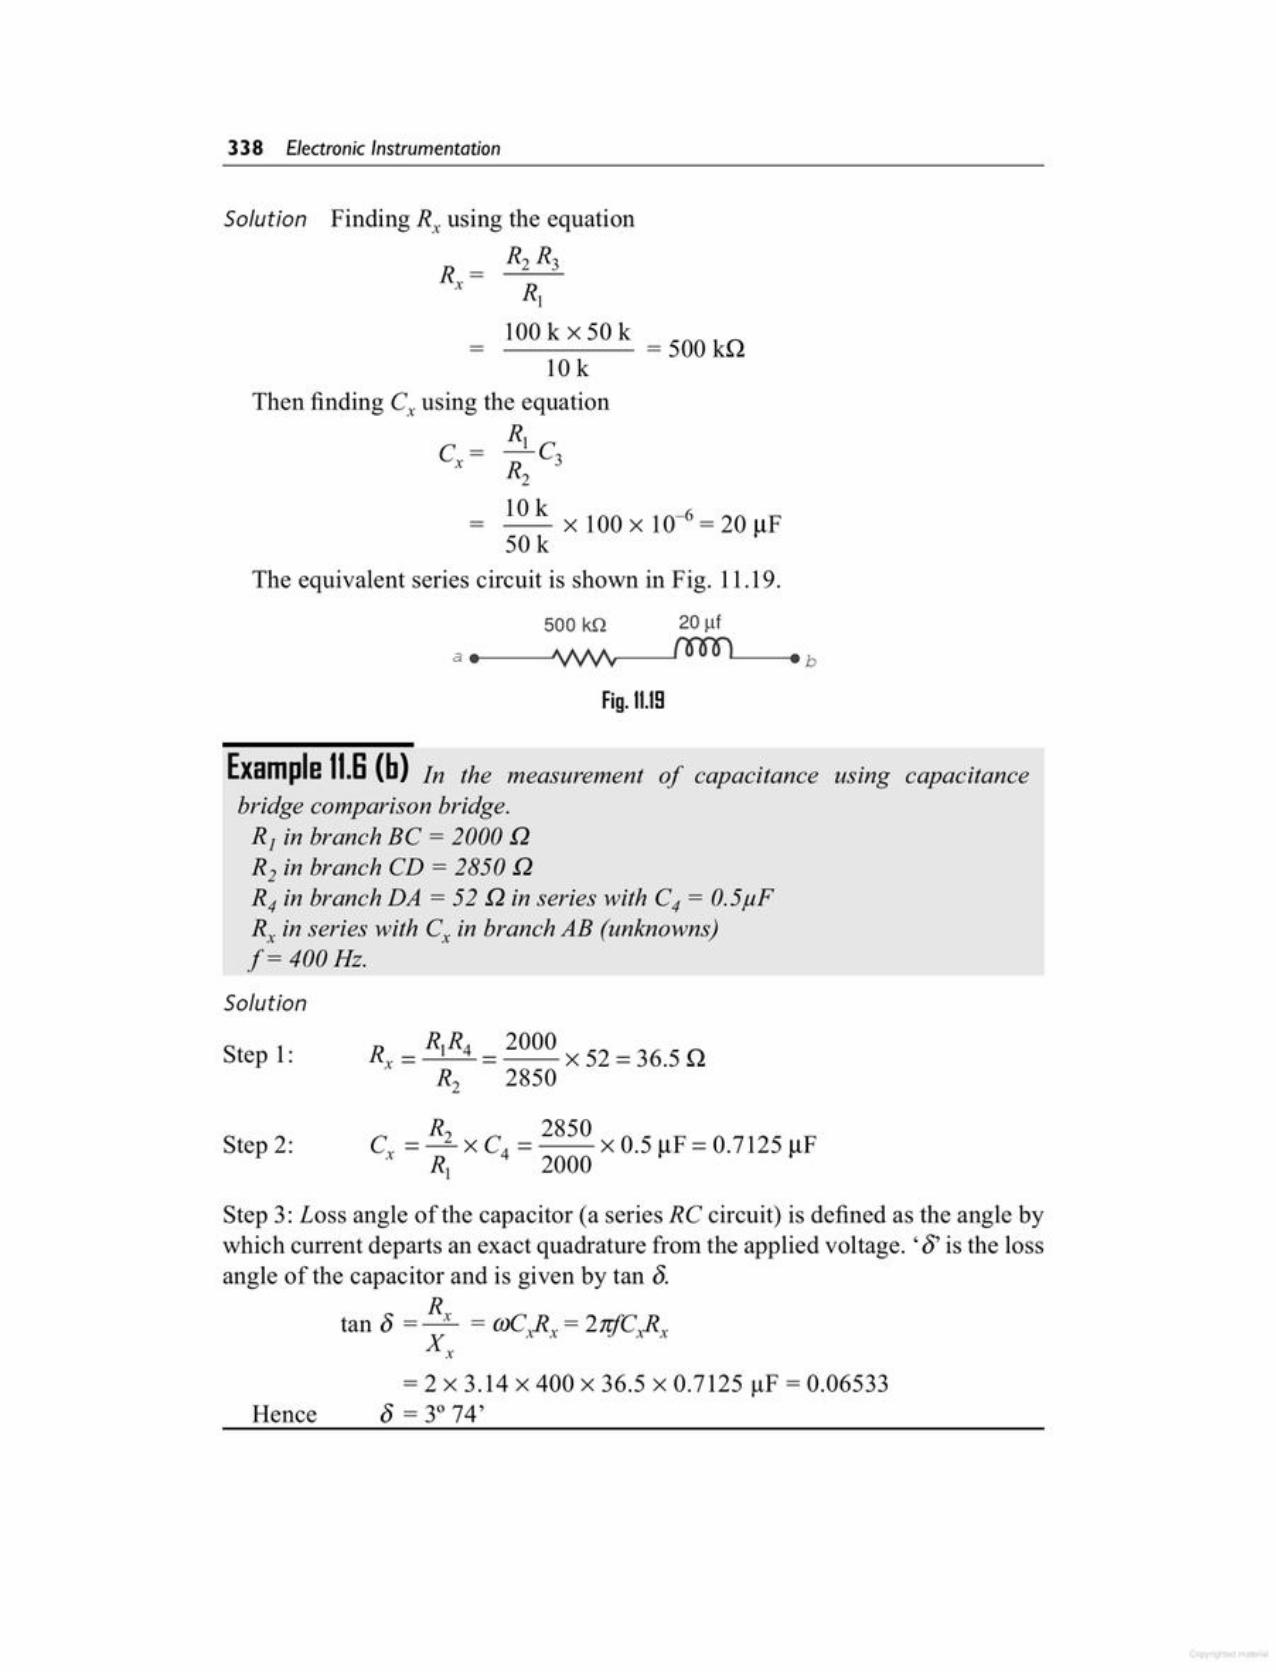
Step 3: Loss angle of the capacitor (a series RC circuit) is defined as the angle bywhich current departs an exact quadrature from the applied voltage. '8' is the lossangle of the capacitor and is given by tan 8.
Rtan 8 =__x = mC 1) = 2..riC 1)X x'~x I'd' x'~xx
= 2 x 3.14 x 400 x 36.5 x 0.7125 f.!F= 0.06533Hence 8 = 3° 74'
Step 2:
R; = R(R4 = 2000 x 52 = 36.5 QR2 2850
C = R2 xC = 2850 x 0.5 "F = 0.7125 "Fx R 4 2000 I"" I""
I
Step 1:
Solution
Example 11.S(b) In the measurement of capacitance using capacitancebridge comparison bridge.R1 in branch BC = 2000 QR2 in branch CD = 2850 QR4 in branch DA = 52 Q in series with C4 = 0.5",FR; in series with C; in branch AB (unknowns).f= 400Hz.
Fig. 11.19
500 kQ 20 J.lf
a ••----~~~r~~--~.b
Then finding C; using the equationR( CC=x R 32
- 10 k x 100 X 10-6 = 20 flF50 k
The equivalent series circuit is shown in Fig. 11.19.
Rl
_ 100 k x 50 k = 500 kQ10 k
Finding R; using the equation
R2R3R =x
Solution
338 Electronic Instrumentation
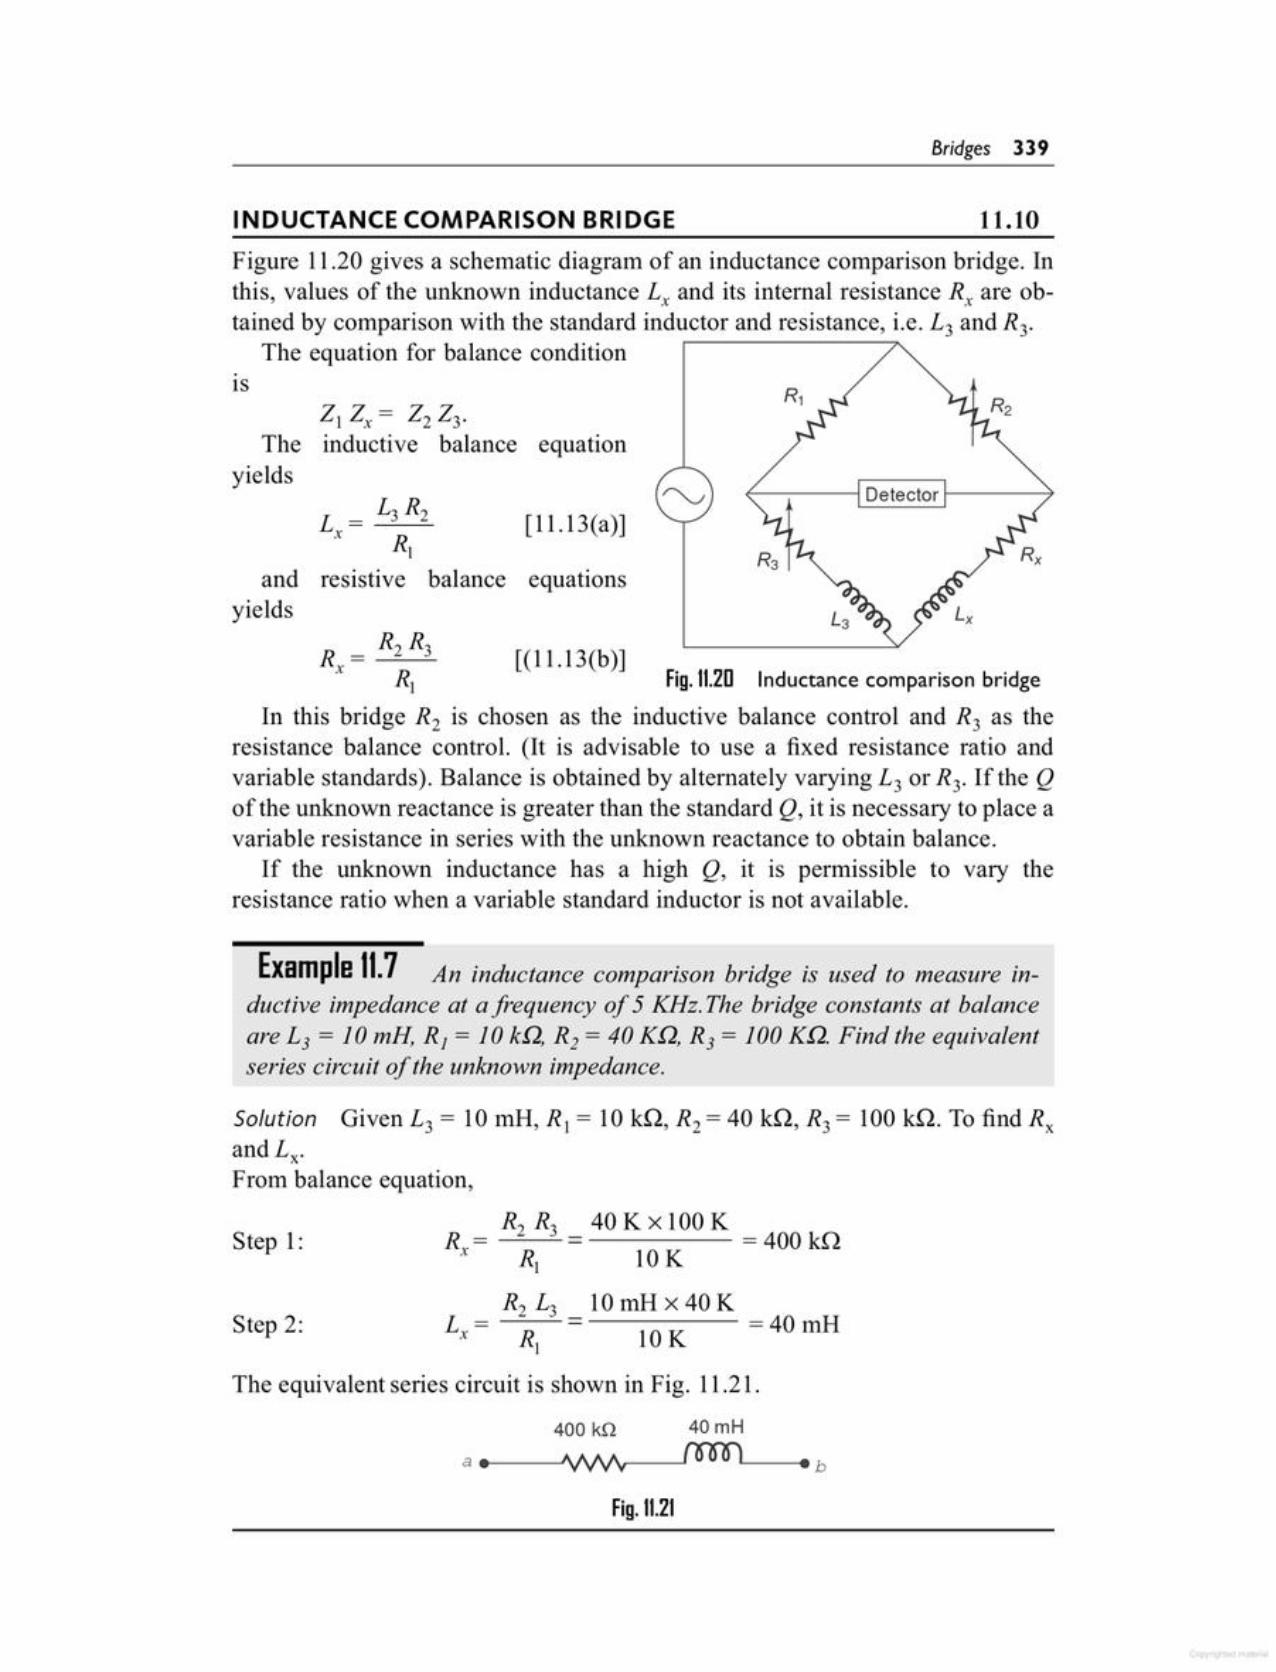
Fig. 11.21
400 kQ 40mHa ••--_'VVVY~____JromL----e.b
The equivalent series circuit is shown in Fig. 11.21.
Step 2:
Step 1:R2 R3 40 Kx100 K
R = - = 400 kQ-x R) 10K
R2 L3 10mH x 40KL = - =40mH-x R) 10 K
Solution Given L3 = 10 mH, R, = 10 kQ, R2 = 40 kQ, R3 = 100 kQ. To find Rxand i;From balance equation,
Example 11.7 An inductance comparison bridge is used to measure inductive impedance at a frequency of 5 KHz. The bridge constants at balanceare L3 = 10mH, RJ = 10kn, R2 = 40Kn, R3 = 100Kn. Find the equivalentseries circuit of the unknown impedance.
In this bridge R2 is chosen as the inductive balance control and R3 as theresistance balance control. (It is advisable to use a fixed resistance ratio andvariable standards). Balance is obtained by alternately varying L3 or R3. If the Qof the unknown reactance is greater than the standard Q, it is necessary to place avariable resistance in series with the unknown reactance to obtain balance.
If the unknown inductance has a high Q, it is permissible to vary theresistance ratio when a variable standard inductor is not available.
Fig. 11.20 Inductance comparison bridge
~----:----l Detector f--------7
[(11.13(b)]
i;= ~R2 [11.13(a)])
and resistive balance equationsyields
z, z,= Z2 Z3'The inductive balance equation
yields
IS
Figure 11.20 gives a schematic diagram of an inductance comparison bridge. Inthis, values of the unknown inductance L; and its internal resistance Rx are obtained by comparison with the standard inductor and resistance, i.e. L3 and R3.
The equation for balance condition
11.10INDUCTANCE COMPARISON BRIDGE
Bridges 339
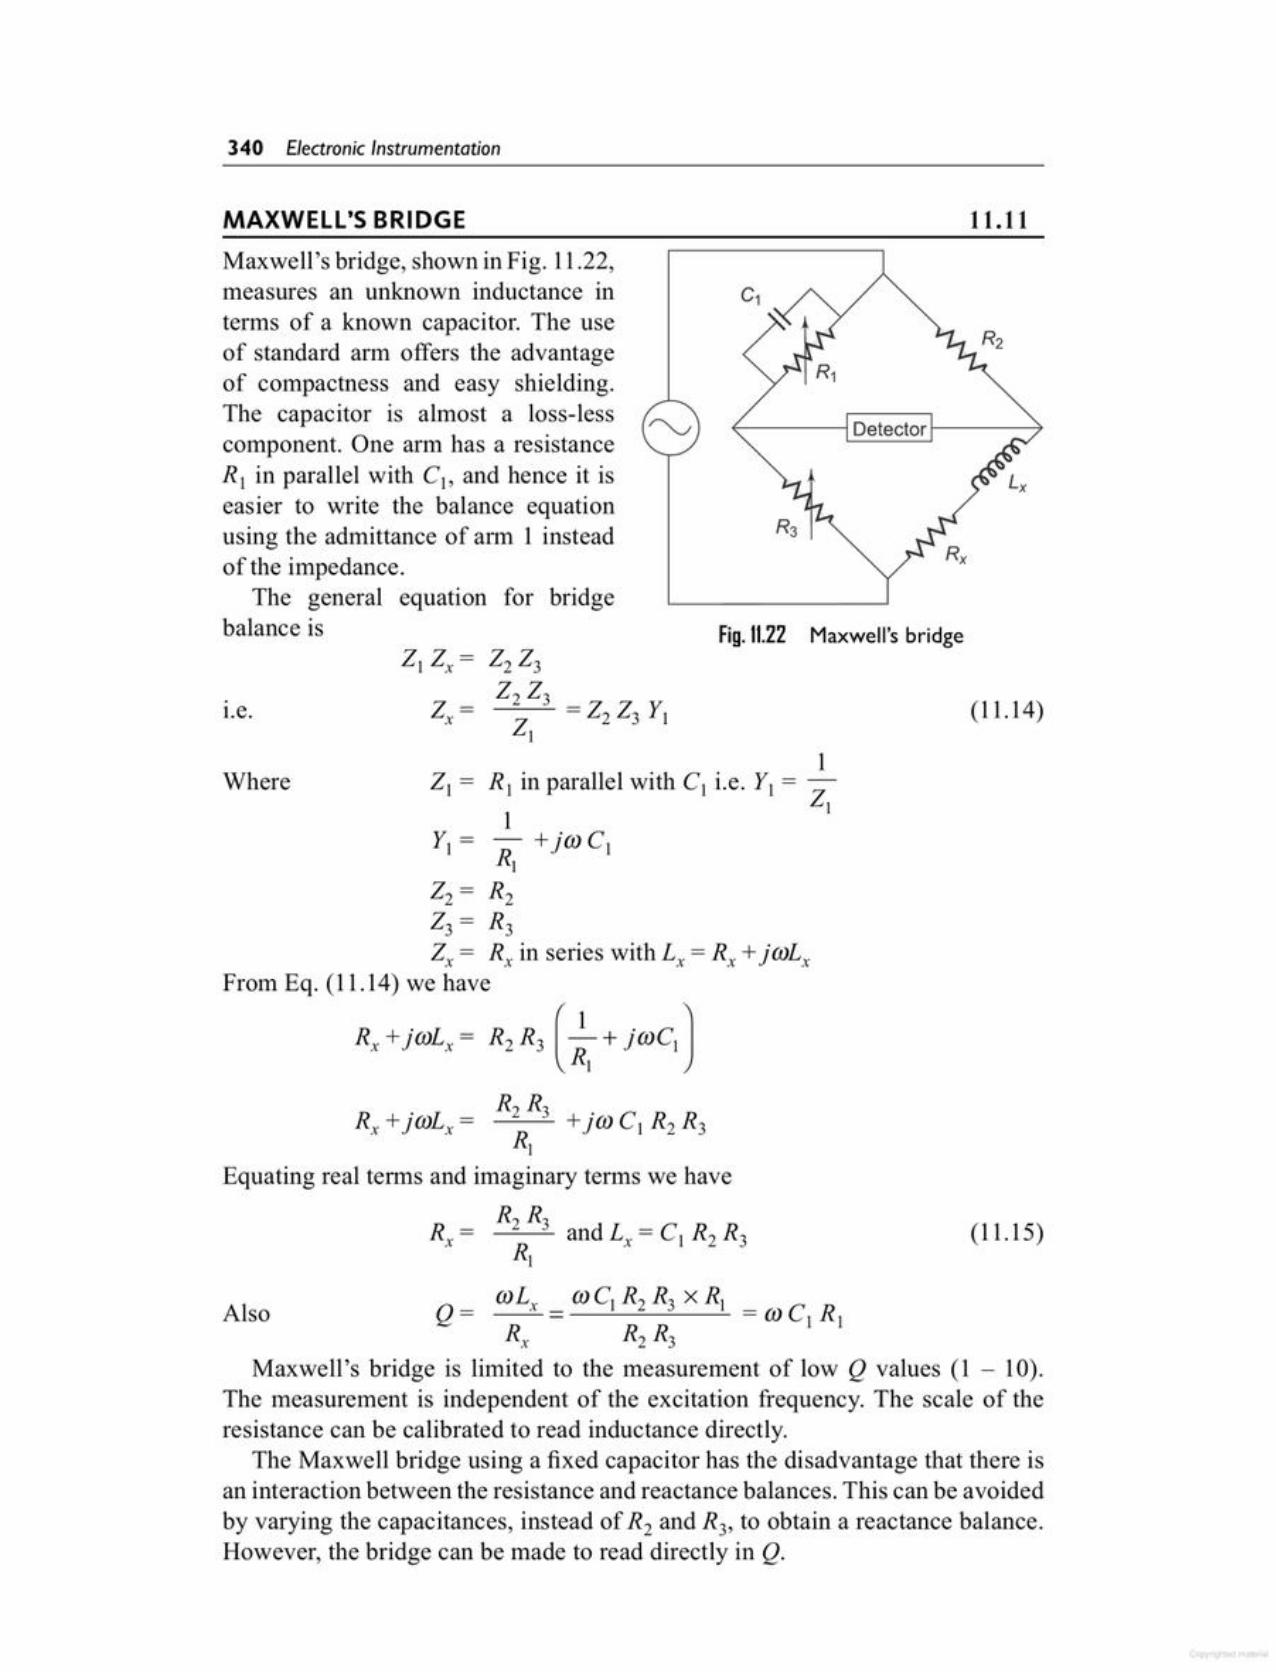
(11.15)
Equating real terms and imaginary terms we have
R2 R3R; = and L; = CI R2 R3Rl
Also Q = mLx = mCI R2 R3 x Rl = caC RR R R I Ix 2 3
Maxwell's bridge is limited to the measurement of low Q values (1 - 10).The measurement is independent of the excitation frequency. The scale of theresistance can be calibrated to read inductance directly.
The Maxwell bridge using a fixed capacitor has the disadvantage that there isan interaction between the resistance and reactance balances. This can be avoidedby varying the capacitances, instead of R2 and R3, to obtain a reactance balance.However, the bridge can be made to read directly in Q.
1Where 21 = R I in parallel with CI i.e. YI= 2
1 IYI = - +jo: CI
RI22 = R223 = R32x = R; in series with L; = R; +jmLx
From Eq. (11.14) we have
Rx+j(J)L, ~ R, R, (~, + j(J)C, )
R2R3---=-___::_ +j m C I R 2 R 3RI
(11.14)
Fig. 11.22 Maxwell's bridge212x= 2223
2x=2223
= 22 23 YIr.e.21
Maxwell's bridge, shown in Fig. 11.22,measures an unknown inductance interms of a known capacitor. The useof standard arm offers the advantageof compactness and easy shielding.The capacitor is almost a loss-lesscomponent. One arm has a resistanceRI in parallel with Cl> and hence it iseasier to write the balance equationusing the admittance of ann 1 insteadof the impedance.
The general equation for bridgebalance is
11.11MAXWELL'S BRIDGE
340 Electronic Instrumentation
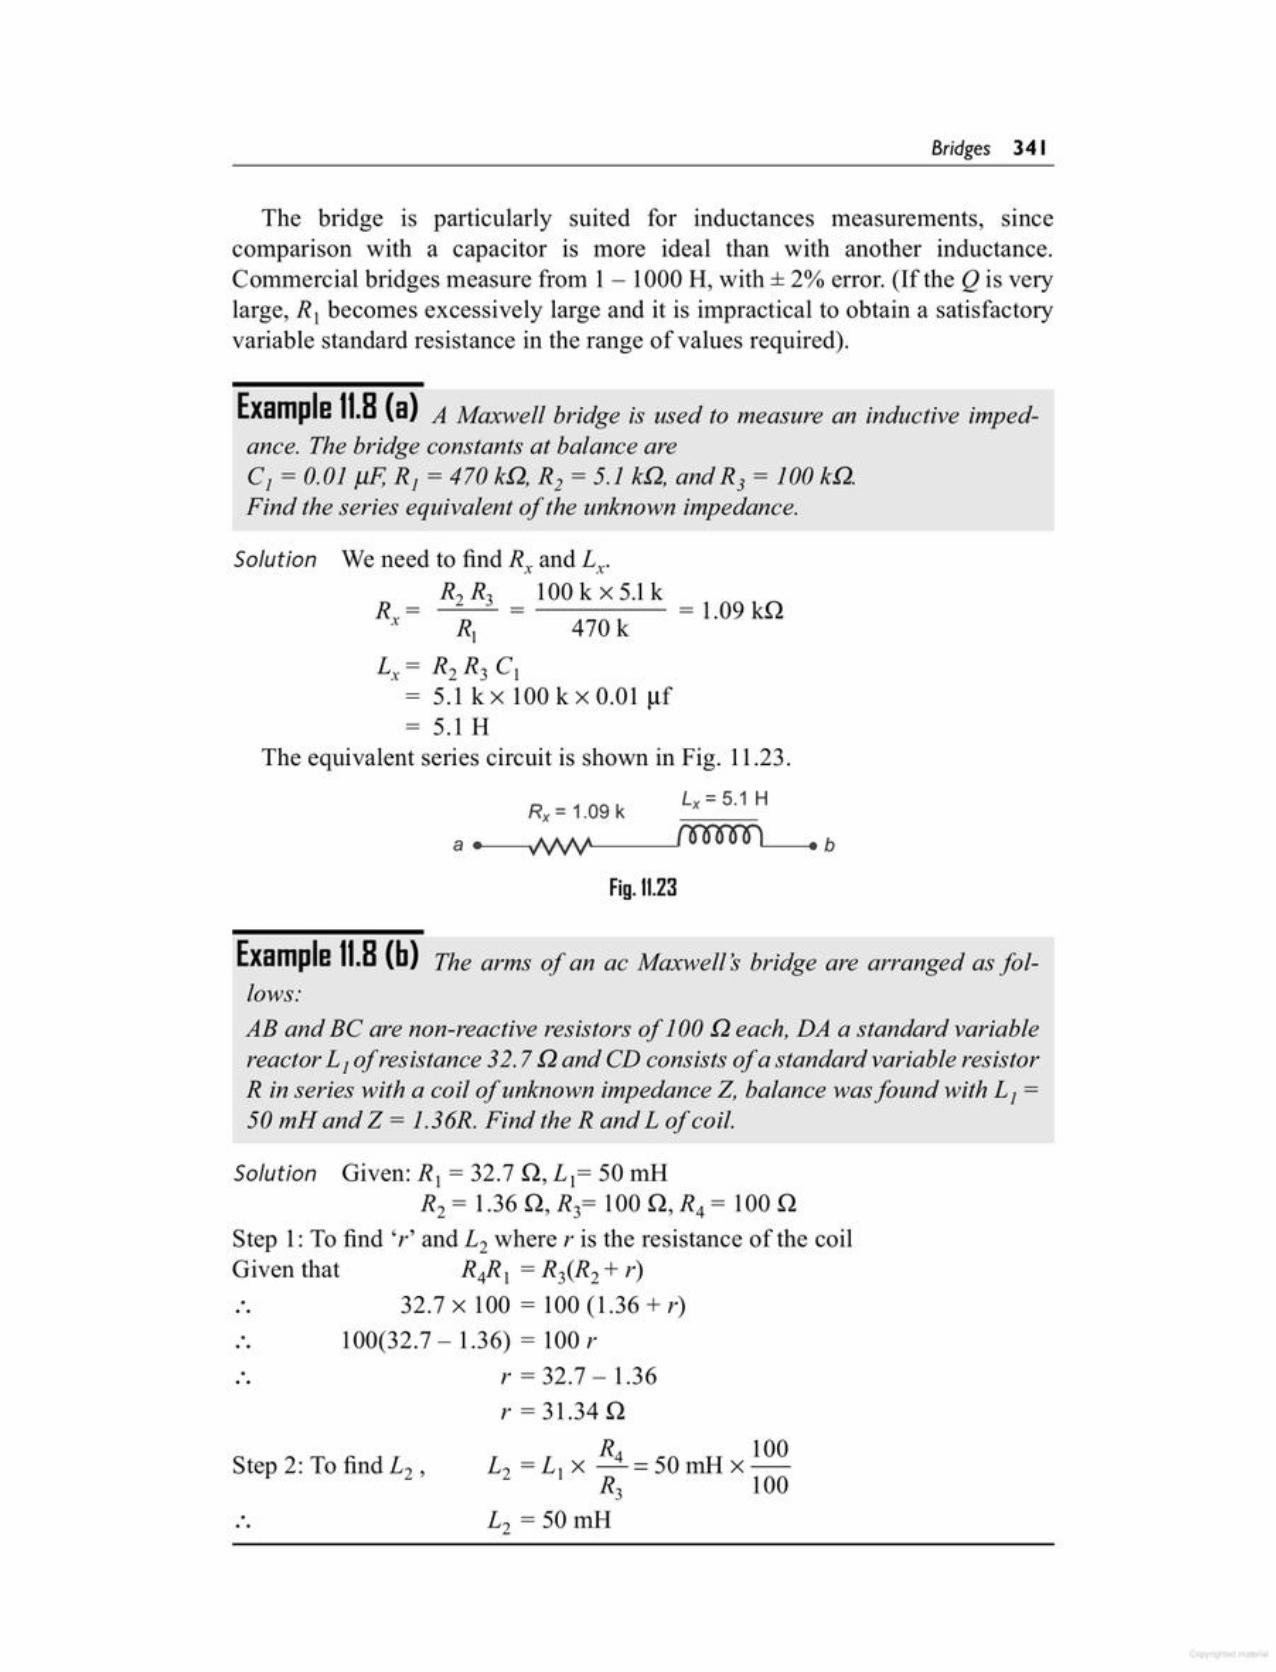
Step 2: To find L2 ,
r = 32.7 - 1.36r=31.34Q
R4 100L2 =L x -=50mHx-I R3 100
L2 = 50 mH
·..
Solution Given: R, = 32.7 Q, L,= 50 mHR2 = 1.36 Q, R3= 100 Q, R4 = 100 Q
Step 1: To find 'r' and L2 where r is the resistance of the coilGiven that R4R, = R3(R2 + r)· 32.7 x 100 = 100 (l.36 + r)· 100(32.7 - 1.36) = 100 r
Example 11.8 (b) The arms of an ac Maxwell s bridge are arranged as follows:AB and BC are non-reactive resistors of 100 Q each, DA a standard variablereactor L j of resistance 32.7 Q and CD consists of a standard variable resistorR in series with a coil of unknown impedance Z, balance was found with L j =
50 mH and Z = 1.36R. Find the Rand L of coil.
Fig. 11.23
Rx = 1.09 k Lx = 5.1 H
a ....--,./WV''----__J(OOOOOlL- .....b
Solution We need to find R; and Lx'R = R2 R3 _ 100 k x 5.l k = 1.09 kQx R 470 kI
Lx= R2R3 C,= 5.1 k x 100 k x 0.01 uf= 5.1 H
The equivalent series circuit is shown in Fig. 11.23.
Example 11.8 (a) A Maxwell bridge is used to measure an inductive impedance. The bridge constants at balance areC, = 0.01 J.1F, R, = 470 kQ, R2 = 5.1 kQ, and R3 = 100 kQ.Find the series equivalent of the unknown impedance.
The bridge is particularly suited for inductances measurements, sincecomparison with a capacitor is more ideal than with another inductance.Commercial bridges measure from 1- 1000 H, with ± 2% error. (If the Q is verylarge, R, becomes excessively large and it is impractical to obtain a satisfactoryvariable standard resistance in the range of values required).
Bridges 341
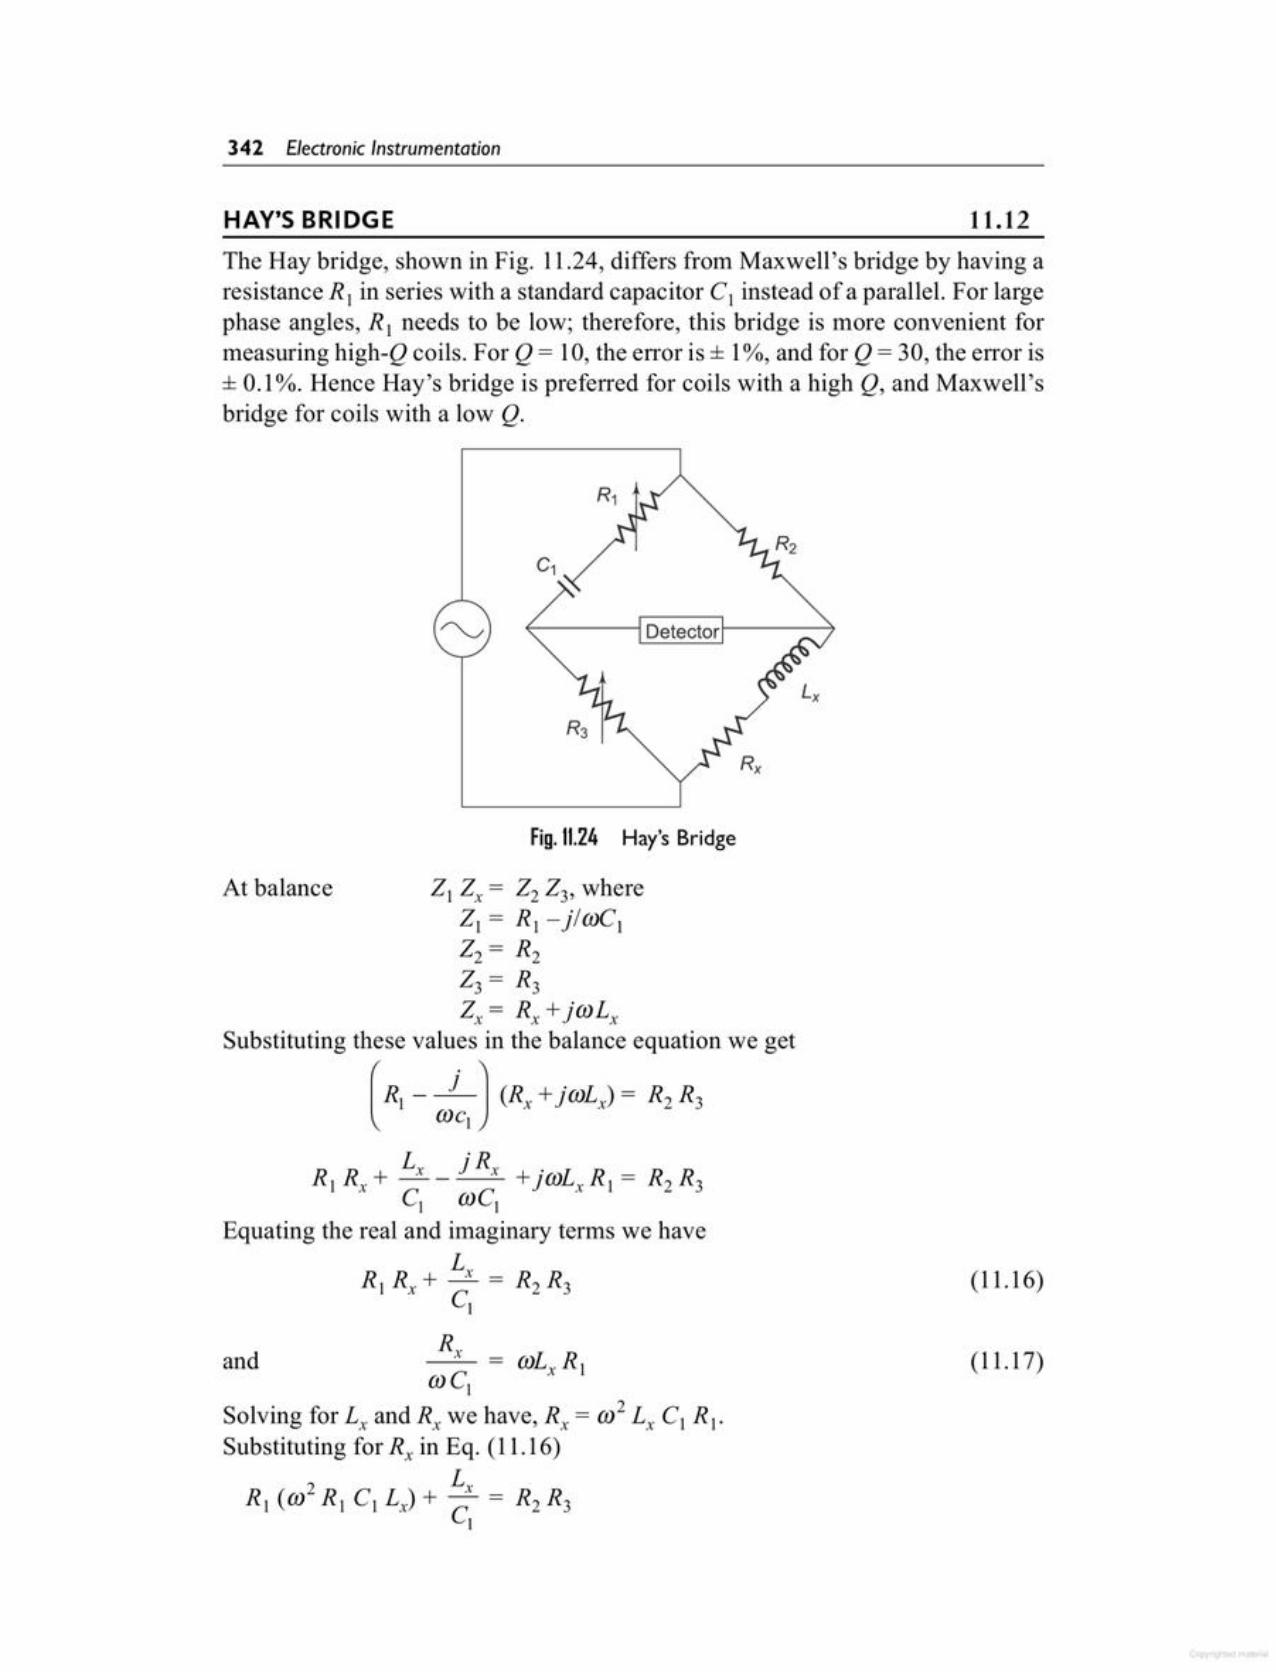
(11.17)
(11.16)
i, j s, ·.r RR[Rx+-- +JOl)..,x [=R2R3C[ OlCI
Equating the real and imaginary terms we haveL
R R + ~ = R2R3I x CI
At balance Zl Z; = Z2 Z3' whereZ[ = R[ - jlOJC[Z2 = R2Z3 = R3Z, = R; +jcol.,
Substituting these values in the balance equation we get
( RJ - j J (Rx +jOlLx) = R2 R3Ole,
Fig.11.24 Hay's Bridge
Detector
The Hay bridge, shown in Fig. 11.24, differs from Maxwell's bridge by having aresistance R] in series with a standard capacitor C1 instead of a parallel. For largephase angles, R I needs to be low; therefore, this bridge is more convenient formeasuring high-Q coils. For Q = 10, the en·or is ± 10/0,and for Q = 30, the error is± 0.1%. Hence Hay's bridge is preferred for coils with a high Q, and Maxwell'sbridge for coils with a low Q.
11.12HAY'S BRIDGE
342 Electronic Instrumentation
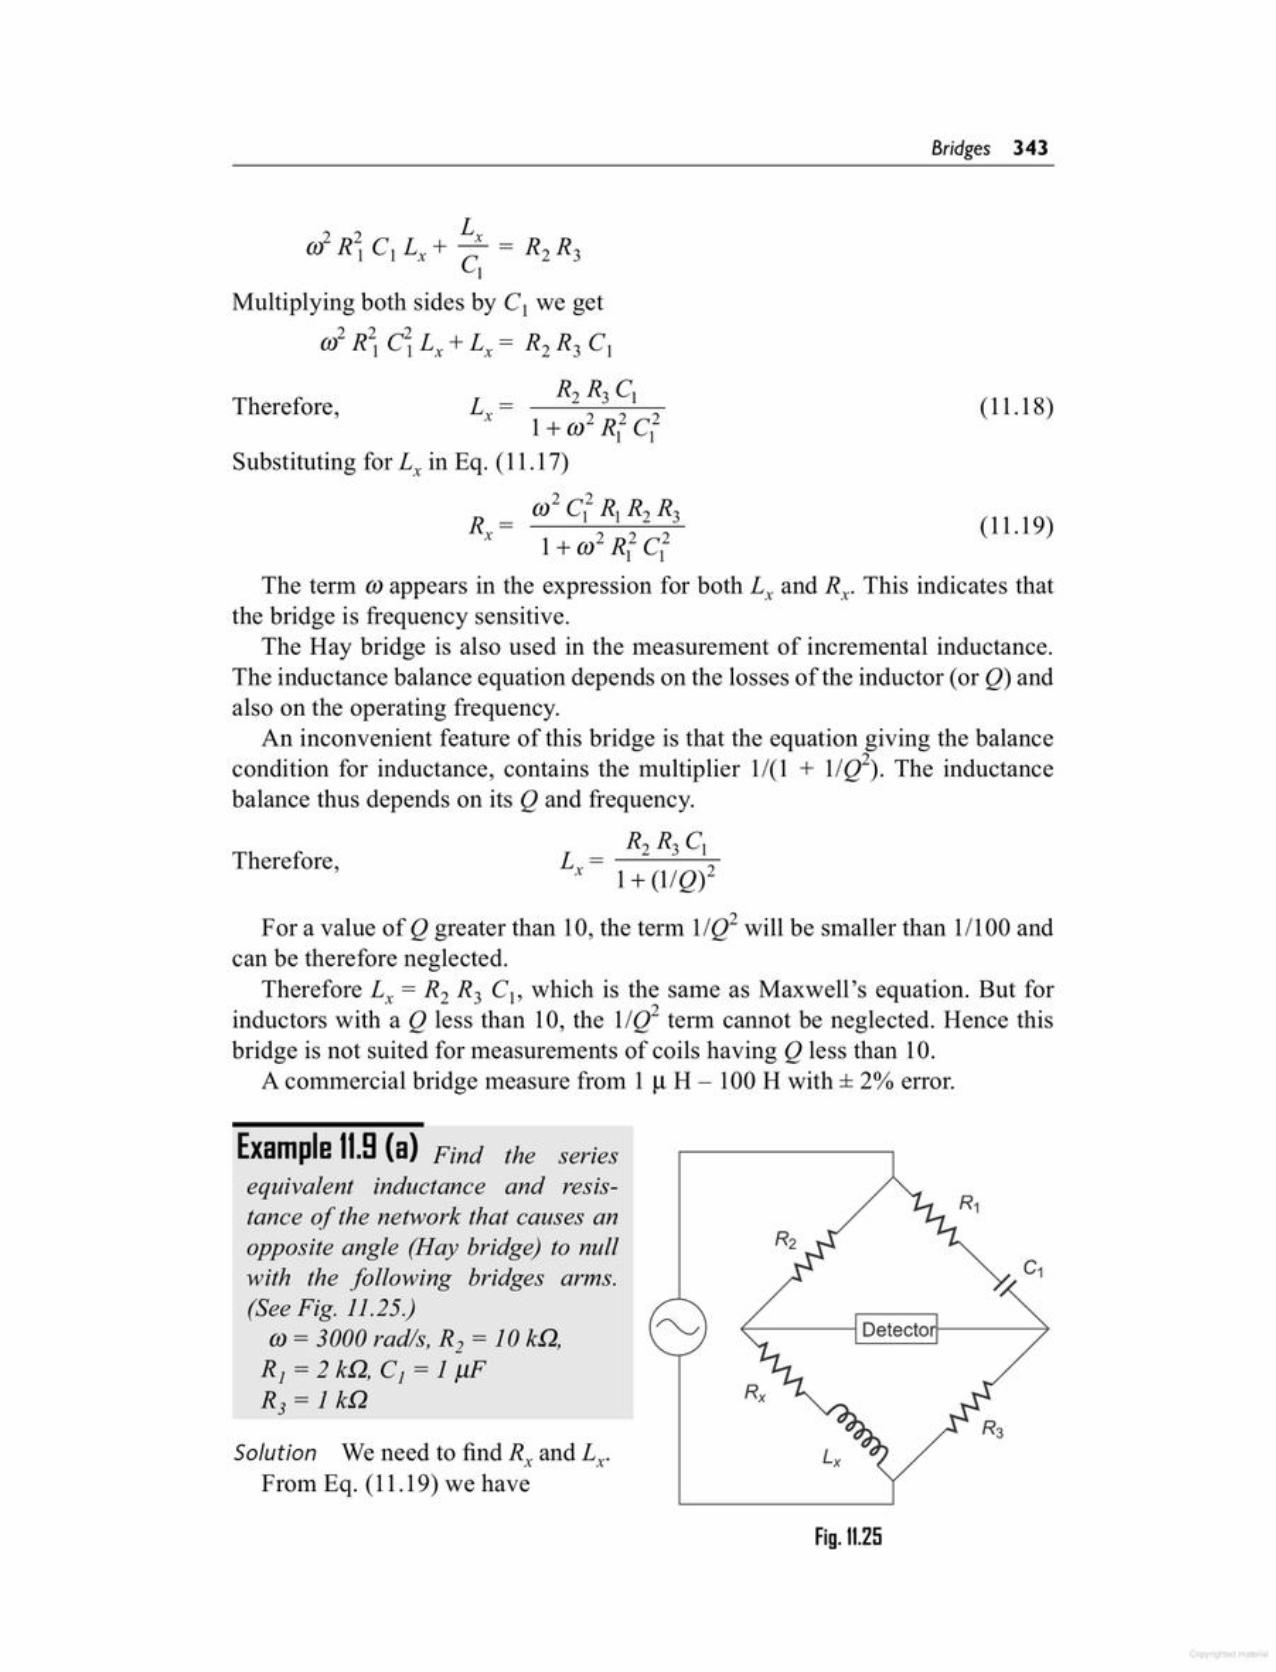
Fig. 11.25
Solution We need to find R, and Lx.From Eq. (11.19) we have
Example 11.8(a) Find the seriesequivalent inductance and resistance of the network that causes anopposite angle (Hay bridge) to nullwith the following bridges arms.(See Fig. 11.25.)
(j)= 3000 rad/s, R2 = 10 kQ,R1= 2 kQ, C1 = 1 J1FR3 = 1»a
For a value of Q greater than 10, the term 1/Q2 will be smaller than 1/100 andcan be therefore neglected.
Therefore L; = R2 R3 C), which is the same as Maxwell's equation. But forinductors with a Q less than 10, the I/Q2 term cannot be neglected. Hence thisbridge is not suited for measurements of coils having Q less than 10.
A commercial bridge measure from 1 ~ H - 100 H with ± 2% error.
(11.19)2 2
(j) C1 s, R2 R3R =x 1+ (j)2R2 C2
) )
The term (j) appears in the expression for both L; and Rx. This indicates thatthe bridge is frequency sensitive.
The Hay bridge is also used in the measurement of incremental inductance.The inductance balance equation depends on the losses of the inductor (or Q) andalso on the operating frequency.
An inconvenient feature of this bridge is that the equation giving the balancecondition for inductance, contains the multiplier 1/(1 + 1/Q2). The inductancebalance thus depends on its Q and frequency.
R2 R3 C,Therefore, L = ___::..........::...........;c_
X 1+ (1/Q)2
(11.18)Therefore, L = R2 R3 C,x 1+ (j)2R2 C2
1 1Substituting for L; in Eq. (11.17)
L(j)2R2 C L + ____:!_ = R R
1 1 x C 2 3,Multiplying both sides by C, we get
(j)2R~ C~L,+L,= R2 R3 C1
Bridges 343
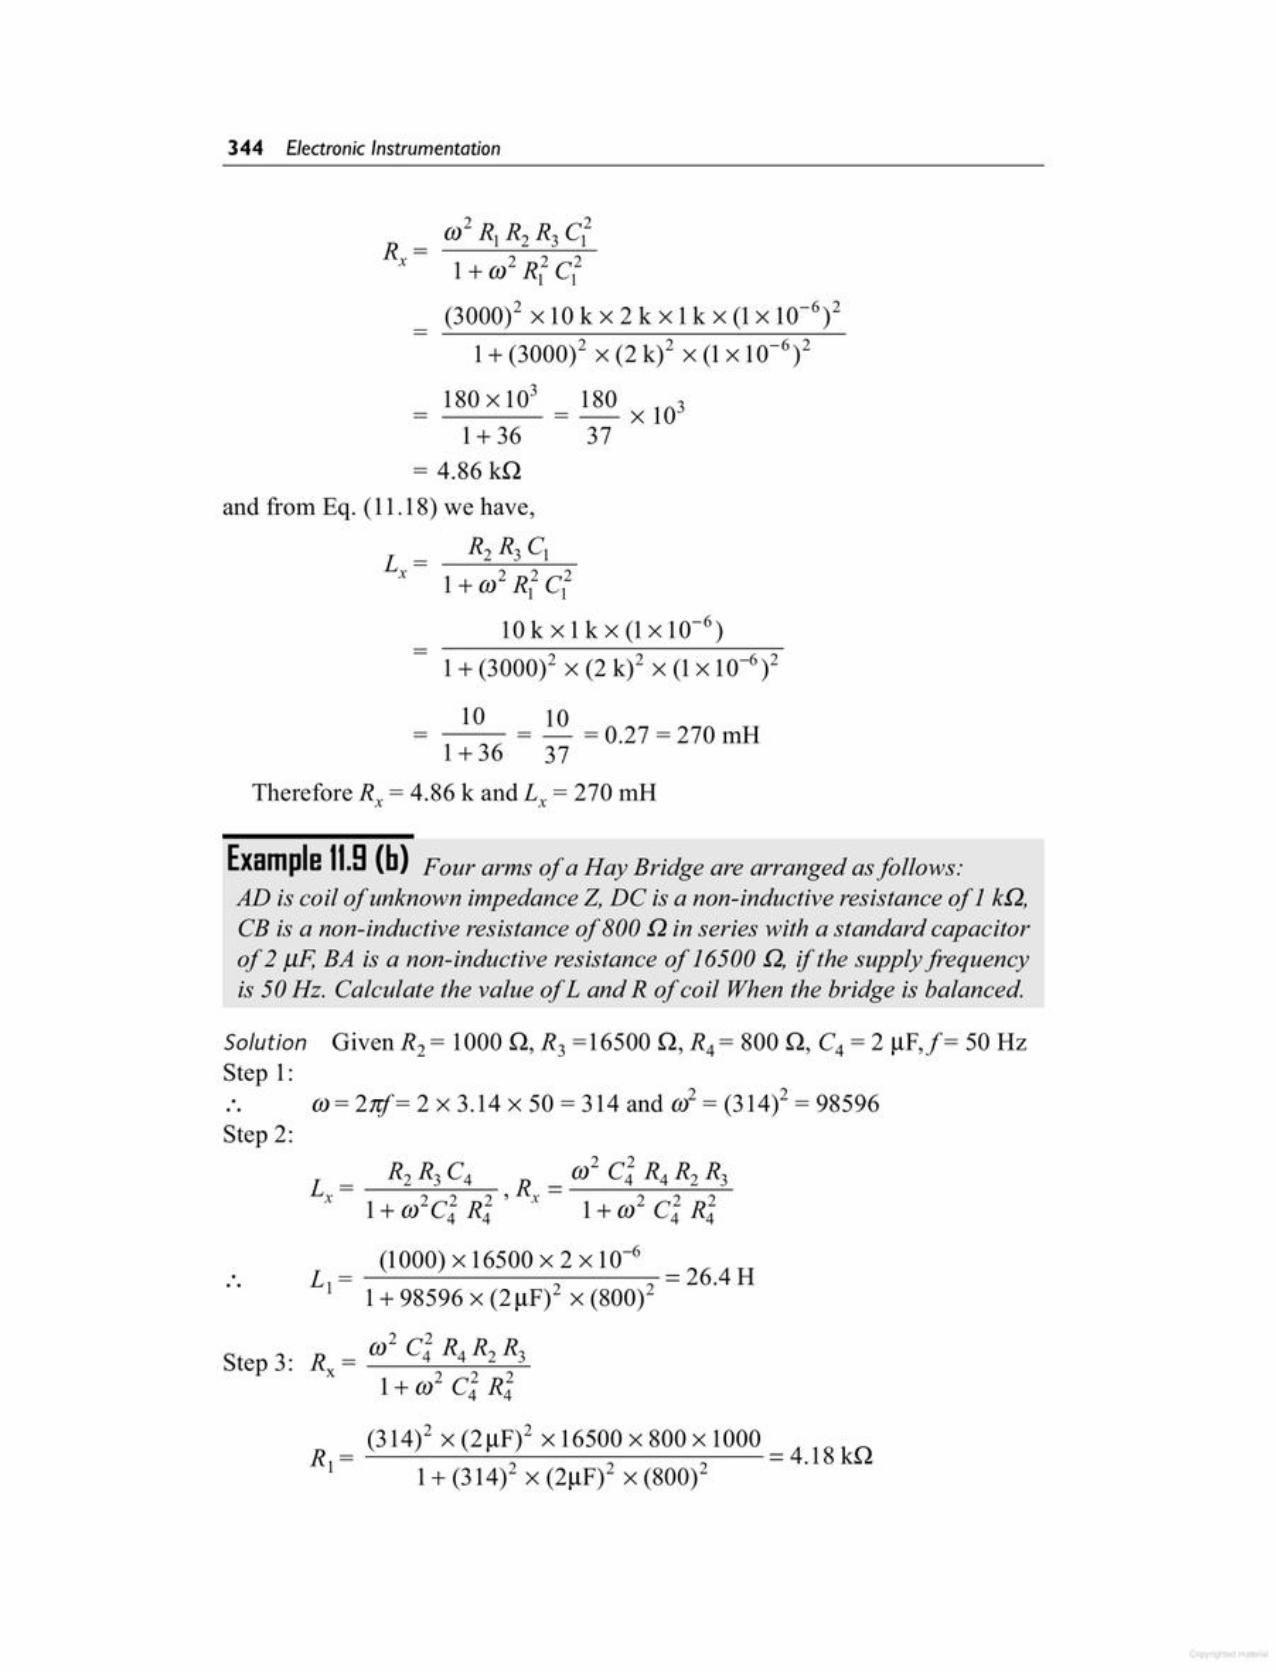
R = (314)2 X (2flF)2 x16500x800xl000 =4.18k.nI 1+ (314)2 X (2flF)2 X (800)2
Step 3:
(1000) X 16500 X 2 X 10-6L = = 26.4H1 1+ 98596 X (2 flF)2 X (800)2
R = (1)2C~ R4 R2 R3x 1+ (1)2c: R2
4 4
...
Step 2:(1)= Zttf= 2 X 3.14 X 50 = 314 and (1)2= (314)2 = 98596...
Solution Given R2 = 1000 .n, R3 =16500 .n, R4 = 800 .n, C4 = 2 flF,f= 50 HzStep 1:
Example 11.8 (b) Four arms of a Hay Bridge are arranged as follows:AD is coil of unknown impedance Z, DC is a non-inductive resistance of 1 kQ,CB is a non-inductive resistance oj'800 Q in series with a standard capacitorof2 f.1F, BA is a non-inductive resistance of 16500 Q, if the supplyfrequencyis 50 Hz. Calculate the value of Land R of coil When the bridge is balanced.
10 10- -- = -- = 0.27 = 270 mH
1+ 36 37Therefore R; = 4.86 k and L, = 270 mH
R2 R3 C1
1+ (1)2R2 C2I 1
10kxlkx(1x10⁻⁶)- ------~----~--~--~
1+ (3000)2 X (2 k)2 X (1X 10-6)2
and from Eq. (11.18) we have,
2R R C2(1) I R2 3 I
1+ (1)2R2 C2I I
(3000)2 X 10 k X 2 k X 1k X (1X 10-6)21+ (3000)2 X (2 k)2 X (1X 10-6)2
= 180 xl0337
180 X 1031+ 36
= 4.86 k.n
344 Electronic Instrumentation
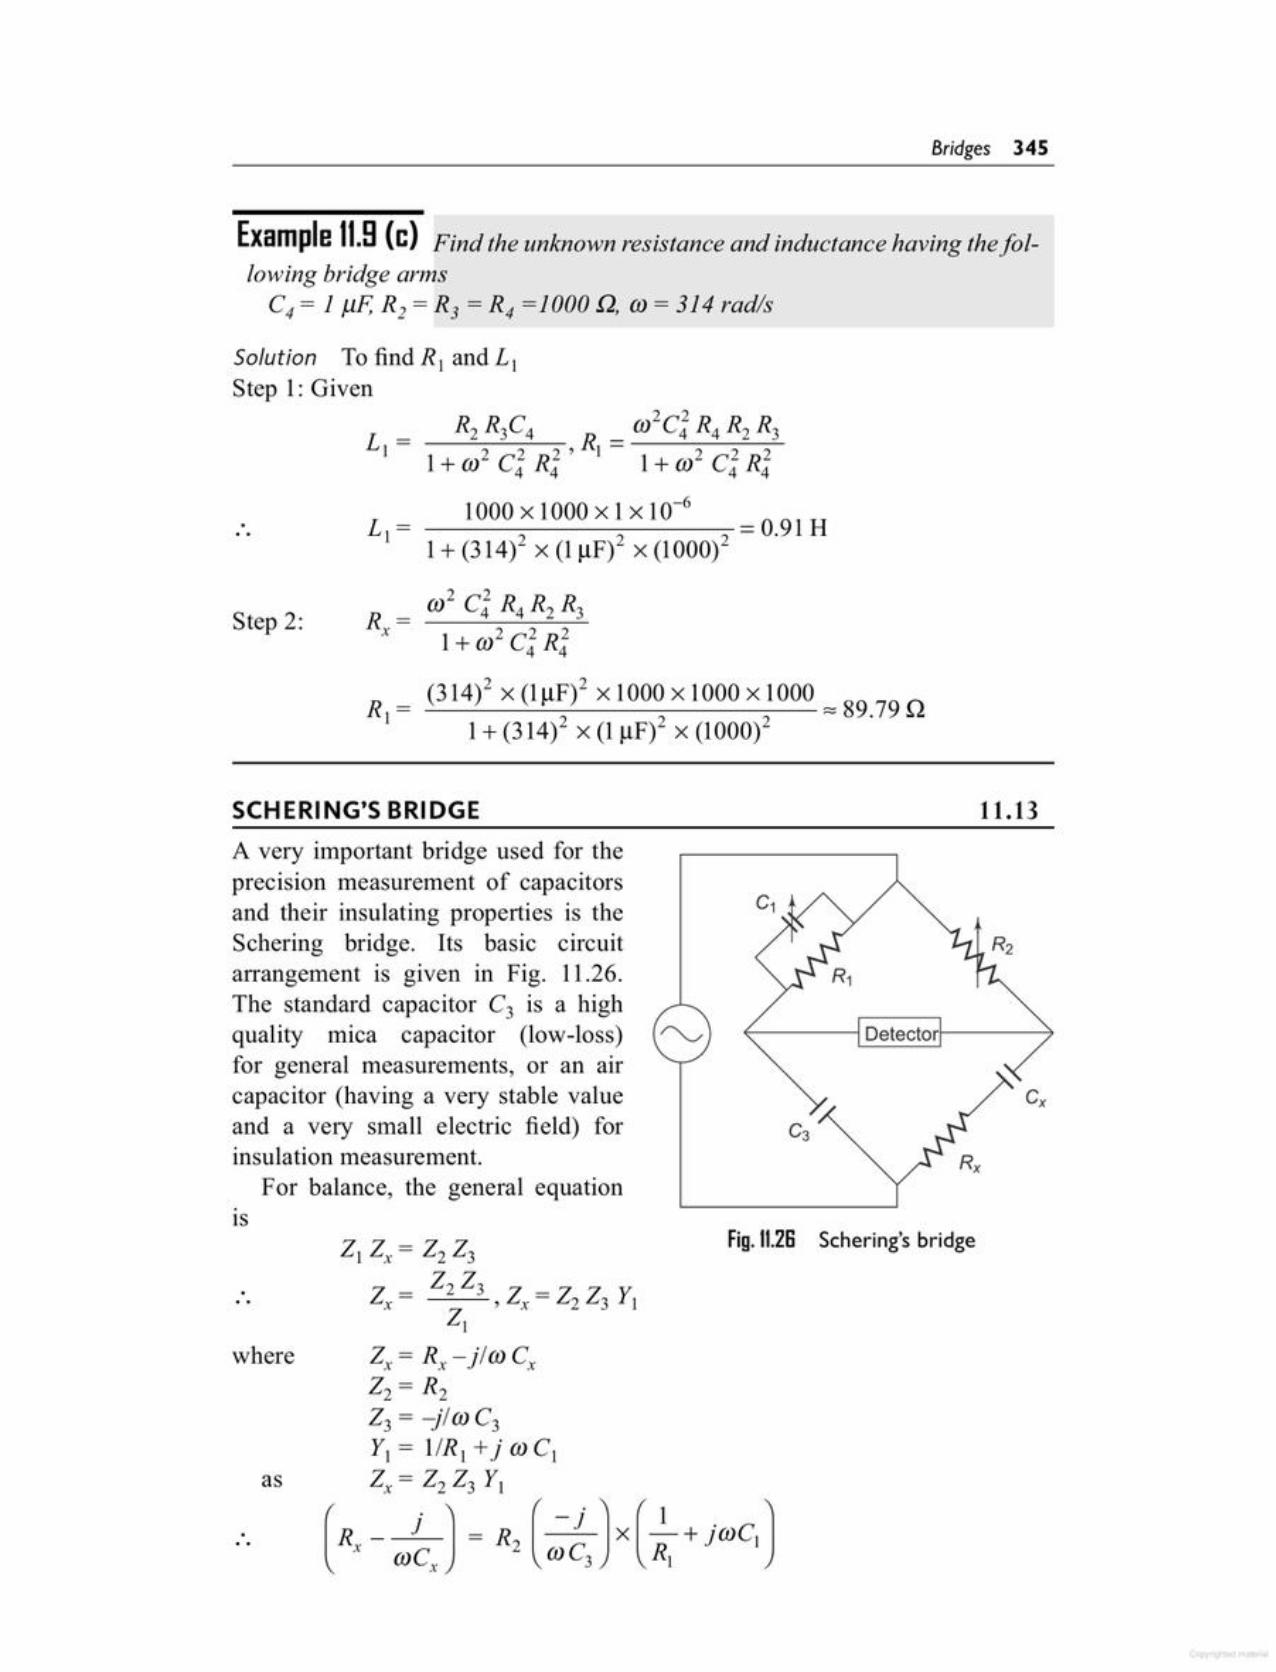
.. .
as
where
...2) 2x = 2223
2223 _Z, = 2) , Z, - 22 23 Y1
Z; = R; -jim C,22 = R223 = -jim C3Y1= llR1+jmCl
2;c= 2223 Y1
(Rx- ro~J ~ R2(;~JX(~1 +jroc1J
Fig. 11.2G Schering's bridgeIS
A very ilnportant bridge used for theprecision measurement of capacitorsand their insulating properties is theSchering bridge. Its basic circuitarrangement is given in Fig. 11.26.The standard capacitor C3 is a highquality mica capacitor (low-loss)for general measurements, or an aircapacitor (having a very stable valueand a very small electric field) forinsulation measurement.
For balance, the general equation
11.13SCHERING'S BRIDGE
(314)2 x(1~F)2 x1000x1000x1000 ""89.79Q1+ (314)2 x (1~F)2 x (1000)2
Step 2:
L =11000 x 1000 x 1X 10-6 = 0.91 H
1+ (314)2 x (1~F)2 x (1000)2
L =1
Solution To find R) and L)Step 1: Given
Example 11.S(c) Find the unknown resistance and inductance having the following bridge armsC4 = 1 J1F, R2 = R3 = R4 =1000 n, ro = 314 rad/s
Bridges 345
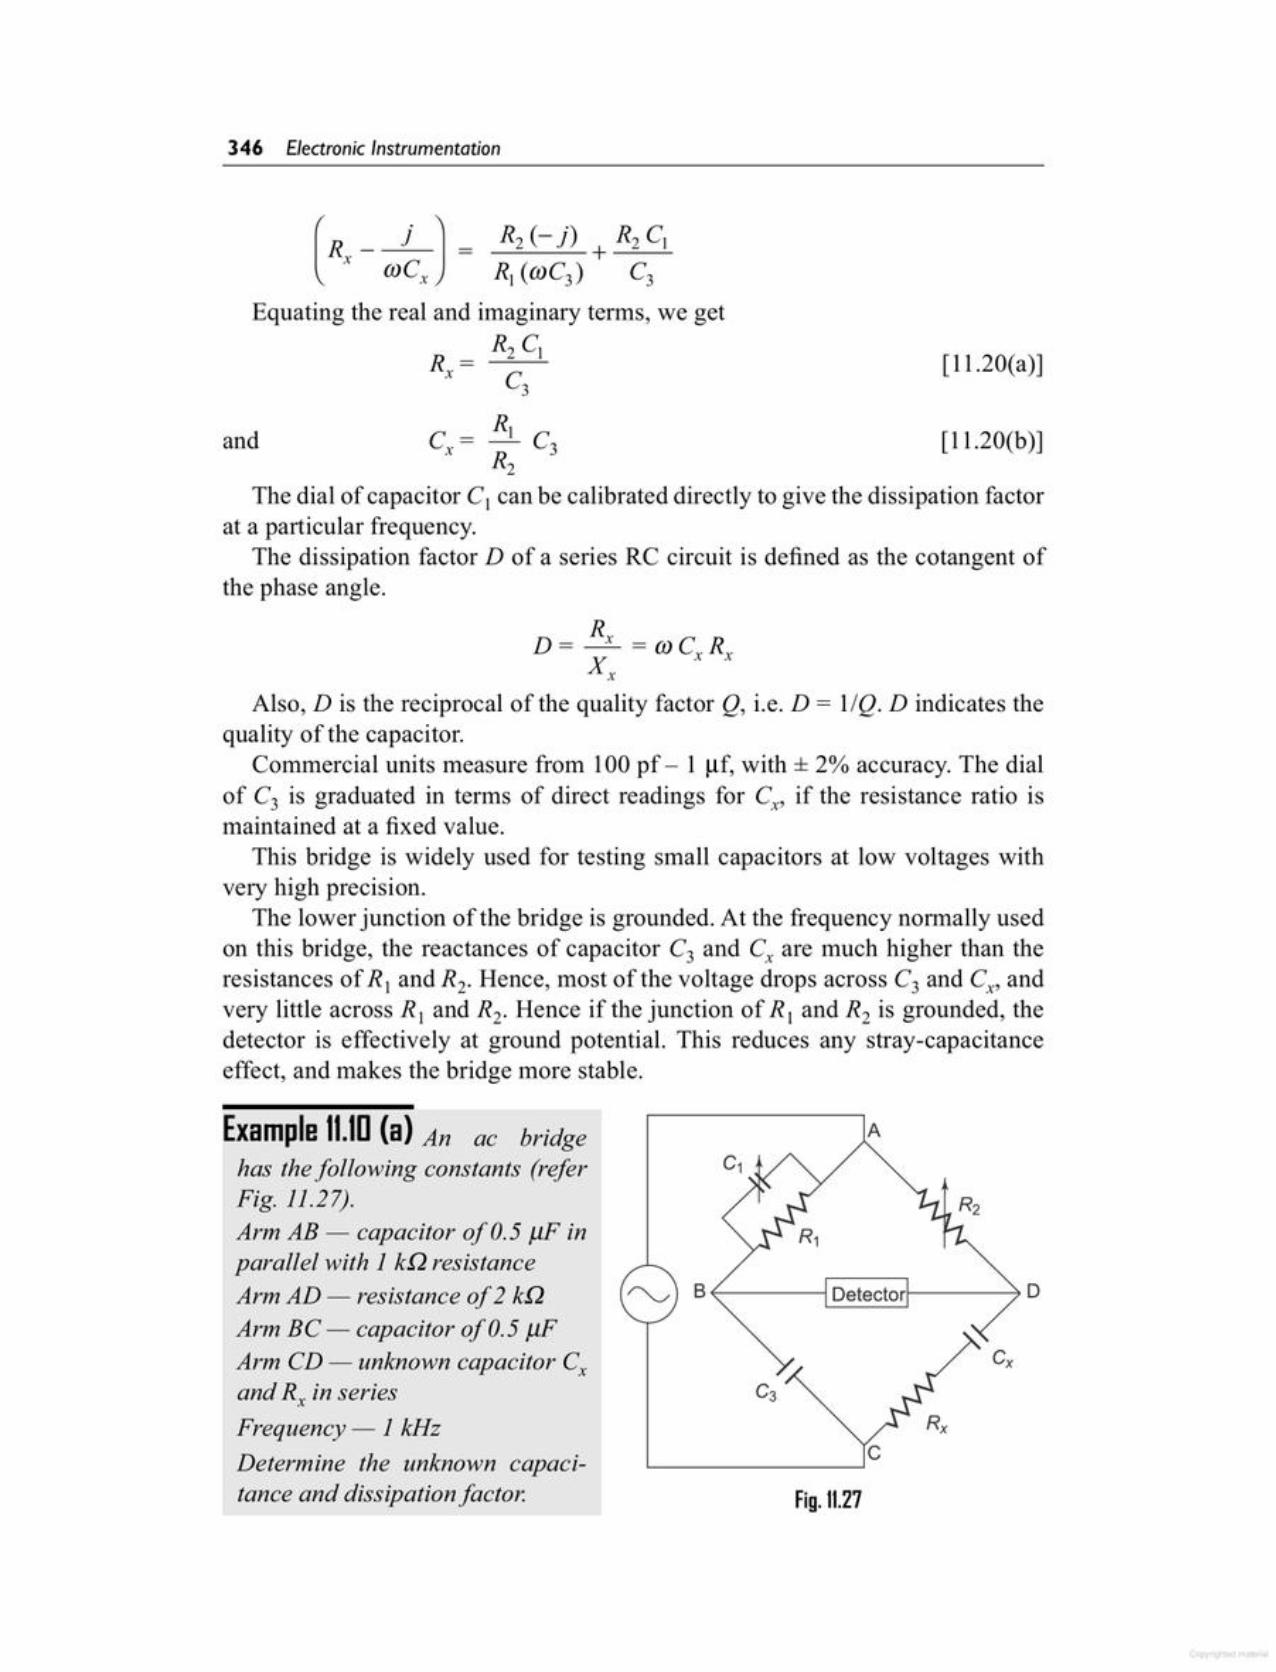
Fig. 11.27
Cl- -l
AExample I1.1D(a) An ac bridgehas the following constants (referFig. 11.27).Arm AB - capacitor of 0.5 f.lF inparallel with 1kQ resistanceArm AD - resistance of 2 kQArm BC- capacitor of 0.5 J.lFArm CD - unknown capacitor C;and Rx in seriesFrequency - 1kHzDetermine the unknown capacitance and dissipation factor.
RxD=-=mCR_X x xx
Also, D is the reciprocal of the quality factor Q, i.e. D = l/Q. D indicates thequality of the capacitor.
Commercial units measure from 100 pf - 1 uf, with ± 2% accuracy. The dialof C3 is graduated in terms of direct readings for Cx, if the resistance ratio ismaintained at a fixed value.
This bridge is widely used for testing small capacitors at low voltages withvery high precision.
The lower junction of the bridge is grounded. At the frequency normally usedon this bridge, the reactances of capacitor C3 and C, are much higher than theresistances of R, and R2. Hence, most of the voltage drops across C3 and Cx' andvery little across R) and R2. Hence if the junction of R, and R2 is grounded, thedetector is effectively at ground potential. This reduces any stray-capacitanceeffect, and makes the bridge more stable.
The dial of capacitor Cj can be calibrated directly to give the dissipation factorat a particular frequency.
The dissipation factor D of a series RC circuit is defined as the cotangent ofthe phase angle.
[11.20(b )]
[11.20(a)]
llcR 32
and
(R - j J = R2 (- j) + R2 C1
x »c, RI (mC3) C3
Equating the real and imaginary terms, we getR2 C1Rx = ---=:._!_
C3
346 Electronic Instrumentation
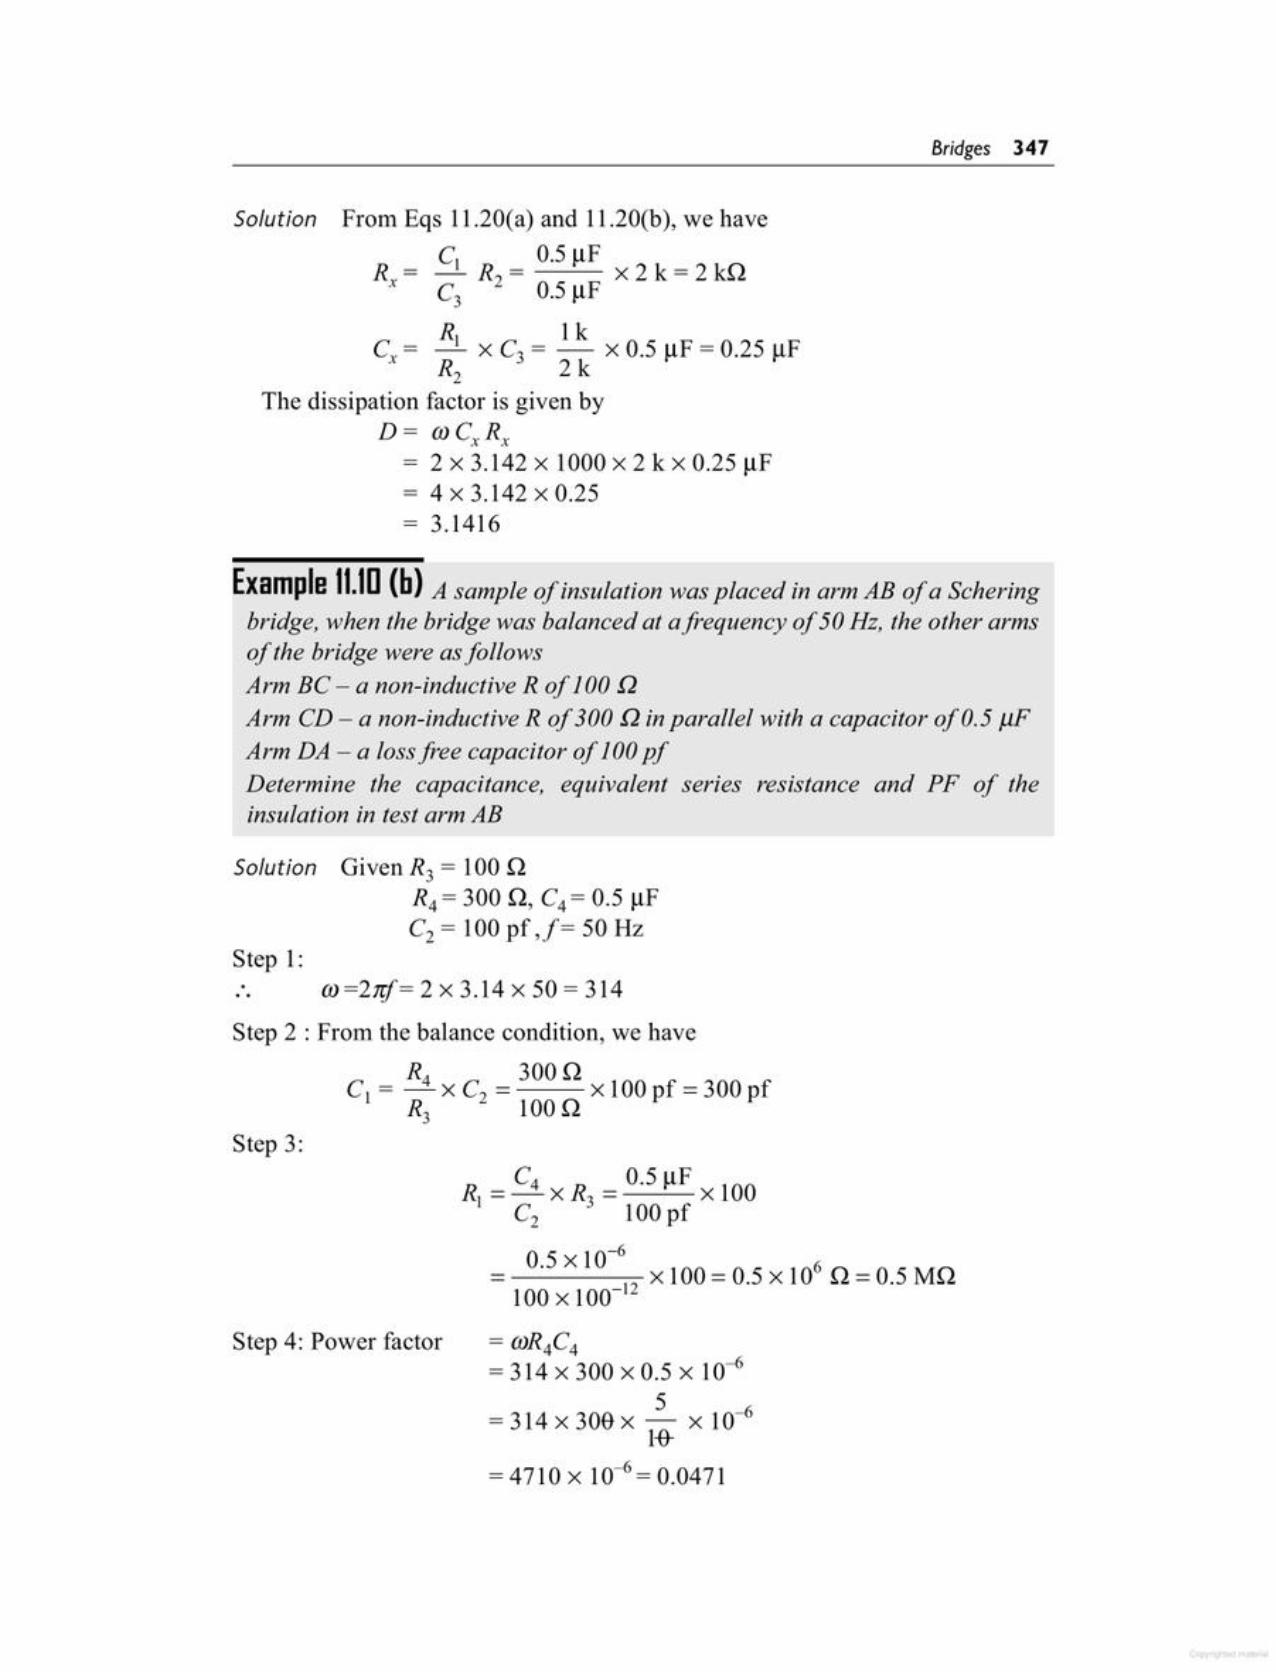
R = C4 X R = 0.5 f.lF x 1001 C2 3 100pf
- 0.5 x 10⁻⁶ x l 00 = 0.5 x 10⁶ Q = 0.5 MQ100 x 100-12
= (J)R4C4
= 314 x 300 x 0.5 X 10-65
= 314 x 30ft x 1& x 10-6
= 4710 X 10-6= 0.0471
Step 4: Power factor
Step 3:
Step 2 : From the balance condition, we have
R4 300 QC, = - X C2 = x 100 pf = 300 pfR3 100 Q
(J)=27if= 2 x 3.14 x 50 = 314Step 1:
Solution Given R3 = 100 QR4 = 300 Q, C4 = 0.5 f.lFC2 = 100 pf J= 50 Hz
Example 11.111(b) A sample of insulation was placed in arm AB 0.1a Scheringbridge, when the bridge was balanced at afrequency of 50Hz, the other armsof the bridge were as followsArm BC - a non-inductive R of 100 QArm CD - a non-inductive R of 300 Q in parallel with a capacitor of 0.5 !1F'Arm DA - a loss free capacitor of 100 pfDetermine the capacitance, equivalent series resistance and PF of theinsulation in test arm AB
Solution From Eqs 11.20(a) and 11.20(b), we have
R = S_ R = 0.5 f.lF x 2 k = 2 kQx C3 2 0.5 f.lF
R, 1kC = - X C3 = - x 0.5 f.lF= 0.25 f.lFx R2 2 k
The dissipation factor is given byD = (J)CxRx= 2 x 3.142 x 1000 x 2 k x 0.25 uf= 4x3.142xO.25= 3.1416
Bridges 347
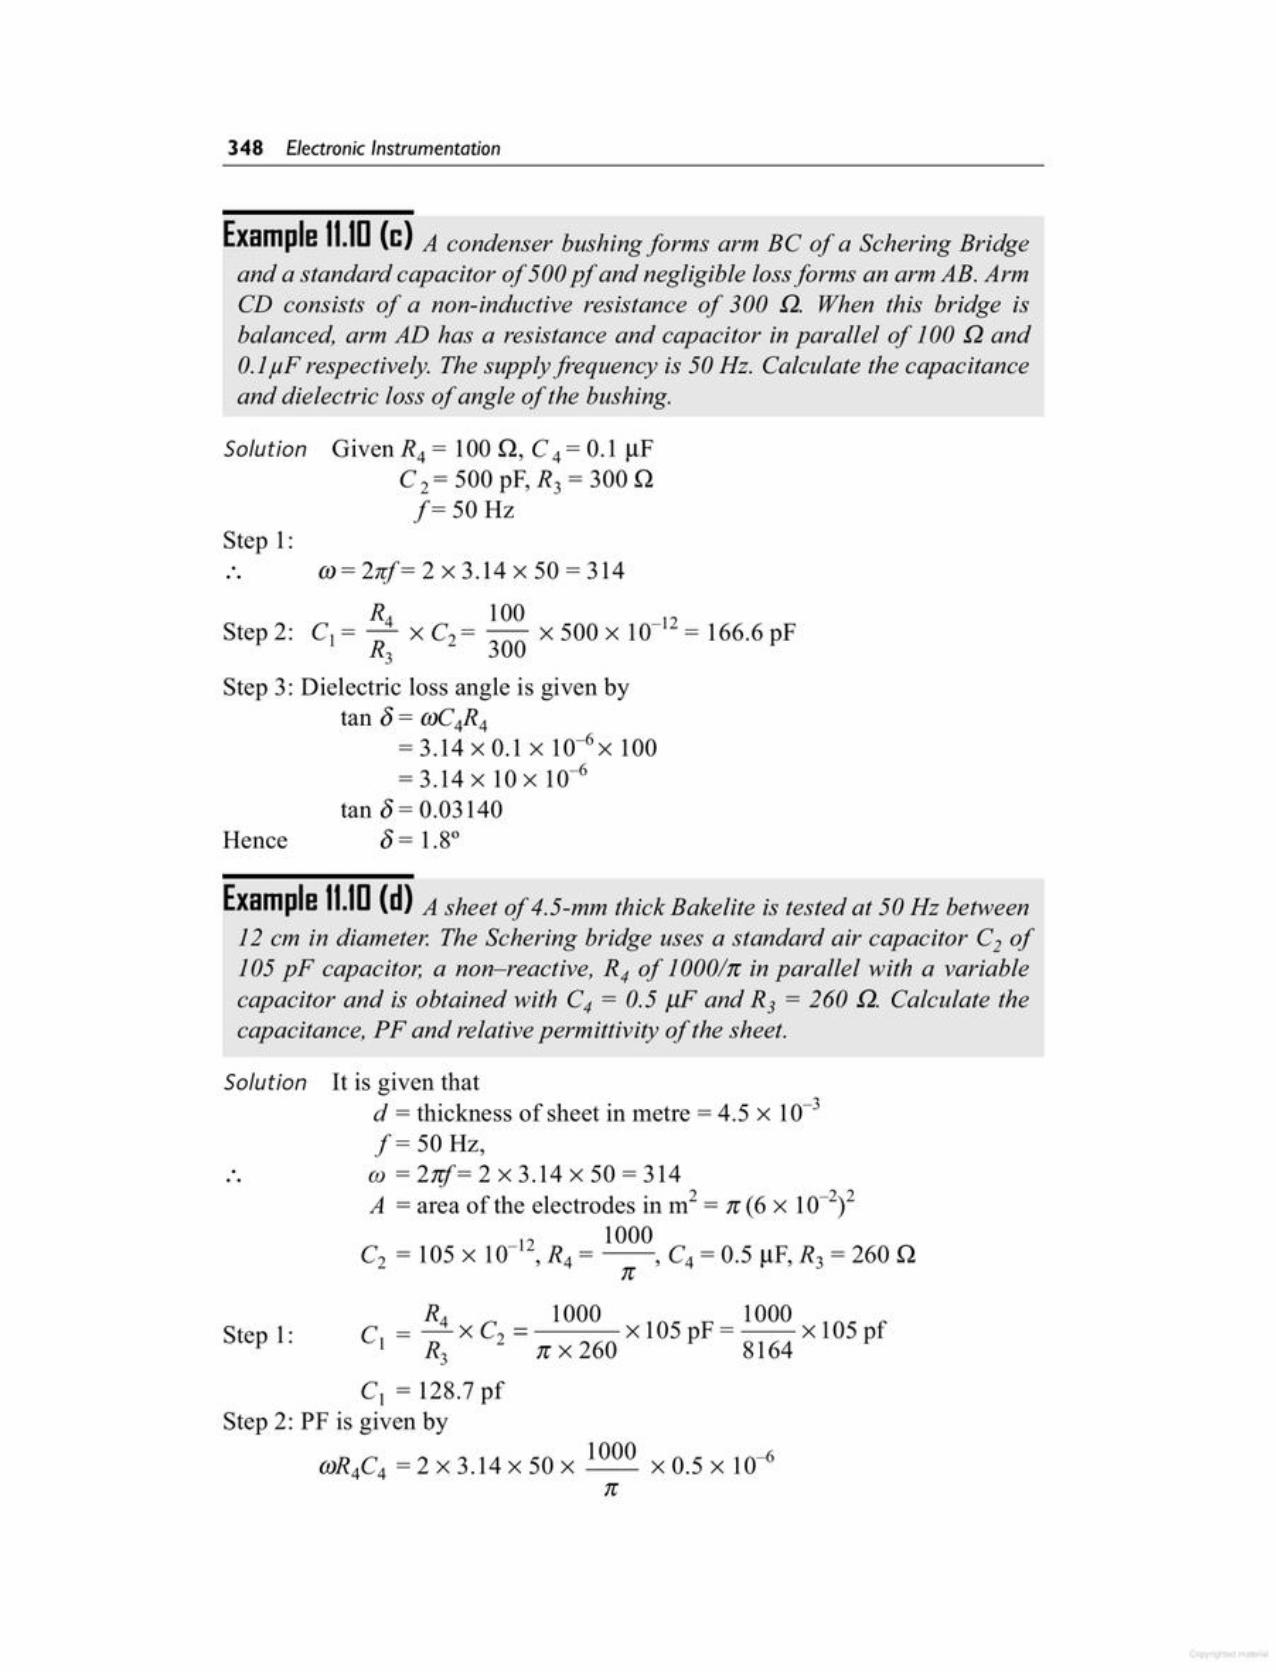
R4 1000 1000Step 1: C,=-xC2= x105pF= xl05pf
R3 n x 260 8164
C, = 128.7 pfStep 2: PF is given by
1000 -6mR4C4 = 2 x 3.14 x 50 x x 0.5 x 10n
It is given thatd = thickness of sheet in metre = 4.5 x 10⁻³f= 50 Hz,OJ = Zttf= 2 x 3.14 x 50 = 314A = area of the electrodes in m2 = n (6 x 10⁻²)2
-'2 1000C2 = 105 x 10 ,R4 = , C4 = 0.5 I-lF, R3 = 260 n
n
Solution
Example 11.1[](d) A sheet of 4.5-mm thick Bakelite is tested at 50 Hz between12 em in diameter. The Schering bridge uses a standard air capacitor C2 of105 pF capacitor, a non-reactive, R4 of 1000ln in parallel with a variablecapacitor and is obtained with C4 = 0.5 J1F and R3 = 260 fl. Calculate thecapacitance, PF and relative permittivity of the sheet.
Step 3: Dielectric loss angle is given bytan 8 = mC4R4
= 3.14 x 0.1 x 10-6X 100= 3.14 x 10 x 10-6
tan 8= 0.03140Hence 8 = 1.8°
100300 x 500 X 10-12 = 166.6 pFStep 2:
m= 2~f= 2 x 3.14 x 50 = 314Step 1:
Solution Given R4 = 100 n, C 4 = 0.1 I-lFC 2 = 500 pF, R3 = 300 nf= 50 Hz
Example 11.1[] (c) A condenser bushing forms arm BC of a Schering Bridgeand a standard capacitor of 500 pf and negligible loss forms an arm AB. ArmCD consists of a non-inductive resistance of 300 fl. When this bridge isbalanced, arm AD has a resistance and capacitor in parallel of 100 fl and0.1f1.Frespectively. The supply frequency is 50 Hz. Calculate the capacitanceand dielectric loss of angle of the bushing.
348 Electronic Instrumentation
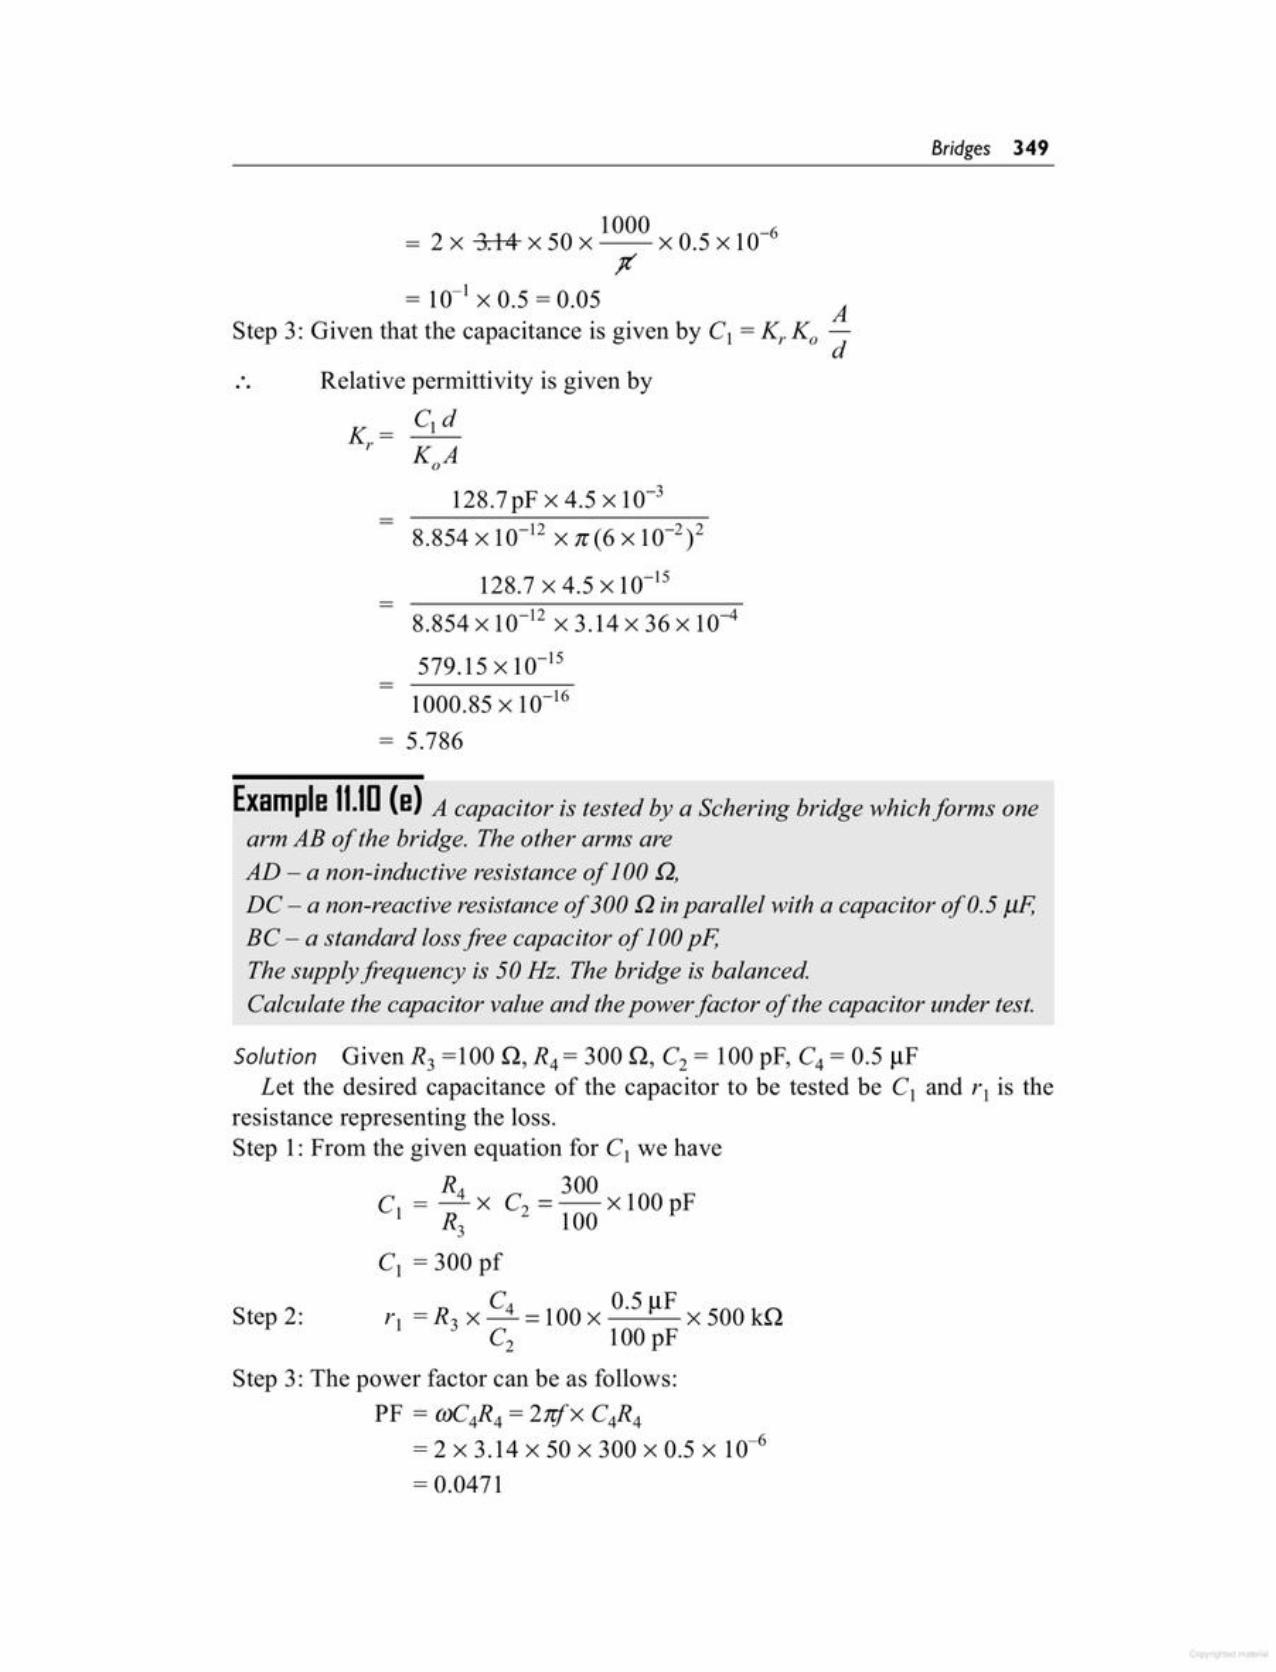
Step 3: The power factor can be as follows:PF = mC4R4 = 2nfx C4R4
= 2 x 3.14 x 50 x 300 x 0.5 X 10-6= 0.0471
Step 2:
Solution Given R3 =100 n, R4 = 300 n, C2 = 100 pF, C4 = 0.5 f..lFLet the desired capacitance of the capacitor to be tested be C1 and r 1 is the
resistance representing the loss.Step 1: From the given equation for C1 we have
R4 300C I = - X C2 = x 100 pF
R3 100C1 = 300 pf
rl =R3 X C4 =100x 0.5f..lF x500knC2 100 pF
Example 11.111(e) A capacitor is tested by a Schering bridge which forms onearm AB of the bridge. The other arms areAD - a non-inductive resistance of 100 Q,DC - a non-reactive resistance of 300 Q in parallel with a capacitor of 0.5 J.lF,BC - a standard loss free capacitor of 100 pF,The supply frequency is 50 Hz. The bridge is balancedCalculate the capacitor value and the power factor of the capacitor under test.
1000.85 x 10-16= 5.786
8.854 X 10-12 x 3.14 x 36 x 10-4
579.15 X 10⁻¹⁵
128.7 x 4.5 x 10-15
KoA
128.7pF X 4.5 x 10-3
Relative permittivity is given by
C1dK=r
...
= 2 X 3.14 x50x 1000 xO.5 x10-6J(
= 10-1 X 0.5 = 0.05 AStep 3: Given that the capacitance is given by C1 =K; Ko -
d
Bridges 349
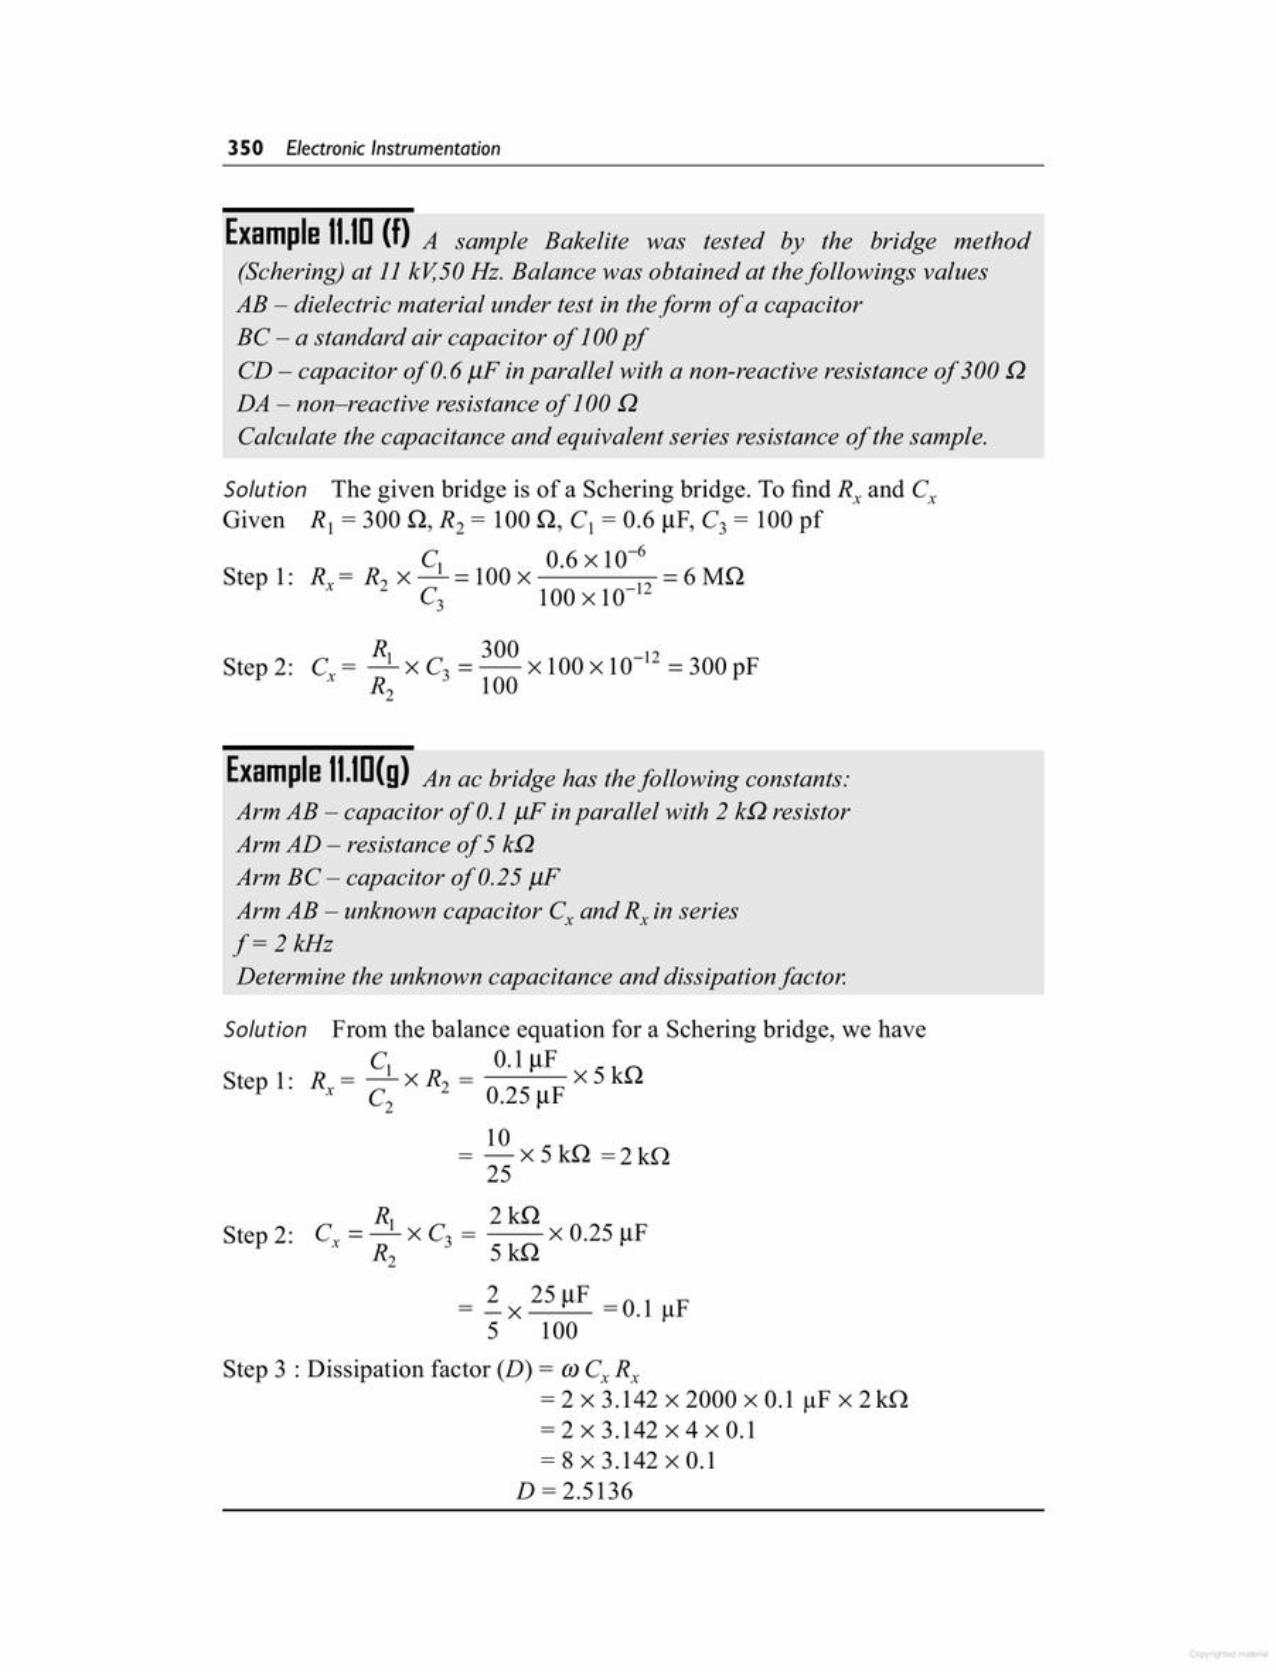
= ~ x 25~F=0.1 ~F5 100
Step 3 : Dissipation factor (D) = (J) C; R;= 2 x 3.142 x 2000 x 0.1 ~F x 2kn= 2 x 3.142 x 4 x 0.1=8x3.142xO.l
D=2.5136
R] 2knC =-xC3 = --xO.25I1Fx R 5 ill ,..,
2Step 2:
Solution From the balance equation for a Schering bridge, we haveC1 0.1 ~F f""\
Step l: R = - x R = x 5 k~l.. x C2 2 0.25~F
10= -x5kn =2kn25
Example I1.1D(g) An ac bridge has the following constants:Arm AB - capacitor of 0.1 J.1F in parallel with 2 kQ resistorArm AD - resistance of 5 kQArm BC - capacitor of 0.25 J.1FArm AB - unknown capacitor C, and R; in seriesf= 2 kHzDetermine the unknown capacitance and dissipation factor.
R] 300 -]2C,= - XC3 = x 100x 10 = 300 pF- R2 100
Step 2:
Solution The given bridge is of a Schering bridge. To find R; and C;Given R] = 300 n, R2 = 100 n, C] = 0.6 ~F, C3 = 100pf
Step 1: Rx= R2 x C] =100x 0.6XI0-~? =6MnC3 100xlO--
Example I1.1D(f) A sample Bakelite was tested by the bridge method(Schering) at 11 kV,50 Hz. Balance was obtained at thefollowings valuesAB - dielectric material under test in the form of a capacitorBC - a standard air capacitor of 100 pfCD - capacitor of 0.6 J.1F in parallel with a non-reactive resistance of 300 QDA - non-reactive resistance of 100 QCalculate the capacitance and equivalent series resistance of the sample.
350 Electronic Instrumentation
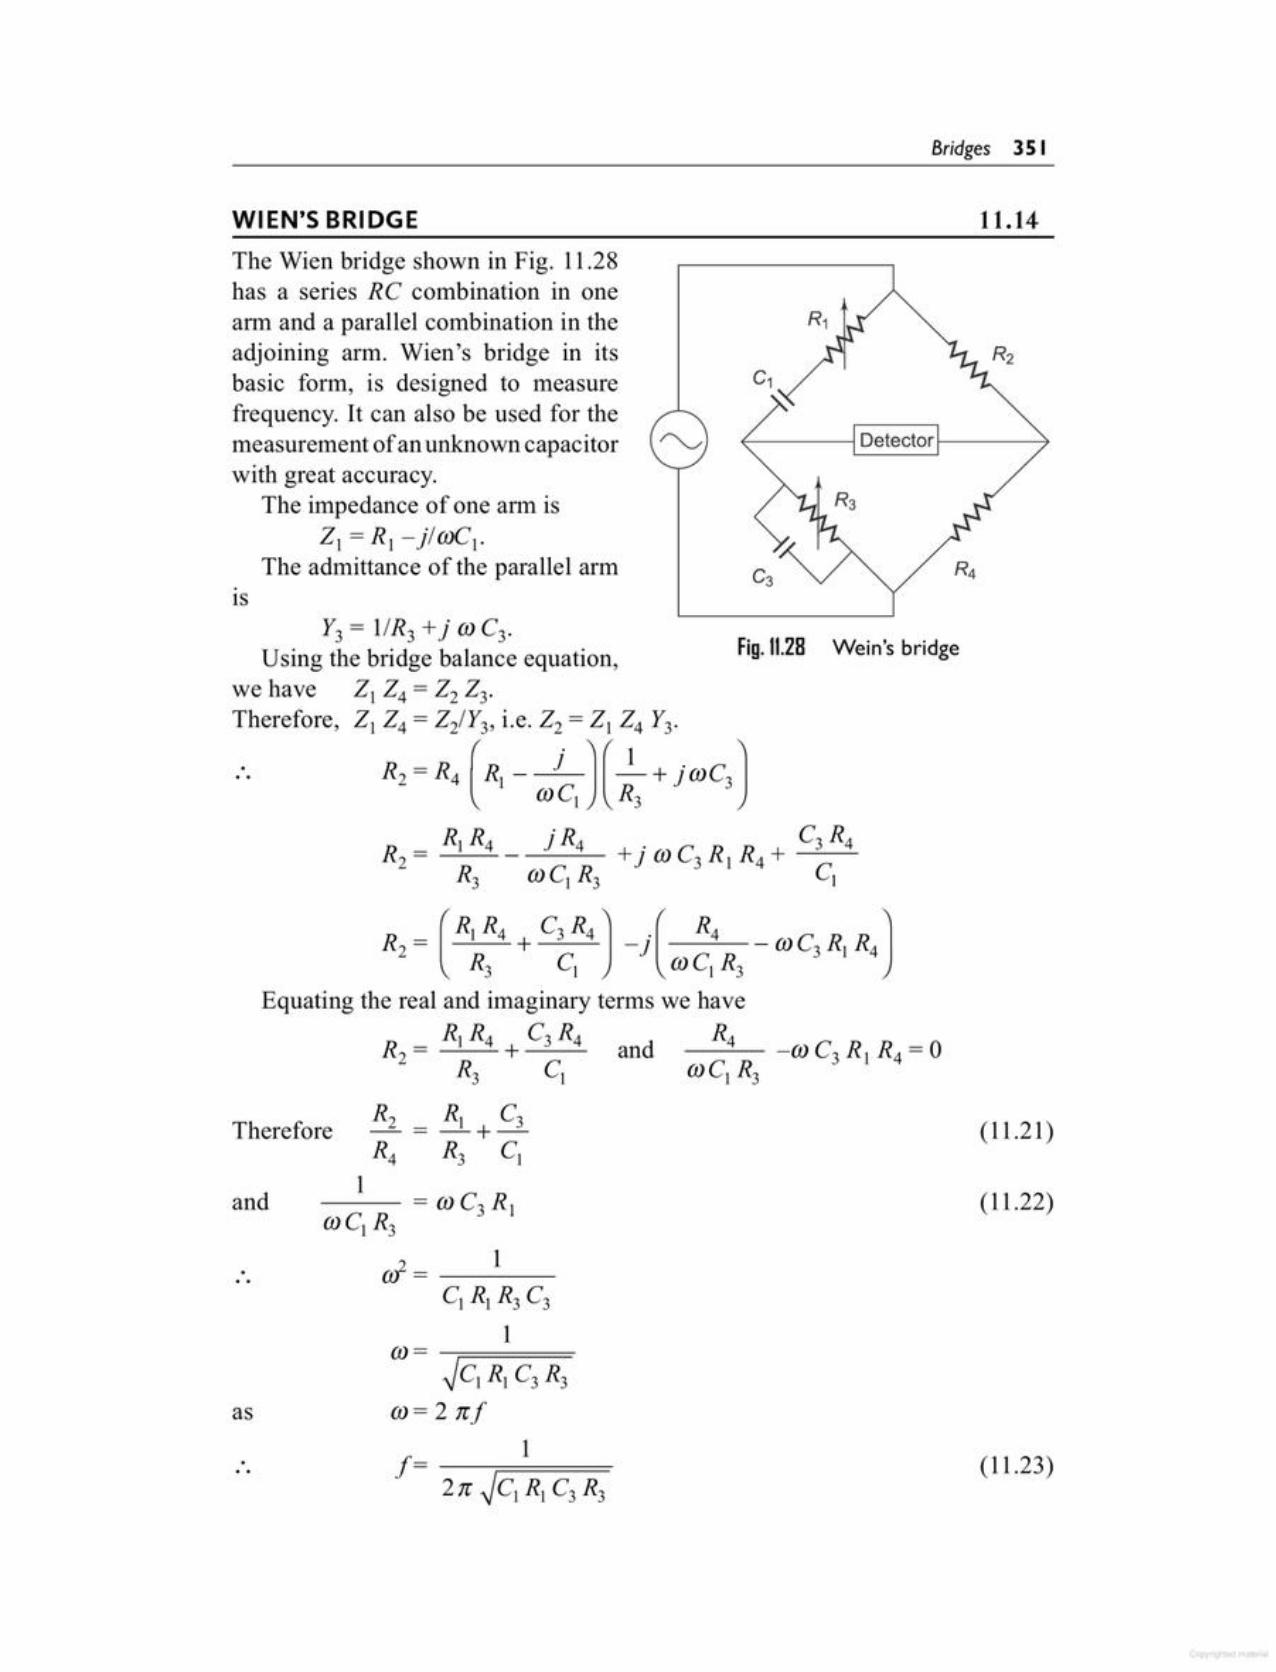
(11.23)
(11.22)
(11.21)
.. .
(1)= --;=====~Cl RI C3 R3
(1)=2nJ
J= 12n ~C)RJ C3 R3
as
and
R2 Rl C3Therefore - = - + -R4 R3 C1
1--- = (1)C3 R,(1)CJ R3
(1)2= __ 1__
Equating the real and imaginary terms we haveR) R4 C3 R4 R4R2 = + and -__;___ -(1) C3 R) R4 = 0R3 C1 (1)C1 R3
R = (R) R4 + C3 R4) -J' ( R4 _ (1)Co R R )2 R C (1)C R .» 43) ) 3
Wein's bridgeFig. 11.28
...
IS
The Wien bridge shown in Fig. 11.28has a series RC combination in onearm and a parallel combination in theadjoining arm. Wien's bridge in itsbasic form, is designed to measurefrequency. It can also be used for themeasurement of an unknown capacitorwith great accuracy.
The impedance of one arm isZl = R, - jl(1)Cl·
The admittance of the parallel arm
Y3 = llR3 +j (1)C3·Using the bridge balance equation,
we have Zl Z4= Z2 Z3'Therefore, Zl Z4= Z21Y3' i.e. Z2= Zl Z4 Y3·
R2 =R4 (Rl - j )(_1 + j(1)C3)(1)C1 R3
11.14WIEN'S BRIDGE
Bridges 3S I
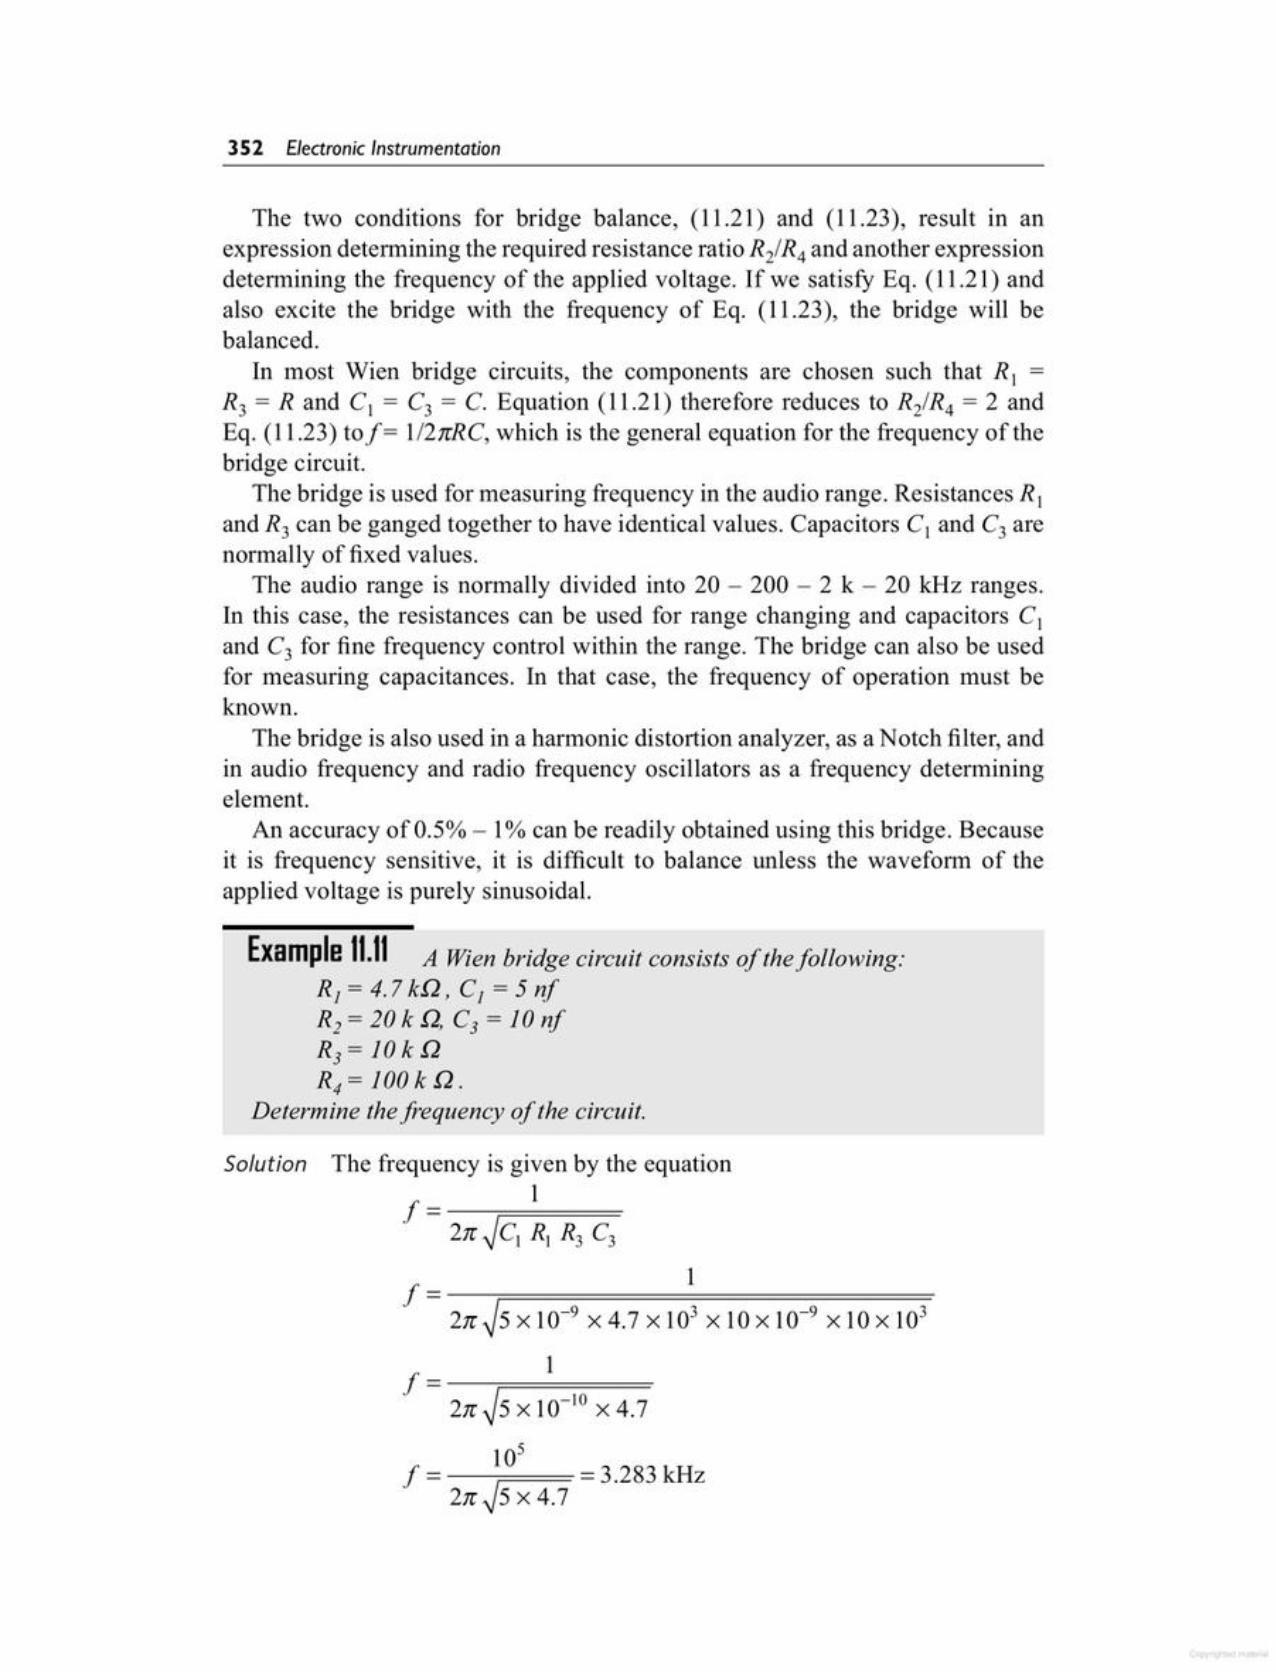
Solution The frequency is given by the equation
f= 12n~Cj s, R3 C3
f= 12n )5 x 10-9 x 4.7 X 103 x 10 X 10-9 X 10 X 103
f= 12n )5 x 10-10 x 4.7
105f = = 3.283 kHz2n~5 x 4.7
Example 11.11 A Wien bridge circuit consists of the following:RJ=4.7k!2, CJ =5nfR2 = 20 k!2, C3 = 10 nfR3= 10k!2R4 = 100 k!2.
Determine the frequency of the circuit.
The two conditions for bridge balance, (11.21) and (11.23), result in anexpression determining the required resistance ratio R21R4and another expressiondetermining the frequency of the applied voltage. Ifwe satisfy Eq. (11.21) andalso excite the bridge with the frequency of Eq. (11.23), the bridge will bebalanced.
In most Wien bridge circuits, the components are chosen such that R 1 =
R 3 = Rand C j = C3 = C. Equation (11.21) therefore reduces to R21R4 = 2 andEq. (1l.23) tof= 112nRC, which is the general equation for the frequency of thebridge circuit.
The bridge is used for measuring frequency in the audio range. Resistances RIand R3 can be ganged together to have identical values. Capacitors C1 and C3 arenormally of fixed values.
The audio range is normally divided into 20 - 200 - 2 k - 20 kHz ranges.In this case, the resistances can be used for range changing and capacitors C 1
and C3 for fine frequency control within the range. The bridge can also be usedfor measuring capacitances. In that case, the frequency of operation must beknown.
The bridge is also used in a harmonic distortion analyzer, as aN otch filter, andin audio frequency and radio frequency oscillators as a frequency determiningelement.
An accuracy of 0.5% - 1% can be readily obtained using this bridge. Becauseit is frequency sensitive, it is difficult to balance unless the waveform of theapplied voltage is purely sinusoidal.
352 Electronic Instrumentation
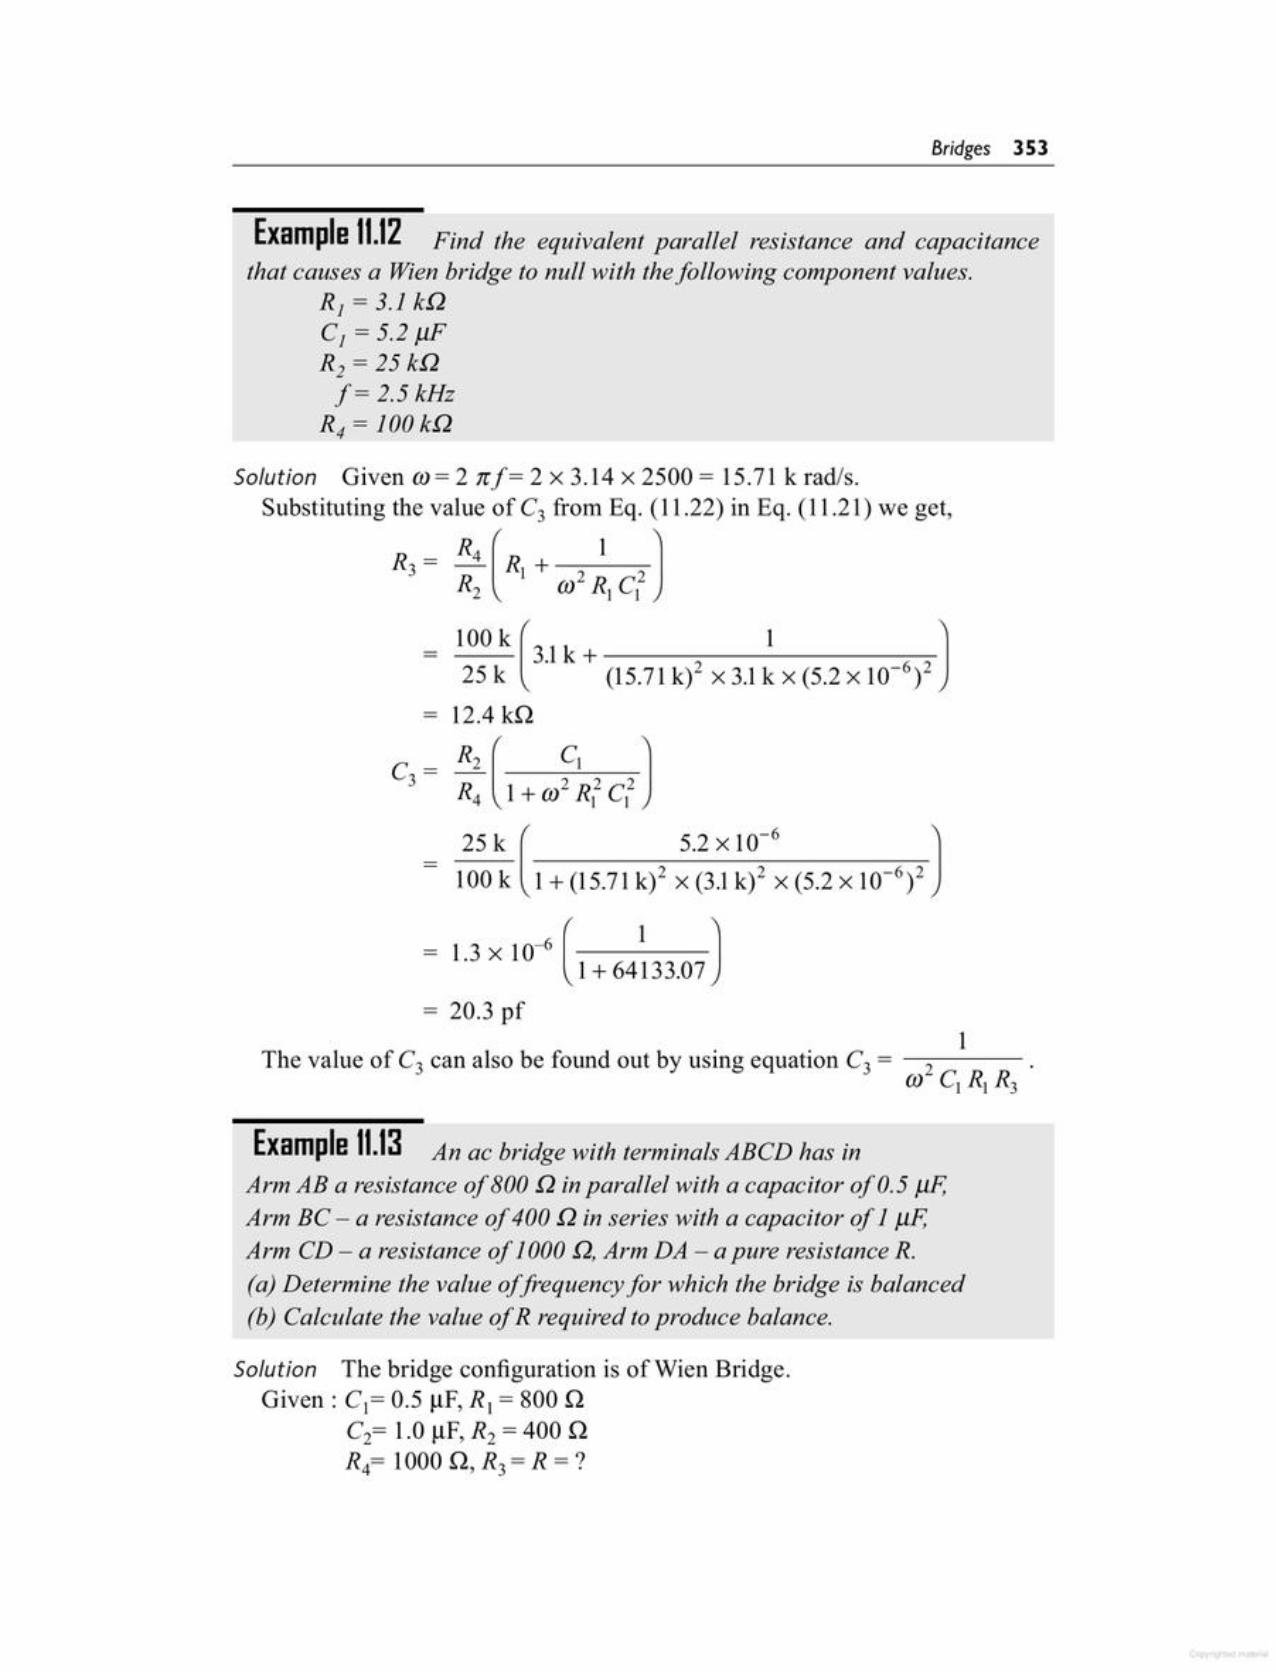
Solution The bridge configuration is of Wien Bridge.Given: C)= 0.5 ~F, R) = 800 n
C2= 1.0 ~F, R2 = 400 nR4= 1000 n,R3 = R =?
Example 11.13 An ac bridge with terminals ABCD has inArm AB a resistance of 800 Q in parallel with a capacitor of 0.5 J.1F,Arm BC - a resistance of 400 Q in series with a capacitor of 1J.1F,Arm CD - a resistance of 1000 Q,Arm DA - a pure resistance R.(a) Determine the value of frequency for which the bridge is balanced(b) Calculate the value of R required to produce balance.
1The value of C3 can also be found out by using equation C3 = 2 .
Q) C) R) R3
C3 = R2 ( C) JR4 1+ Q)2 R)2 C)2
25 k ( 5.2 x 10⁻⁶ J- 100 k 1+ (15.71 k)2 x (3.1k)2 x (5.2 X 10-6)2
- 1.3 x 10-<C + 64:33.07 J= 20.3 pf
Solution Given Q)= 2 ttf= 2 x 3.14 x 2500 = 15.71 k fad/soSubstituting the value of C3 froIn Eq. (11.22) in Eq. (11.21) we get,
R3 = R4 (R) + 2 1 2 JR2 Q) R) C)
- 100 k (3 1k 1 J25 k . + (15.71k)2 x 3.1k x (5.2 X 10-6)2
- 12.4 kn
Example 11.12 Find the equivalent parallel resistance and capacitancethat causes a Wien bridge to null with thefollowing component values.
RJ = 3.1 iaCJ = 5.2 pFR2 = 25 kQI= 2.5 kHz
R4 = 100kQ
Bridges 353
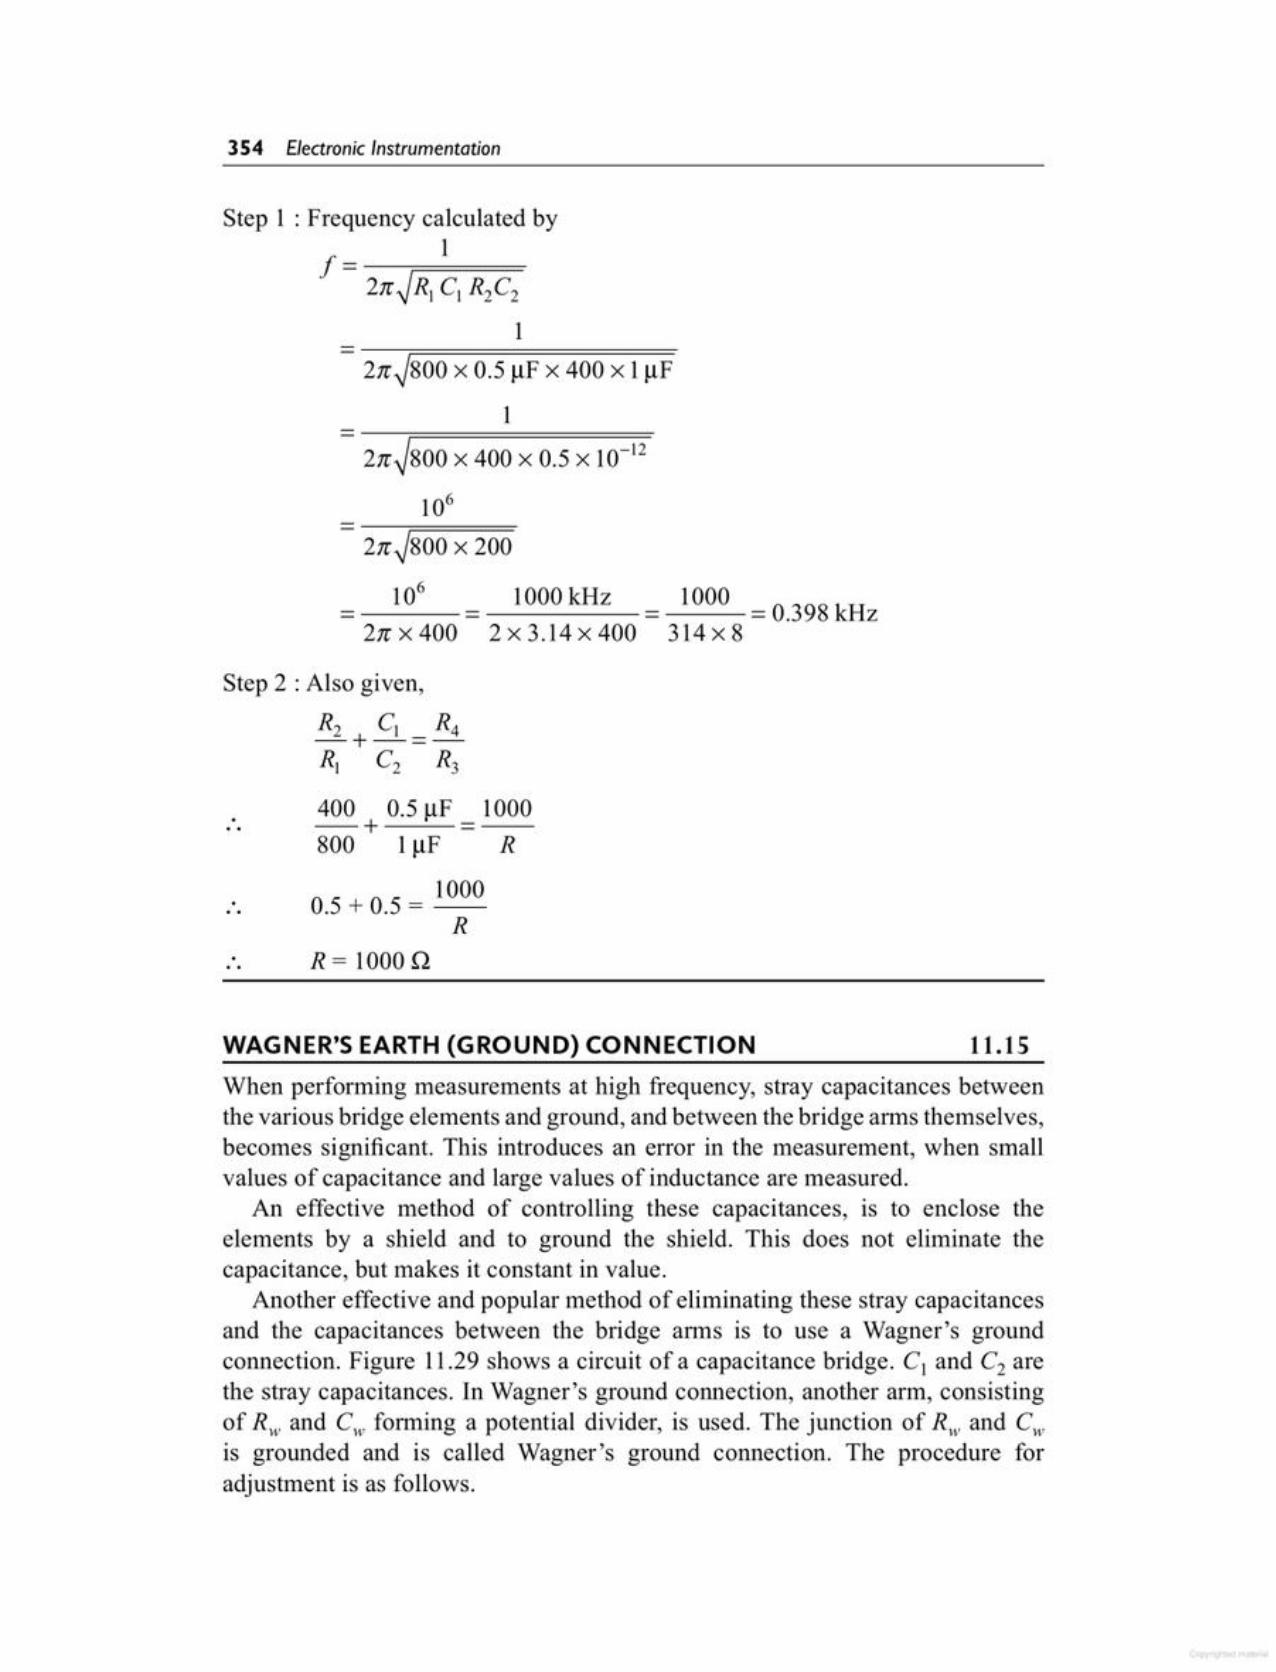
When performing measurements at high frequency, stray capacitances betweenthe various bridge elements and ground, and between the bridge arms themselves,becomes significant. This introduces an error in the measurement, when smallvalues of capacitance and large values of inductance are measured.
An effective method of controlling these capacitances, is to enclose theelements by a shield and to ground the shield. This does not eliminate thecapacitance, but makes it constant in value.
Another effective and popular method of eliminating these stray capacitancesand the capacitances between the bridge anns is to use a Wagner's groundconnection. Figure 11.29 shows a circuit of a capacitance bridge. C) and C2 arethe stray capacitances. In Wagner's ground connection, another ann, consistingof Rw and Cw forming a potential divider, is used. The junction of Rw and Cw
is grounded and is called Wagner's ground connection. The procedure foradjustment is as follows.
11.15WAGNER'S EARTH (GROUND) CONNECTION
R = 1000 Q...
400 0.5 flF 1000--+ =--800 1 flF R
0.5 + 0.5 = 1000R
...
Step 2 :Also given,
R2 C] R4-+-=-R] C2 R3
_ 106 _ 1000 kHz = 1000 = 0.398 kHz2n x 400 2 x 3.14 x 400 314 x 8
----r==============2n~800 x 400 x 0.5 X 10-12
106- -----r=====2n~800 x 200
----r================2n~800 x 0.5 flF x 400 x 1flF
1
Step 1 : Frequency calculated by
f= 12n~R] C] R2C2
1
354 Electronic Instrumentation
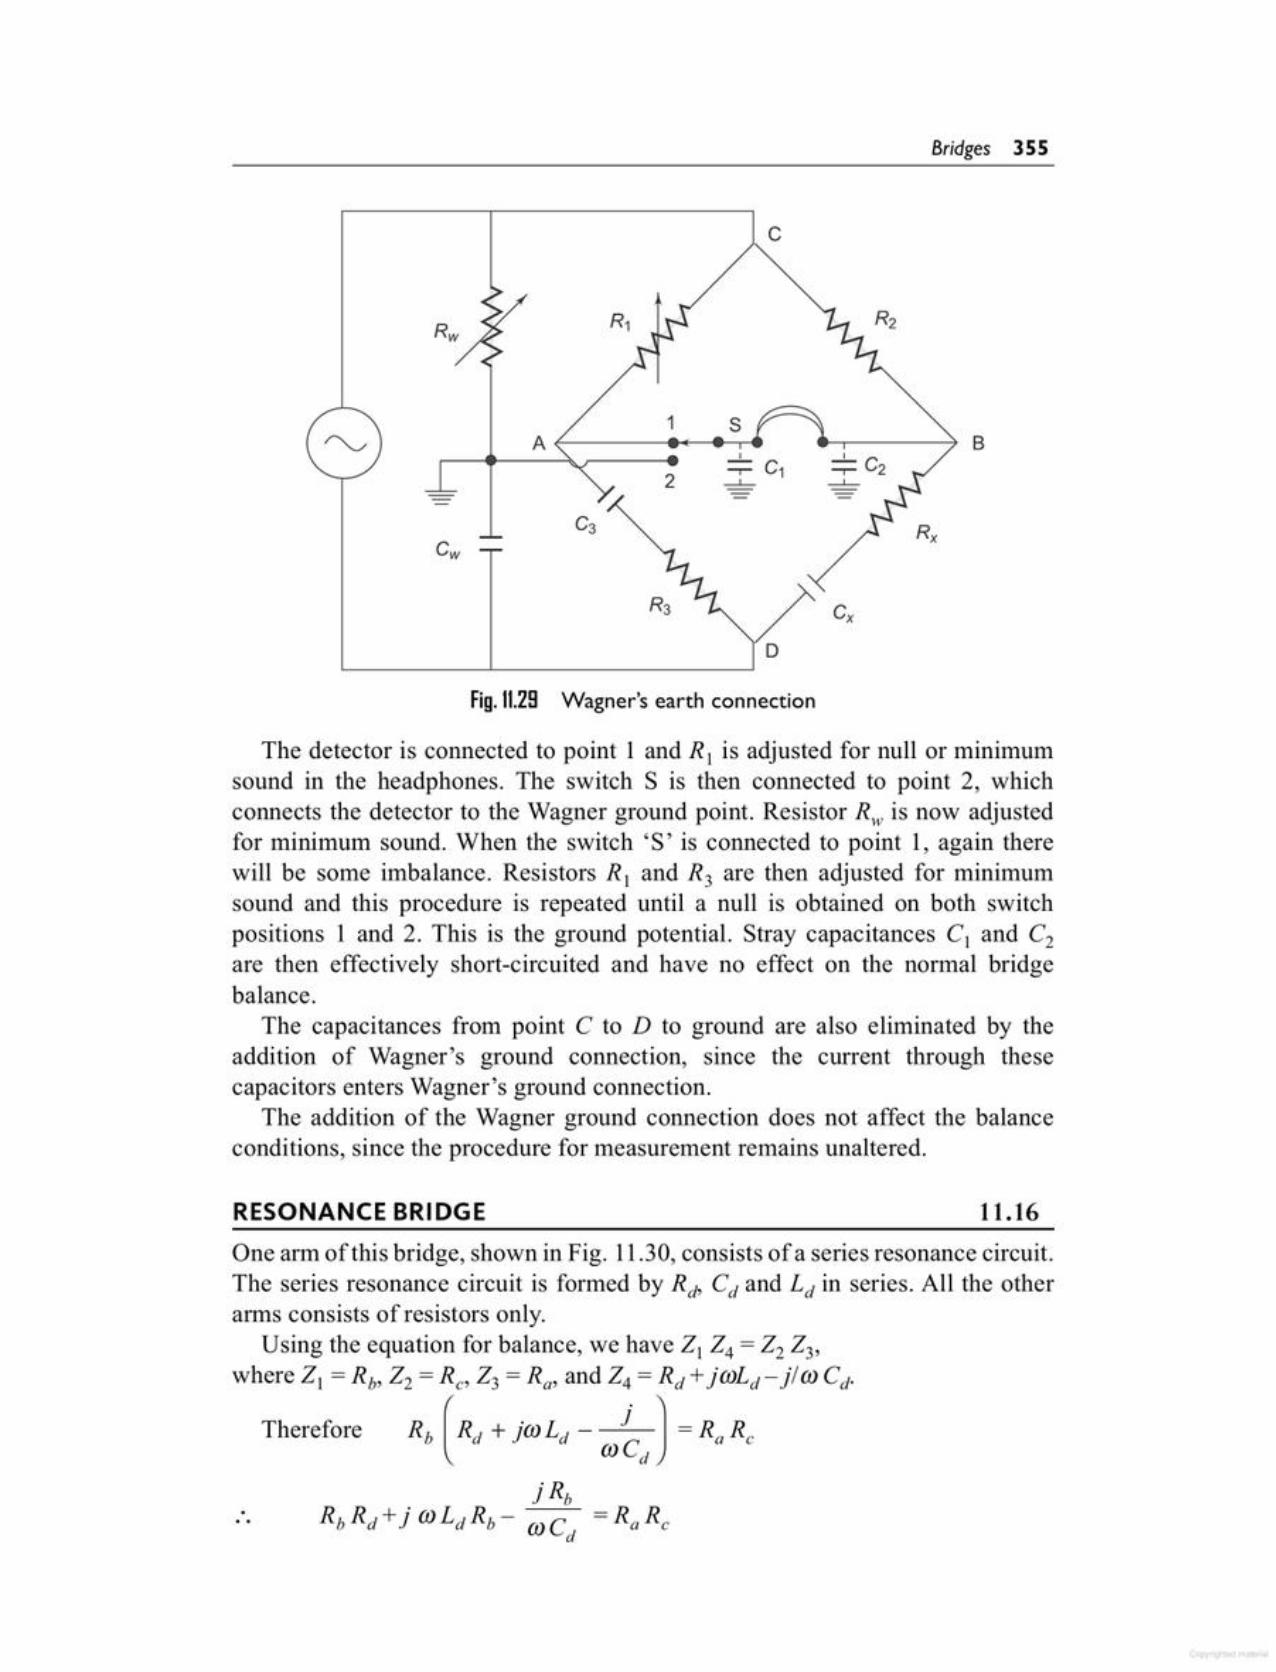
.. .
One arm of this bridge, shown in Fig. 11.30, consists of a series resonance circuit.The series resonance circuit is formed by Rd, Cd and Ld in series. All the otherarms consists of resistors only.
Using the equation for balance, we have 2124 =2223,where 21 = Rb, 22 = Rc' 23 = Ra, and 24 = Rd +jwLd - l!W Cd·
Therefore s, (Rd + jca L, - j ) =s, s,wCd
j RbRbRd+ j wLdRb- toC =RaRc
d
11.16RESONANCE BRIDGE
The detector is connected to point 1 and R 1 is adjusted for null or minimumsound in the headphones. The switch S is then connected to point 2, whichconnects the detector to the Wagner ground point. Resistor Rill is now adjustedfor minimum sound. When the switch'S' is connected to point 1, again therewill be some imbalance. Resistors R 1 and R3 are then adjusted for minimumsound and this procedure is repeated until a null is obtained on both switchpositions 1 and 2. This is the ground potential. Stray capacitances C1 and C2
are then effectively short-circuited and have no effect on the normal bridgebalance.
The capacitances from point C to D to ground are also eliminated by theaddition of Wagner's ground connection, since the current through thesecapacitors enters Wagner's ground connection.
The addition of the Wagner ground connection does not affect the balanceconditions, since the procedure for measurement remains unaltered.
c
A BI I
2::;:: C1 ::;:: C2_._ _._
C3 RxCw
R3 !'Cx
Fig. 11.28 Wagner's earth connection
Bridges 355
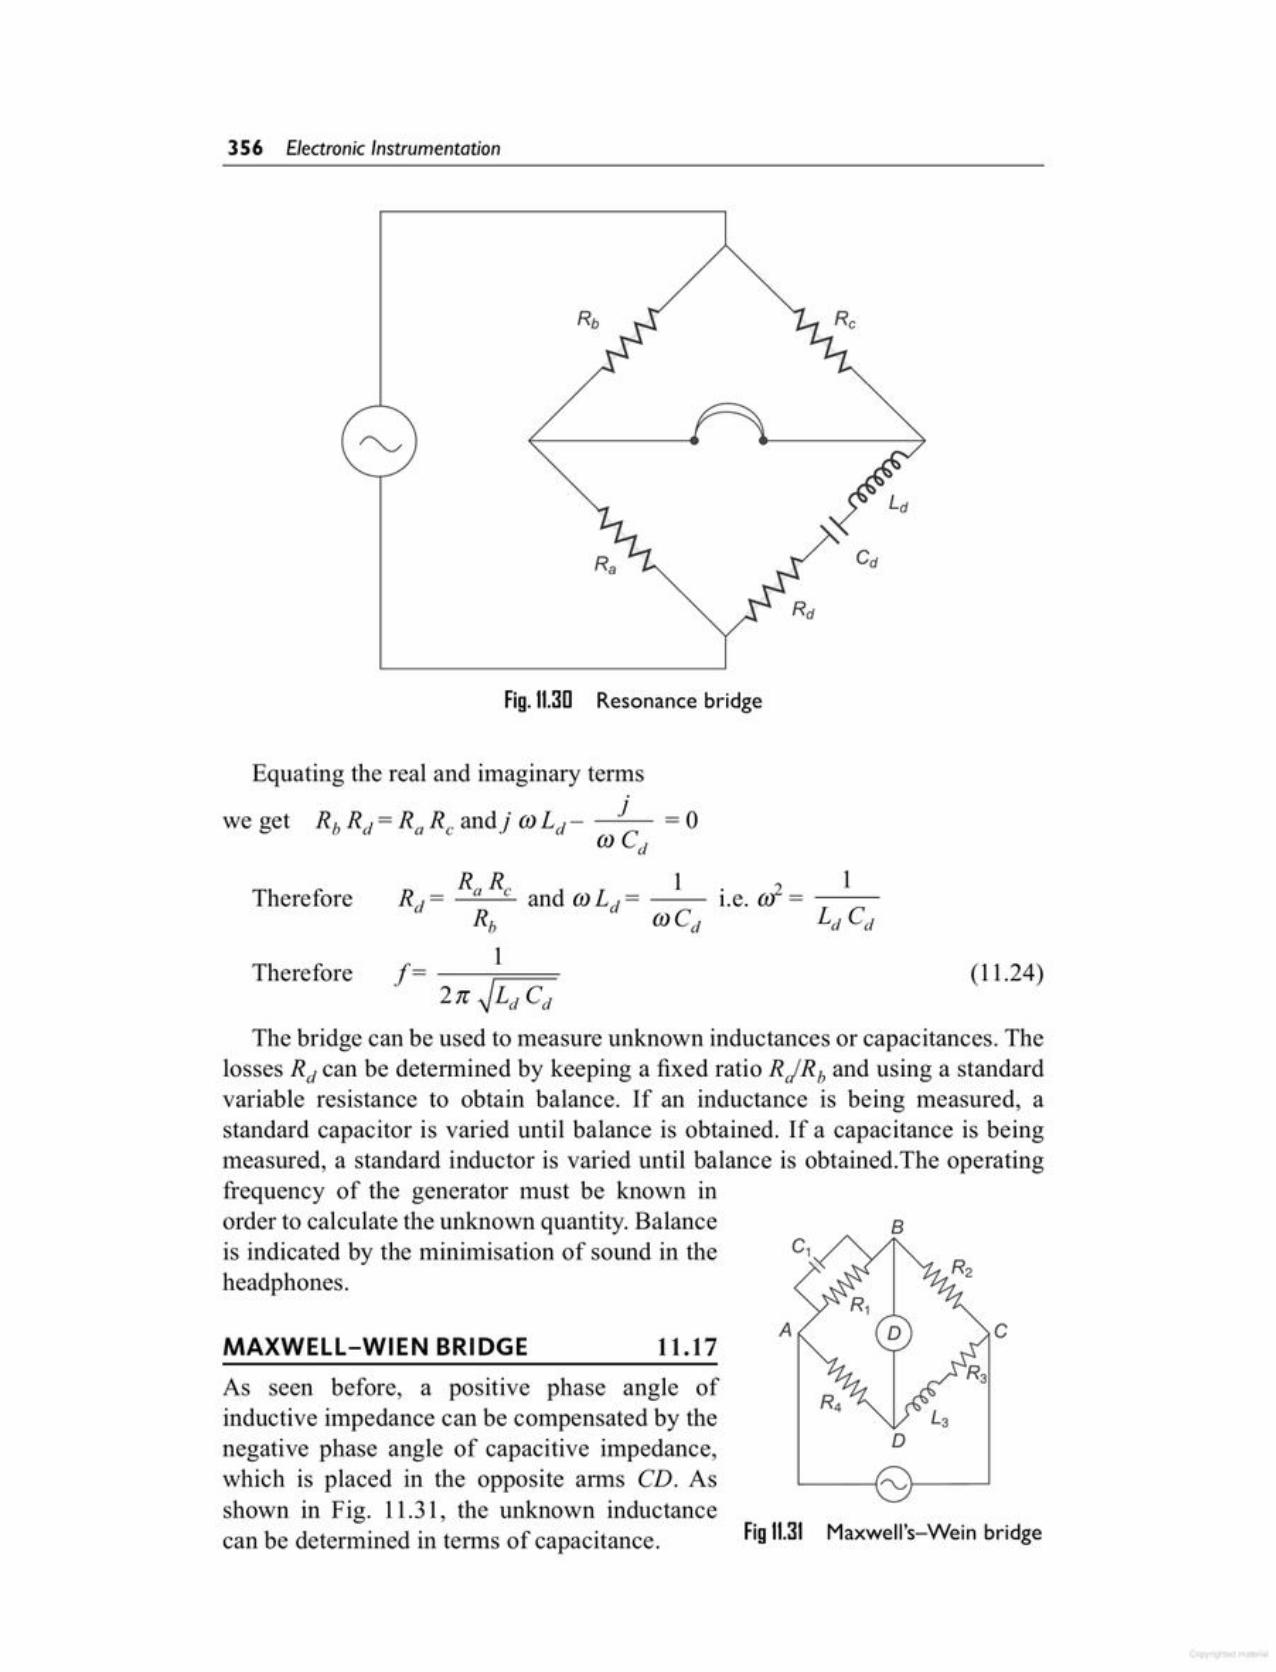
Maxwell's-Wein bridge
D
As seen before, a positive phase angle ofinductive impedance can be compensated by thenegative phase angle of capacitive impedance,which is placed in the opposite arms CD. Asshown in Fig. 11.31, the unknown inductancecan be determined in terms of capacitance. Fig 11.31
cDMAXWELL-WIEN BRIDGEA
11.17
The bridge can be used to measure unknown inductances or capacitances. Thelosses Rd can be determined by keeping a fixed ratio RjRb and using a standardvariable resistance to obtain balance. If an inductance is being measured, astandard capacitor is varied until balance is obtained. If a capacitance is beingmeasured, a standard inductor is varied until balance is obtained.The operatingfrequency of the generator must be known inorder to calculate the unknown quantity. Balance Bis indicated by the minimisation of sound in the c,headphones.
Therefore (11.24)
Therefore
Equating the real and imaginary terms
we get RbRd=RaRcandjOJLd- } =0OJCd
Fig. 11.30 Resonance bridge
356 Electronic Instrumentation

Fig. 1I.31(a)
Example 11.11From Fig. 11.31, R R 600 400
RjR3 = R2R4, therefore R3 = ~ 4 = X = 240 Q, 1000
L3 = CjR2R4 = 0.5 X 10-6x 600 x 400 = 12 X 10-2H= 0.12 mll.Hence R3 = 240 Q and L3 = 0.12 mH
Therefore, L3 = C IR2R4Hence the unknown resistance R3 and unknown inductance L3 can be
determined
22 =R2, 24 =R4 and 23 = R3 +jmL3Using balance condition, 2123 = 2224
Therefore, ( .RJ ) (R3 + jmL3) =R2R41+ jo: CJ RJ
Therefore, RIR3 + jmL3RI= R2R4 (1 + jmC1R1)RJR3 + jmL3RJ= R2R4 + jmCJRJ R2R4
Equating the real and imaginary terms, we haveR2R4R JR3 = R2R4 therefore R3 = ---=-----'-
and jmL3RI= jmC1R1 R2R4 RI
1 1 1 _ 1 . C _ 1+ jmC,R,2, = R//jXc" - = - +. - - + Jm ,- -....:...._____;:........:_21 R, jXcl R, RI
RJ2 = ----=-----, 1+ jto CJ RJ
Therefore,
But
Balance condition is obtained when
2123 = 2224
Bridges 357

Hence with reference to Fig. 11.32 (b) it can be seen that
. R3/ j(J)C2} = (R} +j(J)L}), 22 = R2, 23= Zoc= ( R l i C) and 24 = R4 + 20DR3 + S + 1 j(J)For balance condition,
R3 / j(J)CZ - -2oc - (R3 +Rs + 1/j(J)C) - 3
The balance condition for this bridge can be easily obtained by converting themesh impedances C, R3, R, to an equivalent star with the star point 0 as shown inFig 11.32(b) by using star/delta transformation.
As per delta to star transformation
(a) (b)
Fig 11.32 Anderson's bridge
o
A
88
The Anderson Bridge is a very important and useful modification of the MaxwellWien Bridge as shown in Fig 11.32.
11.18ANDERSON BRIDGE
358 Electronic Instrumentation
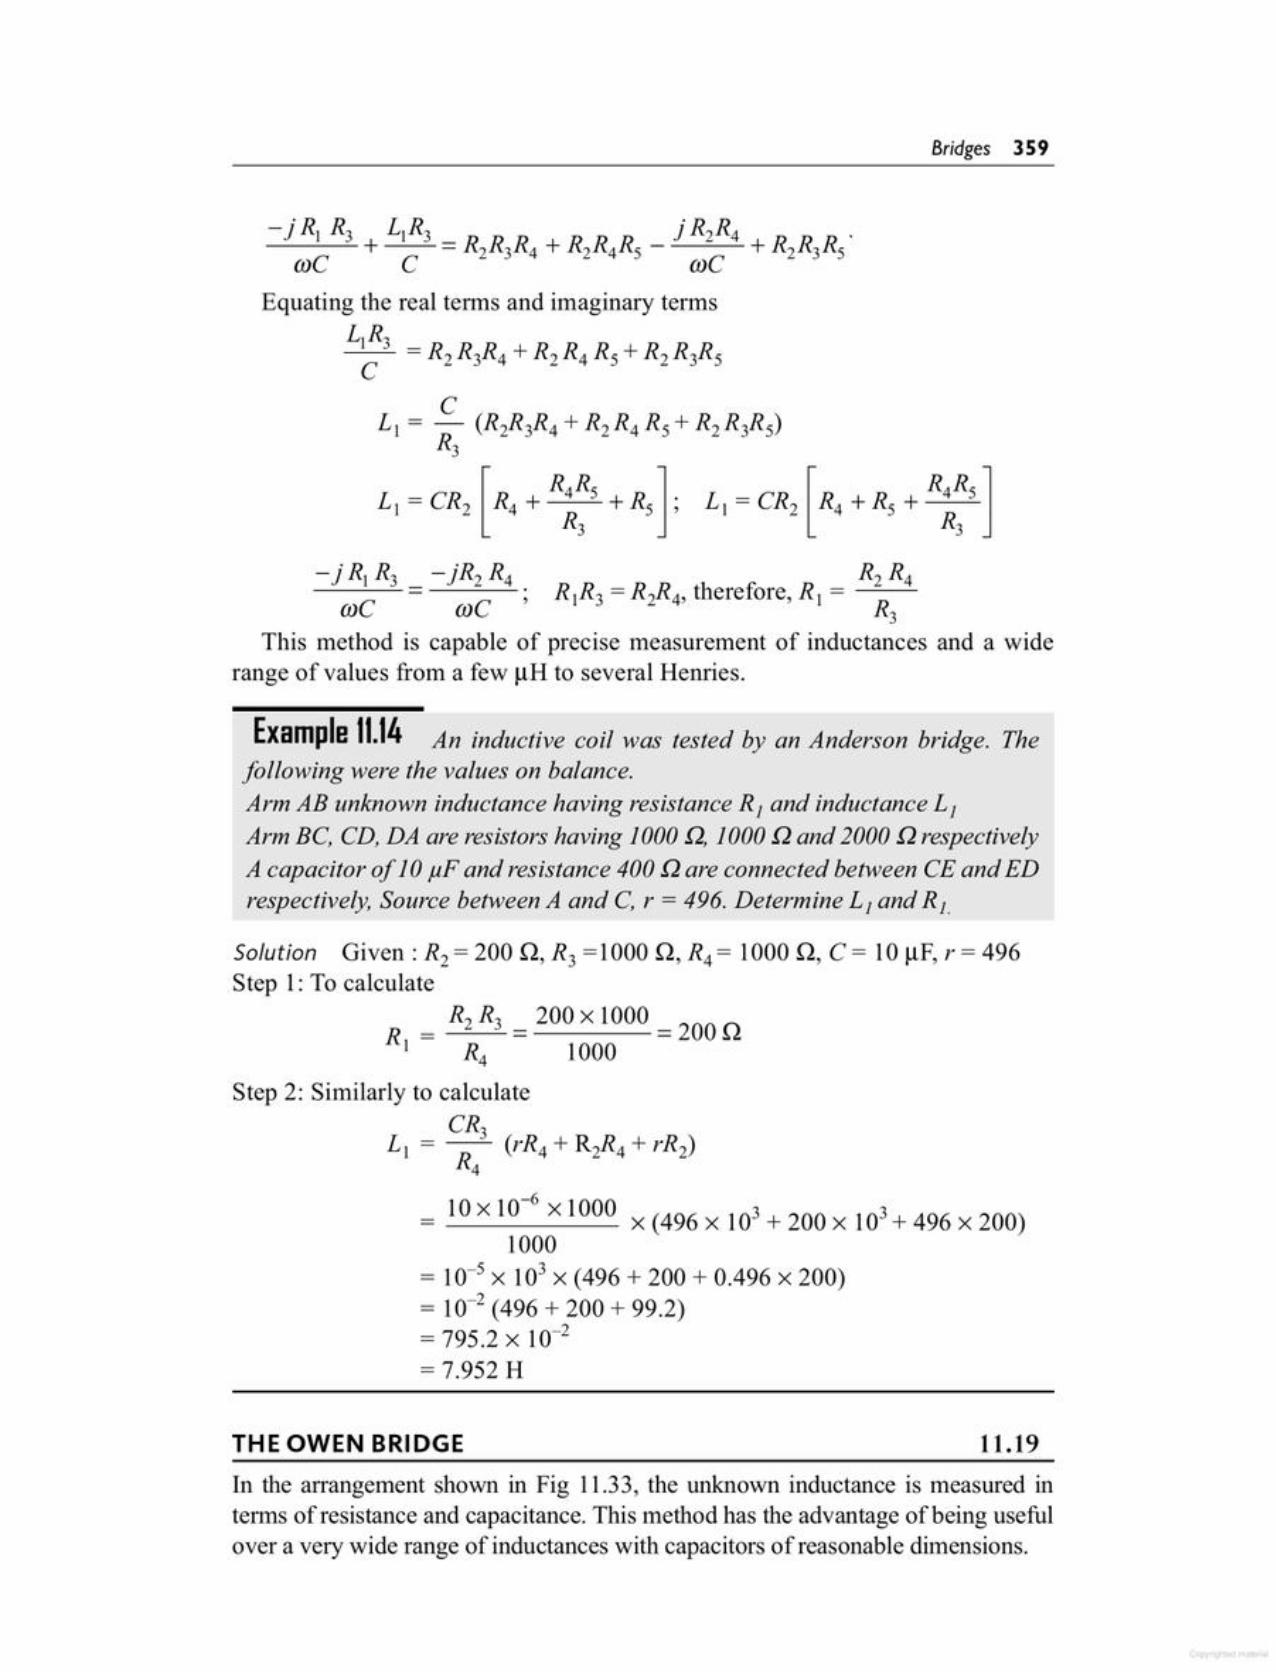
In the arrangement shown in Fig 11.33, the unknown inductance is measured interms of resistance and capacitance. This method has the advantage of being usefulover a very wide range of inductances with capacitors of reasonable dimensions.
11.19THE OWEN BRIDGE
Solution Given: R2 = 200 Q, R3 =1000 Q, R4 = 1000 Q, C = 10 J.lF,r = 496Step 1: To calculate
= R2 R3 = 200 x 1000 = 200 QRj R4 1000
Step 2: Similarly to calculateCR3
L, = (rR4 + R2R4 + rR2)R4
_ 10xlO-6 xlOOO x (496 x 103+200x 103+496 x 200)1000
= 10-s X 103 x (496 + 200 + 0.496 x 200)= 10-2 (496 + 200 + 99.2)= 795.2 x 10-2= 7.952 H
Example 11.14 An inductive coil was tested by an Anderson bridge. Thefollowing were the values on balance.Arm AB unknown inductance having resistance R1 and inductance L 1
Arm BC, CD, DA are resistors having 1000 Q,1000 Q and 2000 Q respectivelyA capacitor of 10 JlF and resistance 400 Q are connected between CE and EDrespectively, Source between A and C, r = 496. Determine L1and R 1.
CLJ = - (R2R3R4 + R2 R4 Rs + R2 R3RS)
R3
- [ R4RS ]. _ [ R4RS]LI - CR2 R4 + R3 + Rs ' LI - CR2 R4 + Rs + R3
- j Rj R3 _ - jR2 R4 R2 R4wC wC' RjR3 = R2R4, therefore, R, = R3
This method is capable of precise measurement of inductances and a widerange of values from a few J.lH to several Henries.
Bridges 359

Fig 11.34 De Sauty bridge
D
A
I
B
-} x ImC3 2
Dividing equation (11.25) and (11.26) we have(11.26)
(11.25)Vs= VD
I, R, = 12R2
C2 be the capacitor whose capacitance IS to bemeasured,
C3 be a standard capacitorR1, R2 be non-inductive resistorsBalance is obtained by varying either R, or R2For balance conditions, point Band D are at same
potential.Therefore,
As seen from Fig. 11.34,Let
11.20
bridgeFig 11.33 Owen's
DE SAUTY BRIDGE
. .-) )
2, = ,22 = R2, 24 = R4 - ,23 = R3 + jmL3mC, mC4
Hence substituting in the balance equation, we get
( - j J X (R3 + jmL3) = R2 x (R4 - j Jm~ m~
- j R3 - j X jtol.; _ R R _ j R2_----=-- + - 2 4mC, mC, «c4
- j R3 !2_ - R R _ j R2----=--___..:o...+ - 2 4mC, C, »c 4
Equating the real and the imaginary terms,
L_3 = R2R4 therefore, L3 = C, R2R4C,
-·R -·R R R C R) 3 = ) 2 Therefore, _3 = _2 hence R3 = ' 2mC, mC4 C, C4 C4
As seen from the values of R3 and L3 the term' m' does not appear in both thefinal equations. Hence the bridge is unaffected by frequency variations.
As per the balance condition,2,23 = 2224 C/,
360 Electronic Instrumentation
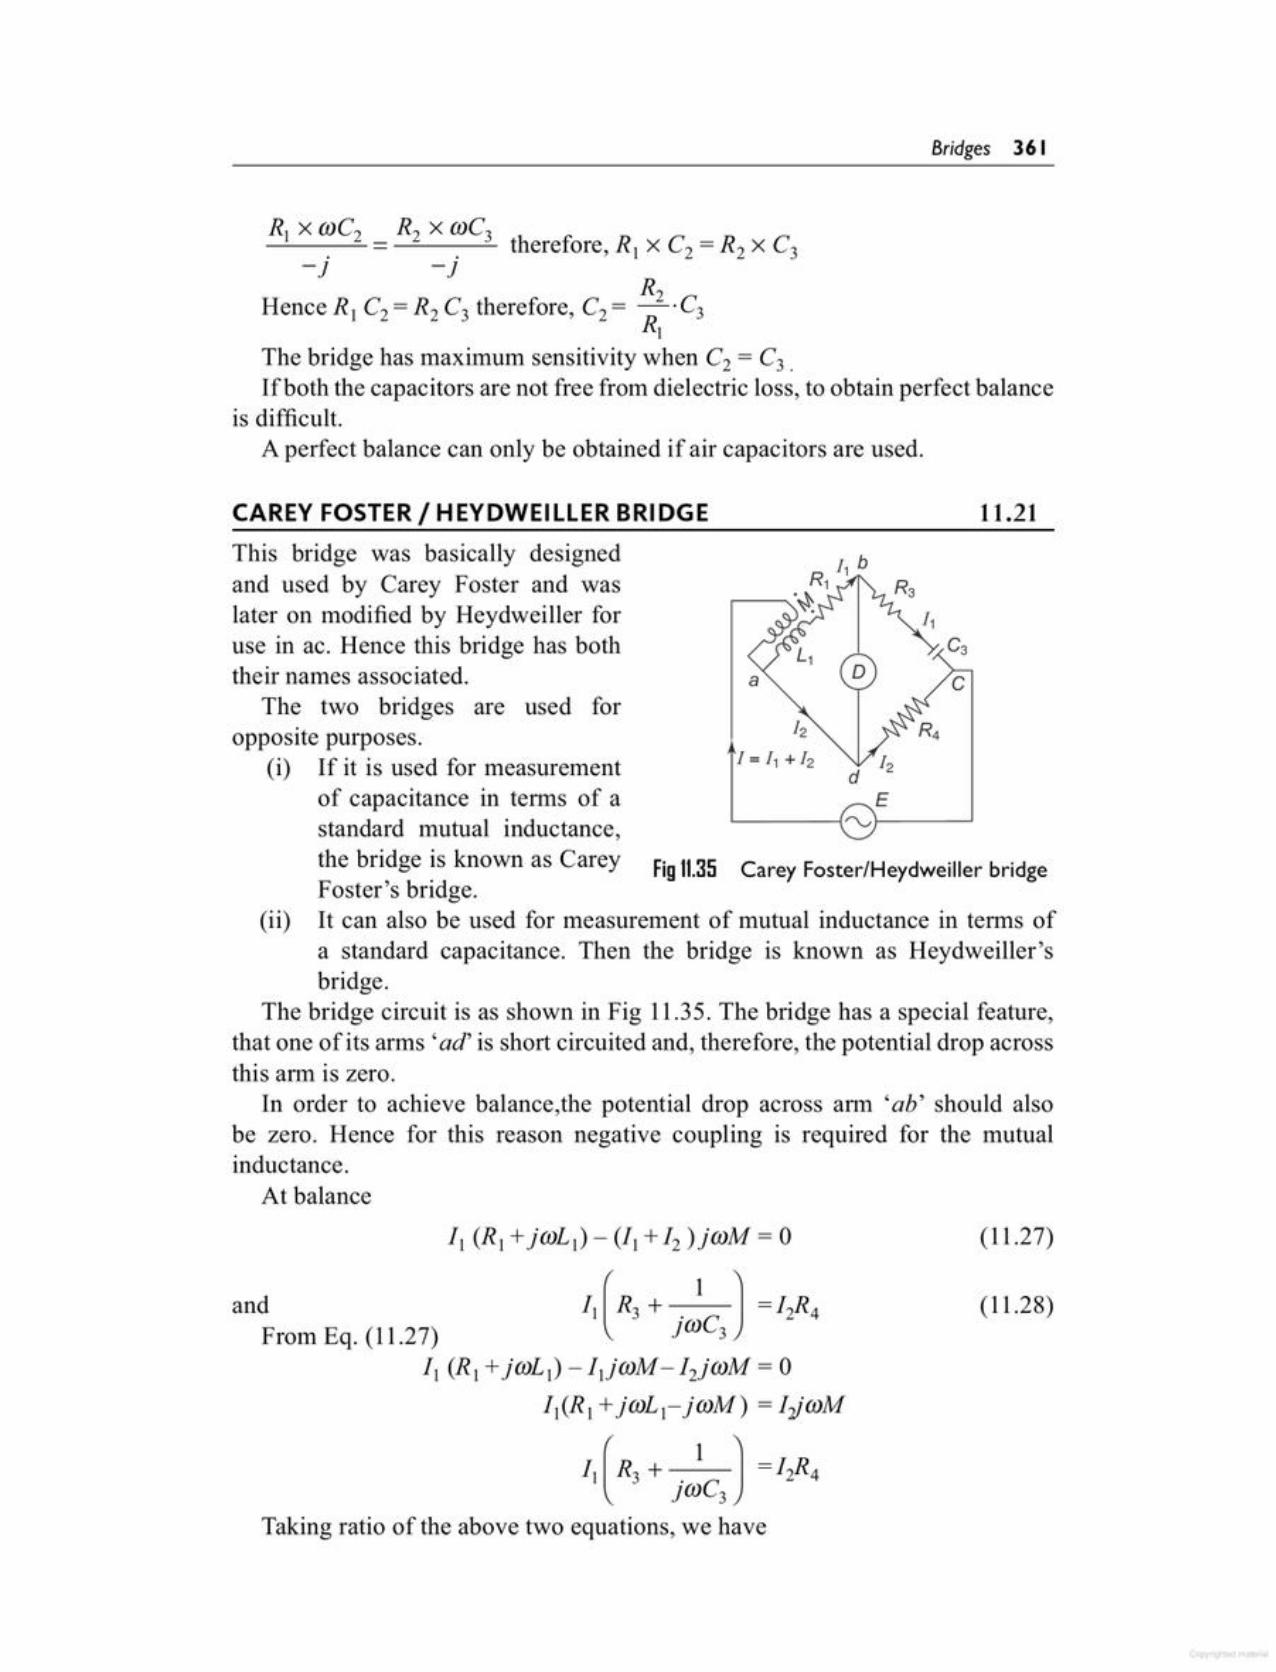
(11.28)
(11.27)II (RI +j(J)LI) - (II+ 12 )j(J)M = 0
and II (R3 + . 1 ) =I2R4From Eq. (11.27) }(J)C3
II (RI +j(J)LI) -Ilj(J)M-I2j(J)M = 0II(RI +j(J)LI- j(J)M) = I-j(J)M
II(R3 + . 1 ) = I2R4}(J)C3
Taking ratio of the above two equations, we have
Carey Foster/Heydweilier bridge
c
11
This bridge was basically designedand used by Carey Foster and waslater on modified by Heydweiller foruse in ac. Hence this bridge has boththeir names associated.
The two bridges are used foropposite purposes.
(i) If it is used for measurementof capacitance in terms of astandard mutual inductance,the bridge is known as Carey Fig 11.35Foster's bridge.
(ii) It can also be used for measurement of mutual inductance in terms ofa standard capacitance. Then the bridge is known as Heydweiller'sbridge.
The bridge circuit is as shown in Fig 11.35. The bridge has a special feature,that one of its arms' ad' is short circuited and, therefore, the potential drop acrossthis arm is zero.
In order to achieve balance,the potential drop across arm 'ab' should alsobe zero. Hence for this reason negative coupling is required for the mutualinductance.
At balance
11.21CAREY FOSTER / HEYDWEILLER BRIDGE
R X (J)C R X (J)CI 2 = 2 3 therefore R X C =R x C. . 'I 2 2 3=! =J
R2Hence R I C2 = R2 C3 therefore, C2 = _. C3RI
The bridge has maximum sensitivity when C2 = C3 .
Ifboth the capacitors are not free from dielectric loss, to obtain perfect balanceis difficult.
A perfect balance can only be obtained if air capacitors are used.
Bridges 361
It can be seen that in the measurement of mutual inductance with this bridge,R3 is a separate resistance while in the measurement of capacitance R3 is not aseparate unit but represents the equivalent series resistance of the capacitor andhence can be determined in terms of the bridge elements.
And
B M = R R C H L = M (R3 + R4) L __ .R.:._l R....:..4C__:3;_.;.(R__:3;__+_R__;4;.;_)ut I 4 3' ence, I I -R4 R4
Therefore, L I = R IC3 (R3 + R4) (11.31)If the bridge is used for measurement of capacitance equations (11.29) and
(11.30) can be written as
(11.30)
(11.29)
Cross-multiplying, we have
R4 (RI + j(J)LI - j(J)M) ~ j(J)M( R, + j~C, J. . jwM
R4RI +jw(LI - M)R4 =jwMR3 + . CjW 3
MR4RI + jw(LI - M)R4 =jwMR3 + C
3
Equating the real and imaginary terms, we have
MR4R) = - therefore, M = RIR4C3
C3
jo: (LI- M) R4 =jwMR3 therefore, (LI - M) R4 = MR3
L, R4 = MR3 + MR4 therefore, L, R4 = M (R3 + R4)
M(R3 + R4)Hence, LI = R
4
I, (R, + joil.; - jwM) - I2jwM-
II ( R, + . I J I2R4jcc,
(RI + joii; - jwM) - jwM-
( 1 J R4R3 +
jwC3
362 Electronic Instrumentation

Assuming that a suitable method of measurement has been selected and thatthe source and detector are given, there are some precautions which must beobserved to obtain accurate readings.
The leads should be carefully laid out in such a way that no loops or longlengths enclosing magnetic flux are produced, with consequent stray inductanceerrors.
11.23PRECAUTIONS TO BETAKEN WHEN USING A BRIDGE
1. For low frequency, the most convenient detector is the vibrationgalvanometer.
2. For ordinary laboratory work at frequencies up to a few 100 Hz, themoving coil type of instrument is usually employed. It has a highsensitivity.
3. In high voltage testing, the moving magnet type of vibration galvanometerwith remote controlled tuning is used, (for 300 Hz - 1 kHz).
4. For higher AF frequencies (>800 Hz), the telephone (headphone) is thebest detector.(Vibration galvanometers and headphones have no phase selectivity, i.e.they do not indicate whether it is resistance or reactance adjustments thatare required.)
5. The ac galvanometer and separately excited dynamometer are phaseselective, and are best suited at low frequencies. They have a highsensitivity.
6. In many cases, especially in bridges for routine use, a pointer instrumentis used. It is advantageous if it can be made phase selective.These pointer instruments are generally moving coil milliamrnetersoperated with some arrangement of copper oxide rectifiers (frequencyrange 40 Hz - 1 kHz).
7. Modern bridge techniques employ the amplifier as a regular feature.8. At frequencies above about 3 kHz, and particularly at high AF or RF, a
heterodyne or beat-tone detector is used.9. With all detectors, the impedance should be selected to suit that of the
bridge. A higher sensitivity can be obtained by using an interbridgetransformer. Also, when headphones are used as detectors, precautionsshould be taken to eliminate capacitance effects between the observerand the headphones.
10. A moving magnet vibration galvanometer has a range of up to 1500 Hz.11. An electrodynamometer can also be used as an ac detector.12. Electrometers are used as detector because small capacitances possess
a very large impedance when used with ac circuits at low frequency,and when measured in the bridge they form a high impedance branch.Hence, this detector is used to increase sensitivity.
11.22TYPES OF DETECTORS
Bridges 363
18. What are some methods by whichmicroprocessors are reducing thecost and complexity of analog measurements?
19. Explain with diagram a basic acbridge.
20. Compare de and ac bridges.21. List various detectors used for ac
measurements,22. State the two conditions that must be
satisfied to obtain bridge balance.23. Describe how a similar angle bridge
(comparison bridge) differs from aWheatstone bridge.
24. Drawandderivethebalanceconditionfor a capacitance comparison bridge.
25. Draw and derive the balance condition for an inductance comparisonbridge.
26. Explain with a diagram how Maxwell's bridge can be used to measureunknown inductance.
27. Draw the circuit diagram and obtainbalance conditions for Maxwell'sbridge. State the limitation of a Maxwell's bridge.
28. Draw the circuit diagram and obtainbalance conditions for Hay's bridge.
29. Compare Maxwell's bridge andHay's bridge.
30. Explain with a diagram how Schering's bridge can be used to measureunknown capacitance.
31. Draw the circuit diagram and obtainbalance conditions for Schering'sbridge.
1. What is a bridge.? What is the importance of a bridge?
2. Explain with diagram the operationof a Wheatstone bridge.
3. What is the criteria for balance of aWheatstone bridge?
4. State the limitations of a Wheatstonebridge. How is it overcome?
5. Explain with a diagram the workingof a unbalanced Wheatstone bridge.
6. Explain with a diagram the workingprinciple of Kelvin's bridge.
7. Describe with diagram the operationof Kelvin's bridge.
8. How does the basic circuit of Kelvin's bridge differ from that of aWheatstone bridge.
9. Derive the balance condition for abasic Kelvin's bridge.
10. Draw and explain a practical Kelvin's double bridge.
11. List and discuss the principle applications of a Kelvin's bridge.
12. Explain with a diagram how a bridgebe used as an error detector.
13. Explain with a block diagram theworking of a digital readout bridge.
14. How does the use of microprocessorsare useful in bridge circuits?
15. Explain the operation of a microprocessor controlled bridge.
16. Describe how a Wheatstone bridgemay be used to control various physical parameters.
17. Define the term 'null' as applied tobridge measurement.
_R_e_v_ie_w_O_u_es_t_iD_ns ~~
With a large L, the self-capacitance of the leads is more important than theirinductance, so they should be spaced relatively far apart.
In measuring a capacitor, it is important to keep the lead capacitance as lowas possible. For this reason the leads should not be too close together and shouldbe made of fine wire.
In very precise inductive and capacitances measurements, leads are encasedin metal tubes to shield them from mutual electromagnetic action, and are usedor designed to completely shield the bridge.
364 Electronic Instrumentation

(b) capacitance(d) frequency
sure(a) Q factor(b) dissipation factor(c) resistance(d) frequency
10. Wien bridge in its basic form is usedto measure unknown(a) inductance (b) capacitance(c) resistance (d) frequency
11. Anderson bridge is used to measureunknown(a) inductance(c) resistance
8. Schering bridge is used to measureunknown(a) inductance (b) capacitance(c) resistance (d) frequency
9. Schering bridge is also used to mea-
(b) medium Q(d) very high Q
7. Hay's bridge is used to measure aninductance of(a) low Q(c) high Q
1. A basic bridge consists of(a) two arms (b) three arms(c) four arms (d) single arm
2. Wheats one bridge is used to measure(a) voltage (b) current(c) power (d) resistance
3. Kelvin's bridge is used to measure(a) voltage (b) current(c) power (d) resistance
4. An ac bridge uses a detector in theform of(a) ammeter (b) voltmeter(c) headphones (d) wattmeter
5. Maxwell's bridge is used to measureunknown(a) inductance (b) capacitance(c) resistance (d) Q
6. Maxwell's bridge is used to measureQ factor in the range(a) 1-10 (b) 30-50(c) 50-75 (d) 75-100
Multiple Choice lluestinns I---~----------------------------~
42. Draw the circuit and obtain the balance condition of an Owen's bridge.
43. Compare Anderson bridge and Owen's bridge.
44. Explain with a diagram the operationof a De Sauty bridge.
45. Draw the circuit and obtain the balance condition of a De Sauty bridge.
46. Compare Schering bridge with DeSauty bridge.
47. What do you mean by Wagner'sground connection? What is its significance?
48. Explain with a diagram the workingof a Wagner's ground connection.
49. Explain how stray capacitances canbe eliminated using Wagner's groundconnection.
50. Explain Resonance Bridge with adiagram.
51. Derive the balance conditions for aresonance bridge.
32. Explain how dissipation factor of acapacitor can be measured.
33. Explain Wien's bridge with a diagram.
34. State and derive the two balance conditions for a Wien bridge.
35. How can a Wien bridge be used tomeasure frequency?
36. Explain with a diagram the workingof a Maxwell Wien bridge.
37. Draw the circuit and derive the condition of balance for a MaxwellWien bridge.
38. Explain with a diagram the workingof an Anderson bridge.
39. Draw the circuit and obtain thebalance condition of an Andersonbridge.
40. Compare Maxwell- Wien bridge withthat of an Anderson bridge.
41. Explain with a diagram the workingof Owen's bridge.
Bridges 365

6. A balanced ac bridge has the following constants.Arm AB - R = 1 k in parallel with C= 0.0471J.FArm BC - R = 2 k in series with C =0.047 IJ.FArm DC - unknownArm DA - C = 0.25 IJ.F.The frequency of the oscillator is 1kHz. Determine the constants of armCD.
7. A bridge is balanced at a frequencyof 1 kHz and has the following constants.Arm AB - 0.2 IJ.Fpure capacitorArm BC - 500 npure resistanceArm CD - unknownArm DA - R = 600 n in parallel withC = 0.1 IJ.F.Derive the balance condition and findthe constants of arm CD, consideredas a series circuit.
8. A 1000 Hz bridge has the followingconstantsArm AB - R = 1 k in parallel with C= 0.25 IJ.FArm BC - R = 1 k in series with C =0.25 IJ.FArm CD - L = 50 mH in series withR = 200 nArm DA - unknownFind the constants of arm DA to balance the bridge.Express the result as a pure R in series with a pure C or L, and as a pureR in parallel with a pure Cor L.
9. An ac bridge has the following constants.Arm AB - a pure capacitor C = 0.2IJ.FFig. 11.37
~---(G)-----76V
5000
5. If the sensitivity of the galvanometerin the circuit of Fig. 11.37 is 10 mm/IJ.A,determine its deflection.
Fig. 11.36
1.5 V
1. Calculate the value of Rx in a Wheatstone bridge if(i) R, = 400 n,R2 = 5 k, R3 = 2 k(ii) R,=10k,R2=40k,R3=15.5k(iii) R, = 5 k, R2 = 40 k, R3 = IOn
2. What resistance range must resistorR3 have in order to measure unknownresistor in the range 1- 100 ill usinga Wheatstone bridge? Given R, = 1 kand R2 = 10 k.
3. Calculate the value of R; in Fig. Ex.11.12, R(J= 1600 Rb, R, = 800 Rb andR, = 1.25 R2.
4. Calculate the current through the galvanometer in the circuit diagram ofFig. 11.36.
Practice Problems I-------------------
13. Wagner's ground is used to(a) eliminate stray capacitances(b) measure capacitance(c) measure resistance(d) measure inductance
12. To measure precise inductance froma few IJ.Hto several henries, the following bridge is used.(a) Maxwell's (b) Hay(c) Maxwell- Wien (d) Anderson
366 Electronic Instrumentation
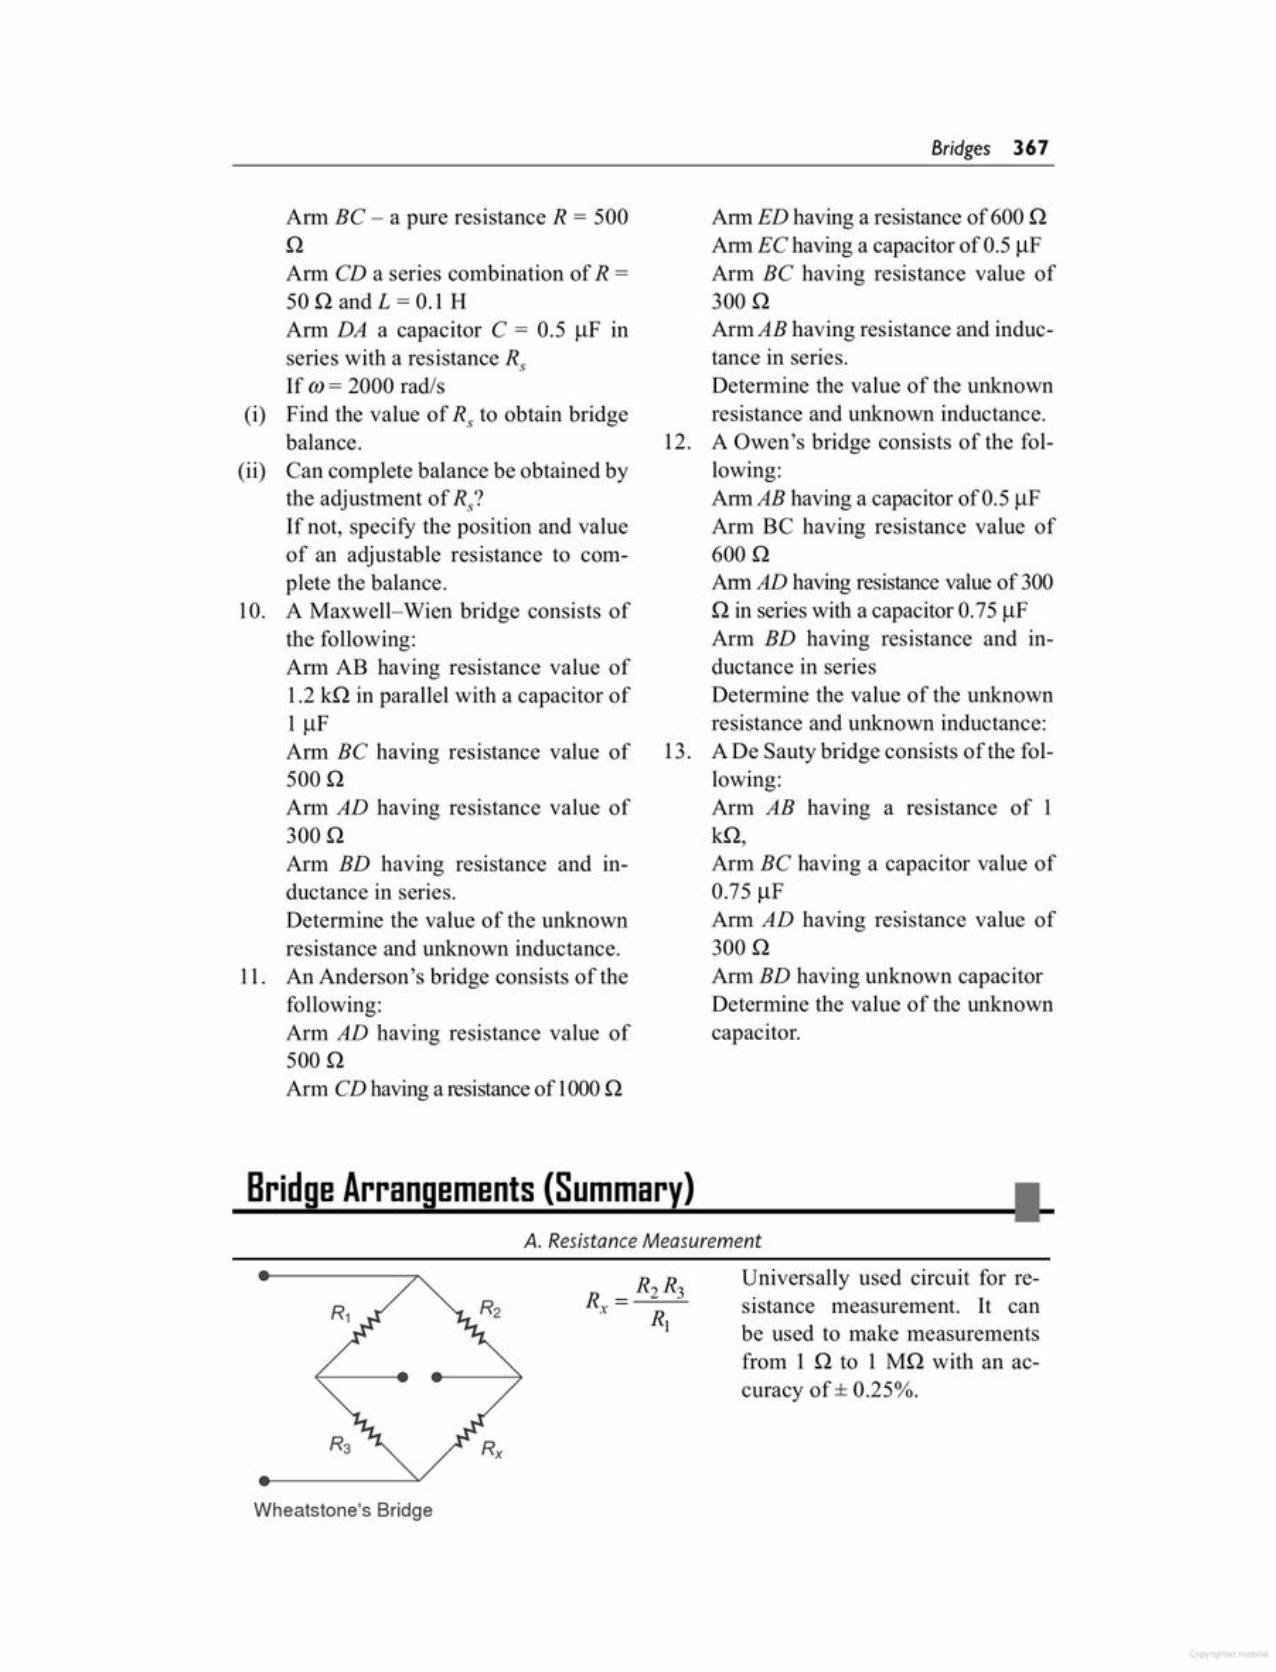
Wheatstone's Bridge
Universally used circuit for resistance measurement. It canbe used to make measurementsfrom 1 .0 to 1 Mn with an accuracy of ± 0.25%.
A. Resistance Measurement
Bridge Arrangements (Summary) I----&----~--~~--~------------~
Arm BC - a pure resistance R = 500 Ann ED having a resistance of 600 .0.0 Ann EC having a capacitor ofO.51lFArm CD a series combination of R = Arm BC having resistance value of50.0 and L = 0.1 H 300 oArm DA a capacitor C = 0.5 IlF in Arm AB having resistance and indue-series with a resistance R, tance in series.If (1) = 2000 rad/s Determine the value of the unknown
(i) Find the value of R, to obtain bridge resistance and unknown inductance.balance. 12. A Owen's bridge consists of the fol-
(ii) Can complete balance be obtained by lowing:the adjustment of Rs? AnnAB having a capacitor ofO.51lFIf not, specify the position and value Arm BC having resistance value ofof an adjustable resistance to com- 600.0plete the balance. Arm AD having resistance value of 300
10. A Maxwell-Wien bridge consists of .0 in series with a capacitor 0.751lFthe following: Arm BD having resistance and in-Arm AB having resistance value of ductance in series1.2 kn in parallel with a capacitor of Determine the value of the unknown11lF resistance and unknown inductance:Arm BC having resistance value of 13. A De Sauty bridge consists of the fol-500.Q lowing:Arm AD having resistance value of Arm AB having a resistance of 1300.0 kn,Arm BD having resistance and in- Arm BC having a capacitor value ofductance in series. 0.751lFDetermine the value of the unknown Ann AD having resistance value ofresistance and unknown inductance. 300 o
11. An Anderson's bridge consists of the Arm BD having unknown capacitorfollowing: Determine the value of the unknownArm AD having resistance value of capacitor.500.QArm CD having a resistance of 1000 .Q
Bridges 367

Most widely used bridge for capacitance measurements. Usedfor measurements of capacitancein the range of 100 pf - 1 IlF,with an accuracy of ± 0.2%.
Used to measure capacitance toa high degree of accuracy whenfrequency and resistance standards are employed.
Used to measure unknown
C = C3RJ capacitances withx R
2reference to a standard capacitor.A fixed resistance ratio and variable standards are used. Balanceis obtained by alternately varying C3 and RI•
Fig. 11.31(b)Schering's Bridge
Wien's Bridge
Capacitance Comparison
B. Capacitance Measurement
Used for measuring small resistances as low as 0.001nwith anaccuracy of ± 2%.
Fig. 11.31 (a)Kelvin's Double Bridge
368 Electronic Instrumentation
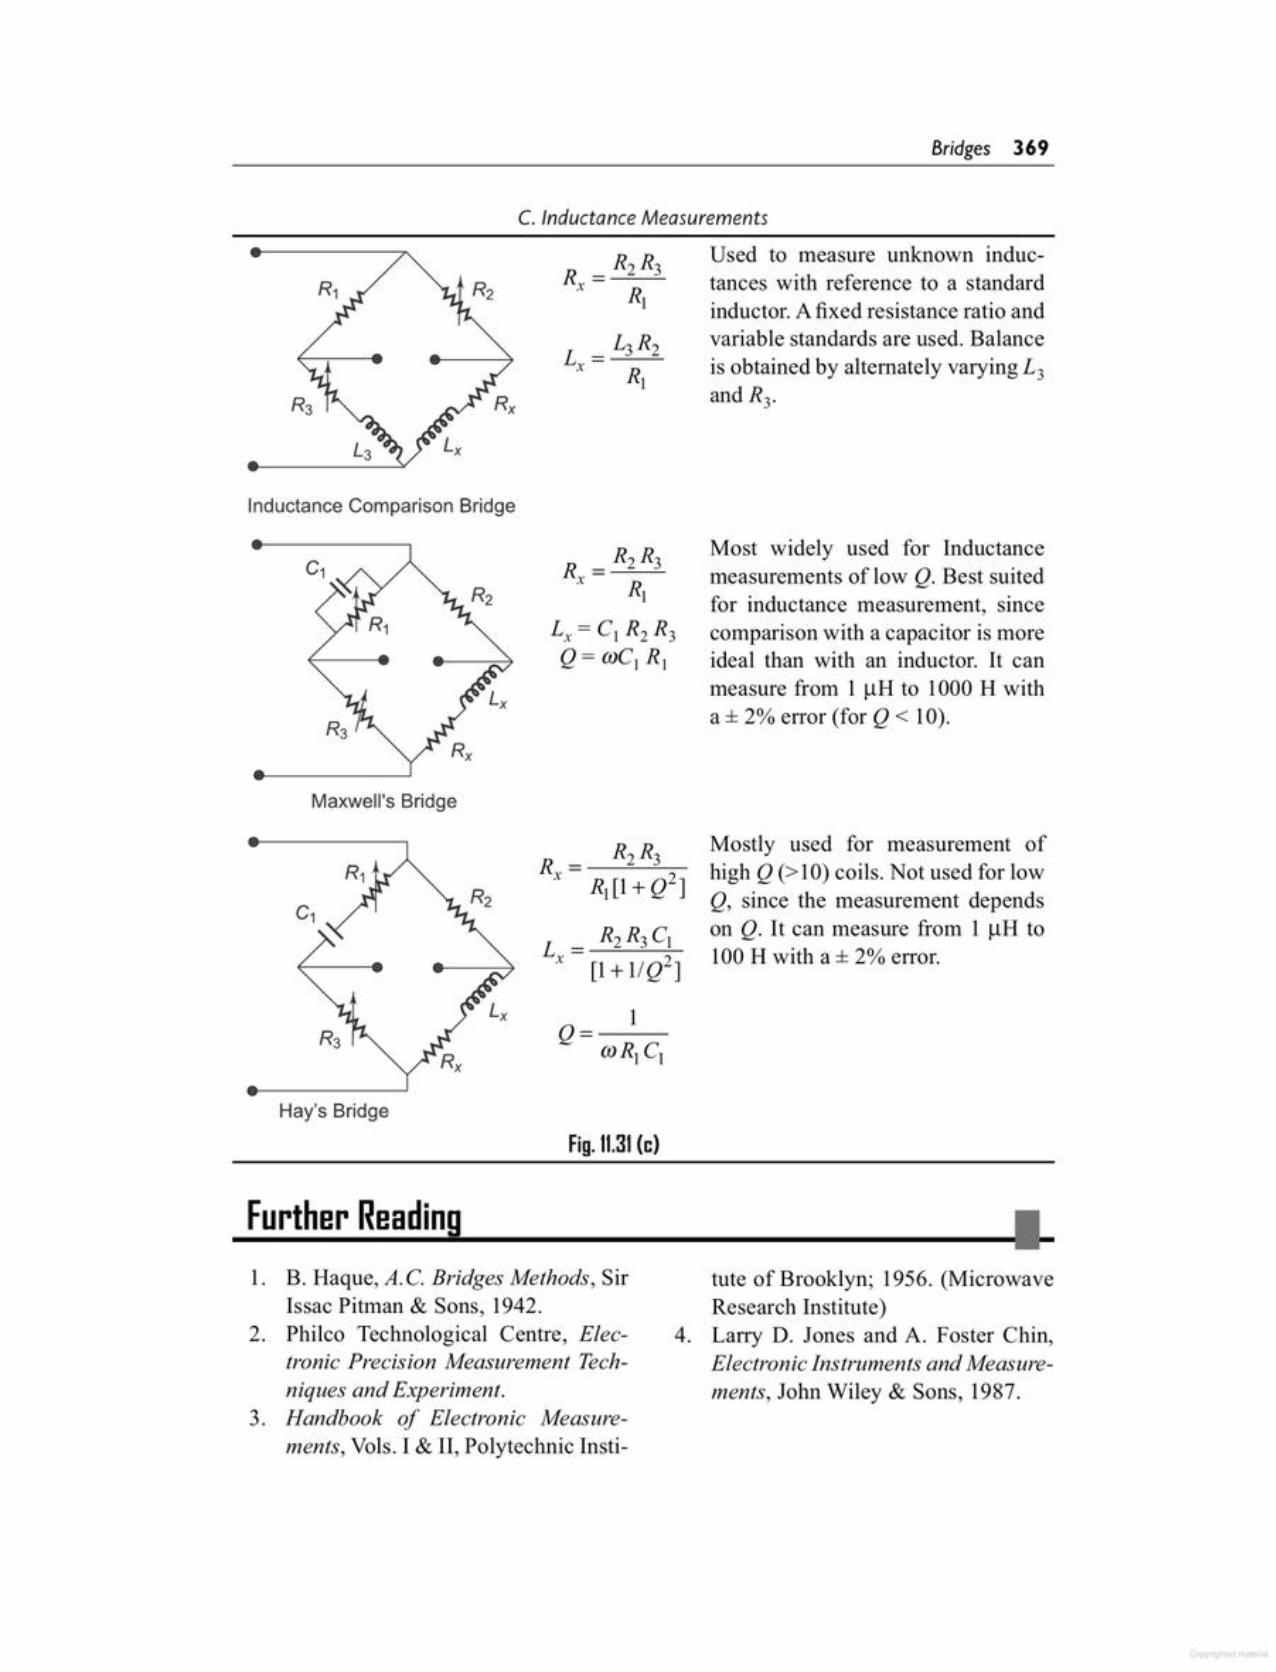
tute of Brooklyn; 1956. (MicrowaveResearch Institute)
4. Larry D. Jones and A. Foster Chin,Electronic Instruments and Measurements, John Wiley & Sons, 1987.
1. B. Haque, A.C. Bridges Methods, SirIssac Pitman & Sons, 1942.
2. Philco Technological Centre, Electronic Precision Measurement Techniques and Experiment.
3. Handbook of Electronic Measurements, Vols. I & II, Polytechnic Insti-
Further Reading I-----------------------------~
Mostly used for measurement ofhigh Q (> 10) coils. Not used for lowQ, since the measurement dependson Q. It can measure from 1 IlH to100 H with a ± 2% error.
Most widely used for Inductancemeasurements of low Q. Best suitedfor inductance measurement, sincecomparison with a capacitor is moreideal than with an inductor. It canmeasure from 1 IlH to 1000 H witha ± 2% error (for Q < 10).
Used to measure unknown inductances with reference to a standardinductor. A fixed resistance ratio andvariable standards are used. Balanceis obtained by alternately varying L3and R3.
Fig. 11.31(c)
L = R2 R3C)x [1+ lIQ2]
R = R2R3x Rj
Lx=CIR2R3
Q = mCI RJ
Hay's Bridge
Maxwell's Bridge
Inductance Comparison Bridge
c. Inductance Measurements
Bridges 369
A recorder is a measuring instrument that displays a time-varying signal in aform easy to examine, even after the original signal has ceased to exist.
Recorders generally provide a graphic recod of variations in the quantitybeing measured, as well as an easily visible scale on which the indication isdisplayed.
The variety of recordipg instruments in the central monitoring and controlstations of many industrial and utility plants is proof of their importance inindustrial work. They provide a continuous, written record of the changes takingplace in the quantity being measured. This chart record may be scaled off inelectrical values (mV/mA) or in terms of some non-electrical quantity, such astemperature or pressure.
Many recording instruments include an additional provision for some sortof controlling action. If the control function is the primary one, the measuringinstrument is called a controller.
The recorder usually provides an instantaneous indication for monitoring atthe same time as it makes a graphic record.
Electronic recording instruments may be divided into three groups.The easiest type is simply a meter having an indicating needle and a writing
pen attached to the needle. If a strip of paper is pulled at a constant velocityunder the writing pen (at a 90° angle to the direction of pen motion), the movingpen plots the time function of the signal applied to the meter. A highly specialdesigned D' Arsonval movement is used to drive the writing pen. This type iscalled a galvanometer recorder.
Another recorder is the null or potentiometric recorder, operating on a selfbalancing comparison basis by servomotor action. This recorder is basicallya voltage responsive positional servo system using a motor to move a writingdevice back and forth across a piece of paper. The servo system can be madeextremely accurate, rugged and powerful.
The magnetic recorder is the third type. In it, a thin magnetic tape or wire, ismagnetised in accordance with a varying signal as the tape passes rapidly acrossa magnetic recording head. The frequency response of magnetic recorders canextend from 0 Hz to a few kHz to nearly 10MHz. Because of the wide bandwidth
12.1INTRODUCTION
Recorders

Most recorders use a pointer attached to the stylus, so that the instantaneousvalue of the quantity being recorded can be measured directly on a calibratedscale. The assembly of a strip chart recorder is shown in Fig. 12.1(b). Thisrecorder uses a single pen and is servo driven.
Most strip chart recorders use a servo feedback system, to ensure that thedisplacement of the pen (stylus) across the paper tracks the input voltage in therequired frequency range.
A potentiometer system is generally used to measure the position of thewriting head (stylus).
The chart paper drive system generally consists of a stepping motor whichcontrols the movement of the chart paper at a uniform rate.
The data on the strip chart paper can be recorded by various methods.
1. Pen and Ink Stylus The ink is supplied to the stylus from a refillable reservoirby capillary action. Modern technology has replaced these pens by disposablefibre tip pens. In addition, multichannel operation can be performed, i.e. at any
Fig.12.1 (a) Basic strip chart recorder
j PaperMovement
Pen
InputSignal
rvootor
Range Signal\.0
SeSelector Conditioning M
,/'Event vMarker
Chart rChartSpeed DriveSelector
EventInput
Strip chart recorders are those in which data is recorded on a continuous roll ofchart paper moving at a constant speed. The recorder records the variation ofone or more variables with respect to time. The basic element of a strip chartrecorder consists of a pen (stylus) used for making marks on a movable paper,a pen (stylus) driving system, a vertically moving long roll of chart paper andchart paper drive mechanism and a chart speed selector switch, (as shown inFig. 12.1(a»).
12.2STRIP CHART RECORDER
of tape recorders, several modes of recording (direct, FM and digital) can beused.
There are two types of recording devices, (i)Analog, and (ii) Digital. Analogrecorders may be (i) graphic or (ii) magnetic. Graphic recorders are deviceswhich display and store a pen and ink record of some physical quantity. Theyare of three types (i) strip chart recorder, (ii) circular chart recorder, and an(iii) X-Y recorder. These and other types of recorders are discussed in detail inthe following sections.
Recorders 37 I
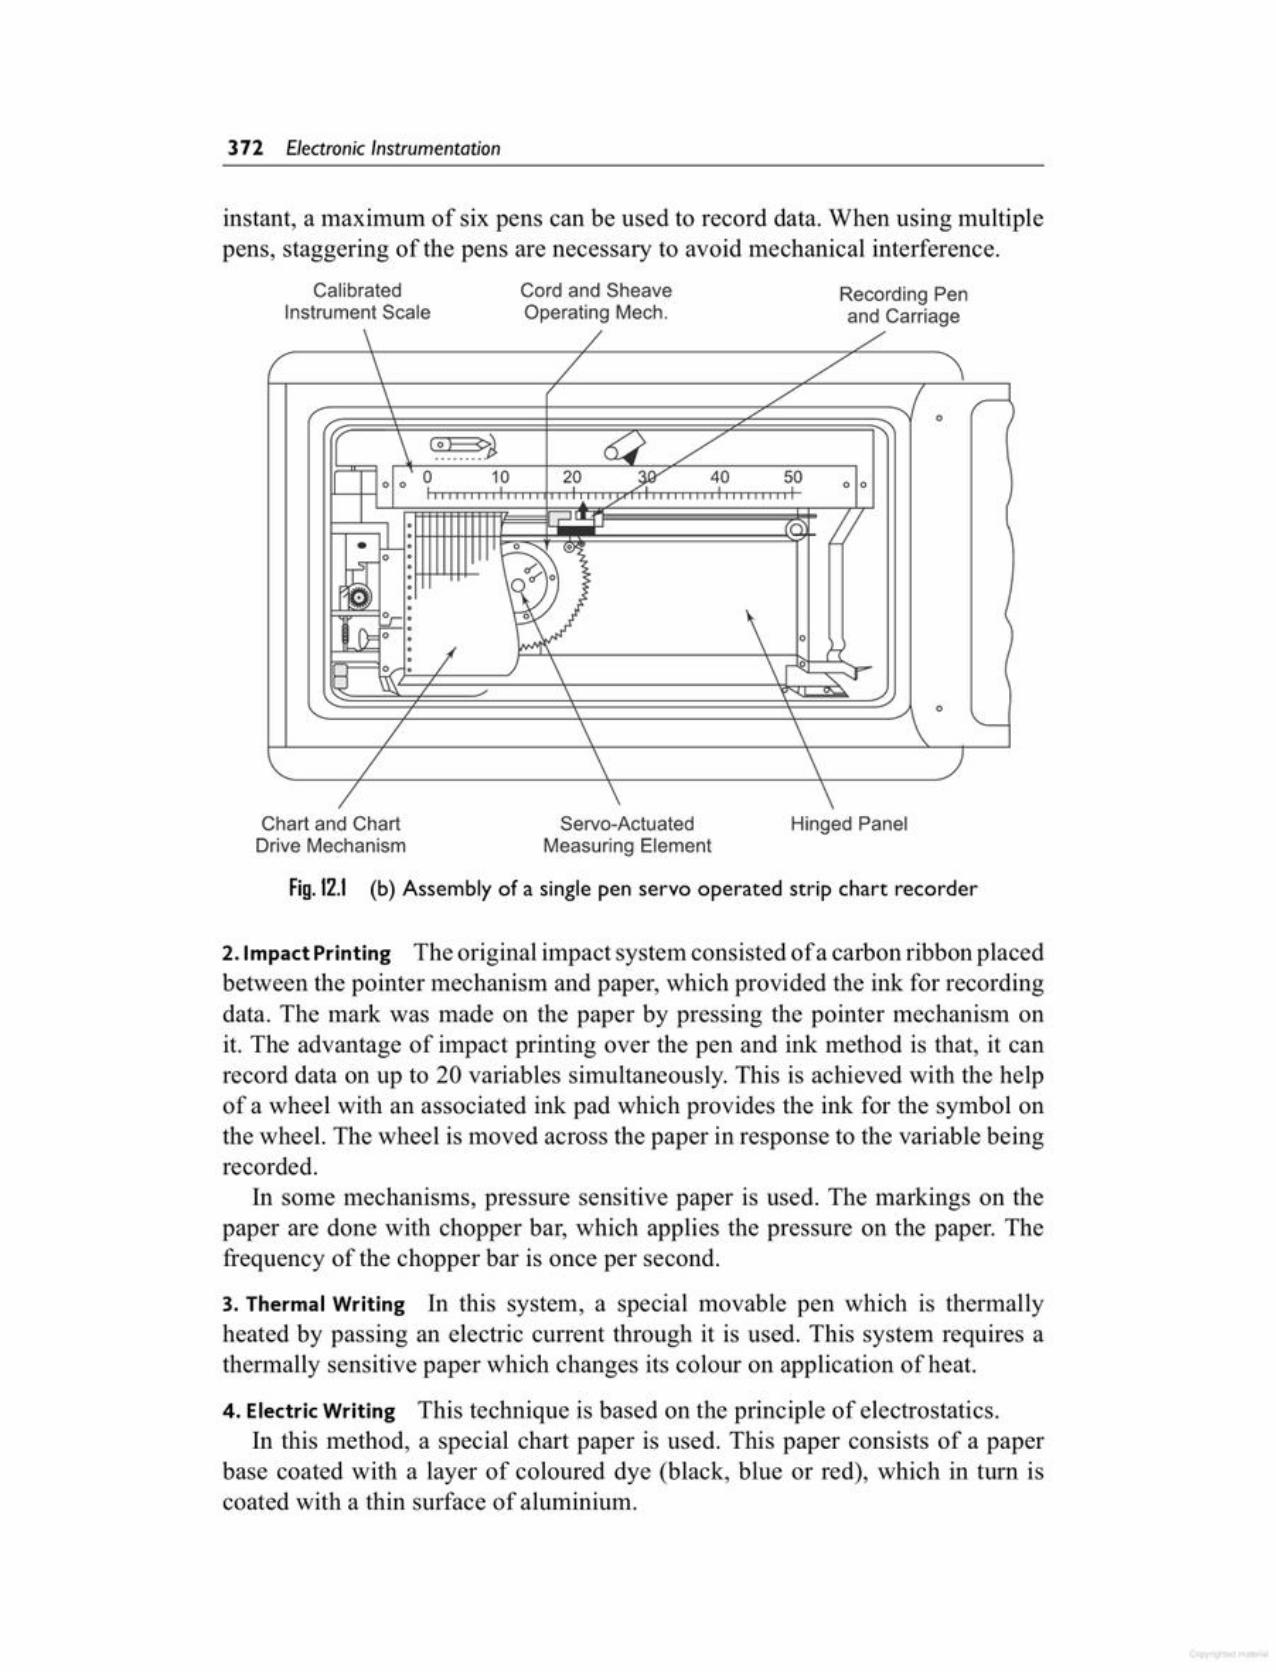
2. Impact Printing The original impact system consisted of a carbon ribbon placedbetween the pointer mechanism and paper, which provided the ink for recordingdata. The mark was made on the paper by pressing the pointer mechanism onit. The advantage of impact printing over the pen and ink method is that, it canrecord data on up to 20 variables simultaneously. This is achieved with the helpof a wheel with an associated ink pad which provides the ink for the symbol onthe wheel. The wheel is lTIovedacross the paper in response to the variable beingrecorded.
In some mechanisms, pressure sensitive paper is used. The markings on thepaper are done with chopper bar, which applies the pressure on the paper. Thefrequency of the chopper bar is once per second.
3. Thermal Writing In this system, a special movable pen which is thermallyheated by passing an electric current through it is used. This system requires athermally sensitive paper which changes its colour on application of heat.
4. Electric Writing This technique is based on the principle of electrostatics.In this method, a special chart paper is used. This paper consists of a paper
base coated with a layer of coloured dye (black, blue or red), which in tum iscoated with a thin surface of aluminium.
Fig.12.1 (b) Assembly of a single pen servo operated strip chart recorder
Hinged PanelServo-ActuatedMeasuring Element
Chart and ChartDrive Mechanism
\ / .// \ / -: '\
\ -: I0
I( \ (.~~~ cQ -:000 10 20 »: 40 ~o 0 0
;.. :/
• _L: "'---i (( /;~®'2..sr 0 : g'\
i~ o "")0 ~
W \ (£_'_CE 0 : 0
\1Y: I,_,
r \ \~~~ ./ \
0
/ \ \ \ '---
/ \ \ )/ \ \
Recording Penand Carriage
Cord and SheaveOperating Mech.
CalibratedInstrument Scale
instant, a maximum of six pens can be used to record data. When using multiplepens, staggering of the pens are necessary to avoid mechanical interference.
372 Electronic Instrumentation
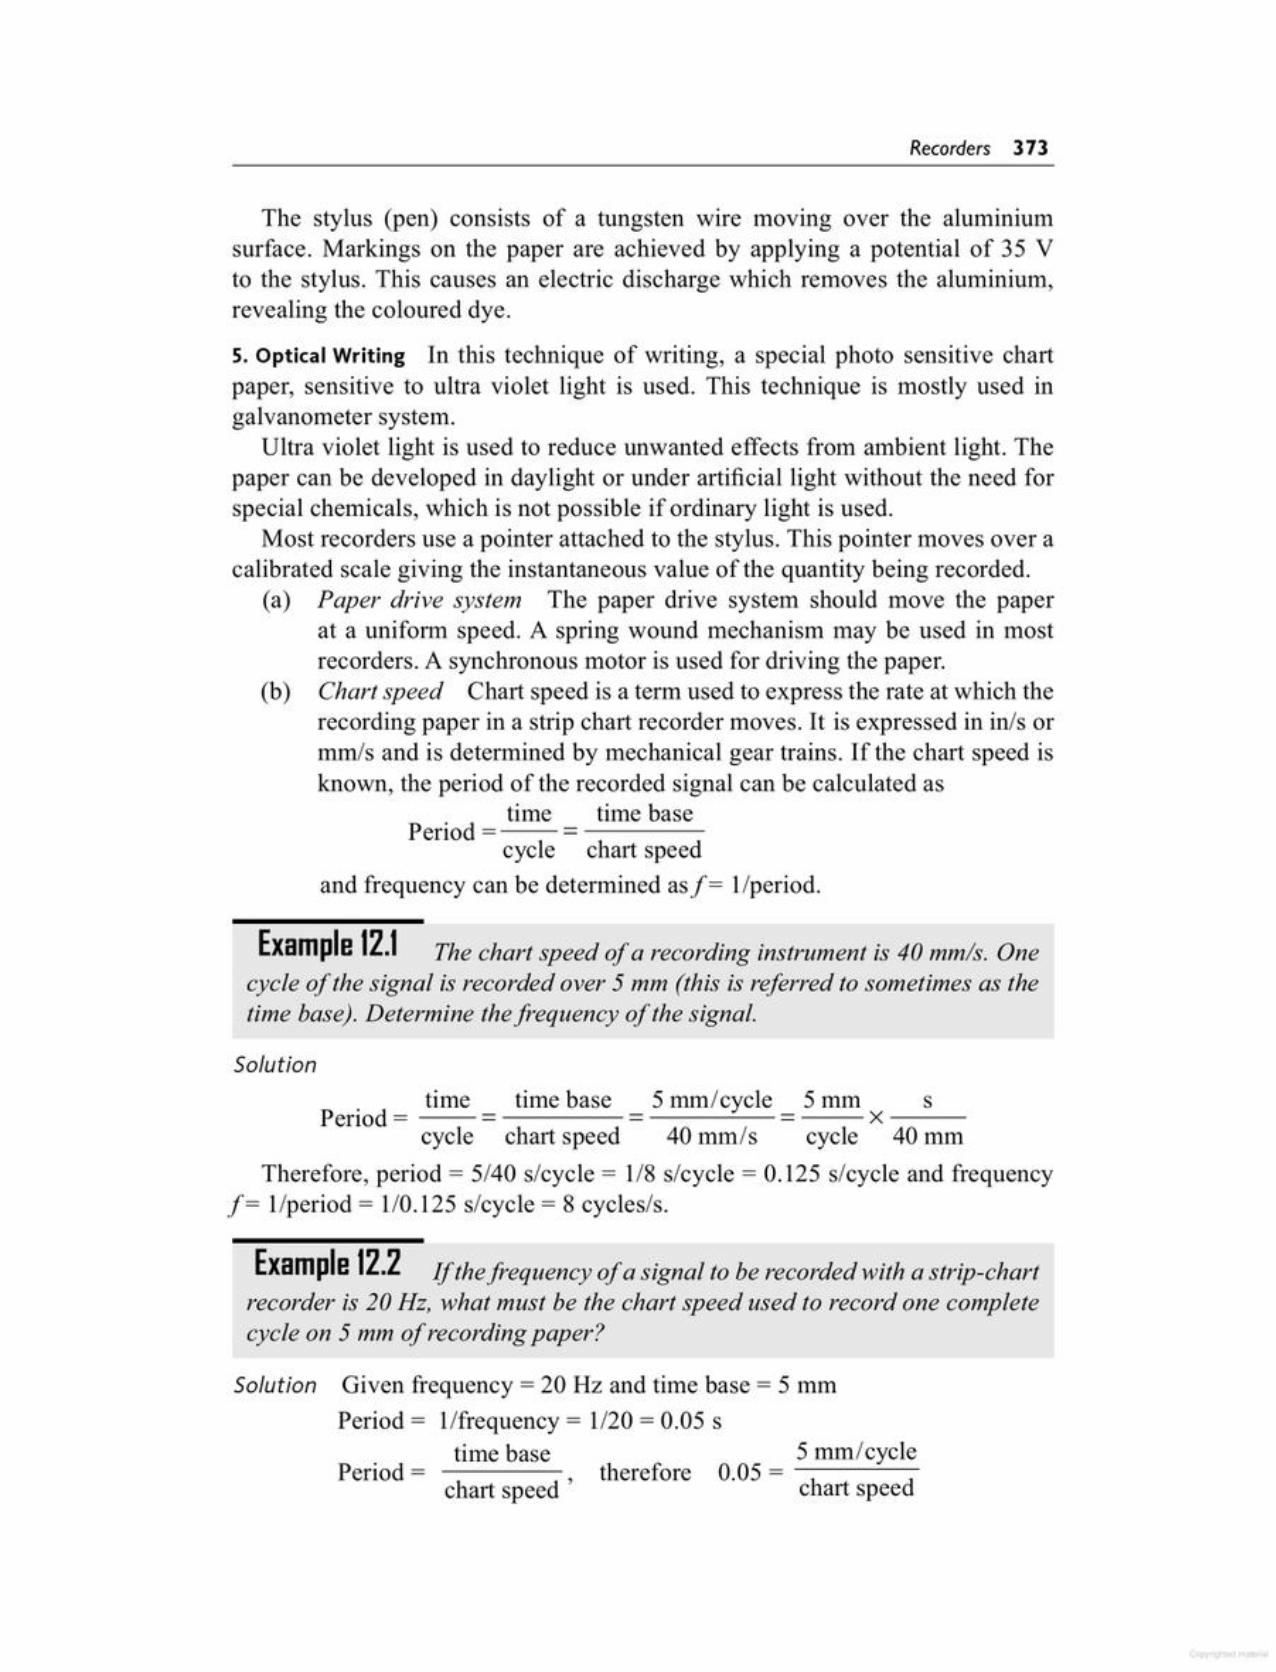
5 mm/cycletherefore 0.05 = -----=-
chart speedtime base
Period =chart speed '
Solution Given frequency = 20 Hz and time base = 5 mmPeriod = l/frequency = 1/20 = 0.05 s
Example 12.2 If thefrequency of a signal to be recorded with a strip-chartrecorder is 20 Hz, what must be the chart speed used to record one completecycle on 5 mm of recording paper?
Therefore, period = 5/40 s/cycle = 1/8 s/cycle = 0.125 s/cycle and frequency.f= l/period = 1/0.125 s/cycle = 8 cycles/so
5 mm/cycle _ 5 mm s--x---40lnln/s cycle 40 mm
time time basePeriod = ------
cycle chart speed
Solution
Example 12.1 The chart speed of a recording instrument is 40 mmls. Onecycle of the signal is recorded over 5 mm (this is referred to sometimes as thetime base). Determine the frequency of the signal.
The stylus (pen) consists of a tungsten wire moving over the aluminiumsurface. Markings on the paper are achieved by applying a potential of 35 Vto the stylus. This causes an electric discharge which removes the aluminium,revealing the coloured dye.
5. Optical Writing In this technique of writing, a special photo sensitive chartpaper, sensitive to ultra violet light is used. This technique is mostly used ingalvanometer system.
Ultra violet light is used to reduce unwanted effects from ambient light. Thepaper can be developed in daylight or under artificial light without the need forspecial chemicals, which is not possible if ordinary light is used.
Most recorders use a pointer attached to the stylus. This pointer moves over acalibrated scale giving the instantaneous value of the quantity being recorded.
(a) Paper drive system The paper drive system should move the paperat a uniform speed. A spring wound mechanism may be used in mostrecorders. A synchronous motor is used for driving the paper.
(b) Chart speed Chart speed is a term used to express the rate at which therecording paper in a strip chart recorder moves. It is expressed in in/s ormm/s and is determined by mechanical gear trains. If the chart speed isknown, the period of the recorded signal can be calculated as
time time basePeriod = 1-
eye e chart speedand frequency can be determined asf= l/period.
Recorders 373

The D' Arsonval movement used in moving coil indicating instruments can alsoprovide the movement in a galvanometer recorder.
The D' Arsonval movement consists of a moving coil placed in a strongmagnetic field, as shown in Fig. 12.2(a).
In a galvanometer type recorder, the pointer of the D' Arsonval movement isfitted with a pen-ink (stylus) mechanism.
The pointer deflects when current flows through the moving coil. Thedeflection of the pointer is directly proportional to the magnitude of the currentflowing through the coil.
As the signal current flows through the coil, the magnetic field of the coilvaries in intensity in accordance with the signal. The reaction of this field with thefield of the permanent magnet causes the coil to change its angular position. Asthe position of the coil follows the variation of the signal current being recorded,the pen is accordingly deflected across the paper chart.
The paper is pulled from a supply roll by a motor driven transport mechanism.Thus, as the paper moves past the pen and as the pen is deflected, the signalwaveform is traced on the paper.
The recording pen is connected to an ink reservoir through a narrow bore tube.Gravity and capillary action establish a flow of ink from the reservoir through thetubing and into the hollow of the pen.
Galvanometer type recorders are well suited for low frequency ac inputsobtained from quantities varying slowly at frequencies of upto 100 cis, or inspecial cases up to 1000 cis.
Because of the compact nature of the galvanometer unit (or pen motor) thistype of recorder is particularly suitable for multiple channel operation. Hence itfinds extensive use in the simultaneous recording of a large number of varyingtransducers outputs.
This recorder uses a curvilinear system of tracing. The time lines on thechart must be arcs of radius R (where R is the length of the pointer), and thegalvanometer shaft must be located exactly at the center of curvature of a timeline arc. Improper positioning of the galvanometer or misalignment of the chartpaper in the recorder can give a distorted response, i.e. having a negative risetime or a long rise time. One method of avoiding the distorted appearance of
12.3GALVANOMETER TYPE RECORDER
Chart speed =5mm 1--x-----cycle 0.05 slcycle
5 x 100--- mmls = 100 mmls5
There are basically two types of strip chart recorders, the (i) galvanometertype, and the (ii) null type (potentiometric).
374 Electronic Instrumentation

recordings in curvilinear coordinates is to produce the recording in rectangularcoordinates. In this design, the chart paper is pulled over a sharp edge that definesthe locus of the point of contact between the paper and the recording stylus. Thestylus is rigidly attached to the galvanometer coil and wipes over the sharp edgeas the coil rotates.
In one of the recorders, the paper used is usually heat sensitive, and thestylus is equipped with a heated tip long enough to guarantee a hot point ofcontact with the paper, regardless of the stylus position on the chart. Alternativelythe paper can be electrically sensitive, in which case the stylus tip would serve tocarry current into the paper at the point of contact.
The recorders can work on ranges ranging from a few mAimV to several mAlmV. These moving galvanometer type recorders are comparatively inexpensiveinstruments, having a narrow bandwidth of 0 - 10Hz. They have a sensitivity ofabout 0.4 V/mm, or from a chart of 100 mm width a full scale deflection of 40mV is obtained.
In most instruments, the speed of the paper through the recorder isdetermined by the gear ratio of the driving mechanism. If it is desired to changethe speed of the paper, one or more gears must be changed.
Paper speed is an important consideration for several reasons.1. If the paper moves too slowly, the recorded signal variations are bunched
up and difficult to read.2. If the paper moves too fast, the recorded waveform will be so spread
out that greater lengths of paper will be required to record the variationsof the signal. It also makes the task of reading and interpreting thewaveforms more difficult.
3. Also, the operator can determine the frequency components of therecorded waveform, if he knows how fast the paper has moved pastthe pen position. The paper is usually printed with coordinates, such asgraph paper.
Some recorders contain a timing mechanism that prints a series of small dotsalong the edge of the paper chart, as the paper moves through the recorder. Thistime marker produces one mark per second.
These types of recorders are mostly used as optical recorders, and contain alight source provided by either an ultra violet or tungsten lamp.
A small mirror is connected to the galvanometer movement and the light beamis focussed on this mirror, as shown in Fig. 12.2(b).
The beam reflected from the mirror is focussed into a spot on a lightsensitive paper.
As the current passes through the coil, the mirror deflects. The movement ofthe light beam is affected by the deflection of the small mirror, and the spot on thepaper also varies for the same reason, thus tracing the waveform on the paper.
Recorders 375
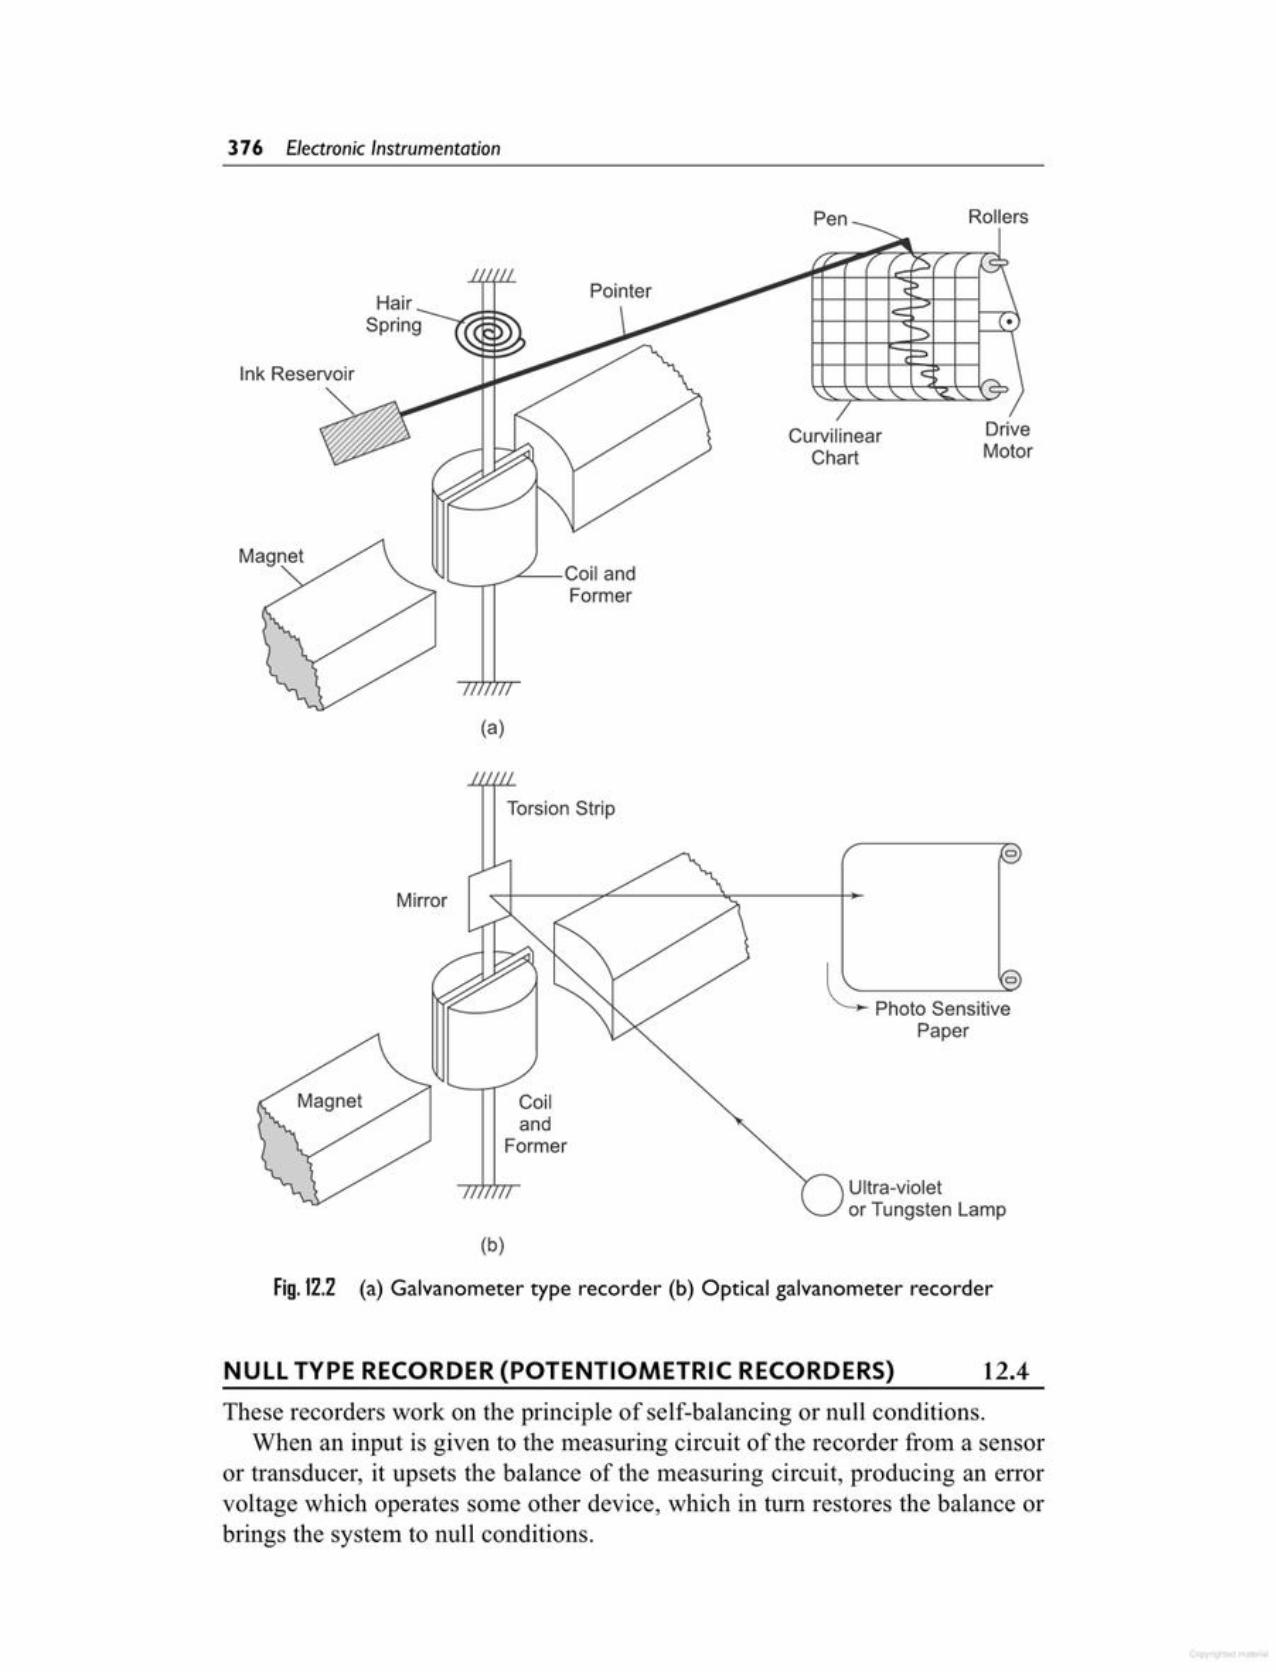
NULL TYPE RECORDER (POTENTIOMETRIC RECORDERS) 12.4These recorders work on the principle of self-balancing or null conditions.
When an input is given to the measuring circuit of the recorder from a sensoror transducer, it upsets the balance of the measuring circuit, producing an errorvoltage which operates some other device, which in tum restores the balance orbrings the system to null conditions.
Fig. 12.2 (a) Galvanometer type recorder (b) Optical galvanometer recorder
(b)
Ultra-violetor Tungsten Lamp
Coiland
Former
Magnet
~ Photo sensitiv:Paper
o
Mirror
Torsion Strip
(a)
l__.........,-~-Coil andFormer
Magnet
CurvilinearChart
Pointer
Ink Reservoir
376 Electronic Instrumentation
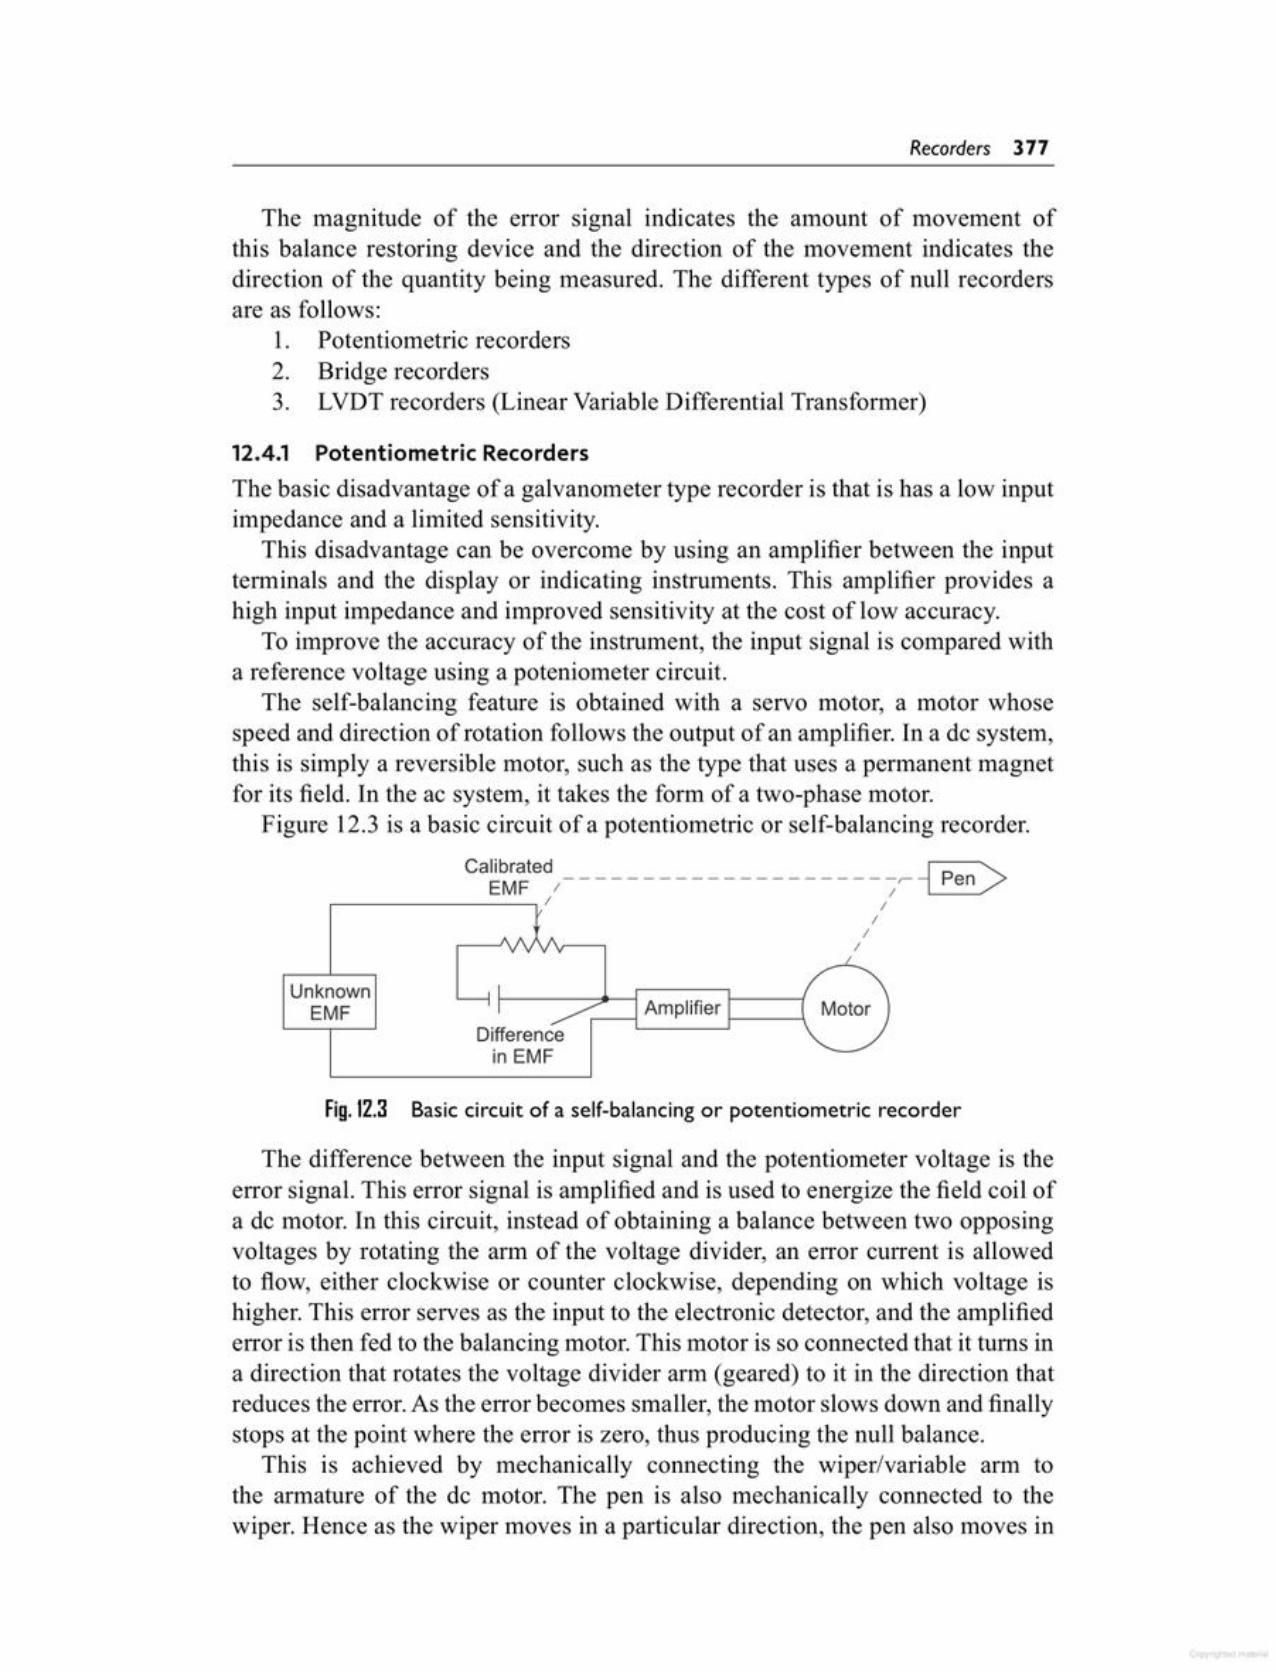
The difference between the input signal and the potentiometer voltage is theerror signal. This error signal is amplified and is used to energize the field coil ofa de motor. In this circuit, instead of obtaining a balance between two opposingvoltages by rotating the arm of the voltage divider, an error current is allowedto flow, either clockwise or counter clockwise, depending on which voltage ishigher. This error serves as the input to the electronic detector, and the amplifiederror is then fed to the balancing motor. This motor is so connected that it turns ina direction that rotates the voltage divider arm (geared) to it in the direction thatreduces the error. As the error becomes smaller, the motor slows down and finallystops at the point where the error is zero, thus producing the null balance.
This is achieved by mechanically connecting the wiper/variable arm tothe armature of the de motor. The pen is also mechanically connected to thewiper. Hence as the wiper moves in a particular direction, the pen also moves in
Fig. 12.3 Basic circuit of a self-balancing or potentiometric recorder
Differencein EMF
AmplifierUnknownEMF
12.4.1 Potentiometric RecordersThe basic disadvantage of a galvanometer type recorder is that is has a low inputimpedance and a limited sensitivity.
This disadvantage can be overcome by using an amplifier between the inputterminals and the display or indicating instruments. This amplifier provides ahigh input impedance and improved sensitivity at the cost of low accuracy.
To improve the accuracy of the instrument, the input signal is compared witha reference voltage using a poteniometer circuit.
The self-balancing feature is obtained with a servo motor, a motor whosespeed and direction of rotation follows the output of an amplifier. In a de system,this is simply a reversible motor, such as the type that uses a permanent magnetfor its field. In the ac system, it takes the form of a two-phase motor.
Figure 12.3 is a basic circuit of a potentiometric or self-balancing recorder.
ca~~~ted / -;r- ~,---------, / /
///
The magnitude of the error signal indicates the amount of movement ofthis balance restoring device and the direction of the movement indicates thedirection of the quantity being measured. The different types of null recordersare as follows:
1. Potentiometric recorders2. Bridge recorders3. LVDT recorders (Linear Variable Differential Transformer)
Recorders 377
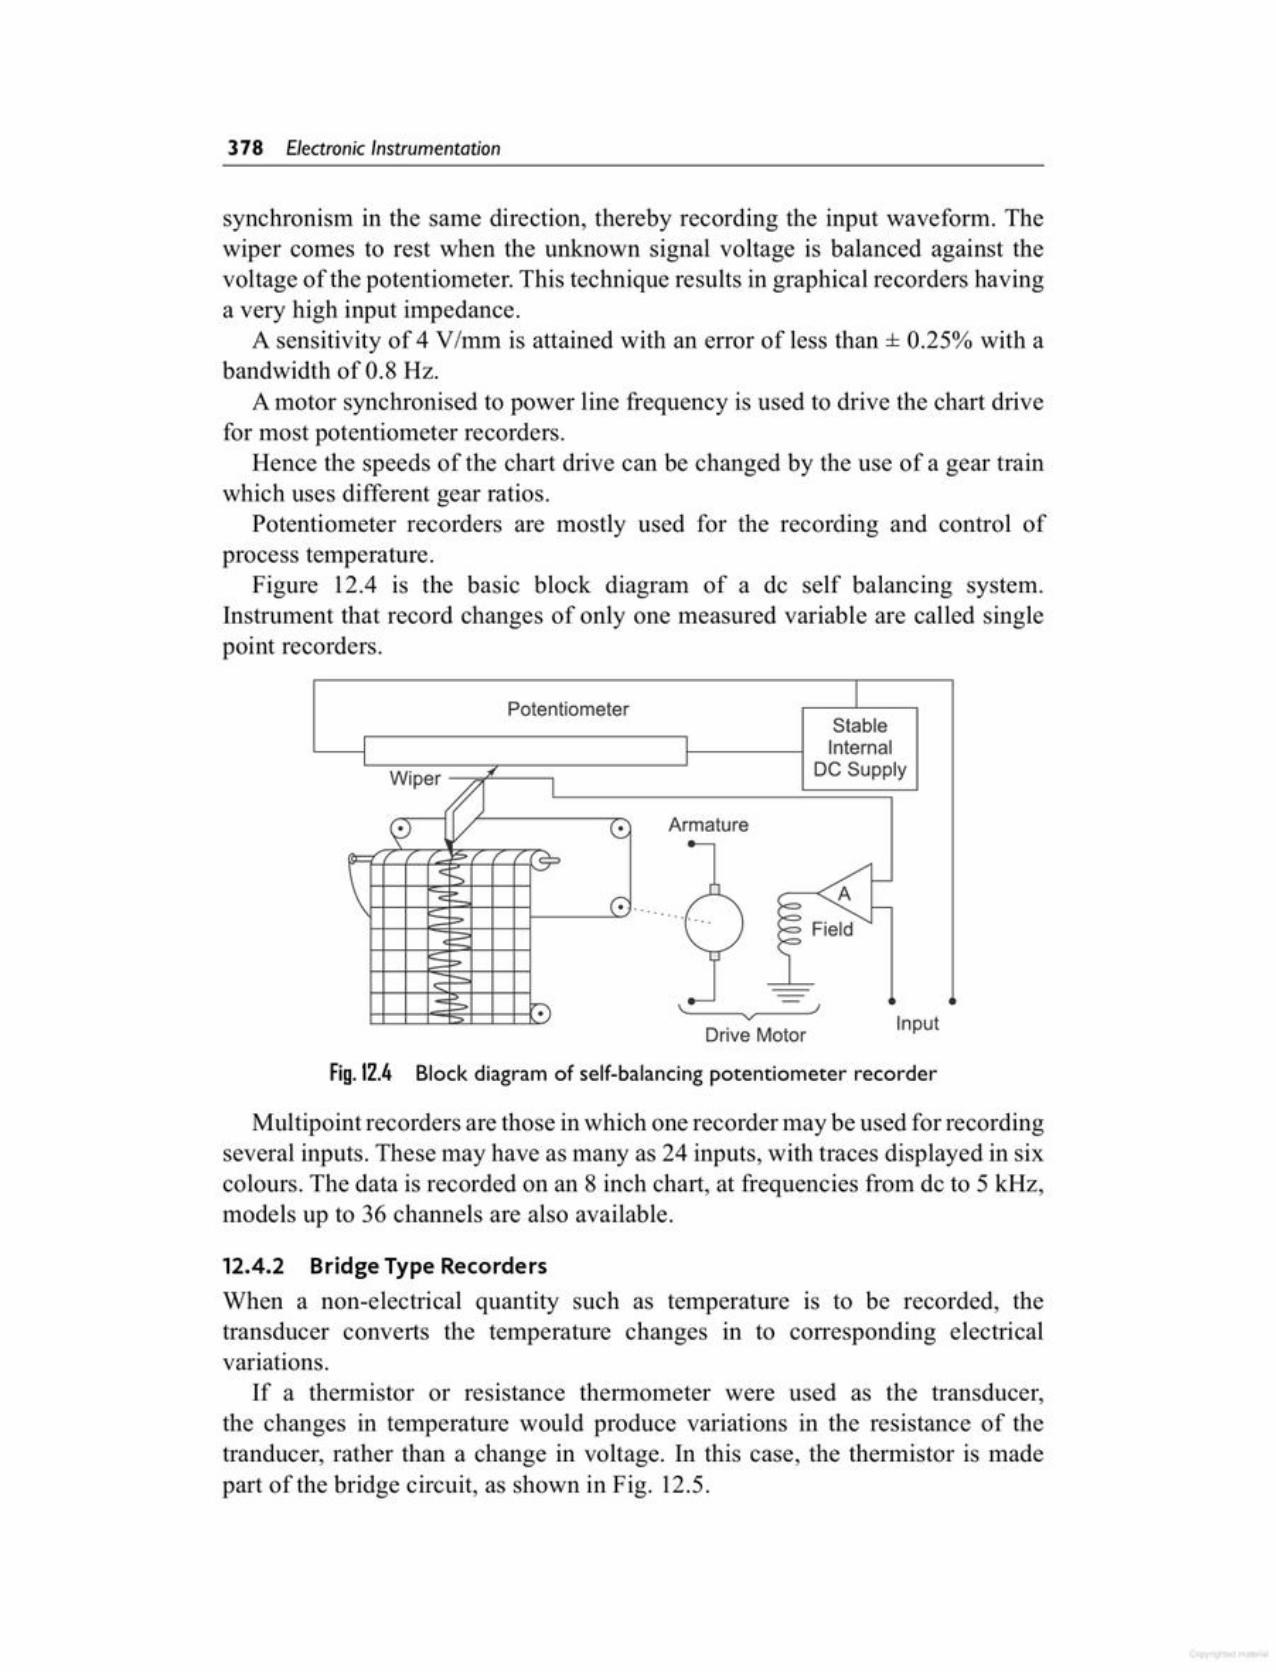
12.4.2 Bridge Type RecordersWhen a non-electrical quantity such as temperature is to be recorded, thetransducer converts the temperature changes in to corresponding electricalvariations.
If a thermistor or resistance thermometer were used as the transducer,the changes in temperature would produce variations in the resistance of thetranducer, rather than a change in voltage. In this case, the thermistor is madepart of the bridge circuit, as shown in Fig. 12.5.
Multipoint recorders are those in which one recorder may be used for recordingseveral inputs. These may have as many as 24 inputs, with traces displayed in sixcolours. The data is recorded on an 8 inch chart, at frequencies from dc to 5 kHz,models up to 36 channels are also available.
Fig. 12.4 Block diagram of self-balancing potentiometer recorder
pDrive Motor
Potentiometer IStable
I I InternalI I DC Supply=>1f
I
~ V ~ Armature-= ~
~f-\ <: -, ~
\ c ::" G: '" K=> Sf-f- :::> .........~ Field.:»
~f- ::>--I-S ,- -[.) - .J
In ut
synchronism in the same direction, thereby recording the input waveform, Thewiper comes to rest when the unknown signal voltage is balanced against thevoltage of the potentiometer. This technique results in graphical recorders havinga very high input impedance.
A sensitivity of 4 V/mm is attained with an error of less than ± 0.25% with abandwidth of 0.8 Hz.
A motor synchronised to power line frequency is used to drive the chart drivefor most potentiometer recorders.
Hence the speeds of the chart drive can be changed by the use of a gear trainwhich uses different gear ratios.
Potentiometer recorders are mostly used for the recording and control ofprocess temperature.
Figure 12.4 is the basic block diagram of a de self balancing system.Instrument that record changes of only one measured variable are called singlepoint recorders.
378 Electronic Instrumentation
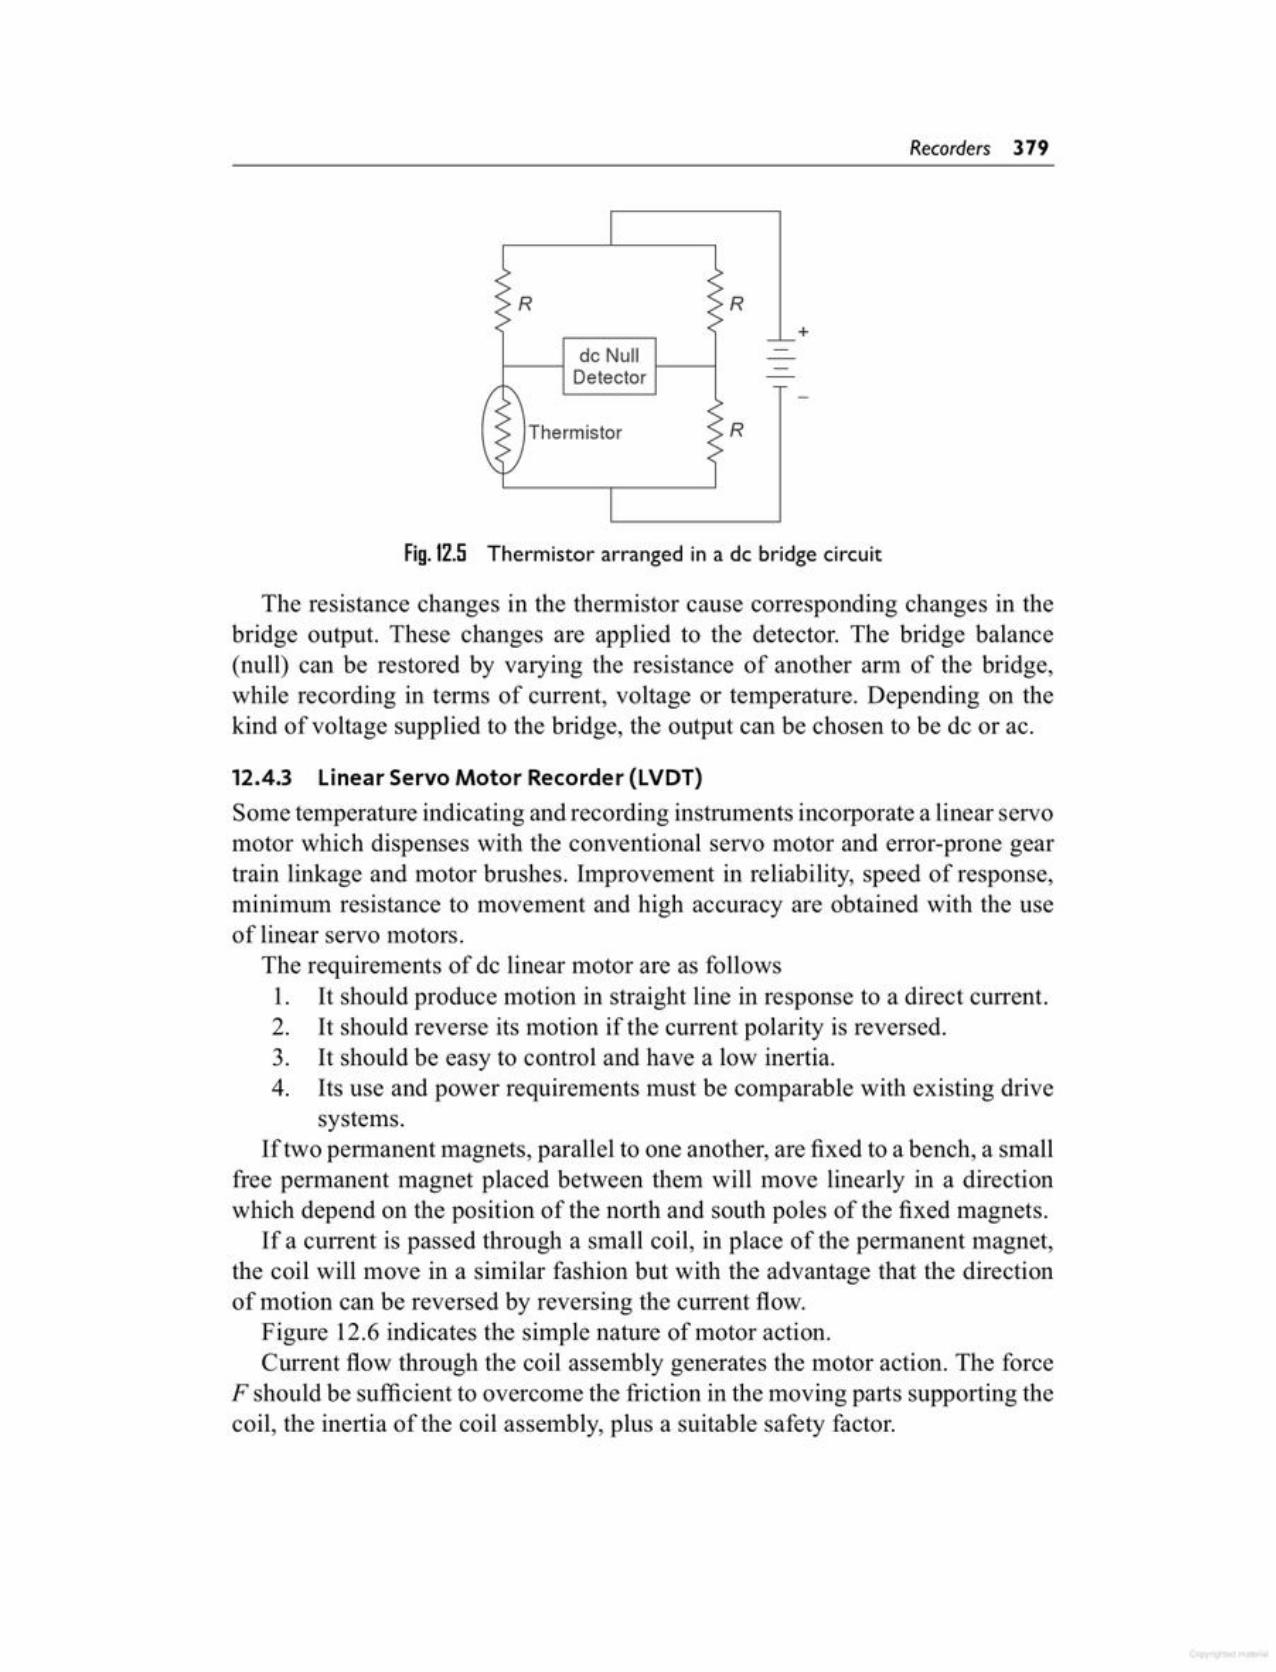
The resistance changes in the thermistor cause corresponding changes in thebridge output. These changes are applied to the detector. The bridge balance(null) can be restored by varying the resistance of another arm of the bridge,while recording in terms of current, voltage or temperature. Depending on thekind of voltage supplied to the bridge, the output can be chosen to be de or ac.
12.4.3 Linear Servo Motor Recorder (LVOT)Some temperature indicating and recording instruments incorporate a linear servomotor which dispenses with the conventional servo motor and error-prone geartrain linkage and motor brushes. Improvement in reliability, speed of response,minimum resistance to movement and high accuracy are obtained with the useof linear servo motors.
The requirements of de linear motor are as follows1. It should produce motion in straight line in response to a direct current.2. It should reverse its motion if the current polarity is reversed.3. It should be easy to control and have a low inertia.4. Its use and power requirements must be comparable with existing drive
systems.If two permanent magnets, parallel to one another, are fixed to a bench, a small
free permanent magnet placed between them will move linearly in a directionwhich depend on the position of the north and south poles of the fixed magnets.
If a current is passed through a small coil, in place of the permanent magnet,the coil will move in a similar fashion but with the advantage that the directionof motion can be reversed by reversing the current flow.
Figure 12.6 indicates the simple nature of motor action.Current flow through the coil assembly generates the motor action. The force
F should be sufficient to overcome the friction in the moving parts supporting thecoil, the inertia of the coil assembly, plus a suitable safety factor.
Fig.12.5 Thermistor arranged in a dc bridge circuit
R
+R
Thermistor
dc NullDetector
Recorders 379

Fig.12.B LVDT (Basic principle)
The coil in the linear motor is supported by two small pulleys at the rear andthe front with a spring affixed to the coil and resting on a slide wire. The pulleysare adjusted to maintain a clearance air gap around the rod. The scale pointeris part of the coil holder. This arrangement provides a direct drive for the scalepointer and slide wire contacts, enabling motion in straight line, which
(i) permits the use of a straight former for the slide wire, and(ii) enables a flat scale to be used.Ferrodynamic (LVDT) recorders are versatile instruments used for measuring
and recording process variables such as pressure, vacuum, flow, level, and angleof rotation. These instruments work on the null balance principle and are usedin conjunction with suitable primary transmitters (transducers), as differenttransformers or induction transducers. The accuracy of these instruments is ofthe order of ± 0.6% of full scale division. The threshold sensitivity is about ±0.25% of span and the response time is about 6 seconds.
Principle of OperationThe instrument comprises the following main units.
1. Ferrodynamic compensating converter2. Solid state amplifier3. Balancing motor4. Linkage mechanism5. Chart drive mechanism (for recorders)The ferrodynamic converter consists of a sturdy moving coil placed in an
alternating magnet field. The magnitude and phase of the induced EMF in themoving coil depends upon the angle of rotation of the coil. A bias winding is
Parallel Linesof Magnetic Flux
Current Throughthe Coil
Soft IronPlate
, ,,, - - - - - ' ,/ / - - - - - \ ,, I N - - - - - N \ ,
I I - - - -~~
I Ir r\ \ I I Leakage\ \ I I\ \ S S " " Magnetic Flux, \\ , I /
," ,//
'"
Shaped PolePieceSoft
Iron Rod
380 Electronic Instrumentation
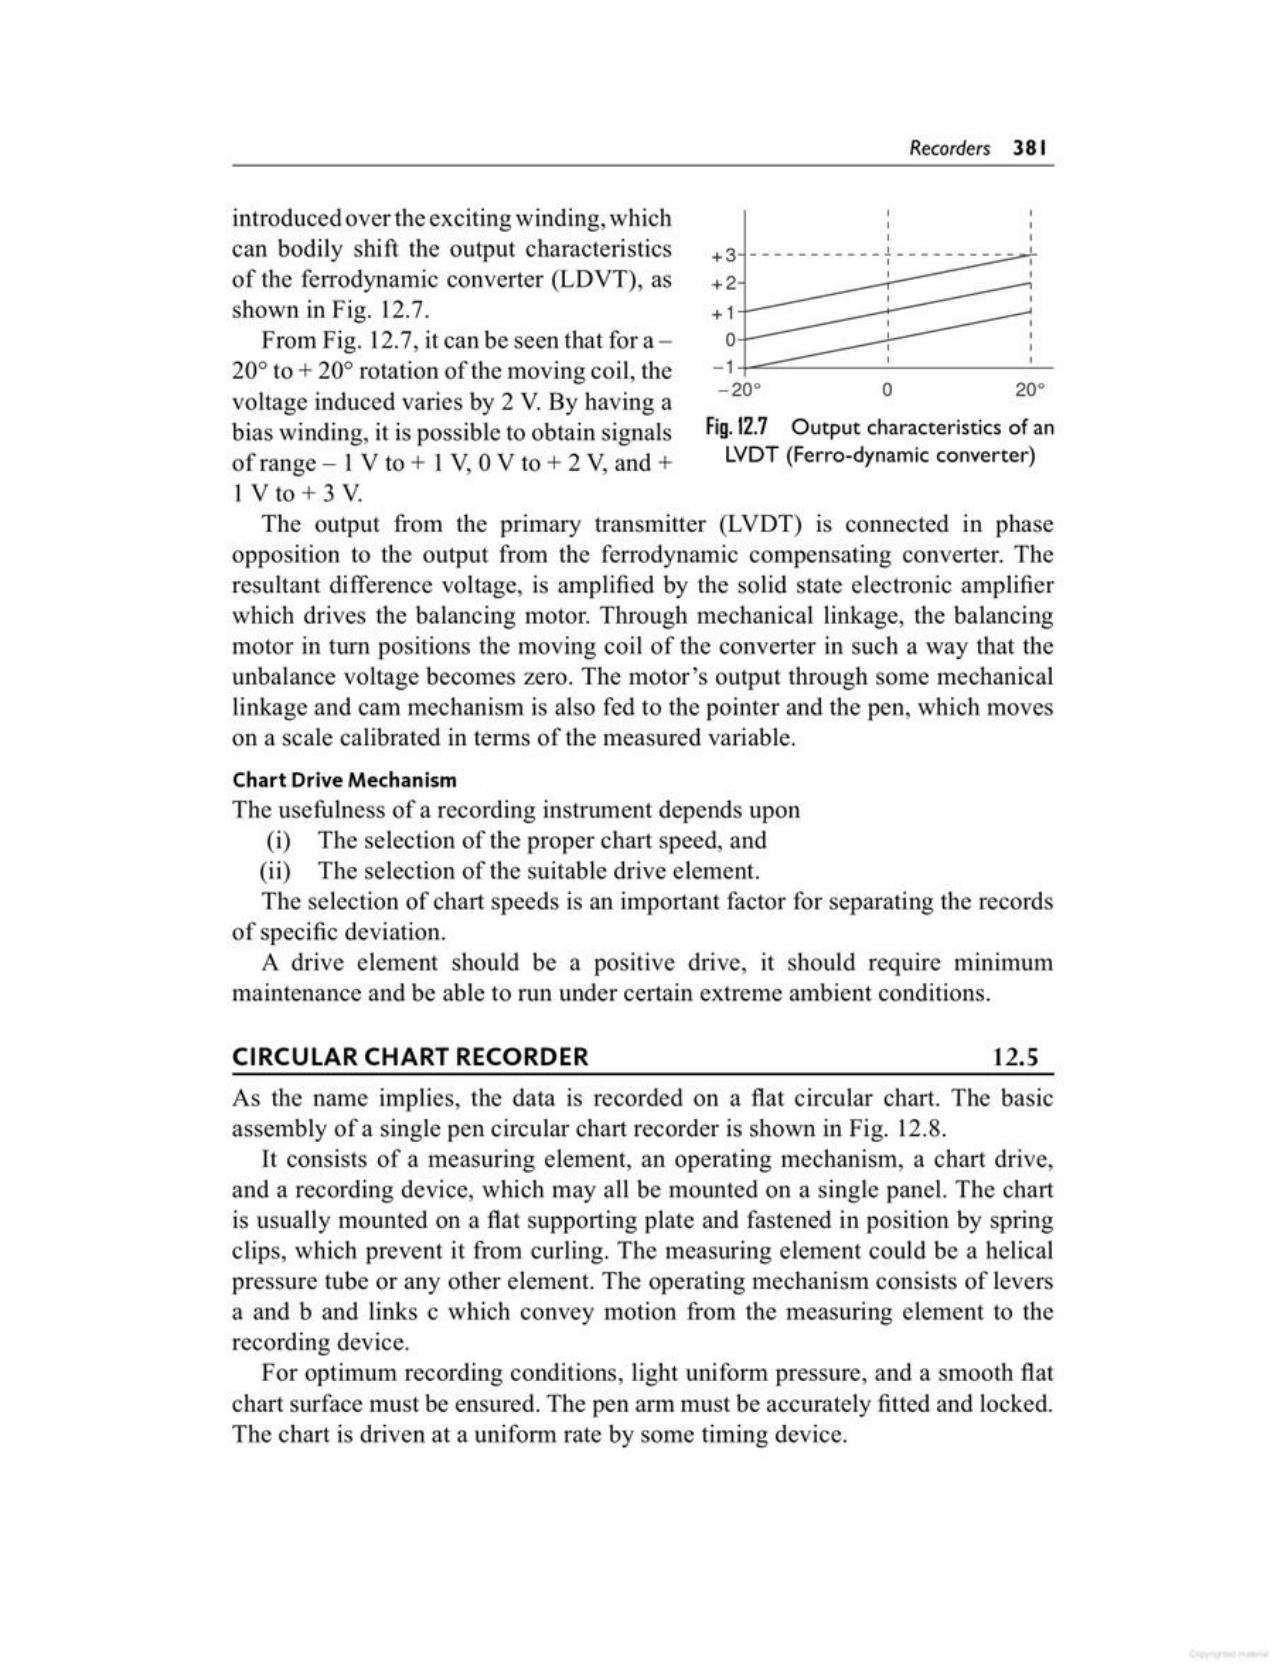
As the name implies, the data is recorded on a flat circular chart. The basicassembly of a single pen circular chart recorder is shown in Fig. 12.8.
It consists of a measuring element, an operating mechanism, a chart drive,and a recording device, which may all be mounted on a single panel. The chartis usually mounted on a flat supporting plate and fastened in position by springclips, which prevent it from curling. The measuring element could be a helicalpressure tube or any other element. The operating mechanism consists of leversa and b and links c which convey motion from the measuring element to therecording device.
For optimum recording conditions, light uniform pressure, and a smooth flatchart surface must be ensured. The pen ann must be accurately fitted and locked.The chart is driven at a uniform rate by some timing device.
12.5CIRCULAR CHART RECORDER
Chart Drive MechanismThe usefulness of a recording instrument depends upon
(i) The selection of the proper chart speed, and(ii) The selection of the suitable drive element.The selection of chart speeds is an important factor for separating the records
of specific deviation.A drive element should be a positive drive, it should require minimum
maintenance and be able to run under certain extreme ambient conditions.
Fig. 12.7 Output characteristics of anLVDT (Ferro-dynamic converter)
o-1+-~------~--------~---200
+1O_._-
+3 1 _II
+2
introduced over the exciting winding, whichcan bodily shift the output characteristicsof the ferrodynamic converter (LDVT), asshown in Fig. 12.7.
From Fig. 12.7, it can be seen that for a-20° to + 20° rotation of the moving coil, thevoltage induced varies by 2 V. By having abias winding, it is possible to obtain signalsof range - 1V to + 1V, 0 V to + 2 V, and +1 V to + 3 V.
The output from the primary transmitter (LVDT) is connected in phaseopposition to the output from the ferro dynamic compensating converter. Theresultant difference voltage, is amplified by the solid state electronic amplifierwhich drives the balancing motor. Through mechanical linkage, the balancingmotor in turn positions the moving coil of the converter in such a way that theunbalance voltage becomes zero. The motor's output through some mechanicallinkage and cam mechanism is also fed to the pointer and the pen, which moveson a scale calibrated in terms of the measured variable.
Recorders 381

In most research fields, it is often convenient to plot the instantaneous relationshipbetween two variables [Y =I(x)] , rather than to plot each variable separately asa function of time.
In such cases, the X-Y recorder is used, in which one variable is plottedagainst another variable.
In an analog X-Y recorder, the writing head is deflected in either thex-direction or the y-direction on a fixed graph chart paper. The graph paper used
12.6X-Y RECORDER
Circular Chart Drive A conventional drive assembly consists essentially of acentre chart support spindle and an drive motor. The chart is generally centeredand locked around the centre spindle. The chart speed may vary from one rotationin 15 minutes to one rotation in 30 days. A 30 em circular chart has a maximumtime-line length of approximately 100 em in a revolution, whereas a 15 em stripchart may move 25 m of chart in the same period. The various drives for circularcharts are classified as follows.
1. Mechanical (spring clock drive).2. Pneumatic (air lock drive).3. Electric (synchronous regulated de motor or motor wound spring).4. Dual powered drive (duplex), i.e. a synchronous motor and spring clock
mechanical drive.5. Externally controlled drives.
Fig.12.8 Assembly of a single pen direct-acting circular chart recorder
Base EndMeasuring Element
Pen Lifter---._c
Pen Mountingb
Chart Hub
Pen Arm
Case
Time Indicator
Chart Drive
Recording Pen"V" Type
0 0 0
Door Chart Plate
382 Electronic Instrumentation
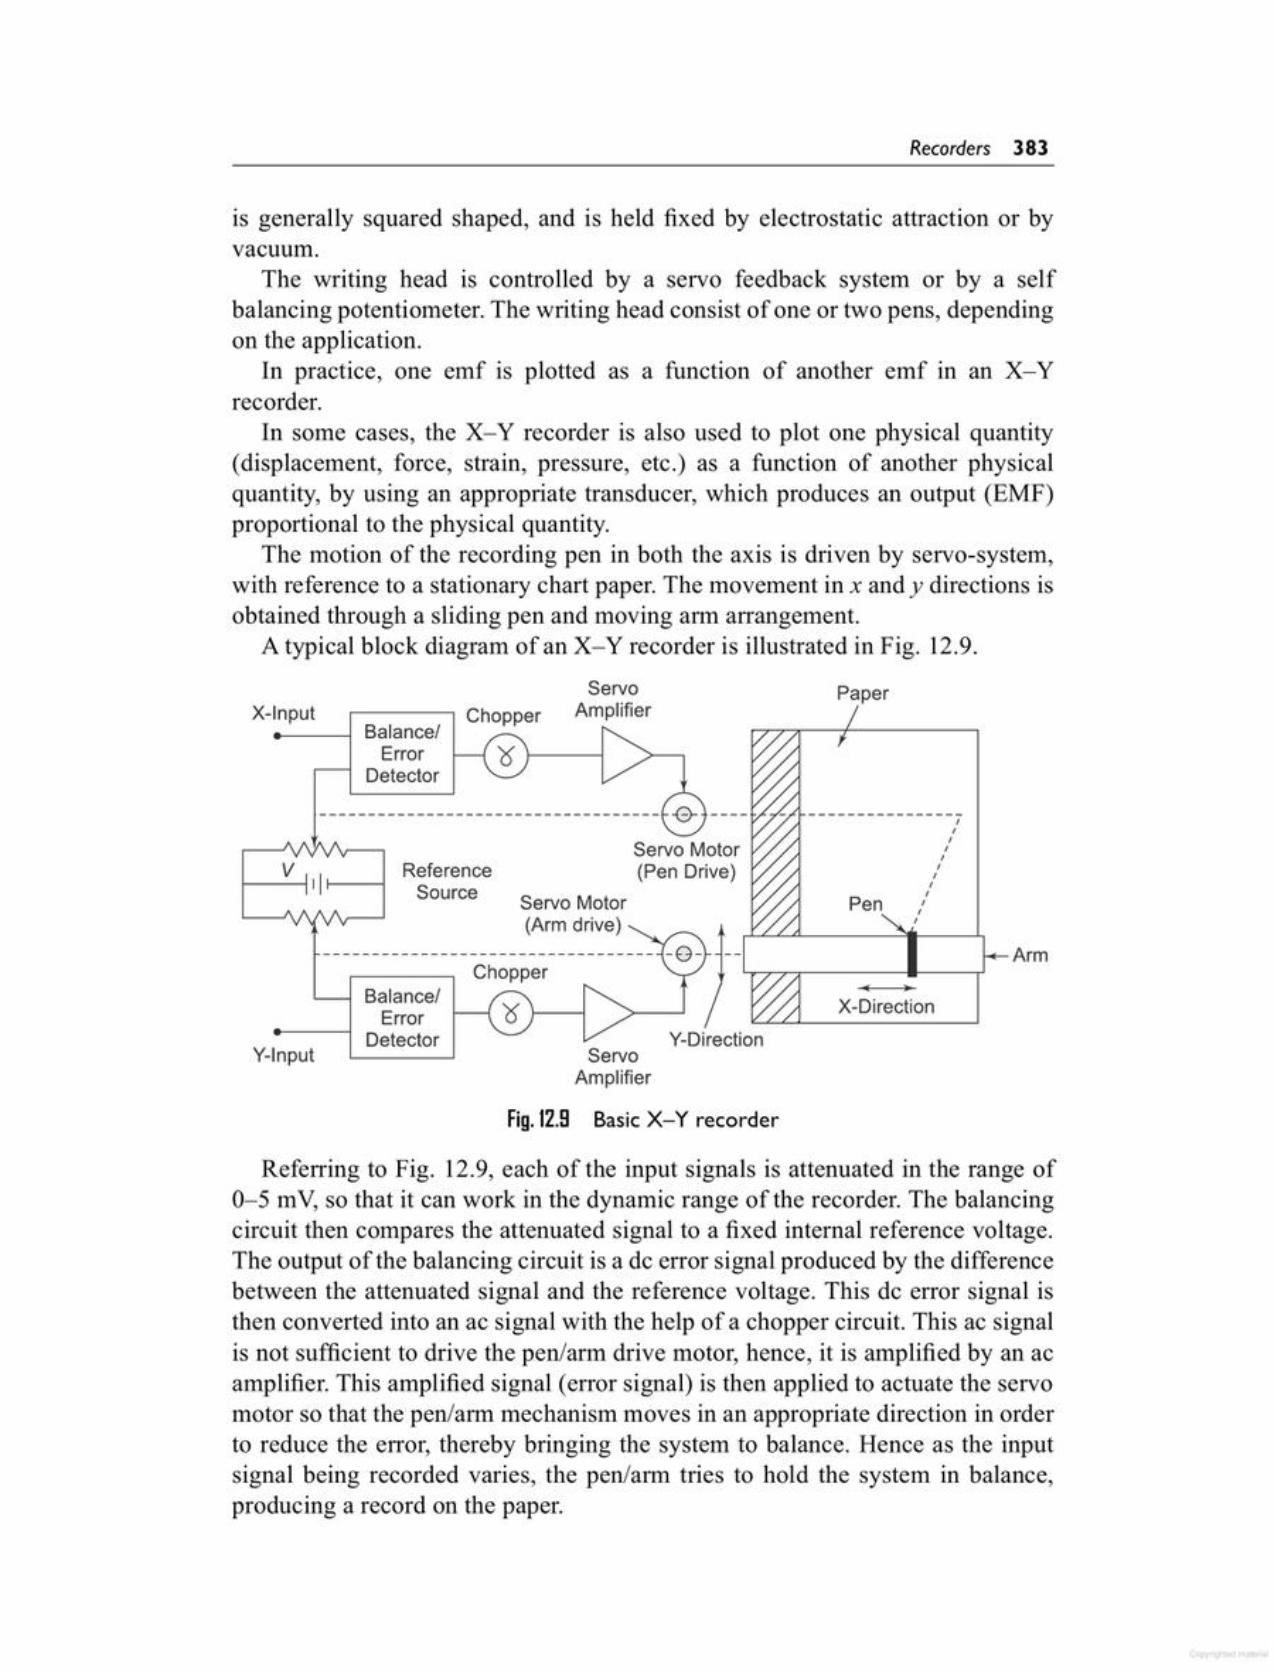
Referring to Fig. 12.9, each of the input signals is attenuated in the range of0-5 mV, so that it can work in the dynamic range of the recorder. The balancingcircuit then compares the attenuated signal to a fixed internal reference voltage.The output of the balancing circuit is a de error signal produced by the differencebetween the attenuated signal and the reference voltage. This de error signal isthen converted into an ac signal with the help of a chopper circuit. This ac signalis not sufficient to drive the pen/arm drive motor, hence, it is amplified by an acamplifier. This amplified signal (error signal) is then applied to actuate the servomotor so that the pen/arm mechanism moves in an appropriate direction in orderto reduce the error, thereby bringing the system to balance. Hence as the inputsignal being recorded varies, the pen/arm tries to hold the system in balance,producing a record on the paper.
ServoAmplifier
Fig. 12.9 BasicX-Y recorder
Y-Direction
X-DirectionBalance/Error 1---1
Detector
Chopper
PenServo Motor(Arm drive)
ReferenceSource
Y-Input
V 111---1
IIIIIIIIIIII
Servo Motor(Pen Drive)
Arm
PaperServoAmplifier,----, Chopper
Balance/Error
Detector
X-Input
is generally squared shaped, and is held fixed by electrostatic attraction or byvacuum.
The writing head is controlled by a servo feedback system or by a selfbalancing potentiometer. The writing head consist of one or two pens, dependingon the application.
In practice, one emf is plotted as a function of another emf in an X-Yrecorder.
In some cases, the X-Y recorder is also used to plot one physical quantity(displacement, force, strain, pressure, etc.) as a function of another physicalquantity, by using an appropriate transducer, which produces an output (EMF)proportional to the physical quantity.
The motion of the recording pen in both the axis is driven by servo-system,with reference to a stationary chart paper. The movement in x and y directions isobtained through a sliding pen and moving arm arrangement.
A typical block diagram of an X-Y recorder is illustrated in Fig. 12.9.
Recorders 383
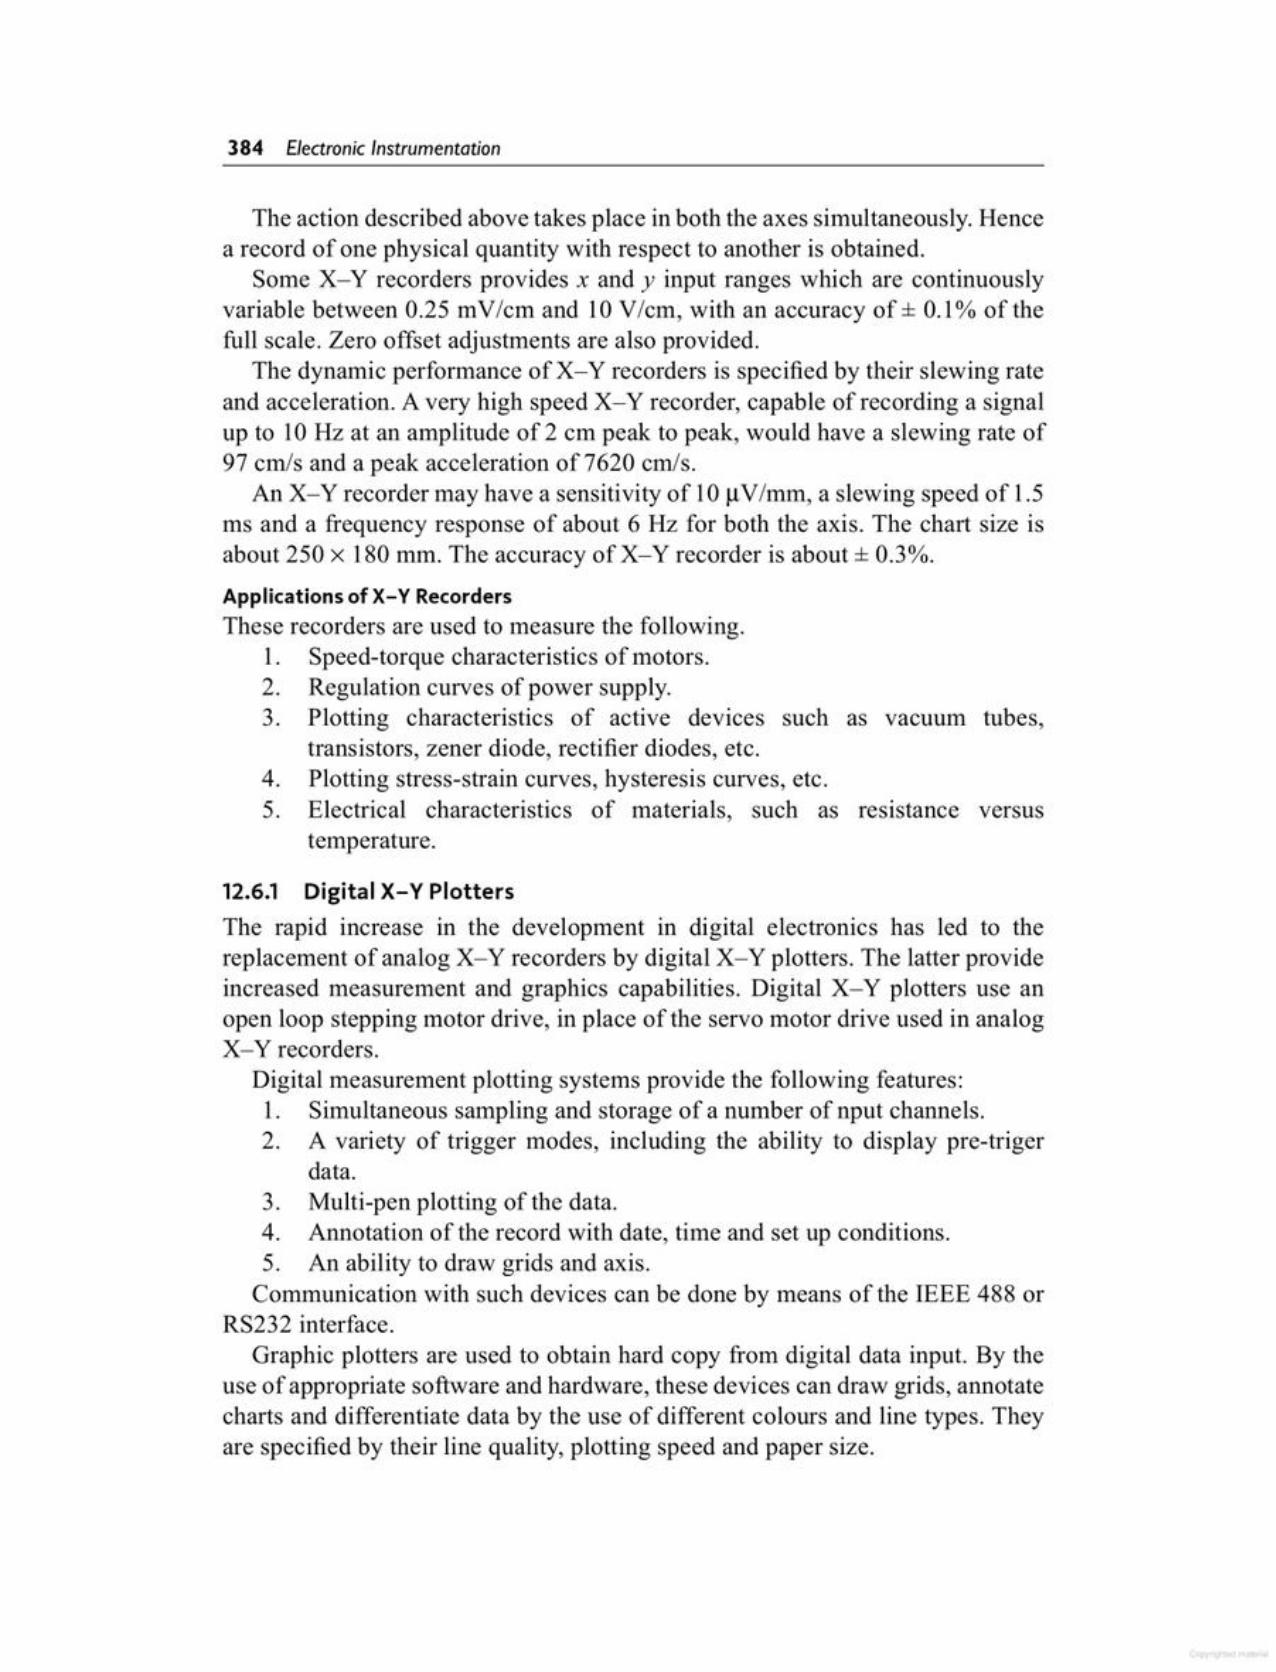
12.6.1 Digital X- Y PlottersThe rapid increase in the development in digital electronics has led to thereplacement of analog X-Y recorders by digital X-Y plotters. The latter provideincreased measurement and graphics capabilities. Digital X-Y plotters use anopen loop stepping motor drive, in place of the servo motor drive used in analogX-Y recorders.
Digital measurement plotting systems provide the following features:1. Simultaneous sampling and storage of a number of nput channels.2. A variety of trigger modes, including the ability to display pre-triger
data.3. Multi-pen plotting of the data.4. Annotation of the record with date, time and set up conditions.5. An ability to draw grids and axis.Communication with such devices can be done by means of the IEEE 488 or
RS232 interface.Graphic plotters are used to obtain hard copy from digital data input. By the
use of appropriate software and hardware, these devices can draw grids, annotatecharts and differentiate data by the use of different colours and line types. Theyare specified by their line quality, plotting speed and paper size.
The action described above takes place in both the axes simultaneously. Hencea record of one physical quantity with respect to another is obtained.
Some X-Y recorders provides x and y input ranges which are continuouslyvariable between 0.25 mV/cm and 10 V/cm, with an accuracy of ± 0.1% of thefull scale. Zero offset adjustments are also provided.
The dynamic performance of X-Y recorders is specified by their slewing rateand acceleration. A very high speed X-Y recorder, capable of recording a signalup to 10Hz at an amplitude of 2 em peak to peak, would have a slewing rate of97 cm/s and a peak acceleration of7620 crn/s.
An X-Y recorder may have a sensitivity of 10 J!Vfmm, a slewing speed of 1.5ms and a frequency response of about 6 Hz for both the axis. The chart size isabout 250 x 180 mm. The accuracy of X-Y recorder is about ± 0.3%.
Applications of X- Y RecordersThese recorders are used to measure the following.
1. Speed-torque characteristics of motors.2. Regulation curves of power supply.3. Plotting characteristics of active devices such as vacuum tubes,
transistors, zener diode, rectifier diodes, etc.4. Plotting stress-strain curves, hysteresis curves, etc.5. Electrical characteristics of materials, such as resistance versus
temperature.
384 Electronic Instrumentation
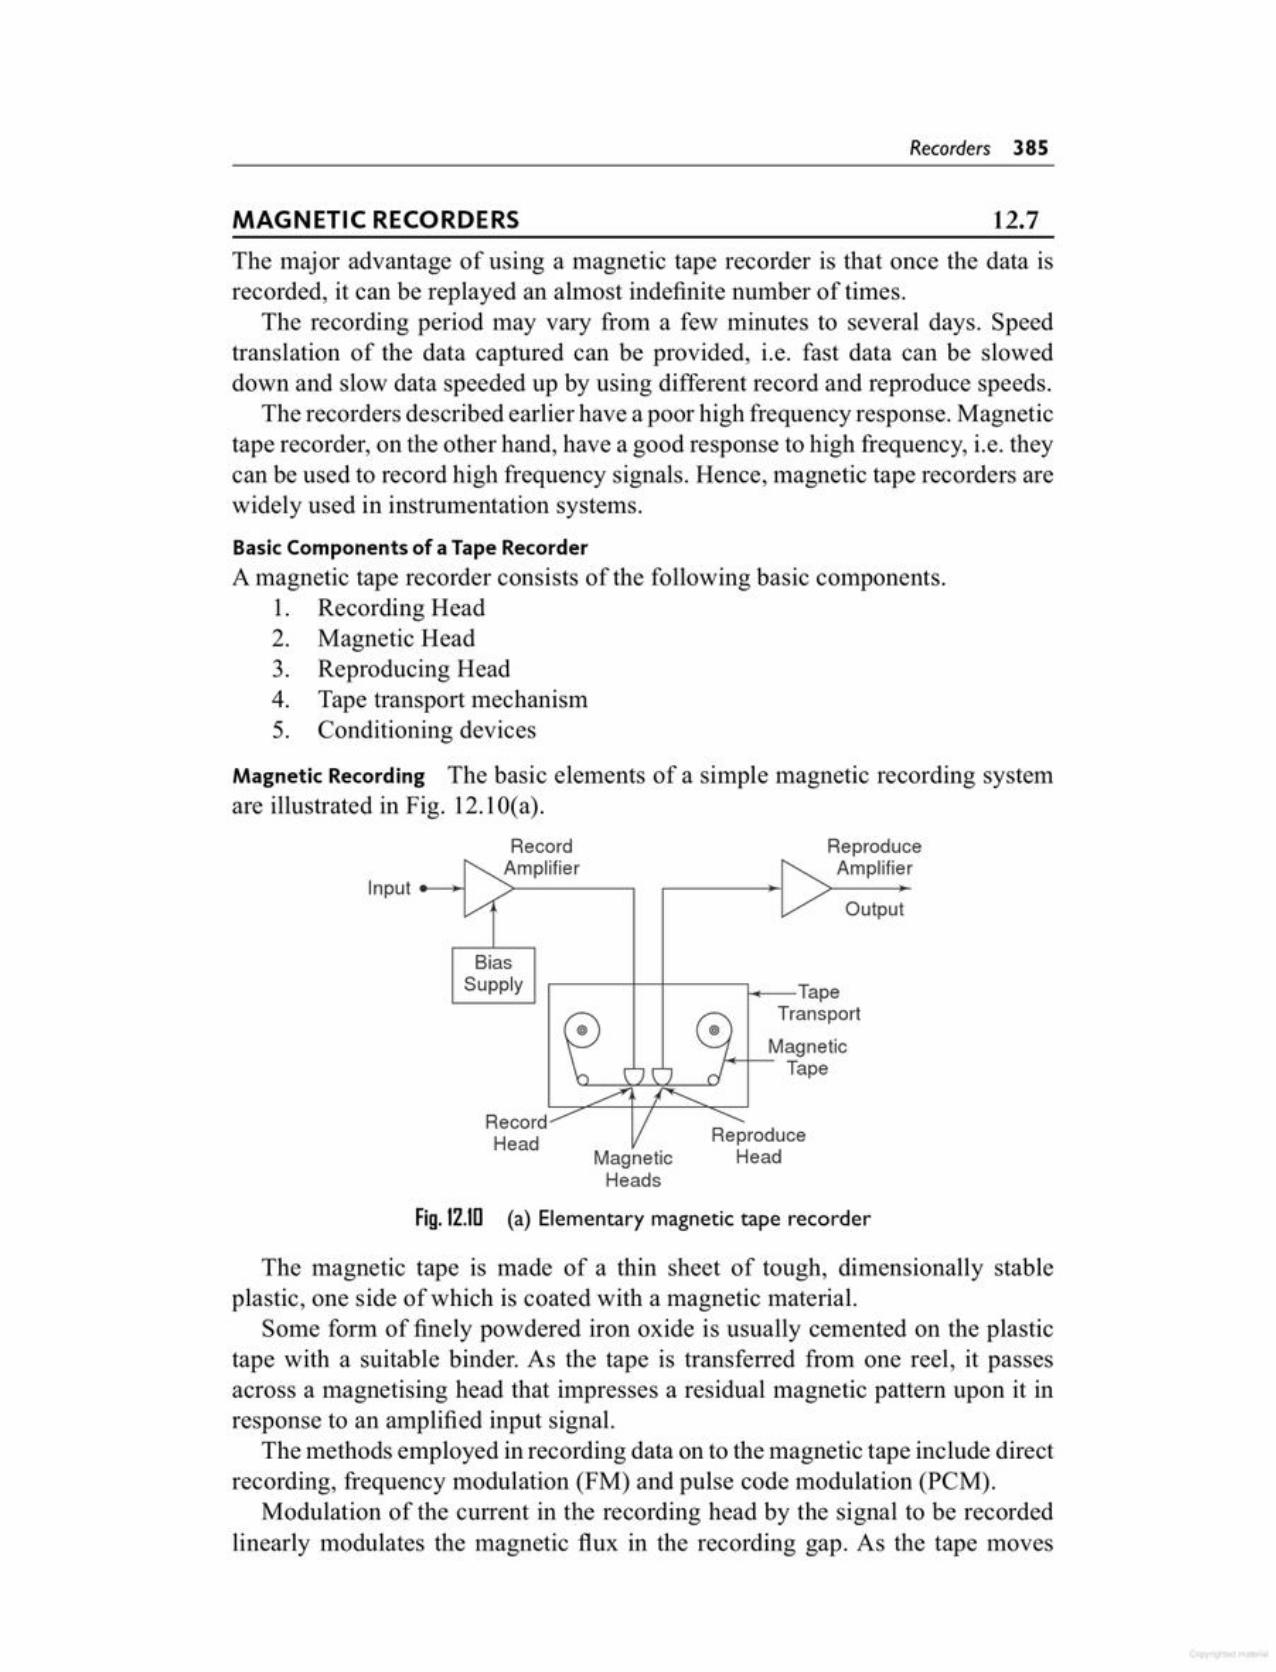
The magnetic tape is made of a thin sheet of tough, dimensionally stableplastic, one side of which is coated with a magnetic material.
Some form of finely powdered iron oxide is usually cemented on the plastictape with a suitable binder. As the tape is transferred from one reel, it passesacross a magnetising head that impresses a residual magnetic pattern upon it inresponse to an amplified input signal.
The methods employed in recording data on to the magnetic tape include directrecording, frequency modulation (FM) and pulse code modulation (PCM).
Modulation of the current in the recording head by the signal to be recordedlinearly modulates the magnetic flux in the recording gap. As the tape moves
Fig.12.1O (a) Elementary magnetic tape recorder
ReproduceHeadMagnetic
Heads
RecordHead
BiasL-S_u_p_p_ly-,1--II--~oE--Tape
Transport
Magnetic!-+-it- Tape
'-'---~..£..-'"6-----l..I
ReproduceAmplifier
Output
RecordAmplifier
The major advantage of using a magnetic tape recorder is that once the data isrecorded, it can be replayed an almost indefinite number of times.
The recording period may vary from a few minutes to several days. Speedtranslation of the data captured can be provided, i.e. fast data can be sloweddown and slow data speeded up by using different record and reproduce speeds.
The recorders described earlier have a poor high frequency response. Magnetictape recorder, on the other hand, have a good response to high frequency, i.e. theycan be used to record high frequency signals. Hence, magnetic tape recorders arewidely used in instrumentation systems.
Basic Components of a Tape RecorderA magnetic tape recorder consists of the following basic components.
1. Recording Head2. Magnetic Head3. Reproducing Head4. Tape transport mechanism5. Conditioning devices
Magnetic Recording The basic elements of a simple magnetic recording systemare illustrated in Fig. 12.10(a).
12.7MAGNETIC RECORDERS
Recorders 385
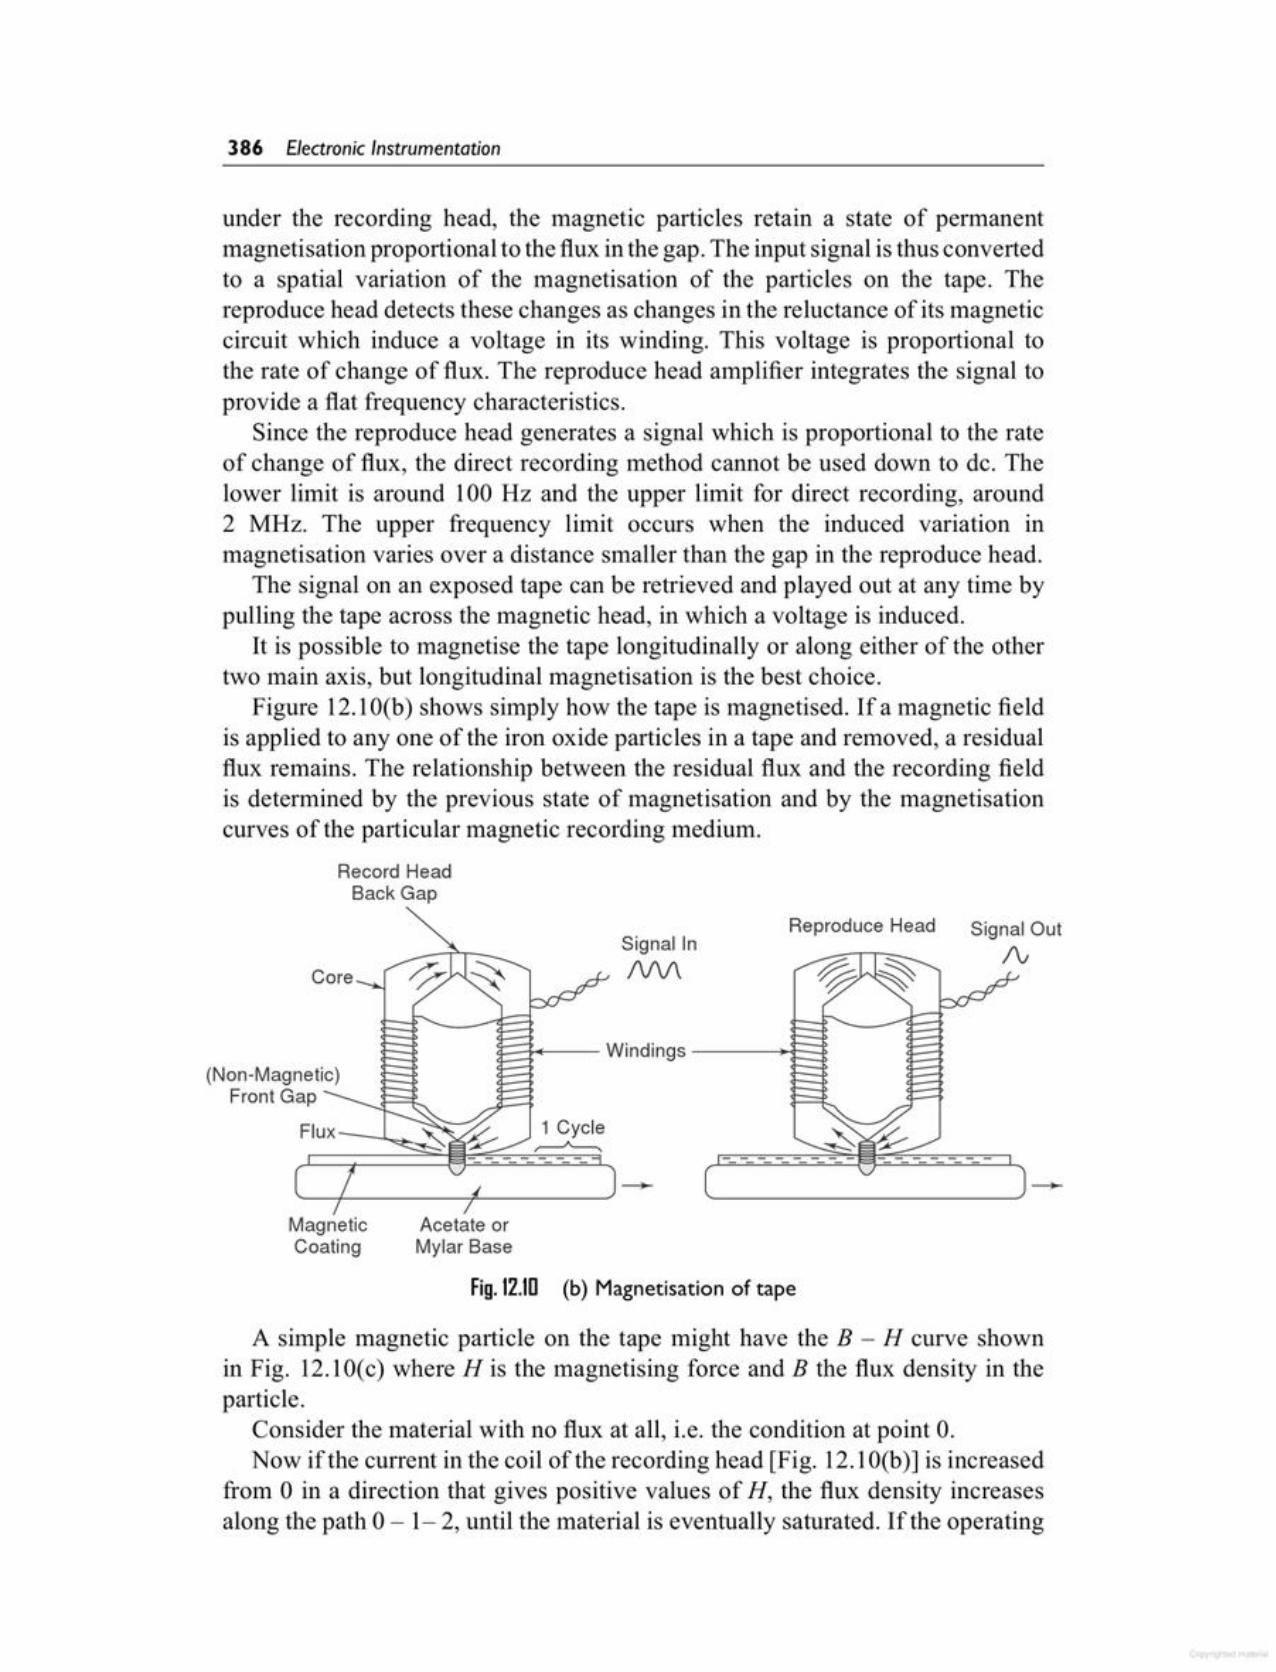
A simple magnetic particle on the tape might have the B - H curve shownin Fig. 12.10(c) where H is the magnetising force and B the flux density in theparticle.
Consider the material with no flux at all, i.e. the condition at point o.Now if the current in the coil of the recording head [Fig. 12.1O(b)] is increased
from 0 in a direction that gives positive values of H, the flux density increasesalong the path 0 - 1- 2, until the material is eventually saturated. If the operating
Acetate orMylar Base
Fig.12.10 (b) Magnetisation of tape
MagneticCoating
1 Cycle
Reproduce Head Signal OutI\;Signal In
IVV\
(Non-Magnetic)Front Gap
Flux
under the recording head, the magnetic particles retain a state of permanentmagnetisation proportional to the flux in the gap. The input signal is thus convertedto a spatial variation of the magnetisation of the particles on the tape. Thereproduce head detects these changes as changes in the reluctance of its magneticcircuit which induce a voltage in its winding. This voltage is proportional tothe rate of change of flux. The reproduce head amplifier integrates the signal toprovide a flat frequency characteristics.
Since the reproduce head generates a signal which is proportional to the rateof change of flux, the direct recording method cannot be used down to de. Thelower limit is around 100 Hz and the upper limit for direct recording, around2 MHz. The upper frequency limit occurs when the induced variation inmagnetisation varies over a distance smaller than the gap in the reproduce head.
The signal on an exposed tape can be retrieved and played out at any time bypulling the tape across the magnetic head, in which a voltage is induced.
It is possible to magnetise the tape longitudinally or along either of the othertwo main axis, but longitudinal magnetisation is the best choice.
Figure 12.1O(b) shows simply how the tape is magnetised. If a magnetic fieldis applied to anyone of the iron oxide particles in a tape and removed, a residualflux remains. The relationship between the residual flux and the recording fieldis determined by the previous state of magnetisation and by the magnetisationcurves of the particular magnetic recording medium.
Record HeadBack Gap
386 Electronic Instrumentation

Methods of RecordingThere are three methods of magnetic tape recording which are used forinstrumentation purposes.
1. Direct recording2. FM recording3. Pulse Duration Modulation recording (PDM)FM recorders are generally used for instrumentation purposes. PDM recording
is used in instrumentation for special applications where a large number of slowlychanging variables have to be recorded simultaneously.Direct RecordingThis type of recording is described in the introduction of Sec. 12.7.Advantage of Direct Recording
1. This recording process has a wide frequency response, ranging from50 Hz - 2 MHz for a tape speed of 3.05 m/s. It provides the greatestbandwidth obtainable for a given recorder.
2. It requires simple electronic circuits.3. It has a good dynamic response and takes overloads without increase in
distortion. In general, instrumentation recorders have a signal to noiseratio of 22 - 30 db at 1% total harmonic distortion.
4. It is used to record signals where information is contained in the relationbetween frequency and amplitude, such as the spectrum analysis ofnorse.
5. It can be used for recording voice signals.Disadvantage
1. The direct recording process is characterised by some amplitudeinstability caused by random surface inhomogeneities in the tape
curve(c) Typical magnetisationFig. 12.10
5--__
H
Bpoint is brought from 0 only as far as 1, andH is brought back to 0, B follows a minorhysteresis loop back to point 6. A greatervalue of coil current would leave a higherresidual flux, and a lower current a lowerresidual; a very simple recording processresults.
However, the linearity between residualflux and recording current is very poor.Hence to obtain linearity in direct recording,FM is used. In all systems, the signal isreproduced by passing the magnetised tapeover a magnetic head similar to the recordinghead. The magnetisation of the particles onthe tape induces a varying flux in the reproducing head and a voltage is inducedin the coil, proportional to the rate of change of flux.
Recorders 387

Input to the tape recorders is generally at the 1 V level, and so mosttransducers require amplification before recording.
An FM recording system is illustrated in Fig. 12.11. In this system a carrieroscillator frequencyj., called the centre frequency, is modulated by the level ofthe input signal.
Table 12.1
Tape speed Carrierfrequency Flat frequency RMS (SIN)inls kHz response ± 0.5 db,Hz ratio
120.0 108.0 0-20,000 5060.0 54.0 0-10,000 5030.0 27.0 0-5,000 4915.0 13.5 0-2,500 487.5 6.75 0-1,250 473.75 3.38 0-625 461.88 1.68 0-312 45
When a more accurate response to dc voltages is required, an FM system isgenerally used.
In this FM system, the input signal is used to frequency modulate a carrier, i.e.the carrier signal is frequency modulated by the input signal (FM modulation),which is then recorded on the tape in the usual way.
The central frequency is selected with respect to the tape speed andfrequency deviation selected for the tape recorders is ± 40% about the carrierfrequency.
The reproduce head reads the tape in the usual way and sends a signal to theFM demodulator and low pass filter, and the original signal is reconstructed. Thesignal to noise ratio (SIN) of an FM recorder is of the order of 40 - 50 db, withan accuracy of less then ± 1%.
This ± 1 db flat frequency response of FM recorders can go as high as80 kHz at 120 in/s tape speed, when using very high carrier frequencies (above400 kHz).
When high frequency (HF) is not needed, and with a view to conservingtape. A tape speed range selector is generally provided. When the tape speed ischanged, the carrier frequency also changes in the same proportion. Therefore,no matter what tape speed is being used, the recorded wavelength of a given deinput remains the same, since ± 40% full scale frequency deviation is utilised inall cases. A common set of specifications are given in Table 12.1.
12.8FREQUENCYMODULATION (FM) RECORDING
coating. Some portion may not be perfectly recorded owing to dirt orpoor manufacture.
2. This recorder is only used when maximum bandwidth is required.
388 Electronic Instrumentation
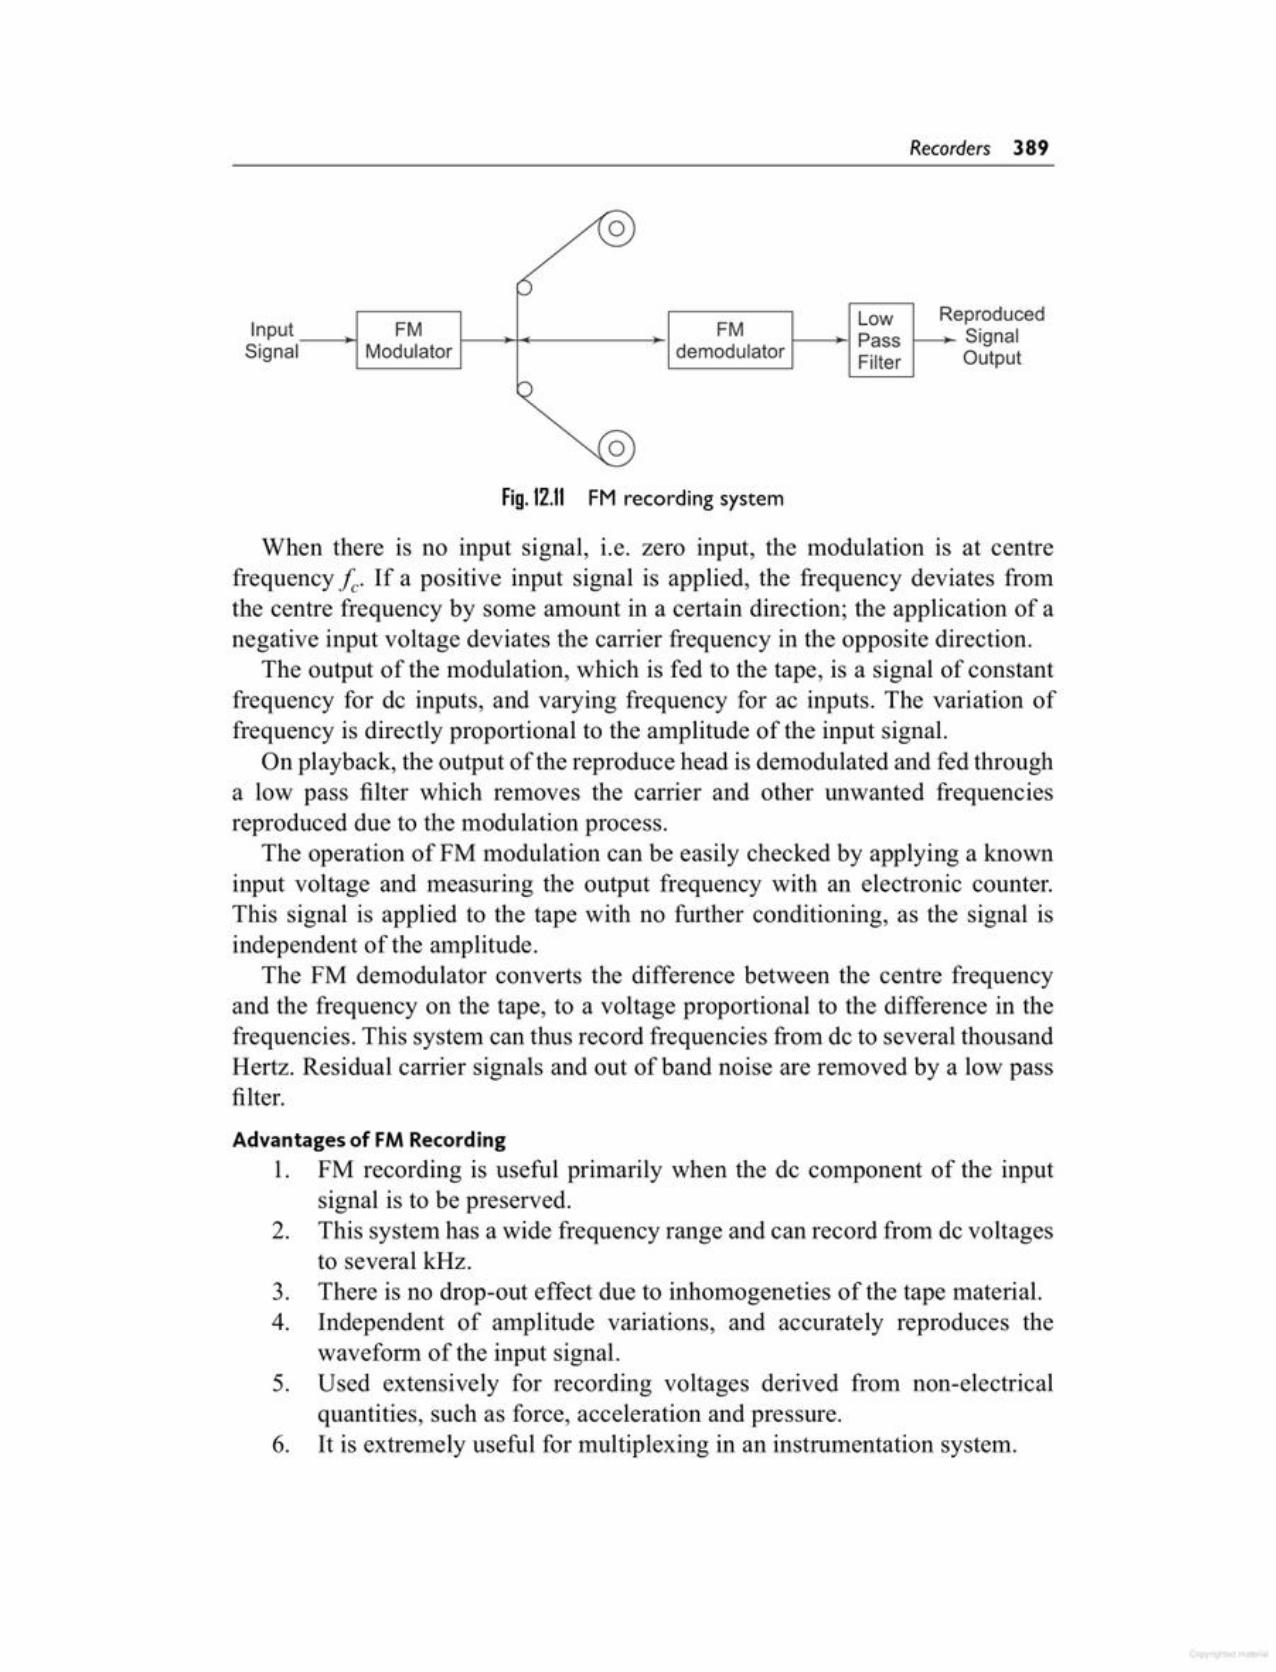
Advantages of FM Recording1. FM recording is useful primarily when the de component of the input
signal is to be preserved.2. This system has a wide frequency range and can record from de voltages
to several kHz.3. There is no drop-out effect due to inhomogeneties of the tape material.4. Independent of amplitude variations, and accurately reproduces the
waveform of the input signal.5. Used extensively for recording voltages derived from non-electrical
quantities, such as force, acceleration and pressure.6. It is extremely useful for multiplexing in an instrumentation system.
When there is no input signal, i.e. zero input, the modulation is at centrefrequency !c. If a positive input signal is applied, the frequency deviates fromthe centre frequency by some amount in a certain direction; the application of anegative input voltage deviates the carrier frequency in the opposite direction.
The output of the modulation, which is fed to the tape, is a signal of constantfrequency for de inputs, and varying frequency for ac inputs. The variation offrequency is directly proportional to the amplitude of the input signal.
On playback, the output of the reproduce head is demodulated and fed througha low pass filter which removes the carrier and other unwanted frequenciesreproduced due to the modulation process.
The operation of FM modulation can be easily checked by applying a knowninput voltage and measuring the output frequency with an electronic counter.This signal is applied to the tape with no further conditioning, as the signal isindependent of the amplitude.
The FM demodulator converts the difference between the centre frequencyand the frequency on the tape, to a voltage proportional to the difference in thefrequencies. This system can thus record frequencies from de to several thousandHertz. Residual carrier signals and out of band noise are removed by a low passfilter.
Fig.12.11 FM recording system
Low ReproducedFM 1--_1 Pass 1--'"Signal
demodulator Filter OutputInput _--.; FMSignal Modulator
Recorders 389

Digital magnetic tapes are often used as storage devices in digital data processingapplications. Digital tape units are of two types, incremental and synchronous.
Incremental digital recorders are commanded to step ahead (increment) foreach digital character to be recorded. Input data may be at a relatively slow,or even discontinuous rate. In this way, each character is equally and preciselyspaced along the tape.
In a synchronous digital recorder, the tape moves at a constant speed (about 75crn/s) while a large number of data characters are recorded. The data inputs are atprecise rates, up to tens of thousands of characters per second. The tape is rapidlybrought up to speed, recording takes place, and the tape is brought to a fast stop.In this way a block of characters (a record) is written with each character spacedequally along the tape. Blocks of data are usually separated from each other byan erased area on the tape called the record gap. The synchronous tape unit startsand stops the tape for each block of data to be recorded.
Characters are represented on magnetic tape by a coded combination of l-bitin appropriate tracks across the tape width. The recording technique used in mostinstrumentation tape recorders is the industry accepted IBM format of NonReturn Zero (NRZ) recording.
In this system the tape is magnetically saturated at all times in either thepositive or the negative direction.
The NRZ method uses the change in flux direction on the tape to indicate 1bit, and no change in flux direction to indicate 0 bit. This method is illustrated inFig. 12.12, where the binary numbr 11101011 is represented by a flux pattern inthe NRZ system.
The simplest method of coding the recording head field is to reverse itsdirection.
12.9DIGITAL DATA RECORDING
Pulse Duration ModulationPulse width modulation is also called pulse duration modulation (PDM). In thissystem, the amplitude and the starting time of each pulse is kept fixed, but thewidth of the pulse is made proportional to the amplitude of the signal at thatinstant. This type of system is mostly used for Digital recording.
Disadvantages1. FM recording is extremely sensitive to tape speed fluctuations.2. FM recording circuitry is more complicated than that of direct recording
systems.3. FM system has a limited frequency response.4. It requires a high tape speed.5. It requires a high quality of tape transport and speed control.
390 Electronic Instrumentation
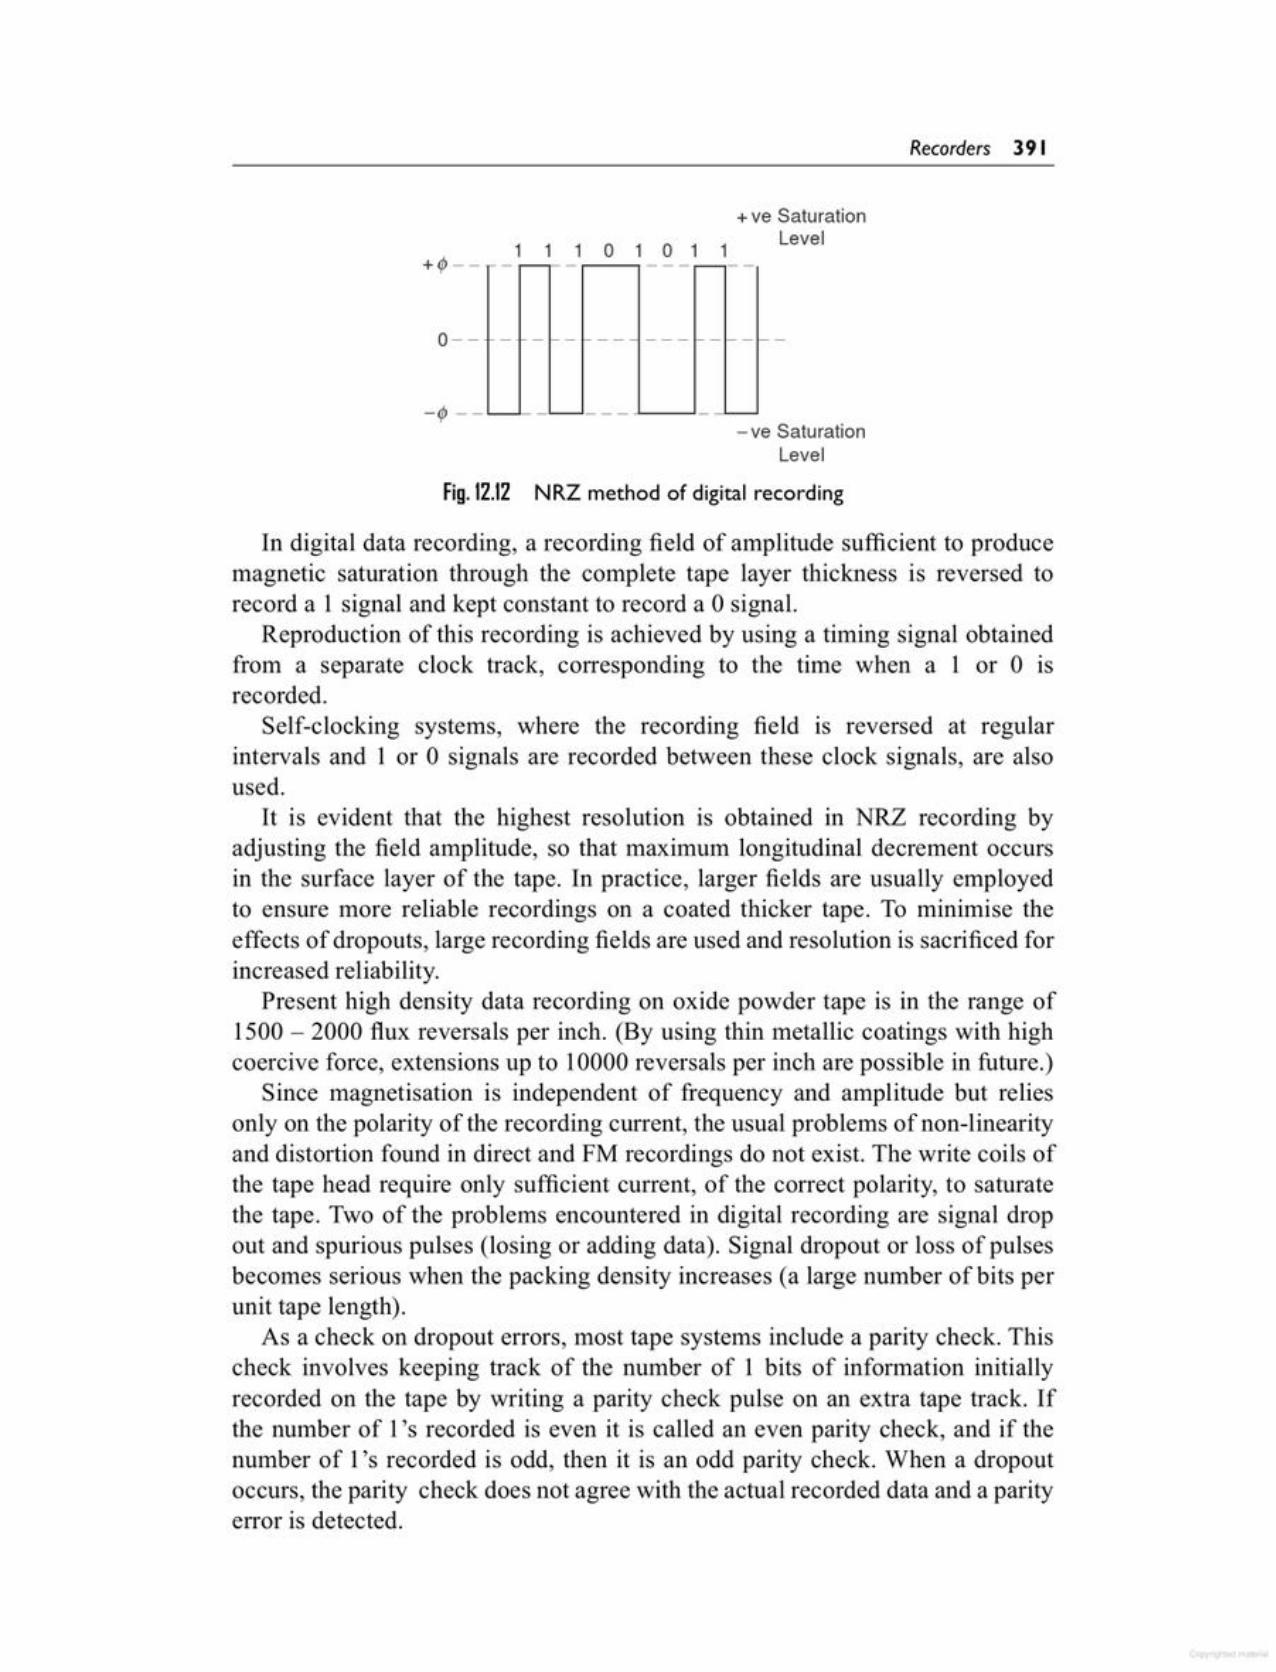
In digital data recording, a recording field of amplitude sufficient to producemagnetic saturation through the complete tape layer thickness is reversed torecord a 1 signal and kept constant to record a 0 signal.
Reproduction of this recording is achieved by using a timing signal obtainedfrom a separate clock track, corresponding to the time when a 1 or 0 isrecorded.
Self-clocking systems, where the recording field is reversed at regularintervals and 1 or 0 signals are recorded between these clock signals, are alsoused.
It is evident that the highest resolution is obtained in NRZ recording byadjusting the field amplitude, so that maximum longitudinal decrement occursin the surface layer of the tape. In practice, larger fields are usually employedto ensure more reliable recordings on a coated thicker tape. To minimise theeffects of dropouts, large recording fields are used and resolution is sacrificed forincreased reliability.
Present high density data recording on oxide powder tape is in the range of1500 - 2000 flux reversals per inch. (By using thin metallic coatings with highcoercive force, extensions up to 10000 reversals per inch are possible in future.)
Since magnetisation is independent of frequency and amplitude but reliesonly on the polarity of the recording current, the usual problems of non-linearityand distortion found in direct and FM recordings do not exist. The write coils ofthe tape head require only sufficient current, of the correct polarity, to saturatethe tape. Two of the problems encountered in digital recording are signal dropout and spurious pulses (losing or adding data). Signal dropout or loss of pulsesbecomes serious when the packing density increases (a large number of bits perunit tape length).
As a check on dropout errors, most tape systems include a parity check. Thischeck involves keeping track of the number of 1 bits of information initiallyrecorded on the tape by writing a parity check pulse on an extra tape track. Ifthe number of 1's recorded is even it is called an even parity check, and if thenumber of 1's recorded is odd, then it is an odd parity check. When a dropoutoccurs, the parity check does not agree with the actual recorded data and a parityerror is detected.
Fig.12.12 NRZ method of digital recording
- ve SaturationLevel
-ifJ --
,- - ------
f-- f-- r- ---- --- -- r-r
-'--- ---
0--
+ve SaturationLevel11101011+ifJ--
Recorders 39 I
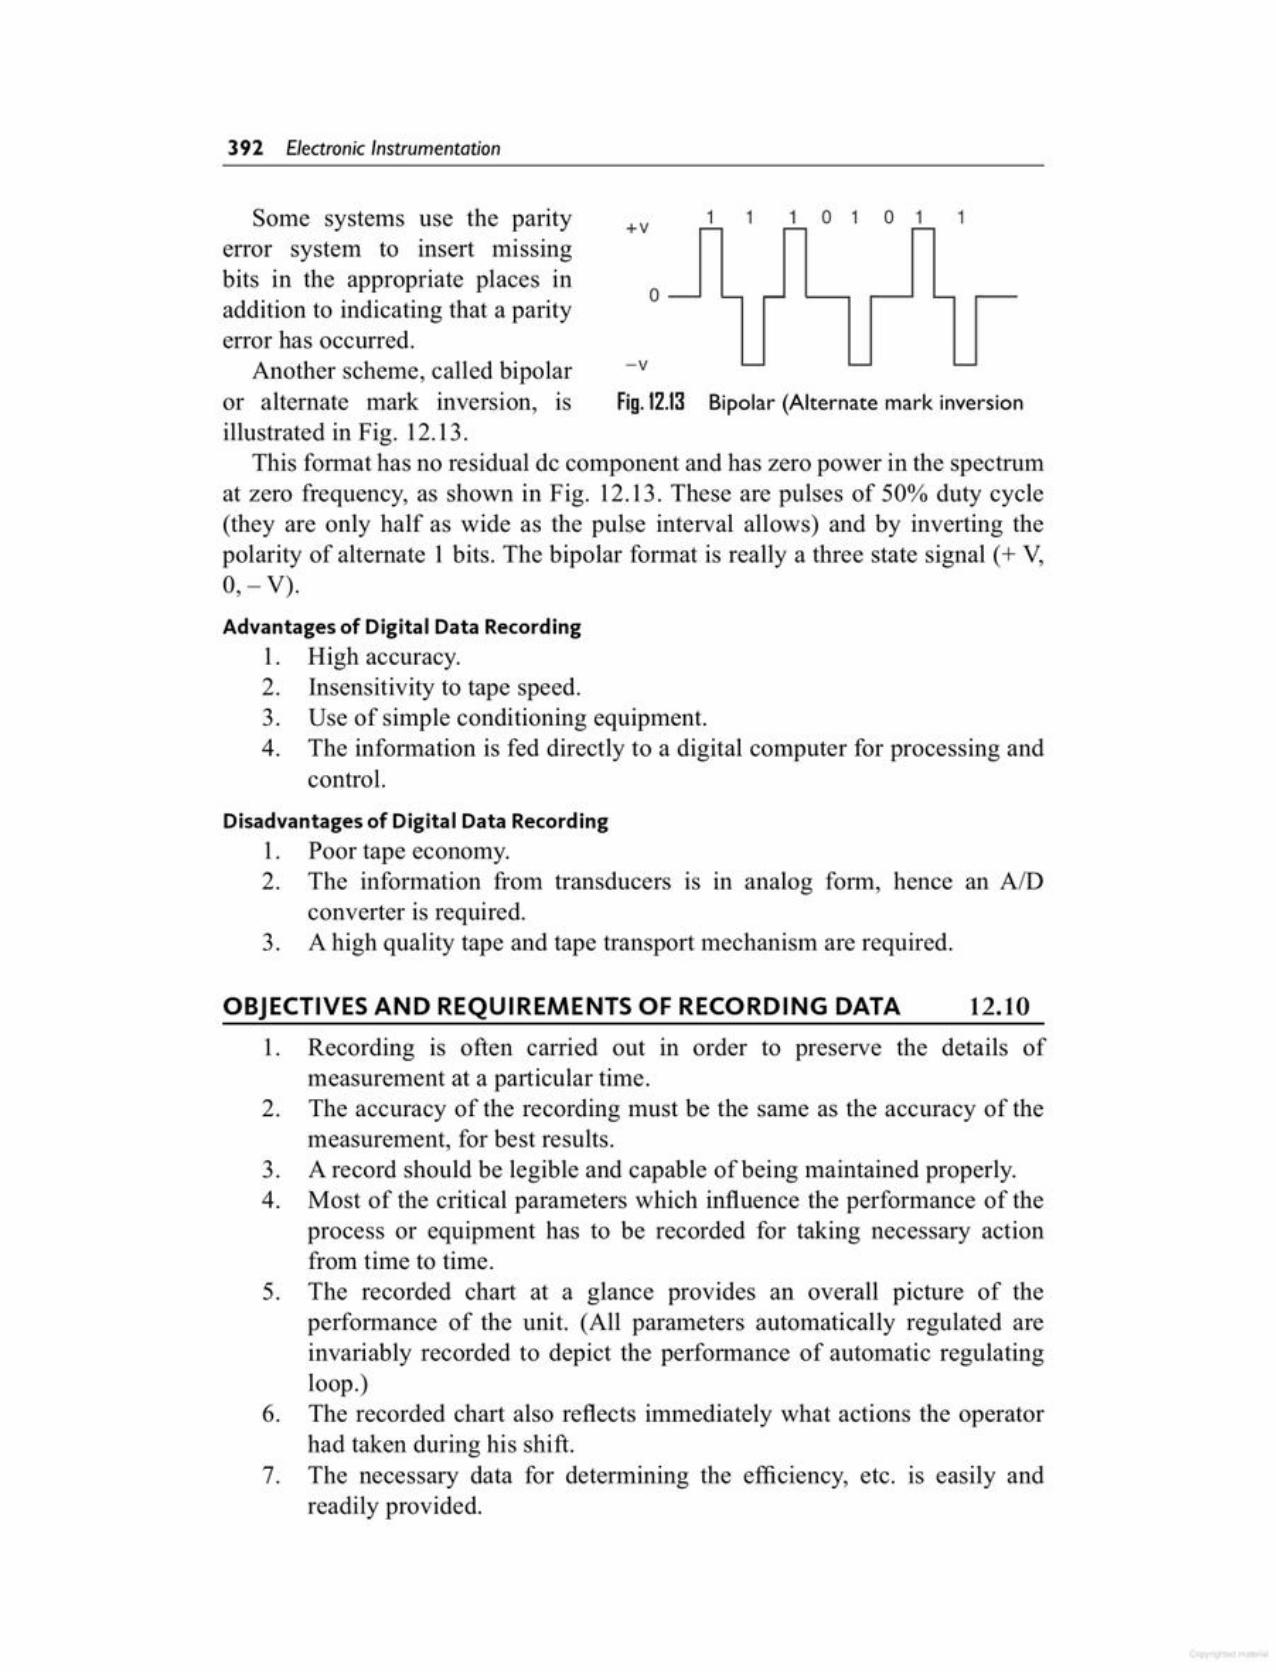
1. Recording is often carried out in order to preserve the details ofmeasurement at a particular time.
2. The accuracy of the recording must be the same as the accuracy of themeasurement, for best results.
3. A record should be legible and capable of being maintained properly.4. Most of the critical parameters which influence the performance of the
process or equipment has to be recorded for taking necessary actionfrom time to time.
5. The recorded chart at a glance provides an overall picture of theperformance of the unit. (All parameters automatically regulated areinvariably recorded to depict the performance of automatic regulatingloop.)
6. The recorded chart also reflects immediately what actions the operatorhad taken during his shift.
7. The necessary data for determining the efficiency, etc. is easily andreadily provided.
12.10OBJECTIVES AND REQUIREMENTS OF RECORDING DATA
Disadvantages of Digital Data Recording1. Poor tape economy.2. The information from transducers IS In analog form, hence an AID
converter is required.3. A high quality tape and tape transport mechanism are required.
Advantages of Digital Data Recording1. High accuracy.2. Insensitivity to tape speed.3. Use of simple conditioning equipment.4. The information is fed directly to a digital computer for processing and
control.
Bipolar (Alternate mark inversionFig. 12.13--v
0- - -
11101011- - r--+vSome systems use the parity
error system to insert missingbits in the appropriate places inaddition to indicating that a parityerror has occurred.
Another scheme, called bipolaror alternate mark inversion, isillustrated in Fig. 12.13.
This format has no residual de component and has zero power in the spectrumat zero frequency, as shown in Fig. 12.13. These are pulses of 50% duty cycle(they are only half as wide as the pulse interval allows) and by inverting thepolarity of alternate 1 bits. The bipolar format is really a three state signal (+ V,0, - V).
392 Electronic Instrumentation
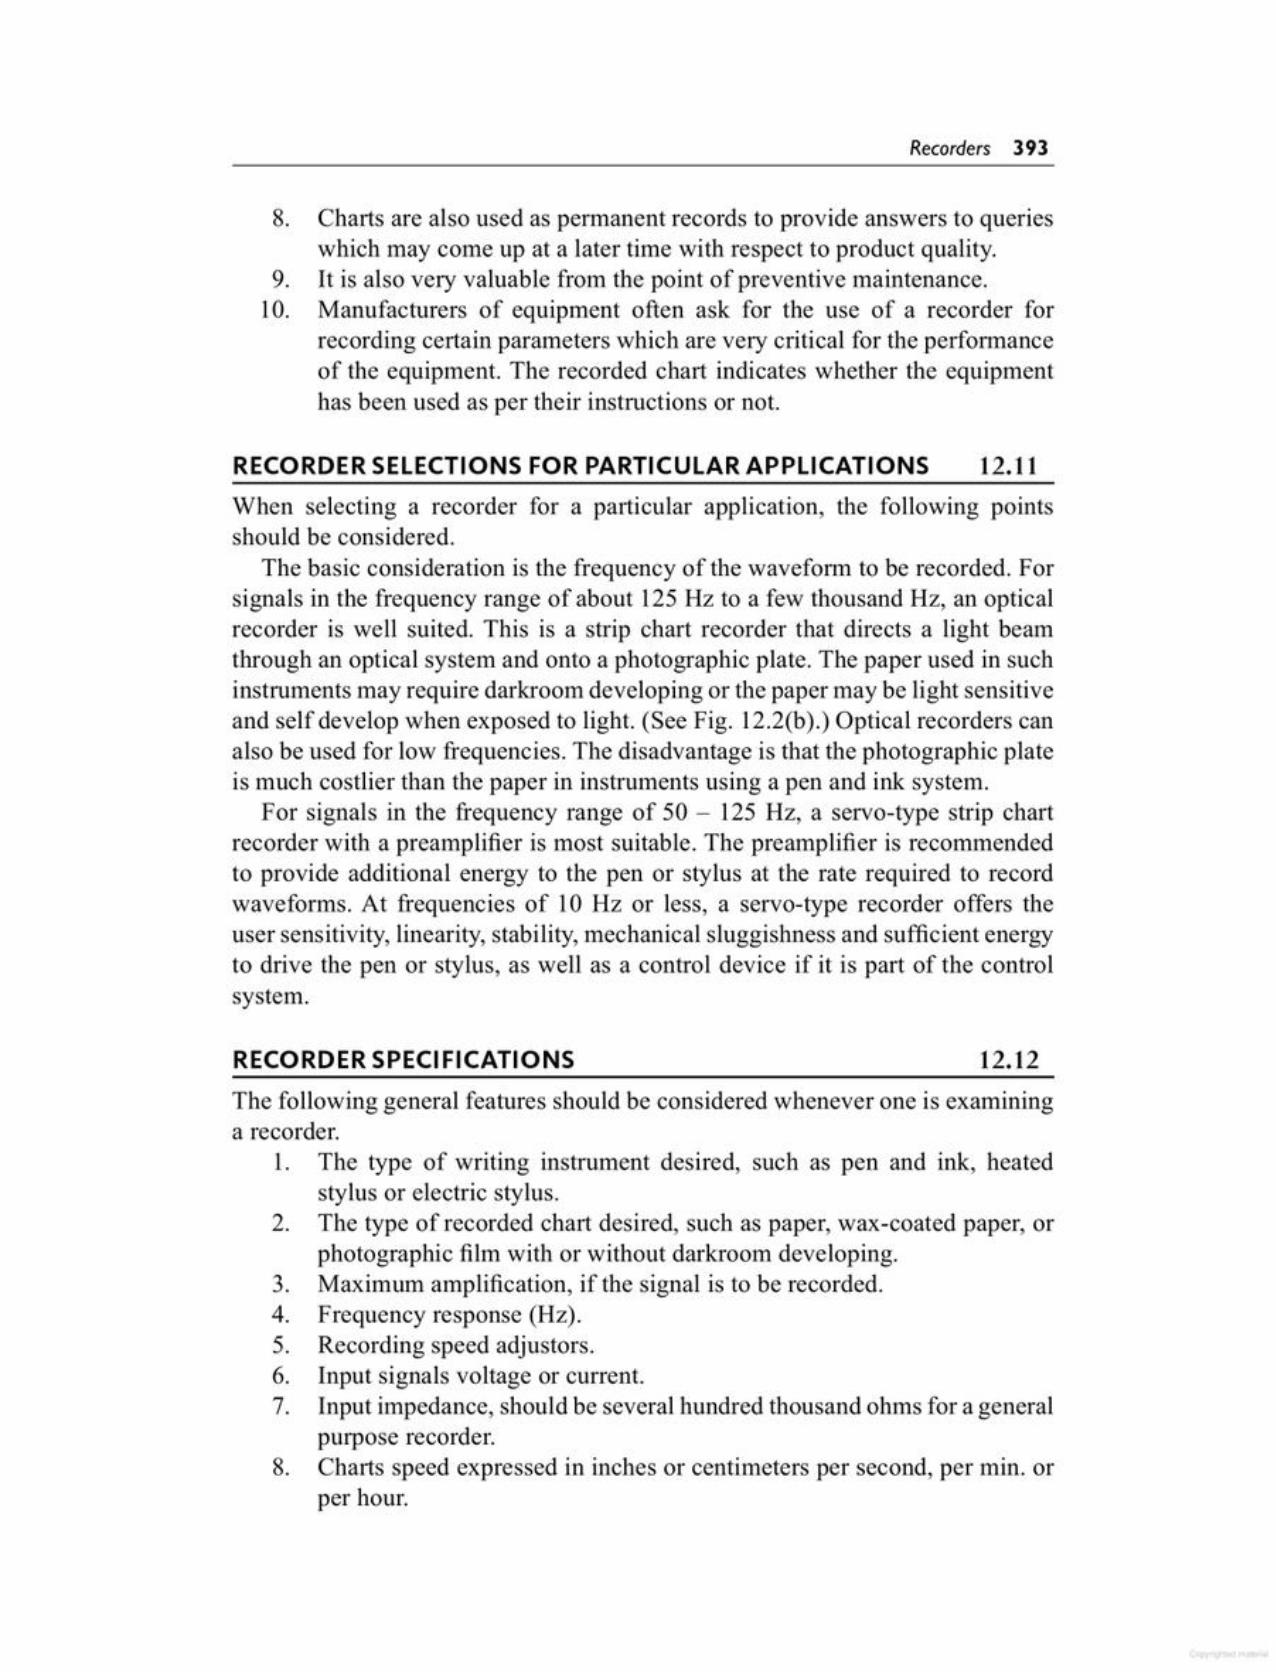
The following general features should be considered whenever one is examininga recorder.
1. The type of writing instrument desired, such as pen and ink, heatedstylus or electric stylus.
2. The type of recorded chart desired, such as paper, wax-coated paper, orphotographic film with or without darkroom developing.
3. Maximum amplification, if the signal is to be recorded.4. Frequency response (Hz).5. Recording speed adjustors.6. Input signals voltage or current.7. Input impedance, should be several hundred thousand ohms for a general
purpose recorder.8. Charts speed expressed in inches or centimeters per second, per min. or
per hour.
12.12RECORDER SPECIFICATIONS
When selecting a recorder for a particular application, the following pointsshould be considered.
The basic consideration is the frequency of the waveform to be recorded. Forsignals in the frequency range of about 125 Hz to a few thousand Hz, an opticalrecorder is well suited. This is a strip chart recorder that directs a light beamthrough an optical system and onto a photographic plate. The paper used in suchinstruments may require darkroom developing or the paper may be light sensitiveand self develop when exposed to light. (See Fig. 12.2(b).) Optical recorders canalso be used for low frequencies. The disadvantage is that the photographic plateis much costlier than the paper in instruments using a pen and ink system.
For signals in the frequency range of 50 - 125 Hz, a servo-type strip chartrecorder with a preamplifier is most suitable. The preamplifier is recommendedto provide additional energy to the pen or stylus at the rate required to recordwaveforms. At frequencies of 10 Hz or less, a servo-type recorder offers theuser sensitivity, linearity, stability, mechanical sluggishness and sufficient energyto drive the pen or stylus, as well as a control device if it is part of the controlsystem.
RECORDER SELECTIONS FOR PARTICULAR APPLICATIONS 12.11
8. Charts are also used as permanent records to provide answers to querieswhich may come up at a later time with respect to product quality.
9. It is also very valuable from the point of preventive maintenance.10. Manufacturers of equipment often ask for the use of a recorder for
recording certain parameters which are very critical for the performanceof the equipment. The recorded chart indicates whether the equipmenthas been used as per their instructions or not.
Recorders 393
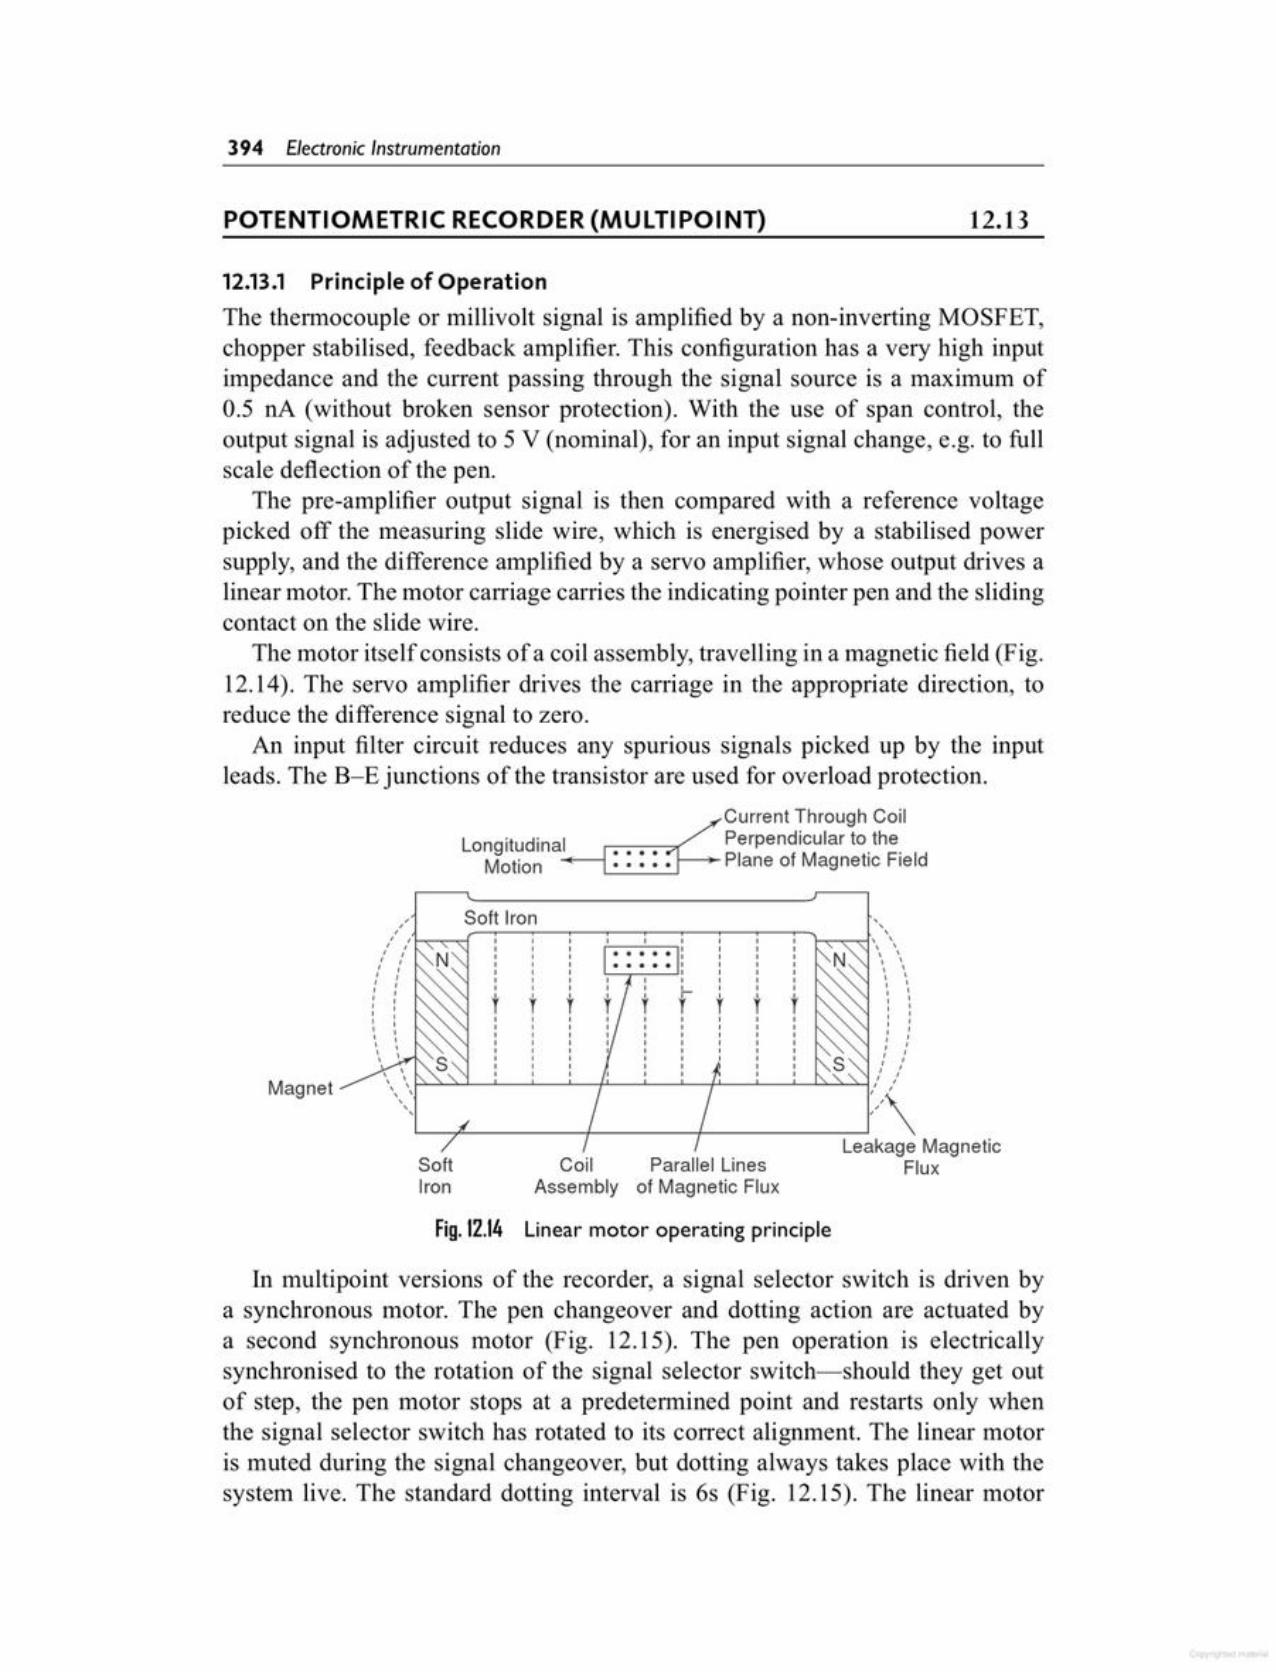
In multipoint versions of the recorder, a signal selector switch is driven bya synchronous motor. The pen changeover and dotting action are actuated bya second synchronous motor (Fig. 12.15). The pen operation is electricallysynchronised to the rotation of the signal selector switch-should they get outof step, the pen motor stops at a predetermined point and restarts only whenthe signal selector switch has rotated to its correct alignment. The linear motoris muted during the signal changeover, but dotting always takes place with thesystem live. The standard dotting interval is 6s (Fig. 12.15). The linear motor
Fig.12.14 Linear motor operating principle
Coil Parallel LinesAssembly of Magnetic Flux
SoftIron
,, Soft Iron,, , , , , , , ,, , , I , , I ,r , , , , , , ,,I , , , , , ,
I, , , I , , I ,, I , , , , I ,I I , , , , , ,, I t t t t t t,, ,, ,, ,, ,, ,, ,I I.I
Magnet
Current Through CoilLongitudinal r:-:--::-:-::;>( Perpendicular to the
Motion ~(__,I:::: :"1 Plane of Magnetic Field
12.13.1 Principle of OperationThe thermocouple or millivolt signal is amplified by a non-inverting MOSFET,chopper stabilised, feedback amplifier. This configuration has a very high inputimpedance and the current passing through the signal source is a maximum of0.5 nA (without broken sensor protection). With the use of span control, theoutput signal is adjusted to 5 V (nominal), for an input signal change, e.g. to fullscale deflection of the pen.
The pre-amplifier output signal is then compared with a reference voltagepicked off the measuring slide wire, which is energised by a stabilised powersupply, and the difference amplified by a servo amplifier, whose output drives alinear motor. The motor carriage carries the indicating pointer pen and the slidingcontact on the slide wire.
The motor itself consists of a coil assembly, travelling in a magnetic field (Fig.12.14). The servo amplifier drives the carriage in the appropriate direction, toreduce the difference signal to zero.
An input filter circuit reduces any spurious signals picked up by the inputleads. The B-E junctions of the transistor are used for overload protection.
12.13POTENTIOMETRIC RECORDER(MULTIPOINT)
394 Electronic Instrumentation
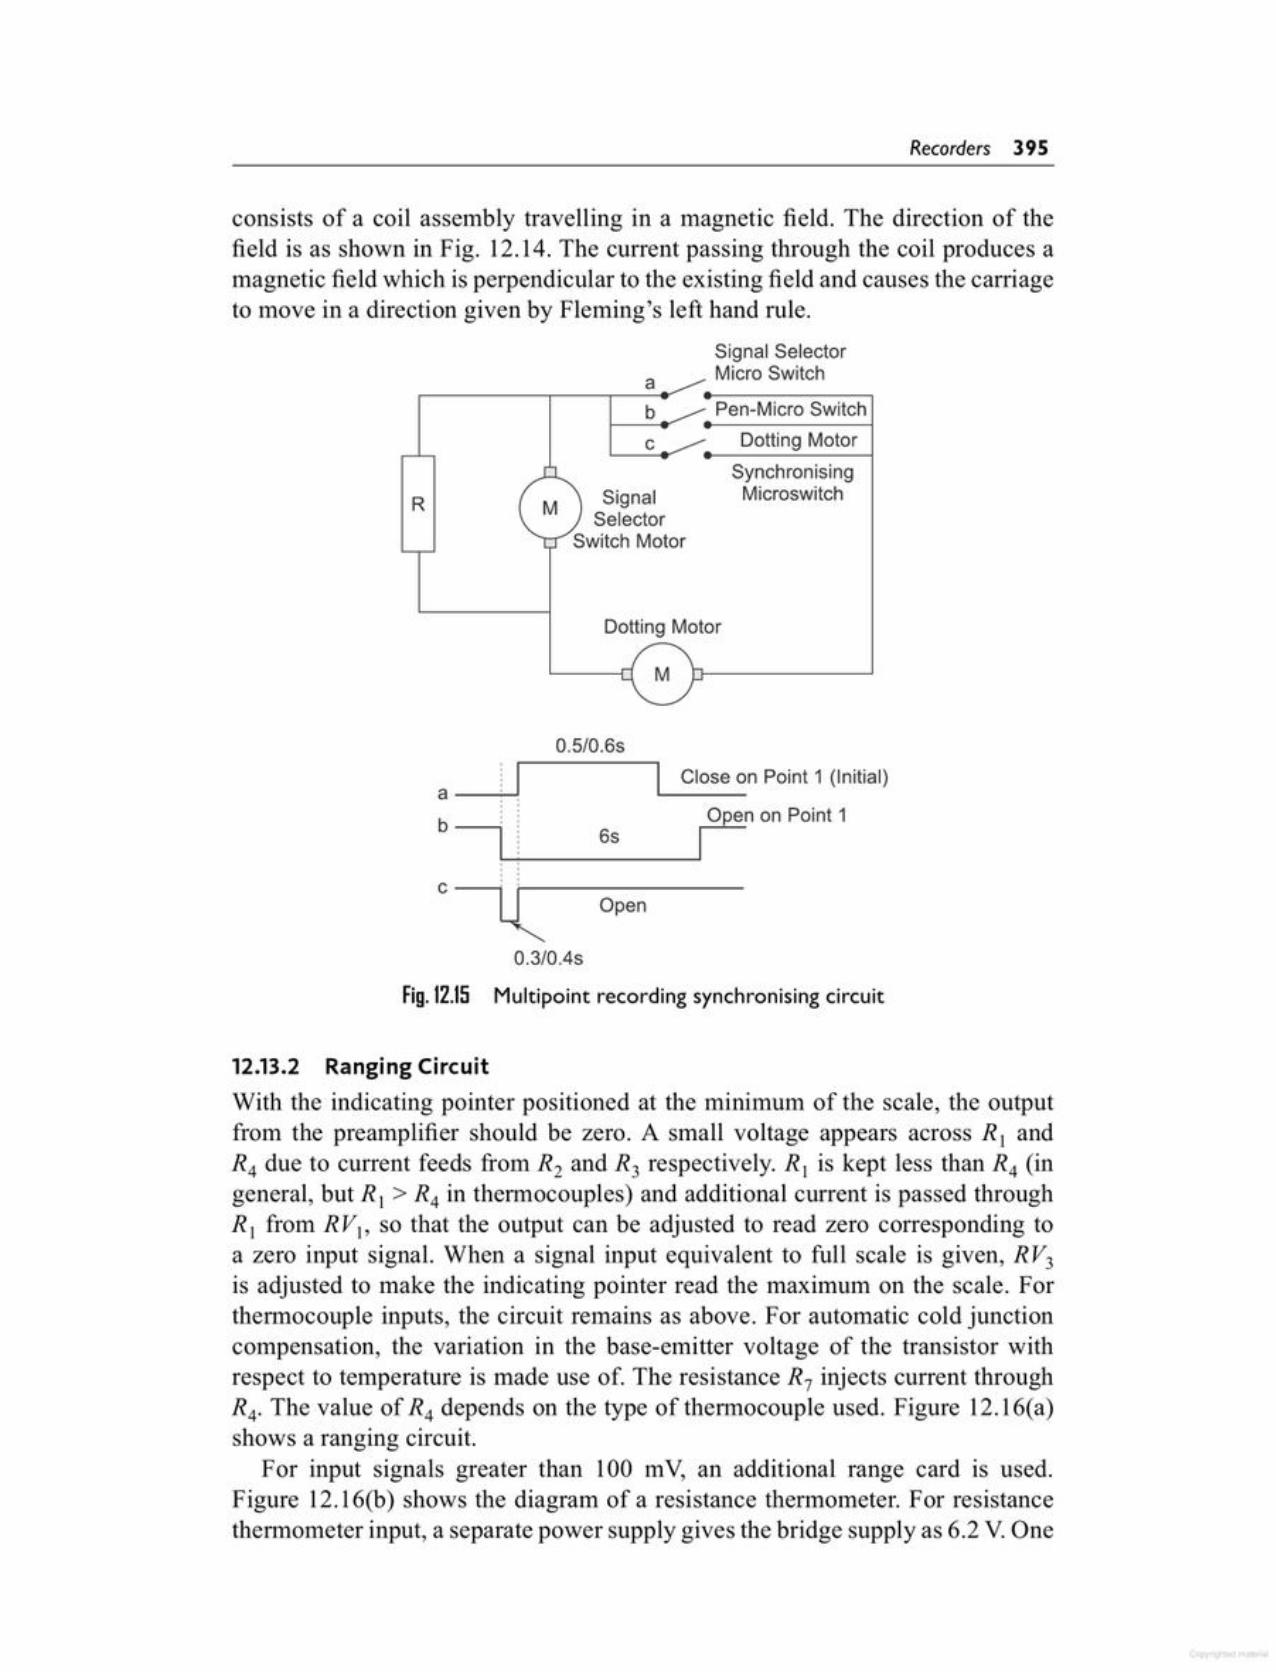
12.13.2 Ranging CircuitWith the indicating pointer positioned at the minimum of the scale, the outputfrom the preamplifier should be zero. A small voltage appears across R 1 andR4 due to current feeds from R2 and R3 respectively. R) is kept less than R4 (ingeneral, but R 1 > R4 in thermocouples) and additional current is passed throughR) from RV), so that the output can be adjusted to read zero corresponding toa zero input signal. When a signal input equivalent to full scale is given, RV3
is adjusted to make the indicating pointer read the maximum on the scale. Forthermocouple inputs, the circuit remains as above. For automatic cold junctioncompensation, the variation in the base-emitter voltage of the transistor withrespect to temperature is made use of. The resistance R7 injects current throughR4. The value of R4 depends on the type of thermocouple used. Figure 12.16(a)shows a ranging circuit.
For input signals greater than 100 mV, an additional range card is used.Figure 12.16(b) shows the diagram of a resistance thermometer. For resistancethermometer input, a separate power supply gives the bridge supply as 6.2 V.One
0.3/0.4s
Fig. 12.15 Multipoint recording synchronising circuit
Open
Close on Point 1 (Initial)
Open on Point 1
I6sb ---i
0.5/0.6s
Dotting Motor
cSynchronisingMicroswitchSignal
SelectorSwitch Motor
b
R
Pen-Micro SwitchDotting Motor
a
consists of a coil assembly travelling in a magnetic field. The direction of thefield is as shown in Fig. 12.14. The current passing through the coil produces amagnetic field which is perpendicular to the existing field and causes the carriageto move in a direction given by Fleming's left hand rule.
Signal SelectorMicro Switch
Recorders 395

(Equivalent Circuit)
Fig.12.IS (b) Basic diagram of a resistance thermometer
AB
R.T.Bulb
+6.2 V
-6.2 V
Linear MotorCoil
Sensor
Zeroingand
Damping
OV
ThermocoupleormVInput
A ,..------'----,..........--t Ranging
andFiltering
165 k165 k
165 k4.7 k165 k
Fig.12.IS (a) Ranging circuit (Millivolt and thermocouple inputs)
O/p(-5 V)
SetSpan
- 6.2 V .---'- ----'- --L- -'
Rs
+
RV1Set Zero
OVOV.-.----------------.-----------.----.------------.--_.
396 Electronic Instrumentation
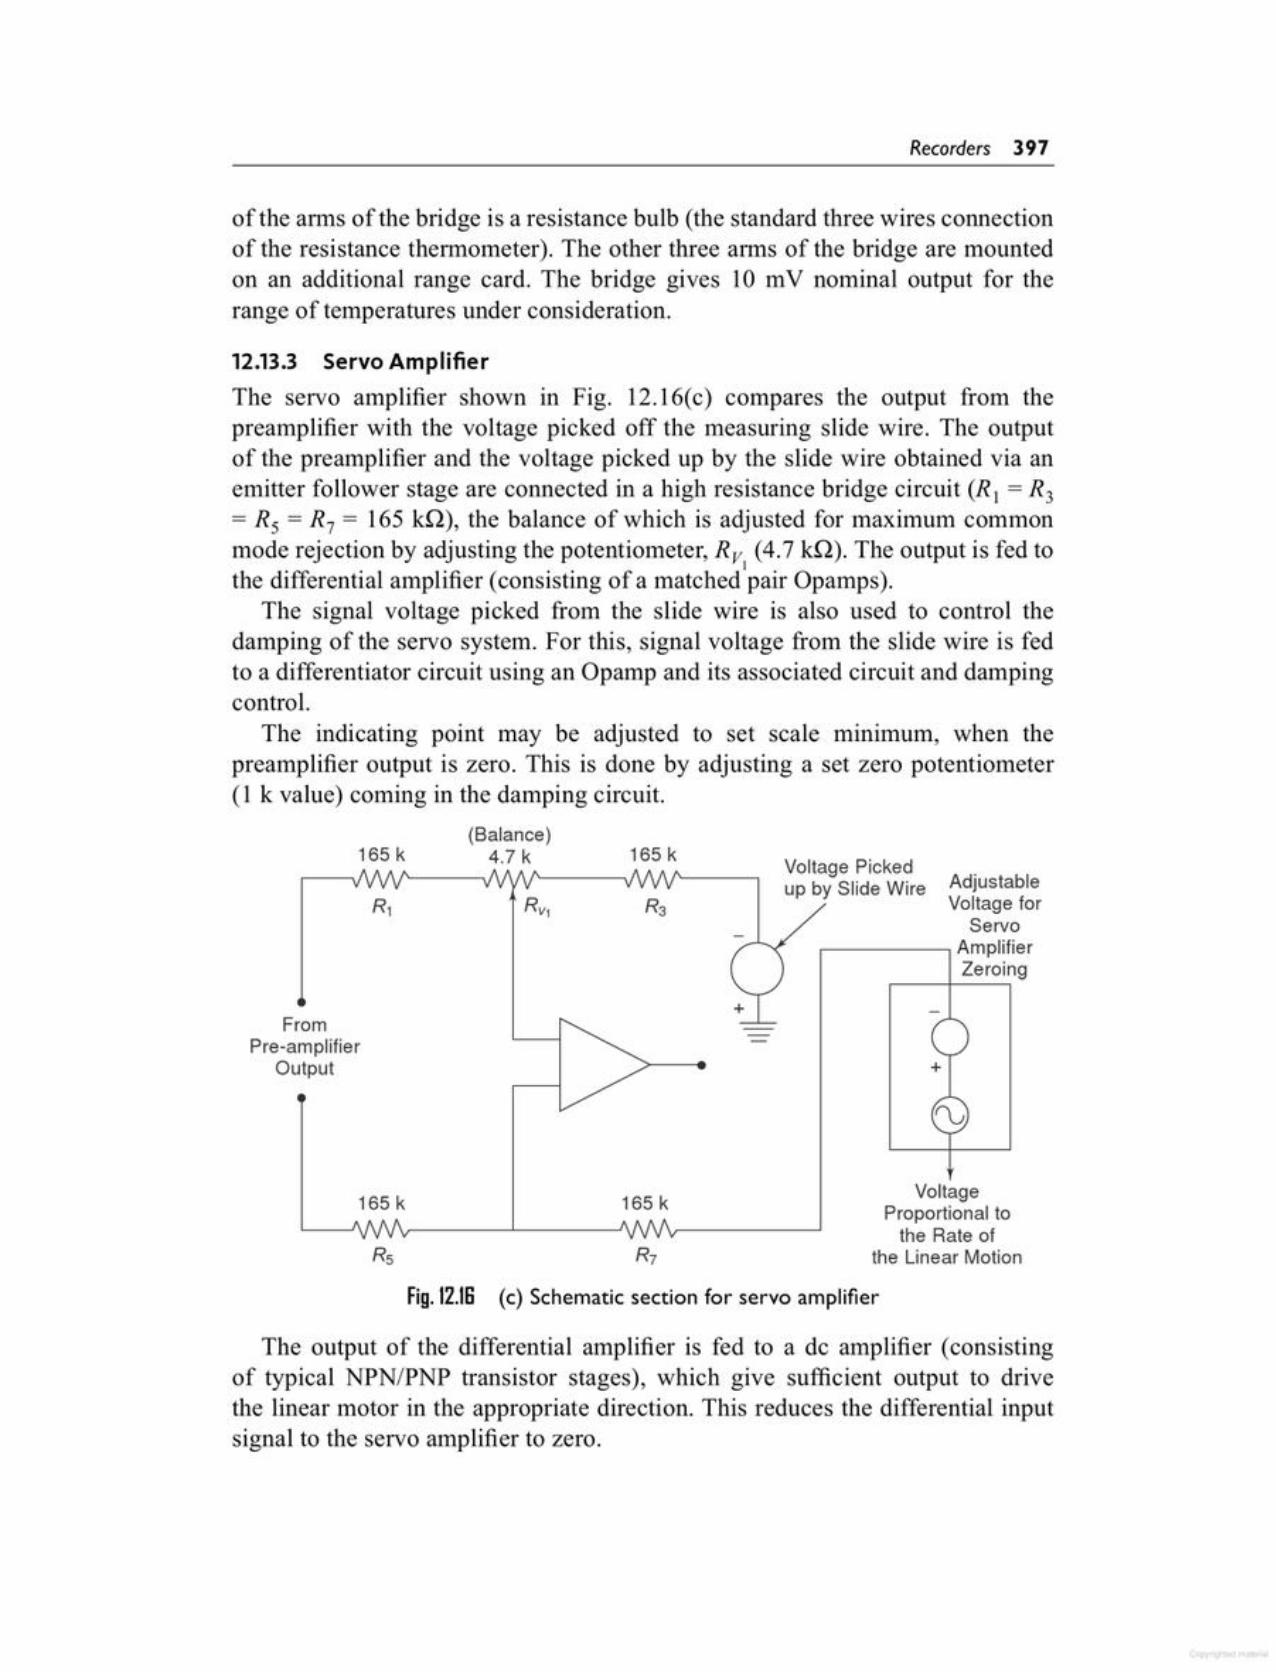
The output of the differential amplifier is fed to a de amplifier (consistingof typical NPN/PNP transistor stages), which give sufficient output to drivethe linear motor in the appropriate direction. This reduces the differential inputsignal to the servo amplifier to zero.
Fig.12.1S (c) Schematic section for servo amplifier
165 k165 k VoltageProportional tothe Rate of
the Linear MotionRs
AdjustableVoltage for
Servo,------, Amplifier
Zeroing
FromPre-amplifier
Output
Voltage Pickedup by Slide Wire
165 k165 k
12.13.3 Servo AmplifierThe servo amplifier shown in Fig. 12.16(c) compares the output from thepreamplifier with the voltage picked off the measuring slide wire. The outputof the preamplifier and the voltage picked up by the slide wire obtained via anemitter follower stage are connected in a high resistance bridge circuit (Rt = R3= Rs = R7 = 165 kfz), the balance of which is adjusted for maximum commonmode rejection by adjusting the potentiometer, Rv (4.7 kQ). The output is fed to
Ithe differential amplifier (consisting of a matched pair Opamps).
The signal voltage picked from the slide wire is also used to control thedamping of the servo system. For this, signal voltage from the slide wire is fedto a differentiator circuit using an Opamp and its associated circuit and dampingcontrol.
The indicating point may be adjusted to set scale minimum, when thepreamplifier output is zero. This is done by adjusting a set zero potentiometer(1 k value) coming in the damping circuit.
(Balance)4.7 k
of the arms of the bridge is a resistance bulb (the standard three wires connectionof the resistance thermometer). The other three alms of the bridge are mountedon an additional range card. The bridge gives 10m V nominal output for therange of temperatures under consideration.
Recorders 397

12.13.5 Multiple Recorders (6 Point Recorders)The controller consists of a high gain opamp in comparator configuration, withone input from the pre-amplifier and another from the set point potentiometer.The output of the comparator is connected to the Schmitt trigger via both high andlow control microswitches, operated by control cams, as shown in Fig. 12.17.
The Schmitt trigger circuit maintains the relay state after the input isdisconnected, i.e. while the signal selector switches scan the other signal input.The control microswitch ensures that the relay does not change state duringsignal changeover, while the pre-amplifier input is open-circuit. Once the relaygets energised, it remains in that state via its own (normally open) contacts andthrough the Reset button.
12.13.4 Multipoint VariationInmultipoint recorders, each signal to be measured is connected in turn to theranging circuit input terminals by means of a rotating selector switch, which isdriven from a synchronous motor having a speed of 10 rpm via an intermittentmotor. Each signal is sampled for a period of 3 or 6 seconds, depending on theswitch motor fitted.
A second synchronous motor (10 rpm - 24 V ac) is mounted and fitted withcams and microswitches (Fig. 12.15).
The cam at the extreme end actuates the pen lifting (and dotting) bar andinitiates the pen dotting. As the stylus lifts off the paper, a pawl and ratchetsystem in the pen head rotates the stylus and ink well to the next point.
A synchronising microswitch, mounted under the pen head, is operated bya pip on the stylus shaft. The contacts are open while the pen stylus is at initialpoint 1.
Fitted to the shaft of the dotting motor is a second cam, which operates asecond microswitch in the synchronising circuit. The contact switches are openfor a period of 0.3 - 0.4s, once in each revolution of the dotting motor, whichrotates once during the sampling period of each plint, i.e. 6s.
The third synchronising microswitch is operated by the projection on the sideof the plastic intermittent advance gear on the same shaft of the signal switch.The contact of this microswitch closes for a period of 0.5 - 0.6s once in eachrevolution of the signal switch, i.e. once every 72s for a 6s sampling.
When the recorder goes out of synchronisation, if the cams and pen styIus areset correctly, the dotting lnotor will continue operating until the stylus comesaround to the initial point. At this point the pen microswitch opens, as does thedotting microswitch. The dotting motor then stops.
The signal selector switch motor operates continuously, and when themicroswitch operated by this motor closes, the dotting starts again.
(Note: The closing time of the signal selector microswitch is slightly morethan the open time of the dotting motor microswitch, ensuring that the dottingmotor microswitch be closed again before the signal selector switch motormicroswitch opens.)
398 Electronic Instrumentation
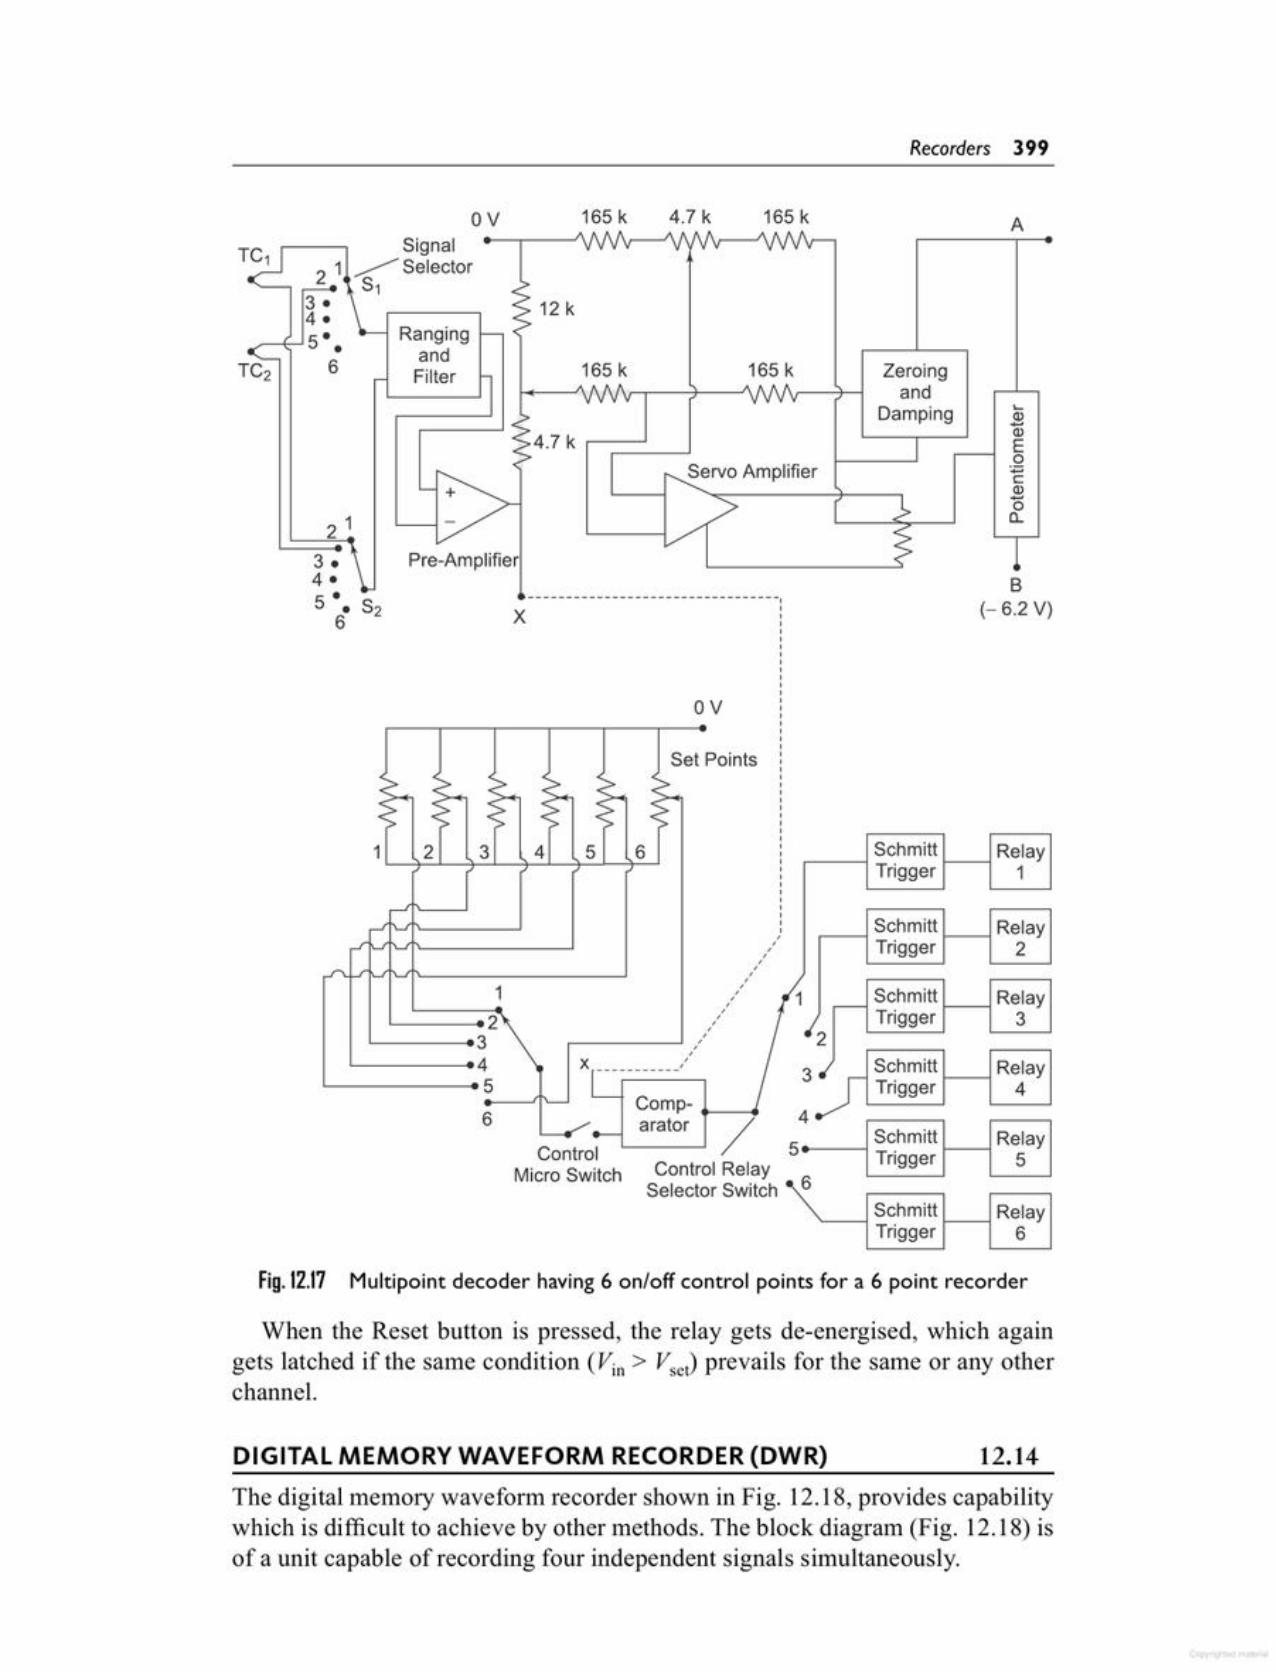
The digital memory waveform recorder shown in Fig. 12.18, provides capabilitywhich is difficult to achieve by other methods. The block diagram (Fig. 12.18) isof a unit capable of recording four independent signals simultaneously.
12.14
When the Reset button is pressed, the relay gets de-energised, which againgets latched if the same condition (Vin > Vset) prevails for the same or any otherchannel.
Fig. 12.17 Multipoint decoder having6 on/off control points for a 6 point recorder
DIGITAL MEMORY WAVEFORM RECORDER(DWR)
Schmitt RelayTrigger 6
ControlMicro Switch
Comp- +-_.arator / 54.. _~ Schmitt 1--1 RelayControl Relay Trigger 5Selector Switch 6
Schmitt RelayTrigger 1---1 43
,,,,,,,,,,,,,,,,,,.-----' /,,,
1--- ...2L...---_3
1---- ....4l...-----_5
6
B(- 6.2 V)
.....Q).....Q)
Eo:;::Jc2oQ_
2
1
Schmitt RelayTrigger 2
- Schmitt RelayTrigger 3
Schmitt Relay,----i Trigger 1---1 1
Set Points
OV
x
1
4.7 k ir====-_j
Zeroingand
Damping
165 k
A165 k4.7 k
165 k
12 k
Pre-Amplifier3.4·5 •• S2
6
2 1
RangingandFilter
Signal2 1 ~ Selector
S1
165 kOV
Recorders 399

The practical implementation of this concept rests on the ready availability,small size and reasonable cost of digital memories and associated digitalhardware.
Consider a signal channel, the analog voltage input signal is digitised by a10 bit AID converter with a resolution of 0.1% (1 part in 1024) and frequencyresponse of 25 kHz.
The total digital memory of 4096 words can be used for a single channel 2048words can be used for each of the two channels an 1024 for each of the fourchannels.
The analog input voltage is sampled at adjustable rates (up to 100000samples per second) and the data points are read into the memory. A maximumof 4096 points are storable in this particular instrument.
(Sampling rate and memory size must be selected to suit duration andwaveform of the physical event being recorded. Some models have samplingrates up to 200 MHz.)
Once the sampled record of the event is captured in the memory, manyuseful manipulations are possible, since the memory can be read without erasingit (non-destructive readout).
By reading the memory out slowly through a digital to analog converter, theoriginal event (which could have been extremly rapid) is reproduced as a slowlychanging voltage, that is easy to record permanently in large size on a slowX-Y plotter.
Fig. 12.18 Digital memory waveform recorder
External Trigger
4
3
II)+-'::Ja.c
2
~Digital Output 10 Bit _j L 12 Bit
D/A D/A
Amplifier Output ControlAttenuator > 10 Bit-- & Offset
-AID
r--
1024 1024 1024 1024->-Attenuator 10 Bitf- Word Word Word Word
& Offset AID Memory Memory Memory Memory
-Attenuator > 1~~it n --& Offset-
Record Control~
-Attenuator > 10 Bit Internal& Offset
-AID
I"-
Trigger Timing andCircuit Mode Logic
1
Analog Output
400 Electronic Instrumentation
Copyr g'1ted mate tal
The following are some of the thousands of applications for recorders inindustry.
1.Temperature Recording Astrip chart recorder may be used toprovide a graphicalrecord of temperature as a function of time. There are two primary methods usedfor recording temperature, the thermocouple method and the resistance method.
The thermocouple method utilises commercially available thermocouples thatcover a wide range of temperature. These serve very well as temperature-sensingelements and are readily compatible with strip-chart recorders.
The circuit shown in Fig. 12.19(a), is a basic circuit used to record thethermocouple voltage.
A thermocouple (discussed in Sec. 3.6) is made by joining two dissimilarmetals. A potential difference, which is proportional to the temperature, existsacross the junctions. This potential difference has an almost linear relationshipwith the temperature and is very repeatable.
'12.15APPLICATIONS OF A STRIP CHART RECORDER
If the memory is read out rapidly and repetitively, an input event which hasa one shot transient becomes a repetitive waveform that now may be observedeasily on an ordinary oscilloscope (not a storage eRO). The digital memory alsomay be readout directly (without going through a digital to analog converter) tosay, a computer where a stored program can manipulate the data in almost anydesired way.
Pre-trigger recording allows the device to record the input signal precedingthe trigger point, a unique and often useful capability. In ordinary triggering,the recording process is started by the rise of the input signal (or some externaltriggering signal) above some preset threshold value. If this threshold is set toolow, random noise will trigger the system; too high a threshold prevents recordingof the initial rise of the desired signal. The digital recorder can be set to recordcontinuously (new data coming into the memory pushes out the old data, oncethe data memory is full), until the trigger signal is received. Then the recordingprocess is stopped, thereby freezing in the memory data received prior to thetrigger signal.
An adjustable trigger delay allows operator control of the stop point, so that thetrigger may occur near the beginning, middle or end of the stored information.
While digital memory waveform recorders are marketed without attachedrecording devices for analog outputs, such packages are available as a digitalmemory oscillographs or oscilloscopes.
The usual 40 Hz frequency response of pen/ink recorders can be extendedto 20 kHz with a plug-in module using waveform digitising principles. Thispri.iciple of waveform digitising makes direct recording easier. Direct writinginstruments of high recording quality are available for recording a very widerange of signals.
Recorders 40 I

Copyr gr,lcd mate ial
.23. What is the approximate maximum
frequency response of a galvanometer type recorder?
24. What are the primary functions of agalvanometer recorder?
25. Differentiate between galvanometertype recorder and potentiometric recorder.
26. Define single point recorder andmultipoint recorder.
27. Define a circular recorder.28. Explain the working principle of a
circular recorder.29. Describe the operation of a circular
chart recorder. List various applications of a circular chart recorder.
30. Define a plotter.31. Differentiate between plotter and rc
corder.32. Describe the operation of a X-Y plot
ter. List the various applications of aXY plotter.
33. Classify different types of recordersused in instrumentation.
34. State the advantage of using a potentiometer circuit.
35. What is a servo system?36. List the various objective and re
quirements of recording data.37. List the various specification of a re
corder.38. List vanous applications of strip
chart recorder.39. State the purpose of error detector in
a recorder.40. How is automatic balance achieved
in a recording instrument?4 J . Give the constructional features of
strip chart recorders. State its variousappl ications.
42. An ADC signal cannot be reproducedif recorded on a direct recording system. Comment.
43. What are the basic components of amagnetic recorder,
1. Differentiate between indicator andrecorder.
2. List various types of recorders.3. Jtate the working principle of a strip
chart recorder.4. List three major types of a strip chart
recorder.5. List various pen mechanisms used
for recording.6. Define chart speed.7. Describe the operation ofa strip chart
recorder.8. Explain the working principle of a
galvanometer type recorder.9. Describe the operation of a galva
nometer type recorder with the helpof a diagram. State the disadvantagesof a galvanometer type recorder.
10. State the limitations of a galvanometer recorder and how is it eliminated.
11. Why does the galvanometer recorderuses a curvilinear chart.
12. State the importance of paper speed.13. Explain the basic principle of null
type recorders.14. State different types of null type de
tectors.15. Describe the operation of null type
recorder with the help of a diagram.16. Compare between galvanometer and
null type recorders.17. Describe with diagram' the working
of a bridge type recorders ..18. Explain with diagram the operation
of a LVDT type recorder.19. State the requirement of a de linear
motor used in LVDT type recorder.20. List three functions that a recorder
may simultaneously serve in industrial applications.
21. List minimum five specifications thatshould be considered while selectinga recording instrument.
22. Describe. three applications for recording instruments.
Review Duestions I--------------------------------------------,~---------------
Recorders 403
(c) square chart(d) circular chart
7. A circular chart uses principle of(a) electrostatic(b) mechanical and link levers(c) galvanometer(d) self-balancing potentiometer
8. A X- Y recorder uses the principle of(a) galvanometer(b) mechanical levers(c) electrostatic(d) self-balancing potentiometer
9. AnX-Yplotter,plots(a) one variable with respect to time(b) an emf against a physical quantity(c) one variable against another vari-
able10. An X-Yplotter uses
(a) a single pen(b) a single pen/arm mechanism(c) a double pen(d) a double pen/arm mechanism
1. A recorder is an instrument used for(a) recording (b) indicating(c) display (d) measurement
2. A strip chart recorder uses(a) a long roll of paper(b) a circular paper(c) a stationary paper
3. A galvanometer type recorder uses(a) taut band(b) PMMC movement(c) moving iron type
4. A null type recorder uses(a) amplifier (b) inductor(c) capacitor (d) potentiometer
5. A galvanometer recorder has(a) very high input impedance(b) high input impedance(c) low input impedance(d) very low input impedance
6. A circular recorder uses(a) rectilinear chart(b) curvilinear chart
Multiple Choice Duestions I---~-~------------------------
52. Explain NRZ method of recording.53. State the advantages and disadvan
tages of digital recording.54. List the feature provided by a digital
X- Y plotter.55. Describe the operation of a digital
memory waveform recorder.56. Explain how transients can be
recorded using digital waveformrecorders.
57. Explain the concept of Pre-triggeringas used in digital waveform recorders.
58. Explain A to D converter and D to Aconverter.
59. Explain the working principle of adigital X-Y plotter.
60. Explain the working principle of adigital recorder
61. Describe the operation of a digitalrecorder.
44. Explain with diagram the operationof a magnetic recorder.
45. State the advantages of direct recordmg.
46. Explain with diagram the working ofan FM recording system. State theadvantages and disadvantages ofFMrecording.
47. Describe with the help of a blockdiagram the operation of an X- Y recorder. List the applications of anX- Y recorder.
48. Differentiate between strip chart andX-Y recorders.
49. Differentiate between circular chartand X- Y recorder.
50. Explain the working principle of adigital memory waveform recorder.
51. List the various mode of operation ofa digital recorder.
404 Electronic Instrumentation
Copyr g"lted mat ial
5. A.K. Sawhney, Electrical and Electrical Measurements, Khanna Publishers.
6. Larry D. Jones and A. Foster Chin,Electronic Instruments and Measurements, John Wiley & Sons, 1987.
7. Oliver Cage, Electronic Measurements and Instrumentation, McGrawHill, 1975.
8. E.O. Doebelin, Measurement Systems: Applications and Design, 4thedition, McGraw-Hill, 1990.
1. Austin E. Fribance, Industrial Instrumentation Fundamentals, 6thEdition, Tata McGraw-Hill, J 984.
2. Douglas M. Considine, Process Instruments and Control Handbook.
3. Jones, instrument Technology, Vol.4, Instrumentation Systems, B.E.Notlingl, Butterworth, 1987.
4. R.K. Jain, Mechanical and industrialMeasurements, Khanna Publishers,1983.
_F_UM__he_r_R_ea_di_ng~ ~~
3. The chart speed of a recording instrument is 10 mm/s. If the time base ofthe recorded signal is 20 mm, whatis the frequency of the recorded signal?
4. The chart speed of a recording instrument is 25 mmls. If the time base ofthe recorded signal is 10 mm, whatis the frequency of the recorded signal?
1. The frequency of a signal to be recorded with a strip chart recorderis 15 Hz. What chart speed must beused to record one complete cycle ona 5 mm of recording paper?
2. If the frequency of a signal to berecorded with a strip chart recorderis 30 Hz, what chart speed must beused to record one complete cycle on5 mm of recording paper?
12. Pre-triggering is used in digital memory waveform recorder to record(a) input signal preceding the trigger
point(b) to trigger the memory(c) to start the operation
Practice Problems
II. A digital memory waveform recorderrecords(a) slow variation(b) transient(c) high frequency(d) very low variation
Recorders 405