Measurement of the Secondary Radionuclides 10 Be, 26 Al, 36 Cl, 54 Mn, and 14 C and Implications for...
25
THE ASTROPHYSICAL JOURNAL, 563:768È792, 2001 December 20 ( 2001. The American Astronomical Society. All rights reserved. Printed in U.S.A. MEASUREMENT OF THE SECONDARY RADIONUCLIDES 10Be, 26Al, 36Cl, 54Mn, AND 14C AND IMPLICATIONS FOR THE GALACTIC COSMIC-RAY AGE N. E. YANASAK1 AND M. E. WIEDENBECK Jet Propulsion Laboratory, California Institute of Technology, Pasadena, CA 91109 R. A. MEWALDT, A. J. DAVIS, A. C. CUMMINGS, J. S. GEORGE, R. A. LESKE, AND E. C. STONE California Institute of Technology, Pasadena, CA 91125 E. R. CHRISTIAN AND T. T. VON ROSENVINGE NASA Goddard Space Flight Center, Greenbelt, MD 20771 AND W. R. BINNS, P. L. HINK, AND M. H. ISRAEL Washington University, St. Louis, MO 63130 Received 2000 October 6 ; accepted 2001 August 2 ABSTRACT We report on abundance measurements of 10Be, 26Al, 36Cl, and 54Mn in the Galactic cosmic rays (GCRs) using the Cosmic-Ray Isotope Spectrometer (CRIS) instrument aboard the Advanced Composi- tion Explorer spacecraft at energies from D70 to D400 MeV nucleon~1. We also report an upper limit on the abundance of GCR 14C. The high statistical signiÐcance of these measurements allows the energy dependence of their relative abundances to be studied. A steady-state, leaky-box propagation model, incorporating observations of the local interstellar medium (ISM) composition and density and recent partial fragmentation cross section measurements, is used to interpret these abundances. Using this model, the individual galactic conÐnement times derived using data for each species are consistent with a unique conÐnement time value of Myr. The CRIS abundance measurements are consis- q esc \ 15.0 ^ 1.6 tent with propagation through an average ISM hydrogen number density H atoms n H \ 0.34 ^ 0.04 cm~3. The surviving fractions, f, for each radioactive species have been calculated. From predictions of the di†usion models of Ptuskin & Soutoul, the values of f indicate an interstellar cosmic-ray di†usion coefficient of D \ (3.5 ^ 2.0) ] 1028 cm2 s~1. Subject headings : cosmic rays È Galaxy : general È Galaxy : halo È ISM : abundances 1. INTRODUCTION The composition of the galactic cosmic rays (GCRs) observed in the vicinity of Earth results from a source com- position that has been transformed by physical processes during transport. Consequently, the study of GCR com- position concerns the details of cosmic-ray transport as well as the nature of the GCR source. During transport, cosmic- ray particles di†use through the Galaxy, traveling through regions of varied matter density, magnetic Ðeld strength, and fractional ionization of the interstellar medium (ISM) and ultimately escaping the Galaxy or becoming therma- lized in the ISM. They may undergo spallation in the ISM, transforming a parent nucleus into lighter, daughter nuclei. Radioactive species with half-lives smaller than the time of GCR conÐnement in the Galaxy may experience decay in Ñight. The steady-state abundances of these species will depend on the amount injected by the source, if any, and the balance between the production rate from spallation in the ISM and loss rates from Galactic escape, decay, or nuclear interactions during transport. Secondary GCRs are those produced by fragmentation during transport of the primary GCRs, which are present at the source, and fragmentation of other secondaries. Abun- dances of the stable secondaries indicate the average amount of ISM material traversed during GCR propaga- tion before escape. Because secondary radioactive cosmic- ray species will be created and decay only during transport, 1 Now at Human Neuroimaging Facility, Department of Psychology, University of Georgia, Athens, GA 30602 ; yanasak=arches.uga.edu. their steady-state abundances will be sensitive to the con- Ðnement time if their mean lifetimes are comparable to or shorter in duration than this time (see Simpson & Garcia- Munoz 1988 and references therein). Species with signiÐ- cantly longer lifetimes than the GCR conÐnement time will behave as if they were stable species ; those with lifetimes that are signiÐcantly shorter will be sensitive to the conÐne- ment time, but their GCR abundances will be small. Using experimental measurements of secondary-to-primary ratios such as B/C to determine the average amount of ISM material traversed, the cosmic-ray conÐnement time can be derived using the abundance of long-lived b-decay second- ary radionuclides (for a recent review of GCR secondary radionuclide ““ clock ÏÏ studies, see Ptuskin & Soutoul 1998b). Because the fractional abundance that survives transport for these species depends on the loss rate by frag- mentation in the ISM, the ISM density in a region traversed by a radioactive species during its lifetime can also be studied. The abundance of the clock isotope 10Be in the cosmic rays was Ðrst deduced from satellite measurements aboard the Interplanetary Monitoring Platform (IMP) 7 and 8 spacecraft (Garcia-Munoz, Mason, & Simpson 1975) about 25 years ago, contemporaneously with pioneering attempts using balloon-borne instruments (e.g., Webber et al. 1977 ; Hagen, Fisher, & Ormes 1977 ; Buffington, Orth, & Mast 1978). The ISEE 3 spacecraft was the Ðrst cosmic-ray experiment to achieve separation of the 10Be abundance peak in a histogram of measured particle masses (Wiedenbeck & Greiner 1980). These earlier measurements were interpreted using a simple ““ leaky-box ÏÏ model (LBM), 768
Transcript of Measurement of the Secondary Radionuclides 10 Be, 26 Al, 36 Cl, 54 Mn, and 14 C and Implications for...

THE ASTROPHYSICAL JOURNAL, 563 :768È792, 2001 December 20( 2001. The American Astronomical Society. All rights reserved. Printed in U.S.A.
MEASUREMENT OF THE SECONDARY RADIONUCLIDES 10Be, 26Al, 36Cl, 54Mn, AND 14C ANDIMPLICATIONS FOR THE GALACTIC COSMIC-RAY AGE
N. E. YANASAK1 AND M. E. WIEDENBECK
Jet Propulsion Laboratory, California Institute of Technology, Pasadena, CA 91109
R. A. MEWALDT, A. J. DAVIS, A. C. CUMMINGS, J. S. GEORGE, R. A. LESKE, AND E. C. STONE
California Institute of Technology, Pasadena, CA 91125
E. R. CHRISTIAN AND T. T. VON ROSENVINGE
NASA Goddard Space Flight Center, Greenbelt, MD 20771
AND
W. R. BINNS, P. L. HINK, AND M. H. ISRAEL
Washington University, St. Louis, MO 63130Received 2000 October 6 ; accepted 2001 August 2
ABSTRACTWe report on abundance measurements of 10Be, 26Al, 36Cl, and 54Mn in the Galactic cosmic rays
(GCRs) using the Cosmic-Ray Isotope Spectrometer (CRIS) instrument aboard the Advanced Composi-tion Explorer spacecraft at energies from D70 to D400 MeV nucleon~1. We also report an upper limiton the abundance of GCR 14C. The high statistical signiÐcance of these measurements allows the energydependence of their relative abundances to be studied. A steady-state, leaky-box propagation model,incorporating observations of the local interstellar medium (ISM) composition and density and recentpartial fragmentation cross section measurements, is used to interpret these abundances. Using thismodel, the individual galactic conÐnement times derived using data for each species are consistent with aunique conÐnement time value of Myr. The CRIS abundance measurements are consis-qesc \ 15.0^ 1.6tent with propagation through an average ISM hydrogen number density H atomsnH \ 0.34 ^ 0.04cm~3. The surviving fractions, f, for each radioactive species have been calculated. From predictions ofthe di†usion models of Ptuskin & Soutoul, the values of f indicate an interstellar cosmic-ray di†usioncoefficient of D\ (3.5^ 2.0)] 1028 cm2 s~1.Subject headings : cosmic rays È Galaxy : general È Galaxy : halo È ISM: abundances
1. INTRODUCTION
The composition of the galactic cosmic rays (GCRs)observed in the vicinity of Earth results from a source com-position that has been transformed by physical processesduring transport. Consequently, the study of GCR com-position concerns the details of cosmic-ray transport as wellas the nature of the GCR source. During transport, cosmic-ray particles di†use through the Galaxy, traveling throughregions of varied matter density, magnetic Ðeld strength,and fractional ionization of the interstellar medium (ISM)and ultimately escaping the Galaxy or becoming therma-lized in the ISM. They may undergo spallation in the ISM,transforming a parent nucleus into lighter, daughter nuclei.Radioactive species with half-lives smaller than the time ofGCR conÐnement in the Galaxy may experience decay inÑight. The steady-state abundances of these species willdepend on the amount injected by the source, if any, and thebalance between the production rate from spallation in theISM and loss rates from Galactic escape, decay, or nuclearinteractions during transport.
Secondary GCRs are those produced by fragmentationduring transport of the primary GCRs, which are present atthe source, and fragmentation of other secondaries. Abun-dances of the stable secondaries indicate the averageamount of ISM material traversed during GCR propaga-tion before escape. Because secondary radioactive cosmic-ray species will be created and decay only during transport,
1 Now at Human Neuroimaging Facility, Department of Psychology,University of Georgia, Athens, GA 30602 ; yanasak=arches.uga.edu.
their steady-state abundances will be sensitive to the con-Ðnement time if their mean lifetimes are comparable to orshorter in duration than this time (see Simpson & Garcia-Munoz 1988 and references therein). Species with signiÐ-cantly longer lifetimes than the GCR conÐnement time willbehave as if they were stable species ; those with lifetimesthat are signiÐcantly shorter will be sensitive to the conÐne-ment time, but their GCR abundances will be small. Usingexperimental measurements of secondary-to-primary ratiossuch as B/C to determine the average amount of ISMmaterial traversed, the cosmic-ray conÐnement time can bederived using the abundance of long-lived b-decay second-ary radionuclides (for a recent review of GCR secondaryradionuclide ““ clock ÏÏ studies, see Ptuskin & Soutoul1998b). Because the fractional abundance that survivestransport for these species depends on the loss rate by frag-mentation in the ISM, the ISM density in a region traversedby a radioactive species during its lifetime can also bestudied.
The abundance of the clock isotope 10Be in the cosmicrays was Ðrst deduced from satellite measurements aboardthe Interplanetary Monitoring Platform (IMP) 7 and 8spacecraft (Garcia-Munoz, Mason, & Simpson 1975) about25 years ago, contemporaneously with pioneering attemptsusing balloon-borne instruments (e.g., Webber et al. 1977 ;Hagen, Fisher, & Ormes 1977 ; Buffington, Orth, & Mast1978). The ISEE 3 spacecraft was the Ðrst cosmic-rayexperiment to achieve separation of the 10Be abundancepeak in a histogram of measured particle masses(Wiedenbeck & Greiner 1980). These earlier measurementswere interpreted using a simple ““ leaky-box ÏÏ model (LBM),
768

MEASUREMENT OF SECONDARY RADIONUCLIDES 769
which replaces the spatial di†usion and loss of particles atthe boundary of the Galaxy by a phenomenological meanpath length through the ISM for escape, which has nospatial dependence. This mean path length, determinedjesc,from secondary-to-primary ratios as stated before, is relatedto the mean ISM density traversed by the GCRs and themean conÐnement time in this model by the expression
Here, bc is the GCR velocity in theqesc \ jesc/MnISMbc.ISM, is the conÐnement time, is the mean ISMqesc nISMnumber density, and M is the mean atomic weight of theISM material. In practice, some groups choose to report themean ISM hydrogen number density instead of the meannHISM number density, which can be translated into a meanISM density by knowing the H/He ratio used by eachgroup. In the context of the leaky-box model, the meanproperties of the ISM referred to are averaged within theGCR propagation volume around the Earth, not necessar-ily within the whole Galaxy. The balloon measurementssuggested a mean ISM number density ranging fromD0.23È0.70 atoms cm~3, while the abundances reportedfrom the IMP 7 and 8 and ISEE 3 spacecraft were moreconsistent with a narrower range of densities at the lowerend of the balloon measurement range nISMD 0.2È0.33atoms cm~3 and a conÐnement time of D8È20 Myr. Theseobservations led to the initial conclusion that the meandensity in the conÐnement volume is less than the meandensity in the Galactic disk, which was taken to be D1atom cm~3 (e.g., Garcia-Munoz et al. 1975).
The conÐnement time and mean ISM density can bedetermined using radioactive species other than 10Be aswell. Secondary radionuclides observed at Earth originatewithin a volume surrounding the solar system having aradius proportional to the di†usion length, l, during theirmean lifetime This length is given asqdecay.
l\ (Dcqdecay)1@2 , (1)
where D is the interstellar di†usion coefficient and c is theLorentz factor. Therefore, one can potentially probe theaverage ISM density within volumes of di†erent radiiaround the solar system using clock species with di†erenthalf-lives. One can also investigate whether di†erent radio-nuclides have the same conÐnement volume, which wouldbe expected if the primary parents came from the samespatial source distribution. Table 1 shows a list of specieswith half-lives suitable for this study. In addition toimproved abundance measurements of 10Be, measurementsof 26Al, 36Cl, and 54Mn have been made by experiments onthe ISEE 3 (Wiedenbeck 1983) and Voyager spacecraft(Lukasiak, McDonald, & Webber 1994b, 1997a) and withgreatly improved resolution by the experiment on theUlysses spacecraft (Connell 1998 ; Connell, DuVernois, &Simpson 1998 ; Simpson & Connell 1998 ; DuVernois 1997).Interpretation of these abundances using an LBM reveals asimilar propagation history among all species, with themean ISM number density atoms cm~3nISM^ 0.19È0.52and Myr.qesc ^ 9È27
The absence of gross di†erences in the ISM densities andconÐnement times inferred from the di†erent radionuclidesis not necessarily surprising, considering that the range inhalf-lives is limited. Secondary species with shorter decaylifetimes such as 14C, with a half-life D300 times shorterthan the half-life of 10Be, can be used to probe the very localISM density. One can sample a larger neighborhood in theGalaxy by measuring abundances for the secondary radio-
TABLE 1
DECAY HALF-LIVES OF SECONDARY RADIONUCLIDES
Clock Isotope Decay Mode Mode Half-Life Reference
10Be . . . . . . . . . . . b~ 1.51] 106 yr 114C . . . . . . . . . . . . b~ 5700 yr 226Ala . . . . . . . . . . b` 8.73] 105 yr 3
e-capture 8.45 ] 106 yr 336Cla . . . . . . . . . . b~ 3.07] 105 yr 2
e-capture 1.59 ] 107 yr 254Mnb . . . . . . . . b~ (6.3^ 1.7)] 105 yr 4
b~ (9.3^ 3.9)] 105 yr 5e-capture 312 days 6
a Although these species decay by e-capture as well as by b-decay, thee-capture mode is negligible for these species (see ° 4).
b The species 54Mn also decays by b`. However, the half-life for thisdecay is much longer (D500 times) than the b~-mode half-life, so theb`-decay mode is negligible.
REFERENCES.È(1) Ajzenberg-Selove 1988. (2) Be, Coursol, & Duche-min 1999. (3) Endt 1990. (4) Wuosmaa et al. 1998. (5) Zaerpoor et al. 1997,1999. (6) Firestone 1996. Data from (1), (2), and (3) were extracted usingthe NNDC On-Line Data Service from the ENSDF database, usingrevisions 1999 February, 2000 July, and 2000 January, respectively.
active species at higher energies, where relativistic time dila-tion increases the decay lifetime. Preliminary attempts tomeasure 10Be at higher energies with balloon instrumentsgenerally lacked the statistics and mass resolution to showsigniÐcant di†erences from satellite measurements (e.g.,Buffington et al. 1978). Measurements from the SMILIexperiment (Ahlen et al. 2000) have led to ISM density pre-dictions that are unexpectedly higher atom cm~3) than(Z1those from low-energy data, although the statistics for thisexperiment are low (nine 10Be events). A more recent, directmeasurement of the 10Be isotopic abundance was made bythe balloon-borne ISOMAX experiment (Streitmatter et al.1993) during its 1998 Ñight, and a preliminary analysis ofthe data (ED 0.4È1 GeV nucleon~1) indicates an ISMdensity consistent with lower energy satellite data (Geier2000), albeit with a large uncertainty [p(10Be/9Be)D 40%].In addition, attempts have been made to investigate thebehavior of radionuclides using measurements of elementalratios that involve the abundances of the radioactive parentand its daughter product (e.g., Webber et al. 1998a), but thistype of analysis is problematic. Because isotopic species arenot identiÐed using this method, one cannot uniquelydemonstrate that a measured change in the relative elemen-tal abundances with increasing energy results from anincrease in the radioactive isotope abundance or from adeviation in the measured abundances of the other stableisotopes from theoretical predictions. Energy dependencescould also arise from uncertainties in transport model inputparameters (e.g., fragmentation cross sections) or from newphysical phenomena.
In this paper, we report new measurements of 10Be, 26Al,36Cl, and 54Mn at energies from D70 to D400 MeVnucleon~1 made using the Cosmic Ray Isotope Spectrom-eter (CRIS) instrument aboard the Advanced CompositionExplorer (ACE) spacecraft (Stone et al. 1998a). We comparethe isotopic abundances measured using ACE/CRIS toresults from previous experiments, and we report an upperlimit on the abundance of the rare GCR isotope 14C. Fromthe abundances of stable secondaries measured using CRIS,we determine the mean path length responsible for the pro-duction of the clock isotopes. We compare our clock abun-
770 YANASAK ET AL. Vol. 563
dance measurements to predictions from a simple LBMmodel to Ðnd values for the conÐnement time and meanISM density indicated by each species, in an attempt toprovide a consistent picture of GCR propagation for all thesecondary radionuclides. Taking advantage of the high sta-tistical signiÐcance of the CRIS data set, we present mea-surements for the abundances of these species at multipleenergies for comparison with the expected energy depen-dence from this model.
Because leaky-box models assume a homogeneous ISMmatter distribution, observable di†erences arise in the pre-dictions between the LBM and more realistic models ofGCR propagation (e.g., Ptuskin & Soutoul 1998a ; Strong &Moskalenko 1998) for the di†erent clock isotopes if signiÐ-cant inhomogeneities in the matter distribution exist. Inaddition, the models that may incorporate di†usion, con-vection, and reacceleration of the GCRs as they propagatethrough an inhomogeneous Galactic matter distributionmake predictions using the GCR clock surviving fractionfor quantities that have more direct astrophysical signiÐ-cance such as the scale height of the Galactic halo or theGalactic di†usion coefficient. We discuss implications ofour data for these models of GCR transport in addition tothe LBM. Finally, we consider uncertainties in modelingGCR transport in general (see Appendix A) and discusstheir e†ect on the interpretation of our measurements andof previously reported results.
2. OBSERVATIONS
The ACE/CRIS instrument (Stone et al. 1998a), used toobtain the data reported here, measures the GCR elementaland isotopic composition by using multiple measurementsof dE/dx versus total energy (Goulding & Harvey 1975).CRIS consists of four stacks of large-area Li-drifted Sidetectors 10 cm in diameter with nominal thicknesses of 3mm that measure energy loss of the particles (total instru-ment geometry factor D250 cm2 sr). Trajectories are deter-mined using a scintillating optical Ðber trajectoryhodoscope (SOFT) above the Si stacks. The SOFT systemconsists of three pairs of x-y planes, with an active dimen-sion of 26 cm ] 26 cm, constructed out of 200 ] 200 kmsquare cross section scintillating Ðbers and an additionalpair of Ðber planes at the top of the instrument that serve asa trigger. Light output from the Ðbers is routed to a CCDcamera.
The period of observation for these data extends from1997 August 27 to 1999 April 9 for 10Be, 26Al, 36Cl, and54Mn. The period for 14C is slightly longer to improve thestatistics for this very rare isotope (1997 August 27 to 1999July 8). Days of signiÐcant solar energetic particle intensitywere excluded from these periods as well as days duringwhich the spacecraft was inserted into its orbit. The remain-ing period of active data collection is 401 days for 10Be,26Al, 36Cl, and 54Mn, and 442 days for 14C.
Events were selected for this study to avoid contami-nation from the small number of particles with large uncer-tainties in their identiÐcation, which result from sourcessuch as observation of multiple particles within the resolv-ing time of the electronics. After event selection, correctionsin the abundances were made to account for selection cri-teria that could a†ect the relative isotopic abundances.Nuclei selected for this study were required to enter into thedetector through the SOFT hodoscope at the top of theinstrument. Those penetrating less than 0.6 cm from any
edge of the trigger plane in SOFT were eliminated. Particletrajectories for which the three coordinate pairs from thehodoscope did not lie within 5 standard deviations of astraight line (the measured standard deviation forSOFTD 100 km) were rejected.
In addition to trajectory uncertainties introduced by thehodoscope, uncertainties in the response of the Si detectorsto particle events can occasionally lead to misidentiÐcation.The CRIS Si detectors have surface ““ dead layers,ÏÏ whichare not negligible (D2% of the nominal detector thickness),within which deposited particle energy will not fully con-tribute to the measured pulse height. Nuclei stopping closeto the dead layers were rejected from this study to avoidmisidentiÐcation from the incomplete registration of thedeposited energy. Background events in which the incidentparticle fragmented in the Si stack or exited through thesides or in which multiple particles traversed the detectorwithin the time resolution of CRIS were eliminated bydemanding consistency among multiple charge and massdeterminations. Using di†erent detector combinations tomeasure the residual energy of a stopping particle, E@, nearthe end of range and the upstream energy loss, *E (the““*E[ E@ technique,ÏÏ described in Stone et al. 1998b), threecharge determinations were obtained for each particleevent. Given two di†erent charge determinations Z1 andZ2, a charge consistency parameter (Z2 [ Z1)/Z1 can bedeÐned, as shown in Figure 1. From the three charge deter-minations mentioned above, two di†erent charge consis-tency parameters were deÐned, and the mean and standarddeviation for the distribution of each charge consistencyparameter were determined, using the CRIS data set beforeevent selection. Events di†ering by more than 5 standarddeviations from the mean of each distribution were rejected.
Between two and seven mass determinations wereobtained in a similar manner to the charge determinationsusing an individual detector to measure *E in each case,with the number of determinations depending on thenumber of Si detectors penetrated before stopping of theparticle. Given a particular detector combination, the meanand standard deviations for mass distributions of a particu-lar charge species were determined as well. The mass foreach event was calculated from a s2 Ðt of the mass determi-nations from each detector combination using the corre-sponding means and standard deviations. Particles having as2 value lying above a cuto† indicating a 94% statisticalprobability for an event to have a s2 of equal or lower valuewere eliminated.
A full Monte Carlo simulation of the instrument wasperformed as well as an analytical treatment of the instru-ment charge and mass resolution during the instrumentdesign. Mass resolution in the CRIS instrument is limitedby the e†ects of Landau Ñuctuations in energy deposited inthe Si telescopes and multiple Coulomb scattering. Asshown in Stone et al. (1998a), the mass resolution is depen-dent on the charge of the cosmic-ray species. The massresolution also degrades with an increase in the ““ zenith ÏÏangle theta, deÐned as the incidence angle of the particletrajectory with respect to a normal to the detector surface(Stone et al. 1998a). For example, the mass resolution for56Fe is amu at h ¹ 10¡, which increases top
M^ 0.23 p
M^
0.32 amu at h ¹ 40¡. For h ¹ 30¡, the mass resolution variesfrom to 0.27 amu in the charge range Z\ 6È26.p
M^ 0.13
This resolution is consistent with expectations from theinstrument simulation (Stone et al. 1998a). For this study, a

No. 2, 2001 MEASUREMENT OF SECONDARY RADIONUCLIDES 771
FIG. 1.ÈCharge consistency measure vs. charge. Each determination of charge uses a di†erent combination of detectors to measure the residual energy ofa stopping particle, E@, near the end of range and the upstream energy loss, *E. In this example, Z1 was calculated using the energy deposited in the Sidetector that stopped the particle for E@ and the energy deposited in all previous upstream detectors as *E. The charge Z2 was determined using the energydeposited in the Si detector at the top of the stack as *E and all subsequent downstream detectors as E@. The dashed lines on the plot correspond to 5standard deviations from the mean value of (Z2 [ Z1)/Z1 for a particular charge. A subset (D18,000) of all events in the CRIS data are plotted.
cuto† zenith angle was chosen for each species to minimizethe overlap between peaks in the mass distributions andmaximize the statistical sample, and these angles are shownin Table 2.
Mass histograms for the GCR elements Be, Al, Cl, andMn containing secondary radionuclides are shown inFigure 2, and the C histogram is shown in Figure 3. Thestatistics of the CRIS data set also allow measurement ofthe isotopic abundances for the clock isotopes at multipleenergies ; the mass histograms for several energy intervalsare shown in Figure 4. After the selection of events with anunambiguous mass identiÐcation using criteria mentioned
above, the peak shapes are approximately Gaussian. Theisotopes of Be, Al, Cl, and Mn have clearly resolved peaks inthe histograms and, with the exception of Mn, there is verylittle overlap between adjacent mass peaks. The majorcarbon isotopes, 12C and 13C, are also well-resolved,demonstrating the potential for good resolution of 14C fromshoulders in the 13C mass peak if 14C were present.
With the exception of Be and C, the isotopic abundanceswere determined using the maximum-likelihood method toÐt Gaussian peak shapes to the histograms, and these Ðtsare shown overlying the histograms. Because of the excel-lent mass separation for lighter elements, the Be isotopic
TABLE 2
ABUNDANCES OF THE GALACTIC COSMIC-RAY RADIONUCLIDES NEAR EARTH
Energy Typical ISM Energya Maximum Angle rms MassRatio (MeV nucleon~1) (MeV nucleon~1) (deg) (amu) Measurementb
10Be/9Be . . . . . . . 70È145 120È350 40 0.09 0.120^ 0.008E1 : 70È95 0.123^ 0.013E2 : 95È120 0.115^ 0.013E3 : 120È145 0.122^ 0.016SIS :c 20È70 0.147^ 0.036
14C/C . . . . . . . . . . 70È210 120È430 15 0.10 \2.3] 10~4d26Al/27Al . . . . . . 125È300 190È560 40 0.17 0.042^ 0.002
E1 : 125È183 0.042^ 0.003E2 : 183È242 0.043^ 0.004E3 : 242È300 0.037^ 0.004
36Cl/Cl . . . . . . . . . 150È350 210È580 30 0.19 0.061^ 0.007E1 : 150È250 0.056^ 0.010E2 : 250È350 0.063^ 0.011
54Mn/Mn . . . . . . 178È400 240È630 30 0.24 0.109^ 0.006E1 : 178È252 0.113^ 0.010E2 : 252È326 0.109^ 0.011E3 : 326È400 0.106^ 0.012
a Approximately 95% of the GCRs observed by CRIS within the energy range shown in the second column have typicalISM energies shown in the third column. The ISM energies were calculated using a model by Fisk 1971, described in ° 3.
b These relative abundances include corrections for di†erences in geometry factors, detection efficiency, and nuclearfragmentation within the instrument. Uncertainties reÑect 1 standard deviation statistical uncertainties only.
c This lowest energy point was measured using the SIS instrument aboard the ACE spacecraft.d Eighty-four percent conÐdence level on the upper limit.

772 YANASAK ET AL. Vol. 563
FIG. 2.ÈMass histograms for Be (SET \ 107 MeV nucleon~1), Al (SET \ 212 MeV nucleon~1), Cl (SET \ 250 MeV nucleon~1), and Mn (SET \ 289MeV nucleon~1). The maximum allowed zenith angles for these data are for Be and Al and for Cl and Mn. The overlying curves for Al,hmax \ 40¡ hmax \ 30¡Cl, and Mn were obtained using maximum-likelihood Ðts, as discussed in the text. A 10] magniÐcation of the Be, Al, and Cl counts scale is shown as a lighthistogram and Ðtted curve. The total number of events in the histograms are 6552 for Be, 10967 for Al, 1196 for Cl, and 2954 for Mn.
abundances were obtained by counting events in each peak.Small corrections to the measured relative abundances(\12% for the Be isotopes, \4% for all others) were madeto take into account isotopic di†erences in fragmentation inthe instrument, SOFT efficiency, and geometry factor for agiven energy bin. The resulting isotopic abundance ratios,after application of these corrections, are shown in Table 2.
After calculating the isotopic abundances using Ðts topeaks in the mass histograms, an adjustment must be madeto account for the small amount of background contribu-tion to the secondary radionuclide abundances. This back-ground is most likely due to two sources : spillover fromadjacent isotopes due to non-Gaussian tails and fragmenta-tion in the material at the top of CRIS. For example, thecharge consistency criteria and multiple mass determi-nations described above will most likely not eliminate aGCR particle that loses a neutron in the D0.442 g cm~2above the Si detectors. Mass histograms for some of themore abundant elements in GCRs show evidence of small
mass peaks for radioactive species that are not present inthe GCRs because of their short half-lives (e.g., 22Na, whichdecays by b`-emission in yr). An estimate of theq1@2\ 2.6overall background contribution was made in the followingmanner. Using elements that are abundant in the GCRssuch as carbon and silicon, mass histograms were gener-ated, and the abundance of the lightest stable GCR isotopein each histogram was determined. Events in the massregion below this peak, which should be only background,were counted if they were within 3 standard deviations of 1amu below the peak. Using this sum of background eventcounts, the amount of background to be subtracted wascalculated as a percentage of the abundance for the lighteststable isotope. A value of this percentage averaged over allof the abundant GCR species was calculated and an uncer-tainty was assigned to bound the range of percentages. Theamount of background subtraction applied to the second-ary radionuclide species was of the adjacent,0.7~0.5`0.7 %heavier peak. This adjustment is negligible for 10Be, but the

No. 2, 2001 MEASUREMENT OF SECONDARY RADIONUCLIDES 773
FIG. 3.ÈLog scale mass histogram for C (SET \ 134 MeV nucleon~1).Maximum allowed zenith angle for these data is The hatchedhmax \ 15¡.region shows the data that fall within 3 standard deviations of the 14Ccentral peak mass located at 14 amu. One standard deviation is 0.10 amu,from a maximum-likelihood Ðt of a Gaussian shape to the 12C peak. Thisdata set contains 41,805 C events.
amount of adjustment to the 26Al/27Al, 36Cl/Cl, and54Mn/Mn ratios was D14%, D3%, and D2%, respectively.The results in Table 2 include these corrections.
A limit on the abundance of 14C was calculated in thefollowing manner. From Ðtting the 12C peak, the standarddeviation of the mass distribution of events was determinedto be p \ 0.10 amu. Events within 3 standard deviations ofthe 14C central peak mass located at 14 amu were countedand included in the 14C abundance. Measuring the abun-dance of GCR 14C is complicated by contamination due toa small amount of 14C produced via fragmentation ofheavier GCR nuclei interacting in the instrument. Most ofthe observed 14C abundance probably resulted from frag-mentation in the upper parts of the instrument or fromspillover from neighboring abundance peaks, so the mea-sured abundance corresponds to an upper limit for theGCR 14C. Estimating the amount of 14C from sources otherthan the natural GCR abundance requires a fairly detailedmodel of detector response to account for the fraction ofinteraction products not eliminated by charge- and mass-consistency cuts. However, we can compare the observedamount of 14C with trace abundances measured with CRISfor short-lived species, which are produced solely by frag-mentation in CRIS or exist because of spillover. Estimatesof species such as 16N and 12B measured with CRIS, withhalf-lives of the order of milliseconds to seconds, indicatethat the majority of the observed 14C is not of Galacticorigin.
Figure 5 shows a comparison between CRIS abundancesfor the secondary radionuclides measured at Earth andthose obtained previously from Ulysses (Connell 1998 ;
Connell et al. 1998 ; DuVernois 1997 ; Simpson & Connell1998), ISEE 3 (Wiedenbeck & Greiner 1980 ; Wiedenbeck1983), Voyager (Lukasiak et al. 1994a, 1997a, 1997b), IMP 7and 8 (Garcia-Munoz, Simpson, & Wefel 1981), andballoon experiments (Webber & Kish 1979 ; Webber 1982).Other experiments that report only upper limits on theabundance for these species are not shown for clarity. Pre-vious abundance measurements were made at di†erentlevels of solar modulation, and these have been adjusted tothe level of modulation appropriate to CRIS for direct com-parison (see ° 3 for details). Because these adjustments relyon modulation levels determined by each experiment, thecomparison is approximate. The largest adjustmentrequired was 25% for the ISEE 3 measurement of 10Be/9Be(Wiedenbeck & Greiner 1980).
The uncertainties shown in Figure 5 are statistical and donot include instrumental systematics, uncertainties in solarmodulation corrections, or uncertainties in the atmosphericcorrections for the balloon abundances. The CRIS data aregenerally consistent with those from previous experimentsto within statistical uncertainties. For the 10Be and 26Alclock species, abundance measurements with well-resolvedisotopic peaks from experiments other than CRIS exist atdi†erent energies, and in theory the energy dependence forthese abundances can be tested using these previous mea-surements. However, several factors complicate this methodof probing the energy dependence. One factor is that eachprevious measurement was generally reported as one abun-dance per experiment covering a fairly wide energy range,owing to the limited counting statistics. Because most ofthese previous observations were made with instrumentsusing a similar measurement technique to CRIS, most of theenergy ranges covered by previous measurements signiÐ-cantly overlap. Comparisons that used these overlappingmeasurements tend to deemphasize any subtle abundancevariations with energy that may exist. Another com-plication is that systematic uncertainties in measurementsby previous experiments need to be considered. Systematicuncertainties in the analysis of the CRIS data will tend toa†ect all of the measurements similarly, preserving theenergy dependence. The measurement of these abundancesfrom CRIS over di†erent energy bands provides a set ofstatistically uncorrelated measurements that indicates thatthere is no statistically signiÐcant energy dependence in theclock abundances at these energies.
3. PROPAGATION MODELING
The abundances observed by CRIS were compared withsteady-state abundances calculated using a steady-state,leaky-box model (e.g., Meneguzzi, Audouze, & Reeves1971). Table 3 lists the important parameters of this model,which are described later in this section in greater detail.This model is an approximation to a class of models thatsimulate the spatial and temporal evolution of GCR par-ticles in the Galaxy during transport, incorporating pro-cesses such as di†usion (see ° 1). The LBM replaces theGalactic matter distribution with a spatially independentdistribution of path lengths through which the GCRs pro-pagate before escape.
Formally, the distribution of path lengths through whichGCRs propagate in leaky-box models is exponential (Davis1960) with a mean value, adjusted for agreement withjesc,observed GCR abundance data. The mean path length maydepend on GCR energy and species, which simulate the

774 YANASAK ET AL. Vol. 563
FIG. 4.ÈMass histograms for Be, Al, Cl, and Mn measured over di†erent energy intervals reported in Table 2. The energy intervals proceed from lowest tohighest moving from left to right across the Ðgure. The maximum allowed zenith angles are the same as in Fig. 2. A 10] magniÐcation of the Be, Al, and Clabundances is shown as a lighter histogram.
physical dependence of GCR di†usion and Galactic con-Ðnement on these quantities. Other path length distribu-tions (PLDs) can be investigated using the ““ weighted-slab ÏÏtechnique (Fichtel & Reames 1968). Using this technique,the passage of the GCRs through matter and their conse-quent fragmentation is simulated using slabs of di†erentlength, and a distribution of these slab path lengths is speci-Ðed explicitly to model transport. The weighted-slab tech-nique using an exponential PLD approximates theleaky-box model results with some signiÐcant di†erences(Stephens & Streitmatter 1998). The observed abundancesof stable GCR secondaries have been Ðtted remarkably wellusing both the weighted-slab technique and steady-statesolutions of the leaky-box model, and the mean path lengthhas been found to require an energy dependence to Ðt the
abundances (e.g., Ferrando et al. 1991). The model used inthis study, which will be referred to hereafter for simplicityas a ““ steady-state ÏÏ model, involves numerical solution ofthe leaky-box equation as given by Meneguzzi et al. (1971).
The abundances of the secondary clock isotopes mea-sured at Earth correspond to the fraction of the producedabundance that has survived without decaying in transport.The surviving fraction, f, of a GCR secondary radionuclidespecies i is deÐned as the ratio of the GCR abundanceobserved at Earth to the abundance that would be observedif there were no decay in Ñight. In the LBM, if cosmic-rayenergy loss is neglected, the surviving fraction is given by
f \ 1/qesc ] 1/qi,spall
1/qesc ] 1/qi,spall] 1/cq
i,decay. (2)

No. 2, 2001 MEASUREMENT OF SECONDARY RADIONUCLIDES 775
FIG. 5.ÈSecondary radionuclide abundance ratios from CRIS and previous experiments with a mass resolution of amu, as a function of energy.pM
¹ 0.35Data from CRIS are shown as Ðlled triangles pointing downward. A single data point for the 10Be/9Be ratio using the SIS instrument (Stone et al. 1998b)aboard ACE is shown for comparison at lower energy as a Ðlled upward triangle. Ratios for the previous experiments have been adjusted to the level of solarmodulation at the time of CRIS observations, /\ 325 MV, for direct comparison. References for the data are as follows : Circle, Wiedenbeck & Greiner(1980) ; Wiedenbeck (1983) ; square, Lukasiak et al. (1994a, 1994b) ; open upward triangle, Connell (1998) ; Connell et al. (1998) ; Simpson & Connell (1998) ;DuVernois (1997) ; star, Garcia-Munoz et al. (1981) ; right triangle, Webber & Kish (1979) ; Webber (1982) ; Ðlled triangles this study.
In this expression, is the GCR conÐnement time,qesc qi,decayis the mean decay lifetime of the radionuclide in its rest
frame, is the characteristic lifetime against spallationqi,spallin the ISM, and c is the GCR Lorentz factor. As shown in
equation (2), f results from the competition between particleloss by radioactive decay and loss by escape and fragmenta-tion. The value of f depends on the ISM density, as welloISM,as on since the spallation time, is proportional toqesc, q
i,spall,
TABLE 3
PARAMETERS IN THE LEAKY-BOX MODEL
Parameter Reference Comments
Source composition :Elemental . . . . . . . . . . . . . 1 Adjusted to match CRIS observationsIsotopic . . . . . . . . . . . . . . . 2Spectra . . . . . . . . . . . . . . . . dJ/dEP p~2.35, similar to Engelmann et al. 1990
Cross sections :Totala . . . . . . . . . . . . . . . . . 3Partialb . . . . . . . . . . . . . . . . 4
Interstellar Medium:Composition . . . . . . . . . . 5 90% H, 10% HeIonization . . . . . . . . . . . . . 6 H ` /Htot\ 0.10^ 0.04
Mean path lengthc . . . . . . 7 jesc \ 26.7b g cm~2/[(bR/1.0 GV)0.58] (bR/1.4 GV)~1.4]Solar modulation . . . . . . . 8 Equivalent to /\ 325 MV
a Energy dependence renormalized to match available cross section data.b See Appendix A. Energy dependence renormalized to match available cross section data.c Form from Soutoul & Ptuskin 1999 adjusted to match CRIS data.REFERENCES.È(1) Engelmann et al. 1990 ; DuVernois & Thayer 1996. (2) Anders & Grevesse 1989. (3)
Letaw et al. 1983. (4) Silverberg, Tsao, & Barghouty 1998. (5) Peimbert 1975 ; Churchwell, Mezger,Huchtmeier 1974. (6) Taylor & Cordes 1993 ; Diplas & Savage 1994 ; Dame et al. 1987. (7) Soutoul &Ptuskin 1999. (8) Fisk 1971.

776 YANASAK ET AL. Vol. 563
In the leaky-box model, the product is pro-oISM. oISM qescportional to the mean path length for escape :
jesc \ qesc oISMbc . (3)
Using inferred from abundance measurements of stablejescGCR secondaries relative to their primary parents, both qescand can be derived.oISMUnder certain conditions, the LBM appears to be anadequate approximation of di†usion models. For example,a di†usion model of Ptuskin et al. (1997) suggests that low-energy GCRs may move fairly freely (i.e., large di†usioncoefficient) within an internal zone encompassing theGalactic disk, which is bounded by another region wherehydrodynamic waves are self-generated by the streaming ofGCRs. The waves in this bounding region scatter GCRsstrongly and efficiently trap them close to the internal zone,e†ectively simulating a leaky box at low energies within thissmaller region of the Galaxy. However, the interpretation ofGCR radionuclide data using the leaky-box model maydi†er from that of di†usion models with inhomogeneousmatter distributions, depending on the species and the GCRenergy. In an inhomogeneous model, shorter lived second-ary radionuclides will tend to be more concentrated aroundthe regions of high ISM density where they are predomi-nantly produced. Density inhomogeneities can be presenton a variety of scales ranging from the scale height of theGalactic disk down to the scale of individual molecularclouds. If a medium with large-scale inhomogeneities isinvolved in the production of the secondary radionuclidesthat we observe, the abundances for species of di†erent half-lives may not all be simultaneously well represented by anLBM with a single set of input parameters such as averageISM density because they probe di†erent distance scales inthe ISM. Thus, the comparison of the di†erent ISM den-sities derived from the measured abundances of di†erentradionuclides may provide a general insight into the exis-tence and scale of inhomogeneities.
One can also approximate the e†ects of cosmic-ray trans-port in the Galaxy by using the weighted-slab technique,which presupposes that the solution can be separated intotwo parts (e.g., Ptuskin, Jones, & Ormes 1996) : a ““ nuclearpart ÏÏ that dictates the amount of fragmentation for eachspecies in slabs of material of various lengths and an““ astrophysical part ÏÏ that speciÐes the distribution of theseslab path lengths that the GCRs traverse from the source tothe Earth. One advantage to this technique is that the pathlength distribution can be varied from the simple exponen-tial PLD implicit in the LBM. Because particles lose energyduring propagation and both the fragmentation cross sec-tions and PLD depend on energy, the separability of thesolution is only approximate, and this leads to di†erencesbetween the predictions of the LBM and the weighted-slabmodel with exponential PLD (e.g., Stephens & Streitmatter1998). The weighted-slab technique assumes that the meanpath length depends only on the steady-state particle energy(Ptuskin et al. 1996). However, the mean path length usedby models that solve the steady-state LBM equations is anaverage over the energies the GCRs have while slowingdown in the ISM, which gives a larger average energy thanthe steady-state particle energy. In the cosmic-ray energyregime below 1 GeV nucleon~1 where ionization energyloss during propagation is a sizable fraction of the initialparticle energy, a Ðt to secondary-to-primary ratio datagives a path length that decreases with decreasing energy
(e.g., Garcia-Munoz et al. 1987). This means that the abso-lute Ñux at a particular steady-state energy will be under-estimated by the weighted-slab technique because theGCRs will traverse a shorter mean path length beforeescape. Therefore, in the energy regime below 1 GeVnucleon~1, weighted-slab models require a larger meanpath length to Ðt measured secondary-to-primary ratio dataat a given energy than steady-state models. Di†erences inÑux predictions for stable secondaries in the two modelswith an identical mean path length may be as great as 17%(Stephens & Streitmatter 1998).
A di†erence in predictions between the two models alsoexists for the secondary radionuclide Ñuxes, although thisdi†erence is somewhat less than that in the predicted stablesecondary abundances. Because the ionization energy loss isproportional to Z2/A, the di†erence will be greatest for the10Be clock because of the change from A/Z^ 2.0 to 2.5during fragmentation of the parent to create this isotope. Atan ISM energy of 250 MeV nucleon~1 relevant to CRIS Bedata (see Table 2), Stephens & Streitmatter (1998) estimatethat the predicted 10Be/9Be abundance ratio in the ISMusing a weighted-slab model will be D2% higher than theLBM ratio. Solar modulation will deemphasize this e†ectfurther. However, the mean path length in a weighted-slabmodel required to match secondary data will be larger, andthis will lead to di†erent predictions of and the averageqescISM density for the two models using equation (3).
Abundances at the source for our model were adjusted tomatch predictions of the propagation model to CRIS data.The elemental abundances are generally consistent withingiven uncertainties with the elemental source compositionderived using HEAO 3 data (Engelmann et al. 1990) formajor elemental species such as C, Si, and Fe and withUlysses observations (DuVernois & Thayer 1996) for rarerelements such as P. Generally, the isotopic abundances aresimilar to those found in the solar system (Anders & Gre-vesse 1989) with adjustments for elemental fractionationcorrelated with Ðrst-ionization potential or condensationtemperature (e.g., Meyer, Drury, & Ellison 1997 ; Meyer1985), with one notable exception being the well-documented source enhancement of 22Ne (e.g., Mewaldt1988 and references therein ; for a recent measurement of22Ne, see Binns et al. 2000).
Source spectra were assumed to be power laws inmomentum dJ/dEP p~2.35 (within the range of spectralindex values deduced by Engelmann et al. 1990). Ionizationenergy loss, radioactive decay, spallation, and rates forattachment and stripping of single electrons on the GCRnuclei during propagation are incorporated in our model.For some of the species of interest in this study, the pro-duction and total fragmentation cross sections are not well-determined (see Appendix B for details). We use the energydependence for partial fragmentation cross sections fromSilberberg, Tsao, & Barghouty (1998, hereafter STB) andtotal fragmentation cross sections from Letaw, Silberberg,& Tsao (1983), renormalized for good agreement with thepresently available set of cross section data, including thosethat were reported subsequent to STB (see Appendix B).
The ISM composition was assumed to be 90% H, 10%He by number (Peimbert 1975), consistent with solar photo-spheric measurements (Grevesse, Noels, & Sauval 1996),though the uncertainty in extending these abundances tothe ISM may be signiÐcant (Strong & Moskalenko 1998). Inorder to understand uncertainties in this quantity on our

No. 2, 2001 MEASUREMENT OF SECONDARY RADIONUCLIDES 777
analysis, we have considered the e†ects of a 20% variationin the He/H ratio (He/H \ 0.11^ 0.02, from Peimbert1975). Also of importance is the e†ect of ionized ISM gas onthe determination of the mean path length. Soutoul, Fer-rando, & Webber (1987) noted that the presence of ionizedhydrogen in the ISM would increase the amount of GCRionization energy loss during transport through an ISM ofpure hydrogen by a factor of approximately 1.4, relative toionization losses experienced in pure neutral hydrogen. Thisincrease is based on observations by Harding & Harding(1985) of a 15% ionized fraction of ISM hydrogen. In ourprevious analyses (Yanasak et al. 1999, 2000, hereafterY1999 and Y2000), we used a 24% ionized H fraction in theISM, consistent with present observations of the scaleheights and Galactic midplane densities of the ionized,neutral, and molecular H components (Nordgren, Cordes,& Terzian 1992 ; Diplas & Savage 1994 ; Dame et al. 1987).This value was also approximately consistent with the Hionized fraction of 28% used by DuVernois, Simpson, &Thayer (1996) in the Ulysses data analyses.
However, this ionization fraction is based on the assump-tion that GCR propagation occurs within a volume havinga larger radius than the scale height of all of the ISM com-ponents. The characteristic distance through which GCRsdi†use, l, can be approximated using an equation similar toequation (1) :
lB (Dt)1@2 . (4)
In this equation, D is the GCR di†usion coefficient in theGalaxy, and t is the GCR lifetime against fragmentation inthe ISM. Using the total fragmentation cross section fromWestfall et al. (1979) to calculate the interaction length of56Fe in the ISM, the lifetime against fragmentation for Fe inan ISM of density atoms cm~3 is approximatelynISMD 0.54.4 Myr. Using a typical di†usion coefficient ofDD 2 ] 1028 cm2 s~1 (Ptuskin & Soutoul 1998a), the di†u-sion length is D530 pc, which is somewhat smaller than thescale height of the H` gas distribution. If one considers afraction of this Fe to undergo escape Myr), the(qesc D 15propagation lifetime will be smaller by D23%, and lqpropwill decrease to D400 pc. Integrating the density distribu-tions for each gas component within a sphere of radius 400pc, we Ðnd that the ionized fraction is consistent with alower value of The error estimateH`/HtotD 10%^ 4%.assigned to the value of reÑects the uncertainty inH`/Htotthe molecular H density, the di†erence between the resultsfrom Nordgren et al. (1992) and Taylor & Cordes (1993) forthe H` density, and the uncertainty in the size of the GCRpropagation volume. One expects this estimate of theionized fraction to be lower than the previous estimatebecause the smaller integration volume excludes a largerproportion of the ionized fraction of the ISM, which is mostsigniÐcant far from the Galactic disk.
The value of was adjusted to account for secondary-jescto-primary elemental abundance ratios measured withCRIS. We examined the ratios B/C, P/S, (Sc]V)/Fe, and(17¹ Z¹ 25)/Fe. HEAO 3 data (Engelmann et al. 1990)were used as a consistency check of at higher energies.jescFitting the energy dependence of the secondary-to-primaryratios is critical for determining the ISM density and con-Ðnement time over the energy range of the data. As sug-gested by the work of Soutoul & Ptuskin (1999), we assume
the following form of the escape mean free path :
jesc \ 26.7b g cm~2(bR/1.0 GV)0.58 ] (bR/1.4 GV)~1.4 . (5)
In this expression, R is the particle rigidity, and b \ v/c,where v is the cosmic-ray velocity. This form for has ajescstronger dependence on energy at lower energies than com-monly used forms that assume based on thejesc P b,concept of the di†usion of GCRs back into the Galacticdisk competing with the outward convection of a dynamicalGalactic halo (Jones 1979). Previous low-energy experi-ments have found that is required to Ðt thejesc P b3.5h4.5observed energy dependences of secondary-to-primaryratios (e.g., Krombel & Wiedenbeck 1988 ; Garcia-Munoz etal. 1987). An energy dependence of that is stronger thanjescPb provides a better Ðt for CRIS GCR secondary-to-primary ratios as well (Davis et al. 2000). Although we haveadopted the form for given in equation (5) on empiricaljescgrounds, its strong dependence on b at low energies is con-sistent with a model of Tan et al. (1987), which suggests thatGCR di†usion at energies below 1 GeV nucleon~1 could besuppressed more e†ectively than at higher energies becauseof self-trapping by hydrodynamic waves generated bycosmic-ray streaming. Recent theoretical work suggests thata strong energy dependence of could also result from ajescdependence of the velocity of a Galactic wind on the heightabove the Galactic disk (Soutoul & Ptuskin 1999). Alterna-tively, it has been suggested that the strong energy depen-dence observed in the low-energy B/C ratio could also beattributable to the e†ects of reacceleration (Strong & Mos-kalenko 1998). For the interstellar energy characteristic ofthe 10Be measured by CRIS, E^ 250 MeV nucleon~1, themean path length traversed by the GCRs before escape isD6.7 g cm~2.
Comparisons of the CRIS secondary-to-primary ratioswith predictions from our LBM calculations using theexpression for given in equation (5) are shown in Figurejesc6. The CRIS data for B/C, P/S, and (Sc]V)/Fe are allreasonably well Ðtted with the same overall normalizationof In the case of P/S, (Sc]V)/Fe, and (17¹ Z¹ 25)/jesc.Fe, a lack of fragmentation cross section data over a largerange in energy adds uncertainty to the energy dependenceof fragmentation in this model (see Appendix B), which maybe the origin of the discrepancy between data and the modelpredictions for the (17 ¹ Z¹ 25)/Fe ratio. The availablecross section data are at energies similar to those sampledby CRIS in the ISM and probably account for the agree-ment at the lower CRIS energies. A single normalization for
was also found in some previous analyses (e.g., Engel-jescmann et al. 1990), but others attempting to use a singleexponential PLD ultimately required di†erent normal-izations for B/C and (Sc]V)/Fe ratios (e.g., Garcia-Munozet al. 1987). We also note that DuVernois et al. (1996) Ðnd asuitable normalization for all secondary-to-primary ratios,but the experimental value of the Ulysses (Sc]V)/Fe ratiois below the CRIS measurement at a similar energy byD20%.
When a discrepancy between model Ðts for the lower Zsecondary-to-primary ratios and the sub-Fe/Fe ratio wasnoted previously, weighted-slab PLDs with an energy-dependent truncation at shorter path lengths were sug-gested to resolve this discrepancy (e.g., Garcia-Munoz et al.1987 ; Webber 1993). This could result from a concentration

778 YANASAK ET AL. Vol. 563
FIG. 6.ÈGCR secondary-to-primary ratios. The open circles are CRIS data, and the Ðlled diamonds are data from HEAO 3 (Engelmann et al. 1990). Alsoshown are theoretical curves from the propagation model described in this study.
of matter around discrete GCR sources in the Galaxy.Unlike our current study, our previous analyses (Y1999,Y2000) indicated a di†erent normalization for the (Sc]V)/Fe ratio and the lower Z secondary-to-primary ratios mea-sured by CRIS. However, the di†erence in normalizationfrom that reported by Yanasak et al. (Y2000) is attributableentirely to the assumption of a lower ionization fraction inthe ISM, based on a more detailed examination of the char-acteristic propagation volume. The increased energy loss inthe ISM resulting from a larger assumed H` fraction, inconjunction with energy dependent fragmentation crosssections, decreases the amount of secondary production inthe Fe group relative to lower Z secondaries. A similare†ect was noted by Webber (1993), although his conclusionsabout the need for truncation were di†erent, possiblybecause of the use of older fragmentation cross sections.Without stronger observational constraints on the H`/Htotratio in the propagation volume, it appears difficult toseparate the e†ects of PLD truncation and ionized fractionon the secondary-to-primary ratios.
Solar modulation of the cosmic-ray spectra was simu-lated with numerical solutions of a spherically symmetricFokker-Planck model as described by Fisk (1971). In oursolar modulation calculation, it is assumed that the inter-planetary di†usion coefficient is proportional to bR and isindependent of location in the heliosphere. Using this pro-portionality, the normalization of the di†usion coefficientcorresponds to a modulation parameter /\ 325 MV forGCRs in propagating from outside the heliosphere to 1 AU,using the relationship between / and the di†usion coeffi-cient deÐned by Gleeson & Axford (1968). This value for /was obtained by comparing spectra from our LBM calcu-lation to data from CRIS and HEAO 3 (Davis et al. 2000).The value of modulation used in this study is di†erent fromthe higher value from our earliest analysis (/\ 555 MV,from Y1999). The previous value was based on the study byBadhwar & OÏNeill (1993), which used the Climax neutronmonitor as an indication of the level of cosmic-ray modula-tion. Subsequent work by ourselves (Davis et al. 2000) andothers (A. Lukasiak 2000, private communication) showedthat somewhat lower values of / are more consistent withthe solar minimum data from CRIS. Rather than assum-
ing a modulation parameter and determining with thisjescconstraint, our current study proceeded by Ðnding thevalues for and / simultaneously that agree well with thejescCRIS data. To within the statistical accuracy of the CRISdata, the uncertainty in the value of / is constrained toD^50 MV. However, the possibility exists of a larger sys-tematic uncertainty related to the technique used to Ðnd amodulation level or to the assumed rigidity dependence ofthe interplanetary di†usion coefficient. Consequences of anuncertainty in solar modulation will be discussed in the nextsection.
4. DISCUSSION
As described in ° 3 above, the abundances of the second-ary clock isotopes are used within the leaky-box model toderive a mean ISM density, Given the mean pathoISM.length for escape and a mean ISM density, one can calcu-late the Galactic conÐnement time of GCRs from equation(3). Cosmic rays di†use through the Galaxy, and becauseeach clock species has a di†erent mean lifetime, the volumesof the ISM through which each species di†uses will besomewhat di†erent. The ISM matter distribution within theGalactic disk can vary dramatically over distance scalescharacteristic to GCR propagation (e.g., Frisch 1998), soISM densities derived from LBMs need not be consistentamong the various clock species. For example, using equa-tion (1) for the di†usion distance and a typical di†usioncoefficient DD 1028 cm2 s~1 (Ptuskin & Soutoul 1998a),10Be will sample a region within D300 pc of the solarsystem, while 36Cl will sample a region smaller by a factorD[q(36Cl)/q(10Be)]1@2 ^ 0.4. Considering that the nominalscale height of the Galactic disk may be D120 pc (Diplas &Savage 1994), the average ISM density determined from theabundance of 36Cl may reÑect the disk density more thanthe average density determined using 10Be.
The left-hand column of Figure 7 compares predictions ofthe steady-state LBM discussed in ° 3 for various assumedvalues of the ISM hydrogen number density, to CRISnH,abundances for the secondary radionuclides measured atEarth and those obtained previously from satellite obser-vations aboard Ulysses (Connell 1998 ; Connell et al. 1998 ;DuVernois 1997 ; Simpson & Connell 1998), ISEE 3

No. 2, 2001 MEASUREMENT OF SECONDARY RADIONUCLIDES 779
FIG. 7.ÈSecondary radionuclide abundance ratios from CRIS and previous satellite experiments as a function of energy. Curves in the Ðrst column ofplots show model predictions for various assumed densities of ISM hydrogen in H atoms cm~3. Ratios for the previous experiments have been adjusted tothe level of solar modulation for CRIS as in Fig. 5. Hatched regions in the second column of plots show the variation in model predictions for constant ISMdensity assuming an uncertainty in the level of solar modulation */\ ^50 MV. The half-life for 54Mn comes from Wuosmaa et al. (1997) and Zaerpoor etal. (1999) : Myr. References for the data are as follows : Filled downward triangle, ACE/CRIS (this work) ; Ðlled upward triangle, ACE/SIS (thisT1@2\ 0.68work) ; circle, Wiedenbeck & Greiner (1980) ; Wiedenbeck (1983) ; square, Lukasiak et al. (1994a, 1994b) ; open triangle, Connell (1998) ; Connell et al. (1998) ;Simpson & Connell (1998) ; DuVernois (1997).
(Wiedenbeck & Greiner 1980 ; Wiedenbeck 1983), andVoyager (Lukasiak et al. 1994a, 1997a, 1997b). Previousabundance measurements were made at di†erent periods inthe solar cycle, and these have been adjusted to the level ofmodulation appropriate to CRIS as in Figure 5. In the cases
such as ISEE 3 where modulation is treated using a ““ force-Ðeld ÏÏ model (Gleeson & Axford 1968), the force-Ðeldparameter, ', indicating the amount of modulation inenergy units is converted to an analogous modulationparameter in rigidity / using the following relation :

780 YANASAK ET AL. Vol. 563
/B (A/Z)', where (A/Z) is assumed to be 2 (Gleeson &Axford 1968). To within statistical uncertainties, the densityvalues derived from this model using the CRIS data arecomparable to those obtained from previous calculations(Connell 1998). From Figure 7, the hydrogen number den-sities, obtained from the CRIS measurements of thenH,various clock isotopes range from 0.27 to 0.43 H atomscm~3, with the highest densities indicated by the 36Cl data.With our assumed ISM composition of 90% H, 10% He bynumber, this range corresponds to an ISM number density
atoms cm~3. As has been noted(H] He)nISM\ 0.30È0.48before (e.g., Garcia-Munoz et al. 1975), average ISM densityvalues indicated by all of the secondary clock abundances inthis study are less than the typically adopted disk density
atom cm~3. In spite of its shorter half-life, thenISMD 1abundance of 36Cl does not show any indication of anaverage ISM density that is signiÐcantly larger in its smallerpropagation volume than those implied by the other radio-active secondary abundances. As discussed later in thissection, the mean ISM hydrogen density and its weightedstandard deviation considering both systematic and sta-tistical uncertainties is H atoms cm~3.nH \ 0.34 ^ 0.04Using an ISM composition of 90% H, 10% He, this valuecorresponds to an ISM number density nISM\ 0.38^ 0.04atoms cm~3. Considering only statistical uncertainties foreach species, the mean hydrogen density is within 2 stan-dard deviations of each individual density value.
Because of the high statistical signiÐcance of the CRISdata, the e†ect of systematic uncertainties in density predic-tions arising from uncertainties in model parameters suchas the level of solar modulation and cross sections must beconsidered (see Appendix A). Hatched regions in the plotsin the right-hand column in Figure 7 show the e†ect on thepredictions for Ðxed ISM density when the level of solarmodulation is varied by */\ 50 MV. Di†erences in themodulation lead to greater change in the predictions forthe 10Be/9Be ratio than for the other species because of theassumed rigidity dependence in the modulation di†usioncoefficient and the larger A/Z di†erence between these iso-topic species. A change in the solar modulation level*/\ 50 MV, equal to the amount of uncertainty men-tioned in the previous section and shown in Figure 7, corre-sponds to a variation in the assumed ISM density ofD^5% from the 10Be data. The other species show a some-what smaller dependence on solar modulation uncer-tainties. Although uncertainties from statistics dominate,the contribution from modulation should not be neglected,being larger than 15% of the statistical uncertainty for thecombined CRIS data and as large as 60% of the statisticaluncertainty for 10Be.
The deduced from 54Mn is in greatest statistical dis-nHparity with the mean density indicated by all species.However, interpretation of the abundance of 54Mn is lesscertain because of its poorly known cosmic-ray half-life (seeTable 1). In the laboratory, 54Mn decays primarily via elec-tron capture, with a 312 day half-life. However, in thecosmic rays, the fully stripped 54Mn nuclei decay only byb`- and b~-modes, with the b`-decay half-life estimated tobe D500 times longer than the b~-decay half-life (Zaerpooret al. 1997). In addition, the cross section for attachment ofan electron to a bare 54Mn nucleus is not negligible and isenergy dependent, and this can complicate the interpreta-tion of the 54Mn abundance measurement (e.g., Wieden-beck et al. 2000). Measurement of the b~-decay half-life in
the laboratory has proceeded through the difficult directdetection of the decay (e.g., Kibedi et al. 1997), which hasyielded only a lower limit on the lifetime and through indi-rect methods by observation of b`-decay and inference of
from theoretical considerations (e.g., Zaerpoor etT1@2(b~)al. 1997 ; Wuosmaa et al. 1998). From the work of Zaerpooret al. (1997, 1999) and Wuosmaa et al. (1998), the combinedmeasurements of the b`-decay imply a value for the b~-decay of yr in the GCRs,T1@2(54Mn) \ (6.8^ 1.5)] 105which includes systematic and statistical uncertainties.From our model, a half-life uncertainty of ^1.5] 105 yrcorresponds to a hydrogen ISM density uncertainty of([0.053, ]0.079) H atoms cm~3.
Progress is being made toward an accurate theoreticalprediction of the 54Mn b~-decay half-life. Recent theoreti-cal calculations of the 54Mn b~-decay half-life by Martinez-Pinedo & Vogel (1998) using a shell model calculation ofb-decay rates indicate a value of T1@2(54Mn) \ (4.94^ 0.06)] 105 yr, smaller than what has been inferred from previousmeasurements of the 54Mn b`-decay half-life (Zaerpoor etal. 1999 ; Wuosmaa et al. 1998). The estimated uncertaintyresults from a particular theoretical consideration and doesnot necessarily reÑect all theoretical uncertainties. Somedisagreement exists in their predictions for other preciselymeasured b-decay half-lives as well, for reactions such as26Al(b`)26Mg. G. Martinez-Pinedo & P. Vogel (1999,private communication) suggest that these di†erences resultfrom a quenching factor a†ecting the absolute value of thenuclear form factor, which is removed by taking the ratio ofb~-decay and b`-decay half-lives. Multiplying the ratio oftheir predicted b~-decay and b`-decay half-lives for 54Mnwith the experimental value of the b`-decay half-life fromWuosmaa et al. (1998) and Zaerpoor et al. (1999) yields
yr for the b~-decay branch,T1@2(54Mn) \ (6.0^ 1.2)] 105in good agreement with calculations from earlier studies ofthe half-life for the b~-decay branch using b`-decay half-lifemeasurements. More work in this area is needed to resolvethis discrepancy, including a direct measurement of the b~-decay of 54Mn. At present, 54Mn is useful as a consistencycheck between the propagation history of Fe-group ele-ments and lighter species, while further interpretation of the54Mn abundance awaits a determination of the 54Mn half-life with improved precision.
The densities indicated by the CRIS data may indicate asubstantial amount of propagation in a local ISM cavity(Ptuskin & Soutoul 1998a). The recent survey by Diplas &Savage (1994) of within the Galactic disk around thenHsolar system Ðnds an average neutral atomic hydrogendensity component of 0.32 H atoms cm~3 in a cylindricalvolume 2 kpc in radius and extending 240 pc above andbelow the Galactic disk. Previous surveys have foundneutral hydrogen densities in a similar volume to be asmuch as D50% larger (Diplas & Savage 1994). Combiningthis amount with the observed contribution of 0.1 mol-H2ecules cm~3 from the local molecular hydrogen clouddensity at the Galactic midplane (Dame et al. 1987) and 0.02H` ions cm~3 from the ionized hydrogen density at theGalactic midplane (Taylor & Cordes 1993), the total hydro-gen density is approximately 0.54 H atoms cm~3 in thenHneighborhood of the disk around the solar system. Further-more, the actual density within 240 pc of the solar system isless than this value by D11% H atoms cm~3),(nH D 0.47because the molecular cloud distribution about the Galacticdisk is modeled as a Gaussian with an rms dispersion of 74
No. 2, 2001 MEASUREMENT OF SECONDARY RADIONUCLIDES 781
pc. This density is somewhat less than the typically assumedtotal density of 1 atom cm~3 H atoms cm~3)(nH D 0.9given for the Galactic disk, which has been used to suggestsigniÐcant propagation in a lower density halo (e.g.,Simpson & Garcia-Munoz 1988). Although this explana-tion is not excluded, the Galactic disk hydrogen densityresult of H atoms cm~3 is in less disparity withnH D 0.47values derived from the CRIS data H(nH \ 0.34 ^ 0.04atoms cm~3) than are previous assumptions of HnH D 0.9atoms cm~3, and signiÐcant halo propagation of theGCRs may not be required to explain the cosmic-ray clockobservations.
The predicted energy dependence for all clock species isconsistent with the data to within the statistical limitationsof the observations, although the abundances of 26Al fromCRIS are also consistent with no energy dependence. Pre-liminary results from the cosmic-ray di†usion model ofStrong & Moskalenko (1999) predict Ñatter energy depen-dences of the clock abundance ratios less than 1 GeVnucleon~1 than those given in our model (Fig. 7), somewhatmore consistent with 26Al but with similar consistency forthe other species. Uncertainty in the energy dependencearising from uncertainties in the isotopic fragmentationcross section for production may also account for an addi-tional 10% di†erence at most in the derived ISM density atlower energies (see Appendix B). Higher energy 10Be data
(Geier 2000) should provide a stronger test of the energydependence of the Galactic conÐnement of GCRs, bothbecause they will allow a wider range of time dilations to besampled and because the higher energy abundances will beless a†ected by solar modulation.
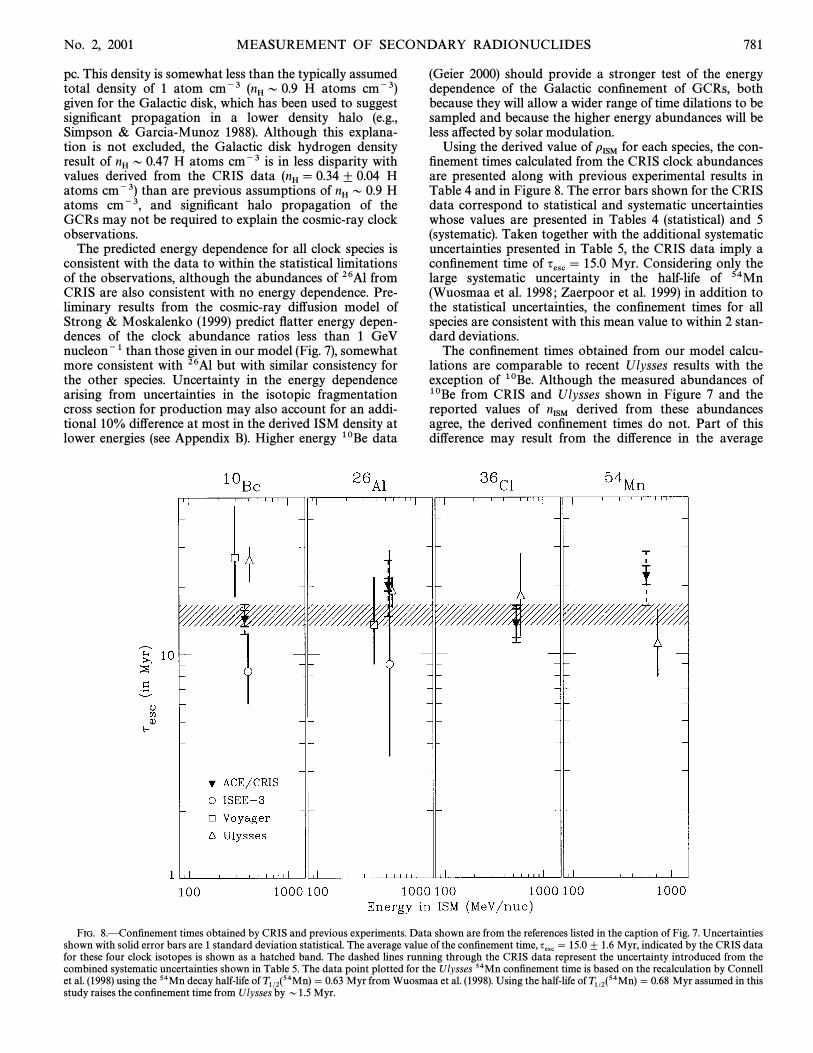
Using the derived value of for each species, the con-oISMÐnement times calculated from the CRIS clock abundancesare presented along with previous experimental results inTable 4 and in Figure 8. The error bars shown for the CRISdata correspond to statistical and systematic uncertaintieswhose values are presented in Tables 4 (statistical) and 5(systematic). Taken together with the additional systematicuncertainties presented in Table 5, the CRIS data imply aconÐnement time of Myr. Considering only theqesc \ 15.0large systematic uncertainty in the half-life of 54Mn(Wuosmaa et al. 1998 ; Zaerpoor et al. 1999) in addition tothe statistical uncertainties, the conÐnement times for allspecies are consistent with this mean value to within 2 stan-dard deviations.
The conÐnement times obtained from our model calcu-lations are comparable to recent Ulysses results with theexception of 10Be. Although the measured abundances of10Be from CRIS and Ulysses shown in Figure 7 and thereported values of derived from these abundancesnISMagree, the derived conÐnement times do not. Part of thisdi†erence may result from the di†erence in the average
FIG. 8.ÈConÐnement times obtained by CRIS and previous experiments. Data shown are from the references listed in the caption of Fig. 7. Uncertaintiesshown with solid error bars are 1 standard deviation statistical. The average value of the conÐnement time, Myr, indicated by the CRIS dataqesc \ 15.0^ 1.6for these four clock isotopes is shown as a hatched band. The dashed lines running through the CRIS data represent the uncertainty introduced from thecombined systematic uncertainties shown in Table 5. The data point plotted for the Ulysses 54Mn conÐnement time is based on the recalculation by Connellet al. (1998) using the 54Mn decay half-life of Myr from Wuosmaa et al. (1998). Using the half-life of Myr assumed in thisT1@2(54Mn) \ 0.63 T1@2(54Mn) \ 0.68study raises the conÐnement time from Ulysses by D1.5 Myr.

782 YANASAK ET AL. Vol. 563
TABLE 4
MEAN CONFINEMENT TIMES AND SURVIVING FRACTIONS OF THE GALACTIC COSMIC-RAY CLOCK NUCLEI
T1@2a nHb qescbClock (Myr) Experiment (H atoms cm3) (Myr) f b Reference
10Be . . . . . . . 1.5 ACE/CRIS 0.358 ^ 0.032 14.5^ 1.3 0.252 ^ 0.018 This workUlyssesc 0.18^ 0.03 26.0~5.0`4.0 . . . 1Voyager 0.275~0.113`0.137 27.1~9.0`18.9 . . . 2Voyager 0.295~0.099`0.117 . . . 0.259 ^ 0.072 3ISEE 3 0.30~0.10`0.12 8.4~2.4`4.0 . . . 4
14C . . . . . . . . 5.7 ] 10~3 ACE/CRIS . . . . . . \2.3] 10~2 This work26Al . . . . . . . 0.87 ACE/CRIS 0.276 ^ 0.018 20.4^ 1.3 0.248 ^ 0.012 This work
Ulyssesc 0.24~0.04`0.05 19.0~3.0`3.0 . . . 5Voyager 0.52~0.20`0.26 13.5~4.5`8.5 0.32^ 0.09 6ISEE 3d 0.25~0.17`0.65 9.0~6.5`20.0 . . . 7
36Cl . . . . . . . 0.31 ACE/CRIS 0.425 ^ 0.067 13.8^ 2.2 0.155 ^ 0.021 This workUlyssesc 0.26~0.09`0.11 18.0~6.0`10.0 . . . 8
54Mn . . . . . . 0.68^ 0.15 ACE/CRIS 0.267 ^ 0.027 22.4^ 2.3 0.284 ^ 0.019 This workVoyagere . . . . . . 0.34 ^ 0.15 9Ulyssesc,e 0.37~0.14`0.22 14.0~4.0`6.0 . . . 10
a GCR half-lives shown include bB-decay branches only.b Quoted uncertainties are statistical.c The term recalculated from assuming 6.3% He, 93.7% H.nH nISM,d The term recalculated from assuming 10% He, 90% H.nH nISM,e Assumes Myr.T1@2\ 1REFERENCES.È(1) Connell 1998. (2) Lukasiak et al. 1994a. (3) Lukasiak et al. 1997a. (4) Wiedenbeck & Greiner
1980. (5) Simpson & Connell 1998. (6) Lukasiak et al. 1994b. (7) Wiedenbeck 1983. (8) Connell et al. 1998. (9)Lukasiak et al. 1997b. (10) DuVernois 1997.
values of used for converting derived values of tojesc oISMcorresponding values of We Ðnd g cm~2 forqesc. jesc ^ 6.710Be obtained from CRIS at an ISM energy of 250 MeVnucleon~1 (see Table 2), and we estimate the path length forthe Ulysses measurement at this energy to be gjesc ^ 4.7
cm~2 from the formulation of the path length presented byDuVernois et al. (1996). Because the B/C ratio used todetermine in both studies is similar, this may be sugges-jesctive of di†erences in the total and partial fragmentationcross sections for the production of light secondaries used
TABLE 5
SOURCES OF UNCERTAINTYa IN COSMIC-RAY ISOTOPE SPECTROMETER DATA AND TRANSPORT MODEL
MEASUREMENT MODELING
SPECIES QUANTITY Statistical Backgroundb Solar Modulationc,d Cross Sectione He/Hf,d H`/Htotg,d Half-Lifeh
H ISM Density, nH (H atoms cm~3)
10Be . . . . . . . 0.358 0.032 \0.001 0.018 0.042 0.008 . . . . . .26Al . . . . . . . 0.276 0.018 ~0.061`0.045 0.003 0.062 0.006 . . . . . .36Cl . . . . . . . 0.425 0.067 ~0.017`0.011 0.010 0.029 0.010 . . . . . .54Mn . . . . . . 0.267 0.027 ~0.012`0.008 0.002 0.005 0.006 . . . ~0.052`0.078
ConÐnement Time, qesc (Myr)
10Be . . . . . . . 14.5 1.3 \0.1 0.8 1.2 0.6 0.3 . . .26Al . . . . . . . 20.4 1.3 ~2.9`5.8 0.2 3.2 0.9 0.4 . . .36Cl . . . . . . . 13.8 2.2 ~0.3`0.6 0.3 0.5 0.6 0.3 . . .54Mn . . . . . . 22.4 2.3 ~0.7`1.1 0.2 0.2 1.0 0.5 ~5.1`5.4
Surviving Fraction, f
10Be . . . . . . . 0.252 0.018 \0.001 0.010 0.026 0.005 0.002 . . .26Al . . . . . . . 0.248 0.012 ~0.041`0.030 0.002 0.042 \0.001 0.002 . . .36Cl . . . . . . . 0.155 0.021 ~0.005`0.003 0.003 0.006 0.004 0.001 . . .54Mn . . . . . . 0.284 0.019 ~0.008`0.006 0.001 0.003 0.004 0.003 \0.001
a Values given are nominally 1 standard deviation.b Background from spillover of non-Gaussian tails from adjacent peaks in the mass histogram is calculated as a percentage of the area of the
Gaussian Ðt to the adjacent peak (see ° 2). The background subtraction and uncertainty is of the adjacent peak area.0.7~0.5`0.7 %c The term /\ 325 ^ 50 MV.d Uncertainties are correlated between species.e Calculation of uncertainties is described in Appendix B.f ISM composition : He/H\ 0.11^ 0.02.g ISM composition : H`/Htot\ 0.10^ 0.04.h The term Myr.T1@2(54Mn) \ 0.68^ 0.15

No. 2, 2001 MEASUREMENT OF SECONDARY RADIONUCLIDES 783
by the two groups (see Appendix B). However, this discrep-ancy cannot be attributed to di†erences between theweighted-slab model used in the Ulysses study and oursteady-state model since weighted-slab models requirelarger values of the mean path length than steady-statemodels to account for secondary-to-primary ratios (Ptuskinet al. 1996 ; see also ° 3). Interstellar compositional di†er-ences between these two models may also play a role ;however, the greatest di†erence between the studies is theionization fraction, which has greater inÑuence on predic-tions of the sub-Fe/Fe secondary-to-primary ratio than ofthe B/C ratio.
As mentioned in ° 3, the input parameters to the LBM inthis study are somewhat di†erent from those used in ourprevious analyses (Y1999, Y2000), and the e†ect of thesedi†erences on our derived values for and deservesnISM qescmention. The Y1999 study was a preliminary attempt tomodel GCR data from CRIS, relying more heavily onmodel parameters used in previous studies, which had notundergone a thorough reexamination. Upon further scru-tiny of the model used in the Y1999 study, the solar modu-lation level (see ° 3) and both partial and totalfragmentation cross sections used in Y1999 required adjust-ment to match the current literature. The total fragmenta-tion cross sections used in Y1999 for the Fe-group werefound to be in slight disagreement with those shown in plotsfrom STB and measurement data, and these were adjustedfor Y2000 and this work. Furthermore, a comparison ofpartial cross sections for production of the GCR clocksused in the Y19992 study with more recent cross sectiondata (see Appendix B) showed di†erences for some of thereactions, and these input cross sections were adjusted foragreement. In addition to these changes, investigation of theionization fraction used in both Y1999 and Y2000 alsorevealed a value that was too high, as described in ° 3,requiring di†erent normalizations for to account for thejesclower Z and the Fe-group secondary-to-primary ratios.
The e†ect of these adjustments is to require a di†erentmean path length, changing the values of the conÐnementtime and, in some cases, the average ISM densities fromthose we derive in this study. Adjustment of the partialfragmentation cross sections does not a†ect the mean pathlength but changes the required average ISM densities andthe conÐnement time through equation (3). The parameterdi†erences described above required our previous value of
in Y1999 to be D15% less than the value in this studyjescin order to agree with all secondary-to-primary ratiosexcept for sub-Fe/Fe. In the case of the latter ratio, thecombined errors in choosing an ionization fraction andtotal fragmentation cross sections in Y1999 e†ectivelynegated, resulting in a similar Fe-group mean path lengthfor Y1999 and this study. Comparing the Y2000 study withthe present work, the value of is appreciably di†erentjesconly for the Fe-group species, so the conÐnement time for54Mn is the only quantity signiÐcantly changed in ourcurrent analysis.
Within the framework of the leaky-box model, the sur-viving fraction probes the average ISM density during the
2 The cross sections for the Y1999 study were evaluated using versionv1993 of software from the Space Physics Data System node at the Loui-siana State University based on the work of Webber, Kish, & Schrier(1990b), available at http ://spdsch.phys.lsu.edu/SPDSCH–Pages/Software–Pages/Software.html.
FIG. 9.ÈSurviving fractions, f, of the secondary radionuclides in theISM as a function of half-life. The horizontal error bars correspond to theapproximate range in half-lives from time dilation at ISM energies for eachspecies. Vertical error bars indicate the amount of statistical and system-atic error in the calculation of the surviving fractions (see Table 5). Alsoshown are curves based on a leaky-box model of propagation relatingsurviving fraction to half-lives of arbitrary duration, assuming di†erencesin the fragmentation mean free path appropriate for secondary nuclei withmasses equal to A\ 10, 14, 26, 36, and 54. The curves are extended belowthe minimum GCR half-life for each species using dotted lines to show thetrend given by eq. (A8). These curves increase in surviving fraction for agiven value of half-life as mass increases. For this calculation, correctionsfor time dilation appropriate to ISM energies for each species are included.The curves are calculated using the conÐnement time and mean ISMdensity deduced from 10Be. Energy loss during propagation is not con-sidered in the calculation of the model curves.
species lifetime once the abundances of stable secondariesconstrain the escape mean free path. In Figure 9 and Table4 we present the surviving fractions given by our LBM foreach clock, including our upper limit on the fraction of 14C.The curves shown in Figure 9 were calculated using equa-tion (A8) in Appendix A, which results from a steady-stateLBM that neglects energy loss. As Figure 9 demonstrates,the predictions of f from equation (A8) using model parame-ters appropriate for 10Be do not agree exactly with thesurviving fractions calculated with our LBM (whichincludes energy loss) using measurements for each species.The fraction for the shorter-lived isotope 36Cl is in greaterdisagreement from the curves than 10Be or 26Al and mayindicate a slightly higher ISM density than the valuederived from the 10Be measurements. Considering the rela-tively small range of half-lives between 10Be and 36Cl
and the fact that the di†usion[T1@2(10Be)/T1@2(36Cl)^ 5]distances to which these correspond scale as (see(qdecay)1@2eq. [1]), these species may not be particularly sensitiveprobes of local inhomogeneities in the ISM matter distribu-tion. However, longer distance scales can be probed bymeasuring radioactive nuclide abundances at energieswhere time dilation extends the decay half-lives (e.g., Geier2000). To probe smaller distance scales, the surviving frac-tion for 14C should be more precisely determined to providea more complete picture of local inhomogeneity over abroad range of characteristic distances. Presently, the upperlimit on the 14C abundance from CRIS does not provide astrong constraint on the interstellar density encountered bycosmic rays in the region close to the solar system.
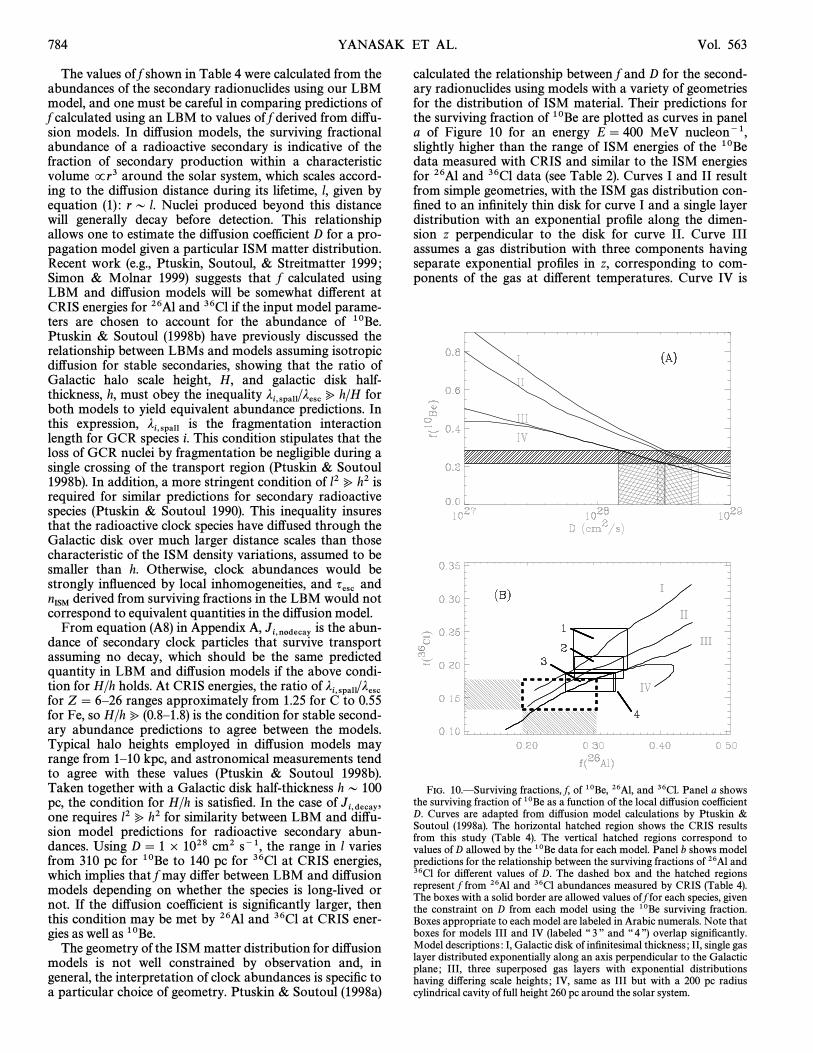
784 YANASAK ET AL. Vol. 563
The values of f shown in Table 4 were calculated from theabundances of the secondary radionuclides using our LBMmodel, and one must be careful in comparing predictions off calculated using an LBM to values of f derived from di†u-sion models. In di†usion models, the surviving fractionalabundance of a radioactive secondary is indicative of thefraction of secondary production within a characteristicvolume Pr3 around the solar system, which scales accord-ing to the di†usion distance during its lifetime, l, given byequation (1) : r D l. Nuclei produced beyond this distancewill generally decay before detection. This relationshipallows one to estimate the di†usion coefficient D for a pro-pagation model given a particular ISM matter distribution.Recent work (e.g., Ptuskin, Soutoul, & Streitmatter 1999 ;Simon & Molnar 1999) suggests that f calculated usingLBM and di†usion models will be somewhat di†erent atCRIS energies for 26Al and 36Cl if the input model parame-ters are chosen to account for the abundance of 10Be.Ptuskin & Soutoul (1998b) have previously discussed therelationship between LBMs and models assuming isotropicdi†usion for stable secondaries, showing that the ratio ofGalactic halo scale height, H, and galactic disk half-thickness, h, must obey the inequality forj
i,spall/jesc ? h/Hboth models to yield equivalent abundance predictions. Inthis expression, is the fragmentation interactionj
i,spalllength for GCR species i. This condition stipulates that theloss of GCR nuclei by fragmentation be negligible during asingle crossing of the transport region (Ptuskin & Soutoul1998b). In addition, a more stringent condition of l2? h2 isrequired for similar predictions for secondary radioactivespecies (Ptuskin & Soutoul 1990). This inequality insuresthat the radioactive clock species have di†used through theGalactic disk over much larger distance scales than thosecharacteristic of the ISM density variations, assumed to besmaller than h. Otherwise, clock abundances would bestrongly inÑuenced by local inhomogeneities, and andqescderived from surviving fractions in the LBM would notnISMcorrespond to equivalent quantities in the di†usion model.
From equation (A8) in Appendix A, is the abun-Ji,nodecaydance of secondary clock particles that survive transport
assuming no decay, which should be the same predictedquantity in LBM and di†usion models if the above condi-tion for H/h holds. At CRIS energies, the ratio of j
i,spall/jescfor Z\ 6È26 ranges approximately from 1.25 for C to 0.55for Fe, so H/h ? (0.8È1.8) is the condition for stable second-ary abundance predictions to agree between the models.Typical halo heights employed in di†usion models mayrange from 1È10 kpc, and astronomical measurements tendto agree with these values (Ptuskin & Soutoul 1998b).Taken together with a Galactic disk half-thickness h D 100pc, the condition for H/h is satisÐed. In the case of J
i,decay,one requires l2? h2 for similarity between LBM and di†u-sion model predictions for radioactive secondary abun-dances. Using D\ 1 ] 1028 cm2 s~1, the range in l variesfrom 310 pc for 10Be to 140 pc for 36Cl at CRIS energies,which implies that f may di†er between LBM and di†usionmodels depending on whether the species is long-lived ornot. If the di†usion coefficient is signiÐcantly larger, thenthis condition may be met by 26Al and 36Cl at CRIS ener-gies as well as 10Be.
The geometry of the ISM matter distribution for di†usionmodels is not well constrained by observation and, ingeneral, the interpretation of clock abundances is speciÐc toa particular choice of geometry. Ptuskin & Soutoul (1998a)
calculated the relationship between f and D for the second-ary radionuclides using models with a variety of geometriesfor the distribution of ISM material. Their predictions forthe surviving fraction of 10Be are plotted as curves in panela of Figure 10 for an energy E\ 400 MeV nucleon~1,slightly higher than the range of ISM energies of the 10Bedata measured with CRIS and similar to the ISM energiesfor 26Al and 36Cl data (see Table 2). Curves I and II resultfrom simple geometries, with the ISM gas distribution con-Ðned to an inÐnitely thin disk for curve I and a single layerdistribution with an exponential proÐle along the dimen-sion z perpendicular to the disk for curve II. Curve IIIassumes a gas distribution with three components havingseparate exponential proÐles in z, corresponding to com-ponents of the gas at di†erent temperatures. Curve IV is
FIG. 10.ÈSurviving fractions, f, of 10Be, 26Al, and 36Cl. Panel a showsthe surviving fraction of 10Be as a function of the local di†usion coefficientD. Curves are adapted from di†usion model calculations by Ptuskin &Soutoul (1998a). The horizontal hatched region shows the CRIS resultsfrom this study (Table 4). The vertical hatched regions correspond tovalues of D allowed by the 10Be data for each model. Panel b shows modelpredictions for the relationship between the surviving fractions of 26Al and36Cl for di†erent values of D. The dashed box and the hatched regionsrepresent f from 26Al and 36Cl abundances measured by CRIS (Table 4).The boxes with a solid border are allowed values of f for each species, giventhe constraint on D from each model using the 10Be surviving fraction.Boxes appropriate to each model are labeled in Arabic numerals. Note thatboxes for models III and IV (labeled ““ 3 ÏÏ and ““ 4 ÏÏ) overlap signiÐcantly.Model descriptions : I, Galactic disk of inÐnitesimal thickness ; II, single gaslayer distributed exponentially along an axis perpendicular to the Galacticplane ; III, three superposed gas layers with exponential distributionshaving di†ering scale heights ; IV, same as III but with a 200 pc radiuscylindrical cavity of full height 260 pc around the solar system.

No. 2, 2001 MEASUREMENT OF SECONDARY RADIONUCLIDES 785
identical to the distribution of curve III with the exceptionof a cylindrical cavity evacuated around the solar system ofradius 200 pc and full height 260 pc based on the obser-vations of Paresce (1984) and others. Values of f obtainedfrom the CRIS data using the LBM calculations are shownas horizontal hatched regions extending across panel a,assuming 1 standard deviation uncertainties including bothsystematic and statistical errors. Also shown are the rangeof values of D over which the surviving fractions from CRISoverlap with the predictions from each model curve, plottedas vertical hatched regions. A comparison of the values off (10Be) from CRIS to the model curves yields a local di†u-sion coefficient D ranging from D1.5] 1028 cm2 s~1 to5.5] 1028 cm2 s~1, with a typical value of D within thesemodels of D3.5] 1028 cm2 s~1.
Panel b of Figure 10 compares predictions from eachmodel to the surviving fractions for 36Cl, 26Al, and 10Be.Assuming a consistent value for D between species, eachmodel described above predicts a relationship betweenf (36Cl) and f (26Al), shown as curves in panel b. The boxbordered by a dashed line shows the surviving fractiondeduced from CRIS measurements within 1 standard devi-ation for these two species, including statistical and system-atic uncertainties. Using the range in values for D derivedfrom the surviving fraction for 10Be in panel a, one canpredict the surviving fractions for the other two species, andthese predictions for each model are shown as boxes with asolid border in panel b. The Arabic numerals denote themodel from which the range of D was chosen using f (10Be).The overlap between boxes indicates consistency betweenmodels. From Figure 10, the models with three gas com-ponents (III and IV) appear to be favored, and the simplemodel I appears the least consistent with the surviving frac-tion data from CRIS. However, the boxes represent 1 stan-dard deviation, so this result does not strongly constrain themodel geometry. Introduction of a low-density cavity ofradius 200 pc around the solar system does not a†ect Dgreatly for D\ 4 ] 1028 cm2 s~1 since these isotopesdi†use signiÐcantly larger distances than the size of thecavity in their lifetimes. The di†erence between predictionsof the fraction for the shorter lived species 14C is potentiallya stronger test. However, the present CRIS upper limit tothe surviving fraction of 14C does not signiÐcantly constrainthe ISM matter distributions investigated by Ptuskin &Soutoul (1998a).
The values of and f from our LBM and associatednH, qesc,uncertainties are presented in Table 5 (see also Appendix A).Statistical uncertainties, while much improved over pre-vious measurements, continue to be signiÐcant. However,the uncertainty in partial fragmentation cross sections con-tributes a comparable amount of uncertainty, originatingfrom the small number of available cross section measure-ments for some reactions. Cross section uncertainties for36Cl and 54Mn, although smaller than statistical uncer-tainties, are estimated from the di†erences in the theoreticalcross section formulae of STB and Webber, Kish, & Schrier(1990b, hereafter WKS). A more realistic estimate may be atleast as large as the uncertainty contribution for specieswith a larger number of cross section measurements such as26Al, which results from inconsistencies in fragmentationdata (see Appendix B).
Uncertainty in the ISM ionization fraction a†ects thedetermination of Uncertainty in the mean path lengthjesc.has a greater inÑuence on the value of the conÐnement time
for 54Mn than on the other clock species because the pathlength for fragmentation is shorter for Fe-group speciesthan for lighter GCR species. As discussed in ° 3, the ioniza-tion fraction adopted for this study is H`/Htot \ 10%^ 4% (Taylor & Cordes 1993 ; Diplas & Savage 1994 ;Dame et al. 1987), and the conÐnement times and uncer-tainties in Table 5 assume this value of the ionization frac-tion and this uncertainty. However, if the uncertainty in theionization fraction is signiÐcantly larger and its value iscloser to D20%È30% as indicated by some previous studies(e.g., DuVernois et al. 1996), the conÐnement time given bythe 54Mn abundance will increase by D13 Myr, while theconÐnement times indicated by other species increase byD1 Myr. As mentioned previously, the most signiÐcantuncertainty a†ecting the transport parameters derived from54Mn continues to be the value of its half-life.
The mean ISM hydrogen density, calculated by weight-ing the densities for all four species using the statistical andsystematic uncertainties given in Table 5, is nH \ 0.34^ 0.04 H atoms cm~3. This calculation of the weightedstandard deviation around the mean assumes that densityuncertainties resulting from uncertainty in solar modula-tion and ISM composition are correlated between species.The standard deviation given by the distribution of the fourmeasured density values around 0.34 atoms cm~3 is ^0.08atoms cm~3. If the correlated uncertainties are excluded forsimplicity, the reduced s2 value calculated comparing thefour density values with the mean value is 0.77, indicatingthat the four individual density values are consistent with asingle value of the ISM density.
Calculated in a similar manner, the mean conÐnementtime and the weighted standard deviation from statisticaland systematic uncertainties is Myr. Fromqesc \ 15.0^ 1.6the distribution of the individual conÐnement times aroundthe mean, the standard deviation is 4.6 Myr, which is largerthan the weighted standard deviation. However, some ofthis di†erence can be accounted for by the large uncertaintyin the measurement of the Mn half-life. Excluding the 54Mnmeasurement, the mean conÐnement time and weightedstandard deviation is 14.6 ^ 1.6 Myr, and the rms spread ofconÐnement times around the mean is 3.4 Myr.
5. CONCLUSIONS
We have presented isotopic abundance measurements forthe GCR secondary radionuclides 10Be, 26Al, 36Cl, and54Mn and an upper limit for 14C obtained using the CRISinstrument on ACE. We have developed a consistent inter-pretation of these abundances in the context of GCR propa-gation by using a steady-state, leaky-box model consistentwith current observations of the composition of stablecosmic rays and with the composition and density of matterin the local ISM.
The observed abundances of all secondary radionuclidesare adequately accounted for by a Galactic conÐnementtime of Myr, including statistical and sys-qesc \ 15.0^ 1.6tematic uncertainties. This corresponds to an averageISM hydrogen number density H atomsnH \ 0.34 ^ 0.04cm~3 for propagation through the mean path length ofmatter described in ° 3. Subdividing the data into multipleenergy bins indicates an energy dependence for these abun-dances that is consistent with the increase of the radioactiveisotope abundances with increasing energy expected fromleaky-box or di†usion models (e.g., Strong & Moskalenko

786 YANASAK ET AL. Vol. 563
1999) or with no energy dependence over the range ofmeasured energies. The abundance of 36Cl requires a valuefor during propagation that is consistent with averagenHdensities indicated by the longer lived species. Assumingisotropic di†usion, this may indicate that the size of thepropagation volume for 36Cl does not make the abundanceof this species particularly sensitive to ISM mass densitydi†erences between the Galactic disk and the lower densityhalo.
Comparing the surviving fractional abundances to pre-dictions from the di†usion models of Ptuskin & Soutoul(1998a) suggests a value for the cosmic-ray interstellar di†u-sion coefficient of D\ (3.5^ 2.0)] 1028 cm2 s~1. Theabundances of 26Al and 36Cl do not appear to favor theirsimplest model geometry of a thin gas disk when comparedto the value of D derived using the surviving fraction of10Be. The upper limit on the abundance of 14C presented in
this work is not sufficiently stringent to provide signiÐcantnew constraints on the distribution of matter sampled bycosmic rays in the immediate neighborhood of the solarsystem.
We gratefully acknowledge the individuals responsiblefor the development of the CRIS instrument (listed in Stoneet al. 1998a). We appreciate the helpful discussion of PetrVogel concerning theoretical calculations of the half-life of54Mn. We also thank the University of Chicago for provid-ing Climax neutron monitor data (supported by NationalScience Foundation grant ATM 96-13963).
This research was supported by the National Aeronauticsand Space Administration at the California Institute ofTechnology (under grant NAG5-6912), the Jet PropulsionLaboratory, the Goddard Space Flight Center, WashingtonUniversity, and the McDonnell Center for the Space Sci-ences at Washington University.
APPENDIX A
RELATIONSHIP BETWEEN MODEL UNCERTAINTIES, CONFINEMENT TIME, AND INTERSTELLARMEDIUM DENSITY
In addition to statistical uncertainties in measured abundances, uncertainties in the physical parameters required as inputto a leaky-box model limit the ability to determine the conÐnement time, and the average ISM density, For a GCRqesc, oISM.nuclide of species i at a particular ISM energy per nucleon E, the steady-state equation (Meneguzzi et al. 1971) governing itsnumber density, during transport in a leaky box assuming a simple exponential PLD is given byJ
i,
0 \ [ Ji
jesc] L
LE(u
iJi) [ J
i
T pi
M
U[ J
ioISMbccq
i] Q
i, (A1)
where the production term is given asQi
Qi\ ;
jJj
ATpj,iM
U] 1
oISMbccqj,i
B] q
i. (A2)
Here, the sum over j includes all parent species j that can undergo decay or fragmentation into the daughter product i. Thequantity in the fragmentation term is deÐned as
T pM
U4
nH pH ] nHepHeoISM
. (A3)
In these equations, is the ISM number density where M is the ISM atom mass),nISM\ nH ] nHe (oISM4MH nH ]MHe nHe, piis the total fragmentation cross section for species i, is the partial cross section for the fragmentation of j into i, is thep
j,i qimean lifetime of species i against decay, is the mean lifetime of species j before its decay to species i, is theq
j,i ui4 (dE/dx)
iionization energy loss of species i per unit path length x in the ISM, and represents the primary production of species i byqithe GCR source. The superscripts for the cross sections in equation (A3) indicate the target nucleus for the fragmentation
reaction in the ISM. The terms for loss or gain via radioactive decay apply only for speciÐc species.Solving equation (A1) for the steady-state GCR intensities yields
Ji(E)\ Q
i1/jesc(E)] Sp
i/MTISM(E) ] 1/oISMbccq
i[ 1/j
i,u(E), (A4)
where we have expressed the energy-loss term for species i in terms of a characteristic path length for energy loss Thisji,u.
energy-loss path length is given by
1ji,u
\ Lui
LE] t
ui
E, (A5)
where is the GCR spectral index at a given energy. From equation (A4), a measurement of the abundancet4 L ln Ji/L ln E
ratio of a stable secondary species s to a single primary parent p constrains the mean path length through the followingrelationship :
Js
Jp\ Q
sQ
p
1/jesc ] Spp/MT ] 1/j
p,u1/jesc ] Sp
s/MT ] 1/j
s,u. (A6)

No. 2, 2001 MEASUREMENT OF SECONDARY RADIONUCLIDES 787
After some rearranging of terms, we Ðnd
jesc(E)\ (Js/J
p)/(Q
s/Q
p) [ 1
Spp/MT ] 1/j
p,u[ (Sps/MT ] 1/j
s,u)(Js/J
p)/(Q
s/Q
p). (A7)
The source term for secondary GCRs, following from equation (A2) is a function of the GCR primaryÏs equilibriumQs,
abundance, during transport and the cross section for the fragmentation of primary particles to the secondary species. SoJp,
we Ðnd that our ability to derive and the average ISM density using information about and equation (3) (see ° 3) isqesc jesclimited by fragmentation cross sections, ISM compositional uncertainties, and uncertainties in the rate of GCR energy loss inthe ISM. Varying the assumed fraction of ionized material in the ISM can lead to di†erent energy loss rates during thetransport lifetime of the GCRs, as noted by Soutoul et al. (1987).
Using the steady-state LBM solution in equation (A4) above, the sources of uncertainty in determining and fromqesc oISMthe surviving fractional abundance of a secondary clock can be shown. Equation (2) in ° 3 follows from the steady-statesolution of the LBM transport equation. Using equations (3), (A3), and (A4) and neglecting energy loss, we can write thesurviving fraction, f, as
f4Ji,decay
Ji,no decay
\ 1/qesc ] (nH piH ] nHe p
iHe)bc
1/qesc ] (nH piH ] nHe p
iHe)bc] 1/cq
i,decay. (A8)
As this expression demonstrates, uncertainties in and the average ISM density originate from ill-determined fragmenta-qesction cross sections, uncertainties in the ISM composition and uncertainties in which relates andnH/nHe, jesc, qesc oISM.However, the comparison of and the average ISM density using multiple species will help to decrease the contribution toqescthe uncertainty from cross sections, which are generally uncorrelated between species.
APPENDIX B
PARTIAL FRAGMENTATION CROSS SECTIONS
A source of uncertainty that can signiÐcantly a†ect the determination of and is the small number of availableoISM qescmeasurements of some of the relevant isotopic fragmentation cross sections at cosmic-ray energies. Measurements exist forseveral reactions involving primary species such as 56Fe(p,*)36Cl that are important for understanding the production rate ofthe secondary radionuclides at interaction energies similar to those probed by the CRIS measurements (e.g., see Table 6 forreferences used in our propagation model). However, many reaction cross sections either have not been measured or havebeen studied only at one or two energies. The lack of measurements and the existence of systematic di†erences between crosssection experiments limits the ability to predict the energy dependence of fragmentation over a wide range of energies. STBand WKS have used an extensive set of cross section measurements to derive formulae that predict the isotopic fragmentationcross sections for most of the reactions for production from primaries with Z¹ 26. However, these two formulations of theenergy dependence frequently di†er signiÐcantly where they are not well constrained by data. For our study, we use theenergy dependences from STB. Although the STB energy dependences are based on a sizable subset of the references in Table6 as well as on other data at lower and higher energies, their calculations do not always adequately account for themeasurements in the energy range relevant for the CRIS analysis. To obtain better agreement, we normalized the STB curvesto experimental cross section values reported in the references listed in Table 6, taking into account the statistical weight ofthe measurement.
Constraining the production is more problematic for 10Be, in particular, than for the other species. Because the data in thisstudy were accumulated during a period of solar minimum, the cosmic rays observed by CRIS have experienced relativelylittle solar modulation during transport into the heliosphere. Consequently, the ISM energy range for data in this study islower than for observations made on Ulysses (Connell 1998) and ISEE 3 (Wiedenbeck & Greiner 1980). For a modulationlevel appropriate to CRIS, the higher end of the ISM energy range for the other radioactive secondary clocks is near oroverlaps with the reaction energy E^ 600 MeV nucleon~1, at which many of the cross section measurements were made (seeTable 2). However, the approximate ISM energy range for 10Be is somewhat lower, D120È350 MeV nucleon~1. Althoughmeasurements exist below this energy range for a number of the important parent nuclei, the expressions of STB and WKS donot agree with both the measurements above and below this range in some cases.
Figure 11 shows cross section measurements for the production of 9Be and 10Be as a function of energy for a few of theimportant parent nuclei for which measurements exist. In addition, measurements for the reactions 11B(p,*)9Be and 11B(p,*)10Be exist but show inconsistency, and these data are plotted in Figure 11 as an illustration of large measurement discrep-ancies for some reactions. The nuclei from the CNO group contribute D80% to the total observed GCR Be. Althoughnitrogen contributes signiÐcantly to the production of Be as well as carbon and oxygen, the data are too sparse and haveuncertainties that are too large to show any marked disagreement with the theoretical curves of STB or WKS. The hatchedband shows the ISM energy interval relevant to the CRIS Be data. The dotted curves represent the cross sections given by theWKS formulae, and the dashed curves are those predicted by STB, both normalized to the data as mentioned above. Thesoftware that calculates the cross sections using the STP and WKS formulae is based on a code distributed by the LouisianaState University on their Space Physics Data System World Wide Web site (see the footnote in ° 4 for more detail). Althoughformulae from both of the groups predict similar behaviors, such as an asymptotic value at higher energies, neither grouppredicts an energy dependence in good agreement with the lower energy data for all important parent nuclei. Rather than

TABLE 6
REFERENCES FOR PARTIAL CROSS SECTION MEASUREMENTS AT
COSMIC-RAY ENERGIES
Clock Isotope Parent Primary Speciesa Reference
10Be . . . . . . . . . . . C, Al, Ca 1, 2N 1, 2, 3O 1, 2, 4
Mg 1, 2, 3, 5, 6Si 1, 2, 3, 4, 5, 6Fe 1, 2, 5, 711B 8, 9, 1012C 8, 9, 11, 12, 13, 14, 15, 16, 1713C 14, 1814N 916O 6, 13, 19, 20
14C . . . . . . . . . . . . 16O, 20Ne 8, 914N, 15N 8
22Ne 8, 2226Mg 22
26Al . . . . . . . . . . . O 4Si 1, 2, 4Ca 1
Al, Fe 1, 227Al, 28Si, 32S 9, 21
36Ar 21, 2340Ar 23
29Si, 30P, 31P, 33S, 38Ar 2140Ca 24
36Cl . . . . . . . . . . . Ca, Fe 1, 2, 2536Ar 21, 2340Ar 2340Ca 24
37Cl, 38Ar, 54Fe, 55Mn 2154Mn . . . . . . . . . Fe, Ni 1, 2
56Fe 8, 9
a Parent species with no listed mass number indicates that the experimentaltarget was composed of a terrestrial mix of isotopes.
REFERENCES.È(1) Schiekel et al. 1996a. (2) Michel et al. 1995. (3) Raisbeck &Yiou 1974. (4) Sisterson et al. 1997. (5) Raisbeck & Yiou 1975. (6) Raisbeck &Yiou 1977. (7) Perron 1976. (8) Webber et al. 1998b. (9) Webber et al. 1990a. (10)Raisbeck & Yiou 1976. (11) Korejwo et al. 1999. (12) Webber & Kish 1985. (13)Lindstrom et al. 1975. (14) Yiou et al. 1973. (15) Fontes et al. 1971. (16) Le-stringuez et al. 1971. (17) Cumming 1963. (18) Raisbeck et al. 1973. (19) Olson etal. 1983. (20) Yiou 1968. (21) ““Webber et al. 1998a. (22) Chen et al. 1997b. (23)Knott et al. 1997. (24) Chen et al. 1997a. (25) Schiekel et al. 1996b.
TABLE 7
PARAMETERS FOR 9BE AND 10BE PRODUCTION CROSS SECTION FORMULAEa
p0 E0Parent Daughter Isotope (mbarn) m (MeV nucleon~1)
11B . . . . . . 9Be 6.92 . . . . . .10Be 5.05 . . . . . .
12C . . . . . . 9Be 5.76 0.185 254510Be 3.79 0.530 1037
13C . . . . . . 9Be 6.61 . . . . . .10Be 5.60 . . . . . .
14N . . . . . . 10Be 1.75 0.715 67116O . . . . . . 9Be 4.04 0.558 637
10Be 2.52 0.962 798
a See eq. (B1).
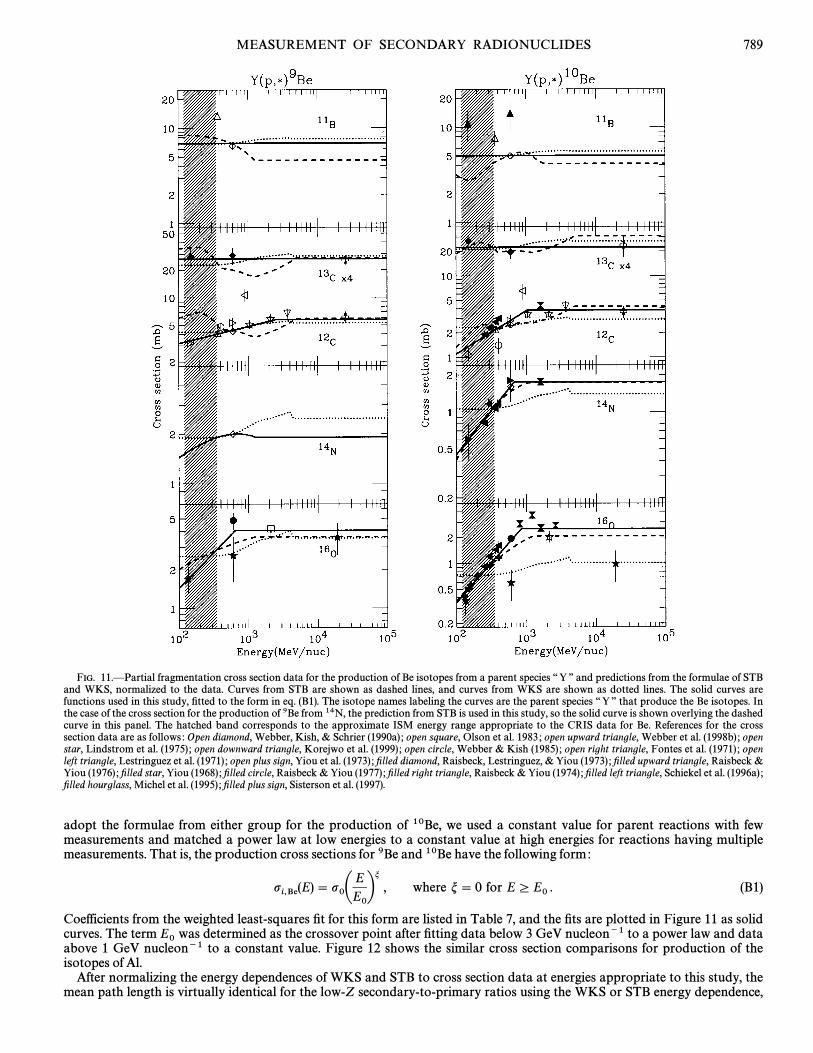
MEASUREMENT OF SECONDARY RADIONUCLIDES 789
FIG. 11.ÈPartial fragmentation cross section data for the production of Be isotopes from a parent species ““ Y ÏÏ and predictions from the formulae of STBand WKS, normalized to the data. Curves from STB are shown as dashed lines, and curves from WKS are shown as dotted lines. The solid curves arefunctions used in this study, Ðtted to the form in eq. (B1). The isotope names labeling the curves are the parent species ““ Y ÏÏ that produce the Be isotopes. Inthe case of the cross section for the production of 9Be from 14N, the prediction from STB is used in this study, so the solid curve is shown overlying the dashedcurve in this panel. The hatched band corresponds to the approximate ISM energy range appropriate to the CRIS data for Be. References for the crosssection data are as follows : Open diamond, Webber, Kish, & Schrier (1990a) ; open square, Olson et al. 1983 ; open upward triangle, Webber et al. (1998b) ; openstar, Lindstrom et al. (1975) ; open downward triangle, Korejwo et al. (1999) ; open circle, Webber & Kish (1985) ; open right triangle, Fontes et al. (1971) ; openleft triangle, Lestringuez et al. (1971) ; open plus sign, Yiou et al. (1973) ; Ðlled diamond, Raisbeck, Lestringuez, & Yiou (1973) ; Ðlled upward triangle, Raisbeck &Yiou (1976) ; Ðlled star, Yiou (1968) ; Ðlled circle, Raisbeck & Yiou (1977) ; Ðlled right triangle, Raisbeck & Yiou (1974) ; Ðlled left triangle, Schiekel et al. (1996a) ;Ðlled hourglass, Michel et al. (1995) ; Ðlled plus sign, Sisterson et al. (1997).
adopt the formulae from either group for the production of 10Be, we used a constant value for parent reactions with fewmeasurements and matched a power law at low energies to a constant value at high energies for reactions having multiplemeasurements. That is, the production cross sections for 9Be and 10Be have the following form:
pi,Be(E)\ p0
A EE0
Bm, where m \ 0 for Eº E0 . (B1)
Coefficients from the weighted least-squares Ðt for this form are listed in Table 7, and the Ðts are plotted in Figure 11 as solidcurves. The term was determined as the crossover point after Ðtting data below 3 GeV nucleon~1 to a power law and dataE0above 1 GeV nucleon~1 to a constant value. Figure 12 shows the similar cross section comparisons for production of theisotopes of Al.
After normalizing the energy dependences of WKS and STB to cross section data at energies appropriate to this study, themean path length is virtually identical for the low-Z secondary-to-primary ratios using the WKS or STB energy dependence,
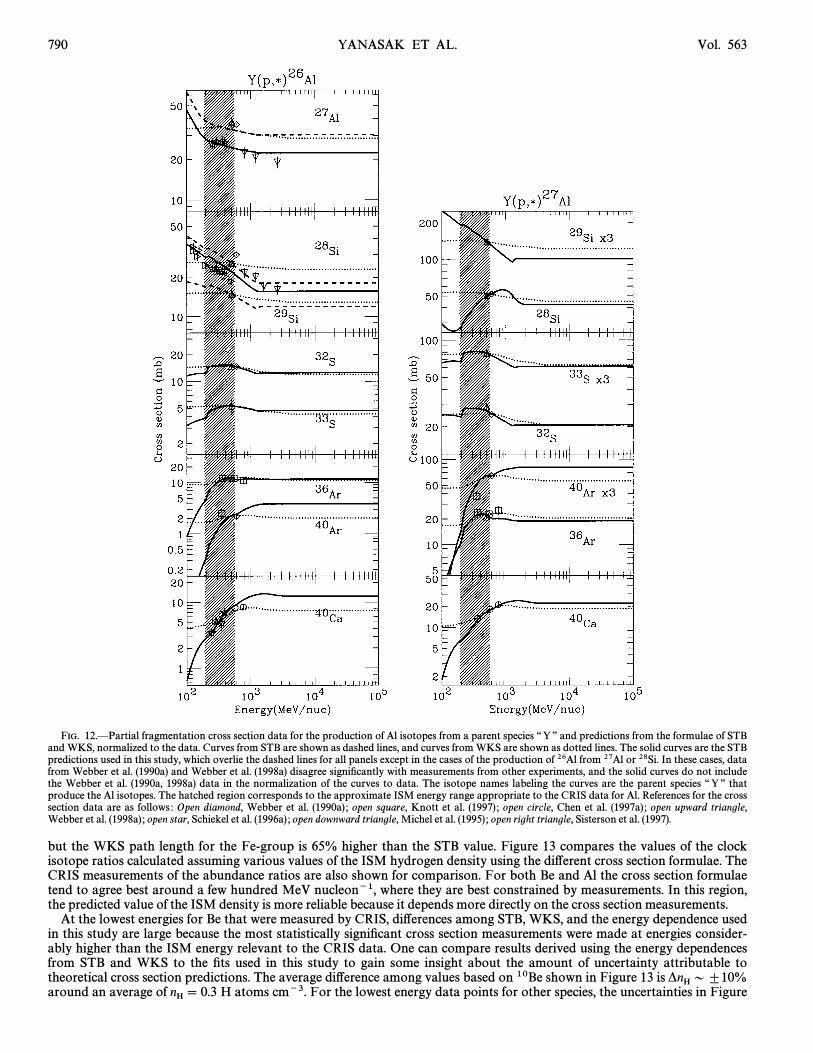
790 YANASAK ET AL. Vol. 563
FIG. 12.ÈPartial fragmentation cross section data for the production of Al isotopes from a parent species ““ Y ÏÏ and predictions from the formulae of STBand WKS, normalized to the data. Curves from STB are shown as dashed lines, and curves from WKS are shown as dotted lines. The solid curves are the STBpredictions used in this study, which overlie the dashed lines for all panels except in the cases of the production of 26Al from 27Al or 28Si. In these cases, datafrom Webber et al. (1990a) and Webber et al. (1998a) disagree signiÐcantly with measurements from other experiments, and the solid curves do not includethe Webber et al. (1990a, 1998a) data in the normalization of the curves to data. The isotope names labeling the curves are the parent species ““ Y ÏÏ thatproduce the Al isotopes. The hatched region corresponds to the approximate ISM energy range appropriate to the CRIS data for Al. References for the crosssection data are as follows : Open diamond, Webber et al. (1990a) ; open square, Knott et al. (1997) ; open circle, Chen et al. (1997a) ; open upward triangle,Webber et al. (1998a) ; open star, Schiekel et al. (1996a) ; open downward triangle, Michel et al. (1995) ; open right triangle, Sisterson et al. (1997).
but the WKS path length for the Fe-group is 65% higher than the STB value. Figure 13 compares the values of the clockisotope ratios calculated assuming various values of the ISM hydrogen density using the di†erent cross section formulae. TheCRIS measurements of the abundance ratios are also shown for comparison. For both Be and Al the cross section formulaetend to agree best around a few hundred MeV nucleon~1, where they are best constrained by measurements. In this region,the predicted value of the ISM density is more reliable because it depends more directly on the cross section measurements.
At the lowest energies for Be that were measured by CRIS, di†erences among STB, WKS, and the energy dependence usedin this study are large because the most statistically signiÐcant cross section measurements were made at energies consider-ably higher than the ISM energy relevant to the CRIS data. One can compare results derived using the energy dependencesfrom STB and WKS to the Ðts used in this study to gain some insight about the amount of uncertainty attributable totheoretical cross section predictions. The average di†erence among values based on 10Be shown in Figure 13 is *nH D^10%around an average of H atoms cm~3. For the lowest energy data points for other species, the uncertainties in FigurenH \ 0.3

No. 2, 2001 MEASUREMENT OF SECONDARY RADIONUCLIDES 791
FIG. 13.ÈComparison of calculated secondary radioactive-isotope abundance ratios using di†erent formulae for the calculation of production crosssections. The points show the measured CRIS values. The curves are parameterized by the ISM hydrogen density in H atoms cm~3. The dashed curves incolumn A result from using the semiempirical isotopic fragmentation cross sections formulated by STB, and the dotted curves in column B use the parametricisotopic fragmentation cross section formulation of WKS. For 36Cl/Cl and 54Mn/Mn, the dashed STB curves in column A were used in this study. The solidcurves in column C result from the cross sections used in this study for 10Be/9Be and 26Al/27Al. In the case of 10Be/9Be, the cross section Ðt described in thisstudy and shown in Fig. 11 was used. For 26Al/27Al, data from Webber et al. (1990a, 1998a) were not used in normalizing the cross section curves toexperimental measurements as shown in Fig. 12. All three families of curves assume a solar modulation level of /\ 325 MV.
13 are for 26Al, for 36Cl, and for 54Mn. For all species with the exception of 36Cl,*nH D ^7% *nH D^3% *nH D ^9%these systematic uncertainties are comparable to the statistical uncertainty of the data as reported over the full energyinterval. Additional cross section measurements, especially for parent species that contribute of one or more of theZ5%È10%clock isotopes, could help to reduce the uncertainties in the derived values of and test for signiÐcant di†erences among thenHvalues derived from the di†erent radionuclides.

792 YANASAK ET AL.
REFERENCESAhlen, S. P., et al. 2000, ApJ, 534, 757Ajzenberg-Selove, F. 1988, Nucl. Phys. A, 490, 1Anders, E., & Grevesse, N. 1989, Geochim. Cosmochim. Acta, 53, 197Badhwar, G. D., & OÏNeill, P. M. 1993, Proc. 23d Int. Cosmic-Ray Conf.
(Calgary), 3, 535Be, M.-M., Coursol, N., & Duchemin, B. 1999, Table de Radionucle� ides
(Gif-sur-Yvette : Commissariat lÏEnergie Atomique)aBinns, W. R. et al. 2000, in AIP Conf. Proc. 528, Acceleration and Trans-
port of Energetic Particles Observed in the Heliosphere : ACE 2000Symposium, ed. R. Mewaldt, J. Jokipii, M. Lee, E. Mobius, & T. Zurbu-chen (Melville : AIP), 413
Buffington, A., Orth, C. D., & Mast, T. S. 1978, ApJ, 226, 355Chen, C.-X., et al. 1997a, Phys. Rev. C, 56, 1536ÈÈÈ. 1997b, ApJ, 479, 504Churchwell, E., Mezger, P. G., & Huchtmeier, W. 1974, A&A, 32, 283Connell, J. J. 1998, ApJ, 501, L59Connell, J. J., DuVernois, M. A., & Simpson, J. A. 1998, ApJ, 509, L97Cumming, J. P. 1963, Ann. Rev. Nucl. Sci., 13, 261Dame, T. M., et al. 1987, ApJ, 322, 706Davis, A. J., et al. 2000, in AIP Conf. Proc. 528, Acceleration and
Transport of Energetic Particles Observed in the Heliosphere : ACE2000 Symposium, ed. R. Mewaldt, J. Jokipii, M. Lee, E. Mobius, &T. Zurbuchen (Melville : AIP), 421
Davis, L. 1960, Proc. 6th Int. Cosmic-Ray Conf. (Moscow), 3, 220Diplas, A., & Savage, B. D. 1994, ApJ, 427, 274DuVernois, M. A. 1997, ApJ, 481, 241DuVernois, M. A., Simpson, J. A., & Thayer, M. R. 1996, A&A, 316, 555DuVernois, M. A., & Thayer, M. R. 1996, ApJ, 465, 982Endt, P. M. 1990, Nucl. Phys. A, 521, 1Engelmann, J. J., et al. 1990, A&A, 233, 96Ferrando, P., Lal, N., McDonald, F. B., & Webber, W. R. 1991, A&A, 247,
163Fichtel, C. E., & Reames, D. V. 1968, Phys. Rev., 175, 1564Firestone, R. B. 1996, in Table of Isotopes, ed. R. B. Firestone & V. S.
Shirley (8th ed. ; New York : Wiley), 228Fisk, L. A. 1971, JGR, 76, 221Fontes, P., Perron, C., Lestringuez, J., Yiou, F., & Bernas, R. 1971, Nucl.
Phys. A, 165, 405Frisch, P. C. 1998, Space Sci. Rev., 86, 107Garcia-Munoz, M., Mason, G. M., & Simpson, J. A. 1975, ApJ, 201, L141Garcia-Munoz, M., Simpson, J. A., Guzik, T. G., Wefel, J. P., & Margolis,
S. H. 1987, ApJS, 64, 269Garcia-Munoz, M., Simpson, J. A., & Wefel, J. P. 1981, Proc. 17th Int.
Cosmic-Ray Conf. (Paris), 2, 72Geier, S. 2000, Ph.D. thesis, Univ. MarylandGleeson, L. J., & Axford, W. I. 1968, ApJ, 154, 1011Goulding, F. S., & Harvey, B. G. 1975, Ann. Rev. Nucl. Sci., 25, 167Grevesse, N., Noels, A., & Sauval, A. J. 1996, in ASP Conf. Ser. 99, Cosmic
Abundances, ed. S. S. Holt & G. Sonneborn (San Francisco : ASP), 117Hagen, F. A., Fisher, A. J., & Ormes, J. F. 1977, ApJ, 212, 262Harding, D. S., & Harding, A. K. 1982, ApJ, 257, 603Jones, F. C. 1979, ApJ, 229, 747Kibedi, T., et al. 1997, ApJ, 489, 951Knott, C. N., et al. 1997, Phys. Rev. C, 56, 398Korejwo, A., Giller, M., Dzikowski, T., Wdowczyk, J., Perelygin, V. V., &
Zarubin, A. V. 1999, Proc. 26th Int. Cosmic-Ray Conf. (Salt Lake City),4, 267
Krombel, K. E., & Wiedenbeck, M. E. 1988, ApJ, 328, 940Lestringuez, J., Raisbeck, G. M., Yiou, F., & Bernas, R. 1971, Phys. Lett. B,
36, 331Letaw, J. R., Silberberg, R., & Tsao, C. H. 1983, ApJS, 51, 271Lindstrom, P. J., Greiner, D. E., Heckman, H. H., Cork, B., & Bieser, F. S.
1975, Document LBL-3650, Lawrence Berkeley LaboratoryLukasiak, A., Ferrando, P., McDonald, F. B., & Webber, W. R. 1994a, ApJ,
423, 426Lukasiak, A., McDonald, F. B., & Webber, W. R. 1994b, ApJ, 430, L69ÈÈÈ. 1997a, Proc. 25th Int. Cosmic-Ray Conf. (Durban), 3, 389ÈÈÈ. 1997b, ApJ, 488, 454Martinez-Pinedo, G., & Vogel, P. 1998, Phys. Rev. Lett., 81, 281Meneguzzi, M., Audouze, J., & Reeves, H. 1971, A&A, 15, 337Mewaldt, R. A. 1988, in AIP Conf. Proc. 183, Cosmic Abundances of
Matter, ed. C. Waddington (Melville : AIP), 124Meyer, J. P. 1985, ApJS, 57, 173Meyer, J. P., Drury, L. C., & Ellison, D. C. 1997, ApJ, 487, 182Michel, R., et al. 1995, Nucl. Instrum. Methods Phys. Res. B, 103, 183Nordgren, T. E., Cordes, J. M., & Terzian, Y. 1992, AJ, 104, 1465Olson, D. L., Berman, B. L., Greiner, D. E., Heckman, H. H., Lindstrom,
P. J., & Crawford, H. J. 1983, Phys. Rev. C, 28, 1602
Paresce, F. 1984, AJ, 89, 1022Peimbert, M. 1975, ARA&A, 13, 113Perron, C. 1976, Phys. Rev. C, 14, 1108Ptuskin, V. S., Jones, F. C., & Ormes, J. F. 1996, ApJ, 465, 972Ptuskin, V. S., & Soutoul, A. 1990, A&A, 237, 445ÈÈÈ. 1998a, A&A, 337, 859ÈÈÈ. 1998b, Space Sci. Rev., 86, 225Ptuskin, V. S., Soutoul, A., & Streitmatter, R. E. 1999, Proc. 26th Int.
Cosmic-Ray Conf. (Salt Lake City), 4, 195Ptuskin, V. S., Volk, H. J., Zirakshvili, V. N., & Breitschwerdt, D. 1997,
A&A, 321, 434Raisbeck, G. M., Lestringuez, J., & Yiou, F. 1973, Nature Phys. Sci., 244,
28Raisbeck, G. M., & Yiou, F. 1974, Phys. Rev. C, 9, 1385ÈÈÈ. 1975, Phys. Rev. Lett., 35, 155ÈÈÈ. 1976, in Spallation Nuclear Reactions and Their Applications, ed.
B. S. P. Shen & M. Merker (Dordrecht : Reidel), 83ÈÈÈ. 1977, Proc. 15th Int. Cosmic-Ray Conf. (Plovdiv), 2, 203Schiekel, T., et al. 1996a, Nucl. Instrum. Methods Phys. Res. B, 114, 91Schiekel, T., Sudbrock, F., Herpers, U., Gloris, M., Leya, I., Michel, R.,
Synal, H.-A., & Suter, M. 1996b, Nucl. Instrum. Methods Phys. Res. B,113, 484
Silberberg, R., Tsao, C. H., & Barghouty, A. F. 1998, ApJ, 501, 911 (STB)Simon, M., & Molnar, A. 1999, Proc. 26th Int. Cosmic-Ray Conf. (Salt
Lake City), 4, 211Simpson, J. A., & Connell, J. J. 1998, ApJ, 497, L85Simpson, J. A., & Garcia-Munoz, M. 1988, Space Sci. Rev., 46, 205Sisterson, J. M., et al. 1997, Nucl. Instrum. Methods Phys. Res. B, 123, 324Soutoul, A., Ferranno, P., & Webber, W. R. 1987, Proc. 21st Int. Cosmic-
Ray Conf. (Adelaide), 3, 337Soutoul, A., & Ptuskin, V. S. 1999, Proc. 26th Int. Cosmic-Ray Conf. (Salt
Lake City), 4, 184Stephens, S. A., & Streitmatter, R. E. 1998, ApJ, 505, 266Streitmatter, R. E., et al. 1993, Proc. 23d Int. Cosmic-Ray Conf. (Calgary),
2, 623Stone, E. C., et al. 1998a, Space Sci. Rev., 86, 285ÈÈÈ. 1998b, Space Sci. Rev., 86, 357Strong, A. W., & Moskalenko, I. V. 1998, ApJ, 509, 212ÈÈÈ. 1999, Proc. 26th Int. Cosmic-Ray Conf. (Salt Lake City), 4, 255Tan, L. C., Mason, G. M., Gloeckler, G., & Ipavitch, F. M. 1987, Proc. 20th
Int. Cosmic-Ray Conf. (Moscow), 2, 239Taylor, J. H., & Cordes, J. M. 1993, ApJ, 411, 674Webber, W. R. 1982, ApJ, 252, 386ÈÈÈ. 1993, ApJ, 402, 188Webber, W. R., & Kish, J. C. 1979, Proc. 16th Int. Cosmic-Ray Conf.
(Kyoto), 1, 389ÈÈÈ. 1985, Proc. 19th Int. Cosmic-Ray Conf. (La Jolla), 3, 87Webber, W. R., Kish, J. C., Rockstroh, Y., Cassagnou, Y., Legrain, R.,
Soutoul, A., & Testard, O. 1998a, Phys. Rev. C, 58, 1Webber, W. R., Kish, J. C., Rockstroh, Y., Cassagnou, Y., Legrain, R.,
Soutoul, A., Testard, O., & Tull, C. 1998b, ApJ, 508, 949Webber, W. R., Kish, J. C., & Schrier, D. A. 1990a, Phys. Rev. C, 41, 547ÈÈ. 1990b, Phys. Rev. C, 41, 566 (WKS)Webber, W. R., Lezniak, J. A., Kish, J. C., & Simpson, G. A. 1977, Astro-
phys. Lett., 18, 125Westfall, G. D., Wilson, L. W., Lindstrom, P. J., Crawford, H. J., Greiner,
D. E., & Heckman, H. H. 1979, Phys. Rev. C, 19, 1309Wiedenbeck, M. E. 1983, Proc. 18th Int. Cosmic-Ray Conf. (Bangalore), 9,
147Wiedenbeck, M. E., et al. 2000, in AIP Conf. Proc. 528, Acceleration and
Transport of Energetic Particles Observed in the Heliosphere : ACE2000 Symposium, ed. R. Mewaldt, J. Jokipii, M. Lee, E. Mobius, & T.Zurbuchen (Melville : AIP), 363
Wiedenbeck, M. E., & Greiner, D. E. 1980, ApJ, 239, L139Wuosmaa, A. H., et al. 1998, Phys. Rev. Lett., 80, 2085Yanasak, N. E., et al. 1999, Proc. 26th Int. Cosmic-Ray Conf. (Salt Lake
City), 3, 9 (Y1999)ÈÈÈ. 2000, in AIP Conf. Proc. 528, Acceleration and Transport of Ener-
getic Particles Observed in the Heliosphere : ACE 2000 Symposium, ed.R. Mewaldt, J. Jokipii, M. Lee, E. Mobius, & T. Zurbuchen (Melville :AIP), 402 (Y2000)
Yiou, F. 1968, Ann. Phys., 3, 169Yiou, F., Raisbeck, G., Perron, C., & Fontes, P. 1973, Proc. 13th Int.
Cosmic-Ray Conf. (Denver), 1, 512Zaerpoor, K., et al. 1997, Phys. Rev. Lett., 79, 4306ÈÈÈ. 1999, Phys. Rev. Lett., 82, 2219