Sulfur gases and aerosols in and above the equatorial african ...
MEASUREMENT OF THE DISTRIBUTION OF AEROSOLS AMONGMOUSE LOBES BY FLUORESCENT IMAGING
Dandan Yi1, Andrew Price2, Angela Panoskaltsis-Mortari2, Amir Naqwi3, and Timothy ScottWiedmann1,4
1 Department of Pharmaceutics, University of Minnesota, Minneapolis, MN 554552 Pediatric BMT and Pulmonary Medicine, University of Minnesota, Minneapolis, MN 554553 Powerscope Incorporated, Minneapolis, MN 55414
AbstractLung samples were prepared to investigate the perturbing effects of light absorption forquantifying the fluorescence signal of aluminum phthalocyanine tetrasulfonic acid (AlPCS).Standard solutions of known concentration and depth were imaged with different exposure timesand analyzed. The intensity was found to be a linear function of concentration, depth, exposuretime, and area. Mice were exposed to an aerosol of AlPCS with a mass median aerodynamicdiameter of 390 nm and geometric standard deviation of 1.8. Images of intact lung lobes and lunghomogenates were obtained and then analyzed to allow quantifying the concentration of AlPCSamong the lung lobes and trachea. For the distribution of aerosols, the results indicate that theconcentration was uniform among the different lobes. Combining the quantitative analysis of theconcentration with image analysis of the area/thickness, the mass deposited in each lobe wasreadily determined. This approach provides a quantitative means to determine the selectivity ofdrug delivery to mouse lower respiratory tract.
KeywordsFluorescent imaging; lungs; aerosol; aluminum phthalocyanine tetrasulfonic acid; lung lobes
INTRODUCTIONRespiratory drug delivery is well known to provide a high localized concentration in therespiratory tract and to reduce systemic side effects in comparison to oral drugadministration. However, current efforts are focused in targeting specific areas in theairways thereby maximizing drug delivery to the affected tissues. Because of the geometriccomplexity of the lung, assessing the mass distribution of particles within the airways in aquantitative manner is a challenging problem. The definitive methodology for humans is thecombined use of positron emission tomography or gamma scintigraphy with computedtomography of x-ray (1–4). The requirement of chemical labeling and expensive
4To whom correspondence should be addressed: Timothy Scott Wiedmann, Ph.D., University of Minnesota, Department ofPharmaceutics, 308 Harvard St. SE, Minneapolis, MN 55455, Phone 612-624-5457, Fax 612-626-2125, [email protected]'s Disclaimer: This is a PDF file of an unedited manuscript that has been accepted for publication. As a service to ourcustomers we are providing this early version of the manuscript. The manuscript will undergo copyediting, typesetting, and review ofthe resulting proof before it is published in its final citable form. Please note that during the production process errors may bediscovered which could affect the content, and all legal disclaimers that apply to the journal pertain.
NIH Public AccessAuthor ManuscriptAnal Biochem. Author manuscript; available in PMC 2012 February 13.
Published in final edited form as:Anal Biochem. 2010 August ; 403(1-2): 88–93. doi:10.1016/j.ab.2010.04.005.
NIH
-PA Author Manuscript
NIH
-PA Author Manuscript
NIH
-PA Author Manuscript

instrumentation limits the general utility of these approaches. Moreover, the resolution isgenerally insufficient for rodents.
Fluorescence imaging is an attractive approach to assess the deposition of particles in thelung, since measurements can be carried out in live animals (5–8). In principle, there is arelationship between the intensity of light within a pixel, representing a two-dimensionalprojection of the biological sample, and the number of fluorescent molecules within therectangular prism (7,9,10). However, both the incident excitation and the emitted fluorescentlight are scattered, reflected, and absorbed by tissue, which affects the relationship betweenlight captured by the detector and number of molecules. In addition, biological tissue alsoautofluoresces, which gives rise to a heterogeneous background signal.
Light absorption and autofluorescence are problems that can be corrected in a relativelystraightforward manner (7,10). Light absorption is typically treated in an empiricallypredictable manner with the assumption that the attenuation is proportional to an exponentialfunction of thickness. Autofluorescence can be subtracted with blank tissue, or with currentinstrumentation, can be essentially eliminated through judicious selection of probes that emitlight at long wavelengths in the near infrared region of the spectrum (7,8). Scatteringcorrections are inherently more complicated, since the light from a molecule in a rectangularprism below a given pixel can be scattered such that the photons appear in a distant pixel(7,9). Thus, there is simultaneous loss/gain of the signal, which compromises the resolutionof the image as well as interferes with efforts to quantify the distribution of molecules in thelung.
In this work, we have prepared lung samples to investigate the perturbing effects ofabsorption for quantifying the fluorescence signal of aluminum phthalocyanine tetrasulfonicacid (AlPCS). In addition, tissue was processed to allow estimation of the distribution of thefluorescent probe among the lobes of the lung.
THEORYConsider the fluorescent image arising from irradiating a sample that contains a uniformdistribution of fluorescent molecules (Figure 1). The intensity of the excitation light emittedfrom the source, Ix,o, is reduced in an assumed exponential manner as it passes through thetissue such that the value is Ix,z at a distance, z, from the surface is (7)
The parameter, μx, is referred to as the tissue attenuation constant and has units of inverselength. Light is absorbed by the fluorescent molecules and generally the concentration issufficiently low to assume the fraction of light absorbed is independent of depth. Thefraction of light absorbed per molecule, ε, is related to the absorptivity. The fraction of theabsorbed light that is emitted as fluorescence relative to that absorbed is defined as thequantum yield, Φ.
Emitted light from the molecule is also attenuated as it propagates through the tissue in amanner analogous to the excitation light, but with a distinct attenuation coefficient, μm.
Yi et al. Page 2
Anal Biochem. Author manuscript; available in PMC 2012 February 13.
NIH
-PA Author Manuscript
NIH
-PA Author Manuscript
NIH
-PA Author Manuscript

In this work, we define the total attenuation coefficient, μt, as the sum of the excitation andemission coefficients, since they were not separated experimentally. The intensity of light inunits of photons per second in unit area also falls with the distance between the sourcemolecule and detector, since emission is taken to occur equally in all directions. This latterfactor can be incorporated into a constant, if the sample is kept at a fixed distance from thedetector, and the same magnification is used.
Combining these factors, the intensity of light arising from fluorescent molecules with totalmass, M, located at a depth, z, is given by
The total intensity is obtained by integrating over all z, which for a solution where theattenuation coefficient is taken as zero, is given as
where the total mass of molecules is given as the product of the uniform concentration, C,area, A, and depth, z. Thus for solutions, the intensity increases linearly with concentration,area, and depth. In the presence of tissue, the intensity can be calculated as the product ofthe average intensity, <Im,z>, and the depth:
Letting Δz→z and expanding the exponential term
and taking the leading terms
where K = Ix,oεΦ, which is an instrumental constant.
Finally, it is recognized that the integrated optical density, (IOD) with units of photons asassessed from digital images, is proportional to the intensity, exposure time, Te, and surfacearea, A. The surface area is measured in terms of pixels that can be calibrated to yielddimensions of length squared. Thus for solutions and tissues, respectively, the observedoptical density is given the expressions below.
Yi et al. Page 3
Anal Biochem. Author manuscript; available in PMC 2012 February 13.
NIH
-PA Author Manuscript
NIH
-PA Author Manuscript
NIH
-PA Author Manuscript
K can be evaluated with standard solutions of known concentrations, and measuring the IODas a function of thickness allows estimation of both the concentration and tissue attenuationcoefficient of tissue samples containing a uniform concentration of fluorescent probe.
EXPERIMENTALAluminum (III) phthalocyanine chloride tetrasulfonic acid was purchased from FrontierScientific, Inc., Woburn, MA 01801. Water used in these experiments was deionized,distilled and deoxygenated. Cylinders of air were obtained from Minneapolis OxygenCompany (Minneapolis, Minnesota).
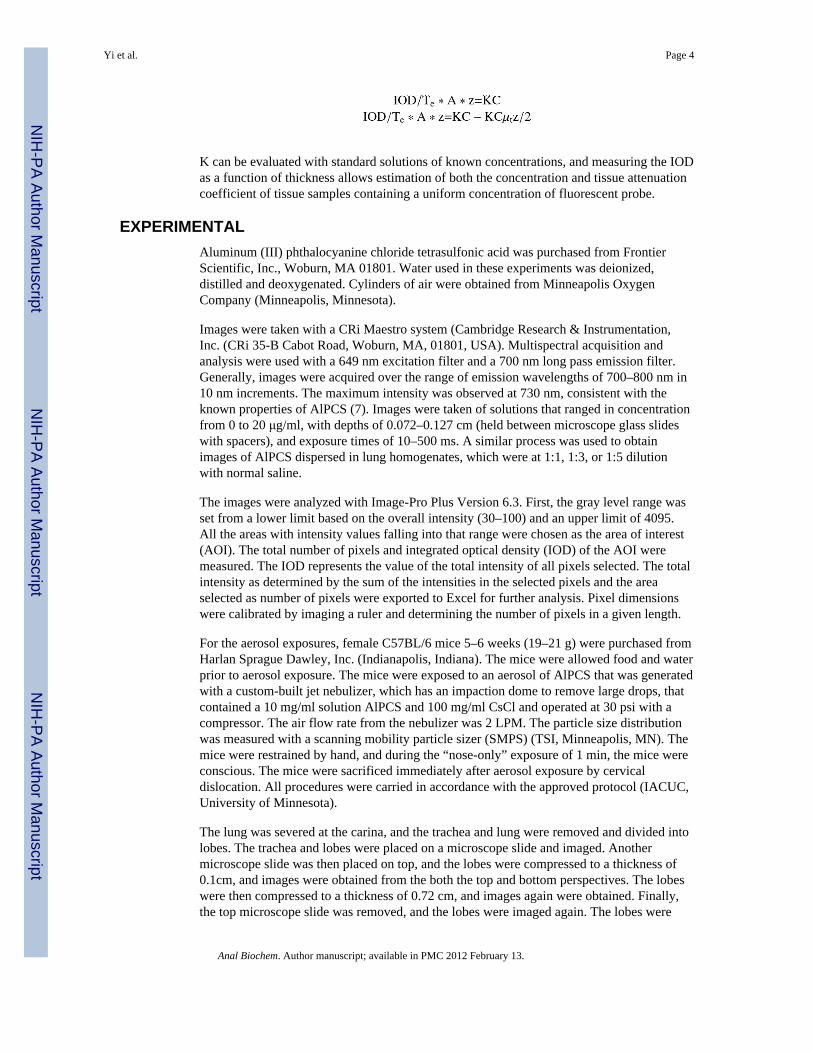
Images were taken with a CRi Maestro system (Cambridge Research & Instrumentation,Inc. (CRi 35-B Cabot Road, Woburn, MA, 01801, USA). Multispectral acquisition andanalysis were used with a 649 nm excitation filter and a 700 nm long pass emission filter.Generally, images were acquired over the range of emission wavelengths of 700–800 nm in10 nm increments. The maximum intensity was observed at 730 nm, consistent with theknown properties of AlPCS (7). Images were taken of solutions that ranged in concentrationfrom 0 to 20 μg/ml, with depths of 0.072–0.127 cm (held between microscope glass slideswith spacers), and exposure times of 10–500 ms. A similar process was used to obtainimages of AlPCS dispersed in lung homogenates, which were at 1:1, 1:3, or 1:5 dilutionwith normal saline.
The images were analyzed with Image-Pro Plus Version 6.3. First, the gray level range wasset from a lower limit based on the overall intensity (30–100) and an upper limit of 4095.All the areas with intensity values falling into that range were chosen as the area of interest(AOI). The total number of pixels and integrated optical density (IOD) of the AOI weremeasured. The IOD represents the value of the total intensity of all pixels selected. The totalintensity as determined by the sum of the intensities in the selected pixels and the areaselected as number of pixels were exported to Excel for further analysis. Pixel dimensionswere calibrated by imaging a ruler and determining the number of pixels in a given length.
For the aerosol exposures, female C57BL/6 mice 5–6 weeks (19–21 g) were purchased fromHarlan Sprague Dawley, Inc. (Indianapolis, Indiana). The mice were allowed food and waterprior to aerosol exposure. The mice were exposed to an aerosol of AlPCS that was generatedwith a custom-built jet nebulizer, which has an impaction dome to remove large drops, thatcontained a 10 mg/ml solution AlPCS and 100 mg/ml CsCl and operated at 30 psi with acompressor. The air flow rate from the nebulizer was 2 LPM. The particle size distributionwas measured with a scanning mobility particle sizer (SMPS) (TSI, Minneapolis, MN). Themice were restrained by hand, and during the “nose-only” exposure of 1 min, the mice wereconscious. The mice were sacrificed immediately after aerosol exposure by cervicaldislocation. All procedures were carried in accordance with the approved protocol (IACUC,University of Minnesota).
The lung was severed at the carina, and the trachea and lung were removed and divided intolobes. The trachea and lobes were placed on a microscope slide and imaged. Anothermicroscope slide was then placed on top, and the lobes were compressed to a thickness of0.1cm, and images were obtained from the both the top and bottom perspectives. The lobeswere then compressed to a thickness of 0.72 cm, and images again were obtained. Finally,the top microscope slide was removed, and the lobes were imaged again. The lobes were
Yi et al. Page 4
Anal Biochem. Author manuscript; available in PMC 2012 February 13.
NIH
-PA Author Manuscript
NIH
-PA Author Manuscript
NIH
-PA Author Manuscript

then weighed and stored at −20 °C. After thawing, three times the weight of buffer wasadded to only the lobes (trachea was not included), and then the mixture was homogenized.Images of the homogenate were obtained by confining the dispersion between twomicroscope slides and using identical acquisition parameters as above.
To compare the intensity values among different lungs, the images were taken on the sameday and with the same magnification, focus and exposure time. All images were saved in 12-bit gray scale files. The images were processed with Image-Pro plus 6.0 as described above.The tissue attenuation coefficient and concentration were estimated from the slope andintercept of a plot of the normalized intensity as a function of thickness.
RESULTSAs a prerequisite to analyzing biological samples, it is imperative to establish the sensitivityand functional dependency of the instrumental response function to area, exposure time,depth, and fluorophore concentration. It is generally accepted that the total intensity shouldincrease linearly with area; however, this presumes that the excitation intensity is uniform.In Figure 2, an image of an AlPCS solution. As can be seen, the uniformity of the intensityis reasonably good but not perfect. The inset depicts a line cut through the image obtainedwith Image-Pro that reveals more clearly that the intensity is greater in the center and fallsoff near the perimeter.
Because of the curvature at the edge of the liquid contained within the microscope slides, theperimeter is extremely bright. For uniform samples, a straightforward correction can beapplied to each pixel based on the measurement of the intensity of a uniform sample. Non-uniform samples are problematic, particularly with the instrument that was used in thisstudy, which has four sources of excitation light in a rectangular array that illuminate thesample at an approximately 45° angle from the horizontal plane.
The second parameter is exposure time. Here again, the presumption is that the excitationrate in terms of photons reaching the fluorophore and emission rate in terms of photonsreaching the detector are constant with time. This would give rise to a collection rate that isconstant and therefore the intensity would be proportional to exposure time. This wasconfirmed by the linear plots shown in Figure 3, where the intensity normalized to pixel areais given as a function of exposure time for a 10 μg/ml solution. Due to the relatively highconcentration and sensitive instrumentation, relatively short exposure times were used, andso there was little concern of photobleaching with AlPCS, which has good photostability (7).The three distinct lines shown in Figure 3 arise from images taken of three solutions with thesame concentration but depths of 0.072, 0.1000, and 0.1270 cm. The slopes calculated withleast squares regression were 6.11, 7.24 and 10.86/pixel*ms, which are proportionatelygreater with increasing depth.
The approach above was extended to an examination of different concentrations. In Figure4, the intensity was normalized to area and depth and plotted as a function of exposure time.In this graph, each individual data point represents the mean of the results from the threedifferent solution depths. It should be noted that at a given exposure time linear relationshipswere found with the intensity plotted as a function of concentration up to a value of 10 μg/ml. However at 20 μg/ml, deviation from linearity was observed (not shown) consistent withself-quenching of fluorescent molecules.
For tissues, it would be ideal to obtain an image of an intact lung lobe containing a uniformconcentration fluorophore; however, this is not practically possible because of the non-uniformity of the tissue and potential change in the tissue properties giving rise to timedependence of the attenuation coefficients. As an alternative approach, a lung homogenate
Yi et al. Page 5
Anal Biochem. Author manuscript; available in PMC 2012 February 13.
NIH
-PA Author Manuscript
NIH
-PA Author Manuscript
NIH
-PA Author Manuscript

was prepared, various amounts of AlPCS were added, and images were obtained as afunction of exposure time, AlPCS concentration, depth, and homogenate concentration. Theintensity was normalized to area and exposure time and plotted as a function ofconcentration for the three designated depths as shown in Figure 5. Analogous results to theaqueous solutions were found in terms of the linearity of the response, but as expected, theobserved intensity was lower. From the reduction in intensity, the attenuation coefficientwas estimated 5.5 cm−1 for the 1:1 dilution.
For the final set of experiments, image analysis was used to assess the deposition of aerosolparticles of AlPCS in the mouse lung and distribution among the lung lobes. The geometricmean particle size and associated geometric standard deviation for the aerosol was 390 nm ±1.81. The image of the separated lung lobes is shown in Figure 6a. It is evident that theintensity is not uniform despite the expectation that the small particle size of the aerosolwould lead to relatively uniform deposition throughout the alveoli of the lungs. The curvedsurface coupled with the shallow depth of field cause certain areas of the image to appearout of focus. The curved surface of the intact lobes also would lead to collection of light at aspecific charged-couple device (CCD) that does not correspond to the pixel directly beneath,since the refractive index difference between air and the tissue will cause the lung lobes toact as lenses. In Figure 6 panel b, the image was obtained from lobes that underwentcompression and then were decompressed. While the images are similar, a closeexamination reveals that the detailed image intensity has been altered. It should be noted thatthe lungs underwent movement in removing the upper slide, so changes can not be uniquelyascribed to the compression process.
The image depicted in panel c of Figure 6 was obtained with compression of the lobes to athickness of 0.1 cm. Comparing this image with the uncompressed lung, the clarity isimproved, the lobes occupy a larger area and intensity is more uniform in that there is a lossof intensity in the bright areas that is seen with the uncompressed lobes. With furthercompression to 0.072 cm (Figure 6d), the area occupied increases further, and the intensityappears to lessen. Finally, images obtained from the reverse side (not shown) were distinctin terms of the intensity distribution but equal in terms of observed area.
Analysis of the intensity of each lobe as a function of thickness allowed estimation of theattenuation coefficient. The results are given in Table I where the lobes and trachea weregiven the following designations, L:left, RS:right superior, RM:right medial, RI:rightinferior, PC:post caudal, and T:trachea. L, RS, RM, and RI had similar attenuationcoefficients ranging from about 6 to values less than 11 cm−1. PC and T had larger values,which is not surprising for the trachea, since it contains significantly more cartilage. Thelarger values of PC may be related to its irregular shape. The value itself clearly indicatesthe significant loss of intensity with depth, where using an attenuation coefficient of 10cm−1, the intensity will fall to 1/e at a distance of 1 mm.
In addition to the attenuation coefficient, the concentration of the deposited fluorophore wasestimated for each lobe by extrapolation to zero thickness. In Table I, the mean and standarddeviation for three replicates are given. For the aerosol, the concentrations in the lobesranged from 1.8 to 2.9 μg/ml and were not significantly different by pair-wise comparisons.The trachea had a similar value of 2.37 μg/ml. The standard deviations were similar to otherstudies in which the total lung concentration was determined following aerosol exposure(11). Interestingly, the variability was comparable when averaged across the different lobesfor the same animal (data not shown) or across the same lobe for different animals (Table I).The total concentration was determined to be 1.74 ± 0.49 μg/ml from analysis of theintensity of the homogenized lung, which is in reasonable agreement with that estimatedfrom intact lungs.
Yi et al. Page 6
Anal Biochem. Author manuscript; available in PMC 2012 February 13.
NIH
-PA Author Manuscript
NIH
-PA Author Manuscript
NIH
-PA Author Manuscript

With compression, the thickness of each lobe is known and the area can be estimated fromthe image, which allows the volume to be calculated. The results from the pixel calibrationwere 175.5 pixels/mm. The results are given in Figure 7 where a thickness of 0.072 cm wasused. The total mean volume was 244 ± 21 mm3, which was approximately 10 % smallerthan that obtained with a compression thickness of 0.1 cm. The mass of the lung was alsodetermined from which the density was calculated. The density ranged from 0.3 to 0.4 g/ml,which is a reasonable value for a deflated lung. With the AlPCS concentration in each lobeand the estimated volume, the mass deposited can be calculated. The values are also given inFigure 7. The distribution of mass correlates with the size of the lobe, which is consistentwith equivalent inflation per mass of the lobes.
DISCUSSIONTo develop respiratory drug delivery systems that are spatially selective in the deposition ofdrug, methods are needed to quantify the success of the delivery system. Althoughsophisticated methods such as PET or helical CT/gamma scintigraphy have been used, theexpensive instrumentation, use of radioactivity, and specialized chemical labeling limit thebroad utility. Moreover, they typically lack the needed spatial resolution for imaging smallrodents. The extensive commercialization of digital cameras, image analyses, andcomputational software makes the use of fluorescence imaging an attractive alternative. Thishas been further enhanced by the introduction of molecular probes that absorb and emit lightin the near infrared, which reduces the extent of tissue attenuation (7,8,12).
In developing methodology for quantifying the distribution of aerosol particles in the lung,the severe problem of tissue attenuation is difficult to overcome when using a live animal.Moreover, the two dimensional images require reconstruction to the three dimensionalanatomical organ (13–15). As such, the path taken here was to excise the lungs and separatethe organ into lobes. The curvature of the tissue causes distortion of the direction of the pathof light secondary to the change in refractive index. This problem was solved bycompressing each lobe between flat microscope slides. The thickness compression wascontrolled by spacers. This had the added benefit of reducing the extent of tissue attenuation.In fact, with the functional dependence of tissue attenuation assumed to be exponential, thevalue of the attenuation was estimated, which in turn was used to correct the observedintensity for quantifying the concentration of the probe in the lobe. Also, it readily allowedfor measurement from two different perspectives, top and bottom, which further reduces theattenuation problem by dividing the thickness in half.
The tissue attenuation coefficients estimated here ranged from 6 to less than 11 cm−1. Thesevalues are higher compared to those of Comsa et al (7), who examined liver and muscleusing AlPCS as a point source. Since the lung is composed of alveoli that contain air, it is amuch more complicated tissue from the perspective of light passage. Specifically, theheterogeneity of the refractive index due to the air/tissue interfaces can be expected toincrease light scattering. The air filled alveoli introduce the possibility of multiple lightreflections at the curved surfaces. These issues pose significant experimental and theoreticalissues for assessing the distribution of drug within a lobe, but by limiting the analysis tointact lobes, the complications were avoided.
Homogenizing the lung lobes clearly minimized the heterogeneity of the sample as wasevident from the images. The reasonable agreement between the estimated concentrationsfrom images of intact lobes and lung homogenate indicate that the heterogeneity of theimage is related to heterogeneity in the tissue attenuation. It was evident with a number oflobes that the presence of connective tissue attenuated light to a much greater extent thannormal lung tissue. Thus, in excising and separating the lung lobes, it is important to remove
Yi et al. Page 7
Anal Biochem. Author manuscript; available in PMC 2012 February 13.
NIH
-PA Author Manuscript
NIH
-PA Author Manuscript
NIH
-PA Author Manuscript

this material. Blood appeared to have a much greater attenuation coefficient than other tissueand interstitial fluid. Clotted blood is especially opaque and thereby potentially gives rise tonon-uniformity unless carefully removed/avoided. On the other hand, it opens the possibilityof flushing the lungs by passing saline or appropriate buffer through the lungs via thebronchial artery/right atrium of the heart.
For the distribution of aerosols, the results indicate that the concentration was uniformamong the different lobes. Combining the quantitative analysis of the concentration withimage analysis of the area/thickness, the mass deposited was readily determined. Thisapproach could be combined with microscopic analysis to reveal the specific distribution ofaerosols in each lobe.
AcknowledgmentsFinancial support was provided in part by NIH Grant HL081789 (AN). DY was supported by a fellowship fromChina Scholarship Council.
References1. Martin AR, Thompson RB, Finlay WH. J Aerosol Med Pulm Drug Deliv. 2008; 21:335–42.
[PubMed: 18800881]2. Dolovich MB. Proc Am Thorac Soc. 2009; 6:477–85. [PubMed: 19687222]3. Eberl S, Chan HK, Daviskas E. J Aerosol Med. 2006; 19:8–20. [PubMed: 16551210]4. Weers J, Metzheiser B, Taylor G, Warren S, Meers P, Perkins WR. J Aerosol Med Pulm Drug
Deliv. 2009; 22:131–8. [PubMed: 19422313]5. Ntziachristos V, Culver JP, Rice BW. J Biomed Opt. 2008; 13:011001. [PubMed: 18456953]6. Ntziachristos V. Proc Am Thorac Soc. 2009; 6:416–8. [PubMed: 19687213]7. Comsa DC, Farrell TJ, Patterson MS. Phys Med Biol. 2008; 53:5797–814. [PubMed: 18827315]8. Adams KE, Ke S, Kwon S, Liang F, Fan Z, Lu Y, Hirschi K, Mawad ME, Barry MA, Sevick-
Muraca EM. J Biomed Opt. 2007; 12:024017. [PubMed: 17477732]9. Mohajerani P, Adibi A, Kempner J, Yared W. J Biomed Opt. 2009; 14:034021. [PubMed:
19566314]10. Chen TW, Lin BJ, Brunner E, Schild D. Biophys J. 2006; 90:2534–47. [PubMed: 16387783]11. Liao X, Liang W, Wiedmann T, Wattenberg L, Dahl A. Exp Lung Res. 2004; 30:755–69.
[PubMed: 15700551]12. Kovar JL, Simpson MA, Schutz-Geschwender A, Olive DM. Anal Biochem. 2007; 367:1–12.
[PubMed: 17521598]13. Xia Z, Huang X, Zhou X, Sun Y, Ntziachristos V, Wong ST. IEEE Trans Inf Technol Biomed.
2008; 12:569–78. [PubMed: 18779071]14. Rostami AA. Inhal Toxicol. 2009; 21:262–90. [PubMed: 19235608]15. Jaafar-Maalej C, Andrieu V, Elaissari A, Fessi H. Expert Opin Drug Deliv. 2009; 6:941–59.
[PubMed: 19637979]
Yi et al. Page 8
Anal Biochem. Author manuscript; available in PMC 2012 February 13.
NIH
-PA Author Manuscript
NIH
-PA Author Manuscript
NIH
-PA Author Manuscript

Figure 1.Schematic diagram of processes affecting the light intensity (a) attenuation of excitationlight, (b) light absorption by fluorophore, (c) fluorescent light emission, and (d) attenuationof emitted light and relationship to the geometry of the image. The axis system used isshown to the right with z taken as a measure of depth starting from the surface of the tissue.The four dotted lines indicate the diagonal arrangement of the four excitation light sourcespositioned at a 45° angle to the plane of the surface of the sample.
Yi et al. Page 9
Anal Biochem. Author manuscript; available in PMC 2012 February 13.
NIH
-PA Author Manuscript
NIH
-PA Author Manuscript
NIH
-PA Author Manuscript

Figure 2.(a) Image of 10 ug/ml AlPCS solution contained between two microscope slides with pointP1 indicating the center of the four sources of light and the lines indicating the line cutsalong which the intensity was measured using Image-Pro software with the values given inplot (b) where the intensity of the horizontal line (left) is given as a function of pixel numberand a similar plot is given for the 45° line (right) where the pixel number corresponds to agreater length by the square root of two.
Yi et al. Page 10
Anal Biochem. Author manuscript; available in PMC 2012 February 13.
NIH
-PA Author Manuscript
NIH
-PA Author Manuscript
NIH
-PA Author Manuscript

Figure 3.Images of a 5 μg/ml solution of AlPCS where obtained as a function of exposure timeconstrained to a specified depth, and the integrated intensity normalized to the number ofpixels is plotted as a function of exposure time for three depths of (▲) 0.072, (■) 0.1, and(◆) 0.127 cm (n=3, where the SD is smaller than the size of the point).
Yi et al. Page 11
Anal Biochem. Author manuscript; available in PMC 2012 February 13.
NIH
-PA Author Manuscript
NIH
-PA Author Manuscript
NIH
-PA Author Manuscript

Figure 4.Images of three different solutions of AlPCS with concentrations of (▲) 2.5, (■) 5, and (◆)10 μg/ml were obtained as a function of exposure time, and the integrated intensitynormalized to the number of pixels and solution height in centimeters is plotted as a functionof exposure time (n=3, where the SD is smaller than the size of the point).
Yi et al. Page 12
Anal Biochem. Author manuscript; available in PMC 2012 February 13.
NIH
-PA Author Manuscript
NIH
-PA Author Manuscript
NIH
-PA Author Manuscript

Figure 5.Images of the AlPCS in lung homogenate:buffer dispersion (1:1) with depths of (▲) 0.072,(■) 0.1, and (◆) 0.127 cm were obtained as a function of concentration and the integratedintensity normalized to the number of pixels, A, and exposure time, Te, is plotted as afunction of concentration (n=3, where the SD is smaller than the size of the point).
Yi et al. Page 13
Anal Biochem. Author manuscript; available in PMC 2012 February 13.
NIH
-PA Author Manuscript
NIH
-PA Author Manuscript
NIH
-PA Author Manuscript

Figure 6.Mice were exposed to an aerosol of AlPCS and the above figure of the lung lobes wereobtained by converting the raw images to a 12 bit gray scale and increasing the contrast ofeach image in an identical manner where (a) initial excised lobes, (b) lobes aftercompression, (c) lobes compressed to a thickness of 0.1 cm, (d) compressed to a thickness of0.072 cm. The lobe designations are L:left, RS:right superior, RM:right medial, RI:rightinferior, PC:post caudal, and T:trachea
Yi et al. Page 14
Anal Biochem. Author manuscript; available in PMC 2012 February 13.
NIH
-PA Author Manuscript
NIH
-PA Author Manuscript
NIH
-PA Author Manuscript

Figure 7.Lung lobe volumes were calculated from the product of the area and depth of imagesobtained following aerosol exposure, and the mass of AlPCS was determined in each lobefrom the product of the concentration estimated from the extrapolated value of the intensityat zero depth and the lobe volume (n=3, ± SD). The lobe designations are L:left, RS:rightsuperior, RM:right medial, RI:right inferior, PC:post caudal, and T:trachea.
Yi et al. Page 15
Anal Biochem. Author manuscript; available in PMC 2012 February 13.
NIH
-PA Author Manuscript
NIH
-PA Author Manuscript
NIH
-PA Author Manuscript

NIH
-PA Author Manuscript
NIH
-PA Author Manuscript
NIH
-PA Author Manuscript
Yi et al. Page 16
Tabl
e I
Mic
e w
ere
expo
sed
to a
n ae
roso
l of A
lPC
S an
d th
e lu
ngs w
ere
exci
sed,
com
pres
sed
to tw
o di
ffer
ent t
hick
ness
es, a
nd im
aged
. Im
ageP
ro w
as u
sed
tode
term
ined
the
inte
nsity
at e
ach
thic
knes
s and
the
atte
nuat
ion
coef
ficie
nts a
nd c
once
ntra
tion
of A
lPC
S (m
ean
± SD
, n=3
) wer
e ca
lcul
ated
as d
escr
ibed
inth
e ex
perim
enta
l sec
tion.
LR
SR
MR
IPC
T
Atte
nuat
ion
coef
ficie
nt, c
m−
16.
3 ±
1.2
8.3
± 1.
49.
1 ±
1.2
5.5
± 1.
610
.8 ±
0.5
10.7
± 1
.9
Con
cent
ratio
n, μ
g/g
2.89
± 0
.40
2.3
± 1.
12.
40 ±
0.3
91.
80 ±
0.0
82.
75 ±
0.5
92.
37 ±
0.9
6
Anal Biochem. Author manuscript; available in PMC 2012 February 13.
Copyright © 2022 FDOKUMEN