Simulations of heat and oxygen diffusion in UO2 nuclear fuel rods
Measurement and Analysis of Reactivity Worth of 241Am Sample
in Water-Moderated Low-Enriched UO2 Fuel Lattices at TCA
Takeshi SAKURAI1;�, Takamasa MORI1, Takenori SUZAKI1, Shigeaki OKAJIMA1,Yoshihira ANDO2, Toru YAMAMOTO2 and Peng Hong LIEM3
1Nuclear Science and Engineering Directorate, Japan Atomic Energy Agency, Tokai-mura, Naka-gun, Ibaraki 319-1195, Japan2Nuclear Energy System Safety Division, Japan Nuclear Energy Safety Organization, Toranomon, Minato-ku, Tokyo 105-0001, Japan
3NAIS Co. Inc., Tokai-mura, Naka-gun, Ibaraki 319-1112, Japan
(Received September 26, 2010 and accepted in revised form November 11, 2010)
The reactivity worths of 22.82 grams of 241Am oxide sample were measured and theoretically analyzedin water-moderated UO2 fuel lattices in seven cores of the Tank-Type Critical Assembly (TCA) at theJapan Atomic Energy Agency for an integral test of 241Am nuclear data. These cores provided a systematicvariation in the neutron spectrum between the thermal and resonance energy regions. The samplereactivity worth was measured with an uncertainty of 2.1% or less. The theoretical analysis was performedusing the JENDL-3.3 nuclear data by a Monte Carlo calculation method. Ratios of calculation to experi-ment (C/Es) of the reactivity worth were between 0.91 and 0.97, and showed no apparent dependence onthe neutron spectrum. In addition, sensitivity analysis based on the deterministic calculation method wascarried out to obtain the impact of changing the 241Am capture cross section on the sample reactivityworth. The result of this analysis showed that the C/E could be significantly improved by almostuniformly increasing the 241Am capture cross section of JENDL-3.3 by 25–30%.
KEYWORDS: 241Am, neutron capture cross section, sample reactivity worth, plutonium agingeffect, TCA, JENDL-3.3, MVP code, SRAC code system, THREEDANT code
I. Introduction
Americium-241 is a minor actinide with a long half-life.This nuclide is accumulated in the mixed-oxide (MOX) fuelthrough the decay of 241Pu with the half-life of 14 years. Theneutron capture cross section of 241Am is much larger thanthose of major actinides in the thermal and resonance energyregions. The decay of 241Pu to 241Am hence causes reactivityloss in the light water reactor (LWR) core loaded with thetime-elapsed MOX fuel rods. This reactivity loss is called‘‘plutonium aging effect.’’
The uncertainty of capture cross section of 241Am is sig-nificantly larger than those of major actinides. This nuclide,therefore, has an influence on the uncertainty of LWR core’scriticality when the core is loaded with the long-time-elapsed MOX fuel rods that contain a considerable amountof this nuclide. For instance, several studies1–5) have ana-lyzed the time dependence of the MOX-fueled LWR core’scriticality, and some of them have shown that the uncertaintyof the 241Am capture cross section caused the time depend-ence in the discrepancy of the criticality between the meas-urement and calculation. A limited number of reactor phys-ics experiments for this nuclide,6–8) however, is found, and
hence, there are not enough integral data to validate thecapture cross section of this nuclide in the thermal andresonance energy regions.
The lack of integral data for this nuclide led the authors toimplement a series of new experiments to produce them. Inthe present study, the reactivity worths of the 241Am samplewere measured in six kinds of low-enriched UO2 fuel latticeswith a light water moderator in the Tank-Type CriticalAssembly (TCA) of the Japan Atomic Energy Agency(JAEA). Water-to-fuel volume ratios of these lattices rangedfrom 0.56 to 3.00 to provide a systematic variation in theneutron spectrum between the thermal and resonance energyregions, so that an experimental database could be producedfor the reactivity worth of 241Am, which was sensitive to theneutron spectrum in these energy regions.
These measurements were theoretically analyzed withthe JENDL-3.3 nuclear data file.9) In addition, sensitivityanalysis was carried out to calculate the impact of changingthe 241Am capture cross section on the sample reactivityworth.
The present paper is organized as follows. Section IIprovides descriptions of the 241Am sample, core configura-tions, and techniques of measurement. Data and methodsused in the analysis are described in Sec. III. Results ofmeasurement and analysis are presented and discussed inSec. IV.
� 2011 Atomic Energy Society of Japan, All Rights Reserved.
�Corresponding author, E-mail: [email protected]
Journal of NUCLEAR SCIENCE and TECHNOLOGY, Vol. 48, No. 5, p. 816–825 (2011)
816
ARTICLE
II. Experiment
1. 241Am SampleThe 241Am sample used in the present experiment is
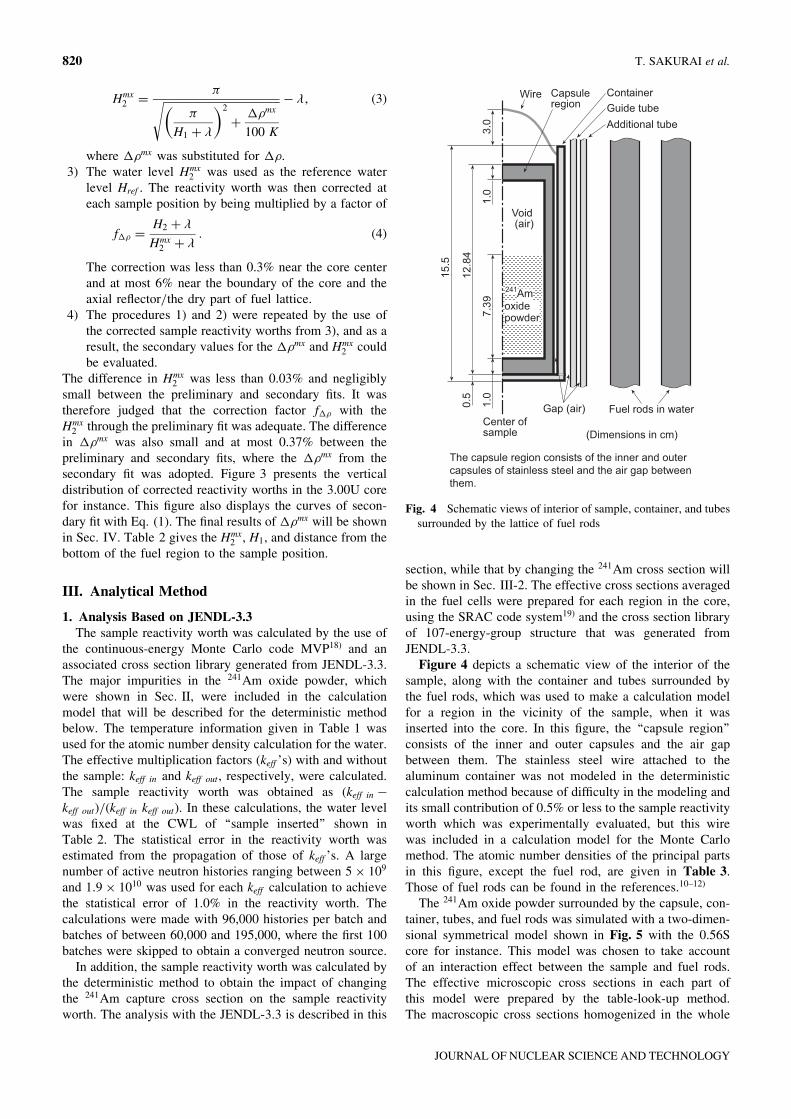
22.82 grams of the 241Am oxide powder that is packed indouble cylindrical capsules of stainless steel, which is sim-ilar to those for a 237Np sample.10) A part of the inside ofan inner capsule is filled with the 241Am oxide powder.The length of this part is 7.39 cm. An outer capsule isprepared to enclose the inner one for protection againsthazards caused by an inner capsule failure. The weightof stainless steel is 74.74 g for the entire assembly of thesample. A schematic view for the interior of the sample willbe shown in Sec. III-1.
The purity of the 241Am oxide powder is 90.6 wt%. Themajor impurities are 237Np (6.26 wt%), 243Am (0.25 wt%),232Th (0.04 wt%), the isotopes of lead (1.70 wt%), nickel(0.42 wt%), calcium (0.17 wt%), and iron (0.16 wt%). Thissample was prepared by the Oak Ridge National Laboratoryin 1980 and has been used for integral experiments on minoractinides in fast reactor cores at the FCA of JAEA.6)
Moreover, the sample was put in a cylindrical container ofaluminum and they were vertically moved in the core as willbe described in Sec. II-2. The weight of aluminum was26.1 g. A small piece of stainless steel wire of 1.3 g weightwas attached to this container to hold it. The container withthe sample inserted into the core will also be shown inSec. III-1 along with the composition of their principal parts,which will be used to make a calculation model for thetheoretical analysis.
2. Experimental Core ConfigurationThe measurements were performed in the six kinds of
square fuel lattices with the water-to-fuel volume ratios(Vm/Vf ’s) ranging between 0.56 and 3.00, which were builtin seven cores as listed in Table 1. These volume ratioscorrespond to the hydrogen-to-uranium atomic ratios (H/Us)between 1.6 and 8.6. Detailed specifications of low-enrichedUO2 fuel rods used in these cores can be found in the refer-ences.11,12) The arrays of fuel rods in these cores are the sameas those described in the reference,10) and hence, brief de-scriptions are given for the core configuration in the presentpaper.
The lattices with small Vm/Vf ’s of 0.56, 1.00, and 1.42were surrounded by another lattice with Vm/Vf of 1.44, sothat they formed two-region cores with the central test regionof various Vm/Vf ’s and the surrounding driver region offixed Vm/Vf . These cores were called 0.56S, 1.00S, and1.42S, respectively. The test and driver regions were builtwith the fuel rods of 3.205 and 2.596 wt% enriched uranium,respectively. Critical Water Levels (CWLs) that were meas-ured from the bottom of the fuel region ranged between 62and 66 cm in these ‘‘two-region cores.’’ The description ofthese CWLs will be given in Sec. II-3. These CWLs aredifferent from those in the reference.10)
The lattices with large Vm/Vf ’s of 1.50 and 3.00 werebuilt with the fuel rods of 2.596 wt% enriched uranium.These ‘‘uniform cores’’ were called 1.50U and 3.00U, re-spectively, and had CWLs of about 120 cm. A considerabledifference in CWL was found between these uniform coresand the foregoing two-region cores. For the lattice with theVm/Vf of 1.83, two uniform cores of 1.83U and 1.83ULwere built, using the fuel rods of 2.596 wt% enrichment.The former had the CWL of 132.2 cm. The latter was builtby adding more fuel rods to the 1.83U core for loweringthe CWL to 64.56 cm, which was similar to that of the two-region cores. The 1.83UL core was prepared to see theinfluence of different CWLs on the prediction accuracy ofsample reactivity worth.
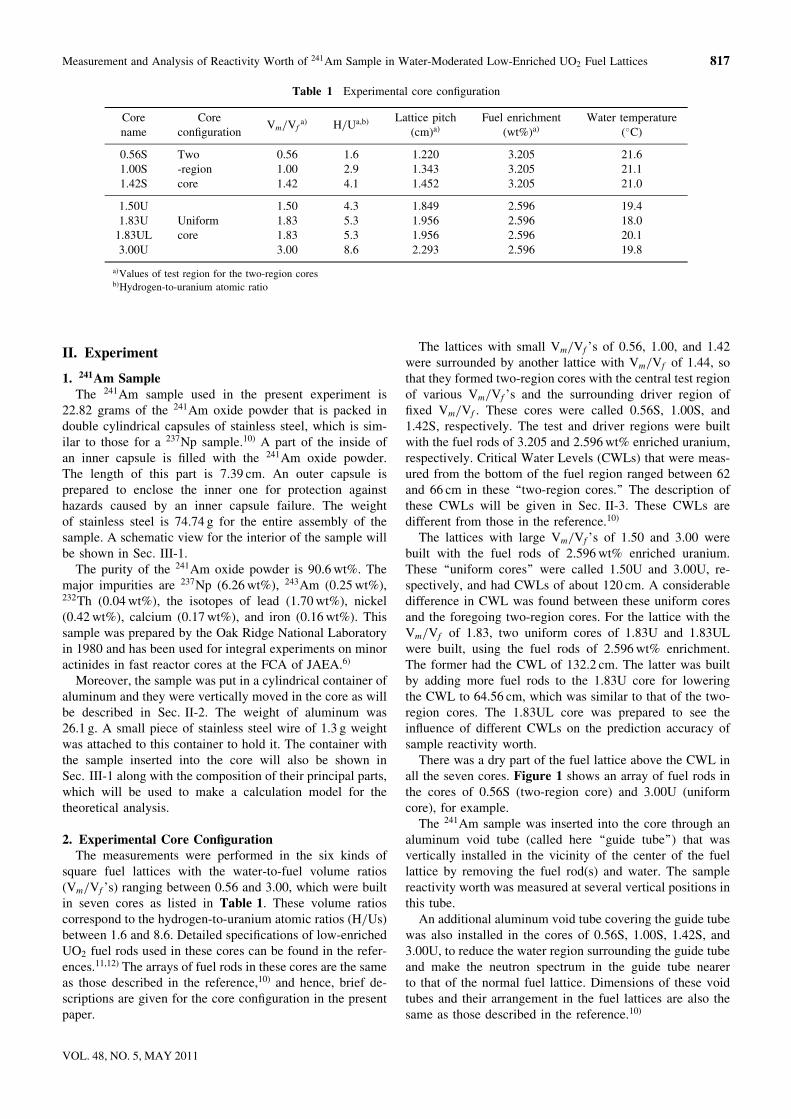
There was a dry part of the fuel lattice above the CWL inall the seven cores. Figure 1 shows an array of fuel rods inthe cores of 0.56S (two-region core) and 3.00U (uniformcore), for example.
The 241Am sample was inserted into the core through analuminum void tube (called here ‘‘guide tube’’) that wasvertically installed in the vicinity of the center of the fuellattice by removing the fuel rod(s) and water. The samplereactivity worth was measured at several vertical positions inthis tube.
An additional aluminum void tube covering the guide tubewas also installed in the cores of 0.56S, 1.00S, 1.42S, and3.00U, to reduce the water region surrounding the guide tubeand make the neutron spectrum in the guide tube nearerto that of the normal fuel lattice. Dimensions of these voidtubes and their arrangement in the fuel lattices are also thesame as those described in the reference.10)
Table 1 Experimental core configuration
Corename
Coreconfiguration
Vm/Vfa) H/Ua,b) Lattice pitch
(cm)a)Fuel enrichment
(wt%)a)Water temperature
(�C)
0.56S Two 0.56 1.6 1.220 3.205 21.61.00S -region 1.00 2.9 1.343 3.205 21.11.42S core 1.42 4.1 1.452 3.205 21.0
1.50U 1.50 4.3 1.849 2.596 19.41.83U Uniform 1.83 5.3 1.956 2.596 18.0
1.83UL core 1.83 5.3 1.956 2.596 20.13.00U 3.00 8.6 2.293 2.596 19.8
a)Values of test region for the two-region coresb)Hydrogen-to-uranium atomic ratio
Measurement and Analysis of Reactivity Worth of 241Am Sample in Water-Moderated Low-Enriched UO2 Fuel Lattices 817
VOL. 48, NO. 5, MAY 2011
In all the cores, an uncompensated ion chamber (UIC) wasinstalled in the horizontal reflector region to monitor theneutron flux level. In the 0.56S core, a regulating rod com-posed of 3.205 wt% enriched UO2 fuel was used for thereactivity worth measurement. This rod was placed in thedriver region as shown in Fig. 1.
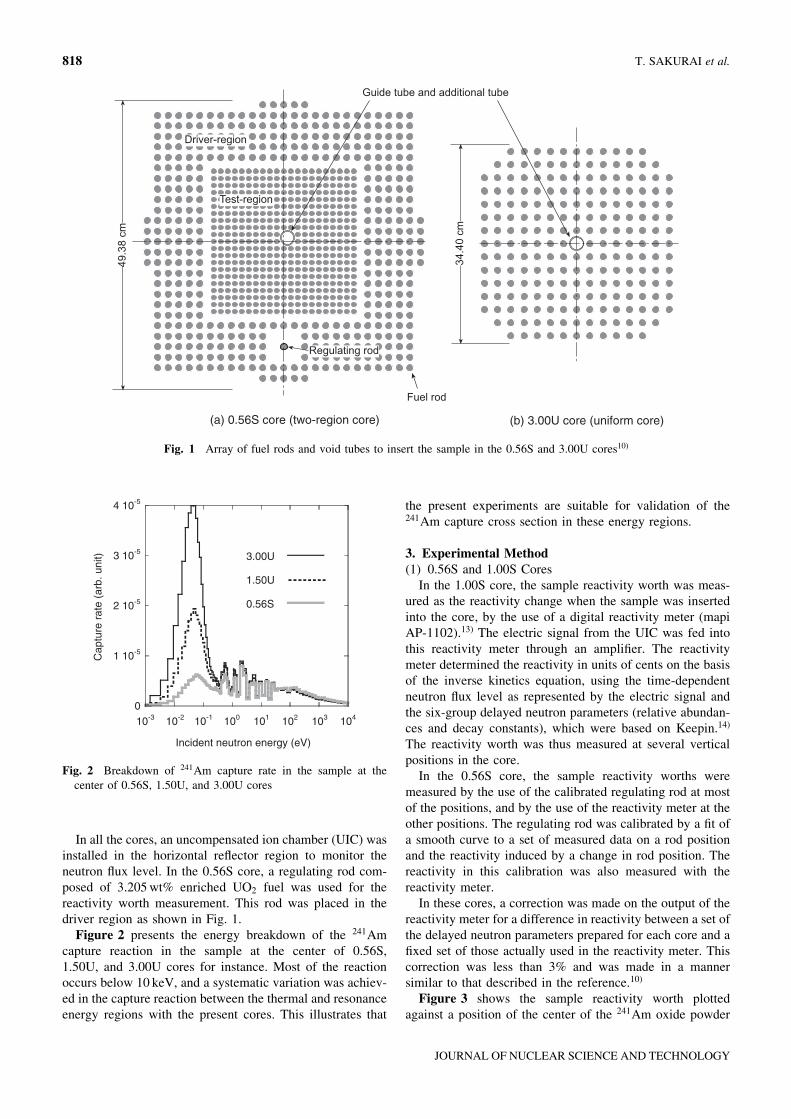
Figure 2 presents the energy breakdown of the 241Amcapture reaction in the sample at the center of 0.56S,1.50U, and 3.00U cores for instance. Most of the reactionoccurs below 10 keV, and a systematic variation was achiev-ed in the capture reaction between the thermal and resonanceenergy regions with the present cores. This illustrates that
the present experiments are suitable for validation of the241Am capture cross section in these energy regions.
3. Experimental Method(1) 0.56S and 1.00S Cores
In the 1.00S core, the sample reactivity worth was meas-ured as the reactivity change when the sample was insertedinto the core, by the use of a digital reactivity meter (mapiAP-1102).13) The electric signal from the UIC was fed intothis reactivity meter through an amplifier. The reactivitymeter determined the reactivity in units of cents on the basisof the inverse kinetics equation, using the time-dependentneutron flux level as represented by the electric signal andthe six-group delayed neutron parameters (relative abundan-ces and decay constants), which were based on Keepin.14)
The reactivity worth was thus measured at several verticalpositions in the core.
In the 0.56S core, the sample reactivity worths weremeasured by the use of the calibrated regulating rod at mostof the positions, and by the use of the reactivity meter at theother positions. The regulating rod was calibrated by a fit ofa smooth curve to a set of measured data on a rod positionand the reactivity induced by a change in rod position. Thereactivity in this calibration was also measured with thereactivity meter.
In these cores, a correction was made on the output of thereactivity meter for a difference in reactivity between a set ofthe delayed neutron parameters prepared for each core and afixed set of those actually used in the reactivity meter. Thiscorrection was less than 3% and was made in a mannersimilar to that described in the reference.10)
Figure 3 shows the sample reactivity worth plottedagainst a position of the center of the 241Am oxide powder
(a) 0.56S core (two-region core) (b) 3.00U core (uniform core)
Fig. 1 Array of fuel rods and void tubes to insert the sample in the 0.56S and 3.00U cores10)
0
1 10-5
2 10-5
3 10-5
4 10-5
10-3 10-2 10-1 100 101 102 103 104
Cap
ture
rat
e (a
rb. u
nit)
Incident neutron energy (eV)
3.00U
0.56S
1.50U
Fig. 2 Breakdown of 241Am capture rate in the sample at thecenter of 0.56S, 1.50U, and 3.00U cores
818 T. SAKURAI et al.
JOURNAL OF NUCLEAR SCIENCE AND TECHNOLOGY
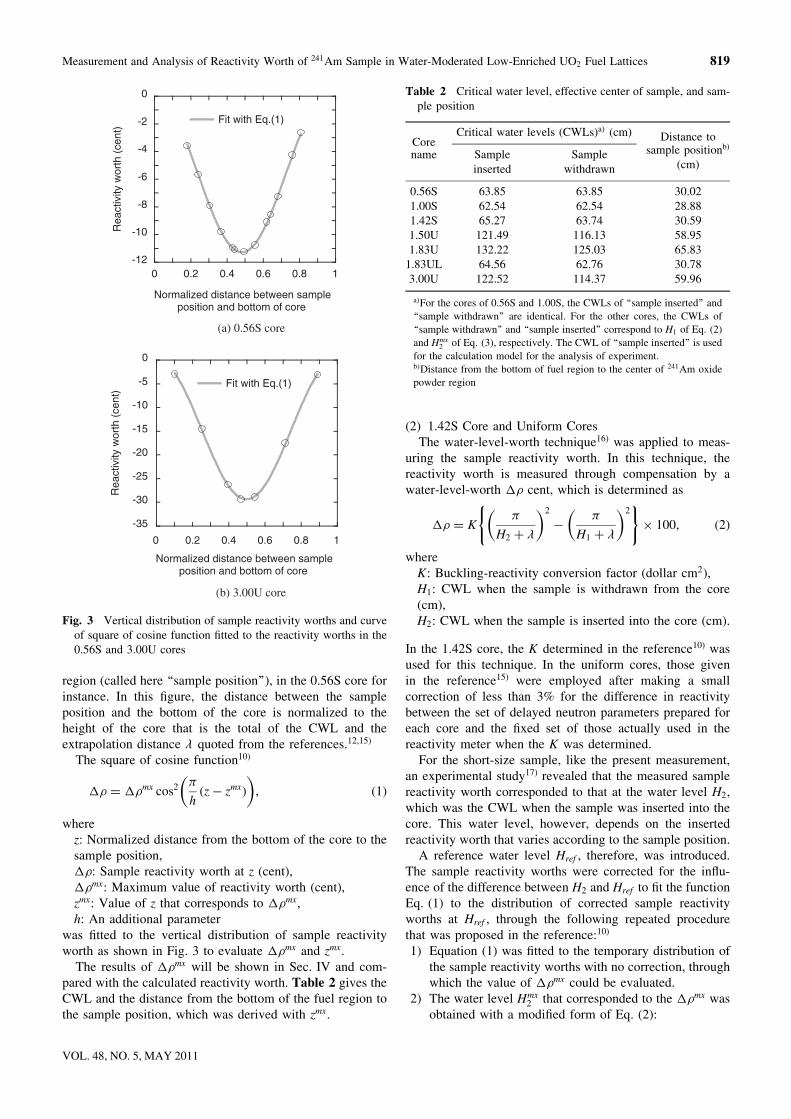
region (called here ‘‘sample position’’), in the 0.56S core forinstance. In this figure, the distance between the sampleposition and the bottom of the core is normalized to theheight of the core that is the total of the CWL and theextrapolation distance � quoted from the references.12,15)
The square of cosine function10)
�� ¼ ��mx cos2 �
hðz� zmxÞ
� �; ð1Þ
wherez: Normalized distance from the bottom of the core to thesample position,��: Sample reactivity worth at z (cent),��mx: Maximum value of reactivity worth (cent),zmx: Value of z that corresponds to ��mx,h: An additional parameter
was fitted to the vertical distribution of sample reactivityworth as shown in Fig. 3 to evaluate ��mx and zmx.
The results of ��mx will be shown in Sec. IV and com-pared with the calculated reactivity worth. Table 2 gives theCWL and the distance from the bottom of the fuel region tothe sample position, which was derived with zmx.
(2) 1.42S Core and Uniform CoresThe water-level-worth technique16) was applied to meas-
uring the sample reactivity worth. In this technique, thereactivity worth is measured through compensation by awater-level-worth �� cent, which is determined as
�� ¼ K�
H2 þ �
� �2
��
H1 þ �
� �2( )
� 100; ð2Þ
whereK: Buckling-reactivity conversion factor (dollar cm2),H1: CWL when the sample is withdrawn from the core(cm),H2: CWL when the sample is inserted into the core (cm).
In the 1.42S core, the K determined in the reference10) wasused for this technique. In the uniform cores, those givenin the reference15) were employed after making a smallcorrection of less than 3% for the difference in reactivitybetween the set of delayed neutron parameters prepared foreach core and the fixed set of those actually used in thereactivity meter when the K was determined.
For the short-size sample, like the present measurement,an experimental study17) revealed that the measured samplereactivity worth corresponded to that at the water level H2,which was the CWL when the sample was inserted into thecore. This water level, however, depends on the insertedreactivity worth that varies according to the sample position.
A reference water level Href , therefore, was introduced.The sample reactivity worths were corrected for the influ-ence of the difference between H2 and Href to fit the functionEq. (1) to the distribution of corrected sample reactivityworths at Href , through the following repeated procedurethat was proposed in the reference:10)
1) Equation (1) was fitted to the temporary distribution ofthe sample reactivity worths with no correction, throughwhich the value of ��mx could be evaluated.
2) The water level Hmx2 that corresponded to the ��mx was
obtained with a modified form of Eq. (2):
-12
-10
-8
-6
-4
-2
0
0 10.2 0.4 0.6 0.8
0 10.2 0.4 0.6 0.8
Rea
ctiv
ity w
orth
(ce
nt)
Normalized distance between sampleposition and bottom of core
Fit with Eq.(1)
(a) 0.56S core
-35
-30
-25
-20
-15
-10
-5
0
Rea
ctiv
ity w
orth
(ce
nt)
Normalized distance between sampleposition and bottom of core
Fit with Eq.(1)
(b) 3.00U core
Fig. 3 Vertical distribution of sample reactivity worths and curveof square of cosine function fitted to the reactivity worths in the0.56S and 3.00U cores
Table 2 Critical water level, effective center of sample, and sam-ple position
CoreCritical water levels (CWLs)a) (cm) Distance to
name Sampleinserted
Samplewithdrawn
sample positionb)
(cm)
0.56S 63.85 63.85 30.021.00S 62.54 62.54 28.881.42S 65.27 63.74 30.591.50U 121.49 116.13 58.951.83U 132.22 125.03 65.83
1.83UL 64.56 62.76 30.783.00U 122.52 114.37 59.96
a)For the cores of 0.56S and 1.00S, the CWLs of ‘‘sample inserted’’ and
‘‘sample withdrawn’’ are identical. For the other cores, the CWLs of
‘‘sample withdrawn’’ and ‘‘sample inserted’’ correspond to H1 of Eq. (2)
and Hmx2 of Eq. (3), respectively. The CWL of ‘‘sample inserted’’ is used
for the calculation model for the analysis of experiment.b)Distance from the bottom of fuel region to the center of 241Am oxide
powder region
Measurement and Analysis of Reactivity Worth of 241Am Sample in Water-Moderated Low-Enriched UO2 Fuel Lattices 819
VOL. 48, NO. 5, MAY 2011
Hmx2 ¼
�ffiffiffiffiffiffiffiffiffiffiffiffiffiffiffiffiffiffiffiffiffiffiffiffiffiffiffiffiffiffiffiffiffiffiffiffiffiffiffiffiffiffi��
H1 þ �
�2
þ��mx
100 K
s � �; ð3Þ
where ��mx was substituted for ��.3) The water level Hmx
2 was used as the reference waterlevel Href . The reactivity worth was then corrected ateach sample position by being multiplied by a factor of
f�� ¼H2 þ �Hmx
2 þ �: ð4Þ
The correction was less than 0.3% near the core centerand at most 6% near the boundary of the core and theaxial reflector/the dry part of fuel lattice.
4) The procedures 1) and 2) were repeated by the use ofthe corrected sample reactivity worths from 3), and as aresult, the secondary values for the ��mx and Hmx
2 couldbe evaluated.
The difference in Hmx2 was less than 0.03% and negligibly
small between the preliminary and secondary fits. It wastherefore judged that the correction factor f�� with theHmx
2 through the preliminary fit was adequate. The differencein ��mx was also small and at most 0.37% between thepreliminary and secondary fits, where the ��mx from thesecondary fit was adopted. Figure 3 presents the verticaldistribution of corrected reactivity worths in the 3.00U corefor instance. This figure also displays the curves of secon-dary fit with Eq. (1). The final results of ��mx will be shownin Sec. IV. Table 2 gives the Hmx
2 , H1, and distance from thebottom of the fuel region to the sample position.
III. Analytical Method
1. Analysis Based on JENDL-3.3The sample reactivity worth was calculated by the use of
the continuous-energy Monte Carlo code MVP18) and anassociated cross section library generated from JENDL-3.3.The major impurities in the 241Am oxide powder, whichwere shown in Sec. II, were included in the calculationmodel that will be described for the deterministic methodbelow. The temperature information given in Table 1 wasused for the atomic number density calculation for the water.The effective multiplication factors (keff ’s) with and withoutthe sample: keff in and keff out, respectively, were calculated.The sample reactivity worth was obtained as ðkeff in �keff outÞ=ðkeff in keff outÞ. In these calculations, the water levelwas fixed at the CWL of ‘‘sample inserted’’ shown inTable 2. The statistical error in the reactivity worth wasestimated from the propagation of those of keff ’s. A largenumber of active neutron histories ranging between 5� 109
and 1:9� 1010 was used for each keff calculation to achievethe statistical error of 1.0% in the reactivity worth. Thecalculations were made with 96,000 histories per batch andbatches of between 60,000 and 195,000, where the first 100batches were skipped to obtain a converged neutron source.
In addition, the sample reactivity worth was calculated bythe deterministic method to obtain the impact of changingthe 241Am capture cross section on the sample reactivityworth. The analysis with the JENDL-3.3 is described in this
section, while that by changing the 241Am cross section willbe shown in Sec. III-2. The effective cross sections averagedin the fuel cells were prepared for each region in the core,using the SRAC code system19) and the cross section libraryof 107-energy-group structure that was generated fromJENDL-3.3.
Figure 4 depicts a schematic view of the interior of thesample, along with the container and tubes surrounded bythe fuel rods, which was used to make a calculation modelfor a region in the vicinity of the sample, when it wasinserted into the core. In this figure, the ‘‘capsule region’’consists of the inner and outer capsules and the air gapbetween them. The stainless steel wire attached to thealuminum container was not modeled in the deterministiccalculation method because of difficulty in the modeling andits small contribution of 0.5% or less to the sample reactivityworth which was experimentally evaluated, but this wirewas included in a calculation model for the Monte Carlomethod. The atomic number densities of the principal partsin this figure, except the fuel rod, are given in Table 3.Those of fuel rods can be found in the references.10–12)
The 241Am oxide powder surrounded by the capsule, con-tainer, tubes, and fuel rods was simulated with a two-dimen-sional symmetrical model shown in Fig. 5 with the 0.56Score for instance. This model was chosen to take accountof an interaction effect between the sample and fuel rods.The effective microscopic cross sections in each part ofthis model were prepared by the table-look-up method.The macroscopic cross sections homogenized in the whole
Fig. 4 Schematic views of interior of sample, container, and tubessurrounded by the lattice of fuel rods
820 T. SAKURAI et al.
JOURNAL OF NUCLEAR SCIENCE AND TECHNOLOGY
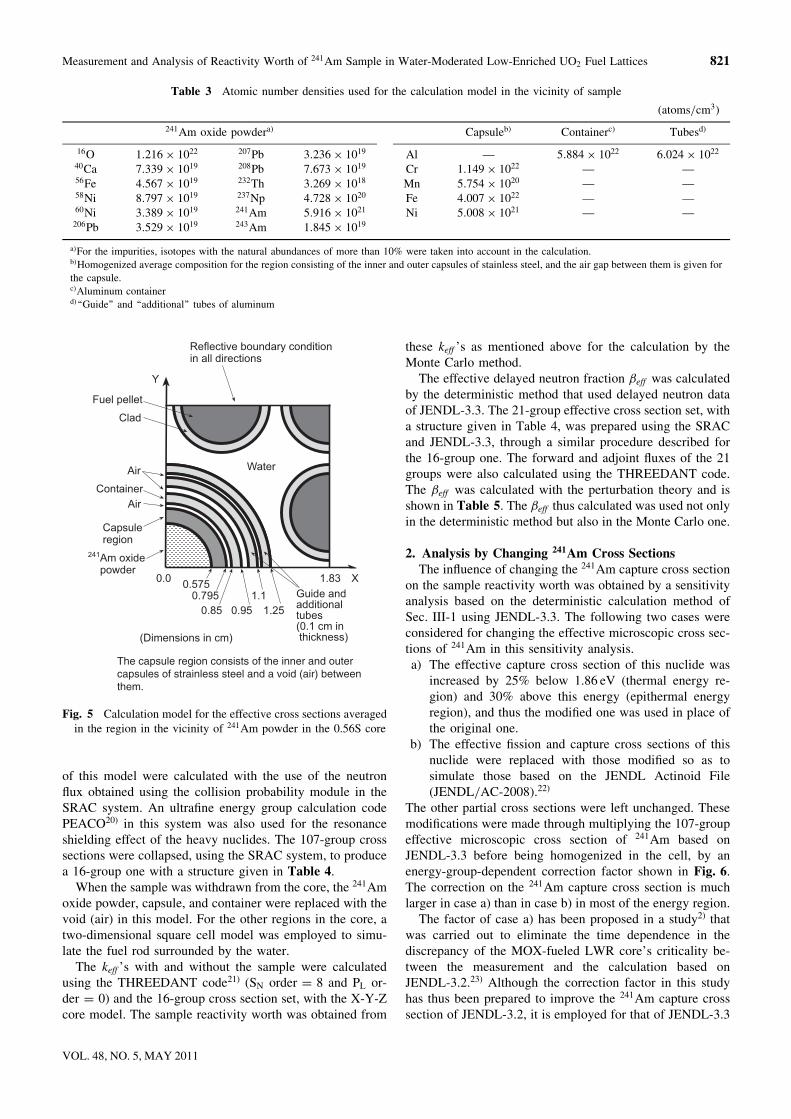
of this model were calculated with the use of the neutronflux obtained using the collision probability module in theSRAC system. An ultrafine energy group calculation codePEACO20) in this system was also used for the resonanceshielding effect of the heavy nuclides. The 107-group crosssections were collapsed, using the SRAC system, to producea 16-group one with a structure given in Table 4.
When the sample was withdrawn from the core, the 241Amoxide powder, capsule, and container were replaced with thevoid (air) in this model. For the other regions in the core, atwo-dimensional square cell model was employed to simu-late the fuel rod surrounded by the water.
The keff ’s with and without the sample were calculatedusing the THREEDANT code21) (SN order = 8 and PL or-der = 0) and the 16-group cross section set, with the X-Y-Zcore model. The sample reactivity worth was obtained from
these keff ’s as mentioned above for the calculation by theMonte Carlo method.
The effective delayed neutron fraction �eff was calculatedby the deterministic method that used delayed neutron dataof JENDL-3.3. The 21-group effective cross section set, witha structure given in Table 4, was prepared using the SRACand JENDL-3.3, through a similar procedure described forthe 16-group one. The forward and adjoint fluxes of the 21groups were also calculated using the THREEDANT code.The �eff was calculated with the perturbation theory and isshown in Table 5. The �eff thus calculated was used not onlyin the deterministic method but also in the Monte Carlo one.
2. Analysis by Changing 241Am Cross SectionsThe influence of changing the 241Am capture cross section
on the sample reactivity worth was obtained by a sensitivityanalysis based on the deterministic calculation method ofSec. III-1 using JENDL-3.3. The following two cases wereconsidered for changing the effective microscopic cross sec-tions of 241Am in this sensitivity analysis.a) The effective capture cross section of this nuclide was
increased by 25% below 1.86 eV (thermal energy re-gion) and 30% above this energy (epithermal energyregion), and thus the modified one was used in place ofthe original one.
b) The effective fission and capture cross sections of thisnuclide were replaced with those modified so as tosimulate those based on the JENDL Actinoid File(JENDL/AC-2008).22)
The other partial cross sections were left unchanged. Thesemodifications were made through multiplying the 107-groupeffective microscopic cross section of 241Am based onJENDL-3.3 before being homogenized in the cell, by anenergy-group-dependent correction factor shown in Fig. 6.The correction on the 241Am capture cross section is muchlarger in case a) than in case b) in most of the energy region.
The factor of case a) has been proposed in a study2) thatwas carried out to eliminate the time dependence in thediscrepancy of the MOX-fueled LWR core’s criticality be-tween the measurement and the calculation based onJENDL-3.2.23) Although the correction factor in this studyhas thus been prepared to improve the 241Am capture crosssection of JENDL-3.2, it is employed for that of JENDL-3.3
The capsule region consists of the inner and outercapsules of strainless steel and a void (air) betweenthem.
Fig. 5 Calculation model for the effective cross sections averagedin the region in the vicinity of 241Am powder in the 0.56S core
Table 3 Atomic number densities used for the calculation model in the vicinity of sample
(atoms/cm3)
241Am oxide powdera) Capsuleb) Containerc) Tubesd)
16O 1:216� 1022 207Pb 3:236� 1019 Al — 5:884� 1022 6:024� 1022
40Ca 7:339� 1019 208Pb 7:673� 1019 Cr 1:149� 1022 — —56Fe 4:567� 1019 232Th 3:269� 1018 Mn 5:754� 1020 — —58Ni 8:797� 1019 237Np 4:728� 1020 Fe 4:007� 1022 — —60Ni 3:389� 1019 241Am 5:916� 1021 Ni 5:008� 1021 — —206Pb 3:529� 1019 243Am 1:845� 1019
a)For the impurities, isotopes with the natural abundances of more than 10% were taken into account in the calculation.b)Homogenized average composition for the region consisting of the inner and outer capsules of stainless steel, and the air gap between them is given for
the capsule.c)Aluminum containerd)‘‘Guide’’ and ‘‘additional’’ tubes of aluminum
Measurement and Analysis of Reactivity Worth of 241Am Sample in Water-Moderated Low-Enriched UO2 Fuel Lattices 821
VOL. 48, NO. 5, MAY 2011
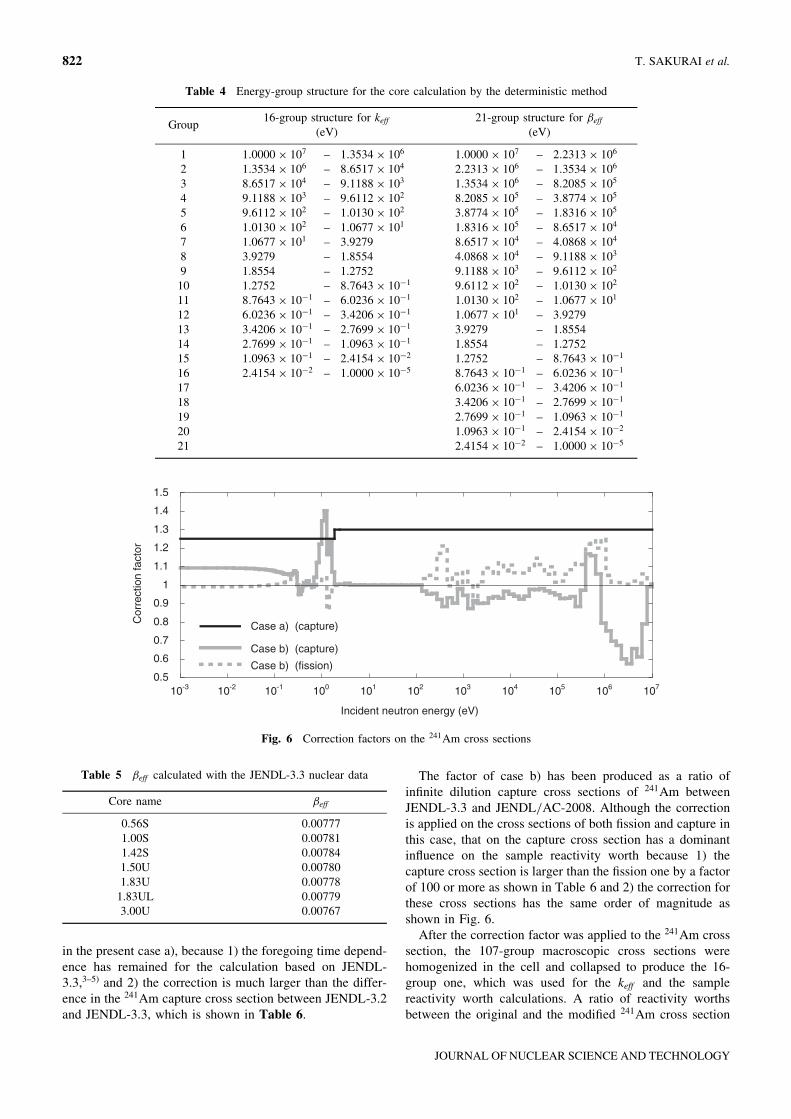
in the present case a), because 1) the foregoing time depend-ence has remained for the calculation based on JENDL-3.3,3–5) and 2) the correction is much larger than the differ-ence in the 241Am capture cross section between JENDL-3.2and JENDL-3.3, which is shown in Table 6.
The factor of case b) has been produced as a ratio ofinfinite dilution capture cross sections of 241Am betweenJENDL-3.3 and JENDL/AC-2008. Although the correctionis applied on the cross sections of both fission and capture inthis case, that on the capture cross section has a dominantinfluence on the sample reactivity worth because 1) thecapture cross section is larger than the fission one by a factorof 100 or more as shown in Table 6 and 2) the correction forthese cross sections has the same order of magnitude asshown in Fig. 6.
After the correction factor was applied to the 241Am crosssection, the 107-group macroscopic cross sections werehomogenized in the cell and collapsed to produce the 16-group one, which was used for the keff and the samplereactivity worth calculations. A ratio of reactivity worthsbetween the original and the modified 241Am cross section
0.5
0.6
0.7
0.8
0.9
1
1.1
1.2
1.3
1.4
1.5
10-3 10-2 10-1 100 101 102 103 104 105 106 107
Cor
rect
ion
fact
or
Incident neutron energy (eV)
Case b) (capture)
Case b) (fission)
Case a) (capture)
Fig. 6 Correction factors on the 241Am cross sections
Table 5 �eff calculated with the JENDL-3.3 nuclear data
Core name �eff
0.56S 0.007771.00S 0.007811.42S 0.007841.50U 0.007801.83U 0.00778
1.83UL 0.007793.00U 0.00767
Table 4 Energy-group structure for the core calculation by the deterministic method
Group16-group structure for keff
(eV)21-group structure for �eff
(eV)
1 1:0000� 107 – 1:3534� 106 1:0000� 107 – 2:2313� 106
2 1:3534� 106 – 8:6517� 104 2:2313� 106 – 1:3534� 106
3 8:6517� 104 – 9:1188� 103 1:3534� 106 – 8:2085� 105
4 9:1188� 103 – 9:6112� 102 8:2085� 105 – 3:8774� 105
5 9:6112� 102 – 1:0130� 102 3:8774� 105 – 1:8316� 105
6 1:0130� 102 – 1:0677� 101 1:8316� 105 – 8:6517� 104
7 1:0677� 101 – 3.9279 8:6517� 104 – 4:0868� 104
8 3.9279 – 1.8554 4:0868� 104 – 9:1188� 103
9 1.8554 – 1.2752 9:1188� 103 – 9:6112� 102
10 1.2752 – 8:7643� 10�1 9:6112� 102 – 1:0130� 102
11 8:7643� 10�1 – 6:0236� 10�1 1:0130� 102 – 1:0677� 101
12 6:0236� 10�1 – 3:4206� 10�1 1:0677� 101 – 3.927913 3:4206� 10�1 – 2:7699� 10�1 3.9279 – 1.855414 2:7699� 10�1 – 1:0963� 10�1 1.8554 – 1.275215 1:0963� 10�1 – 2:4154� 10�2 1.2752 – 8:7643� 10�1
16 2:4154� 10�2 – 1:0000� 10�5 8:7643� 10�1 – 6:0236� 10�1
17 6:0236� 10�1 – 3:4206� 10�1
18 3:4206� 10�1 – 2:7699� 10�1
19 2:7699� 10�1 – 1:0963� 10�1
20 1:0963� 10�1 – 2:4154� 10�2
21 2:4154� 10�2 – 1:0000� 10�5
822 T. SAKURAI et al.
JOURNAL OF NUCLEAR SCIENCE AND TECHNOLOGY
was calculated for the cases of both a) and b). Finally, thereactivity worth based on the modified cross sections wascalculated as a product of the ratio and the reactivity worthbased on JENDL-3.3 by the Monte Carlo calculation methodof Sec. III-1.
IV. Results and Discussion
1. MeasurementThe measured reactivity worths are presented in Table 7,
where the values of ��mx evaluated with Eq. (1) are shown.The reactivity worths are distributed between �35 and �11
cent and were obtained with uncertainties of 2.1% or less(one � level).
Table 8 shows a breakdown of ��mx uncertainty for eachof the measurement techniques. In the 1.42S and uniformcores, the reactivity worths were measured with the water-level-worth technique. In these cores, the uncertainty in the��mx was estimated from those in the three parameters inEq. (2): K, � , and H1, along with that in the ‘‘square ofcosine function fit.’’ The uncertainties in the three parame-ters do not depend on the sample position, while that in thefit is attributed to the sample position and the H2 that cor-responds to the position. The uncertainties in K, � , and H1
were �1%,15) between�2 and �3:9%,12,15) and �0:01 cm,11)
respectively. The ��mx uncertainty caused by these wasestimated on the basis of the error propagation law usingEq. (2). The uncertainty in the ‘‘square of cosine functionfit’’ was estimated with the scatter of measured data aroundthe fitted curve shown in Fig. 3.
In the 1.00S core, the reactivity worths were measureddirectly by means of the reactivity meter. In this core, theuncertainty of ��mx was estimated as that in the ‘‘square of
cosine function fit’’ that accounted for those in the sampleposition and the reactivity meter reading at each position.
In the 0.56S core, the reactivity worths were measured bythe use of the calibrated regulating rod at most of the samplepositions. In this core, the ��mx uncertainty was estimatedfrom those in the fit, along with those in the regulating-rod-worth curve and the regulating-rod position when the samplewas withdrawn. The uncertainty in the curve was estimatedfrom the scatter of measured data around the curve. Theuncertainty of the rod position was �0:26 mm (0.01 inch).
2. AnalysisThe calculated reactivity worths using the MVP and
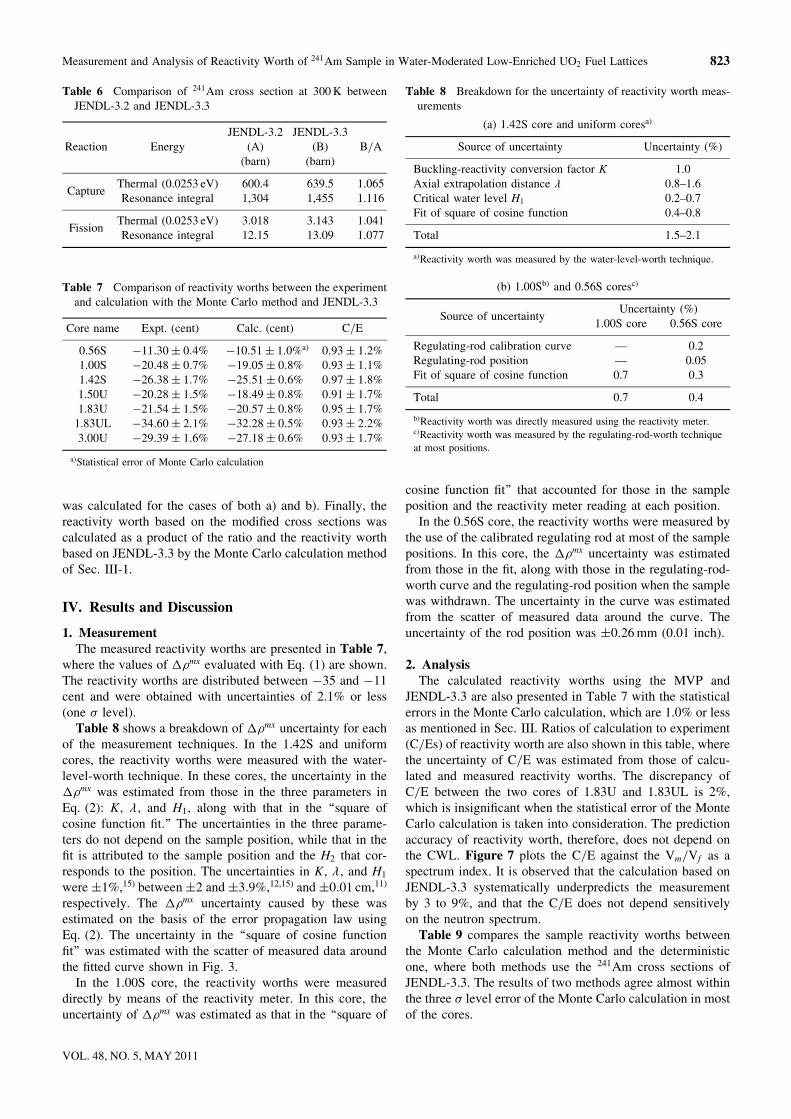
JENDL-3.3 are also presented in Table 7 with the statisticalerrors in the Monte Carlo calculation, which are 1.0% or lessas mentioned in Sec. III. Ratios of calculation to experiment(C/Es) of reactivity worth are also shown in this table, wherethe uncertainty of C/E was estimated from those of calcu-lated and measured reactivity worths. The discrepancy ofC/E between the two cores of 1.83U and 1.83UL is 2%,which is insignificant when the statistical error of the MonteCarlo calculation is taken into consideration. The predictionaccuracy of reactivity worth, therefore, does not depend onthe CWL. Figure 7 plots the C/E against the Vm/Vf as aspectrum index. It is observed that the calculation based onJENDL-3.3 systematically underpredicts the measurementby 3 to 9%, and that the C/E does not depend sensitivelyon the neutron spectrum.
Table 9 compares the sample reactivity worths betweenthe Monte Carlo calculation method and the deterministicone, where both methods use the 241Am cross sections ofJENDL-3.3. The results of two methods agree almost withinthe three � level error of the Monte Carlo calculation in mostof the cores.
Table 8 Breakdown for the uncertainty of reactivity worth meas-urements
(a) 1.42S core and uniform coresa)
Source of uncertainty Uncertainty (%)
Buckling-reactivity conversion factor K 1.0Axial extrapolation distance � 0.8–1.6Critical water level H1 0.2–0.7Fit of square of cosine function 0.4–0.8
Total 1.5–2.1
a)Reactivity worth was measured by the water-level-worth technique.
(b) 1.00Sb) and 0.56S coresc)
Source of uncertaintyUncertainty (%)
1.00S core 0.56S core
Regulating-rod calibration curve — 0.2Regulating-rod position — 0.05Fit of square of cosine function 0.7 0.3
Total 0.7 0.4
b)Reactivity worth was directly measured using the reactivity meter.c)Reactivity worth was measured by the regulating-rod-worth technique
at most positions.
Table 7 Comparison of reactivity worths between the experimentand calculation with the Monte Carlo method and JENDL-3.3
Core name Expt. (cent) Calc. (cent) C/E
0.56S �11:30� 0:4% �10:51� 1:0%a) 0:93� 1:2%1.00S �20:48� 0:7% �19:05� 0:8% 0:93� 1:1%1.42S �26:38� 1:7% �25:51� 0:6% 0:97� 1:8%1.50U �20:28� 1:5% �18:49� 0:8% 0:91� 1:7%1.83U �21:54� 1:5% �20:57� 0:8% 0:95� 1:7%
1.83UL �34:60� 2:1% �32:28� 0:5% 0:93� 2:2%3.00U �29:39� 1:6% �27:18� 0:6% 0:93� 1:7%
a)Statistical error of Monte Carlo calculation
Table 6 Comparison of 241Am cross section at 300 K betweenJENDL-3.2 and JENDL-3.3
Reaction EnergyJENDL-3.2
(A)(barn)
JENDL-3.3(B)
(barn)B/A
CaptureThermal (0.0253 eV) 600.4 639.5 1.065Resonance integral 1,304 1,455 1.116
FissionThermal (0.0253 eV) 3.018 3.143 1.041Resonance integral 12.15 13.09 1.077
Measurement and Analysis of Reactivity Worth of 241Am Sample in Water-Moderated Low-Enriched UO2 Fuel Lattices 823
VOL. 48, NO. 5, MAY 2011
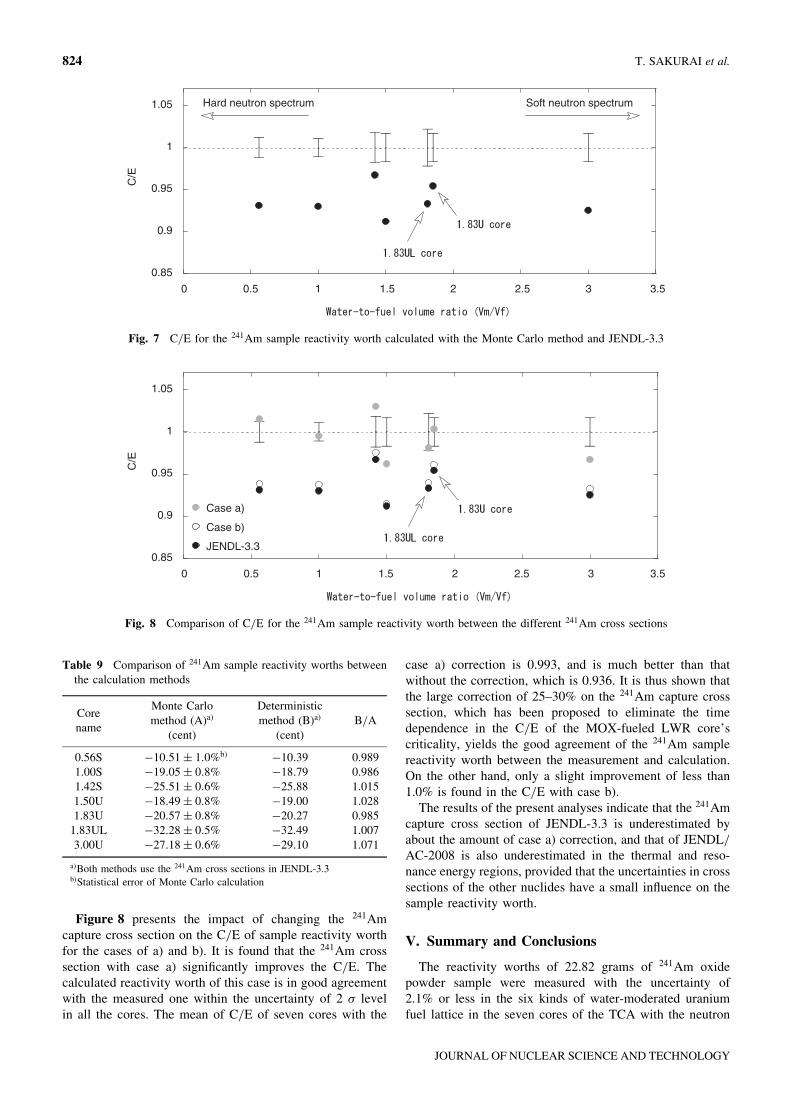
Figure 8 presents the impact of changing the 241Amcapture cross section on the C/E of sample reactivity worthfor the cases of a) and b). It is found that the 241Am crosssection with case a) significantly improves the C/E. Thecalculated reactivity worth of this case is in good agreementwith the measured one within the uncertainty of 2 � levelin all the cores. The mean of C/E of seven cores with the
case a) correction is 0.993, and is much better than thatwithout the correction, which is 0.936. It is thus shown thatthe large correction of 25–30% on the 241Am capture crosssection, which has been proposed to eliminate the timedependence in the C/E of the MOX-fueled LWR core’scriticality, yields the good agreement of the 241Am samplereactivity worth between the measurement and calculation.On the other hand, only a slight improvement of less than1.0% is found in the C/E with case b).
The results of the present analyses indicate that the 241Amcapture cross section of JENDL-3.3 is underestimated byabout the amount of case a) correction, and that of JENDL/AC-2008 is also underestimated in the thermal and reso-nance energy regions, provided that the uncertainties in crosssections of the other nuclides have a small influence on thesample reactivity worth.
V. Summary and Conclusions
The reactivity worths of 22.82 grams of 241Am oxidepowder sample were measured with the uncertainty of2.1% or less in the six kinds of water-moderated uraniumfuel lattice in the seven cores of the TCA with the neutron
0.85
0.9
0.95
1
1.05
0 0.5 1 1.5 2 2.5 3 3.5
C/E
Soft neutron spectrumHard neutron spectrum
Fig. 7 C/E for the 241Am sample reactivity worth calculated with the Monte Carlo method and JENDL-3.3
Table 9 Comparison of 241Am sample reactivity worths betweenthe calculation methods
Corename
Monte Carlomethod (A)a)
(cent)
Deterministicmethod (B)a)
(cent)B/A
0.56S �10:51� 1:0%b) �10:39 0.9891.00S �19:05� 0:8% �18:79 0.9861.42S �25:51� 0:6% �25:88 1.0151.50U �18:49� 0:8% �19:00 1.0281.83U �20:57� 0:8% �20:27 0.985
1.83UL �32:28� 0:5% �32:49 1.0073.00U �27:18� 0:6% �29:10 1.071
a)Both methods use the 241Am cross sections in JENDL-3.3b)Statistical error of Monte Carlo calculation
0.85
0.9
0.95
1
1.05
0 0.5 1 1.5 2 2.5 3 3.5
C/E
JENDL-3.3
Case b)
Case a)
Fig. 8 Comparison of C/E for the 241Am sample reactivity worth between the different 241Am cross sections
824 T. SAKURAI et al.
JOURNAL OF NUCLEAR SCIENCE AND TECHNOLOGY
spectra between the thermal and resonance energy regions.The experimental database has thus been produced for the241Am sample reactivity worth, which is sensitive to theneutron spectrum among these energy regions.
The sample reactivity worth was calculated by the use ofthe JENDL-3.3 nuclear data and continuous-energy MonteCarlo method with the statistical error of 1.0%. The calcu-lations underpredicted the measured reactivity worth by 3 to9%. The C/E showed no apparent dependence on the neu-tron spectrum.
Furthermore, the sensitivity analysis based on the deter-ministic calculation method was carried out to obtain theimpact of changing the 241Am capture cross section on thesample reactivity worth. The result of this analysis showedthat the good agreement of the sample reactivity worth wasobtained between the measurement and calculation, by al-most uniformly increasing the 241Am capture cross sectionof JENDL-3.3 by 25–30%. It is therefore indicated that the241Am capture cross section of JENDL-3.3 is underestimatedby about this amount in the thermal and resonance energyregions, provided that the uncertainties in cross sections ofthe other nuclides have a small influence on the samplereactivity worth. In this respect, future work includes a studyto examine the magnitude of this influence for a more pre-cise improvement of the 241Am capture cross section thanthe present one.
Acknowledgements
The authors appreciate the effort of the operation staff atthe TCA facilities in constructing the experimental cores andproviding the excellent experimental conditions. The calcu-lations with the MVP code were carried out by the use ofthe computers at the Center for Computational Science &e-Systems of JAEA.
References
1) K. Nakajima, Y. Ando, T. Suzaki, ‘‘Analysis of time depend-ence on criticality for MOX cores,’’ Preprints 2001 Fall Mtg.AESJ, Hokkaido, Japan, Sep. 19–21, 2001, I41 (2001), [inJapanese].
2) Study of LWR Core Concepts on Effective Utilization ofPlutonium, Nuclear Power Engineering Corporation (NUPEC)(2002), [in Japanese].
3) K. Okumura, T. Mori, ‘‘Integral test of JENDL-3.3 for thermalreactors,’’ Proc. 2002 Symp. on Nuclear Data, Tokai, Japan,Nov. 21–22, 2002, JAERI-Conf 2003-006, 15–21 (2003).
4) T. Yamamoto, ‘‘Analysis of core physics experiments of highmoderation full MOX LWR,’’ Proc. 2005 Symp. on NuclearData, Tokai, Japan, Feb. 2–3, 2006, JAEA-Conf 2006-009,7–13 (2006).
5) G. Chiba, K. Okumura, ‘‘Towards the completion of JENDL-4: Current status of integral test,’’ Proc. 2008 Annual Symp. onNuclear Data (NDS2008), Tokai, Japan, Nov. 20–21, 2008,JAEA-Conf 2009-004, 21–26 (2009).
6) T. Mukaiyama, M. Obu, M. Nakano, S. Okajima, T. Koakutsu,‘‘Actinide integral measurement in FCA assemblies,’’ Proc.
Int. Conf. Nuclear Data for Basic and Applied Science, SantaFe, NM, USA, May 13–17, 1985, Vol. 1, 483–488 (1986).
7) S. Cathalau, A. Benslimane, ‘‘Qualification of JEF2.2 capturecross-sections for heavy nuclides and fission products in ther-mal and epithermal spectra,’’ Proc. GLOBAL1995, Versailles,France, Sep. 11–14, 1995, 1537–1544 (1995).
8) J. P. Hudelot, R. Klann, P. Fougeras et al., ‘‘OSMOSE: Anexperimental program for the qualification of integral crosssections of actinides,’’ Proc. PHYSOR-2006, Chicago, IL,USA, Apr. 25–29, 2004 (2004), [CD-ROM].
9) K. Shibata, T. Kawano, T. Nakagawa et al., ‘‘Japanese eval-uated nuclear data library version 3 revision-3: JENDL-3.3,’’J. Nucl. Sci. Technol., 39[11], 1125–1136 (2002).
10) T. Sakurai, T. Mori, S. Okajima et al., ‘‘Measurement andanalysis of reactivity worth of 237Np sample in cores of TCAand FCA,’’ J. Nucl. Sci. Technol., 46[6], 624–640 (2009).
11) Y. Miyoshi, T. Arakawa, ‘‘Critical arrays of low-enriched UO2
fuel rods with water-to-fuel volume ratios ranging from 1.5 to3.0 LEU-COMP-THERM-006,’’ Int. Handbook of EvaluatedCriticality Safety Benchmark Experiments ICSBEP, September2007 Edition, NEA/NSC/DOC(95)03, Nuclear Energy Agen-cy, OECD (2007), [CD-ROM].
12) K. Nakajima, doctoral thesis, Hokkaido University, Japan(1998), [in Japanese].
13) Y. Shimazu, Y. Nakano, Y. Tahara, T. Okayama, ‘‘Develop-ment of a compact digital reactivity meter and a reactor phys-ics data processor,’’ Nucl. Technol., 77, 247–254 (1987).
14) G. R. Keepin, Physics of Nuclear Reactor, Addison-WesleyPublishing Company, Inc., Massachusetts, 90 (1965).
15) T. Suzaki, K. Sakurai, K. Nakajima, C. Horiki, ‘‘Precise de-termination of �eff for water-moderated U and Pu cores by amethod using buckling coefficient of reactivity,’’ Proc. 6th Int.Conf. in Nuclear Criticality Safety (ICNC’99), Versailles,France, Sep. 20–24, 1999, 386–394 (1999).
16) T. Yamamoto, Computational Study on the Buckling-Reactiv-ity Conversion Factor in Light Water Moderated UO2 Core,JAERI-M 93-170, Japan Atomic Energy Research Institute(1993).
17) T. Suzaki, K. Murakami, T. Yoritsune, T. Ouchi, M. Kyoya,‘‘Short-size sample worth measurement by critical-water-levelmethod,’’ Preprints 2005 Annu. Mtg. AESJ, Kanagawa, Japan,Mar. 29–31, 2005, G1 (2005), [in Japanese].
18) Y. Nagaya, K. Okumura, T. Mori, M. Nakagawa, MVP/GMVPII: General Purpose Monte Carlo Codes for Neutron andPhoton Transport Calculations based on Continuous Energyand Multigroup Methods, JAERI 1348, Japan Atomic EnergyResearch Institute (2005).
19) K. Okumura, T. Kugo, K. Kaneko, K. Tsuchihashi,SRAC2006: A Comprehensive Neutronics Calculation CodeSystem, JAEA-Data/Code 2007-004, Japan Atomic EnergyAgency (2007).
20) Y. Ishiguro, PEACO-II: A Code for Calculation of EffectiveCross Section in Heterogeneous Systems, JAERI-M 5527,Japan Atomic Energy Research Institute (1974).
21) R. E. Alcouffe, R. S. Baker, F. W. Brinkley et al., DANTSYS:A Diffusion Accelerated Neutral Particle Transport Code Sys-tem, LA-12969M, Los Alamos National Laboratory (1995).
22) O. Iwamoto, T. Nakagawa, N. Otuka et al., ‘‘JENDL ActinoidFile 2008,’’ J. Nucl. Sci. Technol., 46, 510–528 (2009).
23) T. Nakagawa, K. Shibata, S. Chiba et al., ‘‘Japanese evaluatednuclear data library version 3 revision-2: JENDL-3.2,’’ J. Nucl.Sci. Technol., 32[12], 1259–1271 (1995).
Measurement and Analysis of Reactivity Worth of 241Am Sample in Water-Moderated Low-Enriched UO2 Fuel Lattices 825
VOL. 48, NO. 5, MAY 2011
Copyright © 2022 FDOKUMEN


![Voltammetric Determination of Cocaine in Confiscated Samples Using a Carbon Paste Electrode Modified with Different [UO2(X-MeOsalen)(H2O)].H2O complexes](https://static.fdokumen.com/doc/165x107/63258de1545c645c7f09c2d3/voltammetric-determination-of-cocaine-in-confiscated-samples-using-a-carbon-paste.jpg)


![Raman spectroscopic study of the uranyl mineral pseudojohannite Cu6.5[(UO2)4O4(SO4)2]2(OH)5·25H2O](https://static.fdokumen.com/doc/165x107/633658844e9c1ac02e080a47/raman-spectroscopic-study-of-the-uranyl-mineral-pseudojohannite-cu65uo24o4so422oh5a25h2o.jpg)


