
Maximum volume cuboids for arbitrarily shaped in-situ rock blocks as determined by discontinuity...
11
Maximum volume cuboids for arbitrarily shaped in-situ rock blocks as determined by discontinuity analysis—A genetic algorithm approach Erkan U ¨ lker a , Alparslan Turanboy b, a Department of Computer Engineering, Selc - uk University, Konya, Turkey b Seydis -ehir Vocational School of Higher Education, Selc - uk University, Konya, Turkey article info Article history: Received 9 August 2007 Received in revised form 17 April 2008 Accepted 12 August 2008 Keywords: Dimensional stone 3D fracture model Tree structure Genetic algorithm Optimisation abstract The block stone industry is one of the main commercial use of rock. The economic potential of any block quarry depends on the recovery rate, which is defined as the total volume of useful rough blocks extractable from a fixed rock volume in relation to the total volume of moved material. The natural fracture system, the rock type(s) and the extraction method used directly influence the recovery rate. The major aims of this study are to establish a theoretical framework for optimising the extraction process in marble quarries for a given fracture system, and for predicting the recovery rate of the excavated blocks. We have developed a new approach by taking into consideration only the fracture structure for maximum block recovery in block quarries. The complete model uses a linear approach based on basic geometric features of discontinuities for 3D models, a tree structure (TS) for individual investigation and finally a genetic algorithm (GA) for the obtained cuboid volume(s). We tested our new model in a selected marble quarry in the town of I ˙ scehisar (AFYONKARAHI ˙ SAR—TURKEY). & 2009 Elsevier Ltd. All rights reserved. 1. Introduction The economic potential of any size stone quarry is based on two main criteria: (1) appropriate commercial qualities of the rock mass, such as colour and texture, and (2) a viable recovery ratio (i.e., the total volume of usable material against the volume of rock excavated) (Loorents et al., 2000). In addition, the ability of the rock to take a polish is an important requirement. Dimen- sional stone is primarily extracted by cutting, in-situ and a particular rock into very large blocks. After the drilling operation, commercial blocks are mostly produced using methods including blasting, diamond wires and chainsaws. In stone quarries, raw material losses are between 35 and 70% during the block extraction process. When steps such as block processing and transportation are taken into consideration, the total raw material losses may amount to 50–80% of the total volume of rock mass excavated (Mamasaidov et al., 2004). The marble structure, as a rock mass, is a heterogeneous material consisting of several discontinuities. The term ‘‘discontinuity’’ is used here in a generic way, meaning all structures, such as fractures, beds, joints, sand layers or kink bands, with more or less planar geometries, that create the in-situ rock blocks. These weak zones, which are uncontrollable factors, must be carefully taken into account during the excavation; however, currently used in- situ block extraction processes have little scientific basis and rely largely on human experience. As a result, the evaluation of the excavated mass in the quarry is usually made by visual estimation, which is qualitative. Prediction errors are, therefore, inevitable in the assessment processes. We want to explore the following questions: What is the theoretical maximum extractable useful block volume from any given in-situ heterogeneous structure? How much of this volume is being realized as a useful volume using existing methods and experience? What is the difference between these two quantities? Our study focuses on answering these important questions. In many former studies, for example, the evaluation of extraction processes as regards machine productivity and cost analyses, raw material losses have been examined (Alimov and Mamasaidov, 1988; Mamasaidov et al., 2004). Loorents et al. (2000) suggested a mapping method to estimate the fracture system in bedrock of economic interest using sited excavated ditches to supplement the information obtained from core drilling. Another, more detailed study, related to the safety and optimisation of underground design is the CAD–PUMA (EU Commission–Industrial and Materials Technologies Programme). This research project is a computer-aided geological decision support system for planning and optimising underground marble mining. The optimisation concept for a given fracture system pattern and quality is based on the minimum amount of resource materials necessary for the roof and pillar design to be safe. Determining the best orientations and sizes of the galleries and ARTICLE IN PRESS Contents lists available at ScienceDirect journal homepage: www.elsevier.com/locate/cageo Computers & Geosciences 0098-3004/$ - see front matter & 2009 Elsevier Ltd. All rights reserved. doi:10.1016/j.cageo.2008.08.017 Corresponding author. Tel.: +903325825454; fax: +905827609. E-mail addresses: [email protected] (E. U ¨ lker), [email protected] (A. Turanboy). Computers & Geosciences 35 (2009) 1470–1480
-
Upload
independent -
Category
Documents
-
view
1 -
download
0
Transcript of Maximum volume cuboids for arbitrarily shaped in-situ rock blocks as determined by discontinuity...
ARTICLE IN PRESS
Computers & Geosciences 35 (2009) 1470–1480
Contents lists available at ScienceDirect
Computers & Geosciences
0098-30
doi:10.1
� Corr
E-m
(A. Tura
journal homepage: www.elsevier.com/locate/cageo
Maximum volume cuboids for arbitrarily shaped in-situ rock blocks asdetermined by discontinuity analysis—A genetic algorithm approach
Erkan Ulker a, Alparslan Turanboy b,�
a Department of Computer Engineering, Selc-uk University, Konya, Turkeyb Seydis-ehir Vocational School of Higher Education, Selc-uk University, Konya, Turkey
a r t i c l e i n f o
Article history:
Received 9 August 2007
Received in revised form
17 April 2008
Accepted 12 August 2008
Keywords:
Dimensional stone
3D fracture model
Tree structure
Genetic algorithm
Optimisation
04/$ - see front matter & 2009 Elsevier Ltd. A
016/j.cageo.2008.08.017
esponding author. Tel.: +903325825454; fax:
ail addresses: [email protected] (E. Ulker),
nboy).
a b s t r a c t
The block stone industry is one of the main commercial use of rock. The economic potential of any block
quarry depends on the recovery rate, which is defined as the total volume of useful rough blocks
extractable from a fixed rock volume in relation to the total volume of moved material. The natural
fracture system, the rock type(s) and the extraction method used directly influence the recovery rate.
The major aims of this study are to establish a theoretical framework for optimising the extraction
process in marble quarries for a given fracture system, and for predicting the recovery rate of the
excavated blocks. We have developed a new approach by taking into consideration only the fracture
structure for maximum block recovery in block quarries. The complete model uses a linear approach
based on basic geometric features of discontinuities for 3D models, a tree structure (TS) for individual
investigation and finally a genetic algorithm (GA) for the obtained cuboid volume(s). We tested our new
model in a selected marble quarry in the town of Iscehisar (AFYONKARAHISAR—TURKEY).
& 2009 Elsevier Ltd. All rights reserved.
1. Introduction
The economic potential of any size stone quarry is based ontwo main criteria: (1) appropriate commercial qualities of the rockmass, such as colour and texture, and (2) a viable recovery ratio(i.e., the total volume of usable material against the volume ofrock excavated) (Loorents et al., 2000). In addition, the ability ofthe rock to take a polish is an important requirement. Dimen-sional stone is primarily extracted by cutting, in-situ and aparticular rock into very large blocks. After the drilling operation,commercial blocks are mostly produced using methods includingblasting, diamond wires and chainsaws.
In stone quarries, raw material losses are between 35 and 70%during the block extraction process. When steps such as blockprocessing and transportation are taken into consideration, thetotal raw material losses may amount to 50–80% of the totalvolume of rock mass excavated (Mamasaidov et al., 2004). Themarble structure, as a rock mass, is a heterogeneous materialconsisting of several discontinuities. The term ‘‘discontinuity’’ isused here in a generic way, meaning all structures, such asfractures, beds, joints, sand layers or kink bands, with more or lessplanar geometries, that create the in-situ rock blocks. These weakzones, which are uncontrollable factors, must be carefully taken
ll rights reserved.
+905827609.
into account during the excavation; however, currently used in-situ block extraction processes have little scientific basis and relylargely on human experience. As a result, the evaluation of theexcavated mass in the quarry is usually made by visual estimation,which is qualitative. Prediction errors are, therefore, inevitable inthe assessment processes. We want to explore the followingquestions: What is the theoretical maximum extractable usefulblock volume from any given in-situ heterogeneous structure?How much of this volume is being realized as a useful volumeusing existing methods and experience? What is the differencebetween these two quantities? Our study focuses on answeringthese important questions.
In many former studies, for example, the evaluation ofextraction processes as regards machine productivity and costanalyses, raw material losses have been examined (Alimov andMamasaidov, 1988; Mamasaidov et al., 2004). Loorents et al.(2000) suggested a mapping method to estimate the fracturesystem in bedrock of economic interest using sited excavatedditches to supplement the information obtained from coredrilling. Another, more detailed study, related to the safety andoptimisation of underground design is the CAD–PUMA (EUCommission–Industrial and Materials Technologies Programme).This research project is a computer-aided geological decisionsupport system for planning and optimising underground marblemining. The optimisation concept for a given fracture systempattern and quality is based on the minimum amount of resourcematerials necessary for the roof and pillar design to be safe.Determining the best orientations and sizes of the galleries and
ARTICLE IN PRESS
E. Ulker, A. Turanboy / Computers & Geosciences 35 (2009) 1470–1480 1471
the pillars with respect to the discontinuities is the main aim ofthis study. There are also a number of previous studies based ongeostatistical concepts. The excavating structure and the recoveryindices were appraised and classified into several groups accord-ing to technical and commercial criteria. The quantitative andqualitative characteristics of the dimension-stone quarries weresummarised in a synthesis variable by applying correspondenceanalysis as a discrimination tool (Pereira et al., 1992) as well as theKriging estimation of the recovery index in unknown zones forexploitation planning purposes (Pereira et al., 1992; Taboada et al.,1997; Tercan and Ozc-elik, 2000).
The main objectives of this research are to study the optimumextraction, to obtain intact rock blocks with limited disconti-nuities, and to maximise theoretical rock recovery. To achievethese objectives, we performed an in-situ survey analysis withanalytical and numerical studies. In addition, we use a genetic
algorithm (GA) and tree structure (TS), whose details are explainedbelow as our main tools.
2. Methodology and model steps
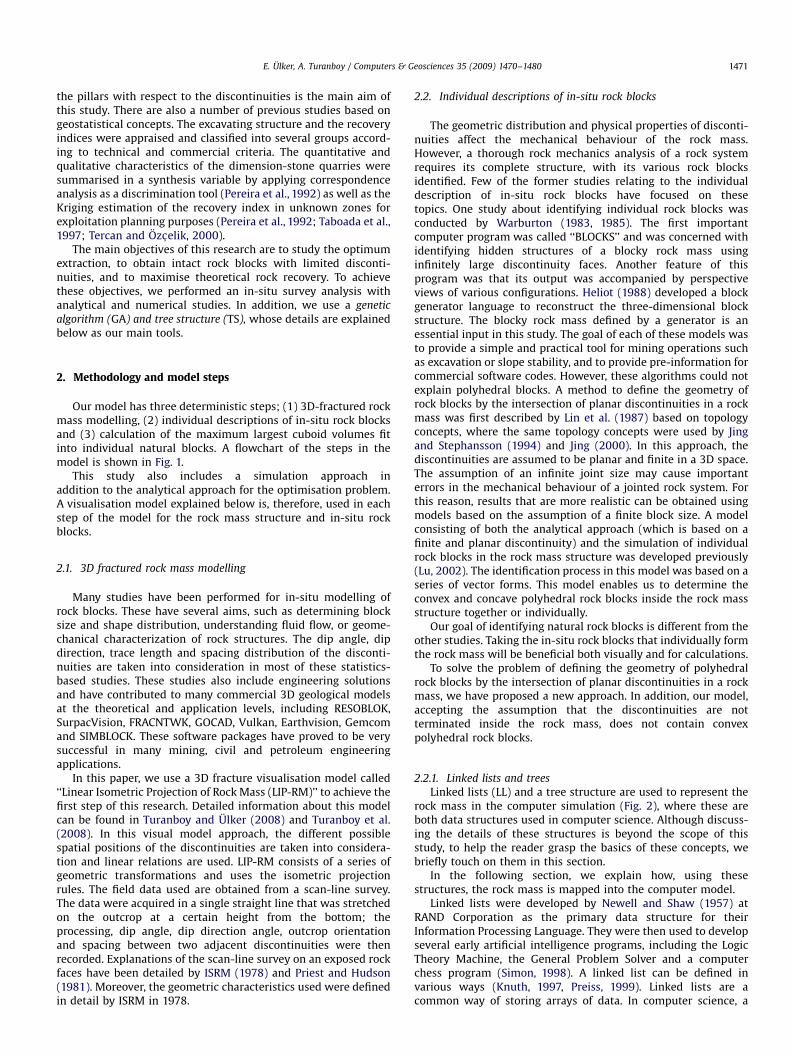
Our model has three deterministic steps; (1) 3D-fractured rockmass modelling, (2) individual descriptions of in-situ rock blocksand (3) calculation of the maximum largest cuboid volumes fitinto individual natural blocks. A flowchart of the steps in themodel is shown in Fig. 1.
This study also includes a simulation approach inaddition to the analytical approach for the optimisation problem.A visualisation model explained below is, therefore, used in eachstep of the model for the rock mass structure and in-situ rockblocks.
2.1. 3D fractured rock mass modelling
Many studies have been performed for in-situ modelling ofrock blocks. These have several aims, such as determining blocksize and shape distribution, understanding fluid flow, or geome-chanical characterization of rock structures. The dip angle, dipdirection, trace length and spacing distribution of the disconti-nuities are taken into consideration in most of these statistics-based studies. These studies also include engineering solutionsand have contributed to many commercial 3D geological modelsat the theoretical and application levels, including RESOBLOK,SurpacVision, FRACNTWK, GOCAD, Vulkan, Earthvision, Gemcomand SIMBLOCK. These software packages have proved to be verysuccessful in many mining, civil and petroleum engineeringapplications.
In this paper, we use a 3D fracture visualisation model called‘‘Linear Isometric Projection of Rock Mass (LIP-RM)’’ to achieve thefirst step of this research. Detailed information about this modelcan be found in Turanboy and Ulker (2008) and Turanboy et al.(2008). In this visual model approach, the different possiblespatial positions of the discontinuities are taken into considera-tion and linear relations are used. LIP-RM consists of a series ofgeometric transformations and uses the isometric projectionrules. The field data used are obtained from a scan-line survey.The data were acquired in a single straight line that was stretchedon the outcrop at a certain height from the bottom; theprocessing, dip angle, dip direction angle, outcrop orientationand spacing between two adjacent discontinuities were thenrecorded. Explanations of the scan-line survey on an exposed rockfaces have been detailed by ISRM (1978) and Priest and Hudson(1981). Moreover, the geometric characteristics used were definedin detail by ISRM in 1978.
2.2. Individual descriptions of in-situ rock blocks
The geometric distribution and physical properties of disconti-nuities affect the mechanical behaviour of the rock mass.However, a thorough rock mechanics analysis of a rock systemrequires its complete structure, with its various rock blocksidentified. Few of the former studies relating to the individualdescription of in-situ rock blocks have focused on thesetopics. One study about identifying individual rock blocks wasconducted by Warburton (1983, 1985). The first importantcomputer program was called ‘‘BLOCKS’’ and was concerned withidentifying hidden structures of a blocky rock mass usinginfinitely large discontinuity faces. Another feature of thisprogram was that its output was accompanied by perspectiveviews of various configurations. Heliot (1988) developed a blockgenerator language to reconstruct the three-dimensional blockstructure. The blocky rock mass defined by a generator is anessential input in this study. The goal of each of these models wasto provide a simple and practical tool for mining operations suchas excavation or slope stability, and to provide pre-information forcommercial software codes. However, these algorithms could notexplain polyhedral blocks. A method to define the geometry ofrock blocks by the intersection of planar discontinuities in a rockmass was first described by Lin et al. (1987) based on topologyconcepts, where the same topology concepts were used by Jingand Stephansson (1994) and Jing (2000). In this approach, thediscontinuities are assumed to be planar and finite in a 3D space.The assumption of an infinite joint size may cause importanterrors in the mechanical behaviour of a jointed rock system. Forthis reason, results that are more realistic can be obtained usingmodels based on the assumption of a finite block size. A modelconsisting of both the analytical approach (which is based on afinite and planar discontinuity) and the simulation of individualrock blocks in the rock mass structure was developed previously(Lu, 2002). The identification process in this model was based on aseries of vector forms. This model enables us to determine theconvex and concave polyhedral rock blocks inside the rock massstructure together or individually.
Our goal of identifying natural rock blocks is different from theother studies. Taking the in-situ rock blocks that individually formthe rock mass will be beneficial both visually and for calculations.
To solve the problem of defining the geometry of polyhedralrock blocks by the intersection of planar discontinuities in a rockmass, we have proposed a new approach. In addition, our model,accepting the assumption that the discontinuities are notterminated inside the rock mass, does not contain convexpolyhedral rock blocks.
2.2.1. Linked lists and trees
Linked lists (LL) and a tree structure are used to represent therock mass in the computer simulation (Fig. 2), where these areboth data structures used in computer science. Although discuss-ing the details of these structures is beyond the scope of thisstudy, to help the reader grasp the basics of these concepts, webriefly touch on them in this section.
In the following section, we explain how, using thesestructures, the rock mass is mapped into the computer model.
Linked lists were developed by Newell and Shaw (1957) atRAND Corporation as the primary data structure for theirInformation Processing Language. They were then used to developseveral early artificial intelligence programs, including the LogicTheory Machine, the General Problem Solver and a computerchess program (Simon, 1998). A linked list can be defined invarious ways (Knuth, 1997, Preiss, 1999). Linked lists are acommon way of storing arrays of data. In computer science, a
ARTICLE IN PRESS
Fig. 1. Flowchart of the model.
Node
NextElement
Ο Leaves
Nodes
Fig. 2. (a) A single linked list and (b) a binary tree.
E. Ulker, A. Turanboy / Computers & Geosciences 35 (2009) 1470–14801472
linked list is one of the fundamental data structures, and it can beused to implement other data structures. Another definition isthat a linked list is a chain of structures or records called nodes,each containing arbitrary data fields and one or two references(‘‘links’’) pointing to the next and/or previous nodes These aredefined as single linked lists because they only point to the nextitem, and not the previous one. Fig. 2(a) shows a single linked list.Several different types of linked lists exist, including doubly linkedlists and circularly-linked lists. Linked lists have several advan-tages over arrays (Knuth, 1997; Preiss, 1999). First, the principal
ARTICLE IN PRESS
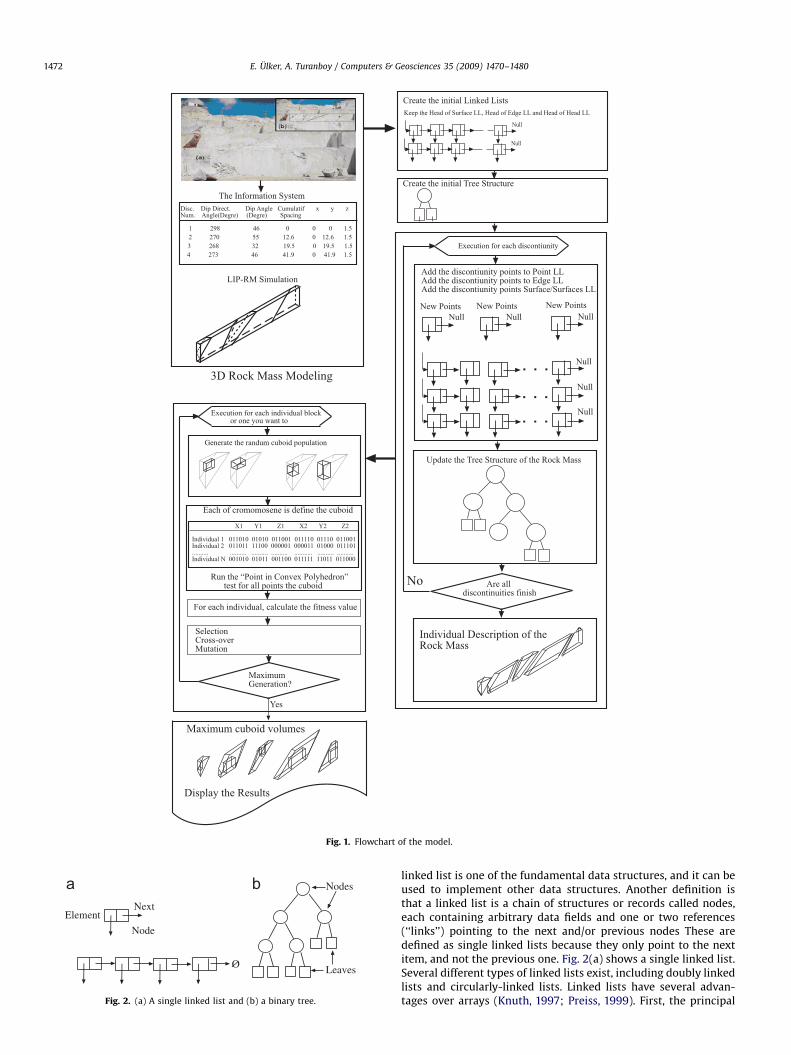
Fig. 3. (a) General view of benches in quarry and (b) modelling boundary as a rectangle with approximate discontinuity traces on modelled bench outcrop.
Table 1Obtained data (dip angle, dip direction angle and cumulative spacing) using scan-
line survey from selected bench outcrop.
Dis. number Dip direction (a0) Dip (b0) Cumulative spacing (m) X Y Z
1 295 46 0 0 0 1.5
2 270 55 12.6 0 12.6 1.5
3 268 32 19.5 0 19.5 1.5
4 273 46 41.9 0 41.9 1.5
1
23
4
1
23
4
Fig. 4. Isometric display of sampled structure; (a) discontinuity traces on visible
surfaces of a rock mass and (b) all (visible and invisible) displaying discontinuity
planes within rock mass.
E. Ulker, A. Turanboy / Computers & Geosciences 35 (2009) 1470–1480 1473
benefit of a linked list over a conventional array is that the order ofthe linked items may be different from the order that the dataitems are stored in memory or on disk. Second, you do not specifya fixed size for your list. Third, elements can be inserted intolinked lists indefinitely, while an array will eventually either fillup or need to be resized, an expensive operation that may noteven be possible if memory is fragmented. On the other hand,arrays allow random access, while linked lists allow onlysequential access to elements. Linked lists are used as a buildingblock for many other data structures, such as stacks, queues andtheir variations. For this, linked lists are a primary (though by nomeans the only) data structure, and are a common feature of thefunctional programming style; they are, especially, useful insystems or application programming.
A tree structure is a way of representing the hierarchical natureof a structure in a graphical form, and is a data structure thatemulates a tree with a set of linked nodes. This is named as a ‘‘treestructure’’ because the graph looks somewhat like a tree, eventhough the tree is generally shown upside down compared to areal tree (Knuth, 1997). There are many different ways torepresent trees (Cormen et al., 2001); common representationsshow the nodes as records allocated on the heap with pointers totheir children, their parents, or both. In a tree structure there isone, and only one, path from any point to any other point. Theconnections between elements are called branches, and thetopmost node in a tree is called the root node. Trees are oftencalled inverted trees because they are normally drawn with theroot at the top. The elements at the very bottom of an invertedtree (that is, those that have no elements below them) are calledleaves (leaf nodes). A node that has a child is called an ancestornode or superior (named internal or inner). The height of a node isthe length of the longest downward path to a leaf from that node.The height of the root is the height of the tree. Tree structures areused extensively in computer science to represent hierarchical filestructures (the leaves are files and the other elements above theleaves are directories) or to depict all kinds of taxonomicknowledge, such as evolutionary trees, family trees and thegrammatical structure of a language. A binary tree is a special typeof inverted tree in which each element has only two branches, asshown in Fig. 2(b). In this program, the rock mass is placed in abinary tree structure.
2.2.2. Tree structure representation
In our model, identified block shapes are shown individually ina tree structure. Furthermore, linked lists are used as a tool in thetree structure formed to contain the surfaces, the edges and thepoints that represent the mass. To understand how the rock massis mapped into the tree structure, we provide a case study. Aphotograph of the bench outcrop is given in Fig. 3(a). The selectedbench, the boundary modelled as a rectangle on the outcrop andthe discontinuity traces measured are approximately representedin Fig. 3(b). The same 3D TS representation of rock blocks is givenagain in the case study section. Table 1 gives the data (dip angle,dip direction angle and cumulative spacing) obtained using thescan-line survey from the selected bench outcrop.
Fig. 4 shows the discontinuity traces on the visible surfaces of arock mass and all (visible and invisible) displaying discontinuityplanes within the rock mass; these are further explained inSection 2.1.
ARTICLE IN PRESS
E. Ulker, A. Turanboy / Computers & Geosciences 35 (2009) 1470–14801474
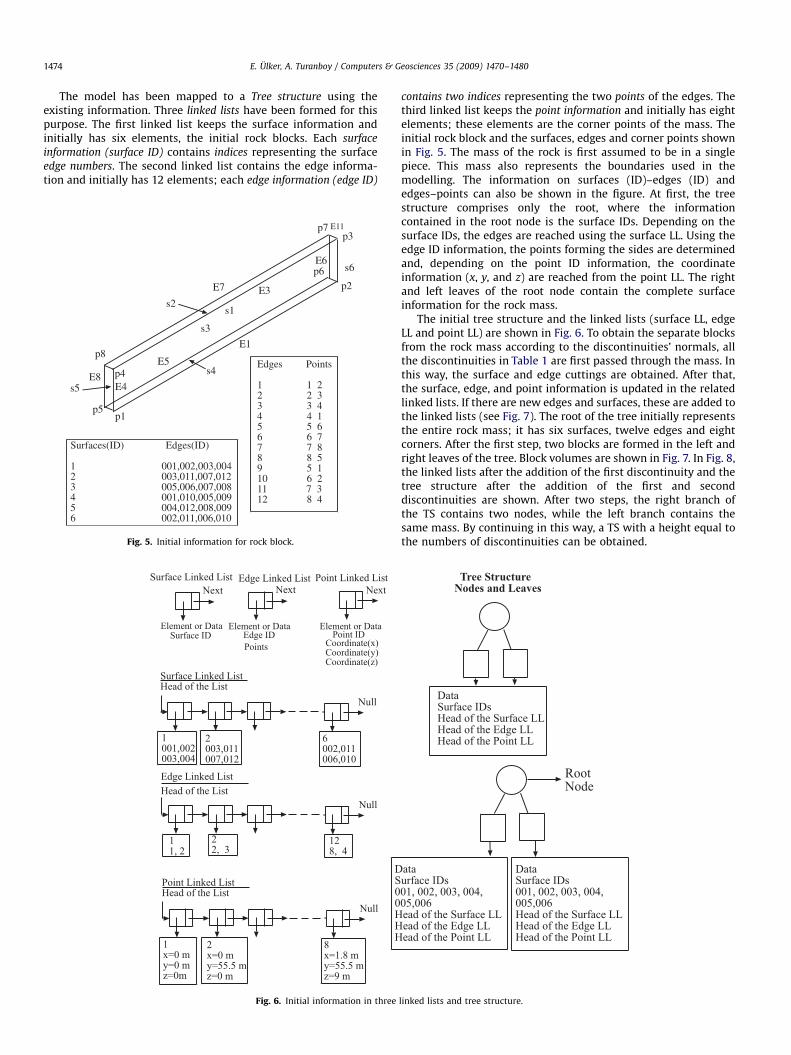
The model has been mapped to a Tree structure using theexisting information. Three linked lists have been formed for thispurpose. The first linked list keeps the surface information andinitially has six elements, the initial rock blocks. Each surface
information (surface ID) contains indices representing the surfaceedge numbers. The second linked list contains the edge informa-tion and initially has 12 elements; each edge information (edge ID)
Null
Surface Linked ListHead of the List
1001,002003,004
2003,011007,012
6002,011006,010
Null
Edge Linked ListHead of the List
11, 2
22, 3
128, 4
Null
Point Linked ListHead of the List
1x=0 my=0 mz=0m
2x=0 my=55.5 mz=0 m
8x=1.8 my=55.5 mz=9 m
Surface Linked ListNext Next Next
Edge Linked List Point Linked List
Element or Data Element or Data Element or DataSurface ID Edge ID
PointsPoint ID
Coordinate(x)Coordinate(y)Coordinate(z)
DS00HHH
Fig. 6. Initial information in three
Surfaces(ID) Edges(ID)
1 001,002,003,0042 003,011,007,0123 005,006,007,0084 001,010,005,0095 004,012,008,0096 002,011,006,010
Edges Points
1 1 22 2 33 3 44 4 15 5 66 6 77 7 88 8 59 5 110 6 211 7 312 8 4
p8
E7
p7 E11p3
E6
p2p6
E3
E1
E5
p1
E4E8
p5
p4s5
s2
s4
s3
s1
s6
Fig. 5. Initial information for rock block.
contains two indices representing the two points of the edges. Thethird linked list keeps the point information and initially has eightelements; these elements are the corner points of the mass. Theinitial rock block and the surfaces, edges and corner points shownin Fig. 5. The mass of the rock is first assumed to be in a singlepiece. This mass also represents the boundaries used in themodelling. The information on surfaces (ID)–edges (ID) andedges–points can also be shown in the figure. At first, the treestructure comprises only the root, where the informationcontained in the root node is the surface IDs. Depending on thesurface IDs, the edges are reached using the surface LL. Using theedge ID information, the points forming the sides are determinedand, depending on the point ID information, the coordinateinformation (x, y, and z) are reached from the point LL. The rightand left leaves of the root node contain the complete surfaceinformation for the rock mass.
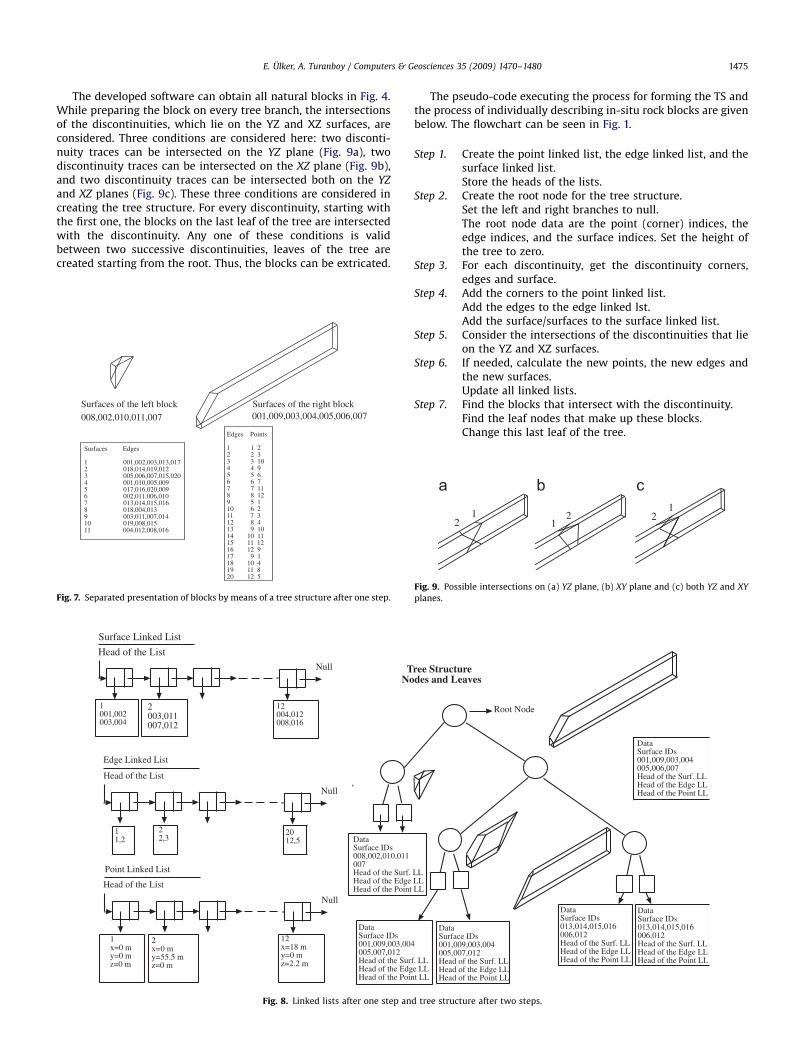
The initial tree structure and the linked lists (surface LL, edgeLL and point LL) are shown in Fig. 6. To obtain the separate blocksfrom the rock mass according to the discontinuities’ normals, allthe discontinuities in Table 1 are first passed through the mass. Inthis way, the surface and edge cuttings are obtained. After that,the surface, edge, and point information is updated in the relatedlinked lists. If there are new edges and surfaces, these are added tothe linked lists (see Fig. 7). The root of the tree initially representsthe entire rock mass; it has six surfaces, twelve edges and eightcorners. After the first step, two blocks are formed in the left andright leaves of the tree. Block volumes are shown in Fig. 7. In Fig. 8,the linked lists after the addition of the first discontinuity and thetree structure after the addition of the first and seconddiscontinuities are shown. After two steps, the right branch ofthe TS contains two nodes, while the left branch contains thesame mass. By continuing in this way, a TS with a height equal tothe numbers of discontinuities can be obtained.
Tree StructureNodes and Leaves
DataSurface IDsHead of the Surface LLHead of the Edge LLHead of the Point LL
ataurface IDs01, 002, 003, 004,05,006ead of the Surface LLead of the Edge LLead of the Point LL
DataSurface IDs001, 002, 003, 004,005,006Head of the Surface LLHead of the Edge LLHead of the Point LL
RootNode
linked lists and tree structure.
ARTICLE IN PRESS
E. Ulker, A. Turanboy / Computers & Geosciences 35 (2009) 1470–1480 1475
The developed software can obtain all natural blocks in Fig. 4.While preparing the block on every tree branch, the intersectionsof the discontinuities, which lie on the YZ and XZ surfaces, areconsidered. Three conditions are considered here: two disconti-nuity traces can be intersected on the YZ plane (Fig. 9a), twodiscontinuity traces can be intersected on the XZ plane (Fig. 9b),and two discontinuity traces can be intersected both on the YZ
and XZ planes (Fig. 9c). These three conditions are considered increating the tree structure. For every discontinuity, starting withthe first one, the blocks on the last leaf of the tree are intersectedwith the discontinuity. Any one of these conditions is validbetween two successive discontinuities, leaves of the tree arecreated starting from the root. Thus, the blocks can be extricated.
Surfaces Edges
1 001,002,003,013,0172 018,014,019,0123 005,006,007,015,0204 001,010,005,0095 017,016,020,0096 002,011,006,0107 013,014,015,0168 018,004,0139 003,011,007,01410 019,008,01511 004,012,008,016
Edges Points
1 1 22 2 33 3 104 4 95 5 66 6 77 7 118 8 129 5 110 6 211 7 312 8 413 9 1014 10 1115 11 1216 12 917 9 118 10 419 11 820 12 5
Surfaces of the left block008,002,010,011,007
Surfaces of the right block001,009,003,004,005,006,007
Fig. 7. Separated presentation of blocks by means of a tree structure after one step.
Null
Edge Linked List
Head of the List
Null
Surface Linked List
Head of the List
Null
Point Linked List
Head of the List
1001,002003,004
2003,011007,012
12004,012008,016
11,2
22,3
2012,5
1x=0 my=0 mz=0 m
2x=0 my=55.5 mz=0 m
12x=18 my=0 mz=2.2 m
TNo
DataSurface IDs001,009,003,004005,007,012Head of the SurHead of the EdgHead of the Poin
DataSurface IDs008,002,010,011007Head of the Surf. Head of the EdgeHead of the Point
Fig. 8. Linked lists after one step an
The pseudo-code executing the process for forming the TS andthe process of individually describing in-situ rock blocks are givenbelow. The flowchart can be seen in Fig. 1.
Step 1. Create the point linked list, the edge linked list, and thesurface linked list.Store the heads of the lists.
Step 2. Create the root node for the tree structure.Set the left and right branches to null.The root node data are the point (corner) indices, theedge indices, and the surface indices. Set the height ofthe tree to zero.
Step 3. For each discontinuity, get the discontinuity corners,edges and surface.
Step 4. Add the corners to the point linked list.Add the edges to the edge linked lst.Add the surface/surfaces to the surface linked list.
Step 5. Consider the intersections of the discontinuities that lieon the YZ and XZ surfaces.
Step 6. If needed, calculate the new points, the new edges andthe new surfaces.Update all linked lists.
Step 7. Find the blocks that intersect with the discontinuity.Find the leaf nodes that make up these blocks.Change this last leaf of the tree.
ree Structuredes and Leaves
Root Node
f. LLe LLt LL
DataSurface IDs001,009,003,004005,007,012Head of the Surf. LLHead of the Edge LLHead of the Point LL
DataSurface IDs013,014,015,016006,012Head of the Surf. LLHead of the Edge LLHead of the Point LL
DataSurface IDs013,014,015,016006,012Head of the Surf. LLHead of the Edge LLHead of the Point LL
LL LL LL
DataSurface IDs001,009,003,004005,006,007Head of the Surf. LLHead of the Edge LLHead of the Point LL
d tree structure after two steps.
21 2
12
1
Fig. 9. Possible intersections on (a) YZ plane, (b) XY plane and (c) both YZ and XY
planes.
ARTICLE IN PRESS
Surfaces of the initial block001, 002, 003, 004, 005, 006
Surfaces of the left block008, 002, 010, 011, 007
Surfaces of the right block001, 009, 003, 004, 005, 006, 007
Discontinuity 1Tree height = 1
Discontinuity 2Tree height = 2
013, 014, 015, 016, 006, 012001, 009, 003, 004, 005, 007, 012
Discontinuity nTree height = n
008,002,010,011,007 001,009,003,022,004,024,005,007,012,020 013,014,023,016,012,017,021 018,019,015,025,020,017,021,026 027,028,029,030,006,026
After all processThe leaf nodes of the Tree Structure
Fig. 10. Final tree structure for modelled rock mass, linked lists and surface-edge information.
x1 y1 z4 x3 y3 z3
Individual 1 011010 01010 011001 011110 01110 011101
(0110100101001100101111001110011101)
Fig. 11. Displaying chromosome indicating a prism.
(1.8, 5, 9) (0, 7.2, 9)
E. Ulker, A. Turanboy / Computers & Geosciences 35 (2009) 1470–14801476
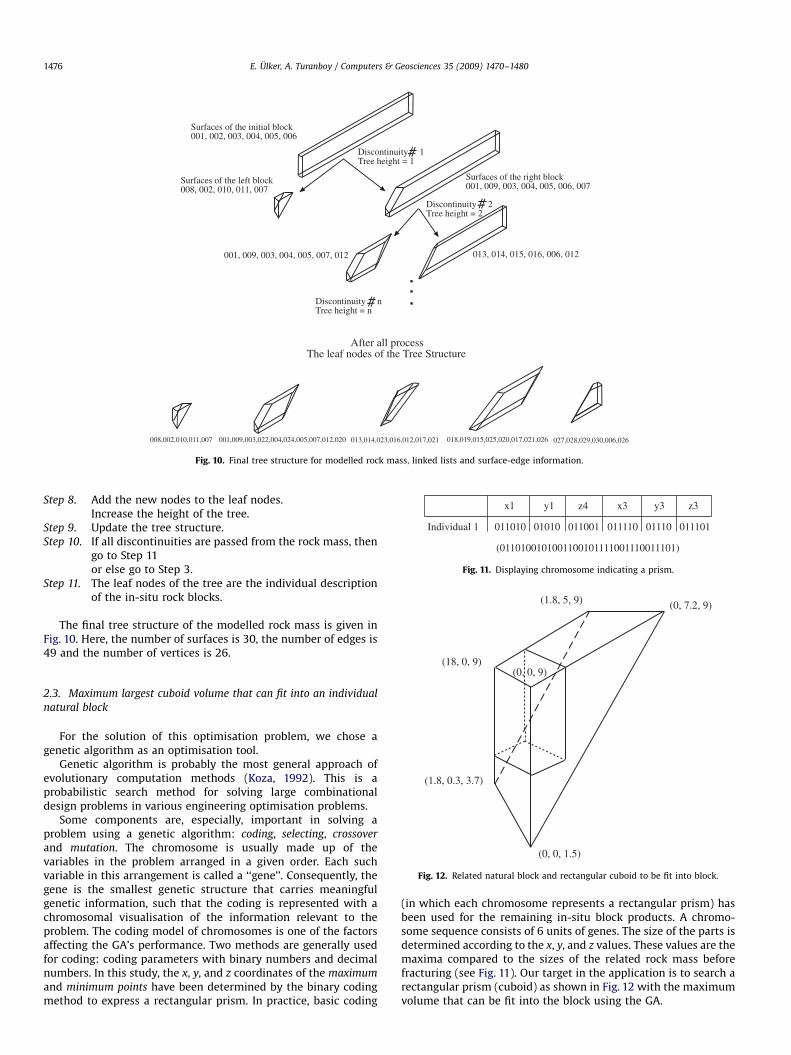
Step 8. Add the new nodes to the leaf nodes.Increase the height of the tree.
Step 9. Update the tree structure.Step 10. If all discontinuities are passed from the rock mass, then
go to Step 11or else go to Step 3.
Step 11. The leaf nodes of the tree are the individual descriptionof the in-situ rock blocks.
The final tree structure of the modelled rock mass is given inFig. 10. Here, the number of surfaces is 30, the number of edges is49 and the number of vertices is 26.
(18, 0, 9)(0, 0, 9)
(1.8, 0.3, 3.7)
(0, 0, 1.5)
Fig. 12. Related natural block and rectangular cuboid to be fit into block.
2.3. Maximum largest cuboid volume that can fit into an individual
natural block
For the solution of this optimisation problem, we chose agenetic algorithm as an optimisation tool.
Genetic algorithm is probably the most general approach ofevolutionary computation methods (Koza, 1992). This is aprobabilistic search method for solving large combinationaldesign problems in various engineering optimisation problems.
Some components are, especially, important in solving aproblem using a genetic algorithm: coding, selecting, crossover
and mutation. The chromosome is usually made up of thevariables in the problem arranged in a given order. Each suchvariable in this arrangement is called a ‘‘gene’’. Consequently, thegene is the smallest genetic structure that carries meaningfulgenetic information, such that the coding is represented with achromosomal visualisation of the information relevant to theproblem. The coding model of chromosomes is one of the factorsaffecting the GA’s performance. Two methods are generally usedfor coding: coding parameters with binary numbers and decimalnumbers. In this study, the x, y, and z coordinates of the maximum
and minimum points have been determined by the binary codingmethod to express a rectangular prism. In practice, basic coding
(in which each chromosome represents a rectangular prism) hasbeen used for the remaining in-situ block products. A chromo-some sequence consists of 6 units of genes. The size of the parts isdetermined according to the x, y, and z values. These values are themaxima compared to the sizes of the related rock mass beforefracturing (see Fig. 11). Our target in the application is to search arectangular prism (cuboid) as shown in Fig. 12 with the maximumvolume that can be fit into the block using the GA.
ARTICLE IN PRESS
Table 2Maximum cuboid volumes.
Natural block numbers Maximum cuboid volumes(m3)
1 22.500
2 85.129
3 31.304
4 98.000
5 89.244
Total 326.177
E. Ulker, A. Turanboy / Computers & Geosciences 35 (2009) 1470–1480 1477
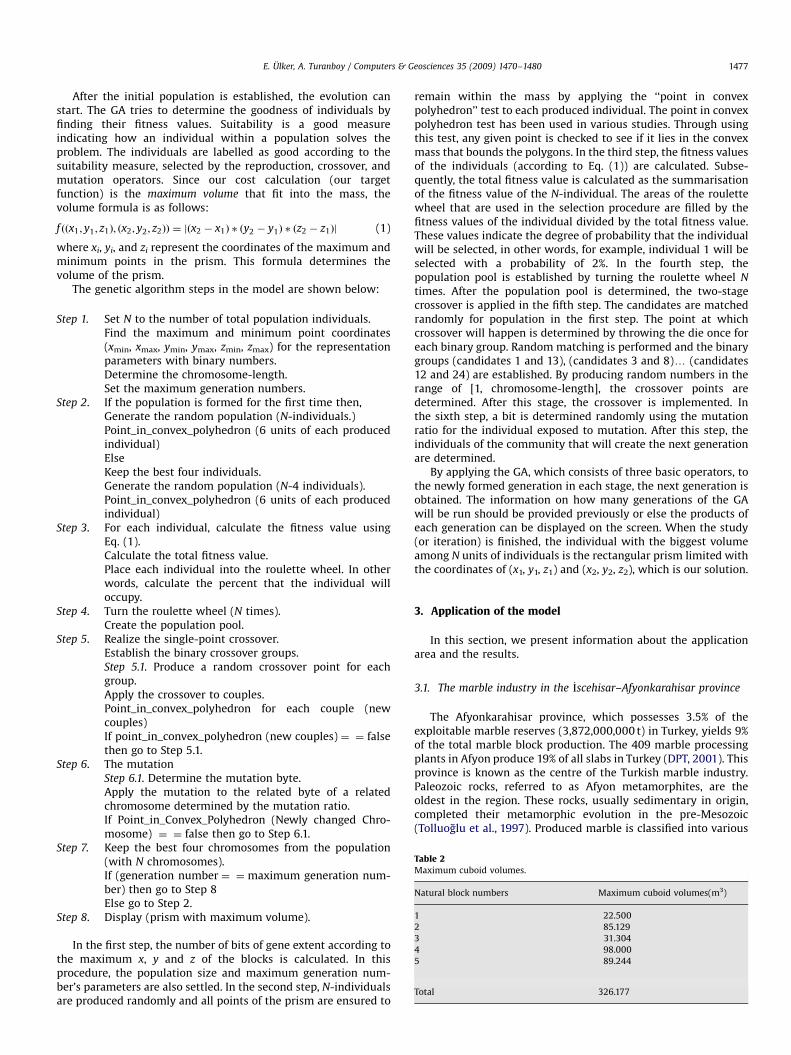
After the initial population is established, the evolution canstart. The GA tries to determine the goodness of individuals byfinding their fitness values. Suitability is a good measureindicating how an individual within a population solves theproblem. The individuals are labelled as good according to thesuitability measure, selected by the reproduction, crossover, andmutation operators. Since our cost calculation (our targetfunction) is the maximum volume that fit into the mass, thevolume formula is as follows:
f ððx1; y1; z1Þ; ðx2; y2; z2ÞÞ ¼ jðx2 � x1Þ � ðy2 � y1Þ � ðz2 � z1Þj (1)
where xi, yi, and zi represent the coordinates of the maximum andminimum points in the prism. This formula determines thevolume of the prism.
The genetic algorithm steps in the model are shown below:
Step 1. Set N to the number of total population individuals.Find the maximum and minimum point coordinates(xmin, xmax, ymin, ymax, zmin, zmax) for the representationparameters with binary numbers.Determine the chromosome-length.Set the maximum generation numbers.
Step 2. If the population is formed for the first time then,Generate the random population (N-individuals.)Point_in_convex_polyhedron (6 units of each producedindividual)ElseKeep the best four individuals.Generate the random population (N-4 individuals).Point_in_convex_polyhedron (6 units of each producedindividual)
Step 3. For each individual, calculate the fitness value usingEq. (1).Calculate the total fitness value.Place each individual into the roulette wheel. In otherwords, calculate the percent that the individual willoccupy.
Step 4. Turn the roulette wheel (N times).Create the population pool.
Step 5. Realize the single-point crossover.Establish the binary crossover groups.Step 5.1. Produce a random crossover point for eachgroup.Apply the crossover to couples.Point_in_convex_polyhedron for each couple (newcouples)If point_in_convex_polyhedron (new couples) ¼ ¼ falsethen go to Step 5.1.
Step 6. The mutationStep 6.1. Determine the mutation byte.Apply the mutation to the related byte of a relatedchromosome determined by the mutation ratio.If Point_in_Convex_Polyhedron (Newly changed Chro-mosome) ¼ ¼ false then go to Step 6.1.
Step 7. Keep the best four chromosomes from the population(with N chromosomes).If (generation number ¼ ¼maximum generation num-ber) then go to Step 8Else go to Step 2.
Step 8. Display (prism with maximum volume).
In the first step, the number of bits of gene extent according tothe maximum x, y and z of the blocks is calculated. In thisprocedure, the population size and maximum generation num-ber’s parameters are also settled. In the second step, N-individualsare produced randomly and all points of the prism are ensured to
remain within the mass by applying the ‘‘point in convexpolyhedron’’ test to each produced individual. The point in convexpolyhedron test has been used in various studies. Through usingthis test, any given point is checked to see if it lies in the convexmass that bounds the polygons. In the third step, the fitness valuesof the individuals (according to Eq. (1)) are calculated. Subse-quently, the total fitness value is calculated as the summarisationof the fitness value of the N-individual. The areas of the roulettewheel that are used in the selection procedure are filled by thefitness values of the individual divided by the total fitness value.These values indicate the degree of probability that the individualwill be selected, in other words, for example, individual 1 will beselected with a probability of 2%. In the fourth step, thepopulation pool is established by turning the roulette wheel N
times. After the population pool is determined, the two-stagecrossover is applied in the fifth step. The candidates are matchedrandomly for population in the first step. The point at whichcrossover will happen is determined by throwing the die once foreach binary group. Random matching is performed and the binarygroups (candidates 1 and 13), (candidates 3 and 8)y (candidates12 and 24) are established. By producing random numbers in therange of [1, chromosome-length], the crossover points aredetermined. After this stage, the crossover is implemented. Inthe sixth step, a bit is determined randomly using the mutationratio for the individual exposed to mutation. After this step, theindividuals of the community that will create the next generationare determined.
By applying the GA, which consists of three basic operators, tothe newly formed generation in each stage, the next generation isobtained. The information on how many generations of the GAwill be run should be provided previously or else the products ofeach generation can be displayed on the screen. When the study(or iteration) is finished, the individual with the biggest volumeamong N units of individuals is the rectangular prism limited withthe coordinates of (x1, y1, z1) and (x2, y2, z2), which is our solution.
3. Application of the model
In this section, we present information about the applicationarea and the results.
3.1. The marble industry in the Iscehisar–Afyonkarahisar province
The Afyonkarahisar province, which possesses 3.5% of theexploitable marble reserves (3,872,000,000 t) in Turkey, yields 9%of the total marble block production. The 409 marble processingplants in Afyon produce 19% of all slabs in Turkey (DPT, 2001). Thisprovince is known as the centre of the Turkish marble industry.Paleozoic rocks, referred to as Afyon metamorphites, are theoldest in the region. These rocks, usually sedimentary in origin,completed their metamorphic evolution in the pre-Mesozoic(Tolluoglu et al., 1997). Produced marble is classified into various
ARTICLE IN PRESS
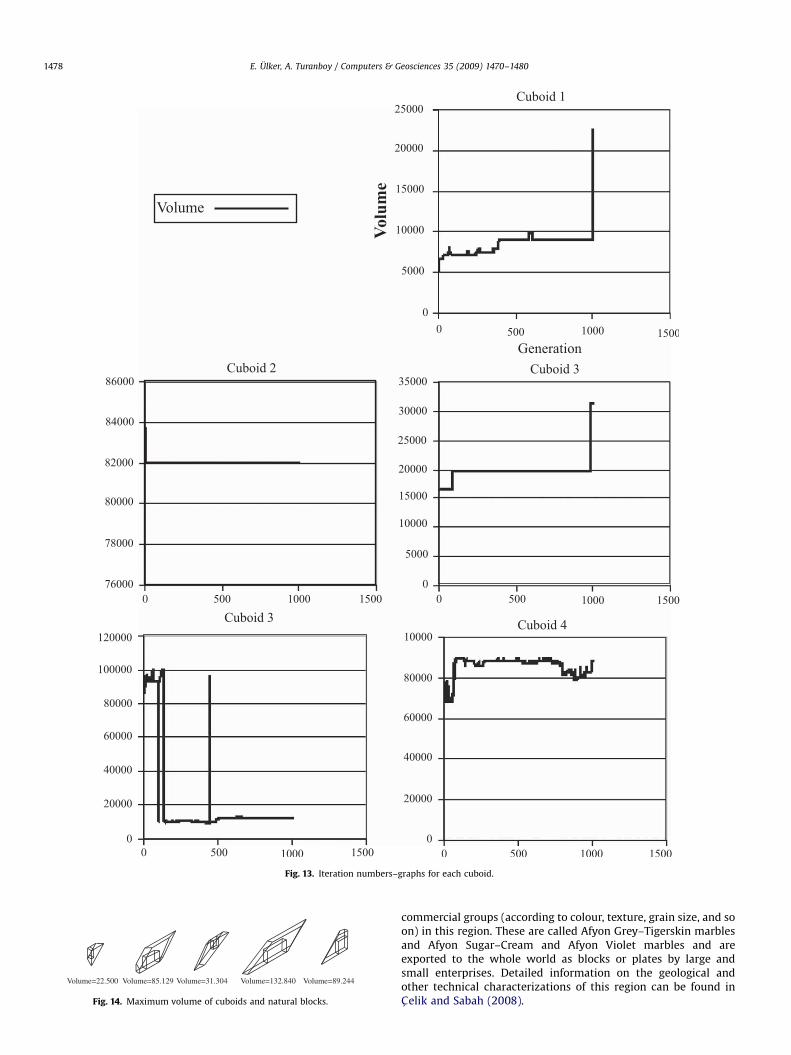
Fig. 13. Iteration numbers–graphs for each cuboid.
Volume=22.500 Volume=85.129 Volume=132.840 Volume=89.244Volume=31.304
Fig. 14. Maximum volume of cuboids and natural blocks.
E. Ulker, A. Turanboy / Computers & Geosciences 35 (2009) 1470–14801478
commercial groups (according to colour, texture, grain size, and soon) in this region. These are called Afyon Grey–Tigerskin marblesand Afyon Sugar–Cream and Afyon Violet marbles and areexported to the whole world as blocks or plates by large andsmall enterprises. Detailed information on the geological andother technical characterizations of this region can be found inC- elik and Sabah (2008).
ARTICLE IN PRESS
E. Ulker, A. Turanboy / Computers & Geosciences 35 (2009) 1470–1480 1479
3.2. The selected quarry
The selected marble quarry (Demmer AS- . Orenaltı MarbleQuarry) for the model is located at the 22nd km of the highwaybetween Afyonkarahisar and Ankara cities in the Iscehisar marbleindustrial zone. Almost all marble kinds mentioned above can beobtained from this quarry. Exploitation is a typical open pit quarryof approximately NW–SE orientation and, in its present form, itconsists of 7–9 benches in the selected quarry. The bench heightvaries between 6 and 10 m. The mined-out benches have a slopeangle near to vertical, reaching 85–901. The production of usefulblocks for the first 5 months of 2007 was 3142 m3, and the annualproduction is approximately 10,000 m3. The marble is extractedwith the use of wire saw cutting machines before the drillingoperation in the quarry. The extracted volume of marble is asregular cuboidal blocks and is loaded onto trucks and transportedto the factory for the other processes. The rough cuboid block sizethat the market demands is approximately at least 3.0 m�1.5m�1.5 m ¼ 6.75 m3. More commercial information can be foundon the company’s website. (www.demmermarble.com).
3.3. Results
A photograph of the bench outcrop for the tested model isgiven in Fig. 3(a). The selected bench, the modelled boundary as arectangle on the outcrop and the measured discontinuity tracesare drawn approximately (see Fig. 3b). Fig. 10 provides avisualisation of this sample. Isometric projection rules were usedin this illustration. The total volume of the selected structure is1.800 m�55.500 m�9.000 m ¼ 899.100 m3.
Table 1 gives the output data in the applications of the model.Thus, all of the individual natural blocks bounded by disconti-nuities and free surfaces have been obtained. The height of thetree structure is 4 in this example. The plane numbers that createdthe individual blocks are given under every block in Fig. 10. The GAwas then run for each block. The preferred genetic values in theapplication are generation number of 1000, population size of 24,mutation ratio of 0.001 and crossover ratio of 0.1. The roulettewheel was used for the selection process. For each block, theobtained volumes of the cuboids when they reached the lastiteration are given in Table 2.
Fig. 13 shows a plot of the iteration number and the matching(obtained volume) relations. If the generation numbers of the GAare increased, solutions are reached ideally, as shown in Fig. 14. Inaddition, the maximum cuboidal blocks that can fit into irregularnatural blocks are shown in Fig. 14. These illustrations are alsoobtained by the isometric projection method.
In the experimental sector, the theoretical recovery rate (onlythe natural block and the maximum cuboids that can fit into thenatural blocks are considered) can be calculated easily as(326.177/899.100)�100 ¼ 36.28%. Only the perpendicular angleshave been taken into account in our model. This rate couldincrease with different cutting angles for the x, y and z axes. Inaddition, if the remaining pieces are also considered, this ratiowill increase. In this region, the final recovery rate has neverexceeded 15%.
4. Conclusions
This optimisation work is based on a careful 3D modelling ofthe rock mass structure coupled with a scan-line surveyingtechnique and this developed computer program. This model canbe used practically for planning a marble exploitation process andwill lead to a maximum block recovery rate in block sizes that themarket demands.
The rock mass has many characteristics other than thediscontinuity geometry and the orientation, such as the mechan-ical characteristics, for instance colour and texture. These areactually technical and economic restrictions. Therefore, for manyquarry-planning processes, the blocks of stone need to beclassified into two categories, as exploitable or non-exploitable,based on these characteristics in the simplest way. Our study alsosupports these pre-assessment problems. In addition, practicalsolutions can be achieved in already existing extraction processes.
The developed model is limited for detailed projects. However,this practical method can be extended to detailed projects byadapting the other characteristic data mentioned above. Forexample, the proposed method can also use data obtained fromother survey techniques such as digital imaging. Furthermore,there are many aspects other than the optimisation of blockrecovery, for instance those that deal with safety, environmentalissues, the management of deposits and the handling and use ofwaste rock, which are directly relevant to quarrying. This methodshould be able to contribute to these important subjects withadditional research. These are the future goals of this study.
Our study has a novel solution for finding the maximumvolume of cuboids that can be cut from any polyhedral blockdescribed in 3D by vertices. The calculations can be done easilyand the model construction can be quickly realized. We believethat this model will bring a different point of view to the conceptof in-situ block optimisation of dimension-stone quarries.
Acknowledgement
This study has been supported by the Scientific Projects of Selc-uk University (Turkey).
References
Alimov, O.D., Mamasaidov, M.T., 1988. Analysis of production method forseparating blocks of natural stone from the rock mass. Journal of MiningScience 24, 162–165.
C- elik, M.Y., Sabah, E., 2008. Geological and technical characterization of Iscehisar(Afyon-Turkey) marble deposits and the impact of marble waste to environ-mental pollution. Journal of Environmental Management 87, 106–116.
Cormen, T.H., Leiserson, C.E., Rivest, R.L., Stein, C., 2001. Introduction to Algorithms,second ed. MIT Press and McGraw-Hill, Cambridge, MA, 1202.
DPT, 2001. (Turkish Republic State Planning Organization). Madencilik Ozel IhtisasKomisyonu Raporu (The Report of Mining Private Specialization Commission).Endustriyel Hammaddeler Alt Komisyonu (The sub-commission of industrialraw materials). Yapı Malzemeleri II C- alıs-ma Grubu Raporu (The Report ofStructural Materials II Working Group). Sekizinci Bes-- Yıllık Kalkınma Planı(Eighth Five Years Development Plan). Yayın No: DPT: 2616-OIK: 627, Ankara,191pp.
Heliot, D., 1988. Generating a blocky rock mass. International Journal of RockMechanics and Mining Sciences 25, 127–138.
ISRM, 1978. International society for rock mechanics, standardization of laboratoryand field tests, suggested methods for the quantitative description ofdiscontinuities in rock masses. International Journal of Rock Mechanics andMining Sciences 15, 319–368.
Jing, L., 2000. Block system construction for three-dimensional discrete elementmodels of fractured rocks. International Journal of Rock Mechanics and MiningSciences 37, 645–659.
Jing, L., Stephansson, O., 1994. Topological identification of block assemblages forjointed rock masses. International Journal of Rock Mechanics and MiningSciences & Geomechanics Abstracts 31, 163–172.
Knuth, D.E., 1997. Art of Computer Programming, Volume 1: FundamentalAlgorithms, third ed. Addison-Wesley, Reading, MA, 650pp.
Koza, J.R., 1992. Genetic Programming: on the Programming of Computers byMeans of Natural Selection. MIT Press, Cambridge, Massachusetts, 840.
Lin, D., Fairhurst, C., Starfield, A.M., 1987. Geometrical identification of threedimensional rock block systems using topological techniques. InternationalJournal of Rock Mechanics and Mining Sciences Geomechanics Abstracts 24,331–338.
Loorents, K.J., Stigh, J., Bjorklund, L., 2000. Prediction of a fracture system from anexcavated ditch in the central Caledonides. Sweden. Bulletin of EngineeringGeology and the Environment 58, 159–165.
Lu, J., 2002. Systematic identification of polyhedral rock blocks with arbitraryjoints and faults. Computers and Geotechnics 29, 49–72.

ARTICLE IN PRESS
E. Ulker, A. Turanboy / Computers & Geosciences 35 (2009) 1470–14801480
Mamasaidov, M.T., Mendekeev, R.A., Ismanov, M.M., 2004. Generalized model oftechnology for article production from stone massif. Journal of Mining Science40, 521–527.
Newell, A., Shaw, F.C., 1957. Programming the logic theory machine. In: ProceedingsWestern Joint Computer Conference, Los Angeles, CA, pp. 230–240.
Pereira, H.G., Brito, G., Albuquerque, T., Riberio, J., 1992. Geostatistical estimationof a summary recovery index for marble quarries. In: Soares, A. (Ed.),Geostatistics Troia’92. Kluwer Academic, Dordrecht, pp. 1029–1040.
Preiss, B.R., 1999. Data Structures and Algorithms with Object-Oriented DesignPatterns in Java. Wiley, New York, 635pp.
Priest, S.D., Hudson, J.A., 1981. Estimation of discontinuity spacing and trace lengthusing scanline surveys. International Journal of Rock Mechanics and MiningSciences & Geomechanics Abstracts 18, 183–197.
Simon, H.A., 1998. Allen Newell: 1927–1992. IEEE Annals of the History ofComputing 20, 63–76.
Taboada, J., Vaamonde, A., Saavedra, A., Alejano, L., 1997. Application ofgeostatistical techniques to exploitation planning in slate quarries. EngineeringGeology 47, 269–277.
Tercan, E., Ozc-elik, Y., 2000. Geostatistical evaluation of dimension-stone quarries.Engineering Geology 58, 25–33.
Tolluoglu, A.U., Erkan, Y., Sumer, E.O., Boyacı, M.N., Yavas-, F., 1997. Afyonmetasedimanter grubunun mesozoik oncesi metamorfik evrimi (The Pre-Mesozoic metamorphic evolution of the Afyon metasedimentary group).Turkiye Jeoloji Bulteni 40, 1–17.
Turanboy, A., Ulker, E., 2008. LIP-RM: an attempt at 3D visualization of in situ rockmass structures. Computational Geosciences 12, 181–192.
Turanboy, A., Gokay, M.K., Ulker, E., 2008. An approach to geometrical modelling ofslope curves and discontinuities. Simulation Modelling and Practice in Theory16, 445–461.
Warburton, P.M., 1983. Applications of a new computer model for reconstructingblocky rock geometry analysis using single block stability and identifyingkeystones. In: Proceedings 5th International Congress on Rock Mechanics,Melbourne, Australia, F225–F231.
Warburton, P.M., 1985. A computer program for reconstructing blocky rockgeometry and analyzing single block stability. Computers & Geosciences 11,707–712.


![[Art Critic] Sleep and dreams as Discontinuity and Severance](https://static.fdokumen.com/doc/165x107/63324e71576b626f850d5b54/art-critic-sleep-and-dreams-as-discontinuity-and-severance.jpg)