Matrix effects on the multi-collector inductively coupled plasma mass spectrometric analysis of...
9
Analytica Chimica Acta 633 (2009) 29–37 Contents lists available at ScienceDirect Analytica Chimica Acta journal homepage: www.elsevier.com/locate/aca Matrix effects on the multi-collector inductively coupled plasma mass spectrometric analysis of high-precision cadmium and zinc isotope ratios Alyssa E. Shiel ∗ , Jane Barling, Kristin J. Orians, Dominique Weis Pacific Centre for Isotopic and Geochemical Research, Department of Earth and Ocean Sciences, University of British Columbia (UBC), Vancouver, B.C. V6T 1Z4, Canada article info Article history: Received 26 May 2008 Received in revised form 4 November 2008 Accepted 13 November 2008 Available online 20 November 2008 Keywords: MC-ICP-MS Mass bias Resin Ion exchange chromatography Heavy stable isotopes Transition metals abstract Resin-derived contaminants added to samples during column chemistry are shown to cause matrix effects that lead to inaccuracy in multi-collector inductively coupled plasma mass spectrometry measurement of small natural variations in Cd and Zn isotopic compositions. These matrix effects were evaluated by com- paring pure Cd and Zn standards and standards doped with bulk column blank from the anion exchange chromatography procedure. Doped standards exhibit signal enhancements (Cd, Ag, Zn and Cu), instru- mental mass bias changes and inaccurate isotopic compositions relative to undoped standards, all of which are attributed to the combined presence of resin-derived organics and inorganics. The matrix effect associated with the inorganic component of the column blanks was evaluated separately by doping standards with metals at the trace levels detected in the column blanks. Mass bias effects introduced by the inorganic column blank matrix are smaller than for the bulk column blank matrix but can still lead to significant changes in ion signal intensity, instrumental mass bias and isotopic ratios. Chemical treat- ment with refluxed HNO 3 or HClO 4 /HNO 3 removes resin-derived organic components resulting in matrix effects similar in magnitude to those associated with the inorganic component of the column blank. Mass bias correction using combined external normalization-SSB does not correct for these matrix effects because the instrumental mass biases experienced by Cd and Zn are decoupled from those of Ag and Cu, respectively. Our results demonstrate that ion exchange chromatography and associated resin- derived contaminants can be a source of error in MC-ICP-MS measurement of heavy stable element isotopic compositions. © 2008 Elsevier B.V. All rights reserved. 1. Introduction The multi-collector inductively coupled plasma mass spec- trometer (MC-ICP-MS) has enabled the measurement of small differences in the isotopic composition of many heavy stable ele- ments. In particular, the enhanced ionization efficiency inherent to the inductively coupled plasma source has enabled the ionization of elements, such as Cd and Zn, that have been difficult to ionize by other methods (e.g. TIMS [1–4]). Recent MC-ICP-MS investigations have revealed small Cd and Zn isotopic variations in terres- trial [5–12], marine [5,6,13–20], anthropogenic [8,11,18,20–26] and extraterrestrial samples [7,27,28]. The largest isotopic variations are of anthropogenic (e.g. ore processing and smelting) and extrater- restrial (e.g. chondrites, meteorites and lunar samples) origins. Reported isotopic variations range from ı 114/110 Cd = −7.8 to +14.8‰ [7,8,15,16,18,20,21,23] relative to the “JMC Cd” reference standard (Johnson Matthey Company) [29] and from ı 66/64 Zn = −3.83 to ∗ Corresponding author. Tel.: +1 604 822 3764. E-mail address: [email protected] (A.E. Shiel). +6.39‰ [5,6,9–14,17,19,20,22,24–28] relative to the “JMC Zn-Lyon” reference standard [5]. Resolution of these small differences in Cd and Zn isotopic com- positions requires a high degree of accuracy and precision and therefore careful attention must be paid to potential spectral and non-spectral interferences [30–33]. Spectral interferences include isobaric interferences of singly (e.g. 114 Sn + on 114 Cd + ) and doubly charged elements (e.g. 136 Ba 2+ on 68 Zn + ) and polyatomic species from the recombination of argon, atmospheric gases, solvents and sample matrix (e.g. 68 Zn 40 Ar + on 108 Cd + ) [31,34]. Spectral inter- ferences on isotopes of the analyte result in non-mass-dependent isotopic variations that are readily identified by comparing the per amu delta values calculated from the different analyte isotope ratios. Non-spectral interferences, or matrix effects, are changes in the instrument response (signal intensity and mass bias) to the ana- lyte resulting from the presence of matrix components [33,35,36]. Non-spectral interferences are difficult to identify because the effects are mass-dependent and may obscure small natural mass- dependent fractionations [35]. Recently, efforts have been made to evaluate non-spectral interferences in the analysis of non- traditional stable isotopes by MC-ICP-MS (e.g. Ir on Ag–Pd [35]; Na, 0003-2670/$ – see front matter © 2008 Elsevier B.V. All rights reserved. doi:10.1016/j.aca.2008.11.026
-
Upload
independent -
Category
Documents
-
view
1 -
download
0
Transcript of Matrix effects on the multi-collector inductively coupled plasma mass spectrometric analysis of...
Ms
AP
a
ARRAA
KMMRIHT
1
tdmtoohteorR[(
0d
Analytica Chimica Acta 633 (2009) 29–37
Contents lists available at ScienceDirect
Analytica Chimica Acta
journa l homepage: www.e lsev ier .com/ locate /aca
atrix effects on the multi-collector inductively coupled plasma masspectrometric analysis of high-precision cadmium and zinc isotope ratios
lyssa E. Shiel ∗, Jane Barling, Kristin J. Orians, Dominique Weisacific Centre for Isotopic and Geochemical Research, Department of Earth and Ocean Sciences, University of British Columbia (UBC), Vancouver, B.C. V6T 1Z4, Canada
r t i c l e i n f o
rticle history:eceived 26 May 2008eceived in revised form 4 November 2008ccepted 13 November 2008vailable online 20 November 2008
eywords:C-ICP-MSass bias
esinon exchange chromatographyeavy stable isotopesransition metals
a b s t r a c t
Resin-derived contaminants added to samples during column chemistry are shown to cause matrix effectsthat lead to inaccuracy in multi-collector inductively coupled plasma mass spectrometry measurement ofsmall natural variations in Cd and Zn isotopic compositions. These matrix effects were evaluated by com-paring pure Cd and Zn standards and standards doped with bulk column blank from the anion exchangechromatography procedure. Doped standards exhibit signal enhancements (Cd, Ag, Zn and Cu), instru-mental mass bias changes and inaccurate isotopic compositions relative to undoped standards, all ofwhich are attributed to the combined presence of resin-derived organics and inorganics. The matrixeffect associated with the inorganic component of the column blanks was evaluated separately by dopingstandards with metals at the trace levels detected in the column blanks. Mass bias effects introduced bythe inorganic column blank matrix are smaller than for the bulk column blank matrix but can still leadto significant changes in ion signal intensity, instrumental mass bias and isotopic ratios. Chemical treat-ment with refluxed HNO or HClO /HNO removes resin-derived organic components resulting in matrix
3 4 3effects similar in magnitude to those associated with the inorganic component of the column blank.Mass bias correction using combined external normalization-SSB does not correct for these matrix
effects because the instrumental mass biases experienced by Cd and Zn are decoupled from those of Agand Cu, respectively. Our results demonstrate that ion exchange chromatography and associated resin-derived contaminants can be a source of error in MC-ICP-MS measurement of heavy stable element isotopic
+r
ptnicfsfip
compositions.
. Introduction
The multi-collector inductively coupled plasma mass spec-rometer (MC-ICP-MS) has enabled the measurement of smallifferences in the isotopic composition of many heavy stable ele-ents. In particular, the enhanced ionization efficiency inherent to
he inductively coupled plasma source has enabled the ionizationf elements, such as Cd and Zn, that have been difficult to ionize byther methods (e.g. TIMS [1–4]). Recent MC-ICP-MS investigationsave revealed small Cd and Zn isotopic variations in terres-rial [5–12], marine [5,6,13–20], anthropogenic [8,11,18,20–26] andxtraterrestrial samples [7,27,28]. The largest isotopic variations aref anthropogenic (e.g. ore processing and smelting) and extrater-
estrial (e.g. chondrites, meteorites and lunar samples) origins.eported isotopic variations range from ı114/110Cd = −7.8 to +14.8‰7,8,15,16,18,20,21,23] relative to the “JMC Cd” reference standardJohnson Matthey Company) [29] and from ı66/64Zn = −3.83 to∗ Corresponding author. Tel.: +1 604 822 3764.E-mail address: [email protected] (A.E. Shiel).
rtlNedtt
003-2670/$ – see front matter © 2008 Elsevier B.V. All rights reserved.oi:10.1016/j.aca.2008.11.026
© 2008 Elsevier B.V. All rights reserved.
6.39‰ [5,6,9–14,17,19,20,22,24–28] relative to the “JMC Zn-Lyon”eference standard [5].
Resolution of these small differences in Cd and Zn isotopic com-ositions requires a high degree of accuracy and precision andherefore careful attention must be paid to potential spectral andon-spectral interferences [30–33]. Spectral interferences include
sobaric interferences of singly (e.g. 114Sn+ on 114Cd+) and doublyharged elements (e.g. 136Ba2+ on 68Zn+) and polyatomic speciesrom the recombination of argon, atmospheric gases, solvents andample matrix (e.g. 68Zn40Ar+ on 108Cd+) [31,34]. Spectral inter-erences on isotopes of the analyte result in non-mass-dependentsotopic variations that are readily identified by comparing theer amu delta values calculated from the different analyte isotopeatios. Non-spectral interferences, or matrix effects, are changes inhe instrument response (signal intensity and mass bias) to the ana-yte resulting from the presence of matrix components [33,35,36].
on-spectral interferences are difficult to identify because theffects are mass-dependent and may obscure small natural mass-ependent fractionations [35]. Recently, efforts have been madeo evaluate non-spectral interferences in the analysis of non-raditional stable isotopes by MC-ICP-MS (e.g. Ir on Ag–Pd [35]; Na,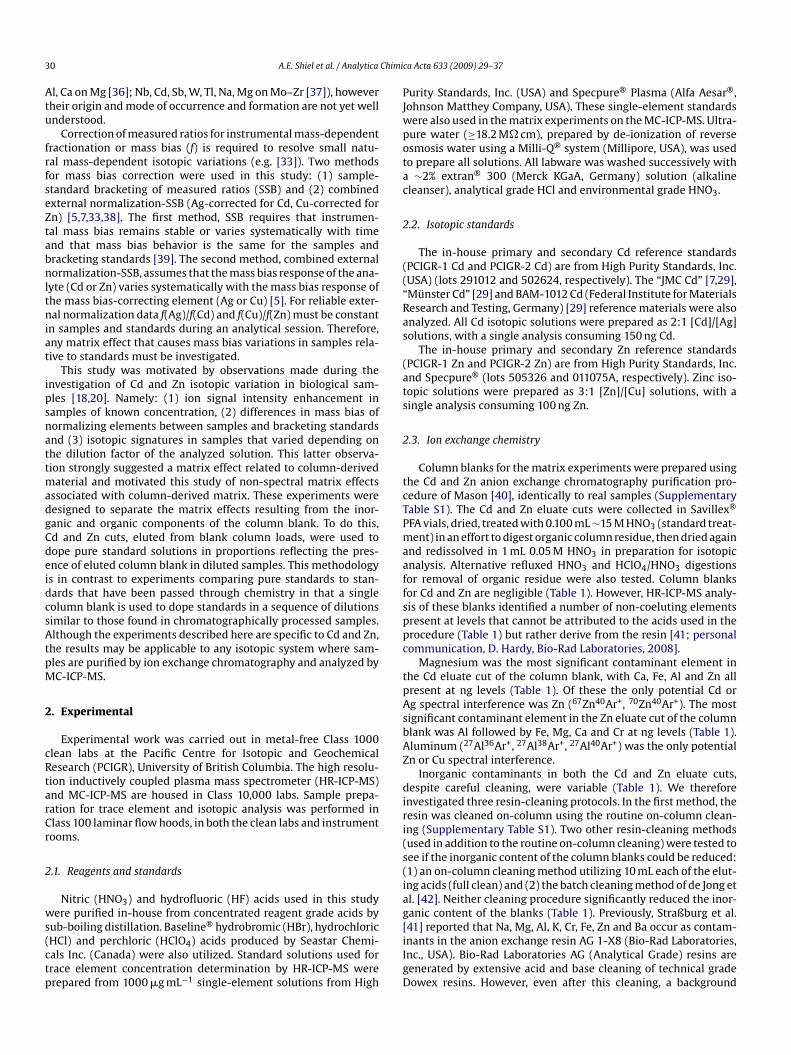
3 Chimi
Atu
frfseZtabnltniat
ipsnattmadgCdeidcsAtpM
2
cRtarCr
2
ws(ctp
PJwpotac
2
((“Ras
(ats
2
tcTPmaaffsppc
tpAsbAZ
diri(s(iag
0 A.E. Shiel et al. / Analytica
l, Ca on Mg [36]; Nb, Cd, Sb, W, Tl, Na, Mg on Mo–Zr [37]), howeverheir origin and mode of occurrence and formation are not yet wellnderstood.
Correction of measured ratios for instrumental mass-dependentractionation or mass bias (f) is required to resolve small natu-al mass-dependent isotopic variations (e.g. [33]). Two methodsor mass bias correction were used in this study: (1) sample-tandard bracketing of measured ratios (SSB) and (2) combinedxternal normalization-SSB (Ag-corrected for Cd, Cu-corrected forn) [5,7,33,38]. The first method, SSB requires that instrumen-al mass bias remains stable or varies systematically with timend that mass bias behavior is the same for the samples andracketing standards [39]. The second method, combined externalormalization-SSB, assumes that the mass bias response of the ana-
yte (Cd or Zn) varies systematically with the mass bias response ofhe mass bias-correcting element (Ag or Cu) [5]. For reliable exter-al normalization data f(Ag)/f(Cd) and f(Cu)/f(Zn) must be constant
n samples and standards during an analytical session. Therefore,ny matrix effect that causes mass bias variations in samples rela-ive to standards must be investigated.
This study was motivated by observations made during thenvestigation of Cd and Zn isotopic variation in biological sam-les [18,20]. Namely: (1) ion signal intensity enhancement inamples of known concentration, (2) differences in mass bias oformalizing elements between samples and bracketing standardsnd (3) isotopic signatures in samples that varied depending onhe dilution factor of the analyzed solution. This latter observa-ion strongly suggested a matrix effect related to column-derived
aterial and motivated this study of non-spectral matrix effectsssociated with column-derived matrix. These experiments wereesigned to separate the matrix effects resulting from the inor-anic and organic components of the column blank. To do this,d and Zn cuts, eluted from blank column loads, were used toope pure standard solutions in proportions reflecting the pres-nce of eluted column blank in diluted samples. This methodologys in contrast to experiments comparing pure standards to stan-ards that have been passed through chemistry in that a singleolumn blank is used to dope standards in a sequence of dilutionsimilar to those found in chromatographically processed samples.lthough the experiments described here are specific to Cd and Zn,
he results may be applicable to any isotopic system where sam-les are purified by ion exchange chromatography and analyzed byC-ICP-MS.
. Experimental
Experimental work was carried out in metal-free Class 1000lean labs at the Pacific Centre for Isotopic and Geochemicalesearch (PCIGR), University of British Columbia. The high resolu-ion inductively coupled plasma mass spectrometer (HR-ICP-MS)nd MC-ICP-MS are housed in Class 10,000 labs. Sample prepa-ation for trace element and isotopic analysis was performed inlass 100 laminar flow hoods, in both the clean labs and instrumentooms.
.1. Reagents and standards
Nitric (HNO3) and hydrofluoric (HF) acids used in this studyere purified in-house from concentrated reagent grade acids by
ub-boiling distillation. Baseline® hydrobromic (HBr), hydrochloricHCl) and perchloric (HClO4) acids produced by Seastar Chemi-als Inc. (Canada) were also utilized. Standard solutions used forrace element concentration determination by HR-ICP-MS wererepared from 1000 �g mL−1 single-element solutions from High
[iIgD
ca Acta 633 (2009) 29–37
urity Standards, Inc. (USA) and Specpure® Plasma (Alfa Aesar®,ohnson Matthey Company, USA). These single-element standardsere also used in the matrix experiments on the MC-ICP-MS. Ultra-ure water (≥18.2 M� cm), prepared by de-ionization of reversesmosis water using a Milli-Q® system (Millipore, USA), was usedo prepare all solutions. All labware was washed successively with
∼2% extran® 300 (Merck KGaA, Germany) solution (alkalineleanser), analytical grade HCl and environmental grade HNO3.
.2. Isotopic standards
The in-house primary and secondary Cd reference standardsPCIGR-1 Cd and PCIGR-2 Cd) are from High Purity Standards, Inc.USA) (lots 291012 and 502624, respectively). The “JMC Cd” [7,29],Münster Cd” [29] and BAM-1012 Cd (Federal Institute for Materialsesearch and Testing, Germany) [29] reference materials were alsonalyzed. All Cd isotopic solutions were prepared as 2:1 [Cd]/[Ag]olutions, with a single analysis consuming 150 ng Cd.
The in-house primary and secondary Zn reference standardsPCIGR-1 Zn and PCIGR-2 Zn) are from High Purity Standards, Inc.nd Specpure® (lots 505326 and 011075A, respectively). Zinc iso-opic solutions were prepared as 3:1 [Zn]/[Cu] solutions, with aingle analysis consuming 100 ng Zn.
.3. Ion exchange chemistry
Column blanks for the matrix experiments were prepared usinghe Cd and Zn anion exchange chromatography purification pro-edure of Mason [40], identically to real samples (Supplementaryable S1). The Cd and Zn eluate cuts were collected in Savillex®
FA vials, dried, treated with 0.100 mL ∼15 M HNO3 (standard treat-ent) in an effort to digest organic column residue, then dried again
nd redissolved in 1 mL 0.05 M HNO3 in preparation for isotopicnalysis. Alternative refluxed HNO3 and HClO4/HNO3 digestionsor removal of organic residue were also tested. Column blanksor Cd and Zn are negligible (Table 1). However, HR-ICP-MS analy-is of these blanks identified a number of non-coeluting elementsresent at levels that cannot be attributed to the acids used in therocedure (Table 1) but rather derive from the resin [41; personalommunication, D. Hardy, Bio-Rad Laboratories, 2008].
Magnesium was the most significant contaminant element inhe Cd eluate cut of the column blank, with Ca, Fe, Al and Zn allresent at ng levels (Table 1). Of these the only potential Cd org spectral interference was Zn (67Zn40Ar+, 70Zn40Ar+). The mostignificant contaminant element in the Zn eluate cut of the columnlank was Al followed by Fe, Mg, Ca and Cr at ng levels (Table 1).luminum (27Al36Ar+, 27Al38Ar+, 27Al40Ar+) was the only potentialn or Cu spectral interference.
Inorganic contaminants in both the Cd and Zn eluate cuts,espite careful cleaning, were variable (Table 1). We therefore
nvestigated three resin-cleaning protocols. In the first method, theesin was cleaned on-column using the routine on-column clean-ng (Supplementary Table S1). Two other resin-cleaning methodsused in addition to the routine on-column cleaning) were tested toee if the inorganic content of the column blanks could be reduced:1) an on-column cleaning method utilizing 10 mL each of the elut-ng acids (full clean) and (2) the batch cleaning method of de Jong etl. [42]. Neither cleaning procedure significantly reduced the inor-anic content of the blanks (Table 1). Previously, Straßburg et al.
41] reported that Na, Mg, Al, K, Cr, Fe, Zn and Ba occur as contam-nants in the anion exchange resin AG 1-X8 (Bio-Rad Laboratories,nc., USA). Bio-Rad Laboratories AG (Analytical Grade) resins areenerated by extensive acid and base cleaning of technical gradeowex resins. However, even after this cleaning, a background
A.E. Shiel et al. / Analytica Chimica Acta 633 (2009) 29–37 31
Table 1Inorganic contents of column chemistry blanks are shown for three resin cleaning methods, the routine clean was used in this study (Supplementary Table S1). Perchlorictreatment of a column blank after routine cleaning (Cd Blank 6 and Zn Blank 4) was evaluated for additional contamination.
Element (ng) Routine clean Full cleanJune 2007
Batch cleanApril 2008
HClO4-treatedJune 2007
[Matrix element]5/[Cd]6 or[Zn]7 in real samples
October 2006 June 2007 April 2008
Cd fraction (0.5 M HNO3)Mg1 42 17 0.2 21 2.7 74 0.095–0.447Al1 3.3 0.83 1.1 2.1 1.1 2.5 0.007–0.032Ca1 8.2 ND 0.46 3.3 0.97 7.3 0.011–0.053Cr1 0.7 0.33 0.2 0.61 0.15 41 0.001–0.003Fe2 3.8 1.5 0.61 1.3 0.44 2.8 0.003–0.015Zn3 1.9 1 0.14 0.67 0.43 1.6 0.001–0.004Cd4 ND ND ND ND ND ND
Zn fraction (0.1 M HBr + 0.5 M HNO3)Mg1 1.7 ND 4.2 19 ND 11 0.002–0.011Al1 66 42 21 108 10 42 0.078–0.368Ca1 1.7 ND 0.15 5.3 ND 3.5 0.001–0.006Cr1 1.3 1.9 0.92 1.5 0.47 42 0.001–0.003Fe2 5.2 4.4 7.6 8.6 4.4 5.0 0.003–0.012Zn3 1.4 2.6 3.7 0.60 0.67 0.90 0.000–0.002
NE + 0.5 Mb weigh0
oicrb2n
2
2
amEtcA
2
PDimtuw
bit1
cb
liszb
2
td
ı
ı
w16aasfsiA1
pbc
nlonpmla
ot detected (ND).lement should elute in 1the first 10 mL of 7 M HCl; 28 M HF + 2 M HCl; 30.1 M HBrlank, chemistry performed October 2006; B.C. oyster tissue Cd6 (2.9–13.7 ppm dry.150 g tissue digested and loaded on column.
f elements persists due to variable purity of components usedn the initial manufacture of the technical grade resin [personalommunication, D. Hardy, Bio-Rad Laboratories, 2008]. As a result,esin-derived inorganic elements and organics (e.g. styrene divinyl-enzene [personal communication, D. Hardy, Bio-Rad Laboratories,008]) may be leached out during column chemistry producingon-reproducible blanks.
.4. Mass spectrometry
.4.1. Trace element analysesTrace element analyses of column blanks were performed on
n ELEMENT2 (Thermo Finnigan, Germany) HR-ICP-MS. Measure-ents were made using a Conikal glass concentric nebulizer (Glass
xpansion, USA) and a Scott-type glass spray chamber. Elemen-al concentrations were quantified using multi-element calibrationurves with indium, measured at mass 115, as an internal standard.ll solutions were prepared with 0.15 M HNO3.
.4.2. Isotopic analysesIsotope ratios were measured by multi-collection on a Nu
lasma MC-ICP-MS (Nu 021; Nu Instruments, UK) using theSN-100 (Nu Instruments, UK) membrane desolvator for sample
ntroduction. The standard dry plasma cones (type B; Nu Instru-ents, UK) were used, with the exception of one experiment, where
he standard wet plasma cones (type A; Nu Instruments, UK) weresed. A standard SSB measurement protocol [33] was followed,here samples were run alternately with standards.
The Cd isotope measurement method was adapted from Wom-acher et al. [7] and consisted of a dynamic run with main and
nterference cycles that enabled collection of masses 106–118 (iso-opes of Cd, Ag and Sn). Correction of the Sn interference on 112Cd,14Cd and 116Cd was enabled by measurement of 118Sn. An analysisomprised 2 blocks of 15 × 5 s integrations with a 20 s ESA deflectedaseline before each block.
Zinc isotope measurements consisted of a single cycle to col-
ect masses 62–68 (isotopes of Zn, Cu and Ni). Correction of the Ninterference on 64Zn was permitted by collection of 62Ni. Each mea-ured ratio comprised 2 blocks of 15 × 10 s integrations. An on-peakero was measured before each Zn analysis in order to correct forackground signal.evruM
HNO3 or 40.5 M HNO3; 5molar concentrations of matrix elements in the highestt) and Zn7 (197–1082 ppm dry weight) concentrations used in calculation, assume
.5. Isotope data presentation
Cadmium and Zn isotopic compositions are expressed relative tohe PCIGR-1 Cd and PCIGR-1 Zn reference standards in the standardelta (ı) notation as follows:
iCd =(
(iCd)sample
(iCd)standard
− 1
)× 1000
jZn =(
(jZn)sample
(jZn)standard
− 1
)× 1000
here i and j are the measured isotope ratios, for Cd i = 111/110,12/110, 113/110 or 114/110 and for Zn j = 66/64, 67/64, 68/64 or8/66. Isotopic compositions are reported in terms of ı114/110Cd (‰)nd ı66/64Zn (‰). However, these and the other isotope ratios arelso reported as delta values per atomic mass unit (amu) in theupplementary tables (S2, S3, S4, S5, S6); these values are usedor diagnostic purposes to (1) control quality and (2) monitor forpectral interferences. Delta values per amu are calculated by divid-ng the delta value by the difference in mass of the two isotopes.lthough monitored, low abundance Cd isotopes, 106Cd (1.25%) and
08Cd (0.89%), are not reported, as they are associated with poorrecision. Although relatively abundant, 116Cd (7.49%) is omittedecause it is not measured in the same cycle as the mass bias-orrecting element (Ag).
Delta values are reported as (1) SSB and (2) combined externalormalization-SSB corrected. For SSB, delta values are calcu-
ated from measured ratios in samples referenced to the meanf their two bracketing standards [33]. For combined externalormalization-SSB, the external normalization of Cd or Zn sam-les and standards was made using Ag or Cu, respectively. Theeasured 107Ag/109Ag or 65Cu/63Cu ratios are then used to calcu-
ate the instrumental mass bias, f(Ag) and f(Cu), and these valuesre used to correct the measured Cd and Zn ratios using the
xponential form of the General Power Law (GPL) [5,33]. Deltaalues were then calculated by referencing exponentially cor-ected sample ratios to exponentially corrected standard ratiossing the SSB method. The graphical normalization method ofaréchal et al. [5] was not used here because there was insuffi-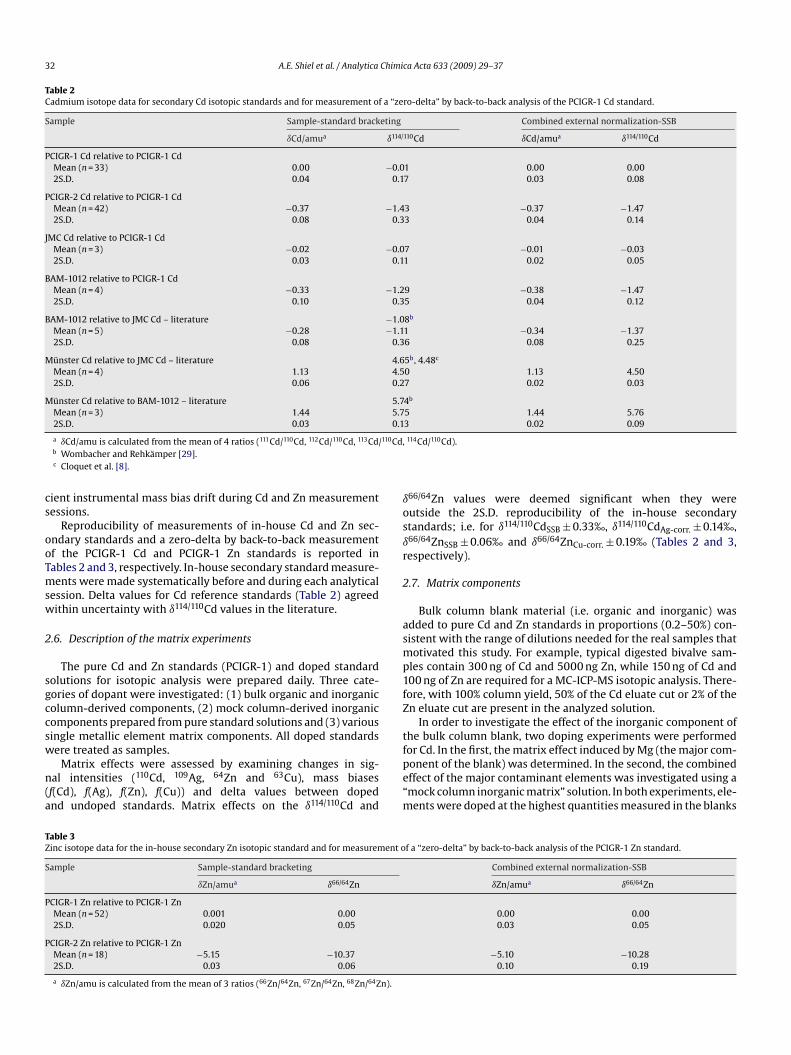
32 A.E. Shiel et al. / Analytica Chimica Acta 633 (2009) 29–37
Table 2Cadmium isotope data for secondary Cd isotopic standards and for measurement of a “zero-delta” by back-to-back analysis of the PCIGR-1 Cd standard.
Sample Sample-standard bracketing Combined external normalization-SSB
ıCd/amua ı114/110Cd ıCd/amua ı114/110Cd
PCIGR-1 Cd relative to PCIGR-1 CdMean (n = 33) 0.00 −0.01 0.00 0.002S.D. 0.04 0.17 0.03 0.08
PCIGR-2 Cd relative to PCIGR-1 CdMean (n = 42) −0.37 −1.43 −0.37 −1.472S.D. 0.08 0.33 0.04 0.14
JMC Cd relative to PCIGR-1 CdMean (n = 3) −0.02 −0.07 −0.01 −0.032S.D. 0.03 0.11 0.02 0.05
BAM-1012 relative to PCIGR-1 CdMean (n = 4) −0.33 −1.29 −0.38 −1.472S.D. 0.10 0.35 0.04 0.12
BAM-1012 relative to JMC Cd – literature −1.08b
Mean (n = 5) −0.28 −1.11 −0.34 −1.372S.D. 0.08 0.36 0.08 0.25
Münster Cd relative to JMC Cd – literature 4.65b, 4.48c
Mean (n = 4) 1.13 4.50 1.13 4.502S.D. 0.06 0.27 0.02 0.03
Münster Cd relative to BAM-1012 – literature 5.74b
Mean (n = 3) 1.44 5.75 1.44 5.762S.D. 0.03 0.13 0.02 0.09
110Cd,
cs
ooTmsw
2
sgccsw
n(a
ıosır
2
asmp1fZ
t
TZ
S
P
P
a ıCd/amu is calculated from the mean of 4 ratios (111Cd/110Cd, 112Cd/110Cd, 113Cd/b Wombacher and Rehkämper [29].c Cloquet et al. [8].
ient instrumental mass bias drift during Cd and Zn measurementessions.
Reproducibility of measurements of in-house Cd and Zn sec-ndary standards and a zero-delta by back-to-back measurementf the PCIGR-1 Cd and PCIGR-1 Zn standards is reported inables 2 and 3, respectively. In-house secondary standard measure-ents were made systematically before and during each analytical
ession. Delta values for Cd reference standards (Table 2) agreedithin uncertainty with ı114/110Cd values in the literature.
.6. Description of the matrix experiments
The pure Cd and Zn standards (PCIGR-1) and doped standardolutions for isotopic analysis were prepared daily. Three cate-ories of dopant were investigated: (1) bulk organic and inorganicolumn-derived components, (2) mock column-derived inorganicomponents prepared from pure standard solutions and (3) variousingle metallic element matrix components. All doped standards
ere treated as samples.Matrix effects were assessed by examining changes in sig-al intensities (110Cd, 109Ag, 64Zn and 63Cu), mass biasesf(Cd), f(Ag), f(Zn), f(Cu)) and delta values between dopednd undoped standards. Matrix effects on the ı114/110Cd and
fpe“m
able 3inc isotope data for the in-house secondary Zn isotopic standard and for measurement o
ample Sample-standard bracketing
ıZn/amua ı66/64Zn
CIGR-1 Zn relative to PCIGR-1 ZnMean (n = 52) 0.001 0.002S.D. 0.020 0.05
CIGR-2 Zn relative to PCIGR-1 ZnMean (n = 18) −5.15 −10.372S.D. 0.03 0.06
a ıZn/amu is calculated from the mean of 3 ratios (66Zn/64Zn, 67Zn/64Zn, 68Zn/64Zn).
114Cd/110Cd).
66/64Zn values were deemed significant when they wereutside the 2S.D. reproducibility of the in-house secondarytandards; i.e. for ı114/110CdSSB ± 0.33‰, ı114/110CdAg-corr. ± 0.14‰,66/64ZnSSB ± 0.06‰ and ı66/64ZnCu-corr. ± 0.19‰ (Tables 2 and 3,espectively).
.7. Matrix components
Bulk column blank material (i.e. organic and inorganic) wasdded to pure Cd and Zn standards in proportions (0.2–50%) con-istent with the range of dilutions needed for the real samples thatotivated this study. For example, typical digested bivalve sam-
les contain 300 ng of Cd and 5000 ng Zn, while 150 ng of Cd and00 ng of Zn are required for a MC-ICP-MS isotopic analysis. There-ore, with 100% column yield, 50% of the Cd eluate cut or 2% of then eluate cut are present in the analyzed solution.
In order to investigate the effect of the inorganic component ofhe bulk column blank, two doping experiments were performed
or Cd. In the first, the matrix effect induced by Mg (the major com-onent of the blank) was determined. In the second, the combinedffect of the major contaminant elements was investigated using amock column inorganic matrix” solution. In both experiments, ele-ents were doped at the highest quantities measured in the blanksf a “zero-delta” by back-to-back analysis of the PCIGR-1 Zn standard.
Combined external normalization-SSB
ıZn/amua ı66/64Zn
0.00 0.000.03 0.05
−5.10 −10.280.10 0.19

A.E. Shiel et al. / Analytica Chimic
Table 4First and second ionization energies (eV) and atomic weights for analytes and matrixelements relevant in this study [43].
Atomic weight Element 1st IP 2nd IP
24.3 Mg 7.65 15.0427.0 Al 5.98 18.8340.1 Ca 6.11 11.8763.6 Cu 7.73 20.2965.4 Zn 9.39 17.9685.5 Rb 4.18 27.2987.6 Sr 5.69 11.03
107.9 Ag 7.58 21.48112.4 Cd 8.99 16.91132.9 Cs 3.89 23.16137.3 Ba 5.21 10.00
2
(wccmo
mtmwiii
3
iSari
3
riCeetg(
me(e
2ı(moi
lamc
mcaıımlp
bptnSetm
3c
snswTmotvit
mi(tfac
3
qcsiCAaio
175.0 Lu 5.43 13.9192.2 Ir 8.9707.2 Pb 7.42 15.03
October 2006, Table 1). Therefore, the Cd standard (150 ng mL−1)as doped with 42 ng mL−1 of Mg corresponding to a molar con-
entration of 1.3 times the molar concentration of Cd. The “mockolumn inorganic matrix” was prepared similarly resulting in a totalatrix element concentration of 1.7 times the molar concentration
f Cd.In the final set of experiments, large quantities of metallic ele-
ents, five times the molar concentration of Cd or Zn, were added tohe Cd and Zn standards to approximate sample-derived inorganic
atrix components and characterize the matrix effects associatedith individual inorganic element additions. The matrix elements
n these experiments were chosen on the basis of their abundancen biological or geological materials as well as to cover a wide rangen mass and ionization potential (IP) (Table 4; [43]).
. Results and discussion
The results for the bulk column blank matrix addition exper-ments for Cd and Zn are given in Supplementary Tables S2 and3, respectively. The results for the inorganic column blank matrixddition experiments are given in Supplementary Table S4 withesults of the metallic elements doping experiments for Cd and Znn Supplementary Tables S5 and S6, respectively.
.1. Bulk column blank matrix addition
Ion signal enhancement relative to the undoped standardsesults from the presence of bulk column blank matrix duringsotopic analysis by MC-ICP-MS. Ion signal intensity changes, ford–Ag (Fig. 1a and b) and for Zn–Cu (Fig. 2a and b), vary consid-rably from run to run but are generally somewhat larger for thelement pair Zn–Cu as compared to the pair Cd–Ag. For both pairshe mass bias-correcting elements (Ag and Cu) (Figs. 1b and 2b)enerally experience larger signal enhancement than the analytesCd and Zn) (Figs. 1a and 2a).
More importantly, column matrix induces changes in the instru-ental mass bias of both analytes and mass bias-correcting
lements, resulting in inaccurate Cd and Zn isotope ratiosFigs. 1c, d and 2c, d). These effects, like the ion signal intensitynhancement, vary from one session to the next.
For SSB corrected Cd delta values, with the addition of up to0% matrix to standards, mass bias changes are insignificant and114/110
CdSSB values are within error of undoped standard valuesFig. 1c). However, heavy ı114/110CdSSB values result at columnatrix concentrations of 50% due to higher f(Cd) in the presencef matrix (Fig. 1c). Use of the wet plasma cones (A cones) for Cdsotopic analysis does not reduce this mass bias change. Low matrix
tameo
a Acta 633 (2009) 29–37 33
evels (0.2–2%) have little effect on f(Zn) and thus ı66/64ZnSSB valuesre within error of matrix free values (Fig. 2c). However as with Cd,ass bias effects result in heavy ı66/64ZnSSB values for 10% and 50%
olumn matrix (Fig. 2c).For the combined external normalization-SSB instrumental
ass bias correction using f(Ag) and f(Cu), f(Ag) and f(Cu) over-orrect the measured Cd and Zn isotopic ratios, i.e. f(Ag) > f(Cd)nd f(Cu) > f(Zn), resulting in light ı114/110CdAg-corr. (Fig. 1d) and66/64ZnCu-corr. (Fig. 2d) values even at low matrix levels. The114/110CdAg-corr. and ı66/64ZnCu-corr. values per amu are similar inagnitude, suggesting the matrix induced mass bias effects may be
argely related to the relative ionization potentials of the elementairs, Cd–Ag and Zn–Cu, which unlike mass are similar (Table 4).
Differences in mass bias between analytes and their massias-correcting elements, such as these, have been reported inrevious studies [7,35,37] and result in discrepancies betweenhe delta values derived from the SSB and the combined exter-al normalization-SSB instrumental mass bias correction methods.uch discrepancies may be used to identify the presence of matrixffects. Importantly, as we demonstrate here, it cannot be assumedhat the combined external normalization-SSB correction produces
ore accurate results than SSB correction alone.
.2. Inorganic elements introduced during cadmium columnhemistry
Although the relative contribution of inorganic elements ismall, their effect on ion signal intensity and mass bias can be sig-ificant. Doping with Mg (column blank level) increases the ionignal intensities of both Cd and Ag (4.5–14.9%) as does dopingith “mock column inorganic matrix” (8.6–15.7%) (Supplementary
able S4). Doping with Mg alone leads to insignificant changes inass bias and delta values for both mass bias correction meth-
ds. The “mock column inorganic matrix” produces changes in f(Cd)hat are insignificant or, in one of four tests, result in a heavy deltaalue (ı114/110CdSSB = 0.47‰). This suggests that the larger changesn f(Cd) introduced by bulk column blank matrix are largely relatedo resin-derived organics.
The combined external normalization-SSB mass bias correctionethod using f(Ag) results in ı114/110CdAg-corr. values that are heavy
n two tests (ı114/110CdAg-corr. = 0.24‰, 0.37‰) and light in one testı114/110CdAg-corr. = −0.26‰). For these three tests, the magnitude ofhe change in the ı114/110CdAg-corr. values is 28–71% of that observedor the bulk column blank matrix, again suggesting inorganics alonere not responsible for the mass bias effects introduced by bulkolumn blank matrix.
.3. Inorganic matrix effects
Additions of metallic matrix elements to the analyte in largeruantities than are present in the “mock column inorganic matrix”ause ion signal intensity enhancement in the majority of cases anduppression in a few cases. In contrast to bulk column blank matrix,on signal intensity changes are greater for the higher mass paird–Ag than for Zn–Cu. Both Cd and Zn ion signals are suppressed byl and enhanced by Sr (2 of 3 results for Sr-doped Cd standards), Band Pb (Fig. 3a and b). Aluminum, Sr and Ba enhance both Ag and Cuon signal intensities (Fig. 3a and b). While Pb causes suppressionf the Cu ion signal, but not of the Ag ion signal, suggesting that
he mechanism for suppression is more effective for lower massnalyte ions (Fig. 3a and b). Silver ion signal intensity is alwaysore enhanced than Cd and Cu ion signal intensity is usually morenhanced than Zn perhaps due to the lower ionization potentialsf the mass bias-correcting elements (Table 4).
34 A.E. Shiel et al. / Analytica Chimica Acta 633 (2009) 29–37
Fig. 1. Matrix effects on Cd isotope ratio measurements as a function of bulk column blank matrix addition: (a) percent changes in 110Cd ion signal intensity, (b) percentc 109 114/110 114/110 r (a) a 110 109
d andarı in (b)o
darwFtafı
Tft1
f(eetS
tvf
Ss(lm(pl(
3
stmTcc
hanges in Ag ion signal intensity, (c) ı CdSSB and (d) ı CdAg-corr. values. Fouring measurement of a “zero-delta” by back-to-back analysis of the PCIGR-1 Cd st114/110CdAg-corr. values for the in-house secondary Cd standard (Table 2). Note thatverlapping.
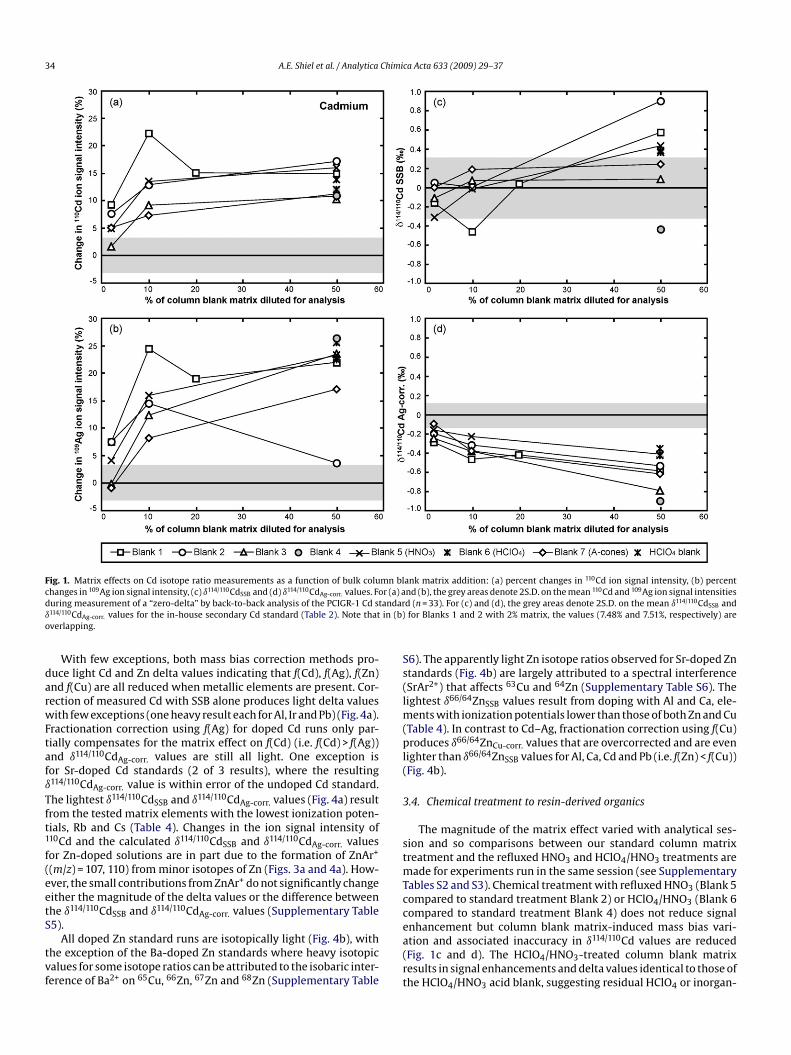
With few exceptions, both mass bias correction methods pro-uce light Cd and Zn delta values indicating that f(Cd), f(Ag), f(Zn)nd f(Cu) are all reduced when metallic elements are present. Cor-ection of measured Cd with SSB alone produces light delta valuesith few exceptions (one heavy result each for Al, Ir and Pb) (Fig. 4a).
ractionation correction using f(Ag) for doped Cd runs only par-ially compensates for the matrix effect on f(Cd) (i.e. f(Cd) > f(Ag))nd ı114/110CdAg-corr. values are still all light. One exception isor Sr-doped Cd standards (2 of 3 results), where the resulting114/110CdAg-corr. value is within error of the undoped Cd standard.he lightest ı114/110CdSSB and ı114/110CdAg-corr. values (Fig. 4a) resultrom the tested matrix elements with the lowest ionization poten-ials, Rb and Cs (Table 4). Changes in the ion signal intensity of10Cd and the calculated ı114/110CdSSB and ı114/110CdAg-corr. valuesor Zn-doped solutions are in part due to the formation of ZnAr+
(m/z) = 107, 110) from minor isotopes of Zn (Figs. 3a and 4a). How-ver, the small contributions from ZnAr+ do not significantly changeither the magnitude of the delta values or the difference betweenhe ı114/110CdSSB and ı114/110CdAg-corr. values (Supplementary Table
5).All doped Zn standard runs are isotopically light (Fig. 4b), withhe exception of the Ba-doped Zn standards where heavy isotopicalues for some isotope ratios can be attributed to the isobaric inter-erence of Ba2+ on 65Cu, 66Zn, 67Zn and 68Zn (Supplementary Table
ea(rt
nd (b), the grey areas denote 2S.D. on the mean Cd and Ag ion signal intensitiesd (n = 33). For (c) and (d), the grey areas denote 2S.D. on the mean ı114/110CdSSB andfor Blanks 1 and 2 with 2% matrix, the values (7.48% and 7.51%, respectively) are
6). The apparently light Zn isotope ratios observed for Sr-doped Zntandards (Fig. 4b) are largely attributed to a spectral interferenceSrAr2+) that affects 63Cu and 64Zn (Supplementary Table S6). Theightest ı66/64ZnSSB values result from doping with Al and Ca, ele-
ents with ionization potentials lower than those of both Zn and CuTable 4). In contrast to Cd–Ag, fractionation correction using f(Cu)roduces ı66/64ZnCu-corr. values that are overcorrected and are even
ighter than ı66/64ZnSSB values for Al, Ca, Cd and Pb (i.e. f(Zn) < f(Cu))Fig. 4b).
.4. Chemical treatment to resin-derived organics
The magnitude of the matrix effect varied with analytical ses-ion and so comparisons between our standard column matrixreatment and the refluxed HNO3 and HClO4/HNO3 treatments are
ade for experiments run in the same session (see Supplementaryables S2 and S3). Chemical treatment with refluxed HNO3 (Blank 5ompared to standard treatment Blank 2) or HClO4/HNO3 (Blank 6ompared to standard treatment Blank 4) does not reduce signal
nhancement but column blank matrix-induced mass bias vari-tion and associated inaccuracy in ı114/110Cd values are reducedFig. 1c and d). The HClO4/HNO3-treated column blank matrixesults in signal enhancements and delta values identical to those ofhe HClO4/HNO3 acid blank, suggesting residual HClO4 or inorgan-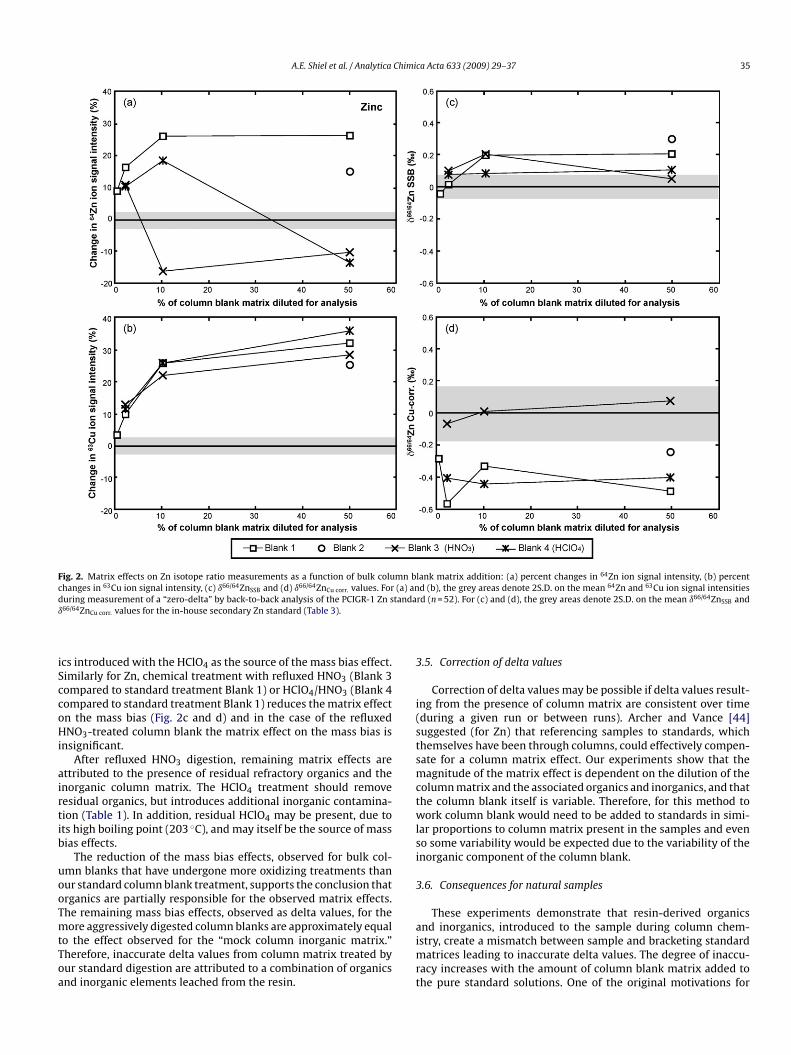
A.E. Shiel et al. / Analytica Chimica Acta 633 (2009) 29–37 35
Fig. 2. Matrix effects on Zn isotope ratio measurements as a function of bulk column blank matrix addition: (a) percent changes in 64Zn ion signal intensity, (b) percentchanges in 63Cu ion signal intensity, (c) ı66/64ZnSSB and (d) ı66/64ZnCu corr. values. For (a) and (b), the grey areas denote 2S.D. on the mean 64Zn and 63Cu ion signal intensitiesd tandaı
iSccoHi
airtib
uooTmtToa
3
i(stsmctwlsi
3
uring measurement of a “zero-delta” by back-to-back analysis of the PCIGR-1 Zn s66/64ZnCu corr. values for the in-house secondary Zn standard (Table 3).
cs introduced with the HClO4 as the source of the mass bias effect.imilarly for Zn, chemical treatment with refluxed HNO3 (Blank 3ompared to standard treatment Blank 1) or HClO4/HNO3 (Blank 4ompared to standard treatment Blank 1) reduces the matrix effectn the mass bias (Fig. 2c and d) and in the case of the refluxedNO3-treated column blank the matrix effect on the mass bias is
nsignificant.After refluxed HNO3 digestion, remaining matrix effects are
ttributed to the presence of residual refractory organics and thenorganic column matrix. The HClO4 treatment should removeesidual organics, but introduces additional inorganic contamina-ion (Table 1). In addition, residual HClO4 may be present, due tots high boiling point (203 ◦C), and may itself be the source of massias effects.
The reduction of the mass bias effects, observed for bulk col-mn blanks that have undergone more oxidizing treatments thanur standard column blank treatment, supports the conclusion thatrganics are partially responsible for the observed matrix effects.he remaining mass bias effects, observed as delta values, for the
ore aggressively digested column blanks are approximately equalo the effect observed for the “mock column inorganic matrix.”herefore, inaccurate delta values from column matrix treated byur standard digestion are attributed to a combination of organicsnd inorganic elements leached from the resin.
aimrt
rd (n = 52). For (c) and (d), the grey areas denote 2S.D. on the mean ı66/64ZnSSB and
.5. Correction of delta values
Correction of delta values may be possible if delta values result-ng from the presence of column matrix are consistent over timeduring a given run or between runs). Archer and Vance [44]uggested (for Zn) that referencing samples to standards, whichhemselves have been through columns, could effectively compen-ate for a column matrix effect. Our experiments show that theagnitude of the matrix effect is dependent on the dilution of the
olumn matrix and the associated organics and inorganics, and thathe column blank itself is variable. Therefore, for this method toork column blank would need to be added to standards in simi-
ar proportions to column matrix present in the samples and eveno some variability would be expected due to the variability of thenorganic component of the column blank.
.6. Consequences for natural samples
These experiments demonstrate that resin-derived organics
nd inorganics, introduced to the sample during column chem-stry, create a mismatch between sample and bracketing standardatrices leading to inaccurate delta values. The degree of inaccu-acy increases with the amount of column blank matrix added tohe pure standard solutions. One of the original motivations for
36 A.E. Shiel et al. / Analytica Chimica Acta 633 (2009) 29–37
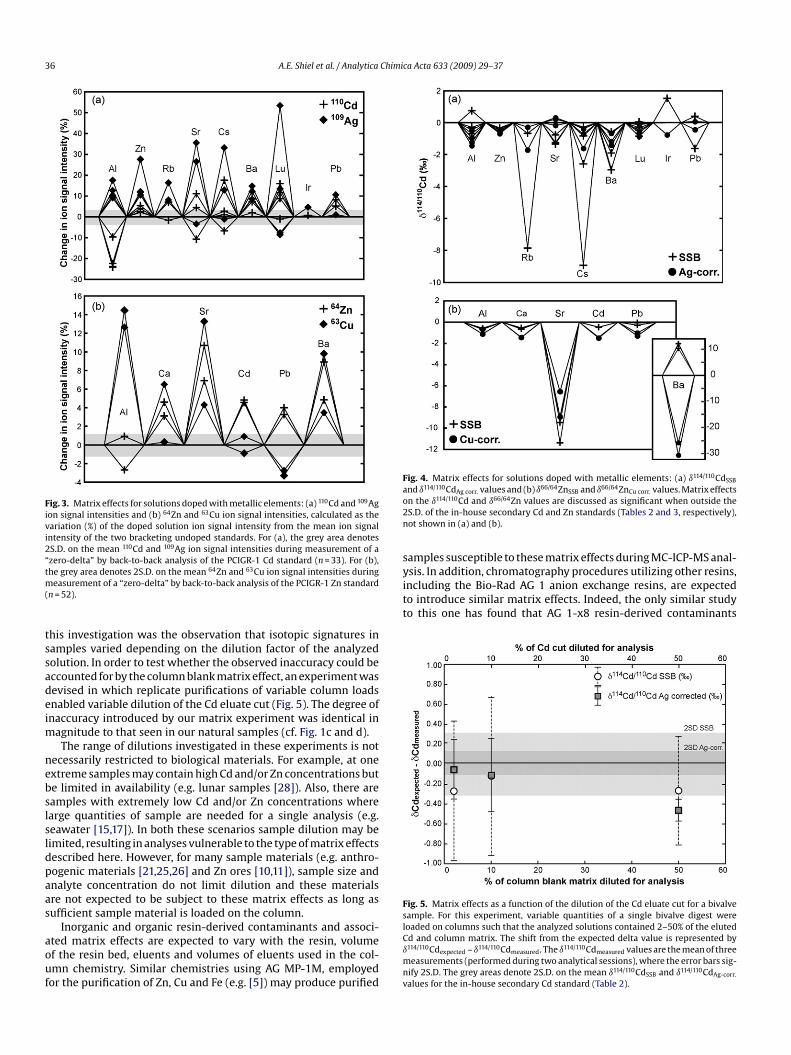
Fig. 3. Matrix effects for solutions doped with metallic elements: (a) 110Cd and 109Agion signal intensities and (b) 64Zn and 63Cu ion signal intensities, calculated as thevariation (%) of the doped solution ion signal intensity from the mean ion signalintensity of the two bracketing undoped standards. For (a), the grey area denotes2S.D. on the mean 110Cd and 109Ag ion signal intensities during measurement of a“zero-delta” by back-to-back analysis of the PCIGR-1 Cd standard (n = 33). For (b),tm(
tssadeim
nebslsldpaas
aouf
Fig. 4. Matrix effects for solutions doped with metallic elements: (a) ı114/110CdSSB
a 114/110 66/64 66/64
o2n
sysis. In addition, chromatography procedures utilizing other resins,including the Bio-Rad AG 1 anion exchange resins, are expectedto introduce similar matrix effects. Indeed, the only similar studyto this one has found that AG 1-x8 resin-derived contaminants
Fig. 5. Matrix effects as a function of the dilution of the Cd eluate cut for a bivalvesample. For this experiment, variable quantities of a single bivalve digest wereloaded on columns such that the analyzed solutions contained 2–50% of the eluted
he grey area denotes 2S.D. on the mean 64Zn and 63Cu ion signal intensities duringeasurement of a “zero-delta” by back-to-back analysis of the PCIGR-1 Zn standard
n = 52).
his investigation was the observation that isotopic signatures inamples varied depending on the dilution factor of the analyzedolution. In order to test whether the observed inaccuracy could beccounted for by the column blank matrix effect, an experiment wasevised in which replicate purifications of variable column loadsnabled variable dilution of the Cd eluate cut (Fig. 5). The degree ofnaccuracy introduced by our matrix experiment was identical in
agnitude to that seen in our natural samples (cf. Fig. 1c and d).The range of dilutions investigated in these experiments is not
ecessarily restricted to biological materials. For example, at onextreme samples may contain high Cd and/or Zn concentrations bute limited in availability (e.g. lunar samples [28]). Also, there areamples with extremely low Cd and/or Zn concentrations wherearge quantities of sample are needed for a single analysis (e.g.eawater [15,17]). In both these scenarios sample dilution may beimited, resulting in analyses vulnerable to the type of matrix effectsescribed here. However, for many sample materials (e.g. anthro-ogenic materials [21,25,26] and Zn ores [10,11]), sample size andnalyte concentration do not limit dilution and these materialsre not expected to be subject to these matrix effects as long asufficient sample material is loaded on the column.
Inorganic and organic resin-derived contaminants and associ-
ted matrix effects are expected to vary with the resin, volumef the resin bed, eluents and volumes of eluents used in the col-mn chemistry. Similar chemistries using AG MP-1M, employedor the purification of Zn, Cu and Fe (e.g. [5]) may produce purifiedCımnv
nd ı CdAg corr. values and (b) ı ZnSSB and ı ZnCu corr. values. Matrix effectsn the ı114/110Cd and ı66/64Zn values are discussed as significant when outside theS.D. of the in-house secondary Cd and Zn standards (Tables 2 and 3, respectively),ot shown in (a) and (b).
amples susceptible to these matrix effects during MC-ICP-MS anal-
d and column matrix. The shift from the expected delta value is represented by114/110Cdexpected – ı114/110Cdmeasured. The ı114/110Cdmeasured values are the mean of threeeasurements (performed during two analytical sessions), where the error bars sig-
ify 2S.D. The grey areas denote 2S.D. on the mean ı114/110CdSSB and ı114/110CdAg-corr.
alues for the in-house secondary Cd standard (Table 2).

Chimic
cUatro
4
osetfi
(
(
(
(
(
(
A
MMaoiCg
A
i
R
[
[
[
[[[
[
[
[
[
[
[
[[
[[
[
[
[
[[[
[
[
[[
[
[[[[
[792–794.
A.E. Shiel et al. / Analytica
ause matrix effects in MC-ICP-MS analysis of Mo isotopes [45].ltimately, each ion exchange purification method will need to bessessed individually. Based on our experiments, we recommend,hat for accurate delta values, sufficient quantities of sample mate-ial be loaded on the column so that, no more than 20% of the Cdr Zn eluate cut is in the analyzed solution.
. Conclusions
Matrix effects are particularly significant in the measurementf isotopic fractionation in systems with small natural variations,uch as Cd and Zn. Our study demonstrates that column matrix andven low-levels of metallic elements must be evaluated as poten-ial sources of error during Cd and Zn isotopic analysis. The mainndings of our investigation are:
1) Bulk column blank matrix and metallic elements cause signalenhancement. In both Cd–Ag and Zn–Cu systems, enhance-ments are greater for the lower ionization potential massbias-correcting elements (Ag and Cu) than for the analytes (Cdand Zn). Signal enhancement and suppression indicate matrixproblems and are associated with inaccurate Cd and Zn isotoperatios.
2) Mass bias changes result from bulk column blank matrix intro-duced during standard column chemistry. For both Cd and Znthese mass bias changes result in heavy SSB-corrected delta val-ues and light combined external normalization-SSB correcteddelta values.
3) The inorganic content of bulk column blank matrix is variableand even small quantities can cause significant effects. How-ever, the effects are not large enough to account for those of thebulk column blank matrix.
4) Residual resin-derived organics are a significant source ofcolumn-induced matrix effects.
5) Chemical treatment of column blanks, aimed at destroy-ing resin-derived organics, with either refluxed HNO3 orHClO4/HNO3 reduced the mass bias effect relative to the stan-dard HNO3 dry down.
6) In both Cd–Ag and Zn–Cu systems, the mass bias responsesof the analyte and mass bias-correcting element differin the presence of matrix. This results in disagreementbetween ı114/110CdSSB and ı114/110CdAg-corr. and ı66/64ZnSSB andı66/64ZnCu-corr. values. In such cases the externally normalizedvalues cannot be assumed to give the more accurate result.
cknowledgements
This work benefited from discussions on matrix effects with Bertueller and we also thank him for his assistance with the ELE-ENT2 HR-ICP-MS. We are grateful to James Scoates, Laure Aimoz
nd six anonymous reviewers for comments on various versionsf this manuscript. We also thank Frank Wombacher for provid-ng aliquots of the “JMC Cd”, the “Münster Cd” and the BAM-1012d reference standards. This study was funded by NSERC Discoveryrants to Dominique Weis and Kristin Orians.
ppendix A. Supplementary data
Supplementary data associated with this article can be found,n the online version, at doi:10.1016/j.aca.2008.11.026.
[
[[[
a Acta 633 (2009) 29–37 37
eferences
[1] K.J.R. Rosman, J.R. Delaeter, Nature 261 (1976) 216–218.[2] K.J.R. Rosman, I.L. Barnes, L.J. Moore, J.W. Gramlich, Geochem. J. 14 (1980)
267–277.[3] K.J.R. Rosman, J.R. Delaeter, Earth Planet. Sci. Lett. 89 (1988) 163–169.[4] R.D. Loss, K.J.R. Rosman, J.R. Delaeter, Geochim. Cosmochim. Acta 54 (1990)
3525–3536.[5] C.N. Maréchal, P. Télouk, F. Albarède, Chem. Geol. 156 (1999) 251–273.[6] C.N. Maréchal, E. Nicolas, C. Douchet, F. Albarède, G3 1 (2000).[7] F. Wombacher, M. Rehkämper, K. Mezger, C. Munker, Geochim. Cosmochim.
Acta 67 (2003) 4639–4654.[8] C. Cloquet, O. Rouxel, J. Carignan, G. Libourel, J. Geostand. Geoanal. 29 (2005)
95–106.[9] D.J. Weiss, T.F.D. Mason, F.J. Zhao, G.J.D. Kirk, B.J. Coles, M.S.A. Horstwood, New
Phytol. 165 (2005) 703–710.10] J.J. Wilkinson, D.J. Weiss, T.F.D. Mason, B.J. Coles, Econ. Geol. 100 (2005)
583–590.11] A. Dolgopolova, D.J. Weiss, R. Seltmann, B. Kober, T.F.D. Mason, B. Coles, C.J.
Stanley, Appl. Geochem. 21 (2006) 563–579.12] D.J. Weiss, N. Rausch, T.F.D. Mason, B.J. Coles, J.J. Wilkinson, L. Ukonmaanaho,
T. Arnold, T.M. Nieminen, Geochim. Cosmochim. Acta 71 (2007) 3498–3517.13] S. Pichat, C. Douchet, F. Albarède, Earth Planet. Sci. Lett. 210 (2003) 167–178.14] J. Bermin, D. Vance, C. Archer, P.J. Statham, Chem. Geol. 226 (2006) 280–297.15] F. Lacan, R. Francois, Y.C. Ji, R.M. Sherrell, Geochim. Cosmochim. Acta 70 (2006)
5104–5118.16] S. Ripperger, M. Rehkämper, D. Porcelli, A.N. Halliday, Earth Planet. Sci. Lett. 261
(2007) 670–684.17] S.G. John, The marine biogeochemistry of zinc isotopes, in: Chemical Oceanog-
raphy, Massachusetts Institute of Technology, 2007, p. 142.18] A.E. Shiel, K.J. Orians, D. Cossa, D. Weis, Geochim. Cosmochim. Acta 71 (2007)
A928.19] S.G. John, O.J. Rouxel, P.R. Craddock, A.M. Engwall, E.A. Boyle, Earth Planet. Sci.
Lett. 269 (2008) 17–28.20] A.E. Shiel, K.J. Orians, D. Cossa, D. Weis, Geochim. Cosmochim. Acta 72 (2008)
A859.21] C. Cloquet, J. Carignan, G. Libourel, T. Sterckeman, E. Perdrix, Environ. Sci. Tech-
nol. 40 (2006) 2525–2530.22] C. Cloquet, J. Carignan, G. Libourel, Environ. Sci. Technol. 40 (2006) 6594–6600.23] Y. Sivry, B. Dupré, J. Sonke, J. Viers, S. Audry, J. Schafer, G. Blanc, J. Riotte, Geochim.
Cosmochim. Acta 70 (2006) A595.24] S.G. John, G. Park, Z. Zhang, E.A. Boyle, Chem. Geol. 245 (2007) 61–69.25] Y. Sivry, J. Riotte, J.E. Sonke, S. Audry, J. Schäfer, J. Viers, G. Blanc, R. Freydier, B.
Dupré, Chem. Geol. 255 (2008) 295–304.26] J.E. Sonke, Y. Sivry, J. Viers, R. Freydier, L. Dejonghe, L. Andre, J.K. Aggarwal, F.
Fontan, B. Dupré, Chem. Geol. 252 (2008) 145–157.27] J.M. Luck, D. Ben Othman, F. Albarede, Geochim. Cosmochim. Acta 69 (2005)
5351–5363.28] F. Moynier, F. Albarede, G.F. Herzog, Geochim. Cosmochim. Acta 70 (2006)
6103–6117.29] F. Wombacher, M. Rehkämper, J. Geostand. Geoanal. 28 (2004) 173–178.30] E.H. Evans, J.J. Giglio, J. Anal. At. Spectrom. 8 (1993) 1–18.31] D.J. Douglas, S.D. Tanner, in: A. Montaser (Ed.), Inductively Coupled Plasma Mass
Spectrometry, Wiley–VCH, 1998, pp. 615–679.32] G. Horlick, A. Montaser, in: A. Montaser (Ed.), Inductively Coupled Plasma Mass
Spectrometry, Wiley–VCH, 1998, pp. 503–588.33] M. Rehkämper, F. Wombacher, J.K. Aggarwal, in: P.A. de Groot (Ed.), Handbook
of Stable Isotope Analytical Techniques, Elsevier, 2004, pp. 692–725.34] S.H. Tan, G. Horlick, Applied Spectroscopy 40 (1986) 445–460.35] R.W. Carlson, E.H. Hauri, C.M.O.D. Alexander, in: J.G. Holland, S.D. Tanner (Eds.),
Plasma Source Mass Spectrometry: The New Millennium, The Royal Society ofChemistry, Cambridge, 2001, pp. 288–297.
36] A. Galy, N.S. Belshaw, L. Halicz, R.K. O’Nions, Int. J. Mass Spectrom. 208 (2001)89–98.
37] A.J. Pietruszka, R.J. Walker, P.A. Candela, Chem. Geol. 225 (2006) 121–136.38] H.P. Longerich, B.J. Fryer, D.F. Strong, Spectrochim. Acta Part B 42 (1987) 39–48.39] F. Albarède, B. Beard, Rev. Mineral. Geochem. 55 (2004) 113–152.40] T.F.D. Mason, High-precision transition metal isotope analysis by plasma-
source mass spectrometry and implications for low temperature geochemistry,in: Geology, University of London, London, 2003, p. 287.
41] S. Straßburg, D. Wollenweber, G. Wunsch, Fresenius J. Anal. Chem. 360 (1998)
42] J. de Jong, V. Schoemann, J.L. Tison, S. Becquevort, F. Masson, D. Lannuzel, J.Petit, L. Chou, D. Weis, N. Mattielli, Anal. Chim. Acta 589 (2007) 105–119.
43] J.E. Sansonetti, W.C. Martin, J. Phys. Chem. Ref. Data 34 (2005) 1559–2259.44] C. Archer, D. Vance, J. Anal. At. Spectrom. 19 (2004) 656–665.45] A.J. Pietruszka, A.D. Reznik, Int. J. Mass Spectrom. 270 (2008) 23–30.