MATHEMATICAL MORTALITY MODELS AND MODELING URBANIZATION’S INFLUENCE ON DEATHS IN JAMAICA
17
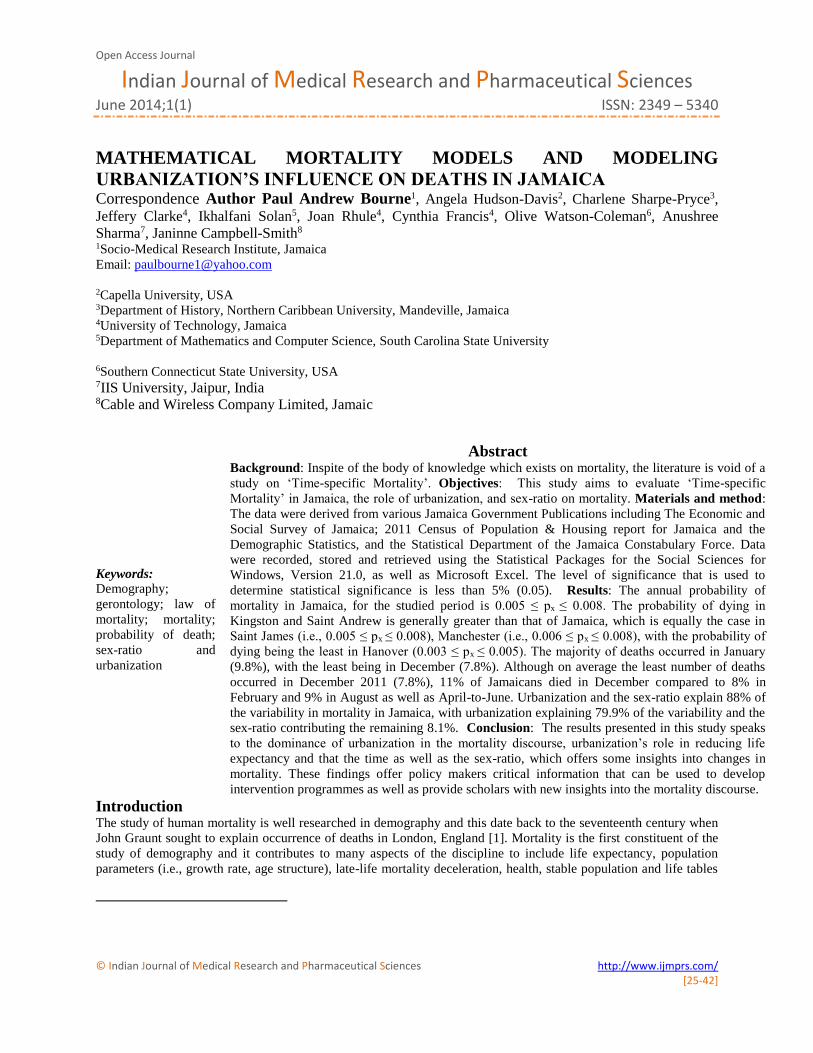
Open Access Journal Indian Journal of Medical Research and Pharmaceutical Sciences June 2014;1(1) ISSN: 2349 – 5340 © Indian Journal of Medical Research and Pharmaceutical Sciences http://www.ijmprs.com/ [25-42] MATHEMATICAL MORTALITY MODELS AND MODELING URBANIZATION’S INFLUENCE ON DEATHS IN JAMAICA Correspondence Author Paul Andrew Bourne 1 , Angela Hudson-Davis 2 , Charlene Sharpe-Pryce 3 , Jeffery Clarke 4 , Ikhalfani Solan 5 , Joan Rhule 4 , Cynthia Francis 4 , Olive Watson-Coleman 6 , Anushree Sharma 7 , Janinne Campbell-Smith 8 1 Socio-Medical Research Institute, Jamaica Email: [email protected] 2 Capella University, USA 3 Department of History, Northern Caribbean University, Mandeville, Jamaica 4 University of Technology, Jamaica 5 Department of Mathematics and Computer Science, South Carolina State University 6 Southern Connecticut State University, USA 7 IIS University, Jaipur, India 8 Cable and Wireless Company Limited, Jamaic Keywords: Demography; gerontology; law of mortality; mortality; probability of death; sex-ratio and urbanization Abstract Background: Inspite of the body of knowledge which exists on mortality, the literature is void of a study on ‘Time-specific Mortality’. Objectives: This study aims to evaluate ‘Time-specific Mortality’ in Jamaica, the role of urbanization, and sex-ratio on mortality. Materials and method: The data were derived from various Jamaica Government Publications including The Economic and Social Survey of Jamaica; 2011 Census of Population & Housing report for Jamaica and the Demographic Statistics, and the Statistical Department of the Jamaica Constabulary Force. Data were recorded, stored and retrieved using the Statistical Packages for the Social Sciences for Windows, Version 21.0, as well as Microsoft Excel. The level of significance that is used to determine statistical significance is less than 5% (0.05). Results: The annual probability of mortality in Jamaica, for the studied period is 0.005 ≤ px ≤ 0.008. The probability of dying in Kingston and Saint Andrew is generally greater than that of Jamaica, which is equally the case in Saint James (i.e., 0.005 ≤ px ≤ 0.008), Manchester (i.e., 0.006 ≤ px ≤ 0.008), with the probability of dying being the least in Hanover (0.003 ≤ px ≤ 0.005). The majority of deaths occurred in January (9.8%), with the least being in December (7.8%). Although on average the least number of deaths occurred in December 2011 (7.8%), 11% of Jamaicans died in December compared to 8% in February and 9% in August as well as April-to-June. Urbanization and the sex-ratio explain 88% of the variability in mortality in Jamaica, with urbanization explaining 79.9% of the variability and the sex-ratio contributing the remaining 8.1%. Conclusion: The results presented in this study speaks to the dominance of urbanization in the mortality discourse, urbanization’s role in reducing life expectancy and that the time as well as the sex-ratio, which offers some insights into changes in mortality. These findings offer policy makers critical information that can be used to develop intervention programmes as well as provide scholars with new insights into the mortality discourse. Introduction The study of human mortality is well researched in demography and this date back to the seventeenth century when John Graunt sought to explain occurrence of deaths in London, England [1]. Mortality is the first constituent of the study of demography and it contributes to many aspects of the discipline to include life expectancy, population parameters (i.e., growth rate, age structure), late-life mortality deceleration, health, stable population and life tables
-
Upload
independent -
Category
Documents
-
view
3 -
download
0
Transcript of MATHEMATICAL MORTALITY MODELS AND MODELING URBANIZATION’S INFLUENCE ON DEATHS IN JAMAICA
Open Access Journal
Indian Journal of Medical Research and Pharmaceutical Sciences June 2014;1(1) ISSN: 2349 – 5340
© Indian Journal of Medical Research and Pharmaceutical Sciences http://www.ijmprs.com/ [25-42]
MATHEMATICAL MORTALITY MODELS AND MODELING
URBANIZATION’S INFLUENCE ON DEATHS IN JAMAICA Correspondence Author Paul Andrew Bourne1, Angela Hudson-Davis2, Charlene Sharpe-Pryce3,
Jeffery Clarke4, Ikhalfani Solan5, Joan Rhule4, Cynthia Francis4, Olive Watson-Coleman6, Anushree
Sharma7, Janinne Campbell-Smith8 1Socio-Medical Research Institute, Jamaica
Email: [email protected]
2Capella University, USA 3Department of History, Northern Caribbean University, Mandeville, Jamaica 4University of Technology, Jamaica 5Department of Mathematics and Computer Science, South Carolina State University
6Southern Connecticut State University, USA 7IIS University, Jaipur, India 8Cable and Wireless Company Limited, Jamaic
Keywords:
Demography;
gerontology; law of
mortality; mortality;
probability of death;
sex-ratio and
urbanization
Abstract Background: Inspite of the body of knowledge which exists on mortality, the literature is void of a
study on ‘Time-specific Mortality’. Objectives: This study aims to evaluate ‘Time-specific
Mortality’ in Jamaica, the role of urbanization, and sex-ratio on mortality. Materials and method:
The data were derived from various Jamaica Government Publications including The Economic and
Social Survey of Jamaica; 2011 Census of Population & Housing report for Jamaica and the
Demographic Statistics, and the Statistical Department of the Jamaica Constabulary Force. Data
were recorded, stored and retrieved using the Statistical Packages for the Social Sciences for
Windows, Version 21.0, as well as Microsoft Excel. The level of significance that is used to
determine statistical significance is less than 5% (0.05). Results: The annual probability of
mortality in Jamaica, for the studied period is 0.005 ≤ px ≤ 0.008. The probability of dying in
Kingston and Saint Andrew is generally greater than that of Jamaica, which is equally the case in
Saint James (i.e., 0.005 ≤ px ≤ 0.008), Manchester (i.e., 0.006 ≤ px ≤ 0.008), with the probability of
dying being the least in Hanover (0.003 ≤ px ≤ 0.005). The majority of deaths occurred in January
(9.8%), with the least being in December (7.8%). Although on average the least number of deaths
occurred in December 2011 (7.8%), 11% of Jamaicans died in December compared to 8% in
February and 9% in August as well as April-to-June. Urbanization and the sex-ratio explain 88% of
the variability in mortality in Jamaica, with urbanization explaining 79.9% of the variability and the
sex-ratio contributing the remaining 8.1%. Conclusion: The results presented in this study speaks
to the dominance of urbanization in the mortality discourse, urbanization’s role in reducing life
expectancy and that the time as well as the sex-ratio, which offers some insights into changes in
mortality. These findings offer policy makers critical information that can be used to develop
intervention programmes as well as provide scholars with new insights into the mortality discourse.
Introduction The study of human mortality is well researched in demography and this date back to the seventeenth century when
John Graunt sought to explain occurrence of deaths in London, England [1]. Mortality is the first constituent of the
study of demography and it contributes to many aspects of the discipline to include life expectancy, population
parameters (i.e., growth rate, age structure), late-life mortality deceleration, health, stable population and life tables

Open Access Journal
Indian Journal of Medical Research and Pharmaceutical Sciences June 2014;1(1) ISSN: 2349 – 5340
© Indian Journal of Medical Research and Pharmaceutical Sciences http://www.ijmprs.com/ [25-42]
[2]-[6]. Outside of the established tenets of mortality (i.e., life expectancy, life tables, stable population, age
structure, population projection and population growth rate), a Caribbean health demographer, Paul Andrew Bourne,
along with other scholars have added an extensive body of literature on mortality to include and not limited to deaths
at older ages (75+ years), the economics of mortality at older ages, and mortality and health [7]-[10] as well as
murder economics [11].
The study of mortality is a highly mathematical area, which explains it being studied by mathematicians,
actuaries, and statisticians as well as demographers, with each contributing a part to the general mortality discourse
[2],[3], [12]-[16]. Inspite of the body of knowledge which exists on mortality, the literature is void of a study on
‘Time-specific Mortality.’ Researchers and agencies like the World Health Organizations have been preoccupied,
rightfully so, with non-communicable diseases (CNCDs) because they account for the majority of human deaths in
the world[17]-[22] and no attention is placed on ‘Time-specific Morality.’ This study is proposing that ‘Time-
specific Mortality’ covers the area of geographical and time mortality. The reality is the mortality discourse is void
of a study that examines whether deaths occur more at a particular time of the year or geographical locality. In
addition, we also tested six hypotheses 1) mortality is influenced by urbanization and the sex-ratio, 2) urbanization
has a greater influence on mortality than the sex-ratio, 3) a direct correlation exists between urbanization and the
sex-ratio (using data for 2011), 4) the probability of death for age is an exponential function, 5) the probability of
death for age is the same slope over the life course, and 6) the probability of death is the same slope over the
lifecourse of the population.
Theoretical Framework
The Gompertz-Makeham law of mortality described that death rate is a composite function of age-independent
components (named after Makeham) and the age-dependent components (named after Gompertz) [2], [3]. The
Gompertz-Makeham law of mortality showed that death exponentially increases with age, using age from 30 to 80
years. It is expressed in the hazard function below (i.e., h(x)):
Where , , and
This study employs the Gompertz-Makeham law of mortality to examine deaths in Jamaica, while expanding on the
discourse to include urbanization, sex-ratio, area and time of death.
Materials and methods The current work is a secondary data analysis. The data were derived from various Jamaica Government
Publications including The Economic and Social Survey of Jamaica (ESSJ) [23]; 2011 Census of Population &
Housing report for Jamaica [24]; the Demographic Statistics [25], and the Statistical Department of the Jamaica
Constabulary Force (JCF) [26]. Demographic Statistics provide data on mortality, population, and deaths and the
Statistical Department of the Jamaica Constabulary Force on murders. The Economic and Social Survey of Jamaica
(ESSJ) is a publication which collates information on social and economic indicators of Jamaica. It is a publication
by the Planning Institute of Jamaica. The period for this work is from 2000 to 2011. Data were recorded, stored and
retrieved using the Statistical Packages for the Social Sciences for Windows, Version 21.0, as well as Microsoft
Excel. The level of significance that is used to determine statistical significance is less than 5% (0.05). This study
applies the computations of rates, proportion and probability. Ordinary least square (OLS) regression analyses are
used to establish the model for mortality. We also tested six hypotheses 1) mortality is influenced by urbanization
and the sex-ratio, 2) urbanization has a greater influence on mortality than the sex-ratio, 3) a direct correlation exists
between urbanization and the sex-ratio (using data for 2011), 4) the probability of death for age is an exponential
function, 5) the probability of death for age is the same slope over the lifecourse, and 6) the probability of death is
the same slope over the lifecourse:
Ho1 (i.e., null hypothesis one): Mortality in Jamaica ≠ ƒ (Urbanization, Sex-ratio)
Ho2 (i.e., null hypothesis two): Urbanization contributes less to mortality than the sex-ratio
Ho3: (i.e., null hypothesis three): A direct correlation exists between urbanization and the sex-ratio
Ho4 (i.e., null hypothesis four): The probability of death for age is not an exponential function
Ho5 (i.e., null hypothesis five): The probability of death for age is the same slope over the lifecourse
Ho6 (i.e., null hypothesis six): Urbanization constantly increases the rate of death in geographical areas.
Open Access Journal
Indian Journal of Medical Research and Pharmaceutical Sciences June 2014;1(1) ISSN: 2349 – 5340
© Indian Journal of Medical Research and Pharmaceutical Sciences http://www.ijmprs.com/ [25-42]
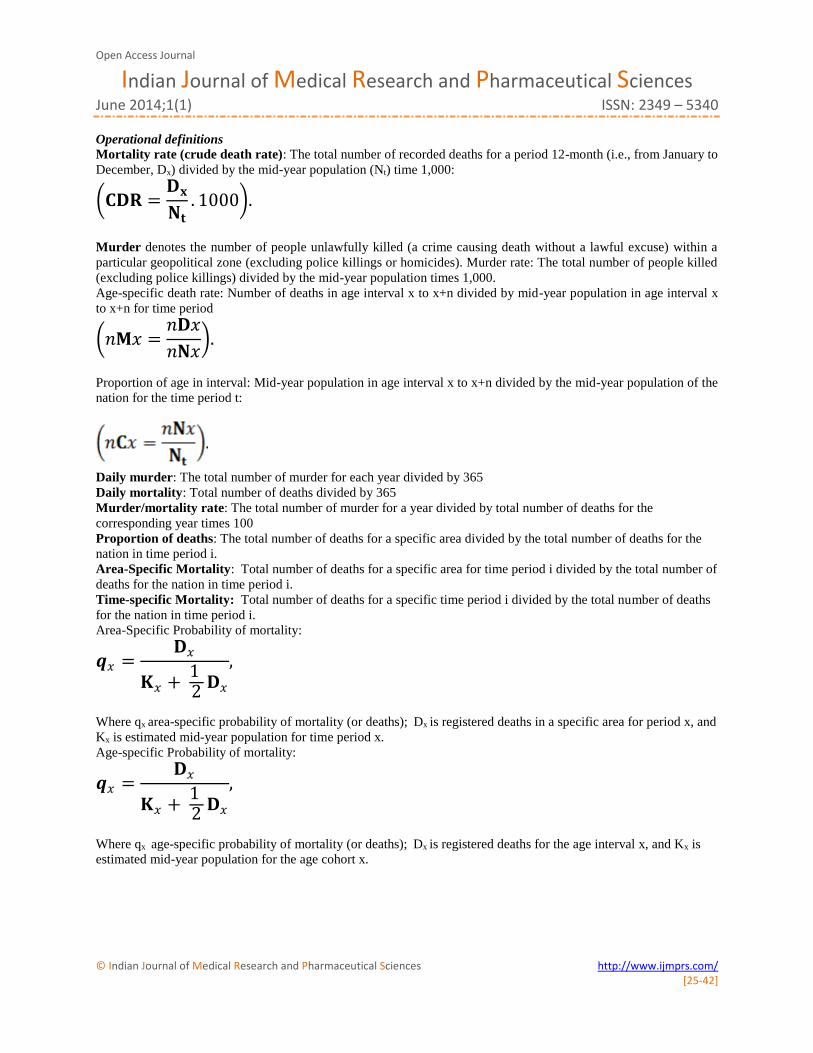
Operational definitions
Mortality rate (crude death rate): The total number of recorded deaths for a period 12-month (i.e., from January to
December, Dx) divided by the mid-year population (Nt) time 1,000:
𝐂𝐃𝐑 =𝐃𝐱
𝐍𝐭. 1000 .
Murder denotes the number of people unlawfully killed (a crime causing death without a lawful excuse) within a
particular geopolitical zone (excluding police killings or homicides). Murder rate: The total number of people killed
(excluding police killings) divided by the mid-year population times 1,000.
Age-specific death rate: Number of deaths in age interval x to x+n divided by mid-year population in age interval x
to x+n for time period
𝑛𝐌𝑥 =𝑛𝐃𝑥
𝑛𝐍𝑥 .
Proportion of age in interval: Mid-year population in age interval x to x+n divided by the mid-year population of the
nation for the time period t:
Daily murder: The total number of murder for each year divided by 365
Daily mortality: Total number of deaths divided by 365
Murder/mortality rate: The total number of murder for a year divided by total number of deaths for the
corresponding year times 100
Proportion of deaths: The total number of deaths for a specific area divided by the total number of deaths for the
nation in time period i.
Area-Specific Mortality: Total number of deaths for a specific area for time period i divided by the total number of
deaths for the nation in time period i.
Time-specific Mortality: Total number of deaths for a specific time period i divided by the total number of deaths
for the nation in time period i.
Area-Specific Probability of mortality:
𝒒𝑥 =𝐃𝑥
𝐊𝑥 + 1 2𝐃𝑥
,
Where qx area-specific probability of mortality (or deaths); Dx is registered deaths in a specific area for period x, and
Kx is estimated mid-year population for time period x.
Age-specific Probability of mortality:
𝒒𝑥 =𝐃𝑥
𝐊𝑥 + 1 2𝐃𝑥
,
Where qx age-specific probability of mortality (or deaths); Dx is registered deaths for the age interval x, and Kx is
estimated mid-year population for the age cohort x.
Open Access Journal
Indian Journal of Medical Research and Pharmaceutical Sciences June 2014;1(1) ISSN: 2349 – 5340
© Indian Journal of Medical Research and Pharmaceutical Sciences http://www.ijmprs.com/ [25-42]
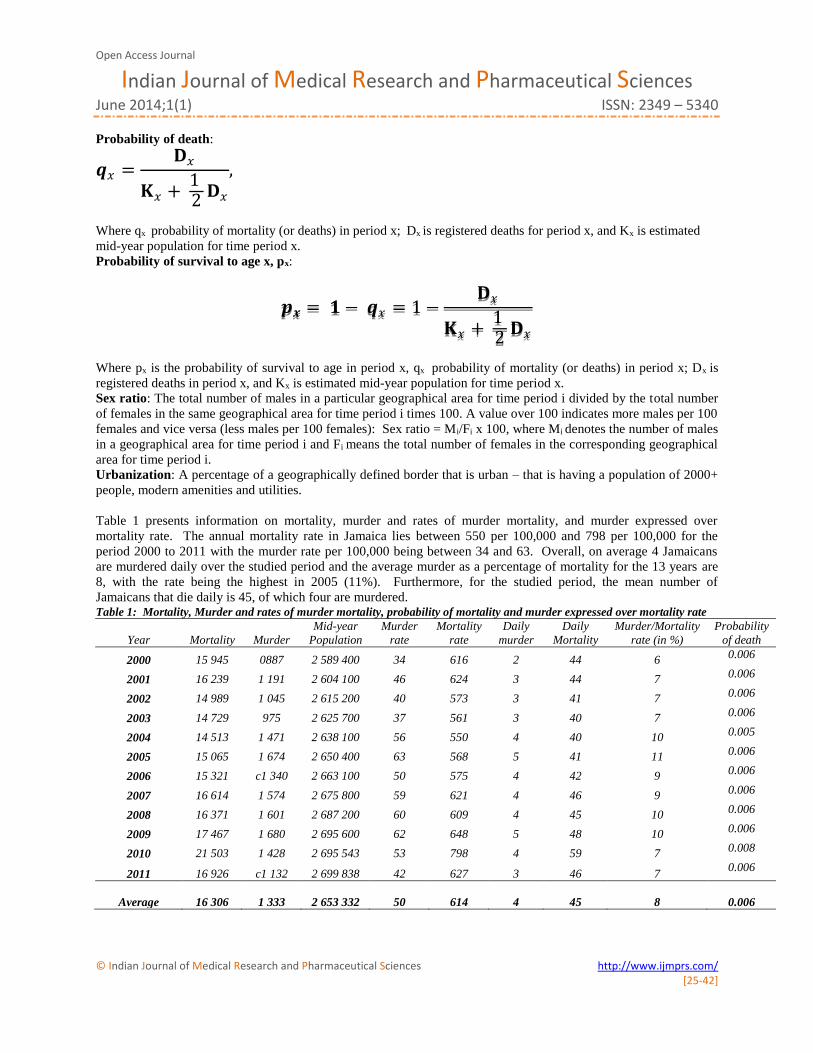
Probability of death:
𝒒𝑥 =𝐃𝑥
𝐊𝑥 + 1 2𝐃𝑥
,
Where qx probability of mortality (or deaths) in period x; Dx is registered deaths for period x, and Kx is estimated
mid-year population for time period x.
Probability of survival to age x, px:
𝒑𝒙 = 𝟏 − 𝒒𝑥 = 1 −𝐃𝑥
𝐊𝑥 + 1 2𝐃𝑥
𝒑𝒙 = 𝟏 − 𝒒𝑥 = 1 −𝐃𝑥
𝐊𝑥 + 1 2𝐃𝑥
Where px is the probability of survival to age in period x, qx probability of mortality (or deaths) in period x; Dx is
registered deaths in period x, and Kx is estimated mid-year population for time period x.
Sex ratio: The total number of males in a particular geographical area for time period i divided by the total number
of females in the same geographical area for time period i times 100. A value over 100 indicates more males per 100
females and vice versa (less males per 100 females): Sex ratio = Mi/Fi x 100, where Mi denotes the number of males
in a geographical area for time period i and Fi means the total number of females in the corresponding geographical
area for time period i.
Urbanization: A percentage of a geographically defined border that is urban – that is having a population of 2000+
people, modern amenities and utilities.
Table 1 presents information on mortality, murder and rates of murder mortality, and murder expressed over
mortality rate. The annual mortality rate in Jamaica lies between 550 per 100,000 and 798 per 100,000 for the
period 2000 to 2011 with the murder rate per 100,000 being between 34 and 63. Overall, on average 4 Jamaicans
are murdered daily over the studied period and the average murder as a percentage of mortality for the 13 years are
8, with the rate being the highest in 2005 (11%). Furthermore, for the studied period, the mean number of
Jamaicans that die daily is 45, of which four are murdered. Table 1: Mortality, Murder and rates of murder mortality, probability of mortality and murder expressed over mortality rate
Year Mortality Murder
Mid-year
Population
Murder
rate
Mortality
rate
Daily
murder
Daily
Mortality
Murder/Mortality
rate (in %)
Probability
of death
2000 15 945 0887 2 589 400 34 616 2 44 6 0.006
2001 16 239 1 191 2 604 100 46 624 3 44 7 0.006
2002 14 989 1 045 2 615 200 40 573 3 41 7 0.006
2003 14 729 975 2 625 700 37 561 3 40 7 0.006
2004 14 513 1 471 2 638 100 56 550 4 40 10 0.005
2005 15 065 1 674 2 650 400 63 568 5 41 11 0.006
2006 15 321 c1 340 2 663 100 50 575 4 42 9 0.006
2007 16 614 1 574 2 675 800 59 621 4 46 9 0.006
2008 16 371 1 601 2 687 200 60 609 4 45 10 0.006
2009 17 467 1 680 2 695 600 62 648 5 48 10 0.006
2010 21 503 1 428 2 695 543 53 798 4 59 7 0.008
2011 16 926 c1 132 2 699 838 42 627 3 46 7 0.006
Average 16 306 1 333 2 653 332 50 614 4 45 8
0.006
Open Access Journal
Indian Journal of Medical Research and Pharmaceutical Sciences June 2014;1(1) ISSN: 2349 – 5340
© Indian Journal of Medical Research and Pharmaceutical Sciences http://www.ijmprs.com/ [25-42]
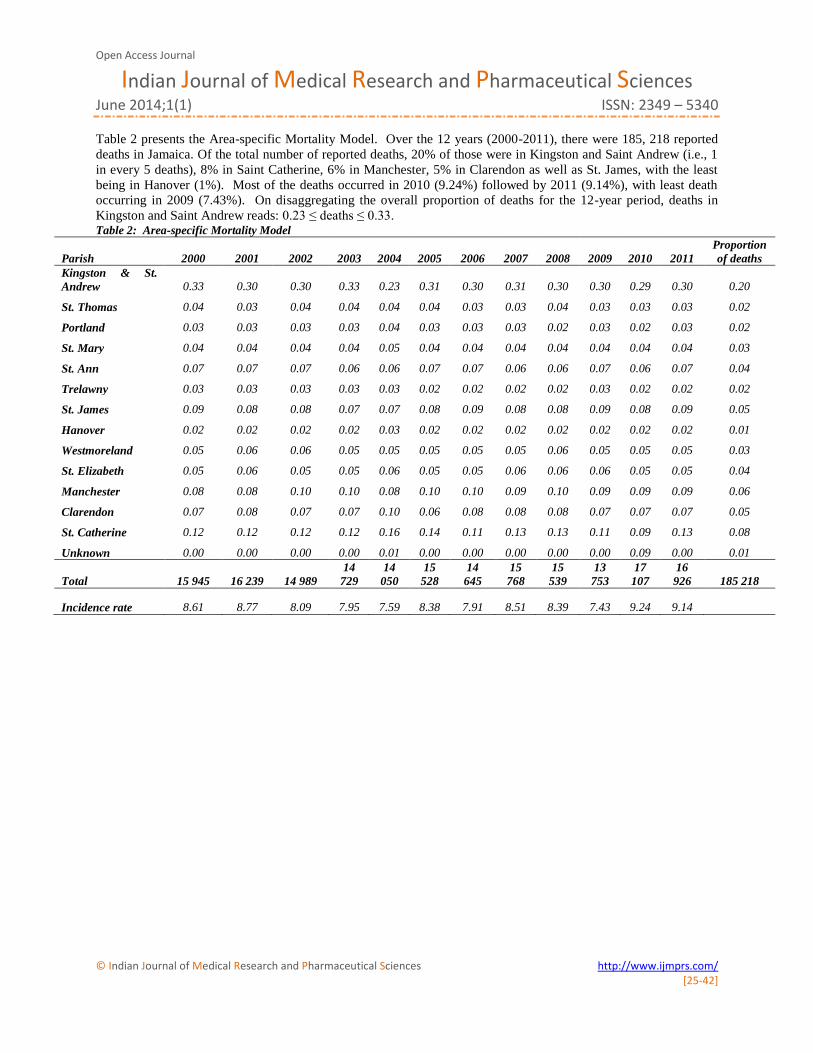
Table 2 presents the Area-specific Mortality Model. Over the 12 years (2000-2011), there were 185, 218 reported
deaths in Jamaica. Of the total number of reported deaths, 20% of those were in Kingston and Saint Andrew (i.e., 1
in every 5 deaths), 8% in Saint Catherine, 6% in Manchester, 5% in Clarendon as well as St. James, with the least
being in Hanover (1%). Most of the deaths occurred in 2010 (9.24%) followed by 2011 (9.14%), with least death
occurring in 2009 (7.43%). On disaggregating the overall proportion of deaths for the 12-year period, deaths in
Kingston and Saint Andrew reads: 0.23 ≤ deaths ≤ 0.33. Table 2: Area-specific Mortality Model
Parish 2000 2001 2002 2003 2004 2005 2006 2007 2008 2009 2010 2011
Proportion
of deaths
Kingston & St.
Andrew 0.33 0.30 0.30 0.33 0.23 0.31 0.30 0.31 0.30 0.30 0.29 0.30 0.20
St. Thomas 0.04 0.03 0.04 0.04 0.04 0.04 0.03 0.03 0.04 0.03 0.03 0.03 0.02
Portland 0.03 0.03 0.03 0.03 0.04 0.03 0.03 0.03 0.02 0.03 0.02 0.03 0.02
St. Mary 0.04 0.04 0.04 0.04 0.05 0.04 0.04 0.04 0.04 0.04 0.04 0.04 0.03
St. Ann 0.07 0.07 0.07 0.06 0.06 0.07 0.07 0.06 0.06 0.07 0.06 0.07 0.04
Trelawny 0.03 0.03 0.03 0.03 0.03 0.02 0.02 0.02 0.02 0.03 0.02 0.02 0.02
St. James 0.09 0.08 0.08 0.07 0.07 0.08 0.09 0.08 0.08 0.09 0.08 0.09 0.05
Hanover 0.02 0.02 0.02 0.02 0.03 0.02 0.02 0.02 0.02 0.02 0.02 0.02 0.01
Westmoreland 0.05 0.06 0.06 0.05 0.05 0.05 0.05 0.05 0.06 0.05 0.05 0.05 0.03
St. Elizabeth 0.05 0.06 0.05 0.05 0.06 0.05 0.05 0.06 0.06 0.06 0.05 0.05 0.04
Manchester 0.08 0.08 0.10 0.10 0.08 0.10 0.10 0.09 0.10 0.09 0.09 0.09 0.06
Clarendon 0.07 0.08 0.07 0.07 0.10 0.06 0.08 0.08 0.08 0.07 0.07 0.07 0.05
St. Catherine 0.12 0.12 0.12 0.12 0.16 0.14 0.11 0.13 0.13 0.11 0.09 0.13 0.08
Unknown 0.00 0.00 0.00 0.00 0.01 0.00 0.00 0.00 0.00 0.00 0.09 0.00 0.01
Total 15 945 16 239 14 989
14
729
14
050
15
528
14
645
15
768
15
539
13
753
17
107
16
926 185 218
Incidence rate 8.61 8.77 8.09 7.95 7.59 8.38 7.91 8.51 8.39 7.43 9.24 9.14

Open Access Journal
Indian Journal of Medical Research and Pharmaceutical Sciences June 2014;1(1) ISSN: 2349 – 5340
© Indian Journal of Medical Research and Pharmaceutical Sciences http://www.ijmprs.com/ [25-42]
Table 3 shows the proportion of annual deaths by time of year from 2000 to 2011 including the total proportion of
deaths for each time period. The majority of deaths occurred in January (9.8%), with the least being in December
(7.8%). Although on average the least number of deaths occurred in December (7.8%); in 2011, 11% of Jamaicans
died in December compared to 8% in February and 9% in August as well as April-to-June. Furthermore, mortality is
relatively consistent in February and August, with January showing the greatest fluctuation in incidence rate. In fact,
on average, 8.3% of Jamaicans die each month. The incidence rate of mortality in January reads: 8% ≤ Mortality ≤
12%.
Table 3: Time-specific Mortality Model
Details 2000 2001 2002 2003 2004 2005 2006 2007 2008 2009 2010 2011 Total
January 0.10 0.10 0.10 0.10 0.10 0.08 0.09 0.11 0.10 0.11 0.10 0.12 0.098
February 0.09 0.07 0.08 0.08 0.08 0.07 0.08 0.07 0.09 0.09 0.08 0.10 0.080
March 0.09 0.09 0.08 0.09 0.09 0.08 0.08 0.06 0.09 0.10 0.11 0.11 0.086
April 0.09 0.08 0.09 0.08 0.09 0.08 0.08 0.09 0.09 0.10 0.09 0.09 0.084
May 0.09 0.08 0.08 0.08 0.08 0.09 0.10 0.08 0.09 0.08 0.09 0.10 0.083
June 0.09 0.09 0.08 0.08 0.09 0.08 0.09 0.08 0.08 0.09 0.09 0.10 0.084
July 0.09 0.09 0.09 0.09 0.08 0.08 0.08 0.09 0.09 0.08 0.10 0.09 0.083
August 0.08 0.09 0.08 0.07 0.08 0.08 0.09 0.08 0.06 0.07 0.09 0.10 0.079
September 0.08 0.07 0.07 0.08 0.08 0.10 0.08 0.08 0.07 0.07 0.10 0.09 0.081
October 0.08 0.09 0.09 0.08 0.08 0.08 0.09 0.09 0.08 0.07 0.10 0.09 0.080
November 0.07 0.07 0.08 0.07 0.08 0.11 0.09 0.09 0.06 0.07 0.11 0.10 0.084
December 0.05 0.08 0.08 0.09 0.07 0.07 0.08 0.08 0.09 0.07 0.11 0.08 0.078
Total 15945 16239 14989 14729 14050 15528 14645 15768 15539 13753 17107 16926 185 218
Open Access Journal
Indian Journal of Medical Research and Pharmaceutical Sciences June 2014;1(1) ISSN: 2349 – 5340
© Indian Journal of Medical Research and Pharmaceutical Sciences http://www.ijmprs.com/ [25-42]
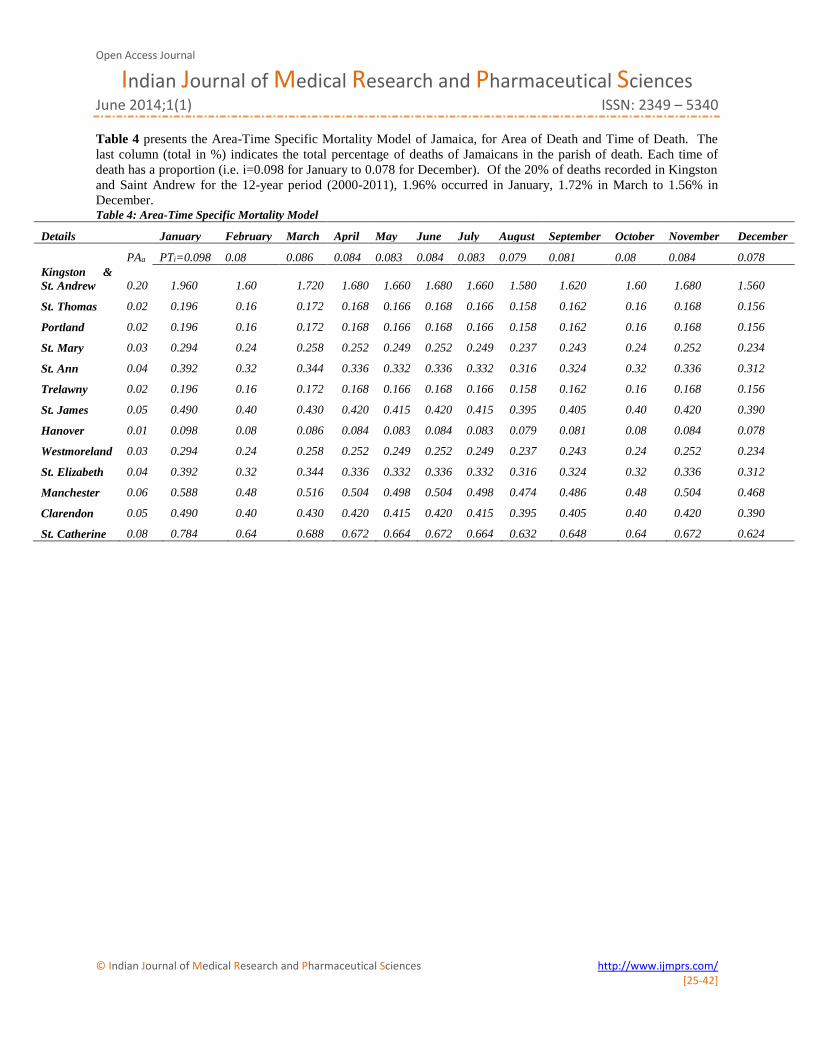
Table 4 presents the Area-Time Specific Mortality Model of Jamaica, for Area of Death and Time of Death. The
last column (total in %) indicates the total percentage of deaths of Jamaicans in the parish of death. Each time of
death has a proportion (i.e. i=0.098 for January to 0.078 for December). Of the 20% of deaths recorded in Kingston
and Saint Andrew for the 12-year period (2000-2011), 1.96% occurred in January, 1.72% in March to 1.56% in
December. Table 4: Area-Time Specific Mortality Model
Details
January February March April May June July August September October November December
PAa PTi=0.098 0.08 0.086 0.084 0.083 0.084 0.083 0.079 0.081 0.08 0.084 0.078
Kingston &
St. Andrew 0.20 1.960 1.60 1.720 1.680 1.660 1.680 1.660 1.580 1.620 1.60 1.680 1.560
St. Thomas 0.02 0.196 0.16 0.172 0.168 0.166 0.168 0.166 0.158 0.162 0.16 0.168 0.156
Portland 0.02 0.196 0.16 0.172 0.168 0.166 0.168 0.166 0.158 0.162 0.16 0.168 0.156
St. Mary 0.03 0.294 0.24 0.258 0.252 0.249 0.252 0.249 0.237 0.243 0.24 0.252 0.234
St. Ann 0.04 0.392 0.32 0.344 0.336 0.332 0.336 0.332 0.316 0.324 0.32 0.336 0.312
Trelawny 0.02 0.196 0.16 0.172 0.168 0.166 0.168 0.166 0.158 0.162 0.16 0.168 0.156
St. James 0.05 0.490 0.40 0.430 0.420 0.415 0.420 0.415 0.395 0.405 0.40 0.420 0.390
Hanover 0.01 0.098 0.08 0.086 0.084 0.083 0.084 0.083 0.079 0.081 0.08 0.084 0.078
Westmoreland 0.03 0.294 0.24 0.258 0.252 0.249 0.252 0.249 0.237 0.243 0.24 0.252 0.234
St. Elizabeth 0.04 0.392 0.32 0.344 0.336 0.332 0.336 0.332 0.316 0.324 0.32 0.336 0.312
Manchester 0.06 0.588 0.48 0.516 0.504 0.498 0.504 0.498 0.474 0.486 0.48 0.504 0.468
Clarendon 0.05 0.490 0.40 0.430 0.420 0.415 0.420 0.415 0.395 0.405 0.40 0.420 0.390
St. Catherine 0.08 0.784 0.64 0.688 0.672 0.664 0.672 0.664 0.632 0.648 0.64 0.672 0.624
Open Access Journal
Indian Journal of Medical Research and Pharmaceutical Sciences June 2014;1(1) ISSN: 2349 – 5340
© Indian Journal of Medical Research and Pharmaceutical Sciences http://www.ijmprs.com/ [25-42]
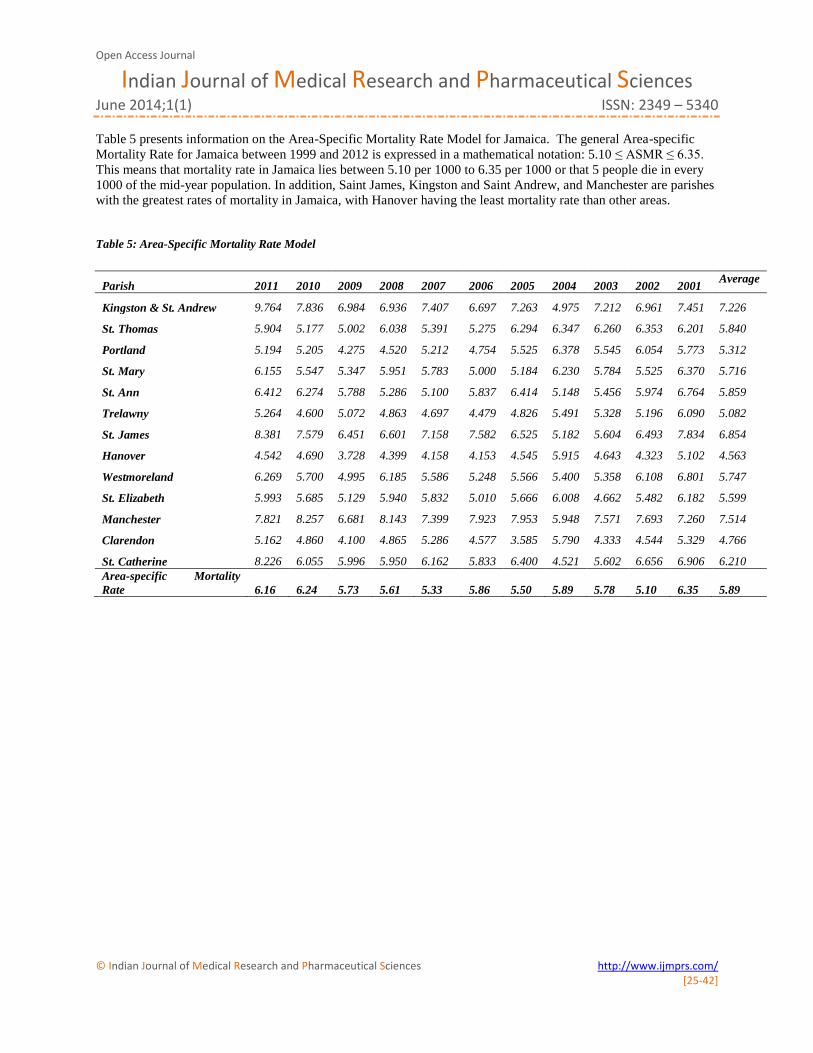
Table 5 presents information on the Area-Specific Mortality Rate Model for Jamaica. The general Area-specific
Mortality Rate for Jamaica between 1999 and 2012 is expressed in a mathematical notation: 5.10 ≤ ASMR ≤ 6.35.
This means that mortality rate in Jamaica lies between 5.10 per 1000 to 6.35 per 1000 or that 5 people die in every
1000 of the mid-year population. In addition, Saint James, Kingston and Saint Andrew, and Manchester are parishes
with the greatest rates of mortality in Jamaica, with Hanover having the least mortality rate than other areas.
Table 5: Area-Specific Mortality Rate Model
Parish 2011 2010 2009 2008 2007 2006 2005 2004 2003 2002 2001 Average
Kingston & St. Andrew 9.764 7.836 6.984 6.936 7.407 6.697 7.263 4.975 7.212 6.961 7.451 7.226
St. Thomas 5.904 5.177 5.002 6.038 5.391 5.275 6.294 6.347 6.260 6.353 6.201 5.840
Portland 5.194 5.205 4.275 4.520 5.212 4.754 5.525 6.378 5.545 6.054 5.773 5.312
St. Mary 6.155 5.547 5.347 5.951 5.783 5.000 5.184 6.230 5.784 5.525 6.370 5.716
St. Ann 6.412 6.274 5.788 5.286 5.100 5.837 6.414 5.148 5.456 5.974 6.764 5.859
Trelawny 5.264 4.600 5.072 4.863 4.697 4.479 4.826 5.491 5.328 5.196 6.090 5.082
St. James 8.381 7.579 6.451 6.601 7.158 7.582 6.525 5.182 5.604 6.493 7.834 6.854
Hanover 4.542 4.690 3.728 4.399 4.158 4.153 4.545 5.915 4.643 4.323 5.102 4.563
Westmoreland 6.269 5.700 4.995 6.185 5.586 5.248 5.566 5.400 5.358 6.108 6.801 5.747
St. Elizabeth 5.993 5.685 5.129 5.940 5.832 5.010 5.666 6.008 4.662 5.482 6.182 5.599
Manchester 7.821 8.257 6.681 8.143 7.399 7.923 7.953 5.948 7.571 7.693 7.260 7.514
Clarendon 5.162 4.860 4.100 4.865 5.286 4.577 3.585 5.790 4.333 4.544 5.329 4.766
St. Catherine 8.226 6.055 5.996 5.950 6.162 5.833 6.400 4.521 5.602 6.656 6.906 6.210
Area-specific Mortality
Rate 6.16 6.24 5.73 5.61 5.33 5.86 5.50 5.89 5.78 5.10 6.35
5.89
Open Access Journal
Indian Journal of Medical Research and Pharmaceutical Sciences June 2014;1(1) ISSN: 2349 – 5340
© Indian Journal of Medical Research and Pharmaceutical Sciences http://www.ijmprs.com/ [25-42]
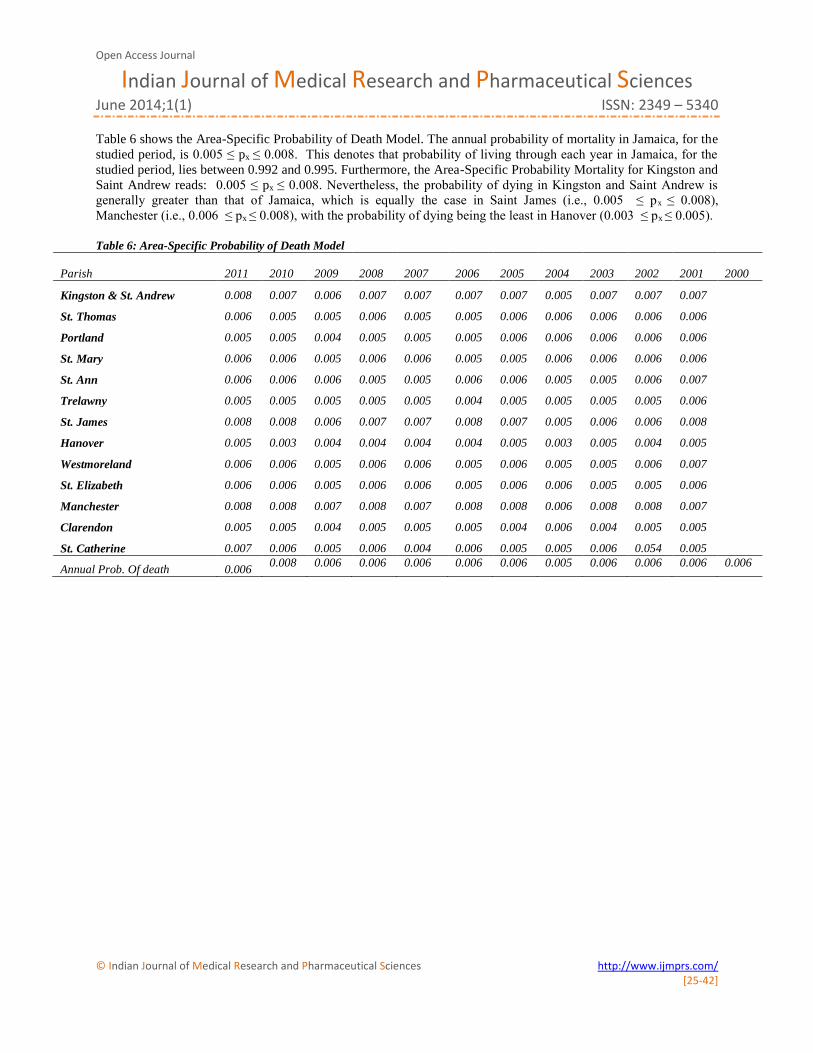
Table 6 shows the Area-Specific Probability of Death Model. The annual probability of mortality in Jamaica, for the
studied period, is 0.005 ≤ px ≤ 0.008. This denotes that probability of living through each year in Jamaica, for the
studied period, lies between 0.992 and 0.995. Furthermore, the Area-Specific Probability Mortality for Kingston and
Saint Andrew reads: 0.005 ≤ px ≤ 0.008. Nevertheless, the probability of dying in Kingston and Saint Andrew is
generally greater than that of Jamaica, which is equally the case in Saint James (i.e., 0.005 ≤ px ≤ 0.008),
Manchester (i.e., 0.006 ≤ px ≤ 0.008), with the probability of dying being the least in Hanover (0.003 ≤ px ≤ 0.005). Table 6: Area-Specific Probability of Death Model
Parish 2011 2010 2009 2008 2007 2006 2005 2004 2003 2002 2001
2000
Kingston & St. Andrew 0.008 0.007 0.006 0.007 0.007 0.007 0.007 0.005 0.007 0.007 0.007
St. Thomas 0.006 0.005 0.005 0.006 0.005 0.005 0.006 0.006 0.006 0.006 0.006
Portland 0.005 0.005 0.004 0.005 0.005 0.005 0.006 0.006 0.006 0.006 0.006
St. Mary 0.006 0.006 0.005 0.006 0.006 0.005 0.005 0.006 0.006 0.006 0.006
St. Ann 0.006 0.006 0.006 0.005 0.005 0.006 0.006 0.005 0.005 0.006 0.007
Trelawny 0.005 0.005 0.005 0.005 0.005 0.004 0.005 0.005 0.005 0.005 0.006
St. James 0.008 0.008 0.006 0.007 0.007 0.008 0.007 0.005 0.006 0.006 0.008
Hanover 0.005 0.003 0.004 0.004 0.004 0.004 0.005 0.003 0.005 0.004 0.005
Westmoreland 0.006 0.006 0.005 0.006 0.006 0.005 0.006 0.005 0.005 0.006 0.007
St. Elizabeth 0.006 0.006 0.005 0.006 0.006 0.005 0.006 0.006 0.005 0.005 0.006
Manchester 0.008 0.008 0.007 0.008 0.007 0.008 0.008 0.006 0.008 0.008 0.007
Clarendon 0.005 0.005 0.004 0.005 0.005 0.005 0.004 0.006 0.004 0.005 0.005
St. Catherine 0.007 0.006 0.005 0.006 0.004 0.006 0.005 0.005 0.006 0.054 0.005
Annual Prob. Of death 0.006 0.008 0.006 0.006 0.006 0.006 0.006 0.005 0.006 0.006 0.006 0.006
Open Access Journal
Indian Journal of Medical Research and Pharmaceutical Sciences June 2014;1(1) ISSN: 2349 – 5340
© Indian Journal of Medical Research and Pharmaceutical Sciences http://www.ijmprs.com/ [25-42]
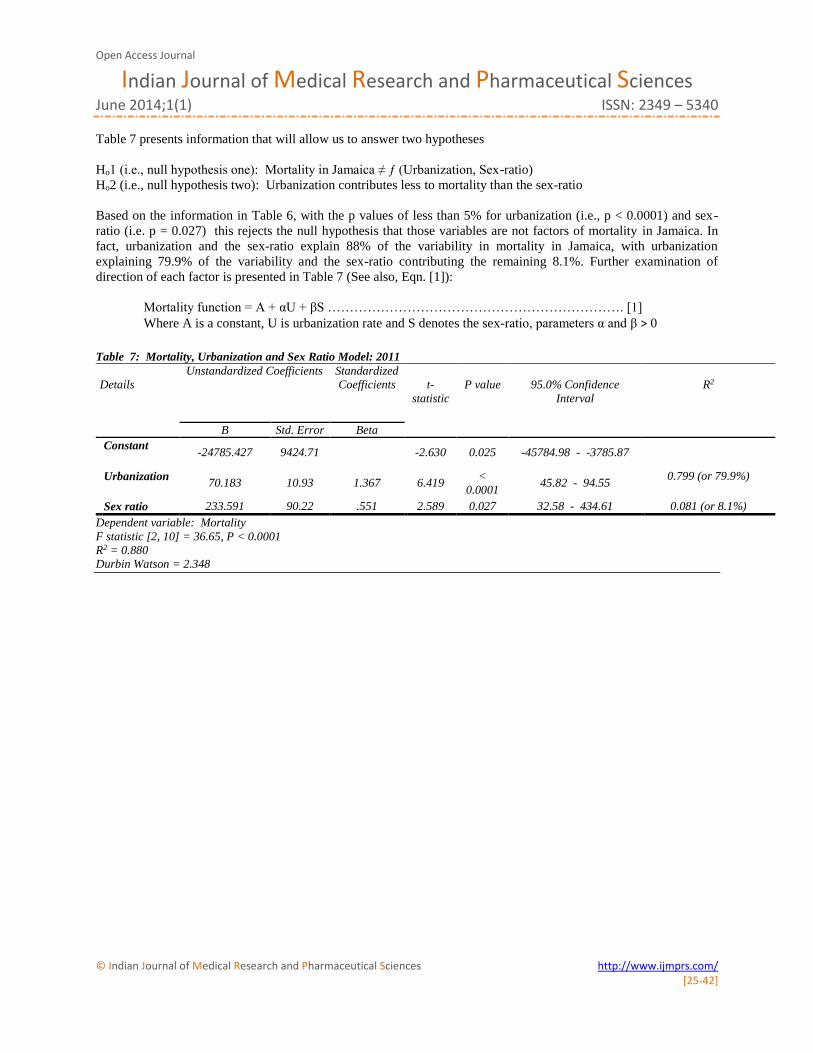
Table 7 presents information that will allow us to answer two hypotheses
Ho1 (i.e., null hypothesis one): Mortality in Jamaica ≠ ƒ (Urbanization, Sex-ratio)
Ho2 (i.e., null hypothesis two): Urbanization contributes less to mortality than the sex-ratio
Based on the information in Table 6, with the p values of less than 5% for urbanization (i.e., p < 0.0001) and sex-
ratio (i.e. p = 0.027) this rejects the null hypothesis that those variables are not factors of mortality in Jamaica. In
fact, urbanization and the sex-ratio explain 88% of the variability in mortality in Jamaica, with urbanization
explaining 79.9% of the variability and the sex-ratio contributing the remaining 8.1%. Further examination of
direction of each factor is presented in Table 7 (See also, Eqn. [1]):
Mortality function = A + αU + βS …………………………………………………………. [1]
Where A is a constant, U is urbanization rate and S denotes the sex-ratio, parameters α and β ˃ 0
Table 7: Mortality, Urbanization and Sex Ratio Model: 2011
Details
Unstandardized Coefficients Standardized
Coefficients
t-
statistic
P value
95.0% Confidence
Interval
R2
B Std. Error Beta
Constant -24785.427 9424.71
-2.630 0.025 -45784.98 - -3785.87
Urbanization 70.183 10.93 1.367 6.419
<
0.0001 45.82 - 94.55
0.799 (or 79.9%)
Sex ratio 233.591 90.22 .551 2.589 0.027 32.58 - 434.61 0.081 (or 8.1%)
Dependent variable: Mortality
F statistic [2, 10] = 36.65, P < 0.0001
R2 = 0.880
Durbin Watson = 2.348
Open Access Journal
Indian Journal of Medical Research and Pharmaceutical Sciences June 2014;1(1) ISSN: 2349 – 5340
© Indian Journal of Medical Research and Pharmaceutical Sciences http://www.ijmprs.com/ [25-42]
Ho3: (i.e., null hypothesis three): An inverse correlation exists between urbanization and the sex-ratio
Table 8 presents information on correlations between pairs of factors: mortality and urbanization; mortality and sex
ratio; sex-ratio and urbanization. Hence, we fail to reject the null hypothesis. A strong positive statistical correlation
exists between mortality and urbanization (Pearson’s correlation coefficient = 0.894; P < 0.0001) and an indirect
association between mortality and sex-ratio (Pearson’s correlation coefficient = -0.621, P = 0.012). A negative
statistical association exists between urbanization and the sex ratio (Pearson’s correlation coefficient = -0.857, P <
0.0001). This denotes that the more an area in Jamaica is urbanized, the lower the sex ratio (i.e., number of males
per 100 females) and vice versa.
Table 8: Correlation matrix, 2011
Mortality Urbanization Sex ratio
Pearson Correlation Mortality 1.000 0.894 -0.621
Urbanization 0.894 1.000 -0.857
Sex ratio -0.621 -0.857 1.000 Sig. (1-tailed) Mortality . 0.000 0.012
Urbanization 0.000 . 0.000 Sex ratio 0.012 0.000 .
N 13 13 13
Age-specific Probability of Mortality Curve
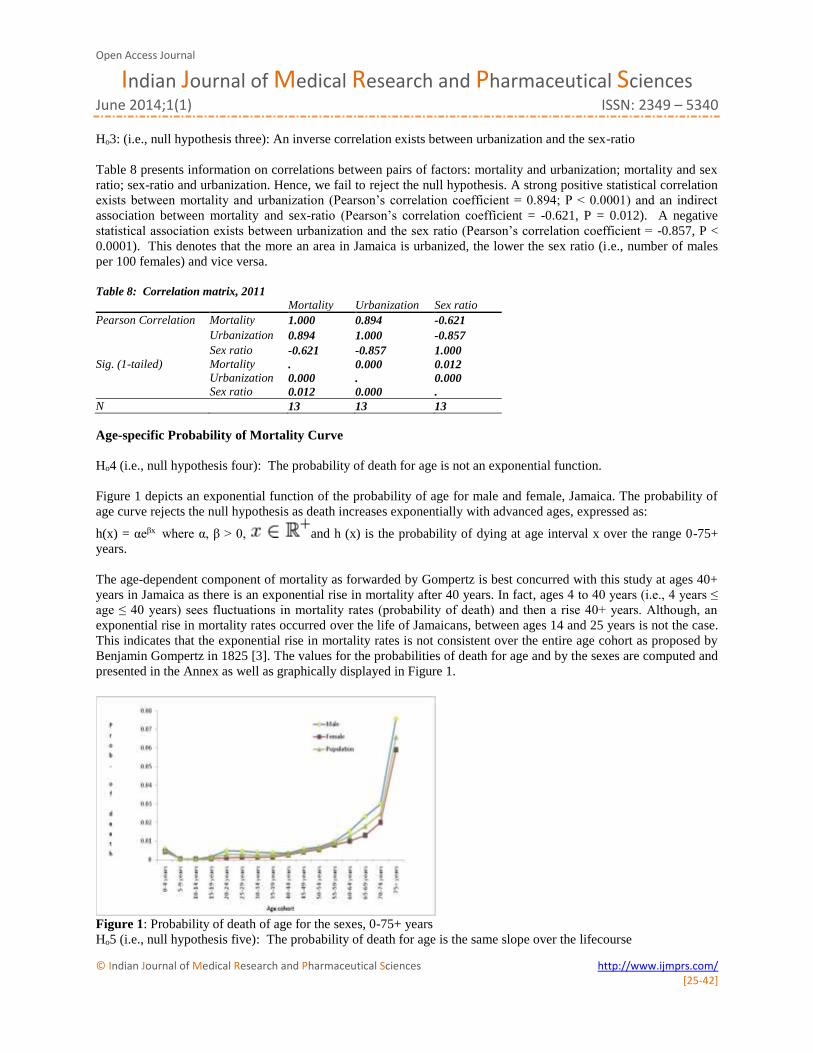
Ho4 (i.e., null hypothesis four): The probability of death for age is not an exponential function.
Figure 1 depicts an exponential function of the probability of age for male and female, Jamaica. The probability of
age curve rejects the null hypothesis as death increases exponentially with advanced ages, expressed as:
h(x) = αeβx where α, β > 0, and h (x) is the probability of dying at age interval x over the range 0-75+
years.
The age-dependent component of mortality as forwarded by Gompertz is best concurred with this study at ages 40+
years in Jamaica as there is an exponential rise in mortality after 40 years. In fact, ages 4 to 40 years (i.e., 4 years ≤
age ≤ 40 years) sees fluctuations in mortality rates (probability of death) and then a rise 40+ years. Although, an
exponential rise in mortality rates occurred over the life of Jamaicans, between ages 14 and 25 years is not the case.
This indicates that the exponential rise in mortality rates is not consistent over the entire age cohort as proposed by
Benjamin Gompertz in 1825 [3]. The values for the probabilities of death for age and by the sexes are computed and
presented in the Annex as well as graphically displayed in Figure 1.
Figure 1: Probability of death of age for the sexes, 0-75+ years
Ho5 (i.e., null hypothesis five): The probability of death for age is the same slope over the lifecourse

Open Access Journal
Indian Journal of Medical Research and Pharmaceutical Sciences June 2014;1(1) ISSN: 2349 – 5340
© Indian Journal of Medical Research and Pharmaceutical Sciences http://www.ijmprs.com/ [25-42]
Ho5 (i.e., null hypothesis five): The probability of death is the same slope over the lifecourse.
Figures 2 and 3 depicts different slope between 5-39 years and 40-75+ years. In fact, an exponential function of the probability of age is depicted between for 40-75+ years and a straight line for ages 5-39 years old Jamaicans. The probability of age curves rejects the null hypothesis that death increases exponentially with over the lifecourse.
The exponential increases in mortality occurs from 40+ years as well as advanced ages, expressed in Figure 2 (or
equation h(x)):
h(x) = αeβx where α, β > 0, and h (x) is the probability of dying at age interval x over the range 40-75+
years.
Figure 2: Probability of death from 40-75+ years old
Open Access Journal
Indian Journal of Medical Research and Pharmaceutical Sciences June 2014;1(1) ISSN: 2349 – 5340
© Indian Journal of Medical Research and Pharmaceutical Sciences http://www.ijmprs.com/ [25-42]
The probability of death for Jamaicans ages 5-39 years is best expressed by a straight line (see Figure 3 and t(x)):
t(x) = α + βx where α, β > 0, x is 5-year age cohort, and t (x) is the probability of dying at age interval x, ages 5-39
years.
Figure 3: Probability of death from 5-39 years old
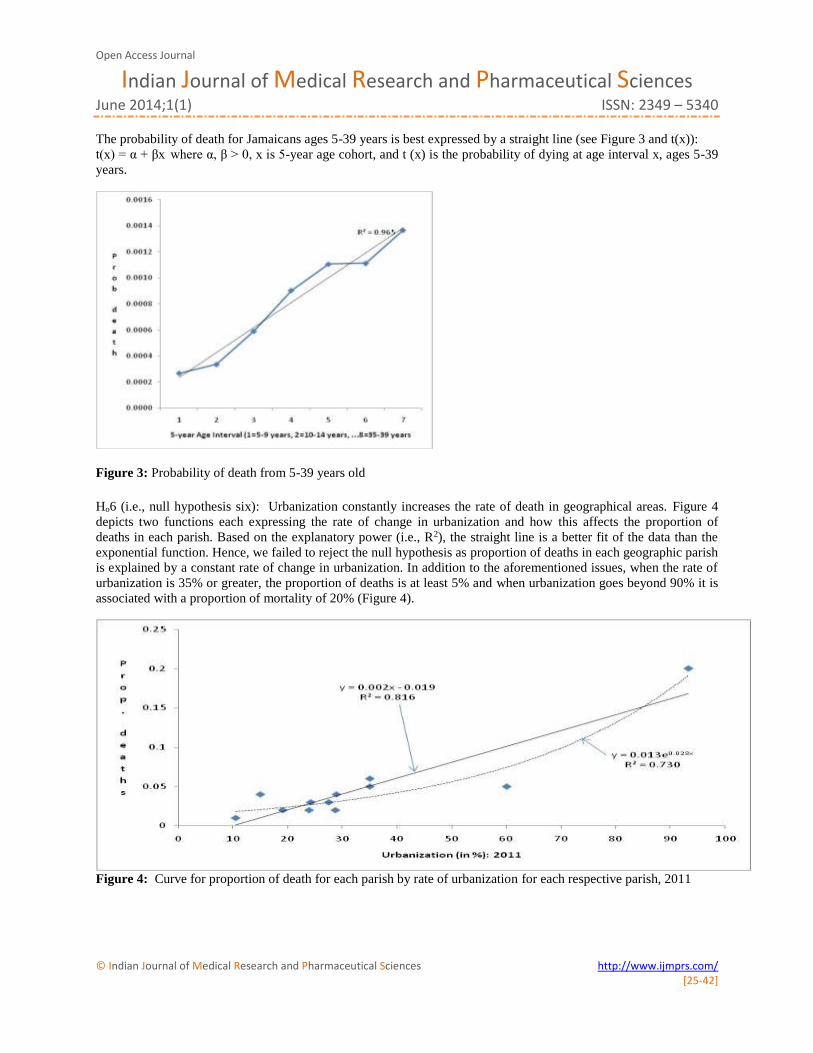
Ho6 (i.e., null hypothesis six): Urbanization constantly increases the rate of death in geographical areas. Figure 4
depicts two functions each expressing the rate of change in urbanization and how this affects the proportion of
deaths in each parish. Based on the explanatory power (i.e., R2), the straight line is a better fit of the data than the
exponential function. Hence, we failed to reject the null hypothesis as proportion of deaths in each geographic parish
is explained by a constant rate of change in urbanization. In addition to the aforementioned issues, when the rate of
urbanization is 35% or greater, the proportion of deaths is at least 5% and when urbanization goes beyond 90% it is
associated with a proportion of mortality of 20% (Figure 4).
Figure 4: Curve for proportion of death for each parish by rate of urbanization for each respective parish, 2011
Open Access Journal
Indian Journal of Medical Research and Pharmaceutical Sciences June 2014;1(1) ISSN: 2349 – 5340
© Indian Journal of Medical Research and Pharmaceutical Sciences http://www.ijmprs.com/ [25-42]
Limitations
Mortality comprises of murder and non-murder components. Although the non-murder mortality figures used are
numbers that are published nationally, due to calculation errors along with institutional coordination issues of data
collection agencies, some of the data presented may either be a little more or a little less than expected. The non-
murder component of mortality is the larger proportion, and this larger component is more affected by the errors and
issues presented earlier.
Results and discussion The mortality discourse commenced as early as the seventeenth century with John Graunt [1] and this has increased
with new tenets [2]-[6]. Unlike other studies in the mortality discourse, this research covers area-time specific
mortality models; urbanization and the sex ratio explain mortality as well as the potency of each factor on mortality.
Some of the findings that emerged from the current study are that the average probability of death in Jamaica for
studied period is 0.006; the average mortality rate is 614 per 100,000; average murder rate is 50 per 100,000. On
average murder accounts for 8% of average mortality, and the probability of mortality changes over the lifecourse.
The majority of mortality in Jamaica occurred in Kingston and Saint Andrew (20% of total deaths) followed by
Saint Catherine (8%), Manchester (6%) and then Saint James (5%). As it relates to time mortality rate, 9.8% of
deaths occurred in January; 8.6% in March and 8.4% in April, June and November, with December having the least
number of deaths (7.8%). Furthermore, urbanization accounts for 79.9% of the variability in mortality and this factor
directly influences mortality. In addition to the aforementioned findings, areas with more females are more likely to
have greater mortality.
The issue of urbanization influencing mortality is already established in the literature [27]-[31], with this
research concurring with past empirical findings. However, this study confirms that urbanized areas are more likely
to have more deaths and this is equally the case if the area has more females than males. The parishes with the
majority of deaths in Jamaica (Saint Andrew and Kingston; Saint James; Saint Catherine and Manchester), 39% of
total mortality, have sex-ratios that are lower than 100 per 100 females, indicating that more females reside therein
than males with the exception of Manchester. The rate of urbanization in Kingston (100%) and Saint Andrew
(86.5%) is 93.5%, a sex ratio of 96.7 males per 100 females and 20% mortality occurring in these parishes, of which
1.96% of the deaths occur in January. On the contrary, Hanover has the least urbanization rate in Jamaica (10.5%), a
sex-ratio of 101.7 males per 100 females and the lowest proportion of deaths (1%) compared to highly urbanized
and proportion of deaths like Kingston and Saint Andrew, Saint James (urbanization rate = 60%). It is
urbanization’s influence on mortality that is critical in the mortality discourse than gender and urbanization plays a
dominant role in the death profile of Jamaicans. There has been a rapid urbanization of many rural areas in Jamaica
as in 1970 the rate of urbanization was 40.6% and in 2011 it stood at 53.9% [25], and this is associated with
overcrowding, urban sprawl, poor housing and living conditions, poor sanitary convenience and other social
amenities which are explaining the increasing rise in mortality in Jamaica and by extension low-to-middle income
nations.
Another new finding emerging from this study is the inverse correlation between the sex-ratio and
urbanization, which indicates that on average areas in Jamaica with a greater degree of urbanization have a greater
likeliness of having more females residing therein. Those findings can be contextualized with past research. A study
by Bourne et al. [7] found that the mortality rate of Jamaicans 60+ years old is 58.64 per 100 of the mid-year
population and that this was greater for females than for males. Another study by Bourne et al. [32] revealed that in
2008, 49.9% of mortality was related to chronic non-communicable diseases (male, 44.4%; female, 57.1%) as well
as that ageing is associated with ageing-related diseases like chronic conditions (i.e., cardiovascular diseases,
diabetes, cancers, arthritis). Those studies provided significant insights into the mortality rates of the current work,
the feminization of deaths and also concurs with the current findings that deaths are feminized phenomenon in
Jamaica. We can deduce from this research and those of the literature that urbanization, feminization, ageing at older
ages and time of the year are reducing the life expectancy of Jamaicans, and that murder is secondary to
communicable diseases as well as urbanization. There is a clear reality added by this study that mortality is shrouded
by urbanization and masculinity, and that probability of death has being relatively consistent over the last 12 years in
Jamaica, with murder playing a small role in the mortality discourse.
The life expectancy of Jamaican females is greater than that of males [24], which offers an insight into the
survivability of the sexes and account for the gender-mortality differential (i.e. greater probability of deaths of
females than males), indicating that former have a different mortality profile than the latter, which concurs with the
Open Access Journal
Indian Journal of Medical Research and Pharmaceutical Sciences June 2014;1(1) ISSN: 2349 – 5340
© Indian Journal of Medical Research and Pharmaceutical Sciences http://www.ijmprs.com/ [25-42]
literature [33]-[36]. Although mortality is a gendered phenomenon (i.e., occurring mostly among females) in
Jamaica like in many nations, this research shows that urbanization is changing the mortality structure more than
other issues in the mortality discourse. The difference between this work and the literature is that urbanization is
accounting for majority of the deaths in Jamaica which is not the case in rural Australia [37]-[41]. Furthermore,
another difference lies in the direction of urbanization and mortality between this study and the literature. In the
literature there is an inverse correlation between mortality and urbanization [42]-[47], which is not the case in
Jamaica. In fact, there is a dominance of urbanization in explaining the rise in mortality in Jamaica, which is not the
case in the literature. A group of scholars opined that “Thus urban mortality decline by itself cannot drive
urbanization” [47], which is not the case in Jamaica as urbanization accounts for almost 80% of the variability in
mortality. Bandyopadhyay and Green [47] offered an explanation for what is happening in Jamaica as it relates to
the urbanization-mortality paradigm by suggesting that “Our preliminary results suggest that mortality decline
causes urbanization through the creation of new cities rather than promoting urban growth in already-extant cities”.
Their perspective is profound in explaining what is occurring in Jamaica as the increases in mortality are owing to
the expansion of new urban centres. This means that urbanization of new centres indicate 1) overcrowding, 2)
congestion, 3) increase pollution, 4) reduced leisure time, and 5) those account for the greater degree of mortality
occurring in Jamaica not due to the expansion of already urban areas. Such a proposition is encapsulated in the fact
that the urban centre with the greatest proportion of mortality in Jamaica has a rate of urbanization of over 90% (i.e.,
Kingston and Saint Catherine) and this has been increasing at a constant over the past two decades, with the rate of
urbanization in some parishes increasing at a geometric rate and having greater mortality than those with constant
urbanization like Saint Catherine, Saint James, and Manchester. However, we do not concur with Bandyopadhyay
and Green [47] that there is a causal link between urbanization and mortality even though there is evidence that the
relationship is a very strong one. Another disagreement is with the direction of association, we found positive and
Bandyopadhyay and Green [47] research turned out to be an inverse association.
In addition, the urbanization-mortality phenomenon as well as the sex-ratio mortality phenomenon is
arithmetic law unlike the exponential law between the probability of mortality and age which concurs with
Benjamin Gompertz’s work on the law of mortality [3]. In fact, this work disagrees with the theory developed by
that mortality rate increases more slowly at advanced ages [48] as well as the theory advanced by Gompertz [3] that
mortality increases exponentially over the lifecourse. The rate of change of mortality of Jamaicans ages 5-39 years
increases at a constant rate, while the rate of change of death at advanced ages, 40+ years, increases at an increasing
rate (i.e., exponential rate). We can deduced from the current findings and those of the literature that lifestyle
practices of the urban peoples are retarding the life expectancy of people in urban centres and resulting in the
increases in deaths.
Conclusion The results presented herein speak to the dominance of urbanization in the mortality discourse and that time as well
as the sex-ratio offers some insights into changes in mortality. Outside of those issues, time and the age cohorts are
crucial in mortality discourse and at advanced ages the rate of mortality increases at an increasing rate compared to
the constant rate at ages 5-39 years. Clearly, urbanization is an epidemic like chronic non-communicable diseases
and practices of people in urban areas explain the risk factors associated with many diseases and the resulting
mortality in developed and developing societies.
Acknowledgements We would like to express our sincere appreciation to the Library Staffers at the Statistical Institute of Jamaica for
their assistance in searching through various documents and providing different documents from which the data for
this study are taken.
References 1. J. Graunt. Natural and political observations made upon the Bills of Mortality; 1662. Willcox WF, ed.
Baltimore: Johns Hopkins University Press; 1939.
2. W.M. Makeham. On the Law of Mortality and the Construction of Annuity Tables. J. Inst. Actuaries and Assur.
Mag Vol. 8, pp. 301–310, 1860.
Open Access Journal
Indian Journal of Medical Research and Pharmaceutical Sciences June 2014;1(1) ISSN: 2349 – 5340
© Indian Journal of Medical Research and Pharmaceutical Sciences http://www.ijmprs.com/ [25-42]
3. B. Gompertz. On the Nature of the Function Expressive of the Law of Human Mortality, and on a New Mode of
Determining the Value of Life Contingencies. Philosophical Transactions of the Royal Society Vol. 115, pp.
513–585, 1825.
4. B.L. Strehler, and A.S. Mildvan. General Theory of Mortality and Aging. Science Vol. 132, pp. 14-21, 1960.
5. L.A. Gavrilov, N.S. Gavrilova, and V.N. Nosov. Human life span stopped increasing: Why? Gerontology Vol.
29, Issue 3, pp. 176–180, 1983.
6. N.S. Gavrilova, and L.A. Gavrilov. Ageing and Longevity: Mortality Laws and Mortality Forecasts for Ageing
Populations [In Czech: Stárnutí a dlouhovekost: Zákony a prognózyúmrtnosti pro stárnoucí populace].
Demografie, Vol. 53, Issue 2, pp. 109–128, 2011.
7. P.A. Bourne, I. Solan, C. Sharpe-Pryce, J. Campbell-Smith, and C. Francis. Human Ageing, Mortality and the
Role of Macroeconomics Variables in Determining Death at Older Ages. Epidemiol Vol. 4, pp. 144, 2014.
8. P.A Bourne, D.A.McGrowder, and T.V. Crawford. Decomposing Mortality Rates and Examining Health Status
of the Elderly in Jamaica. The Open Geriatric Medicine Journal Vol 2, pp. 34-44, 2009.
9. P.A. Bourne. Impact of poverty, not seeking medical care, unemployment, inflation, self-reported illness, health
insurance on mortality in Jamaica. North American Journal of Medical Sciences Vol.1, Issue 3, pp. 99-109,
2009.
10. P.A. Bourne. Births, economic growth, mortality and murder in a developing country. Health; Vol. 4, Issue 2,
pp.46-55, 2012.
11. C. March, and P.A. Bourne. The Influence of Macroeconomic Factors on Murders in Jamaica: Should the
Police Be Cautious in Interpreting the Murder Statistics? Asian Journal of Business Management, Vol. 3, Issue
4, pp. 257-277, 2011.
12. N. Keyfitz. Introduction to the mathematics of population with revisions. Massachusetts: Addison-Wesley
Publishing Company; 1977.
13. M.A. Ogborn. On the nature of the function expressive of the law of human mortality. JIA, Vol. 79, pp. 0170-
0212, 1953.
14. D.T. Rowland. Demographic methods and concepts. Oxford University Press, Oxford; 2003.
15. S.H. Preston, P. Heuveline, and M. Guillot. Demography: Measuring and modelling population processes.
Massachusetts: Blackwell Publishers; 2001.
16. C. Newell. Methods and models in demography. New York: The Guilford Press; 1988.
17. J.B. Echouffo-Tcheugui, and A.P. Kengne. Chronic non-communicable diseases in Cameroon-burden,
determinants and current policies. Globalization and Health, Vol. 7, pp. 44, 2011.
18. Mathers CD, Boerma T, Ma Fat D. Global and regional causes of death. Br Med Bull, Vol. 92, pp.7–32, 2009.
19. C.J. Hospedales, T.A. Samuels, R. Cummings, G. Gollop, and E. Greene. Raising the priority of chronic
noncommunicable diseases in the Caribbean. Rev Panam Salud Publica, Vol. 30, pp. 393–400, 2011.
20. A.O. Abdulkadri, C. Cunningham-Myrie, and T. Forrester. Economic burden of diabetes and hypertension in
CARICOM states. Soc Econ Stud., Vol. 58, pp.175–97, 2009.
21. World Health Organization. Preventing Chronic Diseases a vital investment. Geneva, WHO; 2005.
22. World Health Organization. Global Burden of Disease 2004 Update. Geneva, WHO; 2008.
23. Planning Institute of Jamaica. Economic and Social Survey of Jamaica, 1988-2012. Kingston: PIOJ.
24. Statistical Institute of Jamaica (STATIN). (1999-2013) Demographic statistics, 1999-2012. Kingston: STATIN;
1989-2013.
25. Statistical Institute of Jamaica (STATIN). 2011 Census of Population and Housing report. Kingston: STATIN;
2012.
26. Statistical Department, Jamaica Constabulary Force (JCF). Murder statistics, 2000-2011. Kingston: JCF; 2000-
2011.
27. S.M Smith, and G. Mensah. Population aging and implications for epidemic cardiovascular disease in Sub-
Saharan Africa. Ethn Dis Vol. 13, pp. S77-S80, 2003.
28. P.A. Bourne, C. Francis, C. Sharpe-Pryce, A.H. Davis, and I. Solan. Diabetes, Hypertension, Arthritis and Other
Chronic Non-communicable Diseases in an English-speaking Caribbean Nation: A Health Perspective. J
Endocrinol Diab Vol. 1, Issue 1, pp. 12, 2014.
29. A. Niakara, L.V. Nebie, N.M. Zagre, N.A. Ouedraogo, and AC Megnigbeto. Knowledge of an urban population
about arterial hypertension: prospective study carried out in Ouagadougou, Burkina Faso. Bull Soc Pathol Exot,
Vol. 96, pp. 219-222, 2003.
Open Access Journal
Indian Journal of Medical Research and Pharmaceutical Sciences June 2014;1(1) ISSN: 2349 – 5340
© Indian Journal of Medical Research and Pharmaceutical Sciences http://www.ijmprs.com/ [25-42]
30. World Health Organization. Good Health Adds Life to Years: Global Brief for World Health Day 2012.
Geneva: WHO; 2012.
31. T.Yamada, , C.C. Chen, I.M. Chiu, and S.W. Rizvi. Non-Communicable Diseases in Developing Countries:
Causes and Health Policy/Program Assessments. J Trop Dis Vol. 1, pp. 117, 2013.
32. P.A. Bourne, C. Francis, C. Sharpe-Pryce, A. Hudson-Davis, I. Solan, and O. Watson-Coleman. Epidemic of
non-communicable diseases in Jamaica: Monsters awoken from lifestyle. Oalib Vol. 1, pp. 1-16, 2014.
33. G. Draper, G. Turrell, and B Oldenburg. Health Inequalities in Australia: Mortality. Health Inequalities
Monitoring Series No. 1. AIHW Cat. No. PHE 55. Canberra: Queensland University of Technology and the
Australian Institute of Health and Welfare; 2004.
34. E. Annandale, and K Hunt. Gender inequalities in health. Buckingham: Open University Press; 2000.
35. E. Cameron, and J Bernardes. Gender and disadvantage in health: men’s health for a change. In: Bartley M,
Blane D & Davey Smith G (Eds). The sociology of health inequalities. Oxford: Blackwell, pp. 115–34, 1998.
36. N. Hart. Sex, gender and survival: inequalities of life chances between European men and women. In: J Fox
(Ed.). Health inequalities in European Countries. Aldershot: Gower Publishing, pp. 109–141, 1989.
37. C. Mathers. Health differential among adult Australians aged 25–64 years. Australian Institute of Health and
Welfare: Health Monitoring Series No. 1. Canberra: AGPS; 1994.
38. C. Mathers. Health differentials among older Australians. Australian Institute of Health and Welfare: Health
Monitoring Series No. 2. Canberra: AGPS; 1994.
39. C. Mathers. Health differentials among Australian children. Australian Institute of Health and Welfare: Health
Monitoring Series No 3. Canberra: AGPS; 1995.
40. C. Mathers. Health differentials among young Australian adults. Australian Institute of Health and Welfare:
Health Monitoring Series No. 4. Canberra: AGPS; 1996.
41. C. Mathers, T. Vos, and C. Stevenson. The burden of disease and injury in Australia. AIHW Cat. No. PHE 17.
Canberra: AIHW; 1999.
42. T. Dyson. The Role of the Demographic Transition in the Process of Urbanization. Population and
Development Review, Vol. 37, pp. 35-54, 2011.
43. M.R. Haines. The Urban Mortality Transition in the United States, 1800-1940. NBER Historical Working Paper
#134; 2001.
44. K.A. Lynch. Individuals, Families and Communities in Europe, 1200-1800. Cambridge: Cambridge University
Press; 2003.
45. L.H. Lees, and P.M. Hohenberg. Urban Decline and Regional Economies: Brabant, Castile, and Lombardy,
1550-1750. Comparative Studies in Society and History, Vol. 31, Issue 3, pp. 439-461, 1989.
46. E.A. Wrigley. Urban Growth and Agricultural Change: England and the Continent in the Early Modern Period.
Journal of Interdisciplinary History, Vol. 15, Issue 4, pp. 683-728, 1985.
47. Bandyopadhyay S, Green E. Urbanization and mortality decline. Population Seminar Series and Oxford
University (CSAE), November 25, 2013.
48. L.A. Gavrilov, and N.S. Gavrilova. The Biology of Life Span: A Quantitative Approach. New York: Harwood
Academic Publisher; 1991.
Author Biblography
Paul Andrew Bourne
Paul Bourne is a health demographer and epidemiologist who
has published over 130 scholarly articles in various peer
reviewed journals including Journal of Men’s Health. Among his
accomplishment is a study to examine female hairstyle
professional in the Jamaica Constabulary Force (JCF). The
research was used to formulate a policy on the professional
appearance of female officers in the JCF.
Email: [email protected]
s