Polyphenols and Volatiles in Fruits of Two Sour Cherry Cultivars, Some Berry Fruits and Their Jams
Upload
independentCategory
view
0download
0
ORIGINAL PAPER
Mathematical modelling of the accumulation of carbohydratesand organic acids throughout the ripening process of Hungariansour cherry cultivars
G. Ficzek • M. Ladanyi • G. Vegvari •
M. Toth
Received: 18 August 2014 / Revised: 24 November 2014 / Accepted: 19 January 2015 / Published online: 1 February 2015
� Springer-Verlag Berlin Heidelberg 2015
Abstract
Key message Changes in sugar and acid content of
Hungarian sour cherries during the ripening period can
be described by a mathematical model.
Abstract The Hungarian sour cherry cultivars can be
utilised not only as raw material for the food industry, but
also for fresh consumption. Changes in the main sugar and
organic acid components in the fruit of sour cherry culti-
vars bred in Hungary (‘Erdi jubileum’, ‘Erdi b}oterm}o’,
‘Maliga emleke’, ‘Kantorjanosi 3’ and IV-3/48) were
determined with the aid of HPLC analysis at nine sam-
pling dates during the ripening process. The main carbo-
hydrate components of the fruit of the Hungarian
cultivars tested were glucose (48.73–81.57 mg/g), fructose
(30.99–60.26 mg/g) and sucrose (11.67–50.37 mg/g). In
the course of ripening the changes in the glucose and
fructose contents could be described using a saturation
model, and changes in the sucrose content with an expo-
nential model. The main organic acid components were
malic acid (220.38–382.72 mg/g), succinic acid
(104.54–209.90 mg/g), tartaric acid (89.04–182.01 mg/g)
and ascorbic acid (4.60–17.49 mg/g). In general the
decrease in the organic acid components could be descri-
bed using a decreasing saturation model, while the vitamin
C content either increased in the course of ripening
according to a logistic model or exhibited a decline that
could be described with a quadratic function. Conse-
quently, there were substantial differences in the sugar and
acid profiles of the various Hungarian sour cherry cultivars,
some of which can be recommended for use as parents in
breeding for better chemical quality.
Keywords Prunus cerasus L. � Fruit development �HPLC � Regression model
Introduction
The consumption of sour cherries (Prunus cerasus L.) is of
considerable importance due to their suitability for pro-
cessing, their extremely favourable composition and par-
ticularly their beneficial effect on human health. Their
favourable dietary effect can be attributed not only to their
high content of polyphenols, flavonoids and anthocyanins
(Chaovanalikit and Wrolstad 2004; Kirakosyan et al. 2009;
Khoo et al. 2011), but also to the average or above-average
quantities of minerals (K, Ca, Mg, Fe, Cu, Zn, Mn)
(Mester-Ficzek et al. 2008).
The growing conditions in the Carpathian Basin are
ideally suited to the ecological requirements of sour cher-
ries, as is clear from the large number of landraces and the
wide variety of forms presented by the cultivars. Crossing
and regional selection have resulted in numerous Hungar-
ian sour cherry cultivars, which have also been tested in
Communicated by E. Priesack.
G. Ficzek (&) � M. Toth
Department of Pomology, Faculty of Horticultural Sciences,
Corvinus University of Budapest, Villanyi ut 29-43,
1118 Budapest, Hungary
e-mail: [email protected]
M. Ladanyi
Department of Mathematics and Informatics, Faculty of
Horticultural Sciences, Corvinus University of Budapest,
Villanyi ut 29-43, 1118 Budapest, Hungary
G. Vegvari
Department of Soil Science and Water Management, Faculty of
Horticultural Sciences, Corvinus University of Budapest,
Villanyi ut 29-43, 1118 Budapest, Hungary
123
Trees (2015) 29:797–807
DOI 10.1007/s00468-015-1159-6

other countries in Europe and America. In addition to a
number of advantageous cultivar traits (e.g. self-fertility),
the Hungarian cultivars also have outstanding anthocyanin
content, while their anthocyanin profile is completely dif-
ferent from that of West European and American cultivars
(Ficzek et al. 2011). An important aim of further breeding
is to improve the fruit quality and the beneficial health
effects, which will require an expansion of the basic
breeding materials. The breeding value of certain Hun-
garian sour cherry cultivars (‘Erdi b}oterm}o’, ‘Ujfehertoi
furtos’) has also been recognised in the USA (Wang et al.
2000; Iezzoni et al. 2005).
The quantity and ratio of carbohydrate and acid com-
ponents determine the flavour of the fruit and the nature of
the products manufactured from them. The chemical
components in the ripe fruit have been proved to differ
from one cultivar to another (Scalzo et al. 2005; Dragovic-
Uzelac et al. 2007), while the findings of Poll et al. (2003)
and Steger-Mate et al. (2010) have shown that they also
depend on the stage of maturity. Whether the end-use will
be fresh consumption or industrial processing, it is thus
important to monitor the accumulation of primary photo-
synthetic metabolites over the course of ripening. The
growth of stone fruits can be described by a double sigmoid
curve consisting of growth stages I–III (Tukey 1934). In
stage I intensive cell division results in a substantial rate of
growth, after which the hardening of the endocarp during
stage II is accompanied by slower growth. In stage III,
which is again characterised by intensive growth, carbo-
hydrates are accumulated and ripening processes begin.
The biological productivity of the cultivars is thus influ-
enced not only by the increase in fruit size, but also by the
accumulation of primary photosynthetic metabolites.
Information is available on the sugar and acid composition
of various fruit species and cultivars at harvest maturity
(Souci et al. 2008), but few data have been published on
how these parameters change in the course of ripening.
Changes in the sugar components during fruit development
were studied in ‘Golden Delicious’ apples by Beruter and
Kalberer (1983) and in ‘Suncrest’ peaches by Genard et al.
(1996). Walker et al. (2011) monitored changes in the
soluble carbohydrate components of the sweet cherry cul-
tivar ‘Durone Nero II’ during fruit development, while Gao
et al. (2003) determined the transport of sorbitol in
‘Montmorency’ as the fruit developed, but changes in the
sugar and acid components during the ripening process
have not yet been analysed in sour cherry.
The aim of the present research was to determine the
main carbohydrate and organic acid components and to
construct a mathematical model of their accumulation
throughout the ripening process in experiments involving
Hungarian sour cherry cultivars that have not previously
been analysed.
Materials and methods
Fruit materials
The fruit examined in 2008 were harvested from 10-
12-year-old trees of the cultivars ‘Erdi jubileum’, ‘Erdi
b}oterm}o’, ‘Maliga emleke’ and ‘Kantorjanosi 3’ and the
prospective cultivar IV-3/48, grown in the experimental
orchard of the Fruitculture Research Institute of the
National Agricultural Research and Innovation Centre in
Erd-Elvira (Table 1). Fruit samples were taken from the
north, south, east and west sides of four trees of each
genotype. Samples were taken on a total of nine occasions
from growth stage III, i.e. from the start of fruit colouring,
until the over-ripe stage (Table 2). The maturity optimum
was determined by fruit removal force and analytical
measurements in a parallel study carried out also in Erd-
Elvira by Kallay et al. (2010a, b). The 75–80 % maturity
was considered to be optimal for the processing industry,
and it was reached at the 7th sampling date.
Reagents and solutions
Glucose (CAS No. [50-99-7]), fructose (CAS No. [57-48-
7]) and sucrose (CAS No. [57-50-1]) of analytical purity,
and malic acid (CAS No. [97-67-6]), succinic acid (CAS
No. [110-15-6]), fumaric acid (CAS No. [110-17-8]),
ascorbic acid (CAS No. [50-81-7]) and tartaric acid (CAS
No. [526-83-0]) standards were obtained from the Sigma
Aldrich Chemical Co. The water used as solvent was pre-
pared using a MILLEX water purification system, with a
final Millipore filter size of 0.22 lm. The standards were
dissolved in water and injected into the HPLC equipment
after repeated filtration.
HPLC equipment
The WATERS (Milford, MA, 01757, USA) HPLC system
had the following components: a 1525 Binary HPLC pump,
a column thermostat, a 717plus autosampler (set to 5 �C)
and an in line degasser, and was powered by EMPOWER
TM2 software.
Sample preparation
The flesh of the fruit samples (1,000 g) was homogenised
in a food processor and stored at -25 �C until required. For
the measurements, 100 lg of each sample was placed in an
Eppendorf tube and diluted with water to 1 ml. In the
course of sugars and acids extraction the samples were kept
in the dark at 4 �C, and dissolving was assisted using an
ultrasonic bath for 4 min The samples were then centri-
fuged at 4 �C at 15,000 rpm in a Hettich Mikro 22R
798 Trees (2015) 29:797–807
123
ultracentrifuge, after which the supernatant was passed
through a 0.45 lm Millipore Syringe Filter Unit SLHN-13.
The samples thus obtained were injected into the HPLC
system.
Sugar analysis
A WATERS 2414 Refractive Index Detector was installed,
with the cell temperature set to 40 �C. Chromatographic
separation was performed on a WATERS Sugar-PakI col-
umn (300 mm 9 6.5 mm ID), tempered to 90 �C. The
sampling frequency was 10/s with a sensitivity of 256. The
mobile phase was water, in which 50 mg/l Ca-EDTA (cal-
cium disodium ethylene diamine tetraacetate) was dissolved.
The flow rate was 0.5 cm3/min, resulting in a pressure of
450 ± 20 psi on the column. The injected sample quantity
was 20 ll, with a running time of 30 min. The retention
times of the individual components were as follows: sucrose
8.6 min, glucose 10.3 min, fructose 12.2 min.
Organic acid determination
A WATERS 2487 Dual Absorbance UV/VIS Detector
was installed. The individual components were separated
using a Shodex RSpak KC-811 organic acid column and
a Shodex KG-G precolumn (tempered to 40 �C). The
mobile phase was water containing 0.1 % phosphoric
acid, purified prior to use with a Millipore filter (pore
size 0.45 lm). The flow rate was 1 ml/min, leading to a
pressure of 600 ± 25 psi on the column. The injected
sample quantity was 20 ll and the running time 15 min.
Detection took place at a wavelength of 220 nm, with
the exception of vitamin C, which was detected at
260 nm. The sampling frequency was 10/s. The retention
times of the standards were as follows: malic acid
7.6 min, succinic acid 8.7 min, tartaric acid 7.2 min,
ascorbic acid 7.9 min.
Statistical analysis
Changes in the sugar and acid components of sour cherry
cultivars during ripening were modelled using non-linear
regression with the least squares method. The explained
variances (R2) were calculated, and the models and their
parameters were tested using ANOVA and Student’s t test,
respectively. The normality of the residuals was verified
using the Kolmogorov–Smirnov test with Lillieford cor-
rection at the p[ 0.1 level (Table 3).
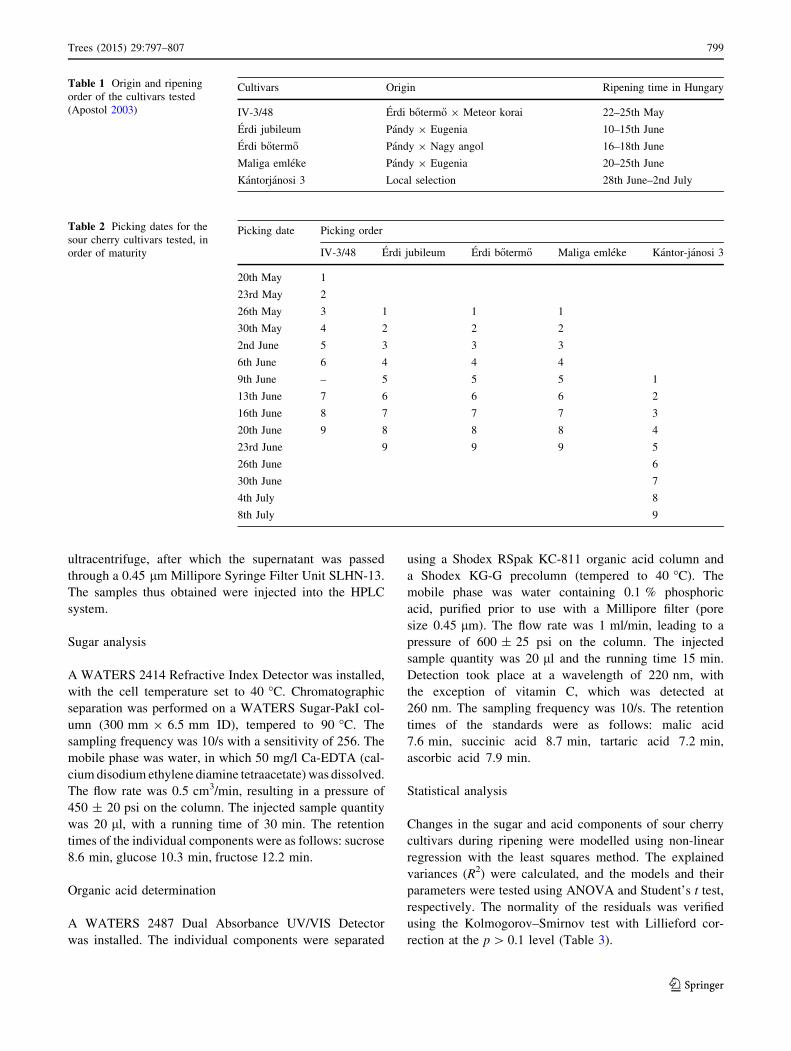
Table 1 Origin and ripening
order of the cultivars tested
(Apostol 2003)
Cultivars Origin Ripening time in Hungary
IV-3/48 Erdi b}oterm}o 9 Meteor korai 22–25th May
Erdi jubileum Pandy 9 Eugenia 10–15th June
Erdi b}oterm}o Pandy 9 Nagy angol 16–18th June
Maliga emleke Pandy 9 Eugenia 20–25th June
Kantorjanosi 3 Local selection 28th June–2nd July
Table 2 Picking dates for the
sour cherry cultivars tested, in
order of maturity
Picking date Picking order
IV-3/48 Erdi jubileum Erdi b}oterm}o Maliga emleke Kantor-janosi 3
20th May 1
23rd May 2
26th May 3 1 1 1
30th May 4 2 2 2
2nd June 5 3 3 3
6th June 6 4 4 4
9th June – 5 5 5 1
13th June 7 6 6 6 2
16th June 8 7 7 7 3
20th June 9 8 8 8 4
23rd June 9 9 9 5
26th June 6
30th June 7
4th July 8
8th July 9
Trees (2015) 29:797–807 799
123

Table 3 Regression models and their parameters
Model Parameters
Increasing or decreasing saturation model Y = p0 ? p1(1 - exp
(-p2 9 X)) ? eWhere p0 = Y(0),
p0 ? p1 = limX???Y(X), i.e. the saturation value
p1p2 = slope at point X = 0,
(p2[ 0 in increasing model while p2\ 0 in decreasing model)
X—picking as independent variable
e—normally distributed error term with zero expectation
Quadratic model: Y = p0 ? p1 9 X ? p2 9 X2 ? e Where pi are the coefficients of Xi (i = 1, 2, 3)
Exponential model: Y = p0 9 exp (p1 9 X) ? e Where p0 = Y(0)
p0p1 = slope at point X = 0
Inverse model: Y = p0 ? (p1/X) ? e Where p0 = limX???Y(X)
-p1 = slope at point X = 1
p0 ? p1 = Y(1)
Logistic model: Y = p0 ? (p1 - p0)/(1 ? exp (-p2 9 (x - p3))) ? e Where p0 = limX?-?Y(X)
p1 = limX???Y(X), i.e. the saturation value
The model has an inflexion point at X = p3 with slope value
(p1 - p0)p2
Table 4 The content of the
sugar components in sour cherry
cultivars throughout the
ripening period (picking dates
1–9)
Different letters are for
significantly different cultivars
groups within the same picking
time, according to Tukey’s post
hoc test (p\ 0.05)
Picking IV-3/48 Erdi jubileum Erdi b}oterm}o Maliga emleke Kantor-janosi 3
Glucose (mg/g)
1 26.86 a 46.72 cd 41.80 b 42.41 bc 48.34 d
2 38.22 a 56.64 c 54.53 c 43.83 ab 48.54 b
3 55.11 b 68.27 c 53.19 b 44.55 a 48.78 ab
4 64.47 c 67.16 c 53.73 b 41.6 ab 43.14 ab
5 66.16 b 64.27 b 55.21 a 47.83 a 50.96 a
6 66.71 c 72.02 c 56.42 b 49.80 ab 48.94 a
7 65.08 c 81.57 d 57.21 b 48.73 a 54.69 ab
8 68.26 b 82.99 c 67.86 b 49.73 a 52.94 a
9 68.60 bc 75.93 c 67.76 b 57.71 a 57.34 a
Fructose (mg/g)
1 13.60 a 41.66 c 21.69 b 20.12 b 37.99 c
2 23.95 a 52.09 c 35.46 b 25.12 a 37.72 b
3 38.46 b 44.45 c 37.76 b 23.02 a 37.69 b
4 45.58 c 53.35 d 41.38 c 28.65 a 34.18 b
5 46.93 bc 50.78 c 41.85 b 25.83 a 44.73 bc
6 46.44 c 55.69 d 44.26 c 31.12 a 37.25 b
7 44.74 b 60.26 c 44.28 b 30.99 a 40.26 b
8 48.69 b 61.84 d 48.80 c 32.99 a 39.85 b
9 48.69 b 56.79 c 48.80 b 38.27 a 34.55 c
Sucrose (mg/g)
1 2.83 a 17.83 d 6.84 b 7.66 b 14.59 c
2 4.32 a 29.46 d 12.71 c 7.66 b 14.58 c
3 7.71 a 24.56 d 12.03 b 6.55 a 14.56 c
4 12.56 ab 33.45 c 14.00 b 10.25 a 10.77 a
5 14.45 b 33.88 c 14.10 b 8.14 a 15.01 b
6 15.42 b 39.82 c 15.53 b 11.46 a 13.25 ab
7 15.64 b 50.16 c 16.54 b 11.67 a 14.96 ab
8 17.64 b 50.37 c 20.12 b 12.70 a 16.94 b
9 17.98 a 48.05 c 20.20 b 16.97 a 17.63 a
800 Trees (2015) 29:797–807
123

Since the amount of carbohydrates and organic acids
(expressed by seven indices) are dependent variables, it
was reasonable to run a two-way multivariate ANOVA
(MANOVA) model with factors ‘species’ (5 levels) and
‘picking time’ (9 levels). Normality of the residuals was
accepted by their skewness and kurtosis (Tabachnick and
Fidell 2007). Homogeneity of variances was checked by
Levene’s test (p[ 0.05). Given the significance of the
overall test, the univariate main effects were examined and
the treatment means were separated by Tukey’s post hoc
test. All statistical procedures were conducted using the
software IBM SPSS 21.
Results
Two-way MANOVA revealed a significant multivariate
main effect both for species and picking time (Wilk’s
k\ 0.001, p\ 0.001 in both cases). Significant univariate
main effects were obtained for each (sugar and acid)
variables and for both factors [Fspecies (4, 90) = 270,
p\ 0.001; Fpicking (8, 90) = 9.6, p\ 0.001]. Significant
pairwise differences according to Tukey’s post hoc test are
represented in Tables 4 and 6 (p\ 0.05).
Sugar composition and accumulation in the fruit
Changes in the main sugar components, glucose, fructose and
sucrose with the regarding homogenous groups throughout the
ripening process are illustrated in Table 4. Of the nine sam-
pling dates, the 7th, equivalent to 75–80 % maturity, meets the
requirements of the most important processing end-use (bot-
tled fruit). The results indicated that the quantity of the indi-
vidual carbohydrate components increased in the course of
ripening, though the rate of increase differed both for the
cultivars and the individual sugar components.
Table 5 Estimated model
parameters for the saturation of
the sugar components during
ripening, their significance level
and the F values of the ANOVA
tests for the models with their
significance level and the
explained variance (R2)
Models, estimated values of the
parameters, t values belonging
to each parameter, ANOVA
F values for each model, and the
value of the coefficient of
determination (R2)
* Significant at the p\ 0.001
level
Cultivar Model Parameters t F R2
Glucose
IV-3/48 Increasing saturation p0 24.96 12.76 2,548.23 0.95*
p1 44.63 20.52
p2 0.54 7.99
Erdi jubileum Increasing saturation p0 47.95 18.99 1,847.90 0.83*
p1 35.87 7.60
p2 0.27 2.91
Kantorjanosi 3 Increasing saturation p0 46.03 29.47 2,094.99 0.54
p1 11,216.66 0.00
p2 9.81E-05 0.00
Fructose
IV-3/48 Increasing saturation p0 12.16 7.84 1,983.18 0.95*
p1 36.84 21.57
p2 0.57 8.57
Erdi jubileum Increasing saturation p0 43.30 21.25 1,535.83 0.66*
p1 25.10 1.82
p2 0.14 1.03
Erdi b}oterm}o Increasing saturation p0 23.10 17.95 2,771.46 0.92*
p1 24.58 16.64
p2 0.47 6.27
Sucrose
IV-3/48 Increasing saturation p0 1.84 3.27 1,304.09 0.96*
p1 19.96 13.21
p2 0.22 5.74
Erdi jubileum Exponential p0 21.42 21.46
p1 0.12 12.22 149.41 0.86*
Erdi b}oterm}o Exponential p0 9.14 19.84
p1 0.01 10.16 103.26 0.81*
Maliga emleke Exponential p0 6.66 20.12
p1 0.01 9.52 90.57 0.78*
Trees (2015) 29:797–807 801
123

The main sugar component in the fruit tested was glu-
cose, which was detected in the largest quantities in ‘Erdi
jubileum’ at all the harvest dates. At the 7th sampling date
the glucose quantity was 20 % lower in IV-3/48 than in
‘Erdi jubileum’, followed in decreasing order by ‘Erdi
b}oterm}o’, ‘Kantorjanosi 3’ and ‘Maliga emleke’. The
changes in the glucose content during ripening were
characterised by an initial intensive rise, which was close
to saturation point by the 7th sampling date, after which
little change was observed. Of the five cultivars tested, the
changes in three could be described using a saturation
model, with extremely high R2 values for IV-3/48 and ‘Erdi
jubileum’ (Table 5). The data recorded for the latter cul-
tivar are illustrated in Fig. 1.
In the case of sour cherry the sweet taste of the fruit can
be attributed not only to glucose, but also to fructose. At all
the picking dates the highest fructose content was mea-
sured in the fruit of ‘Erdi jubileum’. At the 7th sampling
date the fructose content was approx. 30 % lower in ‘Erdi
b}oterm}o’ and ‘Kantorjanosi 3’ and 50 % lower in ‘Maliga
emleke’ than in ‘Erdi jubileum’. An intensive increase in
the fructose level was observed in the latter cultivar even in
the over-ripe stage (Table 4). The changes over the rip-
ening period could be described with a saturation curve for
three cultivars (IV-3/48, ‘Erdi jubileum’, ‘Erdi b}oterm}o’),
two of which had R2 values in excess of 0.9 at the
p\ 0.001 level (Table 5). The fructose content of the fruit
was shown by the model to approach the saturation point
by the 7th sampling date. The model fitted for genotype IV-
3/48 is presented as an example in Fig. 2.
The highest sucrose content was observed in ‘Erdi ju-
bileum’, while the fruit of the other cultivars only con-
tained small quantities of this sugar component (Table 4).
For three cultivars the changes in sucrose content during
ripening could be described with an exponential model,
with very high R2 values significant at the p\ 0.001 level
(Table 5). The data recorded for ‘Erdi b}oterm}o’ are illus-
trated in Fig. 3.
Acid composition and accumulation of sour cherries
Changes in the four organic acid components measured
(malic acid, succinic acid, tartaric acid, ascorbic acid) with
regard to the homogenous groups are presented in Table 6.
In general the quantity of the acid fractions in the fruit of
all the cultivars exhibited a decline throughout the ripening
period, but the intensity of the decrease varied as a function
of the acid component and the cultivar.
The main acid component was malic acid. At the 7th
sampling date the highest, very similar malic acid con-
tents were recorded in the fruit of ‘Kantorjanosi 3’ and
‘Erdi jubileum’, with 20 and 30 % lower values in ‘Ma-
liga emleke’ and ‘Erdi b}oterm}o’, respectively. The lowest
malic acid content was recorded for genotype IV-3/48
(Table 6). Changes in the malic acid content of three
cultivars could be described using a saturation model.
Fig. 1 Glucose content in the fruit of ‘Erdi jubileum’ and the
saturation model fitted to the data
Fig. 2 Fructose content in the fruit of IV-3/48 and the saturation
model fitted to the data
Fig. 3 Sucrose content in the fruit of ‘Erdi b}oterm}o’ and the
exponential model fitted to the data
802 Trees (2015) 29:797–807
123

Unusually, in the case of IV-3/48 intensive malic acid
biosynthesis was only detected until the 5th sampling
date, when the level approached the saturation value, after
which little change was observed (R2 = 0.896). In the
fruit of ‘Erdi b}oterm}o’ and ‘Kantorjanosi 3’ a decreasing
saturation model could be fitted to the malic acid data,
which declined gradually until the saturation value was
approached (Table 7). Figure 4 illustrates the model
found for ‘Kantorjanosi 3’.
Succinic acid was found in the largest quantities in
‘Kantorjanosi 3’ and ‘Erdi jubileum’ and in the smallest
amounts in ‘Maliga emleke’, ‘Erdi b}oterm}o’ and IV-3/48 at
the 7th picking date (Table 6). In ‘Erdi b}oterm}o’ (Fig. 5)
and ‘Kantorjanosi 3’ the changes during the ripening pro-
cess could be described by an inverse function, with an
initial rapid decline that gradually slowed, while a
decreasing saturation model could be used to describe the
changes in ‘Maliga emleke’ (Table 7).
Table 6 The content of the
acid components in sour cherry
cultivars throughout the
ripening period (picking dates
1–9)
Different letters are for
significantly different cultivars
groups within the same picking
time, according to Tukey’s post
hoc test (p\ 0.05)
Picking IV-3/48 Erdi jubileum Erdi b}oterm}o Maliga emleke Kantor-janosi 3
Malic acid (mg/100 g)
1 108.06 a 369.65 c 357.62 c 283.43 b 351.92 c
2 120.67 a 370.89 c 356.98 c 282.43 b 451.81 d
3 181.83 a 386.96 d 337.42 c 272.62 b 442.27 e
4 199.97 a 328.67 b 307.67 b 335.97 b 422.37 c
5 229.12 a 350.40 c 301.26 b 321.40 bc 381.72 d
6 218.88 a 352.07 c 287.72 b 328.11 c 393.58 d
7 220.38 a 365.64 c 252.07 a 317.01 b 382.72 c
8 218.64 a 352.79 c 288.13 b 290.48 b 357.36 c
9 217.97 a 278.78 b 287.47 b 233.43 a 376.99 c
Succinic acid (mg/100 g)
1 103.49 a 189.49 b 257.03 c 194.86 b 241.74 c
2 101.49 a 172.03 b 206.18 c 197.86 c 308.94 d
3 128.67 a 181.65 b 182.80 b 186.59 b 292.89 c
4 115.91 a 142.55 b 160.38 b 215.74 c 244.30 d
5 121.37 a 127.48 ab 143.43 b 195.25 c 206.75 c
6 117.82 a 204.43 d 151.41 b 175.99 c 208.79 d
7 104.54 a 192.39 d 128.00 b 168.37 c 209.90 e
8 117.14 a 197.01 c 136.47 b 137.53 b 183.57 c
9 118.47 a 131.16 b 135.81 b 160.69 c 181.21 d
Tartaric acid (mg/100 g)
1 27.10 a 231.95 c 177.62 b 162.68 b 173.46 b
2 36.03 a 212.59 c 195.07 c 163.04 b 213.23 c
3 71.88 a 218.48 c 159.05 d 128.00 b 179.07 c
4 73.52 a 170.57 c 163.02 c 134.23 b 172.39 c
5 88.55 a 186.13 c 172.05 c 133.54 b 141.83 b
6 99.65 a 195.54 d 170.94 c 137.41 b 143.61 b
7 89.04 a 182.01 c 126.00 b 135.00 b 134.21 b
8 81.63 a 186.89 c 136.66 b 132.47 b 123.87 b
9 77.97 a 167.65 d 123.36 b 139.54 c 143.93 c
Ascorbic acid (mg/100 g)
1 6.41 a 12.70 b 7.16 a 19.67 c 24.42 d
2 7.07 a 11.12 b 12.86 c 10.44 b 25.56 d
3 11.39 b 13.58 c 13.39 c 9.62 a 23.03 d
4 12.76 b 14.59 c 10.17 a 9.50 a 21.41 d
5 12.72 b 16.60 c 7.89 a 8.50 a 17.57 c
6 15.99 c 16.70 c 9.76 b 4.22 a 17.26 c
7 17.49 d 16.41 c 8.75 b 4.60 a 16.46 d
8 15.77 c 19.81 d 10.02 b 5.20 a 16.20 c
9 16.07 c 19.21 d 9.96 b 5.92 a 17.46 cd
Trees (2015) 29:797–807 803
123

Table 7 Estimated model
parameters for changes in acid
components during ripening,
their significance level and the
F values of the ANOVA tests
for the models with their
significance level and the
explained variance (R2)
Models, estimated values of the
parameters, t values belonging
to each parameter, ANOVA
F values for each model, and the
value of the coefficient of
determination (R2)
* Significant at the p\ 0.001
level
Cultivar Model Parameters t F R2
Malic acid
IV-3/48 Increasing saturation p0 97.36 11.97
p1 132.25 14.13
p2 0.46 5.33 1,553.23 0.90*
Erdi b}oterm}o Decreasing saturation p0 366.28 46.68
p1 -97.71 -5.69
p2 0.25 2.33 3,530.04 0.79*
Kantorjanosi 3 Decreasing saturation p0 488.99 21.60
p1 -141.59 -6.92
p2 0.25 1.77 3,642.45 0.74*
Succinic acid
Maliga emleke Decreasing saturation p0 146.6 18.81
p1 65.93 3.51
p2 0.23 1.45 1,315.85 0.61*
Erdi b}oterm}o Inverse p0 121.64 13,575.00
p1 143.78 18.24 332.55 0.93*
Kantorjanosi 3 Inverse p0 149.54 21.77
p1 349.94 13.23 175.05 0.89*
Tartaric acid
IV-3/48 Quadratic model p0 0
p1 28.34 30.64
p2 -2.2 30.65 1,688.47 0.99*
Erdi jubileum Decreasing saturation p0 232.49 30.66
p1 -57.751 30.67
p2 0.373 30.68 1,638.86 0.62*
Erdi b}oterm}o Exponential p0 188.23 30.69
p2 -29,304.18 41,850.00 49.53 0.66*
Maliga emleke Decreasing saturation p0 166.09 30.71
p1 -32.12 30.72
p2 0.76 30.73 2,059.04 0.57*
Kantorjanosi 3 Decreasing saturation p0 264.96 30.74
p1 -135.69 30.75
p2 0.47 30.76 2,027.03 0.89*
Ascorbic acid
IV-3/48 Logistic p0 3.49 1.12
p1 16.66 27.17
p2 0.73 2.90
p3 2.89 41,730.00 954.05 0.93*
Erdi jubileum Logistic p0 10.45 41,712.00
p1 20.73 6.44
p2 0.47 1.17
p3 4.95 4.42 935.16 0.81*
Erdi b}oterm}o Inverse p0 7.87 13.34
p1 10.84 4.77 22.78 0.51*
Maliga emleke Inverse p0 3.59 8.81
p1 16.03 16.26 264.49 0.91*
Kantorjanosi 3 Inverse p0 13.56 13.85
p1 25.40 28.46 191.70 0.90*
804 Trees (2015) 29:797–807
123

Great variability was detected for the changes in tartaric
acid content (Table 6). Of the five cultivars investigated,
three (‘Erdi jubileum’, ‘Maliga emleke’, ‘Kantorjanosi 3’)
could be described using a decreasing saturation model,
while those of IV-3/48 and ‘Erdi b}oterm}o’ followed a qua-
dratic and an exponential model, respectively (Table 7). The
model fitted to ‘Erdi jubileum’ is illustrated in Fig. 6.
The vitamin C content of the fruit exhibited an increase
during ripening in two cultivars (IV-3/48, ‘Erdi jubileum’)
and a decrease in three (‘Erdi b}oterm}o’, ‘Maliga emleke’,
‘Kantorjanosi 3’). At the 7th sampling date very similar
quantities of vitamin C were measured in the fruit of IV-3/
48, ‘Erdi jubileum’ and ‘Kantorjanosi 3’, while consider-
ably lower values were recorded for ‘Erdi b}oterm}o’ and
‘Maliga emleke’ (Table 6). The cultivars could be divided
into two groups on the basis of changes in the vitamin C
content. The increase could be described with a logistic
model for two cultivars (IV-3/48, ‘Erdi jubileum’), while
the decrease in the other three cultivars (Erdi b}oterm}o’,
‘Maliga emleke’, ‘Kantorjanosi 3’), which was significant
at the p\ 0.001 level, followed an inverse model
(Table 7). The models fitted to IV-3/48 and ‘Maliga em-
leke’ are illustrated in Figs. 7 and 8.
Discussion
Previous studies have dealt mainly with the sugar and acid
components of sour cherries in the harvest maturity stage.
The present results confirm those of Souci et al. (2008),
Fig. 4 Malic acid content in the fruit of ‘Kantorjanosi 3’ and the
decreasing saturation model fitted to the data
Fig. 5 Succinic acid content in the fruit of ‘Erdi b}oterm}o’ and the
inverse model fitted to the data
Fig. 6 Tartaric acid content in the fruit of ‘Erdi jubileum’ and the
decreasing saturation model fitted to the data
Fig. 7 Vitamin C content in the fruit of IV-3/48 and the logistic
model fitted to the data
Fig. 8 Vitamin C content in the fruit of ‘Maliga emleke’ and the
inverse model fitted to the data
Trees (2015) 29:797–807 805
123

Bonerz et al. (2007) and Gao et al. (2003), who found that the
sugar content of the fruit consisted mainly of glucose.
However, the glucose content of the Hungarian cultivars
(49–82 mg/g) exhibited greater diversity than that reported
by Bonerz et al. (2007) and Souci et al. (2008) in the case of
German cultivars (49–52 mg/g). The same was true of the
fructose content, which ranged from 31–60 mg/g in the
present work. The sweet taste of the fruit of ‘Erdi jubileum’
could be attributed not only to its high glucose and fructose
content, but also to the substantial quantity of sucrose. It was
also clear that some of the Hungarian cultivars were superior
to the German and American cultivars in terms of glucose
and fructose content. It can thus be stated that Hungarian sour
cherries have a very varied sugar profile. With respect to the
main sugar components the Hungarian cultivars resemble the
German cultivars, as both contain primarily glucose, fructose
and sucrose, while the main sugar components of the
American cultivar ‘Montmorency’ are glucose, fructose and
sorbitol (Gao et al. 2003). The differences in sugar compo-
sition, the variable sugar profile and the diversity in the fla-
vour balance all confirm the different genetic origin of the
Hungarian sour cherry genotypes.
Functions describing the accumulation of sugar compo-
nents in sour cherries have not previously been determined.
During the characterisation of the sorbitol transporter gene,
Gao et al. (2003) recorded the glucose, fructose and sorbitol
contents of ‘Montmorency’ cherries on eight sampling dates
covering the whole of fruit development (stages I–III). As
the accumulation of photosynthetic pigments is concen-
trated in stage III, the modelling of quantitative changes in
these compounds is only possible if a large number of
samples are taken during this stage. The mathematical
models constructed on the basis of the present work can thus
be regarded as novel results.
The main acid component of the Hungarian sour cher-
ries was malic acid. This is in agreement with the findings
of Poll et al. (2003) and Bonerz et al. (2007), but consid-
erable differences in the quantities were detected between
the cultivars, and this was also true for the other acid
components. The cultivars tested contained similar quan-
tities of succinic and tartaric acid. The majority of the
Hungarian cultivars contained approx. 40 % more vitamin
C than the 12 mg/g value reported by Souci et al. (2008).
The present work therefore identified the special value of
certain Hungarian cultivars in terms of acid content, as well
as being the first to present a mathematical model of
changes in the acid components in the course of ripening.
Conclusions
Hungarian sour cherry cultivars have an extremely varied
sugar and acid profile. Some of these cultivars (e.g. ‘Erdi
jubileum’, ‘Erdi b}oterm}o’, IV-3/48) are not only ideal for
fresh consumption and processing purposes, but can also
be recommended as parental partners in breeding for
improved chemical quality. The fresh fruit of cultivars
with low carbohydrate content (‘Maliga emleke’,
‘Kantorjanosi 3’) can also be included in the diet of dia-
betics. In the present study, changes occurring in the main
carbohydrates and organic acids in the course of ripening
have been described using mathematical models for the
first time. The data obtained in this work will form the
basis for further investigations on the optimum picking
date for processing.
Author contribution statement Sugar and acid composition were
measured with HPLC by G. Vegvari and G. Ficzek. The large part of
the text was written by G. Ficzek, who also prepared the figures.
Statistical analysis and the related part of the text were made by M.
Ladanyi. M. Toth gave useful advices, corrected the text and she was
the supervisor of the research. All authors made a statement to accept
the manuscript.
Acknowledgements Thanks are due to the Fruitculture Research
Institute of the National Agricultural Research and Innovation Centre,
and especially to Dr. Geza Bujdoso and Sandor Szugyi, for providing
the samples. This research was funded by the Regional University
Knowledge Centre—Research and Development in Foodstuff Chain
(Project No. RET-04/2006) and by the TAMOP 4.2.1./B-09/01/KMR/
2010-0005 project. The authors would also like to thank the staff of
WATERS Ltd., Budapest, for their technical advice with the HPLC
analysis.
Conflict of interest The authors declare that they have no com-
peting interests.
References
Apostol J (2003) Cseresznye- es meggynemesıtes, a fontosabb fajtak
leırasa (Breeding of cherry and sour cherry and description of the
most important cultivars). In: Hrotko K (ed) Cseresznye es
meggy (Cherry and sour cherry). Mez}ogazda Kiado, Budapest,
pp 37–94 (in Hungarian)
Beruter J, Kalberer PP (1983) The uptake of sorbitol by apple fruit
tissue. Z Pflanzenphysiol 110:113–125
Bonerz D, Wurth K, Dietrich H, Will F (2007) Analytical charac-
terization and the impact of ageing on anthocyanin composition
and degradation in juices from five sour cherry cultivars. Eur
Food Res Technol 224(3):335–364
Chaovanalikit A, Wrolstad RE (2004) Anthocyanin and polyphenolic
composition of fresh and processed cherries. J Food Sci
69(1):73–83
Dragovic-Uzelac V, Levaj B, Bursac D, Pedisic S, Radojcic I, Bisko
A (2007) Total phenolics and antioxidant capacity assays of
selected fruits. Agric Conspec Sci 72:279–284
Ficzek G, Vegvari G, Sandor G, Steger-Mate M, Kallay E, Szugyi S,
Toth M (2011) HPLC evaluation of anthocyanin components in
the fruits of Hungarian sour cherry cultivars during ripening.
J Food Agric Environ 9(1):30–35
Gao Z, Maurousset L, Lemoine R, Yoo SD, van Nocker S, Loescher
W (2003) Cloning, expression, and characterization of sorbitol
transporters from developing sour cherry fruit and leaf sink
tissues. Plant Physiol 131:1566–1575
806 Trees (2015) 29:797–807
123

Genard M, Souty M, Reich M, Laurent R (1996) Modelling the
carbon use for sugar accumulation and synthesis in peach fruit.
Acta Hortic 416:121–128
Iezzoni AF, Sebolt AM, Wang D (2005) Sour cherry breeding
program at Michigan State University. Acta Hortic 667:131–134
Kallay E, Szenci Gy, Ficzek G, Steger-Mate M, Bujdoso G, Szugyi S,
Toth M (2010a) Determination of optimal harvest time of sour
cherry varieties by measurement of the actual fruit removing
force and of the main components of inner content (in Hungarian
language). Kertgazdasag 42(3–4):25–33
Kallay E, Ficzek G, Andor D, Steger-Mate M, Boronkay G, Kirilla Z,
Bujdoso G, Vegvari Gy, Toth M (2010b) Variety specific
integrated fruit production development in order to optimize
inner content value. Int J Hortic Sci 16(2):27–31
Khoo GM, Clausen MR, Pedersen BH, Larsen E (2011) Bioactivity
and total phenolic content of 34 sour cherry cultivars. J Food
Comp Anal 24:772–776
Kirakosyan A, Seymour EM, Urcuyo LDE, Kaufman PB, Bolling SF
(2009) Chemical profile and antioxidant capacities of tart cherry
products. Food Chem 115:20–25
Mester-Ficzek M, Kallay E, Steger-Mate M, Lelik L, Bujdoso G, Toth
M (2008) Changes in mineral content of fruits of tart cherry
varieties during maturation period. In: Proceedings of interna-
tional conference on science and technique in the agri- and food
business, pp 159–165
Poll L, Petersen MB, Nielsen GS (2003) Influence of harvest year and
harvest time on soluble solids, titrateable acid, anthocyanin
content and aroma components in sour cherry (Prunus cerasus L.
cv. ‘‘Stevnsbar’’). Eur Food Res Technol 216:212–216
Scalzo J, Politi A, Pellegrini N, Mezzetti B, Battino M (2005) Plant
genotype affects total antioxidant capacity and phenolic contents
in fruit. Nutrition 21:207–213
Souci SW, Fachmann W, Kraut H (2008) Food composition and
nutrition tables 1989/1990. 7th revised and completed edition.
Med. Pharm. Scientific Publishers, Stuttgart
Steger-Mate M, Ficzek G, Kallay E, Bujdoso G, Barta J, Toth M
(2010) Optimising harvest time of sour cherry cultivars on the
basis of quality parameters. Acta Alim 39(1):59–68
Tabachnick BG, Fidell LS (2007) Using multivariate statistics, 5th
edn. Allyn & Bacon, Needham Heights
Tukey HB (1934) Growth of the embryo, seed, and pericarp of the
sour cherry in relation to season of fruit ripening. Proc Am Soc
Hortic Sci 31:125–144
Walker RP, Battistelli A, Moscatello S, Chen ZH, Leegood RC,
Famiani F (2011) Phosphoenolpyruvate carboxykinase in cherry
(Prunus avium L.) fruit during development. J Exp Bot
62(15):5357–5365
Wang D, Karle R, Iezzoni AF (2000) QTL analysis of flower and fruit
traits in sour cherry. Theor Appl Genet 100(3–4):535–544
Trees (2015) 29:797–807 807
123
Copyright © 2022 FDOKUMEN