Mateus Proença Morais Public Banks and Access to ...
56
Mateus Proença Morais Public Banks and Access to Conditional Cash Transfer Programs Dissertação de Mestrado Thesis presented to the Programa de Pós–graduação em Eco- nomia, do Departamento de Economia da PUC-Rio in partial fulfillment of the requirements for the degree of Mestre em Eco- nomia. Advisor: Prof. Juliano Assunção Rio de Janeiro April 2021
-
Upload
khangminh22 -
Category
Documents
-
view
4 -
download
0
Transcript of Mateus Proença Morais Public Banks and Access to ...

Mateus Proença Morais
Public Banks and Access to Conditional CashTransfer Programs
Dissertação de Mestrado
Thesis presented to the Programa de Pós–graduação em Eco-nomia, do Departamento de Economia da PUC-Rio in partialfulfillment of the requirements for the degree of Mestre em Eco-nomia.
Advisor: Prof. Juliano Assunção
Rio de JaneiroApril 2021
DBD
PUC-Rio - Certificação Digital Nº 1913106/CA

Mateus Proença Morais
Public Banks and Access to Conditional CashTransfer Programs
Thesis presented to the Programa de Pós–graduação em Econo-mia da PUC-Rio in partial fulfillment of the requirements for thedegree of Mestre em Economia. Approved by the ExaminationCommittee:
Prof. Juliano AssunçãoAdvisor
Departamento de Economia – PUC-Rio
Prof. Leonardo RezendeDepartamento de Economia – PUC-Rio
Prof. Gabriel UlysseaDepartment of Economics - University College London
Rio de Janeiro, April the 16th, 2021
DBD
PUC-Rio - Certificação Digital Nº 1913106/CA

All rights reserved.
Mateus Proença Morais
B.A. in Economics, Escola de Economia de São Paulo -Fundação Getulio Vargas, 2018
Bibliographic dataMorais, Mateus Proença
Public Banks and Access to Conditional Cash TransferPrograms / Mateus Proença Morais; advisor: Juliano Assun-ção. – 2021.
56 f: il. color. ; 30 cm
Dissertação (mestrado) - Pontifícia Universidade Católicado Rio de Janeiro, Departamento de Economia, 2021.
Inclui bibliografia
1. Economia – Teses. 2. Politicas Públicas. 3. Transfe-rência de Renda. 4. Infraestrutura. 5. Expansão Bancária. I.Assunção, Juliano. II. Pontifícia Universidade Católica do Riode Janeiro. Departamento de Economia. III. Título.
CDD: 620.11
DBD
PUC-Rio - Certificação Digital Nº 1913106/CA

Acknowledgments
To my advisor Juliano Assunção, who guided and disciplined my researchendeavors. His support made this project possible, and his ideas and suggesti-ons arguably improved my research quality. I would also like to thank Profs.Leonardo Rezende and Gabriel Ulyssea for participating in the ExaminationCommittee.
To my parents, Janaina and Silvio, and my sister, Alice, for their love andpatience. Anything I accomplish is yours as well. I can put in words howthankful I am for having you all by my side.
To Arthur Bragança. The time I spent at Climate Policy Initiative (CPI) underyour supervision taught me a lot and made me a better researcher.
To Coordenação de Aperfeiçoamento de Pessoal de Nível Superior - Brasil(CAPES) who financed my Master’s studies and allowed me to dedicate myselfentirely to Research. The financial support from PUC-Rio is also gratefullyacknowledged.
DBD
PUC-Rio - Certificação Digital Nº 1913106/CA

Abstract
Morais, Mateus Proença; Assunção, Juliano (Advisor). PublicBanks and Access to Conditional Cash Transfer Programs.Rio de Janeiro, 2021. 56p. Dissertação de Mestrado – Departamentode Economia, Pontifícia Universidade Católica do Rio de Janeiro.
In this work, I study public banks’ role in implementing ConditionalCash Transfer Programs (CCTs). Using an entry model with heterogeneousfirms inspired by Bresnahan & Reiss (1991), I can determine how the BolsaFamília program in Brazil impacts Caixa Econômica Federal and other bank’sdecisions differently. I also evaluate whether beneficiaries are able to effectivelyaccess the Bolsa Família program when there is no financial institution intheir municipality. Exploiting variation in bank coverage following a CentralBank resolution, I also find that fewer benefits are withdrawn in municipalitieswithout a bank, causing involuntary cancellations of the program. The resultssuggest that bank coverage is a relevant aspect of the implementation of cashtransfer policies and that public banks can be effective in simultaneouslyimproving access to public policies and financial services.
KeywordsPolicy; Cash Transfer; Infrastructure; Banking Expansion.
DBD
PUC-Rio - Certificação Digital Nº 1913106/CA
Resumo
Morais, Mateus Proença; Assunção, Juliano. Bancos Públicose Acesso à Programas de Transferência Condicionada deRenda. Rio de Janeiro, 2021. 56p. Dissertação de Mestrado –Departamento de Economia, Pontifícia Universidade Católica doRio de Janeiro.
Neste trabalho, estudo o papel dos bancos públicos na implementaçãode Programas de Transferência Condicionada de Renda (CCTs). Usandoum modelo de entrada com firmas heterogêneas inspirado em Bresnahan &Reiss (1991), consigo determinar como o programa Bolsa Família no Brasilimpacta as decisões da Caixa Econômica Federal e de outros bancos de formadiferente. Também avalio se os beneficiários do programa têm acesso efetivoao Bolsa Família quando não há instituição financeira em seu município.Explorando variação na cobertura bancária após uma resolução do BancoCentral, também encontro que menos benefícios são retirados em municípiossem banco, causando cancelamentos involuntários do programa. Os resultadossugerem que cobertura bancária é um aspecto relevante na implementação depolíticas de transferência de renda e que bancos públicos podem ser eficazesna melhoria simultânea do acesso às políticas públicas e a serviços financeiros.
Palavras-chavePoliticas Públicas; Transferência de Renda; Infraestrutura; Expansão
Bancári.
DBD
PUC-Rio - Certificação Digital Nº 1913106/CA
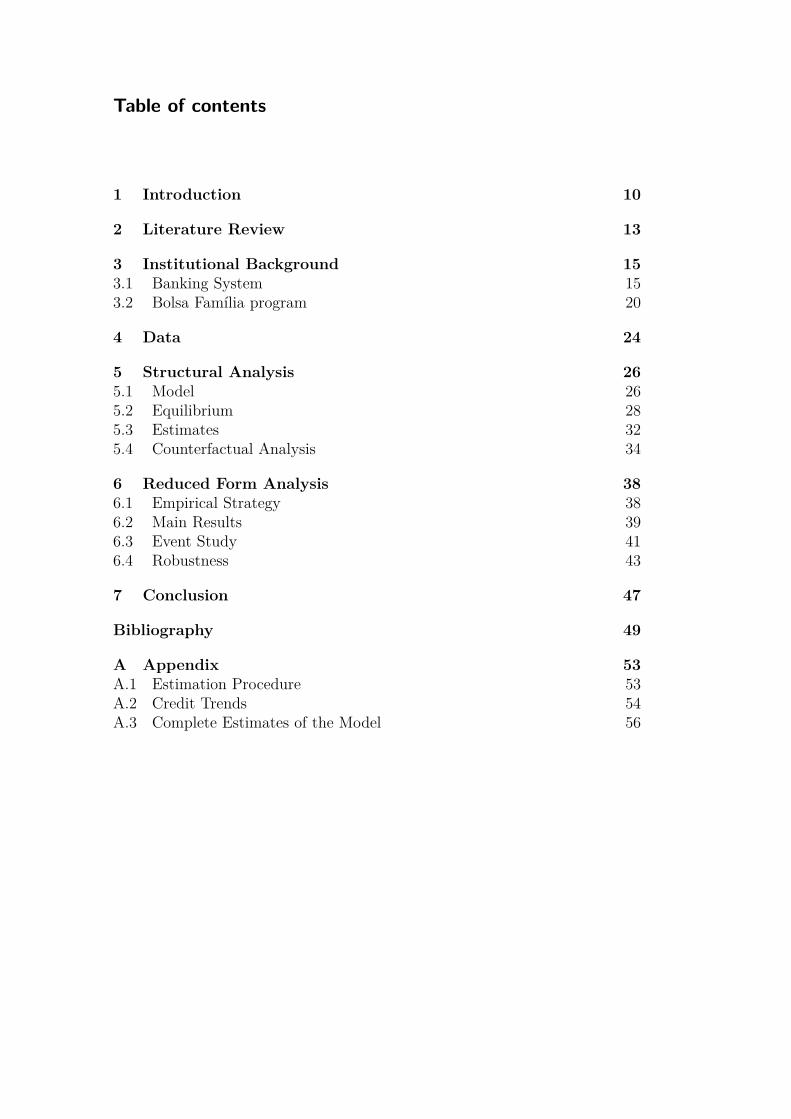
Table of contents
1 Introduction 10
2 Literature Review 13
3 Institutional Background 153.1 Banking System 153.2 Bolsa Família program 20
4 Data 24
5 Structural Analysis 265.1 Model 265.2 Equilibrium 285.3 Estimates 325.4 Counterfactual Analysis 34
6 Reduced Form Analysis 386.1 Empirical Strategy 386.2 Main Results 396.3 Event Study 416.4 Robustness 43
7 Conclusion 47
Bibliography 49
A Appendix 53A.1 Estimation Procedure 53A.2 Credit Trends 54A.3 Complete Estimates of the Model 56
DBD
PUC-Rio - Certificação Digital Nº 1913106/CA

List of figures
Figure 3.1 Banking Expansion by type of bank 16Figure 3.2 Banking Coverage and points of sale by Bank 18Figure 3.3 Credit per Municipality Trends 19Figure 3.4 Credit per Agency Trends 20Figure 3.5 Beneficiaries of the Bolsa Família Program by Region 22
Figure 5.1 Simplified Model Equilibria 29Figure 5.2 Simplified Model Equilibria, Imposing Selection Mecha-
nism 30Figure 5.3 Estimated Coefficients from 2004 to 2009. 33Figure 5.4 Counterfactual Banking Coverage 35Figure 5.5 Counterfactual Banking Coverage in 2004 36
Figure 6.1 Event Study Specification 42
Figure A.1 Credit per Municipality Trends 54Figure A.2 Credit per Agency Trends 55
DBD
PUC-Rio - Certificação Digital Nº 1913106/CA

List of tables
Table 4.1 Descriptive Statistics 25
Table 5.1 Joint Distribution of Banks in January 2004 31Table 5.2 Main Estimates of the Model 32Table 5.3 Characteristics of Counterfactual Municipalities 37
Table 6.1 Regressions linking Caixa Econômica Federal’s Coverageto Bolsa Família’s Cancelled Benefits. 40
Table 6.2 Regressions linking Caixa’s Agencies per 10 Thousand toBolsa Família’s Cancelled Benefits. 44
Table 6.3 Regressions linking Distance to the Nearest CaixaEconômica Federal to Bolsa Família’s Cancelled Benefits. 45
Table A.1 Complete Estimates of the Model 56
DBD
PUC-Rio - Certificação Digital Nº 1913106/CA

1Introduction
Conditional Cash Transfer programs (CCTs) are essential mechanismsto help provide a minimal standard of living for all citizens and alleviateadverse situations such as unemployment, sickness, and disabilities (Fiszbein& Schady (2009)). Additionally, the program’s condicionalities incentivizevulnerable families, especially children, to access health and education servicesthat may break the cycle of intergenerational persistence of poverty. Programshave been shown to impact inequality (Soares et al. (2010)), child’s health(Gertler (2004)), educational attainment (García & Saavedra (2017)), and evenwomen’s health and emancipation levels (Barber & Gertler (2009)).
However, one aspect that is frequently set aside is its complicatedlogistics. Governments usually rely on banks to distribute these policies.Still, most developing countries have yet to universalize access to financialservices, which may hinder people from withdrawing their benefits, especiallyin vulnerable and remote areas. This paper explores the relationship betweenbanking coverage and access to CCTs.
Brazil’s context offers fertile ground to study this question. The BolsaFamília program (PBF), the most extensive CCT in the world (Shei et al.(2014)), has a cancellation protocol for families that fail to withdraw theirbenefits for six months which allows indirect verifiability of adequate accessto the program. Also, because Brazil opted to distribute the policy throughits banking system, it is possible to study the relationship between bankingcoverage and PBF’s distribution. Caixa Econômica Federal (Caixa), the bankwith highest coverage in the country, solely distributes PBF, which allows meto analyze the effect that policy distribution may have on banks’ operations.
The article uses a dual approach, combining Structural and ReducedForm Analysis to answer two related but different questions and extend theknowledge on the relationship between banking coverage and CCT delivery.First, I develop an entry model with heterogeneous banks to analyze howthe Bolsa Família program differently affected Caixa and other banks’ spatialdistribution. Considering that Caixa may value expanding to remote areasto reach potential beneficiaries, the program may alter equilibrium coverage.The model’s main contribution is to establish how the incentives generated by
DBD
PUC-Rio - Certificação Digital Nº 1913106/CA
Chapter 1. Introduction 11
the distribution of policies interact with competition effects to shape banks’decisions.
The structural model estimates that, in 2004, Caixa is indifferent betweenentering a municipality with R$398 (US$69.70) less GDP per capita andentering a municipality with one extra percent of Bolsa Família beneficiaries.After estimation, I analyze a counterfactual scenario in which PBF did notexist or, equivalently, Caixa did not value its distribution. This exercise showsthat Caixa’s efforts to distribute PBF significantly accelerated bank coverage inremote areas, with more than 1000 additional municipalities having coverageat one point due to the program. Also, municipalities in the counterfactualare more impoverished, less populated, and have a higher percentage of PBFbeneficiaries.
As a second research question, I evaluate the effect of banking infrastruc-ture on adequate access to the PBF. Exploiting variation in Caixa ’s coverageand Bolsa Família ’s cancellation rules, I can estimate the impact of bankingcoverage on families’ effective access to the program. Specifically, I investi-gate if cancellations rise when Caixa leaves a municipality and, conversely, ifcancellations decline when Caixa enters it. My main specification is a sim-ple Differences-in-Differences approach with variation in treatment timing, inwhich I find that Caixa ’s presence in a municipality reduces the number ofcancellations of Bolsa Família by 9,9%. I also estimate placebo specificationsand verify that Banco do Brasil and private banks’ coverage do not affectprogram cancellations.
The results are akin to an event-study model. I find that cancellationsdecrease when Caixa covers a municipality, with reductions of up to 50% in thenumber of cancellations in its peak, at the second month of banking coverage.Results also indicate no anticipation effects, which strengthens the hypothesisthat cancellations rise is due to access constraints.
Additionally, I perform two robustness exercises. First, I use a similarapproach to the main specification but replacing Caixa ’s coverage with thenumber of Caixa ’s per 10 thousand inhabitants. Effects remain significantalthough smaller, which suggests that opening additional Caixa agencies havelittle impact on PBF and, for most municipalities, one Caixa should be enoughto guarantee proper distribution of benefits.
Second, I investigate it the distance to the nearest Caixa affects cancella-tions. Contrary to previous estimates, effects are not robust. Nevertheless, thisfinding does not contradict the main results. It indicates that conditional onCaixa ’s absence, it does not matter whether the family needs to withdraw itsbenefits in a close or a far away municipality. Traveling to another municipality
DBD
PUC-Rio - Certificação Digital Nº 1913106/CA

Chapter 1. Introduction 12
entails high costs for these low-income families, which is sufficient to hinderaccess to benefits.
This paper main’s contribution is highlighting infrastructure’s role in pro-viding access to CCT programs in developing countries. While these concernsmight go unnoticed in implementing similar programs in developed countries,it is vital to keep in mind that rural and remote areas in the third world maynot have facilities such as banks. Although specific Brazilian institutions maypartially cause this paper’s results, this paper shows that accessibility shouldarguably be a central concern in elaborating any CCT on poor or developingcountries.
The remainder of the paper is organized as follows: Chapter 2 reviews therelated literature, Chapter 3 describes the Brazilian banking environment andthe Bolsa Família program. Chapter 4 describes the Data. Chapter 5 developsthe model used to study how policies may differently impact banks’ spatialdistribution, estimates it, and provides a counterfactual analysis. Reducedform evidence on banking infrastructure’s role in access to CCTs is discussedin Chapter 6. Section 7 concludes.
DBD
PUC-Rio - Certificação Digital Nº 1913106/CA

2Literature Review
There is a vast literature on Conditional Cash Transfer programs.Fiszbein & Schady (2009) discusses the main aspects of this type of programand its prominent examples worldwide. Several papers evaluate the impactof specific CCTs, such as Soares et al. (2010) for the Bolsa Família programand Gertler (2004) for the PROGRESA program in Mexico, finding robustresults in poverty alleviation and child health. García & Saavedra (2017) pro-vides a meta-analysis of CCTs focusing on educational impacts and their cost-effectiveness, finding significant heterogeneity between programs. There is alsoa literature that focuses on specific aspects of these programs or correlatesoutcomes, such as Barber & Gertler (2009) on CCTs’ role on women’s ac-cess to high-quality health care and women’s empowering and Zucco Jr (2013)that shows the political payoffs of implementing the Bolsa Família program inBrazil. This paper’s contribution to this discussion is analyzing an aspect ofthese programs that is often overlooked: the importance of infrastructure foradequate access in remote areas.
This paper also speaks to the literature that studies banking expansionand competition. An industrial organization literature focuses on creatingmodels that reflect the main economic trade-offs faced by banks. Joaquimet al. (2019), for instance, develop a spatial competition model betweenfinancial service providers and provides a framework in industrial organizationto study competition and information frictions in the banking sector. Somepapers also study the economic environment after an exogenous change incompetition parameters in a more applied setting. Gao et al. (2019) documentsthe economic consequences of a bank entry deregulation in China and showthat it leads to higher screening standards, lower interest rates, and lowerdelinquency rates for corporate loans from entrant banks.
Specifically, this paper is related to previous literature that studiesbanking expansion and competition in Brazil. Kumar et al. (2006) documentsthe regulation of banking correspondents in Brazil and Assunção (2013) uses anentry model to show that this reform drastically reduced costs for operation innew markets, allowing banking coverage to increase in the 2000s decade (BancoCentral do Brasil (2010)). Müller (2017) evaluates the impact of banking
DBD
PUC-Rio - Certificação Digital Nº 1913106/CA

Chapter 2. Literature Review 14
correspondents in urban areas, particularly in Brazilian slums, and relatesfinancial inclusion to reduced violence. Coelho et al. (2012) studies anotherfactor contributing to banking expansion in Brazil: the payroll experiment of2003. This reform allowed repayment through automatic payroll deduction,which significantly decreased credit risk and allowed banks to expand credit.Finally, Coelho et al. (2013) estimates the competition effects between publicand private banks, concluding that public banks do not significantly affectprivate banks’ operations.
There is also a literature that focuses on the social aspect of bankingexpansion and contrasts public and private banks’ roles. Burgess & Pande(2005) evaluates the welfare effects of expanding bank coverage to remote areas.It concludes that rural banks’ expansion contributed to reducing poverty inIndia. Assuncao et al. (2012) develops a dynamic model that describes spatialcompetition in Thailand between commercial and public banks. The authorsshow that public banks affect coverage and spatial distribution because theycare about access to financial services. Wijesiri et al. (2019) considers theexistence of a trade-off between social and financial performance of publicbanks while Sapienza (2004) and Coleman & Feler (2015) study the effects ofgovernment ownership on bank lending. The former focuses on the politicalincentives public banks may have to favor some lenders, while the latter showsthe anti-cyclical potential of public credit during an economic crisis.
DBD
PUC-Rio - Certificação Digital Nº 1913106/CA

3Institutional Background
3.1Banking System
The Brazilian banking system is characterized by the coexistence betweenprivate and public banks and remained relatively stable until the end of the1990s decade (Coleman & Feler (2015)), even though Brazil experimented withprofound economic and social changes since the 1960s, becoming increasinglyindustrialized and urbanized.
Caixa Econômica Federal, a public bank founded in 1861, became pro-gressively responsible for distributing most of the Brazilian social policies suchas income and food subsidy and school grants since the 1990s (Kumar et al.(2006)). It is the bank with the most prominent coverage in Brazil (as BancoCentral do Brasil (2010) claims, and Figure 3.2 illustrates), mainly because itcommitted to distributing a wide range of policies. Today, it distributes mostof the social programs that need a bank in Brazil, such as Fundo de Garan-tia por Tempo de Serviço (FGTS), Financiamento Estudantil (FIES), BolsaFamília and Minha Casa Minha Vida.
The other main public bank in Brazil is Banco do Brasil (BB), which wasfounded on October 12th, 1808, and was the first banking institution to operatein the country, being responsible for currency issue until the creation of theCentral Bank in December 1964. Formerly a typical public bank, performingfunctions of both commercial and development banks, shifted its focus after2001, and its operations became similar to private banks (Andrade & Deos(2009)).
Unlike Caixa, lending constituted a large part of Banco do Brasil’sproposed business. Its operation focused mostly on the informal market byoffering micro-credit loans and low-cost accounts (Kumar et al. (2006)). Italso has an important role as a source of rural credit. Banco do Brasil is alsoquite different from Caixa because it is a mixed ownership company, with thegovernment owning just about 50% of the shares of the company. Its ownershipstructure is one reason for its bigger focus on credit and smaller adherence topublic programs.
DBD
PUC-Rio - Certificação Digital Nº 1913106/CA

Chapter 3. Institutional Background 16
The private banking sector in Brazil is somewhat concentrated. Themajor banks to operate in Brazil are Itaú, Bradesco and Santander. Thesebanks provide, together with Caixa and BB, most of the country’s financialservices and constitute most of the branches and banking correspondents thatI aggregate in the Private Banks category in my analysis.
Resolution 2640/99 was a resolution enacted by the Brazilian CentralBank to regulate and allow a steep increase in the number of Banking Cor-respondents. Banking Correspondents are institutions that provide financialservices on behalf of a bank. Usually, banking correspondents are set at aPost Office or a lottery retailer that offers those services while simultaneouslymaintaining its original business.
As shown by Assunção (2013) and Loureiro et al. (2011), it is muchcheaper to open a banking correspondent than a branch since there is noneed to invest in new infrastructure or hire many employees. This Resolutionenabled Caixa, along with other banks, to spread to regions that were noteconomically viable before.
Figure 3.1: Banking Expansion by type of bank
Notes: Both Agencies and Banking Correspondents were considered in the Graph. Caixastands for Caixa Econômica Federal and BB stands for Banco do Brasil
DBD
PUC-Rio - Certificação Digital Nº 1913106/CA

Chapter 3. Institutional Background 17
Another possible cause for banking expansion was the 2003 BrazilianPayroll experiment, which allowed workers to use their payroll and retirementbenefits to get loans. The experiment vastly decreased credit cost and enabledbanks to lend more and expand to previously unprofitable areas (Coelho et al.(2012)).
Along with Caixa and Banco do Brasil, the two banks that most ex-panded their banking correspondents operations after Resolution 2640/99 wereLemon Bank and Bradesco. Lemon Bank was a venture created in June 2002that only operated through banking correspondents and focused on the un-banked public in dense urban areas. On the other hand, Bradesco is one ofBrazil’s major banks and used the banking correspondents legislation to ex-pand its coverage through the creation of Banco Postal, a subsidiary thatoffered banking services in post offices. Bradesco paid R$ 200 million (aboutUS$35 million) for exclusive access to 5,300 of the 10,500 post offices in Brazil.The purchase was also significant for the increase in banking coverage sincegovernment regulation stipulated that Banco Postal should be present in atleast 1,000 new municipalities covered by the Postal office.
Figure 3.1 compares banking coverage between 2001 and 2004 for Caixa,Banco do Brasil, and Private Banks. The graph shows Caixa expandedits operations to almost all municipalities by 2004, even remote areas inthe Amazon. In contrast, BB and the Private banks did not significantlyexpand their coverage in the period even though banking correspondents hadenabled expansion at a relatively low cost. The map is useful to highlight thegeographical aspect of their differences. Caixa expanded to remote areas it wasnot present before, such as the Amazon, the interior of Piauí and Tocantins,areas with smaller potential for new accounts or credit.
Figure 3.2 shows a complete picture of banking expansion from 2001to 2010. The first panel describes intensive margin expansion from Caixa,Banco do Brasil, and Private Banks. Banking coverage expanded greatly inthis decade. The graph reports that BB and the Private Banks significantlyexpanded their operations after 2004, although they do not reach Caixa’salmost universal coverage.
In the extensive margin, however, the situation is the opposite. Thesecond panel of Figure 3.2 reports the number of banking points of salein Brazil. Points of sale are defined as the sum of branches and bankingcorrespondents. Private banks experienced a more than fourfold expansionin the decade, expanding their 40 thousand points of sale to more than 160thousand by the end of 2010, while BB and Caixa only experienced a modestexpansion after 2006 and 2008, respectively.
DBD
PUC-Rio - Certificação Digital Nº 1913106/CA

Chapter 3. Institutional Background 18
Figure 3.2: Banking Coverage and points of sale by Bank
Notes: Both Agencies and Banking Correspondents were considered in the Graph.
The relationship between banking coverage and monthly average creditper municipality is reported in Figure 3.3. Each point represents one yearbetween 2001 and 2010. Year indicators were omitted for graphic clarity, but aversion that includes them is in Appendix A.2. Years can also be easily inferredsince both points of sale and banking coverage were continuously growing overthe period.
The figure exposes that credit per municipality expanded considerablyfor all banks in the period, especially private banks, along with coverage andpoints of sale spread. The credit per municipality increases can be explained byan increase in credit demand due to favorable macroeconomic conditions andsocial inclusion of the period. Note that movements in credit per municipalityseem to be correlated with both points of sale and banking coverage, with aweaker relationship in Caixa’s operation.
Figure 3.4 plots the number of points of sale and banking coverage inBrazil against average monthly credit per point of sale for Caixa, Banco doBrasil and private banks. Once again, each point represents a year between2001 and 2010, and year indicators were omitted for graphic clarity. A versionwith years indicators is included in Appendix A.2 but years can be easilyinferred since both points of sale and banking coverage were continuously
DBD
PUC-Rio - Certificação Digital Nº 1913106/CA

Chapter 3. Institutional Background 19
Figure 3.3: Credit per Municipality Trends
Notes: Both Agencies and Banking Correspondents were considered in the graph. Credit’sunit is Million Reais (R$). Each dot represents a year between 2001 and 2010. Indicators ofeach year were omitted for graphic clarity but can be inferred since both Total Agencies andCoverage increased in the period for all Banks. Version with year indicators in AppendixA.2.
growing over the period.The credit per point of sale decreases for all banks in the period, except
Caixa whose credit per point of sale increases. This fact suggests that both BBand private banks expanded their operations to unburden existing points ofsale from the increasing demand for credit and financial services. Since somemunicipalities are still not profitable with current economic growth levels andGDP per capita, BB and private banks choose not to cover some remote areas.
The information on Figures 3.3 and 3.4 evaluated jointly indicate thatthe credit market size increased significantly between 2001 and 2010 and thatBB and private banks opened new points of sale to adequate their operations tothis new situation. In contrast, Caixa’s expansion does not seem to be relatedto excess credit demand. Other factors should explain its expansion and highercoverage than its competitors. The model in 5 indicates that Caixa’s behavioris less motivated by profitability than other banks and is associated with thedistribution of Bolsa Família’s benefits.
DBD
PUC-Rio - Certificação Digital Nº 1913106/CA

Chapter 3. Institutional Background 20
Figure 3.4: Credit per Agency Trends
Notes: Both Agencies and Banking Correspondents were considered in the graph. Credit’sunit is Million Reais (R$). Each dot represents a year between 2001 and 2010. Indicators ofeach year were omitted for graphic clarity but can be inferred since both Total Agencies andCoverage increased in the period for all Banks. Version with year indicators in AppendixA.2.
3.2Bolsa Família program
The Bolsa Família program (PBF), created in October 2003 by theBrazilian Federal Government, is the most extensive Conditional Cash Trans-fer program (CCT) in the world (Shei et al. (2014)). It unified pre-existingConditional and Unconditional Cash Transfer programs such as Bolsa Ali-mentação, Bolsa Escola, Cartão Alimentação, and Auxílio Gás. It is highlyregarded as a very successful public policy in reducing inequality and extremepoverty (Soares et al. (2006)) while improving educational outcomes with lowcosts (see Soares et al. (2010) for a complete impact evaluation, Neri et al.(2013) for the macroeconomic effects of the program, and Ribeiro et al. (2017)for a survey on its central studies).
The program was designed to alleviate poverty while simultaneouslyending its cycle of intergenerational persistence. It acts on three differentdimensions: first, the direct cash transfers unburden families from currentpenury condition. Second, the condicionalities ensure that families registered
DBD
PUC-Rio - Certificação Digital Nº 1913106/CA

Chapter 3. Institutional Background 21
at the program satisfy a set of requirements related to children’s health andeducation outcomes, enabling children to have an upbringing that preparesthem for future labor-markets opportunities and breaking the cycle of poverty.Finally, the complementary actions aim to create direct opportunities forfamilies to improve their standards of living.
There is also a vital autonomy aspect to the program. The benefits arecredited directly to the beneficiaries’ accounts, and they are entirely free tochoose how to spend their money. Also, despite the beneficiary unit beingthe whole household, benefits are given preferentially to women, strengtheningwomen’s autonomy and subverting potentially oppressing power dynamics inthe household.
Eligibility for the program includes extremely poor and poor fam-ilies, those whose income per capita less than R$85(US$14.87)1 andR$170(US$29.74) per month respectively, with children or pregnant women.The basic benefits’ values are R$85(US$14.87) per month for extremely poorfamilies plus additional variable benefits that depend on the number of chil-dren, teens, and pregnant women in the family. There is also an extra benefitfor those families that continue extremely poor after benefits, whose value isat least the exact quantity they need to overcome extreme poverty.
For a complete description of the program and a deeper discussion ofPBF’s main aspects, see Lima et al. (2018) and Medeiros et al. (2007).
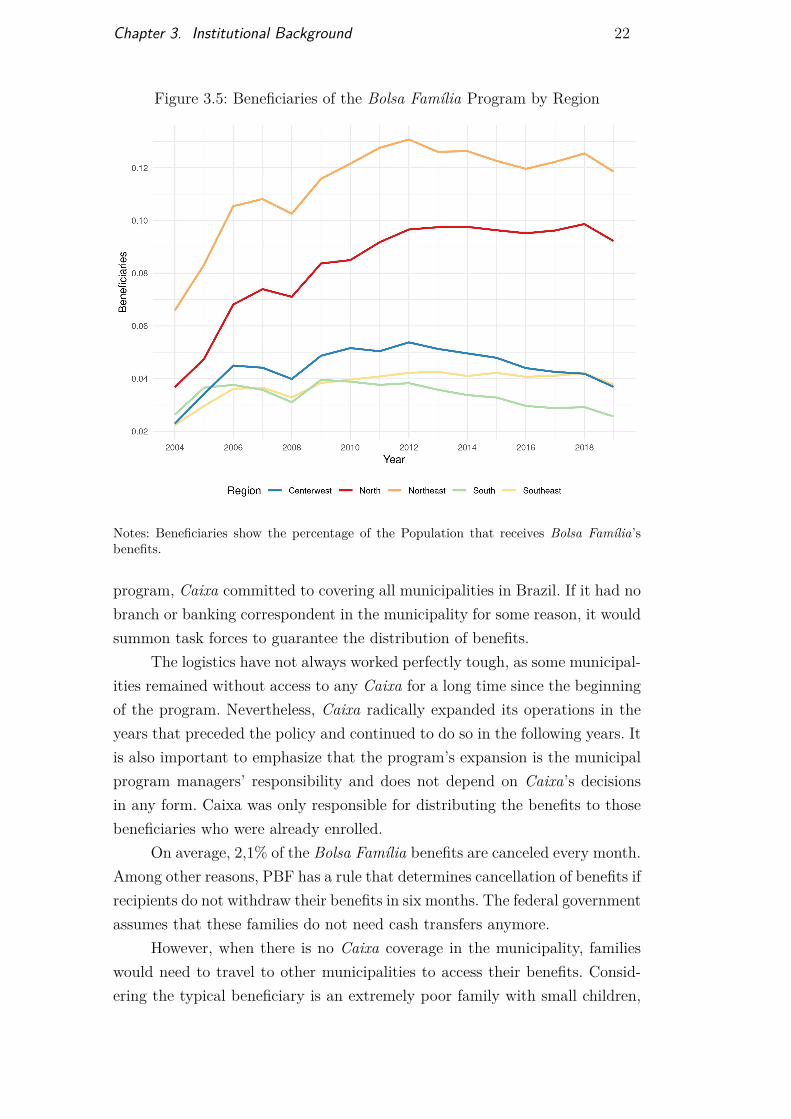
Figure 3.5 describes the evolution of Bolsa Família program’s beneficia-ries from 2004 to 2019, by region. There was a significant expansion in the pro-gram in its first years due to its decentralized operation that delegates to mu-nicipal managers the task of reaching low-income families and registering themon the program. The funds that each municipality receives for the program arelinked to its success in expanding coverage and its transparency in declaringits expenses, as reflected by the Índice de Gestão Descentralizada(IGD-M).
All regions follow similar trends in the period, experiencing a slightdecline in the percentage of the population that receives benefits in the recentyears, after a rapid expansion in its genesis. The Northeastern region has thehighest percentage of beneficiaries, closely followed by the Northern region. Itwas somewhat expected since, compared to other regions, they have smallerGDP per capita and higher poverty rates.
Caixa Econômica Federal, as defined in Law No. 10,836 from January 9,2004, is the only bank authorized to pay the Bolsa Família’s benefits. Amongits obligations are the organization of the benefit payment logistics and reportsfor the program’s inspection. Given the size and relevance of the Bolsa Família
1All conversions from Reais to US Dollars were based on April’s 1st 2021 quotation.
DBD
PUC-Rio - Certificação Digital Nº 1913106/CA
Chapter 3. Institutional Background 22
Figure 3.5: Beneficiaries of the Bolsa Família Program by Region
Notes: Beneficiaries show the percentage of the Population that receives Bolsa Família’sbenefits.
program, Caixa committed to covering all municipalities in Brazil. If it had nobranch or banking correspondent in the municipality for some reason, it wouldsummon task forces to guarantee the distribution of benefits.
The logistics have not always worked perfectly tough, as some municipal-ities remained without access to any Caixa for a long time since the beginningof the program. Nevertheless, Caixa radically expanded its operations in theyears that preceded the policy and continued to do so in the following years. Itis also important to emphasize that the program’s expansion is the municipalprogram managers’ responsibility and does not depend on Caixa’s decisionsin any form. Caixa was only responsible for distributing the benefits to thosebeneficiaries who were already enrolled.
On average, 2,1% of the Bolsa Família benefits are canceled every month.Among other reasons, PBF has a rule that determines cancellation of benefits ifrecipients do not withdraw their benefits in six months. The federal governmentassumes that these families do not need cash transfers anymore.
However, when there is no Caixa coverage in the municipality, familieswould need to travel to other municipalities to access their benefits. Consid-ering the typical beneficiary is an extremely poor family with small children,
DBD
PUC-Rio - Certificação Digital Nº 1913106/CA

Chapter 3. Institutional Background 23
travels may be too costly. Families would need to lose a working day, arrangechildcare and buy a bus ticket to access their benefits, which may cost morethan their entitlements. Also, Table 4.1 reports that there are occurrencesof families that needed to travel more than 200 Kilometers until the nearestCaixa.
Since the cost of traveling to other municipalities may be too highfor impoverished families, many beneficiaries may be unable to withdrawtheir benefits, being involuntarily excluded from these programs. Chapter 6investigates if families are able to effectively access the Bolsa Família programwhen there is no Caixa coverage in the municipality.
DBD
PUC-Rio - Certificação Digital Nº 1913106/CA

4Data
I use four primary sources of data for the analysis presented in this paper.First, the number of Bank Branches for each bank in the municipality levelis taken from the Brazilian Central Bank’s database ESTBAN. I also haveinformation on which services each Banking Correspondent provides, so I canfilter which ones are relevant to the study. From this source, I also use theCredit variable. Although it is not used in my main analysis, I use to constructthe variables Credit per Municipality and Credit per Agency, which appear onFigures 3.4 and 3.3. Data is available from 1990 to 2020.
Second, the information on banking correspondents, institutions thatprovide financial services in behalf of a bank, is available since 2014 in theCorrespondentes no País database. I was also able to access data on bankingcorrespondents from 1990 to 2020 through the Lei de Acesso a Informação(LAI), a Brazilian data transparency law.
I choose to aggregate information from branches and banking correspon-dents since, for my purposes, they are equivalent. I have the exact date eachbranch and banking correspondent opened and closed, which I choose to ag-gregate in monthly frequency to make it compatible with the other variables.I also choose to use this data only since 2004, which is when the Bolsa Famíliaprogram starts. Exceptions are Figures 3.1, 3.2, 3.4, and 3.3, which use datasince 2001 to describe Coverage and Credit trends.
These two databases culminate on the variables of coverage, numberof agencies (branches and banking correspondents) and distance to nearestagency, which are created for Caixa Econômica Federal, Banco do Brasil andPrivate Banks, which are all aggregated into the same category.
Third, the data on the Bolsa Família program is available at a monthlyfrequency in the Ministério de Desenvolvimento Social’s (MDS) website, andI use the number of beneficiaries and the value of benefits from the programfrom 2004 to 2019. The number of cancelled and blocked benefits, which I useas dependent variable in our main regressions, is also available at the websitebut only from 2014 to 2019. Ideally, I would use cancellation data since 2004,when the program started, but data for the first years of the program is notyet consolidated in the Ministry’s archives.
DBD
PUC-Rio - Certificação Digital Nº 1913106/CA

Chapter 4. Data 25
Finally, from the Instituto Brasileiro de Geografia e Estatística (IBGE), Iuse the Gross Domestic Product (GDP) from 2004 to 2018, the latest availabledata, and estimated population for municipalities from 2004 to 2019. This datais annual, so I will need to assume that they are constant throughout the year.Official municipality and state shapefiles are also available at their website,which I use to elaborate the maps and to construct the distance variables.
Table 4.1 reports the Descriptive Statistics for all the main variables usedin the analysis.
Table 4.1: Descriptive Statistics
Statistic Mean St. Dev. Min Max N RangeCaixa Coverage 0.966 0.181 0 1 1,068,905 2004 - 2019BB Coverage 0.728 0.445 0 1 1,068,905 2004 - 2019Private Coverage 0.887 0.316 0 1 1,068,905 2004 - 2019# of Caixas 4.940 35.212 0 3,117 1,068,905 2004 - 2019# of BBs 4.406 18.918 0 1,801 1,068,905 2004 - 2019# of Private Banks 38.435 297.992 0 25,316 1,068,905 2004 - 2019Distance to Caixa 0.807 5.717 0 232.831 1,068,900 2004 - 2019Distance to BB 7.311 18.274 0 378.031 1,068,900 2004 - 2019Distance to Private 3.285 12.774 0 291.796 1,068,900 2004 - 2019BF Beneficiaries 2,152 7,403 0 511,168 1,068,722 2004 - 2019BF Benefits 282 1,001 0 77,561 1,068,705 2004 - 2019Population 35.2 207.9 0.8 12,252 1,068,852 2004 - 2019GDP per Capita 14.528 17.709 0 815.7 1,001,952 2004 - 2018Cancellations 42.380 289.941 0 43,748 388,791 2014 - 2019Cancellations per 1000 20.745 28.440 0 450 388,786 2014 - 2019
Notes: All variables are at the Municipality Level and available at a Monthly Frequency, exceptPopulation and GDP per Capita, which are annual but extrapolated to Monthly Frequency. CaixaCoverage, BB Coverage and Private Coverage are Dummy variables indicating Bank’s Coveragein the Municipality. # of Caixas, # of BBs and # of Private Banks indicates the number of pointsof sale for each bank in the Municipality. Distance to Caixa, Distance to BB and and Distance toPrivate are the Distance in Kilometers to the Nearest Agency. BF Benefits and Population’s unitis thousands and GDP per Capita’s unit is Thousand Reais (R$).
Caixa Coverage, BB Coverage, and Private Coverage are Dummy vari-ables indicating Bank’s Coverage in the Municipality. # of Caixas, # of BBs,and # of Private Banks indicate the number of points of sale for each bankin the municipality. Distance to Caixa, Distance to BB, and Distance to Pri-vate are the distances in Kilometers to the Nearest Agency, calculated as thedistance of the municipality’s centroid to the nearest municipality with anagency’s centroid.
DBD
PUC-Rio - Certificação Digital Nº 1913106/CA

5Structural Analysis
5.1Model
This chapter proposes a model that characterizes the determinantsof bank entry decisions in Brazilian municipalities, extending the modelsfrom Bresnahan & Reiss (1991) and Assunção (2013) to incorporate thedistribution of public policies in banks’ decisions. The model gives us measuresof the monetary value Caixa attributes to attending extra beneficiaries of theprogram, which helps us evaluate their incentives and decide the best ways toimplement policies that rely on financial institutions. I will also see how banks’priorities changed over time, allowing me to create a counterfactual bankingcoverage in Brazil in a scenario where Caixa does not care about distributingBolsa Família benefits. The counterfactual allows measuring the impact thatthe distribution of policies had on the Brazilian banking expansion.
Given the relevance of banks for financial services and the possibilityof delivering cash transfer programs, it is essential to characterize how banksbehave in practice, what determines their decisions of entrance and exit ina given market, and find optimal policies. As described before, every bankdistributes financial services, but only Caixa distributes policy (Bolsa Família).The model’s main contribution is to establish how the incentives generated bythe distribution of policies shape banks’ distribution.
There are two main mechanisms governing banking coverage decisions:on the one hand, banks want to expand their operations to get access to anew market and increase their credit and deposit operations. On the otherhand, the market structure may affect profitability. Also, in the case of CaixaEconômica Federal, there is potentially a third incentive, distributing BolsaFamília benefits to its beneficiaries. My model aims to quantify each factor’srelevance in banks’ decisions and deepen the understanding of the patterns ofcompetition in the Brazilian banking sector.
The model fits in the category of multiple-agents qualitative responsemodels, surveyed by Reiss (1996). This category of models is appropriate tocharacterize an economic environment when interacting agents use strategic
DBD
PUC-Rio - Certificação Digital Nº 1913106/CA

Chapter 5. Structural Analysis 27
behavior to determine the equilibrium outcomes. They allow the possibilityof incorporating game-theory tools to an empirical problem and unveiling theunderlying economic incentives that justify equilibrium behavior.
The framework is a static entry model with many agents (bank branches)distributed in two types of banks, Caixa and Other Banks. The category OtherBanks includes both Banco do Brasil and all the Private Banks. The maindifference between types is that Caixa distributes the CCT program and mayvalue extended access to the program. Branches are defined as the game’sagents for simplicity.
Each branch decides whether to enter each market (municipality). If abranch decides not to enter a market, its profit is zero and, adapting fromMazzeo (2002), type i branch’s profit, if they decide to enter market m, isgiven by:
Πim = Popm(αYm +λiPBFm) − Γii ∗ (#im − 1) − Γij ∗ (#jm) −F + εim (5-1)
Where Ym is the municipality’s GDP per capita in thousand Reais (R$),PBFm is the percentage of beneficiaries of Bolsa Família in municipality m,F is the fixed cost of operating in a new market, #i is the number of sametype branches in the market, #jm is the number of different type branches inthe market, and εim are the unobservable factors of profits. Since Caixa is theonly bank allowed to distribute the program, λi is set to zero for other banks.
This configuration generates seven economically relevant parameters. αquantifies the extra profitability that comes from entering a municipality withhigher GDP through higher market size for credit or new deposit accounts. λ isthe marginal monetary value that Caixa attributes to entering a municipalitywith more Bolsa Família beneficiaries. Another way to interpret the coefficientis that it represents how much profit Caixa is willing to abdicate to distributebenefits to one extra family.
The fixed cost F associated with starting operations in a new marketis useful to disentangle the operational costs of starting operations from thecompetition costs associated with the elasticities parameters (Γ).
By allowing same-type competitors to affect profits differently thandifferent-type competitors, the model generates four competition parameters:Γcc and Γoo are the crowding-out effect generated by one extra same-typebranch in the market, while Γco and Γoc are marginal inter-bank competi-tion effects. Since the category Other Banks represents all banks except CaixaEconômica Federal, Γoo actually aggregates effects between different commer-cial banks while Γco and Γoc indicate whether Caixa competes for commercial
DBD
PUC-Rio - Certificação Digital Nº 1913106/CA

Chapter 5. Structural Analysis 28
banks profits.
5.2Equilibrium
The agents play a simultaneous game to decide whether or not to entereach municipality. We need two conditions for a Nash Equilibrium to thisgame. First, branches that start operations in a market have positive profits.Otherwise, it would be profitable, given other agents’ decisions, not to enter.Therefore, we must have:
Πcm(a, b) + εcm ≥ 0 and Πom(a, b) + εom ≥ 0 (5-2)Second, by the same logic, branches that do not enter would have negative
profits if they operated. Let Πim(a, b) be type i bank’s observable profitwhen there are a Caixa’s and b Other Bank’s in market m. Then, in a NashEquilibrium, we must also have:
Πcm(a+ 1, b) + εcm < 0 and Πom(a, b+ 1) + εom < 0 (5-3)To guarantee the existence of a Nash Equilibrium, we must make two
assumptions:
Assumption 1: Γcc, Γoo, Γco, and Γoc are strictly positive.The first assumption means that any competitor that enters the market
lowers the profits of all its competitors. It is reasonable since branches losemarket share when there is a new participant in the market.
Assumption 2: limx→∞Πcm(x, b) < 0 and limy→∞Πom(a, y) < 0, for every aand b.
The second assumption states that, independently of the other type’sdecisions, there is a limit in the number of profitable branches that can beopened. Since the number of consumers is always finite, it makes sense alwaysto exist a point where the costs of opening a new branch exceed its benefits.
Theorem 5.1 Under Assumption 1 and Assumption 2, a Nash Equilibriumfor the game always exists, although it may not be unique.
Proof. First, fix a value b = b . Since Πc(0, b) = 0, there always exists somevalue a such that Πc(a, b) ≥ 0. From Assumption 2, there also always existsan a such that Πc(a, b) < 0. From Assumption 1, Πc(a, b) and Πo(a, b) arestrictly decreasing in both a and b. Therefore, there must be an a∗ such thatΠc(a∗, b) ≥ 0 and Πc(a∗+1, b) < 0. Now, fix a = a∗. Using the same argument,
DBD
PUC-Rio - Certificação Digital Nº 1913106/CA

Chapter 5. Structural Analysis 29
there must exist a b∗ such that Πc(a∗, b∗) ≥ 0 and Πc(a∗, b∗+ 1) < 0. (a∗, b∗) isa Nash Equilibrium. �
Figure 5.1: Simplified Model Equilibria
εo
εcΠcm(1, 0) Πcm(1, 1)
Πom(1, 0)
Πom(1, 1)
MultipleEquilibria
NoBanks Caixa
OtherBanks Both
Notes: The Graph describes the parameters regions which generate each possible equilibrium,allowing the possibility of multiple equilibria. For didactic purposes, it is based on a simplifiedversion of the model with the binary decision of entering or not each Municipality. A graphfor the full model would give us the same intuition but would require a considerable amountof extra regions.
To give some intuition, Graph 5.1 illustrates the possible market out-comes in a simplified version of the model, where there is only one agent ofeach type. It shows that each branch will enter the market if its shock is favor-able enough, given the parameters’ values and other type’s decisions. Changingparameters values would dislocate the line where each bank finds it profitableto enter the market.
To extend the graph to represent the full model, we would need to draweach of the (N + 1) ∗N horizontal straight lines Πc(a, b) and the (N + 1) ∗Nlines Πo(a, b) for every combination of a and b from 0 to N and order them,creating 2N+1 possible outcomes.
The multiple equilibria possibility arises because, in those regions, bothagents find it profitable to enter the market if there are N competitors, butnot if there are N + 1. Therefore, we could either observe that only Caixaenters or only Other Banks enter that market. This situation may cause someproblems for estimating the model since the same parameters may predict twodifferent market outcomes. To solve this problem, we need to impose one extraassumption:
DBD
PUC-Rio - Certificação Digital Nº 1913106/CA

Chapter 5. Structural Analysis 30
Assumption 3: Γcc > Γco and Γoo > Γoc.This assumption states that the impact of a new same-type competitor
on profits is always larger than the impact of a different-type competitor. Itis a reasonable condition since same-type branches provide the same servicesand usually have a closer consumer base than different-type competitors. Itrestricts the possible multiple equilibria to those in nearby regions where oneextra Caixa branch or one extra Other Banks branch would find it profitable toenter the market if the other one decides not to enter but would not otherwise.
Now, it is possible to define an equilibrium selection mechanism. Definingthat, in the case of multiple equilibria, the last branch to enter is the one whichwould have higher profits by operating, only one Nash Equilibrium is possibleand the following extra inequalities hold:
Caixa enters if Πcm(a, b) + εcm > Πom(a− 1, b+ 1) + εom and,
Other Banks enter if Πom(a, b) + εom > Πcm(a+ 1, b− 1) + εcm(5-4)
Figure 5.2: Simplified Model Equilibria, Imposing Selection Mechanism
εo
εcΠcm(1, 0) Πcm(1, 1)
Πom(1, 0)
Πom(1, 1)
NoBanks
Caixa
OtherBanks
Both
Notes: The Graph describes the parameters regions which generate each possible equilibrium,after we impose the selection mechanism that assumes the bank with higher profits operateswhen two equilibria are possible. For didactic purposes, it is based on a simplified version ofthe model with the binary decision of entering or not each Municipality. A graph for the fullmodel would give us the same intuition but would require a considerable amount of extraregions.
The selection mechanism is illustrated in the simpler version of the modelby Figure 5.2. The diagonal line that separates the region where Caixa and
DBD
PUC-Rio - Certificação Digital Nº 1913106/CA

Chapter 5. Structural Analysis 31
Other Banks enter is precisely the line where both types would have thesame profit by operating. Rigorously, the line is still a region where multipleequilibria are possible. However, since it has measure zero, it should not causeany practical issues.
Even after imposing the selection mechanism, the model generates 2N+1
possible equilibrium outcomes, where N is the maximum number of agenciesor banking correspondents. Considering that we observe 25,316 private banksonce in our sample, computing the parameters for all the possible outcomesand regions in this model would be prohibitive. Therefore, we must define acutoff X such that markets that surpass this quantity will be included in theregion ”Xor more branches”.
Table 5.2 reports the joint distribution of banks in Brazil to assist onthe choice of X. The table’s main point is to show that Caixa rarely hasmore than three branches in a market, while the other banks choose to keepexpanding their operations, depending on the market’s profitability. Therefore,this indicates that Caixa is indeed faced with different incentives than otherbanks and suggests extending the model up to 4 branches should be enoughto characterize the economic environment.
Table 5.1: Joint Distribution of Banks in January 2004
Number of Other BanksNumber of Caixas 0 1 2 3 4 5 6 7 8 9 10
0 95 45 20 7 5 0 0 3 0 1 01 1, 987 1, 180 515 216 112 50 43 16 12 8 42 112 94 91 78 52 44 41 18 20 21 123 5 1 1 9 18 19 22 12 19 13 124 0 0 0 0 1 2 5 2 1 4 35 0 0 0 1 0 1 1 1 0 0 16 0 0 0 1 0 0 0 0 0 1 07 0 0 0 0 0 0 0 0 0 1 08 0 0 0 0 0 0 0 0 1 0 19 0 0 0 0 2 0 0 1 0 0 010 0 0 0 0 0 0 0 0 0 0 2
Notes: Number of Caixa’s branches are represented in the vertical-Axis while the number of otherbanks’ branches are represented in the horizontal-axis. Both Agencies and Banking Correspondentswere considered in the Table. For clarity purposes, joint distribution is reported only up to 10branches, even tough some municipalities have more branches.
Given the problem’s relatively high dimensionality, to estimate themodel, I used a simulation-based approach. It consists of drawing randomshocks (εc, εo) from a known distribution and calculating the simulated equi-librium at each market for a given value of the parameters. Then, I computethe number of times the observed outcome in the data is equal to the simulated.This process is repeated several times for different values of the parameters.
DBD
PUC-Rio - Certificação Digital Nº 1913106/CA

Chapter 5. Structural Analysis 32
The estimated parameters are the ones that make the simulated configura-tion most similar to the actual data. The complete estimation algorithm isdescribed in Appendix A.1.
5.3Estimates
Model’s estimated parameters are reported in Table 5.2 and Figure 5.3.Coefficients do not have a direct economic meaning since our profit function isnot defined in a specific value unit. Instead, it is a multiple of the actual profitfunction in Reais(R$).
The α coefficient, which is the marginal value of entering a municipalitywith higher GDP, increased significantly between 2004 and 2008. The increaseis probably related to the period’s favorable macroeconomic scenario, whichincreased the demand for credit, as indicated by Figure 3.3. λ, in contrast,is considerably higher in the first years of the program when Caixa had tocatch up with the Bolsa Família program’s expansion. However, because ofthe large standard errors associated with estimation, the null hypothesis thatλ = 0 cannot be rejected. Nevertheless, the counterfactual reported in the nextsection suggests that the coefficient is sufficient to cause a sizeable expansionof Caixa’s operations in the period.
Table 5.2: Main Estimates of the Model
Year α λ Ratio F Γcc Γco Γoo Γoc2004 3.72e-08 1.48e-05 3.98e+02 6.29e-04 9.77e-02 1.00e-04 1.28e-03 1.21e-04
(2.14e-07) (2.96e-05) (1.30e-03) (2.20e-03) (3.64e-04) (2.14e-03) (2.77e-04)2005 4.06e-08 1.76e-05 4.34e+02 7.63e-04 9.74e-02 5.51e-05 1.51e-03 7.07e-05
(2.55e-07) (2.93e-05) (1.39e-03) (2.28e-03) (1.57e-04) (2.28e-03) (1.96e-04)2006 6.51e-08 1.18e-05 1.82e+02 6.62e-04 9.65e-02 1.14e-04 2.41e-03 5.10e-05
(3.00e-07) (2.35e-05) (1.44e-03) (3.34e-03) (3.98e-04) (3.41e-03) (2.64e-04)2007 6.33e-08 5.12e-06 8.09e+01 9.66e-04 9.53e-02 6.52e-05 3.29e-03 1.44e-04
(3.65e-07) (1.80e-05) (1.82e-03) (4.56e-03) (2.59e-04) (4.72e-03) (5.06e-04)2008 1.10e-07 8.02e-06 7.30e+01 1.18e-03 9.32e-02 9.69e-05 5.06e-03 7.82e-05
(3.26e-07) (3.15e-05) (2.52e-03) (6.03e-03) (3.23e-04) (6.41e-03) (2.42e-04)2009 3.88e-08 1.06e-05 2.74e+02 1.01e-03 9.06e-02 1.04e-04 7.88e-03 1.33e-04
(4.27e-07) (2.80e-05) (2.06e-03) (9.28e-03) (2.87e-04) (9.34e-03) (5.14e-04)2010 1.33e-07 1.28e-05 9.62e+01 2.27e-04 9.00e-02 6.33e-05 9.44e-03 8.34e-05
(3.52e-07) (2.65e-05) (5.81e-04) (1.06e-02) (1.62e-04) (1.07e-02) (3.16e-04)
Notes: Ratio is not directly estimated from the model. It is defined as λα . Estimates for all years are available at the
Appendix.
To facilitate interpretation, the variable Ratio = λα
is reported. Thiscoefficient tells us, given market sizes and competitive setups, how muchCaixa is willing to abdicate entering a more lucrative market (with higherGDP per capita) to attend a city with more Bolsa Família beneficiaries. Forinstance, the Ratio coefficient in 2004 means that Caixa is indifferent between
DBD
PUC-Rio - Certificação Digital Nº 1913106/CA

Chapter 5. Structural Analysis 33
entering a municipality with 398 fewer Reais in GDP per capita and enteringa municipality with one extra percent of Bolsa Família beneficiaries.
The Ratio is higher in the first years of the Bolsa Família programbut remains considerably high until 2010. The result is compatible with ourhypothesis that Caixa was interested in expanding its operations in the firstyears of the program to guarantee access to all beneficiaries.
Figure 5.3: Estimated Coefficients from 2004 to 2009.
Notes: Ratio is not directly estimated from the model. It is defined as λα . Estimates for all
years are available at the Appendix.
The same-type elasticities presented contrasting behaviors: while Γoomore than quadrupled from 2004 to 2009, indicating increasing competitionin the credit market, Γcc slowly but regularly decreased. Still, Γcc remainedalmost ten times bigger than Γoo. This difference suggests that, to Caixa, it ismuch less profitable to open additional branches in a market once it alreadycovers it, perhaps because the extra branch does not improve Bolsa Família’sdistribution as much as the first branch (see Table 6.4).
The different-type elasticities did not present a very discernible patternover the years, although their magnitudes are much smaller than the same-type elasticities. Caixa does not seem to compete with commercial banksand vice-versa. Results are similar to Coelho et al. (2013). Target consumersbeing inherently different or Caixa’s focus on the Bolsa Família program couldexplain this.
The fixed cost (F ) coefficient remained stable in the first years butincreased steadily after 2006, probably due to increased logistics costs. It is also
DBD
PUC-Rio - Certificação Digital Nº 1913106/CA
Chapter 5. Structural Analysis 34
much smaller than the same-type elasticities, indicating that the main costsgoverning branches’ decisions are related to market structure and competition.
One limitation of the model is that, due to computational restrictions,only 100 samples were bootstrapped for each estimation, generating higherstandard error than ideal. Therefore, the estimates may not be so precise.
Since banking coverage is almost universal after 2009, the data for theseyears do not have enough cross-section variation for the model to identify itsparameters, and the estimations are imprecise. Therefore, I choose to omitthem from the text, but estimates for all years from 2004 to 2017 are availablein Appendix A.3.
5.4Counterfactual Analysis
The model’s estimation allows us to create a banking coverage counter-factual in Brazil for each year in our sample. The counterfactual shows howwould Brazilian banking coverage be if the Bolsa Família program did notexist (or if Caixa did not care about the program’s distribution). Therefore,counterfactual municipalities are defined as those covered by Caixa in the data,which would not be if we set λ to zero. Using this setting, I simulate counterfac-tual profits and outcomes in each municipality, generating a new equilibriumbanking coverage.
Figure 5.4 reports the difference between the actual and predicted totalof municipalities with bank coverage in Brazil between 2004 and 2009. It showsthat the Bolsa Família program accelerated banking coverage in Brazil, withmore than 1000 municipalities being covered in 2005 only because Caixa waspreoccupied with distributing the program.
The model generates a relatively small number of counterfactual munic-ipalities between 2006 and 2008 due to the smaller λ in these years. Theseoscillations in the counterfactual come from imprecision in estimating the pa-rameters caused by the small number of bootstraps. Nevertheless, counterfac-tual coverage remains positive in all years of our sample.
Although banking coverage would most likely expand in Brazil even inthe absence of the CCT program, the program accelerated this process andwas probably responsible for externalities in bancarization by anticipatingbanking presence in remote areas. One possible extension of this research,if bancarization data were publicly available, would be to investigate trendsin the access to financial services of municipalities in the counterfactual andrelate them to Caixa’s coverage.
Figure 5.5 reports counterfactual municipalities in 2004, that is, the
DBD
PUC-Rio - Certificação Digital Nº 1913106/CA

Chapter 5. Structural Analysis 35
Figure 5.4: Counterfactual Banking Coverage
Notes: Counterfactual Municipalities are the Municipalities which are covered by Caixa butwould not be in the Counterfactual where λ is forced to zero, that is, if Caixa did not conferany monetary value to distributing benefits to Bolsa Família Beneficiaries.
municipalities that were covered only by Caixa but would not be if λ = 0.Coverage is concentrated in municipalities in poor regions such as the interiorof the Piauí and Tocantins states and the North of Minas Gerais.
Counterintuitively, few municipalities from the Northern region of Brazilare included in the counterfactual. It may seem strange since it is a region withlots of poor municipalities and a high percentage of Bolsa Família beneficiaries(Figure 3.5). However, the Northern municipalities are, on average, territoriallyextensive municipalities that, even though they have a small population densityand low urbanization rates, have relatively high populations. Indeed, theaverage population for Northern municipalities in 2004 was 33,995, the second-highest for any Brazilian Region.
Thus, the model considers that it is lucrative to cover these markets,even if the Bolsa Família program did not exist. It might suggest thatthe counterfactual results are being underestimated since a relatively highpercentage of the population lives in remote rural areas and would not haveaccess to banking services even if it opened in the main municipality district.
Table 5.3 compares municipalities in the counterfactual with municipali-ties that would be covered by some bank in the counterfactual and are coveredin the data.
In all years of our sample, Caixa enters municipalities with a smaller
DBD
PUC-Rio - Certificação Digital Nº 1913106/CA

Chapter 5. Structural Analysis 36
Figure 5.5: Counterfactual Banking Coverage in 2004
Notes: Counterfactual Municipalities are the Municipalities which are covered by Caixa butwould not be in the Counterfactual where λ is forced to zero, that is, if Caixa did not conferany monetary value to distributing benefits to Bolsa Família Beneficiaries.
population and GDP per capita and a higher proportion of Bolsa Famíliabeneficiaries. Comparison of the groups in 2004 makes the contrast clear:Caixa’s counterfactual municipalities have an average population, GDP percapita and percentage of Bolsa Família beneficiaries of 4,342, 3,242 and 5.1,while covered municipalities had 39,109, 7,915, and 2.9, respectively. Thiscontrast remains in the following years.
DBD
PUC-Rio - Certificação Digital Nº 1913106/CA

Chapter 5. Structural Analysis 37
Table 5.3: Characteristics of Counterfactual Municipalities
Counterfactual Municipalities Covered Municipalities
Year Population GDP per Capita Beneficiaries N Population GDP per Capita Beneficiaries N2004 4,342 3.242 0.051 949 39,109 7.915 0.029 4,516
(2,090) (1.765) (0.037) (215,885) (9.33) (0.025)2005 4,234 3.754 0.074 1,020 40,162 8.198 0.049 4,464
(2,105) (2.029) (0.039) (219,409) (9.838) (0.031)2006 2,881 3.371 0.111 166 35,107 8.225 0.069 5,285
(1,108) (1.315) (0.039) (204,171) (9.708) (0.038)2007 3,429 3.929 0.129 353 35,687 9.566 0.084 5,102
(1,339) (1.609) (0.039) (206,345) (11.089) (0.044)2008 2,293 4.549 0.135 45 35,085 10.39 0.084 5,380
(801) (1.851) (0.037) (203,778) (12.207) (0.045)2009 4,045 5.566 0.111 739 39,759 11.698 0.08 4,727
(1,761) (2.589) (0.04) (218,528) (12.136) (0.044)
Notes: Counterfactual Municipalities are the Municipalities which are covered by Caixa but would not be in the Counterfactualwhere λ is forced to zero, that is, if Caixa did not confer any monetary value to distributing benefits to Bolsa Família Beneficiaries.Covered Municipalities are the Municipalities which are both covered in a given year and would still be covered in its counterfactual.
Results reveal Caixa’s efforts to expand its operations to remote and poorregions which, although not profitable to other Banks, have a high percentageof Bolsa Família beneficiaries.
DBD
PUC-Rio - Certificação Digital Nº 1913106/CA
6Reduced Form Analysis
6.1Empirical Strategy
This section presents evidence that many vulnerable people can onlyeffectively access cash transfer policies when there is a Caixa agency or bankingcorrespondent in the municipality. Since CCTs are focused on the poor andextremely poor, often with small children, families may face difficulties totravel great distances, and accessibility concerns may be of great importance.As explained in Section 1, benefits from Bolsa Família are canceled if notwithdrawn in 6 months. I will investigate if cancellations rise when Caixa leavesa municipality and, conversely, if cancellations decline when Caixa enters.
The natural setting for the analysis is a Differences-in-Differences modelwith staggered adoption. There is booming literature in Econometrics thatproposes new and improved procedures for estimating this type of model,systematized and summarized by Baker et al. (2021). Unfortunately, in thiscase, there are units that both start and stop being treated (Caixa opensand closes branches) along the sample, which do not allow the use of the mainsuggested specifications and tests by Athey & Imbens (2018), Goodman-Bacon(2018) and Callaway & Sant’Anna (2020), all designed with the assumptionthat a treated unit will remain treated for the duration of the analysis.
Therefore, my main specification is a simple Differences-in-Differencesapproach with variation in treatment timing, noting that the effect’s interpre-tation is not as straightforward as one would wish. The final estimate will be aweighted average of several comparisons between treated and not treated unitsalong different periods, possibly making some of the treated units have nega-tive weights in the final reported coefficient. Model’s identification essentiallyrelies on Caixa’s Coverage’s timing and its association with a decline in thenumber of canceled benefits.
The estimated equation is given by:
Yit = β0 + β1Caixait + β2Xit + φi + ηt + εit (6-1)Where Yit is the number of Cancelled Benefits per thousand beneficiaries,
Caixait indicates Caixa’s Agency or Banking correspondent coverage in month
DBD
PUC-Rio - Certificação Digital Nº 1913106/CA
Chapter 6. Reduced Form Analysis 39
t at municipality i, Xit is the vector of covariates (log(GDP per Capita) andlog(Population)), φi is a municipality fixed effect, ηt is a month-year fixedeffect, and εit is the error term. the coefficient of interest is β1. This settingmakes it explicit that banks are allowed to enter and leave municipalities atany period, allowing control units to become treated and vice-versa. It is anessential feature of our model because the entrance and exit decisions constitutea significant study aspect.
There may exist concerns regarding Caixa’s coverage exogeneity. Asestablished in the previous section, Caixa’s coverage decisions are partlymotivated by the distribution of the PBF program, making the coverageregressor possibly endogenous to the number of canceled benefits. There isno simple way to solve this identification problem. The paper tests severaldifferent specifications and placebo tests to increase confidence in the effects,but some inherent uncertainty is associated with the identification.
6.2Main Results
Table 6.1 presents the main results. I am mostly interested in PanelA, which measures the impact of Caixa’s coverage on the number of can-celed benefits per thousand beneficiaries. The first column, which reports thesimplest regression with no controls and fixed effects, has a negative coeffi-cient that is significant at the 10% level. The other three columns, which addlog(GDP per Capita) and log(Population) controls, municipality fixed effectsand time fixed effects, respectively, all report negative coefficients which aresignificant at the 1% level.
Our main specification described by Equation 6-1, is reported in Column4. It indicates that Caixa’s coverage, on average, prevents 1.980 canceledbenefits from the Bolsa Família program for every thousand beneficiaries.Considering the dependent variable’s sample mean is 20, Caixa’s coverageaccounts for a decrease of 9.9% in the number of canceled benefits.
To increase confidence in the results, I also estimated the same equations,using Banco do Brasil and Privates Banks’ coverage - banks that do notdistribute Bolsa Família benefits - as our dependent variables. Since Caixais the only bank authorized to pay the benefits, we would expect that otherbanks’ coverage does not affect the program. Estimates are reported in Panel Band C of Table 6.1. In both panels, some coefficients are significant at 1% butare not robust, varying between positive and negative and losing significance,depending on the specification. No panel can replicate the result of negativeand significant coefficients in Column 4, which controls for the other primary
DBD
PUC-Rio - Certificação Digital Nº 1913106/CA

Chapter 6. Reduced Form Analysis 40
Table 6.1: Regressions linking Caixa Econômica Federal’s Coverage to BolsaFamília’s Cancelled Benefits.
Dependent Variable: Cancellations per 1000(1) (2) (3) (4)
Panel A: Caixa Econômica Federal
Caixa Coverage −0.687∗ −1.048∗∗∗ −4.949∗∗∗ −1.980∗∗∗(0.356) (0.384) (0.673) (0.563)
Panel B: Banco do Brasil
BB Coverage −1.125∗∗∗ 1.937∗∗∗ −1.436 −0.239(0.304) (0.334) (0.945) (0.790)
Panel C: Private Banks
Private Coverage −3.053∗ −1.088 7.538∗∗∗ 8.830∗∗∗(1.754) (1.923) (2.523) (2.106)
Municipality Fixed Effects No No Yes YesTime Fixed Effects No No No YesControls No Yes Yes YesObservations 388,786 325,555 325,555 325,555Mean of Dependent Variable 20.8 20.0 20.0 20.0Coverage is defined as the presence of at least one Agency or Banking Correspondentin the municipality. Standard errors in parenthesis, clustered at the municipalitylevel. Every regression on each column has the same number of observations.Controls used are log(GDP per Capita) and log(Population). ∗ p < 0.1; ∗∗ p < 0.05;∗∗∗ p < 0.01.
sources of confounding variation.Since the number of observations is high, some significant coefficients are
expected, even though they disappear in some specifications. Because PanelA is the only robust set of regressions, there is increased credibility to thehypothesis that Caixa’s coverage of the municipality matters for access to theBolsa Família program.
The relevance of the time fixed effects can be noted by comparingthe magnitude of Columns 3 and 4 from Panel A. The steep decline inthe magnitude of the effect suggests that there are also relevant variablessuch as the macroeconomic environment or federal government priorities thatsignificantly affect the number of canceled benefits.
There is a reduction in the sample size of 63,231 observations from the
DBD
PUC-Rio - Certificação Digital Nº 1913106/CA

Chapter 6. Reduced Form Analysis 41
first to the second columns because municipal GDP data from 2019 is still notavailable in Brazil. It may be an explanation for the smaller effects in the firstcolumn. Cancellations per thousand beneficiaries are much higher in 2019 inall regions, probably due to the new government’s different priorities. It maydilute the effect of Caixa’s coverage.
These results suggest that, when there is no bank in the municipality,some families cannot afford to travel to the nearest municipality with anauthorized bank, resulting in lost access to the CCT program. The inability towithdraw benefits is not surprising since, in our sample, we registered familiesthat needed to travel more than 200 Kilometers to access their benefits. Also,beneficiaries are families below the poverty line which have small kids in theirhousehold. These families would need to lose a day’s job and find childcare totravel to the nearest agency, and sometimes the bus ticket may cost more thanthe actual benefits they are entitled to receive.
Banking infrastructure is, therefore, a relevant aspect for access toCCTs in developing countries. It may be trivial in developed economies,but accessibility concerns remain an issue that needs to be addressed whenimplementing programs directed to low-income families.
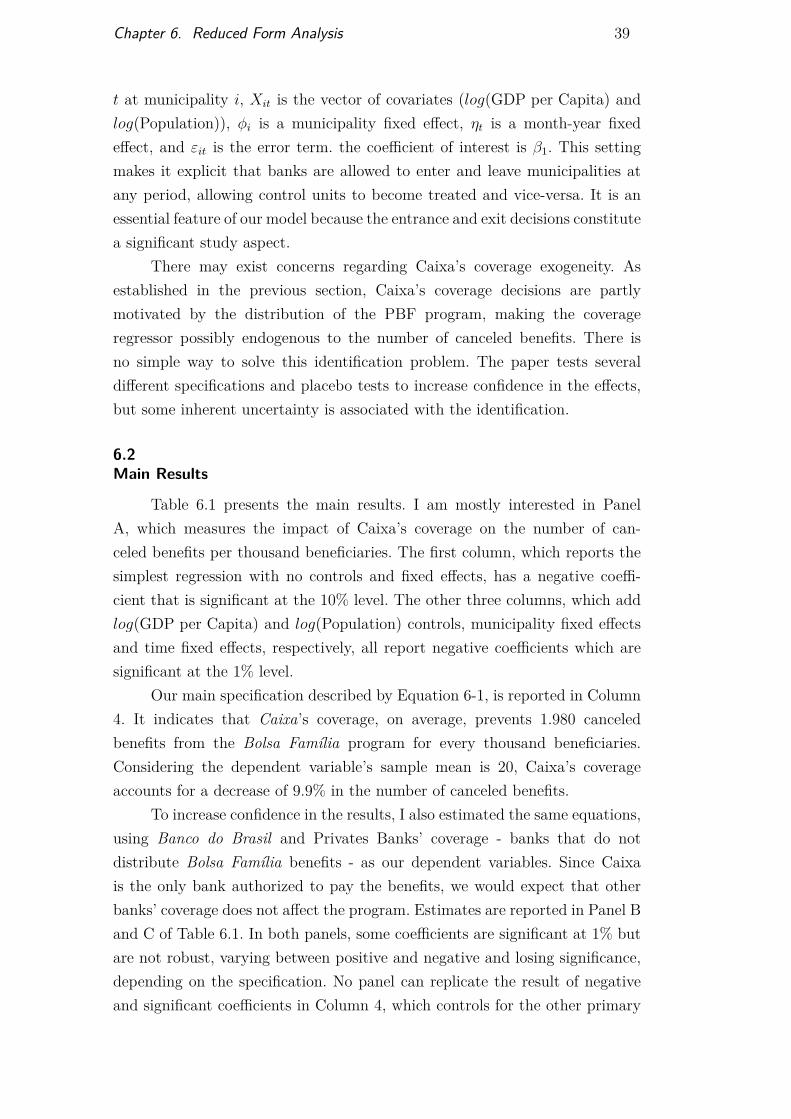
6.3Event Study
Another possible setup to evaluate our framework is the Event Studyspecification. It allows us to see the intervention dynamics and verify evenfurther that the investigated hypothesis holds in other settings. Ideally, thespecification would follow Sun & Abraham (2020), with a saturated modelinteracted with cohort dummies. Unfortunately, I cannot include all leadsand lags in our estimation since, in our sample, Caixa’s is seldom absentof a municipality for more than four months. It happens because we onlyhave Cancellation data from 2014 onwards when Caixa’s coverage is alreadyconsiderable.
The estimation of the Sun & Abraham (2020) method would be usefulto certify that we are using the appropriate model and to allow us to estimatewhat happens after six months of Caixa’s entrance, which is the limit forwithdrawal of benefits defined by law. For that, we would need the data oncanceled benefits since 2004, which are not consolidated at the Ministério deDesenvolvimento Social (MDS).
Considering this limitation, the estimated equation is given by:
Yip = β0 +∑
−6≤p≤4,p 6=−1
β1pCaixaip + β2Xip + φi + ηp + εip (6-2)
DBD
PUC-Rio - Certificação Digital Nº 1913106/CA

Chapter 6. Reduced Form Analysis 42
Period p is defined as the distance in months to Caixa’s entrance inthe municipality, with negative values indicating that Caixa is yet to openits branch. Yip is the number of Cancelled Benefits per thousand beneficiaries,Caixaip indicates Caixa’s Agency or Banking correspondent coverage in periodp at municipality i, Xit is the vector of covariates (log(GDP per Capita) andlog(Population)), φi is a municipality fixed effect, ηt is a month-year fixedeffect, and εit is the error term. the coefficient of interest are β1p.
This specification is particularly useful to verify if there is any antic-ipation behavior and if the effects are lasting. Anticipating behavior wouldundermine the central hypothesis since it is not compatible with access prob-lems. Also, understanding the duration of the effect can give better insight intowhat happens at uncovered municipalities.
Estimated coefficients are reported in Figure 6.3. The graph shows thatcancellations decline right after Caixa arrives at a given municipality, and thereis no anticipation. Results are compatible with the theory that cancellationsare mainly due to difficulties of access generated by Caixa’s distance fromfamilies.
Figure 6.1: Event Study Specification
Notes: Confidence Interval of 95%. Coverage is defined as the presence of at least one Agencyor Banking Correspondent in the municipality. Standard errors clustered at the municipalitylevel. Controls used are log(GDP per Capita) and log(Population).
Also, effects tend to get smaller after the peak, two to three months
DBD
PUC-Rio - Certificação Digital Nº 1913106/CA

Chapter 6. Reduced Form Analysis 43
after Caixa enters the municipality. It suggests a stock of beneficiaries cannotwithdraw their benefits and get canceled early, while the other beneficiarieshave fewer access problems. The main problem in this scenario is that preciselythe most impoverished and vulnerable families, which are the policy’s focus,are unable to access the program when there is no banking coverage.
Reported effects are bigger than those from the main results section, es-pecially during the second and third months. It suggests that a reasonablenumber of families had not cashed out their benefits for months before Caixa’scoverage since benefits can only be canceled after six months without with-drawals. It would be a difficult phenomenon to justify in normal circumstancesbecause families with such levels of income are rarely able to save money andcould never afford to leave their benefits at their accounts for several months.However, the hypothesis of access difficulties can easily justify this behavior:families do not withdraw because they cannot do so, and banking infrastruc-ture is required for full access to the program.
To extend this analysis, we would need the complete data on cancel-lations. If I could analyze the period where Caixa had a smaller coverage, Iwould be able to compare the municipalities for up to six months after Caixaenters the municipality, allowing a complete assessment of the coverage effects.Nevertheless, existing data already indicates that access is indeed a problemin developing countries and should be a relevant variable when implementingpolicy.
6.4Robustness
As a first robustness exercise, I replicated the regressions estimated in Ta-ble 6.1 but changed the main regressor to Banks (or banking Correspondents)by ten thousand inhabitants. I use the same main specification indicated inEquation 6-1.
Table 6.4 reports the estimates. Panel A’s estimates are all significantat the 1% level, which corroborates the hypothesis that Caixa’s coverage isrelevant for the access of the Bolsa Família program.
Panel B and Panel C also remain not robust. Even though all estimatesare significant at the 1% level, coefficients oscillate between positive andnegative and are smaller than those of Panel A. Again; the high significancecan be justified by the high number of observations in the regressions.
Compared to the main regressions, the effects are smaller. It happensbecause, conceptually, we measure something different. Instead of evaluatingthe impact of Caixa’s coverage, we measure the effect that one more Caixa’s
DBD
PUC-Rio - Certificação Digital Nº 1913106/CA

Chapter 6. Reduced Form Analysis 44
agency or banking correspondent in the municipality has on the number ofcanceled benefits per thousand beneficiaries. Smaller effects indicate that thefirst Caixa branch to enter the municipality is the one that matters for access tobenefits, with the other branches diluting the effect and making the coefficientsmaller.
Table 6.2: Regressions linking Caixa’s Agencies per 10 Thousand to BolsaFamília’s Cancelled Benefits.
Dependent Variable: Cancellations per 1000(1) (2) (3) (4)
Panel A: Caixa Econômica Federal
Caixa per 10 Thousand −1.728∗∗∗ −0.525∗∗∗ −1.252∗∗∗ −0.288∗∗∗(0.026) (0.032) (0.082) (0.070)
Panel B: Banco do Brasil
BB per 10 Thousand 0.980∗∗∗ 0.307∗∗∗ −0.157∗∗∗ −0.205∗∗∗(0.018) (0.022) (0.053) (0.046)
Panel C: Private Banks
Private Banks per 10 Thousand 0.602∗∗∗ 0.253∗∗∗ −0.180∗∗∗ −0.044∗∗∗(0.006) (0.007) (0.018) (0.016)
Municipality Fixed Effects No No Yes YesTime Fixed Effects No No No YesControls No Yes Yes YesObservations 388,786 325,555 325,555 325,555Mean of Dependent Variable 20.8 20.0 20.0 20.0Coverage is defined as the presence of at least one Agency or Banking Correspondentin the municipality. Standard errors in parenthesis, clustered at the municipality level.Every regression on each column has the same number of observations. Controls usedare log(GDP per Capita) and log(Population). ∗ p < 0.1; ∗∗ p < 0.05; ∗∗∗ p < 0.01.
In the preferred specification, one marginal Caixa agency or bankingcorrespondent decreases cancellations by 1.44%, which contributes to the storythat the first agency is the most important and that the difficulty in access iseffectively the capacity to travel to the nearest municipality to withdraw thebenefits. It means that, for most municipalities, one agency should be enoughto guarantee the proper distribution of benefits.
As a second robustness exercise, I estimated the same differences-in-differences model, changing the main regressor to the nearest bank’s distance
DBD
PUC-Rio - Certificação Digital Nº 1913106/CA

Chapter 6. Reduced Form Analysis 45
in Kilometers. Again, I use the same main specification indicated in Equation6-1.
Table 6.4 reports the estimated coefficients. Contrary to previous esti-mates, Panel A’s effects are not robust. The interpretation of these resultsis that the marginal effect on cancellations per 1000 beneficiaries of a higherdistance to the nearest Caixa branch is zero. The only regression that reportsresults that would be intuitive is Column 3, which indicates that one moreKilometer to the nearest Caixa would increase cancellations by 0.36%. How-ever, we cannot infer that this effect is different from zero.
Panel B and C are also not robust and present similar patterns to PanelA. It indicates that there is probably no effect of Distance on Cancellations,despite one significant estimate.
Table 6.3: Regressions linking Distance to the Nearest Caixa EconômicaFederal to Bolsa Família’s Cancelled Benefits.
Dependent Variable: Cancellations per 1000(1) (2) (3) (4)
Panel A: Caixa Econômica Federal
Distance to Caixa −0.037∗∗∗ −0.007 0.071∗∗∗ 0.017(0.012) (0.012) (0.020) (0.017)
Panel B: Banco do Brasil
Distance to BB −0.074∗∗∗ −0.164∗∗∗ 0.067 −0.007(0.015) (0.016) (0.047) (0.039)
Panel C: Private Banks
Distance to Private Bank 0.145∗ −0.111 0.005 0.001(0.079) (0.093) (0.108) (0.090)
Municipality Fixed Effects No No Yes YesTime Fixed Effects No No No YesControls No Yes Yes YesObservations 388,786 325,555 325,555 325,555Mean of Dependent Variable 20.8 20.0 20.0 20.0Coverage is defined as the presence of at least one Agency or Banking Correspon-dent in the municipality. Standard errors in parenthesis, clustered at the munici-pality level. Every regression on each column has the same number of observations.Controls used are log(GDP per Capita) and log(Population). ∗ p < 0.1; ∗∗ p < 0.05;∗∗∗ p < 0.01.
DBD
PUC-Rio - Certificação Digital Nº 1913106/CA

Chapter 6. Reduced Form Analysis 46
Despite not yielding significant estimates, the results in Table 6.4 corrob-orate the theory that the critical aspect of access to conditional cash transferprograms is the infrastructure coverage in each municipality. Conditional onCaixa’s absence, it does not matter whether the family needs to withdraw itsbenefits in a close or a far away municipality. Traveling to another munici-pality entails high costs for these families, as stated in Section 6.2, because itmeans losing a day of work (when someone in the family is employed), havingto arrange childcare, and buying an expensive bus ticket.
DBD
PUC-Rio - Certificação Digital Nº 1913106/CA

7Conclusion
This article studies the relationship between Public Banks and thedistribution of CCT programs. First, I use an entry model with heterogeneousbanks to determine the Bolsa Família program’s impact on banking coverage.I find that, because Caixa values expanding coverage to reach potentialbeneficiaries, coverage was significantly accelerated in remote areas, with morethan 1000 extra municipalities being covered at one point. Municipalitiescovered by Caixa are more impoverished, less populated, and have a higherpercentage of PBF beneficiaries.
Then, exploiting variation in Caixa’s coverage and Bolsa Família’s can-cellation rule, I estimate that Caixa’s presence in a municipality reduces thenumber of cancellations of Bolsa Família by 9,9%. Results are similar in anevent-study model but with reductions in cancellations of up to 50% at thesecond month of banking coverage. Results also indicate that there is no an-ticipation, and the effects are somewhat lasting.
I also perform two robustness exercises. I use a similar approach tothe main specification but replacing Caixa’s coverage with the number ofCaixa’s per 10 thousand inhabitants and distance to the nearest Caixa. Effectsremain significant in the first exercise, although smaller, but are not robustin the second. These results indicate that opening additional points of saleon previously covered municipalities or decreasing the distance to the nearestagency without covering the municipality are two ineffective policies. Travelingto another municipality entails high costs for these low-income families, butone point of sale is usually enough to guarantee satisfactory distribution ofbenefits.
This paper’s main takeaway is that infrastructure plays an essentialrole in providing access to CCT programs in developing countries. Also, thedistribution of policies may cause externalities to bank coverage. Specific to theBrazilian case, this paper finds that PBF improved banking coverage duringthe 2000s in remote and rural areas. Further work should verify if the extracoverage has further impacted poverty and inequality levels in these regions.
This paper results’ bring a few direct policy implications: first, assuringthat beneficiaries effectively access the program is an essential aspect of policy
DBD
PUC-Rio - Certificação Digital Nº 1913106/CA

Chapter 7. Conclusion 48
implementation. Second, using institutions with an aligned interest in policydistribution may be a valuable solution to guarantee access to benefits. Third,banking institutions’ priorities may be just as relevant as competition effectsto determine equilibrium coverage.
DBD
PUC-Rio - Certificação Digital Nº 1913106/CA

Bibliography
BRESNAHAN, T. F.; REISS, P. C.. Entry and competition in concentratedmarkets. Journal of political economy, 99(5):977–1009, 1991.
FISZBEIN, A.; SCHADY, N. R.. Conditional cash transfers: reducingpresent and future poverty. The World Bank, 2009.
SOARES, F. V.; RIBAS, R. P. ; OSÓRIO, R. G.. Evaluating the impactof brazil’s bolsa familia: Cash transfer programs in comparativeperspective. Latin American Research Review, p. 173–190, 2010.
GERTLER, P.. Do conditional cash transfers improve child health?evidence from progresa’s control randomized experiment. Americaneconomic review, 94(2):336–341, 2004.
GARCÍA, S.; SAAVEDRA, J. E.. Educational impacts and cost-effectiveness of conditional cash transfer programs in developingcountries: A meta-analysis. Review of Educational Research, 87(5):921–965, 2017.
BARBER, S. L.; GERTLER, P. J.. Empowering women to obtain highquality care: evidence from an evaluation of mexico’s conditionalcash transfer programme. Health Policy and Planning, 24(1):18–25, 2009.
SHEI, A.; COSTA, F.; REIS, M. G. ; KO, A. I.. The impact of brazil’s bolsafamília conditional cash transfer program on children’s health careutilization and health outcomes. BMC international health and humanrights, 14(1):10, 2014.
ZUCCO JR, C.. When payouts pay off: Conditional cash transfers andvoting behavior in brazil 2002–10. American journal of political science,57(4):810–822, 2013.
JOAQUIM, G.; TOWNSEND, R. ; ZHORIN, V.. Optimal contracting andspatial competition among financial service providers. Technicalreport, Working Paper, 2019.
DBD
PUC-Rio - Certificação Digital Nº 1913106/CA

Bibliography 50
GAO, H.; RU, H.; TOWNSEND, R. ; YANG, X.. Rise of bank competition:Evidence from banking deregulation in china. Technical report,National Bureau of Economic Research, 2019.
KUMAR, A.; NAIR, A.; PARSONS, A. ; URDAPILETTA, E.. Expanding bankoutreach through retail partnerships. Correspondent Banks in Brazil,2006.
ASSUNÇÃO, J.. Eliminating entry barriers for the provision of bankingservices: Evidence from ‘banking correspondents’ in brazil. Journalof Banking & Finance, 37(8):2806–2811, 2013.
BANCO CENTRAL DO BRASIL. Relatório de inclusão financeira, n. 1,2010.
MÜLLER, L. H.. Bancos na favela: Relações entre agências bancárias emoradores de uma região urbana alvo de políticas de pacificação.Tempo Social, 29(1):89–107, 2017.
COELHO, C. A.; DE MELLO, J. M. ; FUNCHAL, B.. The brazilian payrolllending experiment. Review of economics and statistics, 94(4):925–934,2012.
COELHO, C. A.; DE MELLO, J. M. ; REZENDE, L..Do public banks competewith private banks? evidence from concentrated local markets inbrazil. Journal of Money, Credit and Banking, 45(8):1581–1615, 2013.
BURGESS, R.; PANDE, R.. Do rural banks matter? evidence fromthe indian social banking experiment. American Economic Review,95(3):780–795, 2005.
ASSUNCAO, J.; MITYAKOV, S. ; TOWNSEND, R. M.. Ownership matters:the geographical dynamics of baac and commercial banks in thai-land. Technical report, Citeseer, 2012.
WIJESIRI, M.; MARTÍNEZ-CAMPILLO, A. ; WANKE, P.. Is there a trade-off between social and financial performance of public commercialbanks in india? a multi-activity dea model with shared inputs andundesirable outputs. Review of Managerial Science, 13(2):417–442, 2019.
SAPIENZA, P.. The effects of government ownership on bank lending.Journal of financial economics, 72(2):357–384, 2004.
DBD
PUC-Rio - Certificação Digital Nº 1913106/CA

Bibliography 51
COLEMAN, N.; FELER, L.. Bank ownership, lending, and local economicperformance during the 2008–2009 financial crisis. Journal of Mone-tary Economics, 71:50–66, 2015.
ANDRADE, R. P. D.; DEOS, S.. A trajetória do banco do brasil no períodorecente, 2001-2006: banco público ou banco estatal" privado"?Revista de Economia Contemporânea, 13(1):47–79, 2009.
LOUREIRO, E.; MADEIRA, G. ; BADER, F.. Expansão dos correspondentesbancários no brasil: uma análise empírica. Texto para discussão, (433),2011.
SOARES, F. V.; SOARES, S.; MEDEIROS, M. ; OSÓRIO, R. G.. Programas detransferência de renda no brasil: impactos sobre a desigualdade.2006.
NERI, M. C.; VAZ, F. M. ; SOUZA, P. H. G. F. D.. Efeitos macroeconômicosdo programa bolsa família: uma análise comparativa das transfer-ências sociais. Programa Bolsa Família: uma década de inclusão e cidadania.Brasília: Ipea, 1:193–206, 2013.
RIBEIRO, F. G.; SHIKIDA, C. ; HILLBRECHT, R. O.. Bolsa família: Umsurvey sobre os efeitos do programa de transferência de rendacondicionada do brasil. Estudos Econômicos (São Paulo), 47(4):805–862,2017.
LIMA, A.; PAES, A.; SAMBIASE, A.; HULLEN, A.; RIBEIRO, B.; BORGES, C. ;OTHERS. Manual do pesquisador-programa bolsa família [internet].Brasília: Ministério do Desenvolvimento Social, 2018.
MEDEIROS, M.; BRITTO, T. ; SOARES, F.. Programas focalizados detransferência de renda no brasil: contribuições para o debate. 2007.
REISS, P. C.. Empirical models of discrete strategic choices. TheAmerican Economic Review, 86(2):421–426, 1996.
MAZZEO, M. J.. Product choice and oligopoly market structure. RANDJournal of Economics, p. 221–242, 2002.
BAKER, A.; LARCKER, D. F. ; WANG, C. C.. How much should wetrust staggered difference-in-differences estimates? Available at SSRN3794018, 2021.
DBD
PUC-Rio - Certificação Digital Nº 1913106/CA
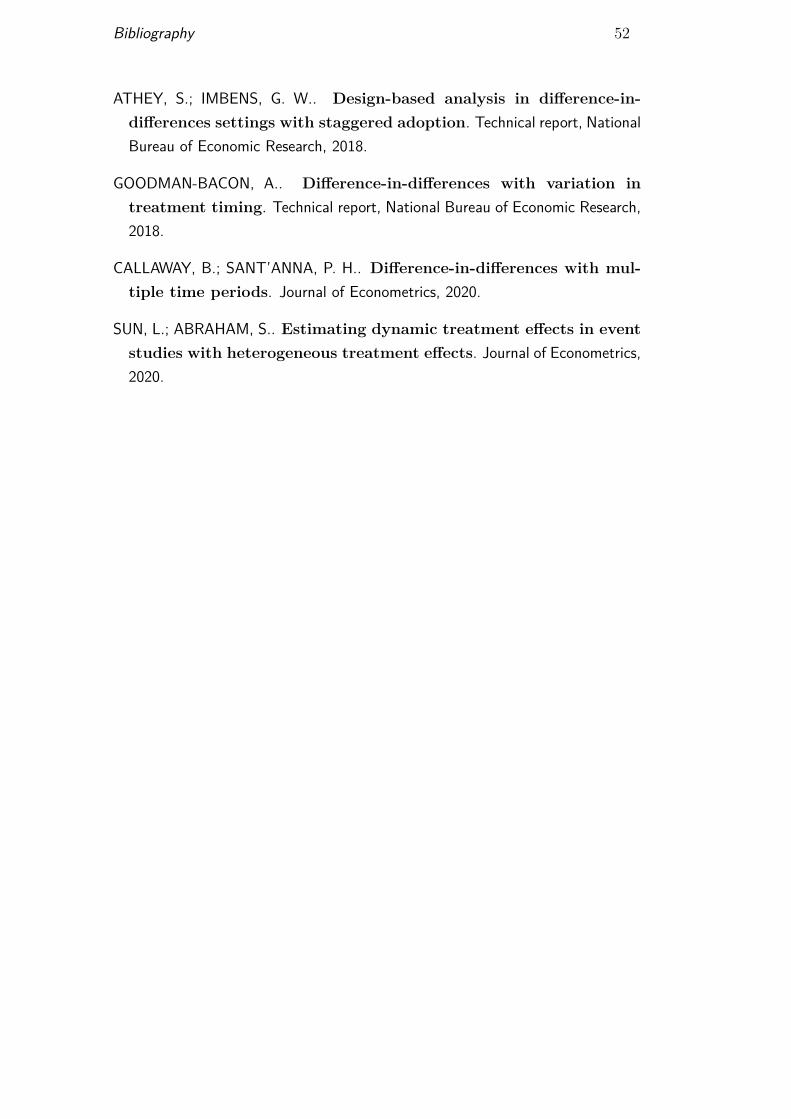
Bibliography 52
ATHEY, S.; IMBENS, G. W.. Design-based analysis in difference-in-differences settings with staggered adoption. Technical report, NationalBureau of Economic Research, 2018.
GOODMAN-BACON, A.. Difference-in-differences with variation intreatment timing. Technical report, National Bureau of Economic Research,2018.
CALLAWAY, B.; SANT’ANNA, P. H.. Difference-in-differences with mul-tiple time periods. Journal of Econometrics, 2020.
SUN, L.; ABRAHAM, S.. Estimating dynamic treatment effects in eventstudies with heterogeneous treatment effects. Journal of Econometrics,2020.
DBD
PUC-Rio - Certificação Digital Nº 1913106/CA

AAppendix
A.1Estimation Procedure
Once the model predicts a unique equilibrium, the empirical estimationof the model is quite simple. It relies on the principle of revealed preference;if a specific outcome is observed on the market, it must be that this wasthe most profitable choice for each bank, given other bank’s choices. Thealgorithm for the estimation is as follows: First, I draw k shocks (εc, εm), whichI assume follows a bivariate normal distribution. With these draws, I determinethe economy’s simulated equilibrium for each shock and a given value of theparameters. Then, I use the inequalities derived from the model (Equations5-2, 5-3, and 5-4) to compute the number of times the observed outcomes areequal to the predicted in each market m. The product of these ratios generatesa likelihood function of the parameters. The likelihood function is given by:
L =∏m
Pm(α, λ, F,Γcc,Γco,Γoo,Γoc)k
(A-1)
Where Pm(α, λ, F,Γcc,Γco,Γoo,Γoc) is the number of times (out of k) thatthe simulated outcome is equal to the observed outcome in market m. As kgoes to infinity, this function converges to the probability of observing eachmarket’s outcomes, given the parameters. Maximizing the likelihood functionwith respect to the parameters (α, λ, F,Γcc,Γco,Γoo,Γoc) yields the estimatedvalues. In the reported results, k was set to 200.
Since the objective function is a product of indicator functions, its surfaceis very rough and discontinuous, and optimizing it is a complex task. Tosolve this problem, I implement a smoothing procedure, similar to Mazzeo(2002), which consists of replacing each indicator function derived from theprofit inequalities I(Πij) with Φ(Πij/0.1), where Φ is the cumulative normaldistribution.
Finally, to generate standard errors for our estimates, I employed abootstrapping scheme where N samples with replacement were generated withthe same size as our initial sample, and the parameters were estimated for eachof the samples. Point estimation was the average of estimations, and standard
DBD
PUC-Rio - Certificação Digital Nº 1913106/CA

Chapter A. Appendix 54
errors are the standard deviation of the estimates. Because of computationallimitations, N was set to 100.
A.2Credit Trends
Figure A.1: Credit per Municipality Trends
Notes: Both Agencies and Banking Correspondents were considered in the graph. Credit’sunit is Million Reais (R$). Each dot represents a year between 2001 and 2010. Version withyear indicators.
DBD
PUC-Rio - Certificação Digital Nº 1913106/CA

Chapter A. Appendix 55
Figure A.2: Credit per Agency Trends
Notes: Both Agencies and Banking Correspondents were considered in the graph. Credit’sunit is Million Reais (R$). Each dot represents a year between 2001 and 2010. Version withyear indicators.
DBD
PUC-Rio - Certificação Digital Nº 1913106/CA

Chapter A. Appendix 56
A.3Complete Estimates of the Model
Table A.1: Complete Estimates of the Model
Year α λ Ratio F Γcc Γco Γoo Γoc2004 3.72e-08 1.48e-05 3.98e+02 6.29e-04 9.77e-02 1.00e-04 1.28e-03 1.21e-04
(2.14e-07) (2.96e-05) (1.30e-03) (2.20e-03) (3.64e-04) (2.14e-03) (2.77e-04)2005 4.06e-08 1.76e-05 4.34e+02 7.63e-04 9.74e-02 5.51e-05 1.51e-03 7.07e-05
(2.55e-07) (2.93e-05) (1.39e-03) (2.28e-03) (1.57e-04) (2.28e-03) (1.96e-04)2006 6.51e-08 1.18e-05 1.82e+02 6.62e-04 9.65e-02 1.14e-04 2.41e-03 5.10e-05
(3.00e-07) (2.35e-05) (1.44e-03) (3.34e-03) (3.98e-04) (3.41e-03) (2.64e-04)2007 6.33e-08 5.12e-06 8.09e+01 9.66e-04 9.53e-02 6.52e-05 3.29e-03 1.44e-04
(3.65e-07) (1.80e-05) (1.82e-03) (4.56e-03) (2.59e-04) (4.72e-03) (5.06e-04)2008 1.10e-07 8.02e-06 7.30e+01 1.18e-03 9.32e-02 9.69e-05 5.06e-03 7.82e-05
(3.26e-07) (3.15e-05) (2.52e-03) (6.03e-03) (3.23e-04) (6.41e-03) (2.42e-04)2009 3.88e-08 1.06e-05 2.74e+02 1.01e-03 9.06e-02 1.04e-04 7.88e-03 1.33e-04
(4.27e-07) (2.80e-05) (2.06e-03) (9.28e-03) (2.87e-04) (9.34e-03) (5.14e-04)2010 1.33e-07 1.28e-05 9.62e+01 2.27e-04 9.00e-02 6.33e-05 9.44e-03 8.34e-05
(3.52e-07) (2.65e-05) (5.81e-04) (1.06e-02) (1.62e-04) (1.07e-02) (3.16e-04)2011 1.04e-07 9.94e-06 9.57e+01 1.36e-04 8.76e-02 2.97e-05 1.20e-02 5.64e-05
(3.05e-07) (2.40e-05) (3.77e-04) (1.33e-02) (1.80e-04) (1.33e-02) (1.66e-04)2012 2.91e-07 -6.00e-06 -2.06e+01 1.16e-04 5.83e-02 3.60e-05 4.14e-02 3.72e-05
(4.64e-07) (2.94e-05) (4.39e-04) (2.43e-02) (1.75e-04) (2.45e-02) (2.25e-04)2013 3.37e-07 -7.28e-06 -2.16e+01 1.29e-04 5.98e-02 3.25e-05 4.00e-02 6.97e-06
(4.19e-07) (3.84e-05) (3.18e-04) (2.19e-02) (2.71e-04) (2.18e-02) (1.64e-04)2014 3.95e-07 8.93e-06 2.26e+01 1.05e-04 6.98e-02 -1.07e-05 3.00e-02 7.38e-06
(4.73e-07) (3.79e-05) (2.91e-04) (1.92e-02) (3.38e-04) (1.92e-02) (2.12e-04)2015 2.41e-07 2.52e-06 1.05e+01 6.60e-05 7.20e-02 4.03e-05 2.78e-02 -1.61e-05
(4.29e-07) (2.80e-05) (1.96e-04) (1.88e-02) (1.80e-04) (1.88e-02) (2.27e-04)2016 2.35e-07 -2.53e-06 -1.08e+01 7.86e-05 6.73e-02 2.46e-05 3.26e-02 -3.24e-05
(3.81e-07) (4.12e-05) (2.62e-04) (2.09e-02) (2.61e-04) (2.09e-02) (2.24e-04)2017 2.60e-07 -1.10e-05 -4.23e+01 1.06e-04 6.31e-02 3.32e-05 3.67e-02 2.41e-05
(3.77e-07) (3.73e-05) (3.27e-04) (2.34e-02) (1.13e-04) (2.34e-02) (1.50e-04)
Notes: Ratio is not directly estimated from the model. It is defined as λα .
DBD
PUC-Rio - Certificação Digital Nº 1913106/CA