
O TESTEMUNHO DA MAGNIFICENCIA REGIA NA CORTE DE AVIS NO SECULO XV
Int. J. Biol. Res., 1(2): 105-114, 2013.
MATERNAL INVESTMENT OF BIOMASS IN PODS, SEEDS AND SEED PACKAGING IN DELONIX REGIA (BOJER) RAFIN (CAESALPINIACEAE)
D. Khan and Zulfiqar Ali Sahito*
Department of Botany, University of Karachi, Karachi-75270, Pakistan.
ABSTRACT
Biomass investment in pods, seeds and seed packaging has been studied in a tree of Delonix regia (Bojer) Rafin from the campus of the University of Karachi, Pakistan. The pods are woody and tardily dehiscent or indehiscent for long period of time and seeds are mottled and transversely placed in the pod. The weight of air-dried pods (PW) varied from 19.40 to 98.36 g (CV = 34.23%) and averaged to 61.6797 ± 2.5238g. The pod weight distributed normally [Kolmogorov-Smirnov z (KS-z) = 0.792; p<0.557]. The brood size (TNS, number of normal seeds per pod (sensu Uma Shaanker et al., 1998) averaged to 13.43 ± 0.668 (CV: 41.63%). As the value of KS-z, 0.764, was insignificant (p<0.603) the brood size tended to be normally distributed. The seed mass per pod (SWPP) averaged to 5.3435 ± 0. 2995 g per pod and varied by a quantum of 48.64%. The distribution of mean single seed weight for a pod (MSSW) was symmetrical among the pods. It averaged to 0.3951 ± 0.0117g and varied from 0.1414 to 0.5573g. The pericarp mass per pod varied from 18.15 to 89.31g (CV: 33.79%) and averaged to 56.291 ± 2.271g. The pericarp mass tended to be normally distributed. Some 91.45 ± 0.302 % of the pod biomass was allocated to pericarp (seed protection) and 8.52 ± 0.302 % to the seeds (reproductive function). The three parameters of pod (PW, SWPP and TNS) collectively interacted in a model to significantly influence the MSSW (R2 = 0.899). In split sub models, PW coupled with TNS and SWPP coupled with TNS as independent variables influenced MSSW significantly (p<0.0001) and in both cases TNS (brood size) associated with MSSW negatively. The weight of individual seed for a sample of 946 seeds averaged to 397.40 ± 3.936mg varying from 55.81 to 638.10 mg (11.52-fold variation). Seed packaging cost (SPC) in D. regia was 11.912 ± 0.5272 g.g-1.seeds and 4.5493 ± 0.1882 g.seed-1 - quite higher than several pod-dehiscent-legumes. The seed packaging cost (SPC2 = g.g-1.seeds) related with brood size in accordance with a negative power model (exp. = -0.54841) i.e. the investment of biomass in pericarp had a negative trade-off with brood size.
KEYWORDS: Delonix regia, Brood size, Seed weight, Within-pod biomass allocation, Seed packaging cost
INTRODUCTION
Angiospermic seeds developing from ovules are enveloped in Pericarp. Seeds give rise to seedlings and pericarp provide protection and nutrition to seeds and at times dispersal. Pericarp occupies significantly varying proportion of the fruit biomass. Determining within fruit reproductive allocation is important for the understanding of reproductive bionomics and seed size significance in plant life strategy (Chen et al., 2010). The quantification of reproductive allocation at fruit and seed levels has been made in several ecological studies (Willson et al., 1990; Lee et al., 1991; Lord and Westoby, 2006; Martinez et al., 2007; Chen et al., 2010, Khan and Zaki, 2012; Khan and Sahito, 2013; Khan et al., 2013). Some ecologists have been interested in examining the scaling relationship between the seed packaging and the individual seed mass. Such studies are likely to be important and interesting (Mehlman, 1993) since pattern of seed-packaging varies significantly among broadly ecologically similar species and within species (Willson et al., 1990; Chen et al., 2010) and even among fruits within an individual (Khan and Zaki, 2012; Khan and Sahito, 2013; Khan et al., 2013).
In this paper, variation in pod-, and seed-size and seed packaging cost within an individual tree of Delonix regia (Bojer) Rafin (vernacular- Royal Poinciana, Flamboyant, Gul Mohr), a most beautiful ornamental multipurpose legume, is studied. It is native of Madagascar and an endangered species in wild. This spectacular tree bursts into bloom on the onset of summer with scarlet mass of flowers on flat spreading canopy. Its pods and seeds may be used in multiple ways. MATERIALS AND METHODS
Seventy mature dark brown pods from a tree of Delonix regia growing in the campus of University of Karachi were collected in 2012. These pods were air-dried for around 60 days in laboratory. Measurements were made on pods and seeds to determine biomass investment in seed and seed packaging for following parameters after Mehlman (1993) and Chen et al., (2010). 1. Pod weight (PW) of air-dried pods, 2. Total seed weight per pod (SWPP), 3. Number of seeds per pod (TNS, the brood size), 4. Pericarp weight per pod (PWP), 5. Mean single seed weight (MSSW) in a pod, 6. Per cent proportion of pericarp weight to fruit (pod) weight (PPFR), 7. Per cent proportion of seed weight to fruit (pod) weight (PSFR), 8. Pod weight per seed (PWS = PW / TNS), 9. Seed packaging cost per seed (SPC1 = PWP / TNS and 10. Seed packaging cost per g seeds (SPC2 = PWP / SWPP). The weight of each seed recovered from the pods was recorded pod-wise. The location and distribution parameters were calculated for the pod and seed characteristics. The frequency distributions were characterized with skewness (g1) and kurtosis (g2). Kolmogorov-Smirnov z (KS-z) test was performed to detect normal distribution (Sokal and Rholf, 1995). In allometric analysis, the slope of the fitted regression line was compared with the slope of the null line using t-test formula (t = b –H / SEb; df = n -2, where n is the number of samples, t, the t-statistics, b, slope of the fitted line, SEb is the SE of b and H is the slope of null line) (Underwood, 1997).
*, Present Address: University of Chinese Academy of Sciences, Beijing 100039, PR China & The State Key Laboratory of Plant Cell & Chromosome Engineering, Centre of Agricultural Resource Research, Institute of Genetics and Developmental Biology, Chinese Academy of Sciences, 286 Huaizhong Road, Shijiazhuang, Hebei, PR China

D. Khan & Zulfiqar Ali Sahito 106
RESULTS AND DISCUSSION Pod size: Pods of D. regia are 30-60 cm long, 3-5 cm wide and 0.6-0.8 cm in thickness. Pods are tardily dehiscent or even indehiscent even when fallen on the ground. They are green flaccid when young and turn dark brown and woody on maturity. Young pods are edible (Du Puy et al., 1995). They are firm, compressed, parallel-edged, straight, pendent, many-seeded, filled between the seeds with wood and shortly beaked at the tip. The weight of air-dried pods varied from 19.40 to 98.36 g (CV = 34.23%) and averaged to 61.6797 ± 2.5238 g (Table 1). The pod weight distributed normally (KS-z = 0.792; p<0.557) and mostly (74.3% of the pods) concentrated in the region of 50.1 to 98.36g and 25.7% were below 50g in weight. Pods < 20g in weight were only 1.4% of the total pods studied. Only 4 pods (5.71% of the total pods) had one seed each smaller than 100mg.
Table 1. Location and dispersion statistics of pods and seeds of D. regia. Parameter N Min. Max. Mean SE CV (%) G1 G2 KS-z p Curve
(KS-z based) PL (cm) 55 19.0 51.0 31.879 1.0449 24.31 0.271 -0.579 0.680 0.745 Symmetrical TNS 70 4 28 13.43 0.668 41.63 0.421 -0.280 0.764 0.603 Symmetrical PW (g) 70 19.400 98.361 61.6797 2.5238 34.23 -0.273 -0.744 0.792 0.557 Symmetrical SWPP (g) 70 0.8483 9.9730 5.3435 0.29953 41.28 0.069 -1.085 0.663 0.771 Symmetrical PERI (g) 70 18.15 89.31 56.291 2.271 33.79 -0.276 -0.742 0.739 0.646 Symmetrical MSSW (g) 70 0.1414 0.5573 0.3951 0.0117 24.70 -0.073 -0.920 0.969 0.305 Symmetrical PWPS (g) 70 2.3081 10.0014 4.9443 0.19306 32.67 0.657 0.079 0.872 0.433 Symmetrical PPFR 70 83.38 96.20 91.4840 0.3019 2.76 -0.615 1.607 0.670 0.761 Symmetrical PSFR 70 3.8006 16.6189 8.5163 0.3019 29.66 0.615 1.607 0.670 0.761 Symmetrical SPC1 (g.seed-1) 70 1.9245 9.5770 4.5493 0.18816 31.80 0.717 0.247 0.824 0.505 Symmetrical
SPC2 (g.g-1 seeds) 70 5.0172 25.3117 11.912 0.5272 37.03 1.369 1.636 1.323 0.060 + Skewed & Leptokurtic
g1, skewness; g2, kurtosis. sg1 (N: 70) = 0.287; sg2 (N: 70), 0.566. sg1 (N: 55) = 0.322; sg2 (N: 55), 0.634. Key to the acronyms: PL, pod length (cm); TNS, Seeds per pod; PW, pod weight (g); SWPP, Seed yield per pod; PERI, pericarp MSSW, mean single seed weight in a pod; PWPS, pod weight per seed; SPC1, seed packaging cost (g per seed); SPC2. Seed packaging cost (g per g seeds); PPFR, per cent proportion of pericarp mass to fruit mass; PSFR, per cent proportion of seed mass to fruit mass
Brood size: The brood size (number of normal seeds per pod (sensu Uma Shaanker et al., 1998) in D. regia averaged to 13.43 ± 0.668 (CV: 41.63%) and had insignificant positive skewness). Some 50% of the pods had 10 to 20 seeds and 71.4% of the pods had 5 to 20 seeds per pod. None of the pod was, however, completely devoid of seeds. The brood size in D. regia, in present studies, appeared to be lesser than that (20-40) reported by Ali (1973). The brood size of some caesalpiniacean species has been reported by Uma Shaanker et al., (1988) - Bauhinia purpurea (9.9 ± 2.92), Bauhinia recemosa (10.86 ± 6.52), B. ungulata (13.0 ± 10.14), Tamarindus indica (4.59 ± 2.72) and Cassia fistula (78). Based on the study of 101 pods, the brood size in Cassia fistula has been reported to be 55.78 ± 2.29 (ranging from 0 to 110) by Khan and Zaki (2012).
The insignificant value of KS-z (0.764; p<0.603) indicated that the brood size tended to be normally distributed (Table 1; Fig. 1). Uma Shaanker et al., (1988) have also reported the brood size to be normally distributed in Bauhinia recemosa, B. ungulata, and Cassia fistula. Distribution of brood size in C. fistula is also reported to be normal by Khan and Zaki (2012). The distribution of brood size has, however, been reported to significantly vary from the normal in several plants. This trait may be positively skewed (PSD) or negatively skewed (NSD). The pattern of brood may probably come up due to differences in the developmental history specific to the individual pods in the environmental context. PSD in brood size is induced when a minority of ovules develops into mature seeds in most fruits and seed-to-ovule ratio is low i.e. < 50 % and as a result fruits are one to few-seeded (Uma Shaanker et al., 1988). Furthermore, the coefficient of variation for brood size remains quite high. There are, however, examples of some species that accomplish brood size NSD through a maternally regulated pre-fertilization inhibition of pollen grains germination by the stigma. (Ganeshaiah et al., 1986, 1988). In Leucaena, for example the germination of pollen grains is inhibited by the stigma unless a minimum threshold number of pollens are deposited. This leads to NSD of fertilized ovules (Ganeshaiah et al., 1986). A similar mechanism has also been reported in Tammarind (Thimmaraju et al., 1989; Usha, 1986), and Moringa (Uma Shaanker and Ganeshaiah, 1987). NSD of seeds in pods is said to be a common feature of majority of multi-ovulate species (Lee and Bazzaz, 1982). Seed mass per pod: The seed mass per pod averaged to 5.3435 ± 0.2995 g per pod and varied by a quantum of 41.28%. As the number of seeds per pod varied greatly and in consequence the seed yield ranged from 0.8483g per pod to 9.9730g in case of pods containing several seeds (Table 1). The seed mass per pod tended to follow normal distribution (KS-z = 0.663, p<0.771). Mean single seed weight in pod (MSSW): The distribution of MSSW was symmetrical among the pods. It averaged to 0.3951 ± 0.0117g and varied from 0.1414 to 0.5573g (Table 1). Pericarp mass: The pericarp mass per pod varied from 18.15 to 89.31g (CV: 33.79%) and averaged to 56.291 ± 2.271g. The distribution of pericarp mass tended to be normally distributed as the magnitude of KS-z was low (0.739) and insignificant (p<0.648) (Table 1).

Maternal investment of biomass in pods, seeds and seed packaging 107
0 5 10 15 20 25 30BROOD SIZE PER POD
0
2
4
6
8
10
12
14
FREQUENCY
N = 70, Mean = 13.43, SE = 0.668, Median = 13.00, SD = 5.591, CV (%) = 41.63, G1 = 0.421, Sg1 = 0.287, G2 = -0.280, Sg2 = 0.566, Minimum = 4, Maximum = 28, KS-z = 0.764, p<0.603
Fig. 1. Distribution of brood size.
Fig. 2. Percent proportion of Pericarp mass to fruit mass (PPFR) and seed mass proportion to fruit mass (PSFR).
Functional allocation of biomass in pods: In Angiosperms, a fruit may be considered to serve three basic functions in the life history– reproductive, protective and dispersal. In D. regia, there is no special structure for dispersal of seed after release from the pod; there were only two functional categories–protective due to pericarp and reproductive in form of seeds. In D. regia pods studied (N = 70), 91.45 ± 0.302 % of the pod biomass was allocated to pericarp (seed protective function) and 8.52 ± 0.302 % to the seeds (reproductive function) (Fig. 2). Individual seed weight: The weight of individual seed for a sample of 946 seeds averaged to 397.3925 ± 3.936mg varying from 55.81 to 638.10 mg (11.52-fold variation) (Fig. 3). Seed weight of D. regia is variously reported. About 4500 seeds from Puerto Rican sources weighed around 1kg i.e. on an average a seed weighed 222.2 mg (Marrero, 1949) and around 2000 – 3000 Columbian seeds weighed around 1kg i.e. single seed on an average weighed to 333.3 to 500 mg (Navarette, undated). CAB International (2000) reported 1600-3700 D. regia seeds to weigh 1kg i.e. single seed weighs 270.3 to 625 mg.
Intraspecific variation in seed mass is common in tropical species (Janzen, 1977; Foster and Janson, 1985; Khan et al., 1984; Murali, 1997; Marshall, 1986; Upadhaya et al., 2007) and it may be many-fold in magnitude (Zhang and Maun, 1990). Sachaal (1980) found 5.6 fold variation among 659 seeds collected from a population of Lupinus texensis. Khan et al., (1984) have reported seed weight variation in desert herbs to be around 6.82 % in Achyranthes aspera, 12.91% in Peristrophe bicalyculata, 14 % in Cassia holosericea and 16.83% in Prosopis juliflora. Opuntia ficus-indica exhibited seed weight variation c. 18.2% (Khan, 2006). Michaels et al., (1988) have examined 39 species (46 populations) of plants in eastern-central Illinois and reported variability (in terms of coefficient of variation) of seed mass commonly exceeding 20% - significant variation being among the conspecific plants in most species sampled. Seed weight variation in Senna occidentalis was 18.35% (Saeed and Shaukat, 2000). Seed weight variation in Thespesia populnea was around 27% (Gohar et al., 2012)). Sixteen-fold variation in seed mass is reported in Lamatium salmoniflorum (Thompson and Pellmyr, 1989). According to Tíscar Oliver and Borja (2010) most variation occurred in seed mass within trees of Pinus nigra subsp. Salzamannii (c 61%) rather than between them (c 39%). Four-fold variation in seed mass was found ranging from 8 to 32 (-36) mg. Variation in seed mass is even reported within fruits (Stanton, 1984; Mendez, 1997).
The distribution of seed weight in D. regia was negatively skewed and leptokurtic (KS-z = 1.808; p<0.003) (Fig. 3) i.e., D. regia produced more smaller seeds than expected from normal distribution of seed weight as also reported in Purshia tridentata (Krannitz, 1997). Seed weight in Cassia fistula was also found to be leptokurtic and negatively skewed by Khan and Zaki (2012). Seeds below 100mg were 1.2%, those between 100.1 to 300 mg were 18% of the total seeds. Majority of seeds (79.8%) fall in the category of 400 to 600 mg. Seeds > 600mg in weight were few (0.6%). Halpern (2005) reported normal distribution of seed mass in Lupinus perennis. Sachaal (1980) found seed weight to be leptokurtic and positively skewed in Lupinus texensis. Seed weight distribution has been reported to be normal in six cultivars of sunflower and skewed in three cultivars (Khan et al., 2011). Seed mass normally distributed in Blutapason portulacoides and Panicum recemosum but not in case of Spartina ciliata (Cardazzo, 2002). Zhang (1998) has reported seed mass variation in Aeschynomene americana by weighing 150 seeds from each of its 72 populations to be normally distributed in 9, positively skewed significantly (p < 0.05) in 14 and negatively skewed in 49 populations. The mass of mature seeds had a normal distribution in two natural populations of Arum italicum (Mendez, 1997). Seed weight may vary within a species with site quality and temporally – varying from symmetry to skewness, from leptokurtosis to platykurtosis (Busso and Perryman, 2005). The variation in weight of seeds of D. regia was observed to be lesser (CV: 30.46%) than that of the brood size (CV: 41.63%). It is in agreement with Harper’s (1961) contention that there is lesser variation in seed size than the seed number. It has strongly been supported by Smith and Fretwell’s (1974) model of resource optimization.
PSFR = 8.52 ± 0.302
PPFR = 91.48 ± 0.302

D. Khan & Zulfiqar Ali Sahito 108
0.00 100.00 200.00 300.00 400.00 500.00 600.00 700.00SEED WEIGHT - SIZE CLASSES (mg)
0
20
40
60
80
FREQUENCY
N = 946, Mean = 397.3925, SE = 3.9361, Median = 408.3350, SD = 121.06259, CV (%) = 30.46, G1 = -0.539, Sg1 = 0.080, G2 = -0.279, Sg2 = 0.159, Minimum = 55.81, Maximum = 638.10, KS-z = 1.808, p<0.003 Fig. 3. Frequency distribution of single seed weight of Delonix regia.
82.50 85.00 87.50 90.00 92.50 95.00 97.50PERCENT PERICARP PROPORTION TO FRUIT (PFR)
0
5
10
15
20
FREQUENCY
N = 70, Mean = 91.4837, SE = 0.30187, Median = 91.6104, CV = 2.76%, g1 = -0.615, Sg1 = 0.287, g2 = 1.607, Sg2 = 0.566, Minimum = 83.38, Maximum = 96.20, KS-z = 0.670, p<0.761 Fig, 4. Distribution pattern of percent proportion of pericarp to fruit mass (PPFR).
The variation in seed size may be the result of many factors (Fenner, 1985; Wulff, 1986). Winn (1991) has
suggested that plants may not have the capability of producing a completely uniform seed weight simply as a result of variations in resource availability (e. g., soil moisture during seed development). Seed size is significantly reduced under moisture stress in mature trees of walnut (Martin et al., 1980). Seed weight is said to be the direct function of precipitation (moisture availability) and monthly precipitation is reported to explain around 85% of the total variation in seed weight in Wyoming sage brush, Artemisia tridentata (Busso and Perryman, 2005). Seed weight is also reported to decline with age in walnut (Juglans major) in terrace habitat of central Arizona (Stromberg and Patten (1990). It has also been reported to be the function of plant height in a population of Ranunculus acris (Totland and Birks, 1996). The large variation of seed mass among plants suggests a potential for but not necessarily the presence of genetic control of seed size. This is because maternal parents may influence seed size via both maternal genetics and the maternal environment effect (Roach and Wulff, 1987; Busso and Perryman, 2005). Seed weight variation in plants thus appears universal which may be due to trade-off of resource allocation between seed size and number (Venable, 1992) or environmental heterogeneity (Janzen, 1977) or the genetic reasons. It has been suggested that producing seeds of different sizes can be an evolutionary stable strategy in spatially or temporally heterogeneous habitats (Geritz, 1995). Alonso-Balnco et al., (1999) have indeed identified several gene loci responsible for natural genetic variation in seed size in Arabidopsis thaliana. Doganlar et al., (2000) have presented seed weight variation model in tomato. It may be asserted that within a species, seed mass variation should have both genetic and environmental components. Contrary to it, the variation within a plant can only reflect environmental variance due to either development stability or genetically based adaptive variability. High degree of seed weight variation within an individual of D. regia (CV: 30.46%) appears to highly environmental and may be thought to have important ecological implications in its life history diversification (Braza et al., 2010).
Variation in per cent proportion of pericarp to fruit mass: The PPFR (% pericarp to fruit mass proportion) varied among the pods from 83.38 to 96.20 (mean = 91.484 ± 0.3019g. PPFR appeared to be negatively skewed (g1 = - 0.615) and leptokurtic (g2 = 1.607) but tended to be distributed normally on the basis of Kolmogorov-Smirnov test (KS-z = 0.670, p<0.761) (Table 1; Fig. 4). It varied only 2.76%. PPFR is known to vary in plants (Herrera, 1987; Lee et al., 1991). Chen et al., (2010) has reported data on average pericarp mass to fruit mass ratio in 62 broad-leaved woody tropical species – the lowest for Nothapodytes pittosporoidea (0.152) and the largest for Liquidamber formosana (0.972). The higher proportion of biomass investment in pericarp is suggested to be favoured when offspring mortality is density-dependent (Janzen, 1970; Ganeshaiah and Uma Shaanker, 1991). Converse to it, higher proportion of biomass may be favoured to seeds when the principal cause of mortality is the limitation in some critical resource (Baker, 1972). Seed packaging: The investment in seed packaging in D. regia was much higher than that in several leguminous species (Table 2). Seed packaging cost in D. regia was 11.912 ± 0.5272g.g-1.seeds and 4.5493 ± 0.1882 g.seed-1. Willson et al., (1990) had also noted a marked variation in average seed packaging investment amongst 28 species surveyed. Cassia fasciculata included in their study showed SPC per seed to be 76.47 ± 1.89 mg per seed. Mehlman (1993) also reported SPC to vary significantly in pods of Baptisia lanceolata. Khan and Zaki (2012) have reported packaging cost in indehiscent type of pods of C. fistula to vary from pod to pod – (mean SPC: 767.2 ± 51.4 mg per seed to 6961.3 ± 461.0 mg per g seeds). Seed packaging investment across 62 species of 35 families from China (No legume included) is also
Maternal investment of biomass in pods, seeds and seed packaging 109
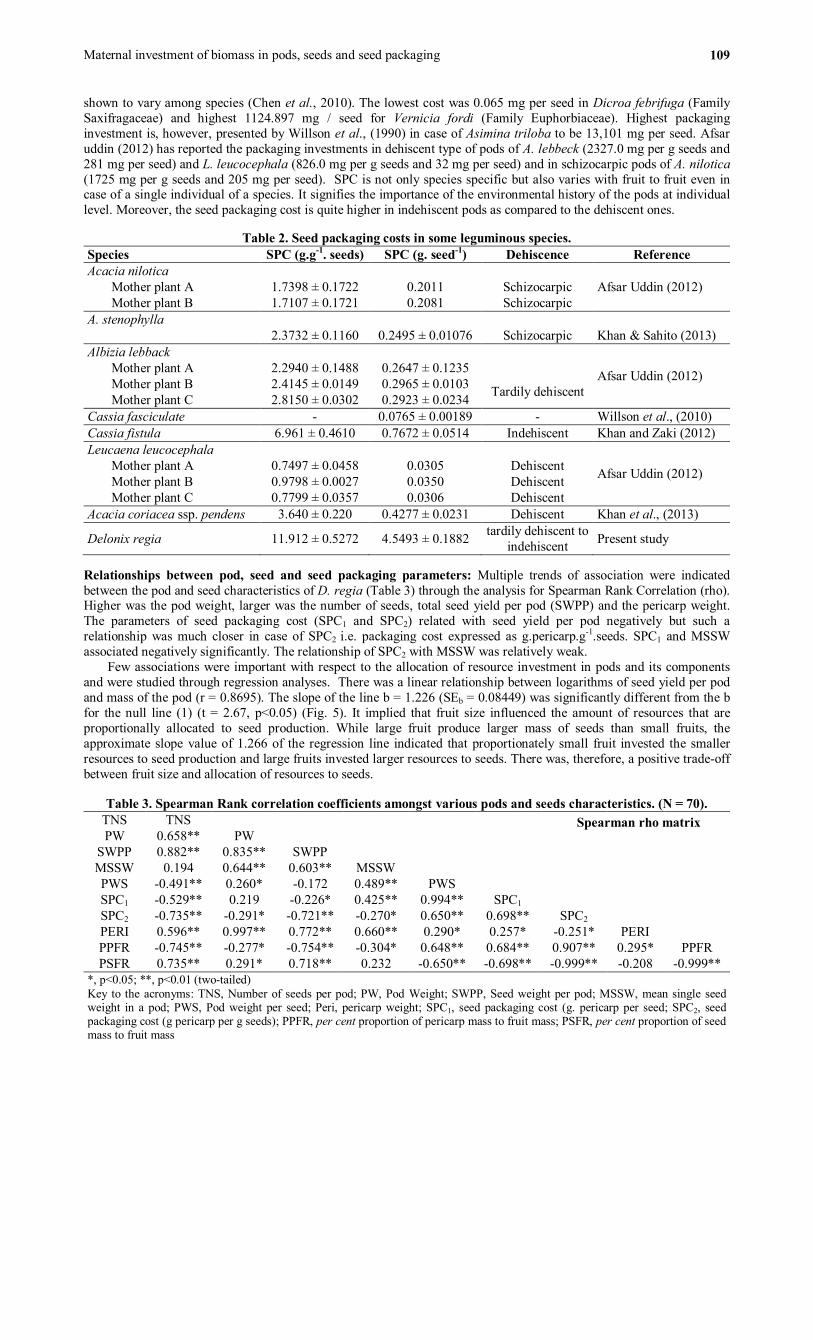
shown to vary among species (Chen et al., 2010). The lowest cost was 0.065 mg per seed in Dicroa febrifuga (Family Saxifragaceae) and highest 1124.897 mg / seed for Vernicia fordi (Family Euphorbiaceae). Highest packaging investment is, however, presented by Willson et al., (1990) in case of Asimina triloba to be 13,101 mg per seed. Afsar uddin (2012) has reported the packaging investments in dehiscent type of pods of A. lebbeck (2327.0 mg per g seeds and 281 mg per seed) and L. leucocephala (826.0 mg per g seeds and 32 mg per seed) and in schizocarpic pods of A. nilotica (1725 mg per g seeds and 205 mg per seed). SPC is not only species specific but also varies with fruit to fruit even in case of a single individual of a species. It signifies the importance of the environmental history of the pods at individual level. Moreover, the seed packaging cost is quite higher in indehiscent pods as compared to the dehiscent ones.
Table 2. Seed packaging costs in some leguminous species. Species SPC (g.g-1. seeds) SPC (g. seed-1) Dehiscence Reference Acacia nilotica
Afsar Uddin (2012) Mother plant A 1.7398 ± 0.1722 0.2011 Schizocarpic Mother plant B 1.7107 ± 0.1721 0.2081 Schizocarpic
A. stenophylla 2.3732 ± 0.1160 0.2495 ± 0.01076 Schizocarpic Khan & Sahito (2013) Albizia lebback
Afsar Uddin (2012) Mother plant A 2.2940 ± 0.1488 0.2647 ± 0.1235 Tardily dehiscent Mother plant B 2.4145 ± 0.0149 0.2965 ± 0.0103
Mother plant C 2.8150 ± 0.0302 0.2923 ± 0.0234 Cassia fasciculate - 0.0765 ± 0.00189 - Willson et al., (2010) Cassia fistula 6.961 ± 0.4610 0.7672 ± 0.0514 Indehiscent Khan and Zaki (2012) Leucaena leucocephala
Afsar Uddin (2012) Mother plant A 0.7497 ± 0.0458 0.0305 Dehiscent Mother plant B 0.9798 ± 0.0027 0.0350 Dehiscent Mother plant C 0.7799 ± 0.0357 0.0306 Dehiscent
Acacia coriacea ssp. pendens 3.640 ± 0.220 0.4277 ± 0.0231 Dehiscent Khan et al., (2013)
Delonix regia 11.912 ± 0.5272 4.5493 ± 0.1882 tardily dehiscent to indehiscent Present study
Relationships between pod, seed and seed packaging parameters: Multiple trends of association were indicated between the pod and seed characteristics of D. regia (Table 3) through the analysis for Spearman Rank Correlation (rho). Higher was the pod weight, larger was the number of seeds, total seed yield per pod (SWPP) and the pericarp weight. The parameters of seed packaging cost (SPC1 and SPC2) related with seed yield per pod negatively but such a relationship was much closer in case of SPC2 i.e. packaging cost expressed as g.pericarp.g-1.seeds. SPC1 and MSSW associated negatively significantly. The relationship of SPC2 with MSSW was relatively weak.
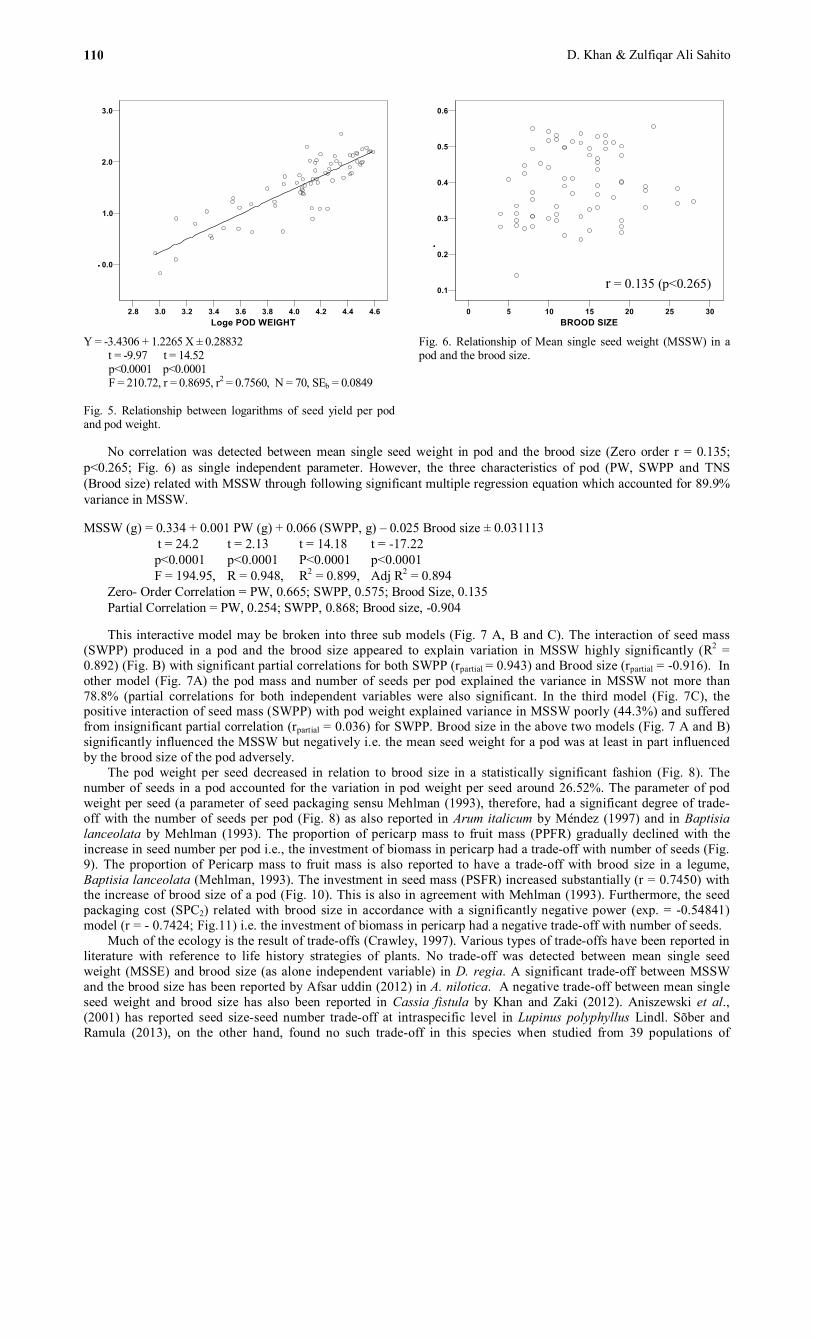
Few associations were important with respect to the allocation of resource investment in pods and its components and were studied through regression analyses. There was a linear relationship between logarithms of seed yield per pod and mass of the pod (r = 0.8695). The slope of the line b = 1.226 (SEb = 0.08449) was significantly different from the b for the null line (1) (t = 2.67, p<0.05) (Fig. 5). It implied that fruit size influenced the amount of resources that are proportionally allocated to seed production. While large fruit produce larger mass of seeds than small fruits, the approximate slope value of 1.266 of the regression line indicated that proportionately small fruit invested the smaller resources to seed production and large fruits invested larger resources to seeds. There was, therefore, a positive trade-off between fruit size and allocation of resources to seeds.
Table 3. Spearman Rank correlation coefficients amongst various pods and seeds characteristics. (N = 70). TNS TNS PW 0.658** PW
SWPP 0.882** 0.835** SWPP MSSW 0.194 0.644** 0.603** MSSW PWS -0.491** 0.260* -0.172 0.489** PWS SPC1 -0.529** 0.219 -0.226* 0.425** 0.994** SPC1 SPC2 -0.735** -0.291* -0.721** -0.270* 0.650** 0.698** SPC2 PERI 0.596** 0.997** 0.772** 0.660** 0.290* 0.257* -0.251* PERI PPFR -0.745** -0.277* -0.754** -0.304* 0.648** 0.684** 0.907** 0.295* PPFR PSFR 0.735** 0.291* 0.718** 0.232 -0.650** -0.698** -0.999** -0.208 -0.999**
*, p<0.05; **, p<0.01 (two-tailed) Key to the acronyms: TNS, Number of seeds per pod; PW, Pod Weight; SWPP, Seed weight per pod; MSSW, mean single seed weight in a pod; PWS, Pod weight per seed; Peri, pericarp weight; SPC1, seed packaging cost (g. pericarp per seed; SPC2, seed packaging cost (g pericarp per g seeds); PPFR, per cent proportion of pericarp mass to fruit mass; PSFR, per cent proportion of seed mass to fruit mass
Spearman rho matrix
D. Khan & Zulfiqar Ali Sahito 110
2.8 3.0 3.2 3.4 3.6 3.8 4.0 4.2 4.4 4.6Loge POD WEIGHT
0.0
1.0
2.0
3.0
Loge SEED WEIGHT PER POD
Y = -3.4306 + 1.2265 X ± 0.28832 t = -9.97 t = 14.52 p<0.0001 p<0.0001 F = 210.72, r = 0.8695, r2 = 0.7560, N = 70, SEb = 0.0849 Fig. 5. Relationship between logarithms of seed yield per pod and pod weight.
0 5 10 15 20 25 30BROOD SIZE
0.1
0.2
0.3
0.4
0.5
0.6
MEAN SEED WEIGHT
Fig. 6. Relationship of Mean single seed weight (MSSW) in a pod and the brood size.
No correlation was detected between mean single seed weight in pod and the brood size (Zero order r = 0.135;
p<0.265; Fig. 6) as single independent parameter. However, the three characteristics of pod (PW, SWPP and TNS (Brood size) related with MSSW through following significant multiple regression equation which accounted for 89.9% variance in MSSW. MSSW (g) = 0.334 + 0.001 PW (g) + 0.066 (SWPP, g) – 0.025 Brood size ± 0.031113
t = 24.2 t = 2.13 t = 14.18 t = -17.22 p<0.0001 p<0.0001 P<0.0001 p<0.0001 F = 194.95, R = 0.948, R2 = 0.899, Adj R2 = 0.894 Zero- Order Correlation = PW, 0.665; SWPP, 0.575; Brood Size, 0.135 Partial Correlation = PW, 0.254; SWPP, 0.868; Brood size, -0.904
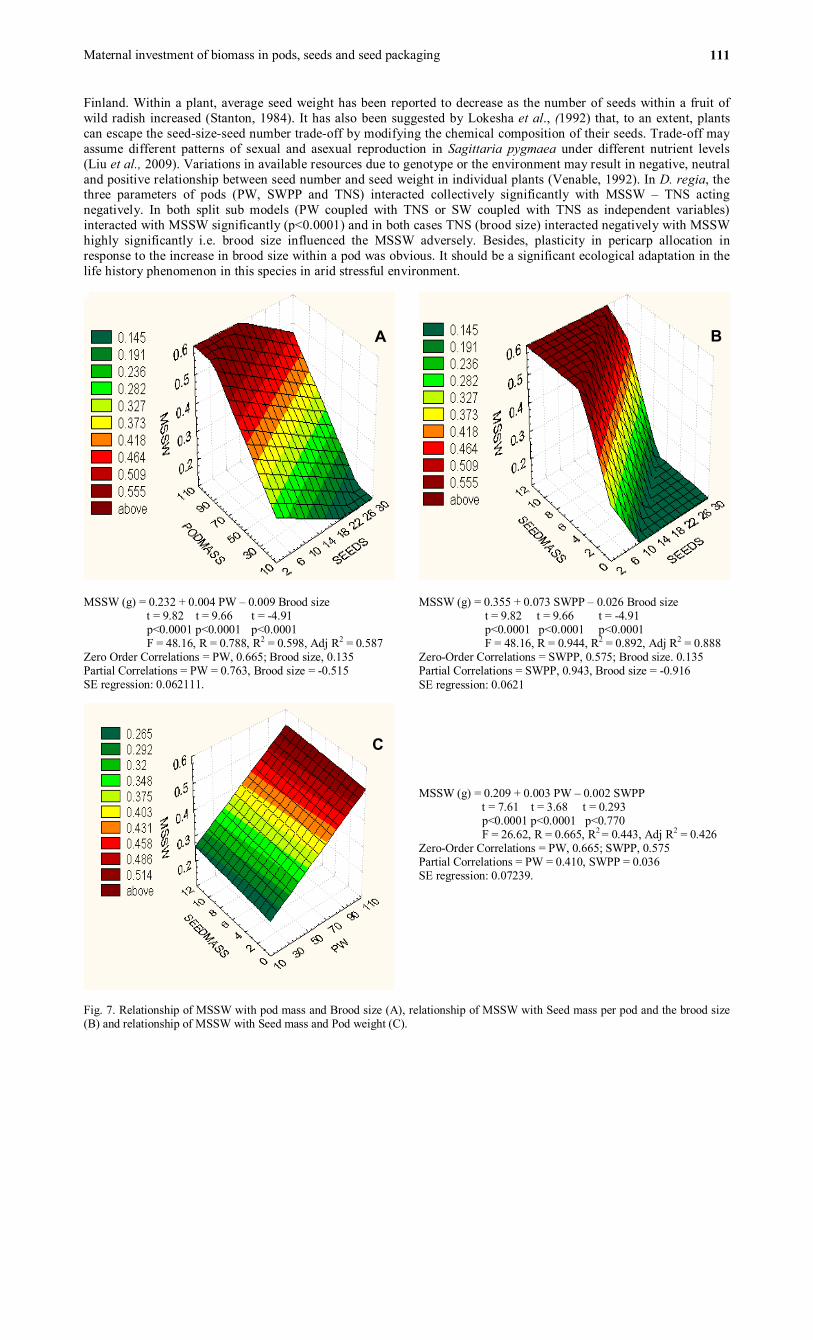
This interactive model may be broken into three sub models (Fig. 7 A, B and C). The interaction of seed mass
(SWPP) produced in a pod and the brood size appeared to explain variation in MSSW highly significantly (R2 = 0.892) (Fig. B) with significant partial correlations for both SWPP (rpartial = 0.943) and Brood size (rpartial = -0.916). In other model (Fig. 7A) the pod mass and number of seeds per pod explained the variance in MSSW not more than 78.8% (partial correlations for both independent variables were also significant. In the third model (Fig. 7C), the positive interaction of seed mass (SWPP) with pod weight explained variance in MSSW poorly (44.3%) and suffered from insignificant partial correlation (rpartial = 0.036) for SWPP. Brood size in the above two models (Fig. 7 A and B) significantly influenced the MSSW but negatively i.e. the mean seed weight for a pod was at least in part influenced by the brood size of the pod adversely.
The pod weight per seed decreased in relation to brood size in a statistically significant fashion (Fig. 8). The number of seeds in a pod accounted for the variation in pod weight per seed around 26.52%. The parameter of pod weight per seed (a parameter of seed packaging sensu Mehlman (1993), therefore, had a significant degree of trade-off with the number of seeds per pod (Fig. 8) as also reported in Arum italicum by Méndez (1997) and in Baptisia lanceolata by Mehlman (1993). The proportion of pericarp mass to fruit mass (PPFR) gradually declined with the increase in seed number per pod i.e., the investment of biomass in pericarp had a trade-off with number of seeds (Fig. 9). The proportion of Pericarp mass to fruit mass is also reported to have a trade-off with brood size in a legume, Baptisia lanceolata (Mehlman, 1993). The investment in seed mass (PSFR) increased substantially (r = 0.7450) with the increase of brood size of a pod (Fig. 10). This is also in agreement with Mehlman (1993). Furthermore, the seed packaging cost (SPC2) related with brood size in accordance with a significantly negative power (exp. = -0.54841) model (r = - 0.7424; Fig.11) i.e. the investment of biomass in pericarp had a negative trade-off with number of seeds.
Much of the ecology is the result of trade-offs (Crawley, 1997). Various types of trade-offs have been reported in literature with reference to life history strategies of plants. No trade-off was detected between mean single seed weight (MSSE) and brood size (as alone independent variable) in D. regia. A significant trade-off between MSSW and the brood size has been reported by Afsar uddin (2012) in A. nilotica. A negative trade-off between mean single seed weight and brood size has also been reported in Cassia fistula by Khan and Zaki (2012). Aniszewski et al., (2001) has reported seed size-seed number trade-off at intraspecific level in Lupinus polyphyllus Lindl. Sõber and Ramula (2013), on the other hand, found no such trade-off in this species when studied from 39 populations of
r = 0.135 (p<0.265)
Maternal investment of biomass in pods, seeds and seed packaging 111
Finland. Within a plant, average seed weight has been reported to decrease as the number of seeds within a fruit of wild radish increased (Stanton, 1984). It has also been suggested by Lokesha et al., (1992) that, to an extent, plants can escape the seed-size-seed number trade-off by modifying the chemical composition of their seeds. Trade-off may assume different patterns of sexual and asexual reproduction in Sagittaria pygmaea under different nutrient levels (Liu et al., 2009). Variations in available resources due to genotype or the environment may result in negative, neutral and positive relationship between seed number and seed weight in individual plants (Venable, 1992). In D. regia, the three parameters of pods (PW, SWPP and TNS) interacted collectively significantly with MSSW – TNS acting negatively. In both split sub models (PW coupled with TNS or SW coupled with TNS as independent variables) interacted with MSSW significantly (p<0.0001) and in both cases TNS (brood size) interacted negatively with MSSW highly significantly i.e. brood size influenced the MSSW adversely. Besides, plasticity in pericarp allocation in response to the increase in brood size within a pod was obvious. It should be a significant ecological adaptation in the life history phenomenon in this species in arid stressful environment.
MSSW (g) = 0.232 + 0.004 PW – 0.009 Brood size t = 9.82 t = 9.66 t = -4.91 p<0.0001 p<0.0001 p<0.0001 F = 48.16, R = 0.788, R2 = 0.598, Adj R2 = 0.587 Zero Order Correlations = PW, 0.665; Brood size, 0.135 Partial Correlations = PW = 0.763, Brood size = -0.515 SE regression: 0.062111.
MSSW (g) = 0.355 + 0.073 SWPP – 0.026 Brood size t = 9.82 t = 9.66 t = -4.91 p<0.0001 p<0.0001 p<0.0001 F = 48.16, R = 0.944, R2 = 0.892, Adj R2 = 0.888 Zero-Order Correlations = SWPP, 0.575; Brood size. 0.135 Partial Correlations = SWPP, 0.943, Brood size = -0.916 SE regression: 0.0621
MSSW (g) = 0.209 + 0.003 PW – 0.002 SWPP t = 7.61 t = 3.68 t = 0.293 p<0.0001 p<0.0001 p<0.770 F = 26.62, R = 0.665, R2 = 0.443, Adj R2 = 0.426 Zero-Order Correlations = PW, 0.665; SWPP, 0.575 Partial Correlations = PW = 0.410, SWPP = 0.036 SE regression: 0.07239.
Fig. 7. Relationship of MSSW with pod mass and Brood size (A), relationship of MSSW with Seed mass per pod and the brood size (B) and relationship of MSSW with Seed mass and Pod weight (C).
A B
C

D. Khan & Zulfiqar Ali Sahito 112
0 5 10 15 20 25 30BROOD SIZE
2.0
4.0
6.0
8.0
10.0
POD WEIGHT PER SEED
Pod wt. per seed = 6.999095 – 0.153016 Brood size ± 1.3801
t = 16.21 t = -5.15 p<0.0001 p<0.0001
F = 26.52 (p<0.0001), r = - 0.5297, r2 = 0.2670 Fig. 8. Relationship of pod weight per seed (g) and the brood size.
0 5 10 15 20 25 30BROOD SIZE
82.5
85.0
87.5
90.0
92.5
95.0
97.5
PERCENT PROPORTION OF PERICARP TO
FRUIT
PPFR = 96.0023 – 0.3365 Brood size ± 1.697 t = 180.8 t = -9.28 p<0.0001 p<0.0001 F = 84.79 (p<0.0001), r = -0.7450, r2 = 0.5550
Fig. 9 Relationship of PPFR with brood size.
0 5 10 15 20 25 30BROOD SIZE
2.5
5.0
7.5
10.0
12.5
15.0
17.5
PERCENT PROPORTION OF SEED MASS TO
FRUIT MASS
PSFR = 3.9972 + 0.33649 Brood size ± 1.6922
t = 7.529 t = 9.21 p<0.0001 p<0.0001 F = 84.79 (p<0.0001), r = 0.7450, r2 = 0.5550
Fig. 10. Relationship of PSFR with brood size.
5.0
10.0
15.0
20.0
25.0
30.0
0 5 10 15 20 25 30BROOD SIZE
ObservedPower
Y = 44.38123. X – 0.54841 ± 0.22748 t = 6.55 t = -9.14 p<0.0001 p<0.0001 F = 83.50; r = - 0.7424, r2 = 0.5512, N = 70
Fig. 11. Relationship between seed packaging cost (SPC2) and brood size.
Variation in seed mass against the number of seeds in fruit is generally viewed by ecologists in terms of Smith-
Fretwell theory of optimization of allocation of resources where parents maximize their fitness producing seeds with a homogenous optimal size. Variation around the optimal size within an individual or a population could be related to variation in parental size or quality of resources (McGinley, 1988), physiological, developmental or morphological constraints (McGinley et. al., 1987), parent offspring conflict and sibling rivalry (Uma Shankar et al., 1988; Ganeshaiah and Uma Shankar, 1988; Ganeshaih and Uma Shaanker, 2003). Since Smith-Fretwell model predicts optimum seed size expected in a particular ecological context, different optima for different individuals of a species may be expected. This concept may probably be as well extended to fruits of an individual tree where different optima may occur for different fruits produced on a tree. It may be adjudged from the high degree of variation of mean single seed weight (MSSW) among the pods and total seed mass in pods (SWPP) of an individual tree. A reproductive potential of a fruit obviously should be a function of its developmental history based on both its external and internal environments (Khan and Sahito, 2013). REFERENCES Afsar uddin (2012). Some quantitative observations on pods and seeds of three Mimosacean species: pods-, seeds – and brood-size
variability, packaging cost and seed size-seed number trade off. M.Sc. Thesis, Dept. Bot., University of Karachi. 139 pp.
SEED
PA
CK
AG
ING
CO
ST (S
PC2)
, (g
. per
g s
eeds
)
Maternal investment of biomass in pods, seeds and seed packaging 113
Ali, S.I. (1973). Caesalpiniaceae. Flora of West Pakistan. Fascicle # 54. Alonso-Blanco. C., H.B. Vries, C.J. Hauhart and M. Koornneef. (1999). Natural allelic variation at seed size loci in relation to other
life history traits of Arabidopsis thaliana. Proc. Natl. Acad. Sci. USA 96: 4710-4717. Aniszewski, T., M.H. Kupari and A.J. Leinonen. (2001). Seed number, seed size and seed diversity in Washington lupin Lupinus
polyphyllus Lindl. Am. J. Bot. 87: 77-82. Baker, H.G. (1972). Seed weight in relation to environmental conditions in California. Ecology 53: 997-1010. Braza, R., J. Arroyo and M.B. García. (2010). Natural variation of fecundity components in a widespread plant with dimorphic seeds.
Acta Oecologia 36: 471-476. Busso, C.A. and B.L. Perryman. (2005). Seed weight variation of Wyoming sagebrush in Northern Nevada. Biocell 29 (3): 279-285. CAB International. (2000). Forestry Compendium Global Module. Wallingford, UK, CAB International. Cardazzo, C.V. (2002). Effect of seed mass on germination and growth in three dominant species in southern Brazilian coastal dunes.
Braz. J. Biol., 62 (3): (doi: 10.1590/S1519-69842002000300005) Chen, H., S. Felker and S. Sun. (2010). Allometry of within-fruit reproductive allocation in subtropical dicot woody species. Am. J.
Bot. 97: 611-619. Chen, H., K.J. Niklas, D. Yang, D. and S. Sun. (2009). The effect of twig architecture and seed number on seed size variation in
subtropical woody species. New Phytologist 183 (4): 1212- 1221. Crawley, M.J. (1997). Life history and environment (pp. 157-191). In: Plant Ecology. II Ed. (M.J. Crawley, Ed.). Oxford: Blackwell, Doganlar, S., A. Frary and S.D. Tanksley. (2000). The genetic basis of seed weight variation: tomato as a model system. Theor. Appl.
Genet. 100: 4267-1273. Du Puy, D.J.P.B., R. Paterson, and Rabevohitra. (1995). The genus Delonix (Leguminosae” Caesalpinoidae: Caesalpiniaceae) in
Madagascar. Kew Bulletin 50(3): 445-475. Fenner, M. (1985). Seed Ecology. Chapman and Hall., NY. 151 pp. Foster, S.A. and S.A. Jansen. (1985). The relationship between seed size and establishment conditions in tropical woody plants.
Ecology, 66: 773-780. Ganeshaiah, K.N. and R. Uma Shaanker. (1988). Seed abortion in wind-dispersed pods of Dalbergia sissoo: maternal regulation of
sibling rivalry. Oecologia, 77: 135-139. Ganeshaiah, K.N. and R. Uma Shaanker. (1991). Seed size optimization in a wind-dispersed tree Butea monosperma, a trade-off
between seedling establishment and pod dispersal efficiency. Oikos 60: 3-6. Ganeshaiah, K.N. and R. Uma Shaanker. (2003). Sociobiology of plants (pp. 64 -76). In: Plant resources of Karnataka, A Decade of
Diversity. Univ. Agricultural Sciences. Banglore, India.104 pp. Ganeshaiah, K.N., R. Uma Shaanker and G. Shivashanker. (1986). Stigmatic inhibition of pollen grain germination-its implication for
frequency distribution of seed number in pods of Leucaena leucocephala (Lam) de Wit. Oecologia, 70: 568-72. Geritz, S.A.H. (1995). Evolutionary stable polymorphism and small-scale spatial variation in seedling density, Am. Nat. 146: 685-707. Gohar, Z.N., D. Khan and R. Ahmad. (2012). Plant size-fecundity relations in Thespesia populnea (L.) sol. Ex. Corr. growing under
arid-saline conditions in Karachi, Pakistan. Int. J. Biol. & Biotech., 9(3): 161-190. Halpern, S.L. (2005). Sources and consequences of seed size variation in Lupinus perennis (Fabaceae): adaptive and non-adaptive
hypotheses. Am. J. Bot., 92(2): 205-213. Harper, J.L. (1961). Approached to the study of plant competition. In: F.L. Milthorpe (Ed.) Mechanism in Biological Competition.
Soc. for Exp. Biology Symposium. 15: 1-39. Harper, J.L. (1977). Population Biology of Plants. Academic Press, N.Y. Herrera, C.M. (1987). Vertebrate-dispersed plants of the Iberian Peninsula: A study of fruit characteristics. Ecol. Monographs, 17:
305-331. Janzen, D. (1970). Herbivores and the number of tree species in tropical forests. Am. Naturalist, 104: 501-528. Janzen, D.H. (1977). Variation in seed weight in Costa Rican Cassia grandis (Leguminosae). Tropical Ecology, 18: 177-186. Khan, D. (2006). Some seed and seedling characteristics (tricotyledony) of Opuntia ficus-indica (L.) Mill. (Cactaceae). Int. J. Biol. &
Biotech., 3(4): 795-800. Khan, D. and Z.A. Sahito. (2013). Variation in pod-and seed sizes and seed packaging cost in Acacia stenophylla A. Cunn. Ex.
Bentham. – An Australian wattle growing in Karachi, Pakistan. FUUAST J. Biol., 3(1): 15-30. Khan, D. and M.J. Zaki. (2012). Pods and seeds characteristics within a pod crop of an Amaltas tree (Cassia fistula L.:
Caesalpiniaceae). I: Insect infestation, number of seeds per pod, and the packaging cost. Int. J. Biol. & Biotech., 9(1-2): 31-50. Khan, D., M. Anis and M.J. Zaki. (2011). Seed mass variation in seed lots of nine cultivars of sunflower (Helianthus annuus L.). Int.
J. Biol. & Biotech., 8(2): 263-273. Khan, D., S.S. Shaukat and M. Faheemuddin. (1984). Germination studies of certain desert plants. Pak. J. Bot., 16: 231-254. Khan, D., Z.A. Sahito and M.J. Zaki. (2013). Parental investment of biomass in pod, seed and seed packaging in a tree of wiry wattle
(Acacia coriacea subsp. pendens) growing in Karachi, Pakistan. Int. J. Biol. & Biotech., 10(4): 515-536. Krannitz, P.G. (1997). Seed weight variability of antelope bitterbrush (Purshia tridentata: Rosaceae). Am. Midl. Nat., 638: 306-321. Lee, T.D. and F.A. Bazzaz. (1982). Regulation of fruit and seed production in annual legume (Cassia fasciculata). Ecology, 63: 1283-1373. Lee, W.G., P.J. Grubb and J.B. Wilson. (1991). Patterns of resource allocation in fleshy fruits of nine European tall shrub species.
Oikos, 61: 307-315. Liu, F., J-M. Chen and Q-F. Wang. (2009). Trade-offs between sexual and asexual reproduction in a monoecious species Sagittaria
pygmaea (Alismataceae): the effect of different nutrient levels. Plant Syst. & Evol., 277: 61-65. Lokesha, R., S.G. Hedge, R. Uma Shaanker and K.N. Ganeshaiah. (1992). Dispersal mode as a selective force in shaping the chemical
composition of seeds. Am. Nat., 140: 520-525. Lord, J.M. and M. Westoby. (2006). Accessory costs of seed production. Oecologia, 150: 310-317. Marshall, D.L. (1986). Effect of seed size on seedling success in three species of Sesbania (Fabaceae). Am. J. Bot., 73: 457-464. Martin, G.C., K. Uriu and C.N. Nishijuma. (1980). The effect of drastic reduction of water input on mature walnut tree. Hortic. Sci.,
15: 157-158.
D. Khan & Zulfiqar Ali Sahito 114
Martinez, I., D. Gupta and J.R. Obeso. (2007). Allometric allocation in fruits and seed packaging conditions the conflict among selective pressures on the seed size. Evol. Ecology, 21: 517-533.
McGinley, M.A., D.H. Timme and M.A. Geber. (1987). Parental investment in offspring in variable environment: theoretical and empirical considerations. Am. Nat., 130: 370-398.
McGinley, M.A. (1988). Within and among plant variation in seed mass and papus size in Tragopogon dubios. Can. J. Bot., 67: 1298-1304.
Mehlman, D.W. (1993). Seed size and seed packaging variation in Baptisia lanceolata (Fabaceae). Am. J. Bot., 80(7): 735-742. Méndez, M. (1997). Sources of variation in seed mass in Arum italicum. Int. J. Plant Sci., 158(3): 298-305. Michaels, H.J., B. Benner, A.P. Hartgerink, T.D. Lee, S. Rice, M.F. Wilson and S. Rice. (1988). Seed size variation: magnitude,
distribution and ecological correlates. Evol. Ecol., 2(2): 157-166. Morrero, J. (1949). Tree seed data from Puerto Rico. Caribbean Forester, 10: 11-30. Murali, K.S. (1997). Pattern of seed size, germination and seed viability of tropical tree species in southern India. Biotropica, 29: 271-279. Navarette, E.J. (undated). Informacion basica y tratamientos pre-germintivos en semillas forestales Columbia: Ministerio de
Agriculture. Estacion Forestral la Florida, 28 pp. (seen in Vozza, J.A. (2008). Delonix regia (Bojer ex Hook,) Raf., flamboyan (pp. 668-669) In: Woody Plant Seed Manual. USDA FS Agriculture Hand Book 727, 1228 Pp.
Roach, D.A. and R.D. Wulff. (1987). Maternal effects in plants. Ann. Rev. Ecol. Syst., 18: 209-235. Sachaal, B.A. (1980). Reproduction capacity and seed size in Lupinus texensis. Am. J. Bot., 67: 703-709. Saeed, S. and S.S. Shaukat. (2000). Effect of seed size on germination, emergence, growth and seedling survival of Senna occidentalis
Link. Pak. J. Biol. Sci., 3(2): 292-295. Smith, C.C. and G.D. Fretwell. (1974). The optional balance between seed size and number of offspring. The Ann. Naturalist, 108:
499-506. Sober, V. and S. Romula. (2013). Seed number and environmental condition do not explain seed size variability for the invasive herb
Lupinus polyphyllus. Plant Ecol., 214: 993-892. Sokal, R.R. and E.J. Rholf (1995). Biometry. III edition. Freeman, San Francisco, CA, USA. Stanton, M.L. (1984). Seed variation in wild radish: effect of seed size on components of seedling and adult fitness. Ecology, 65:
1105-1112. Stromberg, J.C. and D.T. Patten. (1990). Variation in seed size of a southwestern riparian tree, Arizona walnut (Juglans major). Am.
Midl. Nat., 124(2): 269-276. Thimmaraju, K.R., V. Bhaskar and K. Usha. (1989). Pollen-limited seed set in pods of tamarind (Tamarindus indica L.). Ann. Sci.
For., 46 (suppl.): 56s-59s. Thompson, J.N. (1984). Variation among individual seed masses in Lamatium grayi (Umbelliferae) under controlled conditions:
magnitude and partitioning of the variance. Ecology, 65: 626-631. Thompson, J.N. and O. Pellmyr. (1989). Origins of variation in seed number and mass: interaction of sex expression and herbivory in
Lamatium salmoniflorum. Oecologia, 79: 395-402. Tíscar Oliver, P.A. and M.E. Lucas Borja. (2010). Seed mass variation, germination time and seedling performance in a population of
Pinus niger subsp. Salzamannii. Forest Systems, 19(3): 344-353. Totland, Q. and H.J.B. Birks. (1996). Factors influencing inter-population variation in Ranunculus acris seed production in an alpine
area of south-western Norway. Ecography, 19(3): 269-278. (Doi: 10.1111/j.1600-0587.1996.tb00236.x) Uma Shaanker, R. and K.N. Ganeshaiah. (1987). Pollen grain deposition patterns in multi-ovulate species reflect optimum seed
packing strategies for sexual selection. Evol. Trends Plants. (seen in Uma Shaanker et al., (1988). Uma Shaanker, R., K.N. Ganeshaiah and K.S. Bawa. (1988). Parent-offspring conflict, sibling rivalry, and brood size patterns in
plants. Ann. Rev. Ecol. Syst., 19: 177-205. Underwood, A.J. (1997). Experiments in Ecology. Cambridge University Press, Cambridge, UK. Upadhaya, K., H.N. Pandey and P.S. Law. (2007). The effect of seed mass on germination, seedling survival and growth in Prunus
jenkinsii Hook. f. & Thoms. Turk. J. Bot., 31: 31-36. Usha, K. 1986. Studies on pollination biology in Tammarind (Tamarindus indica L.) in relation to its productivity. M.Sc.
(Horticulture) Thesis. Univ. Agric. Sci. Bangalore, India. Venable, D.L. (1992). Size-number trade-off and the variation in seed size with plant resource status. The Am. Naturalist, 140: 287-
304. Willson, M.F. (1992). The ecology of seed dispersal (pp. 61-85). In: Seeds: The Ecology of Regeneration in Plant Communities. (Ed.
M. Fenner). CAB International, Wallingford. Willson, M.F., H.J. Michaels, R.I. Bertin, B. Benner, S. Rice, T.D. Lee and A.P. Hartgerink. (1990). Intraspecific variation in seed
packaging. Am. Midl. Nat., 123: 179-185. Winn, A.A. (1991). Proximate and ultimate sources of within-individual variation in seed mass in Prunella vulgaris (Lamiaceae). Am.
J. Bot., 78: 838-844. Wullf, R.D. (1986). Seed size variation in Desmodium paniculatum I. factors affecting seed size. J. Ecol., 74: 87-97. Zhang, J. (1998). Variation and allometry of seed weight in Aeschynomene americana. Annals of Botany, 82: 843-847. Zhang, J. and M.A. Maun. (1983). Fruit size variation and its effect on germination and seedling growth in Xanthium strumarium.
Can. J. Bot., 61: 2309-2315. Zhang, J. and M.A. Maun (1990). Seed size variation and its effects on seedling growth in Agropyron psammophilum. Bot. Gaz., 151:
106-113.
(Received July 2013; Accepted October 2013)
Copyright © 2022 FDOKUMEN


![Iosif Vasile FERENCZ, Despre o faleră de bronz descoperită la Sarmizegetusa-Regia [About a bronze phalera found at Sarmizegetusa Regia]](https://static.fdokumen.com/doc/165x107/63152a14511772fe45103cb0/iosif-vasile-ferencz-despre-o-falera-de-bronz-descoperita-la-sarmizegetusa-regia.jpg)
