Maternal 3’UTRs: from egg to onset of zygotic transcription in Atlantic cod
14
RESEARCH ARTICLE Open Access Maternal 3’UTRs: from egg to onset of zygotic transcription in Atlantic cod Lene Kleppe 1* , Rolf B Edvardsen 1 , Heiner Kuhl 2 , Ketil Malde 1 , Tomasz Furmanek 1 , yvind Drivenes 1 , Richard Reinhardt 3 , Geir L Taranger 1 and Anna Wargelius 1 Abstract Background: Zygotic transcription in fish embryos initiates around the time of gastrulation, and all prior development is initiated and controlled by maternally derived messenger RNAs. Atlantic cod egg and embryo viability is variable, and it is hypothesized that the early development depends upon the feature of these maternal RNAs. Both the length and the presence of specific motifs in the 3’UTR of maternal RNAs are believed to regulate expression and stability of the maternal transcripts. Therefore, the aim of this study was to characterize the overall composition and 3’UTR structure of the most common maternal RNAs found in cod eggs and pre-zygotic embryos. Results: 22229 Sanger-sequences were obtained from 3’-end sequenced cDNA libraries prepared from oocyte, 1-2 cell, blastula and gastrula stages. Quantitative PCR revealed that EST copy number below 9 did not reflect the gene expression profile. Consequently genes represented by less than 9 ESTs were excluded from downstream analyses, in addition to sequences with low-quality gene hits. This provided 12764 EST sequences, encoding 257 unique genes, for further analysis. Mitochondrial transcripts accounted for 45.9-50.6% of the transcripts isolated from the maternal stages, but only 12.2% of those present at the onset of zygotic transcription. 3’UTR length was predicted in nuclear sequences with poly-A tail, which identified 191 3’UTRs. Their characteristics indicated a more complex regulation of transcripts that are abundant prior to the onset of zygotic transcription. Maternal and stable transcripts had longer 3’UTR (mean 187.1 and 208.8 bp) and more 3’UTR isoforms (45.7 and 34.6%) compared to zygotic transcripts, where 15.4% had 3’UTR isoforms and the mean 3’UTR length was 76 bp. Also, diversity and the amount of putative polyadenylation motifs were higher in both maternal and stable transcripts. Conclusions: We report on the most pronounced processes in the maternally transferred cod transcriptome. Maternal stages are characterized by a rich abundance of mitochondrial transcripts. Maternal and stable transcripts display longer 3'UTRs with more variation of both polyadenylation motifs and 3'UTR isoforms. These data suggest that cod eggs possess a complex array of maternal RNAs which likely act to tightly regulate early developmental processes in the newly fertilized egg. Keywords: 3’UTR, Sequence/EST filtering, External spiking, Transcriptome, Teleost, Embryonic development Background A series of complex biological processes take place over time in order to transform a newly fertilized egg into a fully grown organism. At the very beginning of embry- onic development, these biological processes are com- pletely controlled by maternally derived materials. Maternally deposited messenger RNAs (maternal RNAs) and proteins drive embryo development until the zygote is able to transcribe its own RNA. The link between ma- ternal mRNAs and the ability of the embryo to develop normally is of high relevance in many fields, including that of aquaculture. For aquaculture species including Atlantic cod (Gadus morhua L.), there is a necessity to produce viable eggs and embryos to ensure both economic- and welfare aspects. However, variable egg viability is common, especially in marine farmed fish species (Reviewed in [1,2]). Also, egg viability in cod var- ies between batches within one spawning season [3]. Al- though a number of studies have identified different factors that may affect egg viability, as well as indicators * Correspondence: [email protected] 1 Institute of Marine Research, P. O. Box 1870, Nordnesgaten 50, 5817 Bergen, Norway Full list of author information is available at the end of the article © 2012 Kleppe et al.; licensee BioMed Central Ltd. This is an Open Access article distributed under the terms of the Creative Commons Attribution License (http://creativecommons.org/licenses/by/2.0), which permits unrestricted use, distribution, and reproduction in any medium, provided the original work is properly cited. Kleppe et al. BMC Genomics 2012, 13:443 http://www.biomedcentral.com/1471-2164/13/443
-
Upload
molgen-mpg -
Category
Documents
-
view
3 -
download
0
Transcript of Maternal 3’UTRs: from egg to onset of zygotic transcription in Atlantic cod
Kleppe et al. BMC Genomics 2012, 13:443http://www.biomedcentral.com/1471-2164/13/443
RESEARCH ARTICLE Open Access
Maternal 3’UTRs: from egg to onset of zygotictranscription in Atlantic codLene Kleppe1*, Rolf B Edvardsen1, Heiner Kuhl2, Ketil Malde1, Tomasz Furmanek1, �yvind Drivenes1,Richard Reinhardt3, Geir L Taranger1 and Anna Wargelius1
Abstract
Background: Zygotic transcription in fish embryos initiates around the time of gastrulation, and all priordevelopment is initiated and controlled by maternally derived messenger RNAs. Atlantic cod egg and embryoviability is variable, and it is hypothesized that the early development depends upon the feature of these maternalRNAs. Both the length and the presence of specific motifs in the 3’UTR of maternal RNAs are believed to regulateexpression and stability of the maternal transcripts. Therefore, the aim of this study was to characterize the overallcomposition and 3’UTR structure of the most common maternal RNAs found in cod eggs and pre-zygotic embryos.
Results: 22229 Sanger-sequences were obtained from 3’-end sequenced cDNA libraries prepared from oocyte, 1-2cell, blastula and gastrula stages. Quantitative PCR revealed that EST copy number below 9 did not reflect the geneexpression profile. Consequently genes represented by less than 9 ESTs were excluded from downstream analyses,in addition to sequences with low-quality gene hits. This provided 12764 EST sequences, encoding 257 uniquegenes, for further analysis. Mitochondrial transcripts accounted for 45.9-50.6% of the transcripts isolated from thematernal stages, but only 12.2% of those present at the onset of zygotic transcription. 3’UTR length was predictedin nuclear sequences with poly-A tail, which identified 191 3’UTRs. Their characteristics indicated a more complexregulation of transcripts that are abundant prior to the onset of zygotic transcription. Maternal and stabletranscripts had longer 3’UTR (mean 187.1 and 208.8 bp) and more 3’UTR isoforms (45.7 and 34.6%) compared tozygotic transcripts, where 15.4% had 3’UTR isoforms and the mean 3’UTR length was 76 bp. Also, diversity and theamount of putative polyadenylation motifs were higher in both maternal and stable transcripts.
Conclusions: We report on the most pronounced processes in the maternally transferred cod transcriptome.Maternal stages are characterized by a rich abundance of mitochondrial transcripts. Maternal and stable transcriptsdisplay longer 3'UTRs with more variation of both polyadenylation motifs and 3'UTR isoforms. These data suggestthat cod eggs possess a complex array of maternal RNAs which likely act to tightly regulate early developmentalprocesses in the newly fertilized egg.
Keywords: 3’UTR, Sequence/EST filtering, External spiking, Transcriptome, Teleost, Embryonic development
BackgroundA series of complex biological processes take place overtime in order to transform a newly fertilized egg into afully grown organism. At the very beginning of embry-onic development, these biological processes are com-pletely controlled by maternally derived materials.Maternally deposited messenger RNAs (maternal RNAs)and proteins drive embryo development until the zygote
* Correspondence: [email protected] of Marine Research, P. O. Box 1870, Nordnesgaten 50, 5817 Bergen,NorwayFull list of author information is available at the end of the article
© 2012 Kleppe et al.; licensee BioMed CentralCommons Attribution License (http://creativecreproduction in any medium, provided the or
is able to transcribe its own RNA. The link between ma-ternal mRNAs and the ability of the embryo to developnormally is of high relevance in many fields, includingthat of aquaculture. For aquaculture species includingAtlantic cod (Gadus morhua L.), there is a necessity toproduce viable eggs and embryos to ensure botheconomic- and welfare aspects. However, variable eggviability is common, especially in marine farmed fishspecies (Reviewed in [1,2]). Also, egg viability in cod var-ies between batches within one spawning season [3]. Al-though a number of studies have identified differentfactors that may affect egg viability, as well as indicators
Ltd. This is an Open Access article distributed under the terms of the Creativeommons.org/licenses/by/2.0), which permits unrestricted use, distribution, andiginal work is properly cited.
Kleppe et al. BMC Genomics 2012, 13:443 Page 2 of 14http://www.biomedcentral.com/1471-2164/13/443
that could help in determining if an egg batch is of goodor bad shape (reviewed in [4]), the complete picture isfar from fully understood. During oogeneis transcribedmaternal RNAs are stored in dormant complexes fortranslation just before or after fertilization [5]. The acti-vation of translation is regulated and starts with polya-denlyation of the stored mRNA. A recent paper inzebrafish reports that 30% of maternal transcripts arepolyadenylated prior to fertilization while 70% are pro-gressively polyadenylated after fertilization [6]. In severalvertebrates including Xenopus, zebrafish and mouse, ele-ments (motifs) in the 3’UTR confer translation initiationand mRNA stability or degradation [5,7,8]. These 3’UTRelements bind specific proteins and/or protein-complexes which mediate stability, translation and deg-radation of maternal RNAs [5].As development progresses, maternal transcripts grad-
ually mix with zygotic transcripts and many are degraded,in line with the first events of embryogenesis. This mater-nal to zygotic transition (MZT) is characterized by a grad-ual degradation of maternal mRNAs and proteins,followed by transcriptional activation of the zygotic gen-ome (reviewed in [9]). MZT coincides with cell cyclelengthening and loss of cell synchrony at cell cycle 13 inXenopus, termed the midblastula transition (MBT)[10,11]. In zebrafish the MBT initiates at cycle 10 [12],when the embryo contains 512 cells [13]. In medaka MZTis uncoupled from the midblastula stage, and beginsalready at the 64 cells stage coinciding with the start ofasynchronous cell division [14]. In contrast, a large pro-portion of the maternal RNA is degraded already at the 2-cell stage in mammals [15,16], highlighting the markedspecies-specific differences in the timing of mRNA deg-radation and subsequent zygotic genome activation.The basic composition of maternal RNAs in the oocyte
and early embryogenesis has only been assayed in a fewteleost species including zebrafish [17,18] and recentlyAtlantic cod [19]. However, these studies looked at thecomposition of expressed genes using a microarray. Ols-vik [20] characterized the blastula stage in cod, using a
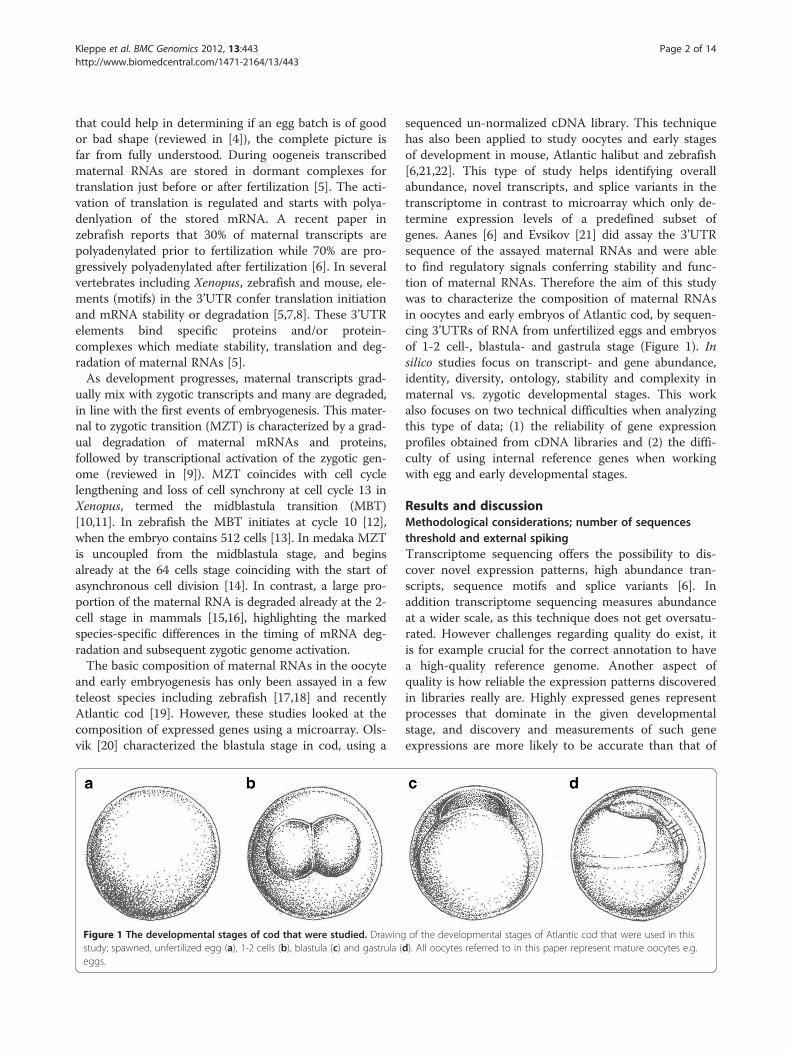
Figure 1 The developmental stages of cod that were studied. Drawingstudy; spawned, unfertilized egg (a), 1-2 cells (b), blastula (c) and gastrula (eggs.
sequenced un-normalized cDNA library. This techniquehas also been applied to study oocytes and early stagesof development in mouse, Atlantic halibut and zebrafish[6,21,22]. This type of study helps identifying overallabundance, novel transcripts, and splice variants in thetranscriptome in contrast to microarray which only de-termine expression levels of a predefined subset ofgenes. Aanes [6] and Evsikov [21] did assay the 3’UTRsequence of the assayed maternal RNAs and were ableto find regulatory signals conferring stability and func-tion of maternal RNAs. Therefore the aim of this studywas to characterize the composition of maternal RNAsin oocytes and early embryos of Atlantic cod, by sequen-cing 3’UTRs of RNA from unfertilized eggs and embryosof 1-2 cell-, blastula- and gastrula stage (Figure 1). Insilico studies focus on transcript- and gene abundance,identity, diversity, ontology, stability and complexity inmaternal vs. zygotic developmental stages. This workalso focuses on two technical difficulties when analyzingthis type of data; (1) the reliability of gene expressionprofiles obtained from cDNA libraries and (2) the diffi-culty of using internal reference genes when workingwith egg and early developmental stages.
Results and discussionMethodological considerations; number of sequencesthreshold and external spikingTranscriptome sequencing offers the possibility to dis-cover novel expression patterns, high abundance tran-scripts, sequence motifs and splice variants [6]. Inaddition transcriptome sequencing measures abundanceat a wider scale, as this technique does not get oversatu-rated. However challenges regarding quality do exist, itis for example crucial for the correct annotation to havea high-quality reference genome. Another aspect ofquality is how reliable the expression patterns discoveredin libraries really are. Highly expressed genes representprocesses that dominate in the given developmentalstage, and discovery and measurements of such geneexpressions are more likely to be accurate than that of
of the developmental stages of Atlantic cod that were used in thisd). All oocytes referred to in this paper represent mature oocytes e.g.
Kleppe et al. BMC Genomics 2012, 13:443 Page 3 of 14http://www.biomedcentral.com/1471-2164/13/443
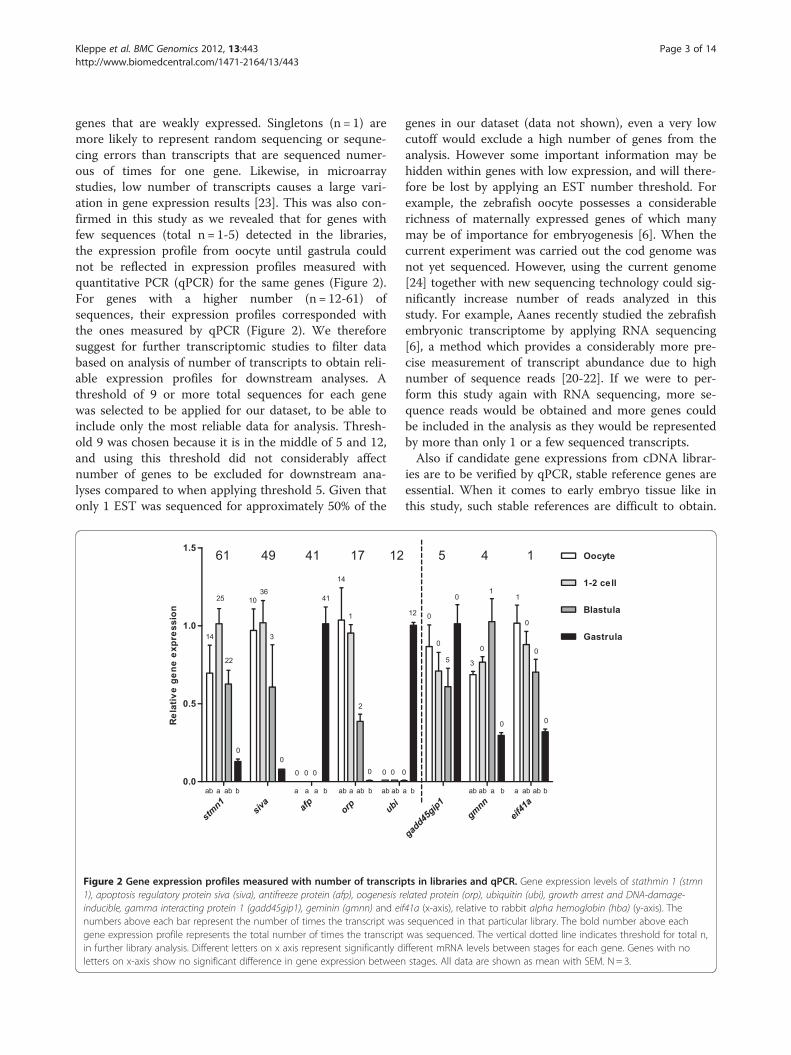
genes that are weakly expressed. Singletons (n = 1) aremore likely to represent random sequencing or sequne-cing errors than transcripts that are sequenced numer-ous of times for one gene. Likewise, in microarraystudies, low number of transcripts causes a large vari-ation in gene expression results [23]. This was also con-firmed in this study as we revealed that for genes withfew sequences (total n = 1-5) detected in the libraries,the expression profile from oocyte until gastrula couldnot be reflected in expression profiles measured withquantitative PCR (qPCR) for the same genes (Figure 2).For genes with a higher number (n = 12-61) ofsequences, their expression profiles corresponded withthe ones measured by qPCR (Figure 2). We thereforesuggest for further transcriptomic studies to filter databased on analysis of number of transcripts to obtain reli-able expression profiles for downstream analyses. Athreshold of 9 or more total sequences for each genewas selected to be applied for our dataset, to be able toinclude only the most reliable data for analysis. Thresh-old 9 was chosen because it is in the middle of 5 and 12,and using this threshold did not considerably affectnumber of genes to be excluded for downstream ana-lyses compared to when applying threshold 5. Given thatonly 1 EST was sequenced for approximately 50% of the
Figure 2 Gene expression profiles measured with number of transcrip1), apoptosis regulatory protein siva (siva), antifreeze protein (afp), oogenesis rinducible, gamma interacting protein 1 (gadd45gip1), geminin (gmnn) and eifnumbers above each bar represent the number of times the transcript wasgene expression profile represents the total number of times the transcriptin further library analysis. Different letters on x axis represent significantly dletters on x-axis show no significant difference in gene expression between
genes in our dataset (data not shown), even a very lowcutoff would exclude a high number of genes from theanalysis. However some important information may behidden within genes with low expression, and will there-fore be lost by applying an EST number threshold. Forexample, the zebrafish oocyte possesses a considerablerichness of maternally expressed genes of which manymay be of importance for embryogenesis [6]. When thecurrent experiment was carried out the cod genome wasnot yet sequenced. However, using the current genome[24] together with new sequencing technology could sig-nificantly increase number of reads analyzed in thisstudy. For example, Aanes recently studied the zebrafishembryonic transcriptome by applying RNA sequencing[6], a method which provides a considerably more pre-cise measurement of transcript abundance due to highnumber of sequence reads [20-22]. If we were to per-form this study again with RNA sequencing, more se-quence reads would be obtained and more genes couldbe included in the analysis as they would be representedby more than only 1 or a few sequenced transcripts.Also if candidate gene expressions from cDNA librar-
ies are to be verified by qPCR, stable reference genes areessential. When it comes to early embryo tissue like inthis study, such stable references are difficult to obtain.
ts in libraries and qPCR. Gene expression levels of stathmin 1 (stmnelated protein (orp), ubiquitin (ubi), growth arrest and DNA-damage-41a (x-axis), relative to rabbit alpha hemoglobin (hba) (y-axis). Thesequenced in that particular library. The bold number above eachwas sequenced. The vertical dotted line indicates threshold for total n,ifferent mRNA levels between stages for each gene. Genes with nostages. All data are shown as mean with SEM. N = 3.
Kleppe et al. BMC Genomics 2012, 13:443 Page 4 of 14http://www.biomedcentral.com/1471-2164/13/443
For example, neither β-actin, elongation factor 1- α(ef1α), 18S, actin related protein (arp) nor ubiquitin(ubi) showed stable reference gene expression in stagesassayed for gene expression [Additional file 1], [25,26].For this reason we chose not to use any of the referencegenes tested, but instead apply a technique (externalspiking) where external RNA (rabbit alpha hemoglobin(hba)) is added in equal amounts to each RNA sample[27]. The considerably more stable expression pattern ofhba can be seen in [Additional file 1]. We therefore sug-gest that external spiking may serve as a good alternativeto the traditional reference genes previously applied inqPCR, especially when measuring gene expressions inearly embryo tissue.
% t
ran
scri
pts
Oocyte
1-2 c
ell
Blastu
la
Gastru
la0
20
40
60
80
100
Mitochondrial
Nuclear
2684 3242 39552883
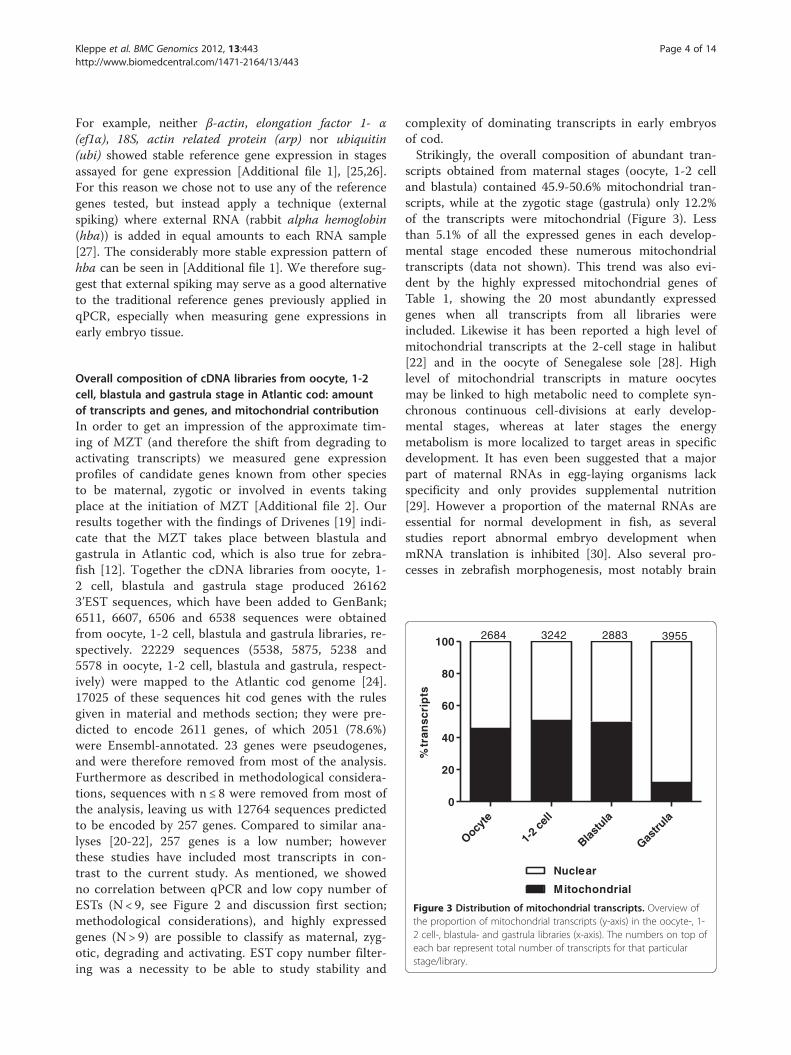
Figure 3 Distribution of mitochondrial transcripts. Overview ofthe proportion of mitochondrial transcripts (y-axis) in the oocyte-, 1-2 cell-, blastula- and gastrula libraries (x-axis). The numbers on top ofeach bar represent total number of transcripts for that particularstage/library.
Overall composition of cDNA libraries from oocyte, 1-2cell, blastula and gastrula stage in Atlantic cod: amountof transcripts and genes, and mitochondrial contributionIn order to get an impression of the approximate tim-ing of MZT (and therefore the shift from degrading toactivating transcripts) we measured gene expressionprofiles of candidate genes known from other speciesto be maternal, zygotic or involved in events takingplace at the initiation of MZT [Additional file 2]. Ourresults together with the findings of Drivenes [19] indi-cate that the MZT takes place between blastula andgastrula in Atlantic cod, which is also true for zebra-fish [12]. Together the cDNA libraries from oocyte, 1-2 cell, blastula and gastrula stage produced 261623’EST sequences, which have been added to GenBank;6511, 6607, 6506 and 6538 sequences were obtainedfrom oocyte, 1-2 cell, blastula and gastrula libraries, re-spectively. 22229 sequences (5538, 5875, 5238 and5578 in oocyte, 1-2 cell, blastula and gastrula, respect-ively) were mapped to the Atlantic cod genome [24].17025 of these sequences hit cod genes with the rulesgiven in material and methods section; they were pre-dicted to encode 2611 genes, of which 2051 (78.6%)were Ensembl-annotated. 23 genes were pseudogenes,and were therefore removed from most of the analysis.Furthermore as described in methodological considera-tions, sequences with n ≤ 8 were removed from most ofthe analysis, leaving us with 12764 sequences predictedto be encoded by 257 genes. Compared to similar ana-lyses [20-22], 257 genes is a low number; howeverthese studies have included most transcripts in con-trast to the current study. As mentioned, we showedno correlation between qPCR and low copy number ofESTs (N < 9, see Figure 2 and discussion first section;methodological considerations), and highly expressedgenes (N > 9) are possible to classify as maternal, zyg-otic, degrading and activating. EST copy number filter-ing was a necessity to be able to study stability and
complexity of dominating transcripts in early embryosof cod.Strikingly, the overall composition of abundant tran-
scripts obtained from maternal stages (oocyte, 1-2 celland blastula) contained 45.9-50.6% mitochondrial tran-scripts, while at the zygotic stage (gastrula) only 12.2%of the transcripts were mitochondrial (Figure 3). Lessthan 5.1% of all the expressed genes in each develop-mental stage encoded these numerous mitochondrialtranscripts (data not shown). This trend was also evi-dent by the highly expressed mitochondrial genes ofTable 1, showing the 20 most abundantly expressedgenes when all transcripts from all libraries wereincluded. Likewise it has been reported a high level ofmitochondrial transcripts at the 2-cell stage in halibut[22] and in the oocyte of Senegalese sole [28]. Highlevel of mitochondrial transcripts in mature oocytesmay be linked to high metabolic need to complete syn-chronous continuous cell-divisions at early develop-mental stages, whereas at later stages the energymetabolism is more localized to target areas in specificdevelopment. It has even been suggested that a majorpart of maternal RNAs in egg-laying organisms lackspecificity and only provides supplemental nutrition[29]. However a proportion of the maternal RNAs areessential for normal development in fish, as severalstudies report abnormal embryo development whenmRNA translation is inhibited [30]. Also several pro-cesses in zebrafish morphogenesis, most notably brain
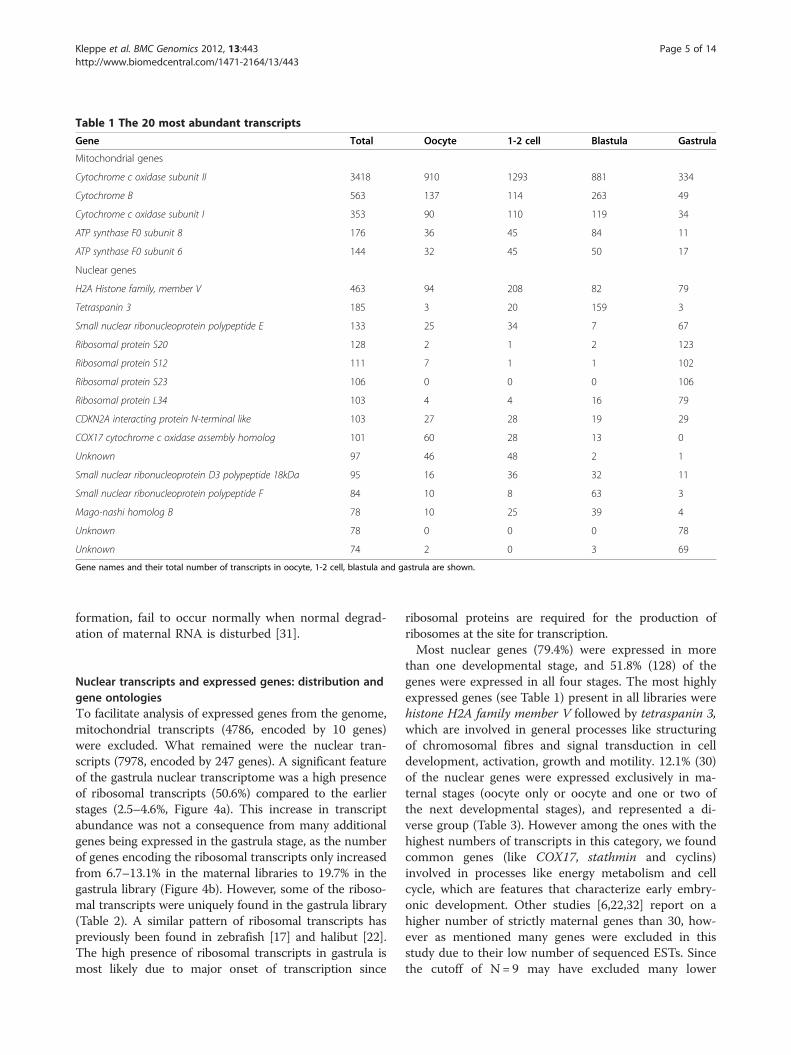
Table 1 The 20 most abundant transcripts
Gene Total Oocyte 1-2 cell Blastula Gastrula
Mitochondrial genes
Cytochrome c oxidase subunit II 3418 910 1293 881 334
Cytochrome B 563 137 114 263 49
Cytochrome c oxidase subunit I 353 90 110 119 34
ATP synthase F0 subunit 8 176 36 45 84 11
ATP synthase F0 subunit 6 144 32 45 50 17
Nuclear genes
H2A Histone family, member V 463 94 208 82 79
Tetraspanin 3 185 3 20 159 3
Small nuclear ribonucleoprotein polypeptide E 133 25 34 7 67
Ribosomal protein S20 128 2 1 2 123
Ribosomal protein S12 111 7 1 1 102
Ribosomal protein S23 106 0 0 0 106
Ribosomal protein L34 103 4 4 16 79
CDKN2A interacting protein N-terminal like 103 27 28 19 29
COX17 cytochrome c oxidase assembly homolog 101 60 28 13 0
Unknown 97 46 48 2 1
Small nuclear ribonucleoprotein D3 polypeptide 18kDa 95 16 36 32 11
Small nuclear ribonucleoprotein polypeptide F 84 10 8 63 3
Mago-nashi homolog B 78 10 25 39 4
Unknown 78 0 0 0 78
Unknown 74 2 0 3 69
Gene names and their total number of transcripts in oocyte, 1-2 cell, blastula and gastrula are shown.
Kleppe et al. BMC Genomics 2012, 13:443 Page 5 of 14http://www.biomedcentral.com/1471-2164/13/443
formation, fail to occur normally when normal degrad-ation of maternal RNA is disturbed [31].
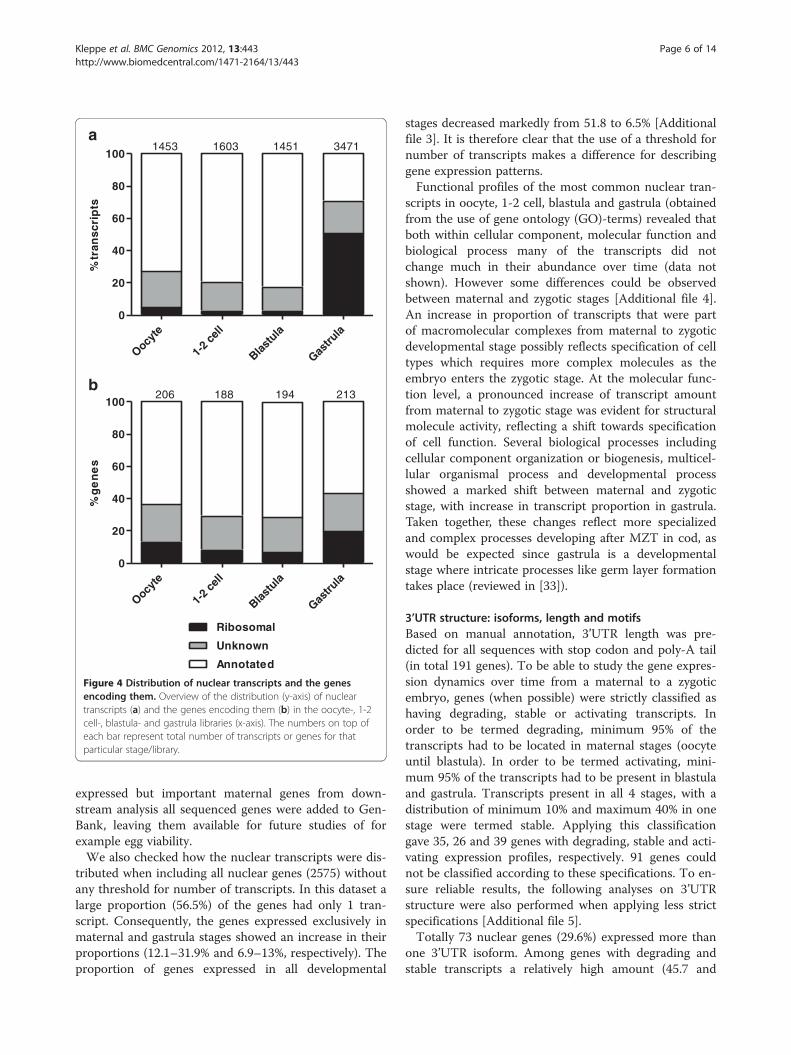
Nuclear transcripts and expressed genes: distribution andgene ontologiesTo facilitate analysis of expressed genes from the genome,mitochondrial transcripts (4786, encoded by 10 genes)were excluded. What remained were the nuclear tran-scripts (7978, encoded by 247 genes). A significant featureof the gastrula nuclear transcriptome was a high presenceof ribosomal transcripts (50.6%) compared to the earlierstages (2.5–4.6%, Figure 4a). This increase in transcriptabundance was not a consequence from many additionalgenes being expressed in the gastrula stage, as the numberof genes encoding the ribosomal transcripts only increasedfrom 6.7–13.1% in the maternal libraries to 19.7% in thegastrula library (Figure 4b). However, some of the riboso-mal transcripts were uniquely found in the gastrula library(Table 2). A similar pattern of ribosomal transcripts haspreviously been found in zebrafish [17] and halibut [22].The high presence of ribosomal transcripts in gastrula ismost likely due to major onset of transcription since
ribosomal proteins are required for the production ofribosomes at the site for transcription.Most nuclear genes (79.4%) were expressed in more
than one developmental stage, and 51.8% (128) of thegenes were expressed in all four stages. The most highlyexpressed genes (see Table 1) present in all libraries werehistone H2A family member V followed by tetraspanin 3,which are involved in general processes like structuringof chromosomal fibres and signal transduction in celldevelopment, activation, growth and motility. 12.1% (30)of the nuclear genes were expressed exclusively in ma-ternal stages (oocyte only or oocyte and one or two ofthe next developmental stages), and represented a di-verse group (Table 3). However among the ones with thehighest numbers of transcripts in this category, we foundcommon genes (like COX17, stathmin and cyclins)involved in processes like energy metabolism and cellcycle, which are features that characterize early embry-onic development. Other studies [6,22,32] report on ahigher number of strictly maternal genes than 30, how-ever as mentioned many genes were excluded in thisstudy due to their low number of sequenced ESTs. Sincethe cutoff of N = 9 may have excluded many lower
% t
ran
scri
pts
Oocyte
1-2 c
ell
Blastu
la
Gastru
la0
20
40
60
80
100
Ribosomal
Unknown
Annotated
145116031453 3471
% g
en
es
Oocyte
1-2 c
ell
Blastu
la
Gastru
la0
20
40
60
80
100188 194 213206
a
b
Figure 4 Distribution of nuclear transcripts and the genesencoding them. Overview of the distribution (y-axis) of nucleartranscripts (a) and the genes encoding them (b) in the oocyte-, 1-2cell-, blastula- and gastrula libraries (x-axis). The numbers on top ofeach bar represent total number of transcripts or genes for thatparticular stage/library.
Kleppe et al. BMC Genomics 2012, 13:443 Page 6 of 14http://www.biomedcentral.com/1471-2164/13/443
expressed but important maternal genes from down-stream analysis all sequenced genes were added to Gen-Bank, leaving them available for future studies of forexample egg viability.We also checked how the nuclear transcripts were dis-
tributed when including all nuclear genes (2575) withoutany threshold for number of transcripts. In this dataset alarge proportion (56.5%) of the genes had only 1 tran-script. Consequently, the genes expressed exclusively inmaternal and gastrula stages showed an increase in theirproportions (12.1–31.9% and 6.9–13%, respectively). Theproportion of genes expressed in all developmental
stages decreased markedly from 51.8 to 6.5% [Additionalfile 3]. It is therefore clear that the use of a threshold fornumber of transcripts makes a difference for describinggene expression patterns.Functional profiles of the most common nuclear tran-
scripts in oocyte, 1-2 cell, blastula and gastrula (obtainedfrom the use of gene ontology (GO)-terms) revealed thatboth within cellular component, molecular function andbiological process many of the transcripts did notchange much in their abundance over time (data notshown). However some differences could be observedbetween maternal and zygotic stages [Additional file 4].An increase in proportion of transcripts that were partof macromolecular complexes from maternal to zygoticdevelopmental stage possibly reflects specification of celltypes which requires more complex molecules as theembryo enters the zygotic stage. At the molecular func-tion level, a pronounced increase of transcript amountfrom maternal to zygotic stage was evident for structuralmolecule activity, reflecting a shift towards specificationof cell function. Several biological processes includingcellular component organization or biogenesis, multicel-lular organismal process and developmental processshowed a marked shift between maternal and zygoticstage, with increase in transcript proportion in gastrula.Taken together, these changes reflect more specializedand complex processes developing after MZT in cod, aswould be expected since gastrula is a developmentalstage where intricate processes like germ layer formationtakes place (reviewed in [33]).
3’UTR structure: isoforms, length and motifsBased on manual annotation, 3’UTR length was pre-dicted for all sequences with stop codon and poly-A tail(in total 191 genes). To be able to study the gene expres-sion dynamics over time from a maternal to a zygoticembryo, genes (when possible) were strictly classified ashaving degrading, stable or activating transcripts. Inorder to be termed degrading, minimum 95% of thetranscripts had to be located in maternal stages (oocyteuntil blastula). In order to be termed activating, mini-mum 95% of the transcripts had to be present in blastulaand gastrula. Transcripts present in all 4 stages, with adistribution of minimum 10% and maximum 40% in onestage were termed stable. Applying this classificationgave 35, 26 and 39 genes with degrading, stable and acti-vating expression profiles, respectively. 91 genes couldnot be classified according to these specifications. To en-sure reliable results, the following analyses on 3’UTRstructure were also performed when applying less strictspecifications [Additional file 5].Totally 73 nuclear genes (29.6%) expressed more than
one 3’UTR isoform. Among genes with degrading andstable transcripts a relatively high amount (45.7 and
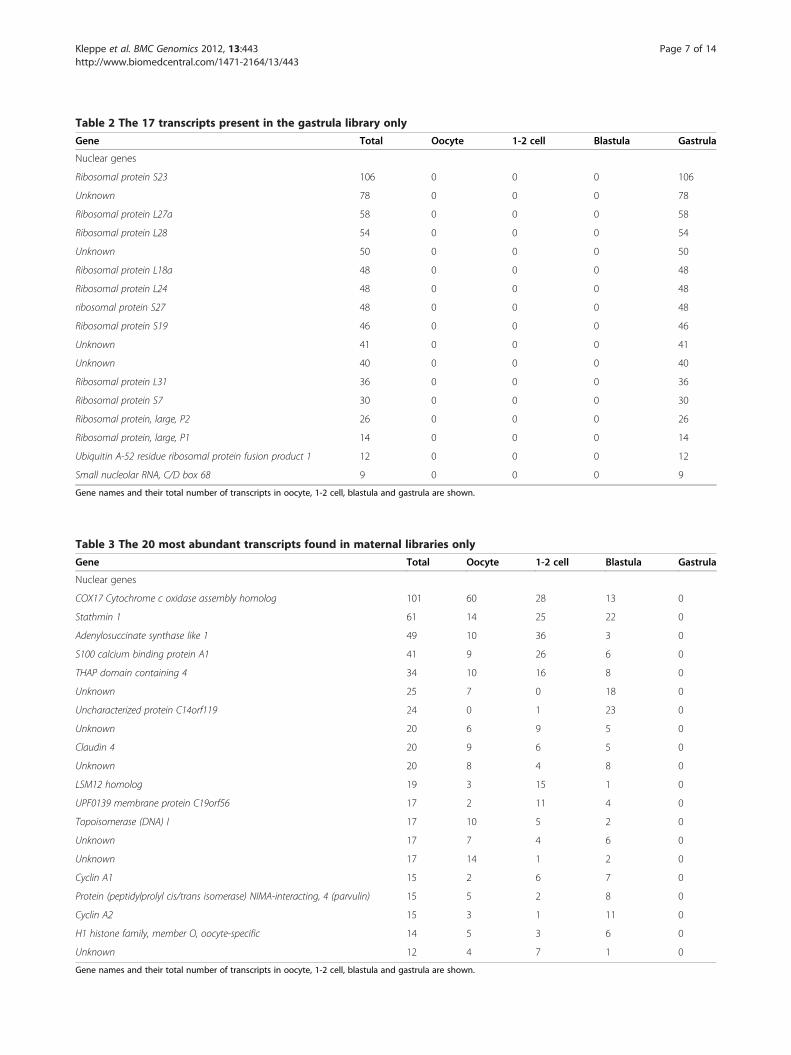
Table 2 The 17 transcripts present in the gastrula library only
Gene Total Oocyte 1-2 cell Blastula Gastrula
Nuclear genes
Ribosomal protein S23 106 0 0 0 106
Unknown 78 0 0 0 78
Ribosomal protein L27a 58 0 0 0 58
Ribosomal protein L28 54 0 0 0 54
Unknown 50 0 0 0 50
Ribosomal protein L18a 48 0 0 0 48
Ribosomal protein L24 48 0 0 0 48
ribosomal protein S27 48 0 0 0 48
Ribosomal protein S19 46 0 0 0 46
Unknown 41 0 0 0 41
Unknown 40 0 0 0 40
Ribosomal protein L31 36 0 0 0 36
Ribosomal protein S7 30 0 0 0 30
Ribosomal protein, large, P2 26 0 0 0 26
Ribosomal protein, large, P1 14 0 0 0 14
Ubiquitin A-52 residue ribosomal protein fusion product 1 12 0 0 0 12
Small nucleolar RNA, C/D box 68 9 0 0 0 9
Gene names and their total number of transcripts in oocyte, 1-2 cell, blastula and gastrula are shown.
Table 3 The 20 most abundant transcripts found in maternal libraries only
Gene Total Oocyte 1-2 cell Blastula Gastrula
Nuclear genes
COX17 Cytochrome c oxidase assembly homolog 101 60 28 13 0
Stathmin 1 61 14 25 22 0
Adenylosuccinate synthase like 1 49 10 36 3 0
S100 calcium binding protein A1 41 9 26 6 0
THAP domain containing 4 34 10 16 8 0
Unknown 25 7 0 18 0
Uncharacterized protein C14orf119 24 0 1 23 0
Unknown 20 6 9 5 0
Claudin 4 20 9 6 5 0
Unknown 20 8 4 8 0
LSM12 homolog 19 3 15 1 0
UPF0139 membrane protein C19orf56 17 2 11 4 0
Topoisomerase (DNA) I 17 10 5 2 0
Unknown 17 7 4 6 0
Unknown 17 14 1 2 0
Cyclin A1 15 2 6 7 0
Protein (peptidylprolyl cis/trans isomerase) NIMA-interacting, 4 (parvulin) 15 5 2 8 0
Cyclin A2 15 3 1 11 0
H1 histone family, member O, oocyte-specific 14 5 3 6 0
Unknown 12 4 7 1 0
Gene names and their total number of transcripts in oocyte, 1-2 cell, blastula and gastrula are shown.
Kleppe et al. BMC Genomics 2012, 13:443 Page 7 of 14http://www.biomedcentral.com/1471-2164/13/443
Nu
mb
er
of
ge
ne
s
All gen
es
Degra
ding
Stable
Activa
ting
0
50
100
150
200
250
29.6%
45.7%34.6% 15.4%
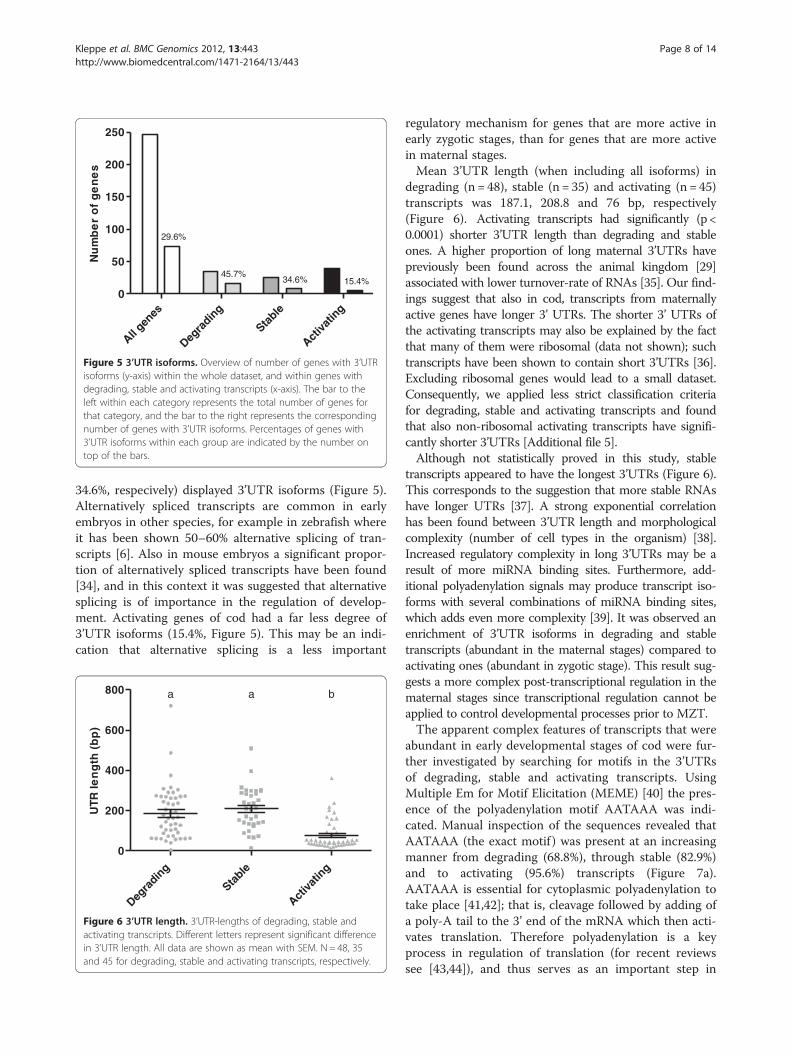
Figure 5 3’UTR isoforms. Overview of number of genes with 3’UTRisoforms (y-axis) within the whole dataset, and within genes withdegrading, stable and activating transcripts (x-axis). The bar to theleft within each category represents the total number of genes forthat category, and the bar to the right represents the correspondingnumber of genes with 3’UTR isoforms. Percentages of genes with3’UTR isoforms within each group are indicated by the number ontop of the bars.
Kleppe et al. BMC Genomics 2012, 13:443 Page 8 of 14http://www.biomedcentral.com/1471-2164/13/443
34.6%, respecively) displayed 3’UTR isoforms (Figure 5).Alternatively spliced transcripts are common in earlyembryos in other species, for example in zebrafish whereit has been shown 50–60% alternative splicing of tran-scripts [6]. Also in mouse embryos a significant propor-tion of alternatively spliced transcripts have been found[34], and in this context it was suggested that alternativesplicing is of importance in the regulation of develop-ment. Activating genes of cod had a far less degree of3’UTR isoforms (15.4%, Figure 5). This may be an indi-cation that alternative splicing is a less important
UTR
len
gth
(b
p)
Degra
ding
Stable
Activa
ting
0
200
400
600
800 a a b
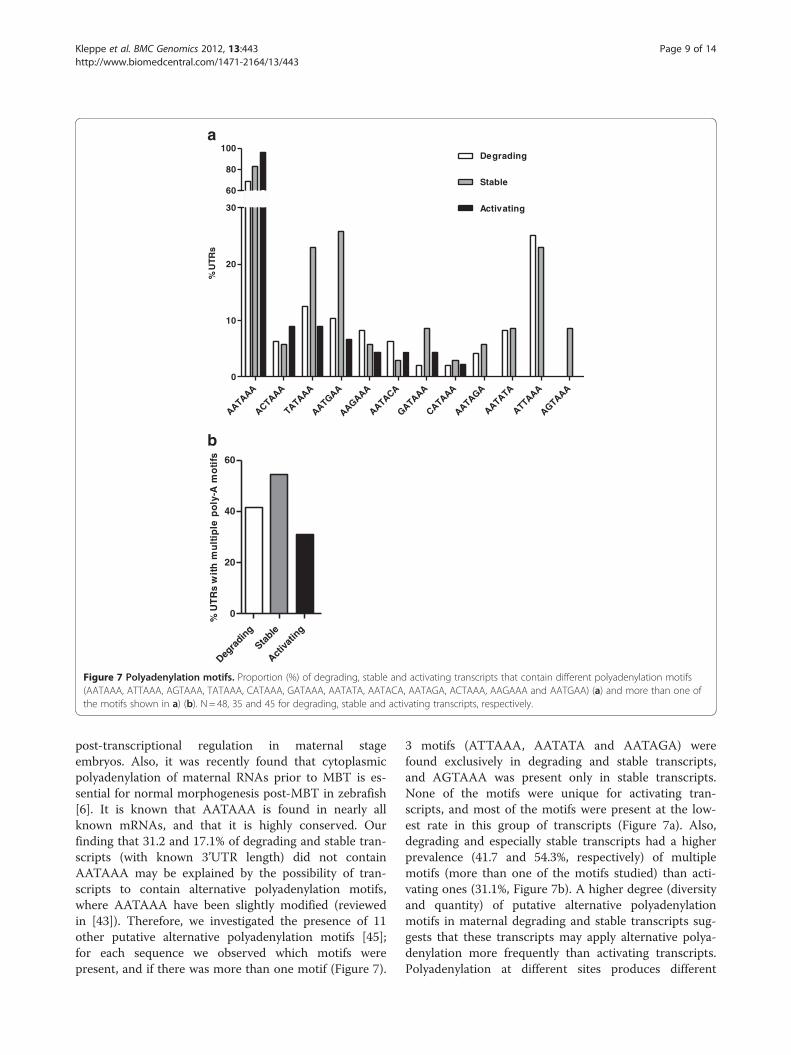
Figure 6 3’UTR length. 3’UTR-lengths of degrading, stable andactivating transcripts. Different letters represent significant differencein 3’UTR length. All data are shown as mean with SEM. N = 48, 35and 45 for degrading, stable and activating transcripts, respectively.
regulatory mechanism for genes that are more active inearly zygotic stages, than for genes that are more activein maternal stages.Mean 3’UTR length (when including all isoforms) in
degrading (n = 48), stable (n = 35) and activating (n = 45)transcripts was 187.1, 208.8 and 76 bp, respectively(Figure 6). Activating transcripts had significantly (p <0.0001) shorter 3’UTR length than degrading and stableones. A higher proportion of long maternal 3’UTRs havepreviously been found across the animal kingdom [29]associated with lower turnover-rate of RNAs [35]. Our find-ings suggest that also in cod, transcripts from maternallyactive genes have longer 3’ UTRs. The shorter 3’ UTRs ofthe activating transcripts may also be explained by the factthat many of them were ribosomal (data not shown); suchtranscripts have been shown to contain short 3’UTRs [36].Excluding ribosomal genes would lead to a small dataset.Consequently, we applied less strict classification criteriafor degrading, stable and activating transcripts and foundthat also non-ribosomal activating transcripts have signifi-cantly shorter 3’UTRs [Additional file 5].Although not statistically proved in this study, stable
transcripts appeared to have the longest 3’UTRs (Figure 6).This corresponds to the suggestion that more stable RNAshave longer UTRs [37]. A strong exponential correlationhas been found between 3’UTR length and morphologicalcomplexity (number of cell types in the organism) [38].Increased regulatory complexity in long 3’UTRs may be aresult of more miRNA binding sites. Furthermore, add-itional polyadenylation signals may produce transcript iso-forms with several combinations of miRNA binding sites,which adds even more complexity [39]. It was observed anenrichment of 3’UTR isoforms in degrading and stabletranscripts (abundant in the maternal stages) compared toactivating ones (abundant in zygotic stage). This result sug-gests a more complex post-transcriptional regulation in thematernal stages since transcriptional regulation cannot beapplied to control developmental processes prior to MZT.The apparent complex features of transcripts that were
abundant in early developmental stages of cod were fur-ther investigated by searching for motifs in the 3’UTRsof degrading, stable and activating transcripts. UsingMultiple Em for Motif Elicitation (MEME) [40] the pres-ence of the polyadenylation motif AATAAA was indi-cated. Manual inspection of the sequences revealed thatAATAAA (the exact motif ) was present at an increasingmanner from degrading (68.8%), through stable (82.9%)and to activating (95.6%) transcripts (Figure 7a).AATAAA is essential for cytoplasmic polyadenylation totake place [41,42]; that is, cleavage followed by adding ofa poly-A tail to the 3’ end of the mRNA which then acti-vates translation. Therefore polyadenylation is a keyprocess in regulation of translation (for recent reviewssee [43,44]), and thus serves as an important step in
% U
TRs
AATAAA
ACTAAA
TATAAA
AATGAA
AAGAAA
AATACA
GATAAA
CATAAA
AATAGA
AATATA
ATTAAA
AGTAAA
0
10
20
30
60
80
100Degrading
Stable
Activating%
UT
Rs
wit
h m
ult
iple
po
ly-A
mo
tifs
Degra
ding
Stable
Activa
ting
0
20
40
60
a
b
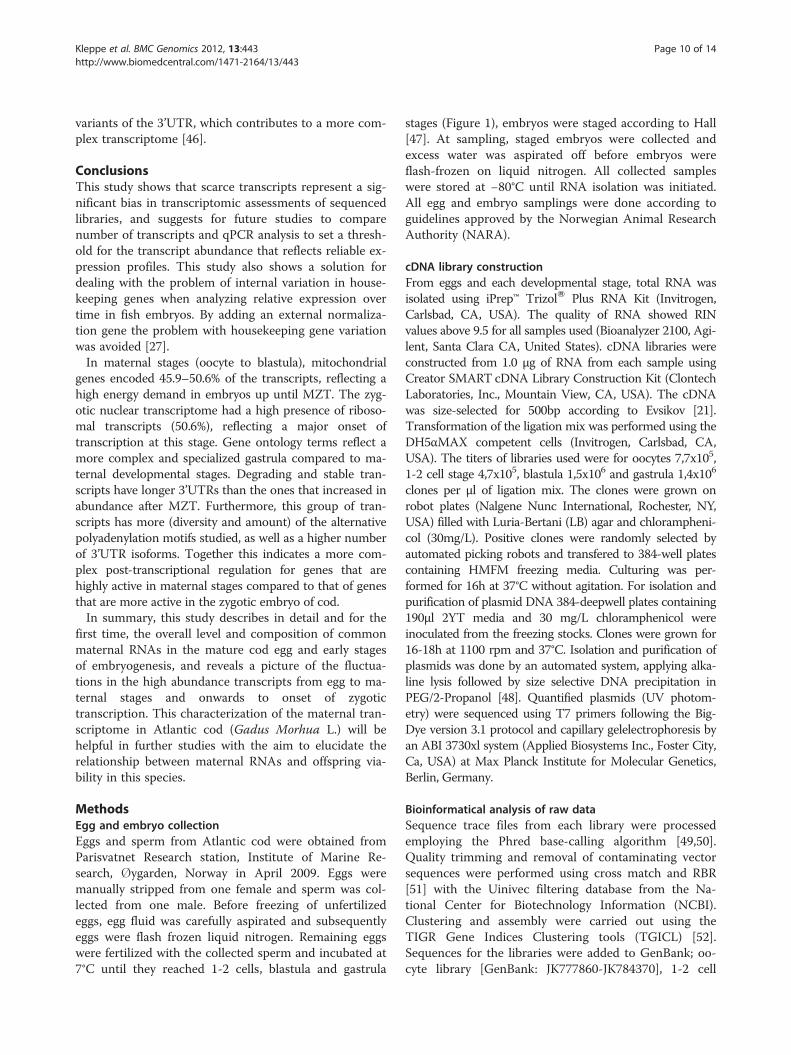
Figure 7 Polyadenylation motifs. Proportion (%) of degrading, stable and activating transcripts that contain different polyadenylation motifs(AATAAA, ATTAAA, AGTAAA, TATAAA, CATAAA, GATAAA, AATATA, AATACA, AATAGA, ACTAAA, AAGAAA and AATGAA) (a) and more than one ofthe motifs shown in a) (b). N = 48, 35 and 45 for degrading, stable and activating transcripts, respectively.
Kleppe et al. BMC Genomics 2012, 13:443 Page 9 of 14http://www.biomedcentral.com/1471-2164/13/443
post-transcriptional regulation in maternal stageembryos. Also, it was recently found that cytoplasmicpolyadenylation of maternal RNAs prior to MBT is es-sential for normal morphogenesis post-MBT in zebrafish[6]. It is known that AATAAA is found in nearly allknown mRNAs, and that it is highly conserved. Ourfinding that 31.2 and 17.1% of degrading and stable tran-scripts (with known 3’UTR length) did not containAATAAA may be explained by the possibility of tran-scripts to contain alternative polyadenylation motifs,where AATAAA have been slightly modified (reviewedin [43]). Therefore, we investigated the presence of 11other putative alternative polyadenylation motifs [45];for each sequence we observed which motifs werepresent, and if there was more than one motif (Figure 7).
3 motifs (ATTAAA, AATATA and AATAGA) werefound exclusively in degrading and stable transcripts,and AGTAAA was present only in stable transcripts.None of the motifs were unique for activating tran-scripts, and most of the motifs were present at the low-est rate in this group of transcripts (Figure 7a). Also,degrading and especially stable transcripts had a higherprevalence (41.7 and 54.3%, respectively) of multiplemotifs (more than one of the motifs studied) than acti-vating ones (31.1%, Figure 7b). A higher degree (diversityand quantity) of putative alternative polyadenylationmotifs in maternal degrading and stable transcripts sug-gests that these transcripts may apply alternative polya-denylation more frequently than activating transcripts.Polyadenylation at different sites produces different
Kleppe et al. BMC Genomics 2012, 13:443 Page 10 of 14http://www.biomedcentral.com/1471-2164/13/443
variants of the 3’UTR, which contributes to a more com-plex transcriptome [46].
ConclusionsThis study shows that scarce transcripts represent a sig-nificant bias in transcriptomic assessments of sequencedlibraries, and suggests for future studies to comparenumber of transcripts and qPCR analysis to set a thresh-old for the transcript abundance that reflects reliable ex-pression profiles. This study also shows a solution fordealing with the problem of internal variation in house-keeping genes when analyzing relative expression overtime in fish embryos. By adding an external normaliza-tion gene the problem with housekeeping gene variationwas avoided [27].In maternal stages (oocyte to blastula), mitochondrial
genes encoded 45.9–50.6% of the transcripts, reflecting ahigh energy demand in embryos up until MZT. The zyg-otic nuclear transcriptome had a high presence of riboso-mal transcripts (50.6%), reflecting a major onset oftranscription at this stage. Gene ontology terms reflect amore complex and specialized gastrula compared to ma-ternal developmental stages. Degrading and stable tran-scripts have longer 3’UTRs than the ones that increased inabundance after MZT. Furthermore, this group of tran-scripts has more (diversity and amount) of the alternativepolyadenylation motifs studied, as well as a higher numberof 3’UTR isoforms. Together this indicates a more com-plex post-transcriptional regulation for genes that arehighly active in maternal stages compared to that of genesthat are more active in the zygotic embryo of cod.In summary, this study describes in detail and for the
first time, the overall level and composition of commonmaternal RNAs in the mature cod egg and early stagesof embryogenesis, and reveals a picture of the fluctua-tions in the high abundance transcripts from egg to ma-ternal stages and onwards to onset of zygotictranscription. This characterization of the maternal tran-scriptome in Atlantic cod (Gadus Morhua L.) will behelpful in further studies with the aim to elucidate therelationship between maternal RNAs and offspring via-bility in this species.
MethodsEgg and embryo collectionEggs and sperm from Atlantic cod were obtained fromParisvatnet Research station, Institute of Marine Re-search, �ygarden, Norway in April 2009. Eggs weremanually stripped from one female and sperm was col-lected from one male. Before freezing of unfertilizedeggs, egg fluid was carefully aspirated and subsequentlyeggs were flash frozen liquid nitrogen. Remaining eggswere fertilized with the collected sperm and incubated at7°C until they reached 1-2 cells, blastula and gastrula
stages (Figure 1), embryos were staged according to Hall[47]. At sampling, staged embryos were collected andexcess water was aspirated off before embryos wereflash-frozen on liquid nitrogen. All collected sampleswere stored at −80°C until RNA isolation was initiated.All egg and embryo samplings were done according toguidelines approved by the Norwegian Animal ResearchAuthority (NARA).
cDNA library constructionFrom eggs and each developmental stage, total RNA wasisolated using iPrep™ TrizolW Plus RNA Kit (Invitrogen,Carlsbad, CA, USA). The quality of RNA showed RINvalues above 9.5 for all samples used (Bioanalyzer 2100, Agi-lent, Santa Clara CA, United States). cDNA libraries wereconstructed from 1.0 μg of RNA from each sample usingCreator SMART cDNA Library Construction Kit (ClontechLaboratories, Inc., Mountain View, CA, USA). The cDNAwas size-selected for 500bp according to Evsikov [21].Transformation of the ligation mix was performed using theDH5αMAX competent cells (Invitrogen, Carlsbad, CA,USA). The titers of libraries used were for oocytes 7,7x105,1-2 cell stage 4,7x10⁵, blastula 1,5x10⁶ and gastrula 1,4x10⁶
clones per μl of ligation mix. The clones were grown onrobot plates (Nalgene Nunc International, Rochester, NY,USA) filled with Luria-Bertani (LB) agar and chlorampheni-col (30mg/L). Positive clones were randomly selected byautomated picking robots and transfered to 384-well platescontaining HMFM freezing media. Culturing was per-formed for 16h at 37°C without agitation. For isolation andpurification of plasmid DNA 384-deepwell plates containing190μl 2YT media and 30 mg/L chloramphenicol wereinoculated from the freezing stocks. Clones were grown for16-18h at 1100 rpm and 37°C. Isolation and purification ofplasmids was done by an automated system, applying alka-line lysis followed by size selective DNA precipitation inPEG/2-Propanol [48]. Quantified plasmids (UV photom-etry) were sequenced using T7 primers following the Big-Dye version 3.1 protocol and capillary gelelectrophoresis byan ABI 3730xl system (Applied Biosystems Inc., Foster City,Ca, USA) at Max Planck Institute for Molecular Genetics,Berlin, Germany.
Bioinformatical analysis of raw dataSequence trace files from each library were processedemploying the Phred base-calling algorithm [49,50].Quality trimming and removal of contaminating vectorsequences were performed using cross match and RBR[51] with the Uinivec filtering database from the Na-tional Center for Biotechnology Information (NCBI).Clustering and assembly were carried out using theTIGR Gene Indices Clustering tools (TGICL) [52].Sequences for the libraries were added to GenBank; oo-cyte library [GenBank: JK777860-JK784370], 1-2 cell
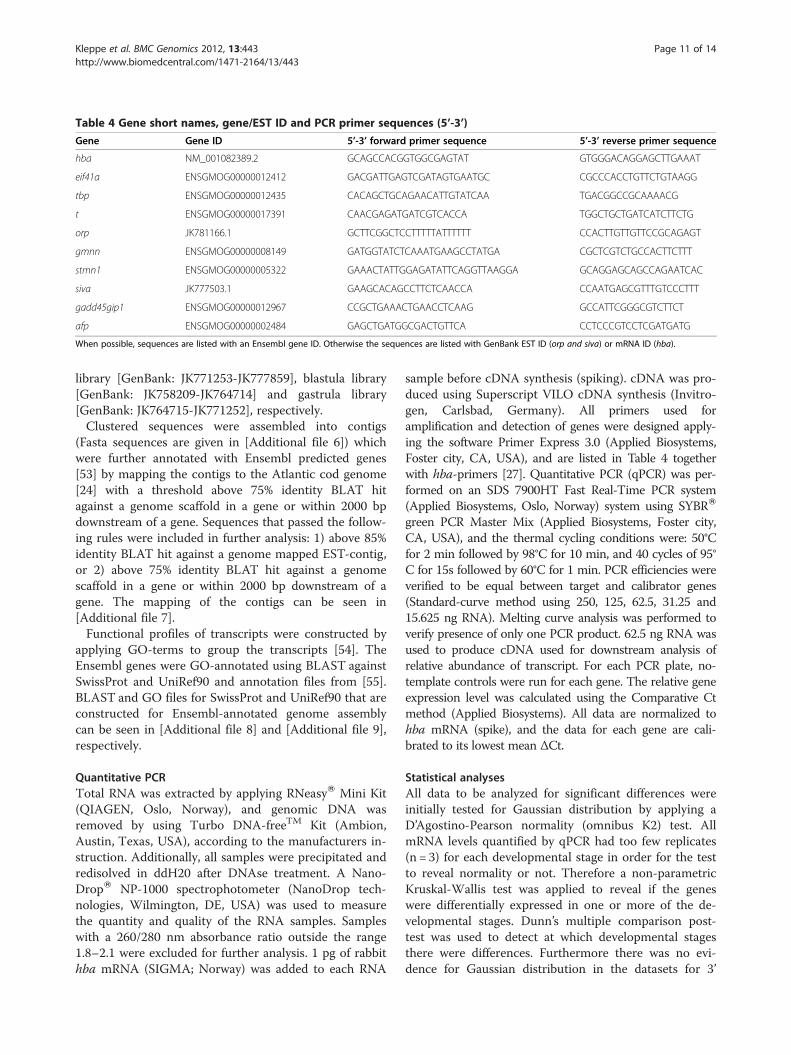
Table 4 Gene short names, gene/EST ID and PCR primer sequences (5’-3’)
Gene Gene ID 5’-3’ forward primer sequence 5’-3’ reverse primer sequence
hba NM_001082389.2 GCAGCCACGGTGGCGAGTAT GTGGGACAGGAGCTTGAAAT
eif41a ENSGMOG00000012412 GACGATTGAGTCGATAGTGAATGC CGCCCACCTGTTCTGTAAGG
tbp ENSGMOG00000012435 CACAGCTGCAGAACATTGTATCAA TGACGGCCGCAAAACG
t ENSGMOG00000017391 CAACGAGATGATCGTCACCA TGGCTGCTGATCATCTTCTG
orp JK781166.1 GCTTCGGCTCCTTTTTATTTTTT CCACTTGTTGTTCCGCAGAGT
gmnn ENSGMOG00000008149 GATGGTATCTCAAATGAAGCCTATGA CGCTCGTCTGCCACTTCTTT
stmn1 ENSGMOG00000005322 GAAACTATTGGAGATATTCAGGTTAAGGA GCAGGAGCAGCCAGAATCAC
siva JK777503.1 GAAGCACAGCCTTCTCAACCA CCAATGAGCGTTTGTCCCTTT
gadd45gip1 ENSGMOG00000012967 CCGCTGAAACTGAACCTCAAG GCCATTCGGGCGTCTTCT
afp ENSGMOG00000002484 GAGCTGATGGCGACTGTTCA CCTCCCGTCCTCGATGATG
When possible, sequences are listed with an Ensembl gene ID. Otherwise the sequences are listed with GenBank EST ID (orp and siva) or mRNA ID (hba).
Kleppe et al. BMC Genomics 2012, 13:443 Page 11 of 14http://www.biomedcentral.com/1471-2164/13/443
library [GenBank: JK771253-JK777859], blastula library[GenBank: JK758209-JK764714] and gastrula library[GenBank: JK764715-JK771252], respectively.Clustered sequences were assembled into contigs
(Fasta sequences are given in [Additional file 6]) whichwere further annotated with Ensembl predicted genes[53] by mapping the contigs to the Atlantic cod genome[24] with a threshold above 75% identity BLAT hitagainst a genome scaffold in a gene or within 2000 bpdownstream of a gene. Sequences that passed the follow-ing rules were included in further analysis: 1) above 85%identity BLAT hit against a genome mapped EST-contig,or 2) above 75% identity BLAT hit against a genomescaffold in a gene or within 2000 bp downstream of agene. The mapping of the contigs can be seen in[Additional file 7].Functional profiles of transcripts were constructed by
applying GO-terms to group the transcripts [54]. TheEnsembl genes were GO-annotated using BLAST againstSwissProt and UniRef90 and annotation files from [55].BLAST and GO files for SwissProt and UniRef90 that areconstructed for Ensembl-annotated genome assemblycan be seen in [Additional file 8] and [Additional file 9],respectively.
Quantitative PCRTotal RNA was extracted by applying RNeasyW Mini Kit(QIAGEN, Oslo, Norway), and genomic DNA wasremoved by using Turbo DNA-freeTM Kit (Ambion,Austin, Texas, USA), according to the manufacturers in-struction. Additionally, all samples were precipitated andredisolved in ddH20 after DNAse treatment. A Nano-DropW NP-1000 spectrophotometer (NanoDrop tech-nologies, Wilmington, DE, USA) was used to measurethe quantity and quality of the RNA samples. Sampleswith a 260/280 nm absorbance ratio outside the range1.8–2.1 were excluded for further analysis. 1 pg of rabbithba mRNA (SIGMA; Norway) was added to each RNA
sample before cDNA synthesis (spiking). cDNA was pro-duced using Superscript VILO cDNA synthesis (Invitro-gen, Carlsbad, Germany). All primers used foramplification and detection of genes were designed apply-ing the software Primer Express 3.0 (Applied Biosystems,Foster city, CA, USA), and are listed in Table 4 togetherwith hba-primers [27]. Quantitative PCR (qPCR) was per-formed on an SDS 7900HT Fast Real-Time PCR system(Applied Biosystems, Oslo, Norway) system using SYBRW
green PCR Master Mix (Applied Biosystems, Foster city,CA, USA), and the thermal cycling conditions were: 50°Cfor 2 min followed by 98°C for 10 min, and 40 cycles of 95°C for 15s followed by 60°C for 1 min. PCR efficiencies wereverified to be equal between target and calibrator genes(Standard-curve method using 250, 125, 62.5, 31.25 and15.625 ng RNA). Melting curve analysis was performed toverify presence of only one PCR product. 62.5 ng RNA wasused to produce cDNA used for downstream analysis ofrelative abundance of transcript. For each PCR plate, no-template controls were run for each gene. The relative geneexpression level was calculated using the Comparative Ctmethod (Applied Biosystems). All data are normalized tohba mRNA (spike), and the data for each gene are cali-brated to its lowest mean ΔCt.
Statistical analysesAll data to be analyzed for significant differences wereinitially tested for Gaussian distribution by applying aD’Agostino-Pearson normality (omnibus K2) test. AllmRNA levels quantified by qPCR had too few replicates(n = 3) for each developmental stage in order for the testto reveal normality or not. Therefore a non-parametricKruskal-Wallis test was applied to reveal if the geneswere differentially expressed in one or more of the de-velopmental stages. Dunn’s multiple comparison post-test was used to detect at which developmental stagesthere were differences. Furthermore there was no evi-dence for Gaussian distribution in the datasets for 3’
Kleppe et al. BMC Genomics 2012, 13:443 Page 12 of 14http://www.biomedcentral.com/1471-2164/13/443
UTR length analysis, including when they were con-verted to log values. Therefore a non-parametric Krus-kal-Wallis test was also applied here to calculate if therewere any differences in UTR length between differentgroups of transcripts. Dunn’s post test was applied to re-veal which groups differed from each other. The statis-tical tests were performed using GraphPad Prism 5.04(GraphPad Software Inc., La Jolla, CA92037, USA). Ap-value of ≤0.05 indicates significant difference.
Additional files
Additional file 1: Gene expression of reference genes in oocyte, 1-2cell, blastula and gastrula stage in cod. mRNA levels are shown ascycle threshold (Ct)-values when 250 ng RNA was used for cDNAsynthesis. All data are shown as mean with SEM. N = 2.
Additional file 2: Gene expression levels of candidate genes toreveal timing of midblastula transition in cod. mRNA levels of 3candidate genes were measured in oocyte, 1-2 cell, blastula and gastrulastage. mRNA levels are relative to hba. Bars with different lettersrepresent significant different mRNA levels for each gene. All data areshown as mean with SEM. N = 3. The maternal candidate chosen was theeukaryotic translation initiation factor 4E (eif4e) in which the 1b variant isfound in oocyte and early embryo only in mouse (eif4Eloo, eif41b; [21])and zebrafish [55]. Syntenic analysis in cod did not reveal eif41b,suggesting that this gene has been lost in this species (Data not shown,[27]). We measured eif41a, and mRNA levels significantly decreased from1-2 cell stage to gastrula. In contrast, Robalino [57] detected a constantlevel of eif41a in oocyte and early embryo. eif41a is involved in recruitingcytoplasmic mRNA and initiation translation [58], and higher levels ofeif41a generally correlate with increased protein synthesis and cellgrowth [59]. To indicate MZT, the TATA box binding protein (tbp) wasselected. During early cleavage maternal stores of tbp are translated andby MBT the protein contribute to transcription initiation in Xenopus [60]and zebrafish [61]. tbp is also involved in degradation of maternal mRNAs[62], another main feature of MZT. In accordance with this, we detected agradual decrease in tbp mRNA levels from oocyte until blastula. Atgastrulation zygotic gene expression is presumably active, and one earlyzygotic gene in zebrafish is no tail (t), which is expressed in nuclei of thegerm ring of the late blastula and early gastrula [63,64]. Likewise we didnot detect expression of this gene until gastrula, where it was highlyexpressed.
Additional file 3: Distribution of nuclear genes with and withouttranscript number threshold. The bar to the left represents theproportion of nuclear genes that were expressed exclusively in maternalstages, gastrula or in all four stages, when analyzing the dataset with atranscript number threshold (n > 8). The bar to the right represents thedataset when no threshold is applied. Total number of genes in thedatasets (100%) is indicated on top of each bar.
Additional file 4: Functional profile of transcripts that showed adifference in abundance between maternal and zygotic stages.Three levels of function (parent ontologies) are shown: cellularcomponent, molecular function and biological process. The number ontop of each bar represents the total number of transcripts in that stage,which could be coupled to the parent ontology (percentages aretherefore calculated from these numbers as 100%). Each transcript mayhave multiple gene ontology annotations. Regarding cellular component115 (oocyte), 122 (1-2 cell), 160 (blastula) and 80 (gastrula) transcripts didnot have an annotation. The respective numbers for molecular functionwere 219, 250, 344 and 179, and for biological process they were 211,251, 350 and 133. Macromol. comp. = macromolecular complex. Str. mol.act. = structural molecule activity. Cell. comp. org. = cellular componentorganization or biogenesis. Multicell. org. pr. = multicellular organismalprocess. Dev. pr. = developmental process.
Additional file 5: Results from repeated 3’UTR structure analyses,with less strict criteria for classification and excluding all ribosomalgenes. Results from repeated analyses on 3’UTR structure, with less strictclassification of gene groups and excluding all ribosomal genes. Inaddition to genes with above 95% of transcripts present in oocyte untilblastula stage (original analysis), genes with above 70% of transcriptspresent in oocyte and 1-2 cell were also included as degrading. Likewise,in addition to genes with above 95% of transcripts present in blastulaand gastrula stage (original analysis), genes with above 70% of transcriptspresent in gastrula alone were also included as activating. Blastula stagemay contain both maternal and zygotic transcripts; therefore includingthis stage in the less strict criteria for classification resulted in a numberof genes that fell into more than 1 category. Therefore the less strictclassification included transcripts of high proportion in oocyte and 1-2cell or gastrula. For genes regarded as stable, the required proportion oftranscripts in each of the four developmental stages (oocyte, 1-2 cell,blastula and gastrula) was extended from 25 ± 15% to 25 ± 20%. a)Overview of number of genes with 3’UTR isoforms (y-axis) within thewhole dataset, and within genes with degrading, stable and activatingtranscripts (x-axis). The bar to the left within each category represents thetotal number of genes for that category, and the bar to the rightrepresents the corresponding number of genes with 3’UTR isoforms.Percentages of genes with 3’UTR isoforms within each group areindicated by the number on top of the bars. b) 3’UTR-lengths ofdegrading, stable and activating transcripts. Different letters representsignificant difference in 3’UTR length. All data are shown as mean withSEM. N = 69, 57 and 29 for degrading, stable and activating transcripts,respectively. c) Proportion (%) of degrading, stable and activatingtranscripts that contain different polyadenylation motifs (AATAAA,ATTAAA, AGTAAA, TATAAA, CATAAA, GATAAA, AATATA, AATACA,AATAGA, ACTAAA, AAGAAA and AATGAA). d) Proportion (%) ofdegrading, stable and activating transcripts that contain more than oneof the motifs shown in c). N = 69, 57 and 29 for degrading, stable andactivating transcripts, respectively.
Additional file 6: Contigs based on clustered sequences. This filecontains clustered sequences from all libraries, with given contig name.The contig name can be linked to annotation and accession number in[Additional file 7].
Additional file 7: Contig annotations. This file shows the mapping ofEST-contigs to the Atlantic cod genome. Contig annotations for the 257genes analysed in this study are shown.
Additional file 8: Gene Ontology annotation based on SwissProtBLAST hits. This file contains Gene Ontology (GO) annotation based onSwissProt BLAST hits. 1) SwissProt gene symbol hit, 2) Ensembl gene, 3)Ensembl annotation, 4) SwissProt hit gene names, 5) SwissProt hit e-value, 6) SwissProt hit score, 7) Total SwissProt hits in the wholepredicted gene set, 8) GO UniProtKB, 9) GO gene symbol, 10) GOnumber, 11) GO reference, 12) GO gene name, 13) GO alternative genesymbols, 14) Counter.
Additional file 9: Gene Ontology annotation based on UniRef90BLAST hits. This file contains Gene Ontology annotation based onUniRef90 BLAST hits. 1) UniRef hit, 2) Ensembl gene, 3) Ensemblannotation, 4) UniRef90 hit, 5) UniRef90 hit e-value, 6) UniRef90 hit score,7) Total UniRef90 hits in the whole predicted gene set, 8) GO UniRef, 9)GO gene name, 10) GO number, 11), GO gene description, 12) Counter.
Competing interestsThe authors declare that they have no competing interests.
Authors’ contributionsLK performed RNA isolation, qPCR analysis, in silico analysis of sequences thatwere mapped to the cod genome and drafted the manuscript. AW and GLTdesigned the study. AW and RBE sampled eggs/embryos and participated inthe in silico analysis and manuscript preparation. AW designed the cDNAlibraries for cod egg and developmental stages and HK and RR performedlibrary sequencing. KM and TF carried out bioinformatical processing ofsequence raw data. �D provided guidance and participated in data analyses.All authors read and approved the final manuscript.
Kleppe et al. BMC Genomics 2012, 13:443 Page 13 of 14http://www.biomedcentral.com/1471-2164/13/443
AcknowledgementsThis work was funded by the EU-project LIFECYCLE [56]. We would like tothank Heidi Kongshaug for constructing cDNA libraries for cod egg and earlydevelopmental stages, the Norwegian Microarray Consortium for providingguidance with analyses and publication of microarray data, Dr. SteinMortensen for drawing Figure 1, Dr. Craig Morton for correcting writtenenglish language and Prof. Jon Vidar Helvik and Dr. Eva Andersson forproviding help and guidance throughout the process.
Author details1Institute of Marine Research, P. O. Box 1870, Nordnesgaten 50, 5817 Bergen,Norway. 2Max Planck Institute for Molecular Genetics, Ihnestrasse 63-73,D-14195 Berlin-Dahlem, Germany. 3Max-Planck Genome centre, MPI fuerPflanzenzüchtungsforschung, Carl-von-Linné-Weg 10, D-80829 Koeln,Germany.
Received: 19 March 2012 Accepted: 29 August 2012Published: 1 September 2012
References1. Kjørsvik E, Mangor Jensen A, Holmefjord I: Egg quality in fishes. Adv Mar
Biol 1990, 26:71–113.2. Brooks S, Tyler CR, Sumpter JP: Egg quality in fish: what makes a good
egg? Rev Fish Biol Fisher 1997, 7(4):387–416.3. Kjesbu OS, Solemdal P, Bratland P, Fonn M: Variation in annual egg
production in individual captive Atlantic cod (Gadus morhua). Can J FishAquat Sci 1996, 53(3):610–620.
4. Bobe J, Labbé C: Egg and sperm quality in fish. Gen Comp Endocrinol 2010,165(3):535–548.
5. Evsikov AV, Marín de Evsikova C: Evolutionary origin and phylogeneticanalysis of the novel oocyte-specific eucaryotic translation initiationfactor 4E in Tetrapoda. Dev Genes Evol 2009, 219(2):111–118.
6. Aanes H, Winata CL, Lin CH, Chen JP, Srinivasan KG, Lee SG, Lim AY, Hajan HS,Collas P, Bourque G, Gong Z, Korzh V, Aleström P, Mathavan S: ZebrafishmRNA sequencing deciphers novelties in transcriptome dynamics duringmaternal to zygotic transition. Genome Res 2011, 21(8):1328–1338.
7. Voeltz GK, Steitz JA: AUUUA sequences direct mRNA deadenylationuncoupled from decay during Xenopus early development. Mol Cell Biol1998, 18(12):7537–7545.
8. Paillard L, Omilli F, Legagneux V, Bassez T, Maniey D, Osborne HB: EDENand EDEN-BP, a cis element and an associated factor that mediatesequence-specific mRNA deadenylation in Xenopus embryos. EMBO J1998, 17(1):278–287.
9. Tadros W, Lipshitz HD: The maternal-to-zygotic transition: a play in twoacts. Development 2009, 136:3033–3042.
10. Newport J, Kirschner M: A major developmental transition in earlyXenopus embryos 1: characterization and timing of cellular changes atthe midblastula stage. Cell 1982, 30(3):675–686.
11. Newport J, Kirschner M: A major developmental transition in earlyXenopus embryos: 2: control of the onset of transcription. Cell 1982,30(3):687–696.
12. Kane DA, Kimmel CB: The zebrafish midblastula transition. Development1993, 119(2):447–456.
13. Kimmel CB, Ballard WW, Kimmel SR, Ullmann B, Schilling TF: Stages ofembryonic development of the zebrafish. Dev Dyn 1995, 203(3):253–310.
14. Kraeussling M, Wagner TU, Schartl M: Highly asynchronous andasymmetric cleavage divisions accompany early transcriptional activityin pre-blastula Medaka embryos. PLoS One 2011, 6(7):e21741.
15. Bachvarova R, De Leon V: Polyadenylated RNA of mouse ova and loss ofmaternal RNA in early development. Dev Biol 1980, 74(1):1–8.
16. Piko L, Clegg KB: Quantitative changes in total RNA, total poly (A), andribosomes in early mouse embryos. Dev Biol 1982, 89(2):362–378.
17. Mathavan S, Lee SG, Mak A, Miller LD, Murthy KR, Govindarajan KR, Tong Y,Wu YL, Lam SH, Yang H, Ruan Y, Korzh V, Gong Z, Liu ET, Lufkin T:Transcriptome analysis of zebrafish embryogenesis using microarrays.PLoS Genet 2005, 1(2):260–276.
18. Giraldez AJ, Mishima Y, Rihel J, Grocock RJ, Van Dongen S, Inoue K, EnrightAJ, Schier AF: Zebrafish MiR-430 promotes deadenylation and clearanceof maternal mRNAs. Science 2006, 312(5770):75–79.
19. Drivenes O, Edvardsen RB, Taranger GL: Gene expression profiling ofAtlantic cod (Gadus morhua) embryogenesis using microarray. MarineBiotechnol 2011, doi:10.1007/s10126-011-9399-y.
20. Olsvik PA, Holen E: Characterization of an Atlantic cod (Gadus morhua)embryonic stem cell cDNA library. BMC Research Notes 2009, 2(74).doi:10.1186/1756-0500-2-74.
21. Evsikov AV, Graber JH, Brockman JM, Hampl A, Holbrook AE, Singh P, EppigJJ, Solter D, Knowles BB: Cracking the egg: molecular dynamics andevolutionary aspects of the transition from the fully grown oocyte toembryo. Genes Dev 2006, 20:2713–2727.
22. Bai J, Solberg C, Fernandes JMO, Johnston IA: Profiling of maternal anddevelopmental-stage specific mRNA transcripts in Atlantic halibutHippoglossus hippoglossus. Gene 2007, 386(1–2):202–210.
23. Devonshire AS, Elaswarapu R, Foy CA: Evaluation of external controls forthe standardization of gene expression biomarker measurements. BMCGenomics 2010, 11:662.
24. Star B, Nederbragt AJ, HJentoft S, Grimholt U, Malmstrøm M, Gregers TF,Rounge TB, Paulsen J, Solbakken MH, Sharma A, Wetten OF, Lanzén A,Winer R, Knight J, Vogel JH, Aken B, Andersen O, Lagesen K, Tooming-Klunderud A, Edvardsen RB, Tina KG, Espelund M, Nepal C, Previti C, KarlsenBO, Moum T, Skage M, Berg PR, Gjøen T, Kuhl H, et al: The genomesequence of Atlantic cod reveals a unique immune system. Nature 2011,477(7363):207–210.
25. Mittelholzer C, Andersson E, Consten D, Hirai T, Nagahama Y, Norberg B:20β-hydroxysteroid dehydrogenase and CYP19A1 are differentiallyexpressed during maturation in Atlantic cod (Gadus morhua). J MolEndochrinol 2007, 39:319–328.
26. Olsvik PA, Søfteland L, Lie KK: Selection of reference genes for qRT-PCRexamination of wild populations of Atlantic cod Gadus morhua. BMCResearch Notes 2008, 1:47.
27. Donnison M, Pfeffer PL: Isolation of genes associated withdevelopmentally competent bovine oocytes and quantitation of theirlevels during development. Biol Reprod 2004, 71:1813–1821.
28. Tingaud-Sequeira A, Chauvigné F, Lozano J, Aqulleiro MJ, Asensio E, Cerdà J:New insights into molecular pathways associated with flatfish ovariandevelopment and atresia revealed by transcriptional analysis. BMCGenomics 2009, 10:434.
29. Shen-Orr SS, Pilpel Y, Hunter CP: Composition and regulation of maternaland zygotic transcriptomes reflects species-specific reproductive mode.Genome Biol 2010, 11(6):R58.
30. Nagler JJ: In vivo treatment with cycloheximide or actinomyciin Dinhibits early embryonic development in rainbow trout (Oncorhynchusmykiss). Fish Physiol Biochem 2000, 22(1):61–66.
31. Giraldez AJ, Cinalli RM, Glasner ME, Enright AJ, Thomson JM, Baskerville S,Hammond SM, Bartel DP, Schier AF: MicroRNAs regulate brainmorphogenesis in zebrafish. Science 2005, 308(5723):833–838.
32. Mommens M, Fernandes JM, Bizuayehu TT, Bolla SL, Johnston IA, Babiak I:Maternal gene expression in Atlantic halibut (Hippoglossus hippoglossusL.) and its relation to egg quality. BMC Research Notes 2010, 3:138.
33. Montero J-A, Heisenberg C-P: Gastrulation dynamics: cells move intofocus. Trends Cell Biol 2004, 14(11):620–627.
34. Revil T, Gaffney D, Dias C, Majewski J, Jerome-Majewska LA: Alternativesplicing is frequent during early embryonic development in mouse. BMCGenomics 2010, 11:399.
35. Schier AF: The maternal-zygotic transition: death and birth of RNAs.Science 2007, 316(5823):406–407.
36. Ledda M, Di Croce M, Bedini B, Wannenes F, Corvaro M, Boyl PP, Caldarola S,Loreni F, Amaldi F: Effects of 3’UTR length on the translational regulation of50-terminal oligopyrimidine mRNAs. Gene 2005, 344:213–220.
37. Tanguay RL, Gallie DR: Translational efficiency is regulated by the lengthof the 3’ untranslated region. Mol Cell Biol 1996, 16(1):146–156.
38. Chen C-Y, Chen S-T, Juan H-F, Huang H-C: Lengthening of 3’UTR increasescomplexity in animal evolution. 2010. Available from Nature Precedingshttp://hdl.handle.net/10101/npre.2010.4915.1.
39. Ji Z, Lee JY, Pan Z, Jiang B, Tian B: Progressive lengthening of 3’untranslated regions of mRNAs by alternative polyadenylation duringmouse embryonic development. PNAS 2009, 106(17):7028–7033.
40. Bailey TL, Elkan C: Fitting a mixture model by expectation maximizationto discover motifs in biopolymers. Proceedings of the Second InternationalConference on Intelligent Systems for Molecular Biology 1994, 2:28–36.

Kleppe et al. BMC Genomics 2012, 13:443 Page 14 of 14http://www.biomedcentral.com/1471-2164/13/443
41. Fox CA, Sheets MD, Wickens MP: Poly(A) addition during maturation offrog oocytes: distinct nuclear and cytoplasmic activities and regulationby the sequence UUUUUAU. Genes Dev 1989, 3:2151–2162.
42. McGrew LL, Dworkin-Rastl E, Dworkin MB, Richter JD: Poly(A) elongationduring Xenopus oocyte maturation is required for translationalrecruitment and is mediated by a short sequence element. Genes Dev1989, 3:803–815.
43. Colgan DF, Manley JL: Mechanism and regulation of mRNApolyadenylation. Genes Dev 2011, 11:2755–2766.
44. Villalba A, Coll O, Gebauer F: Cytoplasmic polyadenylation andtranslational control. Curr Opin Genet Dev 2011, 21:452–457.
45. Beaudoing E, Freier S, Wyatt JR, Claverie J-M, Gautheret D: Patterns ofvariant polyadenylation signal usage in human genes. Genome Res 2000,10(7):1001–1010.
46. Edwalds-Gilbert G, Veraldi KL, Milcarek C: Alternative poly(A) site selectionin complex transcription units: means to an end? Nucleic Acids Res 1997,25(13):2547–2561.
47. Hall TE, Smith P, Johnston IA: Stages of embryonic development in theAtlantic cod Gadus morhua. J Morphol 2004, 259:255–270.
48. Kuhl H, Sarropoulou E, Tine M, Kotoulas G, Magoulas A, Reinhardt R: Acomparative BAC map for the gilthead sea bream (Sparus aurata L.).J Biomed Biotechnol 2011, 2011:329025.
49. Ewing B, Hillier L, Wendl MC, Green P: Base-calling of automatedsequencer traces using Phred. 1. Accuracy assessment. Genome Res 1998,8(3):175–185.
50. Ewing B, Green P: Base-calling of automated sequencer traces usingPhred. 1. Error probabilities. Genome Res 1998, 8(3):186–194.
51. Malde K, Schneeberger K, Coward E, Jonassen I: RBR: library-less repeatdetection for ESTs. Bioinformatics 2006, 22(18):2232–2236.
52. Pertea G, Huang X, Liang F, Antonescu V, Sultana R, Karamycheva S, Lee Y,White J, Cheung F, Parvizi B, Tsai J, Quackenbush J: TIGR Gene Indicesclustering tools (TGICL): a software system for fast clustering of large ESTdatasets. Bioinformatics 2003, 19(5):651–652.
53. The cod genome webpage. www.codgenome.no.54. Ashburner M, Ball CA, Blake JA, Botstein D, Butler H, Cherry JM, Davis AP,
Dolinski K, Dwight SS, Eppig JT, Harris MA, Hill DP, Issel-Tarver L,Kasarskis A, Lewis S, Matese JC, Richardson JE, Ringwald M, Rubin GM,Sherlock G: Gene Ontology: tool for the unification of biology. NatGenet 2000, 25(1):25–29.
55. Gene ontology annotation files. http://www.geneontology.org/.56. The LIFECYCLE project web page. http://www.lifecycle-fp7.eu/.57. Robaliano J, Joshi B, Fahrenkrug SC, Jagus R: Two zebrafish eIF4E family
members are differentially expressed and functionally divergent. J BiolChem 2004, 279(11):10532–10541.
58. Von der Haar T, Gross JD, Wagner G, McCarthy JEG: The mRNA cap-bindingprotein eIF4E in post-transcriptional gene expression. Nat Struct Mol Biol2004, 11(6):503–511.
59. Raught B, Gingras A-C, Gygi SP, Imataka H, Morino S, Gradi A, AebersoldR, Sonenberg N: Serum-stimulated, rapamycin-sensitivephosphorylation sites in the eukaryotic translation initiation factor4GI. EMBO J 2000, 19(3):434–444.
60. Veenstra GC, Destrée OHJ, Wolffe AP: Translation of maternal TATA-binding protein mRNA potentiates basal but not activatedtranscription in Xenopus embryos at the midblastula transition. Mol CellBiol 1999, 19(12):7972–7982.
61. Bártfai R, Balduf C, Hilton T, Rathmann Y, Hadzhiev Y, Tora L, Orbán L, MüllerF: TBP2, a vertebrate-specific member of the TBP family, is required inembryonic development of zebrafish. Curr Biol 2004, 14(7):593–598.
62. Ferg M, Sanges R, Gehrig J, Kiss J, Bauer M, Lovas A, Szabo M, Yang L,Straehle U, Pankratz MJ, Olasz F, Stupka E, Müller F: The TATA-bindingprotein regulates maternal mRNA degradation and differential zygotictranscription in zebrafish. EMBO J 2007, 26(17):3945–3956.
63. Schulte-Merker S, Ho RK, Herrmann BG, Nüsslein-Volhard C: The proteinproduct of the zebrafish homologue of the mouse T gene is expressedin nuclei of the germ ring and the notochord of the early embryo.Development 1992, 116:1021–1032.
64. Schulte-Merker S, van Eeden FJ, Halpern ME, Kimmel CB, Nüsslein-Volhard C:no tail (ntl) is the zebrafish homologue of the mouse T (Brachyury) gene.Development 1994, 120(4):1009–1015.
doi:10.1186/1471-2164-13-443Cite this article as: Kleppe et al.: Maternal 3’UTRs: from egg to onset ofzygotic transcription in Atlantic cod. BMC Genomics 2012 13:443.
Submit your next manuscript to BioMed Centraland take full advantage of:
• Convenient online submission
• Thorough peer review
• No space constraints or color figure charges
• Immediate publication on acceptance
• Inclusion in PubMed, CAS, Scopus and Google Scholar
• Research which is freely available for redistribution
Submit your manuscript at www.biomedcentral.com/submit