Material Properties For Process Simulation Z. Guo*, N ...
23
Material Properties For Process Simulation Z. Guo * , N. Saunders, J.P. Schillé, A.P. Miodownik Sente Software Ltd., Surrey Technology Centre, Guildford GU2 7YG, U.K. Abstract This paper reviews the recent developments in material property modelling and its applications in processing simulation. Many material properties needed by process simulation can now be readily provided, such as the solidification properties and high temperature stress-strain curves. The solidification properties are affected by changes in composition within the specification range of an alloy; such changes in properties then affect casting simulation results. The mechanical properties are calculated by considering two competing deformation mechanisms (dominated by either dislocation glide or dislocation climb), with automatic selection of the dominant mechanism. Sample calculations are given for a variety of engineering alloys, including steels, aluminum, titanium, and nickel-based superalloys. The material properties data calculated can now be passed directly into commercial computer-aided engineering (CAE) packages for casting and deformation simulation. Keywords: Material properties; Process simulation; High temperature strength; Stress- strain curves; JMatPro * Corresponding author: Tel: +44-(0)-1483-685475; fax: +44-(0)-1483-685472. E-mail address: [email protected] Preprint of article published in Mat.Sci.Eng.A, 499, (2009), p.7 https://doi.org/10.1016/j.msea.2007.09.097
-
Upload
khangminh22 -
Category
Documents
-
view
4 -
download
0
Transcript of Material Properties For Process Simulation Z. Guo*, N ...

Material Properties For Process Simulation
Z. Guo*, N. Saunders, J.P. Schillé, A.P. Miodownik
Sente Software Ltd., Surrey Technology Centre, Guildford GU2 7YG, U.K.
Abstract
This paper reviews the recent developments in material property modelling and its
applications in processing simulation. Many material properties needed by process
simulation can now be readily provided, such as the solidification properties and high
temperature stress-strain curves. The solidification properties are affected by changes in
composition within the specification range of an alloy; such changes in properties then
affect casting simulation results. The mechanical properties are calculated by considering
two competing deformation mechanisms (dominated by either dislocation glide or
dislocation climb), with automatic selection of the dominant mechanism. Sample
calculations are given for a variety of engineering alloys, including steels, aluminum,
titanium, and nickel-based superalloys. The material properties data calculated can now
be passed directly into commercial computer-aided engineering (CAE) packages for
casting and deformation simulation.
Keywords: Material properties; Process simulation; High temperature strength; Stress-
strain curves; JMatPro
* Corresponding author: Tel: +44-(0)-1483-685475; fax: +44-(0)-1483-685472.
E-mail address: [email protected]
Preprint of article published in Mat.Sci.Eng.A, 499, (2009), p.7 https://doi.org/10.1016/j.msea.2007.09.097

Introduction
Material data is a vital input for CAE process simulation packages based on finite-
element or finite-difference (FE/FD) analysis. Such data include physical, thermo-
physical and mechanical properties, all as a function of temperature. Traditionally such
data are gathered from experimentation, which has significant disadvantages in that not
all of the required data are readily available and, in particular, measurement of high
temperature properties is not only expensive but time-consuming. It is therefore of no
surprise that lack of material data has been a common problem for all FE/FD simulation
packages. To overcome this problem and provide reliable and cost effective data for
process simulation, computer-based models are required so that such properties can be
readily calculated. A schematic diagram of the approach for processing modelling is
shown in Fig. 1.
The present paper demonstrates the capabilities of computer software JMatPro [1] that
is able to calculate the material data required in process simulation, which otherwise has
to be measured through experiments such as dilatometry and Gleeble® testing. While
detailed information on the development and validation of relevant models can be referred
to Refs. [2,3,4,5,6,7], this paper is focused on the application aspects of the material data
calculated, concentrating on two areas. One is the calculation of physical and thermo-
physical properties critical to casting simulation. The other is the calculation of high
temperature strength and stress-strain curves which are critical to deformation simulation.
Physical and Thermo-Physical Properties
Physical and thermo-physical properties are critical parameters for casting simulation.
JMatPro's ability to model these properties has been well documented in previous

published work for various metallic systems [3,4,5]. The properties that can be modelled
include: density, molar volume, thermal expansion coefficient, Young’s, bulk and shear
modulii, Poisson’s ratio, thermal conductivity and diffusivity, electrical conductivity and
resistivity, all are provided for each available phase when necessary.
This section examines how changes in composition within the specification range of
an alloy may affect its properties during solidification, and how casting simulation results
are consequently influenced [7]. An aluminium alloy A319 is taken as an example here.
The compositions of various A319 alloys are given in Table 1. Variations in elements Si,
Cu and Zn were considered and the freezing range calculated for the three alloys are also
given in Table 1.
Fig. 2 shows fraction solid vs. temperature plots calculated for the three A319 alloys.
As might be expected, with increasing Cu and Si the freezing range decreases. Higher
levels of Si also increases the amount of silicon eutectic and reduces the range of primary
aluminum phase. The change in density during solidification for the three alloys shown
in Fig. 3 demonstrates that total density change can be strongly affected by the fraction
solid behaviour within specification.
The material property data calculated has been used as direct input to casting
simulation software MAGMASOFT® and PROCAST®. How changes in material
properties due to variation in composition may affect the results of casting simulation is
demonstrated here using MAGMASOFT®. The component is a cylinder head typically
made of A319 alloy via gravity casting [8]. Fig. 4 shows the calculated local solidification
time for various A319 alloys. Local solidification time is one of the most used criteria
that can show potential regions for defects, which are often isolated maximum heights in
the casting. There are no isolated maxima shown in Fig. 4. However, it can be seen that

solidification behaviour has been significantly altered through changing the composition,
which has a subsequent significant impact on the feeding behaviour in critical regions of
the cast. The calculated feeding percentage for various A319 alloys is shown in Fig. 5,
which allows the user to determine the quality of feeding of the casting, which in turn
will allow the user to see potential areas where porosity may occur. It can be seen that
for the alloy A319 at high specification the feeding result shows no problems in the
displayed region, while the average and low compositions indicate potential problems
with porosity. This can be explained by the fact that for the best case, the local
solidification time in the critical area is increased, leading to better liquid flow and hence
a lower susceptibility to defects from poor feeding.
High Temperature Strength and Stress-Strain Curves
In addition to thermo-physical properties, thermo-mechanical processing simulation
requires important mechanical properties such as high temperature strength and stress-
strain curves (or flow stress curves). CAE simulation packages normally provide a range
of constitutive equations that describe stress as a function of temperature, strain and strain
rate, and the choice of the equations used can significantly affect the simulation results.
Not only does the user have to decide which equations to use, but also he has to determine
the values of the material parameters in those equations.
Examination of alternative constitutive equations shows that some of them are based
on empirical observations of phenomena measured at macro level, i.e. the shape and form
of the stress/strain curve, while others are motivated by micro-mechanical considerations
[9], i.e., the development of those equations used to describe materials’ behaviour is not
based on the underlying mechanisms of material deformation.
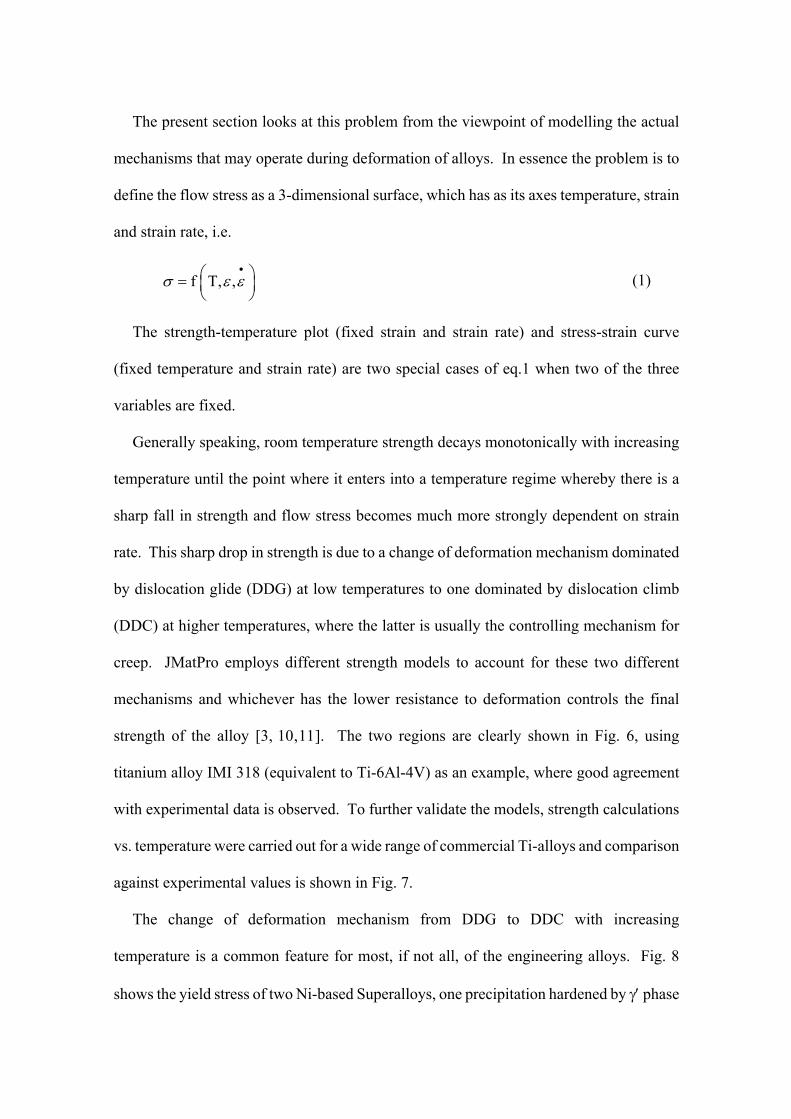
The present section looks at this problem from the viewpoint of modelling the actual
mechanisms that may operate during deformation of alloys. In essence the problem is to
define the flow stress as a 3-dimensional surface, which has as its axes temperature, strain
and strain rate, i.e.
(1)
The strength-temperature plot (fixed strain and strain rate) and stress-strain curve
(fixed temperature and strain rate) are two special cases of eq.1 when two of the three
variables are fixed.
Generally speaking, room temperature strength decays monotonically with increasing
temperature until the point where it enters into a temperature regime whereby there is a
sharp fall in strength and flow stress becomes much more strongly dependent on strain
rate. This sharp drop in strength is due to a change of deformation mechanism dominated
by dislocation glide (DDG) at low temperatures to one dominated by dislocation climb
(DDC) at higher temperatures, where the latter is usually the controlling mechanism for
creep. JMatPro employs different strength models to account for these two different
mechanisms and whichever has the lower resistance to deformation controls the final
strength of the alloy [3, 10,11]. The two regions are clearly shown in Fig. 6, using
titanium alloy IMI 318 (equivalent to Ti-6Al-4V) as an example, where good agreement
with experimental data is observed. To further validate the models, strength calculations
vs. temperature were carried out for a wide range of commercial Ti-alloys and comparison
against experimental values is shown in Fig. 7.
The change of deformation mechanism from DDG to DDC with increasing
temperature is a common feature for most, if not all, of the engineering alloys. Fig. 8
shows the yield stress of two Ni-based Superalloys, one precipitation hardened by g¢ phase
f T, ,s e e•æ ö= ç ÷
è ø
(Nimonic 105) and the other a solid solution alloy (Nimonic 75). The transition where
sudden softening occurs is correctly predicted, as the loss of strength of Nimonic 105 as
the g¢ phase dissolves. To emphasise the predictive capability of the model, the calculated
yield stress of twenty-two commercial superalloys as a function of temperature between
room temperature (RT) and 1000ºC is shown in Fig.9.
Fig. 10 shows a similar plot for various stainless steels, including austenitic, ferritic
and duplex types. Yield stress as a function of strain rate has also been calculated for a
316 stainless steel at strain rates of 0.0001, 0.01 and 1s-1 and is shown in Fig.11. The
switch of deformation from DDG to DDC is clearly observed and is substantially
displaced as a function of strain rate. However, even at a strain-rate of 1 s-1, creep is still
the dominant mechanism above 1000ºC. Of particular interest is that the strain rate
dependency in the creep controlled regime is substantially greater than in the DDG
regime. For example at 1100ºC, the yield stress increases by almost a factor 4 between
0.0001 and 1s-1, in comparison yield stress in the DDG region is rather insensitive to strain
rate.
The switch of deformation mechanism from DDG to DDC with increasing temperature
that is seen in the yield stress (or s0.2) vs. temperature plots corresponds to the flow stress
at a small fixed strain. However, we are also interested in flow at much greater strains
and it is interesting to observe what may happen as strains are greatly increased, for
example in a stress/strain curve. In this case we see that it is possible for deformation to
start in the DDG region, with significant work hardening. However, at a critical strain
(et) the strength may reach a level where creep controlled flow is weaker, and deformation
will continue by creep. This is shown schematically in Fig. 12.
The procedures for the calculation of stress-strain curves in the DDC and DDG regions
have been described in previous work Ref. [12] and Ref. [13], respectively and Fig.13
shows a comparison plot of calculated and experimental stress-strain curves for a medium
carbon steel (strain rate 0.1 s-1) at elevated temperatures. The calculated stress-strain
curves, which include a transition between deformation mechanisms agree rather well
with experiment. It is noted that flow softening is often suggested to be due to the
recovery and/or recrystallisation processes. However, as is clearly shown here, flow
softening can be a natural result of the transition from DDG to DDC deformation
mechanism.
Depending on the alloy type, temperature and strain rate regime, et can be quite
different. For a given alloy, higher temperatures and slower strain rates may result in a
smaller et, while the DDG mechanism continues to dominate as stress monotonically
increases with increasing strain, until fracture occurs. In high temperature regions, creep
controlled deformation may be lower than the DDG controlled yield stress at all strains
and flow is governed purely by creep. Fig. 14 shows the comparison of calculated and
experimental stress-strain curves for nickel-based superalloy Inconel 718 at 1050oC. In
this case the DDG yield stress lies around 200 MPa and only the 1 s-1 stress strain curve
exhibits a transition between deformation mechanisms.
The flow stress curves of a titanium grade Ti-6Al-4V (ELI) are shown in Figs. 15 and
16, corresponding to various strain rates at 950°C and various temperatures at strain rate
0.1 s-1, respectively. In all cases there is no DDG region, in good agreement with
experimental observations. The predictive capability of the model in flow stress
calculation for a wide range of Ti-alloys, which have been tested at various temperatures

and strain rates, is demonstrated in Fig. 17. Similar accuracies between experiment and
calculation have also been obtained for Ni-based superalloys [12] and stainless steels [14].
The proven accuracy of JMatPro in calculating high temperature strength and stress-
strain curves demonstrates its ability in generating the flow stress data required for
deformation simulation. The problem of choosing the right constitutive equation and
assigning correct values to the material parameters involved has therefore been effectively
removed. In addition, to make the calculated material data more easily used by process
modellers, extra sub-routines have been written so that the data can now be organised in
such a format that can be directly read by FE/FD simulation packages. Such linking has
been successfully developed with casting, forging and heat treatment simulation packages
and will subsequently be extended to welding simulation packages.
Summary
The paper has shown how the recent developments in materials properties modelling has
been able to calculate a variety of material properties and behaviour for multi-component
alloys. In particular, the paper has concentrated on solidification properties for casting
simulation, and high temperature strength and stress-strain curves for deformation
simulation. Links with many FE-based process simulation packages have been established
successfully and the calculated material data can now be organised in such a format that can
be directly read by such packages.
References
[1] http://www.sentesoftware.co.uk/biblio.html, A collection of free downloadable
papers on the development and application of JMatPro, compiled by Sente Software Ltd.,
2007. (Most of the papers below authored by Saunders and Guo can be downloaded from
this website.)
[2] N. Saunders, X. Li, A.P. Miodownik and J.P. Schille, in: Materials Design
Approaches and Experiences, Eds. J.C. Zhao et al., TMS, Warrendale, PA, p. 185 (2001)
[3] N. Saunders, Z. Guo, X. Li, A.P. Miodownik and J.P. Schille: JOM Vol. 55, No.12,
60-65 (2003)
[4] N. Saunders, X. Li, A.P. Miodownik and J.P. Schille, in: Modelling of Casting,
Welding and Advanced Solidification Processes X, Eds D. Stefanescu et al., TMS,
Warrendale, PA, p. 669 (2003)
[5] Z. Guo, N. Saunders, A.P. Miodownik and J.P. Schillé: Mater. Sci. Eng. A413-414,
465-469 (2005)
[6] N. Saunders, Z. Guo, X. Li, A.P. Miodownik and J.P. Schille, in: Superalloys 2004,
Eds K.A. Green et al., TMS, Warrendale, PA, p. 849 (2004)
[7] Z. Guo, N. Saunders, E. Hepp and J.P. Schillé, Modelling of material properties - A
viable solution to the lack of material data in casting simulation, in: The 5th Decennial
International Conference on Solidification Processing, Sheffield, July 23-25, 2007
[8] E. Hepp, Private communication, MagmaSoft, 2007
[9] A. Söderberg and U. Sellgren, Modelling of Strain Hardening and Strain Rate
Hardening of Dual Phase Steels in Finite Element Analysis of Energy-Absorbing
Components, in: NAFEMS World Congress 2005, 17-20 May 2005, Malta
[10] Z. Guo, N. Saunders, A.P. Miodownik and J.P. Schillé, Materials Science Forum,
Vols. 546-549, 1319-1326 (2007)

[11] Z. Guo, N. Saunders, A.P. Miodownik and J.P. Schillé, Rare Metal Materials and
Engineering, Vol. 35 Sup. 1, 108-111 (2006)
[12] N. Saunders, Z. Guo, A.P. Miodownik and J.P. Schillé, Modelling Material
Properties and Behaviour of Ni and Ni-Fe Based Superalloys, in: Proceedings of 2005
Superalloys 718, 625, 706 and Derivatives, Eds. J. Groh, E. Loria, 2-5 October 2005,
Pittsburgh, U.S.A.
[13] X. Li, A. P. Miodownik and N. Saunders, J. Phase Equilibria, Vol. 22, p. 247 (2001)
[14] Unpublished research, Sente Software Ltd., Guildford GU2 7YG, U.K., 2007
Captions of Tables and Figures
Table 1: Composition and freezing range of three A319 alloys (wt.%)
Fig. 1. JMatPro calculation provides an alternative to experimental measurement in
providing the material data required for process simulation
Fig. 2. Calculated fraction solid vs. temperature for the three A319 alloys
Fig. 3. Calculated density vs. temperature for the three A319 alloys
Fig. 4. Calculated local solidification time for various A319 alloys
Fig. 5. Calculated feeding/porosity for various A319 alloys
Fig. 6. Comparison between experimental and calculated yield stress for titanium alloy IMI
318 (Ti-6Al-4V).
Fig. 7. Comparison between experimental and calculated yield stress for various Ti-alloys
between RT and 700C.
Fig. 8. Comparison between experimental and calculated yield stress for Nimonic 75 and 105
as a function of temperature.
Fig. 9. Comparison between experimental and calculated yield stresst for various wrought
nickel superalloys and pure Ni between RT and 1000ºC.
Fig. 10. Comparison between experimental and calculated yield stress for various stainless
steels between RT and 900ºC.
Fig. 11. Calculated yield stresses for a 316 stainless steel as a function of temperature at
various strain rates.

Fig. 12. Change of deformation mechanism from DDG to DDC in a high temperature stress-
strain curve at the critical transition strain (et)
Fig. 13. Comparison of calculated and experimental stress-strain curves at 0.1 /s for a carbon
steel at various temperatures
Fig. 14. Comparison of calculated and experimental stress-strain curves for a nickel-based
superalloy Inconel 718 at 1050oC
Fig. 15 . Comparison between experimental and calculated flow stress curves for Ti-6Al-4V
(ELI) at 950ºC with various strain rates.
Fig. 16. Comparison between experimental and calculated flow stress curves for Ti-6Al-4V
(ELI) at various temperatures with strain rate 0.1/s.
Fig. 17. Comparison between experimental and calculated flow stress for various titanium
alloys at various temperatures and strain rates.

Table 1: Composition and freezing range of three A319 alloys (wt.%)
A319 Si Cu Mg Mn Zn Fe Al Freezing
range (°C) Remarks
Low spec 5 3 0.3 0.5 0.1 0.6 bal. 508-617 Lower limit specification
Average 6 4 0.3 0.5 0.3 0.6 bal. 505-607 Average composition
High spec 7 5 0.3 0.5 0.5 0.6 bal. 500-596 Upper limit specification

Geometry (mesh)
Material data
Results FE/FD solution
Processing
to be replaced by
Experimental JMatPro Calculation
Fig. 1. JMatPro calculation provides an alternative to experimental measurement in providing the material data required for process simulation

Fig. 2. Calculated fraction solid vs. temperature for the three A319 alloys
0
0.2
0.4
0.6
0.8
1
450 500 550 600 650Temperature (oC)
Frac
tion
solid
High specAverageLow spec
Fig. 3. Calculated density vs. temperature for the three A319 alloys
2.45
2.5
2.55
2.6
2.65
2.7
2.75
450 500 550 600 650Temperature (oC)
Den
sity
(g/m
m3)
High specAverageLow spec
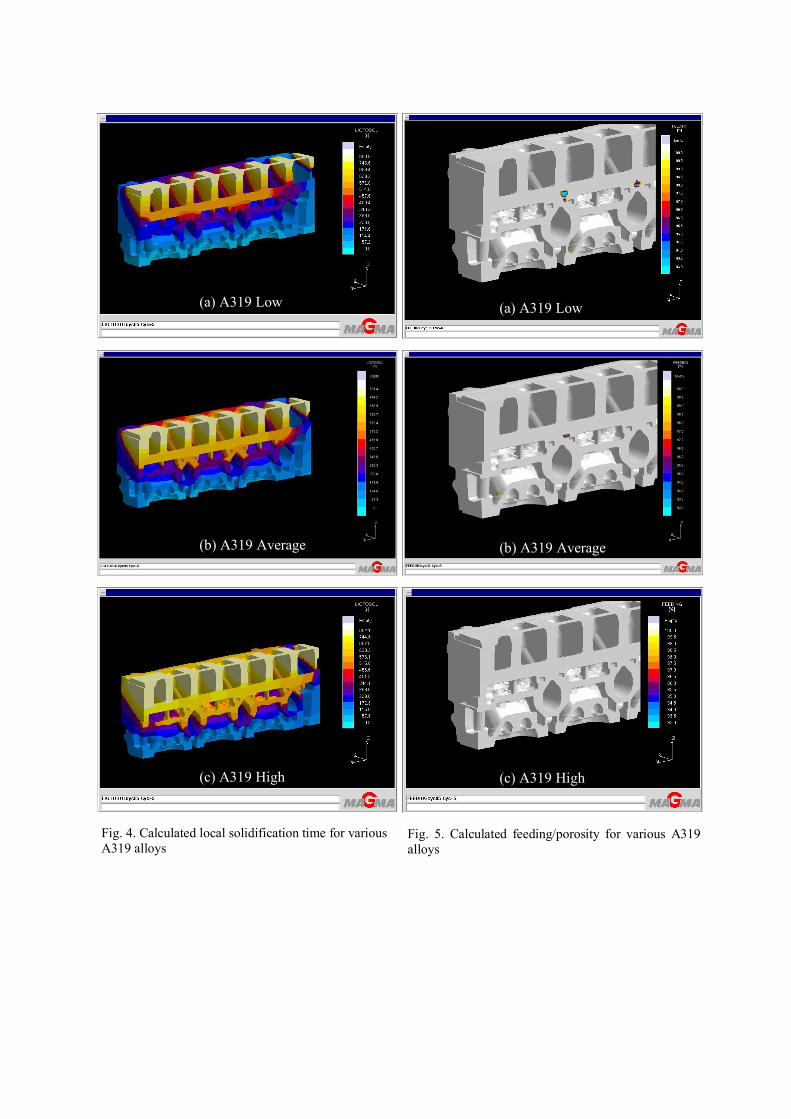
Fig. 5. Calculated feeding/porosity for various A319 alloys
(b) A319 Average
(a) A319 Low
(c) A319 High
Fig. 4. Calculated local solidification time for various A319 alloys
(b) A319 Average
(a) A319 Low
(c) A319 High

0
200
400
600
800
1000
1200
1400
0 200 400 600 800 1000 1200 1400Experimental (MPa)
Cal
cula
ted
(MPa
)
AT3-296AT3-297AT6-298AT4-268AT8-300AT8-301Ti-38644SP700IMI 318Ti62S35A 50A 65A75ATi 550Ti551Ti829Ti834Ti6246
Fig. 7. Comparison between experimental and calculated yield stress for various Ti-alloys between RT and 700C.
Fig. 6. Comparison between experimental and calculated yield stress for titanium alloy IMI 318 (Ti-6Al-4V).
0
200
400
600
800
1000
1200
0 200 400 600 800Temperature (oC)
Yie
ld st
ress
(MPa
)
IMI 318 - Exp.JMatPro Cal.DDG mechanismDDC mechanism

Fig. 9. Comparison between experimental and calculated yield stresst for various wrought nickel superalloys and pure Ni between RT and 1000ºC.
0100200300400500600700800900
100011001200
0 200 400 600 800 1000 1200
Experimental Yield Stress (MPa)
Cal
c. Y
ield
Stre
ss (M
Pa)
Pure NickelNimonic 75Nimonic 80ANimonic 90Nimonic 105Nimonic 115Nimonic 263Nimonic 901Nimonic PE11Nimonic PE16Nimonic PK33Nimonic PK33Hastelloy XInconel 625Inconel 718Inconel X750Udimet R41Udimet 520Udimet 700Udimet 720Udimet D979Waspaloy
0
100
200
300
400
500
600
700
800
900
0 200 400 600 800 1000 1200 1400Temperature (oC)
Yie
ld st
ress
(MPa
)
Calc.Exp.
Nimonic 75
Nimonic 105
Fig. 8. Comparison between experimental and calculated yield stress for Nimonic 75 and 105 as a function of temperature.

Fig. 10. Comparison between experimental and calculated yield stress for various stainless steels between RT and 900ºC.
0
100
200
300
400
500
600
0 100 200 300 400 500 600
Experimental Yield Stress (MPa)
Cal
cula
ted
Yie
ld S
tress
(MPa
)302
304
304L
316
316L
321
347
400
409
439
12SR
18CrNb
18SR
DS 2205
DS 2507
DS 2304
Zeron 100
0
50
100
150
200
250
300
0 500 1000 1500
Temperature (oC)
Yie
ld st
ress
(MPa
)
.0001 s-1
.01 s-1
1 s-1
Fig. 11. Calculated yield stresses for a 316 stainless steel as a function of temperature at various strain rates.

Fig. 12. Change of deformation mechanism from DDG to DDC in a high temperature stress-strain curve at the critical transition strain (et)
Strain
Stre
ss
DDG region DDC region
Transition strain

Fig. 13. Comparison of calculated and experimental stress-strain curves at 0.1 /s for a carbon steel at various temperatures
020406080
100120140160180200220
0 0.05 0.1 0.15 0.2 0.25 0.3 0.35 0.4True strain
True
stre
ss (M
Pa)
800 C Cal.800 C Exp.900 C Cal.900 C Exp.1000 C Cal.1000 C Exp.1100 C Cal.1100 C Exp.1200 C Cal.1200 C Exp.
0
50
100
150
200
250
300
0 0.1 0.2 0.3 0.4 0.5True strain
True
stre
ss (M
Pa)
1/s Cal. 1/s Exp.0.1/s Cal. 0.1/s Exp.0.01/s Cal. 0.01/s Exp.
Fig. 14. Comparison of calculated and experimental stress-strain curves for a nickel-based superalloy Inconel 718 at 1050oC

Fig. 15. Comparison between experimental and calculated flow stress curves for Ti-6Al-4V (ELI) at 950ºC with various strain rates.
0
20
40
60
80
100
120
140
160
180
200
220
0 0.2 0.4 0.6 0.8
S train
Str
ess
(MP
a)
calc100/s10/s1/s0.1/s0.01/s0.001/sexp100/s10/s1/s0.1/s0.01/s0.001/s
020406080
100120140160180200220240260280300
0 0.2 0.4 0.6 0.8
S train
Str
ess
(MP
a)
calc800C850C900C950C1000C1050Cexp800C850C900C950C1000C1050C
Fig. 16. Comparison between experimental and calculated flow stress curves for Ti-6Al-4V (ELI) at various temperatures with strain rate 0.1/s.

10
100
1000
10 100 1000
Experimental flow stress (MPa)
Cal
cula
ted
flow
stre
ss (M
Pa)
Ti6Al4V850C (0.01 /s) 900C (0.01/s)950C (0.01/s) 1000C (0.01/s)1050C (0.01/s) 900C (5/s)1000C (5/s) 1100C (5/s)1200C (5/s) 1300C (5/s)800-1025C (0.1/s) 800-1025C (1/s)800-1025C (3/s) 900C (0.0005/s)900C (0.005/s) 900C (0.05/s)1093C (0.1/s) 800-1050C (0.001/s)800-1050C (0.01/s) 800-1050C (0.1/s)800-1050C (1/s) 800-1050C (10/s)800-1050C (100/s)Ti-5Al-2.5Sn (ELI)1093C (0.1/s)Ti-B191000C (.01/s) 1000C (0.1/s)1000C (1/s) 1000C (10/s)Beta 21S800C (0.0005/s) 800C (0.001/s)800C (0.005/s) 800C (0.05/s)800C (0.5/s)Ti-1023800C (0.000042/s) 800C (0.00042/s)800C (0.0042/s) 800C (0.042/s)750C (0.000042/s) 750C (0.00042/s)750C (0.0042/s) 750C (0.042/s)Ti-15333843-1260C (0.1/s) 843-1260C (0.01/s)1093-1260C (0.001/s) 927C (0.001/s)927C (0.01/s) 927C (0.1/s)1093C (0.1/s)Ti6242 899C (0.001/s) 899C (0.01/s)899C (0.1/s) 899C (1/s)927C (0.001/s) 927C (0.01/s)927C (0.1/s) 927C (1/s)954C (0.001/s) 954C (0.01/s)954C (0.1/s) 954C (1/s)982C (0.001/s) 982C (0.01/s)982C (0.1/s) 982C (1/s)1010C (0.001/s) 1010C (0.01/s)1010C (0.1/s) 1010C (1/s)25-775C (.00003/s)
HT flow stress for various Ti-Alloys
Fig. 17. Comparison between experimental and calculated flow stress for various titanium alloys at various temperatures and strain rates.