Master proper.docx - CORE
80
Isoform identification and partial characterisation of Glutaminase in CD4+ T lymphocytes Sam Nicholson Master Thesis in Human Nutrition Institute of Medicine, The University of Bergen (UiB) In association with the Institute of Basic Medical Sciences, Faculty of Medicine, The University of Oslo (UiO) May 2013
-
Upload
khangminh22 -
Category
Documents
-
view
0 -
download
0
Transcript of Master proper.docx - CORE

Isoform identification and partial
characterisation of Glutaminase in
CD4+ T lymphocytes
Sam Nicholson
Master Thesis in Human Nutrition
Institute of Medicine, The University of Bergen (UiB)
In association with the Institute of Basic Medical Sciences, Faculty of Medicine,
The University of Oslo (UiO)
May 2013

ACKNOWLEDGEMENTS
The work presented here was performed at the Institute of Basic Medical Sciences, University of
Oslo in Norway from autumn 2012 to spring 2013.
First, my sincere thanks to my supervising professor Bjørn Steen Skålhegg for his guidance and
enthusiasm and for the collaborative and energetic working environment he champions.
Thanks go also to my direct supervisor Halvor Holen for his patience and support; and to Tuva
Hereng, Ken Rosendal and Sissel Eikvar who fielded all manner of bizarre questions over the
last nine months with grace and kindness. My collaborator Henning Cederkvist - who can Mass
Spec with the best of them - also deserves a special nod of appreciation.
A big thank you also to Trond Brattelid for his support – especially his assistance during my
emergency evacuation back to Oslo.
Finally, to my wife Valeri, goes my most humble of thanks for her tireless commitment to our
new baby boy, Elliott, and for her continued, unflinching love.
Sam Nicholson
Oslo, May 2013

TABLE OF CONTENTS
2
Table of Contents
LIST OF ABBREVIATIONS ...................................................................................................................................................... 4
ABSTRACT ..................................................................................................................................................................................... 6
1.0 INTRODUCTION .......................................................................................................................................................... 7
1.1 THE IMMUNE SYSTEM ....................................................................................................................................... 7
1.1.1 CELLS OF AN IMMUNE RESPONSE ........................................................................................................ 7
1.1.1.1 Leukocytes ...................................................................................................................................................... 8
1.1.1.2 Lymphocytes.................................................................................................................................................. 9
1.1.2 T CELLS .............................................................................................................................................................. 10
1.1.2.1 T cell subtypes ........................................................................................................................................... 10
1.1.2.2 CD4+ T cells ................................................................................................................................................. 11
1.1.3 T CELL ANTIGEN ACTIVATION ............................................................................................................. 12
1.1.3.1 Antigen-Presenting Cells ...................................................................................................................... 13
1.1.3.2 T cell antigen receptors ......................................................................................................................... 13
1.1.3.3 Some molecules involved in T cell activation ............................................................................ 14
1.2 CELLULAR METABOLISM ............................................................................................................................. 15
1.2.1 T CELL METABOLISM ................................................................................................................................ 18
1.2.1.1 Naive T cells ................................................................................................................................................ 18
1.2.1.2 Proliferating T cells ................................................................................................................................. 19
1.2.2 GLUCOSE METABOLISM IN T CELLS .................................................................................................. 21
1.2.3 GLUTAMINE METABOLISM .................................................................................................................... 24
1.2.3.1 Glutaminase................................................................................................................................................. 26
1.2.3.2 Glutaminase inhibitors .......................................................................................................................... 27
1.3 AIM OF THE STUDY .......................................................................................................................................... 29
2.0 METHODS ................................................................................................................................................................... 30
2.1 CD4+ T Cell Isolation .................................................................................................................................. 30
2.2 Identification of Glutaminase isoforms in resting CD4+ cells ............................................... 31
2.3 CD4+ T lymphocyte activation .............................................................................................................. 36
2.5 qPCR – Gene Expression ........................................................................................................................... 39
2.6 Glutamine flux – Mass Spectrometry ................................................................................................. 43
2.8 Glutaminase inhibition – protein ......................................................................................................... 45
3.0 RESULTS .................................................................................................................................................................. 46
3.1 Characterisation of Glutaminase isoforms in naive CD4+ T cells ....................................... 46
3.3 Characterisation of Glutaminase isoforms in activated CD4+ T cells ............................... 47
3.3 qPCR – Gene Expression ........................................................................................................................... 51

TABLE OF CONTENTS
3
3.5 Glutamine removal ...................................................................................................................................... 52
3.6 Glutaminase inhibition – CD4+ T Lymphocytes ........................................................................... 53
3.7 Glutaminase inhibition - protein .......................................................................................................... 54
3.4 Glutamine flux – Mass Spectrometry ................................................................................................. 56
4.0 DISCUSSION............................................................................................................................................................... 61
5.0 CONCLUSION ............................................................................................................................................................. 67
FUTURE PERSPECTIVES ..................................................................................................................................................... 68
Appendix A – Additional Procedures............................................................................................................................ 75
Appendix B – List of solutions and reagents ............................................................................................................. 77
Appendix C – Protein/RNA Concentrations .............................................................................................................. 79

LIST OF ABBREVIATIONS
4
LIST OF ABBREVIATIONS
ACL ATP citrate lyase
AMP Adenosine monophosphate
AMPK AMP-dependant protein kinase
APC Antigen-presenting cell
ASCT2 Neutral amino acid transporter 2
ATP Adenosine triphosphate
BCR B cell receptor
CaMKK2 Calcium calmodulin-dependent protein kinase
CD Cluster of differentiation
DC Dendritic cells
DMSO Dimethyl sulfoxide
DNA Deoxyribonucleic acid
EDTA Ethylenediaminetetraacetic acid
FAS Fatty acid synthase
FBS Fetal bovine serum
GAC C-type Glutaminase
Gln Glutamine
GLS Glutaminase
Glu Glutamate
GSH Glutathione
HIV Human Immunodeficiency Virus
HLA Human leukocyte antigen
ICAM Intercellular adhesion molecule
IFNγ Interferon-gamma
IL-x Interleukin
KGA Kidney-type Glutaminase
LAT Linker for activation of T cells

LIST OF ABBREVIATIONS
5
LDH Lactate dehydrogenase
LFA-1 Lymphocyte function-associated antigen 1
LGA Liver-type Glutaminase
LKB1 Liver kinase B1
MAPK /ERK Mitogen-activated protein kinases / Extracellular signal-regulated kinases
MDH Malate dehydrogenase
ME Malic enzyme
MHC Major histocompatibility complex
mTORC Mammalian target of rapamycin
MTX Methotrexate
NADH Nicotinamide adenine dinucleotide
NADPH Nicotinamide adenine dinucleotide phosphate
NEAA Non-essential amino acids
NFAT Nuclear factor of activated T cells
NK Natural killer cells
PAMPs Pathogen-associated molecular patterns
PBS Phosphate-buffered solution
PPP Pentose phosphate pathway
PPRs Pattern recognition receptors
PTK Protein tyrosine kinase
qPCR real-time Polymerase chain reaction
RA Rheumatoid Arthritis
RNA Ribonucleic acid
ROS Reactive oxygen species
SNAT Sodium-coupled neutral amino acid transporter
TCA Tricarboxylic acid cycle
TCR T cell receptor
ZAP70 Chain associated protein 70

ABSTRACT
6
ABSTRACT
The proliferating phenotype is highly glycolytic and reliant on sufficient supply and synthesis of
biosynthetic intermediaries to meet the demands of rapid cell replication. Glutamine
contributes to this up-regulated synthetic machinery by providing critical anaplerotic carbon to
the TCA cycle; nitrogen for nucleoside production; and, through its rapid conversion to lactate,
the reducing agent NADPH necessary to maintain the increase in anabolic activity. Glutaminase
represents a key step in this catabolism of glutamine and has been shown to be up-regulated in
many different proliferating tissues. It presents a target for the possible suppression of
undesired proliferation in over-reactive immunity.
The expression of the three Glutaminase isoforms (KGA, LGA & GAC) where partially
characterized using Western Blots in mature naïve and proliferating human CD4+ T
lymphocytes after TCR-CD3/CD28 activation. Two Glutaminase inhibitors, BPTES and
compound 968, were evaluated through 3H-Thymidine incorporation assays and mass
spectrometry analysis of glutamine flux. In addition, the effects of glutamine removal from
proliferating populations of human CD4+ T lymphocytes were also analysed
Our results showed glutamine is absolutely necessary for optimal CD4+ T lymphocyte
proliferation and that the Glutaminase isoform GAC is up-regulated in proliferating human CD4+
T lymphocytes. Its inhibition leads to attenuation in proliferative activity.
INTRODUCTION
7
1.0 INTRODUCTION
1.1 THE IMMUNE SYSTEM
The mammalian immune system encompasses the cells, tissues and molecules that endow the
host organism with the ability to protect itself from infection and disease1. An immune response
is the coordinated reaction of this system against an infection. Deficiencies in the immune
system can quickly lead to serious illness and even death - illustrating the importance of
immunity to the survival of the organism.
Host organisms have two main tiers of defence against foreign infections: innate and adaptive
immunity2. Innate immunity describes the initial defence an organism mounts against infection.
A healthy organism develops with this system fully functional. Adaptive immunity matures over
time and mediates a more effective response to any subsequent infection. There are two types
of adaptive immunity: humoral and cell-mediated immunity. Each consists of a separate set of
cells and molecules that protect against extracellular and intracellular microbes, respectively.
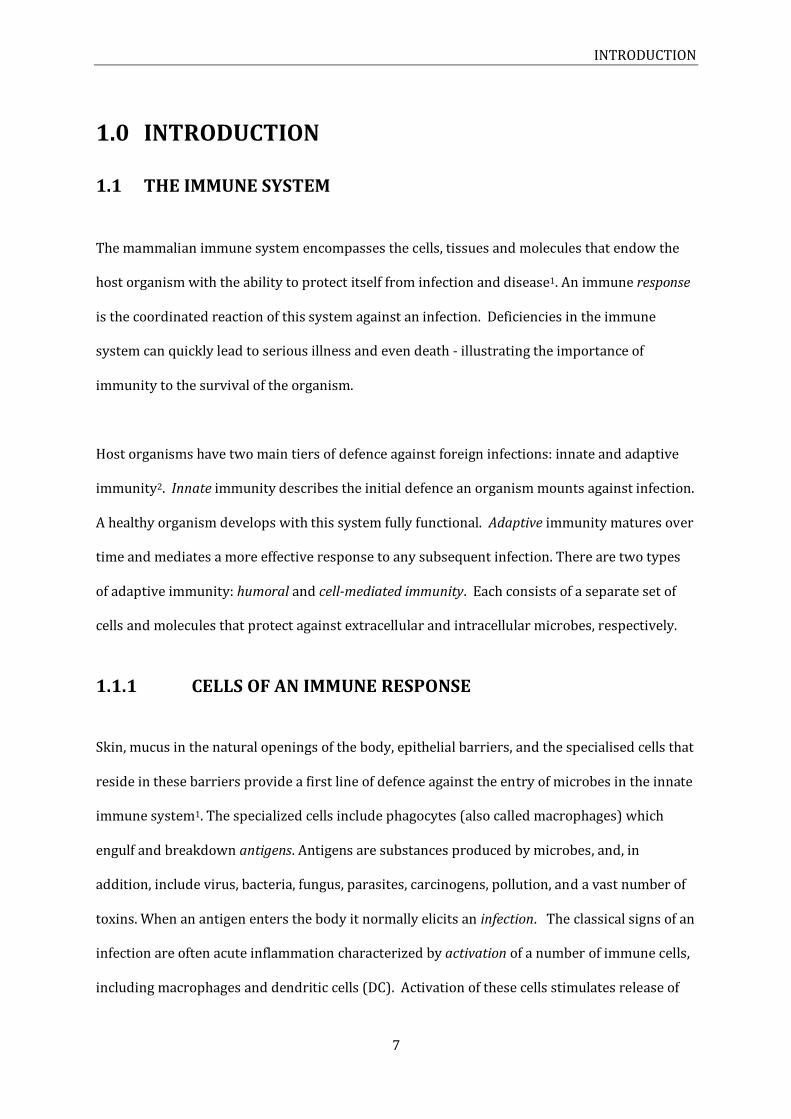
1.1.1 CELLS OF AN IMMUNE RESPONSE
Skin, mucus in the natural openings of the body, epithelial barriers, and the specialised cells that
reside in these barriers provide a first line of defence against the entry of microbes in the innate
immune system1. The specialized cells include phagocytes (also called macrophages) which
engulf and breakdown antigens. Antigens are substances produced by microbes, and, in
addition, include virus, bacteria, fungus, parasites, carcinogens, pollution, and a vast number of
toxins. When an antigen enters the body it normally elicits an infection. The classical signs of an
infection are often acute inflammation characterized by activation of a number of immune cells,
including macrophages and dendritic cells (DC). Activation of these cells stimulates release of

INTRODUCTION
8
inflammatory mediators that account for the clinical signs of infection. These inflammatory
mediators increase blood perfusion to the infected area (inflammation) that allow for the rapid
recruitment of a group of specialised cells, collectively called leukocytes.
Extravasation describes the movement of the various leukocytes critical to the initiation and
eradication of an infection and involve chemokine and receptor-mediated migration and
adhesion2. The products of the cells involved in the infection also promote cell surface receptor
expression on immune cells in the blood stream enabling them to roll slowly along the
endothelial surface in order to migrate and stop at the infection site. The complement,
coagulation, and fibrinolysis cascade systems also act in unison to initiate, propagate and
maintain this inflammatory response.
1.1.1.1 Leukocytes
Leukocytes are a diverse group of specialised immune cells that protect the body against
infection and foreign matter1. There are five in total, distinct in function and often characterised
as granulocytes or mononuclear cells. Granules of membrane-bound enzymes in the cytoplasm
that digest endocytosed particles characterise granulocytes, also called polymorphonuclear
leukocytes3. There are three types of granulocytes: neutrophils, basophils, and eosinophils.
Mononuclear leukocytes are characterised by the absence of granules in their cytoplasm. There
are three types: monocytes, macrophages and lymphocytes (see Fig 1).

INTRODUCTION
9
Figure 1. Differentiation of human leukocytes. A hematopoietic stem cell can differentiate into two lineages: (to the left)into stem cells that differentiate into precursors that eventually become either red blood cells, platelets, the two mononuclear cells, Monocytes and Macrophages, or the granulocytes (Eosinophils, Basophils and Neutrophils); or (to the right) into lymphoid stem cells that differentiate into either Natural Killer (NK) cells or lymphoblasts that become either T or B lymphocytes3.
1.1.1.2 Lymphocytes
There are three classes of mammalian lymphocytes: T-cells, B-cells and Natural Killer cells (NK
cells). The populations of these lymphocytes are kept relatively stable throughout an organism’s
lifespan4. This homeostasis is achieved through a tightly regulated system of targeted apoptosis

INTRODUCTION
10
and autophagy involving antigens, cytokines (small, hormone-like extracellular messenger
molecules) and other co-stimulatory signals. Naive lymphocytes can live a surprisingly long life
and spend most of their existence circulating through the lymphatic system. T cell lineage is
differentiated by the type of protein expressed on the surface of the cell3. “CD” denotes “Cluster
of Differentiation” and is the standard nomenclature used to differentiate T cell phenotypes.
Natural Killer cells (NK cells) are a part of the adaptive immune response1. They are a type of
cytotoxic lymphocyte that provides rapid response to virally infected cells and tumour
formation. They are active around three days after infection.
B cells have three main tasks: generate antibodies against antigens, function as antigen-
presenting cells (APC; see below), and develop into memory B cells after activation. The B cell is
a key component in humoral immunity (“humours” = extracellular fluids of the body), which
includes secreted antibodies, complement proteins and certain antimicrobial peptides. B cells
can be distinguished from other lymphocytes by several cell surface markers. One such marker,
the protein complex known as a B cell receptor (BCR), allows the B cell to bind to specific
antigens.
T cells also express antigen receptors on their surface. This receptor is called a T cell antigen
receptor (TCR). That BCRs and TCRs are formed randomly in order to recognize any antigen
make B and T cells key mediators of adaptive immunity.
1.1.2 T CELLS
1.1.2.1 T cell subtypes
There are five main T-cell subtypes, all expressing either the CD4 or the CD8 surface marker5.
The CD4 and CD8 molecules serve to stabilize the interaction between the TCR complex and the
Major Histocompatibility Complex (MHC II and I) protein molecules, expressed on various other
cells, including APCs. The subgroups of T cells include: “Regulatory” T cells (Tregs)which

INTRODUCTION
11
suppress immunity; whereas “Natural Killer” T cells (not to be confused with NK cells) act in a
similar way to cytotoxic T cells but are part of the innate response and do not adapt in response
to an antigen or infection. The largest groups of T cells are made up of the “Helper” T-cells or
CD4+ T cells, and the “Cytotoxic” T-cells or CD8+ T cells which are the basis for the development
of “Memory” T cells. Memory T cells are hallmarks of a highly developed organism and will
expand more rapidly into helper or cytotoxic T-cells in response to re-infection. CD8+ T cells
(cytotoxic T cells, TC cells, or CTLs) recognise their targets by binding to antigens associated
with MHC I – present on all nucleated cells. They destroy virally infected cells and tumour cells
and are implicated in transplant rejection6. CD8+ cells can be inactivated by certain molecules
such as IL-10 and adenosine secreted by Treg cells. This forces the CD8+ cells into an anergic
state with prevents uncontrolled proliferation of immune cells and helps prevent autoimmune
diseases.
1.1.2.2 CD4+ T cells
“Helper” T cells or CD4+ T cells are essential in the co-ordination and amplification of an
effective immune response to foreign contaminants as they regulate both humoral and cellular
immunity 1. Cytokines excreted from the cells activate macrophages; promote inflammation;
and stimulate the proliferation and differentiation of other T and B lymphocytes (Figure 2).
Differentiated effector CD4+ cells appear 3-4 days after infection, the best known being Th1 and
Th2 - differentiated only in the type of cytokine they produce7. Th1 cells secrete Interferon-y
(IFNγ), a potent stimulator of macrophages and the production of antibody isotopes that
promote phagocytosis of microbes. Th2 CD4+ leukocytes secrete interleukin (IL)-4, a cytokine
that stimulates the production IgE antibodies from B cells, and IL-5 which activates eosinophils
– therefore promoting phagocyte-independent, eosinophil-mediated immunity useful for
targeting parasites. A fraction become long-lived memory T cells.

INTRODUCTION
12
Figure 2. The co-ordination of cell-mediated and humoral immunity. T Helper cells co-ordinate immunity through release of cytokines that stimulate B cells and cytotoxic T cells. Cytokines also function in an autocrine fashion to reinforce activation8.
The importance of the CD4+ T cell phenotype can be illustrated by the deleterious affects the
HIV virus has on the immune system: the HIV virus targets cells that express the CD4 surface
protein. The subsequent decrease in CD4+ T cell population increases the number of pathogens
that escape antigen recognition. As a consequence there is an inflation in the number and
severity of infectious diseases in the individual 9.
1.1.3 T CELL ANTIGEN ACTIVATION
T cells are unable to recognize free pathogens in the circulation. A pathogen must first be
processed and “presented” to a T cell by an antigen-presenting cell (APC)1. T cell antigen
activation requires the complexing of a T cell and an APC via the interaction of a series of
proteins on the surface of both cells that include either the MHC type I (MHCI) or type II (MHCII)
molecules on the APC; the TCR complex; and either the CD4 or CD8 molecule on the T cell. The
APC displays antigen molecules on its surface via the MHC molecules to which a CD8+ or CD4+ T
cell are able to recognize and initiate a response. An endogenous antigen is displayed by MHC I
and an exogenous antigen is displayed on MHCII.

INTRODUCTION
13
1.1.3.1 Antigen-Presenting Cells
APCs are highly efficient at internalizing antigens, either by phagocytosis or by receptor-
mediated endocytosis10. APCs capture microbial cells (typically viruses or bacteria) then travel
from the infection site to the lymph nodes where the internalized microbe is digested and
antigen fragments called epitopes are displayed on the MHC molecule on the surface of the cell
for T cell activation and clonal expansion (Figure 3) 1. Cells that express both MHC proteins are
often termed “Profession APCs”10. For example, DCs are one of the most important professional
APCs and express a wide range of antigen presentation11. A DC, or any cell in the body, that
becomes infected by a virus may promote its own self-destruction via a cytotoxic T cell by
expressing part of the infected cell through the ubiquitously expressed MHCI complex.
However, DC can also promote an immune response via the MHCII proteins and interaction with
CD4+ helper T cells. Other types of professional APCs include macrophages, B cells, and some
epithelial cells.
Figure 3. Antigen presentation via Major Histocompatibility Complex I & II and recognition by T Cell Receptors. 1. Antigen associates with MHC molecule; 2. T cell recognizes MHC/Antigen combination12.
1.1.3.2 T cell antigen receptors
The T cell antigen receptor (TCR) is a heterodimer that exists bound to the cell membrane in
complex with another protein complex, the CD3 molecules. The TCR consists of two variable (α)

INTRODUCTION
14
alpha and beta (β) chains; the CD3 complex has four distinct chains (a CD3 γ, CD3 δ and two
CD3ε chains)13 – together these molecules form the TCR/CD3 complex. The alpha and beta
chains of the TCR have a constant (C) region and a variable (V) region. The extracellular
variable region binds to the antigen/MHC complex while the constant region anchors the TCR to
the cell membrane. As mentioned, during antigen encounter the CD4 and the CD8 molecules
work as co-receptors stabilising the interaction between the TCR and the MHCII or MHC I
surface molecules. A random process of gene splicing and rearrangement of the segments of
DNA that code for the antigen-binding parts of the TCR accounts for the infinite range in antigen
specificity 2. A fully developed population of T cells contains in excess of approximately 1
trillion unique T-cell receptors, which are rearranged and selected for in the thymus. This
almost infinite specificity means that upon antigen encounter only one T lymphocyte will be
activated and start to proliferate. This process is called clonal expansion.
1.1.3.3 Some molecules involved in T cell activation
T cell activation requires two separate signals1. The first is the binding and recognition by the
TCR to antigens presented by an APC via the MHC. The second signal occurs upon co-stimulation
of the CD28 molecule which is expressed constitutively by naïve T cells. The ligand for CD28 is
the CD80 protein on the APC. This second, co-stimulatory signal ensures that the cell reacts to
foreign contaminants only and strengthens the bond between the two cells1. Another
interaction between the adhesion molecules integrin protein LFA-1 on the T cell and ICAM on
the APC, further strengthen the bond during T cell activation13. TCR-antigen recognition
activates SRC kinase Lck which phosphorylates the immunoglobulin family tyrosine (Y)-based
activation motifs (ITAMs) in the CD3 protein complex14(figure 4). The subsequent
phosphorylation of chain associated protein (ZAP70) leads to the phosphorylation of other
protein tyrosine kinases (PTKs), increased endogenous Ca2+ flux and RAS activation. These
upstream events lead to a complex series of signaling cascades crucial for a normal immune

INTRODUCTION
15
response that lead to the activation of transcription factors, production of the late phase T cell
specific growth factor IL-2 and subsequent clonal expansion15.
Figure 4. Events following TCR activation. The T-cell receptor (TCR) and CD4 or CD8 co-receptors recognise the major histocompatibility complex (MHC) (not-pictured). Ligation activates the SRC kinase Lck (purple) which phosphorylates immunoglobulin family tyrosine Y-based activation motifs (ITAMs) in the CD3 protein complex (Brown – Y-p). Subsequent recruitment and phosphorylation of chain-associated protein (ZAP70) leads to a series of complex signalling cascades leading to, PI3K/Akt activation (green) and increased calcium (Ca2+) flux, activation of transcription factors, cytokine production and proliferation16.
1.2 CELLULAR METABOLISM
Indeed, what happens internally after TCR/CD3 activation is a classic example of a cell adapting
to its environment by the rewiring its metabolic pathways17. This metabolic shift from one state
to another allows the cells to grow and replicate and, ultimately, serve their function to
eliminate foreign pathogens. It also presents a challenge: how to effectively take up and
metabolize the nutrients necessary for optimal cellular growth and replication.

INTRODUCTION
16
Metabolism defines the complex network of chemical reactions that allows organisms to convert
substances into metabolic energy, and biomolecules necessary for daily maintenance in addition
to growth and proliferation 18.
The conversion of one substance into another is achieved by a series of reactions commonly
called metabolic pathways 19. For example, proteins ingested by an organism are commonly
broken down into the amino acids that fuel in vivo protein synthesis. However, amino acids can
also be converted into numerous nitrogen-containing substances including nucleotides20. In
addition, amino acids are also converted into molecules containing sulphur groups such as
Acetyl Coenzyme A (AcCoa): a molecule vital to energy metabolisms and to the antioxidant
glutathione (GSH) that protects cells from damage. Each step in these series of reactions
requires an enzyme which allows the metabolic reactions to occur in a regulated fashion.
This regulatory ability is of most importance for the production of energy. Energy is supplied by
adenosine triphosphate ATP - a high energy molecule that fuels the reactions that allow muscles
to contract, in addition to the numerous biosynthetic reactions that fuel cellular growth and
replication18. Glucose derived from dietary and internal stores of carbohydrates (glycogen in
animals), amino acids from protein, and fatty acids all contribute to the production of ATP
through interrelated metabolic pathways (Figure 5).

INTRODUCTION
17
Figure 5. Energy substrates converge on TCA cycle. The catabolism of the carbohydrate glucose, amino acids from proteins and fatty acids from fat produce Acetyl CoA which can be further oxidized in the Tricarboxylic Acid Cycle (TCA or Krebs cycle) in the mitochondria21.
All three metabolic pathways (of glucose, lipids and some amino acids) converge on
mitochondrial molecule Acetyl CoA, a key substrate fed into a series of amphibole reactions, also
called the citric acid cycle, or tricarboxylic acid (TCA) cycle18. The reactions in the TCA cycle
supply the carbon intermediaries needed during the anabolism of numerous biomolecules and
the synthesis of ATP. ATP is produced by oxidative phosphorylation by the reducing agent
nicotinamide adenine dinucleotide (NADH) and flavide adenine dinucleotide (FADH) at the
inner membrane of the mitochondria22. Here molecular oxygen (O2) is reduced to water in the
presence of H+ and electrons from supplied by NADH and FADH. For a simplification see
Figure 6.

INTRODUCTION
18
Figure 6. Production of ATP from glucose. Acetyl CoA is catabolized in the TCA cycle to produce CO2 and reducing agents for the production of ATP in the mitochondrial matrix membrane23.
The energy requirements of cells can change exponentially from moment to moment, depending
on the local and systemic requirements17;24. To meet such requirements flux through the
various metabolic pathways changes rapidly by, for example, regulating the activity of a single,
or set of, enzymes in a chosen pathway. This type of dynamic switch in metabolic activity is well
illustrated when a naïve quiescent T cell is activated, resulting in growth and proliferation.
1.2.1 T CELL METABOLISM
1.2.1.1 Naive T cells
Naive T cells roam the circulation in search of pathogens17. As such their metabolic needs are
relatively modest, needing only sufficient ATP to fuel migration and basic housekeeping duties
such as maintaining membrane ion gradients and the cytoskeleton, synthesis of biomaterials for
cell maintenance, and transportation of proteins and other substrates around the cell. They
achieve this mainly through the highly efficient catabolism of glucose and other intermediaries
through the TCA cycle and mitochondrial oxidative phosphorylation (as described above)25.
Naive T cells are not autonomous but are dependent on extrinsic signals in order to maintain

INTRODUCTION
19
this basic metabolic profile 26. A lack in these signals renders the cells unable to adequately
absorb glucose and the cells atrophy and die 27.
1.2.1.2 Proliferating T cells
Within minutes after activation, T cells undergo dramatic physiological changes. This can be
observed by cell swelling (blastogenesis) during the first 24 to 72 hours post activation28. This
increase in size is supported by elevated uptake of several energy substrates necessary for the
increased synthesis of biomass consisting of DNA, proteins and lipids25;29-32. Synthesis of
biomass also requires ATP and the electron donor NADPH. Figure 7 (below) shows the massive
shift in metabolic activity associated with the production of protein, lipids and ATP in activated
lymphocytes.
Figure 7. Increased biosynthesis of proteins, lipids and energy production upon T-cell activation33.
The release of cytokines and the up-regulation of several transcription pathways such as the
janus-kinase and Phoshatidylinositide 3-kinases / serine-threonine-specific protein kinase
(PI3K/Akt) pathways, mediated by the c-Myc proto-oncogene further enhance and prime the
cell for expansion17.
Activated T cells produce the T cell-specific growth factor IL-2 which further stimulate adjacent
T cells to up-regulate their IL-2 receptor (IL2R) as well as the glucose transporter GLUT1 for
increased uptake of glucose, both in order to support proliferation34. Downstream from the IL-

INTRODUCTION
20
2R, the PI3K-Akt transcription pathway potentiates the up-regulation and translocation of Glut1
to the cell membrane; increases the up regulation and localisation of hexokinases and other
glycolytic enzymes such as phosphofructo kinase 1 (PFK1) and lactate dehydrogenase ( LDH);
increases flux through the pentose phosphate pathway (PPP); and activates the mammalian
target of rapamycin (mTORC1) pathway vital for protein synthesis – thus ensuring maximum
uptake, retention and utilization of glucose within the cell and initiation of protein synthesis
(Figure 8)35-37.
Figure 8. Metabolic reprogramming in activated T cells. The indicated metabolic activities in resting T cells (black bars) and activated T cells (white bars). The shift was determined 24 hours post activation by increased glycolysis, pentose phosphate pathway activity, glutaminolysis and oxygen consumption, with concurrent reduced activity in the TCA cycle and fatty acid oxidation33.
AMP-activated Protein Kinase (AMPK) is a vital regulator of energy metabolism in cells18;38. It
functions by increasing the activity of catabolic, ATP-generating pathways and inhibiting
anabolic processes that deplete ATP. AMPK traditionally responds to an increasing intracellular
AMP / ATP ratio which indicates falling cellular energy levels and by phosphorylation of Liver
kinase B1 (LKB1) at Threonine 172. However AMPK has been shown in expanding T
lymphocytes to respond to elevated Ca2 levels through Calcium-calmodulin-dependant protein
kinase kinases (CaMKKs)(Figure 9)39. TCR activation evokes the release of Ca2 from the
endoplasmic reticulum in addition to Ca2 entry via membrane ion channels. A sustained,
elevated intracellular Ca2 concentration is vital during the early stages of T cell activation,
INTRODUCTION
21
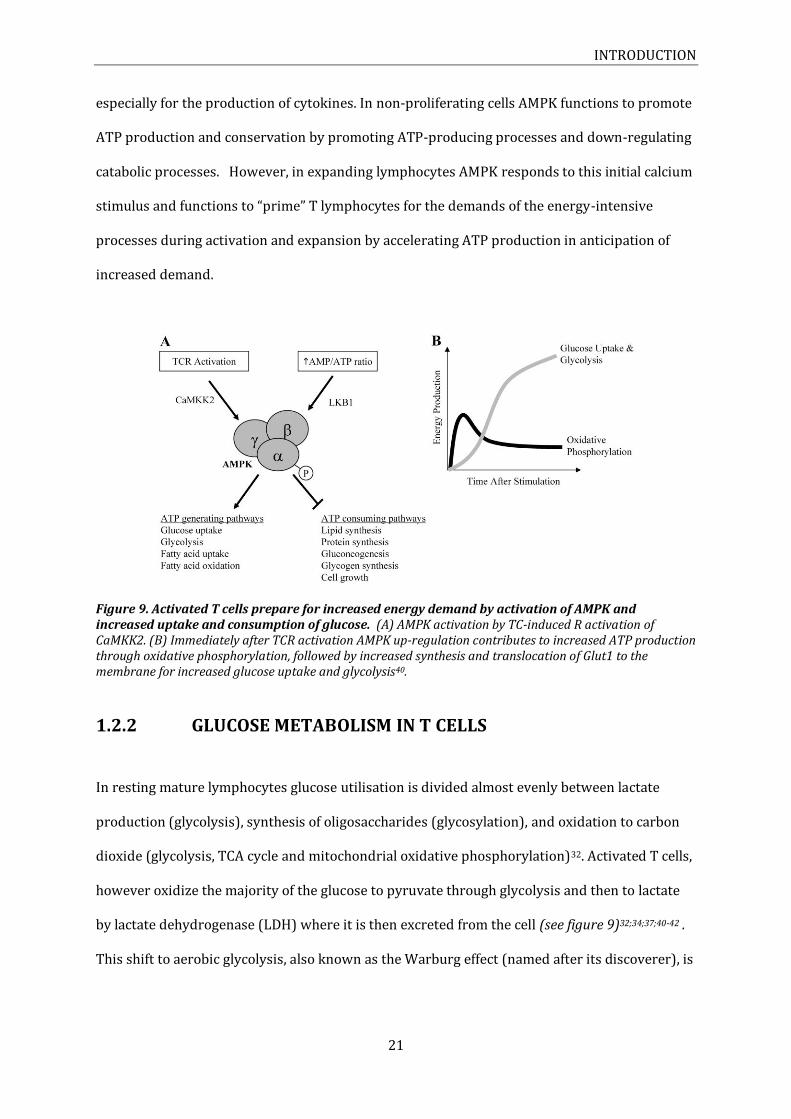
especially for the production of cytokines. In non-proliferating cells AMPK functions to promote
ATP production and conservation by promoting ATP-producing processes and down-regulating
catabolic processes. However, in expanding lymphocytes AMPK responds to this initial calcium
stimulus and functions to “prime” T lymphocytes for the demands of the energy-intensive
processes during activation and expansion by accelerating ATP production in anticipation of
increased demand.
Figure 9. Activated T cells prepare for increased energy demand by activation of AMPK and increased uptake and consumption of glucose. (A) AMPK activation by TC-induced R activation of CaMKK2. (B) Immediately after TCR activation AMPK up-regulation contributes to increased ATP production through oxidative phosphorylation, followed by increased synthesis and translocation of Glut1 to the membrane for increased glucose uptake and glycolysis40.
1.2.2 GLUCOSE METABOLISM IN T CELLS
In resting mature lymphocytes glucose utilisation is divided almost evenly between lactate
production (glycolysis), synthesis of oligosaccharides (glycosylation), and oxidation to carbon
dioxide (glycolysis, TCA cycle and mitochondrial oxidative phosphorylation)32. Activated T cells,
however oxidize the majority of the glucose to pyruvate through glycolysis and then to lactate
by lactate dehydrogenase (LDH) where it is then excreted from the cell (see figure 9)32;34;37;40-42 .
This shift to aerobic glycolysis, also known as the Warburg effect (named after its discoverer), is

INTRODUCTION
22
elevated and sustained during expansion and differentiation and occurs even in the presence of
ample amounts of oxygen43.
At first glance this shift to a less efficient production of ATP seems counterintuitive to the
energy demands of proliferating cells: the oxidation of glucose through aerobic glycolysis
produces only 2 molecules of ATP whereas 36 ATPs are generated through mitochondrial
oxidative phosphorylation18. Yet many single-celled organisms use glucose fermentation to
proliferate, demonstrating that aerobic glycolysis is sufficient in providing the necessary ATP
for cellular replication. This perceived inconsistency in energy production may be due to our
over-estimation of a cell’s energy requirements under proliferation. Normal proliferating cells
are exposed to an abundant supply of glucose and nutrients and despite tremendous rates of
replication consistently exhibit high ratios of NADH/NAD and ATP/ADP, suggesting that the
demands of the proliferating cell extend far beyond mere energy production24. A proliferating
cell must replicate all of its contents. This replication places large demands on the supply of
macromolecule precursors (lipids, amino acids, nucleotides and reducing agents (such as
NADPH). Glucose (and glutamine, discussed in the next section) provides, almost exclusively,
the carbon backbones necessary for this synthesis through anabolic pathways: the PPP and the
production of the sugar metabolite ribose 5-phophate necessary for nucleotide synthesis (not
pictured), and NADPH which is also necessary for the maintenance of reduced GSH in addition
to macromolecule synthesis; fatty acid synthesis from Acetyl CoA; and glycolytic intermediaries
for synthesis of non-essential amino acids (NEAA) (see figure 10)28;44. It quickly becomes
apparent that committing the majority of glucose to oxidative phosphorylation and
mitochondrial ATP synthesis would severely restrict production of these intermediaries and
retard cellular replication28.

INTRODUCTION
23
Figure 10. Flux of glucose and substrates in quiescent and proliferating cells. Flux of glucose (glc) in a quiescent cell (left) through glycolysis into pyruvate (pyr) which is then oxidised in the TCA cycle. Other oxidisable substrates like amino and fatty acids can also be converted into TCA intermediaries. Here the majority of ATP (yellow stars) is produced by oxidative phosphorylation. During proliferation (right), ATP generation is due largely to the massive increase in glycolytic flux. The resulting pyruvate is converted into lactate (lac) by lactate dehydrogenase (LDH) which regenerates NAD+ from NADH necessary for glycolysis. The resulting lactate is excreted from the cell. Some pyruvate enters the mitochondria to be converted to acetyl-CoA by pyruvate dehydrogenase (PDH) which is then converted into other TCA intermediaries such as citrate (cit), essential in the generation of lipid membranes for daughter cells. Amino acid pre-cursors from the TCA cycle also contribute to the synthesis of proteins in the cell. In the cytoplasm citrate is hydrolysed by ATP citrate lyase (ACL) into acetyl-CoA for synthesis of lipids by fatty acid synthase (FAS). Malate dehydrogenase (MDH) converts the resultant oxaloacetate into malate (mal) which can then either by transported back to the mitochondria for conversion back to pyruvate by malic enzyme (ME) whilst generating NADPH used in the synthesis of fatty acids24.
Of perhaps equal importance as a major provider of carbon backbones for this increase in
biomass by proliferating T cells is glutamine.

INTRODUCTION
24
1.2.3 GLUTAMINE METABOLISM
Glutamine is the most abundant amino acid in the human body comprising 60% of free amino
acids45. It is synthesised primarily in the lungs, skeletal muscle and adipose tissue. Serum
concentrations range from 0.4 - 0.9mM46. It is synthesized through the conversion of glutamate
and ammonia to glutamine through the hydrolysis of ATP:
L-Glutamate + NH3 + ATP > L-Glutamine + ADP + Pi
Glutamine is the primary supplier of nitrogen and carbon for protein synthesis; it is essential in
the transportation and regulation of nitrogen; vital in the production of nucleotides, glucose
through gluconeogenesis, and glucosamine; as a precursor in the synthesis of
neurotransmitters; acid/base regulation in the kidneys; and in the replenishing of GSH for
optimal protection against oxidative stress47;48. It is also the major provider of carbon for alpha-
ketoglutarate and an important anaplerotic substrate for the TCA cycle and the synthesis of
lipids (Figure 11). Indeed, many highly proliferative tissue types exhibit elevated levels of
glutamine turnover to support energy production including enterocytes, fetal cells, hair follicles,
tumours and the cells of the immune system46.
Activated T cells selectively enhance glutamine uptake through expression and synthesis of the
major glutamine transporters Sodium-coupled amino acid transporters 1 and 2 (SNAT1 and
SNAT2), Solute carrier family 7 member 5 (SLC7A5) and Neutral amino acid transporter
(ASCT2). Elevated glutamine uptake and metabolism is stimulated by TCR-CD3 induced
ERK/MAPK activity and increased c-myc expression 30;30;49.

INTRODUCTION
25
Figure 11. Catabolism of glutamine in proliferating cells. Citrate lost to the synthesis of lipids (green arrows) in proliferating cells is replenished from the metabolism of glutamine (red arrows). After transport into the cytosol by SNAT glutamine (Gln) donates nitrogen for purine and pyrimidine synthesis through oxidation to glutamate (Glu) by Glutaminase (GLS). Glutamate donates its amino group to α-keto acids for synthesis of nonessential amino acids and α-ketoglutarate (α-KG). Mitochondrial glutamine can also be converted into glutamate by phosphate-dependent Glutaminase (PDG) which frees an amido group (red square). The mitochondrial glutamate can then either be used to synthesize amino acids by aminotransferases or mitochondrial α-KG by glutamate dehydrogenase (GDH). α-KG can then enter the TCA cycle and replenish oxaloacetate (OAA) and citrate. The carbon from glutamine can also be converted into lactate (glutaminolysis) which generates the reducing agents NADPH and NAD+ in the cytoplasm24.
As figure 11 demonstrates, glutamine is a key anaplerotic source of carbon for replenishment of
TCA intermediaries and synthesis of macromolecules. It is also a source of fresh NAD+ and
NADPH necessary for reductive, biosynthetic pathways. In glioblastoma cells 90% of glucose
and 60% of glutamine is converted into either lactate or lanaline which is then rapidly excreted
from the cell, with robust NADPH production being the result50. Inhibition of LDH, a key enzyme
in this process, undermines cell proliferation. This suggests that the removal of excess carbon
from the cell may be necessary to generate enough NADPH to fuel cell proliferation51.
As mentioned earlier, GSH is the cell’s major antioxidant and its synthesis is dependent on
adequate supply of glutamine. GSH’s role is crucial in preventing oxidative damage to DNA,
INTRODUCTION
26
proteins, enzymes and lipids52. It is also an essential component in the synthesis and repair of
DNA, enzyme activation and protein synthesis – all critical under rapid cell proliferation. GSH is
synthesised from the amino acids cysteine, glycine and glutamate. Due to this dependence on
glutamate, GSH synthesis is also highly dependent on adequate cellular glutamine. Restricting
available GSH to proliferating lymphocytes greatly diminishes their ability to replicate53.
1.2.3.1 Glutaminase
Glutaminase catalyses the hydrolysis of glutamine to glutamate and ammonia:
L-glutamine + H20 > L-glutamate + NH4
Three mammalian Glutaminase isoforms have been identified: the Kidney-type Glutaminase
(KGA) and Glutaminase C (GAC) - a splice-variant of KGA - both coded by the gls gene; and Liver-
type Glutaminase (LGA) - coded by gls2. KGA and GAC are expressed in the brain, kidney,
intestine, fetal liver and many other tissues, unlike LGA, which, as the name suggests, is located
only in hepatic cells46. Evidence points to the binding of both KGA and GAC to the inner
membrane of the mitochondria, however some evidence suggests they may reside in the
intramembrane, free from the membrane54;55. Figure 12 depicts the identical N-terminus shared
by KGA and GAC and the identical core shared by all variants that is highly conserved in each
isoform and likely the catalytic domain of the enzyme. Each enzyme has a unique C-terminal.

INTRODUCTION
27
Figure 12. The three human glutamines isoforms are compared to bacterial Glutaminase. A common core (black) is conserved in each isoenzyme. GAC and KGA isoforms share an identical N-terminal (white). Each human Glutaminase isoform has a unique C-terminal (patterns)56.
The three different isoenzymes vary not only in protein structure but also in enzyme kinetics.
GAC and KGA isoforms require a polyvalent anion for activation, the most common being
phosphate which elicits half-maximal activity at 20-30mM46. The isoforms have Km values for
glutamine at around 2-5mM. The Km values for both enzymes are improved in the presence of
elevated phosphate30. This is in contrast to LGA which has a relatively high Km for glutamine (17
mM) and hence much less sensitive to variations in the concentration of phosphate. Both KGA
and GAC, but not LGA, are inhibited by their enzymatic product glutamate.
Reinforcing the notion that fast-growing cells are reliant on increased levels of glutamine, many
cancer cells up-regulate the KGA and GAC isoforms for continued expansion, with mRNA levels
elevated in breast cancer, colorectal carcinomas, adenomas and glyomas29.
1.2.3.2 Glutaminase inhibitors
Recently, attention has been focused on the ability of two compounds found to inhibit
mammalian Glutaminase activity in vitro and in tumour cells57-59.

INTRODUCTION
28
Figure 13. BPTES (Bis-2-(5-phenylacetimido-1,2,4-thiadiazol-2-yl) ethyl sulphide)
Figure 14. Compound “968” (5-(3-bromo-4-(dimethylamino) phenyl)-2,2-dimethyl-2,3,5,6-tetrahydrobenzo[a]phenanthridin-4(1H)-one)
Both compound Bis-2-(5-phenylacetimido-1,2,4-thiadiazol-2-yl) ethyl sulphide (BPTES) (figure
13) and 5-(3-bromo-4-(dimethylamino) phenyl)-2,2-dimethyl-2,3,5,6-
tetrahydrobenzo[a]phenanthridin-4(1H)-one (968) (figure 14) appear to allosterically regulate
the Glutaminase enzyme by altering the tetramer confirmation59. This differs to other
Glutaminase inhibitors such as 6-Diazo-5-oxo-L-norleucine (DON) and acivicin which covalently
modify residues on the binding pocket and have significant toxicity issues. Both inhibitors are
neither irreversible nor competitive versus glutamine and simultaneously lower both Km and
Vmax values58. It appears that 968 has a reduced ability to inhibit the phosphate-activated
Glutaminase, whereas BPTES can, hinting at differing modes of inhibition for each compound.
INTRODUCTION
29
Both KGA and GAC Glutaminase isoforms are elevated in certain tumour cells60. Recent research
has shown that inhibition of the GAC enzyme by compound 968 in these tumours can inhibit
oncogenic progression59.
1.3 AIM OF THE STUDY
Based on what has been described above we hypothesize that the proliferative phenotype of
increased glucose and glutamine dependency seen in many different cancer cells is similar in
activated mammalian T lymphocytes , a view which is supported by the literature28;29;41;50;61.
The enzyme Glutaminase is of particular interest because of it essential role in the catabolism of
glutamine for anaplerotic carbon and reducing agents vital to cell proliferation.
The primary aims for the study, therefore, are as follows:
Identification of protein and mRNA expression for Glutaminase in naïve non-
proliferating and CD3/CD28-activated proliferating CD4+ T lymphocytes.
Investigate the requirement of glutamine for T cell proliferation by selective inhibition
of Glutaminase and by glutamine removal.
Investigate the intracellular concentrations, and flux of glutamine, in proliferating CD4+
T lymphocytes
METHODS
30
2.0 METHODS
A complete list of solutions and reagents can be found in Appendix B.
2.1 CD4+ T Cell Isolation
Human CD4+ T lymphocytes were isolated from buffy coats (supplied from Blodbanken, Ullevål
sykehus). Buffy coats are samples of anti-coagulated blood rich in leukocytes and platelets after
density gradient centrifugation of whole blood samples. Average volume was approximately
40-50ml. Buffy coats were diluted with 24ml cell medium (RPMI 1640: 10% inactivated FBS
(fetal bovine serum); 2mM L-glutamine; 0.5% Penicillin-Streptomycin) and 1ml EDTA
(Ethylenediaminetetraacetic acid) and rotated for 15min at 4 °C to prevent coagulation.
Dynabeads CD4+ Isolation
The Dynabeads CD4 Positive Isolation Kits (Invitrogen) were used to isolate CD4+ T
lymphocytes from buffy coats. The Dynabead vial was first vortexed for 30 seconds, then 200uL
of the super paramagnetic bead solution (4.5 µm diameter; 4 x 10⁸ beads/mL) was suspended in
a Dynamag-2 magnet (Invitrogen), the supernatant removed, and the bead pellet washed with
1ml PBS (phosphate buffer solution) at room temperature to remove the 0.02% sodium azide
preservative. The beads were then resuspended in 200uL cell medium and then added to the
buffy coat solution which was then rotated at 4 °C for a further 30 minutes to allow bead/cell
binding. The bead-bound cells were then removed from the buffy coat solution by dispending
the solution into two 50ml Falcon conical tubes and suspending these in a DynaMag-50 magnet
(Invitrogen) for 5 minutes to allow the bead-bound cells to migrate and adhere to the side of the
tube. The buffy coat supernatant was then gently removed and discarded. The resulting
bead/cell deposit was then collected into one 15ml Falcon tube using 5ml PBS, then placed in a

METHODS
31
Dynamag-5 (Invitrogen) for 2 minutes. This step was repeated 4 times to wash the bead-bound
CD4+ T lymphocytes and remove any impurities. The cell pellet was then suspended in 100uL
DETACHaBEAD solution (Invitrogen) and incubated for 1 hour at room temperature with gentle
mixing. The DETACHaBEAD solution contains a polyclonal anti-Fab antibody that releases the
CD4+ cells from the Dynabeads. After 1 hour the solution was vortexed at 2500rpm/min for 10
seconds and placed in a magnet for 1 minute. The supernatant containing the released CD4+
lymphocytes was then transferred to a fresh 15ml tube. The remaining beads were then
washed with 1ml PBS and then placed back on the magnet where the supernatant was removed
and added to the fresh tube. This step was repeated twice to salvage any residual cells. The
resulting 2-2.5ml suspension was then placed in the magnet for a further 2 minutes to remove
any remaining beads then centrifuged for 7 min at 1500rpm after which the supernatant was
discarded The cell pellet was then washed in 5ml PBS then centrifuged again for 7 min at
1500rpm. After discarding the supernatant the cell pellet was suspended in 1ml of cell medium
(described earlier) and the cells were counted using a Biorad TC10 Cell Counter (isolation using
this method yielded on average 50 million CD4+ lymphocytes) and incubated in cell medium at
a concentration of 5 million cells/ml and stored (if not used immediately) in a cell incubator at
36.5°C; 5% CO2.
2.2 Identification of Glutaminase isoforms in resting CD4+ cells
Western blots were used to characterise the relative levels of the Glutaminase isoenzymes in
resting mature CD4+ lymphocytes.
Lysation of cell pellet
To effectively lyse the CD4+ cell membrane a solution containing 100uL of NP40 lysis buffer
(Novex), 1uL protease inhibitor phenylmethanesulfonylfluoride (PMSF; 100x; Sigma) and 1uL of
protease inhibitor cocktail (100x; Sigma) were added to the cell pellet and resuspended several
times. The solution was left on ice for 15 minutes with occasional vortexing (once every 3
METHODS
32
minutes; 2500rpm/min). To release the mitochondrial Glutaminase enzymes this procedure
was supplemented with sonication (amplitude 60%; 6 seconds: 2x 2 second bursts). The twice-
lysed cell solution was then centrifuged (15000RPM; 1 minute). The supernatant was then
removed, and, if not used immediately, snap frozen by suspending the supernatant in a -78°C
ethanol/dry ice solution and then stored in a -80°C freezer.
Protein concentration
See Appendix C for a complete list of protein concentrations.
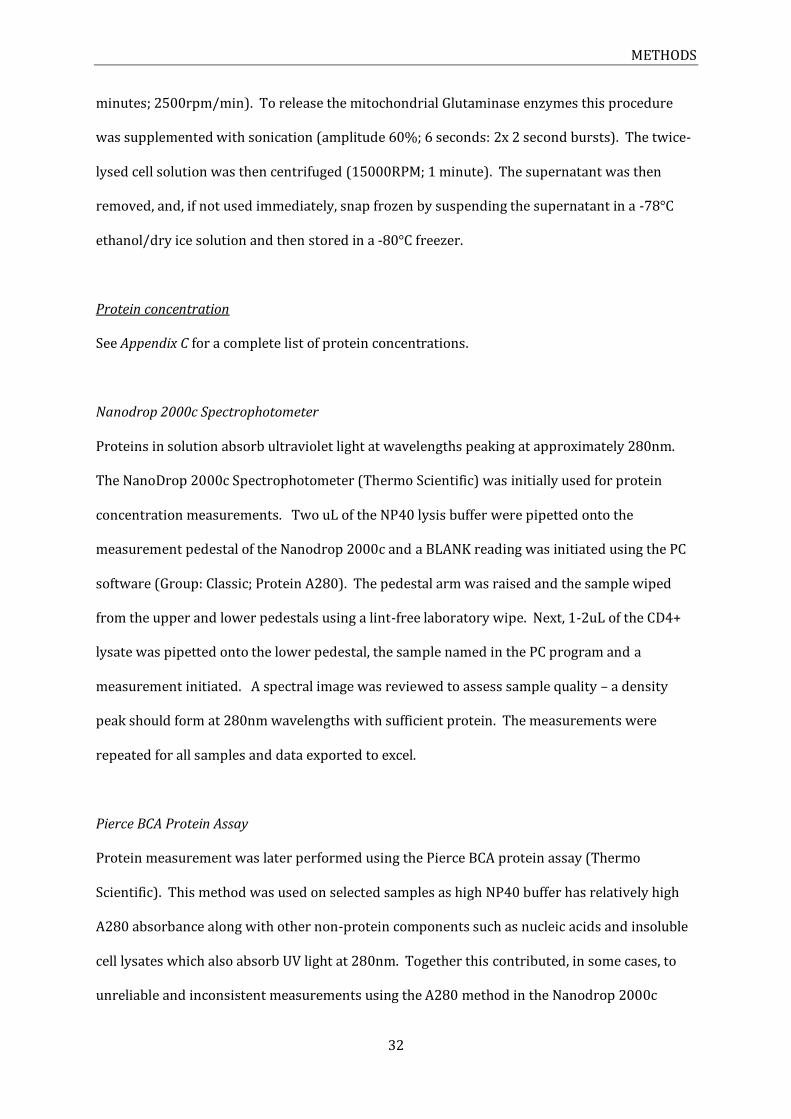
Nanodrop 2000c Spectrophotometer
Proteins in solution absorb ultraviolet light at wavelengths peaking at approximately 280nm.
The NanoDrop 2000c Spectrophotometer (Thermo Scientific) was initially used for protein
concentration measurements. Two uL of the NP40 lysis buffer were pipetted onto the
measurement pedestal of the Nanodrop 2000c and a BLANK reading was initiated using the PC
software (Group: Classic; Protein A280). The pedestal arm was raised and the sample wiped
from the upper and lower pedestals using a lint-free laboratory wipe. Next, 1-2uL of the CD4+
lysate was pipetted onto the lower pedestal, the sample named in the PC program and a
measurement initiated. A spectral image was reviewed to assess sample quality – a density
peak should form at 280nm wavelengths with sufficient protein. The measurements were
repeated for all samples and data exported to excel.
Pierce BCA Protein Assay
Protein measurement was later performed using the Pierce BCA protein assay (Thermo
Scientific). This method was used on selected samples as high NP40 buffer has relatively high
A280 absorbance along with other non-protein components such as nucleic acids and insoluble
cell lysates which also absorb UV light at 280nm. Together this contributed, in some cases, to
unreliable and inconsistent measurements using the A280 method in the Nanodrop 2000c

METHODS
33
Spectrophotometer (Thermo Scientific). The BCA protein assay is based on bicinchoninic acid
(BCA) and relies on two reactions: first, the peptide bonds in proteins reduce Cu2+ in proportion
to the total amount of protein present in the solution, then the resulting Cu+ ions chelate with
two molecules of bicinchoninic acid to form a purple-coloured product that strongly absorbs
light wavelengths of 562nm. The protein concentration can then be assessed by measuring the
absorption characteristics of the target samples against protein solutions with known
absorption characteristics. The procedure for this assay can be viewed in Appendix A.
Preparation of protein samples for polyacrylamide gel electrophoresis (PAGE)
The Criterion Precast polyacrylamide gels (Biorad) come in various percentage densities of
acrylamide. The acrylamide density chosen is dependent on the size of the protein of interest:
large proteins should be run in low-percentage acrylamide gels and small proteins should be
run in higher percentage gels. A 7.5% density gel was chosen because of the small size of the
three Glutaminase isoforms (KGA: 73kDa; LGA: 66kDa; GAC: 55kDa). Each well in the gel should
hold the same amount of total protein. This required the dilution of the higher-concentrate
samples with the NP40 lysis buffer to standardize the concentrations. Next, the lysate was
mixed with 2x sodium dodecyl sulphate (2xSDS) sample buffer at 1:1 ratio (see Table 1 for a
complete list of solutions). The SDS solution binds to and uniformly charges the proteins in the
sample so they can be separated according to relative size (and not charge). The maximum well
volume is determined by the number of wells in the gel and was taken into account when
calculating lysate and SDS sample buffer volumes. The SDS sample buffer/lysate mixture was
heated for 5 minutes at 96 °C to denature the proteins.
Loading samples
A Criterion Precast Gel (Biorad) was placed in a Criterion Cell (Biorad) PAGE container prior to
sample loading (see Table 2 for a complete equipment list). The container was filled with SDS
running buffer, including the reservoir at the top of the gel. Potential bubbles at the bottom of

METHODS
34
the gel were removed by lifting the gel a little upwards in the buffer once or twice. The first well
was loaded with 10uL Precision Plus Dual Colour (Biorad) protein standard (not heated). The
boiled samples were loaded carefully into the other wells with a pipette.
Table 1. List of solutions
Solutions Components
SDS Running Buffer Transfer Buffer TBS (10x) TBST Blocking Buffer Primary Antibody Secondary Antibody
150 g Tris, 720 g Glycine, 50 g SDS, dH2O up to 5 L 15 g Tris, 72 g Glycine, 1 L (20%) methanol, dH2O up to 5 L 12.11 g Tris, 58.4 g NaCl, pH 7.5 1/10 10x TBS + 9/10 dH2O , 0.1% Tween 20 5% non-fat dry milk powder in 1x TBST Diluted in 1x TBST 8.4 µl from a 40% glycerol antibody solution to 10 mL of 1x TBST
Table 2. List of equipment
Equipment Manufacturer Catalog #
Criterion 12+2 well 7.5% Precast gels Criterion 18 well 7.5% Precast gels Criterion Cell Criterion Blotter Criterion Filter Paper Criterion Foam Pad
Biorad Biorad Biorad Biorad Biorad Biorad
345-0005 345-0006 135BR 560BR 170-4085 170-4086
Electrophoresis
The electric current generated by the PAGE cell forces the negatively charged protein samples to
migrate through the acrylamide gel from the negative to the positive electrodes, where they
fractionate according to size. After loading the wells, the PAGE container was run with a Biorad
Powerpac 300 at 100V for approximately 10 minutes until the samples had entered the gel
properly, then at 130V until the dye had completely passed through the gel (typically 1 – 1.5
hours).
Protein transfer
Once electrophoresis was completed the proteins were then transferred to, and immobilized on,
a polyvinylidene fluoride (PVDF) membrane (Millipore). The membrane is highly non-reactive
and has a non-specific affinity for amino acids which makes it resistant to solvents and easily
reused when examining other proteins. First, the gel was removed from its plastic housing and

METHODS
35
sandwiched in a sandwich holder (Biorad) next to a similar sized piece of PVDF membrane,
compressed on either side by three 9.5x15.2cm Criterion Filter Papers (Biorad) and a Criterion
Foam Pad (Biorad). Care was taken to ensure gel viability and the eradication of air bubbles
that would impede transfer. The sandwich was placed in a Criterion Blotter (Biorad) container
which was filled with transfer buffer and run overnight at 4 °C with a Biorad Powerpac 300 at
15V for approximately 12-14 hours.
Blocking
Before probing with the appropriate antibody, the freshly blotted PVDF membrane was blocked
to prevent any unspecific antibody binding: 1 hour at room temperature in blocking buffer (5%
non-fat dry milk powder in TBST (Tris-Buffered Saline plus Tween 20) on a roller. Milk
contains many proteins that bind to the membrane and reduce non-specific binding. After
blocking the membrane was rinsed with TBST until the rinsing liquid was clear.
Probing
Primary antibodies used for detection are produced when a host animal is exposed to the
protein of interest and the resultant antibodies harvested. When exposed to the membrane-
bound protein the antibodies bind to the protein. A secondary antibody is then directed at a
species-specific segment of the primary antibody (i.e. mouse, rabbit, donkey). The secondary
antibody is linked to horseradish peroxidase which is subsequently used to cleave a
chemiluminescent agent that produces light and can be detected by a light-sensitive camera to
determine protein concentrations.
The PVDF membrane was first cut into strips to allow incubation with the three Glutaminase
antibodies plus the control (α-tubulin) and then incubated in the primary antibody solution
(5ml TBST plus antibody) over night at 4°C on a roller. After the primary incubation the
membrane(s) was washed with TBST for one hour, changing buffer every 10 minutes.

METHODS
36
Incubation with the secondary antibody (8.4uL from a 40% glycerol antibody solution to 10ml
of 1xTBST) was 1 hour at room temperature, followed by the same washing procedure as for
the primary antibody.
Detection
The probed and washed membrane were incubated with 1-5ml (dependant on number of
membranes) of Reagent A (Lumino/Enhancer Solution) and B (Stable Peroxide Solution) from
the Super Signal West Pico Chemiluminescent Kit (Thermo Scientific) and laid on a clear plastic
sheet (e.g. Gladpack, gladwrap). The membrane was then exposed using the G.BOX Chemi XL
CCD system (SynGene) at 2 min intervals for 15 minutes to capture the image.
Re-probing
For re-probing, the membrane(s) were washed with TBST for 30 minutes to remove the
chemiluminescent substrate then incubated with the Restore Western Blot Stripping Buffer for
5 to 15 minutes at room temperature, washed in TBST for a further 30 minutes, blocked with
blocking buffer (described previously) for 1 hour at room temperature and then re-probed.
2.3 CD4+ T lymphocyte activation
CD4+T lymphocyte activation assay
Activation of CD4+ lymphocytes was performed in 24-well incubation plates (approx. 3 mill/ml
for activated cells; and 5 mill/ml for control cells). The cells were incubated in RPMI1640
supplemented with glutamine and antibiotics (as described previously). CD4+ cells were
stimulated with 37.5uL Dynabead CD3/CD28 Expansion beads (Invitrogen; 4x10⁷ cells/mL); the
control cells received 22.5uL dummy beads - Dynabead Mouse T-Activator CD3/CD28
(Invitrogen; 4x10⁷ cells/mL). All beads were washed with PBS to remove the preservative as
described earlier. IL-2 was added to all wells at a concentration of 30U/mL. Total volume in
each well was 1ml. The plate was then incubated at 37°C / 5%CO2 for 72 hours in an incubator.

METHODS
37
After 72 hours the well contents were then moved to 1.5mL Eppendorf tubes and centrifuged at
high speed (15000RPM) for 10 seconds. The supernatant was removed and the cell pellet
washed with PBS, centrifuged again at high speed and, if not used immediately, snap frozen in a
-78 °C ethanol/dry ice solution and stored in a -80 °C freezer.
[3H]-Thymidine Incorporation
A [3H]-Thymidine incorporation assay was performed to test for successful CD4+ lymphocyte
activation. 3H-thymidine is a radioactive nucleoside that is incorporated into the newly
synthesised DNA strands of the proliferating cells during mitotic cell division. The protocol
above was adjusted to a 96 well plate/100uL volume assay using the same cell-to-bead ratio
and activation with CD3/CD28 Dynabeads. After incubation for 48 hours a 25uL solution of
[3H]-Thymidine (40 uCi/mL; Nerliens) was added to each well. After incubation for a further
24 hours the cells were harvested using a Filtermate 196 Harvester (Packard) and the level of
3H-thymidine incorporation into DNA then measured using a Top Count Microplate Scintillation
Reader (Packard).
7 day expansion assay
Fifty ml of cell medium supplemented with IL-2 (30U/ml) was heated to 36.5°C and added to a
150 cm2 Falcon Cell Culture Flask (BD Biosciences). Approx. 50 million CD4+ lymphocytes were
added to the mixture after isolation (see CD4+ lymphocyte isolation). Eight hundred uL of
Dynabeads CD3/CD28 Expansion beads (4x10⁷ beads/ml; Invitrogen) solution was added to the
lymphocyte culture (after washing; see CD4+ T lymphocyte activation assay) and gently
resuspended with a 5ml pipette. After four days the cells were gently resuspended once more
and then split equally into two new 150 cm2 Falcon Cell Culture Flasks. 25ml of fresh cell
medium supplemented with IL-2 was added to each flask and the flasks incubated for a further
72 hours.

METHODS
38
Glutamine removal
To determine to what extent the level of glutamine in the cell medium had on CD4+ T
lymphocyte activation Dynabead CD3/CD28 stimulation beads (Invitrogen) were used to
stimulate CD4+ T lymphocytes in serial dilutions of glutamine ranging from 0.1 to 10mM. The
FBS (fetal bovine serum) was dialyzed with a “Slide-A-Lyzer” Dialysis Cassette (30ml; 3.5K
MWCO; Thermo Scientific) to remove small molecules including glutamine (for procedures see
Appendix A). Then 100ul of a CD4+ T lymphocyte population (15x106 cells/ml) in cell medium
(DM5030: 10% dialyzed, inactivated FBS (fetal bovine serum); 0.5% Penicillin-Streptomycin;
IL-2 30U/ml; 36.5°C) were distributed in a 96-well curve-bottomed microplate and activated
with 18.75ul Dynabeads CD3/CD28 Expansion beads (4x10⁷ beads/ml; Invitrogen) per well
(washed first, as described earlier). The microplate was then incubated at 36.5°C for 48 hours.
25ul of 3H-Thymidine (40 uCi/mL; Nerliens) was then added to each well and then incubated
for a further 24 hours. Cells were then harvested and incorporation of 3H-thymidine was
measured using a scintillation counter to determine rate of proliferation. All tests were
performed in triplicate.
Glutaminase inhibition – CD4+ T Lymphocytes
Two potential compounds were evaluated to disrupt cellular glutamine metabolism in CD4+ T
lymphocytes at the level of Glutaminase (see Glutaminase Inhibitors). An assay was set up to test
whether introduction of these inhibitors would have an inhibitory effect on proliferation as had
been observed in other highly proliferative cells. The assay protocol was identical to the
glutamine removal method described in the section above (minus the dialysing step, and
supplementing the medium with 500uM L-glutamine). In addition both compound 968 (SPECS)
and BPTES (Drug Discovery Laboratory AS) were included in the assay. Due to precipitation
issues both inhibitor stocks were made with 100% DMSO. Serial dilutions of both inhibitors
were made so that final assay concentrations were 0.1, 1, 10 and 100uM after addition of 0.5ul
per well (max 0.5% DMSO per well). Control wells (minus inhibitor, with DMSO) were included.

METHODS
39
3H-thymidine incorporation was measured after 72 hours. All tests were performed in
triplicate.
2.5 qPCR – Gene Expression
Quantitative polymerase chain reaction (qPCR) was used to detect the gene expression levels in
the naïve and activated CD4+ lymphocyte samples. RNA was first extracted from target samples
and then converted to cDNA using reverse-transcriptase reaction. The cDNA templates were
then exposed to gene specific probes and analysed using qPCR to determine relative expression
levels.
RNA isolation
The RNeasy Plus Mini Kit (Qiagen) was used for RNA isolation from the naïve and activated
CD4+ lymphocyte samples. All work was performed on ice. A buffer containing 1 part β-
mercaptoethanol to 100 parts RLT Plus buffer (from RNeasy Kit) was added to each sample
(350uL per sample). The RLT Plus buffer contains highly denaturing guanidine-isothiocyanate
mix which inactivates RNases and ensures purification of intact RNA. The CD4+ lysate/buffer
solution was then homogenized with a syringe and needle (20 gauge/0.9mm diameter; approx.
10 cycles was sufficient). The homogenized solution was then spun through the gDNA
Eliminator columns (30 seconds at 10000rpm), which in combination with the high-salt RTS
buffer removes genomic DNA. 350uL of 70% ethanol was then added to the flow-through which
was then transferred to an RNeasy spin column and centrifuged for 15 seconds at 10000RPM.
During centrifugation the total RNA binds to the internal membrane and any impurities are
washed away. The flow-through was then discarded and 700uL RW1 solution (from RNeasy
kit) was added to the RNeasy spin column and then centrifuged for a further 15 seconds at
10000RPM. The flow through was discarded again. 500uL RPE solution (from RNeasy kit) was
then added to the spin column and centrifuged for 15 seconds at 10000RPM, after which the
flow through was discarded once more. This process was repeated twice to rinse any

METHODS
40
contaminants from the RNA collection membrane. The column was then placed inside a
supplied 1.5mL collection tube and 50uL of 60 °C RNA-free water was added directly to the
membrane to elute the RNA. The RNeasy Spin Column and collection tube was then jointly
centrifuged at 10000RPM for 1 minute to collect the purified RNA.
RNA concentration
The NanoDrop 2000c Spectrophotometer (Thermo Scientific) was used to measure total RNA
concentrations in the activated and non-activated CD4+ T lymphocytes. The program was set
to “Group: Classic” and “Nucleic Acid” in the home screen and to “RNA” analysis at the
measurement screen. First 2uL of the RNase-free water was pipetted onto the measurement
pedestal of the Nanodrop 2000c and a BLANK reading initiated from the measurement screen.
The pedestal arm was then raised and the sample wiped from the upper and lower pedestals
using a lint-free laboratory wipe. Next, 1-2uL of the purified RNA solution was pipetted onto the
lower pedestal, the sample named, and a measurement initiated. The process was repeated for
all samples and the data exported to Excel. All work was performed on ice. The RNA
concentrations were standardized for each sample with the addition of RNase-free water to the
higher concentrates. (see Appendix C for a complete list of total RNA concentrations).
Reverse Transcription
Complementary DNA (cDNA) synthesis from the purified RNA samples was achieved using the
QuantiTect Reverse Transcription Kit (Qiagen). Reverse transcriptase enzymes are
multifunctional, with 3 distinct enzymatic activates: an RNA-dependent DNA polymerase and
DNA-dependent DNA polymerase transcribes cDNA from the RNA template; and an
exoribonuclease then degrades the RNA. These 3 steps allow for transcription of RNA into DNA
for later detection. The kit provides a two-step process that: 1) eliminates genomic DNA and; 2)
synthesizes cDNA using a reverse transcriptase reaction. All work was performed on ice.
1. Genomic DNA removal:

METHODS
41
The genomic DNA elimination reaction was performed according to Table 3.
Table 3. Genomic DNA elimination reaction components
Component Volume/reaction Final Concentration
gDNA Wipeout Buffer, 7x purified CD4+ RNA RNase-free water
2ul (from Nanodrop 2000c)
Variable
1x
Total volume 14ul -
The elimination reaction was then incubated for 2 minutes at 42 °C and then placed back on ice.
2. Reverse transcription:
The reverse transcription master mix was prepared according to Table 4.
Table 4. Reverse-transcription reaction components.
Component Volume/reaction Final Concentration
Reverse-transcription master mix Quantiscript Reverse Transcriptase Quantiscript RT Buffer RT Primer mix Template RNA Entire gDNA elimination reaction
1ul 4ul 1ul
14ul
1x
Total volume 20ul -
Fourteen uL of the RNA template mix from the previous step is added to each PCR tube
containing the reverse-transcription master mix and incubated in a thermal cycler for 15
minutes at 42 °C; a further3 minutes at 95 °C and then at 4 °C before being placed immediately
on ice. A negative control (no reverse transcriptase; no-RT) was included to test for any
contaminating genomic DNA. This is done by performing a control reaction with no reverse
transcription added.
qPCR
Quantitative polymerase chain reaction (qPCR) and TaqMan Gene Expression Assays (Applied
Biosystems) were used to amplify and detect the specific nucleic acid sequences used to
synthesise the three Glutaminase isoenzymes in the stimulated and non-stimulated CD4+
lymphocyte samples. The TaqMan assays rely on the use of sequence-specific reporter probes

METHODS
42
that emit a fluorescent signal when cleaved from the cDNA template during thermal cycling and
the transcriptive action of DNA polymerase (see figure 15).
Figure 15. RT-PCR with fluorescent probes. Polymerisation of the cDNA template cleaves the gene-specific
TaqMan probe (purple) only if it is hybridized to the target sequence. The probe fragments and the reporter
(R – green) displaces, separating from the quencher (Q – blue). The reporter emits a fluorescent signal
which is detected by the RT-PCR equipment in real-time. (Image retrieved 20 March 2013, from: www SDS (sodium dodecyl
sulphate).appliedbiosystems.com)
After reverse transcription the TaqMan Gene Expression assay reagents were thawed on ice and
combined with the cDNA templates in a 96 well PCR microplate according to Table 5 (below).
Purified water was added to each cDNA template if greater volumes were required.
Table 5. qPCR gene expression reaction components
Component Volume/reaction Final Concentration
TaqMan Master Mix PLUS TaqMan Assay (10:1) cDNA template
11ul 9ul
2x
Total volume 20ul

METHODS
43
The reaction mix was then centrifuged for 1 minute at 1200rpms and the microplate placed
inside an Applied Biosystems 7900HT Fast Real-Time PCR system with the thermal cover
attached. The system was set to determine relative DNA levels (∆∆ct (RQ)); detectors were
added according to the plate setup and samples labelled. Thermal cycling was set as per
Table 6.
Table 6. PCR Thermal cycling settings
Incubation
Enzyme activation
PCR
Step HOLD HOLD CYCLE (40 Cycles)
Denature Anneal/Extend Time 2 min 10 min 15 sec 1 min
Temperature 50 °C 95 °C 95 °C 60 °C
Thermal cycling took approximately 2 hours. Data was then analysed using the accompanying
Applied Biosysetms Sequence Detection System (SDS) software (v2.3).
2.6 Glutamine flux – Mass Spectrometry
In an attempt to characterise the intracellular concentration and flux of glutamine in
proliferating CD4+ T lymphocytes we collaborated with the Department of Medical
Biochemistry at Oslo University Hospital. Mass spectrometry is a method for determining the
composition of a sample; including the mass, chemical and electrical properties of the particles
and molecules that make up the sample62. In a typical mass spectrometry measurement the
sample (be it solid, liquid or gas) is first ionized then forced through an analyser comprising of
electric and magnetic fields which affects the ionised sample’s speed and direction according to
its mass and charge. The ions pass into a detector which identifies and quantifies the analyte
depending on its trajectory and latency.

METHODS
44
Mass spectrometry sample preparation
On the seventh day of the 7 day expansion assay (described earlier under CD4+ T lymphocyte
activation) the expanding CD4+ T lymphocyte population was transferred to two 50ml Falcon
Conical Tubes and centrifuged at 1500RPM for 7 minutes. The supernatant was removed and
discarded and the cell pellets gently resuspended in 10ml of 36.5 °C PBS to wash the cells of the
original cell medium. This step was repeated twice. The cells were then counted using the
TC10 Cell Counter (Biorad) and then, depending on total yield, resuspended in a 13C-glutamine
medium (DM5030; 13C-glutamine 500uM; Glucose 5mM; NaHCO3 3.7g/ml; 0.5% Penicillin-
Streptomycin; 36.5°C) to allow for distribution of 150ul cell medium with approx. 750 000 CD+
lymphocytes into 1.5ml Eppendorf tubes. The tubes were kept in a 36.5 °C water bath to
maintain optimum temperatures. Two holes were pierced in the Eppendorf tube lids. The tubes
were then incubated for 0, 2, 4, 8 and 24 hours at 36.5°C. After incubation the tubes were
centrifuged at high speed (15000RPM) for 10 seconds and the medium removed and saved in
separate Eppendorf tubes. The cell pellet was washed with 300ul PBS then centrifuged again at
15000RPM for 10 seconds. This was repeated two times to remove the labelled glutamine
medium. The cell pellets and the saved medium were then lysed with 450ul -80°C 80% MS-
grade Methanol (Merck), left at room temperature for 10 minutes then centrifuged again at high
speed for 1 minute. The supernatants of both samples were then transferred into fresh 1.5ml
Eppendorf tubes and, along with the cell pellets, snap frozen in a -78°C Ethanol/dry ice solution
and stored in a -80°C freezer for mass spectrometry analysis.
This protocol was also used in an attempt to characterise the flux of glutamine into proliferating
CD4+ T lymphocytes in the presence of the two Glutaminase inhibitors: compound 968 and
BPTES. All parameters were identical. In addition, 0.75ul BPTES /968 (20mM stocks; 100%
DMSO) was added to specific Eppendorf tubes directly before incubation to achieve a final
concentration of 100uM. Samples were incubated once again for 0, 2, 4, 8 & 24 hours at 36.5°C
and then processed for mass spectrometry in the procedure described above.

METHODS
45
2.8 Glutaminase inhibition – protein
The effects of compound 968 and BPTES were also tested on an in vitro Glutaminase enzyme
assay. Figure 16 (below) shows the two-step catabolism of glutamine to α-ketoglutarate and
NADH in the presence of the enzymes Glutaminase (GLS) and glutamate dehydrogenase (GDH).
Using a micro plate reader the appearance of NADH in the second reaction was quantified as a
measurement of Glutaminase activity, alone and in the presence of the inhibitors. The effect of
phosphate on Glutaminase activity was also measured.
Figure 16. Two step reaction to form alpha-ketoglutarate and NADH from glutamine through glutamate. GLS – Glutaminase; GDH – Glutamate Dehydrogenase.
The first assay was performed as per Table 7 (below). All components were prepared and
stored on ice. 5 minutes before assay start they were removed from the ice and allowed to
warm to room temperature.
Table 7. Reaction components.
Reaction mix (2x)
Glutaminase mix (2.5x) NAD (Roche)
4mM
Glutaminase** (100mM, 1mM, 10nM)
GDH*
6 units
TRIS-acetate 50mM L-glutamine 8mM
TRIS-acetate buffer 50mM K2PO4
100mM
* Glutamate Dehydrogenase (Sigma) ** E. coli (Sigma)

RESULTS
46
Five uL of 10% DMSO was added to a 96-well, flat-bottomed, clear microplate followed by 20ul
of Glutaminase mix. Finally, 25ul of Reaction mix was added and the microplate placed in a
Fluorostar OPTIMA microplate reader (BMG Labtech) which had previously been configured
(96-well plate/Greinar BioOne; 50ul well volume; 340-10 Excitation filter; wavelength
adjusted). All tests were performed in triplicates. Blank (50ul TRIS-acetate) and Negative
controls (minus Glutaminase mix) were included. Blank corrected, raw and average data was
exported to Excel. In the second assay the 5ul of 10% DMSO was substituted for 5ul from stock
solutions of BPTES/968 (10% DMSO; 50mM TRIS-Acetate buffer) to achieve final
concentrations of 0.1, 1, 10 & 100uM. No dipotassium phosphate was used in the second assay.
3.0 RESULTS
3.1 Characterisation of Glutaminase isoforms in naive CD4+ T cells
The isoforms of Glutaminase in CD4+ T cells are not well characterized. Therefore, we prepared
western blots of protein extracts prepared from CD4+ T cells (Figure 16). Naïve mature CD4+
lymphocytes were isolated from buffy coats as described under Methods. Cells were lysed,
diluted in an SDS sample buffer and total protein (15ug/lane) separated by SDS-PAGE in a 7.5%
acrylamide gel. Fractionated proteins were transferred to PVDF membranes which were
incubated with antibodies to the three known Glutaminase isoforms: KGA (250-1000:1), GAC
(600:1) and LGA (500:1); in addition to a control, α-tubulin (5000:1). Figure 17 depicts KGA
(73kDa) and to a lesser extent GAC (55kDa), but not LGA (66kDa), are expressed at detectable
levels using this method in CD4+ T lymphocytes.

RESULTS
47
Figure 17. Relative Glutaminase isoenzyme levels in resting mature CD4+ lymphocytes. Lane 1 - α-tubulin (55kDa); Lane 2 - KGA (arrow; 73kDa); Lane 3 - GAC (arrow; 55kDa); Lane 4 – LGA (not visible).
3.3 Characterisation of Glutaminase isoforms in activated CD4+ T cells
Since expression of the KGA and GAC Glutaminase isoforms was evident in naïve CD4+ T
lymphocytes, we next investigated if the same set of Glutaminase isoforms were expressed in
CD4+ T lymphocytes activated through their CD3 and CD28 cell surface markers.
CD4+ T lymphocytes were activated as described under Methods. Figure 18 depicts that within
minutes of the addition of the anti-CD3 and anti-CD28 coated beads, CD4+ lymphocytes begin to
surround individual beads (photos C & D). A successful stimulation was evident from the
yellow medium and “budding” of the activated T cells; and the relative homogenous cell
dispersion & cell morphology, and pink medium of the non-stimulated wells (A & B). At 72
hours the activated cells have conglomerated around beads and swelled in size (E & F).

RESULTS
48
Figure 18. Images of naïve and activated CD4+T lymphocytes in cell culture. A/B: Naive CD4+ lymphocytes (4x)/(40x)- the arrow on the left indicates a single CD4+ T lymphocyte; C/D: CD4+ lymphocytes stimulated with Dynal beads (dark-arrow) after 2 min incubation(4x)/(40x) – the arrow indicates a single Dynal bead; E/F: Stimulated CD4+ lymphocytes after 72 hours incubation time (4x)/(40x).
To confirm that the budding and morphological changes of the CD4+ cells seen in the above
photos were a result of CD3/CD28 activation a solution containing a radioactive nucleoside, 3H-
thymidine, was added to the cell medium after 48 hours. The rate of 3H-thymidine
incorporation into DNA of the CD4+ T cells was then measured after 24 hours using a
scintillation counter.

RESULTS
49
Figure 19. 3H-thymidine nucleoside incorporation into newly synthesized DNA in stimulated and non-stimulated CD4+ lymphocytes. Radioactivity measured in counts per minute (cpm).
Figure 19 demonstrates that after addition of the CD3/CD28 activation beads the rate of 3H-
thymidine uptake and incorporation into newly synthesized DNA over the 24 hours increased
from approximately 600 (+/- 60) cpm to 125,000 (+/-10,000) cpm confirming successful
activation.
To determine the relative expression of the three Glutaminase isoenzymes in CD3/CD28
activated CD4+ T cells we again prepared samples and separated total protein in the manner
described previously (and in more detail in Methods). Figure 20 demonstrates that after
CD3/CD28 activation there appears to be a considerable drop in the relative level of the KGA
Glutaminase isoform (73kDa) and a concurrent increase in the level of the GAC isoform (55kDa).
This was accompanied by the appearance of non-specific banding on both the KGA blot (approx.
48kDa) and GAC blot (approx. 42kDa) that were not present in the non-activated blots. Once
again the LGA isoform was not detected.

RESULTS
50
Figure 20. Relative Glutaminase isoenzyme levels in CD3/CD28-activated CD4+ lymphocytes. Lane 1 - α-tubulin (55kDa); Lane 2 - KGA (arrow; 73kDa); Lane 3 - GAC (arrow; 55kDa); Lane 4 – LGA (not visible).
In an attempt to understand the dynamics of this change in relative isoenzymes expression
between KGA and GAC we set up a time course assay that could examine the relative protein
levels in 12 hour intervals for a total of 72 hours after activation. The procedure used was
identical to the one described earlier. This demonstrated (as illustrated in Figure 21) that KGA
levels drop rapidly in the first 12 hours after CD4+ T lymphocyte activation. Concurrently, there
is a slightly delayed increase in the relative concentration of the GAC isoform which reversed
after 24 hours. This decrease in GAC concentration was not consistent with the previous blot
where the presence of an intense band indicated high GAC levels at 72 hours.

RESULTS
51
Figure 21. Relative Glutaminase isoenzyme concentration at rest (0 hours) and at 12 hour intervals after CD3/CD28 activation (total 72 hours). Upper box - KGA (73kDa); Middle box – GAC (55kDa); Lower box - α-tubulin (55kDa).
3.3 qPCR – Gene Expression
Our results showed elevated levels of the GAC Glutaminase isoform and a concurrent decrease
in the KGA isoform in CD4+ t lymphocytes activated via their CD3 and CD28 surface markers.
Next we wanted to determine whether this dynamic would be evident at the genetic level.
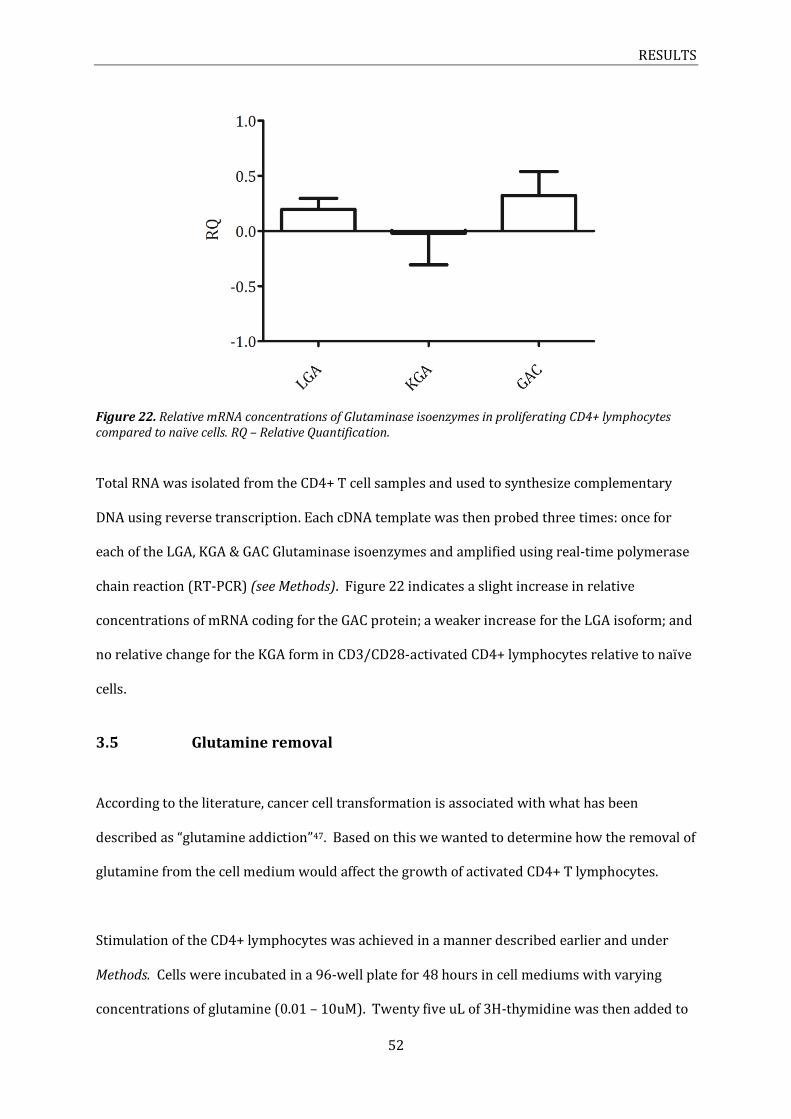
RESULTS
52
Figure 22. Relative mRNA concentrations of Glutaminase isoenzymes in proliferating CD4+ lymphocytes compared to naïve cells. RQ – Relative Quantification.
Total RNA was isolated from the CD4+ T cell samples and used to synthesize complementary
DNA using reverse transcription. Each cDNA template was then probed three times: once for
each of the LGA, KGA & GAC Glutaminase isoenzymes and amplified using real-time polymerase
chain reaction (RT-PCR) (see Methods). Figure 22 indicates a slight increase in relative
concentrations of mRNA coding for the GAC protein; a weaker increase for the LGA isoform; and
no relative change for the KGA form in CD3/CD28-activated CD4+ lymphocytes relative to naïve
cells.
3.5 Glutamine removal
According to the literature, cancer cell transformation is associated with what has been
described as “glutamine addiction”47. Based on this we wanted to determine how the removal of
glutamine from the cell medium would affect the growth of activated CD4+ T lymphocytes.
Stimulation of the CD4+ lymphocytes was achieved in a manner described earlier and under
Methods. Cells were incubated in a 96-well plate for 48 hours in cell mediums with varying
concentrations of glutamine (0.01 – 10uM). Twenty five uL of 3H-thymidine was then added to

RESULTS
53
each well and allowed to incubate for a further 24 hours. 3H-thymidine incorporation was then
measured using a scintillation counter to determine the rate of growth.
Results showed that reducing the concentration of glutamine in the cell growth medium below
1mM had a profound impact on CD4+ T cell proliferation, despite the availability of glucose (see
Figure 23). Proliferation was shown to be stable in glutamine concentrations higher than 1mM,
with a subsequent sharp decline between 1 and 0.1mM. It appeared that at glutamine
concentrations below 0.1uM cells proliferation was almost completely arrested.
Figure 23. CD3/CD28-activated CD4+ T lymphocyte 3H-thymidine incorporation in growth medium with
limiting glutamine concentrations. Radioactivity measured in counts per minute (cpm).
3.6 Glutaminase inhibition – CD4+ T Lymphocytes
Our results demonstrated that activated CD4+ lymphocytes are dependent on glutamine to
proliferate. Next we wanted to determine if blocking glutamine metabolism would have a
similar effect on activated CD4+ T lymphocytes.
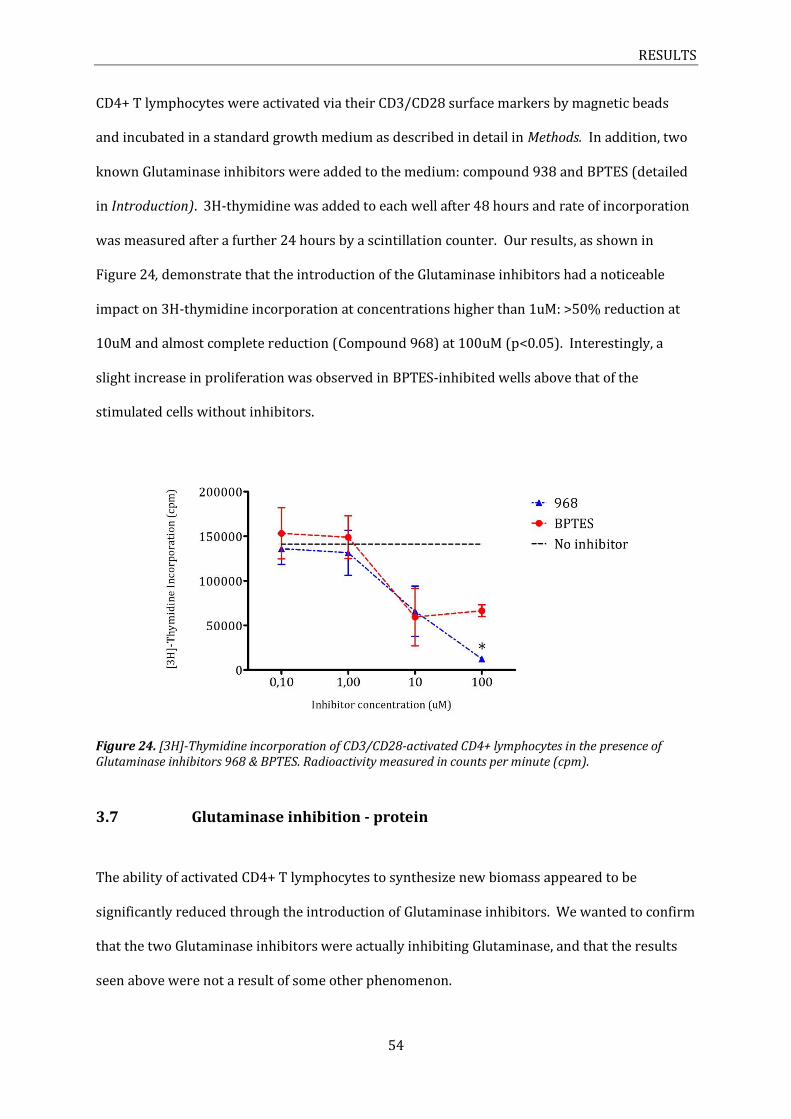
RESULTS
54
CD4+ T lymphocytes were activated via their CD3/CD28 surface markers by magnetic beads
and incubated in a standard growth medium as described in detail in Methods. In addition, two
known Glutaminase inhibitors were added to the medium: compound 938 and BPTES (detailed
in Introduction). 3H-thymidine was added to each well after 48 hours and rate of incorporation
was measured after a further 24 hours by a scintillation counter. Our results, as shown in
Figure 24, demonstrate that the introduction of the Glutaminase inhibitors had a noticeable
impact on 3H-thymidine incorporation at concentrations higher than 1uM: >50% reduction at
10uM and almost complete reduction (Compound 968) at 100uM (p<0.05). Interestingly, a
slight increase in proliferation was observed in BPTES-inhibited wells above that of the
stimulated cells without inhibitors.
Figure 24. [3H]-Thymidine incorporation of CD3/CD28-activated CD4+ lymphocytes in the presence of Glutaminase inhibitors 968 & BPTES. Radioactivity measured in counts per minute (cpm).
3.7 Glutaminase inhibition - protein
The ability of activated CD4+ T lymphocytes to synthesize new biomass appeared to be
significantly reduced through the introduction of Glutaminase inhibitors. We wanted to confirm
that the two Glutaminase inhibitors were actually inhibiting Glutaminase, and that the results
seen above were not a result of some other phenomenon.
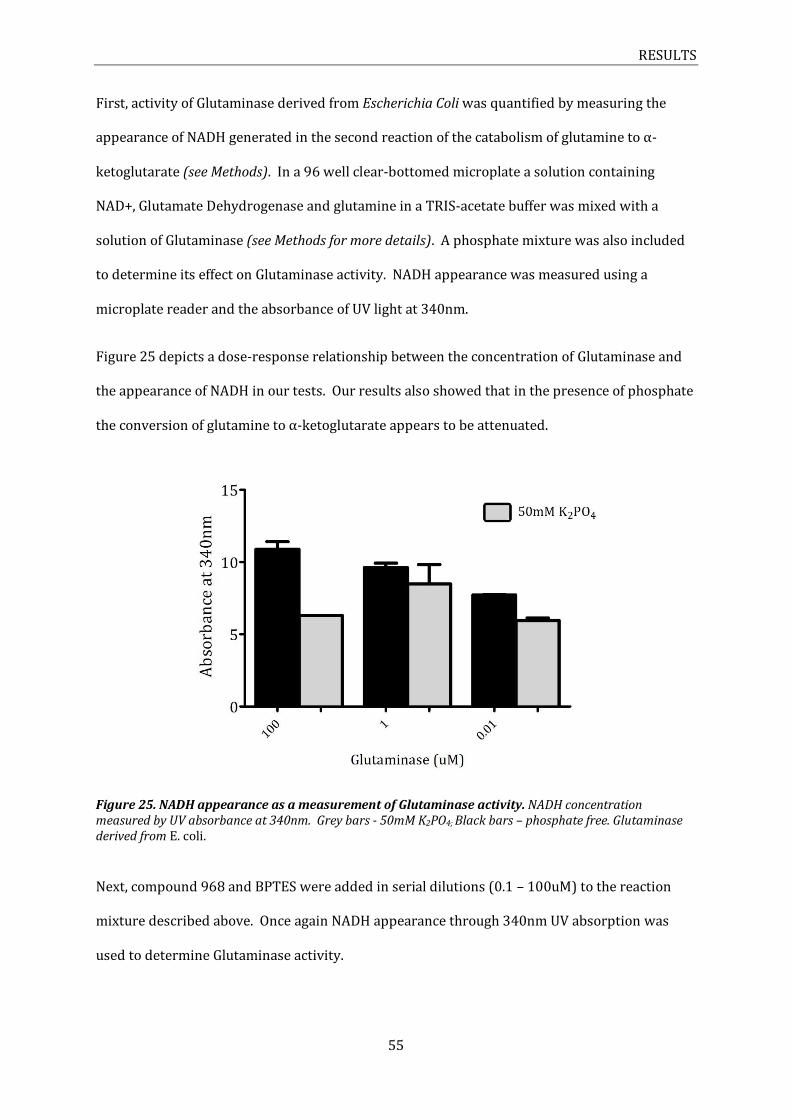
RESULTS
55
First, activity of Glutaminase derived from Escherichia Coli was quantified by measuring the
appearance of NADH generated in the second reaction of the catabolism of glutamine to α-
ketoglutarate (see Methods). In a 96 well clear-bottomed microplate a solution containing
NAD+, Glutamate Dehydrogenase and glutamine in a TRIS-acetate buffer was mixed with a
solution of Glutaminase (see Methods for more details). A phosphate mixture was also included
to determine its effect on Glutaminase activity. NADH appearance was measured using a
microplate reader and the absorbance of UV light at 340nm.
Figure 25 depicts a dose-response relationship between the concentration of Glutaminase and
the appearance of NADH in our tests. Our results also showed that in the presence of phosphate
the conversion of glutamine to α-ketoglutarate appears to be attenuated.
Figure 25. NADH appearance as a measurement of Glutaminase activity. NADH concentration measured by UV absorbance at 340nm. Grey bars - 50mM K2PO4; Black bars – phosphate free. Glutaminase derived from E. coli.
Next, compound 968 and BPTES were added in serial dilutions (0.1 – 100uM) to the reaction
mixture described above. Once again NADH appearance through 340nm UV absorption was
used to determine Glutaminase activity.

RESULTS
56
Figure 26. NADH appearance as a measurement of Glutaminase activity in the presence of inhibitors: 968 and BPTES. NADH concentration measured by UV absorbance at 340nm. Black bar – no inhibitor; light grey – BPTES; dark grey – 968. Glutaminase derived from E. coli.
Together these experiments demonstrated that Glutaminase activity is powerfully inhibited by
both inhibitors in vitro at all concentrations by up to 90% (Figure 26).
3.4 Glutamine flux – Mass Spectrometry
Based on the results depicted in figures 22-26, we suggest that T cell proliferation induced
through the TCR/CD3-CD28 complex requires the presence of glutamine. Therefore, we wanted
to characterise the intracellular concentration, and flux of extracellular added, glutamine in
proliferating CD4+ T lymphocytes with and without the use of the two Glutaminase inhibitors.
Proliferating CD4+ T cells were generated through a 7-day extended version of the CD4+ T cell
activation protocol explained in detail in Methods. After 7 days the cells were washed free of the
growth medium and then incubated for up to 24 hours in a 500uM 13C-glutamine-labelled cell
medium. The medium and the cell pellet where then lysed with 80% methanol and then
analysed using mass spectrometry to determine 13C-glutamine concentrations. Figure 27 clearly
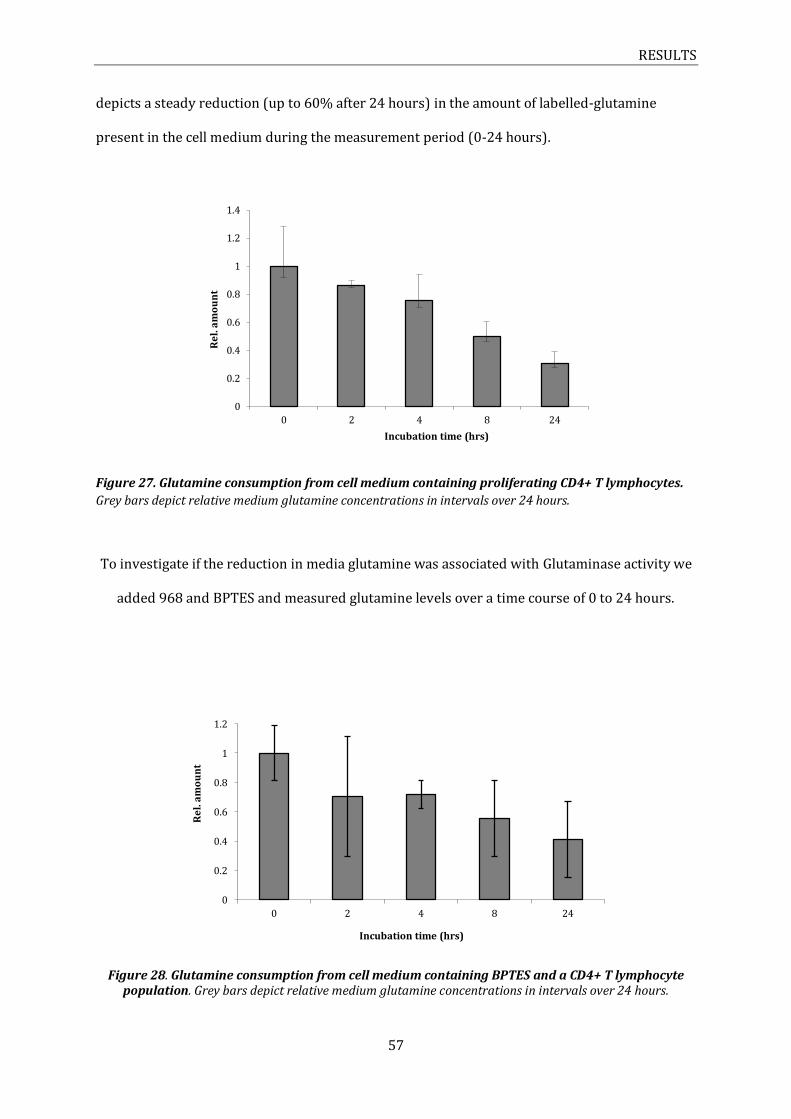
RESULTS
57
depicts a steady reduction (up to 60% after 24 hours) in the amount of labelled-glutamine
present in the cell medium during the measurement period (0-24 hours).
Figure 27. Glutamine consumption from cell medium containing proliferating CD4+ T lymphocytes.
Grey bars depict relative medium glutamine concentrations in intervals over 24 hours.
To investigate if the reduction in media glutamine was associated with Glutaminase activity we
added 968 and BPTES and measured glutamine levels over a time course of 0 to 24 hours.
Figure 28. Glutamine consumption from cell medium containing BPTES and a CD4+ T lymphocyte
population. Grey bars depict relative medium glutamine concentrations in intervals over 24 hours.
0
0.2
0.4
0.6
0.8
1
1.2
1.4
0 2 4 8 24
Re
l. a
mo
un
t
Incubation time (hrs)
0
0.2
0.4
0.6
0.8
1
1.2
0 2 4 8 24
Re
l. a
mo
un
t
Incubation time (hrs)

RESULTS
58
Figure 29. Glutamine consumption from cell medium containing 968 and a CD4+ T lymphocyte
population. Grey bars depict relative medium glutamine concentrations in intervals over 24 hours.
This demonstrated that glutamine reduction in the media was comparably reduced regardless
of the presence of inhibitors. Figures 28 and 29 (above) show similar patterns of glutamine
reduction from the cell medium.
To investigate if glutamine was taken up by the T cells we measured relative intracellular
concentrations of glutamine up to 24 hours in the presence and absence of the glutamine
inhibitors BPTES and 968 (see figures 30, 31 and 32).
Figure 30. Relative intracellular concentrations of glutamine in proliferating CD4+ lymphocytes in
the presence of the Glutaminase inhibitor, BPTES. Grey bars depict relative medium glutamine
concentrations in intervals over 24 hours.
0
0.2
0.4
0.6
0.8
1
1.2
1.4
0 2 4 8 24
Re
l. a
mo
un
t
Incubation time (hrs)
0
2
4
6
8
10
12
14
16
18
0 2 4 8 24
Re
l. A
mo
un
t
Incubation time (hrs)
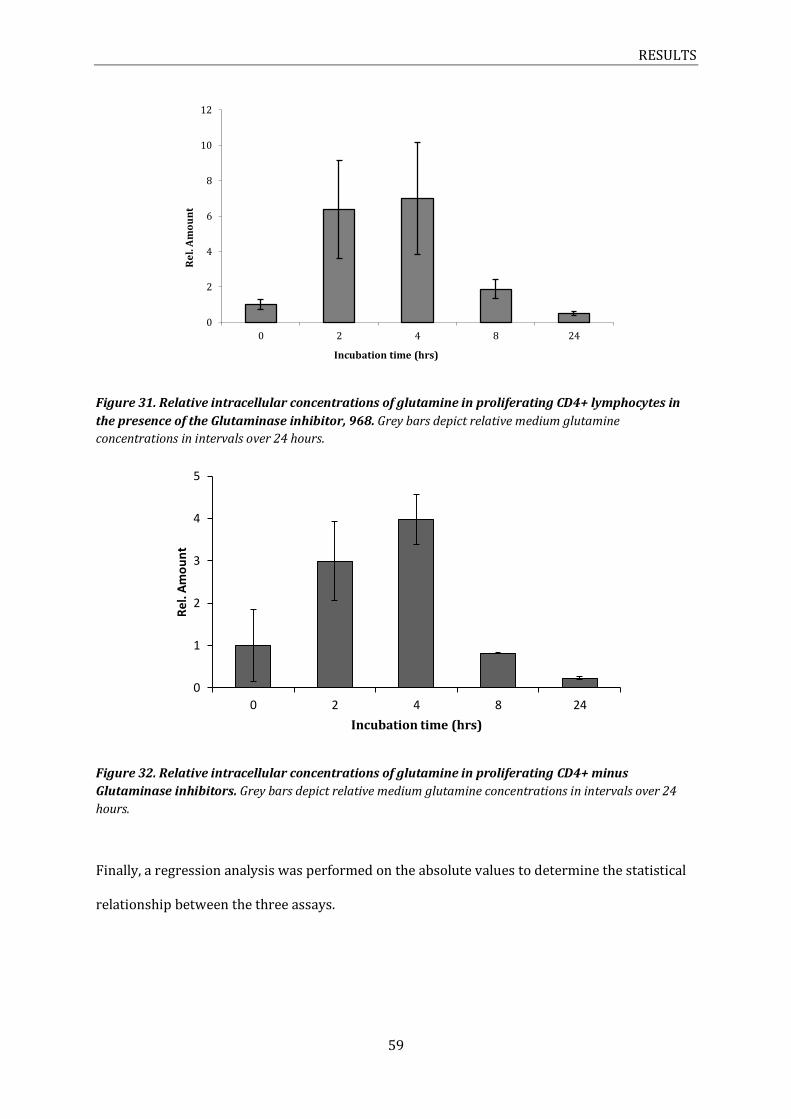
RESULTS
59
Figure 31. Relative intracellular concentrations of glutamine in proliferating CD4+ lymphocytes in
the presence of the Glutaminase inhibitor, 968. Grey bars depict relative medium glutamine
concentrations in intervals over 24 hours.
Figure 32. Relative intracellular concentrations of glutamine in proliferating CD4+ minus
Glutaminase inhibitors. Grey bars depict relative medium glutamine concentrations in intervals over 24
hours.
Finally, a regression analysis was performed on the absolute values to determine the statistical
relationship between the three assays.
0
2
4
6
8
10
12
0 2 4 8 24
Re
l. A
mo
un
t
Incubation time (hrs)
0
1
2
3
4
5
0 2 4 8 24
Rel
. Am
ou
nt
Incubation time (hrs)
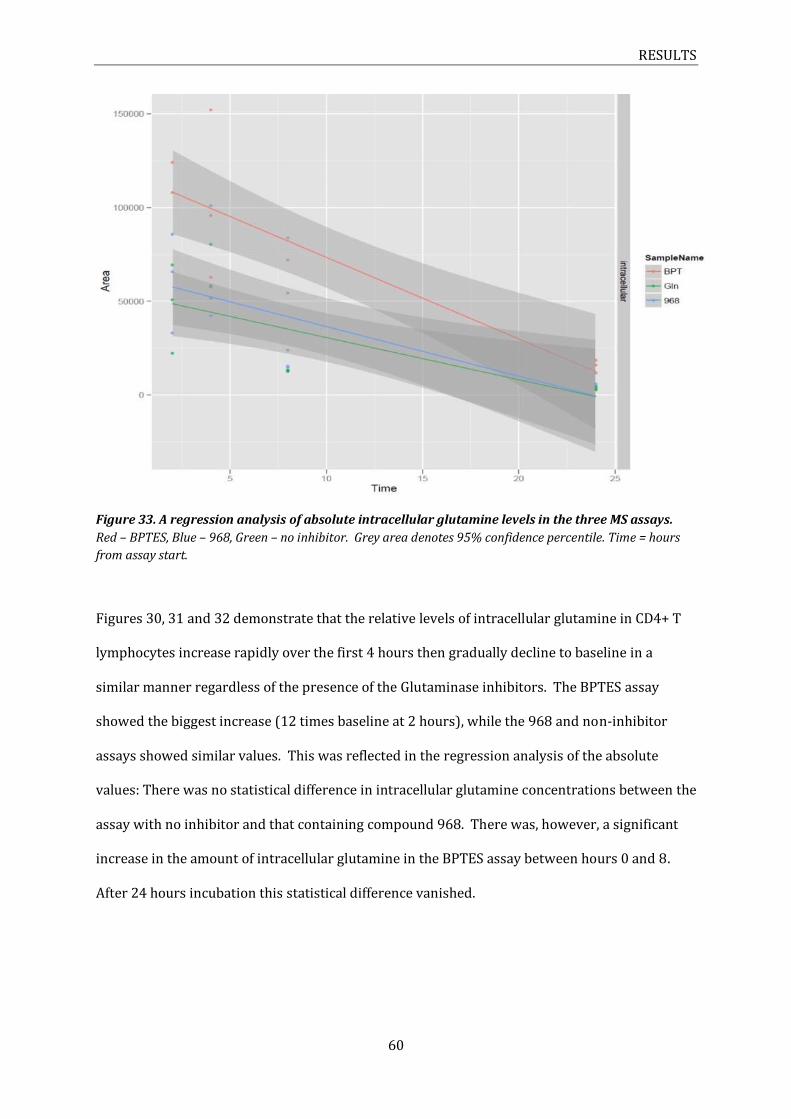
RESULTS
60
Figure 33. A regression analysis of absolute intracellular glutamine levels in the three MS assays.
Red – BPTES, Blue – 968, Green – no inhibitor. Grey area denotes 95% confidence percentile. Time = hours
from assay start.
Figures 30, 31 and 32 demonstrate that the relative levels of intracellular glutamine in CD4+ T
lymphocytes increase rapidly over the first 4 hours then gradually decline to baseline in a
similar manner regardless of the presence of the Glutaminase inhibitors. The BPTES assay
showed the biggest increase (12 times baseline at 2 hours), while the 968 and non-inhibitor
assays showed similar values. This was reflected in the regression analysis of the absolute
values: There was no statistical difference in intracellular glutamine concentrations between the
assay with no inhibitor and that containing compound 968. There was, however, a significant
increase in the amount of intracellular glutamine in the BPTES assay between hours 0 and 8.
After 24 hours incubation this statistical difference vanished.
DISCUSSION
61
4.0 DISCUSSION
Cancer cells exhibit up-regulated glycolytic activity and rapid turnover of biosynthetic
precursors compared with somatic cells. This proliferative phenotype is common between
many different proliferating cells. This relationship allowed us to hypothesize whether the
“glutamine addiction” seen in cancer cells was applicable to proliferating human lymphocytes,
and if, ultimately, we could disrupt glutamine metabolism and attenuate proliferation.
Glutaminase
The up-regulation of the GAC Glutaminase isoform in activated CD4+ lymphocytes seen in our
Western Blot analyses is consistent with similar studies on colorectal tumours63, gliomas64,
central nervous system tumours65 and breast tumours66. Also compatible is the inconsistency
between the increase in Glutaminase protein and expression of the gls gene60;63;64. Our results
also hinted at a slight increase in mRNA levels of GAC, but the data was not significant and
exhibited wide variance as to be unreliable. However, previous studies have demonstrated
elevated GAC mRNA levels in colorectal carcinomas63, breast tumours66 and glyomas64, with
concurrent increases in GAC protein concentration. However, a previous study by Szeliga, et al.
demonstrated a 20 times increase in the level of LGA mRNA in neoplastic cells with no increase
in protein concentration67. This may suggest that there is poor correlation between mRNA and
protein for GLS, at least for certain isoforms.
The transcription factor myc up-regulates glutamine transporter synthesis and expression,
increases mitochondrial glutaminolysis, and sensitizes many proliferating cells to glutamine
withdrawal35;68;69. Interestingly, up-regulation of myc also corresponds to increased GAC
expression in B lymphoma and prostate cancer cells49. In addition, GAC was the only
Glutaminase isoform located in the mitochondria of lung, breast and prostate cancer cells60.
Combined, this suggests that the expression of the three Glutaminase isoforms may not be

DISCUSSION
62
under direct genetic control, but that myc, and perhaps other, undiscovered pathways, may,
indirectly, control their expression and activity through post-translational modifications. The
presence of sub-bands in our western blots taken from activated T lymphocytes may be
evidence of this. It also suggests that the up-regulated GAC isoform may offer neoplastic cells a
selective advantage under proliferation due to its exclusive location in the mitochondria60.
The kinetics of the three Glutaminase isoforms, particularly GAC, in the presence of phosphate
may also hint at another selective advantage for T lymphocytes under proliferation.
Unfortunately we were unable to test the human Glutaminase isoforms. However, our kinetic
data demonstrated that in the presence of 50mM of phosphate the activity of Glutaminase
derived from E. coli was reduced. This was consistent with other experiments70. A comparison
with the mammalian Glutaminase isoforms illustrates the widely differing phosphate-
dependent characteristics that exist between species, and also between isoforms of the same
species. The mammalian GAC isoform, for example, is massively up regulated (40x) in solutions
containing 50mM phosphate whilst the LGA variant is virtually unresponsive60. This suggests
that phosphate is required for optimal catalytic efficiency in the human GAC Glutaminase
isoform, which our results indicate is the dominant isoform in proliferating T cells. We were
unable to find any data regarding mitochondrial phosphate concentrations in proliferating
lymphocytes. To what extent an increase in mitochondrial phosphate concentration contributes
to the activation/up-regulation of GAC Glutaminase seen in proliferating T cells remains to be
seen.
Glutamine dependence
A dependence of activated T cells on sufficient extracellular glutamine was witnessed in our 3H-
thymidine incorporation assays. Initially, the cells that were completely deprived of glutamine
exhibited the same proliferative rate as those with plentiful glutamine. This led us to speculate
at whether the glutamine concentration or other crucial factors in the fetal bovine serum (FBS)
used in the cell medium was negating any effects of the glutamine removal. Once we had

DISCUSSION
63
dialyzed the FBS and removed all small molecules below 3500 kDa, including glutamine, we
immediately got results. We found that at glutamine concentrations lower than 0.5mM the
proliferative ability of CD4+ lymphocytes was reduced by approx. 50%; and at 0.1mM, almost
100%. This dependency was backed up by our spectral analyses of cell media containing
proliferating T lymphocytes. Over a 24 hour period the extracellular glutamine concentration
was reduced by over 60%. This rapid glutamine consumption can be seen in many cancer cells,
with certain tumours consuming so much glutamine they sink plasma glutamine levels67;69.
Together this suggests that proliferating CD4+ T lymphocytes, as with many other highly
proliferative cells, are absolutely dependent on adequate extracellular glutamine. Taken one
step further it may be suggested that the ability of the immune system as a whole is dependent
on glutamine. If this is the case, it may have significant implications from a clinical perspective
when we consider how best to treat diseases that are known to deplete plasma glutamine levels
including chronic inflammatory diseases, sepsis, severe burns and malnutrition71.
We have shown that the expression of a highly catalytic glutamine isoform is up-regulated in
proliferating CD4+ T cells. In addition, elevated glutamine activity features in many different
tumour types57;59;67. When we consider glutamine’s role as a precursor in the metabolic and
biosynthetic requirements of these cells, it is perhaps of little surprise that intracellular
glutamine concentrations are low to non-existent72-74. This suggests that glutamine is
immediately catabolised once it enters the proliferating cell. However, our spectral analyses
examining the intracellular glutamine concentration of proliferating CD4+ T cells did not reflect
this. First, the small concentration of intracellular glutamine witnessed at 0 hours may be a
result of the small delay in freezing/lysing the samples, therefore giving the cells a small
window of opportunity to take up glutamine from the media. Despite this, a large increase in
intracellular glutamine concentration peaked at four hours. An explanation for this could, in
part, be explained by the 30-45 minute washing and distribution process performed before the
cells are suspended in the labelled-glutamine medium. The washing medium is free of

DISCUSSION
64
glutamine (and other amino acids). Glutamine depletion is known to down-regulate glutamine
transporters75 – this may have had the effect of dampening the glutaminolytic machinery inside
the cell. Hence, after glutamine addition and when the transporters up-regulated again,
glutamine catabolism may have been delayed, thus the temporary increase in glutamine
concentration. However, the same washing procedure had no effect on the consumption of
glutamine from the cell medium seen in the other assays. It also seems unlikely given the slow
nature (~12hrs) of the depletory effect75. Another consideration is the lack of IL-2 from our
washing medium. IL-2 depletion has been shown to have an almost instant effect on nutrient
uptake and metabolism in proliferating T lymphocytes76, but once again this effect was not
witnessed in the glutamine uptake experiments with the same procedures. If IL-2 depletion
affected only the catabolism of glutamine and not the transporters (or there was a delay in its
effect on the transporters) then this could explain the temporary peak in intracellular
glutamine. Moreover, we saw a steady reduction of intracellular glutamine concentration after
four hours incubation. Taken together with the steady uptake of glutamine from the cell
medium, this suggests that there was an increase in glutamine catabolism after four hours. It is
clear that our protocol would benefit from a more careful analysis of the signalling effects of IL-
2 and how glutamine depletion affects the cells prior to assay start.
Glutaminase inhibitors
Recent research has highlighted Glutaminase as an exciting therapeutic target in tumours.
Specifically, two allosteric Glutaminase inhibitors, compound 968 and BPTES have recently
been used to slow the growth of glioma cells77 and human breast tumours57.
Glutamine intracellular concentration and flux
We exposed proliferating CD4+ T cells to both inhibitors and used Mass Spectrometry to analyse
the glutamine flux from the cell medium, in addition to the intracellular glutamine
concentration, over a 24 hour period. Our findings suggest that glutamine inhibition has little
DISCUSSION
65
effect on glutamine uptake in proliferating CD4+ T lymphocytes with almost identical clearance
rates between the non-inhibited and inhibited cells. The pattern of glutamine appearance in the
cells (increasing over the initial 2-4 hours and then sinking to baseline) between the three
assays was very similar. Inhibitor/enzyme association is not instantaneous: the inhibitor must
infiltrate the cell first and then bind to the enzyme. Our inhibitors were added to the cells at 0
hours and had no pre-incubation period. The observed delay in the increase of glutamine inside
the cell may be a result of this. It is reasonable to suggest that pre-incubating the cells with the
inhibitors could result in a much more rapid increase in intracellular glutamine. Interestingly,
the intracellular glutamine concentration of the cells exposed to BPTES between 0-4 hours was
significantly higher (2x) than the control cells and those exposed to 968. This suggests that the
inhibitory effect of BPTES was greater than that of 968 - which appeared to have little effect.
Why this significance gradually disappears over the 24 hours, however, is unclear. Indeed, the
steady decline in glutamine concentration from both inhibitor assays is puzzling. Given the
steady uptake of glutamine from the cells it may simply be of kinetic nature – the increasing
glutamine concentration out-competes 968/BPTES for the binding seat on Glutaminase.
Another interesting proposition is that of an alternate metabolic pathway for glutamine.
Enzyme inhibition
We exposed recombinant Glutaminase derived from E. Coli to both inhibitors and measured
Glutaminase activity by the appearance of NADH. Due to the issues with our protocol detailed
earlier, we were unable to obtain any convincing data. Our inability to obtain a dose-response
relationship may, in part, be due to our references for inhibitor concentrations obtained from
the literature (IC50 0.14-19uM78,57). Given the structural differences between mammalian
Glutaminase and Glutaminase from E. Coli a more thorough investigation into ideal inhibitor
concentrations would be prudent. Regardless, we did see reduced catalytic activity of the E.
Coli Glutaminase exposed to both inhibitors at all concentrations used (0.1 – 100uM). This and
other kinetic analyses of recombinant human Glutaminase exposed to BPTES58;78;79 or 96857;60

DISCUSSION
66
suggest that the reduced proliferation observed in tumour cells in the presence of these
inhibitors is a result of Glutaminase inhibition.
CD4+ T lymphocyte inhibition
With this in mind we exposed CD3/CD28-activated CD4+ T lymphocytes to varying
concentrations (0.1uM to 100uM) of both 968 and BPTES. At concentrations higher than 10uM,
both inhibitors had a detrimental effect on cell proliferation. This is most likely due to
conformational changes to mitochondrial Glutaminase and subsequent reduction in
glutaminolysis. This reinforces the notion of “glutamine addiction” as a phenomenon common
to the proliferative phenotype and to our knowledge is the first time a Glutaminase inhibitor has
been successfully used to blunt lymphocyte proliferation.
CONCLUSION
67
5.0 CONCLUSION
Over fifty years ago Otto Warburg observed that cancer cells, unlike somatic cells, fermented
glucose in the presence of available oxygen. Recently, this seminal discovery has led to the
identification of a particular phenotype common to many proliferating cells, including
mammalian lymphocytes. A key factor in this phenotype is the reliance on glutamine
catabolism to provide anaplerotic carbon to the TCA cycle, and the generation of the reducing
agent, NADPH.
This report has identified a specific Glutaminase enzyme, GAC, as up-regulated in proliferating
CD4+ T lymphocytes. We also demonstrated the ability of two Glutaminase inhibitors,
compound “968” and BPTES, to dampen this proliferation.
Unwanted lymphocyte proliferation is a hallmark of autoimmune diseases: a failure of an
organism to recognize its own tissue and the subsequent immune response mounted against
this tissue. Autoimmune diseases including Coeliac disease; Diabetes Mellitus (Type 1); Graves’,
Addison’s & Sjøgren’s disease; and Rheumatoid Arthritis (RA) are the second highest cause of
chronic illness, and the top cause of morbidity in women, in the United States80. RA is
particularly debilitating and affects 0.5-1.0% (700 million) of the world’s population81.
Treatments for these diseases are often very non-specific, broad inhibitors of cell proliferation
which are associated with severe side-effects that greatly diminish recipients’ quality of life. The
identification of Glutaminase inhibitors that dampen unwanted lymphocyte proliferation
represents a first step in the development of target-specific drugs that could potentially improve
the quality of life for sufferers of autoimmune diseases throughout the world.

FUTURE PERSPECTIVES
68
FUTURE PERSPECTIVES
The use of siRNA to target both gls and gls2 genes, in addition to myc, would likely provide
greater insight into how the genetic machinery regulates the expression of the Glutaminase
isoforms in naïve and proliferating CD4+ lymphocytes. Similarly, analyses of the changes in the
myc protein levels would also be of interest.
Sub-cellular localisation of the specific Glutaminase enzymes would confirm whether GAC’s
exclusivity found in certain cancer cells was applicable to T lymphocytes. It would also be
interesting to know if intracellular phosphate concentrations change upon
activation/proliferation, especially in the mitochondria.
Finally, using mass spectrometry to determine the fraction of glutamine-derived carbon that
was converted to CO2, lactate, alanine or citrate would provide a greater appreciation of
glutamine’s role in both naïve and proliferating CD4+ T lymphocytes.

REFERENCES
69
Reference List
1. Abul K.Abbas and Andrew H.Lichtman: Basic Immunology: Functions and disorders of the immune system. Saunders Elsevier, 2006.
2. Janeway CA: Immunobiology: The immune system in health and disease. Garland Science Publishing, 2005.
3. Rod R.Seeley, Trent D.Stephens, and Philip Tate: Anatomy and Physiology. McGraw Hill, 2006.
4. Pua HH and He YW: Autophagy and lymphocyte homeostasis. Curr Top Microbiol Immunol 335:85-105, 2009.
5. TR Mosmann and S Sad: The expanding universe of T-cell subsets: Th1, Th2 and more. Immunology today 17:138-146, 1996.
6. Milstein,O., Hagin,D., Lask,A., Reich-Zeliger,S., and Shezan E: CTLs respond with activation and granule secretion when serving target for T cell recognition. Blood 117:1042-1052, 2011.
7. T R Mosmann and R L Coffman: TH1 and TH2 Cells: Different Patterns of Lymphokine Secretion Lead to Different Functional Properties. Annual Review of Immunology 7:173, 1989.
8. Image retrieved April 14 2013, from: http://commons.wikimedia.org/wiki/File:Lymphocyte_activation-es.png.
9. Moore,R.D. and Chaisson,R.E.: Natural history of HIV infection in the era of combination antiretroviral therapy. Aids 13:1933-1942, 1999.
10. Wang,R. and Green,D.R.: Metabolic checkpoints in activated T cells. Nat.Immunol. 13:907-915, 2012.
11. J Banchereau and RM Steinman : "Dendritic cells and the control of immunity. Nature 1998.
12. Image retrieved 11 March 2013, from: http://bio1152.nicerweb.com/Locked/media/ch43/mhc.html.
13. S Chung and J.Henry Fraser: Regulation of T-cell antigen receptor (TCR) alpha-chain
expression by TCR beta-chain transcripts. Proc.Natl.Acad.Sci.U.S.A 92: 1995.
14. Alegre,M., Frauwirth,KA., and Thompson,CB.: T-cell regulation by CD28 and CTLA-4. Nat Rev Immunol 1:220-228, 2001.
15. J.Henry Fraser, Mercedes Rincón, Kathy D.McCoy, and Graham Le Gros: CTLA4 ligation attenuates AP-1, NFAT and NF-B activity in activated T cells. European journal of immunology 29:838-844, 1999.
16. M,K.D. and Le Gros,G.: The role of CTLA-4 in the regulation of T cell immune responses. Immunol Cell Biol. 77:1-10, 1999.

REFERENCES
70
17. Jones RG and Thompson CB: Revving the engine: signal transduction fuels T cell activation. Immunity. 27:173-178, 2007.
18. Eric P.Widmaier, Hershel Raff, and Kevin T.Strang: Vander's Human PHysiology: The mechanisms of body function. McGraw-Hill, 2006.
19. Keith Frayn: Metabolic Regulation: A Human Perspective. Blackwell Science Ltd, 2003.
20. Newsholme,P., Procopio,J., Lima,M.M., Pithon-Curi,T.C., and Curi,R.: Glutamine and glutamate--their central role in cell metabolism and function. Cell Biochem.Funct. 21:1-9, 2003.
21. Image retrieved 12 March 2013, from: http://www.ask4biology.com/biochemistry/respiration-atp.
22. Vazquez,A., Liu,J., Zhou,Y., and Oltvai,Z.N.: Catabolic efficiency of aerobic glycolysis: the Warburg effect revisited. BMC.Syst.Biol. 4:58, 2010.
23. Image retrieved 15 March 2013, from: http://users.fmrib.ox.ac.uk/~stuart/thesis/chapter_3/section3_3.html).
24. Deberardinis,R.J., Lum,J.J., Hatzivassiliou,G., and Thompson,C.B.: The biology of cancer: metabolic reprogramming fuels cell growth and proliferation. Cell Metab 7:11-20, 2008.
25. Bental M and Deutsch C: Metabolic changes in activated T cells: an NMR study ofhuman peripheral blood lymphocytes. Magn Reson Med 29:317-326, 1993.
26. Wofford JA, Weiman HL, Jacobs SR, and Zhao Y: IL-7 promotes Glut1 trafficking and glucose uptake via STAT5-mediated activation of Akt to support T-cell survival. Blood 111:2101-2111, 2008.
27. Rathmell JC, Vander Heiden MG, Harris MH, Frauwirth KA, and Thompson CB: In the absence of extrinsic signals, nutrient utilization by lymphocytes is insufficient to maintain either cell size or viability. Mol Cell 6:683-692, 2000.
28. Vander Heiden,M.G., Cantley,L.C., and Thompson,C.B.: Understanding the Warburg effect: the metabolic requirements of cell proliferation. Science 324:1029-1033, 2009.
29. Altman,B.J. and Dang,C.V.: Normal and cancer cell metabolism: lymphocytes and lymphoma. FEBS J. 279:2598-2609, 2012.
30. Carr,E.L., Kelman,A., Wu,G.S., Gopaul,R., Senkevitch,E., Aghvanyan,A., Turay,A.M., and Frauwirth,K.A.: Glutamine uptake and metabolism are coordinately regulated by ERK/MAPK during T lymphocyte activation. J.Immunol. 185:1037-1044, 2010.
31. Wang,R. and Green,D.R.: The immune diet: meeting the metabolic demands of lymphocyte activation. F1000.Biol.Rep. 4:9, 2012.
32. Hume,D.A., Radik,J.L., Ferber,E., and Weidemann,M.J.: Aerobic glycolysis and lymphocyte transformation. Biochem.J. 174:703-709, 1978.
33. Wang,R. and Green,D.R.: Metabolic reprogramming and metabolic dependency in T cells. Immunol.Rev. 249:14-26, 2012.

REFERENCES
71
34. Frauwirth,K.A. and Thompson,C.B.: Regulation of T lymphocyte metabolism. J.Immunol. 172:4661-4665, 2004.
35. Dang,C.V.: MYC on the path to cancer. Cell 149:22-35, 2012.
36. Moncada,S., Higgs,E.A., and Colombo,S.L.: Fulfilling the metabolic requirements for cell proliferation. Biochem.J. 446:1-7, 2012.
37. Yuneva,M.: Finding an "Achilles' heel" of cancer: the role of glucose and glutamine metabolism in the survival of transformed cells. Cell Cycle 7:2083-2089, 2008.
38. Winder WW and Hardi DG: AMP-activated protein kinase, a metabolic master switch: possible roles in type 2 diabetes. Am.J.Physiol. 277:1-10, 1999.
39. Woods A, Dickerson K, Heath R, Hong SP, Momcilovic M, Johnstone SR, Carlson M, and Carling D: Ca2+/calmodulin-dependent protein kinase kinase-beta acts upstream of AMP-activated protein kinase in mammalian cells. Cell Metab 2:21-23, 2005.
40. Nanci J.MacIver, Sarah R.Jacobs, Heather L.Wieman, and et al: Glucose metabolism in lymphocytes is a regulated process with signifcant effects on immune cell function and survival. Journal of Leukocyte Biology 84:949-957, 2008.
41. Vander Heiden,M.G., Locasale,J.W., Swanson,K.D., Sharfi,H., Heffron,G.J., Amador-
Noguez,D., Christofk,H.R., Wagner,G., Rabinowitz,J.D., Asara,J.M., and Cantley,L.C.: Evidence for an alternative glycolytic pathway in rapidly proliferating cells. Science 329:1492-1499, 2010.
42. Vander Heiden,M.G.: Targeting cancer metabolism: a therapeutic window opens. Nat.Rev.Drug Discov. 10:671-684, 2011.
43. Warburg O: On the origin of cancer cells. Science 123:309-314, 1956.
44. Lu,W., Pelicano,H., and Huang,P.: Cancer metabolism: is glutamine sweeter than glucose? Cancer Cell 18:199-200, 2010.
45. Deberardinis,R.J. and Cheng,T.: Q's next: the diverse functions of glutamine in metabolism, cell biology and cancer. Oncogene 29:313-324, 2010.
46. Curthoys,N.P. and Watford,M.: Regulation of glutaminase activity and glutamine metabolism. Annu.Rev.Nutr. 15:133-159, 1995.
47. Wise,D.R. and Thompson,C.B.: Glutamine addiction: a new therapeutic target in cancer. Trends Biochem.Sci. 35:427-433, 2010.
48. Dang,C.V.: Rethinking the Warburg effect with Myc micromanaging glutamine metabolism. Cancer Res. 70:859-862, 2010.
49. Gao,P., Tchernyshyov,I., Chang,T.C., Lee,Y.S., Kita,K., Ochi,T., Zeller,K.I., De Marzo,A.M., Van Eyk,J.E., Mendell,J.T., and Dang,C.V.: c-Myc suppression of miR-23a/b enhances mitochondrial glutaminase expression and glutamine metabolism. Nature 458:762-765, 2009.
50. DeBerardinis RJ, Daikhin E, and hompson CB.: Beyond aerobic glycolysis: transformed cells can engage in glutamine metabolism that exceeds the requirement for protein and nucleotide synthesis. Proc.Natl.Acad.Sci.U.S.A 104:19345-19350, 2007.

REFERENCES
72
51. Fantin,V.R., St-Pierre,J., and Leder,P.: Attenuation of LDH-A expression uncovers a link between glycolysis, mitochondrial physiology, and tumor maintenance. Cancer Cell 9:425-434, 2006.
52. Gupta,S.C., Hevia,D., Patchva,S., Park,B., Koh,W., and Aggarwal,B.B.: Upsides and downsides of reactive oxygen species for cancer: the roles of reactive oxygen species in tumorigenesis, prevention, and therapy. Antioxid.Redox.Signal. 16:1295-1322, 2012.
53. Walsh,A.C., Michaud,S.G., Malossi,J.A., and Lawrence,D.A.: Glutathione depletion in human T lymphocytes: analysis of activation-associated gene expression and the stress response. Toxicol.Appl.Pharmacol. 133:249-261, 1995.
54. Roberg,B., Torgner,I.A., and Kvamme,E.: The orientation of phosphate activated glutaminase in the inner mitochondrial membrane of synaptic and non-synaptic rat brain mitochondria. Neurochem.Int. 27:367-376, 1995.
55. Kalra,J. and Brosnan,J.T.: The subcellular localization of glutaminase isoenzymes in rat kidney cortex. J.Biol.Chem. 249:3255-3260, 1974.
56. Curthoys,N.P.: Role of mitochondrial glutaminase in rat renal glutamine metabolism. J.Nutr. 131:2491S-2495S, 2001.
57. Katt,W.P., Ramachandran,S., Erickson,J.W., and Cerione,R.A.: Dibenzophenanthridines as inhibitors of glutaminase C and cancer cell proliferation. Mol.Cancer Ther. 11:1269-1278, 2012.
58. Hartwick,E.W. and Curthoys,N.P.: BPTES inhibition of hGA(124-551), a truncated form of human kidney-type glutaminase. J.Enzyme Inhib.Med.Chem. 27:861-867, 2012.
59. Wang,J.B., Erickson,J.W., Fuji,R., Ramachandran,S., Gao,P., Dinavahi,R., Wilson,K.F., Ambrosio,A.L., Dias,S.M., Dang,C.V., and Cerione,R.A.: Targeting mitochondrial glutaminase activity inhibits oncogenic transformation. Cancer Cell 18:207-219, 2010.
60. Cassago,A., Ferreira,A.P., Ferreira,I.M., Fornezari,C., Gomes,E.R., Greene,K.S., Pereira,H.M., Garratt,R.C., Dias,S.M., and Ambrosio,A.L.: Mitochondrial localization and structure-based phosphate activation mechanism of Glutaminase C with implications for cancer metabolism. Proc.Natl.Acad.Sci.U.S.A 109:1092-1097, 2012.
61. Vander Heiden,M.G., Lunt,S.Y., Dayton,T.L., Fiske,B.P., Israelsen,W.J., Mattaini,K.R., Vokes,N.I., Stephanopoulos,G., Cantley,L.C., Metallo,C.M., and Locasale,J.W.: Metabolic pathway alterations that support cell proliferation. Cold Spring Harb.Symp.Quant.Biol. 76:325-334, 2011.
62. Chhabil Dass: Fundamentals of Contemporary Mass Spectrometry. John Wiley & Sons, 2007.
63. Turner,A. and McGivan,J.D.: Glutaminase isoform expression in cell lines derived from human colorectal adenomas and carcinomas. Biochem.J. 370:403-408, 2003.
64. Szeliga,M., Sidoryk,M., Matyja,E., Kowalczyk,P., and Albrecht,J.: Lack of expression of the liver-type glutaminase (LGA) mRNA in human malignant gliomas. Neurosci.Lett. 374:171-173, 2005.
65. Monika Szeliga, Ewa Matyja, and Marta Obara: Relative expression of mRNAS coding for Glutaminase isoforms in CNS tissue and CNS tumours. Neurochem Res 33:808-813, 2008.

REFERENCES
73
66. Elgadi,K.M., Meguid,R.A., Qian,M., Souba,W.W., and Abcouwer,S.F.: Cloning and analysis of unique human glutaminase isoforms generated by tissue-specific alternative splicing. Physiol Genomics 1:51-62, 1999.
67. Szeliga,M. and Obara-Michlewska,M.: Glutamine in neoplastic cells: focus on the expression and roles of glutaminases. Neurochem.Int. 55:71-75, 2009.
68. Wang,R., Dillon,C.P., Shi,L.Z., Milasta,S., Carter,R., Finkelstein,D., McCormick,L.L., Fitzgerald,P., Chi,H., Munger,J., and Green,D.R.: The transcription factor Myc controls metabolic reprogramming upon T lymphocyte activation. Immunity. 35:871-882, 2011.
69. Wise,D.R., Deberardinis,R.J., Mancuso,A., Sayed,N., Zhang,X.Y., Pfeiffer,H.K., Nissim,I., Daikhin,E., Yudkoff,M., McMahon,S.B., and Thompson,C.B.: Myc regulates a transcriptional program that stimulates mitochondrial glutaminolysis and leads to glutamine addiction. Proc.Natl.Acad.Sci.U.S.A 105:18782-18787, 2008.
70. Greg Brown, Alex Singer, and et al: Functional and Structural Characterization of Four Glutaminases from Escherichia coli and Bacillus subtilis. Bio 47:5724-5735, 2008.
71. Soeters,P.B.: Have we enough glutamine and how does it work? A clinician's view. Annals of Nutrition & Metabolism 60:17-26, 2012.
72. Portais,J.C., Martin,M., Canioni,P., and Merle,M.: Glutathione, but not glutamine, is detected in 13C-NMR spectra of perchloric acid extracts from C6 glioma cells. FEBS J. 327:301-306, 1999.
73. Marquez,J. and et al: Nitrogen metabolism in tumor bearing mice. Arch.Biochem.Biophys 268:667-675, 1989.
74. Sebolt,J.S. and Weber,G.: Negative correlation of L-glutamine concentration with proliferation rate in rat hepatomas. Life Sci 34:301-306, 1984.
75. Bungard,C. and McGivan,J.: Glutamine availability up-regulates expression of the amino acid transporter protein ASCT2 in HepG2 cells and stimulates the ASCT2 promoter. Biochem.J. 382:27-32, 2004.
76. Vander Heiden MG. Metabolic regulation allowing tumor cell adaptation to different physiological states. Tumor Metabolism meets Immunology . 2013.
77. Seltzer,M.J., Bennett,B.D., Joshi,A.D., Gao,P., Thomas,A.G., Ferraris,D.V., Tsukamoto,T., Rojas,C.J., Slusher,B.S., Rabinowitz,J.D., Dang,C.V., and Riggins,G.J.: Inhibition of glutaminase preferentially slows growth of glioma cells with mutant IDH1. Cancer Res. 70:8981-8987, 2010.
78. Thangavelu,K., Pan,C.Q., Karlberg,T., Balaji,G., Uttamchandani,M., Suresh,V., Schuler,H., Low,B.C., and Sivaraman,J.: Structural basis for the allosteric inhibitory mechanism of human kidney-type glutaminase (KGA) and its regulation by Raf-Mek-Erk signaling in cancer cell metabolism. Proc.Natl.Acad.Sci.U.S.A 109:7705-7710, 2012.
79. DeLaBarre,B., Gross,S., Fang,C., Gao,Y., Jha,A., Jiang,F., Song,J.J., Wei,W., and Hurov,J.B.: Full-length human glutaminase in complex with an allosteric inhibitor. Biochemistry 50:10764-10770, 2011.
REFERENCES
74
80. Faustman, D. Institute of Medicine Report: "Women's Health Research: Progress, Pitfalls, and Promise". 2010. The National Academic Press.
81. Helmick,C. and et al: Estimates of the prevalence of arthritis and other rheumatic
conditions in the United States. Part I. Arthritis and Rheumatism 58:15-25, 2008.

APPENDIX A
75
Appendix A – Additional Procedures
Slide-A-Lyser Dialysis Kit – removal of glutamine from cell medium
Modified directly from manufacturer’s website.
A. Hydrate Membrane
1. Remove the cassette from its protective pouch. To prevent contamination, handle the cassette by the plastic frame only. Do not touch the membrane with ungloved hands. The 12-30mL Slide-A-Lyzer Cassette may be placed on end on a flat surface. 2. Hold the float chamber at the top of the unit and immerse cassette in dialysis buffer (PBS) for 2 minutes to hydrate membrane. Note: Hydration increases membrane flexibility and allows it to adjust more readily to the positive pressure created as the sample is added and to the vacuum created when air is removed. 3. Remove cassette from buffer and gently tap the cassette edge on a paper towel to remove excess liquid. Do not blot the membrane. B. Add Sample 1. Fill the syringe with the sample, leaving a small amount of air in the syringe. For large sample volumes, fill the syringe without the needle in place. 2. Orient the needle bevel sideways and penetrate the gasket through one of the syringe ports at a corner of the cassette. Slowly extend the needle into the cavity to a minimal extent and inject approximately half of the sample. For samples with high protein concentrations (e.g., 10mg/mL), fill the cassette slowly to avoid foaming. 3. Withdraw some air from the cassette by pulling up on the syringe piston and then inject remaining sample. 4. With the syringe needle inserted in the cassette cavity, withdraw remaining air from the cavity to compress the membrane windows so the sample contacts the greatest surface area. Use caution to prevent the needle from contacting the membrane. Minimal air left inside the cassette will not significantly affect dialysis efficiency. 5. Remove the syringe needle from the cassette while retaining air in the syringe. The gasket will reseal and the membrane cavity will contain minimal or no air. Mark the cassette corner with a permanent marker or record the number of the injected port. C. Dialyze Sample 1. Float cassette in the dialysis solution of choice and stir gently to avoid creating a vortex that might pull the cassette down in contact with the stir bar. Dialysis times for removal of glutamine: 1. Dialyse for 2 hours at room temperature. 2. Change dialysis buffer and dialyze for another 2 hours. 3. Change the dialysis buffer and dialyze overnight at 4°C. D. Remove Sample 1. Fill syringe with approximately 15mL of air and penetrate gasket with the needle through a top, unused syringe guide port. 2. Slowly discharge air into cassette cavity to separate membranes, which prevents needle penetration of the membrane.

APPENDIX A
76
3. With the needle in place, turn the unit so that needle is on the bottom. Allow sample to collect near the port and withdraw sample into the syringe.
Pierce BCA Protein Kit – protein concentration
Modified directly from manufacturer’s website.
Preparation of Standards and Working Reagent (required for both assay procedures)
A. Preparation of Diluted Albumin (BSA) Standards
Use Table 1 as a guide to prepare a set of protein standards. Dilute the contents of one Albumin Standard (BSA) ampule into several clean vials, preferably using the same diluent as the sample(s). Each 1mL ampule of 2mg/mL Albumin Standard is sufficient to prepare a set of diluted standards for either working range suggested in Table 1. There will be sufficient volume for three replications of each diluted standard. Table 1. Preparation of Dilution Albumin (BSA) Standards
Vial Volume of Dileunt (uL)
Volume and Source of BCA (uL)
Final BSA Concentration (ug/mL)
A 0 300 of stock 2000
B 125 375 of stock 1500
C 325 325 of stock 1000
D 175 175 of vial B dilution 750
E 325 325 of vial C dilution 500
F 325 325 of vial E dilution 250
G 325 325 of vial F dilution 125
H 400 100 of vial G dilution 25
I 400 0 Blank
B. Preparation of the BCA Working Reagent (WR) 1. Use the following formula to determine the total volume of WR required: (# standards + # unknowns) × (# replicates) × (volume of WR per sample) = total volume WR required Note: 2.0mL of the WR is required for each sample in the test-tube procedure, while only 200 µl of WR reagent is required for each sample in the microplate procedure. 2. Prepare WR by mixing 50 parts of BCA Reagent A with 1 part of BCA Reagent B (50:1, Reagent A:B). For the above example, combine 50mL of Reagent A with 1mL of Reagent B. Note: When Reagent B is first added to Reagent A, turbidity is observed that quickly disappears upon mixing to yield a clear, green WR. Prepare sufficient volume of WR based on the number of samples to be assayed. The WR is stable for several days when stored in a closed container at room temperature (RT). Microplate Procedure (Sample to WR ratio = 1:8) 1. Pipette 25µL of each standard or unknown sample replicate into a microplate well (working range = 20-2000µg/mL) Note: If sample size is limited, 10µL of each unknown sample and standard can be used (sample to WR ratio = 1:20). However, the working range of the assay in this case will be limited to 125-2000µg/mL. 2. Add 200µL of the WR to each well and mix plate thoroughly on a plate shaker for 30 seconds. 3. Cover plate and incubate at 37°C for 30 minutes. 4. Cool plate to RT. Measure the absorbance at or near 562nm on a plate reader.

APPENDIX B
77
Appendix B – List of solutions and reagents
NAME SUPPLIER CATALOG #
CD4+ isolation
Phosphate Buffered Solution (PBS) Sigma D8537
RPMI1640 Sigma-Aldrich R0883
Dynabeads CD4+ Isolation Kit Invitrogen 11331D
Lysation
NP40 Lysis buffer Novex FNN0021
PMSF Protease Inhibitor Sigma P7626
Protease Inhibitor Cocktail Sigma P8340
Ethanol Merck 108543
Lgepal CA-360 Sigma I3021
Pierce BCA Protein Assay
Pierce BCA Protein Assay Kit Thermo Scientific 23223
Western Blotting
α-GAC antibody (Rb pAb) Protein Tech 19958-1-AP
α-KGA antibody (Ms mAb) Abcam ab60709
α-LGA antibody (Rb pAB) Abcam ab91073
α-alpha-tubulin antibody (Rb mAb) Sigma 081M4861
SDS (sodium dodecyl sulphate) Biorad 161-0302
Glycine VWR 101196X
NaCl Merck 1.06404.1000
Methanol Merck MX0490
Tween 20 Sigma 101102360 TRIS Calbiochem
648310
Precision Plus Dual Colour Standard Biorad 161-0374
Criterion 12+2well 7.5% HCL-TRIS Gel Biorad 345-0005
Criterion 18 well 7.5% HCL-TRIS Gel Biorad 345-0006
PVDF Transfer Membrane Millipore IPVH00010
Super Signal West Pico Chemilumiescent Kit Thermo Scientific 34080
Restore Western Blot Stripping buffer Thermo Scientific 46430 Criterion Filter Paper Biorad 1704085
CD4 stimulation Dynabeads CD3/CD28 Expansion Beads Invitrogen 11131D
Dynabeads Mouse T-Activator CD3/CD28 Beads Invtirogen 11456D
Interleukin 2 (IL-2) PeproTech 200-02

APPENDIX B
78
[3H]-Thymidine CD4+ Stimulation Test
[3H]-Thymidine Nerliens 27X005MC
qPCR
RNeasy Plus Mini Kit Qiagen 74134
QuantiTect Reverse Transcription Kit Qiagen 205311
β-mercaptoethanol Sigma 129112
Rnase-free water Qiagen 129112
TaqMan Gene Expression Kit Applied Biosystems 4369016
TaqMan GAC Probe Applied Biosystems HS01022166_m1
TaqMan KGA Probe Applied Biosystems HS01014013_m1
TaqMan LGA Probe Applied Biosystems HS00998733_m1
TaqMan B2M Probe Applied Biosystems HS99999907_m1
Mass Spectrometry 13C-L-glutamine Aldrich 607983
MS-grade Methanol Merck 600-001-00
Glutamine removal Pierce Slide-A-Lyzer Dialysis Cassette 3.5K MWCO 30ml Thermo Scientific 66130
Glutaminase inhibition Compound 968 SPECS 36107028
BPTES Drug Discovery Lab AS
Glutaminase E.coli Sigma G8880
L-GDH Sigma 1001153002
NAD Roche 10127965001
DMSO Sigma 276855

APPENDIX C
79
Appendix C – Protein/RNA Concentrations
Nanodrop 2000c Spectrophotometer
Table x. Total protein concentrations in naïve and CD3/CD28-activated CD4+ T lymphocytes.
Donor Sample mg/ml A280 absorbance
260/280 ab. ratio
1 Naive 19.31 19.31 0.56
Activated 22.211 22.211 0.7
2 Naive 20.214 20.214 0.58
Activated 22.599 22.599 0.7
3 Naive 16.502 16.502 0.73
Activated 15.772 15.772 0.57
4 Naive 1.572 1.572 -0.51
Activated 3.533 3.533 1.38
5 Naive 1.971 1.971 -0.13
Activated 1.532 1.532 -0.63
6 Naive 2.681 2.681 0.92
Activated 2.527 2.527 1.08
Table x. Total RNA concentrations in naïve and CD3/CD28-activated CD4+ T lymphocytes.
Donor Sample ng/ul A260 absorbance
A280 absorbance
260/280 absorbance ratio
1 Naive 58.4 0.697 2.1 1.9
Activated 266.8 3.206 2.08 2.12
2 Naive 256.5 3.084 2.08 2.12
Activated 46.1 0.547 2.11 1.79
3 Naive 45.3 0.532 2.13 1.87
Activated 237.4 2.87 2.07 2.13
4 Naive 271.8 3.287 2.07 2.11
Activated 115.5 1.406 2.05 1.93
Pierce BCA Protein Assay
Table x. Total protein concentrations in naïve and CD3/CD28-activated CD4+ T lymphocytes.
Donor Sample 560nm absorbance ug/ml
7 Naive 0.300 774
Activated 0.436 1225
8 Naive 0.233 550
Activated 0.407 1130
9 Naive 0.405 1124
Activated 0.268 667