Mast Cell-Derived Histamine Regulates Liver Ketogenesis via ...
18
Article Mast Cell-Derived Histamine Regulates Liver Ketogenesis via Oleoylethanolamide Signaling Graphical Abstract Highlights d Fasting stimulates extra-hepatic mast cells to release histamine d Histamine travels through the hepatic portal system and activates liver H 1 receptors d H 1 -receptor activation triggers OEA biosynthesis in liver d Histamine-dependent OEA signaling enhances fasting- induced ketogenesis Authors Alessandra Misto, Gustavo Provensi, Valentina Vozella, Maria Beatrice Passani, Daniele Piomelli Correspondence [email protected] In Brief Misto et al. describe a paracrine signaling mechanism that enhances ketogenesis, a crucial adaptive response to food deprivation. The mechanism involves fasting-induced release of histamine from mast cells into the hepatic portal system, stimulation of H 1 receptor-dependent OEA biosynthesis in liver, and co-activation of PPAR-a-mediated ketogenesis by OEA and lipolysis-derived fatty acids. Misto et al., 2019, Cell Metabolism 29, 91–102 January 8, 2019 ª 2018 Elsevier Inc. https://doi.org/10.1016/j.cmet.2018.09.014
-
Upload
khangminh22 -
Category
Documents
-
view
3 -
download
0
Transcript of Mast Cell-Derived Histamine Regulates Liver Ketogenesis via ...

Article
Mast Cell-Derived Histami
ne Regulates LiverKetogenesis via Oleoylethanolamide SignalingGraphical Abstract
Highlights
d Fasting stimulates extra-hepatic mast cells to release
histamine
d Histamine travels through the hepatic portal system and
activates liver H1 receptors
d H1-receptor activation triggers OEA biosynthesis in liver
d Histamine-dependent OEA signaling enhances fasting-
induced ketogenesis
Misto et al., 2019, Cell Metabolism 29, 91–102January 8, 2019 ª 2018 Elsevier Inc.https://doi.org/10.1016/j.cmet.2018.09.014
Authors
Alessandra Misto, Gustavo Provensi,
Valentina Vozella,
Maria Beatrice Passani,
Daniele Piomelli
In Brief
Misto et al. describe a paracrine signaling
mechanism that enhances ketogenesis,
a crucial adaptive response to food
deprivation. The mechanism involves
fasting-induced release of histamine from
mast cells into the hepatic portal system,
stimulation of H1 receptor-dependent
OEA biosynthesis in liver, and
co-activation of PPAR-a-mediated
ketogenesis by OEA and lipolysis-derived
fatty acids.

Cell Metabolism
Article
Mast Cell-Derived HistamineRegulates Liver Ketogenesisvia Oleoylethanolamide SignalingAlessandra Misto,1,2 Gustavo Provensi,3 Valentina Vozella,1 Maria Beatrice Passani,4 and Daniele Piomelli5,6,*1Drug Discovery and Development, Fondazione Istituto Italiano di Tecnologia, Genoa 16163, Italy2School of Advanced Studies Sant’Anna, Pisa 56127, Italy3Department of Neuroscience, Psychology, Drug Research and Child Health, University of Florence, Florence 50139, Italy4Department of Health Science, University of Florence, Florence 50139, Italy5Departments of Anatomy and Neurobiology, Biological Chemistry and Pharmacology, School of Medicine, University of California, Irvine,
CA 92697, USA6Lead Contact*Correspondence: [email protected]
https://doi.org/10.1016/j.cmet.2018.09.014
SUMMARY
The conversion of lipolysis-derived fatty acids intoketone bodies (ketogenesis) is a crucial metabolicadaptation to prolonged periods of food scarcity.The process occurs primarily in liver mitochondriaand is initiated by fatty-acid-mediated stimulationof the ligand-operated transcription factor, peroxi-some proliferator-activated receptor-a (PPAR-a).Here, we present evidence that mast cells contributeto the control of fasting-induced ketogenesis viaa paracrine mechanism that involves secretion ofhistamine into the hepatic portal circulation, stimula-tion of liver H1 receptors, and local biosynthesis ofthe high-affinity PPAR-a agonist, oleoylethanola-mide (OEA). Genetic or pharmacological interven-tions that disable any one of these events, includingmast cell elimination, deletion of histamine- or OEA-synthesizing enzymes, and H1 blockade, blunt keto-genesis without affecting lipolysis. The results revealan unexpected role for mast cells in the regulationof systemic fatty-acid homeostasis, and suggestthat OEA may act in concert with lipolysis-derivedfatty acids to activate liver PPAR-a and promoteketogenesis.
INTRODUCTION
After a meal, the absorptive epithelium of the upper small intes-
tine diverts a fraction of the oleic acid derived from the hydrolysis
of dietary lipids toward the production of oleoylethanolamide
(OEA) (Schwartz et al., 2008; DiPatrizio and Piomelli, 2015).
Acting as a local messenger within the gut, OEA reduces food
intake through a mechanism that involves recruitment of periph-
eral sensory afferents (Rodriguez de Fonseca et al., 2001) and
activation of central pathways that utilize oxytocin and histamine
as neurotransmitters (Gaetani et al., 2010; Provensi et al., 2014).
Several lines of evidence suggest that OEA initiates this
Ce
response by engaging the ligand-operated transcription factor,
peroxisome proliferator-activated receptor-a (PPAR-a). First,
OEA is one of the most potent naturally occurring PPAR-a
agonists identified to date (affinity constant, KD, z40 nM;
median effective concentration, EC50, z120 nM) (Fu et al.,
2003; Astarita et al., 2006a). Second, the satiety-inducing effects
of OEA are abolished by PPAR-a deletion, are mimicked by
synthetic PPAR-a agonists, and are associated with increased
PPAR-a-regulated transcription in gut mucosa (Fu et al., 2003).
Third, viral-mediated enhancement of OEA production in rat
jejunum reduces food intake and concomitantly increases local
expression of PPAR-a target genes (Fu et al., 2008). Finally,
OEA levels in small intestine from various vertebrate species,
including fish, snakes, and rodents, rise from %50 nM in the
fasting state to R250 nM after feeding (Astarita et al., 2006b;
Fu et al., 2007; Tinoco et al., 2014; Igarashi et al., 2017), a con-
centration range that is compatible with PPAR-a activation
(Fu et al., 2003; Astarita et al., 2006a). In sum, the available
data indicate that OEA is a physiologically relevant endogenous
agonist for small-intestinal PPAR-a, which participates in the
control of satiety (DiPatrizio and Piomelli, 2015).
Feeding regulates OEA production also in the liver, but in an
opposite direction to that seen in the gut: hepatic OEA levels
rise in the fasting state and fall after feeding (Fu et al., 2007;
Izzo et al., 2010). The molecular underpinnings and physiological
significance of these changes are unknown, but pharmacolog-
ical evidence hints at a possible role in lipid metabolism. Indeed,
subchronic administration of OEA attenuates liver steatosis in
obese Zucker rats (Fu et al., 2005) and in a rat model of non-
alcoholic fatty liver disease (Li et al., 2015). Moreover, exoge-
nous OEA stimulates fatty-acid oxidation in isolated rat
hepatocytes and enhances ketone body production (ketogen-
esis) in live rats (Guzman et al., 2004). Ketogenesis is an adaptive
metabolic response to prolonged nutrient insufficiency, which
takes place primarily in liver mitochondria (Grabacka et al.,
2016). The process starts with the condensation, catalyzed
by Acetyl-CoA acetyltranferase-1 (Acat-1), of two molecules
of acetyl-CoA to form acetoacetyl-CoA. Addition of another
acetyl-CoA group, mediated by b-Hydroxy-b-methylglutaryl-
CoA synthase-2 (Hmgcs-2), yields HMG-CoA, which is
then converted into the ketone bodies, acetoacetate and
ll Metabolism 29, 91–102, January 8, 2019 ª 2018 Elsevier Inc. 91

b-hydroxybutyrate (b-OHB). The expression of genes involved in
this pathway, including the rate-limiting enzyme Hmgcs-2
(Grabacka et al., 2016), is governed at the transcriptional level
by PPAR-a in hepatocytes (Montagner et al., 2016), whose acti-
vation in fasting animals is thought to depend primarily on lipol-
ysis-derived fatty acids (Kersten, 2014; Dubois et al., 2017).
Here, we describe a paracrine signaling mechanism involved in
the control of liver ketogenesis. We show that fasting stimulates
extra-hepatic mast cells to secrete histamine, which enters the
liver via the portal circulation, activates G protein-coupled H1
receptors, and triggers local biosynthesis of the high-affinity
PPAR-a agonist, OEA. Genetic or pharmacological manipula-
tions that disrupt this process do not affect lipolysis, but mark-
edly attenuate fasting-induced ketogenesis, thus revealing a
previously unsuspected regulatory role for mast cell-derived his-
tamine and liver OEA production in systemic lipid homeostasis.
RESULTS
Endogenous Histamine Drives Fasting-Induced OEABiosynthesis in LiverHistamine regulates food intake (Haas et al., 2008) andmediates,
along with oxytocin, the satiety response evoked by OEA (Gae-
tani et al., 2010; Provensi et al., 2016). In addition to these central
actions, histamine can also stimulate carbohydrate and lipid
metabolism by acting at peripheral sites (Garcia-Sainz et al.,
1987; Masaki et al., 2001a; Fulop et al., 2003; Wang et al.,
2010; Yamada et al., 2016). To assess whether OEA participates
in the peripheral metabolic effects of histamine, we examined
the impact of feeding status on OEA levels in mice lacking the
histamine-synthesizing enzyme, Histidine decarboxylase (Hdc)
(Ohtsu et al., 2001). Hdc�/� mice and their wild-type littermates
were subjected to three feeding conditions that are known to
influence OEA production in a tissue-selective manner (Fu
et al., 2007): free feeding, food deprivation (12 hr), and food
deprivation followed by 1 hr refeeding. Using liquid chromatog-
raphy/mass spectrometry (LC/MS), we measured OEA content
in four tissues: liver, white fat and pancreas (where fasting
elevates OEA levels), and jejunum (where the opposite occurs)
(Rodriguez de Fonseca et al., 2001; Fu et al., 2007; Schwartz
et al., 2008). Hdc ablation suppressed fasting-induced OEA
accumulation in liver (Figure 1A), but did not alter the OEA
response in jejunum (Figure 1B), fat (Figure 1C), or pancreas (Fig-
ure 1D). Moreover, Hdc deletion had no effect on hepatic levels
of the OEA analog palmitoylethanolamide (PEA) (Figure 1E) or on
lipolysis-mediated release of oleic acid (Figure 1F) and other free
fatty acids (FFAs) (Figure S1).
There are two known pathways of OEA biosynthesis (Piomelli,
2013). In gut mucosa, dietary oleic acid is condensed with
phosphatidylethanolamine (PE) to form N-oleoyl-PE, which is
converted to OEA by N-acyl-PE phospholipase D (Nape-pld)
(Fu et al., 2007, 2008; Schwartz et al., 2008; Piomelli, 2013).
Alternatively, in neurons and other cells, N-oleoyl-PE is gener-
ated via transfer of oleic acid from the sn-1 position of phospha-
tidylcholine to the free amine group of PE (Piomelli, 2013). This
reaction is initiated by activity- or receptor-dependent mobiliza-
tion of intracellular calcium (Cadas et al., 1996, 1997) and is
catalyzed by the N-acyltransferase Pla2g4e (Ogura et al.,
2016). To determine whether Hdc ablation impacts OEA biosyn-
92 Cell Metabolism 29, 91–102, January 8, 2019
thesis, we identified and quantified by LC/MS (Table S1)
three OEA precursors whose levels changed in response to
food deprivation: N-oleoyl-PE (18:0-22:6-N18:1), N-oleoyl-PE
(18:1-22:6-N18:1) and N-oleoyl-PE (16:0-18:1-N18:1). Fasting
caused aR3-fold increase in the accumulation of each of these
lipids, and Hdc deletion either suppressed (Figure 1G) or sub-
stantially dampened (Figures 1H and S2A) this response. By
contrast, neither fasting nor Hdc ablation had any effect on the
PEA precursors, N-palmitoyl-PE (18:0-22:6-N16:0) (Figure 1I)
and plasmalogen N-palmitoyl-PE (P18:0-22:6-N16:0) (Fig-
ure S2B). The results show that Hdc is required for fasting-
induced OEA biosynthesis in liver, implicating histamine as an
obligatory mediator of this process.
Histamine Stimulates Liver OEA Biosynthesis via H1
Receptor ActivationTo further test this idea, we examined whether pharmacological
blockade of histamine receptors affects liver OEA formation. His-
tamine activates with submicromolar potencies four G protein-
coupled receptors, termed H1 to H4 (Bongers et al., 2010).
Similar to Hdc ablation, injection of a maximally effective dose
of the H1 antagonist fexofenadine (10 mg/kg) (Matsubara et al.,
2017) prevented the fasting-induced rise in liver OEA levels
without changing such levels in fedmice (Figure 2A). By contrast,
the H2 antagonist famotidine (10mg/kg) (Swiader and Czuczwar,
2014) and the H3 antagonist ciproxifan (3 mg/kg) (Huang et al.,
2006) had no effect on OEA production under any feeding condi-
tion (Figures 2B and 2C), while the H4 antagonist JNJ7777120
(20 mg/kg) (Ballerini et al., 2013) slightly raised OEA content in
free-feeding, but not food-deprived mice (Figure 2D). Further-
more, supporting the possibility that histamine regulates OEA
levels via a liver-autonomousmechanism, we found that (1) intra-
hepatic histamine injections increased liver OEA content in fed
animals (Figure 2E), and (2) incubation in the presence of hista-
mine stimulated OEA formation in the human hepatocyte cell
line, HepG2 (Figure 2F), which expresses H1 receptors (Falus
et al., 1989). Conversely, intracerebroventricular infusion of the
irreversible Hdc inhibitor, a-fluoromethylhistidine (a-FMH) (Gar-
barg et al., 1980), which effectively depletes releasable hista-
mine stores in the mouse brain (Provensi et al., 2014), did not
change fasting-induced OEA production (Figure 2G). The evi-
dence thus suggests that endogenous histamine stimulates
OEA biosynthesis in liver via H1 receptor activation.
Fasting Stimulates Histamine Release from Mast Cellsinto the Hepatic Portal SystemNext, we asked whether fasting changes histamine levels in the
hepatic portal circulation, which provides a likely point of entry
for the amine into the liver. The results show that mouse portal
blood contains measurable levels of histamine and that fasting
markedly increased such levels (Figures 3A and 3B). As ex-
pected from previous reports (Ohtsu et al., 2001; Nakamura
et al., 2017), histamine was also detectable in portal blood of
Hdc�/� mice, most likely due to dietary intake (Ohtsu et al.,
2001, 2002). In these mutants, however, histamine levels did
not change in response to food deprivation (Figure 3C).
Outside the brain, histamine is found predominantly in mast
cells, basophils, and gastric enterochromaffin-like cells, from
which it can be released in response to a variety of immune,

Figure 1. Endogenous Histamine Is Required for Fasting-Induced OEA Biosynthesis in Liver
Effects of Hdc deletion on levels of OEA in (A) liver, (B) jejunum, (C) epididymal white adipose tissue (WAT), and (D) pancreas. Hdc deletion does not affect liver
levels of (E) PEA or (F) oleic acid. Biosynthesis of OEA precursors (G) N-oleoyl-PE (18:0-22:6-N18:1) and (H) N-oleoyl-PE (18:1-22:6-N18:1) is impaired in Hdc�/�
mice, whereas biosynthesis of the PEA precursor, (I) N-palmitoyl-PE (18:0-22:6-N16:0), is unaltered. Wild-type (WT) and Hdc�/� mice were tested under three
experimental conditions: free feeding (open bars), food deprivation (12 hr, gray bars), and food deprivation followed by 1 hr refeeding (closed bars). Results are
expressed as mean ± SEM, n = 5–6 per feeding condition.
*p < 0.05, **p < 0.01, ***p < 0.001. See also Figures S1 and S2; Table S1.
hormonal, and neural signals (Prinz et al., 1999; Borriello et al.,
2017). Because a substantial fraction of blood draining into the
portal vein derives from the gastrointestinal tract, which harbors
a functionally distinct population of mast cells (Pearce, 1986;
Stead et al., 2006), we asked whether histamine release in portal
blood and liver OEA biosynthesis might be altered in mice lack-
ing these cells. In a model of Kit-dependent mast cell deficiency,
WBB6F1/J-KitW/KitW-v/Jmice (Grimbaldeston et al., 2005), food
deprivation failed to affect portal histamine concentrations (Fig-
ure 4A) or liver OEA biosynthesis (Figures 4B and 4C). The deficit
was biochemically selective in thatKitmutants did not differ from
wild-type littermates in other responses evoked by fasting,
including lowered OEA production in jejunum (Figure 4D),
enhanced OEA production in adipose tissue (Figure 4E), and
accelerated lipolysis (Figure 4F). Because abnormalities in Kit
mutant mice extend beyondmast cell deficiency, encompassing
a wide variety of immunological and metabolic functions (Feyer-
abend et al., 2012, 2016), we also used Carboxypeptidase A3
(Cpa3) Cre recombinase knock-in (Cpa3Cre/+) mice, in which
Cre-mediated genotoxicity causes complete mast cell elimina-
tion along with anz60% reduction in basophil number (Feyera-
bend et al., 2011). As observed inKit-dependentmutants, fasting
Cell Metabolism 29, 91–102, January 8, 2019 93

(legend on next page)
94 Cell Metabolism 29, 91–102, January 8, 2019

Figure 3. Fasting Stimulates Histamine Release into the Hepatic Portal Circulation
Histamine identification and quantification in hepatic portal blood.
(A) Representative LC/MS tracing of authentic histamine (red) and native histamine (black).
(B) Mass spectrum of native histamine showing the presence of diagnostic ions [M + H]+ and [M-NH3]+.
(C) Effects of free feeding (open bars), food deprivation (gray bars), and food deprivation/refeeding (closed bars) on histamine levels in portal blood of wild-type
(WT) and Hdc�/� mice. Results are expressed as mean ± SEM, n = 4–5 per feeding condition. ***p < 0.001; #p < 0.01 versus corresponding group of WT mice.
caused no detectable change in histamine or OEAmobilization in
Cpa3Cre/+ mice (Figures 4G and 4H). Collectively, we interpret
these findings as indicating that food deprivation causes
extra-hepatic mast cells to secrete histamine, which reaches
the liver via the portal system and stimulates OEA biosynthesis
in that organ.
Dietary Fat Dampens Histamine Release and Liver OEAProductionIn the small intestine, where OEA acts as a satiety factor
(DiPatrizio and Piomelli, 2015), the feeding-dependent formation
of this lipid mediator is disabled by short-term or long-term
exposure to a high-fat diet (HFD) (Artmann et al., 2008; Igarashi
et al., 2015). To determine whether dietary fat also influences
histamine-dependent OEA biosynthesis in liver, we placed
wild-type mice on an HFD for 7 days and measured portal
histamine and hepatic OEA content under free-feeding, food-
deprived, and refed conditions. The short HFD exposure did
not change body weight (day 0: 25.9 ± 0.4 g; day 7: 27.0 ±
0.5 g; mean ± SEM; n = 15), but dampened fasting-induced
histamine release into the portal circulation (Figure S3A) and
suppressed OEA production in liver (Figure S3B). This effect
was temporary, however, as both fasting-induced responses
were normalized after 30 days of HFD (Figures S3C and
S3D), when mice exposed to the diet were significantly
(***p < 0.0001) heavier than chow-fed controls (standard diet,
day 30: 27.47 ± 0.37 g; HFD, day 30: 32.73 ± 0.63 g; mean ±
SEM; n = 15). Thus, histamine-dependent OEA formation in liver
is subject only to short-term but not long-term modulation by
Figure 2. H1 Receptors Mediate Fasting-Induced OEA Biosynthesis in
Effects of histamine receptor blockade on liver OEA levels in free-feeding (ope
(closed bars).
(A–F) (A) H1 antagonist fexofenadine (10 mg/kg), (B) H2 antagonist famotidine
JNJ7777120 (20mg/kg). Drugs were administered by intraperitoneal injection 1 hr
liver OEA levels in free-feeding wild-type mice, and (F) incubation of HepG2 cells
(G) Effect of intracerebroventricular infusion of the irreversible Hdc inhibitor, a
expressed as mean ± SEM, n = 5–6 per condition.
*p < 0.05, **p < 0.01, ***p < 0.001; #p < 0.01, free-feeding vehicle-treatedmice vers
versus vehicle.
dietary fat, suggesting that adaptive mechanisms might exist
that restore the response after prolonged fat feeding.
Histamine-Driven OEA Biosynthesis Enhances Fasting-Induced KetogenesisExperiments in rats have shown that exogenous OEA promotes
fatty-acid oxidation and ketone body formation by activating
PPAR-a (Guzman et al., 2004). These data prompted us to inves-
tigate the impact of Hdc deletion and histamine receptor antago-
nism on fasting-induced ketogenesis. In wild-type mice, food
deprivation increased b-OHB levels in liver and plasma (Figures
5A and 5B) and concomitantly stimulated transcription of the
ketogenic genes, Acat-1 and Hmgcs-2 (Figures 5C and 5D).
Expression of two additional PPAR-a targets, Fibroblast growth
factor 21 (Fgf21) and Cytochrome P450-4a10 (Cyp4a10), was
also enhanced (Figures 5E and 5F). Consistent with a regulatory
role for histamine, these responses were significantly attenuated
in Hdc�/� mice (Figures 5A–5F). Of note, Hdc deletion differen-
tially affected Fgf21 and Cyp4a10 transcription (Figures 5E and
5F). Similar discrepancies have been documented previously
(e.g., between fasting- and agonist-induced expression of
PPAR-a target genes) and have tentatively attributed to factors
such as cellular PPAR-a localization, concomitant engagement
of other nuclear receptors, and/or differential recruitment of
coactivator proteins (Kersten, 2014). As seen in Hdc�/� mice,
fasting-induced changes in hepatic and circulating b-OHB levels
were also blunted in wild-typemice treatedwith the H1 antagonist
fexofenadine (Figures 5G and 5H), but not in mice treated with
H2, H3, or H4 antagonists (Figures S4A–S4C). In addition,
Liver
n bars), food-deprived (gray bars), and food-deprived/refed wild-type mice
(10 mg/kg), (C) H3 antagonist ciproxifan (3 mg/kg), and (D) H4 antagonist
before tissue harvest. Effects of (E) intrahepatic injection of histamine (mmol) on
with histamine (30 mM, 1 hr).
-FMH, on OEA formation in liver of free-feeding wild-type mice. Results are
us free-feeding drug-treatedmice, except (E and F) where **p < 0.01, histamine
Cell Metabolism 29, 91–102, January 8, 2019 95

Figure 4. Mast Cells Are a Primary Source of Fasting-Induced Histamine Release
Effects of Kit-dependent (WBB6F1/J-KitW/KitW-v/J) or Kit-independent (Cpa3Cre/+) mast cell ablation on fasting-induced histamine release and liver OEA
biosynthesis.WBB6F1/J-KitW/KitW-v/Jmice: (A) histamine concentrations in portal blood; liver levels of (B) OEA and (C) N-oleoyl-PE (18:0-22:6-N18:1); levels of
OEA in (D) jejunum and (E) white adipose tissue (WAT); (F) liver levels of oleic acid. Cpa3Cre/+ mice: (G) histamine concentrations in portal blood; (H) liver OEA
levels. Free feeding (open bars), food deprivation (gray bars), food deprivation/refeeding (closed bars). Results are expressed asmean ± SEM, n = 4–5 per feeding
condition.
*p < 0.05, **p < 0.01, ***p < 0.001 versus wild-type (WT) littermate controls.
fexofenadine administration reduced fasting-inducedAcat-1 and,
to a lesser extent, Hmgcs-2 transcription (Figures S5A and S5B).
As illustrated (Figures 3 and 4), fasting failed to increase portal
histamine and liver OEA levels inKit-independent (Cpa3Cre/+) and
Kit-dependent (WBB6F1/J-KitW/KitW-v/J) models of mast cell
ablation. In the same strains, ketogenesis was also defective
(Figures 6A and 6B). Liver transcription of ketogenic (Acat-1
and Hmgcs-2) and other PPAR-a target genes (Fgf21 and
Cyp4a10) was similarly, albeit differentially, blunted (Figures
6C–6F and S6). If OEA is involved in ketone body production,
as the results outlined previously suggest, the process should
96 Cell Metabolism 29, 91–102, January 8, 2019
be impaired in mice lacking Nape-pld, the enzyme that converts
N-oleoyl-PE into OEA. Confirming this expectation, fasting-
induced rises in b-OHB levels were significantly decreased in
Nape-pld�/� mutants, compared with wild-type littermates (Fig-
ures 6G and 6H). Of note, Nape-pld ablation did not modify the
ketogenic response evoked by injections of OEA (20 mg/kg),
which increased liver b-OHB content to a comparable extent in
Nape-pld�/� andwild-type animals (Figure 6I). In sum, the results
outlined previously suggest that mast cell-derived histamine
magnifies fasting-induced ketogenesis by activating H1
receptor-dependent OEA production in liver.

Figure 5. Endogenous Histamine Enhances Fasting-Induced KetogenesisEffects ofHdc deletion and H1 receptor blockade on b-OHB levels in (A) liver and (B) plasma ofHdc�/�mice and wild-type (WT) controls under free-feeding (open
bars), food-deprived (gray bars), and food-deprived/refed (closed bars) conditions. Transcription of PPAR-a target genes (C) Acat-1, (D)Hmgcs-2, (E) Fgf21, and
(F) Cyp4a10 in liver tissue of WT and Hdc�/� mice. Effects of H1 antagonist fexofenadine (10 mg/kg, intraperitoneal) or vehicle on b-OHB levels in (G) liver and (H)
plasma of WT mice. Fexofenadine was administered 1 hr before tissue harvest. Results are expressed as mean ± SEM, n = 5 per feeding condition.
*p < 0.05, **p < 0.01, ***p < 0.001. See also Figures S4 and S5.
DISCUSSION
The present findings outline a novel regulatory mechanism for
fasting-induced ketogenesis, which involves histamine release
frommast cells into the hepatic portal system, H1 receptor-medi-
ated stimulation of liver OEA biosynthesis, and recruitment of the
nuclear receptor PPAR-a by the combined action of OEA and
lipolysis-derived FFAs (Figure 7). Three sets of data support
this model. First, fasting increases portal histamine levels in
wild-type mice, but not in three mutant mouse strains that lack
either mast cells or Hdc. Second, fasting is accompanied by a
marked enhancement of liver OEA production, a response that
is suppressed by mast cell removal, genetic Hdc silencing, or
pharmacological H1 receptor blockade. Finally, experimental
interventions that disable histamine release and/or liver OEA
biosynthesis also attenuate, but do not completely block, fast-
ing-induced PPAR-a activation and ketogenesis. Notably, the
same interventions have no effect on the accumulation of lipol-
ysis-derived FFAs.
We found that fasting increases histamine levels in portal
blood and concomitantly heightens liver OEA production. These
responses are suppressed in two mechanistically distinct
models of mast cell deficiency: Cpa3Cre/+ mice, in which mast
cells are eliminated by Cre genotoxicity (Feyerabend et al.,
2011), and WBB6F1/J-KitW/KitW-v/J mice, in which mast cell
ablation is caused by impaired Kit signaling and is accompanied
by various immune and metabolic deficits (Gutierrez et al., 2015;
Feyerabend et al., 2016). Collectively, the results support the
hypothesis that mast cells are critically implicated in fasting-
induced histamine secretion. Of note, portal histamine levels
undergo an z200% change in the transition from feeding to
fasting (Figures 4A and 4G). This increase is comparable in
size to those observed in peripheral plasma of asthmatic patients
experiencing challenge-induced bronchoconstriction (Bhat
et al., 1976; Belcher et al., 1988), an event in which histamine
is known to play an important functional role (Kaliner, 1989).
The specific mast cell population(s) involved in fasting-induced
histamine release remains to be identified, but the available evi-
dence points to three candidate sites: gastrointestinal mucosa,
visceral vasculature, and/or portal tracts and sinusoids of the
liver (Farrell et al., 1995; Stead et al., 2006). The distinctive pop-
ulation of mast cells that resides in the gut may be well posi-
tioned to fill this role. Indeed, mucosal mast cells are found in
close proximity of neural fibers (Stead et al., 1987, 1989),
including vagal efferents that are activated during a fast
(Berthoud and Patterson, 1996; Berthoud, 2008a, 2008b). More-
over, mucosal mast cells respond to vagal stimulation with
increased histamine biosynthesis (Stead et al., 2006) and have
been implicated in the monitoring and utilization of dietary fat
(Ji et al., 2012; Sato et al., 2016). Further investigations are
needed to test these possibilities.
The stimulus-dependent production of OEA, like that of most
lipid-derived mediators, is regulated in a cell- and tissue-
selective manner (Piomelli, 2013). Unlike gut mucosa, where
OEA is produced using dietary oleic acid as an obligatory precur-
sor (Schwartz et al., 2008), in the liver this process is ostensibly
uncoupled from influx of lipolysis-derived FFAs (compare
Figures 1A and 1F). It is possible, therefore, though remains to
be demonstrated, that liver cells produce OEA through a
pathway similar to that used by brain neurons, namely, via
Cell Metabolism 29, 91–102, January 8, 2019 97

Figure 6. Role of Mast Cells and OEA in Fasting-Induced Ketogenesis
(A–H) Effects of Kit-independent (Cpa3Cre/+) or Kit-dependent (WBB6F1/J-KitW/KitW-v/J) mast cell ablation on plasma b-OHB levels in (A) Cpa3Cre/+ mice and (B)
WBB6F1/J-KitW/KitW-v/J mice under free-feeding (open bars), food-deprived (gray bars), and food-deprived/refed (closed bars) conditions. Transcription of
PPAR-a target genes (C)Acat-1, (D)Hmgcs-2, (E) Fgf21, and (F)Cyp4a10 in liver ofCpa3Cre/+mice. Effects ofNape-pld deletion on (G) liver and (H) plasma b-OHB
levels.
(I) Effects of intraperitoneal injections of OEA (20mg/kg, green bars) or vehicle (open bars) on b-OHB levels in liver of free-feeding wild-type (WT) andNape-pld�/�
mice. OEA was administered 2 hr before tissue harvest. Results are expressed as mean ± SEM, n = 5 per feeding condition.
*p < 0.05, **p < 0.01, ***p < 0.001 versus WT littermate controls. See also Figure S6.
mobilization of intracellular calcium and subsequent activation of
Pla2g4e, a phospholipase/N-acyltransferase responsible for
N-oleoyl-PE production (Piomelli, 2013; Ogura et al., 2016).
Consistent with this view, previous studies have documented
the presence of functionally active H1 receptors linked to calcium
signaling in hepatocytes (Garcia-Sainz et al., 1992) and other
cellular constituents of the liver (e.g., endothelial cells) (Naka-
mura andMurata, 2018). The identification of specific cell type(s)
involved in histamine-driven OEA formation will allow testing this
hypothesis and is an important objective for future studies.
98 Cell Metabolism 29, 91–102, January 8, 2019
Mammals adapt to prolonged periods of food scarcity by
releasing FFAs from adipose tissue and transforming them into
energy-rich ketone bodies that are used as fuel by brain, muscle,
and other organs (Kersten, 2014; Grabacka et al., 2016). Keto-
genesis occurs primarily in hepatocytes, but its rate is regulated
by a combination of local and systemic factors. Systemic sig-
nals, such as the catabolic hormones glucagon and epinephrine,
accelerate lipolysis and facilitate FFA transport into hepatocytes,
where these lipids may serve as both precursors for ketone
bodies and agonists for the master transcriptional regulator of
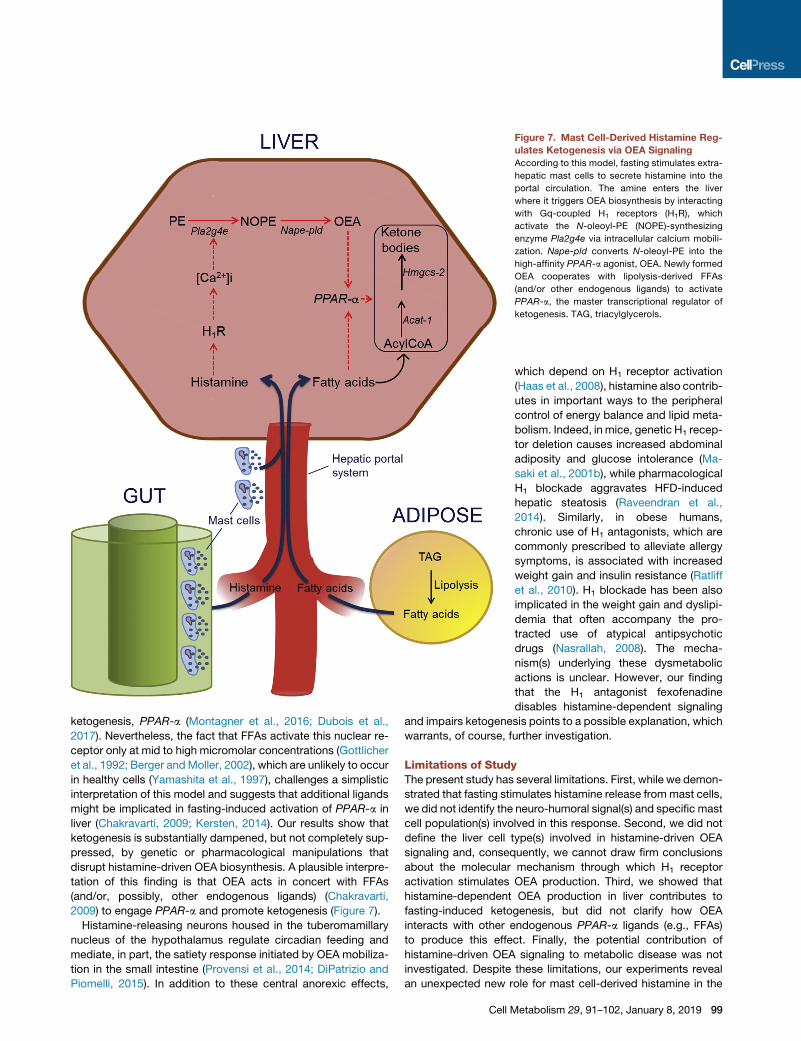
Figure 7. Mast Cell-Derived Histamine Reg-
ulates Ketogenesis via OEA Signaling
According to this model, fasting stimulates extra-
hepatic mast cells to secrete histamine into the
portal circulation. The amine enters the liver
where it triggers OEA biosynthesis by interacting
with Gq-coupled H1 receptors (H1R), which
activate the N-oleoyl-PE (NOPE)-synthesizing
enzyme Pla2g4e via intracellular calcium mobili-
zation. Nape-pld converts N-oleoyl-PE into the
high-affinity PPAR-a agonist, OEA. Newly formed
OEA cooperates with lipolysis-derived FFAs
(and/or other endogenous ligands) to activate
PPAR-a, the master transcriptional regulator of
ketogenesis. TAG, triacylglycerols.
ketogenesis, PPAR-a (Montagner et al., 2016; Dubois et al.,
2017). Nevertheless, the fact that FFAs activate this nuclear re-
ceptor only at mid to high micromolar concentrations (Gottlicher
et al., 1992; Berger andMoller, 2002), which are unlikely to occur
in healthy cells (Yamashita et al., 1997), challenges a simplistic
interpretation of this model and suggests that additional ligands
might be implicated in fasting-induced activation of PPAR-a in
liver (Chakravarti, 2009; Kersten, 2014). Our results show that
ketogenesis is substantially dampened, but not completely sup-
pressed, by genetic or pharmacological manipulations that
disrupt histamine-driven OEA biosynthesis. A plausible interpre-
tation of this finding is that OEA acts in concert with FFAs
(and/or, possibly, other endogenous ligands) (Chakravarti,
2009) to engage PPAR-a and promote ketogenesis (Figure 7).
Histamine-releasing neurons housed in the tuberomamillary
nucleus of the hypothalamus regulate circadian feeding and
mediate, in part, the satiety response initiated by OEA mobiliza-
tion in the small intestine (Provensi et al., 2014; DiPatrizio and
Piomelli, 2015). In addition to these central anorexic effects,
Cell M
which depend on H1 receptor activation
(Haas et al., 2008), histamine also contrib-
utes in important ways to the peripheral
control of energy balance and lipid meta-
bolism. Indeed, in mice, genetic H1 recep-
tor deletion causes increased abdominal
adiposity and glucose intolerance (Ma-
saki et al., 2001b), while pharmacological
H1 blockade aggravates HFD-induced
hepatic steatosis (Raveendran et al.,
2014). Similarly, in obese humans,
chronic use of H1 antagonists, which are
commonly prescribed to alleviate allergy
symptoms, is associated with increased
weight gain and insulin resistance (Ratliff
et al., 2010). H1 blockade has been also
implicated in the weight gain and dyslipi-
demia that often accompany the pro-
tracted use of atypical antipsychotic
drugs (Nasrallah, 2008). The mecha-
nism(s) underlying these dysmetabolic
actions is unclear. However, our finding
that the H1 antagonist fexofenadine
disables histamine-dependent signaling
and impairs ketogenesis points to a possible explanation, which
warrants, of course, further investigation.
Limitations of StudyThe present study has several limitations. First, while we demon-
strated that fasting stimulates histamine release frommast cells,
we did not identify the neuro-humoral signal(s) and specific mast
cell population(s) involved in this response. Second, we did not
define the liver cell type(s) involved in histamine-driven OEA
signaling and, consequently, we cannot draw firm conclusions
about the molecular mechanism through which H1 receptor
activation stimulates OEA production. Third, we showed that
histamine-dependent OEA production in liver contributes to
fasting-induced ketogenesis, but did not clarify how OEA
interacts with other endogenous PPAR-a ligands (e.g., FFAs)
to produce this effect. Finally, the potential contribution of
histamine-driven OEA signaling to metabolic disease was not
investigated. Despite these limitations, our experiments reveal
an unexpected new role for mast cell-derived histamine in the
etabolism 29, 91–102, January 8, 2019 99

regulation of fasting-induced liver ketogenesis, a key node of
bioenergetics homeostasis, and raise the intriguing possibility
that dysfunctions in this paracrine signaling mechanism might
contribute to metabolic disorders.
STAR+METHODS
Detailed methods are provided in the online version of this paper
and include the following:
d KEY RESOURCES TABLE
d CONTACT FOR REAGENT AND RESOURCE SHARING
d EXPERIMENTAL MODEL AND SUBJECT DETAILS
B Animals
B Cell Cultures
d METHOD DETAILS
B Experimental Design
B Tissue Collection and Plasma Preparation
B Drug Administrations
B Intrahepatic Histamine Injections
B Intracerebroventricular Infusion of a-FMH
B Lipid Extraction and Fractionation
B LC/MS Analyses
B Ketone Body Measurements
B Gene Expression Analyses
B Chemicals
d QUANTIFICATION AND STATISTICAL ANALYSIS
SUPPLEMENTAL INFORMATION
Supplemental Information includes six figures and one table and can be found
with this article online at https://doi.org/10.1016/j.cmet.2018.09.014.
ACKNOWLEDGMENTS
We thank Dr. T. Feyerabend and Prof. H.R. Rodewald for Cpa3Cre/+ mutant
mice and critical reading of the manuscript; Drs. S. Galli, S. Pontis, N. Realini,
F. Palese, and P. Blandina for advice and support; Drs. A. Basit and M.E.
Blanco for LC/MS analyses; and A. Costa for help with sample collection.
AUTHOR CONTRIBUTIONS
A.M. performed the experiments, analyzed the data, prepared figures and ta-
bles. G.P. and V.V. provided help with some animal experiments. M.B.P.
participated in experimental design. D.P. ideated and overviewed the project,
and wrote the manuscript with contributions from all coauthors. All authors
reviewed the results and approved the final version of the manuscript.
DECLARATION OF INTERESTS
The authors declare no competing interests.
Received: July 18, 2017
Revised: June 11, 2018
Accepted: September 12, 2018
Published: October 11, 2018
REFERENCES
Artmann, A., Petersen, G., Hellgren, L.I., Boberg, J., Skonberg, C., Nellemann,
C., Hansen, S.H., and Hansen, H.S. (2008). Influence of dietary fatty acids on
endocannabinoid and N-acylethanolamine levels in rat brain, liver and small
intestine. Biochim. Biophys. Acta 1781, 200–212.
100 Cell Metabolism 29, 91–102, January 8, 2019
Astarita, G., Di Giacomo, B., Gaetani, S., Oveisi, F., Compton, T.R., Rivara, S.,
Tarzia, G., Mor, M., and Piomelli, D. (2006a). Pharmacological characterization
of hydrolysis-resistant analogs of oleoylethanolamide with potent anorexiant
properties. J. Pharmacol. Exp. Ther. 318, 563–570.
Astarita, G., and Piomelli, D. (2009). Lipidomic analysis of endocannabinoid
metabolism in biological samples. J. Chromatogr. B Analyt. Technol.
Biomed. Life Sci. 877, 2755–2767.
Astarita, G., Rourke, B.C., Andersen, J.B., Fu, J., Kim, J.H., Bennett, A.F.,
Hicks, J.W., and Piomelli, D. (2006b). Postprandial increase of oleoylethanola-
mide mobilization in small intestine of the Burmese python (Python molurus).
Am. J. Physiol. Regul. Integr. Comp. Physiol. 290, R1407–R1412.
Ballerini, C., Aldinucci, A., Luccarini, I., Galante, A., Manuelli, C.,
Blandina, P., Katebe, M., Chazot, P.L., Masini, E., and Passani, M.B.
(2013). Antagonism of histamine H4 receptors exacerbates clinical and
pathological signs of experimental autoimmune encephalomyelitis. Br.
J. Pharmacol. 170, 67–77.
Basit, A., Pontis, S., Piomelli, D., and Armirotti, A. (2016). Ion mobility mass
spectrometry enhances low-abundance species detection in untargeted
lipidomics. Metabolomics 12, 50.
Belcher, N.G., Murdoch, R., Dalton, N., Clark, T.J., Rees, P.J., and Lee, T.H.
(1988). Circulating concentrations of histamine, neutrophil chemotactic activ-
ity, and catecholamines during the refractory period in exercise-induced
asthma. J. Allergy Clin. Immunol. 81, 100–110.
Berger, J., andMoller, D.E. (2002). Themechanisms of action of PPARs. Annu.
Rev. Med. 53, 409–435.
Berthoud, H.R. (2008a). Vagal and hormonal gut-brain communication: from
satiation to satisfaction. Neurogastroenterol. Motil. 20, 64–72.
Berthoud, H.R. (2008b). The vagus nerve, food intake and obesity. Regul. Pept.
149, 15–25.
Berthoud, H.R., and Patterson, L.M. (1996). Anatomical relationship between
vagal afferent fibers and CCK-immunoreactive entero-endocrine cells in the
rat small intestinal mucosa. Acta Anat. (Basel) 156, 123–131.
Bhat, K.N., Arroyave, C.M., Marney, S.R., Stevenson, D.D., and Tan, E.M.
(1976). Plasma histamine changes during provoked bronchospasm in
asthmatic patients. J. Allergy Clin. Immunol. 58, 647–656.
Bongers, G., De Esch, I., and Leurs, R. (2010). Molecular pharmacology of the
four histamine receptors. Adv. Exp. Med. Biol. 709, 11–19.
Borriello, F., Iannone, R., and Marone, G. (2017). Histamine release from mast
cells and basophils. In Histamine and Histamine Receptors in Health and
Disease. Handbook of Experimental Pharmacology, Y. Hattori and R. Seifert,
eds. (Springer), pp. 121–139.
Cadas, H., Di Tomaso, E., and Piomelli, D. (1997). Occurrence and biosyn-
thesis of endogenous cannabinoid precursor, N-arachidonoyl phosphatidyl-
ethanolamine, in rat brain. J. Neurosci. 17, 1226–1242.
Cadas, H., Gaillet, S., Beltramo, M., Venance, L., and Piomelli, D. (1996).
Biosynthesis of an endogenous cannabinoid precursor in neurons and its
control by calcium and cAMP. J. Neurosci. 16, 3934–3942.
Chakravarti, D. (2009). Regulatory mechanisms in transcriptional signaling by
nuclear hormone receptors, and their regulators: implications in physiology
and disease. introduction. Prog. Mol. Biol. Transl. Sci. 87, 15–22.
DiPatrizio, N.V., and Piomelli, D. (2015). Intestinal lipid-derived signals that
sense dietary fat. J. Clin. Invest. 125, 891–898.
Dubois, V., Eeckhoute, J., Lefebvre, P., and Staels, B. (2017). Distinct but com-
plementary contributions of PPAR isotypes to energy homeostasis. J. Clin.
Invest. 127, 1202–1214.
Falus, A., Walcz, E., Brozik, M., Rokita, H., Fust, G., Hajnal, A., andMeretey, K.
(1989). Stimulation of histamine receptors of human monocytoid and hepa-
toma-derived cell lines and mouse hepatocytes modulates the production of
the complement components C3, C4, factor B, and C2. Scand. J. Immunol.
30, 241–248.
Farrell, D.J., Hines, J.E., Walls, A.F., Kelly, P.J., Bennett, M.K., and Burt, A.D.
(1995). Intrahepatic mast cells in chronic liver diseases. Hepatology 22,
1175–1181.

Feyerabend, F., Drucker, H., Laipple, D., Vogt, C., Stekker, M., Hort, N.,
and Willumeit, R. (2012). Ion release from magnesium materials in physio-
logical solutions under different oxygen tensions. J. Mater. Sci. Mater.
Med. 23, 9–24.
Feyerabend, T.B., Gutierrez, D.A., and Rodewald, H.R. (2016). Of mouse
models of mast cell deficiency and metabolic syndrome. Cell Metab. 24, 1–2.
Feyerabend, T.B., Weiser, A., Tietz, A., Stassen, M., Harris, N., Kopf, M.,
Radermacher, P., Moller, P., Benoist, C., Mathis, D., et al. (2011). Cre-
mediated cell ablation contests mast cell contribution in models of antibody-
and T cell-mediated autoimmunity. Immunity 35, 832–844.
Fu, J., Astarita, G., Gaetani, S., Kim, J., Cravatt, B.F., Mackie, K., and Piomelli,
D. (2007). Food intake regulates oleoylethanolamide formation and degrada-
tion in the proximal small intestine. J. Biol. Chem. 282, 1518–1528.
Fu, J., Gaetani, S., Oveisi, F., Lo Verme, J., Serrano, A., RodriguezDe Fonseca,
F., Rosengarth, A., Luecke, H., Di Giacomo, B., Tarzia, G., et al. (2003).
Oleoylethanolamide regulates feeding and body weight through activation of
the nuclear receptor PPAR-alpha. Nature 425, 90–93.
Fu, J., Kim, J., Oveisi, F., Astarita, G., and Piomelli, D. (2008). Targeted
enhancement of oleoylethanolamide production in proximal small intestine
induces across-meal satiety in rats. Am. J. Physiol. Regul. Integr. Comp.
Physiol. 295, R45–R50.
Fu, J., Oveisi, F., Gaetani, S., Lin, E., and Piomelli, D. (2005).
Oleoylethanolamide, an endogenous PPAR-alpha agonist, lowers body weight
and hyperlipidemia in obese rats. Neuropharmacology 48, 1147–1153.
Fulop, A.K., Foldes, A., Buzas, E., Hegyi, K., Miklos, I.H., Romics, L., Kleiber,
M., Nagy, A., Falus, A., and Kovacs, K.J. (2003). Hyperleptinemia, visceral
adiposity, and decreased glucose tolerance in mice with a targeted disruption
of the histidine decarboxylase gene. Endocrinology 144, 4306–4314.
Gaetani, S., Fu, J., Cassano, T., Dipasquale, P., Romano, A., Righetti, L.,
Cianci, S., Laconca, L., Giannini, E., Scaccianoce, S., et al. (2010). The fat-
induced satiety factor oleoylethanolamide suppresses feeding through central
release of oxytocin. J. Neurosci. 30, 8096–8101.
Garbarg, M., Barbin, G., Rodergas, E., and Schwartz, J.C. (1980). Inhibition of
histamine synthesis in brain by alpha-fluoromethylhistidine, a new irreversible
inhibitor: in vitro and in vivo studies. J. Neurochem. 35, 1045–1052.
Garcia-Sainz, J.A., De La Garza, M.C., Contreras-Rodriguez, J.L., and Najera-
Alvarado, A. (1987). Effects of histamine on the metabolism of isolated rat
hepatocytes: roles of H1- and H2-histamine receptors. Mol. Pharmacol. 31,
253–258.
Garcia-Sainz, J.A., Macias-Silva, M., Olivares-Reyes, A., and Romero-Avila,
M.T. (1992). Histamine activates phosphorylase and inositol phosphate
production in Guinea pig hepatocytes. Eur. J. Pharmacol. 227, 325–331.
Gottlicher, M., Widmark, E., Li, Q., and Gustafsson, J.A. (1992). Fatty acids
activate a chimera of the clofibric acid-activated receptor and the glucocorti-
coid receptor. Proc. Natl. Acad. Sci. U S A 89, 4653–4657.
Grabacka, M., Pierzchalska, M., Dean, M., and Reiss, K. (2016). Regulation of
ketone bodymetabolism and the role of PPARalpha. Int. J. Mol. Sci. 17, E2093.
Grimbaldeston, M.A., Chen, C.C., Piliponsky, A.M., Tsai, M., Tam, S.Y., and
Galli, S.J. (2005). Mast cell-deficient W-sash c-kit mutant Kit W-sh/W-sh
mice as a model for investigating mast cell biology in vivo. Am. J. Pathol.
167, 835–848.
Gutierrez, D.A., Muralidhar, S., Feyerabend, T.B., Herzig, S., and Rodewald,
H.R. (2015). Hematopoietic kit deficiency, rather than lack of mast cells, pro-
tects mice from obesity and insulin resistance. Cell Metab. 21, 678–691.
Guzman, M., Lo Verme, J., Fu, J., Oveisi, F., Blazquez, C., and Piomelli, D.
(2004). Oleoylethanolamide stimulates lipolysis by activating the nuclear re-
ceptor peroxisome proliferator-activated receptor alpha (PPAR-alpha).
J. Biol. Chem. 279, 27849–27854.
Haas, H.L., Sergeeva, O.A., and Selbach, O. (2008). Histamine in the nervous
system. Physiol. Rev. 88, 1183–1241.
Huang, Z.L., Mochizuki, T., Qu, W.M., Hong, Z.Y., Watanabe, T., Urade, Y.,
and Hayaishi, O. (2006). Altered sleep-wake characteristics and lack of arousal
response to H3 receptor antagonist in histamine H1 receptor knockout mice.
Proc. Natl. Acad. Sci. U S A 103, 4687–4692.
Igarashi, M., Dipatrizio, N.V., Narayanaswami, V., and Piomelli, D. (2015).
Feeding-induced oleoylethanolamide mobilization is disrupted in the gut of
diet-induced obese rodents. Biochim. Biophys. Acta 1851, 1218–1226.
Igarashi, M., Narayanaswami, V., Kimonis, V., Galassetti, P.M., Oveisi, F.,
Jung, K.M., and Piomelli, D. (2017). Dysfunctional oleoylethanolamide
signaling in a mouse model of Prader-Willi syndrome. Pharmacol. Res.
117, 75–81.
Izzo, A.A., Piscitelli, F., Capasso, R., Marini, P., Cristino, L., Petrosino, S., and
Di Marzo, V. (2010). Basal and fasting/refeeding-regulated tissue levels of
endogenous PPAR-alpha ligands in Zucker rats. Obesity (Silver Spring)
18, 55–62.
Ji, Y., Sakata, Y., Yang, Q., Li, X., Xu, M., Yoder, S., Langhans, W., and Tso, P.
(2012). Activation of rat intestinal mucosal mast cells by fat absorption. Am. J.
Physiol. Gastrointest. Liver Physiol. 302, G1292–G1300.
Kaliner, M. (1989). Asthma and mast cell activation. J. Allergy Clin. Immunol.
83, 510–520.
Kersten, S. (2014). Integrated physiology and systems biology of PPARalpha.
Mol. Metab. 3, 354–371.
Leung, D., Saghatelian, A., Simon, G.M., and Cravatt, B.F. (2006). Inactivation
of N-acyl phosphatidylethanolamine phospholipase D reveals multiple
mechanisms for the biosynthesis of endocannabinoids. Biochemistry 45,
4720–4726.
Li, L., Li, L., Chen, L., Lin, X., Xu, Y., Ren, J., Fu, J., and Qiu, Y. (2015). Effect
of oleoylethanolamide on diet-induced nonalcoholic fatty liver in rats.
J. Pharmacol. Sci. 127, 244–250.
Livak, K.J., and Schmittgen, T.D. (2001). Analysis of relative gene expression
data using real-time quantitative PCR and the 2(-Delta Delta C(T)) method.
Methods 25, 402–408.
Masaki, T., Yoshimatsu, H., Chiba, S., Watanabe, T., and Sakata, T. (2001a).
Central infusion of histamine reduces fat accumulation and upregulates UCP
family in leptin-resistant obese mice. Diabetes 50, 376–384.
Masaki, T., Yoshimatsu, H., Chiba, S., Watanabe, T., and Sakata, T. (2001b).
Targeted disruption of histamine H1-receptor attenuates regulatory effects
of leptin on feeding, adiposity, and UCP family in mice. Diabetes 50,
385–391.
Matsubara, R., Kumagai, K., Shigematsu, H., Kitaura, K., Nakasone, Y.,
Suzuki, S., Hamada, Y., and Suzuki, R. (2017). Fexofenadine suppresses de-
layed-type hypersensitivity in the murine model of palladium allergy. Int. J.
Mol. Sci. 18, E1357.
Montagner, A., Polizzi, A., Fouche, E., Ducheix, S., Lippi, Y., Lasserre, F.,
Barquissau, V., Regnier, M., Lukowicz, C., Benhamed, F., et al. (2016). Liver
PPARalpha is crucial for whole-body fatty acid homeostasis and is protective
against NAFLD. Gut 65, 1202–1214.
Nakamura, T., and Murata, T. (2018). Regulation of vascular permeability in
anaphylaxis. Br. J. Pharmacol. 175, 2538–2542.
Nakamura, Y., Ishimaru, K., Shibata, S., and Nakao, A. (2017). Regulation of
plasma histamine levels by the mast cell clock and its modulation by stress.
Sci. Rep. 7, 39934.
Nasrallah, H.A. (2008). Atypical antipsychotic-induced metabolic side effects:
insights from receptor-binding profiles. Mol. Psychiatry 13, 27–35.
Ogura, Y., Parsons, W.H., Kamat, S.S., and Cravatt, B.F. (2016). A calcium-
dependent acyltransferase that produces N-acyl phosphatidylethanolamines.
Nat. Chem. Biol. 12, 669–671.
Ohtsu, H., Kuramasu, A., Tanaka, S., Terui, T., Hirasawa, N., Hara, M.,
Makabe-Kobayashi, Y., Yamada, N., Yanai, K., Sakurai, E., et al. (2002).
Plasma extravasation induced by dietary supplemented histamine in hista-
mine-free mice. Eur. J. Immunol. 32, 1698–1708.
Ohtsu, H., Tanaka, S., Terui, T., Hori, Y., Makabe-Kobayashi, Y., Pejler, G.,
Tchougounova, E., Hellman, L., Gertsenstein, M., Hirasawa, N., et al. (2001).
Mice lacking histidine decarboxylase exhibit abnormal mast cells. FEBS
Lett. 502, 53–56.
Overmyer, K.A., Thonusin, C., Qi, N.R., Burant, C.F., and Evans, C.R. (2015).
Impact of anesthesia and euthanasia on metabolomics of mammalian tissues:
studies in a C57BL/6J mouse model. PLoS One 10, e0117232.
Cell Metabolism 29, 91–102, January 8, 2019 101

Pearce, F.L. (1986). On the heterogeneity of mast cells. Pharmacology
32, 61–71.
Pfaffl, M.W., Tichopad, A., Prgomet, C., and Neuvians, T.P. (2004).
Determination of stable housekeeping genes, differentially regulated target
genes and sample integrity: BestKeeper–excel-based tool using pair-wise
correlations. Biotechnol. Lett. 26, 509–515.
Piomelli, D. (2013). A fatty gut feeling. Trends Endocrinol. Metab. 24, 332–341.
Prinz, C., Zanner, R., Gerhard, M., Mahr, S., Neumayer, N., Hohne-Zell, B., and
Gratzl, M. (1999). The mechanism of histamine secretion from gastric entero-
chromaffin-like cells. Am. J. Physiol. 277, C845–C855.
Provensi, G., Blandina, P., and Passani, M.B. (2016). The histaminergic system
as a target for the prevention of obesity and metabolic syndrome.
Neuropharmacology 106, 3–12.
Provensi, G., Coccurello, R., Umehara, H., Munari, L., Giacovazzo, G.,
Galeotti, N., Nosi, D., Gaetani, S., Romano, A., Moles, A., et al. (2014).
Satiety factor oleoylethanolamide recruits the brain histaminergic system to
inhibit food intake. Proc. Natl. Acad. Sci. U S A 111, 11527–11532.
Ratliff, J.C., Barber, J.A., Palmese, L.B., Reutenauer, E.L., and Tek, C. (2010).
Association of prescription H1 antihistamine use with obesity: results from the
National Health and Nutrition Examination Survey. Obesity (Silver Spring) 18,
2398–2400.
Raveendran, V.V., Kassel, K.M., Smith, D.D., Luyendyk, J.P., Williams, K.J.,
Cherian, R., Reed, G.A., Flynn, C.A., Csanaky, I.L., Lickteig, A.L., et al.
(2014). H1-antihistamines exacerbate high-fat diet-induced hepatic steatosis
in wild-type but not in apolipoprotein E knockout mice. Am. J. Physiol.
Gastrointest. Liver Physiol. 307, G219–G228.
Rodriguez de Fonseca, F., Navarro, M., Gomez, R., Escuredo, L., Nava, F., Fu,
J., Murillo-Rodriguez, E., Giuffrida, A., Loverme, J., Gaetani, S., et al. (2001).
An anorexic lipid mediator regulated by feeding. Nature 414, 209–212.
Sato, H., Zhang, L.S., Martinez, K., Chang, E.B., Yang, Q., Wang, F., Howles,
P.N., Hokari, R., Miura, S., and Tso, P. (2016). Antibiotics suppress activation
of intestinal mucosalmast cells and reduce dietary lipid absorption in Sprague-
Dawley rats. Gastroenterology 151, 923–932.
102 Cell Metabolism 29, 91–102, January 8, 2019
Schwartz, G.J., Fu, J., Astarita, G., Li, X., Gaetani, S., Campolongo, P., Cuomo,
V., and Piomelli, D. (2008). The lipid messenger OEA links dietary fat intake to
satiety. Cell Metab. 8, 281–288.
Stead, R.H., Colley, E.C., Wang, B., Partosoedarso, E., Lin, J., Stanisz, A., and
Hillsley, K. (2006). Vagal influences over mast cells. Auton. Neurosci.
125, 53–61.
Stead, R.H., Dixon, M.F., Bramwell, N.H., Riddell, R.H., and Bienenstock, J.
(1989). Mast cells are closely apposed to nerves in the human gastrointestinal
mucosa. Gastroenterology 97, 575–585.
Stead, R.H., Tomioka, M., Quinonez, G., Simon, G.T., Felten, S.Y., and
Bienenstock, J. (1987). Intestinal mucosal mast cells in normal and nema-
tode-infected rat intestines are in intimate contact with peptidergic nerves.
Proc. Natl. Acad. Sci. U S A 84, 2975–2979.
Swiader, M.J., and Czuczwar, S.J. (2014). Interaction of famotidine, an H2 his-
tamine receptor antagonist, with conventional antiepileptic drugs in mice.
Pharmacol. Rep. 66, 485–491.
Takahashi, K., Nosaka, S., Morikawa, S., and Inubushi, T. (1998). Hepatic en-
ergy metabolism during ketamine and isoflurane anaesthesia in haemorrhagic
shock. Br. J. Anaesth. 80, 782–787.
Tinoco, A.B., Armirotti, A., Isorna, E., Delgado, M.J., Piomelli, D., and De
Pedro, N. (2014). Role of oleoylethanolamide as a feeding regulator in goldfish.
J. Exp. Biol. 217, 2761–2769.
Wang, K.Y., Tanimoto, A., Yamada, S., Guo, X., Ding, Y., Watanabe, T.,
Watanabe, T., Kohno, K., Hirano, K., Tsukada, H., et al. (2010).
Histamine regulation in glucose and lipid metabolism via histamine recep-
tors: model for nonalcoholic steatohepatitis in mice. Am. J. Pathol. 177,
713–723.
Yamada, S., Tanimoto, A., and Sasaguri, Y. (2016). Critical in vivo roles of his-
tamine and histamine receptor signaling in animal models of metabolic syn-
drome. Pathol. Int. 66, 661–671.
Yamashita, A., Sugiura, T., and Waku, K. (1997). Acyltransferases and transa-
cylases involved in fatty acid remodeling of phospholipids and metabolism of
bioactive lipids in mammalian cells. J. Biochem. 122, 1–16.

STAR+METHODS
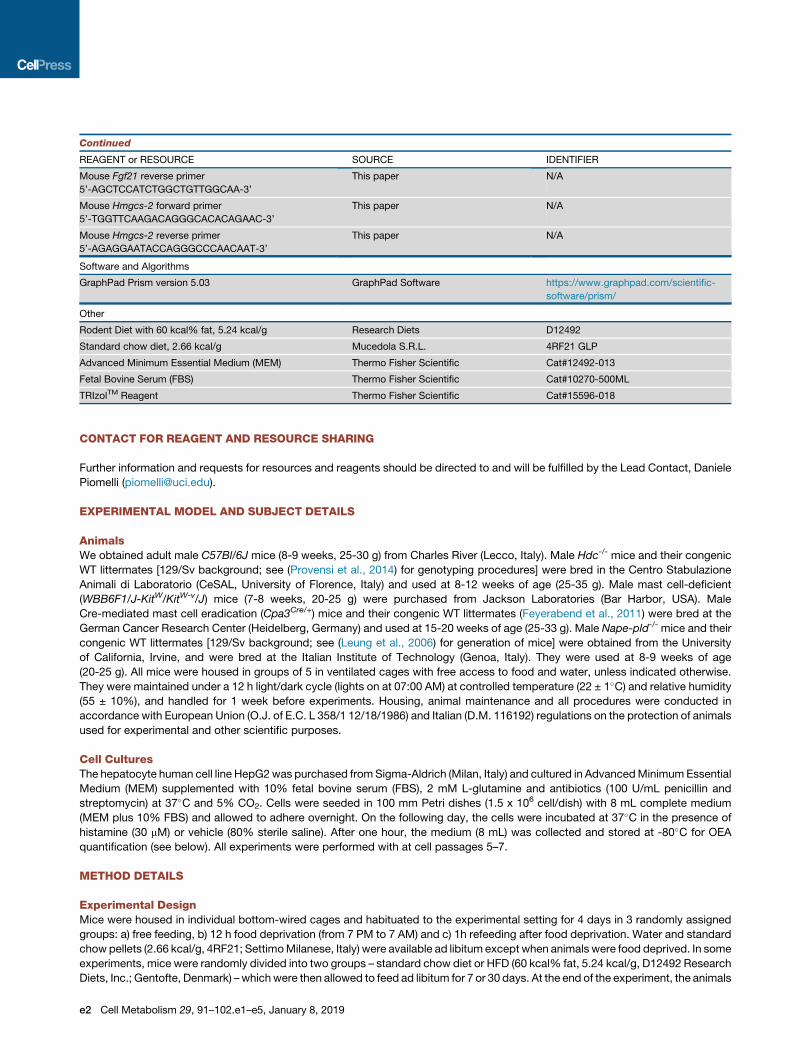
KEY RESOURCES TABLE
REAGENT or RESOURCE SOURCE IDENTIFIER
Chemicals, Peptides, and Recombinant Proteins
1-stearoyl, 2-docosahexaenoyl-phosphatidylethanolamine
N-heptanoyl (N-heptanoyl-PE)
(Basit et al., 2016) N/A
Ciproxifan hydrochloride Sigma-Aldrich Cat#C6492; CAS: 1049741-81-2
Famotidine Sigma-Aldrich Cat#F6889; CAS: 76824-35-6
Fatty acids Sigma-Aldrich Cat#EC10A
Fexofenadine hydrochloride Sigma-Aldrich Cat#F9427; CAS: 153439-40-8
Heparin sodium salt from porcine intestinal mucosa Sigma-Aldrich Cat#H4784-1G; CAS: 9041-08-1
Heptadecanoic acid Sigma-Aldrich Cat#H3500; CAS: 506-12-7
Histamine Sigma-Aldrich Cat#H7125; CAS: 51-45-6
Histamine-a,a,b,b- d4 dihydrochloride ([2H4]-histamine) Sigma-Aldrich Cat#762962
JNJ7777120 Johnson & Johnson Reference Number: 1010888584
L-Glutamine 100X (200mM) EuroClone S.p.A. ECB3000D-20
Oleoyl Ethanolamide (OEA) Cayman Chemicals Cat#90265; CAS: 111-58-0
Oleoyl Ethanolamide-d4 ([2H4]-OEA) Cayman Chemicals Cat#9000552; CAS: 946524-36-3
Palmitoyl Ethanolamide (PEA) Cayman Chemicals Cat#90350; CAS:544-31-0
Palmitoyl Ethanolamide-d4 ([2H4]-PEA) Cayman Chemicals Cat#10007824; CAS: 1159908-45-8
Trypsin-EDTA Sigma-Aldrich T4049-500ML
a-FMH Johnson & Johnson Reference Number: 9101053137
Critical Commercial Assays
iTaqTM Universal SYBR Green Supermix Bio Rad Cat#172-5124 25ML
PureLinkTM DNase Thermo Fisher Scientific Cat#12185-010
PureLinkTM RNA Mini Kit Thermo Fisher Scientific Cat#12183-018A
SuperScript VILOTM cDNA Synthesis Kit Thermo Fisher Scientific Cat#11754-050
b-OHB (Ketone Body) Colorimetric Assay Kit Cayman Chemicals Cat#700190
Experimental Models: Cell Lines
Human hepatocyte cell line (HepG2) Sigma-Aldrich 85011430
Experimental Models: Organisms/Strains
Mouse: C57Bl/6J Charles River JAX 000664
Mouse: Cpa3Cre/+ German Cancer Research Center,
Heidelberg; (Feyerabend et al., 2011)
N/A
Mouse: Hdc-/- CeSAL, University of Florence;
(Ohtsu et al., 2001; Provensi et al., 2014)
N/A
Mouse: Nape-pld-/- University of California, Irvine;
(Leung et al., 2006)
N/A
Mouse: WBB6F1/J-KitW/KitW-v/J The Jackson Laboratory JAX 100410
Oligonucleotides
Mouse Acat-1 forward primer
5’-GTCTGGCTAGTATTTGCAACG-3’
This paper N/A
Mouse Acat-1 reverse primer
5’-TTCAGCCGGTCACATGG-3’
This paper N/A
Mouse Cyp4a10 forward primer
5’-GCTACTCAAGGCTTTCCAGCAG-3’
This paper N/A
Mouse Cyp4a10 reverse primer
5’-CCAGAACCATCTAGGAAAGGCAC-3’
This paper N/A
Mouse Fgf21 forward primer
5’-ATCAGGGAGGATGGAACAGTGG-3’
This paper N/A
(Continued on next page)
Cell Metabolism 29, 91–102.e1–e5, January 8, 2019 e1
Continued
REAGENT or RESOURCE SOURCE IDENTIFIER
Mouse Fgf21 reverse primer
5’-AGCTCCATCTGGCTGTTGGCAA-3’
This paper N/A
Mouse Hmgcs-2 forward primer
5’-TGGTTCAAGACAGGGCACACAGAAC-3’
This paper N/A
Mouse Hmgcs-2 reverse primer
5’-AGAGGAATACCAGGGCCCAACAAT-3’
This paper N/A
Software and Algorithms
GraphPad Prism version 5.03 GraphPad Software https://www.graphpad.com/scientific-
software/prism/
Other
Rodent Diet with 60 kcal% fat, 5.24 kcal/g Research Diets D12492
Standard chow diet, 2.66 kcal/g Mucedola S.R.L. 4RF21 GLP
Advanced Minimum Essential Medium (MEM) Thermo Fisher Scientific Cat#12492-013
Fetal Bovine Serum (FBS) Thermo Fisher Scientific Cat#10270-500ML
TRIzolTM Reagent Thermo Fisher Scientific Cat#15596-018
CONTACT FOR REAGENT AND RESOURCE SHARING
Further information and requests for resources and reagents should be directed to and will be fulfilled by the Lead Contact, Daniele
Piomelli ([email protected]).
EXPERIMENTAL MODEL AND SUBJECT DETAILS
AnimalsWe obtained adult male C57Bl/6J mice (8-9 weeks, 25-30 g) from Charles River (Lecco, Italy). Male Hdc-/- mice and their congenic
WT littermates [129/Sv background; see (Provensi et al., 2014) for genotyping procedures] were bred in the Centro Stabulazione
Animali di Laboratorio (CeSAL, University of Florence, Italy) and used at 8-12 weeks of age (25-35 g). Male mast cell-deficient
(WBB6F1/J-KitW/KitW-v/J) mice (7-8 weeks, 20-25 g) were purchased from Jackson Laboratories (Bar Harbor, USA). Male
Cre-mediated mast cell eradication (Cpa3Cre/+) mice and their congenic WT littermates (Feyerabend et al., 2011) were bred at the
German Cancer Research Center (Heidelberg, Germany) and used at 15-20 weeks of age (25-33 g). Male Nape-pld-/- mice and their
congenic WT littermates [129/Sv background; see (Leung et al., 2006) for generation of mice] were obtained from the University
of California, Irvine, and were bred at the Italian Institute of Technology (Genoa, Italy). They were used at 8-9 weeks of age
(20-25 g). All mice were housed in groups of 5 in ventilated cages with free access to food and water, unless indicated otherwise.
They were maintained under a 12 h light/dark cycle (lights on at 07:00 AM) at controlled temperature (22 ± 1�C) and relative humidity
(55 ± 10%), and handled for 1 week before experiments. Housing, animal maintenance and all procedures were conducted in
accordance with European Union (O.J. of E.C. L 358/1 12/18/1986) and Italian (D.M. 116192) regulations on the protection of animals
used for experimental and other scientific purposes.
Cell CulturesThe hepatocyte human cell line HepG2was purchased fromSigma-Aldrich (Milan, Italy) and cultured in AdvancedMinimumEssential
Medium (MEM) supplemented with 10% fetal bovine serum (FBS), 2 mM L-glutamine and antibiotics (100 U/mL penicillin and
streptomycin) at 37�C and 5% CO2. Cells were seeded in 100 mm Petri dishes (1.5 x 10⁶ cell/dish) with 8 mL complete medium
(MEM plus 10% FBS) and allowed to adhere overnight. On the following day, the cells were incubated at 37�C in the presence of
histamine (30 mM) or vehicle (80% sterile saline). After one hour, the medium (8 mL) was collected and stored at -80�C for OEA
quantification (see below). All experiments were performed with at cell passages 5–7.
METHOD DETAILS
Experimental DesignMice were housed in individual bottom-wired cages and habituated to the experimental setting for 4 days in 3 randomly assigned
groups: a) free feeding, b) 12 h food deprivation (from 7 PM to 7 AM) and c) 1h refeeding after food deprivation. Water and standard
chow pellets (2.66 kcal/g, 4RF21; SettimoMilanese, Italy) were available ad libitum except when animals were food deprived. In some
experiments, mice were randomly divided into two groups – standard chow diet or HFD (60 kcal% fat, 5.24 kcal/g, D12492 Research
Diets, Inc.; Gentofte, Denmark) – whichwere then allowed to feed ad libitum for 7 or 30 days. At the end of the experiment, the animals
e2 Cell Metabolism 29, 91–102.e1–e5, January 8, 2019

were anesthetized with isoflurane (selected because of its minimal impact on liver metabolism) (Overmyer et al., 2015; Takahashi
et al., 1998) and killed by cervical dislocation.
Tissue Collection and Plasma PreparationWe collected blood from the portal vein of anesthetized mice using a 1 mL syringe with 22G needle, and immediately transferred it to
1.5 mL vials containing heparin (0.02 mL). The blood samples were centrifuged for 15 min at 1,000xg and 4�C, plasma layers were
collected and stored at -80�C for further processing. Liver, epididymal white adipose tissue, pancreas and small intestine (jejunum)
were removed immediately, snap-frozen in liquid nitrogen and stored at -80�C.
Drug AdministrationsHistamine antagonists and OEA were administered by intraperitoneal (i.p.) injection 1 h and 2 h, respectively, before sacrifice.
Histamine antagonists (except JNJ7777120) were administered in sterile saline, JNJ7777120 in saline containing 1% ethanol, and
OEA in 80% sterile saline, 10% PEG 400, and 10% Tween 80.
Intrahepatic Histamine InjectionsFor intrahepatic injection, free-feedingmicewere placed in a supine position with the nose andmouth positioned inside amouthpiece
that delivered isoflurane [2% (v/v) in 1 L/min O2]. After disinfection of the surgical area, the skin was removed and a midline incision
was made through the upper abdomen and peritoneum. A portion of the liver was exposed and histamine (0.45 mmol or 0.9 mmol in
sterile saline) was slowly injected into the liver parenchyma using an insulin syringe (injection volume 0.1 mL). 30 min later, the mice
were killed and their livers were collected.
Intracerebroventricular Infusion of a-FMHAnesthesia was performed using a mixture of ketamine (15 mg/kg) and xylazine (2.5 mg/kg). Anesthesized mice were placed in a
stereotaxic frame (Kopf Instruments, Tujunga, USA) and a stainless steel cannula (7 mm in length, outer diameter 0.5 mm, and inner
diameter 0.25 mm) was implanted into the lateral cerebral ventricle and fixed to the skull using dental cement. We used the following
coordinates: antero-posterior (AP) -0.3; lateral (L) ± 1; dorsoventral (DV) -1. A stainless steel microinjection needle was connected
through a polyethylene catheter to a 25 mL Hamilton syringe, and lowered into the lateral ventricle (DV 2.4 mm). After 7 days of
recovery, a-FMH (1 mg/mL in sterile saline) was administered at 1 mL per min for 5 min using an infusion pump. The needle was
left in place for one additional min after each infusion (Provensi et al., 2014).
Lipid Extraction and FractionationWe used a Bligh and Dyer procedure, modified as described (Astarita and Piomelli, 2009). Briefly, frozen tissues (z30-40 mg) were
weighed, transferred to glass vials and homogenized in cold methanol (2 mL) containing [2H4]-OEA, [2H4]-PEA, N-heptanoyl-PE and
heptadecanoic acid as internal standards. Lipids were extracted with chloroform (2mL) and washed with LC/MS-grade water (1 mL).
After centrifugation for 15 min at 2,850xg and 4�C, the organic phases were collected and transferred to a new set of glass vials. To
increase extraction efficiency, the aqueous fractions were extracted again with chloroform (1 mL) and the centrifugation step was
repeated. Both organic phases were pooled and dried under N2. Lipids were reconstituted in chloroform (2 mL) and the organic
extracts were fractionated by Silica Gel G column chromatography (60-A 230-400 mesh; Sigma-Aldrich, Milan, Italy). OEA, PEA
and fatty acids were eluted from the silica column with 2 mL of chloroform/methanol (9:1, v/v), N-acyl-PE species were eluted
with 2 mL of chloroform/methanol (1:1, v/v). The solvent was evaporated under N2 and lipids were reconstituted in methanol/
chloroform (0.1 mL; 9:1, v/v) and transferred to glass vials for LC/MS analyses.
LC/MS AnalysesWe measured OEA using a Xevo TQ UPLC-MS/MS system equipped with a reversed-phase BEH C18 column (2.1350 mm, 1.7 mm
particle size) (Waters, Milford, USA). The mobile phase consisted of 0.1% formic acid in water as solvent A and 0.1% formic acid in
acetonitrile as solvent B. A linear gradient was used: 0.0–0.5 min 20% B; 0.5–2.5 min 20 to 100% B; and 2.5–3.0 min maintained at
100% B. The column was reconditioned to 20% B for 1 min. Analysis time was 4 min and the injection volume was 5 mL. The mass
spectrometer was operated in the positive electrospray ionization (ESI) mode and quantifications were performed using the multiple
reaction monitoring (MRM) transition 326>62 for OEA, 330>66 for [2H4]-OEA, 300>62 for PEA and 304>66 for [2H4]-PEA. Capillary
voltage was 3 kV. Cone voltage and collision energy values were 25 V and 20 eV, respectively. Source temperature was 120�C.Desolvation gas and cone gas (nitrogen) flows were 800 L/h and 20 L/h, respectively. Desolvation temperature was 450�C. The limit
of quantification was 0.5 fmol on column.
N-acyl-PE species were identified and quantified using a Xevo TQ UPLC-MS/MS system equipped with a reversed-phase HSS
T3 C18 column (2.1350 mm, 1.8 mm particle size) (Waters). The mobile phase consisted of 10 mM ammonium formate (pH=5.0)
in acetonitrile/water (60:40, v/v) as solvent A and 10 mM ammonium formate (pH=5.0) in acetonitrile/isopropanol (10:90, v/v) as
solvent B. A linear gradient was used: 0.0–1.0 min 05% B; 1.0–7.0 min 0.5 to 100% B; and 7.0–7.9 min maintained at 100% B.
The column was reconditioned to 50% B for 1 min. The total analysis time was 9 min and the injection volume was 5 mL. The
mass spectrometer was operated in the positive ESI mode and quantification was performed using the MRM transitions
reported in Table S1. Capillary voltage was 3 kV. Cone voltage and collision energy values were 30 V and 25 eV, respectively. Source
Cell Metabolism 29, 91–102.e1–e5, January 8, 2019 e3

temperature was 120�C. Desolvation gas and cone gas (nitrogen) flows were 800 L/h and 20 L/h, respectively. Desolvation temper-
ature was 450�C. The limit of quantification was 0.5 fmoles on column.
We measured oleic acid using an Acquity UPLC system coupled with a Xevo TQ-MS triple quadrupole mass spectrometer.
Separation was carried out on aHSSC18 column (2.1 x 100mm, 1.7 mmparticle size) (Waters) at a flow rate of 0.4mL/min. Themobile
phase consisted of 20 mM ammonium acetate in water as solvent A and acetonitrile/isopropyl alcohol (1:1, v/v) as solvent B. A linear
gradient was used: 0.0–0.5 min 50% B; 0.5–3.5 min 50 to 100% B; 3.5–4.5 min maintained at 90% B; 4.5 to 5.5 min 90 to 100% B;
and maintained at 100% B for further 1.5 min. The column was reconditioned to 50% B for 1.5 min. Analysis time was 9 min and
the injection volume was 5 mL. The mass spectrometer was operated in the negative ESI mode and quantification was performed
using the MRM transition 281.2>281.2 and 269.2>269.2 for heptadecanoic acid (internal standard). Capillary voltage was 2.5 kV.
Cone voltage and collision energy were 25 V and 5 eV, respectively. Source temperature was 120�C. Desolvation gas and cone
gas (nitrogen) flows were 800 L/h and 50 L/h, respectively. Desolvation temperature was 400�C. The limit of quantification was
50 fmoles on column.
For histamine analysis, we transferred plasma samples (0.1 mL) to 1.5 mL plastic vials and precipitated proteins by addition of cold
acetonitrile (0.5 mL) containing [2H4]-histamine (100 nM) as internal standard. Samples were stirred for 1 min and centrifuged for
10 min at 3,000xg and 4�C. The supernatants were collected in glass vials, dried under N2, reconstituted in LC/MS-grade water
(0.1mL) and transferred to LC/MS vials. Separately, a calibration curve was prepared in histamine-depleted plasma (HDP) as follows.
HDP was prepared by adding activated charcoal (0.3 g) to 5 mL of mouse plasma and incubating the suspension at 37�C for 2 h with
stirring. The charcoal was removed by centrifugation for 10 min at 18,800xg. Authentic histamine was added to HDP at concentra-
tions ranging from 10 nM to 1000 nM along with [2H4]-histamine (100 nM). LC/MS analyses were conducted using a Xevo TQ
UPLC-MS/MS system equipped with an Acquity BEH HILIC column (2.13100 mm, 1.7 mm particle size) (Waters). The mobile phase
consisted of 0.5% formic acid in 25 mM ammonium formate as solvent A and acetonitrile as solvent B. A linear gradient was used:
0.0–0.5 min 98% B; 0.5–2.0 min 98% to 50% B; and 2.0–3.0 min maintained at 50% B. The column was reconditioned to 98% B for
1.5 min. Analysis time was 4.5 min and the injection volume was 5 mL. The mass spectrometer was operated in the positive ESI
mode and quantifications were performed using the MRM transitions 112 [M+H]+>95 [M-NH3+H]+ for histamine and 116>99 for
[2H4]-histamine. The capillary voltage was 2.8 kV. The cone voltage and collision energy values were 35 V and 15 eV, respectively.
Desolvation temperature was 450�C. Desolvation gas and cone gas (nitrogen) were 800 L/h and 50 L/h, respectively. The limit of
quantification was 50 fmoles on column.
Ketone Body Measurementsb-OHB was measured in plasma and liver samples using a colorimetric assay kit (Cayman Chemicals), following manufacturer’s
instructions.
Gene Expression AnalysesWe extracted total RNA from liver tissue using TRIzolTM reagent (Thermo Fisher Scientific, Monza, Italy) and quantified with the
PureLinkTM RNA Mini Kit (Thermo Fisher Scientific) as directed by the supplier. Samples were rendered genomic DNA-free by
treatment with DNase (PureLinkTM DNase, Thermo Fisher Scientific, Monza, Italy). cDNA was synthesized from 1 mg of total RNA
by using SuperScript VILOTM cDNA Synthesis Kit (Thermo Fisher Scientific) following manufacturer’s instructions. First-strand
cDNA was amplified using the iTaqTM Universal SYBR Green Supermix (Bio-Rad, Milan, Italy). The primer sequences were:
Acetyl-CoA acetyltransferase-1 (Acat-1) forward: 5’-GTCTGGCTAGTATTTGCAACG-3’; reverse: 5’-TTCAGCCGGTCACATGG-3’;
b-Hydroxy-b-methylglutaryl-CoA synthase-2 (Hmgcs-2) forward: 5’-TGGTTCAAGACAGGGCACACAGAAC-3’; reverse: 5’-AGAG
GAATACCAGGGCCCAACAAT-3’; Fibroblast growth factor 21 (Fgf21) forward: 5’-ATCAGGGAGGATGGAACAGTGG-3’; reverse:
5’-AGCTCCATCTGGCTGTTGGCAA-3’; Cytochrome P450, family 4, subfamily a, polypeptide 10 (Cyp4a10) forward: 5’-GCTACT
CAAGGCTTTCCAGCAG-3’; reverse: 5’-CCAGAACCATCTAGGAAAGGCAC-3’. Real-time PCR reactions were performed using
ViiA�7 Real-Time PCR detection system (Thermo Fisher Scientific). Thermal cycling conditions were: 50�C for 2 min followed by
an initial denaturation step at 95�C for 10 min, followed by 40 cycles, where each cycle was performed at 95�C for 15 s and at
60�C for 60 s. The Bestkeeper software (Pfaffl et al., 2004) was used to determine the expression stability and the geometric
mean of three different housekeeping genes [b-Actin, Hypoxanthine-guanine phosphoribosyltransferase (Hgprt) andGlyceraldehyde
phosphate dehydrogenase (Gapdh)]. The relative quantity of genes of interest was calculated by the 2-DDCt method (Livak and
Schmittgen, 2001). Data are reported as fold change relative to control groups.
ChemicalsWe purchased OEA, [2H4]-OEA, PEA and [2H4]-PEA from Cayman Chemicals (Ann Arbor, Michigan, USA). Fexofenadine, famotidine,
ciproxifan, heptadecanoic acid, fatty acids, histamine, and [2H4]-histamine (histamine-a,a, b, b-2H4) were from Sigma-Aldrich (Milan,
Italy). 1-stearoyl, 2-docosahexaenoyl-phosphatidylethanolamine N-heptanoyl (N-heptanoyl-PE) was synthesized in the lab as
described (Basit et al., 2016). a-FMH and JNJ7777120 were a generous gift from Dr. Nicholas Carruthers (Johnson & Johnson;
San Diego, USA).
e4 Cell Metabolism 29, 91–102.e1–e5, January 8, 2019

QUANTIFICATION AND STATISTICAL ANALYSIS
Datawere evaluated using Student t-test, One-way or Two-way ANOVA followed by Tukey’s or Bonferroni’s post hoc tests, as appro-
priate. Differences between groups were considered statistically significant if P < 0.05. Data were presented as mean ± SEM.
Significant outliers were excluded using the Grubbs’ test, considered statistically significant at P < 0.05. Statistical analyses were
performed using GraphPad Prism version 5.03 (GraphPad Software Inc., San Diego, CA, USA).
Cell Metabolism 29, 91–102.e1–e5, January 8, 2019 e5