MassARRAY multigene screening combined with LDL-C and ...
10
Page 1/10 MassARRAY multigene screening combined with LDL-C and sdLDL-C detection for more favorable outcomes in type 2 diabetes mellitus therapy Yong Tian Pingdingshan People's Hospital No.1 Junhong Wang Pingdingshan People's Hospital No.1 Yanxiao Liu Pingdingshan People's Hospital No.1 Xiangguang Luo Shanghai Biotecan Pharmaceuticals Co., Ltd Ziying Yao Shanghai Biotecan Pharmaceuticals Co., Ltd Xinjun Wang Translational Medical Center for Stem Cell Therapy and Institute for Regenerative Medicine, Shanghai East Hospital, Shanghai Key Laboratory of Signaling and Disease Research, School of Life Sciences and Technology, Tongji University, Shanghai, China Yuanyuan Zhang Wellbody.com Cheng Xu ( [email protected] ) Shanghai Biotecan Pharmaceuticals Co., Ltd Xiaoyu Zhao ( [email protected] ) Fudan University https://orcid.org/0000-0001-8353-3109 Research article Keywords: MassARRAY, LDL-C, sdLDL-C, Type 2 diabetes mellitus, Cardiovascular disease Posted Date: March 2nd, 2021 DOI: https://doi.org/10.21203/rs.3.rs-44331/v3 License: This work is licensed under a Creative Commons Attribution 4.0 International License. Read Full License Version of Record: A version of this preprint was published on March 17th, 2021. See the published version at https://doi.org/10.1186/s12920-021-00937-8.
-
Upload
khangminh22 -
Category
Documents
-
view
3 -
download
0
Transcript of MassARRAY multigene screening combined with LDL-C and ...

Page 1/10
MassARRAY multigene screening combined with LDL-C and sdLDL-Cdetection for more favorable outcomes in type 2 diabetes mellitus therapyYong Tian
Pingdingshan People's Hospital No.1Junhong Wang
Pingdingshan People's Hospital No.1Yanxiao Liu
Pingdingshan People's Hospital No.1Xiangguang Luo
Shanghai Biotecan Pharmaceuticals Co., LtdZiying Yao
Shanghai Biotecan Pharmaceuticals Co., LtdXinjun Wang
Translational Medical Center for Stem Cell Therapy and Institute for Regenerative Medicine, Shanghai East Hospital, Shanghai Key Laboratory of Signalingand Disease Research, School of Life Sciences and Technology, Tongji University, Shanghai, ChinaYuanyuan Zhang
Wellbody.comCheng Xu ( [email protected] )
Shanghai Biotecan Pharmaceuticals Co., LtdXiaoyu Zhao ( [email protected] )
Fudan University https://orcid.org/0000-0001-8353-3109
Research article
Keywords: MassARRAY, LDL-C, sdLDL-C, Type 2 diabetes mellitus, Cardiovascular disease
Posted Date: March 2nd, 2021
DOI: https://doi.org/10.21203/rs.3.rs-44331/v3
License: This work is licensed under a Creative Commons Attribution 4.0 International License. Read Full License
Version of Record: A version of this preprint was published on March 17th, 2021. See the published version at https://doi.org/10.1186/s12920-021-00937-8.

Page 2/10
Abstract
BackgroundTo determine the clinical value of multigene polymorphisms, LDL-C and sdLDL-C on T2DM therapy.
MethodsIn total, 352 T2DM patients before and after treatment and 48 healthy individuals were enrolled in this study. LDL-C and sdLDL-C were detected in 352 T2DMpatients and 48 healthy individuals by Quantimetrix Lipoprint System. The 11 gene polymorphisms—HTR3B (rs2276307, A > G), APOE (rs7412, c.526C > T),APOE (rs429358, c.388T > C), CYP2C9*3 (rs1057910, c.1075A > C), KIF6 (rs20455, c.2155T > C), HMGCR (rs17238540, T > G), HMGCR (rs17244841, A > T),ABCB1 (rs2032582, c.2677G > T/A), HTR7 (rs1935349, C > T), SLCO1B1 (rs4149056, c.521T > C), and CETP (rs708272, G > A)—were screened in these 352T2DM patients by the Agena Bioscience MassARRAY system before therapy.
ResultsGenetic polymorphisms associated with T2DM and statin effects in pretreatment patients were detected, then results showed that all 11 genes hadheterozygous mutation, and 7 genes had homozygous mutation in 352 T2DM patients, more speci�cally re�ected that these gene polymorphisms werecommon in Chinese T2DM patients. LDL-C and sdLDL-C were detected before and after treatment, sdLDL mainly existed in T2DM patients, and T2DM patientshad higher mean levels of sdLDL-C than healthy people. After pharmacotherapy, the coincidence rates of decreases in LDL-C and sdLDL-C levels were 88.35%(311/352) and 84.09% (296/352), consistent with patients in remission.
ConclusionsGene polymorphisms related to pharmacotherapy were common in Chinese T2DM patients. And the expression of LDL-C and sdLDL-C was consistent with theT2DM disease course. Combined multigene screening before therapy and LDL-C and sdLDL-C detection before and after therapy could better assist T2DMtreatment.
BackgroundDiabetes mellitus is a metabolic disorder characterized by consistently elevated blood glucose[1, 2]. According to 2014 epidemiological data, approximately8.3% of the world adult population has primary type 2 diabetes mellitus (T2DM)[3]. T2DM is associated with microvascular and macrovascularcomplications[4] that lead to cardiovascular or cerebrovascular issues[5]. Cerebral infarction in people with T2DM exhibits a different clinical patterncompared with that in patients without T2DM[6]. Therefore, T2DM is a powerful cardiovascular disease (CVD) risk factor[7].
Low-density lipoprotein cholesterol (LDL-C) is a major target for CVD prevention, and the UK Prospective Diabetes Study (UKPDS) demonstrated that LDL-C isa strong CVD risk factor in subjects with T2DM[7]. Many previous studies have shown that LDL phenotype may be divided into Pattern A and Pattern Baccording to particle size or density distributions, by a variety of laboratory methods measure, including analytical ultracentrifugation, densityultracentrifugation by vertical auto pro�le (VAP), segmented gradient gel electrophoresis (sGGE), tube gel electrophoresis (TGE), nuclear magnetic resonance(NMR), or ion mobility (IM)[8]. Pattern A consists of LDL-1 and LDL-2 subfractions, which named larger buoyant LDL (lbLDL). Pattern B consists of LDL-3through LDL-7, which known as small dense LDL (sdLDL), and different LDL subfractions vary in their risk pro�les[9–11]. Mean 10-year follow-up data innondiabetic �rst-degree relatives (FDR) of consecutive patients with T2DM 30–70 years old showed that a higher LDL-C level was signi�cantly associatedwith a higher risk of T2DM in high-risk individuals in Iran[12]. Total cholesterol, LDL-C, triglyceride and small dense LDL-C (sdLDL-C) levels were allsigni�cantly higher in diabetes patients than in nondiabetic individuals, and the elevation of serum sdLDL-C in patients with sustained hypertension suggeststhe establishment of atherogenic complications among diabetes patients[13, 14]. Therefore, the diagnosis and treatment of dyslipidemia is a cornerstone ofdiabetes mellitus management.
Statins are a common prescription medication for cholesterol reduction, and several intervention trials with statins have demonstrated the bene�cial effect oflowering LDL-C in both primary and secondary CVD prevention, especially in subjects with T2DM[15, 16]. To ensure the T2DM treatment effect, genetic testingwas recommended to patients before medication administration[17–24]. SNPs in the HTR3B and HTR7 genes were signi�cantly associated with the myalgiascore and may affect the development of myalgia in statin-treated patients[17]. The APOE rs429358 and rs7412 polymorphisms were mainly associated withLDL-C and plasma total antioxidant capacity (T-AOC) levels (p < 0.05)[18]. Furthermore, CYP2C9*3 (1075A > C) was related to �uvastatin pharmacokinetics inChinese populations[19]. Being a carrier of the c.2155T > C variant of the KIF6 gene negatively impacts patient responses to simvastatin, atorvastatin orrosuvastatin in terms of lipid-lowering effects[20]. In addition, HMGCR mutations cause a signi�cant reduction in total cholesterol and LDL-C levels[21]. TheSLCO1B1 c.521T > C variant signi�cantly increased exposure to simvastatin acid by approximately 40% (p < 0.05)[22]. ABCB1 (rs2032582: 2677G > T/A) wassigni�cantly associated with atorvastatin-induced liver injury (p = 0.00068)[23]. CETP rs708272 SNP together with statin therapy may show a favorableantiatherogenic effect[24].
Although there are many reports about the excellent predictive performance of sdLDL-C for cardiovascular disease and T2DM, we still need to more preciselycon�rm the therapeutic effect of LDL-C or sdLDL-C in T2DM, and perhaps LDL subfractions have more precise clinical applications in T2DM. To improveT2DM therapy, multigene detection was performed before treatment by an Agena Bioscience MassARRAY system, which is an advanced detection system

Page 3/10
based on MALDI-TOF MS technology and can detect dozens of gene loci in one sample[25]. The study �owchart is shown in Fig. 1a. A total of 352 T2DMpatients from Pingdingshan People’s Hospital No. 1 (Henan, China) were enrolled. Samples from T2DM patients underwent multigene detection beforetreatment, and LDL-C and sdLDL-C expression were evaluated before and after treatment with statins until the disease was improving. Finally, the data wereanalyzed by GraphPad Prism 5 statistical software.
Methods
SamplesA total of 400 subjects were recruited from Pingdingshan People’s Hospital No. 1 (Henan, China), including 352 T2DM patients (194 males and 158 females,60.63 years mean age) and 48 healthy people (34 males and 14 females, 45.38 years mean age) (Table 1), from May 2018 to Jan 2020. All subjects signed aninformed consent form before the study. Permission to use these samples was obtained from the Hospital Ethics Committees. Before detection, peripheralblood samples (1 ml each) were extracted from subjects and subjected to centrifugation at 800 × g for 10 min to obtain supernatant plasma samples (0.4 mleach) for LDL-C detection and peripheral blood cell sediment for MassARRAY SNP detection. The T2DM therapy guidance and remission evaluation criteriawere following Guidelines for the Prevention and Treatment of Type 2 Diabetes in China (2017 Edition).
Table 1Participant information (prior to treatment)
T2DM patients (Mean ± SD) Healthy people (Mean ± SD)
Male
(n = 194)
Female
(n = 158)
All
(n = 352)
Male
(n = 34)
Female
(n = 14)
All
(n = 48)
Age (year) 58.27 ± 12.44 63.52 ± 13.10 60.63 ± 12.99 45.82 ± 8.67 44.29 ± 6.07 45.38 ± 7.97
Body mass index (kg/m2) 26.31 ± 3.29 26.06 ± 4.79 26.20 ± 4.03 24.04 ± 1.94 22.96 ± 1.99 23.72 ± 1.99
LDL-1(mg/dl) 17.68 ± 9.52 19.71 ± 9.82 18.59 ± 9.69 22.47 ± 11.59 25.93 ± 12.16 23.48 ± 11.74
LDL-2(mg/dl) 21.33 ± 8.90 21.80 ± 8.90 21.54 ± 8.89 20.29 ± 5.71 21.64 ± 5.09 20.69 ± 5.52
LDL-3(mg/dl) 12.79 ± 5.83 11.63 ± 6.50 12.27 ± 6.16 7.85 ± 4.55 7.86 ± 3.68 7.85 ± 4.28
LDL-4(mg/dl) 6.65 ± 5.54 6.38 ± 5.35 6.53 ± 5.45 1.85 ± 2.72 1.71 ± 2.67 1.81 ± 2.68
LDL-5(mg/dl) 3.47 ± 4.64 3.43 ± 4.14 3.45 ± 4.42 0 0 0
LDL-6(mg/dl) 0.85 ± 1.41 0.71 ± 1.74 0.79 ± 1.55 0 0 0
LDL-7(mg/dl) 0.29 ± 0.78 0.1 ± 0.45 0.20 ± 0.64 0 0 0
Total cholesterol (mmol/l) 4.45 ± 1.34 4.61 ± 1.04 4.54 ± 1.10 3.59 ± 0.72 3.96 ± 0.49 3.70 ± 0.68
Total triglycerides (mmol/l) 2.37 ± 1.80 2.86 ± 10.10 2.59 ± 6.89 1.42 ± 0.82 1.16 ± 0.42 1.34 ± 0.73
Plasma HDL-C (mmol/l) 1.12 ± 0.31 1.88 ± 8.34 1.46 ± 5.60 1.185 ± 0.27 1.33 ± 0.11 1.23 ± 0.24
Plasma LDL-C (mmol/l) 2.47 ± 0.86 2.58 ± 0.78 2.52 ± 0.83 2.04 ± 0.57 2.27 ± 0.44 2.11 ± 0.54
FBG (mmol/l) 8.42 ± 3.22 8.01 ± 3.25 8.24 ± 3.24 5.40 ± 1.08 4.88 ± 0.49 5.25 ± 0.97
SBP (mmHg) 141.95 ± 21.07 142.92 ± 18.68 142.39 ± 20.01 113.65 ± 12.66 109.64 ± 13.69 112.48 ± 12.95
DBP (mmHg) 86.19 ± 12.38 80.17 ± 12.04 83.49 ± 12.57 76.18 ± 7.24 75.86 ± 6.72 76.08 ± 7.03
Heart rate (bpm) 83.60 ± 14.22 82.55 ± 13.10 83.13 ± 13.72 80.29 ± 7.69 82.50 ± 7.06 80.94 ± 7.50
SCr (µmol/l) 74.50 ± 33.83 58.22 ± 21.33 67.17 ± 29.96 74.97 ± 11.15 60.93 ± 5.86 70.88 ± 11.76
Hcy (µmol/l) 14.20 ± 8.92 10.77 ± 3.82 12.66 ± 7.29 13.50 ± 3.49 11.76 ± 2.96 13.00 ± 3.41
GHb (%) 8.41 ± 1.77 8.59 ± 2.18 8.49 ± 1.96 4.94 ± 0.53 4.97 ± 0.55 4.94 ± 0.53
LDL-C detectionFirst, total cholesterol, total triglycerides, plasma HDL-C, and plasma LDL-C were tested by PTS PANELS Lipid Panel Test Strips (PTS diagnostics, NO: PTS-1710) and analyzed by CardioChek® PA (PTS diagnostics, USA) for LDL-C subfraction auxiliary analysis. Then, LDL-C subfraction detection was processed bya Quantimetrix Lipoprint System LDL Subfraction Kit (REF48-7002, Manhattan Beach, CA, USA)[26]. In detail, the gel tubes were �rst removed from the jar andplaced in the preparation rack, and the storage buffer was completely removed from the top of the gels. Then, 25 µl plasma samples were added to each tube,and 200 µl of Lipoprint loading gel was put into each tube. Then, a strip of Para�lm was placed between the gel tubes and preparation rack cover. The loadinggel with the specimen was mixed by reverse blending the preparation rack several times.
This loading gel was photopolymerized for 30 min by the preparation light, and then each gel tube was removed from the preparation rack and carefullyinserted into the silicone adapter of the upper chamber. One hundred milliliters of electrolyte buffer solution were placed in the lower chamber, while 200 ml of

Page 4/10
this solution was placed in the upper chamber. The electrophoresis chamber lid was put in place and connected to the power source. The power source wasadjusted to deliver a current of 3 mA per gel tube, and the samples were electrophoresed at 500 V for 60 min. The power was turned off after theelectrophoresis was complete, the chamber lid was removed, and the electrolyte buffer in the upper chamber was discarded. Finally, the gel tube was put intothe preparation rack and analyzed.
MassARRAY SNP detectionThe MassARRAY iPLEX Gold multiple genotyping analysis system (Agena Bioscience, Inc.) was used, and the reagents contained Agena PCR reagent, AgenaSAP reagent, and Agena iPLEX reagent. For the test details, peripheral blood cell sediment was extracted following the reagent’s protocol (TIANGEN, DP348).PCR mixtures were obtained via the Agena PCR reagent set and start PCR procedures, and then these mixtures were treated with shrimp alkaline phosphatase(SAP). After extending the reaction, the samples underwent desalination processing and dispensing on the chip, were then analyzed by MALDI-TOF MS.MassARRAY primers are shown in Table 2.
Table 2MassARRAY primers
Gene SNP_ID Forward Primer Sequence Reverse Primer Sequence UEP Sequence
HTR3B rs2276307 ACGTTGGATGAAGTCCCTGTTCTTGGGTGA ACGTTGGATGCTTTGGCCTTCTCTCTTGGG CTCTTGGGCCAAGGA
APOE rs7412 ACGTTGGATGGCCCCGGCCTGGTACACTG ACGTTGGATGACCTGCGCAAGCTGCGTAA CGATGACCTGCAGAAG
APOE rs429358 ACGTTGGATGGAGCATGGCCTGCACCTCG ACGTTGGATGCTGTCCAAGGAGCTGCAGG ATGACATGGAGGACGTG
CYP2C9*3 rs1057910 ACGTTGGATGATGCAAGACAGGAGCCACAT ACGTTGGATGTGTCACAGGTCACTGCATGG GTGGGGAGAAGGTCAA
KIF6 rs20455 ACGTTGGATGCCGGTGAGTTCTCACCTTAC ACGTTGGATGCGATCACACGAAGCCATTTC CTGACTCCCAGCATGAA
HMGCR rs17238540 ACGTTGGATGGGACACAATGGATTAGGCTG ACGTTGGATGGAGACTATGTATCACTCACC GGTCTTTTCCAAACTCTTT
HMGCR rs17244841 ACGTTGGATGCACACCATTGCACATTGCAC ACGTTGGATGCAGGTATTCAAGATACAAAG AAGTATGATTGTAATATAAAGGAT
ABCB1 rs2032582 ACGTTGGATGGTCTGGACAAGCACTGAAAG ACGTTGGATGAGTAAGCAGTAGGGAGTAAC CCTCTGACTCACCTTCCCAG
HTR7 rs1935349 ACGTTGGATGGTGTCTGTGGTCAGGTGATA ACGTTGGATGTATTTCCTTGGCTGCCAGTC AAATAGATTGTCCAGACATGA
SLCO1B1 rs4149056 ACGTTGGATGAATCTGGGTCATACATGTGG ACGTTGGATGCCAATGGTACTATGGGAGTC CCCAAGCATATTACCCATGAAC
CETP rs708272 ACGTTGGATGTGTCTGAGACCCAGAATCAC ACGTTGGATGTCTTTACCCCCTGACTCAAC CGGCGCAGATCTGAACCCTAACT
Statistical analysisData were analyzed by GraphPad Prism 5 statistical software (GraphPad Software, Inc., San Diego, CA, USA). Figure 1b of 11 gene polymorphisms analysis of352 T2DM patients was by GraphPad Prism 5 statistical software. Figure 2a-2c LDL-C subfraction detection were analysed by GraphPad Prism 5 statisticalsoftware and p-value of < 0.05 was considered to indicate a statistically signi�cant difference. Figure 2d of ROC analysis for 352 T2DM patients and 48healthy people was by GraphPad Prism 5 statistical software. Figure 3 LDL-C and sdLDL-C monitoring in T2DM patients was analysed by GraphPad Prism 5statistical software, and p-value of < 0.05 was considered to indicate a statistically signi�cant difference.
ResultsMultitudinous gene polymorphisms in Chinese T2DM patients.
Many studies have shown that gene polymorphisms in�uence T2DM therapeutic effects[17–24]. SNPs in the HTR3B, HTR7 or ABCB1 genes were associatedwith myalgia or liver injury[17, 23]. APOE and HMGCR mutations were associated with LDL-C levels[18, 21]. CETP, KIF6, SLCO1B1, and CYP2C9*3 were relatedto the statin effect[19, 20, 22, 24]. To check genetic polymorphisms in Chinese T2DM patients, HTR3B (rs2276307, A > G), APOE (rs7412, c.526C > T), APOE(rs429358, c.388T > C), CYP2C9*3 (rs1057910, c.1075A > C), KIF6 (rs20455, c.2155T > C), HMGCR (rs17238540, T > G), HMGCR (rs17244841, A > T), ABCB1(rs2032582, c.2677G > T/A), HTR7 (rs1935349, C > T), SLCO1B1 (rs4149056, c.521T > C), and CETP (rs708272, G > A) were detected by the MassARRAY systembefore patients underwent statin therapy (Fig. 1b and Table 2).
All 11 mutation loci were checked; and we found all 11 genes had heterozygous mutation, and 7 genes had homozygous mutation in 352 T2DM patients(Fig. 1b). KIF6 (rs20455, c.2155T > C) had the highest heterozygous mutation (47.44%, n = 167), while ABCB1 (rs2032582, c.2677G > T/A) had the highesthomozygous mutation (21.31%, n = 75) in these patients (Fig. 1b). These results re�ected that gene polymorphisms were common in Chinese T2DM patients,and that gene polymorphism detection before treatment had a certain signi�cance for patients. For instance, SLCO1B1 was related to myopathy; this testresult showed that SLCO1B1 (rs4149056, 521CC) was harbored by 9.09% (n = 32) of patients, and patients with this genotype had a high risk of myopathy andrhabdomyolysis[27]. SLCO1B1 (rs4149056, 521TC) was carried by 17.90% (n = 63) of patients, and these patients had a medium risk of myopathy andrhabdomyolysis, with statins tolerated at a medium dose (Fig. 1b). 2019 ESC/EAS guidelines for the management of dyslipidemia indicates that CYP2C8,CYP2C9, CYP2C19, and CYP2D6 are frequently involved in the metabolism of statins[28]. In this study, CYP2C9*3 (rs1057910, c.1075A > C) AA, AC, and CCgenotypes were carried by 89.77%, 10.23%, and 0% of the patients, respectively, and the AC genotype was associated with a high risk of myopathy after�uvastatin was used[19]. Therefore, genotype evaluation is strongly necessary evaluation for T2DM patients before treatment therapy.
sdLDL-C subfractions had superior property in T2DM screening.
Page 5/10
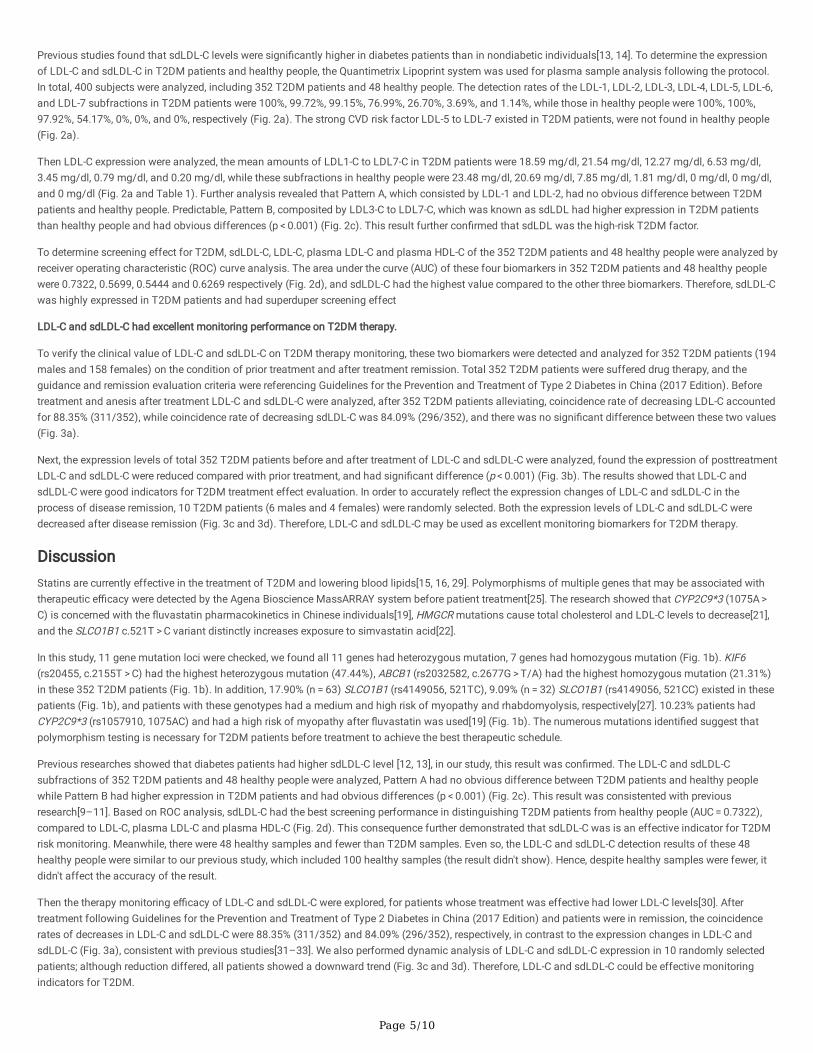
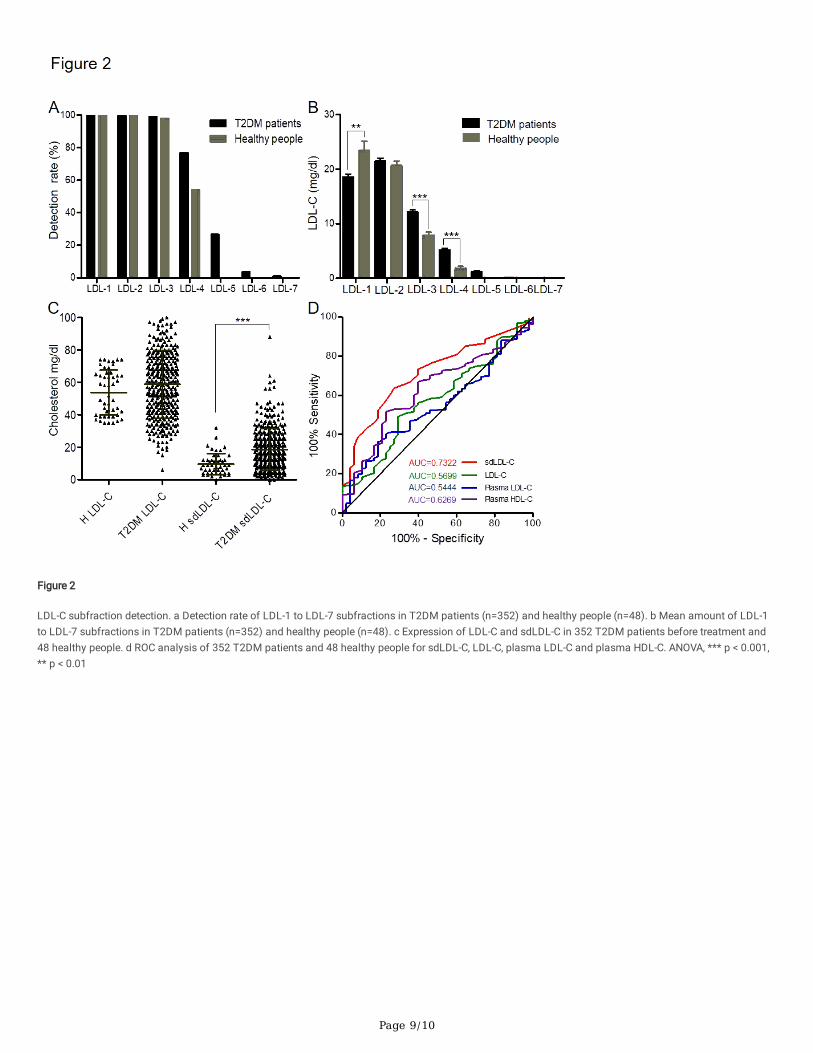
Previous studies found that sdLDL-C levels were signi�cantly higher in diabetes patients than in nondiabetic individuals[13, 14]. To determine the expressionof LDL-C and sdLDL-C in T2DM patients and healthy people, the Quantimetrix Lipoprint system was used for plasma sample analysis following the protocol.In total, 400 subjects were analyzed, including 352 T2DM patients and 48 healthy people. The detection rates of the LDL-1, LDL-2, LDL-3, LDL-4, LDL-5, LDL-6,and LDL-7 subfractions in T2DM patients were 100%, 99.72%, 99.15%, 76.99%, 26.70%, 3.69%, and 1.14%, while those in healthy people were 100%, 100%,97.92%, 54.17%, 0%, 0%, and 0%, respectively (Fig. 2a). The strong CVD risk factor LDL-5 to LDL-7 existed in T2DM patients, were not found in healthy people(Fig. 2a).
Then LDL-C expression were analyzed, the mean amounts of LDL1-C to LDL7-C in T2DM patients were 18.59 mg/dl, 21.54 mg/dl, 12.27 mg/dl, 6.53 mg/dl,3.45 mg/dl, 0.79 mg/dl, and 0.20 mg/dl, while these subfractions in healthy people were 23.48 mg/dl, 20.69 mg/dl, 7.85 mg/dl, 1.81 mg/dl, 0 mg/dl, 0 mg/dl,and 0 mg/dl (Fig. 2a and Table 1). Further analysis revealed that Pattern A, which consisted by LDL-1 and LDL-2, had no obvious difference between T2DMpatients and healthy people. Predictable, Pattern B, composited by LDL3-C to LDL7-C, which was known as sdLDL had higher expression in T2DM patientsthan healthy people and had obvious differences (p < 0.001) (Fig. 2c). This result further con�rmed that sdLDL was the high-risk T2DM factor.
To determine screening effect for T2DM, sdLDL-C, LDL-C, plasma LDL-C and plasma HDL-C of the 352 T2DM patients and 48 healthy people were analyzed byreceiver operating characteristic (ROC) curve analysis. The area under the curve (AUC) of these four biomarkers in 352 T2DM patients and 48 healthy peoplewere 0.7322, 0.5699, 0.5444 and 0.6269 respectively (Fig. 2d), and sdLDL-C had the highest value compared to the other three biomarkers. Therefore, sdLDL-Cwas highly expressed in T2DM patients and had superduper screening effect
LDL-C and sdLDL-C had excellent monitoring performance on T2DM therapy.
To verify the clinical value of LDL-C and sdLDL-C on T2DM therapy monitoring, these two biomarkers were detected and analyzed for 352 T2DM patients (194males and 158 females) on the condition of prior treatment and after treatment remission. Total 352 T2DM patients were suffered drug therapy, and theguidance and remission evaluation criteria were referencing Guidelines for the Prevention and Treatment of Type 2 Diabetes in China (2017 Edition). Beforetreatment and anesis after treatment LDL-C and sdLDL-C were analyzed, after 352 T2DM patients alleviating, coincidence rate of decreasing LDL-C accountedfor 88.35% (311/352), while coincidence rate of decreasing sdLDL-C was 84.09% (296/352), and there was no signi�cant difference between these two values(Fig. 3a).
Next, the expression levels of total 352 T2DM patients before and after treatment of LDL-C and sdLDL-C were analyzed, found the expression of posttreatmentLDL-C and sdLDL-C were reduced compared with prior treatment, and had signi�cant difference (p < 0.001) (Fig. 3b). The results showed that LDL-C andsdLDL-C were good indicators for T2DM treatment effect evaluation. In order to accurately re�ect the expression changes of LDL-C and sdLDL-C in theprocess of disease remission, 10 T2DM patients (6 males and 4 females) were randomly selected. Both the expression levels of LDL-C and sdLDL-C weredecreased after disease remission (Fig. 3c and 3d). Therefore, LDL-C and sdLDL-C may be used as excellent monitoring biomarkers for T2DM therapy.
DiscussionStatins are currently effective in the treatment of T2DM and lowering blood lipids[15, 16, 29]. Polymorphisms of multiple genes that may be associated withtherapeutic e�cacy were detected by the Agena Bioscience MassARRAY system before patient treatment[25]. The research showed that CYP2C9*3 (1075A > C) is concerned with the �uvastatin pharmacokinetics in Chinese individuals[19], HMGCR mutations cause total cholesterol and LDL-C levels to decrease[21],and the SLCO1B1 c.521T > C variant distinctly increases exposure to simvastatin acid[22].
In this study, 11 gene mutation loci were checked, we found all 11 genes had heterozygous mutation, 7 genes had homozygous mutation (Fig. 1b). KIF6(rs20455, c.2155T > C) had the highest heterozygous mutation (47.44%), ABCB1 (rs2032582, c.2677G > T/A) had the highest homozygous mutation (21.31%)in these 352 T2DM patients (Fig. 1b). In addition, 17.90% (n = 63) SLCO1B1 (rs4149056, 521TC), 9.09% (n = 32) SLCO1B1 (rs4149056, 521CC) existed in thesepatients (Fig. 1b), and patients with these genotypes had a medium and high risk of myopathy and rhabdomyolysis, respectively[27]. 10.23% patients hadCYP2C9*3 (rs1057910, 1075AC) and had a high risk of myopathy after �uvastatin was used[19] (Fig. 1b). The numerous mutations identi�ed suggest thatpolymorphism testing is necessary for T2DM patients before treatment to achieve the best therapeutic schedule.
Previous researches showed that diabetes patients had higher sdLDL-C level [12, 13], in our study, this result was con�rmed. The LDL-C and sdLDL-Csubfractions of 352 T2DM patients and 48 healthy people were analyzed, Pattern A had no obvious difference between T2DM patients and healthy peoplewhile Pattern B had higher expression in T2DM patients and had obvious differences (p < 0.001) (Fig. 2c). This result was consistented with previousresearch[9–11]. Based on ROC analysis, sdLDL-C had the best screening performance in distinguishing T2DM patients from healthy people (AUC = 0.7322),compared to LDL-C, plasma LDL-C and plasma HDL-C (Fig. 2d). This consequence further demonstrated that sdLDL-C was is an effective indicator for T2DMrisk monitoring. Meanwhile, there were 48 healthy samples and fewer than T2DM samples. Even so, the LDL-C and sdLDL-C detection results of these 48healthy people were similar to our previous study, which included 100 healthy samples (the result didn't show). Hence, despite healthy samples were fewer, itdidn't affect the accuracy of the result.
Then the therapy monitoring e�cacy of LDL-C and sdLDL-C were explored, for patients whose treatment was effective had lower LDL-C levels[30]. Aftertreatment following Guidelines for the Prevention and Treatment of Type 2 Diabetes in China (2017 Edition) and patients were in remission, the coincidencerates of decreases in LDL-C and sdLDL-C were 88.35% (311/352) and 84.09% (296/352), respectively, in contrast to the expression changes in LDL-C andsdLDL-C (Fig. 3a), consistent with previous studies[31–33]. We also performed dynamic analysis of LDL-C and sdLDL-C expression in 10 randomly selectedpatients; although reduction differed, all patients showed a downward trend (Fig. 3c and 3d). Therefore, LDL-C and sdLDL-C could be effective monitoringindicators for T2DM.

Page 6/10
ConclusionIn conclusion, combined multigene screening and LDL-C and sdLDL-C subfractions detection could help effectively adjust the therapeutic strategy for T2DMpatients before treatment and help monitor the therapeutic effect after treatment.
AbbreviationsT2DM: Type 2 diabetes mellitus; LDL-C: Low-density lipoprotein cholesterol; sd LDL-C: Small dense LDL-C; CVD: Cardiovascular disease; AUC: Area under thecurve; ROC: Receiver operating characteristic
DeclarationsAcknowledgements: Xinjun Wang, the main co-author of this study, especially wishes to thank Hayley Zhuoping Xu, Rong Jiang and Yuepeng Yin for theirassistance in the LDL detection as well as Xiaoge Zhang, Peipei Fan, Wenbo Sun, Yiting Wang and Jiahui Wu for their contribution to MassARRAY assays.These experimenters all come from Biotecan Medical Diagnostics Co., Ltd.
Authors’ contributions: YT, CX and XZ conceived the ideas and experimental design. JW and YL provided clinical samples, performed the experiments andanalyzed the data. XL, YZ and ZY analyzed the data and �gures. YT, XW, CX and XZ analyzed the data and wrote the manuscript. All authors read, reviewedthis �nal version for publication. All authors read and approved the �nal manuscript.
Funding: This work was supported by the Shanghai's industrial transformation and upgrading development project for absorption and innovation of importedtechnology (NO: 18XI-15) and scienti�c instruments application methods project of Shanghai Science and technology innovation action plan(NO:19142200800).
Availability of data and materials: All authors declare that data and any supporting material regarding this manuscript are available and can be requested atany time.
Ethics approval and consent to participate: The study was approved by the Ethics Committee of the Pingdingshan People’s Hospital No.1. All patients providedwritten informed consent for this study. All methods in this study carried out in accordance with the Declaration of Helsinki.
Consent for publication: Not applicable.
Competing interests: The authors declare no con�ict of interests related to the present paper.
Author details: 1Department of endocrinology and metabolism, Pingdingshan People’s Hospital No.1, Pingdingshan, China. 2Shanghai BiotecanPharmaceuticals Co., Ltd, Shanghai Zhangjiang Institute of Medical Innovation, Shanghai, China. 3State Key Laboratory of Genetic Engineerings, School ofLife Sciences, Fudan University, Shanghai, China. 4 Translational Medical Center for Stem Cell Therapy and Institute for Regenerative Medicine, Shanghai EastHospital, Shanghai Key Laboratory of Signaling and Disease Research, School of Life Sciences and Technology, Tongji University, Shanghai, 200092, China. 5
Wellbody Co., China.
References1. American Diabetes A. Standards of medical care in diabetes–2011. Diabetes Care. 2011;34(Suppl 1):11–61.
2. American Diabetes A. Diagnosis and classi�cation of diabetes mellitus. Diabetes Care. 2014;37(Suppl 1):81–90.
3. Collaboration NCDRF. Worldwide trends in diabetes since 1980: a pooled analysis of 751 population-based studies with 4.4 million participants. Lancet.2016;387(10027):1513–30.
4. Rao Kondapally Seshasai S, Kaptoge S, Thompson A, et al. Diabetes mellitus, fasting glucose, and risk of cause-speci�c death. N Engl J Med.2011;364(9):829–41.
5. American Diabetes A. Standards of medical care in diabetes-2015 abridged for primary care providers. Clinical diabetes: a publication of the AmericanDiabetes Association. 2015;33(2):97–111.
�. Arboix A, Rivas A, Garcia-Eroles L, et al. Cerebral infarction in diabetes: clinical pattern, stroke subtypes, and predictors of in-hospital mortality. BMCNeurol. 2005;5(1):9.
7. Turner RC, Millns H, Neil HA, et al. Risk factors for coronary artery disease in non-insulin dependent diabetes mellitus: United Kingdom ProspectiveDiabetes Study (UKPDS: 23). Bmj. 1998;316(7134):823–8.
�. Sninsky JJ, Rowland CM, Baca AM, et al. Classi�cation of LDL phenotypes by 4 methods of determining lipoprotein particle size. J Investig Med.2013;61(6):942–9.
9. Catapano AL, Reiner Z, De Backer G, et al. ESC/EAS Guidelines for the management of dyslipidaemias The Task Force for the management ofdyslipidaemias of the European Society of Cardiology (ESC) and the European Atherosclerosis Society (EAS). Atherosclerosis. 2011;217(1):3–46.
10. Packard CJ. Small dense low-density lipoprotein and its role as an independent predictor of cardiovascular disease. Curr Opin Lipidol. 2006;17(4):412–7.
11. Austin MA, Hokanson JE, Brunzell JD. Characterization of low-density lipoprotein subclasses: methodologic approaches and clinical relevance. Curr OpinLipidol. 1994;5(6):395–403.

Page 7/10
12. Janghorbani M, Soltanian N, Amini M, et al. Low-density lipoprotein cholesterol and risk of type 2 diabetes: The Isfahan diabetes prevention study.Diabetes metabolic syndrome. 2018;12(5):715–9.
13. Inaku KO, Ogunkeye OO, Abbiyesuku FM, et al. Elevation of small, dense low density lipoprotein cholesterol-a possible antecedent of atherogeniclipoprotein phenotype in type 2 diabetes patients in Jos, North-Central Nigeria. BMC clinical pathology. 2017;17:26.
14. Haffner SM, American Diabetes A. Management of dyslipidemia in adults with diabetes. Diabetes Care. 2003;26(Suppl 1):83–6.
15. Colhoun HM, Betteridge DJ, Durrington PN, et al. Primary prevention of cardiovascular disease with atorvastatin in type 2 diabetes in the CollaborativeAtorvastatin Diabetes Study (CARDS): multicentre randomised placebo-controlled trial. Lancet. 2004;364(9435):685–96.
1�. Collins R, Armitage J, Parish S, et al. MRC/BHF Heart Protection Study of cholesterol-lowering with simvastatin in 5963 people with diabetes: arandomised placebo-controlled trial. Lancet. 2003;361(9374):2005–16.
17. Ruano G, Thompson PD, Windemuth A, et al. Physiogenomic association of statin-related myalgia to serotonin receptors. Muscle Nerve. 2007;36(3):329–35.
1�. Yuan L, Liu J, Dong L, et al. Effects of APOE rs429358, rs7412 and GSTM1/GSTT1 Polymorphism on Plasma and Erythrocyte Antioxidant Parametersand Cognition in Old Chinese Adults. Nutrients. 2015;7(10):8261–73.
19. Zhou Q, Ruan ZR, Yuan H, et al. CYP2C9*3(1075A > C), MDR1 G2677T/A and MDR1 C3435T are determinants of inter-subject variability in �uvastatinpharmacokinetics in healthy Chinese volunteers. Arzneimittelforschung. 2012;62(11):519–24.
20. Ruiz-Iruela C, Padro-Miquel A, Pinto-Sala X, et al. KIF6 gene as a pharmacogenetic marker for lipid-lowering effect in statin treatment. PloS one.2018;13(10):e0205430.
21. Kirac D, Bayam E, Dagdelen M, et al. HMGCR and ApoE mutations may cause different responses to lipid lowering statin therapy. Cellular molecularbiology. 2017;63(10):43–8.
22. Jiang F, Choi JY, Lee JH, et al. The in�uences of SLCO1B1 and ABCB1 genotypes on the pharmacokinetics of simvastatin, in relation to CYP3A4 inhibition.Pharmacogenomics. 2017;18(5):459–69.
23. Fukunaga K, Nakagawa H, Ishikawa T, et al. ABCB1 polymorphism is associated with atorvastatin-induced liver injury in Japanese population. BMCGenet. 2016;17(1):79.
24. Kanca D, Gormus U, Tokat B, et al. Additive Antiatherogenic Effects of CETP rs708272 on Serum LDL Subfraction Levels in Patients with CHD UnderStatin Therapy. Biochemical genetics. 2017;55(2):168–82.
25. Min KW, Kim WS, Jang SJ, et al. MassARRAY, pyrosequencing, and PNA clamping for EGFR mutation detection in lung cancer tissue and cytologicalsamples: a multicenter study. J Cancer Res Clin Oncol. 2016;142(10):2209–16.
2�. Hoefner DM, Hodel SD, O'Brien JF,, et al. Development of a rapid, quantitative method for LDL subfractionation with use of the Quantimetrix Lipoprint LDLSystem. Clinical chemistry. 2001;47(2):266–74.
27. Ramsey LB, Johnson SG, Caudle KE, et al. The clinical pharmacogenetics implementation consortium guideline for SLCO1B1 and simvastatin-inducedmyopathy: 2014 update. Clin Pharmacol Ther. 2014;96(4):423–8.
2�. Authors/Task Force M, Guidelines ESCCfP, Societies ESCNC. 2019 ESC/EAS guidelines for the management of dyslipidaemias: Lipid modi�cation toreduce cardiovascular risk. Atherosclerosis. 2019;290:140–205.
29. Lu Y, Cheng Z, Zhao Y, et al. E�cacy and safety of long-term treatment with statins for coronary heart disease: A Bayesian network meta-analysis.Atherosclerosis. 2016;254:215–27.
30. Chen PH, Wang JS, Lin SY, et al. Effects of statins on all-cause mortality at different low-density-lipoprotein cholesterol levels in Asian patients with type 2diabetes. Curr Med Res Opin. 2018;34(11):1885–92.
31. Blake GJ, Otvos JD, Rifai N, et al. Low-density lipoprotein particle concentration and size as determined by nuclear magnetic resonance spectroscopy aspredictors of cardiovascular disease in women. Circulation. 2002;106(15):1930–7.
32. Gardner CD, Fortmann SP, Krauss RM. Association of small low-density lipoprotein particles with the incidence of coronary artery disease in men andwomen. Jama. 1996;276(11):875–81.
33. Krychtiuk KA, Kastl SP, Pfaffenberger S, et al. Association of small dense LDL serum levels and circulating monocyte subsets in stable coronary arterydisease. PloS one. 2015;10(4):e0123367.
Figures

Page 8/10
Figure 1
a Consort �ow diagram. b The eleven gene polymorphisms detected in 352 T2DM patients (194 males and 158 females)
Page 9/10
Figure 2
LDL-C subfraction detection. a Detection rate of LDL-1 to LDL-7 subfractions in T2DM patients (n=352) and healthy people (n=48). b Mean amount of LDL-1to LDL-7 subfractions in T2DM patients (n=352) and healthy people (n=48). c Expression of LDL-C and sdLDL-C in 352 T2DM patients before treatment and48 healthy people. d ROC analysis of 352 T2DM patients and 48 healthy people for sdLDL-C, LDL-C, plasma LDL-C and plasma HDL-C. ANOVA, *** p < 0.001,** p < 0.01

Page 10/10
Figure 3
LDL-C and sdLDL-C monitoring in T2DM patients. a A total of 352 T2DM patients (194 males and 158 females) underwent detection. b Expression of LDL-Cand sdLDL-C in 352 T2DM patients before treatment and after treatment. ANOVA, *** p < 0.001. c LDL-C was detected in 10 T2DM patients (6 males and 4females) before treatment and after treatment. d sdLDL-C was detected in 10 T2DM patients (6 males and 4 females) before treatment and after treatment.The numbers 1 to 10 represent patients 1 to 10
Supplementary Files
This is a list of supplementary �les associated with this preprint. Click to download.
Additional�le1.xlsx
Additional�le2.xlsx