Proterozoic magmatic and tectonometamorphic evolution of the Taratash complex, Central Urals, Russia

(This is a sample cover image for this issue. The actual cover is not yet available at this time.)
This article appeared in a journal published by Elsevier. The attachedcopy is furnished to the author for internal non-commercial researchand education use, including for instruction at the authors institution
and sharing with colleagues.
Other uses, including reproduction and distribution, or selling orlicensing copies, or posting to personal, institutional or third party
websites are prohibited.
In most cases authors are permitted to post their version of thearticle (e.g. in Word or Tex form) to their personal website orinstitutional repository. Authors requiring further information
regarding Elsevier’s archiving and manuscript policies areencouraged to visit:
http://www.elsevier.com/copyright

Author's personal copy
Mass-dependent and mass-independent sulfur isotope fractionation (δ34S and δ33S)from Brazilian Archean and Proterozoic sulfide deposits by laser ablationmulti-collector ICP-MS
Bernhard Bühn ⁎, Roberto V. Santos, Marcel A. Dardenne 1, Claudinei G. de OliveiraInstitute of Geociences, University of Brasilia, Brasilia, DF, 70910‐900, Brazil
a b s t r a c ta r t i c l e i n f o
Article history:Received 15 August 2011Received in revised form 7 February 2012Accepted 6 April 2012Available online 17 April 2012
Editor: J.D. Blum
Keywords:Sulfur isotopesNeoarcheanMass-independent fractionationLaser ablation ICP-MSBrazil
Mass-independent sulfur isotope fractionation (MIF) has been observed in rocks of the geological recordolder than about 2.45 Ga, a characteristic which is thought to be related to processes in the Neoarchean atmo-sphere. Samples recording a MIF effect therefore have to contain sulfur of the exogenic sulfur cycle, while en-dogenic sulfur should not show this effect. The sulfides analysed from six Brazilian deposits represent eitherexogenic or endogenic sulfur sources, with supposed ages ranging from about 1.9 to 2.7 Ga. Sulfur isotopeswere analysed by in‐situ laser ablation MC-ICP-MS. A range of experiments were conducted using interna-tional and in-house isotope standards, which were run under various conditions and set-ups. These includethe reference materials IAEA-S1, IAEA-S3, NBS123 (sphalerite), NBS127 (barite), and in-house standardsBSB-py (pyrite) and BSB-cpy (chalcopyrite). During six days of analysis, an internal precision of sulfide ana-lyses of 0.10–0.15‰ (1 s) for δ34S and 0.40–0.60‰ (1 s) for δ33S, and an accuracy of ~0.30‰ for δ34S and δ33Swas achieved. The standard measurements define a δ33S/δ34S relationship of δ33S=0.513*δ34S+0.149, withR²=0.9997, which is close to the theoretical relationship for mass-dependent fractionation. The by far bestanalytical errors were obtained for natural pyrite, reaching a within-run precision of about 0.05–0.15‰ forδ34S (1 s), and 0.10–0.15‰ (1 s) for δ33S determinations. Including all precision and accuracy data, we arriveat the following 1 s error limits to which sulfur isotope analyses for MIF studies obtained with this methodare reliable: 0.32, 0.34 and 0.46‰ for pyrite (δ34S, δ33S and Δ33S determinations, respectively), 0.34, 0.42and 0.54‰ for pyrrhotite, and 0.34, 0.50 and 0.58‰ for chalcopyrite.Pyrites and pyrrhotites from 2200 Ma old sediments and volcanics associated with the Pilar greenstone belt,Goiás, have δ34S from −15.0 to +2.0‰, and δ33S from −8.0 to +1.0‰, with Δ33S being slightly but not sig-nificantly positive. Pyrites from supposed ca. 2060 Ma old clastic sediments of the Águas Claras Formation(Carajás, Pará), have δ34S=9.5–12.5‰ and δ33S=5.0–6.5‰ with Δ33S close to zero. Chalcopyrites from theSalobo and Sequerinha sulfide deposits, also Carajás, are genetically related to 2570 Ma old A-type alkalinegranites with endogenic sources. They have δ34S=1.6–2.9‰ and δ33S=1.0–1.5‰, and δ34S=0.2–0.9‰and δ33S=0.65‰, respectively, with Δ33S ranging from −0.15 to 0.56. The only Δ33S values of this studywhich clearly suggest sulfur isotope MIF come from the mineralized banded iron-formations of the Quadrilá-tero Ferrífero, Minas Gerais. Pyrites from the Mina de Cuiabá deposit (2700 Ma) have δ34S=3.8–5.1‰ andδ33S=2.9–4.8‰ with Δ33S=0.9–2.2‰, while pyrites and chalcopyrites from São Bento (2720 Ma) haveδ34S=1.6–3.2‰ and δ33S=1.5–2.8‰with Δ33S=0.2–1.5‰. The sulfides represent an epigenetic mineraliza-tion, derived from supracrustal rocks making part of an exogenic sulfur cycle. The study shows, that in-situlaser ablation ICP-MS is sufficiently sensitive for detecting MIF effects in Neoarchean rocks. Whether or notsuch samples show MIF-related Δ33S values depends on the age and provenance of the sulfur.
© 2012 Elsevier B.V. All rights reserved.
1. Introduction
Stable isotope fractionation should largely follow the so-called“terrestrial fractionation line” (Rumble, 2005; Ohmoto et al., 2006),
given that fractionation depends on their mass differences only(“Mass-dependent fractionation” MDF). Hence, in a δ–δ diagram inwhich two sulfur isotope ratios are plotted, terrestrial sampleswould fall on a line with a given positive slope. This is the case forδ34S vs. δ33S plots, in which the majority of terrestrial samples plotswithin their error limits on a line with a slope of 0.515 (Johnston,2011, amongst others). For most isotope fractionation studies of aspecific element, it is therefore not necessary to analyse more thanone isotope ratio, since other isotopic ratios of the element are a
Chemical Geology 312–313 (2012) 163–176
⁎ Corresponding author at: Instituto de Geociências, Universidade de Brasilia, CampusUniversitário Darcy Ribeiro, Brasilia, DF, CEP 70910‐900, Brazil. Tel./fax:+55 61 3307 1113.
E-mail address: [email protected] (B. Bühn).1 Deceased.
0009-2541/$ – see front matter © 2012 Elsevier B.V. All rights reserved.doi:10.1016/j.chemgeo.2012.04.003
Contents lists available at SciVerse ScienceDirect
Chemical Geology
j ourna l homepage: www.e lsev ie r .com/ locate /chemgeo

Author's personal copy
linear functionof themeasured one. Samples that plot off this terrestrialfractionation line, on the other hand, suggest that part of the fraction-ation process does not exclusively depend on isotope mass. Such an ef-fect is referred to as “mass-independent fractionation” (MIF), and isquantified as the offset of the isotope ratios form the theoretical,mass-dependent line, yielding a positive or negative Δ33S value. A MIFeffect in the sulfur isotope system has so far been reported both in nat-ural present-day samples (Romero and Thiemens, 2003; Savarino et al.,2003), and in older sulfide-bearingminerals along the geological record(Farquhar et al., 2000; Hu et al., 2003; Mojzsis et al., 2003; Ono et al.,2003; Papineau et al., 2005, 2007). Evidences for MIF were interpretedto suggest atmospheric photochemical processes and, possibly, thermo-chemical sulfate reduction (Watanabe et al., 2009; Johnston, 2011).
Earth's atmosphere has gone through major changes in its evolution,one of the most important being the Great Oxidation Event (GOE)ranging from 2400 to 1900 Ma (Sleep, 2001), that substantially changedthe oxidation level of the Earth's atmosphere–hydrosphere system(Holland, 2002; Bekker et al., 2004). In the context of atmosphericprocesses being responsible forMIF, studieswere directed principally to-wards the sulfur cycle of the atmosphere–hydrosphere system duringthe Archean and Neoarchean Era just before the GOE at about2.45 Ga years ago (Farquhar and Wing, 2003; Rumble, 2005). A coupleof mechanisms have been suggested to be involved in MIF in thegeological past (Rumble, 2005), which includes the transparency of theatmosphere for ultraviolet radiation in the early stages of Earth's evolu-tion (Farquhar and Wing, 2003). Samples which could inherit a MIF ef-fect from the geological past would have to be in contact with thesurface sulfide cycle. Indeed, sulfur isotopic studies from Archean sedi-ments and meta-sediments up to now have yielded Δ33S values rangingbetween about −2.5 and +11‰ (Farquhar and Wing, 2003; Ono et al.,2003; Rumble, 2005), with the most prominent excursions registeredduring the Neoarchean Era (Farquhar et al., 2010). More recently,Glikson (2010) draw attention on the overlap between sedimentary de-posits containing sulfur isotope MIF signatures and periods of enhancedasteroid impacts, which may have triggered ozone depletion and UV-radiation effects in the Archean atmosphere.
The proof for a MIF effect in sulfide samples requires a fair amountof analytical precision and accuracy for detecting Δ33S values of oftenwell below 1‰. Ohmoto et al. (2001), for example, had questionedthe data of one of the first MIF report in Precambrian sediments byFarquhar et al. (2000) which were later, however, confirmed by Huet al. (2003). Mann et al. (2009) recently have summarized the tradi-tional and non-traditional methods for sulfur isotope analyses. Depend-ing on the analytical method, the difficulties may be related to asophisticated fluorination and gas purification process of the samplematerial before entering a gas mass spectrometer (Hu et al., 2003;Ono et al., 2006), by isobaric interferences, or simply by the fact that sul-fur isotopes display quite a large spread in natural abundances(32S=95.02%, 33S=0.75%, 34S=4.21%, 36S=0.02%). The large rangein isotope abundances may hamper the simultaneous detection of 33Sand 36S (the less frequent ones) togetherwith 32S and 34S (themost fre-quent ones). This may apply to ion microprobe (SIMS) analysis(Papineau et al., 2007; Bullock et al., 2010; Kozdon et al., 2010) orlaser ablation multi-collector ICP-MS (Mason et al., 2006; Craddock etal., 2008) analysis, apart from the prominent isobaric interference of36Ar on 36S (Amrani et al., 2009).
With respect to laser ablation multi-collector ICP-MS analysis, thereare basically two works in the literature (Mason et al., 2006; Craddocket al., 2008), both using a Thermo Neptune MC-ICP-MS as also appliedin this study, but each with a different focus. The present contribution,on the other hand, aims at an analytical protocol which is sufficientlyprecise and accurate for in-situ δ34S and δ33S determinations, in orderto evaluate possible Δ33S excursions from zero as expected for mass-independent sulfur isotope fractionation. The study includes cross-calibrations between international standards and in-house standards.They are used to determine the most powerful laser and ICP-MS set-
up for reliable Δ33S determinations, which would allow to detect devi-ations from the mass-dependent sulfur isotope fractionation linebeyond the analytical error. Themethod is applied to a variety of sulfideminerals from Brazilian sediments and other lithologies, includingsulfide-bearing banded iron-formations from the Quadriltátero Ferrífero,hydrothermal and non-hydrothermal sulfide deposits from the CarajásProvince in northern Brazil, and a range of sediments associated withthe Pilar greenstone belt in central Brazil. The intention is to study pos-sibleMIF effects in these depositswhich showdifferent sources of sulfur(exogenic and endogenic sulfur cycles), and which spread in age fromthe Paleoproterozoic to the Neoarchean, covering a range from about1.9 to 2.7 Ga.
2. Materials
2.1. International standard materials
The reference standards analysed in this study include: IAEA-S1,IAEA-S3, NBS123 (sphalerite ZnS), NBS127 (barite BaSO4), and in-house standards BSB-py (pyrite) and BSB-cpy (chalcopyrite). IAEA-S1and IAEA-S3 are synthetic AgS2 powders. Standard NBS123, alsoknown under the name SRM 8556, are sphalerite crystals of some hun-dreds ofmicrons in size. This standardwas analysed either as single crys-tals, herein named NBS123x, or as pellets made from the powderedsample, denoted NBS123p. NBS127 is a white BaSO4 (barite) powder.The in-house standards BSB-py and BSB-cpy are sulfide crystals of sever-al millimetres in size that have been separated from ultramafic rocks ofthe Neoproterozoic Americano do Brasil layered intrusion (Mota e Silvaet al., 2011). Their 32S/34S isotopic composition had previously been de-terminedby analysis against international standards in aqueous solution.
The standard analyseswere run on six days, apart from the determi-nations for external precision during the analyses of natural samples.Many studies have, in the past, determined or revised the internationalreference materials of the IAEA and NBS series (Ding et al., 2001; Hu etal., 2003; Qi and Coplen, 2003; Yun et al., 2004; Mason et al., 2006; Onoet al., 2006; Mann et al., 2009, amongst others). The isotopic composi-tions of the reference materials which are used in this study are givenin Table 1.
2.2. Natural sulfide samples
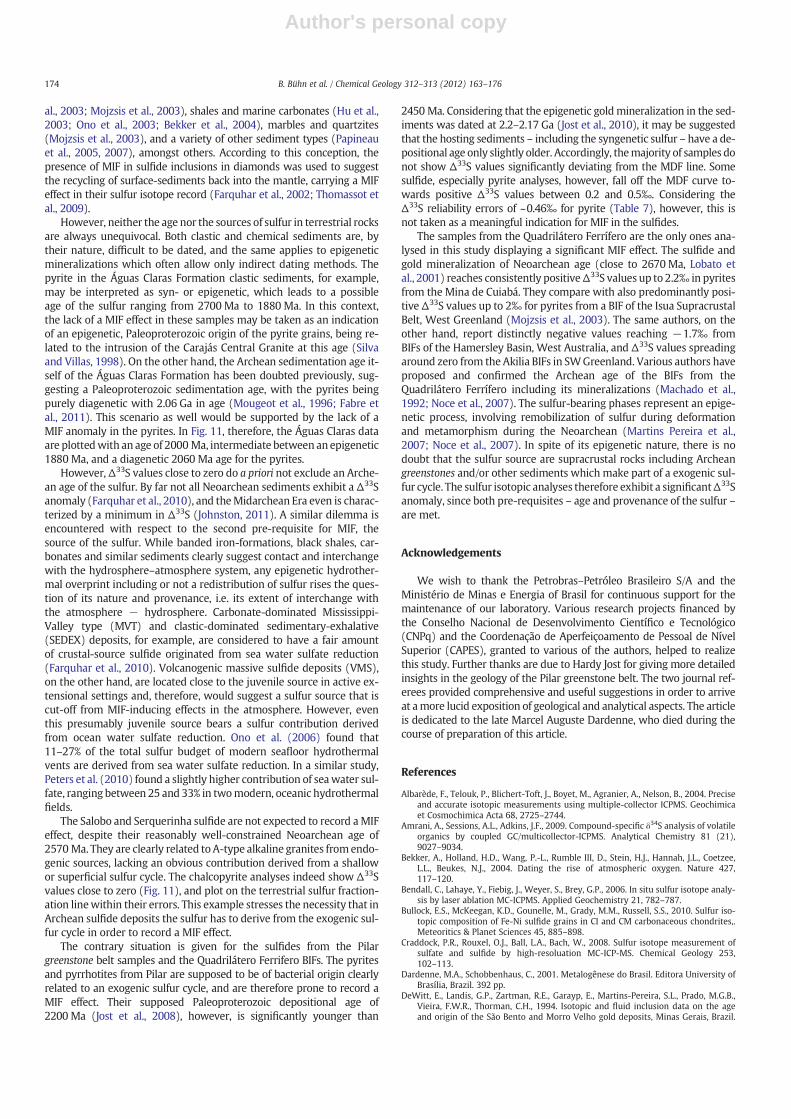
The sulfide samples from natural occurrences in Brazil include sixoccurrences which range from about 1.9 to 2.7 Ga in age. Sulfide min-erals analysed are pyrite, chalcopyrite and pyrrhotite. The sample lo-calities with their regional context are shown in Fig. 1. A brief sampledescription with the supposed age and nature of the sulfur are sum-marized in Table 2 and given below in more detail.
2.2.1. Neoarchean Banded Iron Formation, Quadrilátero Ferrífero (QF)Archean terrains of the QF in the Minas Gerais state, Brazil, com-
prise a greenstone belt association (Rio das Velhas Supergroup, 3.0–2.7 Ga, Machado and Carneiro, 1992) that is surrounded by granit-oid–gneiss complexes (Fig. 1, Teixeira et al., 1996; Noce, 2000; Noceet al., 2007). Felsic rocks of the Rio das Velhas Sequence have beendated at 2772+/−6 Ma (Machado et al., 1992; Noce et al., 2007), an-other age date comes from discordant zircon with an upper interceptage of 2776 +23/−10 Ma (Machado et al., 1991). At the base of the
Table 1Referenced isotopic compositions of the standard materials used.
IAEA-S1(1)
IAEA-S3(1)
NBS123(2)
NBS127(3)
BSB-py(4)
BSB-cpy(4)
V-CDT(1)
32S/34S 22.6504 23.3933 22.2629 22.1926 22.6218 22.7118 22.643632S/33S 126.942 129.072 – 125.679 – – 126.948
(1) Ding et al., 2001, (2) Hu et al., 2003, (3) Mason et al., 2006, (4) Own data.
164 B. Bühn et al. / Chemical Geology 312–313 (2012) 163–176

Author's personal copy
Salvador
Rio de Janeiro
Recife
Belém
Brasília
O o
15 o
30 o
Andes
Phanerozoic basins
Orogenic belts
Cratons > 1100 Ma
30 km
ItacaiúnasSupergroup,ca. 2.75 Ga
ArcheanMetasediments,Águas Claras Fm.
Proterozoic anorogenicgranites, ca. 1.88 Ga,Central Carajás Granite
Late Archean alkalinegranites, ca. 2.57 Ga
Archean granites anddiorites, ca. 2.74 Ga
Granite-gneiss-
complexes
Greenstonebelts
150 km
Salobo
Sossego
Major faults
ÁguasClaras
Paleoproterozoiccover
Middle to LateArchean granite-gneiss-greenstone terranes
Archean and Paleoproterozoicgreenstone belts
100 km
Mina de Cuiabá
São Bento
Carajás Province
Goiásgreenstones
Quadrilátero Ferrífero
Pilar deGoiás
Fig. 1. Locationmap and regional geology for the study areas of Pilar de Goiás, Carajás Province and Quadrilátero Ferrífero. Geology and lithostratigraphy of South America after Graingeret al. (2008), for the Quadrilátero Ferrífero after Lobato et al. (2001), for the Goiás greenstones from Jost et al. (2010), and for the Carajás Province from Tallarico et al. (2005).
Table 2Summary of samples and sample localities, and the nature of its sulfur.
Sample Regional provenance Local provenance Lithology Sulfide mineral Source of sulfide mineralization Supposed age of mineralization
AC1 Carajás Águas Claras Quartzite py Syn-sedimentary 2645 (1)–2681 (2) MaAC2 province, Formation Quartzite py pyrite or 2060 Ma (3),AC3 Pará state Quartzite py or orAC4 Quartzite py epigenetic 1880 Ma (4)AC5 Quartzite py mineralizationSAL1 Carajás Salobo Massive cpy Hydrothermal, 2570 Ma (5)SAL2 province, Pará ore cpy granite relatedSEQ1 Carajás Serquerinha / Massive cpy Hydrothermal, 2570 Ma (5)
province, Pará Sossego ore granite relatedMDC1 Quadrilátero Mina de Massive py Hydrothermally 2700 Ma (6)MDC2 Ferrífero, Minas Cuiabá ore in py remobilized fromMDC3 Gerais state BIF py Archean greenstonesSB1 Quadrilátero Mina Massive py Hydrothermally 2720 Ma (7)SB2 Ferrífero, Minas São Bento ore in py remobilized fromSB3 Gerais state BIF py Archean greenstonesSB4 pySB5 cpySB6 cpyJOT2 Pilar Drill core Bt-qtz schist py Organic sulfur, 2200 Ma (8)JOT16 greenstone in Amphibolite po syngeneticJOT17 belt, meta- Amphibolite poJOT21 Goiás state sediments Carbonaceous schist poJOT30 Carbonaceous schist pyJOT33 Carbonaceous schist poJOT35 Carbonaceous schist poJOT36 Carbonaceous schist poJOT57 Amphibolite poJOT70 Metatonalite po
Age references: (1)Dias et al., 1996; (2) Trendall et al., 1998; (3)Mougeot et al., 1996; Fabre et al., 2011; (4)Machado et al., 1991; (5) Tallarico et al., 2005; (6)Noce et al., 2007; (7)DeWittet al., 1994; (8) Jost et al., 2008.
165B. Bühn et al. / Chemical Geology 312–313 (2012) 163–176
Author's personal copy
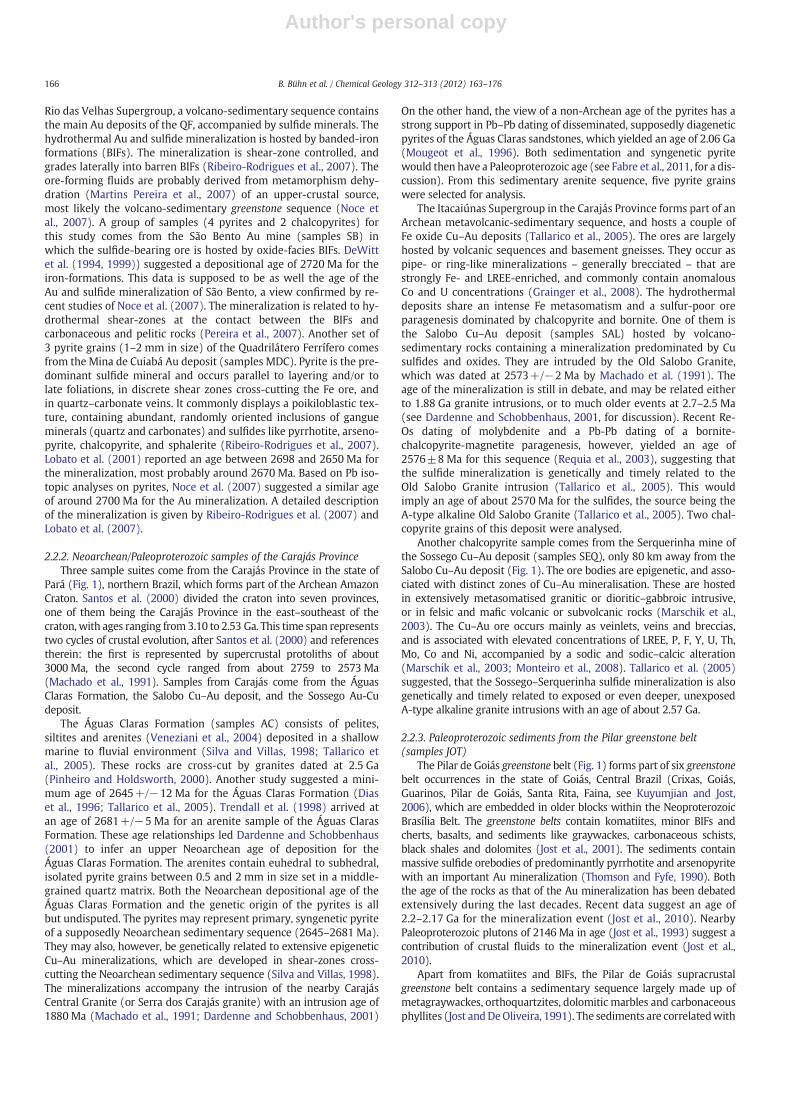
Rio das Velhas Supergroup, a volcano-sedimentary sequence containsthe main Au deposits of the QF, accompanied by sulfide minerals. Thehydrothermal Au and sulfide mineralization is hosted by banded-ironformations (BIFs). The mineralization is shear-zone controlled, andgrades laterally into barren BIFs (Ribeiro-Rodrigues et al., 2007). Theore-forming fluids are probably derived from metamorphism dehy-dration (Martins Pereira et al., 2007) of an upper-crustal source,most likely the volcano-sedimentary greenstone sequence (Noce etal., 2007). A group of samples (4 pyrites and 2 chalcopyrites) forthis study comes from the São Bento Au mine (samples SB) inwhich the sulfide-bearing ore is hosted by oxide-facies BIFs. DeWittet al. (1994, 1999)) suggested a depositional age of 2720 Ma for theiron-formations. This data is supposed to be as well the age of theAu and sulfide mineralization of São Bento, a view confirmed by re-cent studies of Noce et al. (2007). The mineralization is related to hy-drothermal shear-zones at the contact between the BIFs andcarbonaceous and pelitic rocks (Pereira et al., 2007). Another set of3 pyrite grains (1–2 mm in size) of the Quadrilátero Ferrífero comesfrom the Mina de Cuiabá Au deposit (samples MDC). Pyrite is the pre-dominant sulfide mineral and occurs parallel to layering and/or tolate foliations, in discrete shear zones cross-cutting the Fe ore, andin quartz–carbonate veins. It commonly displays a poikiloblastic tex-ture, containing abundant, randomly oriented inclusions of gangueminerals (quartz and carbonates) and sulfides like pyrrhotite, arseno-pyrite, chalcopyrite, and sphalerite (Ribeiro-Rodrigues et al., 2007).Lobato et al. (2001) reported an age between 2698 and 2650 Ma forthe mineralization, most probably around 2670 Ma. Based on Pb iso-topic analyses on pyrites, Noce et al. (2007) suggested a similar ageof around 2700 Ma for the Au mineralization. A detailed descriptionof the mineralization is given by Ribeiro-Rodrigues et al. (2007) andLobato et al. (2007).
2.2.2. Neoarchean/Paleoproterozoic samples of the Carajás ProvinceThree sample suites come from the Carajás Province in the state of
Pará (Fig. 1), northern Brazil, which forms part of the Archean AmazonCraton. Santos et al. (2000) divided the craton into seven provinces,one of them being the Carajás Province in the east–southeast of thecraton, with ages ranging from3.10 to 2.53 Ga. This time span representstwo cycles of crustal evolution, after Santos et al. (2000) and referencestherein: the first is represented by supercrustal protoliths of about3000 Ma, the second cycle ranged from about 2759 to 2573 Ma(Machado et al., 1991). Samples from Carajás come from the ÁguasClaras Formation, the Salobo Cu–Au deposit, and the Sossego Au-Cudeposit.
The Águas Claras Formation (samples AC) consists of pelites,siltites and arenites (Veneziani et al., 2004) deposited in a shallowmarine to fluvial environment (Silva and Villas, 1998; Tallarico etal., 2005). These rocks are cross-cut by granites dated at 2.5 Ga(Pinheiro and Holdsworth, 2000). Another study suggested a mini-mum age of 2645+/−12 Ma for the Águas Claras Formation (Diaset al., 1996; Tallarico et al., 2005). Trendall et al. (1998) arrived atan age of 2681+/−5 Ma for an arenite sample of the Águas ClarasFormation. These age relationships led Dardenne and Schobbenhaus(2001) to infer an upper Neoarchean age of deposition for theÁguas Claras Formation. The arenites contain euhedral to subhedral,isolated pyrite grains between 0.5 and 2 mm in size set in a middle-grained quartz matrix. Both the Neoarchean depositional age of theÁguas Claras Formation and the genetic origin of the pyrites is allbut undisputed. The pyrites may represent primary, syngenetic pyriteof a supposedly Neoarchean sedimentary sequence (2645–2681 Ma).They may also, however, be genetically related to extensive epigeneticCu–Au mineralizations, which are developed in shear-zones cross-cutting the Neoarchean sedimentary sequence (Silva and Villas, 1998).The mineralizations accompany the intrusion of the nearby CarajásCentral Granite (or Serra dos Carajás granite) with an intrusion age of1880 Ma (Machado et al., 1991; Dardenne and Schobbenhaus, 2001)
On the other hand, the view of a non-Archean age of the pyrites has astrong support in Pb–Pb dating of disseminated, supposedly diageneticpyrites of the Águas Claras sandstones, which yielded an age of 2.06 Ga(Mougeot et al., 1996). Both sedimentation and syngenetic pyritewould then have a Paleoproterozoic age (see Fabre et al., 2011, for a dis-cussion). From this sedimentary arenite sequence, five pyrite grainswere selected for analysis.
The Itacaiúnas Supergroup in the Carajás Province forms part of anArchean metavolcanic-sedimentary sequence, and hosts a couple ofFe oxide Cu–Au deposits (Tallarico et al., 2005). The ores are largelyhosted by volcanic sequences and basement gneisses. They occur aspipe- or ring-like mineralizations – generally brecciated – that arestrongly Fe- and LREE-enriched, and commonly contain anomalousCo and U concentrations (Grainger et al., 2008). The hydrothermaldeposits share an intense Fe metasomatism and a sulfur-poor oreparagenesis dominated by chalcopyrite and bornite. One of them isthe Salobo Cu–Au deposit (samples SAL) hosted by volcano-sedimentary rocks containing a mineralization predominated by Cusulfides and oxides. They are intruded by the Old Salobo Granite,which was dated at 2573+/−2 Ma by Machado et al. (1991). Theage of the mineralization is still in debate, and may be related eitherto 1.88 Ga granite intrusions, or to much older events at 2.7–2.5 Ma(see Dardenne and Schobbenhaus, 2001, for discussion). Recent Re-Os dating of molybdenite and a Pb-Pb dating of a bornite-chalcopyrite-magnetite paragenesis, however, yielded an age of2576±8 Ma for this sequence (Requia et al., 2003), suggesting thatthe sulfide mineralization is genetically and timely related to theOld Salobo Granite intrusion (Tallarico et al., 2005). This wouldimply an age of about 2570 Ma for the sulfides, the source being theA-type alkaline Old Salobo Granite (Tallarico et al., 2005). Two chal-copyrite grains of this deposit were analysed.
Another chalcopyrite sample comes from the Serquerinha mine ofthe Sossego Cu–Au deposit (samples SEQ), only 80 km away from theSalobo Cu–Au deposit (Fig. 1). The ore bodies are epigenetic, and asso-ciated with distinct zones of Cu–Au mineralisation. These are hostedin extensively metasomatised granitic or dioritic–gabbroic intrusive,or in felsic and mafic volcanic or subvolcanic rocks (Marschik et al.,2003). The Cu–Au ore occurs mainly as veinlets, veins and breccias,and is associated with elevated concentrations of LREE, P, F, Y, U, Th,Mo, Co and Ni, accompanied by a sodic and sodic–calcic alteration(Marschik et al., 2003; Monteiro et al., 2008). Tallarico et al. (2005)suggested, that the Sossego–Serquerinha sulfide mineralization is alsogenetically and timely related to exposed or even deeper, unexposedA-type alkaline granite intrusions with an age of about 2.57 Ga.
2.2.3. Paleoproterozoic sediments from the Pilar greenstone belt(samples JOT)
The Pilar de Goiás greenstone belt (Fig. 1) forms part of six greenstonebelt occurrences in the state of Goiás, Central Brazil (Crixas, Goiás,Guarinos, Pilar de Goiás, Santa Rita, Faina, see Kuyumjian and Jost,2006), which are embedded in older blocks within the NeoproterozoicBrasília Belt. The greenstone belts contain komatiites, minor BIFs andcherts, basalts, and sediments like graywackes, carbonaceous schists,black shales and dolomites (Jost et al., 2001). The sediments containmassive sulfide orebodies of predominantly pyrrhotite and arsenopyritewith an important Au mineralization (Thomson and Fyfe, 1990). Boththe age of the rocks as that of the Au mineralization has been debatedextensively during the last decades. Recent data suggest an age of2.2–2.17 Ga for the mineralization event (Jost et al., 2010). NearbyPaleoproterozoic plutons of 2146 Ma in age (Jost et al., 1993) suggest acontribution of crustal fluids to the mineralization event (Jost et al.,2010).
Apart from komatiites and BIFs, the Pilar de Goiás supracrustalgreenstone belt contains a sedimentary sequence largely made up ofmetagraywackes, orthoquartzites, dolomitic marbles and carbonaceousphyllites (Jost andDeOliveira, 1991). The sediments are correlatedwith
166 B. Bühn et al. / Chemical Geology 312–313 (2012) 163–176
Author's personal copy
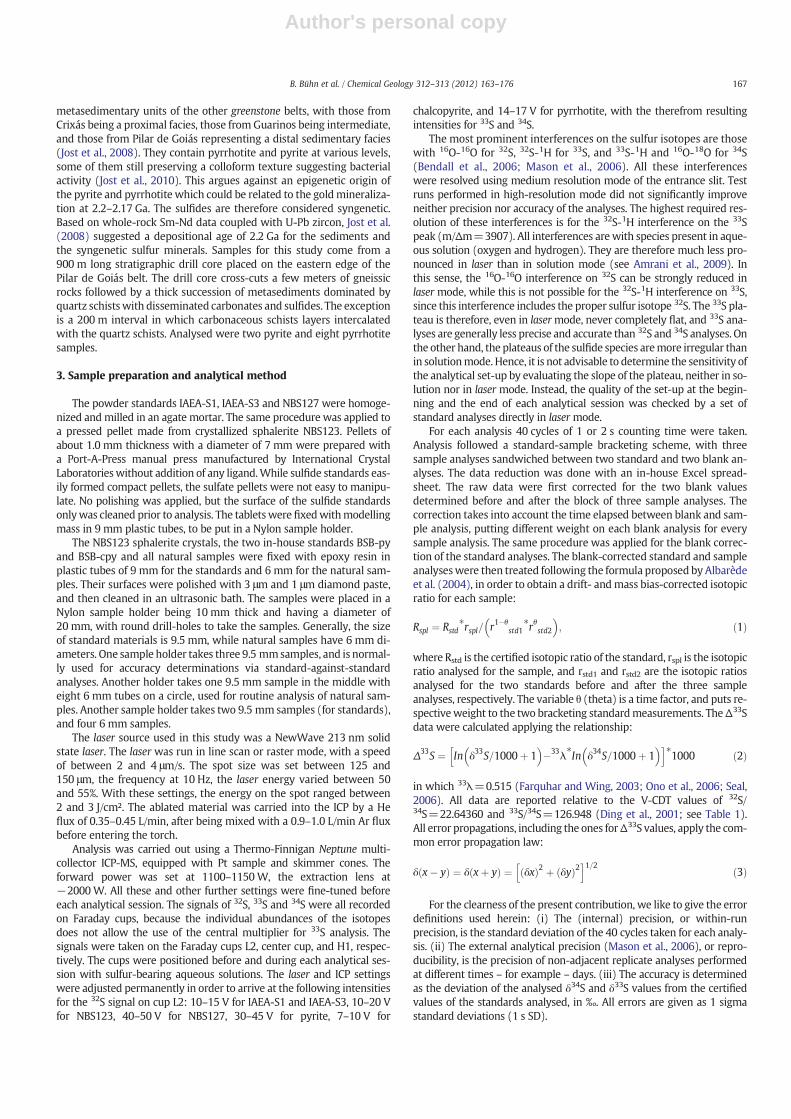
metasedimentary units of the other greenstone belts, with those fromCrixás being a proximal facies, those from Guarinos being intermediate,and those from Pilar de Goiás representing a distal sedimentary facies(Jost et al., 2008). They contain pyrrhotite and pyrite at various levels,some of them still preserving a colloform texture suggesting bacterialactivity (Jost et al., 2010). This argues against an epigenetic origin ofthe pyrite and pyrrhotite which could be related to the goldmineraliza-tion at 2.2–2.17 Ga. The sulfides are therefore considered syngenetic.Based on whole-rock Sm-Nd data coupled with U-Pb zircon, Jost et al.(2008) suggested a depositional age of 2.2 Ga for the sediments andthe syngenetic sulfur minerals. Samples for this study come from a900 m long stratigraphic drill core placed on the eastern edge of thePilar de Goiás belt. The drill core cross-cuts a few meters of gneissicrocks followed by a thick succession of metasediments dominated byquartz schistswith disseminated carbonates and sulfides. The exceptionis a 200 m interval in which carbonaceous schists layers intercalatedwith the quartz schists. Analysed were two pyrite and eight pyrrhotitesamples.
3. Sample preparation and analytical method
The powder standards IAEA-S1, IAEA-S3 and NBS127 were homoge-nized andmilled in an agate mortar. The same procedure was applied toa pressed pellet made from crystallized sphalerite NBS123. Pellets ofabout 1.0 mm thickness with a diameter of 7 mm were prepared witha Port-A-Press manual press manufactured by International CrystalLaboratorieswithout addition of any ligand.While sulfide standards eas-ily formed compact pellets, the sulfate pellets were not easy to manipu-late. No polishing was applied, but the surface of the sulfide standardsonlywas cleaned prior to analysis. The tabletswere fixedwithmodellingmass in 9 mm plastic tubes, to be put in a Nylon sample holder.
The NBS123 sphalerite crystals, the two in-house standards BSB-pyand BSB-cpy and all natural samples were fixed with epoxy resin inplastic tubes of 9 mm for the standards and 6 mm for the natural sam-ples. Their surfaces were polished with 3 μm and 1 μm diamond paste,and then cleaned in an ultrasonic bath. The samples were placed in aNylon sample holder being 10 mm thick and having a diameter of20 mm, with round drill-holes to take the samples. Generally, the sizeof standard materials is 9.5 mm, while natural samples have 6 mm di-ameters. One sample holder takes three 9.5 mmsamples, and is normal-ly used for accuracy determinations via standard-against-standardanalyses. Another holder takes one 9.5 mm sample in the middle witheight 6 mm tubes on a circle, used for routine analysis of natural sam-ples. Another sample holder takes two 9.5 mm samples (for standards),and four 6 mm samples.
The laser source used in this study was a NewWave 213 nm solidstate laser. The laser was run in line scan or raster mode, with a speedof between 2 and 4 μm/s. The spot size was set between 125 and150 μm, the frequency at 10 Hz, the laser energy varied between 50and 55%. With these settings, the energy on the spot ranged between2 and 3 J/cm². The ablated material was carried into the ICP by a Heflux of 0.35–0.45 L/min, after being mixed with a 0.9–1.0 L/min Ar fluxbefore entering the torch.
Analysis was carried out using a Thermo-Finnigan Neptune multi-collector ICP-MS, equipped with Pt sample and skimmer cones. Theforward power was set at 1100–1150W, the extraction lens at−2000W. All these and other further settings were fine-tuned beforeeach analytical session. The signals of 32S, 33S and 34S were all recordedon Faraday cups, because the individual abundances of the isotopesdoes not allow the use of the central multiplier for 33S analysis. Thesignals were taken on the Faraday cups L2, center cup, and H1, respec-tively. The cups were positioned before and during each analytical ses-sion with sulfur-bearing aqueous solutions. The laser and ICP settingswere adjusted permanently in order to arrive at the following intensitiesfor the 32S signal on cup L2: 10–15 V for IAEA-S1 and IAEA-S3, 10–20 Vfor NBS123, 40–50 V for NBS127, 30–45 V for pyrite, 7–10 V for
chalcopyrite, and 14–17 V for pyrrhotite, with the therefrom resultingintensities for 33S and 34S.
The most prominent interferences on the sulfur isotopes are thosewith 16O-16O for 32S, 32S-1H for 33S, and 33S-1H and 16O-18O for 34S(Bendall et al., 2006; Mason et al., 2006). All these interferenceswere resolved using medium resolution mode of the entrance slit. Testruns performed in high-resolution mode did not significantly improveneither precision nor accuracy of the analyses. The highest required res-olution of these interferences is for the 32S-1H interference on the 33Speak (m/Δm=3907). All interferences arewith species present in aque-ous solution (oxygen and hydrogen). They are therefore much less pro-nounced in laser than in solution mode (see Amrani et al., 2009). Inthis sense, the 16O-16O interference on 32S can be strongly reduced inlaser mode, while this is not possible for the 32S-1H interference on 33S,since this interference includes the proper sulfur isotope 32S. The 33S pla-teau is therefore, even in lasermode, never completely flat, and 33S ana-lyses are generally less precise and accurate than 32S and 34S analyses. Onthe other hand, the plateaus of the sulfide species aremore irregular thanin solutionmode. Hence, it is not advisable to determine the sensitivity ofthe analytical set-up by evaluating the slope of the plateau, neither in so-lution nor in laser mode. Instead, the quality of the set-up at the begin-ning and the end of each analytical session was checked by a set ofstandard analyses directly in laser mode.
For each analysis 40 cycles of 1 or 2 s counting time were taken.Analysis followed a standard-sample bracketing scheme, with threesample analyses sandwiched between two standard and two blank an-alyses. The data reduction was done with an in-house Excel spread-sheet. The raw data were first corrected for the two blank valuesdetermined before and after the block of three sample analyses. Thecorrection takes into account the time elapsed between blank and sam-ple analysis, putting different weight on each blank analysis for everysample analysis. The same procedure was applied for the blank correc-tion of the standard analyses. The blank-corrected standard and sampleanalyseswere then treated following the formula proposed by Albarèdeet al. (2004), in order to obtain a drift- andmass bias-corrected isotopicratio for each sample:
Rspl ¼ Rstd�rspl= r1�θ
std1�rθstd2
� �; ð1Þ
where Rstd is the certified isotopic ratio of the standard, rspl is the isotopicratio analysed for the sample, and rstd1 and rstd2 are the isotopic ratiosanalysed for the two standards before and after the three sampleanalyses, respectively. The variable θ (theta) is a time factor, and puts re-spectiveweight to the two bracketing standardmeasurements. TheΔ33Sdata were calculated applying the relationship:
Δ33S ¼ In δ33S=1000þ 1� �
�33λ�In δ34S=1000þ 1� �h i�
1000 ð2Þ
in which 33λ=0.515 (Farquhar and Wing, 2003; Ono et al., 2006; Seal,2006). All data are reported relative to the V-CDT values of 32S/34S=22.64360 and 33S/34S=126.948 (Ding et al., 2001; see Table 1).All error propagations, including the ones forΔ33S values, apply the com-mon error propagation law:
δ x� yð Þ ¼ δ xþ yð Þ ¼ δxð Þ2 þ δyð Þ2h i1=2 ð3Þ
For the clearness of the present contribution, we like to give the errordefinitions used herein: (i) The (internal) precision, or within-runprecision, is the standard deviation of the 40 cycles taken for each analy-sis. (ii) The external analytical precision (Mason et al., 2006), or repro-ducibility, is the precision of non-adjacent replicate analyses performedat different times – for example – days. (iii) The accuracy is determinedas the deviation of the analysed δ34S and δ33S values from the certifiedvalues of the standards analysed, in ‰. All errors are given as 1 sigmastandard deviations (1 s SD).
167B. Bühn et al. / Chemical Geology 312–313 (2012) 163–176
Author's personal copy
4. Results
4.1. Reference materials
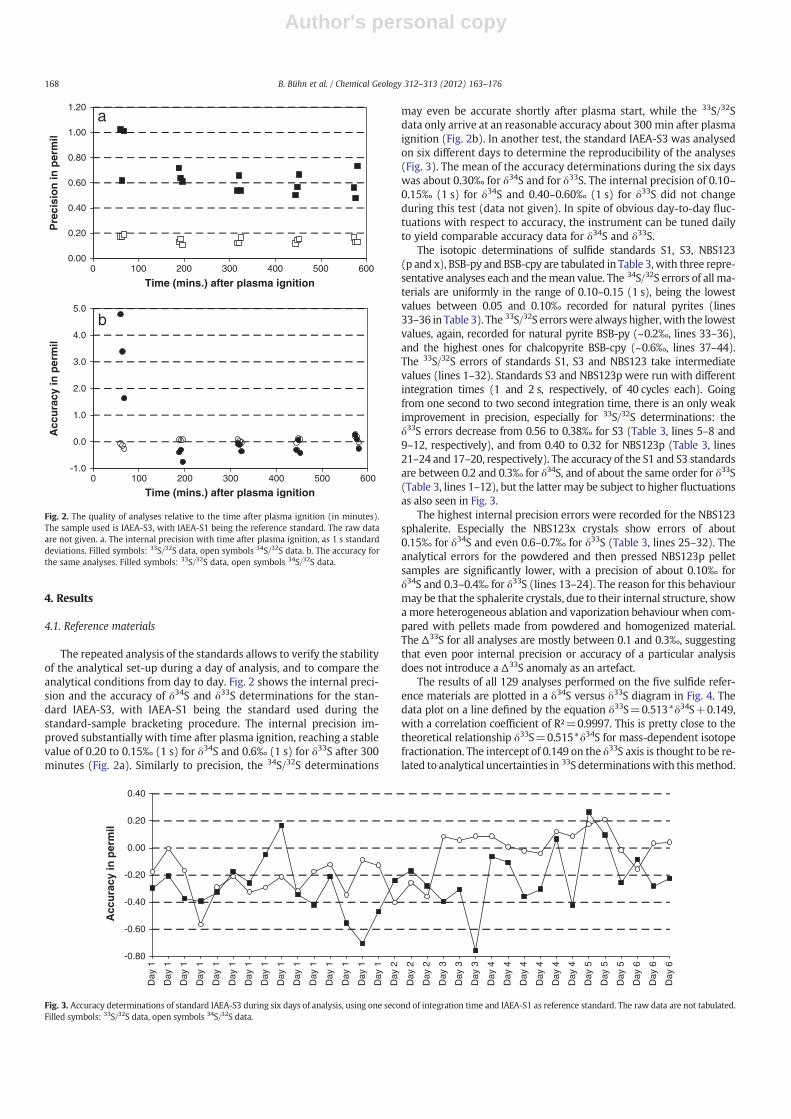
The repeated analysis of the standards allows to verify the stabilityof the analytical set-up during a day of analysis, and to compare theanalytical conditions from day to day. Fig. 2 shows the internal preci-sion and the accuracy of δ34S and δ33S determinations for the stan-dard IAEA-S3, with IAEA-S1 being the standard used during thestandard-sample bracketing procedure. The internal precision im-proved substantially with time after plasma ignition, reaching a stablevalue of 0.20 to 0.15‰ (1 s) for δ34S and 0.6‰ (1 s) for δ33S after 300minutes (Fig. 2a). Similarly to precision, the 34S/32S determinations
may even be accurate shortly after plasma start, while the 33S/32Sdata only arrive at an reasonable accuracy about 300 min after plasmaignition (Fig. 2b). In another test, the standard IAEA-S3 was analysedon six different days to determine the reproducibility of the analyses(Fig. 3). The mean of the accuracy determinations during the six dayswas about 0.30‰ for δ34S and for δ33S. The internal precision of 0.10–0.15‰ (1 s) for δ34S and 0.40–0.60‰ (1 s) for δ33S did not changeduring this test (data not given). In spite of obvious day-to-day fluc-tuations with respect to accuracy, the instrument can be tuned dailyto yield comparable accuracy data for δ34S and δ33S.
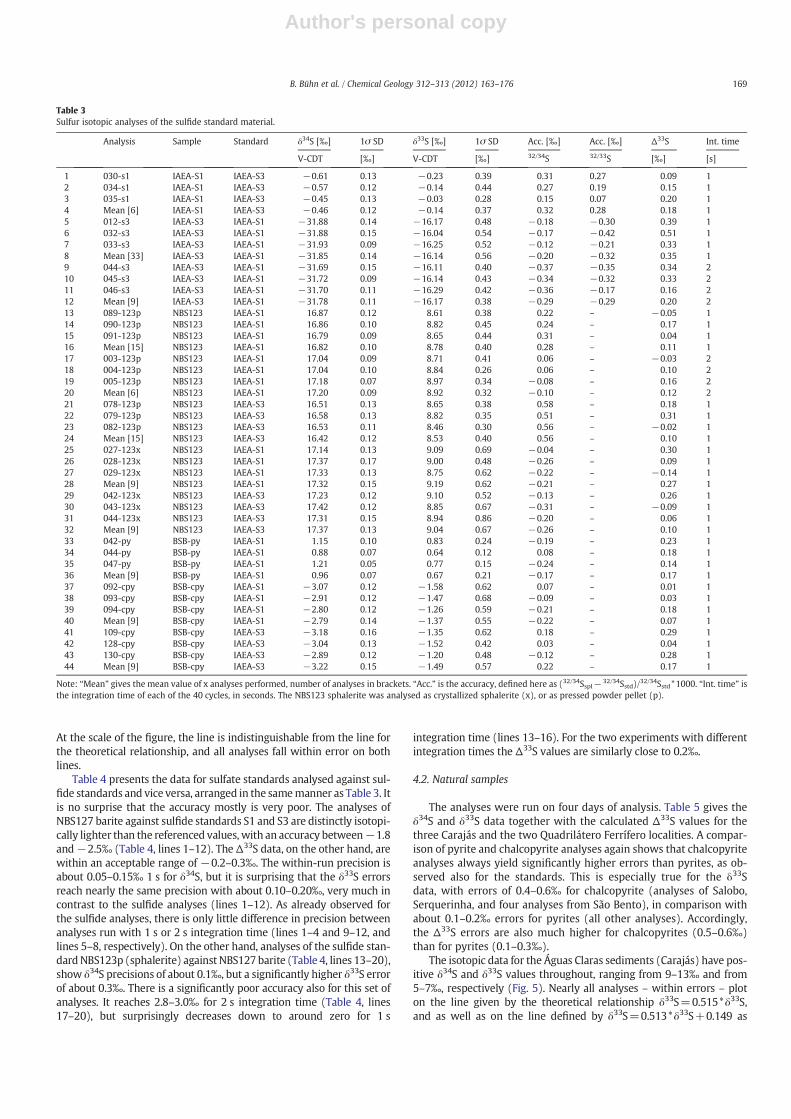
The isotopic determinations of sulfide standards S1, S3, NBS123(p and x), BSB-py and BSB-cpy are tabulated in Table 3, with three repre-sentative analyses each and themean value. The 34S/32S errors of all ma-terials are uniformly in the range of 0.10–0.15 (1 s), being the lowestvalues between 0.05 and 0.10‰ recorded for natural pyrites (lines33–36 in Table 3). The 33S/32S errorswere always higher,with the lowestvalues, again, recorded for natural pyrite BSB-py (~0.2‰, lines 33–36),and the highest ones for chalcopyrite BSB-cpy (~0.6‰, lines 37–44).The 33S/32S errors of standards S1, S3 and NBS123 take intermediatevalues (lines 1–32). Standards S3 and NBS123p were run with differentintegration times (1 and 2 s, respectively, of 40 cycles each). Goingfrom one second to two second integration time, there is an only weakimprovement in precision, especially for 33S/32S determinations: theδ33S errors decrease from 0.56 to 0.38‰ for S3 (Table 3, lines 5–8 and9–12, respectively), and from 0.40 to 0.32 for NBS123p (Table 3, lines21–24 and 17–20, respectively). The accuracy of the S1 and S3 standardsare between 0.2 and 0.3‰ for δ34S, and of about the same order for δ33S(Table 3, lines 1–12), but the latter may be subject to higher fluctuationsas also seen in Fig. 3.
The highest internal precision errors were recorded for the NBS123sphalerite. Especially the NBS123x crystals show errors of about0.15‰ for δ34S and even 0.6–0.7‰ for δ33S (Table 3, lines 25–32). Theanalytical errors for the powdered and then pressed NBS123p pelletsamples are significantly lower, with a precision of about 0.10‰ forδ34S and 0.3–0.4‰ for δ33S (lines 13–24). The reason for this behaviourmay be that the sphalerite crystals, due to their internal structure, showamore heterogeneous ablation and vaporization behaviour when com-pared with pellets made from powdered and homogenized material.The Δ33S for all analyses are mostly between 0.1 and 0.3‰, suggestingthat even poor internal precision or accuracy of a particular analysisdoes not introduce a Δ33S anomaly as an artefact.
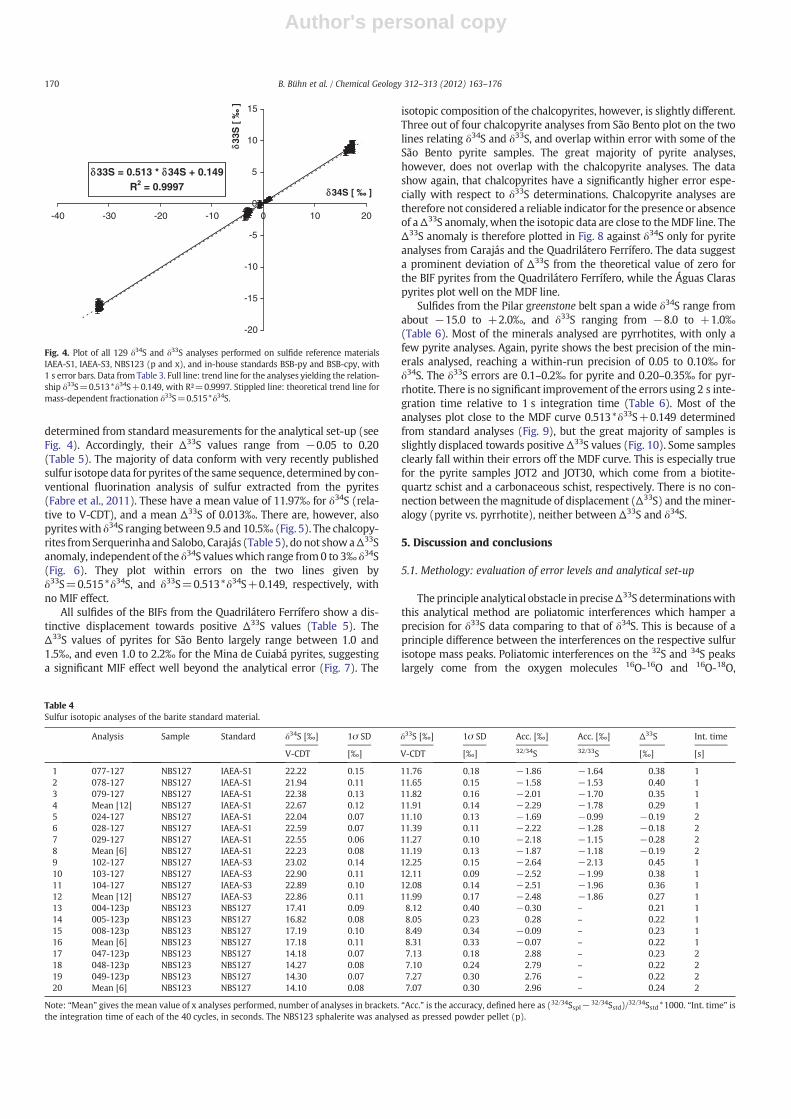
The results of all 129 analyses performed on the five sulfide refer-ence materials are plotted in a δ34S versus δ33S diagram in Fig. 4. Thedata plot on a line defined by the equation δ33S=0.513*δ34S+0.149,with a correlation coefficient of R²=0.9997. This is pretty close to thetheoretical relationship δ33S=0.515*δ34S for mass-dependent isotopefractionation. The intercept of 0.149 on the δ33S axis is thought to be re-lated to analytical uncertainties in 33S determinationswith thismethod.
-1.0
0.0
1.0
2.0
3.0
4.0
5.0
Time (mins.) after plasma ignition
Acc
ura
cy in
per
mil
0.00
0.20
0.40
0.60
0.80
1.00
1.20
0 100 200 300 400 500 600
0 100 200 300 400 500 600
Time (mins.) after plasma ignition
Pre
cisi
on
in p
erm
il
a
b
Fig. 2. The quality of analyses relative to the time after plasma ignition (in minutes).The sample used is IAEA-S3, with IAEA-S1 being the reference standard. The raw dataare not given. a. The internal precision with time after plasma ignition, as 1 s standarddeviations. Filled symbols: 33S/32S data, open symbols 34S/32S data. b. The accuracy forthe same analyses. Filled symbols: 33S/32S data, open symbols 34S/32S data.
-0.80
-0.60
-0.40
-0.20
0.00
0.20
0.40
Day
1
Day
1
Day
1
Day
1
Day
1
Day
1
Day
1
Day
1
Day
1
Day
1
Day
1
Day
1
Day
1
Day
1
Day
1
Day
2
Day
2
Day
2
Day
3
Day
3
Day
3
Day
4
Day
4
Day
4
Day
4
Day
4
Day
4
Day
5
Day
5
Day
5
Day
6
Day
6
Day
6
Acc
ura
cy in
per
mil
Fig. 3. Accuracy determinations of standard IAEA-S3 during six days of analysis, using one second of integration time and IAEA-S1 as reference standard. The raw data are not tabulated.Filled symbols: 33S/32S data, open symbols 34S/32S data.
168 B. Bühn et al. / Chemical Geology 312–313 (2012) 163–176
Author's personal copy
At the scale of the figure, the line is indistinguishable from the line forthe theoretical relationship, and all analyses fall within error on bothlines.
Table 4 presents the data for sulfate standards analysed against sul-fide standards and vice versa, arranged in the samemanner as Table 3. Itis no surprise that the accuracy mostly is very poor. The analyses ofNBS127 barite against sulfide standards S1 and S3 are distinctly isotopi-cally lighter than the referenced values, with an accuracy between−1.8and−2.5‰ (Table 4, lines 1–12). The Δ33S data, on the other hand, arewithin an acceptable range of −0.2–0.3‰. The within-run precision isabout 0.05–0.15‰ 1 s for δ34S, but it is surprising that the δ33S errorsreach nearly the same precision with about 0.10–0.20‰, very much incontrast to the sulfide analyses (lines 1–12). As already observed forthe sulfide analyses, there is only little difference in precision betweenanalyses run with 1 s or 2 s integration time (lines 1–4 and 9–12, andlines 5–8, respectively). On the other hand, analyses of the sulfide stan-dardNBS123p (sphalerite) against NBS127 barite (Table 4, lines 13–20),show δ34S precisions of about 0.1‰, but a significantly higher δ33S errorof about 0.3‰. There is a significantly poor accuracy also for this set ofanalyses. It reaches 2.8–3.0‰ for 2 s integration time (Table 4, lines17–20), but surprisingly decreases down to around zero for 1 s
integration time (lines 13–16). For the two experiments with differentintegration times the Δ33S values are similarly close to 0.2‰.
4.2. Natural samples
The analyses were run on four days of analysis. Table 5 gives theδ34S and δ33S data together with the calculated Δ33S values for thethree Carajás and the two Quadrilátero Ferrífero localities. A compar-ison of pyrite and chalcopyrite analyses again shows that chalcopyriteanalyses always yield significantly higher errors than pyrites, as ob-served also for the standards. This is especially true for the δ33Sdata, with errors of 0.4–0.6‰ for chalcopyrite (analyses of Salobo,Serquerinha, and four analyses from São Bento), in comparison withabout 0.1–0.2‰ errors for pyrites (all other analyses). Accordingly,the Δ33S errors are also much higher for chalcopyrites (0.5–0.6‰)than for pyrites (0.1–0.3‰).
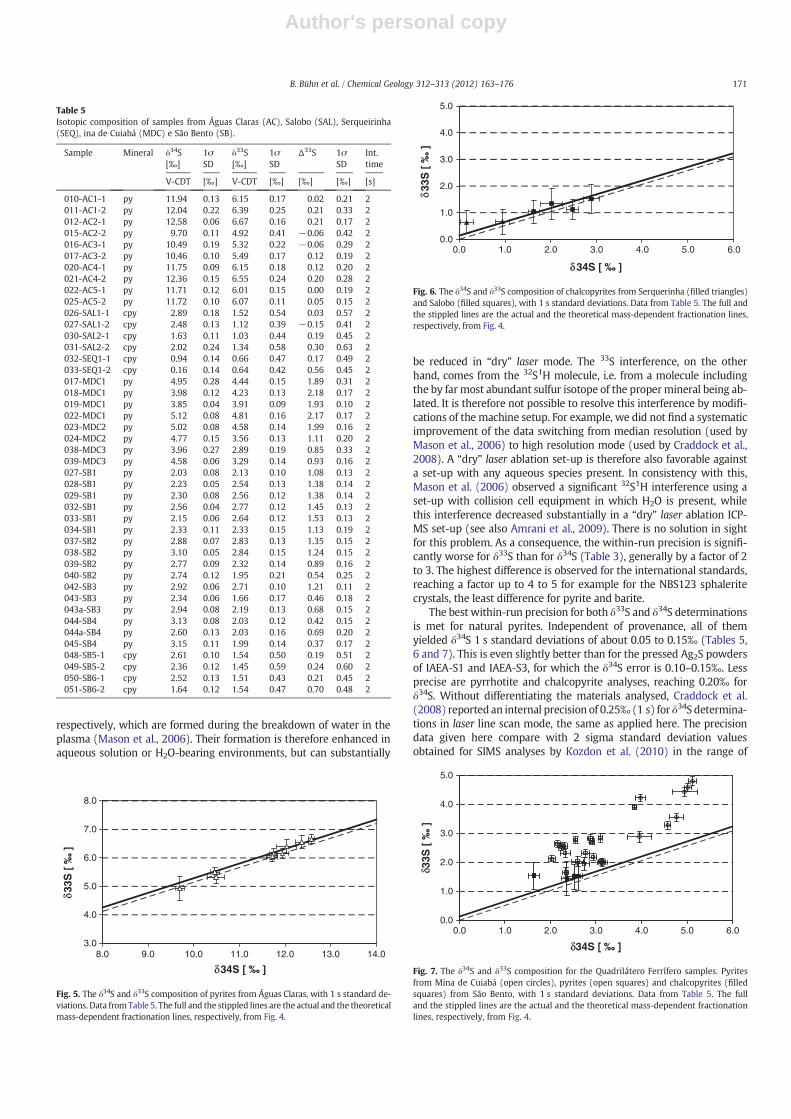
The isotopic data for the Águas Claras sediments (Carajás) have pos-itive δ34S and δ33S values throughout, ranging from 9–13‰ and from5–7‰, respectively (Fig. 5). Nearly all analyses – within errors – ploton the line given by the theoretical relationship δ33S=0.515*δ33S,and as well as on the line defined by δ33S=0.513*δ33S+0.149 as
Table 3Sulfur isotopic analyses of the sulfide standard material.
Analysis Sample Standard δ34S [‰] 1σ SD δ33S [‰] 1σ SD Acc. [‰] Acc. [‰] Δ33S Int. time
V-CDT [‰] V-CDT [‰] 32/34S 32/33S [‰] [s]
1 030-s1 IAEA-S1 IAEA-S3 −0.61 0.13 −0.23 0.39 0.31 0.27 0.09 12 034-s1 IAEA-S1 IAEA-S3 −0.57 0.12 −0.14 0.44 0.27 0.19 0.15 13 035-s1 IAEA-S1 IAEA-S3 −0.45 0.13 −0.03 0.28 0.15 0.07 0.20 14 Mean [6] IAEA-S1 IAEA-S3 −0.46 0.12 −0.14 0.37 0.32 0.28 0.18 15 012-s3 IAEA-S3 IAEA-S1 −31.88 0.14 −16.17 0.48 −0.18 −0.30 0.39 16 032-s3 IAEA-S3 IAEA-S1 −31.88 0.15 −16.04 0.54 −0.17 −0.42 0.51 17 033-s3 IAEA-S3 IAEA-S1 −31.93 0.09 −16.25 0.52 −0.12 −0.21 0.33 18 Mean [33] IAEA-S3 IAEA-S1 −31.85 0.14 −16.14 0.56 −0.20 −0.32 0.35 19 044-s3 IAEA-S3 IAEA-S1 −31.69 0.15 −16.11 0.40 −0.37 −0.35 0.34 210 045-s3 IAEA-S3 IAEA-S1 −31.72 0.09 −16.14 0.43 −0.34 −0.32 0.33 211 046-s3 IAEA-S3 IAEA-S1 −31.70 0.11 −16.29 0.42 −0.36 −0.17 0.16 212 Mean [9] IAEA-S3 IAEA-S1 −31.78 0.11 −16.17 0.38 −0.29 −0.29 0.20 213 089-123p NBS123 IAEA-S1 16.87 0.12 8.61 0.38 0.22 – −0.05 114 090-123p NBS123 IAEA-S1 16.86 0.10 8.82 0.45 0.24 – 0.17 115 091-123p NBS123 IAEA-S1 16.79 0.09 8.65 0.44 0.31 – 0.04 116 Mean [15] NBS123 IAEA-S1 16.82 0.10 8.78 0.40 0.28 – 0.11 117 003-123p NBS123 IAEA-S1 17.04 0.09 8.71 0.41 0.06 – −0.03 218 004-123p NBS123 IAEA-S1 17.04 0.10 8.84 0.26 0.06 – 0.10 219 005-123p NBS123 IAEA-S1 17.18 0.07 8.97 0.34 −0.08 – 0.16 220 Mean [6] NBS123 IAEA-S1 17.20 0.09 8.92 0.32 −0.10 – 0.12 221 078-123p NBS123 IAEA-S3 16.51 0.13 8.65 0.38 0.58 – 0.18 122 079-123p NBS123 IAEA-S3 16.58 0.13 8.82 0.35 0.51 – 0.31 123 082-123p NBS123 IAEA-S3 16.53 0.11 8.46 0.30 0.56 – −0.02 124 Mean [15] NBS123 IAEA-S3 16.42 0.12 8.53 0.40 0.56 – 0.10 125 027-123x NBS123 IAEA-S1 17.14 0.13 9.09 0.69 −0.04 – 0.30 126 028-123x NBS123 IAEA-S1 17.37 0.17 9.00 0.48 −0.26 – 0.09 127 029-123x NBS123 IAEA-S1 17.33 0.13 8.75 0.62 −0.22 – −0.14 128 Mean [9] NBS123 IAEA-S1 17.32 0.15 9.19 0.62 −0.21 – 0.27 129 042-123x NBS123 IAEA-S3 17.23 0.12 9.10 0.52 −0.13 – 0.26 130 043-123x NBS123 IAEA-S3 17.42 0.12 8.85 0.67 −0.31 – −0.09 131 044-123x NBS123 IAEA-S3 17.31 0.15 8.94 0.86 −0.20 – 0.06 132 Mean [9] NBS123 IAEA-S3 17.37 0.13 9.04 0.67 −0.26 – 0.10 133 042-py BSB-py IAEA-S1 1.15 0.10 0.83 0.24 −0.19 – 0.23 134 044-py BSB-py IAEA-S1 0.88 0.07 0.64 0.12 0.08 – 0.18 135 047-py BSB-py IAEA-S1 1.21 0.05 0.77 0.15 −0.24 – 0.14 136 Mean [9] BSB-py IAEA-S1 0.96 0.07 0.67 0.21 −0.17 – 0.17 137 092-cpy BSB-cpy IAEA-S1 −3.07 0.12 −1.58 0.62 0.07 – 0.01 138 093-cpy BSB-cpy IAEA-S1 −2.91 0.12 −1.47 0.68 −0.09 – 0.03 139 094-cpy BSB-cpy IAEA-S1 −2.80 0.12 −1.26 0.59 −0.21 – 0.18 140 Mean [9] BSB-cpy IAEA-S1 −2.79 0.14 −1.37 0.55 −0.22 – 0.07 141 109-cpy BSB-cpy IAEA-S3 −3.18 0.16 −1.35 0.62 0.18 – 0.29 142 128-cpy BSB-cpy IAEA-S3 −3.04 0.13 −1.52 0.42 0.03 – 0.04 143 130-cpy BSB-cpy IAEA-S3 −2.89 0.12 −1.20 0.48 −0.12 – 0.28 144 Mean [9] BSB-cpy IAEA-S3 −3.22 0.15 −1.49 0.57 0.22 – 0.17 1
Note: “Mean” gives the mean value of x analyses performed, number of analyses in brackets. “Acc.” is the accuracy, defined here as (32/34Sspl− 32/34Sstd)/32/34Sstd*1000. “Int. time” isthe integration time of each of the 40 cycles, in seconds. The NBS123 sphalerite was analysed as crystallized sphalerite (x), or as pressed powder pellet (p).
169B. Bühn et al. / Chemical Geology 312–313 (2012) 163–176
Author's personal copy
determined from standard measurements for the analytical set-up (seeFig. 4). Accordingly, their Δ33S values range from −0.05 to 0.20(Table 5). The majority of data conform with very recently publishedsulfur isotope data for pyrites of the same sequence, determined by con-ventional fluorination analysis of sulfur extracted from the pyrites(Fabre et al., 2011). These have a mean value of 11.97‰ for δ34S (rela-tive to V-CDT), and a mean Δ33S of 0.013‰. There are, however, alsopyriteswith δ34S ranging between 9.5 and 10.5‰ (Fig. 5). The chalcopy-rites fromSerquerinha and Salobo, Carajás (Table 5), do not showaΔ33Sanomaly, independent of the δ34S valueswhich range from0 to 3‰ δ34S(Fig. 6). They plot within errors on the two lines given byδ33S=0.515*δ34S, and δ33S=0.513*δ34S+0.149, respectively, withno MIF effect.
All sulfides of the BIFs from the Quadrilátero Ferrífero show a dis-tinctive displacement towards positive Δ33S values (Table 5). TheΔ33S values of pyrites for São Bento largely range between 1.0 and1.5‰, and even 1.0 to 2.2‰ for the Mina de Cuiabá pyrites, suggestinga significant MIF effect well beyond the analytical error (Fig. 7). The
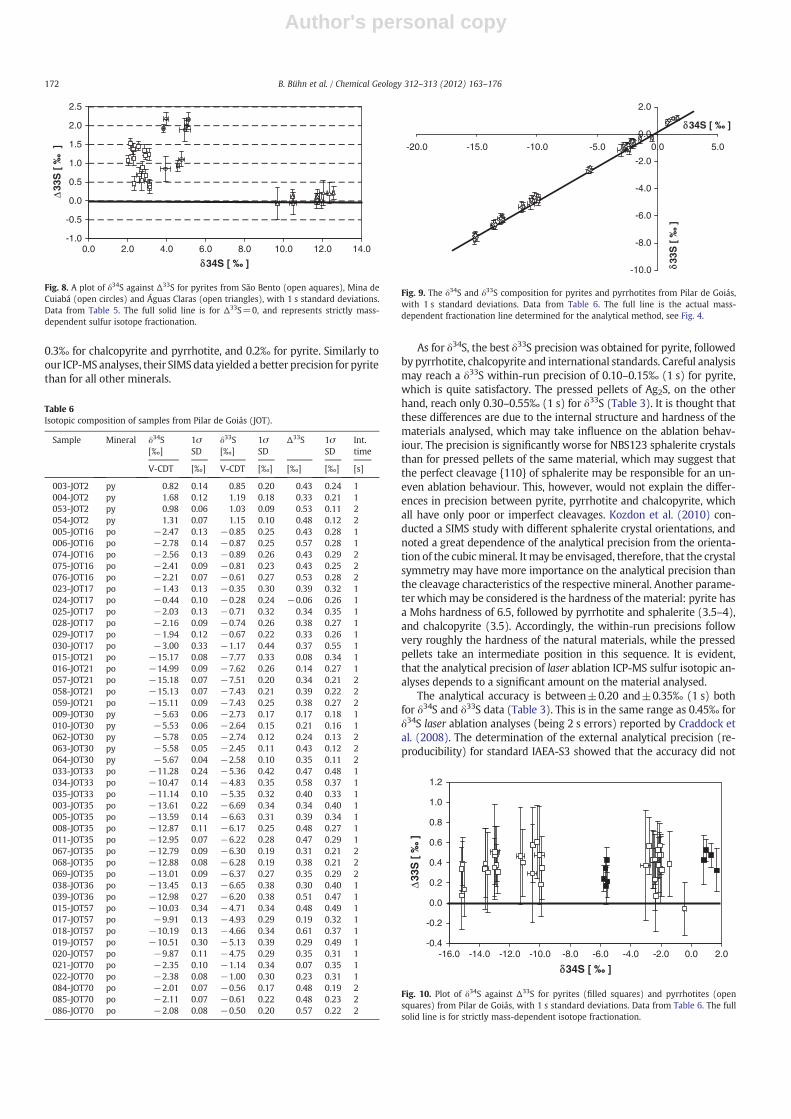
isotopic composition of the chalcopyrites, however, is slightly different.Three out of four chalcopyrite analyses from São Bento plot on the twolines relating δ34S and δ33S, and overlap within error with some of theSão Bento pyrite samples. The great majority of pyrite analyses,however, does not overlap with the chalcopyrite analyses. The datashow again, that chalcopyrites have a significantly higher error espe-cially with respect to δ33S determinations. Chalcopyrite analyses aretherefore not considered a reliable indicator for the presence or absenceof aΔ33S anomaly, when the isotopic data are close to theMDF line. TheΔ33S anomaly is therefore plotted in Fig. 8 against δ34S only for pyriteanalyses from Carajás and the Quadrilátero Ferrífero. The data suggesta prominent deviation of Δ33S from the theoretical value of zero forthe BIF pyrites from the Quadrilátero Ferrífero, while the Águas Claraspyrites plot well on the MDF line.
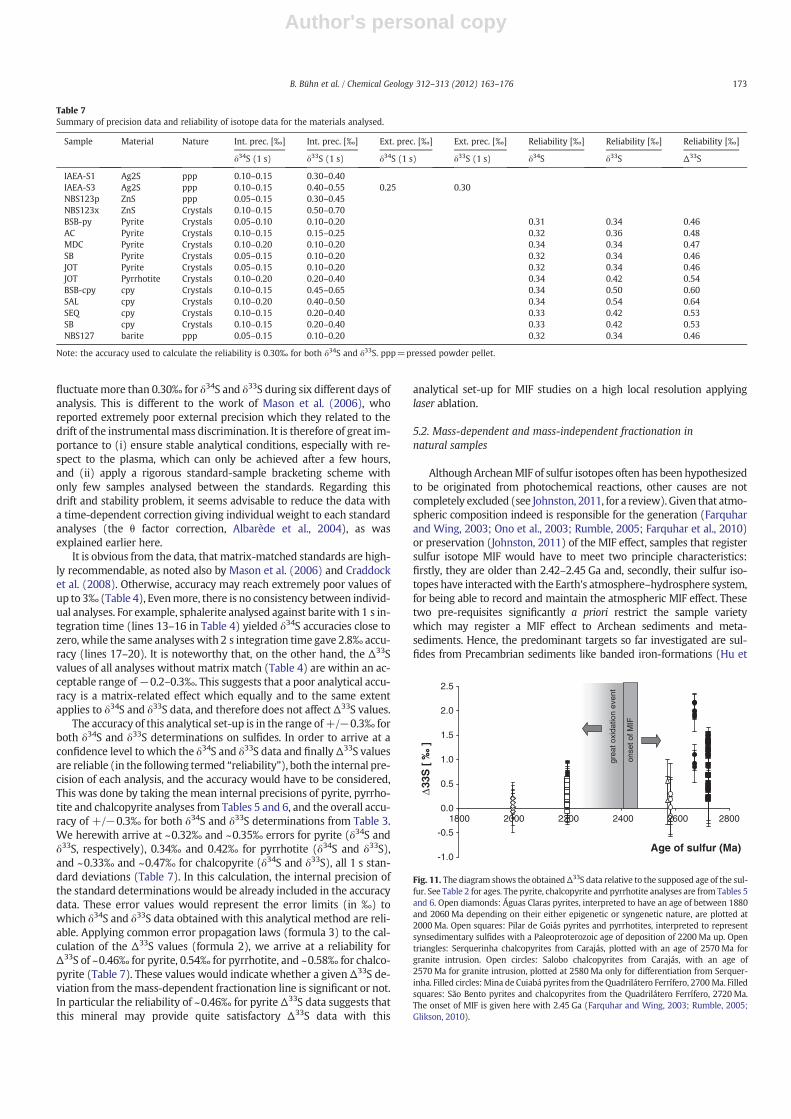
Sulfides from the Pilar greenstone belt span a wide δ34S range fromabout −15.0 to +2.0‰, and δ33S ranging from −8.0 to +1.0‰(Table 6). Most of the minerals analysed are pyrrhotites, with only afew pyrite analyses. Again, pyrite shows the best precision of the min-erals analysed, reaching a within-run precision of 0.05 to 0.10‰ forδ34S. The δ33S errors are 0.1–0.2‰ for pyrite and 0.20–0.35‰ for pyr-rhotite. There is no significant improvement of the errors using 2 s inte-gration time relative to 1 s integration time (Table 6). Most of theanalyses plot close to the MDF curve 0.513*δ33S+0.149 determinedfrom standard analyses (Fig. 9), but the great majority of samples isslightly displaced towards positive Δ33S values (Fig. 10). Some samplesclearly fall within their errors off the MDF curve. This is especially truefor the pyrite samples JOT2 and JOT30, which come from a biotite-quartz schist and a carbonaceous schist, respectively. There is no con-nection between themagnitude of displacement (Δ33S) and theminer-alogy (pyrite vs. pyrrhotite), neither between Δ33S and δ34S.
5. Discussion and conclusions
5.1. Methology: evaluation of error levels and analytical set-up
The principle analytical obstacle in preciseΔ33S determinationswiththis analytical method are poliatomic interferences which hamper aprecision for δ33S data comparing to that of δ34S. This is because of aprinciple difference between the interferences on the respective sulfurisotope mass peaks. Poliatomic interferences on the 32S and 34S peakslargely come from the oxygen molecules 16O-16O and 16O-18O,
δ33S = 0.513 * δ34S + 0.149R2 = 0.9997
-20
-15
-10
-5
0
5
10
15
-40 -30 -20 -10 0 10 20
δ34S [ ‰ ]
δ 33S
[ ‰
]
Fig. 4. Plot of all 129 δ34S and δ33S analyses performed on sulfide reference materialsIAEA-S1, IAEA-S3, NBS123 (p and x), and in-house standards BSB-py and BSB-cpy, with1 s error bars. Data from Table 3. Full line: trend line for the analyses yielding the relation-ship δ33S=0.513*δ34S+0.149, with R²=0.9997. Stippled line: theoretical trend line formass-dependent fractionation δ33S=0.515*δ34S.
Table 4Sulfur isotopic analyses of the barite standard material.
Analysis Sample Standard δ34S [‰] 1σ SD δ33S [‰] 1σ SD Acc. [‰] Acc. [‰] Δ33S Int. time
V-CDT [‰] V-CDT [‰] 32/34S 32/33S [‰] [s]
1 077-127 NBS127 IAEA-S1 22.22 0.15 11.76 0.18 −1.86 −1.64 0.38 12 078-127 NBS127 IAEA-S1 21.94 0.11 11.65 0.15 −1.58 −1.53 0.40 13 079-127 NBS127 IAEA-S1 22.38 0.13 11.82 0.16 −2.01 −1.70 0.35 14 Mean [12] NBS127 IAEA-S1 22.67 0.12 11.91 0.14 −2.29 −1.78 0.29 15 024-127 NBS127 IAEA-S1 22.04 0.07 11.10 0.13 −1.69 −0.99 −0.19 26 028-127 NBS127 IAEA-S1 22.59 0.07 11.39 0.11 −2.22 −1.28 −0.18 27 029-127 NBS127 IAEA-S1 22.55 0.06 11.27 0.10 −2.18 −1.15 −0.28 28 Mean [6] NBS127 IAEA-S1 22.23 0.08 11.19 0.13 −1.87 −1.18 −0.19 29 102-127 NBS127 IAEA-S3 23.02 0.14 12.25 0.15 −2.64 −2.13 0.45 110 103-127 NBS127 IAEA-S3 22.90 0.11 12.11 0.09 −2.52 −1.99 0.38 111 104-127 NBS127 IAEA-S3 22.89 0.10 12.08 0.14 −2.51 −1.96 0.36 112 Mean [12] NBS127 IAEA-S3 22.86 0.11 11.99 0.17 −2.48 −1.86 0.27 113 004-123p NBS123 NBS127 17.41 0.09 8.12 0.40 −0.30 – 0.21 114 005-123p NBS123 NBS127 16.82 0.08 8.05 0.23 0.28 – 0.22 115 008-123p NBS123 NBS127 17.19 0.10 8.49 0.34 −0.09 – 0.23 116 Mean [6] NBS123 NBS127 17.18 0.11 8.31 0.33 −0.07 – 0.22 117 047-123p NBS123 NBS127 14.18 0.07 7.13 0.18 2.88 – 0.23 218 048-123p NBS123 NBS127 14.27 0.08 7.10 0.24 2.79 – 0.22 219 049-123p NBS123 NBS127 14.30 0.07 7.27 0.30 2.76 – 0.22 220 Mean [6] NBS123 NBS127 14.10 0.08 7.07 0.30 2.96 – 0.24 2
Note: “Mean” gives the mean value of x analyses performed, number of analyses in brackets. “Acc.” is the accuracy, defined here as (32/34Sspl− 32/34Sstd)/32/34Sstd*1000. “Int. time” isthe integration time of each of the 40 cycles, in seconds. The NBS123 sphalerite was analysed as pressed powder pellet (p).
170 B. Bühn et al. / Chemical Geology 312–313 (2012) 163–176
Author's personal copy
respectively, which are formed during the breakdown of water in theplasma (Mason et al., 2006). Their formation is therefore enhanced inaqueous solution or H2O-bearing environments, but can substantially
be reduced in “dry” laser mode. The 33S interference, on the otherhand, comes from the 32S1H molecule, i.e. from a molecule includingthe by far most abundant sulfur isotope of the propermineral being ab-lated. It is therefore not possible to resolve this interference by modifi-cations of the machine setup. For example, we did not find a systematicimprovement of the data switching from median resolution (used byMason et al., 2006) to high resolution mode (used by Craddock et al.,2008). A “dry” laser ablation set-up is therefore also favorable againsta set-up with any aqueous species present. In consistency with this,Mason et al. (2006) observed a significant 32S1H interference using aset-up with collision cell equipment in which H2O is present, whilethis interference decreased substantially in a “dry” laser ablation ICP-MS set-up (see also Amrani et al., 2009). There is no solution in sightfor this problem. As a consequence, the within-run precision is signifi-cantly worse for δ33S than for δ34S (Table 3), generally by a factor of 2to 3. The highest difference is observed for the international standards,reaching a factor up to 4 to 5 for example for the NBS123 sphaleritecrystals, the least difference for pyrite and barite.
The best within-run precision for both δ33S and δ34S determinationsis met for natural pyrites. Independent of provenance, all of themyielded δ34S 1 s standard deviations of about 0.05 to 0.15‰ (Tables 5,6 and 7). This is even slightly better than for the pressed Ag2S powdersof IAEA-S1 and IAEA-S3, for which the δ34S error is 0.10–0.15‰. Lessprecise are pyrrhotite and chalcopyrite analyses, reaching 0.20‰ forδ34S. Without differentiating the materials analysed, Craddock et al.(2008) reported an internal precision of 0.25‰ (1 s) for δ34S determina-tions in laser line scan mode, the same as applied here. The precisiondata given here compare with 2 sigma standard deviation valuesobtained for SIMS analyses by Kozdon et al. (2010) in the range of
Table 5Isotopic composition of samples from Águas Claras (AC), Salobo (SAL), Serqueirinha(SEQ), ina de Cuiabá (MDC) e São Bento (SB).
Sample Mineral δ34S[‰]
1σSD
δ33S[‰]
1σSD
Δ33S 1σSD
Int.time
V-CDT [‰] V-CDT [‰] [‰] [‰] [s]
010-AC1-1 py 11.94 0.13 6.15 0.17 0.02 0.21 2011-AC1-2 py 12.04 0.22 6.39 0.25 0.21 0.33 2012-AC2-1 py 12.58 0.06 6.67 0.16 0.21 0.17 2015-AC2-2 py 9.70 0.11 4.92 0.41 −0.06 0.42 2016-AC3-1 py 10.49 0.19 5.32 0.22 −0.06 0.29 2017-AC3-2 py 10.46 0.10 5.49 0.17 0.12 0.19 2020-AC4-1 py 11.75 0.09 6.15 0.18 0.12 0.20 2021-AC4-2 py 12.36 0.15 6.55 0.24 0.20 0.28 2022-AC5-1 py 11.71 0.12 6.01 0.15 0.00 0.19 2025-AC5-2 py 11.72 0.10 6.07 0.11 0.05 0.15 2026-SAL1-1 cpy 2.89 0.18 1.52 0.54 0.03 0.57 2027-SAL1-2 cpy 2.48 0.13 1.12 0.39 −0.15 0.41 2030-SAL2-1 cpy 1.63 0.11 1.03 0.44 0.19 0.45 2031-SAL2-2 cpy 2.02 0.24 1.34 0.58 0.30 0.63 2032-SEQ1-1 cpy 0.94 0.14 0.66 0.47 0.17 0.49 2033-SEQ1-2 cpy 0.16 0.14 0.64 0.42 0.56 0.45 2017-MDC1 py 4.95 0.28 4.44 0.15 1.89 0.31 2018-MDC1 py 3.98 0.12 4.23 0.13 2.18 0.17 2019-MDC1 py 3.85 0.04 3.91 0.09 1.93 0.10 2022-MDC1 py 5.12 0.08 4.81 0.16 2.17 0.17 2023-MDC2 py 5.02 0.08 4.58 0.14 1.99 0.16 2024-MDC2 py 4.77 0.15 3.56 0.13 1.11 0.20 2038-MDC3 py 3.96 0.27 2.89 0.19 0.85 0.33 2039-MDC3 py 4.58 0.06 3.29 0.14 0.93 0.16 2027-SB1 py 2.03 0.08 2.13 0.10 1.08 0.13 2028-SB1 py 2.23 0.05 2.54 0.13 1.38 0.14 2029-SB1 py 2.30 0.08 2.56 0.12 1.38 0.14 2032-SB1 py 2.56 0.04 2.77 0.12 1.45 0.13 2033-SB1 py 2.15 0.06 2.64 0.12 1.53 0.13 2034-SB1 py 2.33 0.11 2.33 0.15 1.13 0.19 2037-SB2 py 2.88 0.07 2.83 0.13 1.35 0.15 2038-SB2 py 3.10 0.05 2.84 0.15 1.24 0.15 2039-SB2 py 2.77 0.09 2.32 0.14 0.89 0.16 2040-SB2 py 2.74 0.12 1.95 0.21 0.54 0.25 2042-SB3 py 2.92 0.06 2.71 0.10 1.21 0.11 2043-SB3 py 2.34 0.06 1.66 0.17 0.46 0.18 2043a-SB3 py 2.94 0.08 2.19 0.13 0.68 0.15 2044-SB4 py 3.13 0.08 2.03 0.12 0.42 0.15 2044a-SB4 py 2.60 0.13 2.03 0.16 0.69 0.20 2045-SB4 py 3.15 0.11 1.99 0.14 0.37 0.17 2048-SB5-1 cpy 2.61 0.10 1.54 0.50 0.19 0.51 2049-SB5-2 cpy 2.36 0.12 1.45 0.59 0.24 0.60 2050-SB6-1 cpy 2.52 0.13 1.51 0.43 0.21 0.45 2051-SB6-2 cpy 1.64 0.12 1.54 0.47 0.70 0.48 2
3.0
4.0
5.0
6.0
7.0
8.0
8.0 9.0 10.0 11.0 12.0 13.0 14.0
δ34S [ ‰ ]
δ33S
[ ‰
]
Fig. 5. The δ34S and δ33S composition of pyrites from Águas Claras, with 1 s standard de-viations. Data from Table 5. The full and the stippled lines are the actual and the theoreticalmass-dependent fractionation lines, respectively, from Fig. 4.
0.0
1.0
2.0
3.0
4.0
5.0
0.0 1.0 2.0 3.0 4.0 5.0 6.0
δ34S [ ‰ ]
δ33S
[ ‰
]
Fig. 6. The δ34S and δ33S composition of chalcopyrites from Serquerinha (filled triangles)and Salobo (filled squares), with 1 s standard deviations. Data from Table 5. The full andthe stippled lines are the actual and the theoretical mass-dependent fractionation lines,respectively, from Fig. 4.
0.0
1.0
2.0
3.0
4.0
5.0
0.0 1.0 2.0 3.0 4.0 5.0 6.0
δ34S [ ‰ ]
δ33S
[ ‰
]
Fig. 7. The δ34S and δ33S composition for the Quadrilátero Ferrífero samples. Pyritesfrom Mina de Cuiabá (open circles), pyrites (open squares) and chalcopyrites (filledsquares) from São Bento, with 1 s standard deviations. Data from Table 5. The fulland the stippled lines are the actual and the theoretical mass-dependent fractionationlines, respectively, from Fig. 4.
171B. Bühn et al. / Chemical Geology 312–313 (2012) 163–176
Author's personal copy
0.3‰ for chalcopyrite and pyrrhotite, and 0.2‰ for pyrite. Similarly toour ICP-MS analyses, their SIMSdata yielded a better precision for pyritethan for all other minerals.
As for δ34S, the best δ33S precision was obtained for pyrite, followedby pyrrhotite, chalcopyrite and international standards. Careful analysismay reach a δ33S within-run precision of 0.10–0.15‰ (1 s) for pyrite,which is quite satisfactory. The pressed pellets of Ag2S, on the otherhand, reach only 0.30–0.55‰ (1 s) for δ33S (Table 3). It is thought thatthese differences are due to the internal structure and hardness of thematerials analysed, which may take influence on the ablation behav-iour. The precision is significantly worse for NBS123 sphalerite crystalsthan for pressed pellets of the same material, which may suggest thatthe perfect cleavage {110} of sphalerite may be responsible for an un-even ablation behaviour. This, however, would not explain the differ-ences in precision between pyrite, pyrrhotite and chalcopyrite, whichall have only poor or imperfect cleavages. Kozdon et al. (2010) con-ducted a SIMS study with different sphalerite crystal orientations, andnoted a great dependence of the analytical precision from the orienta-tion of the cubicmineral. It may be envisaged, therefore, that the crystalsymmetry may have more importance on the analytical precision thanthe cleavage characteristics of the respective mineral. Another parame-ter whichmay be considered is the hardness of the material: pyrite hasa Mohs hardness of 6.5, followed by pyrrhotite and sphalerite (3.5–4),and chalcopyrite (3.5). Accordingly, the within-run precisions followvery roughly the hardness of the natural materials, while the pressedpellets take an intermediate position in this sequence. It is evident,that the analytical precision of laser ablation ICP-MS sulfur isotopic an-alyses depends to a significant amount on the material analysed.
The analytical accuracy is between±0.20 and±0.35‰ (1 s) bothfor δ34S and δ33S data (Table 3). This is in the same range as 0.45‰ forδ34S laser ablation analyses (being 2 s errors) reported by Craddock etal. (2008). The determination of the external analytical precision (re-producibility) for standard IAEA-S3 showed that the accuracy did not
-1.0
-0.5
0.0
0.5
1.0
1.5
2.0
2.5
0.0 2.0 4.0 6.0 8.0 10.0 12.0 14.0
δ34S [ ‰ ]
Δ33
S [
‰ ]
Fig. 8. A plot of δ34S against Δ33S for pyrites from São Bento (open aquares), Mina deCuiabá (open circles) and Águas Claras (open triangles), with 1 s standard deviations.Data from Table 5. The full solid line is for Δ33S=0, and represents strictly mass-dependent sulfur isotope fractionation.
Table 6Isotopic composition of samples from Pilar de Goiás (JOT).
Sample Mineral δ34S[‰]
1σSD
δ33S[‰]
1σSD
Δ33S 1σSD
Int.time
V-CDT [‰] V-CDT [‰] [‰] [‰] [s]
003-JOT2 py 0.82 0.14 0.85 0.20 0.43 0.24 1004-JOT2 py 1.68 0.12 1.19 0.18 0.33 0.21 1053-JOT2 py 0.98 0.06 1.03 0.09 0.53 0.11 2054-JOT2 py 1.31 0.07 1.15 0.10 0.48 0.12 2005-JOT16 po −2.47 0.13 −0.85 0.25 0.43 0.28 1006-JOT16 po −2.78 0.14 −0.87 0.25 0.57 0.28 1074-JOT16 po −2.56 0.13 −0.89 0.26 0.43 0.29 2075-JOT16 po −2.41 0.09 −0.81 0.23 0.43 0.25 2076-JOT16 po −2.21 0.07 −0.61 0.27 0.53 0.28 2023-JOT17 po −1.43 0.13 −0.35 0.30 0.39 0.32 1024-JOT17 po −0.44 0.10 −0.28 0.24 −0.06 0.26 1025-JOT17 po −2.03 0.13 −0.71 0.32 0.34 0.35 1028-JOT17 po −2.16 0.09 −0.74 0.26 0.38 0.27 1029-JOT17 po −1.94 0.12 −0.67 0.22 0.33 0.26 1030-JOT17 po −3.00 0.33 −1.17 0.44 0.37 0.55 1015-JOT21 po −15.17 0.08 −7.77 0.33 0.08 0.34 1016-JOT21 po −14.99 0.09 −7.62 0.26 0.14 0.27 1057-JOT21 po −15.18 0.07 −7.51 0.20 0.34 0.21 2058-JOT21 po −15.13 0.07 −7.43 0.21 0.39 0.22 2059-JOT21 po −15.11 0.09 −7.43 0.25 0.38 0.27 2009-JOT30 py −5.63 0.06 −2.73 0.17 0.17 0.18 1010-JOT30 py −5.53 0.06 −2.64 0.15 0.21 0.16 1062-JOT30 py −5.78 0.05 −2.74 0.12 0.24 0.13 2063-JOT30 py −5.58 0.05 −2.45 0.11 0.43 0.12 2064-JOT30 py −5.67 0.04 −2.58 0.10 0.35 0.11 2033-JOT33 po −11.28 0.24 −5.36 0.42 0.47 0.48 1034-JOT33 po −10.47 0.14 −4.83 0.35 0.58 0.37 1035-JOT33 po −11.14 0.10 −5.35 0.32 0.40 0.33 1003-JOT35 po −13.61 0.22 −6.69 0.34 0.34 0.40 1005-JOT35 po −13.59 0.14 −6.63 0.31 0.39 0.34 1008-JOT35 po −12.87 0.11 −6.17 0.25 0.48 0.27 1011-JOT35 po −12.95 0.07 −6.22 0.28 0.47 0.29 1067-JOT35 po −12.79 0.09 −6.30 0.19 0.31 0.21 2068-JOT35 po −12.88 0.08 −6.28 0.19 0.38 0.21 2069-JOT35 po −13.01 0.09 −6.37 0.27 0.35 0.29 2038-JOT36 po −13.45 0.13 −6.65 0.38 0.30 0.40 1039-JOT36 po −12.98 0.27 −6.20 0.38 0.51 0.47 1015-JOT57 po −10.03 0.34 −4.71 0.34 0.48 0.49 1017-JOT57 po −9.91 0.13 −4.93 0.29 0.19 0.32 1018-JOT57 po −10.19 0.13 −4.66 0.34 0.61 0.37 1019-JOT57 po −10.51 0.30 −5.13 0.39 0.29 0.49 1020-JOT57 po −9.87 0.11 −4.75 0.29 0.35 0.31 1021-JOT70 po −2.35 0.10 −1.14 0.34 0.07 0.35 1022-JOT70 po −2.38 0.08 −1.00 0.30 0.23 0.31 1084-JOT70 po −2.01 0.07 −0.56 0.17 0.48 0.19 2085-JOT70 po −2.11 0.07 −0.61 0.22 0.48 0.23 2086-JOT70 po −2.08 0.08 −0.50 0.20 0.57 0.22 2
-10.0
-8.0
-6.0
-4.0
-2.0
0.0
2.0
-20.0 -15.0 -10.0 -5.0 0.0 5.0
δ34S [ ‰ ]
δ33S
[ ‰
]
Fig. 9. The δ34S and δ33S composition for pyrites and pyrrhotites from Pilar de Goiás,with 1 s standard deviations. Data from Table 6. The full line is the actual mass-dependent fractionation line determined for the analytical method, see Fig. 4.
-0.4
-0.2
0.0
0.2
0.4
0.6
0.8
1.0
1.2
-16.0 -14.0 -12.0 -10.0 -8.0 -6.0 -4.0 -2.0 0.0 2.0
δ34S [ ‰ ]
Δ33
S [
‰ ]
Fig. 10. Plot of δ34S against Δ33S for pyrites (filled squares) and pyrrhotites (opensquares) from Pilar de Goiás, with 1 s standard deviations. Data from Table 6. The fullsolid line is for strictly mass-dependent isotope fractionation.
172 B. Bühn et al. / Chemical Geology 312–313 (2012) 163–176
Author's personal copy
fluctuatemore than 0.30‰ for δ34S and δ33S during six different days ofanalysis. This is different to the work of Mason et al. (2006), whoreported extremely poor external precision which they related to thedrift of the instrumentalmass discrimination. It is therefore of great im-portance to (i) ensure stable analytical conditions, especially with re-spect to the plasma, which can only be achieved after a few hours,and (ii) apply a rigorous standard-sample bracketing scheme withonly few samples analysed between the standards. Regarding thisdrift and stability problem, it seems advisable to reduce the data witha time-dependent correction giving individual weight to each standardanalyses (the θ factor correction, Albarède et al., 2004), as wasexplained earlier here.
It is obvious from the data, that matrix-matched standards are high-ly recommendable, as noted also by Mason et al. (2006) and Craddocket al. (2008). Otherwise, accuracy may reach extremely poor values ofup to 3‰ (Table 4), Evenmore, there is no consistency between individ-ual analyses. For example, sphalerite analysed against baritewith 1 s in-tegration time (lines 13–16 in Table 4) yielded δ34S accuracies close tozero, while the same analyseswith 2 s integration time gave 2.8‰ accu-racy (lines 17–20). It is noteworthy that, on the other hand, the Δ33Svalues of all analyses without matrix match (Table 4) are within an ac-ceptable range of−0.2–0.3‰. This suggests that a poor analytical accu-racy is a matrix-related effect which equally and to the same extentapplies to δ34S and δ33S data, and therefore does not affect Δ33S values.
The accuracy of this analytical set-up is in the range of+/−0.3‰ forboth δ34S and δ33S determinations on sulfides. In order to arrive at aconfidence level to which the δ34S and δ33S data and finally Δ33S valuesare reliable (in the following termed “reliability”), both the internal pre-cision of each analysis, and the accuracy would have to be considered,This was done by taking the mean internal precisions of pyrite, pyrrho-tite and chalcopyrite analyses from Tables 5 and 6, and the overall accu-racy of +/−0.3‰ for both δ34S and δ33S determinations from Table 3.We herewith arrive at ~0.32‰ and ~0.35‰ errors for pyrite (δ34S andδ33S, respectively), 0.34‰ and 0.42‰ for pyrrhotite (δ34S and δ33S),and ~0.33‰ and ~0.47‰ for chalcopyrite (δ34S and δ33S), all 1 s stan-dard deviations (Table 7). In this calculation, the internal precision ofthe standard determinations would be already included in the accuracydata. These error values would represent the error limits (in ‰) towhich δ34S and δ33S data obtained with this analytical method are reli-able. Applying common error propagation laws (formula 3) to the cal-culation of the Δ33S values (formula 2), we arrive at a reliability forΔ33S of ~0.46‰ for pyrite, 0.54‰ for pyrrhotite, and ~0.58‰ for chalco-pyrite (Table 7). These values would indicate whether a given Δ33S de-viation from themass-dependent fractionation line is significant or not.In particular the reliability of ~0.46‰ for pyrite Δ33S data suggests thatthis mineral may provide quite satisfactory Δ33S data with this
analytical set-up for MIF studies on a high local resolution applyinglaser ablation.
5.2. Mass-dependent and mass-independent fractionation innatural samples
Although ArcheanMIF of sulfur isotopes often has been hypothesizedto be originated from photochemical reactions, other causes are notcompletely excluded (see Johnston, 2011, for a review). Given that atmo-spheric composition indeed is responsible for the generation (Farquharand Wing, 2003; Ono et al., 2003; Rumble, 2005; Farquhar et al., 2010)or preservation (Johnston, 2011) of the MIF effect, samples that registersulfur isotope MIF would have to meet two principle characteristics:firstly, they are older than 2.42–2.45 Ga and, secondly, their sulfur iso-topes have interactedwith the Earth's atmosphere–hydrosphere system,for being able to record and maintain the atmospheric MIF effect. Thesetwo pre-requisites significantly a priori restrict the sample varietywhich may register a MIF effect to Archean sediments and meta-sediments. Hence, the predominant targets so far investigated are sul-fides from Precambrian sediments like banded iron-formations (Hu et
-1.0
-0.5
0.0
0.5
1.0
1.5
2.0
2.5
1800 2000 2200 2400 2600 2800
Age of sulfur (Ma)
Δ33
S [
‰ ]
onse
t of M
IF
grea
t oxi
datio
n ev
ent
Fig. 11. The diagram shows the obtainedΔ33S data relative to the supposed age of the sul-fur. See Table 2 for ages. The pyrite, chalcopyrite and pyrrhotite analyses are from Tables 5and 6. Open diamonds: Águas Claras pyrites, interpreted to have an age of between 1880and 2060 Ma depending on their either epigenetic or syngenetic nature, are plotted at2000 Ma. Open squares: Pilar de Goiás pyrites and pyrrhotites, interpreted to representsynsedimentary sulfides with a Paleoproterozoic age of deposition of 2200 Ma up. Opentriangles: Serquerinha chalcopyrites from Carajás, plotted with an age of 2570 Ma forgranite intrusion. Open circles: Salobo chalcopyrites from Carajás, with an age of2570 Ma for granite intrusion, plotted at 2580 Ma only for differentiation from Serquer-inha. Filled circles: Mina de Cuiabá pyrites from the Quadrilátero Ferrífero, 2700 Ma. Filledsquares: São Bento pyrites and chalcopyrites from the Quadrilátero Ferrífero, 2720 Ma.The onset of MIF is given here with 2.45 Ga (Farquhar and Wing, 2003; Rumble, 2005;Glikson, 2010).
Table 7Summary of precision data and reliability of isotope data for the materials analysed.
Sample Material Nature Int. prec. [‰] Int. prec. [‰] Ext. prec. [‰] Ext. prec. [‰] Reliability [‰] Reliability [‰] Reliability [‰]
δ34S (1 s) δ33S (1 s) δ34S (1 s) δ33S (1 s) δ34S δ33S Δ33S
IAEA-S1 Ag2S ppp 0.10–0.15 0.30–0.40IAEA-S3 Ag2S ppp 0.10–0.15 0.40–0.55 0.25 0.30NBS123p ZnS ppp 0.05–0.15 0.30–0.45NBS123x ZnS Crystals 0.10–0.15 0.50–0.70BSB-py Pyrite Crystals 0.05–0.10 0.10–0.20 0.31 0.34 0.46AC Pyrite Crystals 0.10–0.15 0.15–0.25 0.32 0.36 0.48MDC Pyrite Crystals 0.10–0.20 0.10–0.20 0.34 0.34 0.47SB Pyrite Crystals 0.05–0.15 0.10–0.20 0.32 0.34 0.46JOT Pyrite Crystals 0.05–0.15 0.10–0.20 0.32 0.34 0.46JOT Pyrrhotite Crystals 0.10–0.20 0.20–0.40 0.34 0.42 0.54BSB-cpy cpy Crystals 0.10–0.15 0.45–0.65 0.34 0.50 0.60SAL cpy Crystals 0.10–0.20 0.40–0.50 0.34 0.54 0.64SEQ cpy Crystals 0.10–0.15 0.20–0.40 0.33 0.42 0.53SB cpy Crystals 0.10–0.15 0.20–0.40 0.33 0.42 0.53NBS127 barite ppp 0.05–0.15 0.10–0.20 0.32 0.34 0.46
Note: the accuracy used to calculate the reliability is 0.30‰ for both δ34S and δ33S. ppp=pressed powder pellet.
173B. Bühn et al. / Chemical Geology 312–313 (2012) 163–176
Author's personal copy
al., 2003; Mojzsis et al., 2003), shales and marine carbonates (Hu et al.,2003; Ono et al., 2003; Bekker et al., 2004), marbles and quartzites(Mojzsis et al., 2003), and a variety of other sediment types (Papineauet al., 2005, 2007), amongst others. According to this conception, thepresence of MIF in sulfide inclusions in diamonds was used to suggestthe recycling of surface-sediments back into the mantle, carrying a MIFeffect in their sulfur isotope record (Farquhar et al., 2002; Thomassot etal., 2009).
However, neither the age nor the sources of sulfur in terrestrial rocksare always unequivocal. Both clastic and chemical sediments are, bytheir nature, difficult to be dated, and the same applies to epigeneticmineralizations which often allow only indirect dating methods. Thepyrite in the Águas Claras Formation clastic sediments, for example,may be interpreted as syn- or epigenetic, which leads to a possibleage of the sulfur ranging from 2700 Ma to 1880 Ma. In this context,the lack of a MIF effect in these samples may be taken as an indicationof an epigenetic, Paleoproterozoic origin of the pyrite grains, being re-lated to the intrusion of the Carajás Central Granite at this age (Silvaand Villas, 1998). On the other hand, the Archean sedimentation age it-self of the Águas Claras Formation has been doubted previously, sug-gesting a Paleoproterozoic sedimentation age, with the pyrites beingpurely diagenetic with 2.06 Ga in age (Mougeot et al., 1996; Fabre etal., 2011). This scenario as well would be supported by the lack of aMIF anomaly in the pyrites. In Fig. 11, therefore, the Águas Claras dataare plottedwith an age of 2000 Ma, intermediate between an epigenetic1880 Ma, and a diagenetic 2060 Ma age for the pyrites.
However, Δ33S values close to zero do a priori not exclude an Arche-an age of the sulfur. By far not all Neoarchean sediments exhibit a Δ33Sanomaly (Farquhar et al., 2010), and theMidarchean Era even is charac-terized by a minimum in Δ33S (Johnston, 2011). A similar dilemma isencountered with respect to the second pre-requisite for MIF, thesource of the sulfur. While banded iron-formations, black shales, car-bonates and similar sediments clearly suggest contact and interchangewith the hydrosphere–atmosphere system, any epigenetic hydrother-mal overprint including or not a redistribution of sulfur rises the ques-tion of its nature and provenance, i.e. its extent of interchange withthe atmosphere − hydrosphere. Carbonate-dominated Mississippi-Valley type (MVT) and clastic-dominated sedimentary-exhalative(SEDEX) deposits, for example, are considered to have a fair amountof crustal-source sulfide originated from sea water sulfate reduction(Farquhar et al., 2010). Volcanogenic massive sulfide deposits (VMS),on the other hand, are located close to the juvenile source in active ex-tensional settings and, therefore, would suggest a sulfur source that iscut-off from MIF-inducing effects in the atmosphere. However, eventhis presumably juvenile source bears a sulfur contribution derivedfrom ocean water sulfate reduction. Ono et al. (2006) found that11–27% of the total sulfur budget of modern seafloor hydrothermalvents are derived from sea water sulfate reduction. In a similar study,Peters et al. (2010) found a slightly higher contribution of seawater sul-fate, ranging between 25 and 33% in twomodern, oceanic hydrothermalfields.
The Salobo and Serquerinha sulfide are not expected to record aMIFeffect, despite their reasonably well-constrained Neoarchean age of2570 Ma. They are clearly related to A-type alkaline granites fromendo-genic sources, lacking an obvious contribution derived from a shallowor superficial sulfur cycle. The chalcopyrite analyses indeed show Δ33Svalues close to zero (Fig. 11), and plot on the terrestrial sulfur fraction-ation linewithin their errors. This example stresses the necessity that inArchean sulfide deposits the sulfur has to derive from the exogenic sul-fur cycle in order to record a MIF effect.
The contrary situation is given for the sulfides from the Pilargreenstone belt samples and the Quadrilátero Ferrifero BIFs. The pyritesand pyrrhotites from Pilar are supposed to be of bacterial origin clearlyrelated to an exogenic sulfur cycle, and are therefore prone to record aMIF effect. Their supposed Paleoproterozoic depositional age of2200 Ma (Jost et al., 2008), however, is significantly younger than
2450 Ma. Considering that the epigenetic goldmineralization in the sed-iments was dated at 2.2–2.17 Ga (Jost et al., 2010), it may be suggestedthat the hosting sediments – including the syngenetic sulfur – have a de-positional age only slightly older. Accordingly, themajority of samples donot show Δ33S values significantly deviating from the MDF line. Somesulfide, especially pyrite analyses, however, fall off the MDF curve to-wards positive Δ33S values between 0.2 and 0.5‰. Considering theΔ33S reliability errors of ~0.46‰ for pyrite (Table 7), however, this isnot taken as a meaningful indication for MIF in the sulfides.
The samples from the Quadrilátero Ferrífero are the only ones ana-lysed in this study displaying a significant MIF effect. The sulfide andgold mineralization of Neoarchean age (close to 2670Ma, Lobato etal., 2001) reaches consistently positiveΔ33S values up to 2.2‰ in pyritesfrom the Mina de Cuiabá. They compare with also predominantly posi-tive Δ33S values up to 2‰ for pyrites from a BIF of the Isua SupracrustalBelt, West Greenland (Mojzsis et al., 2003). The same authors, on theother hand, report distinctly negative values reaching −1.7‰ fromBIFs of the Hamersley Basin, West Australia, and Δ33S values spreadingaround zero from the Akilia BIFs in SWGreenland. Various authors haveproposed and confirmed the Archean age of the BIFs from theQuadrilátero Ferrífero including its mineralizations (Machado et al.,1992; Noce et al., 2007). The sulfur-bearing phases represent an epige-netic process, involving remobilization of sulfur during deformationand metamorphism during the Neoarchean (Martins Pereira et al.,2007; Noce et al., 2007). In spite of its epigenetic nature, there is nodoubt that the sulfur source are supracrustal rocks including Archeangreenstones and/or other sediments which make part of a exogenic sul-fur cycle. The sulfur isotopic analyses therefore exhibit a significantΔ33Sanomaly, since both pre-requisites – age and provenance of the sulfur –are met.
Acknowledgements
We wish to thank the Petrobras–Petróleo Brasileiro S/A and theMinistério de Minas e Energia of Brasil for continuous support for themaintenance of our laboratory. Various research projects financed bythe Conselho Nacional de Desenvolvimento Científico e Tecnológico(CNPq) and the Coordenação de Aperfeiçoamento de Pessoal de NívelSuperior (CAPES), granted to various of the authors, helped to realizethis study. Further thanks are due to Hardy Jost for giving more detailedinsights in the geology of the Pilar greenstone belt. The two journal ref-erees provided comprehensive and useful suggestions in order to arriveat amore lucid exposition of geological and analytical aspects. The articleis dedicated to the late Marcel Auguste Dardenne, who died during thecourse of preparation of this article.
References
Albarède, F., Telouk, P., Blichert-Toft, J., Boyet, M., Agranier, A., Nelson, B., 2004. Preciseand accurate isotopic measurements using multiple-collector ICPMS. Geochimicaet Cosmochimica Acta 68, 2725–2744.
Amrani, A., Sessions, A.L., Adkins, J.F., 2009. Compound-specific δ34S analysis of volatileorganics by coupled GC/multicollector-ICPMS. Analytical Chemistry 81 (21),9027–9034.
Bekker, A., Holland, H.D., Wang, P.-L., Rumble III, D., Stein, H.J., Hannah, J.L., Coetzee,L.L., Beukes, N.J., 2004. Dating the rise of atmospheric oxygen. Nature 427,117–120.
Bendall, C., Lahaye, Y., Fiebig, J., Weyer, S., Brey, G.P., 2006. In situ sulfur isotope analy-sis by laser ablation MC-ICPMS. Applied Geochemistry 21, 782–787.
Bullock, E.S., McKeegan, K.D., Gounelle, M., Grady, M.M., Russell, S.S., 2010. Sulfur iso-topic composition of Fe-Ni sulfide grains in CI and CM carbonaceous chondrites,.Meteoritics & Planet Sciences 45, 885–898.
Craddock, P.R., Rouxel, O.J., Ball, L.A., Bach, W., 2008. Sulfur isotope measurement ofsulfate and sulfide by high-resoluation MC-ICP-MS. Chemical Geology 253,102–113.
Dardenne, M.A., Schobbenhaus, C., 2001. Metalogênese do Brasil. Editora University ofBrasília, Brazil. 392 pp.
DeWitt, E., Landis, G.P., Zartman, R.E., Garayp, E., Martins-Pereira, S.L., Prado, M.G.B.,Vieira, F.W.R., Thorman, C.H., 1994. Isotopic and fluid inclusion data on the ageand origin of the São Bento and Morro Velho gold deposits, Minas Gerais, Brazil.
174 B. Bühn et al. / Chemical Geology 312–313 (2012) 163–176
Author's personal copy
In: Thorman, C.H., Lane, D.E. (Eds.), V.E. McKelvey Forum on Mineral and EnergyResources. United States Geological Survey, Denver, pp. 27–29.
DeWitt, E., Thorman, C.H., Zartman, R.E., Wooden, J.L., Landis, G.P., 1999. CD-ROM ongeology and origin of gold deposits in iron-formations in Brazil and United States.United States Geological Survey. Minerals Team, Denver.
Dias, G.S., Macambira, M.J.B., Dall'Agnol, R., Soares, A.D.V., Barros, C.E.M., 1996. Dataçãode zircão de sill de metagabro: comprovação da idade arqueana da FormaçãoÁguas Claras, Pará. 5th Symp. Geol. Amazônia, Belém, Brazil: Bull. of Extended Ab-stracts, pp. 376–379.
Ding, T., Valkiers, S., Kipphardt, H., De Briève, P., Taylor, P.D.P., Gonfiantini, R., Krouse,R., 2001. Calibrated sulfur isotope abundace ratios of three IAEA sulfur isotope ref-erence materials and V-CDT with a reassessment of the atomic weight of sulfur.Geochimica et Cosmochimica Acta 65, 2433–2437.
Fabre, S., Nédélec, A., Poitrasson, F., Strauss, H., Thomazo, C., Nogueira, A., 2011. Ironand sulphur isotopes from the Carajás mining province (Pará, Brazil): Implicationsfor the oxidation of the ocean and the atmosphere across the Archean-Proterozoictransition. Chemical Geology 289, 124–139.
Farquhar, J., Wing, B., 2003. Multiple sulfur isotopes and the evolution of the atmo-sphere. Earth and Planetary Science Letters 213, 1–13.
Farquhar, J., Bao, H., Thiemens, M., 2000. Atmospheric influence of Earth's earliest sul-fur cycle. Science 289, 756–759.
Farquhar, J., Wing, B.A., McKeegan, K.D., Harris, J.W., Cartigny, P., Thiemens, M.H., 2002.Mass-independent sulfur of inclusions in diamond and sulfur recycling on earlyEarth. Science 298, 2369–2372.
Farquhar, J., Wu, N., Canfield, D.E., Oduro, H., 2010. Connections between sulfur cycleevolution, sulfur isotopes, sediments, and base metal sulfide deposits. EconomicGeology 105, 509–533.
Glikson, A., 2010. Archean asteroid impacts, banded iron formations andMIF-S anomalies:a discussion. Icarus 207, 39–44.
Grainger, C.J., Groves, D.I., Tallarico, F.H.B., Fletcher, I.R., 2008. Metallogenesis of theCarajás mineral province, southern Amazon craton, Brazil: varying styles of Arche-an through Paleoproterozoic to Neoproterozoic base- and precious-metal minera-lisation. Ore Geology Reviews 33, 451–489.
Holland, H.D., 2002. Volcanic gases, black smokers, and the Great Oxygenation Event.Geochimica et Cosmochimica Acta 66, 3811–3826.
Hu, G., Rumble, D., Wang, P.-L., 2003. An ultraviolet laser microprobe for the in situanalysis of multisulfur isotopes and its use in measuring Archean sulfur isotopemass-independent anomalies. Geochimica et Cosmochimica Acta 67, 3101–3117.
Johnston, D.T., 2011. Multiple sulfur isotopes and the evolution of Earth's surface sulfurcycle. Earth-Science Reviews 106, 161–183.
Jost, H., De Oliveira, A.M., 1991. Stratigraphy of the greenstone belts, Crixás region,Goiás, central Brazil. Journal of South American Earth Sciences 4, 201–214.
Jost, H., Pimentel, M.M., Fuck, R.A., Danni, J.C.M., Heaman, L., 1993. Idade U–Pb do DioritoPosselândia, Hidrolina, Goiás. Revista Brasileira de Geociências 23, 352–355.
Jost, H., et al., 2001. Geologia de terrenos Arqueanos e Proterozóicos da região deCrixás–Cedrolina, Goiás. Revista Brasileira de Geociências 31, 315–328.
Jost, H., Dussin, I.A., Chemale Jr., F., Tassinari, C.C.G., Junges, S., 2008. U-Pb and Sm-Ndconstraints for the Paleoproterozoic age of the metasedimentary sequences ofthe Goiás Archean greenstone belts. VI. South Amer. Symp. Isotope Geol., Bariloche,Argentina: Ext. Abstr., Vol., 1–4.
Jost, H., Chemale Jr., F., Dussin, I.A., Tassinari, C.C.G., Martins, R., 2010. A U-Pb zirconPaleoproterozoic age for the metasedimentary host rocks and gold mineralization ofthe Crixás greenstone belt, Goiás, Central Brazil. Ore Geology Reviews 37, 127–139.
Kozdon, R., Kita, N.T., Huberty, J.M., Fournelle, J.H., Johnson, C.A., Valley, J.W., 2010. In situsulfur isotope analysis of sulfide minerals by SIMS: Precision and accuracy, with ap-plication to themometry of ~3.5 Ga Pilbara chert. Chemical Geology 275, 243–253.
Kuyumjian, R.M., Jost, H., 2006. Low- and high-alumina komatiites of Goiás, CentralBrazil. Journal of South American Earth Sciences 20, 315–326.
Lobato, L.M., Ribeiro-Rodrigues, L.C.R., Vieira, F.W.R., 2001. Brazil's premier gold prov-ince. Part II: geology and genesis of gold deposits in the Archean Rio das Velhasgreenstone belt, Quadrilátero Ferrífero. Mineralium Deposita 36, 249–277.
Lobato, L.M., Santos, J.O.S., McNaughton, N.J., Fletcher, I.R., Noce, C.M., 2007. U-Pb SHRIMPmonazite ages of the giant Morro Velho and Cuiabá gold deposits, Rio das Velhasgreenstone belt, Quadrilátero Ferrífero, Minas Gerais, Brazil. Ore Geology Reviews32, 674–680.
Machado, N., Carneiro, M.A., 1992. U–Pb evidence of late Archean tectono-thermal ac-tivity in the southern São Francisco shield, Brazil. Canadian Journal of Earth Sci-ences 29, 2341–2346.
Machado, N., Lindemayer, Z., Krogh, T.E., Lindemayer, D., 1991. U-Pb geochronology ofArchean magmatism and basement reactivation in the Carajas area, Amazonshield, Brazil. Precambrian Research 49, 329–354.
Machado, N., Noce, C.M., Ladeira, E.A., Belo de Oliveira, O.A., 1992. U–Pb geochronology ofArchean magmatism and Proterozoic metamorphism in the Quadrilátero Ferrífero,southern São Francisco Craton, Brazil. Geological Society of America Bulletin 104,1221–1227.
Mann, J.L., Vocke Jr., R.D., Kelly, W.R., 2009. Revised δ34S reference values for IAEA sul-fur isotope reference materials S-2 and S-3. Rapid Communications in Mass Spec-trometry 23, 1116–1124.
Marschik, R., Spangenberg, J.E., Leveille, R.A., de Almeida, A.J., 2003. The Sossego iron oxideCu–Audeposit, Carajás, Brazil. In: Eliopoulos, D.G., et al. (Ed.),Mineral Exploration andSustainable Development. Millpress, Rotterdam, The Netherlands, pp. 331–334.
Martins Pereira, S.L., Lobato, L.M., Ferreira, J.E., Jardim, E.C., 2007. Nature and origin ofthe BIF-hosted São Bento gold deposit, Quadrilátero Ferrífero, Brazil, with specialemphasis on structural controls. Ore Geology Reviews 32, 571–595.
Mason, P.R.D., Košler, J., de Hoog, J.C.M., Sylvester, P.J., Meffan-Main, S., 2006. In situ de-termination of sulfur isotopes in sulfur-rich materials by laser ablation multiple-
collector inductively coupled plasma mass spectrometry (LA-MC-ICP-MS). Journalof Analytical Atomic Spectrometry 21, 177–186.
Mojzsis, S.J., Coath, C.D., Greenwood, J.P., McKeegan, K.D., Harrison, T.M., 2003. Mass-independent isotope effects in Archean (2.5 to 3.8 Ga) sedimentary sulfides deter-mined by ionmicroprobe analysis. Geochimica et Cosmochimica Acta 67, 1635–1658.
Monteiro, L.V.S., Xavier, R.P., Carvalho, E.R., Hitzman, M.W., Johnson, C.A., Souza Filho,C.R., Torresi, I., 2008. Spatial and temporal zoning of hydrothermal alteration andmineralization in the Sossego iron oxide–copper–gold deposit, Carajás MineralProvince, Brazil: paragenesis and stable isotope constraints. Mineralium Deposita43, 129–159.
Mota e Silva, J., Ferreira Filho, C.F., Bϋhn, B., Dantas, E.L., 2011. Geology, petrology andgeochemistry of the “Americano do Brasil” layered intrusion, central Brazil, and itsNi–Cu sulfide deposits. Mineralium Deposita 46, 57–90.
Mougeot, R., Respaut, J.P., Briqueu, L., Ledru, P., Milesi, J.P., Lerouge, C., Marcoux, E.,Huhn, S.B., Macambira, M.J.B., 1996. Isotope geochemistry constraints for Cu, Aumineralizations and evolution of the Carajás 763 province (Para, Brazil). 39. Con-gresso Brasileiro de Geologia, Salvador, Anais: SBG, vol 7, pp. 321–324.
Noce, C.M., 2000. Geochronology of the Quadrilátero Ferrífero: a review. Geonomos 7,15–23.
Noce, C.M., Tassinari, C., Lobato, L.M., 2007. Geochronological framework of theQuadrilátero Ferrífero, with emphasis on the age of gold mineralization hosted inArchen greenstone belts. Ore Geology Reviews 32, 500–510.
Ohmoto, H., Yamaguchi, K., Ono, S., 2001. Questions regarding Precambrian sulfur iso-tope fractionation. Science 292, U5–U6.
Ohmoto, H., Watanabe, Y., Ikemi, H., Poulson, S.R., Taylor, B.E., 2006. Sulfur isotope ev-idence for an oxic Archean atmosphere. Nature 442, 908–911.
Ono, S., Eigenbrode, J.L., Pavlov, A.A., Kharecha, P., Rumble, D., Kasting, J.F., Freeman,K.H., 2003. New insights into Archean sulfur cycle from mass-independent sulfurisotope records from the Hamersley Basin, Australia. Earth and Planetary ScienceLetters 213, 15–30.
Ono, S., Wing, B., Rumble, D., Farquhar, J., 2006. High precision analysis of all four stableisotopes of sulfur (32S, 33S, 34S and 36S) at nanomole levels using a laser fluorinationisotope-ratio-monitoring gas chromatography mass spectrometry. Chemical Geology225, 30–39.
Papineau, D., Moizsis, S.J., Coathy, C.D., Karhu, J.A., McKeegan, K.D., 2005. Multiplesulfur isotopes of sulfides from sediments in the aftermath of Paleoproterozoic gla-ciations. Geochimica et Cosmochimica Acta 69, 5033–5060.
Papineau, D., Moizsis, S.J., Schmitt, A.K., 2007. Multiple sulfur isotopes fromPaleoproterozoic Huronian interglacial sediments and the rise of atmospheric oxy-gen. Earth and Planetary Science Letters 255, 188–212.
Pereira, S.L.M., Lobato, L.M., Ferreira, J.E., Jardim, E.C., 2007. Nature and origin of theBIF-hosted São Bento gold deposit, Quadrilátero Ferrífero, Brazil, with special em-phasis on structural controls. Ore Geology Reviews 32, 571–595.
Peters, M., Strauss, H., Farquhar, J., Ockert, C., Eickmann, B., Jost, C.L., 2010. Sulfur cy-cling at the Mid-Atlantic Ridge: a multiple sulfur isotope approach. Chemical Geol-ogy 269, 180–196.
Pinheiro, R.V.I., Holdsworth, R.E., 2000. Tectonostratigraphic evolution of the Carajásand Cinzento strike-slip systems, Itacaiúnas Belt, east of the Amazon Craton, ParáState. Revista Brasileira de Geociências 30, 597–606.
Qi, H.P., Coplen, T.B., 2003. Evaluation of the 34S/32S ratio of Soufre de Lacq elementalsulfur isotopic reference material by continuous flow isotope-ratio mass spectrom-etry. Chemical Geology 199, 183–187.
Requia, K., Stein, H., Fontboté, L., Chiaradia, M., 2003. Re-Os and Pb-Pb geochronologyof the Archean Salobo iron oxide copper-gold deposit, Carajás mineral province,northern Brazil. Mineralium Deposita 38, 727–738.
Ribeiro-Rodrigues, L.C., Oliveira, C.G., Friedrich, G., 2007. The Archean BIF-hostedCuiabá gold deposit, Quadrilátero Ferrífero, Minas Gerais, Brazil. Ore Geology Re-views 32, 543–570.
Romero, A.B., Thiemens, M.H., 2003. Mass-independent sulfur isotopic compositions inpresent-day sulfate aerosols. Journal of Geophysical Research, [Atmospheres] 108(D16) (art. no. 4524).
Rumble, D., 2005. Amineralogical and geochemical record of atmospheric photochemistry.American Mineralogist 90, 918–930.
Santos, J.O.S., Hartmann, L.A., Gaudette, H.E., Groves, D.I., McNaughton, N.J., Fletcher,I.R., 2000. A new understanding of the provinces of the Amazon craton based onintegration of field mapping and U-Pb and Sm-Nd geochronology. Gondwana Re-search 3, 453–488.
Savarino, J., Romero, A., Cole-Dai, J., Bekki, S., Thiemens, M.H., 2003. UV induced mass-independent sulfur isotope fractionation in stratospheric volcanic sulfate. Geo-physical Research Letters 30 (21) (art. no. 2131).
Seal, R.R., 2006. Sulfur isotope geochemistry of sulfide minerals. Reviews in Mineralogyand Geochemistry 61, 633–677.
Silva, C.M.G., Villas, R.N., 1998. The Águas Claras Cu-sulfide+/−Au deposit, Carajás re-gion, Pará, Brazil: Geological setting, wall-rock alteration and mineralizing fluids.Revista Brasileira de Geociências 28, 315–326.
Sleep, N., 2001. Oxygenating the atmosphere. Nature 410, 317–319.Tallarico, F.H.B., Figueiredo, B.R., Groves, D.I., Kositcin, N., McNaughton, N.J., Fletcher,
I.R., Rego, J.L., 2005. Geology and SHRIMP U-Pb geochronology of the IgarapéBahia Deposit, Carajás copper-gold belt, Brazil: An Archean (2.57 Ga) example ofiron-oxide Cu-Au-(U-REE) mineralization. Economic Geology 100, 7–28.
Teixeira, W., Carneiro, M.A., Noce, C.M., Machado, N., Sato, K., Taylor, P.N., 1996. Pb, Srand Nd isotope constraints on the Archean evolution of gneissic granitoid com-plexes in the southern São Francisco craton, Brazil. Precambrian Research 78,151–164.
Thomassot, E., Cartigny, P., Harris, J.W., Lorand, J.P., Rollion-Bard, C., Chaussidon, M.,2009. Metasomatic diamond growth: A multi-isotope study (13C, 15N, 33S, 34S) of
175B. Bühn et al. / Chemical Geology 312–313 (2012) 163–176

Author's personal copy
sulphide inclusions and their host diamonds from Jwaneng (Botswana). Earth andPlanetary Science Letters 282, 79–90.
Thomson, M.L., Fyfe, W.S., 1990. The Crixás gold deposit, Brazil: thrust-related, post-peak metamorphic gold mineralization of possible Brasiliano Cycle age. EconomicGeology 85, 928–942.
Trendall, A.F., Basei, M.A.S., De Laeter, J.R., Nelson, D.R., 1998. SHRIMP zircon U-Pb con-straints on the age of the Carajás Formation, Grão Pará Group, Amazon Craton.Journal of South American Earth Sciences 11, 265–277.
Veneziani, P., Santos, A.R., Paradella, W.R., 2004. A tectonostratographic evolution of theCarajás Mineral Province: a model based on remote sensing (Sar-C Radarsat-1,
Landsat-5 TM), aerial geophysics and field data. Revista Brasileira de Geociências 34,67–78.
Watanabe, Y., Farquhar, J., Ohmoto, H., 2009. Anomalous fractionations of sulfur iso-topes during thermochemical sulfate reduction. Science 324 (5925), 370–373.
Yun, M., Wadleigh, M.A., Pye, A., 2004. Directmeasurement of sulfur isotopic compositionin lichens by continuous flow-isotope ratio mass spectrometry. Chemical Geology204, 369–376.
176 B. Bühn et al. / Chemical Geology 312–313 (2012) 163–176
Copyright © 2022 FDOKUMEN